
PROCEEDINGS - AMDISA
431
Impact of Pandemic on Business and Management: Strategies for Sustainability and Growth IUBAT International University of Business Agriculture and Technology AMDISA Association of Management Development Institutions in South Asia PROCEEDINGS
-
Upload
khangminh22 -
Category
Documents
-
view
1 -
download
0
Transcript of PROCEEDINGS - AMDISA
Impact of Pandemic on Business and Management:Strategies for Sustainability and Growth
IUBATInternational University of Business
Agriculture and Technology
AMDISAAssociation of Management
Development Institutions in South Asia
PROCEEDINGS

16th South Asian Management ForumTheme: Impact of Pandemic on Business and
Management: Strategies for Sustainability and Growth
17-18 December, 2021
Organized ByAMDISA - Association of Management Development Institutions in South Asia
Hosted ByCBA - College of Business Administration
IUBAT — International University of Business Agriculture and Technology
Uttara, Dhaka, Bangladesh
VenueIUBAT — International University of Business Agriculture and Technology,
Uttara, Dhaka, Bangladesh
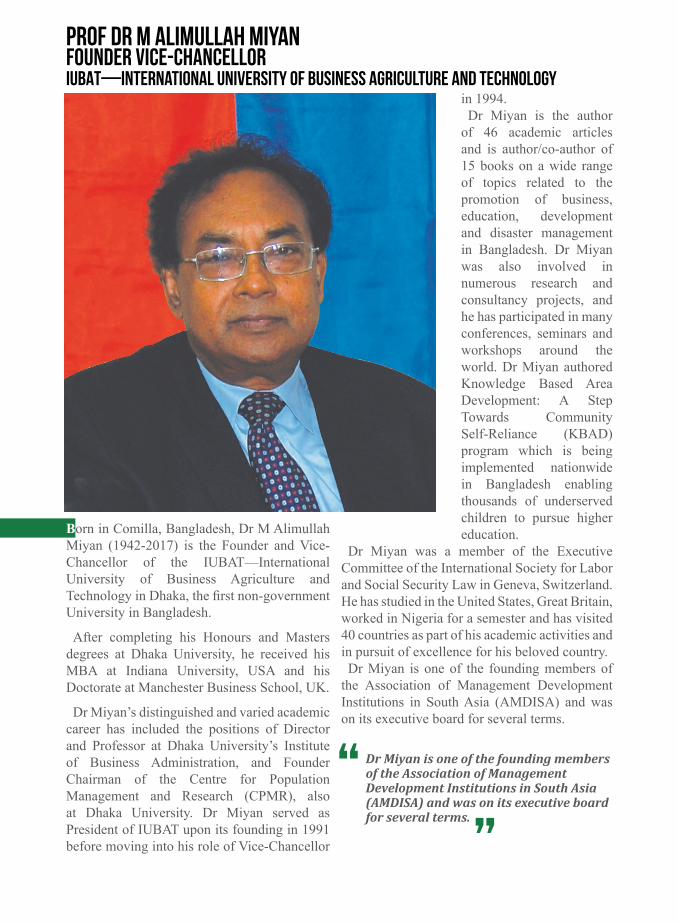
Prof Dr M Alimullah MiyanFounder Vice-ChancellorIUBAT—International University of Business Agriculture and Technology
in 1994. Dr Miyan is the author
of 46 academic articles and is author/co-author of 15 books on a wide range of topics related to the promotion of business, education, development and disaster management in Bangladesh. Dr Miyan was also involved in numerous research and consultancy projects, and he has participated in many conferences, seminars and workshops around the world. Dr Miyan authored Knowledge Based Area Development: A Step Towards Community Self-Reliance (KBAD) program which is being implemented nationwide in Bangladesh enabling thousands of underserved children to pursue higher education.
Dr Miyan was a member of the Executive Committee of the International Society for Labor and Social Security Law in Geneva, Switzerland. He has studied in the United States, Great Britain, worked in Nigeria for a semester and has visited 40 countries as part of his academic activities and in pursuit of excellence for his beloved country.Dr Miyan is one of the founding members of
the Association of Management Development Institutions in South Asia (AMDISA) and was on its executive board for several terms.
Born in Comilla, Bangladesh, Dr M Alimullah Miyan (1942-2017) is the Founder and Vice-Chancellor of the IUBAT—International University of Business Agriculture and Technology in Dhaka, the first non-government University in Bangladesh.
After completing his Honours and Masters degrees at Dhaka University, he received his MBA at Indiana University, USA and his Doctorate at Manchester Business School, UK.
Dr Miyan’s distinguished and varied academic career has included the positions of Director and Professor at Dhaka University’s Institute of Business Administration, and Founder Chairman of the Centre for Population Management and Research (CPMR), also at Dhaka University. Dr Miyan served as President of IUBAT upon its founding in 1991 before moving into his role of Vice-Chancellor
Dr Miyan is one of the founding members of the Association of Management Development Institutions in South Asia (AMDISA) and was on its executive board for several terms.
”
Covid 19 pandemic impacted all walks of our life - health and hygiene, social life and value system, economy, business, education, earnings, environment, and so on. In this context, Association of Management Development Institutions in South Asia(AMDISA) organized and IUBAT- International University of Business Agriculture and Technology hosted the 16th South Asian Management Forum on the theme, “Impact of Pandemic on Business and Management: Strategies for Sustainability and Growth”. The two-day conference was held on 17and 18 December 2021 in Dhaka, Bangladesh in blended/ hybrid mode. The Conference aimed at promoting a better understanding of the crisis caused by pandemics, how the stakeholders have responded to the situation, how these have worked and what should be strategies to cope with the challenges. Out of 97 abstracts received for the conference, 58 papers were accepted for presentation and 49 papers are being published in the Proceedings after review.
Many people have contributed to the successful organization of the Forum and in publishing the Book of Abstracts and the Proceedings. The list of these people is long and so it is not possible to mention their names. However, we must thank the authors, reviewers, and members of the editorial board for their immense contribution. I should thank the President, Prof. Dr. Syed Mir Muhammad Shah, and Vice President Prof. Mohammad Abdul Momen of AMDISA for their moral support. My sincere thanks are due to Prof. Selina Nargis, Treasurer of IUBAT for financial and facilities support. I should thank Mr. Hasanuzzaman Tushar and Mr. Syed Far Abid, Faculty Members of IUBAT and Mr. Alimuzzaman Nayan , the Graphic Designer who worked very hard to organize the conference and publish the Book of Abstract and the Proceedings. We are thankful to the Executive Director Mr. C. Ramakrishna and Mr. T. Ganeswara Rao, Senior Manager of the AMDISA secretariat for their active and timely support for the conference.
Prof. Dr. Abdur RabVice Chancellor, IUBATEditor, Proceedings
EDITORIAL
16th South Asian Management ForumTheme: Impact of Pandemic on Business and Management: Strategies for Sustainability and Growth
Date: 17-18 December, 2021
Venue:IUBAT — International University of Business Agriculture and Technology, Uttara, Dhaka, Bangladesh
Editorial Board:Prof. Dr. Abdur Rab, EditorMd Forhad Hossain, Associate EditorDr. Syed Far Abid HossainMr. Hasanuzzaman Tushar
Graphics and Design:Alimuzzaman Nayan, Graphics Designer, Brand and Communication Department, IUBAT.
Published By: IUBAT — International University of Business Agriculture and Technology, Uttara, Dhaka, Bangladesh
Year of Publication : 2021-12-17ISBN Number: 978-984-35-1624-4
Table of ContentsTitle Page NoAccreditation And Management Education –Strategies For Sustainability And Growth 01Vertical Integration—Is It Necessary For All Manufacturing Industries? 07The Role Of A. I., Post Pandemic, Employees’ Engagement And The Challenges Of Implementing HR Strategies In Bangladeshi Supply Chain Companies 14
Development And Validation Of An Instrument Measuring Sustainability Consciousness 25Accreditation: A Bibliometric Analysis 31Factors Affecting Increased Teacher Workload In Online Teaching During Covid-19 Pandemic 39
Measuring Service Quality Of Online Educational Platforms 49Role Of Personality Traits In Influencing B School Learners’ Dropout Behavior In Moocs And Mediating Role Of Hedonic Attributes Influencing Dropout. 61
Impact Of Pedagogical Changes In Management Education In The Post-Covid-19 Period – A Comparison Study 69
Emerging Trends In Sustainability Of Digital Learning Among Working Executives In Corporates 76
Corporate Dual Dilemma: Age Discrimination And Age- Inclusive Workplaces During Pandemic Times 96
Nexus And Modernization Of Transformational Leadership, Social Justice And Employees’ Psyche Concepts And The Modernization Era In The Manufacturing Industry
106
Hr Practices During Covid-19 Pandemic: A Study Of Indian It And Non-It Sectorconcepts And The Modernization Era In The Manufacturing Industry 114
Value-Based Governance: A Case Of Capacity Building Initiative In Nepal 124Human Resource Management Bundles During Covid-19 Crisis 135Nurturing Green Innovations Through Green Transformational Leadership 149Sustainable Employee Performance: The Motivational Theory Of Lifespan Development Perspective 160
Impact Of Training Methods On Employee Satisfaction In Commercial Banks Of Bangladesh 166
The Impact Of Production And Services Industries Work Environment During Covid-19 Crisis: Discussion Based On Human Resource Management 175
Association Between Corporate Social Responsibility And Firm Performance With Moderating Effects Of Ceo Power: Empirical Evidence From Developing Nation 184
Corporate Dual Dilemma: Age Discrimination And Age- Inclusive Workplaces During Pandemic Times 191
Human Resource Management During Covid-19 Pandemic: Lessons Learned From Readymade Garments Industries Of Bangladesh 201
Impact Of Pandemic On The Constituents Of Death Anxiety 209The Conceptual Framework For Unlocking The Pandemic Imposed Challenges In Healthcare Management And The Economy With Digital Transformation 216
Recovery Strategies For Covid 19 Impact On Bangladeshi Small & Medium Enterprises (Sme) 224
Predictors And Prevalence Of Tobacco Smoking During Covid-19 Among University StudentS 237
Consumer Awareness, Covid-19 And Medical Wastage: The Case Of Bangladesh 244Modeling Of Creative Advertising Impact On Social Media Members’ Acceptance Of Sports Accessories 257
An Empirical Study Based On An Extended Theory Of Planned Behavior: Exploring The Factors Influence Consumers’ Online Buying Intentions. 265
Impact Of Covid-19 On Consumer Buying Behavior Toward Online And Offline Shopping In South Asian Countries: A Review, Synthesis, And Conceptual Framework 275
The Pandemic And The Cross Border Trade – An Indian Business Perspective 288Factors Affecting Organizational Aspects On Sales Peoples’ Performance: The Moderating Effect Of Sales Peoples’ Political Skill 294
Impact Of Covid-19 On Customer’s Sentiments Towards Mobile Banking In India 314Covid-19 is a Blessings for the Users of Fintech: Evidence from the Urban Consumers in Bangladesh 323
The Gig Economy in Bangladesh amidst Covid-19 Pandemic: Is It All Bad or Are There Some Positive Features for Workers? 330
Strategies and Policies for Managing Working Capital 339The Impact of Pandemic on Investment Behavior: Specifically on Gold Investment in India 349
What does the stock market mean to ordinary investors? -A systematic development of grounded theory in the context of Bangladesh 358
The Impact of Covid-19 on Fintech: A Bibliometric Analysis 372Thinking Orientation For Happier Outcomes 377Post-Covid 19 Lessons For E-Commerce Supply Chains In India: Strategic Issues 387A Quantitative Study On The Challenges Faced By Youth Entrepreneurship In The Maldives 395
Women-Led Tech Start-Ups In India – A Case-Based Study 407Opportunities, Challenges, And Solutions For Social Commerce In Bangladeshi E-Business 414
0116th SOUTH ASIAN MANAGEMENT FORUM (SAMF) 2021
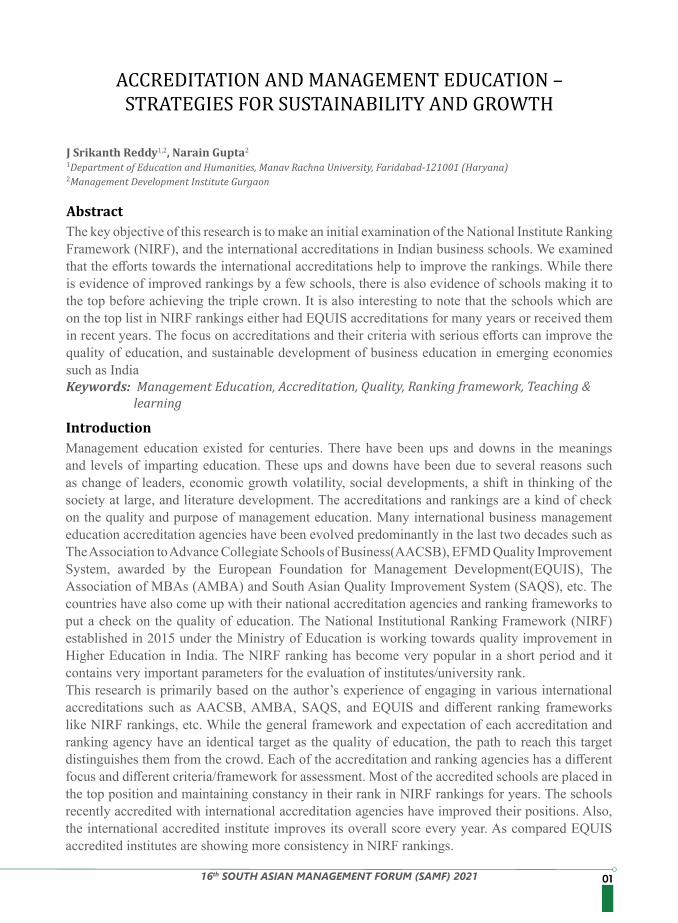
The key objective of this research is to make an initial examination of the National Institute Ranking Framework (NIRF), and the international accreditations in Indian business schools. We examined that the efforts towards the international accreditations help to improve the rankings. While there is evidence of improved rankings by a few schools, there is also evidence of schools making it to the top before achieving the triple crown. It is also interesting to note that the schools which are on the top list in NIRF rankings either had EQUIS accreditations for many years or received them in recent years. The focus on accreditations and their criteria with serious efforts can improve the quality of education, and sustainable development of business education in emerging economies such as India
Management education existed for centuries. There have been ups and downs in the meanings and levels of imparting education. These ups and downs have been due to several reasons such as change of leaders, economic growth volatility, social developments, a shift in thinking of the society at large, and literature development. The accreditations and rankings are a kind of check on the quality and purpose of management education. Many international business management education accreditation agencies have been evolved predominantly in the last two decades such as The Association to Advance Collegiate Schools of Business(AACSB), EFMD Quality Improvement System, awarded by the European Foundation for Management Development(EQUIS), The Association of MBAs (AMBA) and South Asian Quality Improvement System (SAQS), etc. The countries have also come up with their national accreditation agencies and ranking frameworks to put a check on the quality of education. The National Institutional Ranking Framework (NIRF) established in 2015 under the Ministry of Education is working towards quality improvement in Higher Education in India. The NIRF ranking has become very popular in a short period and it contains very important parameters for the evaluation of institutes/university rank.This research is primarily based on the author’s experience of engaging in various international accreditations such as AACSB, AMBA, SAQS, and EQUIS and different ranking frameworks like NIRF rankings, etc. While the general framework and expectation of each accreditation and ranking agency have an identical target as the quality of education, the path to reach this target distinguishes them from the crowd. Each of the accreditation and ranking agencies has a different focus and different criteria/framework for assessment. Most of the accredited schools are placed in the top position and maintaining constancy in their rank in NIRF rankings for years. The schools recently accredited with international accreditation agencies have improved their positions. Also, the international accredited institute improves its overall score every year. As compared EQUIS accredited institutes are showing more consistency in NIRF rankings.
ACCREDITATION AND MANAGEMENT EDUCATION – STRATEGIES FOR SUSTAINABILITY AND GROWTH
Abstract
Introduction
Keywords: Management Education, Accreditation, Quality, Ranking framework, Teaching & learning
J Srikanth Reddy1,2, Narain Gupta2
1Department of Education and Humanities, Manav Rachna University, Faridabad-121001 (Haryana)2Management Development Institute Gurgaon
02 16th SOUTH ASIAN MANAGEMENT FORUM (SAMF) 2021
Accreditation is commonly seen as providing a concrete means of contrasting the quality of recognized schools with that of unaccredited institutions to relevant external stakeholders (e.g., prospective students and faculty, potential employers, and funding organizations) (Blanco-Ramirez, 2015). As a result, obtaining and maintaining accreditation is a ‘value proposition’ for business schools (Trapnell, 2007). The quality of teaching and research at an approved HEI with international recognition is referred to as international accreditation (Batista and Romani-Dias, 2021). Where business schools are concerned, The AACSB is widely regarded as the agency providing one of the most prestigious accreditations, particularly for B-schools located in North America and Europe (Prasad et al., 2019).The former Executive Vice President and the Chief Accreditation Officer for AACSB, Jerry Trapnell (2007, p. 68) argued the value proposition of accreditation as a high standard for business schools, institutions’ commitment to quality through self-evaluation, and external validation of excellence in management.A qualitative study among the Mexican faculty from schools undergoing AACSB accreditation revealed that there was institutional pressure for research output, but the necessary resources required for this output lacked significantly (Prasad et al., 2019). (Staub, 2019) stated that there are multiple factors contributing to this change, including international rankings, internationalization
Literature Review
The paper compares and contrasts the principal pillars of the various international accreditation agencies and ranking NIRF rankings operating in the business and management education sector in India. The research is an effort to unfold how the management educators and business school leaders can leverage the benefits of the strategies laid out by the accreditation and ranking agencies for sustainable growth of the society at large.International accreditations have become key means for B schools to perusing Global status and legitimacy (Arvi et al., 2018). Globally, higher education is focusing more on accreditation and quality continues to rise. International accreditations are key means for universities and institutes to perusing Global status and legitimacy(Arvi et al., 2018). The important International accreditations for management education are AACSB, EQUIS, AMBA, and SAQS. The international accreditation criteria can improve the scores in the various parameters of NIRF rankings. The countries have also come up with their accreditation agencies and ranking frameworks to put a check on the quality of education. The goal of higher education is not only to provide education but also to improve the quality of education. The institutions can improve the quality and can ensure continuous improvement through accreditations. The National Institutional Ranking Framework (NIRF) was established by the Ministry of HRD in September 2015 to rank the Higher Educational Institutes in India from 2016 onwards. The main evaluation parameters for NIRF ranking are Teaching, Learning and Resources, Resources and Professional Practice, Graduate Outcome, Outreach & Inclusivity, and Perception. NIRF ranks the institutions in various disciplines.The National Institute Ranking Framework uses five important parameters for ranking the institutes and universities in India. Each section has a score of 100 and has different sub-parameters in each section(Kumar et al., 2021). The present study analyses the top 20 management institutes in NIRF rankings. The data for the last five years has been captured from the NIRF website. The top NIRF-ranked institutes are consistently maintaining their ranks for many years.RQ1: How are the institutes maintaining their positions in the top place of the NIRF list?RQ2:Do international accreditations help the schools to improve NIRF rank?
0316th SOUTH ASIAN MANAGEMENT FORUM (SAMF) 2021
of higher education, stakeholder demands, and assurance from students and parents that a diploma is equivalent to employment through accreditations.Based on the analysis of four years of NIRF data, (Nassa et al., 2021) stated that all institutions are working on NIRF parameters and sub-parameters for improving their performance, and also revealed that the new institutions making effort to improve NIRF rankings to make it to the top 100 ranked institutions. Accreditation is a long-term (three/five year) assessment that gives absolute grades, whereas ranking is a yearly activity that shows the annual performance of the institute to various stakeholders.(Vasudevan & SudalaiMuthu, 2020) stated that different accreditation and ranking agencies have different frameworks and criteria but most of the parameters are overlapping. The common framework helps an institution improve its ranking and also focuses on the institute’s core activities by saving the time to work on ranking parameters. (Nassa et al., 2021) identified common parameters like teaching and learning, research and industry connect, etc. in the NIRF rankings and global accreditation agencies. This study clearly shows that the institutions accredited with global accreditations get high scores in various parameters of NIRF rank. Accreditations, if taken in their true spirit, can not only improve the quality of education, but also the rankings, and brings sustainable development to the larger business education.
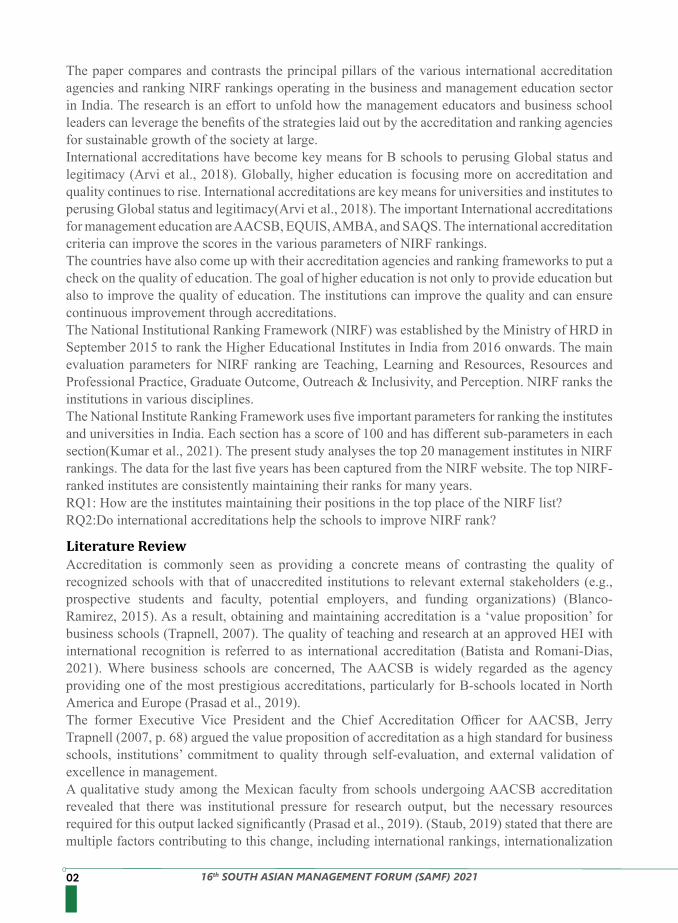
The NIRF ranking data for the last five years has been taken from the National Institutional Rankings Framework (NIRF) website developed by the Ministry of Education, Govt. of India. The top 20 ranks of the management schools have been taken for discussion. We made an initial examination of the rankings and made our inferences.The main aim of all accreditations is to improve the quality of teaching, learning, and research. The international accreditations have some positive association with the NIRF ranking. The top 20 B-schools are accredited with at least one international accreditation. There are a total of six B schools accredited with prestigious international accreditation EQUIS in India (EFMD-EQUIS, 2021). Out of these, five B schools participated in NIRF rankings and acquired positions in the top six places in the last five years of NIRF rankings. IIM-A and IIM-B are accredited with only EFMD-EQUIS, but they maintain their position at the top of the table every year.
Table: Comparison of NIRF over the last five years
Methodology and Analysis
Sr. No.
Institute Name 2021 Rank
2020 Rank
2019 Rank
2018 Rank
2017 Rank
AACSB AMBA EQUIS
1 Indian Institute of Management Ahmedabad
1 1 2 1 1 No No Yes
2 Indian Institute of Management Bangalore
2 2 1 2 2 No No Yes
3 Indian Institute of Management Calcutta
3 3 3 3 3 Yes Yes Yes
4 Indian Institute of Management Kozhikode
4 6 8 6 5 No Yes Yes
5 Indian Institute of Technology Delhi
5 8 9 8 6
6 Indian Institute of Management Indore
6 7 5 11 10 Yes Yes Yes
04 16th SOUTH ASIAN MANAGEMENT FORUM (SAMF) 2021
Being a triple crown accreditation, IIM Calcutta is consistently maintaining its third position for many years, but IIM Indore improved its rank by five positions compared to the 2017 NIRF rankings. Comparatively, the international accredited B schools improved their overall score every year. We can observe that IIM Kozhikode is also accredited EQUIS. It has improved by 4 positions in NIRF 2021 compared to the 2019 rankings. The study identified some of the common frameworks between accreditation agencies and NIRF ranking frameworks like teaching, learning, research, industry collaborations, internationalization, etc. The quality of the research is the common and important parameter in all accreditations, which is also one of the important parameters in NIRF rankings (Nielsen, 2009). Interestingly IIM Indore and MDI Gurgaon had improved their NIRF rankings over years, and these institutes were working on international accreditations for the past few years. In order to maintain consistency in NIRF rankings, schools must go for international accreditations. Through international accreditations, the schools improve the quality, infrastructure, student-faculty ratio, research, and consultancy which helps to improve NIRF rankings.
Source: (NIRF, 2021)
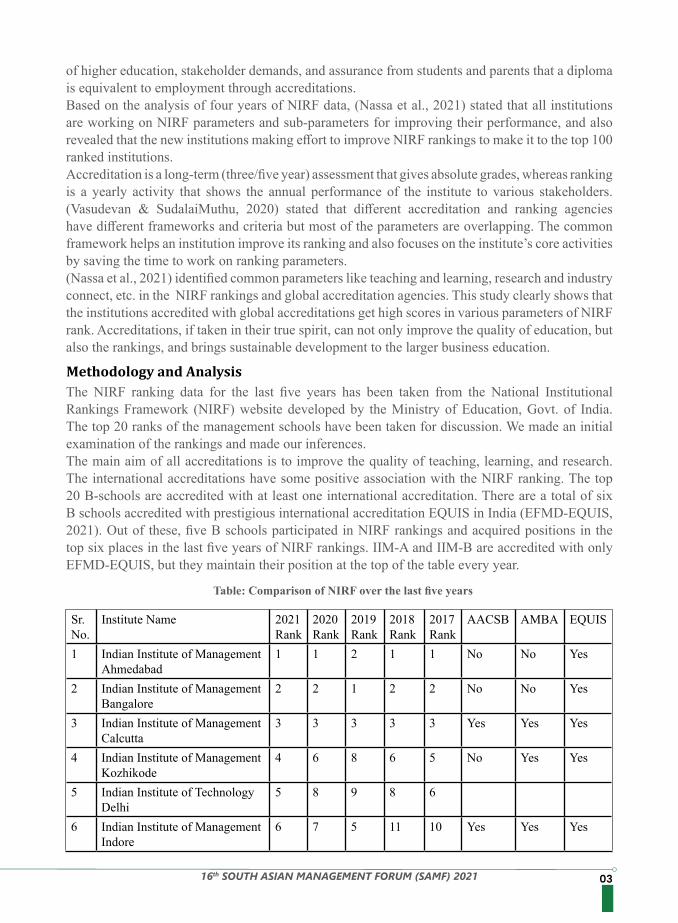
Sr. No.
Institute Name 2021 Rank
2020 Rank
2019 Rank
2018 Rank
2017 Rank
AACSB AMBA EQUIS
7 Indian Institute of Management Lucknow
7 4 4 4 4 Yes Yes No
8 Xavier Labour Relations Insti-tute (XLRI)
8 9 7 10 9 Yes Yes No
9 Indian Institute of Technology Kharagpur
9 5 6 7 7
10 Indian Institute of Technology Bombay
10 11 10 5 NA
11 Management Development Institute
11 10 12 12 16 Yes Yes No
12 National Institute of Industrial Engineering, Mumbai
12 12 29 14 12
13 Indian Institute of Technology Madras
13 14 15 NA #N/A
14 Indian Institute of Technology Roorkee
14 12 11 9 8
15 Indian Institute of Management Raipur
15 19 19 21 14
16 Indian Institute of Technology Kanpur
16 16 22 17 11
17 Indian Institute of Management Tiruchirappalli
17 15 14 15 13
18 Indian Institute of Management Udaipur
18 17 13 13 15 Yes
19 S. P. Jain Institute of Manage-ment & Research
19 18 16 19 18 Yes Yes
20 Symbiosis Institute of Business Management
20 22 20 18 #N/A Yes
0516th SOUTH ASIAN MANAGEMENT FORUM (SAMF) 2021
This research made an initial examination of the NIRF ranking ranks over the past few years, and the top 20 business schools accredited by at least one of the top international accreditations. It was observed that the schools achieving EQUIS are making it to the top in the NIRF or maintaining their position. Also, the race for accreditation is increasing among Indian business schools, but it is interesting to observe that:• For a few business schools which were among the top list in NIRF, the accreditations are more of
a self-assessment and reporting for them. This is because they received NIRF’s top rank before achieving the accreditations.
• A few business schools have significantly improved in the NIRF ranking, and this may be an outcome of the accreditation initiatives taken by the schools.
• There are a large number of schools that received accreditations and did not improve much in NIRF rankings.
It is evident from the Indian business school scenarios that the schools are taking up the accreditations. The sustainable development of quality education may majorly depend on the way the accreditations are taken up by the key stakeholders of the institutions. Accreditation criteria certainly have levers to bring change and sustainable development.No research is free of limitations and assumptions. This research makes comparisons with NIRF ranking only and assumed that the NIRF ranking framework is robust and has a wider coverage of required criteria. The results may change if the comparison is made using other reputed national and international ranking agencies’ ranks and criteria. A detailed investigation is required to understand if the accreditation initiatives have made a difference to the rankings, or if the correlation is a mere coincidence for some institutes.
1. 1. Arvi, K. A., Kettunen, K., & Sohlo, S. (2018). SHAKING THE STATUS QUO : BUSINESS ACCREDITATION AND POSITIONAL. 17(2), 203–225.
2. Batista, M. P., & Romani-Dias, M. (2021). AACSB International accreditation as a catalyst for soft skills in business schools. Journal of Education for Business, 1-7.
3. EFMD-EQUIS. (2021). www.efmdglobal.org.4. Kumar, A., Singh, K., & Siwach, A. K. (2021). NIRF India Rankings 2020 Analyzing the
Ranking Parameters and Score of Top 100 Universities. DESIDOC Journal of Library & Information Technology, 41(5), 385–390. https://doi.org/10.14429/djlit.41.5.16452
5. Nassa, A. K., Arora, J., Singh, P., Joorel, J. P. S., Solanki, H., Kumar, A., & Trivedi, K. (2021). Five years of India rankings and its impact on performance parameters of engineering educational institutions in India. Pt.1. teaching, learning, and resources, graduate outcome, outreach and inclusivity, and perception. DESIDOC Journal of Library and Information Technology, 41(1), 20–36. https://doi.org/10.14429/DJLIT.41.1.16675
6. Nielsen, P. (2009). Coastal and estuarine processes. In Coastal And Estuarine Processes (pp. 1–360). https://doi.org/10.1142/7114
7. NIRF. (2021). National Institutional Ranking Framework.8. Prasad, A., Segarra, P., & Villanueva, C. E. (2019). Academic life under institutional pressures
for AACSB accreditation: Insights from faculty members in Mexican business schools. Studies in Higher Education, 44(9), 1605-1618.
9. Ramírez, G. B. (2015). International accreditation as global position taking: An empirical
Conclusion and Future Research Directions
References
06 16th SOUTH ASIAN MANAGEMENT FORUM (SAMF) 2021
exploration of US accreditation in Mexico. Higher Education, 69(3), 361-374.10. Staub, D. (2019). ‘Another accreditation? what’s the point?’ effective planning and
implementation for specialized accreditation. Quality in Higher Education, 25(2), 171–190. https://doi.org/10.1080/13538322.2019.1634342
11. Trapnell, J. E. (2007). AACSB International accreditation: The value proposition and a look to the future. Journal of Management Development.
12. Vasudevan, N., & SudalaiMuthu, T. (2020). Development of a common framework for outcome-based accreditation and rankings. Procedia Computer Science, 172, 270–276. https://doi.org/10.1016/J.PROCS.2020.05.043
0716th SOUTH ASIAN MANAGEMENT FORUM (SAMF) 2021
Vertical integration is a strategy that allows a company to streamline its operations by taking direct ownership of various stages of its production process rather than relying on external contractors or suppliers. A company may achieve vertical integration by acquiring or establishing its suppliers, manufacturers, distributors, or retail locations rather than outsourcing them. As the company has the option to go for vertical integration at any of the stages, it creates an ambiguous situation and that is why vertical integration has never been a well-understood phenomenon at what stage it has to be achieved. A company that is considering vertical integration needs to consider which is better for the business in the long run. For example, a group of industries may concentrate on spinning out of several businesses and decides to go vertical with the spinning, then he will have to go from spinning to knitting to denim fabric manufacturing and finally garmenting. This can be regarded as transferring risk from product market to factor market as it creates a strong private incentive for vertical integration.The aim of transferring an investment from one stage to another by the company is attributed
to businesses always looking for methods to reduce costs and control the quality of the products and services they provide. A company can create a competitive advantage by integrating different stages of its production process and supply chain into its business. This transfer of investment from one stage to another is regarded as a means of transferring risk from one sector of the economy to another through uncertainty. At a more theoretical level, several authors concerned with industrial organizations suggested that uncertainty looms large which provides an incentive for vertical integration.The focus of this paper is to show that company owners through vertical integration transfer risk
from product market to factor market are doing the entire gamut through uncertainty. This results in most cases failure to improve the quality of products, decrease the cost of production, and above all unable to create a competitive advantage. An individual firm never knows exactly what demand for its product will be each day, even if the total demand for the industry is unchanging. Since production is not instantaneous, firms must make production decisions before observing demand, and hence take a risk of either overproducing or underproducing.
Vertical integration has attracted a great deal of research attention from multiple disciplines like strategic management and organizational economics where researchers have made significant contributions toward understanding this concept (Mahoney, 1992). Balmaceda&Saavedra (2003) noted the increasing worldwide trend to liberalize markets and introduce competition for services that were previously provided by monopolists. As so many industries under the same category are being sprung up in the competitive market, the only goal of the industries is to produce goods and services at the lowest cost compared to their competitors, leaving the idea of doing monopoly
Abstract
Introduction:
Md. Lutfar Rahman*, Registrar and ProfessorMd Adnan Rahman*, Senior Lecturer*College of Business Administration (CBA), IUBAT—International University of Business Agriculture and Technology, Dhaka, Bangladesh
VERTICAL INTEGRATION—IS IT NECESSARY FOR ALL MANUFACTURING INDUSTRIES?
Keywords: Strategy, Competitive Advantage, Uncertainty, Product Market, Factor Market.
08 16th SOUTH ASIAN MANAGEMENT FORUM (SAMF) 2021
business rather than trying to enjoy a competitive advantage. Goods and services are abundantly produced through competition and hence the trend towards liberalization and the introduction of competition in markets with important facilities have in many cases resulted in the vertical integration process that has led the owners of these facilities to become directly involved in serving final customers. For instance, it is now common to see port operators integrated with shipping companies, oil and natural gas transportation companies integrated with distribution companies and hospitals, and/or health plans affiliating with medical clinics and physicians (Taglioni& Nielson, 2004). Companies that are in a monopolistic position have multidimensional facilities that facilitate the company to grow faster. If the other companies with large capacity want to share the facility of the monopolistic incumbent company, they must get the access to integrate vertically with the incumbent monopolistic company. In this article, we mainly explore the necessity to share the monopoly’s offer to enjoy its facility with a potential entrant might be his strategic decision aimed at installing more complete and competitive entry into the industry as a supplier, buyer, or substitute producer of the incumbent’s product.Vertical integration of enterprises is a way of transferring the economic process from one
organizational form to another, which results in the replacement of technological expansion of the enterprise by the quality regulation of the price chain regulation. In addition, when a business is vertically integrated, a more productive moving icon can be changed. At the same time, the enterprise does not seek to maximize profits by focusing on centrifugal guidelines but focuses on improving the quality of products and ensuring its competitiveness (Sobirovna&O’rinboyevich 2019).
Beard, T. R., Kaserman, D. L., & Mayo, J. W. (2001) noted that in any vertical integration strategy, conscious (or unconscious) decisions are made regarding:
(1) The breadth of integrated activities undertaken; (2) The number of stages of integrated activities; (3) The degree of internal transfers for each vertical linkage; and (4) The form of ownership used to control the vertical relationship.
Policy interest in vertical integration has been concerned mainly with the possibility that integration can be used strategically to achieve anticompetitive effects. In the absence of a more substantial theoretical foundation, vertical integration, as a public policy matter, is typically regarded as having dubious, if not outright antisocial properties. Technological interdependencies, or possibly, observational economies, constitute the principal exceptions (Williamson1971).Zhang, D. (2013) Oracle acquired Sun in 2010 and since that time Oracle has transformed into
a maker of software, computers, and computer components – a company more likely the highly vertically integrated companies of the 1960s than the detailed fragmented technology industry of recent years. This is especially surprising since it happens in the technology industry, where specialization and outsourcing have dominated for decades. Apple is another example of a highly vertically integrated organization in the information technology sector. The company owns the designs of its computer hardware, accessories, operating system, and much of its software itself. In some other businesses such as the oil industry, many multinational companies such as ExxonMobil, Shell, and BP almost own the whole supply chain, which includes everything from the oil drilling, the transportation of crude oil, and the refining and distribution process to company-owned retail
Literature Review
0916th SOUTH ASIAN MANAGEMENT FORUM (SAMF) 2021
Argüelloet al. (2019) found that four key factors are hypothesized to affect the vertical integration strategies that firms embrace: (1) Forces propelling industry evolution and exacerbating demand uncertainty; (2) The nature of competition in the linked industries; (3.) The bargaining power of suppliers or distributors (and customers); and (4) Corporate strategy requirements.
1. Demand Uncertainty.2. Creating Credibility for New Industries3. Volatility of Competition4. Product Traits5. Supplier Traits6. Consumer Traits7. Manufacturing Technology TraitsSource: Harrigan, K. R. (1984)
If the business structure of a company is vertically integrated, there are aspects on which it can be disintegrated. The companies integrate their supply chain for superior reasons and later, with In the absence of an updated business structure, they tend to disintegrate. The emerging-market will increasingly pressurize integrated companies to restructure their integration. Similarly, disintegration occurs when a company is not able to reach its desired profitability level in the business market (SITUMORANG, D. T. (2020).Rodríguez-Rodríguez et al., (2020) found the risk that the companies may face is that they must
invest a huge capital amount to set up or buy the distributor or supplier channel. Followed by that a proper follow-up must be intimated to run and maintain the business efficiently, if not it leads to a huge loss of the business. Vertical integration reduces the company’s flexibility which
Factors Affecting Vertical Strategies
Forces of Propelling Industry Evolution:
stations in the local communities. Others moving toward vertical integration recently (in the past five years) includes some big companies such as PepsiCo Inc., General Motors Co., and Boeing Co. Each of the companies has its strategic reasons for moving toward this direction. The companies tend to gain more control of raw materials, distribution or manufacturing across the supply chain. This trend and phenomenon of going back to vertical integration from outsourcing motivate this study on the strategic changes of vertical integration. Vertical integration is usually viewed as the extent to which a firm controls the production of its inputs or supplies and the distribution of its outputs or finished products (Fernandes and Tang, 2012). It involves a variety of decisions concerning whether corporations should provide certain goods or services in-house or purchase them from outside firms. Over the years, vertical integration is used to serve different strategic objectives. He calculates vertical integration level as the ratio of the number of vertically integrated segments
over the total number of segments. According to Harrigan (1984), the choice of the appropriate measure depends on the dimension of vertical integration being studied. In her research, Harrigan also identified four dimensions of vertical integration: breadth of integrated activities, stages of integrated activities, degree of integration, and form of ownership.
10 16th SOUTH ASIAN MANAGEMENT FORUM (SAMF) 2021
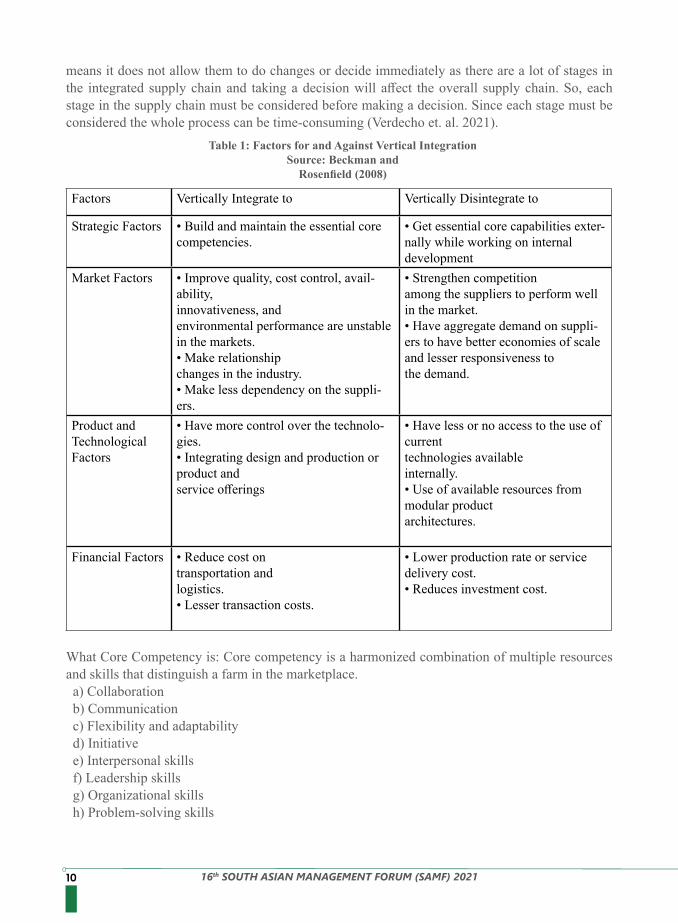
means it does not allow them to do changes or decide immediately as there are a lot of stages in the integrated supply chain and taking a decision will affect the overall supply chain. So, each stage in the supply chain must be considered before making a decision. Since each stage must be considered the whole process can be time-consuming (Verdecho et. al. 2021).
Table 1: Factors for and Against Vertical IntegrationSource: Beckman and
Rosenfield (2008)
Factors Vertically Integrate to Vertically Disintegrate to
Strategic Factors • Build and maintain the essential core competencies.
• Get essential core capabilities exter-nally while working on internaldevelopment
Market Factors • Improve quality, cost control, avail-ability,innovativeness, andenvironmental performance are unstablein the markets.• Make relationshipchanges in the industry.• Make less dependency on the suppli-ers.
• Strengthen competitionamong the suppliers to perform well in the market.• Have aggregate demand on suppli-ers to have better economies of scale and lesser responsiveness tothe demand.
Product and Technological Factors
• Have more control over the technolo-gies.• Integrating design and production or product andservice offerings
• Have less or no access to the use of currenttechnologies availableinternally.• Use of available resources from modular productarchitectures.
Financial Factors • Reduce cost ontransportation andlogistics.• Lesser transaction costs.
• Lower production rate or service delivery cost.• Reduces investment cost.
What Core Competency is: Core competency is a harmonized combination of multiple resources and skills that distinguish a farm in the marketplace.a) Collaborationb) Communicationc) Flexibility and adaptabilityd) Initiativee) Interpersonal skillsf) Leadership skillsg) Organizational skillsh) Problem-solving skills
1116th SOUTH ASIAN MANAGEMENT FORUM (SAMF) 2021
The driving factors that influence vertical integration are the external factors and the potential benefits. Schumpeter, J. A. (2017) argued that external factors such as technical complexity are the high infiltration rates and longer item life traverses make the number of items being used somewhat bigger than the number of items sold in whatever year. Hence, a huge part of significant worth added exercises has moved away from assembling towards keeping up with and overhauling existing items. The demands are where clients focus inclining further toward their center capabilities and progressively depend on their providers to give arrangements that can be incorporated into the organization’s processes (Osegowitsch and Madhok, 2003). Elements under the potential benefits work as the driving force for vertical integration. In
differentiation, the utilization of appropriation administrations for product separation is particularly important for products that are difficult to separate by their own ascribes, either due to an absence of physical contrasts or on the ground that shoppers don’t see any huge contrasts (Anderson and Narus, 1995). Downstream coordination works with providers’ admittance to both data and information about clients. This information stretches out past understanding into what clients need to a top to bottom comprehension of why specific contributions are viewed as attractive by the client, how best to give them, what’s more, what future contributions may resemble ((Osegowitsch and Madhok, 2003). Strategic partnership with customers is the administration contributions in the client interface furnish the provider with an incredible method for holding and growing business
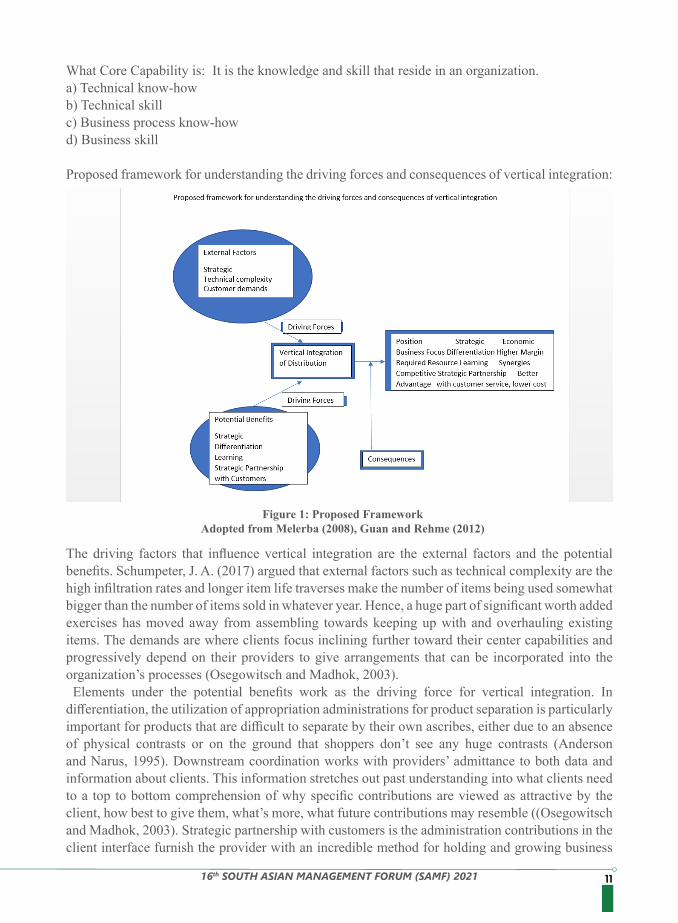
What Core Capability is: It is the knowledge and skill that reside in an organization.a) Technical know-howb) Technical skillc) Business process know-howd) Business skill
Proposed framework for understanding the driving forces and consequences of vertical integration:
Figure 1: Proposed FrameworkAdopted from Melerba (2008), Guan and Rehme (2012)
12 16th SOUTH ASIAN MANAGEMENT FORUM (SAMF) 2021
with their generally important clients. This sets out potential open doors for organizations to turn into more essential colleagues with clients, along these lines of improving client maintenance (Anderson and Narus, 1995).An organization’s supply chain situating strategy has additionally been viewed as a significant
inside main impetus of downstream upward reconciliation since the position in the store network influences the organization’s capacities and jobs, required assets, added esteem, and upper hands (Nicovich and Dibrell, 2007). Among the three principal phases of the supply chain –for example, acquisition, creation, and dispersion (Thomas and Griffin, 1996) – downstream distribution business conveys the potential for selling more items (Mathe and Shapiro, 1993).
The above article made the focus on various types of industries, some of which want to do monopolistic business while others want to produce goods and services at the lowest cost to enjoy a competitive advantage. Downstream integration plays an important role for manufacturing firms in several ways. First, it can help firms to secure the distribution channels of their products, especially in markets with increased uncertainties. Second, it can offer a way to control efficiency gains and cost reductions in the supply chain. Lastly, downstream markets can offer important benefits in addition to large new sources of revenue. Downstream operations refer to the final processes in the production and sale of goods, where finished products are created and sold to consumers. Sales may be at the wholesale level, business-to-business (B2B), or at the retail level, business-to-consumers. Most of the manufacturing organizations in Bangladesh follow downstream integration.
1. Anderson, J. C., &Narus, J. A. (1995). Capturing the value of supplementary services. Harvard Business Review, 73(1), 75-83.
2. Argüello, D., Chavez, E., Lauryssen, F., Vanderschueren, R., Smolders, E., &Montalvo, D. (2019). Soil properties and agronomic factors affecting cadmium concentrations in cacao beans: A nationwide survey in Ecuador. Science of the Total Environment, 649, 120-127.
3. Balmaceda, F., &Saavedra, E. (2003).Vertical integration and shared facilities in unregulated industries. Available at SSRN 585424.
4. Beard, T. R., Kaserman, D. L., & Mayo, J. W. (2001). Regulation, vertical integration, and sabotage. The Journal of Industrial Economics, 49(3), 319-333.
5. Beckman, S. L., &Rosenfield, D. B. (2008). Operations strategy: competing in the 21st century. McGraw-Hill.
6. Fernandes, A. P., & Tang, H. (2012). Determinants of vertical integration in export processing: Theory and evidence from China. Journal of Development Economics, 99(2), 396-414.
7. Guan, W., &Rehme, J. (2012). Vertical integration in supply chains: driving forces and consequences for a manufacturer’s downstream integration. Supply chain management: An International Journal.
8. Harrigan, K. R. (1984). Formulating vertical integration strategies. Academy of management review, 9(4), 638-652.
9. Mahoney, J. T., &Pandian, J. R. (1992).The resource‐based view within the conversation of strategic management. Strategic management journal, 13(5), 363-380.
10. Malerba, F., Nelson, R., Orsenigo, L., &Winter, S. (2008). Vertical integration and disintegration of computer firms: a history-friendly model of the coevolution of the computer
Conclusion
References
1316th SOUTH ASIAN MANAGEMENT FORUM (SAMF) 2021
and semiconductor industries. Industrial and Corporate Change, 17(2), 197-231.11. Mathe, H., & Shapiro, R. D. (1993). Integrating service strategy in the manufacturing company.
Chapman & Hall.12. Nicovich, S. G., Dibrell, C. C., & Davis, P. S. (2007). Integration of Value Chain Position
and Porter’s (1980) Competitive Strategies into the Market Orientation Conversation: An Examination of Upstream and Downstream Activities. Journal of Business & Economic Studies, 13(2).
13. Osegowitsch, T., &Madhok, A. (2003). Vertical integration is dead, or is it?. Business Horizons, 46(2), 25-34.
14. Rodríguez-Rodríguez, R., Alfaro-Saiz, J. J., &Carot, J. M. (2020).A dynamic supply chain BSC-based methodology to improve operations efficiency. Computers in Industry, 122, 103294.
15. Schumpeter, J. A. (2017). The Theory of Economic Development: An Inquiry into Profits, Capita I, Credit, Interest, and the Business Cycle. Routledge.
16. SITUMORANG, D. T. (2020). FORWARD INTEGRATION ANALYSIS INTO MORTAR INDUSTRY AT PT. PUTRI INDAH PERTIWI (Doctoral dissertation, UniversitasGadjahMada).
17. Sobirovna, D. K., &O’rinboyevich, A. A. (2019). Directions for increasing product competitiveness in industrial enterprises. Asian Journal of Multidimensional Research (AJMR), 8(7), 29-35.
18. Taglioni, D., & Nielson, J. (2004). Services trade liberalization: identifying opportunities and gains.
19. Thomas, D. J., & Griffin, P. M. (1996). Coordinated supply chain management. European journal of operational research, 94(1), 1-15.
20. Verdecho, M. J., Alarcón-Valero, F., Pérez-Perales, D., Alfaro-Saiz, J. J., & Rodríguez-Rodríguez, R. (2021).A methodology to select suppliers to increase sustainability within supply chains. Central European Journal of Operations Research, 29(4), 1231-1251.
21. Williamson, O. E. (1971). The vertical integration of production: market failure considerations. The American Economic Review, 61(2), 112-123.
22. Zhang, D. (2013). The revival of vertical integration: strategic choice and performance influences. Journal of management and strategy, 4(1), 1
14 16th SOUTH ASIAN MANAGEMENT FORUM (SAMF) 2021
THE ROLE OF A. I., POST PANDEMIC, EMPLOYEES’ ENGAGEMENT AND THE CHALLENGES OF IMPLEMENTING HR
STRATEGIES IN BANGLADESHI SUPPLY CHAIN COMPANIES
Keywords: pandemic, A.I., Employee’s engagement, barriers, strategies, Supply Chain Management, Bangladesh
Bangladesh will be a Muslim, Rising, and Least Developed Country in Southeast Asia by 2026, according to the United Nations. Aside from the fact that it is a densely populated nation, work prospects are limited. Due to the low cost of labor in urban regions, a great number of businesses have sprung up in recent years. As a consequence, in order to stay competitive, businesses take advantage of possibilities to hire workers at a cheap cost. The company and its workers confront a number of hurdles in order to stay afloat in the marketplace, notably during Covid 19 and the immediate post-pandemic period that follows. Everything has escalated in price due to the epidemic and the prolonged ship blockade of Suage Khal, and import-export operations have been constrained all across the globe as a consequence. Aviation, marine, transportation, logistics, and supply chain management are some of the most promising areas. Business owners are less concerned about their workers since they have the power to enforce a few practical restrictions as well as place some hurdles in their path. As a consequence, people put in less effort and are less engaged in their jobs. Work-at-home employees are also more stressed than those who do not. To guide our study, we develop a conceptual model and hypotheses, as well as a descriptive research design and quantitative research methods. With a sample size of 310 persons and workers as the unit of analysis, we performed our research among supply chain management firms (private enterprises) in the Dhaka metropolitan region. The data was collected digitally through a Google survey form with a Likert scale ranging from 1 to 5 stars. After undertaking data gating, data screaming, and SPSS 23.00 and Smart PLS 3.3.3 version analysis, the researchers will put their plan into action.
Even though Bangladesh’s service industry accounts for 52.09 percent of GDP, the quality and productivity of the service sector have declined (Azad, Raju, and Islam 2021). In Bangladesh’s service industry, employee performance is a major issue, notably in the supply chain, courier, and transportation industries. There is a clear correlation between the number of people employed in service sectors and the amount of productivity they produce. As a result, workers are highly sought-after assets since they are always providing a service to customers. The effectiveness of a company’s personnel affects both the level of satisfaction received by its customers and its overall profit margin. The recent opening of a drop-in service department has caused an increase in animosity among company owners (Azad, Islam 2021).
The Ministry of Expatriates’ Welfare and Overseas Employment (MoEWOE) is responsible for activities related to Bangladeshi expatriates, such as retaining existing labor markets and exploring new ones, coordinating regional and global organizations related to labor migration, and maintaining a database of workers and migrant workers (Karim,2021), Employer participation
Abstract
Introduction
Background of Study and Industry
Abul Kalam Azad1 Dr. Valliappan Raju2
Limkokwing University of Creative Technology, Malaysia1,2
1516th SOUTH ASIAN MANAGEMENT FORUM (SAMF) 2021
People are encouraged to do investigations for many reasons. This is a common issue among psychology students deciding which courses to take and how to complete their undergraduate degrees. It’s easy to dismiss a topic like this as trivial, but it’s an important one that students should explore. The importance of a research effort must be established (Hedrick et al. 2018). Research is vital in many sectors, including academia. As public health improves, jobs and lifestyles become more hygienic. This activity is a desire for information and to better one’s overall quality of life. It shows how to solve problems using scientific and logical reasoning skills. It is a thorough process that occurs when new information is uncovered. The study has benefited society, organizations, and the nation overall (Salvia et. all., 2019 ).
During Covid 19 and the post-pandemic period, both the company and its personnel battle to preserve their market leadership positions. Because of the epidemic and the constant Suez Canal ship blockade, prices have risen and global trade has been restricted. It is widely used in the transportation, logistics, and supply chain sectors (Service Industry). They construct a few operational procedures while also creating a few hurdles in their workers’ route of advancement. As a consequence, people work less hard and show less excitement. Employees who work from home are more anxious than office workers. Flexible work arrangements add additional hours of labor, stress, and effort to employees’ tasks while requiring them to keep in touch with clients. Each of these characteristics is dependent on employee engagement and the organization’s particular approach.
1. To explore the role of A. I., post-pandemic, employee engagement, and the challenges of implementing HR Strategies in Bangladeshi Supply Chain Companies.
2. To identify the organizational barriers to the employee difficulties to make a better performance at the supply chain management companies in Bangladesh.
3. To demonstrate Implementing the strategies at supply chain management companies in Bangladesh.
A “labor-management relationship” is a term used to describe the interactions that take place between workers and their employers while they are at work (LMR). Its primary objectives are the prevention of labor conflicts and the establishment of harmonious working relationships between workers and management (Chowdhury et. all., 2019). As a result, the contributions that Elton Mayo made to management are examined through a lens that is titrated to the sense of his period. This results in a more accurate understanding of Mayo and his work, as well as a more accurate picture illustrating his significant impact on the field of HRM (Muldoon et. all., 2020).
Significance
Problem Statement
Research Objective
Literature Review and Hypothesis Development
in decision-making, industrial democracy, and job involvement in different corporate issues are all techniques typically used by entrepreneurs who struggle with workforce management, particularly in the supply chain industry (Islam, Azad 2021). Supply chain management (SCM) is a new paradigm that pulls together all of the value-creating themes in supply, manufacturing, and distribution innovations from raw materials to end-user consumption. The internet enables the quick upstream transmission of end-user demands across the different supply chain processes at varying tiers (Ahmed et. all, 2018).
16 16th SOUTH ASIAN MANAGEMENT FORUM (SAMF) 2021
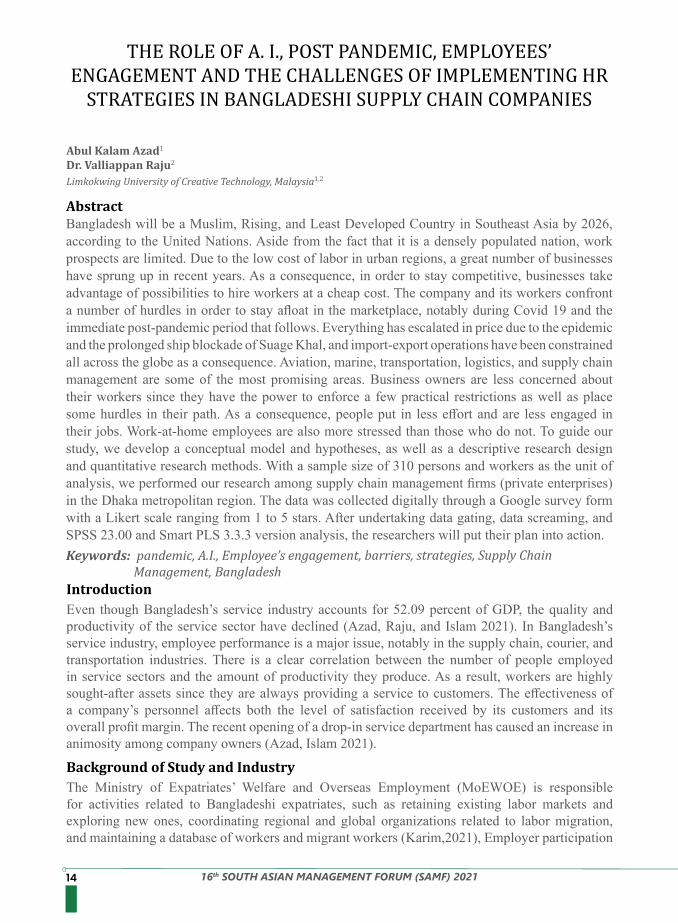
By the year 2021, all theoretical advances in the area of information sciences will have been achieved, signifying the conclusion of theoretical development in the discipline. Unprecedented application of good theoretical underpinnings in the real world has been achieved. Theory, on the other hand, can be threatening and oppressive, particularly when it is portrayed as the one truth rather than as one of many possible ends or outcomes (Sonnenwald, D.H., 2021). We investigated two of our hypotheses to assess them and discovered that they were both incorrect. There are two plausible reasons for this phenomenon, which are as follows:A. AMO TheoryB. Self-Determination Theory
Figure 01: AMO theory, Source: Study.com
Per the AMO theory, the results of this research contribute to the body of knowledge on the elements that impact individual scientific performance at the level of employee involvement. According to the AMO hypothesis, an individual’s voluntary endeavor is impacted by his or her ability, motivation, and opportunity to participate in a certain activity, among other factors (Alba et. all, 2021). A work system has three main components, according to the author, each of which has an impact on the characteristics of workers. Even though employees may be very skilled and driven, if they do not have the chance to contribute, or if they do not flourish, their employee productivity will be raised beyond that of their teammates (Alba et. all, 2021).
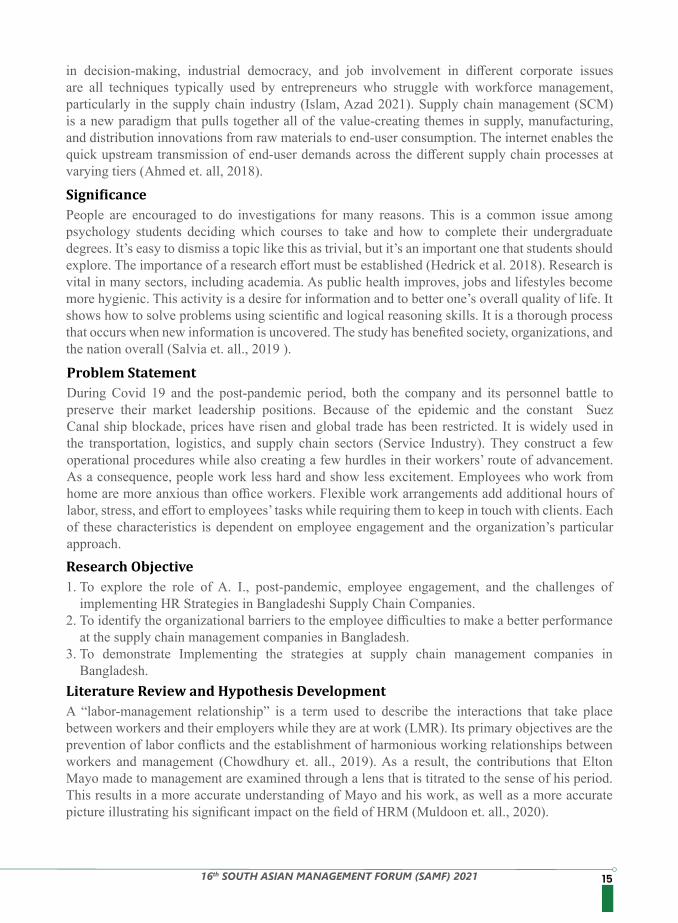
SDT, which is a wide theory of human motivation and personality that spans various subfields, is based on people’s basic psychological needs and development tendencies at its heart. Regardless of whether or not they are directly influenced by the behaviors in issue, it is concerned with the reasons that drive people’s activities. When it comes to self-motivation and drive, SDT is especially interested in how people approach their life (Meyer, J.P., and Gagne, M., 2008).
Theory Development
Theory Development
Self – Determination Theory:
1716th SOUTH ASIAN MANAGEMENT FORUM (SAMF) 2021
Figure 02: Self – Determination Theory, Source: google image
The distinction between autonomous and controlled motivation is critical to the research of SDT. In accordance with SDT, autonomous and controlled motives vary in terms of both the underpinning regulatory mechanisms and the feelings that follow them, and actions may be classed according to how autonomous or managed they are in accordance with SDT. In the absence of both purposes and motivation, motivation is defined as a state of being indifferent. Autonomous and regulated motivation, on the other hand, is characterized by acts that are both deliberate and methodical (Gagné, 2005).
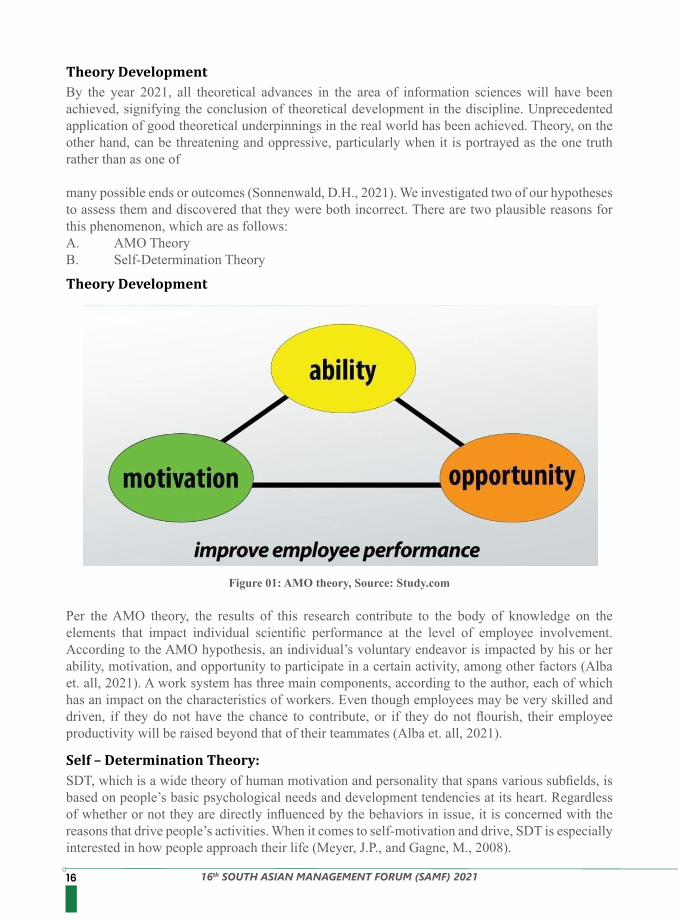
Figure 03: Conceptual Framework and Model for the Study
Conceptual Framework
18 16th SOUTH ASIAN MANAGEMENT FORUM (SAMF) 2021
Hypothesis Development
Research Methodology
Research Design and Methods
The most common starting point for research initiatives is the identification of a problem. For questions and goals to be used as well as hypotheses to be developed, it is required to revise and clarify the issue statement or study topic. Hypotheses that are not supported by evidence are those that propose an explanation for a set of facts that may be investigated further via research. The formulation of hypotheses should be in the form of statements rather than questions. A graph is a representation of the connection between two or more variables that may be measured in one way or another. Testing implications for all of the links supplied above should be immediately evident (Mourougan, 2017).H1: Post pandemic has a positive effect on the Level of Barriers H2: A.I. has a positive effect on the Level of BarriersH3: Employee Engagement has a positive effect on the Level of BarriersH4: Post pandemic has a positive effect on the Level of Barriers through Implementing of StrategiesH5: A.I. has a positive effect on the level of barriers through Implementing StrategiesH6: Employees Engagement has a positive effect on the level of barriers through Implementing
StrategiesH7: Level of Barriers has a positive effect on Implementing Strategies All hypotheses are accepted.
As a general rule, quantitative research is concerned with a systematic and empirical investigation of phenomena. It also involves numerical data processing, which is performed via the use of statistics and mathematics. Making educated guesses about numbers is a crucial step in quantitative research because it bridges the gap between empirical evidence and mathematical articulation of the connection between variables. It is common practice while doing quantitative research to choose and assess data in a numerical format ( Basias., 2018). In most circumstances, the most frequent purpose of empirical research is to achieve one of the two outcomes that have been identified. According to theoretician Filippini, one may either postulate one’s theory or utilize empirical data to judge an existing or newly presented theory that has been offered based on empirical evidence that has been offered by others ( Soni,et. all., 2012).
In the research area, there are so many research designs like:A. DescriptiveB. CorrelationalC. Causal - ComparativeD. Experimental
We selected a descriptive research design for this study. In research fields, there are many research methods like:A. QuantitativeB. QualitativeC. Mix MethodD. Multimethod
But for this study, we selected the quantitative method
1916th SOUTH ASIAN MANAGEMENT FORUM (SAMF) 2021
Population, Sampling, and Unit of Analysis
Results
Respondents Profile
Data Analysis Procedure
The study population is all Dhaka cities private Supply Chain Management companies and the sample size is 310 executive employees. Data were collected digitally online using the google survey form on a Likert scale of 1 to 5.
This chapter examines statistical data and summarizes the intended study’s conclusions. The popular SmartPLS software application was used to analyze the statistical data using Structural Equation Modelling. SE M is used to analyze things under a microscope (SEM). This method is now widely employed in many fields, not only in social work. It’s also been employed in many other disciplines of research (ANJUM, et. all 2021).
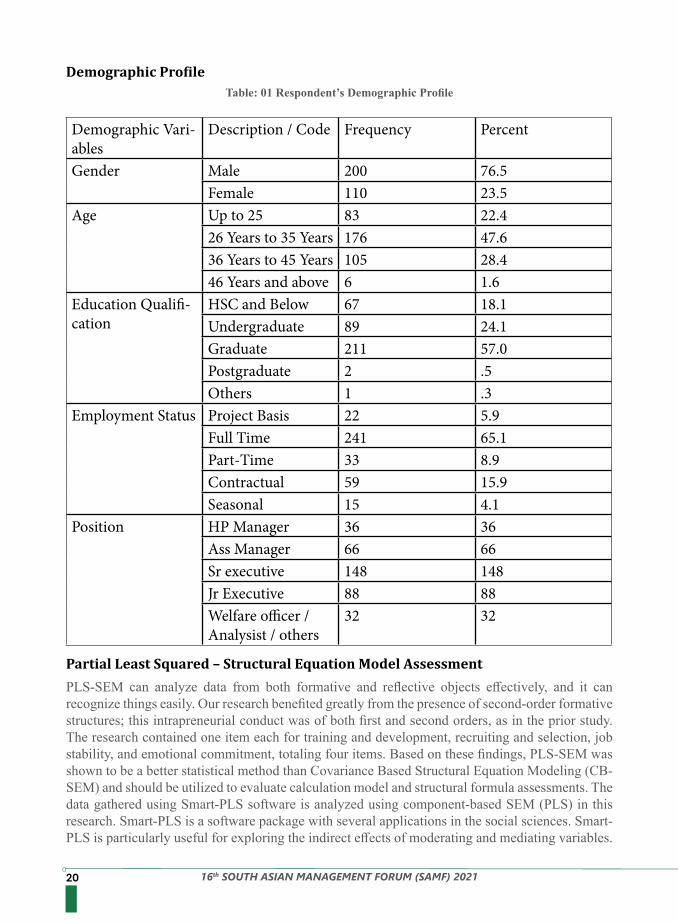
Table 1 shows that the number of male respondents (n 200) outnumbers the number of female respondents (n 110). This is prevalent in Bangladesh, where women’s participation in traditional jobs is significantly lower than in the US (Islam & Kalimuthu, 2020). The most common age range for answers is 26-45. Since they make up the majority of the population, this group is vital to the study’s success. The study received data from up to 65 percent of full-time workers, demonstrating they prioritize the company’s success above their own.
SmartPLS 3.3.3 was used to analyze the data. Nowhere else is an available program for creating route maps. PATH MODELS were used to graphically represent the hypotheses and variable correlations that must be evaluated while collecting data using a SEM ( ANJUM, et. all 2021 ). To deploy unobserved (latent) variables, this program adds or deletes the structural model for them. The application calculates the coefficients and includes them in the final plot design. Any number of data types and settings may be dealt with. Exogenous or independent variables are assessed as latent variables in the structural model using the PLS procedure (i.e. hidden variables). Workgroups, company stimulation, freedom, and resources are some examples. Employers, supervisors, and demanding occupations are examples of inhibitors. Instead, tension, involvement, and other difficult conditions are included in complexity creation. Interdependence, heterogeneity, motivation, and mental health must all be addressed. It was built with imagination (i.e., endogenous and dependent). A number of tools for evaluating algorithms, bootstrapping, and techniques are available in SmartPLS. One identifies and creates model parameters that maximize variance across dependent variables ( ANJUM, et. all 2021 ).
20 16th SOUTH ASIAN MANAGEMENT FORUM (SAMF) 2021
Demographic Profile
Partial Least Squared – Structural Equation Model Assessment
Table: 01 Respondent’s Demographic Profile
Demographic Vari-ables
Description / Code Frequency Percent
Gender Male 200 76.5Female 110 23.5
Age Up to 25 83 22.426 Years to 35 Years 176 47.636 Years to 45 Years 105 28.446 Years and above 6 1.6
Education Qualifi-cation
HSC and Below 67 18.1Undergraduate 89 24.1Graduate 211 57.0Postgraduate 2 .5Others 1 .3
Employment Status Project Basis 22 5.9Full Time 241 65.1Part-Time 33 8.9Contractual 59 15.9Seasonal 15 4.1
Position HP Manager 36 36Ass Manager 66 66Sr executive 148 148Jr Executive 88 88Welfare officer / Analysist / others
32 32
PLS-SEM can analyze data from both formative and reflective objects effectively, and it can recognize things easily. Our research benefited greatly from the presence of second-order formative structures; this intrapreneurial conduct was of both first and second orders, as in the prior study. The research contained one item each for training and development, recruiting and selection, job stability, and emotional commitment, totaling four items. Based on these findings, PLS-SEM was shown to be a better statistical method than Covariance Based Structural Equation Modeling (CB-SEM) and should be utilized to evaluate calculation model and structural formula assessments. The data gathered using Smart-PLS software is analyzed using component-based SEM (PLS) in this research. Smart-PLS is a software package with several applications in the social sciences. Smart-PLS is particularly useful for exploring the indirect effects of moderating and mediating variables.
2116th SOUTH ASIAN MANAGEMENT FORUM (SAMF) 2021
Smart-PLS is very beneficial in studies of moderating and mediating variables ( Macias de Anda, E., 2018 ) .
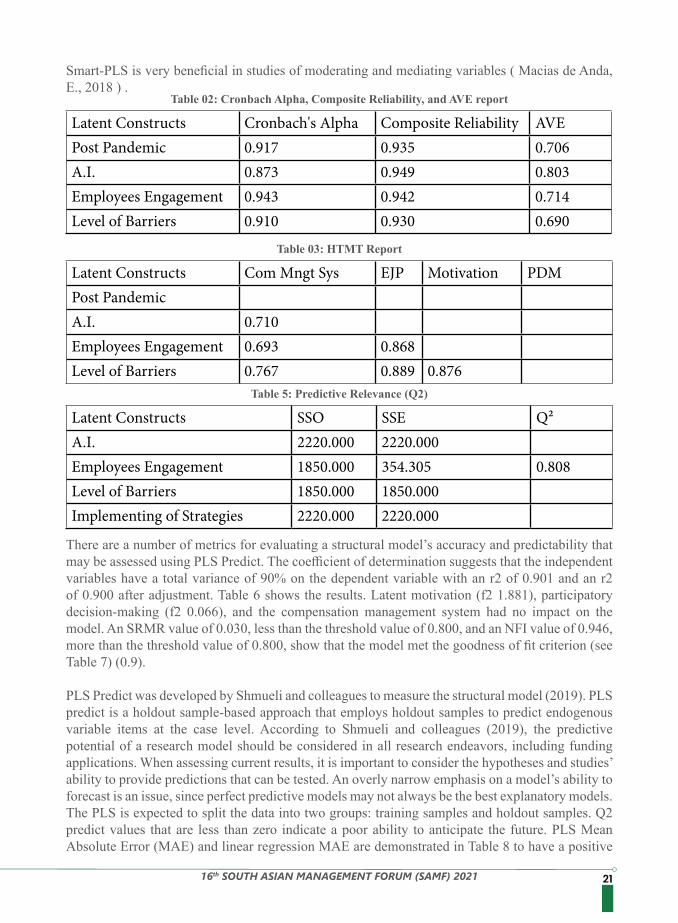
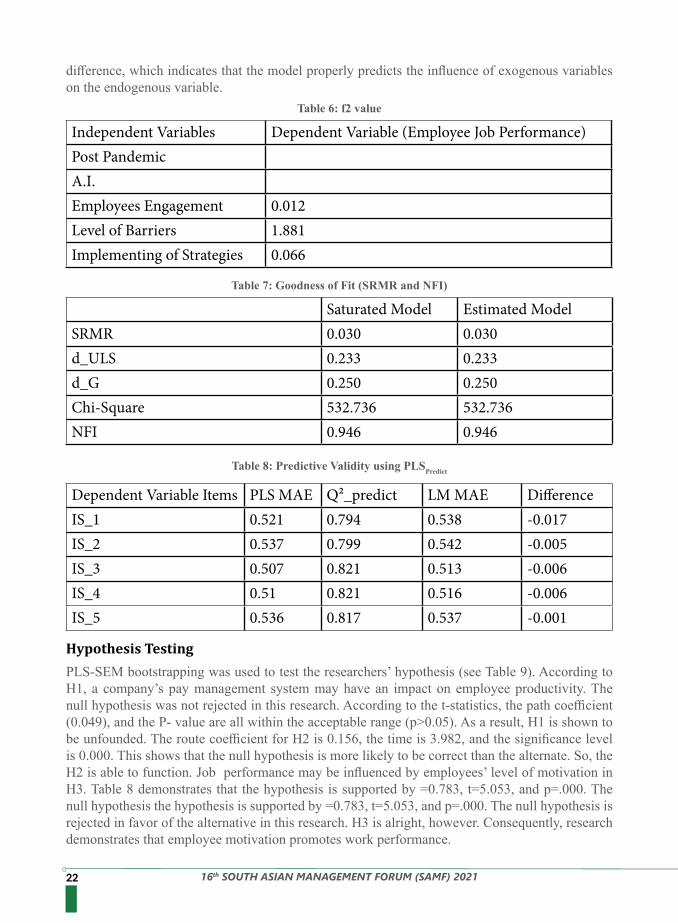
There are a number of metrics for evaluating a structural model’s accuracy and predictability that may be assessed using PLS Predict. The coefficient of determination suggests that the independent variables have a total variance of 90% on the dependent variable with an r2 of 0.901 and an r2 of 0.900 after adjustment. Table 6 shows the results. Latent motivation (f2 1.881), participatory decision-making (f2 0.066), and the compensation management system had no impact on the model. An SRMR value of 0.030, less than the threshold value of 0.800, and an NFI value of 0.946, more than the threshold value of 0.800, show that the model met the goodness of fit criterion (see Table 7) (0.9).
PLS Predict was developed by Shmueli and colleagues to measure the structural model (2019). PLS predict is a holdout sample-based approach that employs holdout samples to predict endogenous variable items at the case level. According to Shmueli and colleagues (2019), the predictive potential of a research model should be considered in all research endeavors, including funding applications. When assessing current results, it is important to consider the hypotheses and studies’ ability to provide predictions that can be tested. An overly narrow emphasis on a model’s ability to forecast is an issue, since perfect predictive models may not always be the best explanatory models. The PLS is expected to split the data into two groups: training samples and holdout samples. Q2 predict values that are less than zero indicate a poor ability to anticipate the future. PLS Mean Absolute Error (MAE) and linear regression MAE are demonstrated in Table 8 to have a positive
Table 02: Cronbach Alpha, Composite Reliability, and AVE report
Table 03: HTMT Report
Table 5: Predictive Relevance (Q2)
Latent Constructs Cronbach's Alpha Composite Reliability AVEPost Pandemic 0.917 0.935 0.706A.I. 0.873 0.949 0.803Employees Engagement 0.943 0.942 0.714Level of Barriers 0.910 0.930 0.690
Latent Constructs Com Mngt Sys EJP Motivation PDMPost PandemicA.I. 0.710Employees Engagement 0.693 0.868Level of Barriers 0.767 0.889 0.876
Latent Constructs SSO SSE Q²A.I. 2220.000 2220.000Employees Engagement 1850.000 354.305 0.808Level of Barriers 1850.000 1850.000Implementing of Strategies 2220.000 2220.000
22 16th SOUTH ASIAN MANAGEMENT FORUM (SAMF) 2021
difference, which indicates that the model properly predicts the influence of exogenous variables on the endogenous variable.
Table 6: f2 value
Independent Variables Dependent Variable (Employee Job Performance)Post PandemicA.I.Employees Engagement 0.012Level of Barriers 1.881Implementing of Strategies 0.066
Table 7: Goodness of Fit (SRMR and NFI)
Table 8: Predictive Validity using PLSPredict
Saturated Model Estimated ModelSRMR 0.030 0.030d_ULS 0.233 0.233d_G 0.250 0.250Chi-Square 532.736 532.736NFI 0.946 0.946
Dependent Variable Items PLS MAE Q²_predict LM MAE DifferenceIS_1 0.521 0.794 0.538 -0.017IS_2 0.537 0.799 0.542 -0.005IS_3 0.507 0.821 0.513 -0.006IS_4 0.51 0.821 0.516 -0.006IS_5 0.536 0.817 0.537 -0.001
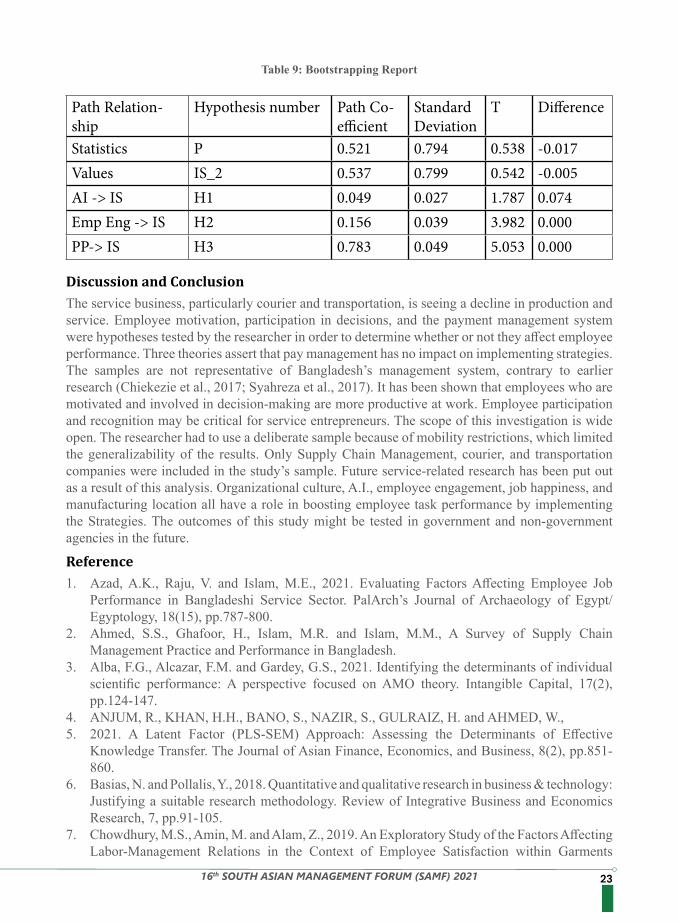
Hypothesis TestingPLS-SEM bootstrapping was used to test the researchers’ hypothesis (see Table 9). According to H1, a company’s pay management system may have an impact on employee productivity. The null hypothesis was not rejected in this research. According to the t-statistics, the path coefficient (0.049), and the P- value are all within the acceptable range (p>0.05). As a result, H1 is shown to be unfounded. The route coefficient for H2 is 0.156, the time is 3.982, and the significance level is 0.000. This shows that the null hypothesis is more likely to be correct than the alternate. So, the H2 is able to function. Job performance may be influenced by employees’ level of motivation in H3. Table 8 demonstrates that the hypothesis is supported by =0.783, t=5.053, and p=.000. The null hypothesis the hypothesis is supported by =0.783, t=5.053, and p=.000. The null hypothesis is rejected in favor of the alternative in this research. H3 is alright, however. Consequently, research demonstrates that employee motivation promotes work performance.
2316th SOUTH ASIAN MANAGEMENT FORUM (SAMF) 2021
The service business, particularly courier and transportation, is seeing a decline in production and service. Employee motivation, participation in decisions, and the payment management system were hypotheses tested by the researcher in order to determine whether or not they affect employee performance. Three theories assert that pay management has no impact on implementing strategies. The samples are not representative of Bangladesh’s management system, contrary to earlier research (Chiekezie et al., 2017; Syahreza et al., 2017). It has been shown that employees who are motivated and involved in decision-making are more productive at work. Employee participation and recognition may be critical for service entrepreneurs. The scope of this investigation is wide open. The researcher had to use a deliberate sample because of mobility restrictions, which limited the generalizability of the results. Only Supply Chain Management, courier, and transportation companies were included in the study’s sample. Future service-related research has been put out as a result of this analysis. Organizational culture, A.I., employee engagement, job happiness, and manufacturing location all have a role in boosting employee task performance by implementing the Strategies. The outcomes of this study might be tested in government and non-government agencies in the future.
1. Azad, A.K., Raju, V. and Islam, M.E., 2021. Evaluating Factors Affecting Employee Job Performance in Bangladeshi Service Sector. PalArch’s Journal of Archaeology of Egypt/Egyptology, 18(15), pp.787-800.
2. Ahmed, S.S., Ghafoor, H., Islam, M.R. and Islam, M.M., A Survey of Supply Chain Management Practice and Performance in Bangladesh.
3. Alba, F.G., Alcazar, F.M. and Gardey, G.S., 2021. Identifying the determinants of individual scientific performance: A perspective focused on AMO theory. Intangible Capital, 17(2), pp.124-147.
4. ANJUM, R., KHAN, H.H., BANO, S., NAZIR, S., GULRAIZ, H. and AHMED, W.,5. 2021. A Latent Factor (PLS-SEM) Approach: Assessing the Determinants of Effective
Knowledge Transfer. The Journal of Asian Finance, Economics, and Business, 8(2), pp.851-860.
6. Basias, N. and Pollalis, Y., 2018. Quantitative and qualitative research in business & technology: Justifying a suitable research methodology. Review of Integrative Business and Economics Research, 7, pp.91-105.
7. Chowdhury, M.S., Amin, M. and Alam, Z., 2019. An Exploratory Study of the Factors Affecting Labor-Management Relations in the Context of Employee Satisfaction within Garments
Table 9: Bootstrapping Report
Path Relation-ship
Hypothesis number Path Co-efficient
Standard Deviation
T Difference
Statistics P 0.521 0.794 0.538 -0.017Values IS_2 0.537 0.799 0.542 -0.005AI -> IS H1 0.049 0.027 1.787 0.074Emp Eng -> IS H2 0.156 0.039 3.982 0.000PP-> IS H3 0.783 0.049 5.053 0.000
Discussion and Conclusion
Reference
24 16th SOUTH ASIAN MANAGEMENT FORUM (SAMF) 2021
Industry of Bangladesh. Business and Economic Research, 9(1), pp.317-330. 8. Gagné, M. and Deci, E.L., 2005. Self‐determination theory and work motivation. Journal of
Organizational Behavior, 26(4), pp.331-362.9. Karim, M.R., 2021 Interplay of overseas employment of Bangladesh and sustainable
development goals: an introspective analysis.10. Muldoon, J., Bendickson, J., Bauman, A. and Liguori, E.W., 2020. Reassessing Elton Mayo:
clarifying contradictions and context. Journal of Management History.11. Meyer, J.P. and Gagne, M., 2008. Employee engagement from a self-determination theory
perspective. Industrial and organizational psychology, 1(1), pp.60-62.12. Mourougan, S. and Sethuraman, K., 2017. Hypothesis development and testing. IOSR Journal
of Business and Management (IOSR-JBM), 9(5), pp.34-40.13. Macias de Anda, E., 2018. Empirical Research to Integrate National Culture in the Design of
Lean Systems.14. ISLAM, M.E. and AZAD, A.K., 2021. Managers’ Propensity for Participative Decision-
Making with the Components of Theory of Planned Behavior: Evidence from Bangladesh. The Journal of Asian Finance, Economics, and Business, 8(6), pp.1141-1149.
15. Salvia, A.L., Leal Filho, W., Brandli, L.L. and Griebeler, J.S., 2019. Assessing research trends related to Sustainable Development Goals: Local and global issues. Journal of cleaner production, 208, pp.841-849.
16. Soni, G. and Kodali, R., 2012. A critical review of empirical research methodology in supply chain management. Journal of Manufacturing Technology Management.
17. Sonnenwald, D.H., 2021. Exploring theory development: Learning from diverse masters. In Theory development in the information sciences (pp. 1-18). University of Texas Press.
18. Hedrick, A., Karpf, D. and Kreiss, D., 2018. The earnest Internet vs. the ambivalent Internet. International Journal of Communication, 12, p.8.

2516th SOUTH ASIAN MANAGEMENT FORUM (SAMF) 2021
DEVELOPMENT AND VALIDATION OF AN INSTRUMENT MEASURING SUSTAINABILITY CONSCIOUSNESS
Keywords: Consciousness, Sustainable Development Goals, Sustainability, United Nations
The present study is undertaken to develop and validate an instrument for measuring sustainability consciousness in the Indian context. The research is conducted to fill the gap in the Indian context by providing a standardized instrument that will measure the sustainability consciousness of individuals/organizations. Results reflect the areas of concern wherein the government/ organizations must put in more efforts to increase the consciousness. Identifying areas and taking corrective measures in improving the sustainability consciousness would be a step forward in the path of accomplishing the sustainability tasks. The instrument will also be useful for stakeholders whose contributions are of prime requisite in achieving sustainable development goals.
Sustainable development has become one of the foremost priorities globally due to the large-scale adverse impacts of human activities on the environment. However, advancing sustainably in all domains requires radical changes. Sustainability will become the key differentiator between the countries that will lead and lag in the coming years. Taking measures for attaining sustainability will be easier for the developed world as compared to the developing ones due to the wide-ranging capabilities of the former. Nonetheless, the central objective of sustainable development will get defeated if the concerns of the latter get unnoticed. Supporting and strengthening the developing and least developed nations is important for accomplishing the goals. Sustainable development is a long process and would be difficult to achieve in the absence of awareness. It is crucial to make people conscious of sustainability issues.
Sustainable development has become a matter of concern irrespective of the domain of activity across the globe. However, due to the existence of wide disparities at the global, national and local levels, achieving sustainability is a herculean task. Governments can initiate agenda for achieving sustainability but the attainment of sustainable development goals depends upon how far stakeholders are conscious of sustainability. Numerous studies have been conducted in the realm of environmental consciousness but being environmentally conscious is not enough to attain sustainability. Today’s generation will have to go beyond environmental consciousness to develop sustainability consciousness. The theoretical foundation of the present study is based on the framework of the United Nations Sustainable Development Goals.Sustainable development has been defined in different ways in different ages. According to Brundtland (1987), sustainable development is a way of fulfilling the requirements of present generations ensuring to leave ample resources for future generations. Sustainable development is a means of improving the environment as well as the quality of life.US Department of the Energy (2001). The first definition of sustainable development focuses on fulfilling the needs and the second describes sustainable development as a strategy that leads to economic benefits and improved quality of life.
Abstract
Introduction
Review of Literature
Dr. Upinder Dhar1
Dr. Santosh Dhar1
Dr. Namrata Jain1
1Shri Vaishnav Vidyapeeth Vishwavidyalaya, Indore, India
26 16th SOUTH ASIAN MANAGEMENT FORUM (SAMF) 2021
The 17 goals aimed to intensify actions in diverse domains such as People, Planet, Prosperity, Peace, and Partnership. It promises an assurance of providing a dignified life to every human being by fulfilling 169 targets defined. Before the commitment of the United Nations to these SDGs as an action plan for 2015-2030, the United Nations declared the period from 2005 to 2014 to be the Decade of Education for Sustainable Development (DESD), UNESCO (2006). During this period, initiatives have been taken for the development of national curricula across the world. The purpose was to impart education by adding two more dimensions- economic and social, in addition to the environmental. Studies were conducted to investigate the effects of Education on Sustainable Development (Michalos, 2011; Olsson and Gericke, 2015; Olsson, 2018; Gericke et al., 2018). The objective of these studies was to find the effects of education on sustainable development at the level of students and to compare and report the results of schools with and without ESD Certification. Empirical studies are available in terms of assessing the consciousness of consumers toward sustainability (Balderjahn et al., 2018; Kapferer and Michaut-Denizeau, 2020). There are few psychometric instruments available for measuring attitudes, knowledge, and behavior towards sustainable development.
In response to the universal call for achieving sustainable development goals by 2030 requires meaningful insights into the awareness (consciousness) of people towards these goals. This is because countries across the globe have only 9 more years to go to attain 17 ambitious goals with 169 targets. Moreover, it is a herculean task to achieve sustainability in all the aspects defined in SDGs due to the existence of wide disparities at the global, national, and local levels. Governments can initiate the agendas for different SDGs but effective implementation of the agendas and attainment of goals requires active contribution from all stakeholders. Nevertheless, the contribution depends upon how far different stakeholders are aware and conscious of sustainability. Numerous studies have been conducted in the realm of environmental consciousness but being an environmentally conscious individual or institution/organization would not be adequate to accomplish sustainability or sustainable development.The literature reviewed so far reveals that there are studies available assessing sustainability
consciousness but the major focus of these studies was to measure the sustainability consciousness of students with respect to Education for Sustainable Development (ESD). Such studies were based on United Nations Educational, Scientific and Cultural Organization (UNESCO) framework. These studies were carried out to discuss the results of implementing ESD and the implications for ESD policy and practice. Besides, studies were also conducted to assess the consciousness of consumers toward sustainable consumption. The review of the literature reveals that the empirical links are missing for measuring sustainability consciousness with special reference to sustainable development goals as adopted by all United Nations member states in 2015. Keeping this in consideration, the present study is undertaken to address these research gaps by developing and validating an instrument for measuring sustainability consciousness in the Indian context. The study has been conducted among different segments of society on various socio-demographic variables. The theoretical foundation of the study is based on the framework of the United Nations Sustainable Development Goals. Results reflect the areas of concern wherein the government or organizations must put in more efforts to increase the awareness (consciousness). Identifying areas and taking corrective measures in improving the awareness would be a step forward in the path of accomplishing the sustainable development goals. The instrument will also be useful for all those stakeholders whose contributions are of prime requisite in achieving the sustainable development
Rationale
2716th SOUTH ASIAN MANAGEMENT FORUM (SAMF) 2021
1. How far people are aware (conscious) of sustainable development goals?2. Does sustainability consciousness differ based on various socio-demographic variables like
gender, level of education, academic discipline, and age?
The Study It is an exploratory study to assess the level of consciousness in terms of awareness about sustainable development goals in society.
The DesignThe study adopted a multi-stage randomized design to achieve the objectives.
The Sample A sample of 259 respondents was chosen to collect the data by following a random sampling procedure.
Tools for Data Collection and AnalysisAn instrument was developed for the study for collecting data. The instrument comprised 51 items to cover 17 Sustainable Development Goals. These items were selected from the 169 targets mentioned in the SDGs. The data were analyzed using parametric and non-parametric tests.
The study is undertaken with the following objectives:1. To develop a standardized instrument for measuring sustainability consciousness.2. To explore the level of awareness about sustainable development goals amongst various segments
of the society.
Research Questions
Research Method
Results And Discussion
Objectives
goals.
Overall SDG AwarenessThe overall awareness of respondents toward the sustainable development goals was classified as high, moderate, and low. Results reveal that out of 259 respondents, merely 5 percent of the population falls under the category of high, 79 percent of the population in the category of moderate, and the remaining 16 percent in the category of low awareness.
Chi-Square Test and CorrelationNon-parametric test- chi-square was applied to find out whether the awareness of sustainable development goals varies significantly across different socio-demographic variables such as gender, level of education, and academic disciplines. And, parametric test- the correlation was applied to find the association between age and overall awareness of respondents towards sustainable development goals.
Null HypothesesH01: Gender does not affect the level of awareness of sustainable development goals.H02: Education does not affect the level of awareness of sustainable development goals.H03: People from different academic disciplines do not differ in their level of awareness of
28 16th SOUTH ASIAN MANAGEMENT FORUM (SAMF) 2021
sustainable development goals.H04: Age does not affect the level of awareness of sustainable development goals.
Gender:H01: Gender does not affect the level of awareness of sustainable development goals.The chi-square significance value is found to be 0.83. Looking at the significance value of 0.83, the null hypothesis cannot be rejected at a 95 percent confidence level. Results indicate that there is no significant difference in the level of awareness of sustainable development goals between the male and their female counterparts.
EducationH02: Education does not affect the level of awareness of sustainable development goals.The educational level of the respondents was categorized under four categories namely higher secondary, undergraduate, postgraduate, and doctorate. The chi-square significance value is found to be 0.34. Considering the significance value of 0.34, the null hypothesis cannot be rejected at a 95 percent confidence level. The results indicate that the level of awareness of sustainable development goals is not affected by the level of education.
Academic Discipline:H03: People from different academic disciplines do not differ in their level of awareness of sustainable development goals.The respondents who participated in the study were from diverse backgrounds such as Agriculture, Management, Engineering, and Science. The chi-square significance value is found to be 0.85. Looking at the value of 0.85, the null hypothesis cannot be rejected at the 95 percent of confidence level. The values are of indication that respondents from different academic disciplines do not differ in the level of awareness of sustainable development goals.
AgeH04: Age does not affect the level of awareness of sustainable development goals.The correlation test was applied to find the association between age and the level of awareness of sustainable development goals. The correlation value is found to be 0.11 indicating a low correlation between the two variables.
Empirical findings highlighted that merely 5 percent of the population has a high awareness of sustainable development goals. The results are in line with the study by Akinlolu et al., (2017). Authors reported that awareness of respondents was very low and 95 percent of the respondents had poor knowledge regarding sustainable development goals. Awareness of University students was found to be low on millennium development goals (MDGs), Nashash (2013). Low awareness of MDGs is a matter of concern for SDGs as the 17 SDGs are built on the eight MDGs. United Nations Report of 2015 acknowledges the gaps that remained in the achievement of millennium development goals. It’s time to learn from the experiences because the SDGs are more extensive than MDGs. There were only 8 goals, 21 targets, and 60 indicators in MDGs in contrast to 17 goals and 169 targets, and 232 indicators in SDGs. Further, the results of the analysis reveal that gender, educational level, academic discipline, and age do not affect the level of awareness of sustainable development goals. While reviewing the literature it was realized that the effect of sociodemographic variables on various parameters pertaining to
Discussion
2916th SOUTH ASIAN MANAGEMENT FORUM (SAMF) 2021
The scope of Agenda 2030 is wider and more complex than its predecessor millennium development goals in terms of the number of goals, targets, and indicators. This massive increase in scope and scale demands collective action and long-term efforts. The study indicates that overall awareness of sustainable development goals is quite low. With only 9 more years in hand to achieve SDGs, or at least to make substantial progress in its achievement, building awareness among different stakeholders is of prime importance. The level of consciousness (awareness) amongst various segments of the society based on gender, education, academic discipline, and age does not reveal any significant difference. The study contributes to the body of knowledge on sustainable development by developing a standardized tool for measuring sustainability consciousness with special reference to sustainable development goals. The instrument will also be useful for the stakeholders whose contributions are of prime requisite in achieving sustainable development goals. However, due to time constraints, the study could not cover all the segments of society. Further research can be envisaged by increasing the size of the sample including various segments such as private and public organizations and adding more socio-demographic variables.
1. Abdul-Wahab, S. A., & Abdo, J. (2010). The effects of demographic factors on the environmental awareness of Omani citizens. Human and ecological risk assessment: An International Journal, 16(2), 380-401.
2. Balderjahn, I., Peyer, M., Seegebarth, B., Wiedmann, K. P., & Weber, A. (2018). The many faces of sustainability-conscious consumers: A category-independent typology. Journal of Business Research, 91, 83-93.
Conclusion
References
the environment resulted in mixed results. With reference to gender, there are studies in the realm of environmental attitudes, environmental behavior, and green products reporting females to have stronger pro-environmental attitudes and behavior and preference toward green products (Zelezny et. al, 2000 Lukman et. al., 2013). In comparison to males, females play a more significant role in establishing values toward the environment. Results of the study by Wahab and Abdo (2010) are in contrast to the above ones. Authors reported that females are less environmentally concerned than males. Similarly, when it comes to age, younger respondents tend to be more concerned about the environment in comparison to older ones (Wahab and Abdo, 2010). These results are in contrast with other studies wherein it was reported that younger respondents tend to have less pro-environmental behavior in comparison to older ones (Gifford and Nilsson, 2014). In the present study, a low correlation has been found between age and awareness. In terms of educational level, De Silva and Pownall (2014) observed that students with college degrees prefer those activities that help in reducing carbon emissions in comparison to those without a college degree. With reference to academic discipline, the results of the present study are in line with the previous findings. Tuna and Ozkocak (2012) stated that the academic discipline is not creating any differences in attitude toward the environment. Similarly, Muderrisoglu and Altanlar (2010) observed that academic discipline does not have any impact on showing responsible behavior towards the environment. However, the results of the present study reported insignificant differences based on gender, educational level, and age. The results are not in line with the other studies might be because of cultural differences. Moreover, the majority of the respondents in the study were undergraduates and postgraduates. In present times, both males and females are receiving equal opportunities and have equal access to resources that might result in insignificant differences based on gender.
30 16th SOUTH ASIAN MANAGEMENT FORUM (SAMF) 2021
3. De Silva, D.G., & Pownall, R.A. (2014). Going green: does it depend on education, gender, or income? Applied Economics, 46(5), 573-586.
4. G. Brundtland, World Commission on Environment and Development. Our Common Future. Oxford University Press, Oxford, 1987.
5. Gericke, N., Boeve‐de Pauw, J., Berglund, T., & Olsson, D. (2019). The Sustainability Consciousness Questionnaire: The theoretical development and empirical validation of an evaluation instrument for stakeholders working with sustainable development. Sustainable Development, 27(1), 35-49.
6. Gifford, R., & Nilsson, A. (2014). Personal and social factors that influence pro‐environmental concern and behavior: A review. International Journal of Psychology, 49(3), 141-157.
7. Kapferer, J. N., & Michaut-Denizeau, A. (2020). Are millennials really more sensitive to sustainable luxury? A cross-generational international comparison of sustainability consciousness when buying luxury. Journal of Brand Management, 27(1), 35-47.
8. Lukman, R., Lozano, R., Vamberger, T., & Krajnc, M. (2013). Addressing the attitudinal gap towards improving the environment: a case study from a primary school in Slovenia. Journal of Cleaner Production, 48, 93-100.
9. Mainieri, T., Barnett, E. G., Valdero, T. R., Unipan, J. B., &Oskamp, S. (1997). Green buying: The influence of environmental concern on consumer behavior. The Journal of social psychology, 137(2), 189-204.
10. Michalos, A. C., Creech, H., Swayze, N., Kahlke, P. M., Buckler, C., & Rempel, K. (2012). Measuring knowledge, attitudes, and behaviors concerning sustainable development among tenth-grade students in Manitoba. Social indicators research, 106(2), 213-238.
11. Muderrisoglu, H. and A. Altanlar (2010). Attitudes and Behaviors of Undergraduate Students toward Environmental Issues. International Journal of Environment Science and Technology. 8(1), 159-168.
12. Nashash, H. M. (2013). Level of millennium development goals awareness among students at Princess Alia University College. European Scientific Journal, 9(16).
13. Olsson, D., & Gericke, N. (2016). The adolescent dip in students’ sustainability consciousness—Implications for education for sustainable development. The Journal of Environmental Education, 47(1), 35-51.
14. Olsson, D., & Gericke, N. (2017). The effect of gender on students’ sustainability consciousness: A nationwide Swedish study. The Journal of Environmental Education, 48(5), 357-370.
15. Omisore, A. G., Babarinde, G. M., Bakare, D. P., &Asekun-Olarinmoye, E. O. (2017). Awareness and knowledge of the sustainable development goals in a university community in southwestern Nigeria. Ethiopian Journal of Health Sciences, 27(6), 669-676.
16. Tuna, Y. and L. Ozkocak (2012). The First Step to Communication with Environmentally Responsible Consumer: Measuring Environmental Consciousness of Turkish Consumers. Online Journal of Communication and Media Technologies. 2(3).131-147.
17. UNESCO (2006). United Nations Decade of Education for Sustainable Development 2005-2014, UNESCO. International implementation scheme. Paris, France: UNESCO
18. US Department of Energy (2001) Center of Excellence for Sustainable Development (on-line), retrieved from http://www.sustainable.doe.gov/overview/ovintro.shtml on 27 September 2021.
19. Zelezny, L. C., Chua, P. P., & Aldrich, C. (2000). Elaborating on gender differences in environmentalism. Journal of Social Issues, 56(3), 443-458.
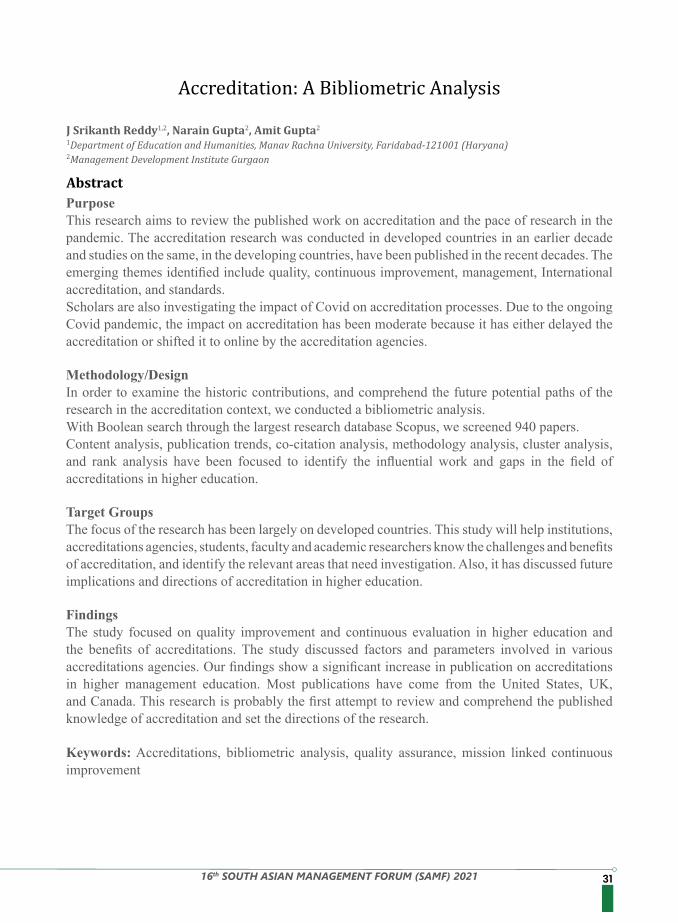
3116th SOUTH ASIAN MANAGEMENT FORUM (SAMF) 2021
PurposeThis research aims to review the published work on accreditation and the pace of research in the pandemic. The accreditation research was conducted in developed countries in an earlier decade and studies on the same, in the developing countries, have been published in the recent decades. The emerging themes identified include quality, continuous improvement, management, International accreditation, and standards. Scholars are also investigating the impact of Covid on accreditation processes. Due to the ongoing Covid pandemic, the impact on accreditation has been moderate because it has either delayed the accreditation or shifted it to online by the accreditation agencies.
Methodology/DesignIn order to examine the historic contributions, and comprehend the future potential paths of the research in the accreditation context, we conducted a bibliometric analysis. With Boolean search through the largest research database Scopus, we screened 940 papers. Content analysis, publication trends, co-citation analysis, methodology analysis, cluster analysis, and rank analysis have been focused to identify the influential work and gaps in the field of accreditations in higher education.
Target GroupsThe focus of the research has been largely on developed countries. This study will help institutions, accreditations agencies, students, faculty and academic researchers know the challenges and benefits of accreditation, and identify the relevant areas that need investigation. Also, it has discussed future implications and directions of accreditation in higher education.
Findings The study focused on quality improvement and continuous evaluation in higher education and the benefits of accreditations. The study discussed factors and parameters involved in various accreditations agencies. Our findings show a significant increase in publication on accreditations in higher management education. Most publications have come from the United States, UK, and Canada. This research is probably the first attempt to review and comprehend the published knowledge of accreditation and set the directions of the research.
Keywords: Accreditations, bibliometric analysis, quality assurance, mission linked continuous improvement
Accreditation: A Bibliometric Analysis
Abstract
J Srikanth Reddy1,2, Narain Gupta2, Amit Gupta2
1Department of Education and Humanities, Manav Rachna University, Faridabad-121001 (Haryana)2Management Development Institute Gurgaon
32 16th SOUTH ASIAN MANAGEMENT FORUM (SAMF) 2021
Accreditation is the quality assurance process for reviewing higher educational institutions and universities (Kumar et al., 2020). The accreditation process helps the institutes to improve the quality in the process of “input-process-output”(Duc Hanh et al., 2019). Accreditation assures the processes and mechanisms in place to meet the defined accreditation standards(Zammuto, 2008) to maintain quality and continuous improvement. The main purpose of the adoption of accreditation is to facilitate the institutions for a competitive environment, to improve their services, and proper utilization of public resources(Andreani et al., 2020). Higher education institutes around the world are going for US accreditation in order to increase international collaboration and globalization (Barrett et al., 2020). Accreditations help to improve academic motivation, student performance, and career prospects (Kafaji, 2020). Based on top accreditations (AACSB, AMBA & EQUIS) in management education, the key drivers for implementation of accreditation in business schools are top management support, availability of budget, teamwork, faculty qualification, and sufficiency, research, infrastructure, assurance of learning, etc.(Avolio & Benzaquen, 2020).
Research Questions Research Methodology Research Outcome1. What are the patterns
of publication and contributions in the field of accreditations
2. What are the methodological and research focus of the author in the accreditation field?
3. What are the important themes of research in the field of accreditation?
4. What topics can researchers explore in the future in the field of accreditation?
5. The research articles were taken from the Scopus database with inclusion and exclusion criteria.
6. A total of 940 articles were fetched for bibliometric analysis.
7. Conducted the performance analysis in the field of Accreditation.
8. Conducted performance analysis in the field of Accreditation.
9. Identified the major methodological and research focus in Accreditation research.
10. Identified the research output and gaps explored by the authors during the last three years.
11. Presented a number of future directions the researchers can explore.
The bibliometric method is used to explore the topic of Accreditations. This method defines application as qualitative data for bibliometric data. By using the bibliometric method, studied the large quantity of data to identify the research gaps. The research gaps are identified using the co-occurrence of keywords and bibliographic coupling.The bibliometric approach combines both science mapping tools and performance analysis in the
research area for the visualization of conceptual sub-domains and thematic evaluation proposed by (Cobo et al., 2011). The co-word analysis identifies the longitudinal framework which permits to examine and track the research field along with the periods. The bibliometric analysis is mainly divided into Science mapping and Performance analysis. The performance analysis manages the execution of various individuals, organizations, and countries in the research field (Donthu et al., 2021). The performance analysis finds the developments and trends, most prolific authors, most prolific journals, institutions, and countries in the field. The author reviewed to identify the various methodologies used in different articles in terms of
data analysis, data collection methods, research design, research methodology, etc.
Introduction
Methodology
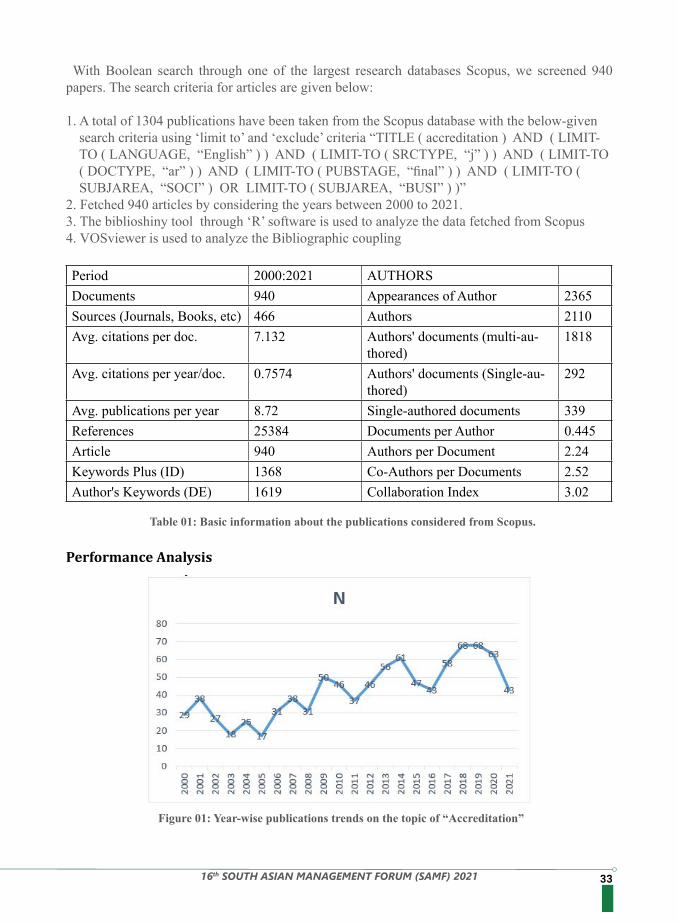
3316th SOUTH ASIAN MANAGEMENT FORUM (SAMF) 2021
With Boolean search through one of the largest research databases Scopus, we screened 940 papers. The search criteria for articles are given below:
1. A total of 1304 publications have been taken from the Scopus database with the below-given search criteria using ‘limit to’ and ‘exclude’ criteria “TITLE ( accreditation ) AND ( LIMIT-TO ( LANGUAGE, “English” ) ) AND ( LIMIT-TO ( SRCTYPE, “j” ) ) AND ( LIMIT-TO ( DOCTYPE, “ar” ) ) AND ( LIMIT-TO ( PUBSTAGE, “final” ) ) AND ( LIMIT-TO ( SUBJAREA, “SOCI” ) OR LIMIT-TO ( SUBJAREA, “BUSI” ) )”
2. Fetched 940 articles by considering the years between 2000 to 2021.3. The biblioshiny tool through ‘R’ software is used to analyze the data fetched from Scopus4. VOSviewer is used to analyze the Bibliographic coupling
Period 2000:2021 AUTHORS Documents 940 Appearances of Author 2365Sources (Journals, Books, etc) 466 Authors 2110Avg. citations per doc. 7.132 Authors' documents (multi-au-
thored)1818
Avg. citations per year/doc. 0.7574 Authors' documents (Single-au-thored)
292
Avg. publications per year 8.72 Single-authored documents 339References 25384 Documents per Author 0.445Article 940 Authors per Document 2.24Keywords Plus (ID) 1368 Co-Authors per Documents 2.52Author's Keywords (DE) 1619 Collaboration Index 3.02
Table 01: Basic information about the publications considered from Scopus.
Performance Analysis
Figure 01: Year-wise publications trends on the topic of “Accreditation”
34 16th SOUTH ASIAN MANAGEMENT FORUM (SAMF) 2021
Figure 1 shows the year-wise publication trends in the accreditation field. It was observed that the number of publications increased in the last five years. For example, the average number of publications between 2016 and 2021 is 300. The number of publications during and after the Covid period between 2020-21 is 106 publications. For measuring the performance analysis, we used quantitative and qualitative contributions of themes in the field of accreditation, detecting the most productive, highest impact, and prominent sub-fields(Viedma-del-jesús & López-herrera, 2011). The topic has been considered as the adoption of accreditations in management and higher education.Country Articles Frequency Single
County Publica-tions
Multi Country Publica-tions
Multi Country Publica-tions Ratio
Total Citation
Avg. Article Cita-tions
USA 277 0.44 260 17 0.0614 2268 8.19UNITED KINGDOM
48 0.08 43 5 0.1042 414 8.62
AUSTRALIA 37 0.06 30 7 0.1892 663 17.92CANADA 28 0.04 20 8 0.2857 454 16.21CHINA 19 0.03 14 5 0.2632 182 9.58INDIA 15 0.02 14 1 0.0667 89 5.93
Table 02: Most Relevant countries by the corresponding author in the area of research in Accreditations
Table 02 indicates that most publications have come from developed countries such as the United States, UK, and Canada, where the accreditations journey started much earlier than it started in the developing countries. We also notice that the south Asian developing countries are coming forward with accreditation and quality initiatives.
Author’s Impact based on the most global cited document:
Author name h-index g-index m-index TC N.P P.Y (starts)VLASSES PH 3 6 0.188 51 12 2006
TRAVLOS DV 2 2 0.125 13 9 2006WADELIN JW 2 2 0.125 13 9 2006
VAN ZANTEN M 7 8 0.5 170 8 2008BRAITHWAITE J 5 6 0.357 106 6 2008
LURIE SJ 1 1 0.077 243 1 2009LYNESS JM 1 1 0.077 243 1 2009
MOONEY CJ 1 1 0.077 243 1 2009VAN ZANTEN M 7 8 0.5 170 8 2008
BOELEN C 1 1 0.077 149 1 2009
Table 03: Author’s Impact
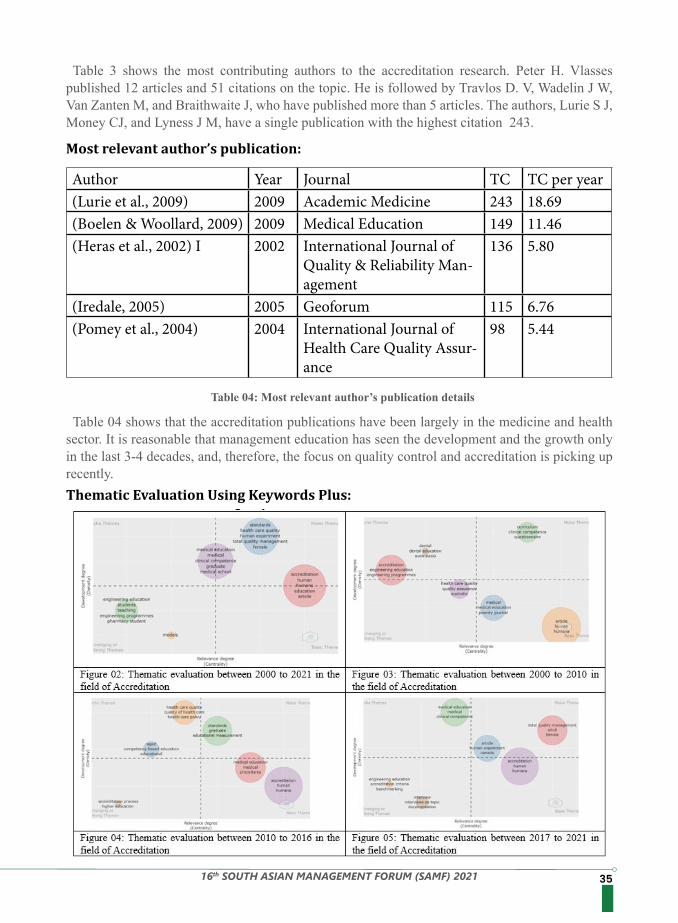
3516th SOUTH ASIAN MANAGEMENT FORUM (SAMF) 2021
Table 3 shows the most contributing authors to the accreditation research. Peter H. Vlasses published 12 articles and 51 citations on the topic. He is followed by Travlos D. V, Wadelin J W, Van Zanten M, and Braithwaite J, who have published more than 5 articles. The authors, Lurie S J, Money CJ, and Lyness J M, have a single publication with the highest citation 243.
Table 04 shows that the accreditation publications have been largely in the medicine and health sector. It is reasonable that management education has seen the development and the growth only in the last 3-4 decades, and, therefore, the focus on quality control and accreditation is picking up recently.
Author Year Journal TC TC per year(Lurie et al., 2009) 2009 Academic Medicine 243 18.69(Boelen & Woollard, 2009) 2009 Medical Education 149 11.46(Heras et al., 2002) I 2002 International Journal of
Quality & Reliability Man-agement
136 5.80
(Iredale, 2005) 2005 Geoforum 115 6.76(Pomey et al., 2004) 2004 International Journal of
Health Care Quality Assur-ance
98 5.44
Table 04: Most relevant author’s publication details
Most relevant author’s publication:
Thematic Evaluation Using Keywords Plus:
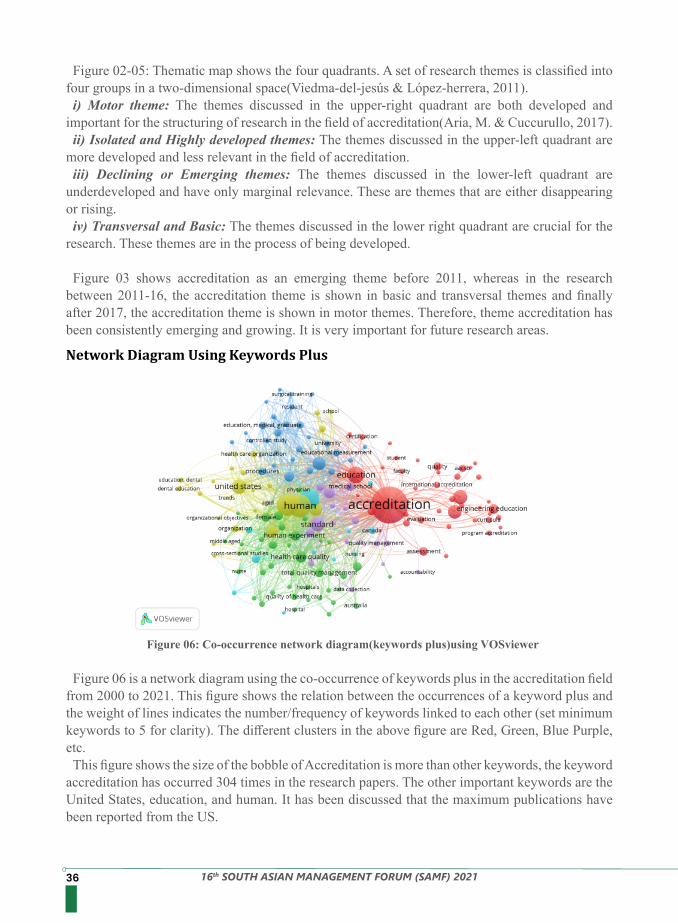
36 16th SOUTH ASIAN MANAGEMENT FORUM (SAMF) 2021
Figure 02-05: Thematic map shows the four quadrants. A set of research themes is classified into four groups in a two-dimensional space(Viedma-del-jesús & López-herrera, 2011).i) Motor theme: The themes discussed in the upper-right quadrant are both developed and
important for the structuring of research in the field of accreditation(Aria, M. & Cuccurullo, 2017). ii) Isolated and Highly developed themes: The themes discussed in the upper-left quadrant are
more developed and less relevant in the field of accreditation. iii) Declining or Emerging themes: The themes discussed in the lower-left quadrant are
underdeveloped and have only marginal relevance. These are themes that are either disappearing or rising.iv) Transversal and Basic: The themes discussed in the lower right quadrant are crucial for the
research. These themes are in the process of being developed.
Figure 03 shows accreditation as an emerging theme before 2011, whereas in the research between 2011-16, the accreditation theme is shown in basic and transversal themes and finally after 2017, the accreditation theme is shown in motor themes. Therefore, theme accreditation has been consistently emerging and growing. It is very important for future research areas.
Figure 06: Co-occurrence network diagram(keywords plus)using VOSviewer
Figure 06 is a network diagram using the co-occurrence of keywords plus in the accreditation field from 2000 to 2021. This figure shows the relation between the occurrences of a keyword plus and the weight of lines indicates the number/frequency of keywords linked to each other (set minimum keywords to 5 for clarity). The different clusters in the above figure are Red, Green, Blue Purple, etc. This figure shows the size of the bobble of Accreditation is more than other keywords, the keyword
accreditation has occurred 304 times in the research papers. The other important keywords are the United States, education, and human. It has been discussed that the maximum publications have been reported from the US.
Network Diagram Using Keywords Plus
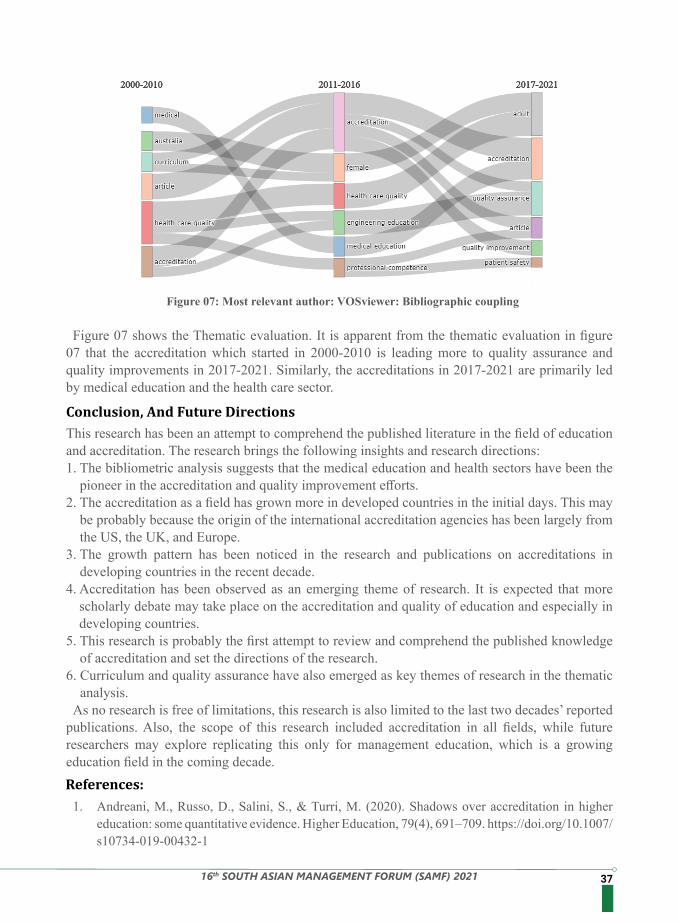
3716th SOUTH ASIAN MANAGEMENT FORUM (SAMF) 2021
Figure 07: Most relevant author: VOSviewer: Bibliographic coupling
Figure 07 shows the Thematic evaluation. It is apparent from the thematic evaluation in figure 07 that the accreditation which started in 2000-2010 is leading more to quality assurance and quality improvements in 2017-2021. Similarly, the accreditations in 2017-2021 are primarily led by medical education and the health care sector.
This research has been an attempt to comprehend the published literature in the field of education and accreditation. The research brings the following insights and research directions:1. The bibliometric analysis suggests that the medical education and health sectors have been the
pioneer in the accreditation and quality improvement efforts.2. The accreditation as a field has grown more in developed countries in the initial days. This may
be probably because the origin of the international accreditation agencies has been largely from the US, the UK, and Europe.
3. The growth pattern has been noticed in the research and publications on accreditations in developing countries in the recent decade.
4. Accreditation has been observed as an emerging theme of research. It is expected that more scholarly debate may take place on the accreditation and quality of education and especially in developing countries.
5. This research is probably the first attempt to review and comprehend the published knowledge of accreditation and set the directions of the research.
6. Curriculum and quality assurance have also emerged as key themes of research in the thematic analysis.
As no research is free of limitations, this research is also limited to the last two decades’ reported publications. Also, the scope of this research included accreditation in all fields, while future researchers may explore replicating this only for management education, which is a growing education field in the coming decade.
Conclusion, And Future Directions
1. Andreani, M., Russo, D., Salini, S., & Turri, M. (2020). Shadows over accreditation in higher education: some quantitative evidence. Higher Education, 79(4), 691–709. https://doi.org/10.1007/s10734-019-00432-1
References:
38 16th SOUTH ASIAN MANAGEMENT FORUM (SAMF) 2021
2. Aria, M. & Cuccurullo, C. (2017). bibliometrics: An R-tool for comprehensive science mapping analysis. Journal of Informetrics,131(6), 959–975. https://doi.org/10.1177/1757913911425736
3. Avolio, B., & Benzaquen, J. (2020). Strategic drivers to approach business school’s accreditations. Journal of Education for Business, 95(8), 519–526. https://doi.org/10.1080/08832323.2019.1707751
4. Barrett, B., Fernandez, F., & Gonzalez, E. M. (2020). Why universities voluntarily pursue US accreditation: the case of Mexico. Higher Education, 79(4), 619–635. https://doi.org/10.1007/s10734-019-00427-y
5. Boelen, C., & Woollard, B. (2009). Social accountability and accreditation: A new frontier for educational institutions. Medical Education, 43(9), 887–894. https://doi.org/10.1111/j.1365-2923.2009.03413.x
6. Cobo, M. J., López-Herrera, A. G., Herrera-Viedma, E., & Herrera, F. (2011). An approach for detecting, quantifying, and visualizing the evolution of a research field: A practical application to the Fuzzy Sets Theory field. Journal of Informetrics, 5(1), 146–166. https://doi.org/10.1016/J.JOI.2010.10.002
7. Donthu, N., Kumar, S., Pandey, N., Pandey, N., & Mishra, A. (2021). Mapping the electronic word-of-mouth (eWOM) research: A systematic review and bibliometric analysis. Journal of Business Research, 135(February), 758–773. https://doi.org/10.1016/j.jbusres.2021.07.015
8. Duc Hanh, N., Thi My Nga, N., Quynh Loan, V., & My Viet, N. (2019). 649-653 of Quality Assurance and Quality Accreditation in Higher Education in Some Developing Countries and Vietnam. American Journal of Educational Research, 7(9), 649–653. https://doi.org/10.12691/education-7-9-8
9. Heras, I., Dick, G. P. M., & Casadesús, M. (2002). ISO 9000 registration’s impact on sales and profitability: A longitudinal analysis of performance before and after accreditation. International Journal of Quality and Reliability Management, 19(6), 774–791. https://doi.org/10.1108/02656710210429618
10. Iredale, R. (2005). Gender, immigration policies and accreditation: Valuing the skills of professional women migrants. Geoforum, 36(2 SPEC. ISS.), 155–166. https://doi.org/10.1016/J.GEOFORUM.2004.04.002
11. Kafaji, M. (2020). The perceived benefits of accreditation on students’ performance: The case of private business schools. Industry and Higher Education, 34(6), 421–428. https://doi.org/10.1177/0950422220902698
12. Kumar, P., Shukla, B., & Passey, D. (2020). Impact of accreditation on quality and excellence of higher education institutions. Investigacion Operacional, 41(2), 151–167.
13. Lurie, S. J., Mooney, C. J., & Lyness, J. M. (2009). Measurement of the general competencies of the accreditation council for graduate medical education: A systematic review. Academic Medicine, 84(3), 301–309. https://doi.org/10.1097/ACM.0B013E3181971F08
14. Pomey, M. P., Contandriopoulos, A. P., François, P., & Bertrand, D. (2004). Accreditation: A tool for organizational change in hospitals? International Journal of Health Care Quality Assurance, 17(3), 113–124. https://doi.org/10.1108/09526860410532757/FULL/PDF
15. Viedma-del-jesús, F. M. M. I., & López-herrera, J. S. A. G. (2011). An application of co-word analysis and bibliometric maps for detecting the most highlighting themes in the consumer behavior research from a longitudinal perspective. https://doi.org/10.1007/s11135-011-9565-3
16. Zammuto, R. F. (2008). Accreditation and the globalization of business. In Academy of Management Learning and Education (Vol. 7, Issue 2, pp. 256–268). George Washington University. https://doi.org/10.5465/AMLE.2008.32712623
3916th SOUTH ASIAN MANAGEMENT FORUM (SAMF) 2021
FACTORS AFFECTING INCREASED TEACHER WORKLOAD IN ONLINE TEACHING DURING COVID-19 PANDEMIC
Keywords: COVID-19 pandemic, Higher education, Online teaching, Teaching-learning, Teacher workload
Higher education institutions in Asian countries such as Bangladesh and Thailand had to stop face-to-face educational activities during the period of the COVID-19 pandemic. Teachers suddenly shifted from face-to-face teaching-learning and evaluation methods to online mode. The transition process increased teacher workload. This quantitative research was conducted to identify factors that increase teachers’ workload during the transition into online teaching. Sixty-eight university teachers in Bangladesh, Thailand, India, and Indonesia were interviewed by a structured questionnaire. Eight factors were identified from the literature review and by filling the research gap. The statistical analysis indicated the teachers’ workload increase was influenced by infrastructure difficulties, lack of students’ technology know-how, and difficult class management. A set of recommendations was made for the practicing teachers and institutional authorities to effectively design online teaching by minimizing the workload.
Since 11th March 2020 when the Director-General of The World Health Organization (WHO) declared the fast-spreading Coronavirus outbreak to be a pandemic (World Health Organization [WHO], 2020) likely to spread to all the counties on our planet, all educational institutions started closing to stop the spread of the virus. The deputy Education Minister of Bangladesh announced an initial closure of schools, colleges, and universities from 17-31 March (Sakib, 2020), which was later extended until predictably September 2020 (The Business Standard [TBS], 2020). In Thailand, all educational institutions were closed initially for two weeks from 18th March to 31st March as announced by the Prime Minister on Tuesday 17th March (Channel News Asia [CAN], 2020). The closure was later extended until 1st July 2020. Both in Bangladesh and Thailand, universities’ closure meant switching off teaching-learning activities from face-to-face (f2f) to online. In Thailand, private and state universities were instructed to shift classes online by the Ministry of Higher Education, Science Research and Innovation (Mala, 2020). In Bangladesh, most of the 350,000 students of private universities started online classes as soon as the universities closed f2f classes (Jasim, 2020). Teacher workload in higher education institutions in these two countries is relatively high. It was reported that the Bangladeshi private university teachers teach 12 classes per year with an average of 30 students in each class besides other institutional activities including coordinating club activities, supervising admission tests, organizing various departmental programs, attending workshops and graduation ceremonies, delivering seminars, advising students, and playing a role in governance (Andaleeb, 2019). As a consequence, it is hypothesized that the sudden shift of academic activities from f2f to online contributed to increasing teachers’ workload during the COVID-19 pandemic. The purpose of this study was to identify possible factors that influence the teacher workload increase. The outcomes from the analytical findings were expected to be useful for the practicing teachers and institutional authorities in designing an effective transition plan. Therefore, the
Abstract
Introduction
Rajib Lochan Das1*and David Paul Meredith2
1IUBAT-International University of Business Agriculture and Technology, Bangladesh2 Webster University, Thailand*Corresponding Author
40 16th SOUTH ASIAN MANAGEMENT FORUM (SAMF) 2021
Digital Technology in EducationFrom the early evolution stage of computers, technology got incorporated into teaching and learning to enhance content and instructions. Integrating technology into education was intended to create a meaningful educational experience for better students’ learning through a transformative process with the potential to increase performance (Goh et al., 2020). Venkatesh, & Davis (2000) introduced an extension of the Technology Acceptance Model (TAM) in the context of higher education with the variables of perceived usefulness, perceived ease of use, and behavioral intention. Qin et al. (2017) and Sánchez-Prieto et al. (2016) also studied Asian higher education taking these variables into the major antecedents as operating independently in educational technology acceptance. Technology became an inseparable part of teaching-learning along with the pedagogical and content knowledge of practicing teachers. Technological, Pedagogical, and Content Knowledge are at the center of seven components of the TPACK framework to address the teachers’ nature of knowledge required (Mishra & Koehler, 2006). These seven components are presented with the Venn diagram of three overlapping sets of technology, pedagogy, and content. Content and pedagogy are primarily managed by the teachers while technology is also a concern of the educational management. Physical devices, infrastructure facilities, and internet connectivity are directly influential to technology. Such technology integration represents a challenge for university administrators in enhancing the quality of an educational program (Naaj, Nachouki & Ankit, 2012).
Differences between F2f and Online TeachingThere is a considerable body of literature on the differences between teaching online and in a traditional f2f classroom. The literature published before the pandemic was based on teachers and students who mainly volunteered to teach online and for courses that their institutions could plan. This differs from the COVID-19 lockdown situation in which all institutions, teachers, and students had to go online whether they wanted to or not and in which courses designed for a f2f classroom had to suddenly be moved online with little or no opportunity to amend the course structure or materials before their online launch. This point is well illustrated in the institutions that made a planned transition from the classroom to online teaching and had been involved in considerable financial investments to set up and support such courses (Siedlaczek, 2004). However, during the COVID-19 pandemic, many universities in lockdown had to make an almost overnight switch using whatever resources were in place at the time such as teachers’ and students’ Wi-Fi connections, laptops, and smartphones (Sari, & Nayir, 2020). The importance of technology was also talked about at length along with the need for hardware that worked efficiently, software that was user-friendly and technical support with a clear structure in terms of roles and responsibilities.
Teacher’s WorkloadOECD (The Organisation for Economic Cooperation and Development) carried out the Teaching and Learning International Survey (TALIS) 2018, by which teachers’ workload was identified as one of the intrinsic factors related to teachers’ job satisfaction. Other intrinsic factors were
Literature Review
research question was formulated as “what factors are affecting teachers’ workload in the transition from f2f to online teaching during the COVID-19 pandemic?”. In this article, the literature review section summarises relevant texts on technology in education and its dynamics connected to teachers’ workload. The next section is about the research methodology followed by findings from the statistical tests and their interpretations, which leads to recommendations for the stakeholders and, finally, the conclusion of the study.
4116th SOUTH ASIAN MANAGEMENT FORUM (SAMF) 2021
teachers’ gender and the socioeconomic composition of classes while the extrinsic factors were teachers’ cooperation in schools, student and teacher relations in schools, participation of stakeholders in school decisions, and teachers’ perceived value in their society (Ainley & Carstens, 2018). Teachers’ workload heavily depends on designing and preparing the lessons. Fernandez (2002) mentioned a lesson study process might presuppose the cooperation of a team of teachers of the same specialty to design and implement a research lesson in 10-15 hours over three to four weeks. Required time for such preparations went higher during online teaching-learning. A huge contributor to the increased workload is creating pre-recorded lectures, making digital content, drafting a script, recording a video with necessary editing, etc (Müller et al., 2021). Other elements quoted as increasing workload were assessments and marking due to the shift to assessing higher-order learning, limited ability to observe students during synchronous sessions, and constantly monitor various inputs. In the same research, it was also mentioned that familiarizing oneself with the vast amount of new technologies and potential pedagogies that could be applied in online teaching are significant contributors to workload increase. In the research article of Davidovich, & Eckhaus (2019), it was stated that the students complained about the level of difficulty in online learning, but they did not even make an effort to ask questions during office hours. So, the teachers’ work hours went beyond regular office time.
Definitions of Variables and HypothesesDasgupta (2013) defined workload as the number of tasks given to an individual over a specified period. Simonson et al. (2009) and Allen, & Seaman (2009) found that course teachers in higher education institutions considered teaching online courses time-consuming. The lack of release time ultimately prevented many of them from teaching online classes. At that period, teaching online was a sort of teachers’ choice unlike the compelling situation of COVID-19 pandemic. According to this study as intended, the dependent variable ‘teachers’ workload increase’ is hypothetically influenced by a set of 8 independent variables.
Professional training: The importance of training for effective teaching was described in scholarly articles. In the context of mathematics teaching during the COVID-19 period, the significance of teacher training for online teaching was justified and suggested (Nantschev et al., 2020). The alternative hypothesis (H1) was that ‘professional training’ of teachers will significantly influence the ‘teachers’ workload increase’.
Performance evaluation: Students performance evaluation is an integral part of teaching and learning. Challenges are increasing in the online education setting. Performance evaluation was recognized as an important factor in the teaching process during the COVID-19 pandemic period (Pócsová et al., 2021). The alternative hypothesis (H2) was that ‘performance evaluation’ of the students will significantly influence the ‘teachers’ workload increase’.
Course design & planning: Designing the course activities by making a plan of lectures and contents were taken into the list of probable factors, especially in the sudden transition. Ujir et al., (2020) in their research article described that a course coordinator may provide support for the course teaches about designing and preparing the contents, which does not match with the context of this study. Thus, this probable factor was taken as a new dynamic in the context by filling up the research gap. The alternative hypothesis (H3) was that ‘course design & planning’ by the teachers will significantly influence the ‘teacher workload increase’.
42 16th SOUTH ASIAN MANAGEMENT FORUM (SAMF) 2021
Infrastructure difficulties: Appropriate digital devices with workable internet connection facilities are the basic requirements for online education. These infrastructure facilities are required for both teachers and students. Universities need to invest substantially in the transition from f2f to online (Siedlaczek, 2004) and supply laptops, smartphones, and WiFi connections for teachers and students in applicable cases (Sari, & Nayir, 2020). The alternative hypothesis (H4) was that ‘infrastructure difficulties’ of both teachers and students perceived by the teachers will significantly influence the ‘teacher workload increase’.
Necessary technical support: San-Martin et al. (2020) described that the universities are willing to adopt technology and provide support to teachers for online teaching when it is without any disruption. The authors took technical support as a variable by saying that institutional support was essential to reassure online teachers, as they had previously shown certain reluctance to shift from f2f to online teaching. The alternative hypothesis (H5) was that ‘necessary technical support for both teachers and students perceived by the teachers will significantly influence the ‘teacher workload increase’.
Lack of students’ technology knowhow: Students’ technological knowhow in teachers’ perception, being aware of opportunities that technology and technological tools for a particular concept and educational level, supported how and when various technology and technological tools could support or hinder students’ learning during COVID-19 (Lauret, & Bayram-Jacobs, 2021). The alternative hypothesis (H6) was that ‘lack of students’ technology knowhow’ perceived by the teachers will significantly influence the ‘teacher workload increase’.
Effective students’ learning: Authors considered this variable as an influencing factor in teacher workload. However, effective students’ learning is a wide term, which is difficult to measure by linking with the dependent variables of this context. The authors did not find sufficient research support on this issue, which was eventually identified as a factor to fill up the research gap. The alternative hypothesis (H7) was that ‘effective students’ learning’ perceived by the teachers will significantly influence the ‘teachers’ workload increase’.
Difficult class management: Classroom management is a common pedagogical term that is substantially different in two contexts: f2f and online teaching. Many students do not turn on their cameras in synchronized class. Müller et al. (2021) stated the teacher respondents spoke about only limited could be observed during online teaching and students’ facial expressions were impossible to capture. This was even more problematic for asynchronous sessions where there is no live feedback. The alternative hypothesis (H8) was that ‘difficult class management’ by the teachers will significantly influence the ‘teachers’ workload increase’.
The researchers intended to identify the factors that increased the workload of teachers during the transition process to online learning during the COVID-19 pandemic based on a quantitative survey.
DataThere were 68 university teachers, selected by non-probability purposeful sampling, who participated in this study. The justification of purposeful sampling for participant selection was described by McMillan, & Schumacher (1993) as “They are likely to be knowledgeable and
Methodology
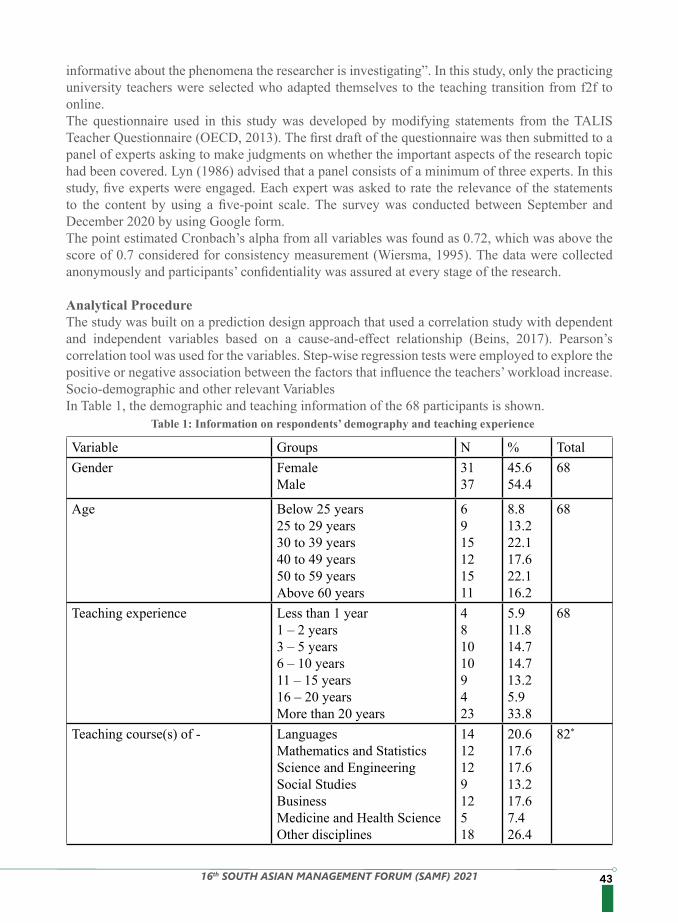
4316th SOUTH ASIAN MANAGEMENT FORUM (SAMF) 2021
informative about the phenomena the researcher is investigating”. In this study, only the practicing university teachers were selected who adapted themselves to the teaching transition from f2f to online. The questionnaire used in this study was developed by modifying statements from the TALIS Teacher Questionnaire (OECD, 2013). The first draft of the questionnaire was then submitted to a panel of experts asking to make judgments on whether the important aspects of the research topic had been covered. Lyn (1986) advised that a panel consists of a minimum of three experts. In this study, five experts were engaged. Each expert was asked to rate the relevance of the statements to the content by using a five-point scale. The survey was conducted between September and December 2020 by using Google form. The point estimated Cronbach’s alpha from all variables was found as 0.72, which was above the score of 0.7 considered for consistency measurement (Wiersma, 1995). The data were collected anonymously and participants’ confidentiality was assured at every stage of the research.
Analytical ProcedureThe study was built on a prediction design approach that used a correlation study with dependent and independent variables based on a cause-and-effect relationship (Beins, 2017). Pearson’s correlation tool was used for the variables. Step-wise regression tests were employed to explore the positive or negative association between the factors that influence the teachers’ workload increase. Socio-demographic and other relevant Variables In Table 1, the demographic and teaching information of the 68 participants is shown.
Table 1: Information on respondents’ demography and teaching experience
Variable Groups N % TotalGender Female
Male31 37
45.6 54.4
68
Age Below 25 years25 to 29 years30 to 39 years40 to 49 years50 to 59 yearsAbove 60 years
6915121511
8.813.222.117.622.116.2
68
Teaching experience Less than 1 year1 – 2 years3 – 5 years6 – 10 years11 – 15 years16 – 20 yearsMore than 20 years
4810109423
5.911.814.714.713.25.933.8
68
Teaching course(s) of - LanguagesMathematics and StatisticsScience and EngineeringSocial StudiesBusinessMedicine and Health ScienceOther disciplines
141212912518
20.617.617.613.217.67.426.4
82*
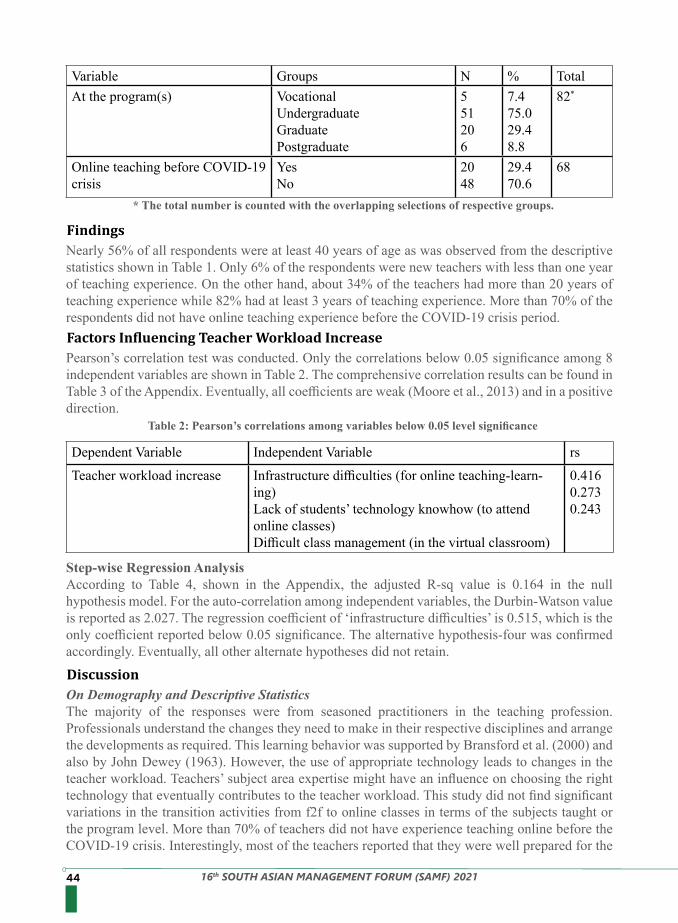
44 16th SOUTH ASIAN MANAGEMENT FORUM (SAMF) 2021
* The total number is counted with the overlapping selections of respective groups.
Table 2: Pearson’s correlations among variables below 0.05 level significance
Variable Groups N % TotalAt the program(s) Vocational
UndergraduateGraduatePostgraduate
551206
7.475.029.48.8
82*
Online teaching before COVID-19 crisis
YesNo
20 48
29.470.6
68
Nearly 56% of all respondents were at least 40 years of age as was observed from the descriptive statistics shown in Table 1. Only 6% of the respondents were new teachers with less than one year of teaching experience. On the other hand, about 34% of the teachers had more than 20 years of teaching experience while 82% had at least 3 years of teaching experience. More than 70% of the respondents did not have online teaching experience before the COVID-19 crisis period.
On Demography and Descriptive StatisticsThe majority of the responses were from seasoned practitioners in the teaching profession. Professionals understand the changes they need to make in their respective disciplines and arrange the developments as required. This learning behavior was supported by Bransford et al. (2000) and also by John Dewey (1963). However, the use of appropriate technology leads to changes in the teacher workload. Teachers’ subject area expertise might have an influence on choosing the right technology that eventually contributes to the teacher workload. This study did not find significant variations in the transition activities from f2f to online classes in terms of the subjects taught or the program level. More than 70% of teachers did not have experience teaching online before the COVID-19 crisis. Interestingly, most of the teachers reported that they were well prepared for the
Step-wise Regression AnalysisAccording to Table 4, shown in the Appendix, the adjusted R-sq value is 0.164 in the null hypothesis model. For the auto-correlation among independent variables, the Durbin-Watson value is reported as 2.027. The regression coefficient of ‘infrastructure difficulties’ is 0.515, which is the only coefficient reported below 0.05 significance. The alternative hypothesis-four was confirmed accordingly. Eventually, all other alternate hypotheses did not retain.
Pearson’s correlation test was conducted. Only the correlations below 0.05 significance among 8 independent variables are shown in Table 2. The comprehensive correlation results can be found in Table 3 of the Appendix. Eventually, all coefficients are weak (Moore et al., 2013) and in a positive direction.
Findings
Discussion
Factors Influencing Teacher Workload Increase
Dependent Variable Independent Variable rs
Teacher workload increase Infrastructure difficulties (for online teaching-learn-ing)Lack of students’ technology knowhow (to attend online classes)Difficult class management (in the virtual classroom)
0.4160.2730.243

4516th SOUTH ASIAN MANAGEMENT FORUM (SAMF) 2021
online classes though they did not think the online classes could be as effective as f2f classes.
On Correlation Test Results‘Teachers’ workload increase’ had all weak and positive (Moore et al., 2013) correlations: 0.416 with ‘infrastructure difficulties’, 0.273 with ‘lack of students’ technology knowhow’, and 0.243 with ‘difficult class management’. From the underlying dimensions of ‘infrastructure difficulties,’ it was found that students’ slow internet connection, inadequate or inappropriate devices of students for online classes, and insufficient infrastructure facilities for online classes provided by the educational institutions were the obstructing factors to successful online teaching. This finding of the study supports Siedlaczek’s (2004) findings regarding the increase in the teachers’ workload for teaching online. Students’ technological know-how was perceived by the teachers through online assignments and students’ motivation online and their adjustment capacities in a few weeks of classes. Students’ comfort levels were found from the underlying entries of online assignments and quizzes, use of digital devices, and internet connection facilities. Sari, & Nayir (2020) found similar factors in their qualitative research article on the challenges of distance education during the COVID-19 pandemic period.The underlying entries of ‘difficult class management’ came from students’ participation in class, students’ interruption during class, difficulties with non-verbal communication, and struggle to manage and organize group activities in online classes. However, this correlation coefficient was the weakest.
Step-wise Regression ResultsAdjusted R-sq value ensures that the linear regression can explain merely a 16.4% variance in the data. Durbin-Watson value is close to 2.0 and lies within the critical range of 1.5 < DW < 2.5 which ensures no first-order linear auto-correlation among the independent variables (Gujarati & Porter, 2009). The results show only the statistical relevance with ‘infrastructure difficulties’ on ‘teachers’ workload increase’. According to the regression values found, one unit increment in ‘infrastructure difficulties’ will decrease 0.515 units in ‘teacher workload increase’.
Overall DiscussionThe teachers involved in this study expressed the view that the institution needed to have policies developed for online courses specifically rather than only adapting existing f2f policies. The teachers also expressed the need for considerable flexibility and adaptability in course design. They suggested more online courses on professional development that ultimately help reduce teachers’ workload.Difficulty in class management is directly related to class size. There is much pressure in Asian countries to facilitate learning for large classes in online teaching. Spector et al., (2016) found from their experience in Indonesia that the ICT integration into formative assessment can reap better benefits. Thousands of Indonesian teachers had to do this in-service who were constantly seeking ways to minimize their heavy workload. Getting immediate feedback on learning tasks was essential but extremely challenging to provide (Spector et al., 2016) is also supported by this study.
Based on the findings and discussion of this study, the following set of recommendations is formulated for different stakeholders including policymakers and implementers.
Recommendations
46 16th SOUTH ASIAN MANAGEMENT FORUM (SAMF) 2021
Higher education institutions in Asian countries including Bangladesh and Thailand had to carry on the academic activities through online classes as the only alternative solution during the COVID-19 pandemic. Teachers suddenly transformed into online teaching by gaining new skills and making necessary adjustments. Such transformation needed extra work hours for teachers. This study intended to identify influential factors in teachers’ workload increase during the transition into online teaching. Based on the findings of this study, a set of inspectional recommendations was made for the practicing teachers and the policy-makers of higher education institutions. The students can also accept the observations to prepare themselves for effective online classes.
The scope of this survey was very limited and an extended approach could include more respondents for more reliable results. Subject expertise of the teachers and their age ranges were not analyzed in this study. Both of these teacher dynamics might have influence on the teacher workload increase.
It is expected that more research activities will be conducted on the topic of teachers’ workload in the higher education settings, especially in online teaching. Moreover, similar research will be expectedly conducted at other education levels.
These authors are thankful to all the colleagues who voluntarily participated in the survey for supporting the research.
1. Ainley, J., & Carstens, R. (2018). Teaching and learning international survey (TALIS) 2018 Conceptual framework”, OECD Education Working Papers, No. 187, OECD Publishing, Paris. http://dx.doi.org/10.1787/799337c2-en
2. Allen, I., & Seaman, J. (2009). Learning on demand: Online education in the United States. Babson Survey Research Group. http://files.eric.ed.gov/fulltext/ED529931.pdf
3. Andaleeb, S. S. (2019). Teaching load: The missing link in higher education quality, The Daily Star, 13 June, 2019.
4. Beins, B. C. (2017). Research method: A tool for life (3rd ed.). Cambridge University Press.5. Bransford, J., Brown, A. & Cocking R. R. (Eds) (2000). How People Learn: Brain, Mind,
Experience, and School. The National Research Council (US).6. ht tps: / /web.b.ebscohost .com/ehost/ebookviewer/ebook/bmxlYmtfXzQ2MDM
Conclusion
Limitation of this study
Future Research Direction
Acknowledgement
References
• Teachers in higher education will redesign their teaching and students’ evaluation planning by incorporating technology.• Teaching-learning plan will be remodeled by the teachers for ensuring the proper utilization of existing resources and finding efficient alternatives for minimizing workload.• University authorities will restructure the teaching-learning facilities, especially appropriate for the online education setting. • Institutions will rationalize infrastructure facilities by providing necessary devices and internet connectivity for both teachers and students. • Students will recognize the importance of responsible behaviors by improving technological know-how for effective learning and performance evaluation processes.• Teachers and students will restore confidence in class management through active, self-directed, and accountable participation.
4716th SOUTH ASIAN MANAGEMENT FORUM (SAMF) 2021
1X19BTg2?nobk=y&sid=3eae5282-d351-4741-ac9c-7dae70add3e0@pdc-v-sessmgr01&vid=3&format=EB&rid=1
7. Channel News Asia (CNA). (2020, March 17). Schools in Thailand to Close for two Weeks to Curb COVID-19 Spread. https://www.channel\newsasia/asia/COVID-19-thailand-schools-closed-prayut-chan-o-cha-1254778
8. Dasgupta, P. R. (2013). Volatility of workload on employee performance and significance of motivation: IT sector. Science Journal of Business and Management, 1(1), 1-7.
9. Davidovich, N., & Eckhaus, E. (2019). Student Evaluation of Lecturers – What do Faculty Members Think about the Damage Caused by Teaching Surveys? Higher Education Studies, 9(3): 12-21. DOI: https://doi.org/10.5539/hes.v9n3p22
10. Dewey, J. (1963). Experience and Education. New York, Collier.11. Fernandez, C. (2002). Learning from Japanese approaches to professional development:
the case of lesson study. Journal of Teachers Education, 53(5), 393-405. https://doi.org/10.1177/002248702237394
12. Firing, K. Moen, A., & Skarsvag, K.I., (2015). Debriefing to learn from Extreme Events: The Case of Utoya. International Journal of Training and Development, 19(4). https://doi.org/10:1111/ijtd.12064
13. Goh, C.F., Hii, P.K., Tan, O.K. & Rasli, A. (2020). Why do University Teachers use E-Learning Systems? International Review of Research in Open and Distributed Learning, 21(2), 136-155.
14. Gujarati, D. N., & Porter, D. C. (2009). Basic Econometrics (9th ed.). Boston, McGraw-Hill Irwin.
15. Jasim, M. M. (2020, April 4). Private University Students Taking Online Classes. The Business Standard [TBS]. https://tbsnews.net/coronavirus-chronicle/covid-19-bangladesh/private-university-students-taking-online-classes-64867
16. Lauret, D., & Bayram-Jacobs, D. (2021). COVID-19 Lockdown Education: The Importance of Structure in a Suddenly Changed Learning Environment. Educ. Sci. 2021, 11, 221. https://doi.org/10.3390/educsci11050221
17. Lyn, M. R. (1986). Determination and quantification of content validity. Nursing Research, 35, 382-385
18. Mala, D. (2020). Covid-19 Fear Pushes Classes Online. The Bangkok Post.19. htpps:www.bangkokpost.com/Thailand/general/1876594/covid-19-fear-pushes-classes-online20. McMillan, J. H., & Schumacher, S. (1993). Research in education: A conceptual understanding.
New York: HarperCollins.21. Mishra, P., & Koehler, M.J. (2006). Technological Pedagogical Content Knowledge: A
Framework for Teacher Knowledge. Teachers College Record, 108(6), 1017-1054. Retrieved from https://www.learntechlib.org/p/99246/
22. Moore, D. S., Notz, W. I., & Flinger, M. A. (2013). The Basic Practice of Statistics (6th ed.). New York, W. H. Freeman, and Company.
23. Müller, A.M., Goh, C., Lim, L.Z., Gao, X. (2021). COVID-19 Emergency eLearning and Beyond: Experiences and Perspectives of University Educators. Education Sciences, 11(19). DOI: https://doi.org/10.3390/educsci11010019
24. Naaj, M.A., Nachouki, M., & Ankit, A. (2012). Evaluating student satisfaction with blended learning in a gender-segregated environment. Journal of Information Technology Education: Research, 11(1), 185-200. Retrieved from https://www.learntechlib.org/p/111500/
25. Nantschev, R., Feuerstein, E., González, R. T., Alonso, I. R., Hackl, W. O., Petridis, K., Triantafyllou, E., & Ammenwerth, E. (2020). Teaching Approaches and Educational Technologies in Teaching Mathematics in Higher Education. Educ. Sci. 2020, 10, 354; https://
48 16th SOUTH ASIAN MANAGEMENT FORUM (SAMF) 2021
doi.org/10.3390/educsci10120354 26. OECD. (2013). TALIS 2013 Teacher Questionnaire, TALIS, Paris: OECD Publishing. http://
www.oecd.org/education/school/TALIS-2013-Teacher-questionnaire.pdf27. Pócsová, J., Mojžišová, A., Takáˇc, M., & Klein, D. (2021). The Impact of the COVID-19
Pandemic on Teaching Mathematics and Students’ Knowledge, Skills, and Grades. Educ. Sci. 2021, 11, 225. https://doi.org/10.3390/educsci11050225
28. Qin, L., Li, N., Zha, S., & He, W. (2017). Research on factors influencing perceived usefulness of a virtual teacher community: A case study of rural teachers in Inner Mongolia, China. Telematics and Informatics, 34(5), 463-471. doi: https://doi.org/10.1016/j.tele.2016.09.008
29. Sakib, A. N. (2020, 16th March). COVID-19: Bangladesh Shuts all Educational Institutions. Anadolu Agency [AA]. https://www.aa.com.tr/en/asia-pacific/covid-19-bangladesh-shuts-all-educational-institutions/1767425
30. Sánchez-Prieto, J.C., Olmos-Migueláñez, S., & García-Peñalvo, F.J. (2016). Informal tools in formal contexts: Development of a model to assess the acceptance of mobile technologies among teachers. Computers in Human Behavior, 55, Part A, 519-528. doi: https://doi.org/10.1016/j.chb.2015.07.002
31. San-Martín, S., Jimenez, N., Rodríguez-Torrico, P., & Piñeiro-Ibarra, I. (2020). The determinants of teachers’ continuance commitment to e-learning in higher education. Educ. Inf. Technol., 25, 3205–3225.
32. Sari, T., & Nayir, F. (2020). Challenges in Distance Education During the (Covid-19) Pandemic Period. Qualitative Research in Education, 9(3), 328-360. https://doi.org/10.17583/qre.2020.5872
33. Siedlaczek, K. (2004). Perceptions about Teaching Online versus in a Classroom Environment, College Quarterly, Summer 2004, 7(3). https://files.eric.ed.gov/fulltext/EJ852047.pdf
34. Simonson, M., Smaldino, S., Albright, M., & Zvacek, S. (2009). Teaching and learning at a distance: Foundations of distance education (4th ed.). Allyn & Bacon.
35. Spector, J.M., Ifenthaler, D., Sampson, D., Yang, L., Mukama, E., Warusavitarana, A., Lokuge, K., Dona, Eichhorn, K., Fluck, A., Huang, R., Bridges, S., Lu, J., Ren, Y., Gui, X., Deneen, C.C., San Diego, J., & Gibson, D.C. (2016). Technology Enhanced Formative Assessment for 21st Century Learning, Journal of Educational Technology & Society, 19(3), 58-71. Retrieved from https://www.jstor.org/stable/10.2307/jeductechsoci.19.3.58
36. The Business Standard [TBS]. (2020, April 27). Educational Institutions may Remain Closed till September if Virus does not Fade: PM. https://tbsnews.net/Bangladesh/education/all-educational-institutions-remain-closed-till-september-pm-74221
37. Ujir, H., Salleh, S.F., Marzuki, A.S.A.W., Hashim, H.F., & Alias, A.A. (2020). Teaching workload in 21st century higher education learning setting, International Journal of Evaluation and Research in Education, 9(1), 221-227. DOI: https://doi.org/10.11591/ijere.v9i1.20419
38. Venkatesh, V., & Davis, F.D. (2000). A Theoretical Extension of the Technology Acceptance Model: Four Longitudinal Field Studies. Management Science, 46(2), 186-204. DOI: https://doi.org/10.1287/mnsc.46.2.186.11926
39. Vygotsky, L. S. (1978). Mind in society: The development of higher psychological processes. Cambridge, MA: Harvard University Press.
40. Wiersma, W. (1995). Research methods in education: An introduction (6th ed.). Massachusetts: Simon & Schuster Company.
41. World Health Organisation (WHO). (2020, March 11). WHO Director-General’s Opening Remarks at the Media Briefing on Covid-19. https://www.who.int/dg/speeches/details/who-director-s-opening-remarks-at-the media-briefing-on-covid-19---11-march-2020
4916th SOUTH ASIAN MANAGEMENT FORUM (SAMF) 2021
MEASURING SERVICE QUALITY OF ONLINE EDUCATIONAL PLATFORMS
Keywords: E-SERVQUAL model; Customer Satisfaction; Online Educational Platforms; Service Quality; Performance.
Education plays an important role in the growth and development of a student but the hit of COVID- 19 badly impacted the entire economy as well as the whole education system. Schools, colleges, universities and various other institutions were forced to close due to this pandemic, students and teachers had no option but to move towards online education to continue the process of learning. The UNESCO report revealed that the coronavirus affected more than 290 million students across 22 nations. This study tried to identify the dimensions and factors that impacted the customer (students) satisfaction and performance of online educational platforms by the E-SERVQUAL model (Efficiency, Responsiveness, Fulfilment, Reliability, Security, and Contact) that are believed to represent the service quality perceived by the customers. Data was collected online by surveying through a structured questionnaire. The results show that there is a significant relationship between service quality dimensions and customer satisfaction. The findings of the research encompass individuals from a society which has been reached at convenience.
The COVID-19 pandemic is the first and worst phenomenon which impacted the whole economy and most of the countries were forced to shut down their operations including schools and colleges. These nationwide closures are affecting over 91%of institutions. UNESCO is supporting nations that are under serious threat with regards to school terminations and are powerless in this scenario. The UNESCO report appraises that the coronavirus pandemic will antagonistically affect more than 290 million understudies across 22 nations. The UNESCO appraises that around 32 crores of understudies are influenced in India, incorporating those in schools and universities (Wadhavane-Tapaswi, 2020). Technology may have a significant job during the lockdown time facilitating examination and work from home. In India, some tuition-based schools could receive internet education techniques. Low-salary private and government schools will most likely be unable to embrace web-based instructing techniques; they will be closed because of no entrance to e-learning arrangements. Advanced education areas are likewise disturbed which again has a clear effect on the nation’s financial future. Different understudies from India took admissions abroad like the US, UK, Australia, China, and so on. Furthermore, these nations are heavily impacted by COVID-19. Perhaps there is a likelihood that many aspiring students won’t take admissions there in future and on the off chance that the circumstance continues, over the long haul will be a decrease in the interest for global advanced education likewise (Goyal, 2020).Education is a vital aspect of the growth and development of a student. Like all schools, colleges,
Abstract
Introduction
Dr. Ellur AnandAssistant Professor*
Dr. Mafruza SultanaLecturer*
Mohammed Aamir ShuaibPGDM Analytics*
Salman KhanPGDM Analytics* *Jagdish Sheth School of Management, India
50 16th SOUTH ASIAN MANAGEMENT FORUM (SAMF) 2021
universities, and various other institutions are closed due to the pandemic, students and teachers have no option but to move towards online educational platforms to continue the process of learning. However, there are many other challenges to overcome. Students with no proper facilities such as Internet access, low bandwidth, and even electric city could find it very difficult to cope with the online educational system but, on the other hand, students with good access to the internet and technology are shifting to online education platforms and focusing on doing more courses on online platforms. For those with access to technology and online learning, there is evidence that online learning is as effective as offline learning, if not more. Research shows that students learning online, on average, can retain more when compared to students learning in a classroom. This increase in effectiveness is because they can (a)learn according to their pace and their way of understanding, (b) go back and re-read the material in a personalized manner, and (c)skip or accelerate through the concepts as per their liking. We are all aware of the economic crisis caused by the pandemic, and most the students are worried that, due to this financial crisis, there would be more unemployment in the economy and getting jobs might get tricky. This fear is pushing them to do more courses and develop more skills to get competitive, and for that, they are turning towards online educational platforms ( NITI Aayog, 2020).Even before this pandemic, many believed that our education system had lost its relevance. Many schools still specialize in traditional academic skills, instead of focusing on skills like critical thinking and adaptableness. While there are concerns that shifting to online may hamper the conventional method of learning and teaching, many have already decided to “make online learning a part of their ‘new normal’ after experiencing its benefits first-hand” (AllAfrica Global Media, 2020).The importance of spreading knowledge through multiple platforms is highlighted due to this pandemic. Online learning is one of the few sectors where investments have been going up. This pandemic has made clear the importance of spreading knowledge across different platforms. Technology has created a potential for better education through online learning, and it is upon us to explore its full potential (AllAfrica Global Media, 2020).Educational platforms like Coursera, DataScience365 and many other platforms are providing free access to their paid course catalogues during this pandemic to encourage students to try out these platforms and increase the users on their platforms. These platforms recognize that this is their opportunity to get as many users as possible onto their platforms. Hence, they are focusing on providing excellent services and doing extensive advertising on YouTube and other educational sites to make use of this opportunity and gain as many users as possible.Hence, in this research paper, we have attempted to understand the impact of various service quality factors of these online educational platforms on overall customer satisfaction with the help of the E-SERVQUAL model.
“Initially, e-service quality was established by describing as the degree to which a website makes shopping, purchasing and delivery efficient and more importantly reliable” (Zeithaml V. A., 2000) .”The concept of E-service quality should be, according to the description, a service that covers from the pre-purchase process up to the post-purchase period. Many studies have been conducted and models and frameworks have been made for the evaluation id E-service quality like (Wolfinbarger, 2003)(Parasuraman, 2005) (Collier, 2006) . Through detailed observation, we found out that there is no particular model or framework to measure this service quality. This concept is built on the commonly accepted notion of perceived quality experienced by the consumer. The quality of a service or a specific product is what a customer thinks it is, and the price he or she pays for it is
Literature Review
5116th SOUTH ASIAN MANAGEMENT FORUM (SAMF) 2021
what the customer perceives about a product or a service. The concept of e-service is one of the popular ways of using information, but it is difficult to provide a detailed e-service description. In addition to internet and web-based technology creation, online consumers use the required product and service details.Zeithaml V. A. (2002 and 2001) developed the E-SERVQUAL measure of e-service quality to study how customers evaluated e-service quality. This new model was built through a three-stage method involving exploratory focus groups, and two stages of empirical data collection and analysis. It includes a total of seven dimensions: contact, responsiveness, compensation, efficiency, reliability, fulfilment, and privacy.“The first four dimensions are known as the core scale of operation, and the latter three dimensions are called a scale of recovery since they are only important when online consumers have concerns or issues. Below are the contents of every dimension” (Babak Nemati, 2011):(1) “The core service scales of E-SERVQUAL services” (Babak Nemati, 2011). “(A) Efficiency: customers’ ability to access and use the website and maintain minimal effort related information. (B)Fulfilment: quality of service specifications, inventory availability in storage, and timely delivery of goods. (C)Reliability: the site’s technical feature, especially the degree to which it is accessible and operating appropriately. (D) Privacy: ensuring that shoppers’ data is not misused, and credit card details are protected” (Babak Nemati, 2011).
(2) “(A)Responsiveness: it measures the capacity of service providers to provide consumers with suitable data when an issue occurs, has processes for managing returns, and offers electronic assurances. (B) Compensation: is to receive money back and to return handling and shipment charges. (c) Contact. Customers’ demand to chat online or over the phone to a live customer service supporter” (Babak Nemati, 2011).
Efficiency“This refers to the ability of the website or online service provider to be easily visible and located by the customer and provide desired information with minimal or very fewer efforts. It effectively covers the overall design” (Kaynama, 2000), “ease of navigation” (Kaynama, 2000) (Zeithaml V. A., 2000) and “overall ease of use”(Dabholkar 1996).
Responsiveness“Measures the ability of e-service to take appropriate steps and help customers when a problem arises, have mechanisms to handle returns, and provide guarantees.The quality and intensity of support a customer receives when he or she is faced with a problem and the duration a customer must wait to get that support post-transaction is where a customer evaluates a service. “The quicker a service provider responds to requests, the better the service is perceived to be ” (Van Riel, 2004) (Yoo, 2001) (Babak Nemati, 2011)
FulfilmentIt is the extent to which the content is delivered, and customers are satisfied with the inputs provided to them.
ReliabilityIt is associated with the technical functioning of the website or platform; it tells how functional a website or a platform is. It is the next SERVQUAL aspect for online services and it is similar to the case of offline services where consumers expect search engines, payment facilities, etc. to work
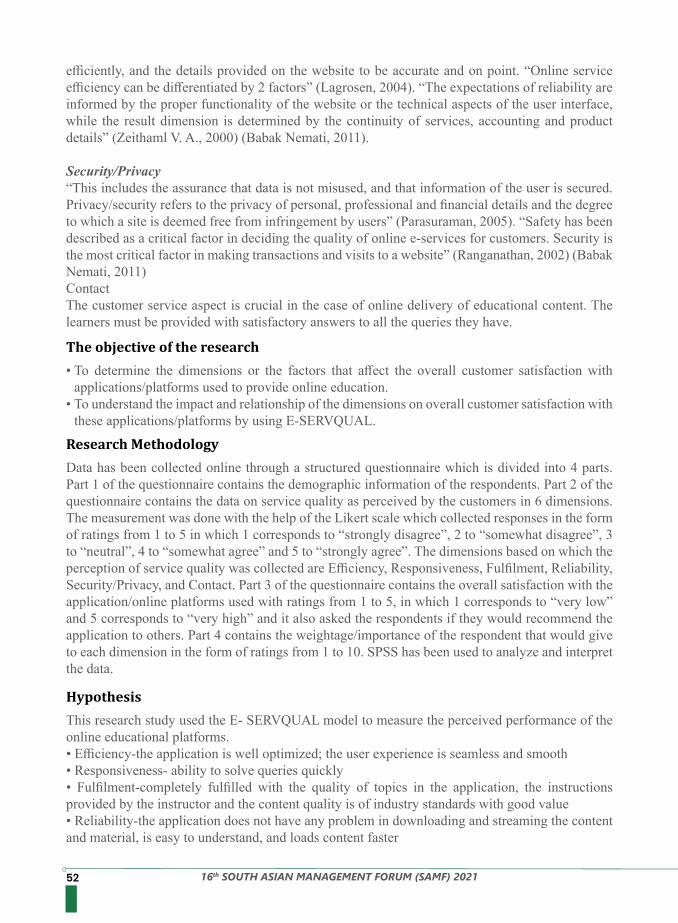
52 16th SOUTH ASIAN MANAGEMENT FORUM (SAMF) 2021
efficiently, and the details provided on the website to be accurate and on point. “Online service efficiency can be differentiated by 2 factors” (Lagrosen, 2004). “The expectations of reliability are informed by the proper functionality of the website or the technical aspects of the user interface, while the result dimension is determined by the continuity of services, accounting and product details” (Zeithaml V. A., 2000) (Babak Nemati, 2011).
Security/Privacy“This includes the assurance that data is not misused, and that information of the user is secured. Privacy/security refers to the privacy of personal, professional and financial details and the degree to which a site is deemed free from infringement by users” (Parasuraman, 2005). “Safety has been described as a critical factor in deciding the quality of online e-services for customers. Security is the most critical factor in making transactions and visits to a website” (Ranganathan, 2002) (Babak Nemati, 2011)ContactThe customer service aspect is crucial in the case of online delivery of educational content. The learners must be provided with satisfactory answers to all the queries they have.
• To determine the dimensions or the factors that affect the overall customer satisfaction with applications/platforms used to provide online education.
• To understand the impact and relationship of the dimensions on overall customer satisfaction with these applications/platforms by using E-SERVQUAL.
This research study used the E- SERVQUAL model to measure the perceived performance of the online educational platforms. • Efficiency-the application is well optimized; the user experience is seamless and smooth• Responsiveness- ability to solve queries quickly • Fulfilment-completely fulfilled with the quality of topics in the application, the instructions provided by the instructor and the content quality is of industry standards with good value• Reliability-the application does not have any problem in downloading and streaming the content and material, is easy to understand, and loads content faster
Data has been collected online through a structured questionnaire which is divided into 4 parts. Part 1 of the questionnaire contains the demographic information of the respondents. Part 2 of the questionnaire contains the data on service quality as perceived by the customers in 6 dimensions. The measurement was done with the help of the Likert scale which collected responses in the form of ratings from 1 to 5 in which 1 corresponds to “strongly disagree”, 2 to “somewhat disagree”, 3 to “neutral”, 4 to “somewhat agree” and 5 to “strongly agree”. The dimensions based on which the perception of service quality was collected are Efficiency, Responsiveness, Fulfilment, Reliability, Security/Privacy, and Contact. Part 3 of the questionnaire contains the overall satisfaction with the application/online platforms used with ratings from 1 to 5, in which 1 corresponds to “very low” and 5 corresponds to “very high” and it also asked the respondents if they would recommend the application to others. Part 4 contains the weightage/importance of the respondent that would give to each dimension in the form of ratings from 1 to 10. SPSS has been used to analyze and interpret the data.
The objective of the research
Hypothesis
Research Methodology
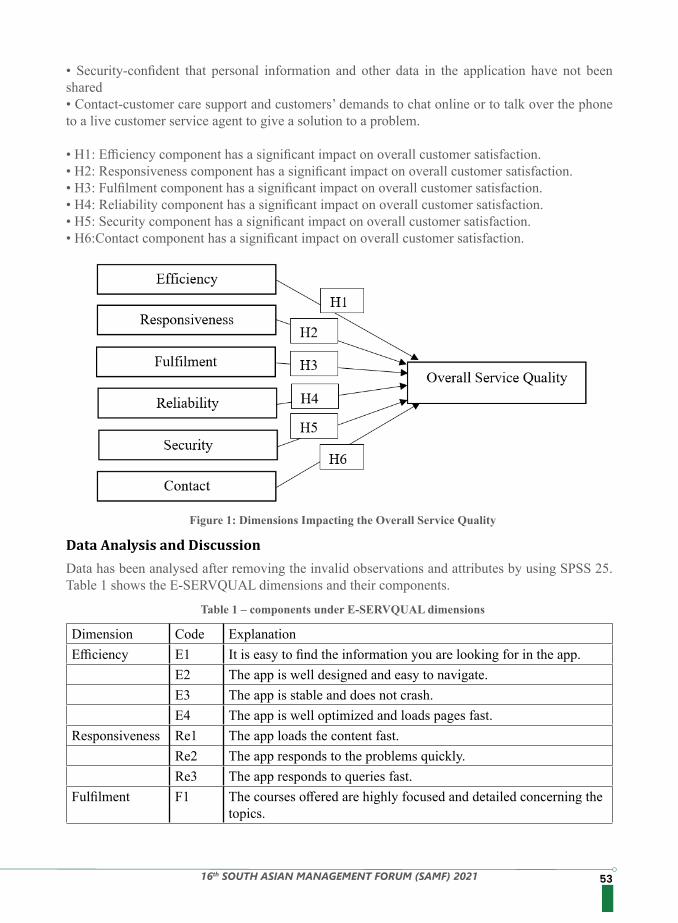
5316th SOUTH ASIAN MANAGEMENT FORUM (SAMF) 2021
Data has been analysed after removing the invalid observations and attributes by using SPSS 25. Table 1 shows the E-SERVQUAL dimensions and their components.
Data Analysis and Discussion
• Security-confident that personal information and other data in the application have not been shared• Contact-customer care support and customers’ demands to chat online or to talk over the phone to a live customer service agent to give a solution to a problem.
• H1: Efficiency component has a significant impact on overall customer satisfaction.• H2: Responsiveness component has a significant impact on overall customer satisfaction.• H3: Fulfilment component has a significant impact on overall customer satisfaction.• H4: Reliability component has a significant impact on overall customer satisfaction.• H5: Security component has a significant impact on overall customer satisfaction.• H6:Contact component has a significant impact on overall customer satisfaction.
Figure 1: Dimensions Impacting the Overall Service Quality
Table 1 – components under E-SERVQUAL dimensions
Dimension Code ExplanationEfficiency E1 It is easy to find the information you are looking for in the app.
E2 The app is well designed and easy to navigate.E3 The app is stable and does not crash. E4 The app is well optimized and loads pages fast.
Responsiveness Re1 The app loads the content fast.Re2 The app responds to the problems quickly.Re3 The app responds to queries fast.
Fulfilment F1 The courses offered are highly focused and detailed concerning the topics.
54 16th SOUTH ASIAN MANAGEMENT FORUM (SAMF) 2021
Dimension Code ExplanationF2 The App meets the expectations and delivers a satisfactory experi-
ence.F3 The courses offered are aligned with industry demand and they are
significantly valued.F4 The delivery of the instructor meets the standards, and they are
easily understandable.Reliability R1 The contents in the app are accurate and free of errors.
R2 The app does not have trouble downloading and streaming the content and material.
R3 The contents and materials in the app are easy to understand.R4 The app has courses from reputed Universities.
Security S1 I am sure that my personal information and my other data in the app are safe, and it is not being shared with any third party.
S2 I do not hesitate while doing money transactions in these apps. S3 I feel that these apps are not secured and compromise my privacy.
Contact C1 Customer care service is available 24/7.C2 It is very easy to reach a customer care service representative.C3 Any issue faced in the app is quickly resolved by the customer care
service representative.C4 It is difficult to make the customer service agent understand the
problem that I am facing.
To check the reliability of the data it is required to find out the Cronbach alpha of each of the dimensions. Cronbach alpha checks if all the elements in that dimension are measuring the same parameter or dimension; in other words, it checks for internal consistency among the questions under the same dimension. As a thumb rule, the Cronbach alpha should be over 0.7 for the data to be accepted as reliable. In this study, it has been found that the Cronbach alpha is greater than 0.7 as shown in Table 2. As a result, it can be said that the data is reliable.
Reliability Test
Table 1 – components under E-SERVQUAL dimensions
Item Code Scale Mean if Item Deleted
Scale Variance if Item Deleted
Corrected Item-Total Cor-relation
Cronbach's Alpha if Item Deleted
Efficiency: Cronbach's alpha = 0.763E1 12.83 3.020 0.572 0.705E2 12.83 3.036 0.544 0.717E3 12.85 2.749 0.524 0.730E4 12.98 2.463 0.627 0.670Responsiveness: Cronbach's alpha = 0.749Re1 8.06 2.119 0.528 0.721
5516th SOUTH ASIAN MANAGEMENT FORUM (SAMF) 2021
Kaiser Meyer Olkin i.e., KMO measure and significance value are used to measure the acceptability of the factor analysis. The KMO value ranges from 0 to 1, and if the KMO value is greater than 0.5 a significance value below 0.05, the factor analysis is said to be acceptable. In this study, the KMO value is 0.883 and the significance value is 0.000. Therefore it can be said that in this particular study the factor analysis is acceptable. Table 3 shows the KMO and Bartlett’s test results.
Factor Analysis:
Table 3 – KMO and Bartlett’s Test
Item Code Scale Mean if Item Deleted
Scale Variance if Item Deleted
Corrected Item-Total Cor-relation
Cronbach's Alpha if Item Deleted
Re2 8.30 1.821 0.606 0.631Re3 8.24 1.551 0.613 0.629Fulfilment: Cronbach’s alpha = 0.813F1 12.50 3.439 0.695 0.771F2 12.56 3.500 0.642 0.794F3 12.56 3.208 0.694 0.770F4 12.53 3.633 0.608 0.809Reliability: Cronbach's alpha = 0.725R1 12.68 3.277 0.531 0.655R2 12.59 3.301 0.551 0.646R3 12.58 3.172 0.578 0.629R4 12.74 2.925 0.436 0.731Security/Privacy: Cronbach's alpha = 0.728S1 7.23 2.453 0.384 0.131S2 7.30 2.439 0.400 0.106S3 (Removed) 7.88 2.758 0.073 0.728Contact: Cronbach’s alpha = 0.819C1 10.96 4.722 0.745 0.723C2 10.95 5.038 0.702 0.746C3 10.87 5.121 0.692 0.752C4 11.20 5.284 0.465 0.863
KMO and Bartlett's Test
Kaiser-Meyer-Olkin Measure of Sampling Adequacy. 0.883
Bartlett's Test of Sphericity Approx. Chi-Square 720.538
df 78
Sig. 0.000
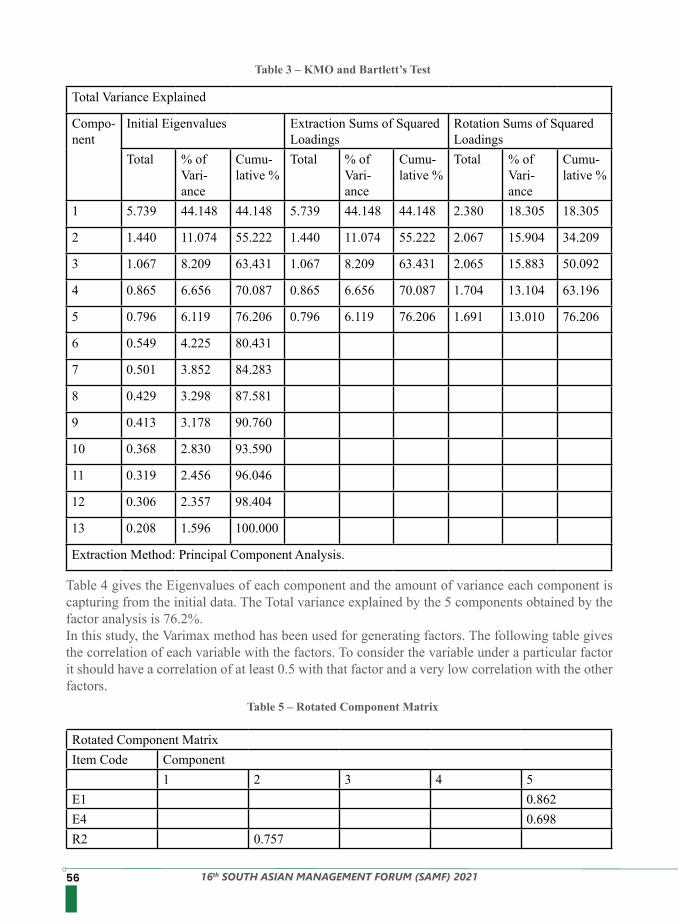
56 16th SOUTH ASIAN MANAGEMENT FORUM (SAMF) 2021
Table 3 – KMO and Bartlett’s Test
Total Variance Explained
Compo-nent
Initial Eigenvalues Extraction Sums of Squared Loadings
Rotation Sums of Squared Loadings
Total % of Vari-ance
Cumu-lative %
Total % of Vari-ance
Cumu-lative %
Total % of Vari-ance
Cumu-lative %
1 5.739 44.148 44.148 5.739 44.148 44.148 2.380 18.305 18.305
2 1.440 11.074 55.222 1.440 11.074 55.222 2.067 15.904 34.209
3 1.067 8.209 63.431 1.067 8.209 63.431 2.065 15.883 50.092
4 0.865 6.656 70.087 0.865 6.656 70.087 1.704 13.104 63.196
5 0.796 6.119 76.206 0.796 6.119 76.206 1.691 13.010 76.206
6 0.549 4.225 80.431
7 0.501 3.852 84.283
8 0.429 3.298 87.581
9 0.413 3.178 90.760
10 0.368 2.830 93.590
11 0.319 2.456 96.046
12 0.306 2.357 98.404
13 0.208 1.596 100.000
Extraction Method: Principal Component Analysis.
Table 4 gives the Eigenvalues of each component and the amount of variance each component is capturing from the initial data. The Total variance explained by the 5 components obtained by the factor analysis is 76.2%.In this study, the Varimax method has been used for generating factors. The following table gives the correlation of each variable with the factors. To consider the variable under a particular factor it should have a correlation of at least 0.5 with that factor and a very low correlation with the other factors.
Table 5 – Rotated Component Matrix
Rotated Component MatrixItem Code Component
1 2 3 4 5E1 0.862E4 0.698R2 0.757
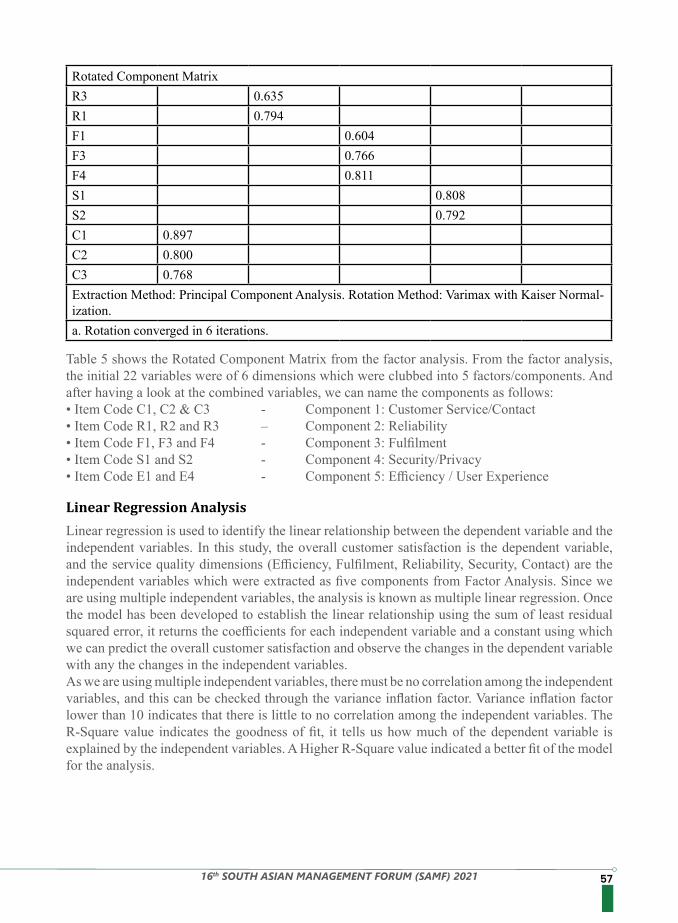
5716th SOUTH ASIAN MANAGEMENT FORUM (SAMF) 2021
Table 5 shows the Rotated Component Matrix from the factor analysis. From the factor analysis, the initial 22 variables were of 6 dimensions which were clubbed into 5 factors/components. And after having a look at the combined variables, we can name the components as follows: • Item Code C1, C2 & C3 - Component 1: Customer Service/Contact• Item Code R1, R2 and R3 – Component 2: Reliability• Item Code F1, F3 and F4 - Component 3: Fulfilment• Item Code S1 and S2 - Component 4: Security/Privacy• Item Code E1 and E4 - Component 5: Efficiency / User Experience
Rotated Component MatrixR3 0.635 R1 0.794 F1 0.604 F3 0.766 F4 0.811 S1 0.808 S2 0.792 C1 0.897 C2 0.800 C3 0.768 Extraction Method: Principal Component Analysis. Rotation Method: Varimax with Kaiser Normal-ization.a. Rotation converged in 6 iterations.
Linear regression is used to identify the linear relationship between the dependent variable and the independent variables. In this study, the overall customer satisfaction is the dependent variable, and the service quality dimensions (Efficiency, Fulfilment, Reliability, Security, Contact) are the independent variables which were extracted as five components from Factor Analysis. Since we are using multiple independent variables, the analysis is known as multiple linear regression. Once the model has been developed to establish the linear relationship using the sum of least residual squared error, it returns the coefficients for each independent variable and a constant using which we can predict the overall customer satisfaction and observe the changes in the dependent variable with any the changes in the independent variables.As we are using multiple independent variables, there must be no correlation among the independent variables, and this can be checked through the variance inflation factor. Variance inflation factor lower than 10 indicates that there is little to no correlation among the independent variables. The R-Square value indicates the goodness of fit, it tells us how much of the dependent variable is explained by the independent variables. A Higher R-Square value indicated a better fit of the model for the analysis.
Linear Regression Analysis
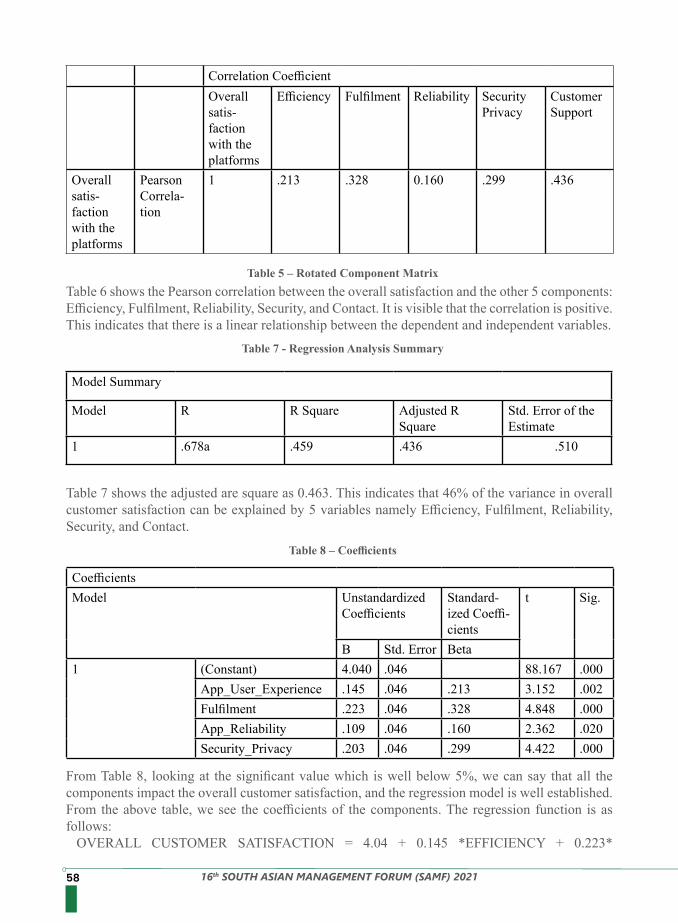
58 16th SOUTH ASIAN MANAGEMENT FORUM (SAMF) 2021
Correlation Coefficient Overall
satis-faction with the platforms
Efficiency Fulfilment Reliability Security Privacy
CustomerSupport
Overall satis-faction with the platforms
Pearson Correla-tion
1 .213 .328 0.160 .299 .436
Table 5 – Rotated Component Matrix
Table 7 - Regression Analysis Summary
Table 8 – Coefficients
Table 6 shows the Pearson correlation between the overall satisfaction and the other 5 components: Efficiency, Fulfilment, Reliability, Security, and Contact. It is visible that the correlation is positive. This indicates that there is a linear relationship between the dependent and independent variables.
Table 7 shows the adjusted are square as 0.463. This indicates that 46% of the variance in overall customer satisfaction can be explained by 5 variables namely Efficiency, Fulfilment, Reliability, Security, and Contact.
From Table 8, looking at the significant value which is well below 5%, we can say that all the components impact the overall customer satisfaction, and the regression model is well established. From the above table, we see the coefficients of the components. The regression function is as follows: OVERALL CUSTOMER SATISFACTION = 4.04 + 0.145 *EFFICIENCY + 0.223*
Model Summary
Model R R Square Adjusted R Square
Std. Error of the Estimate
1 .678a .459 .436 .510
CoefficientsModel Unstandardized
CoefficientsStandard-ized Coeffi-cients
t Sig.
B Std. Error Beta1 (Constant) 4.040 .046 88.167 .000
App_User_Experience .145 .046 .213 3.152 .002Fulfilment .223 .046 .328 4.848 .000App_Reliability .109 .046 .160 2.362 .020Security_Privacy .203 .046 .299 4.422 .000
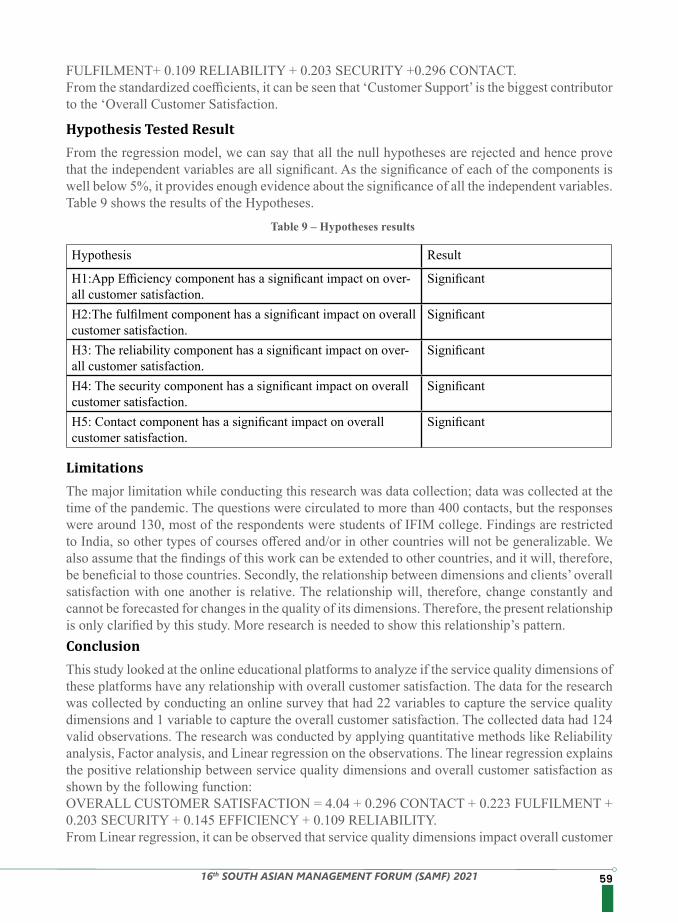
5916th SOUTH ASIAN MANAGEMENT FORUM (SAMF) 2021
Table 9 – Hypotheses results
FULFILMENT+ 0.109 RELIABILITY + 0.203 SECURITY +0.296 CONTACT.From the standardized coefficients, it can be seen that ‘Customer Support’ is the biggest contributor to the ‘Overall Customer Satisfaction.
From the regression model, we can say that all the null hypotheses are rejected and hence prove that the independent variables are all significant. As the significance of each of the components is well below 5%, it provides enough evidence about the significance of all the independent variables. Table 9 shows the results of the Hypotheses.
The major limitation while conducting this research was data collection; data was collected at the time of the pandemic. The questions were circulated to more than 400 contacts, but the responses were around 130, most of the respondents were students of IFIM college. Findings are restricted to India, so other types of courses offered and/or in other countries will not be generalizable. We also assume that the findings of this work can be extended to other countries, and it will, therefore, be beneficial to those countries. Secondly, the relationship between dimensions and clients’ overall satisfaction with one another is relative. The relationship will, therefore, change constantly and cannot be forecasted for changes in the quality of its dimensions. Therefore, the present relationship is only clarified by this study. More research is needed to show this relationship’s pattern.
This study looked at the online educational platforms to analyze if the service quality dimensions of these platforms have any relationship with overall customer satisfaction. The data for the research was collected by conducting an online survey that had 22 variables to capture the service quality dimensions and 1 variable to capture the overall customer satisfaction. The collected data had 124 valid observations. The research was conducted by applying quantitative methods like Reliability analysis, Factor analysis, and Linear regression on the observations. The linear regression explains the positive relationship between service quality dimensions and overall customer satisfaction as shown by the following function:OVERALL CUSTOMER SATISFACTION = 4.04 + 0.296 CONTACT + 0.223 FULFILMENT + 0.203 SECURITY + 0.145 EFFICIENCY + 0.109 RELIABILITY.From Linear regression, it can be observed that service quality dimensions impact overall customer
Hypothesis Tested Result
Limitations
Conclusion
Hypothesis Result
H1:App Efficiency component has a significant impact on over-all customer satisfaction.
Significant
H2:The fulfilment component has a significant impact on overall customer satisfaction.
Significant
H3: The reliability component has a significant impact on over-all customer satisfaction.
Significant
H4: The security component has a significant impact on overall customer satisfaction.
Significant
H5: Contact component has a significant impact on overall customer satisfaction.
Significant
60 16th SOUTH ASIAN MANAGEMENT FORUM (SAMF) 2021
satisfaction. Listed below are the service quality dimensions with the most impact on overall customer satisfaction in descending order:• CONTACT (Customer support)• FULFILMENT• SECURITY• EFFICIENCY (App user experience)• RELIABILITYThe above result indicates the importance of these service quality components in measuring the overall customer satisfaction of online educational platforms.
1. NITI Aayog. (2020, April 16). COVID-19 Pandemic: Impact and strategies for education sector in India. Retrieved from ETGoverment: https://government.economictimes.indiatimes.com/news/education/covid-19-pandemic-impact-and-strategies-for-education-sector-in-india/75173099
2. AllAfrica Global Media. (2020, May 5). The COVID-19 Pandemic Has Changed Education Forever. This is How. Retrieved from MarketScreener: https://www.marketscreener.com/TENCENT-HOLDINGS-LIMITED-3045861/news/Tencent-The-COVID-19-Pandemic-Has-Changed-Education-Forever-This-is-How-30542213/
3. Babak Nemati, H. G. (2011). Analyzing e-service quality in service-based websites by E-SERVQUAL. Tehran, Iran.
4. Collier, J. E. (2006). Measuring service quality in e-retailing. Journal of Service Research, 260-275.
5. Kaynama, S. A. (2000). proposal to assess the service quality of online travel agencies: an exploratory study. Journal of Professional Services Marketing, 63–88.
6. Lagrosen, S. S.-H. (2004). Examination of the dimensions of quality in higher education. Quality Assurance in Education, 61-69.
7. Parasuraman, A. Z. (2005). E-S-QUAL – A multiple-item scale for assessing electronic service quality. Journal of service research, 213-233.
8. Ranganathan, C. &. (2002). Key dimensions of business-to-consumer websites. Information and Management, 457–465.
9. Van Riel, A. C. (2004). Online Travel Service Quality: the Role of Pre-Transaction Services. Total Quality Management & Business Excellence, 475-493.
10. Wikipedia. (n.d.). Retrieved from https://en.wikipedia.org/wiki/Wikipedia11. Wolfinbarger, M. &. (2003). eTailQ: dimensionalizing, measuring and predicting etail quality.
Journal of Retailing.12. Yoo, B. &. (2001). Developing a scale to measure the perceived quality of Internet shopping
sites(SITEQUAL). Quarterly Journal of Electronic Commerce, 31–47.13. Zeithaml, V. A. (2000). A Conceptual Framework for Understanding e-Service Quality:
Implications for. Cambridge, MA: Marketing Science Institute.14. Zeithaml, V. A. (2002). Service quality delivery through websites: a critical review of extant
knowledge. Academy of Marketing Science Journal,, 362-375.
References
6116th SOUTH ASIAN MANAGEMENT FORUM (SAMF) 2021
ROLE OF PERSONALITY TRAITS IN INFLUENCING B SCHOOL LEARNERS’ DROPOUT BEHAVIOR IN MOOCS AND MEDIATING
ROLE OF HEDONIC ATTRIBUTES INFLUENCING DROPOUT.
Purpose/Scope: MOOCs have emerged as an alternative mode of learning. The awareness and enrollments are large in developing countries but previous studies show a low retention rate, the dropout percentage is 90% (Yang et al. 2013). Personality plays a vital role in education and some studies establish a positive relationship between personality traits and academic continuation. But there are limited studies that investigate the role of hedonic attributes in influencing students’ dropout in MOOCs. Hence, the paper aims to determine the role of personality and hedonic attributes in the dropout of MOOCs.Methodology: The data was collected from B school students using the convenience sampling method. The reliability and validity of constructs were measured using Cronbach’s alpha. The questionnaire constructs were adopted from existing literature. Descriptive analysis was used to find the correlation between personality traits, Hedonic attributes, and dropout in MOOCs. Further regression analysis was used to determine the relationship between variables of the study.Conclusion: The study proves that hedonic attributes and neuroticism have a positive influence on the Dropout in MOOCs. Openness is significant but has a negative relationship with dropouts. Hedonic attributes and extraversion personality traits are positively correlated. Hence, the inclusion of hedonic attributes shall influence extraversion personality trait members to continue MOOCS learning.
Internet penetration has brought drastic changes in business operations; the education sector was not left behind. Massive Open Online Course got popularized during the pandemic, it acted as a potential alternative to continue the learning of students, faculties, and corporates. Massive Open Online Courses are designed to provide both structured and unstructured learning methods. It was used by both academicians and corporates to upskill themselves. In addition to knowledge, it provides other benefits such as credit transfer, certificates, and increased flexibility in the enrollment rates in MOOCs. In contradiction to the increased enrollment rates, the dropout rates were also strong. According to Sanagustín et al. (2016), the dropout rate is between 93% and 94%. Such strong dropout rates encourage innovations to curb the dropout rates and simultaneously highlight the benefits of such online courses.During the pandemic, the education system was disturbed; students and practitioners opted for online mode of learning. Students were forced to take a course in MOOCs as part of their internal assessments. Those participations that are mandated in nature are likely to have dropout as a reaction from learners (Kim et al. 2017). On contrary, not all the personalities react similarly in a mandate situations; some may understand the importance of mandate and continue to learn in the MOOCs (Jost et al. 2004). Previous papers aimed to study the role of personality on the intention to continue. There are limited papers that highlight the role of personality in dropouts. Accordingly, this paper aims to investigate
Abstract
Introduction
Dr. Y Lakshman KumarDirector*
Mr. Madan Gowda KJResearch Associate* *ISBR Business School, Bengaluru, India
62 16th SOUTH ASIAN MANAGEMENT FORUM (SAMF) 2021
the role of hedonic attributes in the dropout in MOOCs. The paper highlights the importance of hedonic attributes. In addition, this study helps the academicians to design a course by adopting hedonic attributes to deliver more effectively and increase retention rates.
Personality factorsAs technology started playing a critical role in the education sector, there are substantial studies conducted on understanding the relationship between online learning and personality traits. Meredith (2011) aimed to find the relationship between the personality and completion of online courses using MBIT, KTS, and KTSII measures. The study shows that there is a positive relationship between the personality and completion of online courses and retention rate. Previous to the study by Meredith (2011), Kelly and Schorger (2002) attempted to study the role of a learner’s personality on a learner’s perception of online learning. Authors conclude that personality traits have a positive impact on the satisfaction assessments towards online courses. As a step further, Keller and Karau (2013) investigated the relationship between personality traits and learners’ impressions of online courses. The authors used the FFM and OCI scales to study the relationship. OCI is compromised with sub-variables such as engagement, value to career, overall evaluation, anxiety/frustration, and preference for online courses. Arispe and Blake (2012) aimed to investigate the role of personality traits and learner preferences in fusion online learning. The results show that there is a negative relationship between those two factors.
Big Five PersonalityMcGeown et al. (2014) define personality as “a set of underlying traits that determine how an individual typically behaves, thinks and feels” (p. 279). The previous paper has established a positive relationship between personality and student satisfaction, learner attrition in universities, academic motivation, and academic performance. The previous studies highlight the importance of personality in learners’ learning experience. In order to determine theindividual’s personality, various authors have created a scale but widely adopted the five-factor model (FFM) (Costa & McCrae, 1992). The five-factor model divides the personalities into five factors such as extraversion, agreeableness, conscientiousness, neuroticism, and openness. Big five personality traits had been adopted by various authors to understand their role in students’ intention to continue in the MOOCs. The participants who use MOOCs can be divided into three categories: the first category are those who use them and adapt or defend MOOCs courses, the second category are those who use the MOOCs and get dissatisfied and the last category is those who have not experienced them. Authors argue that these types of behaviors are due to the personality traits that individuals carry. Svendsen et al. (2013) studied the relationship between personality and intention to use. The study shows that extravert personality and openness to experience tend to impact the intention to use MOOCs. Further in 2018, Al-Qirim et al. (2018) found that the majority of users of MOOCs are of agreeableness, extraversion, and conscientiousness personality traits. In India, Gupta (2021) investigated the influence of five personality traits and personal innovativeness on the intention to complete MOOCs. In this current study, we shall study the influence of the personality traits and Hedonic effect on students’ dropout in MOOCs. 1. ConscientiousnessThe individual with conscientious traits will have limited goals but with high concentration to achieve them. A person with low conscientiousness is very flexible and impulsive; moreover, they get persuaded quickly to perform different tasks. A person with high conscientiousness is likely to complete the program whereas a very flexible individual tends to discontinue from program
Literature Review
6316th SOUTH ASIAN MANAGEMENT FORUM (SAMF) 2021
(Howard and Howard, 1998).H1: Conscientiousness positively influences dropout in MOOCs.
2. NeuroticismIndividuals with high neuroticism are more likely to be worried, difficult to predict, and inclined towards being sad (Howard & Howard, 1998. Additionally, they are more anxious, angry, and depressed. Whereas the person who is more emotionally stable is likely to maintain calmness, showcase stability in emotions, and be relaxed (McCrae & John, 1992) and (Howard and Howard, 1998).H2: Neuroticism positively influences dropouts in MOOCs.
3. OpennessIndividuals with high openness are likely to be more innovative, and liberal, and have wider interests. Additionally, they are more creative, adoptive to new cultures, and possess high educational aptitude.Author Boeree describes those with high openness as intellectuals with high esthetics and cultured. (Wallach & Wing, 1969) connected the openness to experience to multidimensional activities such as writing, science, and art.H3: Openness positively influences dropout in MOOCs.
4. AgreeablenessThe individuals who carry more agreeableness are unselfish, gentle, caring, kind, and compassionate. The individuals with low agreeableness are more hostile, self-center, and jealous.H4: Agreeableness positively influences dropout in MOOCs
5. ExtraversionThe learners with high extraverts are a more socialistic people. They are more active in nature and soft, reserved, and like to be alone. Extroverts are more assertive, talkative, and adventurous.H5: Extraversion positively influences dropout in MOOCs.
6. Hedonic AttributesHedonic attributes are the features of the product or services that deal with fun, and exciting entertainment. The attributes may be offered to customers as a product itself, or during the process of purchase or post-purchase. Hedonic attributes in the MOOC context are the entertainment, fun, and joy content involved in the content or process of the MOOC Learning. It includes videos, activities, and virtual management games. Since the learning in the MOOC platform may lead to fall interest by the learners, hedonic attributes may help to regain the interest in MOOCS (Dhar, R., & Wertenbroch, K. 2000)H6: Hedonic attributes positively influence dropout in MOOCs.
The paper aimed to determine the Role of Personality and Hedonic Attributes in influencing the dropout of students in MOOCs. The data was collected using a convenient sampling method and using a questionnaire. The questionnaire was circulated using Google forms Across B school students in Bangalore. We received a total respondents of 186 and validated responses were 141. To measure the internal consistency of the scales, we used Cronbach’s Alpha and Factor Analysis.
Methodology
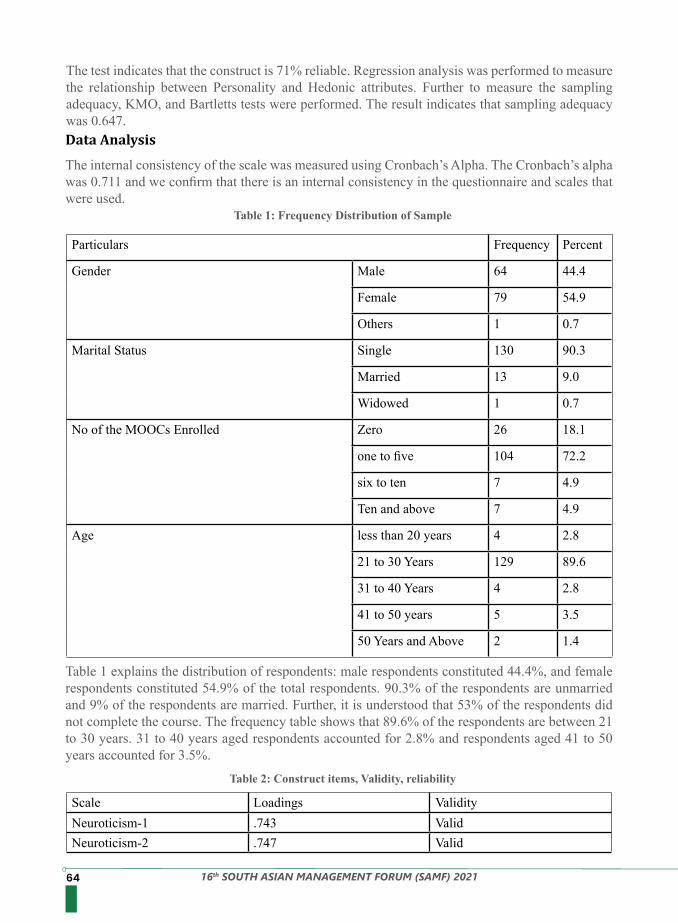
64 16th SOUTH ASIAN MANAGEMENT FORUM (SAMF) 2021
The test indicates that the construct is 71% reliable. Regression analysis was performed to measure the relationship between Personality and Hedonic attributes. Further to measure the sampling adequacy, KMO, and Bartletts tests were performed. The result indicates that sampling adequacy was 0.647.
The internal consistency of the scale was measured using Cronbach’s Alpha. The Cronbach’s alpha was 0.711 and we confirm that there is an internal consistency in the questionnaire and scales that were used.
Table 1 explains the distribution of respondents: male respondents constituted 44.4%, and female respondents constituted 54.9% of the total respondents. 90.3% of the respondents are unmarried and 9% of the respondents are married. Further, it is understood that 53% of the respondents did not complete the course. The frequency table shows that 89.6% of the respondents are between 21 to 30 years. 31 to 40 years aged respondents accounted for 2.8% and respondents aged 41 to 50 years accounted for 3.5%.
Data Analysis
Table 1: Frequency Distribution of Sample
Table 2: Construct items, Validity, reliability
Particulars Frequency Percent
Gender Male 64 44.4
Female 79 54.9
Others 1 0.7
Marital Status Single 130 90.3
Married 13 9.0
Widowed 1 0.7
No of the MOOCs Enrolled Zero 26 18.1
one to five 104 72.2
six to ten 7 4.9
Ten and above 7 4.9
Age less than 20 years 4 2.8
21 to 30 Years 129 89.6
31 to 40 Years 4 2.8
41 to 50 years 5 3.5
50 Years and Above 2 1.4
Scale Loadings ValidityNeuroticism-1 .743 ValidNeuroticism-2 .747 Valid
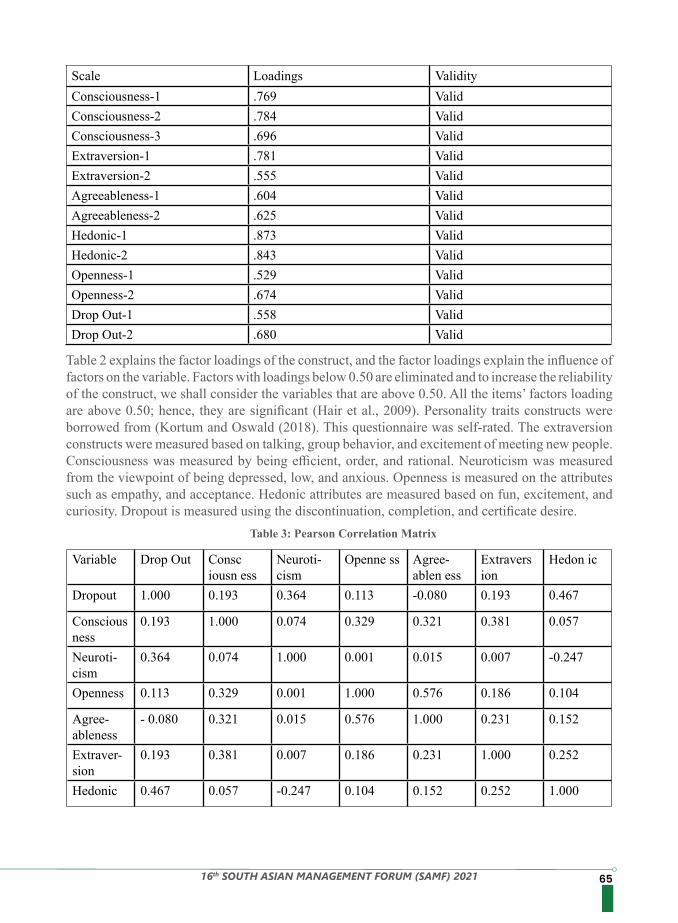
6516th SOUTH ASIAN MANAGEMENT FORUM (SAMF) 2021
Table 2 explains the factor loadings of the construct, and the factor loadings explain the influence of factors on the variable. Factors with loadings below 0.50 are eliminated and to increase the reliability of the construct, we shall consider the variables that are above 0.50. All the items’ factors loading are above 0.50; hence, they are significant (Hair et al., 2009). Personality traits constructs were borrowed from (Kortum and Oswald (2018). This questionnaire was self-rated. The extraversion constructs were measured based on talking, group behavior, and excitement of meeting new people. Consciousness was measured by being efficient, order, and rational. Neuroticism was measured from the viewpoint of being depressed, low, and anxious. Openness is measured on the attributes such as empathy, and acceptance. Hedonic attributes are measured based on fun, excitement, and curiosity. Dropout is measured using the discontinuation, completion, and certificate desire.
Table 3: Pearson Correlation Matrix
Scale Loadings ValidityConsciousness-1 .769 ValidConsciousness-2 .784 ValidConsciousness-3 .696 ValidExtraversion-1 .781 ValidExtraversion-2 .555 ValidAgreeableness-1 .604 ValidAgreeableness-2 .625 ValidHedonic-1 .873 ValidHedonic-2 .843 ValidOpenness-1 .529 ValidOpenness-2 .674 ValidDrop Out-1 .558 ValidDrop Out-2 .680 Valid
Variable Drop Out Consc iousn ess
Neuroti-cism
Openne ss Agree-ablen ess
Extravers ion
Hedon ic
Dropout 1.000 0.193 0.364 0.113 -0.080 0.193 0.467
Conscious ness
0.193 1.000 0.074 0.329 0.321 0.381 0.057
Neuroti-cism
0.364 0.074 1.000 0.001 0.015 0.007 -0.247
Openness 0.113 0.329 0.001 1.000 0.576 0.186 0.104
Agree-ableness
- 0.080 0.321 0.015 0.576 1.000 0.231 0.152
Extraver-sion
0.193 0.381 0.007 0.186 0.231 1.000 0.252
Hedonic 0.467 0.057 -0.247 0.104 0.152 0.252 1.000
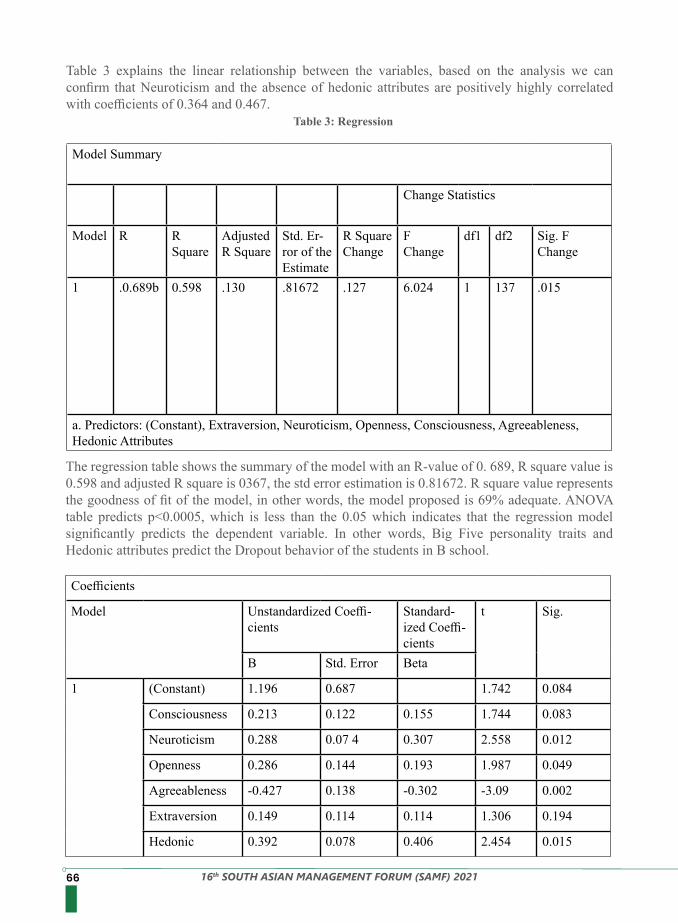
66 16th SOUTH ASIAN MANAGEMENT FORUM (SAMF) 2021
Table 3 explains the linear relationship between the variables, based on the analysis we can confirm that Neuroticism and the absence of hedonic attributes are positively highly correlated with coefficients of 0.364 and 0.467.
The regression table shows the summary of the model with an R-value of 0. 689, R square value is0.598 and adjusted R square is 0367, the std error estimation is 0.81672. R square value represents the goodness of fit of the model, in other words, the model proposed is 69% adequate. ANOVA table predicts p<0.0005, which is less than the 0.05 which indicates that the regression model significantly predicts the dependent variable. In other words, Big Five personality traits and Hedonic attributes predict the Dropout behavior of the students in B school.
Table 3: Regression
Model Summary
Change Statistics
Model R RSquare
Adjusted R Square
Std. Er-ror of the Estimate
R Square Change
F Change
df1 df2 Sig. F Change
1 .0.689b 0.598 .130 .81672 .127 6.024 1 137 .015
a. Predictors: (Constant), Extraversion, Neuroticism, Openness, Consciousness, Agreeableness, Hedonic Attributes
Coefficients
Model Unstandardized Coeffi-cients
Standard-ized Coeffi-cients
t Sig.
B Std. Error Beta
1 (Constant) 1.196 0.687 1.742 0.084
Consciousness 0.213 0.122 0.155 1.744 0.083
Neuroticism 0.288 0.07 4 0.307 2.558 0.012
Openness 0.286 0.144 0.193 1.987 0.049
Agreeableness -0.427 0.138 -0.302 -3.09 0.002
Extraversion 0.149 0.114 0.114 1.306 0.194
Hedonic 0.392 0.078 0.406 2.454 0.015
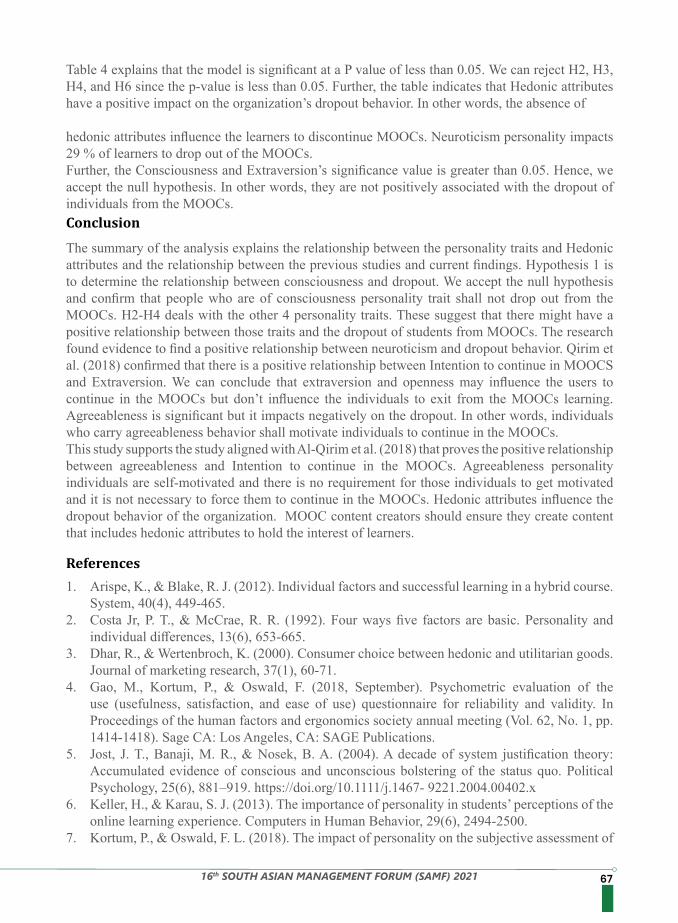
6716th SOUTH ASIAN MANAGEMENT FORUM (SAMF) 2021
Table 4 explains that the model is significant at a P value of less than 0.05. We can reject H2, H3, H4, and H6 since the p-value is less than 0.05. Further, the table indicates that Hedonic attributes have a positive impact on the organization’s dropout behavior. In other words, the absence of hedonic attributes influence the learners to discontinue MOOCs. Neuroticism personality impacts 29 % of learners to drop out of the MOOCs.Further, the Consciousness and Extraversion’s significance value is greater than 0.05. Hence, we accept the null hypothesis. In other words, they are not positively associated with the dropout of individuals from the MOOCs.
The summary of the analysis explains the relationship between the personality traits and Hedonic attributes and the relationship between the previous studies and current findings. Hypothesis 1 is to determine the relationship between consciousness and dropout. We accept the null hypothesis and confirm that people who are of consciousness personality trait shall not drop out from the MOOCs. H2-H4 deals with the other 4 personality traits. These suggest that there might have a positive relationship between those traits and the dropout of students from MOOCs. The research found evidence to find a positive relationship between neuroticism and dropout behavior. Qirim et al. (2018) confirmed that there is a positive relationship between Intention to continue in MOOCS and Extraversion. We can conclude that extraversion and openness may influence the users to continue in the MOOCs but don’t influence the individuals to exit from the MOOCs learning. Agreeableness is significant but it impacts negatively on the dropout. In other words, individuals who carry agreeableness behavior shall motivate individuals to continue in the MOOCs.This study supports the study aligned with Al-Qirim et al. (2018) that proves the positive relationship between agreeableness and Intention to continue in the MOOCs. Agreeableness personality individuals are self-motivated and there is no requirement for those individuals to get motivated and it is not necessary to force them to continue in the MOOCs. Hedonic attributes influence the dropout behavior of the organization. MOOC content creators should ensure they create content that includes hedonic attributes to hold the interest of learners.
1. Arispe, K., & Blake, R. J. (2012). Individual factors and successful learning in a hybrid course. System, 40(4), 449-465.
2. Costa Jr, P. T., & McCrae, R. R. (1992). Four ways five factors are basic. Personality and individual differences, 13(6), 653-665.
3. Dhar, R., & Wertenbroch, K. (2000). Consumer choice between hedonic and utilitarian goods. Journal of marketing research, 37(1), 60-71.
4. Gao, M., Kortum, P., & Oswald, F. (2018, September). Psychometric evaluation of the use (usefulness, satisfaction, and ease of use) questionnaire for reliability and validity. In Proceedings of the human factors and ergonomics society annual meeting (Vol. 62, No. 1, pp. 1414-1418). Sage CA: Los Angeles, CA: SAGE Publications.
5. Jost, J. T., Banaji, M. R., & Nosek, B. A. (2004). A decade of system justification theory: Accumulated evidence of conscious and unconscious bolstering of the status quo. Political Psychology, 25(6), 881–919. https://doi.org/10.1111/j.1467- 9221.2004.00402.x
6. Keller, H., & Karau, S. J. (2013). The importance of personality in students’ perceptions of the online learning experience. Computers in Human Behavior, 29(6), 2494-2500.
7. Kortum, P., & Oswald, F. L. (2018). The impact of personality on the subjective assessment of
Conclusion
References
68 16th SOUTH ASIAN MANAGEMENT FORUM (SAMF) 2021
usability. International Journal of Human-Computer Interaction, 34(2), 177-186.8. McCrae, R. R., & John, O. P. (1992). An introduction to the five-factor model and its applications.
Journal of Personality, 60(2), 175-215. https://doi.org/10.1111/j.1467- 6494.1992.tb00970.x9. Meredith, B. P. (2011). Personality types as an indicator of online student success and retention
(Order No. 3449391). Available from Publicly Available Content Database. (862744346).10. Svendsen, G. B., Johnsen, J. A. K., Almås-Sørensen, L., & Vittersø, J. (2013). Personality
and technology acceptance: the influence of personality factors on the core constructs of the Technology Acceptance Model. Behaviour & Information Technology, 32(4), 323-334.
11. Tarhini, A., Alalwan, A. A., Al-Qirim, N., & Algharabat, R. (2018). An analysis of the factors influencing the adoption of online shopping. International Journal of Technology Diffusion (IJTD), 9(3), 68-87.
12. Wallach, M. A., & Wing Jr, C. W. (1969). The Talented Student; A Validation of the Creativity-Intelligence Distinction.
6916th SOUTH ASIAN MANAGEMENT FORUM (SAMF) 2021
IMPACT OF PEDAGOGICAL CHANGES IN MANAGEMENT EDUCATION IN THE POST-COVID-19 PERIOD – A
COMPARISON STUDY
The disruption caused by COVID-19 largely impacted learning and development. Pedagogical methodologies shifted from being classroom-based to being completely virtual in a matter of weeks. For management education especially, which thrives on the backbone of social and experiential learning, this shift brought in a major setback. In this conceptual research, we seek to explore the impact of the shift in pedagogy for management education from a conventional setting to a virtual mode of learning. We aim to integrate perceptions of current and recent management students on different aspects of learning such as knowledge acquisition, interpretation, retention, and application in a virtual setting as compared to a completely classroom-based setting to identify the windows of opportunity in this area.
In the year 2020, WHO declared the COVID-19 pandemic outbreak as a Public Health Emergency of International Concern (PHEIC) (COVID-19 Situation Reports - PAHO/WHO, n.d.).The pandemic continued to wreak havoc on all industries and segments alike throughout the world all through 2020 as well as 2021. Along with the millions of people worldwide, one of the sectors that were majorly affected was education. When the crisis was at its peak, data from UNESCO reported that over 1.6 billion students in over 190 countries had to stay out of their educational institutions(Pokhrel&Chhetri, 2021). Similarly, close to 100 million teachers and educational personnel had their jobs impacted as institutions suddenly closed down(UNESCO, 2021). Amidst the crisis, the biggest shift that happened in the education sector was the shift to a virtual first mode(Jena, 2020). Students across different age groups resorted to remote learning as pedagogical methods changed from being classroom-based to being online through communication platforms like Zoom, Microsoft Teams, and so on.Among these were students pursuing management education in business schools (b-schools) across India and the world. Being one of the highest levels of education as well as one that acts as a bridge to build immediate future leaders and managers, the mode and method of information delivery are significantly different in b-schools. Whereas schools have a higher percentage of rote-learning integrated within their methodology, b-schools rely more on inculcating practical aspects of management in their students. When COVID-19 caused several countries to completely shut down face-to-face methods of learning, b-schools and management students were among the worst affected(Rawal, 2021). It was during this time that e-learning took prevalence and was able to mitigate much of the challenges being faced by students because of the pandemic. It even gained traction among some groups of students in terms of providing flexibility to schedules, higher access to global learning resources, and new and interesting ways of learning delivery. On the flip side, whether or not it matched up to traditional pedagogical methods which revolved around hands-on practice, something that is a major pillar of management education, is something that still remains ambiguous.
Abstract
Introduction
Kedarnath Thakur, Doctoral Scholar (HRM), XLRI JamshedpurYasmin Kukul, MBA (HR), XIM University, Bhubaneswar
Keywords: COVID-19, Management Education, Virtual Learning, Pedagogy, Learning and Development
70 16th SOUTH ASIAN MANAGEMENT FORUM (SAMF) 2021
This conceptual research aims to:• Explore the impact of the shift in the pedagogy for management education from a conventional
setting to a virtual mode of learning• Understand whether the learning intake of B-school students characterized by acquisition,
interpretation, and retention affected the application of knowledge as a result of the shift• Derive differences in learning outcomes in a virtual or hybrid setting as compared to a completely
classroom-based setting
Owing to the ever-changing business landscape, management education is one of the most dynamic studies (Gupta et al., 2021). Due to this, the pedagogical methods followed by b-schools have always been globally inspired to say the least. The curriculum is driven by a mix of the theory developed by researchers worldwide, and practical aspects taken from various real-life case studies of organizational successes and failures to derive valuable lessons. Management education has therefore mostly been a mix of classroom-based discourse along with online resources to aid the discourse. Broadly, the pedagogical methods in management education can be defined as Face-to-Face Mode of Delivery, Online Mode of Delivery, and Hybrid/Blended Mode of Delivery.
Face-to-Face (F2F) Mode of Delivery (Goyal et al., 2020)The F2F model of learning delivery is the most common method of education in b-schools and is characterized by real-time interaction between the facilitators and students. Along with being familiar with theoretical knowledge, students are exposed to various case study analyses in the form of projects or assignments that involve verbal presentations, role-plays, or other creative forms of delivery. The exchange of information on part of the facilitators as well as the derivation of concepts on part of the students by means of real live presentations aids in creating better learning outcomes for the students. This setup helps in better student engagement and reach as well as helps in a simulation of management scenarios within a classroom which enables better understanding.
Online Mode of DeliveryThe online mode of delivery started as an asynchronous learning method which included pre-recorded videos and other resources for the students to go over at their own pace. Programs other than regular management courses such as distance education or correspondence programs are the ones that made use of this methodology (Goyal et al., 2020). With time, this came to include the synchronous mode of learning where facilitators could hold online classes with real-time students on the opposite end (Dhawan, 2020). With the disruption caused due to COVID-19, the online mode of learning delivery took prevalence in the face of the closure of institutions. This method provides the much-needed flexibility required for both facilitators and students in terms of class timings(Xie et al., 2020). Session recordings also provide extra help to students to go over details later on that they might have missed during class hours. However, the online mode of delivery has also been characterized by lesser student engagement and comprehension of concepts riddled by technological disruptions such as internet connectivity issues in remote places which are not lucky enough to have seamless connectivity(Shahzad et al., 2020).
Hybrid/Blended Mode of DeliveryA blended mode of learning delivery comprises a mix of online as well as classroom-based learning.
Aims and Objectives
Literature Review
7116th SOUTH ASIAN MANAGEMENT FORUM (SAMF) 2021
The responses observed for the different question areas were constituted into pie charts to understand the division of opinions. A brief observation for each area is described in the appendix.In our factor analysis, we observed the following results:
KMO observed was above the minimum bracket value (>0.5) indicating the adequacy of the sample
A common measure of the effectiveness of pedagogical methodologies is the learning intake which can further be subdivided into acquisition, retention, and interpretation of knowledge as a loose translation of cognitive learning as per Bloom’s taxonomy (Colorado College, n.d.). This conceptual research aims to build on that and understand students’ perceptions regarding whether the pedagogical changes due to COVID-19 impacted student learning intake which in turn impacted how students applied the acquired knowledge.A survey instrument was used to collect views and opinions of respondents across different b-schools. The sample population comprised current management students as well as recent graduates who had faced the transition from a completely classroom-based setting to the virtual mode as a result of COVID-19. The respondents were asked to fill out the questionnaire anonymously to avoid exposing person-specific information. The questions in the survey instrument aimed to probe respondents regarding their experience as well as their perception of personal learning outcomes as a result of the shift in pedagogy that happened during the pandemic. Learning intake was further sub-divided into different aspects such as acquisition, interpretation, and retention and we aimed to understand whether this affected the application of knowledge in survey respondents. (Templeton et al., 2002). We also assumed that learning intake was closely related to student engagement in class and aimed to understand its effect as well. Questions in the survey instrument revolved around these areas and responses were captured using a 5-point Likert scale spanning the options Strongly Disagree, Disagree, Neutral, Agree, and Strongly Agree.Using SPSS, we performed factor analysis on the responses gathered to understand how our variables spanning acquisition, retention, interpretation, application of knowledge, and student engagement could be grouped together.We fit our question items under Engagement (EN1 - EN3), Acquisition of Knowledge(AoK1 - AoK4), and Application of Knowledge (APP1 - APP2). We combined items related to acquisition, retention, and interpretation under the singular term Acquisition of Knowledge. We then assessed the dimensionality using the varimax rotated factor solution. A detailed discussion of the interpretations, as well as scope for future research, has been presented in this paper.
Findings
Research Methodology
It is mostly implemented by executive management programs for working professionals or in some distance education programs where a certain percentage of facilitator interactions are F2F while the rest of it is online(Goyal et al., 2020). This method of learning aims to provide the flexibility of schedule and convenience associated with self-paced learning along with a healthy mix of face-to-face experience(Paudel, 2020).Management students are exposed to a simulation of the same in the form of individual and group projects which play an important role in their experiential learning. Due to COVID-19, as learning methods went virtual, they created different levels of student engagement which further affect their learning intake levels. This also created differences in how a student applies the acquired knowledge in situations that demand it.
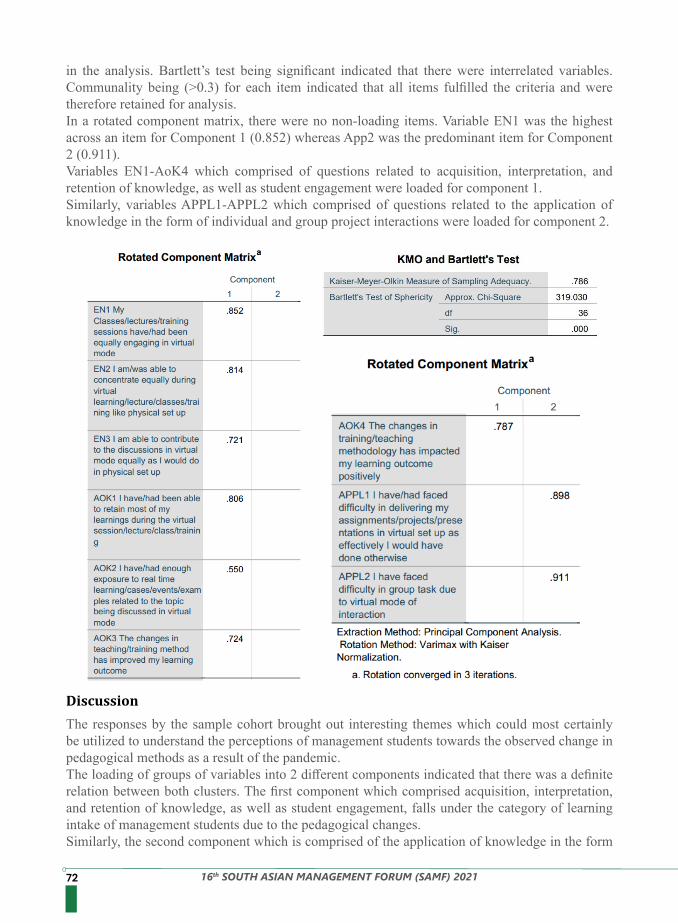
72 16th SOUTH ASIAN MANAGEMENT FORUM (SAMF) 2021
in the analysis. Bartlett’s test being significant indicated that there were interrelated variables. Communality being (>0.3) for each item indicated that all items fulfilled the criteria and were therefore retained for analysis.In a rotated component matrix, there were no non-loading items. Variable EN1 was the highest across an item for Component 1 (0.852) whereas App2 was the predominant item for Component 2 (0.911). Variables EN1-AoK4 which comprised of questions related to acquisition, interpretation, and retention of knowledge, as well as student engagement were loaded for component 1.Similarly, variables APPL1-APPL2 which comprised of questions related to the application of knowledge in the form of individual and group project interactions were loaded for component 2.
The responses by the sample cohort brought out interesting themes which could most certainly be utilized to understand the perceptions of management students towards the observed change in pedagogical methods as a result of the pandemic. The loading of groups of variables into 2 different components indicated that there was a definite relation between both clusters. The first component which comprised acquisition, interpretation, and retention of knowledge, as well as student engagement, falls under the category of learning intake of management students due to the pedagogical changes. Similarly, the second component which is comprised of the application of knowledge in the form
Discussion
7316th SOUTH ASIAN MANAGEMENT FORUM (SAMF) 2021
of individual and group project interactions falls under the category of how student learning was impacted due to the pedagogical changes. Thus, combining both interpretations, it can be presumed that there has been a definite relation between pedagogical changes due to the pandemic, and learning outcomes for management students. A detailed interpretation of students’ perceptions regarding each of the factors is described below:
Acquisition of Knowledge in Virtual ModeKnowledge acquisition is the process of locating, collecting, and refining knowledge for the development of knowledge-based systems (Harmon & King, 1985). It is characterized by the transfer of information from one system to another (Grosso, 1998). As discussed earlier, management education is expected to create experiences for students that would prepare them for real-life scenarios. In such an education system, it becomes imperative to expose students to cases and their solutions as well as encourage them to step into the shoes of a manager to explore other solutions. Respondents to the survey however felt that the levels of exposure to real life cases and experiences were highly curbed due to the virtual mode of interaction. This is also reflected in the interpretation aspect where students could not fully comprehend the real-life implications of the concepts being taught and failed to initiate classroom discussions as effectively as in a physical setup.
Retention of Knowledge in Virtual ModeThe jury was split in half when it came to whether or not students were able to retain what they were taught in a virtual session. Considering that the perceptions of knowledge acquisition tended toward the negative, this presents an ambiguous scenario that needs to be probed further. As such, it is common knowledge that retention can be attributed to other factors such as self-study and personal intelligence as well. Therefore, whether or not a direct link could be established between these factors and the pedagogy of teaching remains to be seen.
Interpretation of Knowledge in Virtual ModeEven though a major portion of respondents felt that they were able to comprehend the topic being discussed, most of them did not feel that they were able to contribute to virtual classroom discussions as well as they could in a physical classroom setup. With lower engagement, it becomes difficult for students to interpret and contribute to classroom discussions. As interpretation also branches out to how easily learners can raise their concerns, less than a majority of respondents felt empowered and comfortable to discuss challenges regarding the topic being discussed in virtual mode, while the majority of them held a negative or a neutral opinion. Among the positive responses, it could be possible that learners could be overestimating their effort in virtual mode. There is a higher possibility however that learners felt that their efforts towards the class discussion were higher as compared to the level of engagement/understanding created by the facilitator.
Application of Knowledge in Virtual ModeThe aim of b-school education is the psychological development of a learner to enable them to think like people leaders and team players and apply their learnings to actual scenarios. Responses, however, seemed to create a distinction between individual task completion ability compared with group task completion ability. While respondents faced no trouble applying their knowledge in the case of individual assignments, a majority of them faced challenges with group assignments. This observation is indicative of the fact the learners who were exposed to virtual learning may not be
74 16th SOUTH ASIAN MANAGEMENT FORUM (SAMF) 2021
able to apply their learnings in an organizational group setup.
Challenges Observed in Virtual LearningInstilling a collaborative approach on the learners’ side including their willingness to work with other learners is what separates management education from other degrees as it provides them a deeper understanding of how they could perform a real task (Garcia et al., 2021). This seemed to be an area significantly affected. Another mismatch observed was that while the respondents rated their efforts in virtual sessions positively, they provided dissatisfactory ratings to the actual process of imparting classes in the virtual mode. Thereby, even as retention, comprehension, and initiating relevant discussions in class were all rated positively, areas such as student engagement and ability to maintain attention spans on part of facilitators seem to be problematic areas. Along similar lines, it was observed that even as survey respondents felt that there were several infrastructural changes that they had observed to ease the transition to a virtual mode of learning as a result of the pandemic, a majority of them felt that their learning outcomes had not improved per se.
As a response to COVID-19 and the transition to a virtual mode of learning, several infrastructural interventions were undertaken to aid management students’ learning. However, the results and analysis of the survey responses ultimately raise questions on whether there need to be facilitator training interventions along with the infrastructural developments to inculcate the skill of imparting education to the students in virtual mode. Considering that management education relies largely on experiential learning, new and improved methods of student engagement need to be devised. Additionally, facilitators need to draw up teaching plans which feature a mixture of conceptual discourse, real-life examples by means of videos or sharing of experiences by industry experts as well as projects that require original thinking on the part of students. In terms of limitations, the current research does not cover facilitators’ points of view in terms of challenges faced. Future research could probe into the challenges faced by the facilitators in the virtual mode of teaching and the responses therein can be combined with those presented in this paper to come up with innovative interventions to benefit the entire management academia fraternity. The future scope of research also includes regression analysis of the components to understand the extent to which each component affects the other.
1. Colorado College. (n.d.). Bloom’s Revised Taxonomy. Retrieved December 6, 2021, from https://www.coloradocollege.edu/other/assessment/how-to-assess-learning/learning-outcomes/blooms-revised-taxonomy.html
2. COVID-19 Situation Reports - PAHO/WHO. (n.d.). Pan American Health Organization. Retrieved December 6, 2021, from https://www.paho.org/en/covid-19-situation-reports
3. Dhawan, S. (2020). Online Learning: A Panacea in the Time of COVID-19 Crisis. Journal of Educational Technology Systems, 49(1), 5–22. https://doi.org/10.1177/0047239520934018
4. Garcia, M., Arrieta, L., Hernandez, S., Cantero, G., & Gonzalez, A. (2021, July). Acquisition of Knowledge Through Creativity and Leadership in a Multidisciplinary Environment. AgEng2021 Evora. https://oa.upm.es/69033/1/3165-ageng2021_full_paper_Acquisition-of-knowledge.pdf
5. Goyal, J. K., Daipuria, P., & Jain, S. (2020). An Alternative Structure of Delivering Management
Limitations and Scope for Future Research
References
7516th SOUTH ASIAN MANAGEMENT FORUM (SAMF) 2021
Education in India. Journal of Educational Technology Systems, 49(3), 325–340. https://doi.org/10.1177/0047239520958612
6. Grosso, C. (1998). Knowledge and Knowledge Acquisition for the Development of Expert Systems for Nursing. Nursing and Computers, 158–167. https://doi.org/10.1007/978-1-4612-2182-1_21
7. Gupta, J., Mitra, B., &Garg, K. (2021). Technological disruptions reshaping management education: A qualitative study of stakeholder perspectives. International Journal of Management in Education, 15(2), 179. https://doi.org/10.1504/ijmie.2021.113526
8. Harmon, P., & King, D. (1985). Expert Systems: Artificial Intelligence in Business [E-book]. Wiley.
9. Jena, P. K. (2020). Indian Education in Pandemic COVID-19. SSRN Electronic Journal, 9–18. https://doi.org/10.2139/ssrn.3762907
10. Paudel, P. (2020). Online Education: Benefits, Challenges, and Strategies During and After COVID-19 in Higher Education. International Journal on Studies in Education, 3(2), 70–85. https://doi.org/10.46328/ijonse.32
11. Pokhrel, S., &Chhetri, R. (2021). A Literature Review on Impact of COVID-19 Pandemic on Teaching and Learning. Higher Education for the Future, 8(1), 133–141. https://doi.org/10.1177/2347631120983481
12. Rawal, M. (2021, January). An analysis of COVID-19 Impacts On Indian Education System (ISSN 2581–9100). Educational Resurgence Journal Volume 2,Issue 5. https://coed.dypvp.edu.in/educational-resurgence-journal/documents/jan-2021/35-40.pdf
13. Shahzad, A., Hassan, R., Aremu, A. Y., Hussain, A., &Lodhi, R. N. (2020). Effects of COVID-19 in E-learning on higher education institution students: the group comparison between male and female. Quality & Quantity, 55(3), 805–826. https://doi.org/10.1007/s11135-020-01028-z
14. Templeton, G. F., Lewis, B. R., & Snyder, C. A. (2002). Development of a Measure for the Organizational Learning Construct. Journal of Management Information Systems, 19(2), 175–218. https://doi.org/10.1080/07421222.2002.11045727
15. UNESCO. (2021, May 4). One year into COVID-19 education disruption: Where do we stand? Retrieved December 6, 2021, from https://en.unesco.org/news/one-year-covid-19-education-disruption-where-do-we-stand
16. Xie, X., Siau, K., & Nah, F. F. H. (2020). COVID-19 pandemic – online education in the new normal and the next normal. Journal of Information Technology Case and Application Research, 22(3), 175–187. https://doi.org/10.1080/15228053.2020.1824884
76 16th SOUTH ASIAN MANAGEMENT FORUM (SAMF) 2021
EMERGING TRENDS IN SUSTAINABILITY OF DIGITAL LEARNING AMONG WORKING EXECUTIVES IN CORPORATES
With COVID-19 disrupting the ‘Education and L&D Sector’, all of a sudden, the world has changed forever in life, lifestyle, perspectives, processes, practices, preferences, and perceptions. Humans are compelled to live in a socially disconnected manner while remaining connected through the advances of a highly networked and connected world. The pandemic impacted different people in different ways, especially forcing employees to Work from Home (WFH) impacting a large majority of the working population to change the way they have worked all along. Higher Educational Institutions (HEIs)/Universities and Business Enterprises across the globe quickly embraced Learn from Home (LFH) systems for Management students for almost the last two years from now. The World Economic Forum (WEF) has launched a ‘Re-skilling Revolution’ with its focus on ‘better skills, better jobs, better education for billion people by 2030’ campaign. This scheme aims to provide a new-skills for the Industry 4.0 era and ensure future-proof workers globally. The COVID-19 pandemic has not only impacted the economies but has also expedited the continuous adoption and embracing of the transformation as a necessity, as a means of survival. During this period, the search for digital education and learning, as also the adoption to cope with the challenges has gone up significantly. The complete reliance on online and virtual learning systems in L&D has ensured an uninterrupted learning process for working executives.The Digital Learning trends using an array of recent L&D Reports– by Deloitte,2019; Skillsoft’s,2019; LinkedIn Workplace Learning Report,2019; UK L&DReport,2019; FICCI-NASSCOM and EY “Future of Jobs” report,2017– which have been indicating that the Digital learning is fast-emerging as one of the realistic options. The FICCI-NASSCOM and EY “Future of Jobs” Report, December 2017found that India possesses a 600 million estimated workforce, and nearly 9 percent of it will be deployed and engaged by 2020 in ‘jobs that don’t exist today and the category of Neoskilling has the skill-sets required for these new-age jobs. Working employees invest their time and energy in skilling/up-skilling/re-skilling to remain relevant to the emerging business context throughout their working life. Given the afore-mentioned context, this research paper has attempted to review and analyze the opportunities, challenges, and emerging trends w.r.t. leveraging Technology & Innovation to enhance Digital Learning/L&D among the 10-different corporates across different industry sectors with case analysis.
Abstract
Dr Subhendu Dey, Professor & Director*
Dr Nandeesh V. Hiremath, Professor*
*Indus Business Academy
Keywords: Digital Learning, Learning, and Development (L&D), Working Executives, Emerging trends in Digital Learning, Impact of COVID on Learning
7716th SOUTH ASIAN MANAGEMENT FORUM (SAMF) 2021
Current Context for Digital Learning and Micro-Learning
The emerging trends of the new world of work and Future of Work (FoW) in Industry 4.0 (4th Industrial revolution) are rapidly becoming a living reality for millions of working professionals and thousands of corporations globally. There are many megatrends impacting our business and the way we work – mobile revolution, edge computing, augmented reality, big data, cyber-security, energy challenges, cloud orchestration, AI, smart machines, connected products, etc. This means that jobs are changing fast. It is no longer an option to not be continuously learning. It is vital and urgent for our business. One of the studies says that 25% of the skills required for key jobs in the future are not yet part of the core skills that we have today. This is a great reason for us to be continually learning and growing in our daily work and daily life. Lifelong Learning, Unlearning, and Relearning (LUR) are imperative both for individuals and organizations.
Many business leaders, managers, and employees agree and are getting worried about how technologies like robotics, machine language (ML), and Artificial intelligence (AI) are changing jobs and how one needs to evolve with time. This concern is valid since some jobs are disappearing owing to technological changes and some other job roles are getting evolved or transformed. According to the latest World Economic Forum (WEF) study, nearly 54% of working employees are required to re-skill and up-skill within 3 years, to stay relevant & competitive in the evolving job market. Simply stated, reskilling has become critically important for organizations & employees, and cannot afford to keep positions un-filled for several months&/or years due to a deficit-supply of talent pool to fill the variety of positions/roles. It’s becoming prominently obvious that MNCs (Multinational Corporations) & large corporates can never rely heavily on discovering & recruiting talent from today’s competitive & tight talent market, while ‘they should build/nurture the talent internally’ for filling in those roles for ensuring business growth & sustainability. Therefore, abysmally low un-employment percentages and rigid imbalance in labor/workforce supply& demand dynamics in the job market for skilled workforce in different countries have made it challenging&daunting task for HR Managers/ Business leaders to hire the “trained-&-ready to deploy-talent” at short notice, hence building in-house talent pools has become a dire necessity. Hence, building “internally equipped talent within” through Digital learning & newer L&D interventions becomes more a necessity, than a luxury, as it gives a competitive advantage, plus added organizational culture-sync, by reducing the time to produce business results.
Deloitte’s 2019 Global Human Capital Trends reports that learning is the top-notch-rated challenge among all corporates. The employees rated the “opportunity to learn” as one of the several priority reasons for undertaking a job role/ professional assignment and most of the CXOs, CEOs, Business leaders &CHROs/HR Leaders are well aware that transformation in best business practices, technology-tools-for-business-productivity, business sustainability, work ethos, and evolving business models have certainly generated a significantly enhanced demand for ongoing-&-continuous learning & lifelong skilling/ upskilling / re-skilling and competency enrichment for staying relevant, both individually at employee level & organizations at macro-level. Many of the market-leader MNCs/corporates& large organizations have designed customized programs to offer/deliver the bit-sized / byte-sized &personalized learning experience to millions of their employees, by integrating work and encouraging collaborative learning from peers/reporting leaders, encompassing ownership for learning within/across the regions/geographies/countries, and considering innovative ways to offer the creative solutions to their daily work-life into the
Introduction
78 16th SOUTH ASIAN MANAGEMENT FORUM (SAMF) 2021
enabling & learning culture at work than just a training culture of the gone-by-era.
In the era of industry 4.0 and the ‘future of work’, there are constantly evolving transformations & significant changes have taken place in the way employees work today, hence significantly modifying/revolutionizing the relationship between learning and work-workforce-workplace & job role/ professional assignment, making them much deeply interwoven-&-integrated and deeply-interconnected than never before. This has thrown up a set of challenges to Business Leaders and the development opportunity for HR-Leaders to build robust work-centric and engaging learning programs & evolving-growth-culture, thereby facilitating up-gradation of skills in the natural journey of their daily /routine job roles on an ongoing and continuous basis. If any business/HR Leader has to accomplish this, it is believed that a new model of Digital and Self Learning is to get emerged as an inspiration from the evolution in information technology (IT) which has brought-in sweeping changes in the last 1-2 decades. Simply stated, the new ways of learning both Digital and Micro learning have emerged & are becoming the hard reality to build the future workforce both in terms of attitude/mindset, skills, and competencies: thus creating a cult for ‘Future of work’ and ‘inbred talent-pool to meet changing/ evolving business needs.
Key Principles for Effective Digital Learning and Micro-Learning
With the advent of technology and fast-paced life, the Learning & Development (L&D) in organizations /corporates has undergone a significant transformation. Today, in the context of Industry 4.0 and the VUCA world, digital learning and micro-learning are becoming reality. According to the India Leadership Academy, Publicis Sapient (2019), the following are emerging principles (adopted from www.strategist.com) in respect of digital learning and micro-learning: a) SPUR the learner: the digital content needs to be Simple, Provocative, Unique, and Relevant
(SPUR). b) Make it anecdotal and conversational to enhance the ability to relate and apply in work-lifec) Use story-telling techniques to significantly increase interest levels and learning ability.d) Use reflective thinking and self-directed learning at all stages viz., 3D (Design, Development &
Delivery) of digital learning contents.e) Create the list of articles & acronyms, so that R&R (recall and retention) is higher in the learning
process.f) Avoid pointless jargon.g) Last but not least, compress but not compromise on the 3Cs (Context, Contents & Conclusion)
of each & every topic.These all are more important because: (a) The average human attention during adult learning is 7-8 minutes, which is surprising yet true, (b) The barrier in learning is TIME, as per the recent LinkedIn Workplace Report, (c ) Almost 90-92% of the MOOCs (Massive Open Online Courses) content remain incomplete and the average pass percentage is 6-8% of the enrolled digital learners, as per the recent Coursera.org study,(d) Learners want ‘on-the-go solutions’ in respect of learning also and (e ) It is because the human brain is designed to process & internalize information in bite-sized chunks OR “bite-size is the right-size” in digital learning in the corporate context, owing to multiple work pressure.
7916th SOUTH ASIAN MANAGEMENT FORUM (SAMF) 2021
2.1 Market Outlook on Digital Learning Systems – Challenges and OpportunitiesKirkpatrick (1954, 1979) and Philips (1991) view evaluation of L&D as essential in terms of the process whereas Cascio (1982) and Giangrecoet. al. (2010) stressed that evaluation should be on organizational focus. Chellaet .al. (2018) have brought-in multiple perspectives based on the extensive research & in-depth discussion with many HR Thought Leaders in Indian corporates like Aditya Birla, Airtel, Asian Paints, Sundaram Finance, MurugappaGropu, etc.
Besides, LinkedIn Workplace Learning Report (2019) revealed some interesting facts like (a) the L&D budget has only 27% constraints; (b) 59% of L&D investments are for online learning; (c) 82% of Top-executives are actively supporting professional learning; (d) L&D managers are thinking-like Marketers to promote learning programs through e-mail marketing, effective by ~65% and (e ) 74% of Gen Z-workers would take a manger-suggested course. Similar findings are also revealed by UK L&D Report, 2019 (findcourses.co.uk).
Nguyen et. al (2020) advocated that among all the forms of digital inclusion, technology-assisted learning is the best platform that can be used as a platform for L&D implementation. L&D contributes to peoples’ motivation, job satisfaction & engagement and also promotes value-based culture, and enhances individual competencies. (Dam and Nick, 2017). Janssen and Van (2004) viewed that innovative ideas and their implementation augment organizational performance and hence L&D and digital learning will change the employment landscape globally. According to the organizational approach, L&D is an aid to collective development that supports organizational goals and helps in improving individual knowledge and skills as well (Harrison, 2009).
Reyna (2011), and Ficheman and Lopes (2018) have built the relationship between the teaching and learning of digital ecosystems (DTLE) which consists of hardware, software, operating systems, and also networking technologies. These, in turn, are interconnected together seamlessly, by using digital technologies, so that the digital learning ecosystem is built effectively to accomplish the intended learning outcomes at workplaces. This is further supported by the findings of Wannapiroon (2016), where it is found that a variety of media are employed in achieving the learning objectives by both the learners and under the support of instructors, especially in the digital learning ecosystem and this has become essential in the digital learning world.
2.2 MOOCs Movement for Massification of Education and Learning & Development (L&D)The findings by Hiremath (2020) on MOOCs-integrated and blended-learning pedagogy have comprehensively studied the relevance to the current context, where the MOOCs (Massive Open Online Courses) term coined by Dave Cormier in 2008, which has emerged from Open Educational Resources (OER) movement. The MOOCs-based Education sector with about 65% session-based and 35% self-paced has played/playing a significantly transformational role globally. The investments in MOOCs-based Education included Courses (US$22million; 37% market share), Edx ($60m, 28%), Udacity ($21.1m), Udemy ($16m), and Khan Academy (as per findings of Yuan and Powell, 2013) and the MOOCs-learners have been projected to grow from 35million (2015) to 120 million (2020). This has surpassed the projections owing to the COVID-19, where the free learning was offered by MOOCs players like EdX, Coursera, MIT open source ware, etc., during March-October 2020. COVID-19 has created the digital transformation and massification of education, especially in countries like India. This transformation is not just limited to the Education sector and has expanded
Literature Review
80 16th SOUTH ASIAN MANAGEMENT FORUM (SAMF) 2021
to the Digital L&D in the Corporate sector as well, as found by Hiremath et al. (2020).
2.3 Digital Learning Ecosystem: Context and Utility to enhance Organizational OutcomesSarnoket al (2019) have found that the “Digital Learning Ecosystem”, primarily comprises two key components viz., (a) the Digital Learning Environment, which includes Software, Hardware, and Network; and (b) the Digital Storytelling Learning & Teaching Community, which comprises of three components: Teaching (by Instructors/ Coaches/ Mentors/ Managers/ Leaders, etc), Learning, and Supporting (from Superiors, peers, friends, family, etc).
Benigno et al (2020) in their study found that the nurturing of “digital learning and effective teaching” by using the online learning resources primarily relies upon the faculty/instructors and students/learners, which will enable the accessibility and adaptability in a more of a learner-centered ecosystem. This can be better enabled by having an excellent base of IT/Digital learning infrastructure, which can act as an enabler of the digital learning system – along with providing access to the online learning resources, facilitating the online training to use such digital resources, building-up the enabling the learning environment – which can certainly enhance the learning experience and effectiveness in digital learning.
Phumeechanyaet. al. (2015) have proposed the framework of “Ubiquitous Learning Environment (ULE)”, wherein the learning environment induces a culture of learning with 3As (i.e, Anywhere, Anytime, Anyhow) by using the portable computers to access to a variety of learning resources; and in most cases, this ULE is self-driven, rather than imposed by the employers and/or L&D Managers. Pischetola and Holmfeld (2020) have indicated that the learning environment alone will not produce the change in the classroom and/or a learning system, but it is enabled better by the learning platform, regular interaction among the learners (either in person, or through digital forums, or experience sharing, etc). They have found that enactivist model in education &learning provides multiple perspectives, in taking suitable decisions at work and addressing the problems.
Aboobaker and Zakkariya (2019) have proposed in their recent research on digital learning and transformation systems that both the academicians and HR/L&D practitioners in the industry should overcome the skepticism/mistrust regarding embracing the digital systems by the learners and employees, respectively, so that the organizational growth and development can be achieved, as per the planned outcomes. Prasad and Ramachandran (2019), in their recently published book entitled “Neoskilling for Digital Transformation and the Artificial Intelligence Revolution”, have illustrated with many research studies and empirical evidence that “digital learning is a way for future for learners & for corporates”. This study has demonstrated multiple facets of 4-stages of learning at workplaces viz., Skilling, Upskilling, Reskilling &Neoskilling. They do make a mention cobots or collaborative robots (the term used for humans working & learning in collaboration with robots) in safe & ergonomic environment. In other words, a customer’s / learner’s query might be answered by using a chatbot (a practical application of machine learning in practice already), while the customer/ learner assumes that it is being answered by a human & in reality, it is not!
8116th SOUTH ASIAN MANAGEMENT FORUM (SAMF) 2021
This academic research, with primary data having an analytical approach, has investigated the multiple dimensions with Working Executives related to:1) assess the learning behavior of working executives on L&D in the changing context of Industry
4.0 & HR 4.0 and evaluate the various factors related to poor engagement & utilization/completion rates of L&D facilities by working executives.
2) analyze the issues, challenges, and opportunities related to Digital Learning systems, to enhance the learning effectiveness in L&D with Digital Learning which is encouraged by the Employers (both in-house Corporate Academies &/or Open Systems) and currently at about 10-20% consumption rate.
The research methodology included a collection of the primary data from the working executives in corporates.
Universe and Sampling Frame of the Study
The Corporates/MNCs operating in India & globally are considered for this research. The Founders/ CEOs/ HR Leaders/ CHROs etc., of these corporates, form the universe of the study and have been used as the sampling frame for undertaking practical research to meet the objectives of this analytical study.
Tools and Techniques of Data Collection
This study has been industry-oriented academic research by collating and compiling information from both primary and secondary sources. The study is based on primary data collected from Corporates and also from the secondary data through published information. To collect the data from HR Leaders and CHROs, the Personal Interview (PI) methodology has been utilized to collect data for working towards the stated objectives of this study.The research methodology used has been a descriptive and analytical study, where in the specific industry L&D/ digital learning case analysis of the selected corporates are briefly described by collating both primary and secondary information. For collecting the data, the authors have used the convenience sampling as a method for gathering the data & collating insights on best Digital learning /L&D practices. To have a 360-degree view of the problem of L&D and digital learning, the researchers have either met industry experts/ HR leaders/ CHROs or collected their views from published resources.Secondary Research on L&D: the relevant exploratory research was carried out by collecting information from Research Journals, Industry Reports, Online Databases, Books on L&D, and Digital Learning Systems on L&D/Digital Learning, which have been used as the bases to work on this research, including Interviews of few HR Leaders & CHROs.4.3 Conceptual Model From secondary research, it was evident that the major factors that play a significant role in the L&D ecosystem is that learning engagement & application of digital learning at work, especially in large corporates, is comparatively less. Currently, the set of L&D challenges are: a) HR Leaders are facing multiple challenges in bringing engagement of learning /digital L&D in
large corporations, b L&D systems in large corporates are having the vast potential to have effective usage of Digital
Objectives Of The Study
Research Methodology
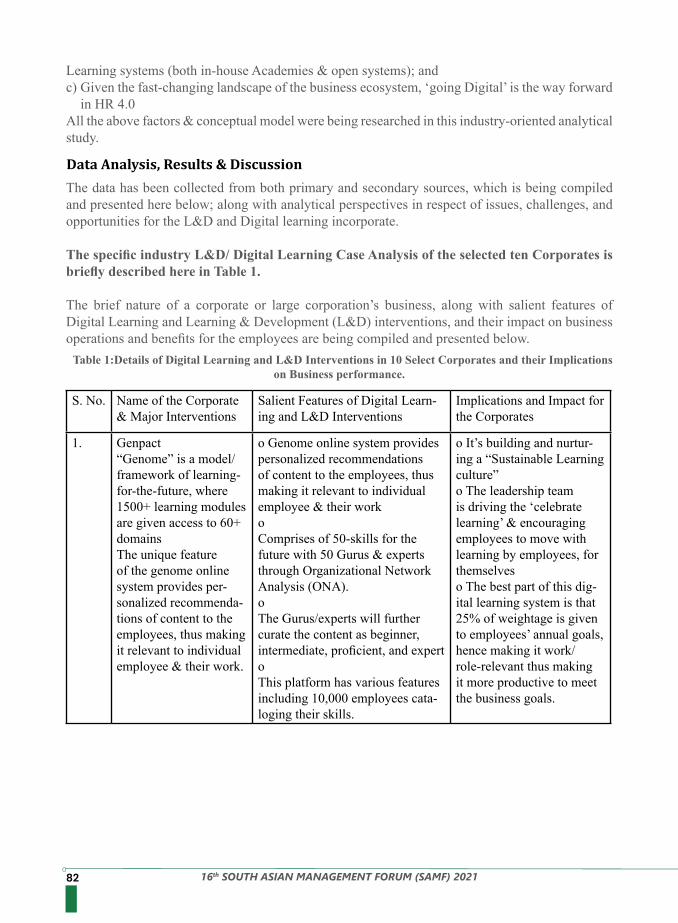
82 16th SOUTH ASIAN MANAGEMENT FORUM (SAMF) 2021
Learning systems (both in-house Academies & open systems); and c) Given the fast-changing landscape of the business ecosystem, ‘going Digital’ is the way forward
in HR 4.0 All the above factors & conceptual model were being researched in this industry-oriented analytical study.
The data has been collected from both primary and secondary sources, which is being compiled and presented here below; along with analytical perspectives in respect of issues, challenges, and opportunities for the L&D and Digital learning incorporate.
The specific industry L&D/ Digital Learning Case Analysis of the selected ten Corporates is briefly described here in Table 1.
The brief nature of a corporate or large corporation’s business, along with salient features of Digital Learning and Learning & Development (L&D) interventions, and their impact on business operations and benefits for the employees are being compiled and presented below.
Data Analysis, Results & Discussion
Table 1:Details of Digital Learning and L&D Interventions in 10 Select Corporates and their Implications on Business performance.
S. No. Name of the Corporate & Major Interventions
Salient Features of Digital Learn-ing and L&D Interventions
Implications and Impact for the Corporates
1. Genpact“Genome” is a model/ framework of learning-for-the-future, where 1500+ learning modules are given access to 60+ domainsThe unique feature of the genome online system provides per-sonalized recommenda-tions of content to the employees, thus making it relevant to individual employee & their work.
o Genome online system provides personalized recommendations of content to the employees, thus making it relevant to individual employee & their workoComprises of 50-skills for the future with 50 Gurus & experts through Organizational Network Analysis (ONA). oThe Gurus/experts will further curate the content as beginner, intermediate, proficient, and expertoThis platform has various features including 10,000 employees cata-loging their skills.
o It’s building and nurtur-ing a “Sustainable Learning culture”o The leadership team is driving the ‘celebrate learning’ & encouraging employees to move with learning by employees, for themselveso The best part of this dig-ital learning system is that 25% of weightage is given to employees’ annual goals, hence making it work/ role-relevant thus making it more productive to meet the business goals.
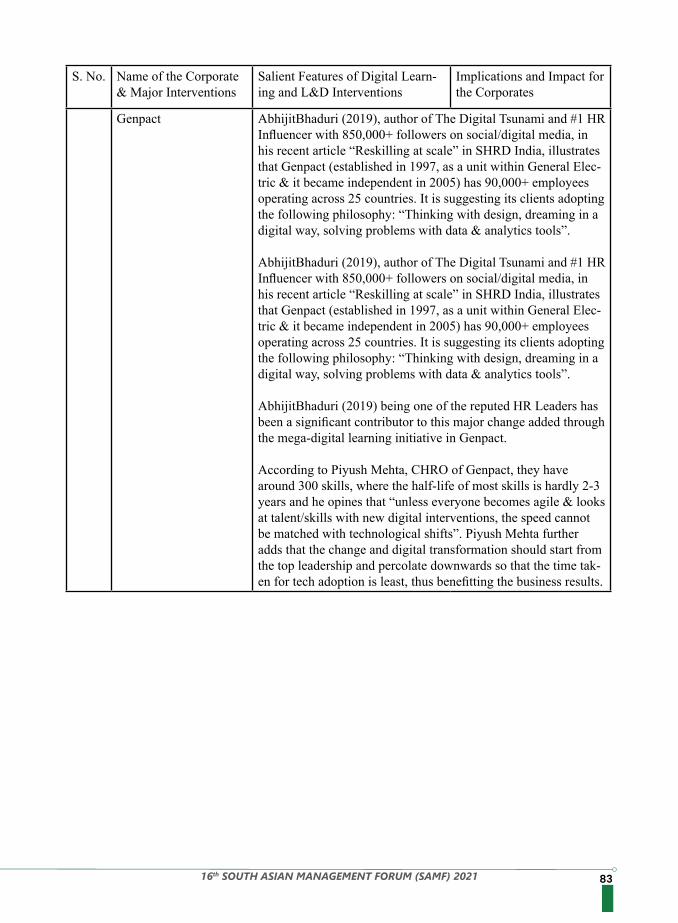
8316th SOUTH ASIAN MANAGEMENT FORUM (SAMF) 2021
S. No. Name of the Corporate & Major Interventions
Salient Features of Digital Learn-ing and L&D Interventions
Implications and Impact for the Corporates
Genpact AbhijitBhaduri (2019), author of The Digital Tsunami and #1 HR Influencer with 850,000+ followers on social/digital media, in his recent article “Reskilling at scale” in SHRD India, illustrates that Genpact (established in 1997, as a unit within General Elec-tric & it became independent in 2005) has 90,000+ employees operating across 25 countries. It is suggesting its clients adopting the following philosophy: “Thinking with design, dreaming in a digital way, solving problems with data & analytics tools”.
AbhijitBhaduri (2019), author of The Digital Tsunami and #1 HR Influencer with 850,000+ followers on social/digital media, in his recent article “Reskilling at scale” in SHRD India, illustrates that Genpact (established in 1997, as a unit within General Elec-tric & it became independent in 2005) has 90,000+ employees operating across 25 countries. It is suggesting its clients adopting the following philosophy: “Thinking with design, dreaming in a digital way, solving problems with data & analytics tools”.
AbhijitBhaduri (2019) being one of the reputed HR Leaders has been a significant contributor to this major change added through the mega-digital learning initiative in Genpact.
According to Piyush Mehta, CHRO of Genpact, they have around 300 skills, where the half-life of most skills is hardly 2-3 years and he opines that “unless everyone becomes agile & looks at talent/skills with new digital interventions, the speed cannot be matched with technological shifts”. Piyush Mehta further adds that the change and digital transformation should start from the top leadership and percolate downwards so that the time tak-en for tech adoption is least, thus benefitting the business results.
84 16th SOUTH ASIAN MANAGEMENT FORUM (SAMF) 2021
S. No. Name of the Corporate & Major Interventions
Salient Features of Digital Learn-ing and L&D Interventions
Implications and Impact for the Corporates
2. Nexval Infotech Pvt Ltd, BangaloreNexval has adopted a self-driven learning strategy.Nexval provides cus-tomized solutions and services to the mortgage lending and servicing industries, which has been featured in Forbes Great Managers Study, 2018 (with 500 Em-ployees in India).
o Nexval is focusing on Solution-centricity by emphasizing to employees that:a) You are LEARNING for SELF (staying relevant for the FUTURE)b) Designed the rewards structure for Learning & Growth (L&G), rather than just L&D from the employer’s perspectivec) Learning Transfer to Pro-ductivity & Sustainability (Curat-ing content to Roles)
Nexval is pow-ering micro-learning by MOOCs with 19,251 hours in recent 4-months & it is a great milestone (with an average of about 38 hours/ employee across 4 months) which is significant, as in Nov/Dec.2019 (Annexure 1) This has fur-ther grown 3x during COVID-19 pandemic times (March – July 2020), which is an encouraging trend Employees are keen to equip themselves with skills/ domains, of their interest & relevance to work
8516th SOUTH ASIAN MANAGEMENT FORUM (SAMF) 2021
S. No. Name of the Corporate & Major Interventions
Salient Features of Digital Learn-ing and L&D Interventions
Implications and Impact for the Corporates
Nexval InfotechPvt Ltd A personal interview and discussion with Mr. Srinath, CHRO revealed that Nexval has adopted a self-driven learning strategy i.e,., “employees are made to realize that their skills have to be up-to-date with Industry 4.0 & they should save their career/ jobs, by embracing new skills/ learning AND it is for their ben-efit first, then the company (which is next)”. Mr.Srinath further clarified that the onus of learning new-age skills, finding their application on the job, and ensuring career growth is the respon-sibility of employees and not that of the employer or that of HR Leaders.
With this strategy, the company was able to overcome resistance from employees, wherein from just 23,000 hours of digital learn-ing in 2018, it has moved to 63,000 hours of digital learning in 2019; which is significantly higher traction & growth in learning engagement.
Further, the Nexval is focusing on Solution-centricity by making the employees understand that:a) They are LEARNING for SELF (staying relevant for the FUTURE)b) The company designed the rewards structure for Learn-ing & Growth (L&G), rather than just L&D from the employer’s perspective c) Learning Transfer to Productivity & Sustainability (Cu-rating content to Roles)
The employees are taking the highest digital learning (Annexure 1) in soft skill programs (4130 hours), followed by commu-nication skills (2352 hours), customer service (20280 hours), performance-related (850 hours), compliance (9800 hours), and time management (657 hours), etc. This indicates that they are keen to equip themselves with skills/ domains of their interest & relevance to work.
86 16th SOUTH ASIAN MANAGEMENT FORUM (SAMF) 2021
S. No. Name of the Corporate & Major Interventions
Salient Features of Digital Learn-ing and L&D Interventions
Implications and Impact for the Corporates
3 AirbusAirbus is a global aero-space giant operating in 35+ countries with over 134,000+ employ-ees earning in million dollars & optimizing in equivalent measure from the Global digital learning library.
The study by Christian Annesley (2017) has re-vealed that the Aircraft manufacturer Airbus has created a Digital Learn-ing Library (started in 2015).
o Airbus has created a Global Digital Learning Library (started in 2015).o It is helping 100,000 +employees in all the 35+ coun-tries to keep their skills updated through 6,900+ usable & sharable learning contents/ modules, for self/career/ leadership growth.o This digital library has grown in the past 2+years, which is one of the primary paybacks till now to be derived from a 5-year digital transformation & organiza-tions-wide program.o The Digital Learning Library has been well accepted by employees and the “learn-ing culture has been evolving” at a faster pace, than what was initially thought by HR Managers and Business Leaders, which is a welcome development, with this mega-Digital initiative across the Airbus company.
Since 2016, it has kicked off with a power-ful take-off (e.g. France, Germany), where there have been 1.4+ million total connections on Pulse driven by 160,000+ active user registrations by the Airbus employees. Arnaud Raffray, Vice President – HR, Airbus, indicated that the employee transformation and digital learning engage-ment at Airbus are growing rapidly. According to the findings of Christian Annesley (2017), the Dig-ital Learning Library has added significantly higher benefits to both employees (learners) and organizations (business performance).
8716th SOUTH ASIAN MANAGEMENT FORUM (SAMF) 2021
S. No. Name of the Corporate & Major Interventions
Salient Features of Digital Learn-ing and L&D Interventions
Implications and Impact for the Corporates
4 Siemens
The newly recruited employee induction is being carried out by using an Induction-App, which is developed in-house
o The HR managers, along with IT-Managers, design and pro-vide the access and log-in creden-tials of the Induction-App, and are providing e-mail to the candidate who is selected and given a joining offer. o It is a simple, easy-to-use, friendly and digital method of introducing the employers, its regulations, career opportunities, etc on-the-go principle. o The key benefits of In-duction-App at Siemens included: instant getting to know each other; avoidance/ reduction of mono-logue in-person sessions; new employees knowing whom to con-tact & for what purpose, almost seamlessly.
The major benefits accrued by Siemens through this Digital Learning consisted of: Moving up the value-chain wrt the HR-Service delivery via a Digital solution, which is convenient, user-friendly, and available on-the-go It saved 1 million and 250 man-hours per year, which is significant It enhanced billa-bility by preventing produc-tivity-loss of 1.5 working days for the business It is a classic illustration of adopting futuristic digital solution to today’s challenges.
5 Astra Zeneca Pharma India Ltd. (AZPIL), Bangalore
In their L&D, the AZPIL has a new-hire learning journey module spanning 24-months, having a blend of both digital and personalized L&D interventions
o The discussion with the HR Managers, L&D Managers with CEO has been able to conceive and crystallize the process-driven policy/ framework to ensure talent growth within the organization.o This includes AZDA (As-tra Zeneca First Leader Academy) and AZLA (Astra Zeneca second Line Leader Academy) to cater to specific learning needs of the employees both of which the em-ployees are encouraged to engage actively in digital learning.o The AstraZeneca Women Leadership Academy is having a specific focus on women employ-ees by having implemented an impactful development framework
Hi-Potential Development Framework at Astra Zeneca, where the 70:20:10 principle is being implemented effectively i.e., 70% for GIG market-place, 20% for Mentoring marketplace, and 10% for learning impetus. (Annex-ure 2) Various L&D, Digital Learning, and AZPIL Academy interven-tions have resulted in an increase in internal succes-sion movements by 54% (business-critical roles), 62% (mid-senior overall), and 100% (in sales leader-ship roles)
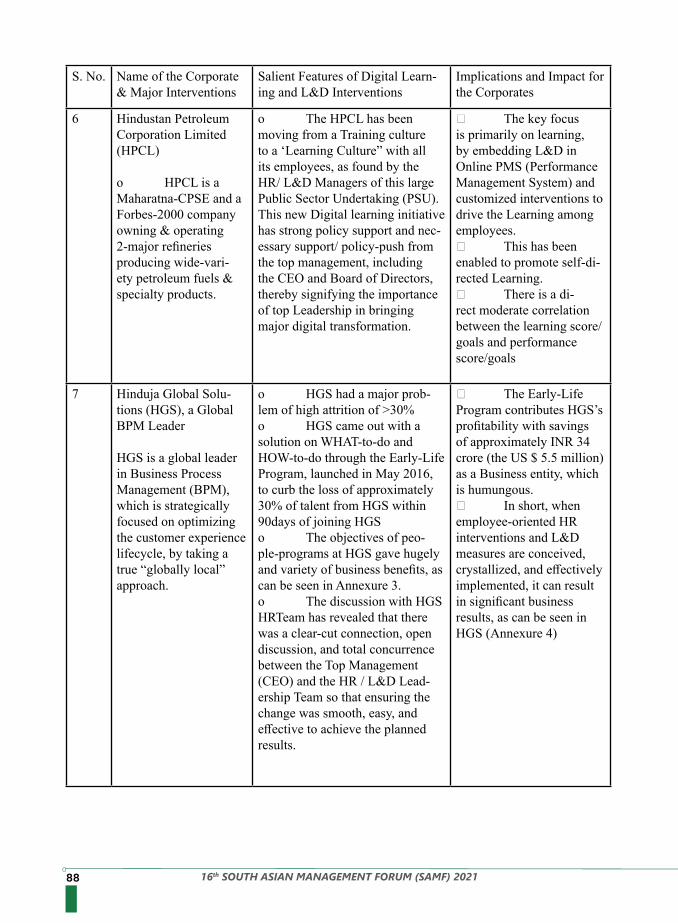
88 16th SOUTH ASIAN MANAGEMENT FORUM (SAMF) 2021
S. No. Name of the Corporate & Major Interventions
Salient Features of Digital Learn-ing and L&D Interventions
Implications and Impact for the Corporates
6 Hindustan Petroleum Corporation Limited (HPCL)
o HPCL is a Maharatna-CPSE and a Forbes-2000 company owning & operating 2-major refineries producing wide-vari-ety petroleum fuels & specialty products.
o The HPCL has been moving from a Training culture to a ‘Learning Culture” with all its employees, as found by the HR/ L&D Managers of this large Public Sector Undertaking (PSU). This new Digital learning initiative has strong policy support and nec-essary support/ policy-push from the top management, including the CEO and Board of Directors, thereby signifying the importance of top Leadership in bringing major digital transformation.
The key focus is primarily on learning, by embedding L&D in Online PMS (Performance Management System) and customized interventions to drive the Learning among employees. This has been enabled to promote self-di-rected Learning. There is a di-rect moderate correlation between the learning score/goals and performance score/goals
7 Hinduja Global Solu-tions (HGS), a Global BPM Leader
HGS is a global leader in Business Process Management (BPM), which is strategically focused on optimizing the customer experience lifecycle, by taking a true “globally local” approach.
o HGS had a major prob-lem of high attrition of >30%o HGS came out with a solution on WHAT-to-do and HOW-to-do through the Early-Life Program, launched in May 2016, to curb the loss of approximately 30% of talent from HGS within 90days of joining HGSo The objectives of peo-ple-programs at HGS gave hugely and variety of business benefits, as can be seen in Annexure 3.o The discussion with HGS HRTeam has revealed that there was a clear-cut connection, open discussion, and total concurrence between the Top Management (CEO) and the HR / L&D Lead-ership Team so that ensuring the change was smooth, easy, and effective to achieve the planned results.
The Early-Life Program contributes HGS’s profitability with savings of approximately INR 34 crore (the US $ 5.5 million) as a Business entity, which is humungous. In short, when employee-oriented HR interventions and L&D measures are conceived, crystallized, and effectively implemented, it can result in significant business results, as can be seen in HGS (Annexure 4)
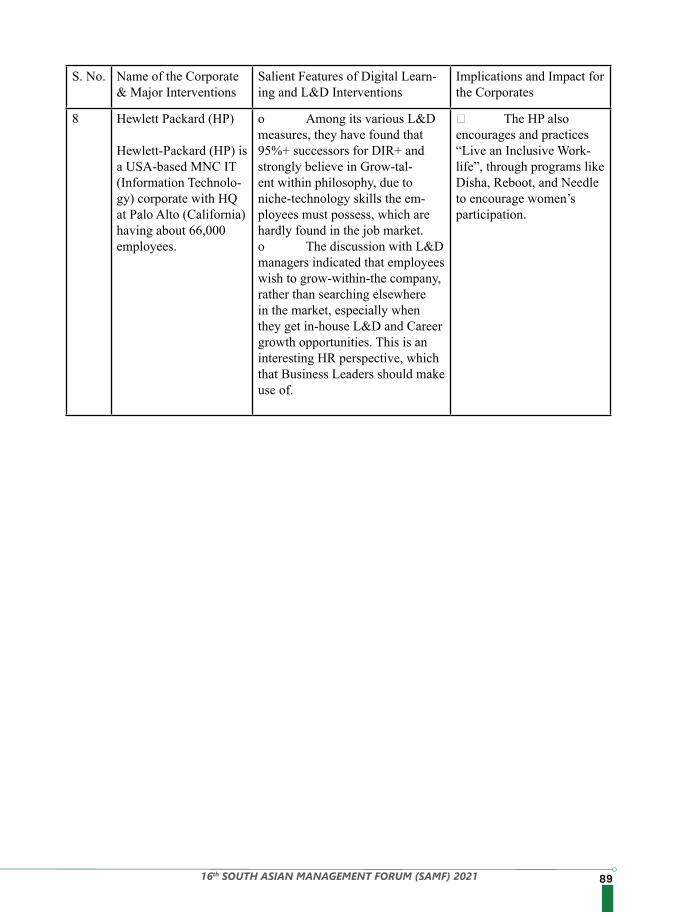
8916th SOUTH ASIAN MANAGEMENT FORUM (SAMF) 2021
S. No. Name of the Corporate & Major Interventions
Salient Features of Digital Learn-ing and L&D Interventions
Implications and Impact for the Corporates
8 Hewlett Packard (HP)
Hewlett-Packard (HP) is a USA-based MNC IT (Information Technolo-gy) corporate with HQ at Palo Alto (California) having about 66,000 employees.
o Among its various L&D measures, they have found that 95%+ successors for DIR+ and strongly believe in Grow-tal-ent within philosophy, due to niche-technology skills the em-ployees must possess, which are hardly found in the job market. o The discussion with L&D managers indicated that employees wish to grow-within-the company, rather than searching elsewhere in the market, especially when they get in-house L&D and Career growth opportunities. This is an interesting HR perspective, which that Business Leaders should make use of.
The HP also encourages and practices “Live an Inclusive Work-life”, through programs like Disha, Reboot, and Needle to encourage women’s participation.
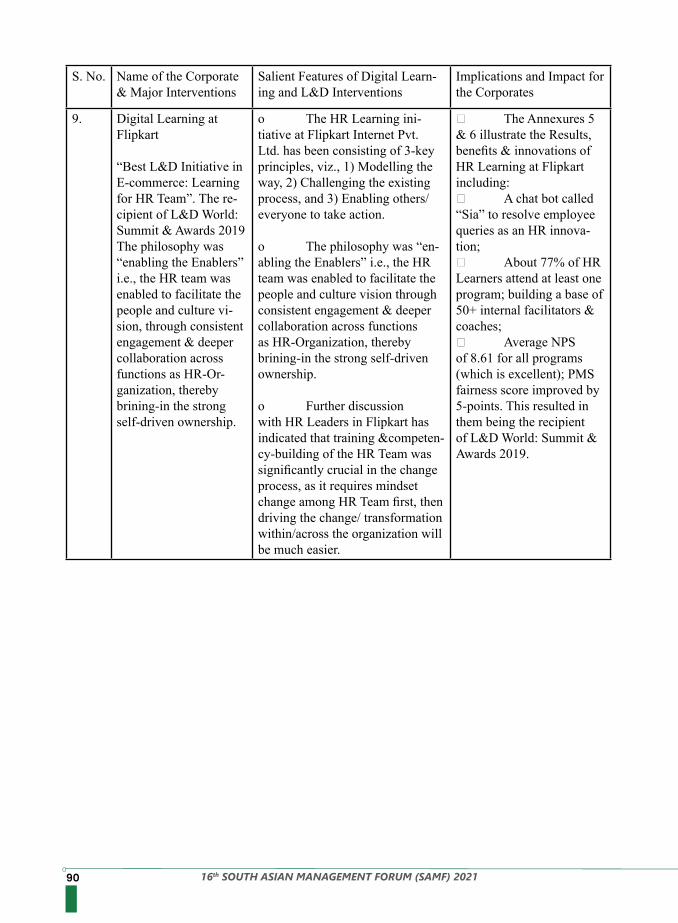
90 16th SOUTH ASIAN MANAGEMENT FORUM (SAMF) 2021
S. No. Name of the Corporate & Major Interventions
Salient Features of Digital Learn-ing and L&D Interventions
Implications and Impact for the Corporates
9. Digital Learning at Flipkart
“Best L&D Initiative in E-commerce: Learning for HR Team”. The re-cipient of L&D World: Summit & Awards 2019The philosophy was “enabling the Enablers” i.e., the HR team was enabled to facilitate the people and culture vi-sion, through consistent engagement & deeper collaboration across functions as HR-Or-ganization, thereby brining-in the strong self-driven ownership.
o The HR Learning ini-tiative at Flipkart Internet Pvt. Ltd. has been consisting of 3-key principles, viz., 1) Modelling the way, 2) Challenging the existing process, and 3) Enabling others/everyone to take action.
o The philosophy was “en-abling the Enablers” i.e., the HR team was enabled to facilitate the people and culture vision through consistent engagement & deeper collaboration across functions as HR-Organization, thereby brining-in the strong self-driven ownership.
o Further discussion with HR Leaders in Flipkart has indicated that training &competen-cy-building of the HR Team was significantly crucial in the change process, as it requires mindset change among HR Team first, then driving the change/ transformation within/across the organization will be much easier.
The Annexures 5 & 6 illustrate the Results, benefits & innovations of HR Learning at Flipkart including: A chat bot called “Sia” to resolve employee queries as an HR innova-tion; About 77% of HR Learners attend at least one program; building a base of 50+ internal facilitators & coaches; Average NPS of 8.61 for all programs (which is excellent); PMS fairness score improved by 5-points. This resulted in them being the recipient of L&D World: Summit & Awards 2019.
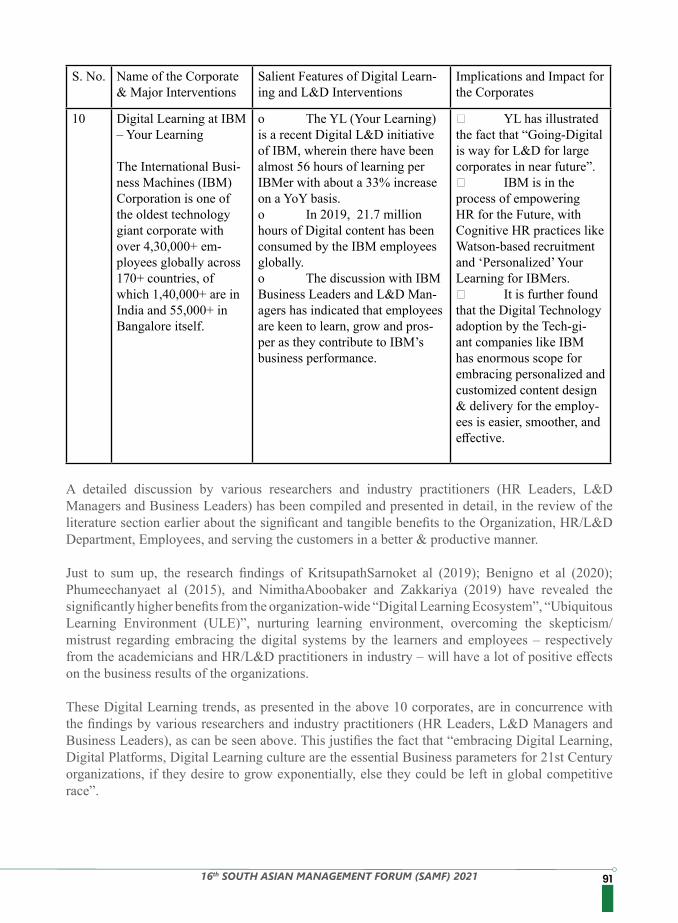
9116th SOUTH ASIAN MANAGEMENT FORUM (SAMF) 2021
S. No. Name of the Corporate & Major Interventions
Salient Features of Digital Learn-ing and L&D Interventions
Implications and Impact for the Corporates
10 Digital Learning at IBM – Your Learning
The International Busi-ness Machines (IBM) Corporation is one of the oldest technology giant corporate with over 4,30,000+ em-ployees globally across 170+ countries, of which 1,40,000+ are in India and 55,000+ in Bangalore itself.
o The YL (Your Learning) is a recent Digital L&D initiative of IBM, wherein there have been almost 56 hours of learning per IBMer with about a 33% increase on a YoY basis. o In 2019, 21.7 million hours of Digital content has been consumed by the IBM employees globally. o The discussion with IBM Business Leaders and L&D Man-agers has indicated that employees are keen to learn, grow and pros-per as they contribute to IBM’s business performance.
YL has illustrated the fact that “Going-Digital is way for L&D for large corporates in near future”. IBM is in the process of empowering HR for the Future, with Cognitive HR practices like Watson-based recruitment and ‘Personalized’ Your Learning for IBMers. It is further found that the Digital Technology adoption by the Tech-gi-ant companies like IBM has enormous scope for embracing personalized and customized content design & delivery for the employ-ees is easier, smoother, and effective.
A detailed discussion by various researchers and industry practitioners (HR Leaders, L&D Managers and Business Leaders) has been compiled and presented in detail, in the review of the literature section earlier about the significant and tangible benefits to the Organization, HR/L&D Department, Employees, and serving the customers in a better & productive manner.
Just to sum up, the research findings of KritsupathSarnoket al (2019); Benigno et al (2020); Phumeechanyaet al (2015), and NimithaAboobaker and Zakkariya (2019) have revealed the significantly higher benefits from the organization-wide “Digital Learning Ecosystem”, “Ubiquitous Learning Environment (ULE)”, nurturing learning environment, overcoming the skepticism/mistrust regarding embracing the digital systems by the learners and employees – respectively from the academicians and HR/L&D practitioners in industry – will have a lot of positive effects on the business results of the organizations.
These Digital Learning trends, as presented in the above 10 corporates, are in concurrence with the findings by various researchers and industry practitioners (HR Leaders, L&D Managers and Business Leaders), as can be seen above. This justifies the fact that “embracing Digital Learning, Digital Platforms, Digital Learning culture are the essential Business parameters for 21st Century organizations, if they desire to grow exponentially, else they could be left in global competitive race”.
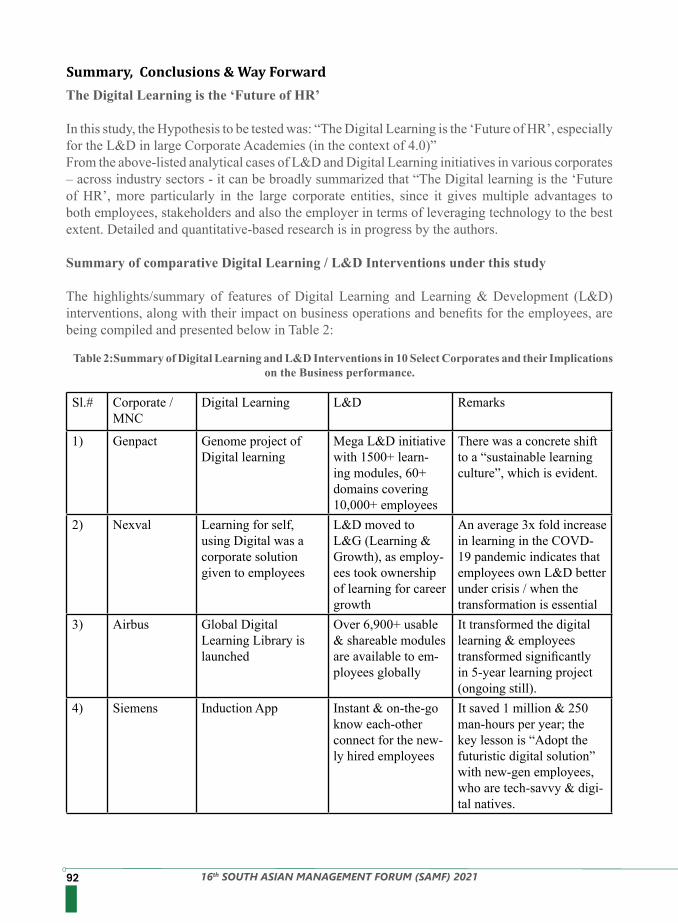
92 16th SOUTH ASIAN MANAGEMENT FORUM (SAMF) 2021
The Digital Learning is the ‘Future of HR’
In this study, the Hypothesis to be tested was: “The Digital Learning is the ‘Future of HR’, especially for the L&D in large Corporate Academies (in the context of 4.0)”From the above-listed analytical cases of L&D and Digital Learning initiatives in various corporates – across industry sectors - it can be broadly summarized that “The Digital learning is the ‘Future of HR’, more particularly in the large corporate entities, since it gives multiple advantages to both employees, stakeholders and also the employer in terms of leveraging technology to the best extent. Detailed and quantitative-based research is in progress by the authors.
Summary of comparative Digital Learning / L&D Interventions under this study
The highlights/summary of features of Digital Learning and Learning & Development (L&D) interventions, along with their impact on business operations and benefits for the employees, are being compiled and presented below in Table 2:
Summary, Conclusions & Way Forward
Table 2:Summary of Digital Learning and L&D Interventions in 10 Select Corporates and their Implications on the Business performance.
Sl.# Corporate / MNC
Digital Learning L&D Remarks
1) Genpact Genome project of Digital learning
Mega L&D initiative with 1500+ learn-ing modules, 60+ domains covering 10,000+ employees
There was a concrete shift to a “sustainable learning culture”, which is evident.
2) Nexval Learning for self, using Digital was a corporate solution given to employees
L&D moved to L&G (Learning & Growth), as employ-ees took ownership of learning for career growth
An average 3x fold increase in learning in the COVD-19 pandemic indicates that employees own L&D better under crisis / when the transformation is essential
3) Airbus Global Digital Learning Library is launched
Over 6,900+ usable & shareable modules are available to em-ployees globally
It transformed the digital learning & employees transformed significantly in 5-year learning project (ongoing still).
4) Siemens Induction App Instant & on-the-go know each-other connect for the new-ly hired employees
It saved 1 million & 250 man-hours per year; the key lesson is “Adopt the futuristic digital solution” with new-gen employees, who are tech-savvy & digi-tal natives.
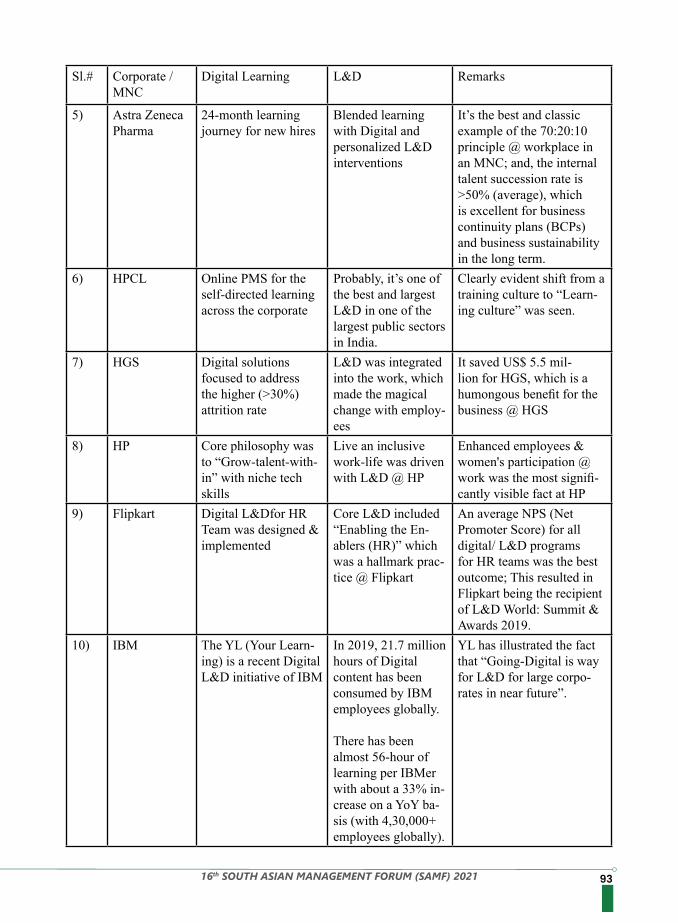
9316th SOUTH ASIAN MANAGEMENT FORUM (SAMF) 2021
Sl.# Corporate / MNC
Digital Learning L&D Remarks
5) Astra Zeneca Pharma
24-month learning journey for new hires
Blended learning with Digital and personalized L&D interventions
It’s the best and classic example of the 70:20:10 principle @ workplace in an MNC; and, the internal talent succession rate is >50% (average), which is excellent for business continuity plans (BCPs) and business sustainability in the long term.
6) HPCL Online PMS for the self-directed learning across the corporate
Probably, it’s one of the best and largest L&D in one of the largest public sectors in India.
Clearly evident shift from a training culture to “Learn-ing culture” was seen.
7) HGS Digital solutions focused to address the higher (>30%) attrition rate
L&D was integrated into the work, which made the magical change with employ-ees
It saved US$ 5.5 mil-lion for HGS, which is a humongous benefit for the business @ HGS
8) HP Core philosophy was to “Grow-talent-with-in” with niche tech skills
Live an inclusive work-life was driven with L&D @ HP
Enhanced employees & women's participation @ work was the most signifi-cantly visible fact at HP
9) Flipkart Digital L&Dfor HR Team was designed & implemented
Core L&D included “Enabling the En-ablers (HR)” which was a hallmark prac-tice @ Flipkart
An average NPS (Net Promoter Score) for all digital/ L&D programs for HR teams was the best outcome; This resulted in Flipkart being the recipient of L&D World: Summit & Awards 2019.
10) IBM The YL (Your Learn-ing) is a recent Digital L&D initiative of IBM
In 2019, 21.7 million hours of Digital content has been consumed by IBM employees globally.
There has been almost 56-hour of learning per IBMer with about a 33% in-crease on a YoY ba-sis (with 4,30,000+ employees globally).
YL has illustrated the fact that “Going-Digital is way for L&D for large corpo-rates in near future”.
94 16th SOUTH ASIAN MANAGEMENT FORUM (SAMF) 2021
From the above discussion, it can be seen evidence that there are certain common patterns and best Digital Learning / L&D interventions which can be summarised here below:1) When ‘Learning is taken, with ownership, by the employees” the rate of success and business impact is significantly higher.2) There is an evident shift from a training culture to “Learning culture” in almost all the 10 MNCs under this study.3) The Digital learning/ L&D interventions are the FUTURE in Industry 4.0 & in the VU-CA-era/post-COVID-19 regime, hence the organizations/ Corporates / MNCs are required to adopt & embrace the “Futuristic Digital solutions” to bring in the engaged learning @ work (discussed below, with details) while creating a lasting business impact; thus it becomes Win-Win-Win scenario for Corporate-Employees-customers.4) There’s a measurable and concrete business impact with Digital learning / L&D interven-tions, which have contributed to Business Continuity Plans (BCPs) & Business sustainability; the most important tents of any business across the industry sectors.5) Interestingly, the ‘intervention of “Enabling the Enablers” by Digital L&D is one of the greatest influencers to bring in the change and transformation among the workforce & employees (e.g. Flipkart & IBM).
From the above summary and above-listed common patterns, the proposed hypothesis of “The Digital Learning is the ‘Future of HR’, especially for the L&D in large Corporate Academies (in the context of Industry 4.0)” stands justified. Of course, further data-driven and deep-dive research are required to generalize this broad finding from this study with 10 major corporates/ MNCs.
Limitations of the Research and the Future Scope: This study has been carried out with a B-School and for just 10 major corporates/ MNCs operating in various sectors. The sample size used can be much bigger, in the future, with larger sample size and deeper data analysis& insights across HEIs/corporations/countries/continents. At present, this can be considered as a base research for undertaking deep-dive analysis. The sectoral analysis& cross-industry perspectives require consideration in the next studies or comparative analysis across a few related sectors that may help in reaching meaningful interpretations and determining the L&D/Digital learning challenges of the specific sectors.
1. Benigno P. Legamia. Jr., Yuri Walter D. Akiate (2020). The Contribution of Online Resources to Fostering Digital Learning and Effective Teaching. Universal Journal of Educational Research, 8(11), 5660 - 5669. DOI: 10.13189/ujer.2020.081170.
2. Cascio, W. (1982) Costing Human Resources. Boston, MA: Kent Publishing Company.3. Chella Ganesh, Harish Devarajan and Rao V.J. (2018), HR Here and Now, Sage Publications
India Pvt. Ltd., New Delhi, 372 pages4. Deloitte Research (2019), Deloitte Report, 2019.5. FICCI-EY Report (2017), FICCI-NASSCOM and EY “Future of Jobs” Report, 2017, Published
Dec 20176. Ficheman, I. K., and Lopes R.D. (2018). “Digital learning ecosystem: Authoring, collaboration,
immersion and mobility,” presented at Eighth IEEE International Conference on Advanced Learn-ing Technologies, 2018.
7. Giangreco, A., Caugati, A., Sebastianao, A. & Bella, D. (2010). Trainees’ reactions to training, The International Journal of Human Resource Management, 21(13), 2468–2487.
8. H. M. van Dam, Nick (2017). 21st Century Corporate Learning & Development Practices 1st edition, bookboon.com.
9. Harrison, R (2009). Learning and Development, 5th Edition, London, CIPD.
References
9516th SOUTH ASIAN MANAGEMENT FORUM (SAMF) 2021
10. Hiremath, N. V. (2020). A study on learning effectiveness in MOOCs-integrated and blended learning pedagogy, with entrepreneurship course among PG students, Nepalese Journal of Man-agement, Volume 7, Number 1, January 2020 (Special Edition), Pages 18-40. www.uniglobe.edu.np.
11. Hiremath, N.V., Mohapatra, A.K. and Paila, Anil Rao .S. (2020). A study on digital learning, learning and development interventions and learnability of working executives in corporates, American Journal of Business, Volume 36, Issue 1, Emerald Publishing Limited,DOI:10.1108/AJB-09-2020-0141, https://www.emerald.com/insight/publication/issn/1935-5181#earlycite
12. India Leadership Academy, Publicis Sapient (2019) www.publicisssapient.com13. Janssen, O. and Van Yperen, N.W. (2004), “Employees’ goal orientations, the quality of lead-
er-member exchange, and the outcomes of job performance and job satisfaction”, Academy of Management Journal, Vol.47, No.3,pp. 368-384.
14. Kirkpatrick, D. (1979). Techniques for evaluating training programs, Training and Development Journal, 78–92.
15. Kirkpatrick, D.L. (1954). Evaluating Human Relations Programs for Industrial Foremen and Supervisors. PHD Thesis. Kirkpatrick Publishing.
16. KritsupathSarnok, PanitaWannapiroon, and PrachyanunNilsook (2019), Digital Learning Eco-system by Using Digital Storytelling for Teacher Profession Students, International Journal of Information and Education Technology, Vol. 9, No. 1, January 2019, pages 21-26
17. LinkedIn Workplace Learning Report (2019). 3rd Annual 2019 Workplace Learning Report,http://learning.linkedin.com pages 44
18. Magda Pischetola and Lone Dirckinck-Holmfeld, (2020), Enactivism and Digital Learning Plat-forms, Proceedings of the Networked Learning Conference 2020. Kolding, Denmark, 18-20 May 2020, https://www.researchgate.net/publication/341549397
19. Nguyen, Andy; Hong, Yvonne; and Gardner, Lesley A., “A Taxonomy of Digital Learning Ac-tivities for Digital Inclusion” (2020). ECIS 2020 Research Papers. 135. https://aisel.aisnet.org/ecis2020_rp/135
20. NimithaAboobaker and Zakkariya K.A. (2019). Influence of digital learning orientation and readiness for change on innovative work behavior: reflections from the higher education sector, Development, and Learning in Organizations · December 2019, VOL. 34 NO. 2 2020, pp. 25-28.
21. Philips, J. J. (1991) Handbook of Training Evaluation and Measurement Methods. Houston, TX: Gulf Publishing Company.
22. Phumeechanya, N., Wannapiroon, P and Nilsook, P. (2015), “Ubiquitous scaffolding learning management system,” in Proc. National Conference on Educational Technology 2015: NCET 2015, Jan 2015, pp. 22-33.
23. Prasad L. & Ramachandran S. (2019), Neoskilling for Digital Transformation and the Artificial Intelligence Revolution, Wiley India Pvt. Ltd., New Delhi and Indian Institute of Management, Bangalore, pages 158
24. Reyna, J. (2011), “Digital teaching and learning ecosystem (DTLE): A theoretical approach for online learning environments,” in Proc. Ascilite 2011 Hobart: Concise Paper, pp. 1080–1088, 2011.
25. Skillsoft’s L&D Survey, 2019 Mind the Gap: Survey Shows Need-to-upskill Employees for the Digital Workplace, Aug. 19, 2019https://www.techfestconf.com/ld/aus/blog/blog/strategy/skills-gap-digital-workplace/
26. UK L&D Report (2019), UK L&D REPORT: 2019, Benchmark Your Workplace Learning Strate-gy (Editor: Abby Guthrie), www.findcourses.co.uk pages 18
27. Wannapiroon, P. (2016), “Information technology and educational innovation”, Faculty of Indus-trial Education, King Mongkut’s University of Technology North Bangkok, 2016, pp. 159-161.
96 16th SOUTH ASIAN MANAGEMENT FORUM (SAMF) 2021
CORPORATE DUAL DILEMMA: AGE DISCRIMINATION AND AGE- INCLUSIVE WORKPLACES DURING PANDEMIC TIMES
Samantha Rathnayake, Ph.D. Faculty Member, Postgraduate Institute of Management, University of Sri Jayewardenepura, Sri Lanka. Email: [email protected]
C D Kumar is an entrepreneur and Founder/ Director of MCK Private Ltd., Sri Lanka. Email: [email protected]
AbstractAge discrimination is rampant during this pandemic, as the corporate world chooses ‘surgical older worker layoffs’ to become leaner. In the process, its competitive advantage: an Age diverse work-force is lost. Producing Age discrimination, then fighting to prevent the same through building Age inclusive workplaces, is a corporate creation of a dual dilemma. In addition, the critical void in literary knowledge and corporate expertise on the subject is of grave concern. As such, this paper addresses the corporate factors of Age discrimination and the twofold corporate obligation of pre-venting Age discrimination and building Age-inclusive workplaces. As an exploratory qualitative study of in-depth interviews and focus groups of 32 managers and thematic data analysis, the study yields several insights.Keywords: Age diversity, Age discrimination, Age inclusion
IntroductionAge discrimination is a global phenomenon that has been intensified during these pandemic times. While the corporate sector contributes to it through several corporate policies and practices, the current pandemic has aggravated it further (Agovino, 2020; Ayalon et al., 2021 Bachman, 2020; Homegardner, 2020). The corporate world employs diverse generational cohorts that generate age discrimination through various individual and organizational factors (Gursoy et al., 2013; Lancast-er & Stillman, 2002; Zemke et al., 2000). On an individual level, it breeds multiple forms of bias, and on an organizational level, institutionalized bias and unfair resource allocation targeting the different generational cohorts gives birth to Age discrimination (Gursoy et al., 2013; Lancaster & Stillman, 2002; Meyer & Rowan, 1977; North & Fiske, 2016; Perry et al., 1996; Perry & Finkel-stein, 1999; Zemke et al., 2000). Currently, a further dimension - the pandemic of older employee layoff has emerged, amplifying Age discrimination. Organizations adopt employee layoff as a com-mon strategy to become leaner, especially during challenging times. However, widespread ‘older employee surgical layoff’ is Age discrimination. Ironically, it is also justified by the notion that they (the older workers) are the worst ‘at risk group’ and hence discriminated against under the guise of favor (Agovino, 2020; Ayalon et al., 2021; Bachman, 2020; Homegardner, 2020). Although Inclu-sion has been accepted as the remedy for all forms of discrimination, Age inclusion is grossly ne-glected in the organizational context as inconsistencies, ambiguity and lack of tools for implemen-tation and measurement exist (Jansen et al., 2011; Shore et al., 2011). Hence, while organizations are immersed in their self-created Age discrimination, they are also engaged in the dual struggle: to eradicate Age discrimination and create Age inclusive workplaces, as the generationally diverse workforce is a competitive advantage to be nurtured and built (Baran & Kłos, 2014). Thus, practic-ing managers and organizations are challenged with the critical dearth of knowledge and expertise in addressing this crucial need (Gordon, 2018). Literature on Diversity, Discrimination, and Inclu-sion primarily deals with protected features such as race, color, language, religion, etc., leaving Age discrimination and Age inclusion understudied (Shore et al., 2011). Further, as age
9716th SOUTH ASIAN MANAGEMENT FORUM (SAMF) 2021
changes with time, it also interacts with all other contextual elements along the timeline, making Age discrimination dynamic (Finkelstein et al., 2015; Fisher et al., 2017). The existing scarce knowledge predominantly on the Western world ignores the rest and does not adequately cover the phenomena; nor has it been tested in an organizational context (Fisher et al., 2017; Jansen et al., 2011; Shore et al., 2011). Age discrimination also does not have a specific underpinning theory but is generally explained through social theories. Similarly, Inclusion does not have a universally agreed-upon definition or an underpinning theory (Jansen et al., 2014; Shore et al., 2011). Thereby, the multifaceted, dynamic theoretical void in the Age discrimination/Age inclusion literature prompts the research questions: ‘How does Age discrimination manifest within organizations? ‘How can inclusion be experienced and what is its role within an age-diverse workforce in organizations?’ and How does the pandemic affect both Age discrimination and Age inclusion?
Literature ReviewAge DiscriminationDue to global aging, youth joining the workforce decrease while the elderly continue to work beyond retirement age, extending the retirement ceiling, resulting in an age-diverse workforce. A diverse age workforce gives rise to age biases, prejudices, and stereotypes that lead to Age discrimination (Gursoy et al., 2013; Lancaster & Stillman, 2002; Zemke et al., 2000), especiallythe areas of recruitment and selection, performance appraisal, training and development, career opportunities, and disciplinary actions and penalties (Cleveland & Shore, 1992; Cox & Nkomo, 1991; Finkelstein et al., 2015; Lawrence, 1990; Maurer & Rafuse, 2001; Shore et al., 2003).The literature on Age discrimination mainly focuses on discrimination of older individuals with a few works on Reverse ageism which is the discrimination of the younger individuals. Butler (1969) defines Age discrimination as the “systematic stereotyping of and discrimination against older people because they are old….” Several other scholars have highlighted the disproportionate (Corell et al., 2010) discriminative behavior that creates, sustains, and reinforces disadvantages for specific individuals/groups against certain other individuals/groups (Dovidio et al., 2010) and denial of fundamental dignity as human beings. McConnachie (2014). The construct ‘Discrimination’ does not have a dedicated theory and is generally explained by Social Theories such as the Social Identity Theory (SIT) (Tajfel & Turner, 1985) and the Self-Categorization Theory (SCT) (Turner, 1987). BiasBias is the subjective perceptions that are often baseless and constitute a common terminology encompassing prejudices, stereotypes, and discrimination. While stereotypes form the cognitive bias, prejudice is the emotional or attitudinal outcome, and discrimination is the behavioral outcome (Fiske, 2000, 2004; Nelson, 2009). As per this study, individuals of a particular age group, shaped by the confluence of socio-cultural-political-economic-historical events of that era, influence them to hold similar beliefs, values, attitudes, perceptions, preferences, characteristics, and behaviors that are both unique and distinct that set each age group apart from one another (Kupperschmidt, 2000; Mannheim, 1952). An Age diverse workforce would consist of several such specific age groups coming together in the workplace, creating Age-based bias, friction, and conflicts leading to Age discrimination, the study’s dependent variable. Thus the study presents the first proposition.
P1: An Age diverse workforce produces Age discrimination
98 16th SOUTH ASIAN MANAGEMENT FORUM (SAMF) 2021
Age-Prototype-Matching
Age-Prototype-Matching can be explained as assigning an age expectation or tagging an age la-bel to the job position (Perry et al., 1996; Perry & Finkelstein, 1999), especially when hiring or promoting, as age becomes a criterion of selection over competency and performance. Fur-ther, previous studies also confirm that Age-Prototype-Matching produces Age discrimination (Perry et al., 1996; Perry & Finkelstein, 1999). Thus, the study presents the second proposition.
P2: Age-Prototype-Matching produces Age discrimination
Institutionalized BiasAs the organizational factor of age discrimination, ‘Institutionalized Bias’ is explained as discriminative practices adopted by organizations in response to the influence and coercion to fall in line with the biased norms and practices of the industry, society, and by large the state and its laws. Theoretical support is found in the Institutional Theory (Meyer & Rowan, 1977), which holds that institutions confirm a sector-specific homogenization for reputation and survival by adopting collective norms and practices of the industry/environment. Examples include themandatory retirement law, prescribed years of experience and age –prototype-matching and non- competency-based evaluations, etc. Thus, the study presents the third proposition.
P3: Institutionalized Bias produces Age discrimination
Unfair Allocation of ResourcesAn age-diverse workforce produces resource-based tensions (North & Fiske 2013 a, b; 2016), which gives rise to the notion of ‘allocation of resources.’ Thus, organizations attempt to maximize resource allocation and ROI in terms of employing and investing in employees based on economic considerations such as cost and ROI connecting to age preferences rather than competency and performance (Abrams et al., 2016; Kooji & Zacher, 2016; Maurer & Rafuse, 2001). North and Fiske explain the resource tension as a three-fold scenario involving ‘Succession, Consumption and Identity, emphasizing that older employees block the younger from enjoying the resources and opportunities, be the burden consuming resources, and practice prescriptive-stereotype deserving to be omitted unjustly. Thus, the study presents the fourth proposition.
P4: Unfair Resource Allocation produces Age discrimination
Pandemic Older worker LayoffA global pandemic stretched over an unpredictable timeframe with increasing spread and fatalities directly affects financial stability and raises concerns about the survival of businesses. As such, to minimize adverse effects, organizations adopt measures to become leaner. Employee layoff is understandably the most common strategy practiced. However, it is reported that older employees are targeted in these ‘surgical layoffs’ under the guise that it is a measure to protect them as they are the ‘at risk group.’ This practice is unethically manipulative and discriminative as it disadvantages the older workers (Agovino, 2020; Ayalon et al., 2021; Bachman, 2020; Homegardner, 2020). Thus, the study presents the fifth proposition.P5: Pandemic older worker layoff produces Age discrimination
InclusionThe literature presents Inclusion as a multifaceted concept with multiple definitions. This study endorses the definition based on the fairness perspective, which defines Inclusion as equality, justice, and full participation at both the group and individual levels so that members of different groups not only have equal access to opportunities, decision-making, and positions of power but they are actively sought out because of their differences (Holvino et al., 2004).
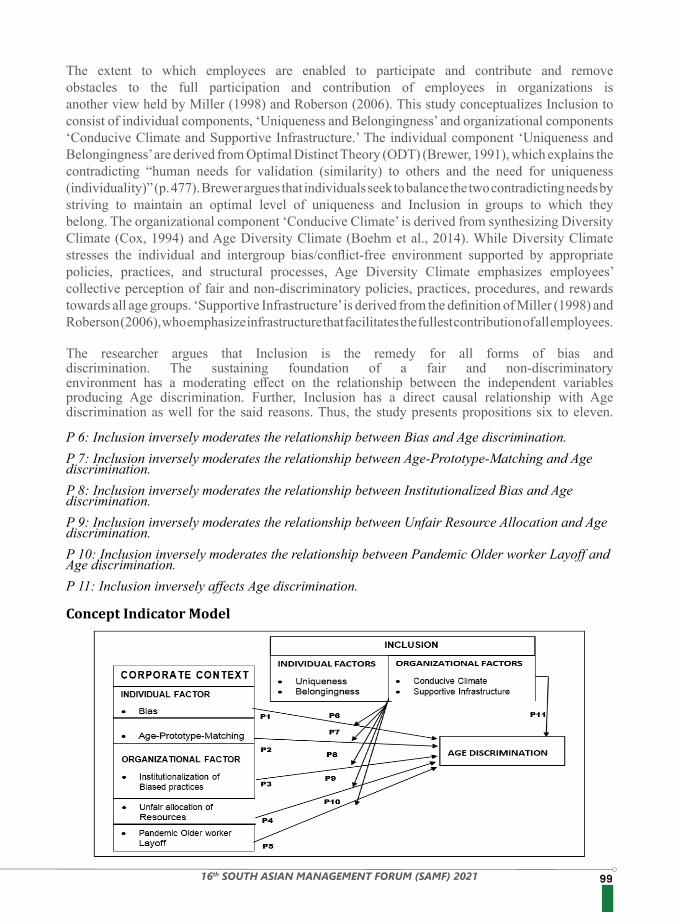
9916th SOUTH ASIAN MANAGEMENT FORUM (SAMF) 2021
The extent to which employees are enabled to participate and contribute and remove obstacles to the full participation and contribution of employees in organizations is another view held by Miller (1998) and Roberson (2006). This study conceptualizes Inclusion to consist of individual components, ‘Uniqueness and Belongingness’ and organizational components ‘Conducive Climate and Supportive Infrastructure.’ The individual component ‘Uniqueness and Belongingness’ are derived from Optimal Distinct Theory (ODT) (Brewer, 1991), which explains the contradicting “human needs for validation (similarity) to others and the need for uniqueness (individuality)” (p. 477). Brewer argues that individuals seek to balance the two contradicting needs by striving to maintain an optimal level of uniqueness and Inclusion in groups to which they belong. The organizational component ‘Conducive Climate’ is derived from synthesizing Diversity Climate (Cox, 1994) and Age Diversity Climate (Boehm et al., 2014). While Diversity Climate stresses the individual and intergroup bias/conflict-free environment supported by appropriate policies, practices, and structural processes, Age Diversity Climate emphasizes employees’ collective perception of fair and non-discriminatory policies, practices, procedures, and rewards towards all age groups. ‘Supportive Infrastructure’ is derived from the definition of Miller (1998) and Roberson (2006), who emphasize infrastructure that facilitates the fullest contribution of all employees.
The researcher argues that Inclusion is the remedy for all forms of bias and discrimination. The sustaining foundation of a fair and non-discriminatory environment has a moderating effect on the relationship between the independent variables producing Age discrimination. Further, Inclusion has a direct causal relationship with Age discrimination as well for the said reasons. Thus, the study presents propositions six to eleven.
P 6: Inclusion inversely moderates the relationship between Bias and Age discrimination.P 7: Inclusion inversely moderates the relationship between Age-Prototype-Matching and Age discrimination.P 8: Inclusion inversely moderates the relationship between Institutionalized Bias and Age discrimination.P 9: Inclusion inversely moderates the relationship between Unfair Resource Allocation and Age discrimination.P 10: Inclusion inversely moderates the relationship between Pandemic Older worker Layoff and Age discrimination.P 11: Inclusion inversely affects Age discrimination.
Concept Indicator Model
100 16th SOUTH ASIAN MANAGEMENT FORUM (SAMF) 2021
MethodologyGiven the study’s exploratory nature, as per Saunders et al. (2009), a qualitative methodology under an Interpretivist philosophy was adopted to create new meanings, interpretations, and understandings through people’s lived experiences, performances, and perceptions. These were captured through interactive-in-depth-one-on-one-interviews. An Inductive Approach allowing theory to develop through emerging concepts, themes, and models from interpreting raw data was adopted. As per Creswell and Clarke (2007), interactive-in-depth-one-on-one-interviews were adopted by the study as it is the primary data collecting tool of Interpretivist qualitative research. In addition, two focus groups were conducted as well. An interview guide was developed and utilized for reference and for ordaining consistency, direction and focus. The researchers phrased the questions differently to capture responses from multiple angles to draw rich and complete answers. A convenience sampling strategy was adopted to facilitate trust, rapport, access, availability, and feedback. A total of 32 individuals performing managerial work in the private sector were chosen as the sample for the interactive-in-depth-one-on-one interviews. Another 12 participants were selected for two focus groups of 6 each.
Data AnalysisThematic analysis was carried out as per the seven steps prescribed by Braun and Clarke (2013). These are transcription, familiarization, coding, identifying themes, reviewing themes, defining/naming themes, and writing up the finalized analysis. An excel worksheet was used in compiling the initial coding, secondary coding, categories, and themes linking the constructs. A ‘complete coding’ method was adopted, resulting in 368 initial codes collated to arrive at 57 categories that formed the nine (9) themes. The study’s trustworthiness was ensured by adhering to the criteria prescribed by scholars (Emden et al., 2001; Lincoln & Guba, 1986; Tracy, 2010). Triangulation was carried out (Denzin & Lincoln, 2011), re-addressing key outcomes with several other participants and conducting two focus groups of six (6) individuals each.
DiscussionThe purpose of the study is to explore the ‘Corporate Contribution’ towards Age discrimination with particular emphasis on the pandemic times and the Inclusive mitigating measures. The study was conducted in response to the dual challenge faced by managers and organizations, especially in pandemic times. Firstly, in battling increasing Age discrimination and secondly, in building Age inclusive organizations that nurture an age-diverse workforce, identified to be a competitive advantage. Existing literature on Diversity, Discrimination, and Inclusion predominantly covers protected attributes such as race, color, language, religion, etc. neglecting Age discrimination and Age inclusion, which do not have devoted underpinning theories, creating a noticeable theoretical void. Further, as Discrimination and Inclusion are both social concerns, studies conducted in the organizational context are scarce as no theory has been developed, implemented, tested, or measured in an organizational context. Hence, in response to the multi-faceted void in the literature and the lack of expertise in organizations, this qualitative study guided by Interpretivism and an Inductive approach to theory development from data captured from interactive-in-depth-one-on-one-interviews and focus groups were conducted.As per this study, age diversity is identified, acknowledged, and confirmed by employees in organizations. Findings on the relationship Bias – Age discrimination revealed
10116th SOUTH ASIAN MANAGEMENT FORUM (SAMF) 2021
revealed that age-based bias is mainly due to work-related-competency/incompetency of the age-diverse workforce that leads to Age discrimination (Baily, 2009; Gursoy et al., 2013). Findings on the Age-Prototype-Matching– Age discrimination relationship reveal that this type of Age discrimination mainly occurs in recruitment and promotions affecting the younger workers and recruitment and training opportunities affecting the older workers (Perry & Finkelstein, 1999). The findings also confirm that the identified diverse characteristics are unique and consistent with the literature that holds that diverse generations possess various skills (Kupperschmidt, 2000). The study also confirms that the ‘Institutionalized Bias’ produced Age discrimination, especially in the training and development domain discriminating the older workers, which is also confirmed by the literature (Meyer & Rowan, 1977). ‘Unfair Allocation of Resources’ produced Age discrimination is revealed to mainly affect the older workers nearing the retirement ceiling as they are rejected as not financially viable or worthy, which is also supported by the literature (Abrams et al., 2016; Kooji & Zacher, 2016; Maurer & Rafuse, 2001; North & Fiske, 2016). Finally, ‘Pandemic Older Worker Layoffs’ targeting older workers is unethical and manipulative as it discriminates (Agovino, 2020; Ayalon et al., 2021; Bachman, 2020; Homegardner, 2020) as older workers could be given the work-from-home option.
Considering the impact of Inclusion, the findings reveal that experiencing uniqueness-an individual factor of Inclusion - mainly focuses on opportunities for employees’ contribution and the necessity to be a part of strategic decision making and other critical organizational processes, support for the achievement of personal/educational/professional/career/financial goals and recognition /appreciation /rewards. The findings confirm that experiencing feelings of Uniqueness is part of individuals’ experience of Inclusion. ‘Belongingness’ is also confirmed by the results to be a part of experiencing Inclusion. Findings reveal that ‘Belongingness’ is expressed as the feeling of being an integral part of the present and future of the organization, enjoying feelings of being cared for, experiencing organizational support in achieving personal/family life goals and dreams, experiencing long-serving and job/financial security and personal wellbeing. Collectively taken, the individual factors of Inclusion, Uniqueness, and Belongingness are confirmed by the findings and supported by the literature (Brewer, 1991; Shore et al., 2011). Under the organizational factor ‘Conducive Climate,’ findings reveal that expressions of respect, a threat-free environment, and fairness/non-discriminatory actions ensure the workplace’s emotional/physical wellbeing. The literature support is found in the works of (Ferdman & Davidson, 2002; Ferdman & Deane, 2013; Holvino et al., 2004). Findings also reveal the need for a supportive performance environment with ‘Supportive Infrastructure,’ enabling them to perform their job role and contribute fully. Findings indicate the ‘Supportive infrastructure’ to include systems, processes, policies, and practices that ensure fair, free and unbiased guidance, instructions, monitoring, measurement, corrective action, feedback, learning and development, and performance evaluation and fair remuneration is provided for all. Holistically, the participants expressed the need to enable employees to perform to the fullest potential and nurture and develop for performance enhancement, and rewarding for the same is expressed strongly by the participants. In doing so, employee consultation and feedback are emphasized as well in the findings. In support of the said findings, scholarly works point out that the removal of all obstacles is necessary to enable full participation and contribution (Roberson, 2006), as well as, everyone needs to be allowed to participate and contribute fully (Miller, 1998) to create and sustain Inclusion.
Thus, considering the role of Inclusion, firstly, the findings reveal that Inclusion mitigates/ eradicates age-based bias as Uniqueness and Belongingness are two features that bring feelings
102 16th SOUTH ASIAN MANAGEMENT FORUM (SAMF) 2021
of Inclusion to all individuals in all age groups. This result is also supported by previous studies(Brewer, 1991; Shore et al., 2011). Secondly, through a Conducive Climate and Supportive Infrastructure, Inclusion enables and ensures fair and non-discriminative policies, practices and procedures through a supportive organizational environment for performance and wellbeing. The literature supports this (Boehm et al., 2014; Cox, 1994; Ferdman & Davidson, 2002; Ferdman & Deane, 2013; Holvino et al., 2004; Miller, 1998; Roberson, 2006). Therefore, the findings confirm that Inclusion inversely impacts (moderating factor) the relationship between Bias, Age-prototype- Matching, Institutional Bias, Unfair Resource Allocation, Pandemic Older worker Layoff, and Age discrimination. The study also confirms that Inclusion taken as a whole has an inverse causal relationship with Age discrimination as it directly acts against/mitigates discrimination.
Theoretical Contribution
Limitations and Directions for Future Research
Managerial Implications
This study firstly contributes to the limited literature on Age Discrimination and Age inclusion. The study presents a second theoretical contribution, as it brings the individual factors ‘uniqueness’ and ‘belongingness’ as per the Optimal Distinct Theory (ODT), (Brewer, 1991) and the organizational factor ‘Conducive Climate’ supported by Diversity Climate (Cox, 1994) and Age Diversity Climate (Boehm et al., 2014), and ‘Supportive Infrastructure’ (Roberson, 2006; Miller, 1998) together to address Age inclusion successfully in an organizational context.
The researcher emphasizes that a longitudinal study would bring forth more valuable insights regarding the change of the variables with time and before/after impacts of the inclusive measures taken, factors which the study has not addressed due to time constraints. As age-based-work-related competencies are the root cause of age discrimination, the study recommends research on cross-mentoring on diverse age groups through a longitudinal study.
The study discusses three managerial implications in accordance with the findings. Firstly, given the increasing trend towards diversity in the workforce, awareness creation of expected behaviors and undesirable behaviors must be internalized from the beginning. Employees need to be sensitized to age-related issues. Organizations need to ensure that correct values are internalized and reinforced at the induction/orientation program level and subsequent programs. Taking care of the older employees during the pandemic and equipping them with skills to continue to work with technology-enabled modes from the safety of their homes is a priority. Organizations could benchmark the best practices of inclusive workplaces. Secondly, as the study highlights the lack of work-related competencies as the leading cause of Age discrimination (as each generation brings its own set of competencies), cross-mentoring is recommended to curb the same. Finally, a conducive organizational climate with supportive infrastructure that fosters performance and wellbeing is recommended, including infrastructure, systems, processes and procedures, and supporting policies and practices. It is noteworthy that technology is identified as a critical factor facilitating same as it levels differences providing a common unbiased, non-discriminative platform for all, especially in these pandemic-remote-working contexts.
10316th SOUTH ASIAN MANAGEMENT FORUM (SAMF) 2021
ConclusionThe study aimed to explore corporate factors producing Age discrimination and mitigation through Age inclusion, emphasizing the pandemic effect. The study was guided by an Interpretivist philosophy, following a qualitative inductive approach using interactive-in-depth-one-on-one interviews for data collection. Data analysis was carried out through Thematic Analysis following the steps prescribed by Braun and Clarke (2013). While the study contributes toward filling the identified void in the literature, the researcher also shares insights with practicing managers of private sector organizations mainly, catering to the pandemic times. The limitations and future explorations are briefed as well. Finally, this study emerges as a timely and worthwhile endeavor in the face of widespread Age discrimination, especially during the current pandemic, and the critical need for inclusive workplaces nurturing competitively advantageous age-diverse workforce.
References1. Abrams, D., Swift, H. J., & Drury, L. (2016). Old and unemployable? How age-based
stereotypes affect willingness to hire job candidates. Journal of Social Issues, 72(1), 105– 1212. Agovino, T. (2020). COVID-19 Deals a duel threat to older workers. SHRM.3. Ayalon, L., Chasteen, A., Tesch-Römer, C., & Wahl, H. W. (2021) Aging in Times of the
COVID-19 Pandemic: Avoiding Ageism and Fostering Intergenerational Solidarity, The Journals of Gerontology: Series B, 76(2), 49–52. https://doi.org/10.1093/geronb/gbaa051
4. Bachman, E. (2020). COVID-19 Layoff or Pretext for Age discrimination against older employees? Forbs.
5. Baily, C. (2009). Reverse intergenerational learning: A missed opportunity? Artificial Intelligence & Society, 23, 111-115.
6. Baran, M., & Kłos, M. (2014). Managing an intergenerational workforce as a factor of company competitiveness, Journal of International Studies, 7(1), 94-101.
7. Boehm, S. A., Kunze, F., & Bruch, H. (2014). Spotlight on age‐diversity climate: The impact of age‐inclusive HR practices on firm‐level outcomes. Personnel Psychology, 67(3), 667- 704.
8. Braun, V., & Clarke, V. (2013). Thematic analysis. In Encyclopedia of critical psychology (pp. 1947-1952). Springer. Brewer, M. B. (1991). The Social Self: On being the same and different at the same time. Personality and Social Psychology Bulletin, 17, 475-482.
9. Butler, R. N. (1969). Age-ism: Another form of bigotry. Gerontologist, 9(4), 243–246.10. Cleveland, J. N., & Shore, L. M. (1992). Self-and supervisory perspectives on age and work
attitudes and performance. Journal of Applied Psychology, 77(4), 469.11. Correll, J., Judd, C. M., Park, B., & Wittenbrink, B. (2010). Measuring prejudice, stereotypes,
and discrimination. In J.F. Dovidio, M. Hewstone, P. Glick & V.M. Esses (Eds.). The Sage Handbook of Prejudice, Stereotyping, and Discrimination. Sage.
12. Cox, T., Jr. (1994). Cultural diversity in organizations. Berrett-Koehler.13. Cox, T. H., & Nkomo, S. M. (1991). A race and gender-group analysis of the early
career experience of MBAs. Work and Occupations, 18(4), 431-446. https://doi.org/10.1177/0730888491018004004
14. Creswell, J. W., & Clarke, V. L. (2007). Designing and conducting mixed methods research Sage.
15. Denzin, N. K., & Lincoln, Y. S. (Eds.). (2011). The Sage handbook of qualitative research. Sage.
16. Dovidio, J. F., Brigham, J. C., Johnson, B. T., & Gaertner, S. L. (2010). Stereotyping, prejudice, and discrimination: Another look. In N. Macrae, C. Stangor & M. Hewstone (Eds.). Stereotypes
104 16th SOUTH ASIAN MANAGEMENT FORUM (SAMF) 2021
and Stereotyping. Guilford.17. Emden, C., Hancock, H., Schubert, S., & Darbyshire, P. (2001). A web of intrigue: The search
for quality in qualitative research. Nurse Education in Practice, 1(4), 204-211.18. Ferdman, B. M., & Davidson, M. N. (2002). Inclusion: What can I and my organization do
about it? The Industrial-Organizational Psychologist, 39(4), 80-85.19. Ferdman, B. M., & Deane, B. R. (2013). Inclusion at societal fault lines: Aboriginal Peoples of
Australia. Diversity at work: The practice of Inclusion, 520-545.20. Finkelstein, L. M., Truxillo, D. M., Fraccaroli, F., & Kanfer, R. (Eds.). (2015). Facing the
challenges of a multi-age workforce: A use-inspired approach. Routledge.21. Fisher, G. G., Truxillo, D. M., Finkelstein, L. M., & Wallace, L. E. (2017). Age discrimination:
Potential for adverse impact and differential prediction related to age. Human resource management review, 27(2), 316-327.
22. Fiske, S. T. (2000). Stereotyping, prejudice, and discrimination at the seam between the centuries: Evolution, culture, mind, and brain. European Journal of Social Psychology, 30, 299-322.
23. Fiske, S. T. (2004). Stereotyping, prejudice, and discrimination: Social biases. In S. T. Fiske (Ed.), Social beings: A core motives approach to social psychology (pp. 397 457). Wiley.
24. Gordon, P. A. (2018). Age diversity in the workplace. In Diversity and Inclusion in the global workplace (pp. 31-47). Macmillan.
25. Gursoy, D., Chi, C., & Karadag, E. (2013).Generational difference in work values and attitudes among frontline and service contact employees. International Journal of Hospitality Management, 32(1), 40-48.
26. Homegardner, T. (2020). Will The Current Pandemic Increase Age Discrimination In The Workplace? Retrieved from Forbs site https://www.forbes.com/sites/forbescoachescouncil/2020/06/02/will-the-current- pandemic-increase-age-discrimination-in-the-workplace/
27. Holvino, E., Ferdman, B. M., & Merrill-Sands, D. (2004). Creating and sustaining diversity and Inclusion in organizations: strategies and approaches. The psychology and management of workplace diversity, 245-276. Blackwell.
28. Jansen, W. S., Otten, S., van der Zee, K. I., & Jans, L. (2014). Inclusion: Conceptualization and measurement. European Journal of Social Psychology, 44(4), 370-385.
29. Kooji, D. T., & Zacher, H. (2016). Why and when do learning goal orientation and attitude decrease with age? The role of perceived remaining time and work centrality. Journal of Social Issues72 (1), 146–168.
30. Kupperschmidt, B. R. (2000). Multigeneration employees: strategies for effective management. The Health Care Manager, 19, 65–76.
31. Lancaster, L. C., & Stillman, D. (2002).When generations collide: Who they are, why they clash, how to solve the generational puzzle at work. HarperCollins.
32. Lawrence, B. S. (1990). At the crossroads: A multiple-level explanation of individual attainment. Organization Science, 1(1), 65-85.
33. Lincoln, Y. S., & Guba, E. G. (1986). But is it rigorous? Trustworthiness and authenticity in naturalistic evaluation. New directions for program evaluation, (30), 73-84. Mannheim, K. (1952). The problem of generations. Routledge.
34. Maurer, T. J., & Rafuse, N. E. (2001). Learning, not litigating: Managing employee development and avoiding claims of age discrimination. Academy of Management Perspectives, 15(4), 110-121.
10516th SOUTH ASIAN MANAGEMENT FORUM (SAMF) 2021
35. Meyer, J. W., & Rowan, B. (1977). Institutionalized organizations: Formal structure as myth and ceremony. American Journal of Sociology, 83(2), 340-363.
36. McConnachie, C. (2014). Human Dignity, ‘Unfair Discrimination’ and Guidance. Oxford Journal of Legal Studies. 34(3), 609–629.
37. Miller, F. A. (1998). Strategic culture change: The door to achieving high performance and Inclusion. Public Personnel Management, 27, 151-160.
38. Nelson, T. D. (2009). Ageism. In T. D. Nelson (Ed.), Handbook of prejudice, stereotyping, and discrimination: 431-440. Psychology Press.
39. North, M. S., & Fiske, S. T. (2013 a). A prescriptive intergenerational-tension ageism scale: succession, identity, and consumption (SIC). Psychological assessment, 25(3), 706.
40. North, M. S., & Fiske, S. T. (2013 b). Act your (old) age: Prescriptive, ageist biases over succession, consumption, and identity. Personality and Social Psychology Bulletin, 39(6), 720-734.
41. North, M. S., & Fiske, S. T. (2016). Resource Scarcity and Prescriptive Attitudes Generate Subtle, Intergenerational Older-Worker Exclusion. Journal of Social Issues, 72(1), 122– 145. https://doi.org/10.1111/JOSI.12159
42. Perry, E. L., Kulik, C. T., & Bourhis, A. C. (1996). Moderating effects of personal and contextual factors in age discrimination. Journal of Applied Psychology, 81, 628-647.
43. Perry, E. L. & Finkelstein, L. M. (1999). Toward a broader view of age discrimination in employment related decisions: a joint consideration of organizational factors and cognitive processes. Human Resource Management Review, 9, 21–49.
44. Roberson, Q. M. (2006). Disentangling the meanings of diversity and Inclusion in organizations. Group & Organization Management, 31(2), 212-236.
45. Saunders, M., Lewis, P., & Thornhill, A. (2009). Understanding research philosophy and approaches to theory development. In Research methods for business students (5th edn., p. 614). Pearson.
46. Shore, L. M., Cleveland, J. N., & Goldberg, C. B. (2003). Work attitudes and decisions as a function of manager age and employee age. Journal of applied psychology, 88(3), 529.
47. Shore, L. M., Randel, A. E., Chung, B. G., Dean, M. A., Ehrhart, K. H., & Singh, G. (2011). Inclusion and diversity in work groups: A review and model for future research. Journal of Management, 37(4), 1262-1289.
48. Tajfel, H. & Turner, J. C. (1985). The Social Identity Theory of Intergroup Behavior. In S. Worchel & W. G. Austin (Eds.), Psychology of Intergroup Relations (2nd ed., pp.7-24). Nelson-Hall.
49. Tracy, S. J. (2010). Qualitative quality: Eight “big-tent” criteria for excellent qualitative research. Qualitative inquiry, 16(10), 837-851.
50. Turner, J. C. (1987). Rediscovering the social group: A self-categorization theory. Basil Blackwell.
51. Zemke, R., Raines, C., & Filipczak, B. (2000). Generations at work: Managing the clash of veterans, boomers, Xers, and Nexters in your workplace. AMA Publications
106 16th SOUTH ASIAN MANAGEMENT FORUM (SAMF) 2021
16SAMF-030NEXUS AND MODERNIZATION OF TRANSFORMATIONAL LEADERSHIP, SOCIAL JUSTICE AND EMPLOYEES’ PSYCHE
CONCEPTS AND THE MODERNIZATION ERA IN THE MANUFACTURING INDUSTRY
Tarnima Warda Andalib1, Sushanto Chandra Sarker2, DilRowshan Zinnat Ara Nazneen3, Asaly Mosaffa41Assistant Professor, BRAC Business School, BRAC University2Assistant Professor, Rajdhani Mohila College3Professor, Dept of Political Science, University of Dhaka4Graduate Student, BRAC Business School, BRAC University
Leaders influence everyone’s regular personal and professional lives. In well and woe, leaders always remain strongly beside the people who treat their followers with justice, and the success of a business or industry relies mostly on how the leaders manage every situation with competence and farsightedness. Historical evidence blended with distinct experiences reveals that these assist with the methods and ways to develop the abilities demonstrated by respected leaders. In this paper, researchers have discussed the characteristics of the leaders in the manufacturing industry and the immediate requirements to be shifted towards modernization by providing the highest importance to the emergence of creativity, humanity, articulation, and vision. Moreover, employees’ psyche in connection to the leaders’ attributes is also revealed and discussed. Researchers have done a thorough content analysis with a systematic approach to receive the scholars’ viewpoints on this particular issue.
Abstract
Keywords: Transformational Leadership, Employees’ Psyche, well-being, Entrepreneurial Attitude, Modernization, Social Justice
Researchers have explored the potential leadership style and their roles and contributions to improve the employees’ psyche concepts, and their well-being to establish social justice (Posner, 2009; Jamal, 2004; Tribe, 2002a; Tribe, 2002b). The paper draws attention to the connection and linkages of transformational leadership with social justice and employees’ psyche concepts while modernizing the concept of leadership in the manufacturing industry of Bangladesh. The paper focuses on exploring the bridging functions and connectivity associated with this leadership style in this particular industry and argues how that positively impacts the employees’ psyche to motivate them, bring out their entrepreneurial attitude, and also to modernize those as per requirement (Nussbaum, 2010; Shergold, 2011).
Leadership has been one of the core topics in the last few decades because good leadership can drive and motivate entrepreneurial minds whereas bad leadership can destroy entrepreneurial minds and actions as well. History reveals the characteristics and the necessary needs of the leaders in business and management, health sectors, political grounds, educational institutions, sports, and communities, where dimensions are very different from each other (Andalib and Halim, 2019).Comprehending the significance of emergent creativity, and innovation in any humane organization
has led scholars and practitioners to explore, design, and develop this new kind of leadership.
Introduction:
Leadership Concepts and Modernization
10716th SOUTH ASIAN MANAGEMENT FORUM (SAMF) 2021
Every single alphabet of leadership stands for an individual meaning itself which completes the whole meaning of leadership too. L for Listen, E for Empower, A for Account for, D for Delegate, E for Encourage, R for Reward and Recognize, S for Specify, H for Help, I for Initiate and Involve, and P for Persuade. If we combine all the alphabetical meanings of “leadership”, these all make up a whole new concept of how a leader should be and what leaders are supposed to do. One of the most common stereotypes of a leader is a charismatic communicator with a crystal-clear vision. However, fostering the formation of innovative ideas is also a crucial aspect of leadership. Nature has taught us four things thus far. It’s better to create conditions for something to emerge than to prescribe a course of action. It’s a way of using your position of power to help others. Creativity plays a role in both types of leadership. To be a leader, you must have a clear vision and the courage to take risks no one else has taken. It also entails creating a safe environment in which members of the community can come together to generate new ideas. This means that the company must be willing to accept and consider new ideas and information as part of its culture for originality to arise within the business. In order to stimulate emergence, it is necessary to cultivate an environment of openness and honor curiosity and creativity. Uncertainty, dread, perplexity, or even consciousness may be felt during the vital turbulence that initiates the birth of new ideas. Experimenting leaders are aware that these emotions play a crucial role in the overall dynamics and work to foster mutually trusted cooperation in their organizations (Andalib et al, 2019).
It’s a common occurrence in the groups. Nature has an intense lesson for us to learn. The way to sustain life is to build and nurture community. With the help of the rest of the world’s communities, humans can live and grow in accordance with their natures. The concept of long-term viability does not presuppose that nothing will ever change. It’s not a static state, but rather a diversly process of co-evolution. Environmental principles can be understood as rules of community because resilience and groups are intimately linked. These ethics can be used to guide the creation and maintenance of long-term collaborative learning. These skills are essential if we are to stay a step ahead and deliver progressive change in our education. (Andalib and Abdul-Halim, 2020).
An intangible trait known as leadership can be difficult to define. The ability to tell if or not someone has “it” is a distinguishing characteristic. Some characteristics can be linked with signals of becoming a leader even though it is hard to identify. Ibsen says ‘Awaken, when we are dead’. Human beings are awakened by their own emotions. Human souls and minds drive them towards a goal in life, that arises from deep inside the heart. Nevertheless, this feeling is awakened by that change coming from the source of entrepreneurial minds and innovations and perspectives as well. Except feeling for thyself or others, anyone cannot be the same. This difference of feeling also awakens the leadership phase of human beings.
It’s important to believe that anything you do is good for you and good for the individuals around you. It has been suggested that authors start with the context, aims, drivers, and vital elements of leadership transition in order to provide insight into what’s currently being done or the business. To explain, comprehend, forecast, and manage are 4 of the most common purposes of academics in general. Any system or organizational innovation can be stymied when employees are absent from the necessary conceptual zone. Gaining information concerning leadership, as well as being able to use it in one’s career or a hospice is the goal of this course. We must believe in ourselves, or even have faith in our leaders, and then have a level of empathy with our coworkers’ feelings. One of the most important leadership skills is the ability to inspire others. A leader is someone who motivates, directs others, chooses effective feedback routes, and resolves issues in a team environment.
108 16th SOUTH ASIAN MANAGEMENT FORUM (SAMF) 2021
One or two changes may be tolerated, but if there are plenty, people become overwhelmed. In order to evaluate building better power, we might use the role of the social structure. Power difficulties cannot be understood or managed unless a proper leadership competency is present. “A leader is a dealer in hope,” Napoleon Bonaparte once stated.
A leader provides a strategic vision that can be implemented by a group. A leader provides the people with a goal to aspire for. As a leader, you must be willing to speak up for what you believe in. To be a good leader, one must be steadfast in one’s efforts and deeds. A group’s devotion to the leader will be unwavering if the leader can inspire confidence and a sense of dependability among the group members. The group notices the leaders’ efficiency, integrity, timeliness, and strong and humanitarian acts. According to an old saying, leaders aren’t created, but rather are given birth to. Being a leader needs a lot of guts. Leaders aren’t available to everyone. Some folks prefer to go along for the trip, and that’s all right with us. Some officials can develop into effective managers, but they may lack the ability to lead. People would like to do excellent work by nature. They are driven by a desire to be successful and to bring joy to those around them. Leadership requires that you allow others to succeed. To empower others, the leader is not completing the work for the individuals who watch him or her, but rather providing with appropriate tools for success. Group empowerment is fostered by the leaders’ inspiration, motivation, and encouragement. “Pessimism” is a phrase that no one wants to be associated with. Even while a leader does not have to be a rainbow-and-sunshine kind of guy, it is important to maintain a positive attitude even when the going gets rough. Even in the most difficult of circumstances, a leader must have the ability to remain self-driven, if he or she must also be able to inspire others. (Andalib, 2018).
Transformational Leadership: “transformational leadership” was coined by Burns (1978) who drew attention to a leadership style that broadened and elevated the interests of employees and inspired them to go beyond what was expected. The prevailing leadership model of the time was transactional: employees worked to fulfill the organization’s goals and were rewarded when they performed well. Likewise, when they did not meet expectations, they were penalized. Transformational leaders, according to Burns (1978), possess personal characteristics that are integrated with their moral fiber and exhibit behaviors to effect better performance
Leading the Change: The words “I have a dream” by Dr. Martin Luther King, Jr. were more powerful than any plan he might have had. Only a great desire for change may be fueled by passion. Feelings may spread like wildfire. While one of the people in the vicinity is down, this could affect the other individual. In the same way, a person’s love for a subject can inspire others. As a result, if a leader sets an example and inspires everybody else to follow, positive change happens on its own. It indicates that raising awareness has the potential to affect a wide range of outcomes. In other words, every person has a unique perspective of independence, which enables them the confidence, zeal, and inclination to act on it. This ability is within each one of us. Individuals, on the other hand, activate their inner strength to grow and reach their predetermined goals. Final thoughts: restoring life to companies through the empowerment of their workgroups not only enriches adaptability, innovation, and understanding potential but also elevates the honor and morality of the people within those organizations by allowing them to interact with those attributes that already exist within themselves. Self-awareness and consciousness empower the individual. People feel encouraged in the pursuit of their purposes, and they don’t have to surrender their dignity or personality to satisfy the goals of a company, life, and themselves...”(Andalib et al, 2013).
Leading the Change
10916th SOUTH ASIAN MANAGEMENT FORUM (SAMF) 2021
from subordinates. They appeal to those employees seeking higher order needs such as self-actualization and self-development, as opposed to meeting some external performance criteria (Den Hartog, Van Muijen, & Koopman, 1997).
Employees’ Psyche and happiness at work: The relationship between the work value, frustration, and satisfaction depends on various factors. Such as, extrinsic and intrinsic work value has vice versa impact on psychological needs and satisfactions(Schreurs et al., 2014; Vansteenkiste et al., 2007)
According to Hater and Bass (1988, p. 695), “the dynamics of transformational leadership involve strong personal identification with the leader, joining in a shared vision of the future, or going beyond the self-interest exchange of rewards for compliance”. Most of the research on transformational leadership to date has been developed within psychology, business management, and organizational studies and case studies are generally focused on management positions in the corporate business environment. Applications in higher education are also present within the literature, although the very different influences playing out on higher education in different jurisdictions, the different motivations that academics exhibit in their work, and levels of academic freedom exercised to make it difficult to draw insights from this limited literature (Ramsden, 1998). That said, it is well recognized that academics are motivated by a range of intrinsic rewards— 132 peer recognition, self-actualization, and personal achievement—and that the imposition of reward structures, especially those that undermine such things as academic freedom, can negatively impact upon an individual academic’s intrinsic motivations (Ginsberg, 2011).
Transformational leadership describes the process where the leaders bring out all the positive and potential from the followers by inspiring, putting visions by arousing their self-interest to achieve the goals(Avolia, Waldman, &Yammarino, 1991). Transformational leadership is the process of exchange of valued commodities where the leaders seek the success of the followers and the entire community to a higher level similarly with a higher level of vision and values (Bass, 1985). At the end of the process, the leader remains the leader and the follower remains the follower but as a result of the process, they mutually benefit from having the ethics, values, and commodities shared (McCloskey, 2015). Transformational leadership results in positive relationships and outcomes among the leaders and followers and the workplace too (Krishnan&Venkat, 2005)
Employee’ Psyche & Frustration at work: Psyche at work is affected by several terms of things such as political and social contrast of the organization, bosses, rival companies, norms and practices in the organizations, etc. (Johns, 1993). Employment relationship with the employee at the workplace is examined (Barling, 1999) which is related to satisfaction and the frustrations at work, regarding the aspects of violation, stress, and burnout (Tetrick& Barling, 1995). If the psyche doesn’t match with the employee, then frustration grows gradually. Thus, work frustration is simply a goal blocker with lots of complex combinations with the psychology of the employee (González‐Gómez, Hudson&Rychalski, 2021).
Social Justice: Social justice is another subcategory of justice, which provides acknowledgments to remove the obstacle to do so what a social individual wants as civic and as their human rights, access, equity, and participation (Bartley, 2021). Employees’ Rights from Labour Acts Protocols must be incorporated to get the insights into employees’ well-being as an organization’s well-being and social justice (Andalib and Darun, 2018; Andalib, 2018; Andalib et al, 2019; Andalib and Halim, 2019)
110 16th SOUTH ASIAN MANAGEMENT FORUM (SAMF) 2021
Again, PNS and PNF indicate the relation between work value with illness and wellness indicators at the workplace regarding satisfaction.
Modernization of Manufacturing HRM: Recently in the organizations, the Human Resources are becoming an essential part of any operational acts and manufacturing(Boudreau et al., 2003; Cook et al., 2002; Juran and Schruben, 2004; Wirojanagud et al., 2007; Yee et al., 2008). Recognizing and evolving this resource has become very important while playing a vital role in both operational management and decision-making in the manufacturing industries (e.g. Heizer and Render, 2007; Wild, 1995). An Integrated HRM framework bringing the necessary factors and perspectives under the same platform can lead to modernization as well where leadership must be given high priority as well. Furthermore, the career enhancement scenario of an employee is flourished and is taken to the heights of an entrepreneurial manner when leaders nurture the employees to that extent (Andalib et al, 2019; Andalib and Darun, 2016; Andalib and Abdul-Halim, 2020; Andalib et al, 2021; Andalib et al, 2013; Andalib et al, 2014)
Researchers have applied the qualitative approach to deal with each factor separately and to find data regarding each factor distinctly, by following Miles and Huberman (2011), thorough content analysis has been done.
Research Methodology and Analysis
Table 1: Factor Analysis of the Manufacturing Companies of Bangladesh
Factors Transformational Leadership contains
In the Manufacturing companies of Bangladesh
Awakening +strongly aligned Aligning
Beliefs or Understanding +hybrid Aligning
Leading power +hybrid Aligning
Visionary +strongly aligned Aligning
Reliable +strongly aligned Existing
Audacity +weakly aligned Existing
Empowering People +strongly aligned Aligning
Positive +hybrid Existing
Motivating & Communi-cating
+strongly aligned Aligning
11116th SOUTH ASIAN MANAGEMENT FORUM (SAMF) 2021
Figure 1: Transformational Leadership towards Modernization
ConclusionIn summing up, the role of transformational leadership has been crucial as far as the issues of ensuring justice within the organization and the psychological well-being of the employees are concerned. A leader being enriched with the very qualities of transformational leadership can develop a feeling of collectiveness among people in achieving organizational goals. This sense of collective interest promotes the employees to think more about the organizational success which contributes to developing their innovative skills. The contribution of the present study is that it has identified how the visionary and innovative skill of a transformational leader can develop a work-friendly atmosphere within the organization by evaluating the contributions of the employees and what they deserve which ultimately cause a positive psychological impact on the enthusiasm and innovative skill of the employees. This is a vital issue as far as the development of HRM is concerned and therefore, more study has to be conducted about how to develop the qualities of transformational leadership among the managers within the organizations.
References1. Andalib, TarnimaWarda and Darun, Mohd. Ridzuan. 2018, An HRM Framework for
Manufacturing Companies of Bangladesh Mapping Employee Rights’ Protocols and Grievance Management System, Indian Journal of Science and Technology, 11, 17
2. Andalib, TarnimaWarda; DarunMohdRidzuan and Azizan, Noor Azlinna, 2019, East Asian Trends of Human Resources Management: Theories and Practices, International Journal of Human Resources Development and Management, 19,2
3. Andalib, TarnimaWarda, 2018, A study on convergence of international employee rights within human resources management practices in Bangladesh. Ph.D. thesis, Universiti Malaysia Pahang.
4. Andalib, TarnimaWarda, and Halim, Hasliza Abdul, 2019, Convergence of Conceptual Innovation Model to Reduce Challenges Faced by the Small and Medium-Sized Enterprises (SMEs) in Bangladesh, Journal of Open Innovation: Technology, Market and Complexity 5 (3), 63
5. Andalib, TarnimaWarda, Azizan, Noor Azlinna and Halim, Hasliza Abdul, 2019, Case Matrices
112 16th SOUTH ASIAN MANAGEMENT FORUM (SAMF) 2021
and Connections of Entrepreneurial Career Management Module, International Journal of Entrepreneurship, 23 (3), 10
6. Andalib, TarnimaWarda, Azizan and Halim-Abdul, Hasliza, 2019, Entrepreneurial Approach to Career Enhancement Model for the Small and Medium Enterprises (SMEs’) of Bangladesh, International Journal of Business Society, 3 (10), 1-7
7. Andalib, TarnimaWarda&Darun, MohdRidzuan, 2016, Identified Determinants of the Conceptual HRM Framework, The National Conference for Postgraduate Research (NCON-PGR 2016), 939-942
8. Andalib, TW, Azizan, NA, Abdul-Halim, H, 2020, Leading Determinants for Sustainability of SMEs in Bangladesh: Multiple Case Studies, International Journal of Supply Chain Management 9 (2), 175-181
9. Andalib, TW, Darun, MR, Azizan, NA, Nazneen, DRZA, 2021, Leveraging Employees’ well-being and Organisation Behavioral attributes within its HRM Practices: Asia versus Europe, Social Change 10 (1), 01-18
10. Andalib, T. W., Darun, M. R. &Azizan, N. A. 2014. A process of developing an HRM framework based on qualitative study in Technology companies in Bangladesh and Malaysia, International Journal of Research in Business and Social Science, (2147-4478), 2014, 3, 2, 148-163
11. Andalib, T. W., Darun, M. R. &Azizan, N. A. 2013, Frustration of employees: Reasons, dimensions and resolving techniques, WCIK E-Journal of Integration Knowledge, In: Proceeding of the World Conference on Integration of Knowledge (WCIK 2013), Langkawi, Kedah, 25-26 November, 1 (11), 15-25.
12. Avolio, Bruce, Waldman, David, &Yammarino, Francis (1991). Leading in the 1990s: The Four I’s of Transformational Leadership. Journal of European Industrial Training, 15, (4), 9-16.
13. Bass, B. M. (1985). Leadership and performance beyond expectations. Collier Macmillan.14. Dredge, D., Wray, M. (2012. June). Exploring the boundary spanning leadership of
‘pracademics’: The teaching-research-service nexus in sustainable tourism. In Schott, C. and Fesenmaier M. (Ed.) Proceedings of the Tourism Education Future Institute 6th Meeting. (p. 123-141). Milan, Italy: Tourism Education Futures
15. McCloskey, M. W. (2015). What is transformational leadership? People Bethel Education [Accessed: March 10, 2016] Available at: http://people. bethel. edu/pferris/otcommon/TransformationalLeadership. pdf.
16. Krishnan, Venkat R. “Transformational leadership and outcomes: Role of relationship duration.” Leadership & Organization Development Journal (2005).
17. Bartley, S. (2021, August 19). What Social Justice Means: Definition & Examples. Grounded. https://grounded.world/2021/08/19/what-social-justice-means/
18. Schreurs, B., van Emmerik, I. H., Van den Broeck, A., & Guenter, H. (2014). Work values and work engagement within teams: The mediating role of need satisfaction. Group Dynamics: Theory, Research, and Practice, 18(4), 267-281. https://doi.org/10.1037/gdn0000009.
19. Vansteenkiste, M., Neyrinck, B., Niemiec, C. P., Soenens, B., Witte, H., &Broeck, A. (2007). On the relations among work value orientations, psychological need satisfaction and job outcomes: A selfdetermination theory approach. Journal of Occupational and Organizational Psychology, 80(2), 251-277. https://doi.org/10.1348/096317906X111024
20. Boudreau, J., Hopp, W., McLain, J. O. and Thomas, L. J. (2003) On the interface between operations management and human resources management. Manufacturing & Service Operations Management, v5(3): 179-202

11316th SOUTH ASIAN MANAGEMENT FORUM (SAMF) 2021
21. Cook, L. S., Bowen, D. E., Chase, R. B., Dasu, S., Stewart, D. M. and Tansik, D. A. (2002) Human issues in service design. Journal of Operations Management, v20(2): 159-174
22. Juran, D. C., and Schruben, L. W. (2004) Using worker personality and demographic information to improve system performance prediction. Journal of Operations Management, v22(355-367
23. Wirojanagud, P., Gel, E. S., Fowler, J. W. and Cardy, R. (2007) Modelling inherent worker differences for workforce planning. International journal of production research, v45(3): 525-553
24. Yee, R. W. Y., Yeung, A. C. L. and Cheng, T. C. E. (2008) The impact of employee satisfaction on quality and profitability in high-contact service industries. Journal of Operations Management, v26(5): 651-668
25. Wild, R. (1995) Production and Operations Management: Text and Cases. 5th ed., Cassell, London. 0-304-33077-9
26. Heizer, J. and Render, B. (2007) Operations Management, Prentice-Hall, London. 978- 0138128784
114 16th SOUTH ASIAN MANAGEMENT FORUM (SAMF) 2021
Ramini Singh*Research Scholar, Visvesvaraya Technological University (Belgaum)Dr. Shaji Kurian, Professor- HR, IFIM Business School, Bangalore
COVID-19 in the year 2020 brought several unforeseen challenges with one challenge being lockdown and normal life coming to a halt. Organizations adopted different employee-friendly HR practices to enable employees to work online or offline during the pandemic. The present study examines whether similar HRPs were implemented by organizations in Indian IT and non-IT sectors. For the study, a survey was conducted among 211 employees to check their satisfaction with the implementation of these practices. The data were analyzed by confirmatory factor analysis (CFA) and t-test. Results suggested that IT and non-IT sector organizations implemented a similar set of practices during COVID-19 despite the sectoral differences.
Keywords – HR practices, IT sector, non-IT sector, pandemic, India
Abstract
The beginning of the year 2020 brought the onset of the deadly COVID-19 pandemic in India. Apart from the loss of life, the pandemic also brought lockdowns and a huge loss of jobs (Tejaswi, M., 2020, April 30) in India. The lockdown and social distancing norms imposed due to the COVID-19 pandemic forced most companies to enable their employees to work remotely. To make remote working efficient, organizations came up with human resource practices (HRPs) (Deccan Herald, 2020, April 12,) to engage employees and enhance their productivity (Harter et al., 2002). These HRPs were designed to result in a positive work-related psychological state (Albrecht, 2010). Many programs, related to employee well-being (The Economic Times, 2020 September 1), were started to handle the stress and anxiety resulting from the pandemic. For learning in core technical areas, e-learning, training programs, and bridge course were organized. Reward and recognition programs were updated by giving points, virtual appreciation messages, or increments in base pay in recognition of employees’ extraordinary continuity of service efforts (Mint,2020, March 27).
The loss of social interaction was addressed by providing virtual coffee breaks or tea sessions where employees were able to interact, play team games or simply share their experiences related to the pandemic. Flexible working hours for onsite or offsite employees were introduced by keeping in mind the safety of employees. The safety of onsite employees was ensured by providing N95 respirators, surgical masks, gloves, PPE kits, sanitizer dispensers, fumigation of transport services, deep cleaning of workstations, and regular temperature screenings. The employees who were working remotely were provided desktops, broadband packages, and advanced software support. Due to streamlining of HRPs in organizations, it also became important to assess employee satisfaction with HRPs and whether it is meeting employee expectations and needs, which in turn will motivate employees to contribute to the organization’s success (Liu et al., 2017; Deery et al.,2017; Nishii & Wright, 2008; Van Beurden et al.,2021). Despite the assessment of HRPs being significant for organizations, not much research has been done in the past on the same (Liu et al., 2017). With this study, the researcher intends to build upon these studies and aims to identify
Introduction:
HR PRACTICES DURING COVID-19 PANDEMIC: A STUDY OF INDIAN IT AND NON-IT SECTORConcepts and the Modern-
ization Era in the Manufacturing Industry
11516th SOUTH ASIAN MANAGEMENT FORUM (SAMF) 2021
employees’ satisfaction with the HRPs at their workplace during pandemic times. For this study, the employees working in the IT and non-IT sectors of India were surveyed. The IT sector is one of the most important and fastest-growing sectors (NASSCOM, 2018) with 4.5 million employees and an 8 percent contribution to the country’s gross domestic product (IBEF, 2021). According to Gellatly et.al (2019), organizations in the IT sector invest heavily in their human resources. In addition to IT sectors, non-IT sectors in India have also played an important role in the growth and development of the nation. These sectors comprise agriculture, manufacturing, service, healthcare, education, banking sectors, and public sector units (PSUs).
In contrast to olden times, organizations in these sectors have formulated policies and practices to increase the productivity of their employees (Akinbode, 2011; Ayanda & Sani, 2011; Becker &Huselid, 1998; Kim, 2010). According to Budhwar and Boyne (2004), the HRPs of these sectors were considered at par with those in the IT sectors. Based on the background study, the objective of this paper is to find whether the same HRPs were implemented in the IT and non-IT sectors.
HRPs in any organization play an important role in creating a conducive environment that augments the motivation, morale, and job satisfaction of employees (Mallick E. et al., 2015). And by implementing these HRPs, organizations intended to convey that they care for their employees in these turbulent times by providing resources needed to do jobs, recognizing their efforts, and equipping them with training for their career development (Robison, 2009). It was also important for organizations to get employees’ feedback on the same. With this objective, the paper intends to identify the implementation level of HRPs in IT and non-IT sectors. In the past, none of the studies have compared HR practices in the IT and non-IT sectors of India.
Although, a study by Budhwar and Boyne in 2004 suggested that HRPs are similar in Indian private and public sectors in terms of the structure of their HR department, recruitment and selection, pay and benefits, training and development, and employee relations, and key HRM strategies. On the other side, this study also suggested that several HRPs in the private sector related to compensation, training, and development tend to differ from public sector organizations in terms of their rational approach. Based on contrary arguments given by Budhwar and Boyne and the difference in the work culture of public and private sectors, it has been hypothesized that HRPs implemented during COVID-19 were different in IT and non-IT sectors in India.H1: There is a significant difference in satisfaction with HRPs implemented during COVID-19 in
IT and non-IT sectors.
Further, for this study, implemented HRPs were divided into three categories: communication and well-being practices (CW), benefits and incentive practices (BI), and practices that showed organizational support (OS). The CW category covered practices related to informal meetings with peer groups, counseling and entertainment sessions, career development and
Theoretical Background and Hypotheses
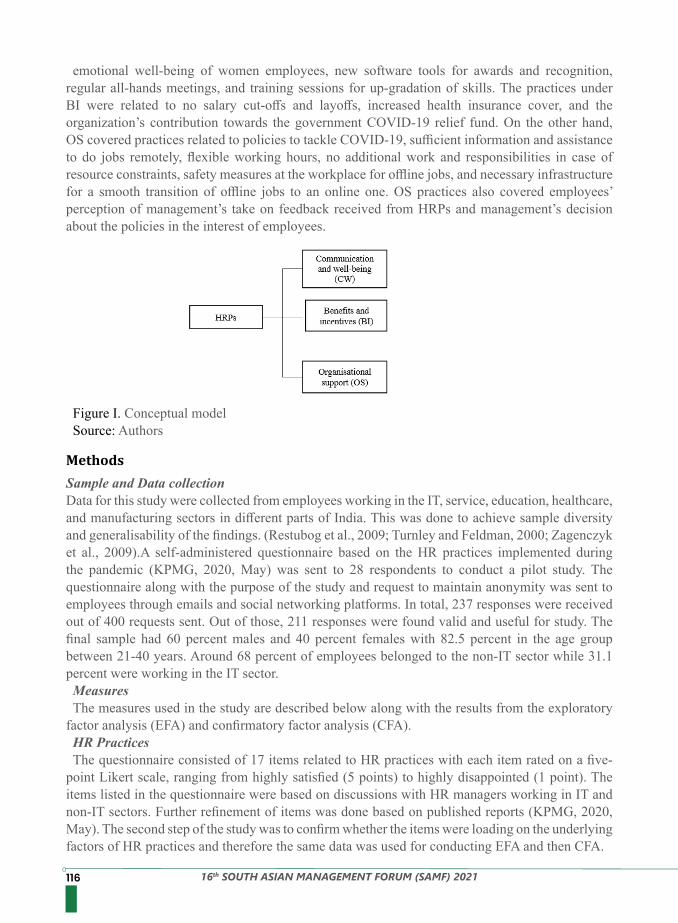
116 16th SOUTH ASIAN MANAGEMENT FORUM (SAMF) 2021
emotional well-being of women employees, new software tools for awards and recognition, regular all-hands meetings, and training sessions for up-gradation of skills. The practices under BI were related to no salary cut-offs and layoffs, increased health insurance cover, and the organization’s contribution towards the government COVID-19 relief fund. On the other hand, OS covered practices related to policies to tackle COVID-19, sufficient information and assistance to do jobs remotely, flexible working hours, no additional work and responsibilities in case of resource constraints, safety measures at the workplace for offline jobs, and necessary infrastructure for a smooth transition of offline jobs to an online one. OS practices also covered employees’ perception of management’s take on feedback received from HRPs and management’s decision about the policies in the interest of employees.
Figure I. Conceptual modelSource: Authors
Sample and Data collectionData for this study were collected from employees working in the IT, service, education, healthcare, and manufacturing sectors in different parts of India. This was done to achieve sample diversity and generalisability of the findings. (Restubog et al., 2009; Turnley and Feldman, 2000; Zagenczyk et al., 2009).A self-administered questionnaire based on the HR practices implemented during the pandemic (KPMG, 2020, May) was sent to 28 respondents to conduct a pilot study. The questionnaire along with the purpose of the study and request to maintain anonymity was sent to employees through emails and social networking platforms. In total, 237 responses were received out of 400 requests sent. Out of those, 211 responses were found valid and useful for study. The final sample had 60 percent males and 40 percent females with 82.5 percent in the age group between 21-40 years. Around 68 percent of employees belonged to the non-IT sector while 31.1 percent were working in the IT sector.MeasuresThe measures used in the study are described below along with the results from the exploratory
factor analysis (EFA) and confirmatory factor analysis (CFA).HR PracticesThe questionnaire consisted of 17 items related to HR practices with each item rated on a five-
point Likert scale, ranging from highly satisfied (5 points) to highly disappointed (1 point). The items listed in the questionnaire were based on discussions with HR managers working in IT and non-IT sectors. Further refinement of items was done based on published reports (KPMG, 2020, May). The second step of the study was to confirm whether the items were loading on the underlying factors of HR practices and therefore the same data was used for conducting EFA and then CFA.
Methods
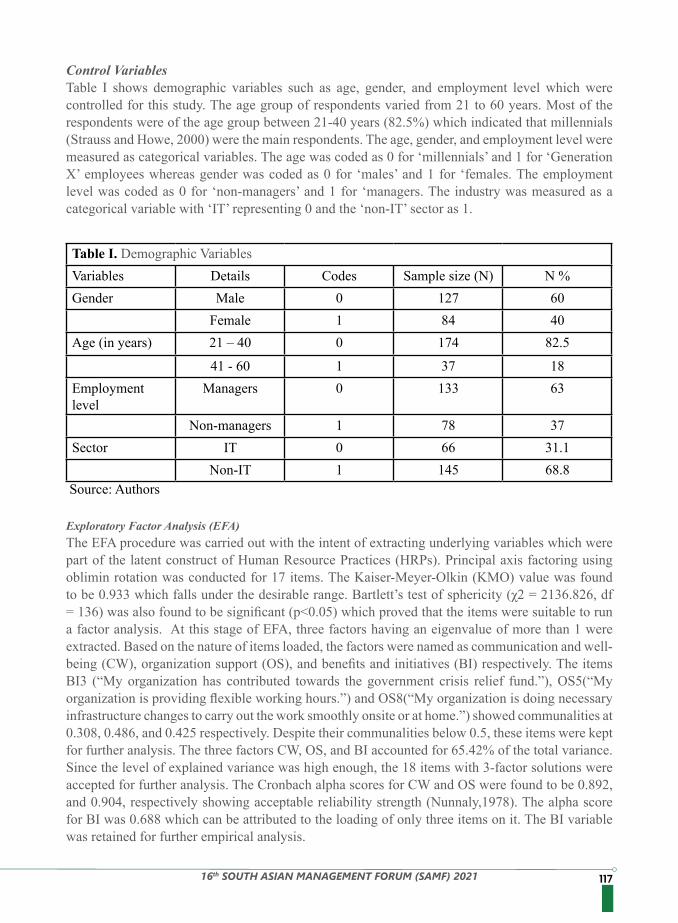
11716th SOUTH ASIAN MANAGEMENT FORUM (SAMF) 2021
Control VariablesTable I shows demographic variables such as age, gender, and employment level which were controlled for this study. The age group of respondents varied from 21 to 60 years. Most of the respondents were of the age group between 21-40 years (82.5%) which indicated that millennials (Strauss and Howe, 2000) were the main respondents. The age, gender, and employment level were measured as categorical variables. The age was coded as 0 for ‘millennials’ and 1 for ‘Generation X’ employees whereas gender was coded as 0 for ‘males’ and 1 for ‘females. The employment level was coded as 0 for ‘non-managers’ and 1 for ‘managers. The industry was measured as a categorical variable with ‘IT’ representing 0 and the ‘non-IT’ sector as 1.
Exploratory Factor Analysis (EFA)The EFA procedure was carried out with the intent of extracting underlying variables which were part of the latent construct of Human Resource Practices (HRPs). Principal axis factoring using oblimin rotation was conducted for 17 items. The Kaiser-Meyer-Olkin (KMO) value was found to be 0.933 which falls under the desirable range. Bartlett’s test of sphericity (χ2 = 2136.826, df = 136) was also found to be significant (p<0.05) which proved that the items were suitable to run a factor analysis. At this stage of EFA, three factors having an eigenvalue of more than 1 were extracted. Based on the nature of items loaded, the factors were named as communication and well-being (CW), organization support (OS), and benefits and initiatives (BI) respectively. The items BI3 (“My organization has contributed towards the government crisis relief fund.”), OS5(“My organization is providing flexible working hours.”) and OS8(“My organization is doing necessary infrastructure changes to carry out the work smoothly onsite or at home.”) showed communalities at 0.308, 0.486, and 0.425 respectively. Despite their communalities below 0.5, these items were kept for further analysis. The three factors CW, OS, and BI accounted for 65.42% of the total variance. Since the level of explained variance was high enough, the 18 items with 3-factor solutions were accepted for further analysis. The Cronbach alpha scores for CW and OS were found to be 0.892, and 0.904, respectively showing acceptable reliability strength (Nunnaly,1978). The alpha score for BI was 0.688 which can be attributed to the loading of only three items on it. The BI variable was retained for further empirical analysis.
Table I. Demographic VariablesVariables Details Codes Sample size (N) N %Gender Male 0 127 60 Female 1 84 40 Age (in years) 21 – 40 0 174 82.5
41 - 60 1 37 18 Employment level
Managers 0 133 63
Non-managers 1 78 37 Sector IT 0 66 31.1 Non-IT 1 145 68.8
Source: Authors
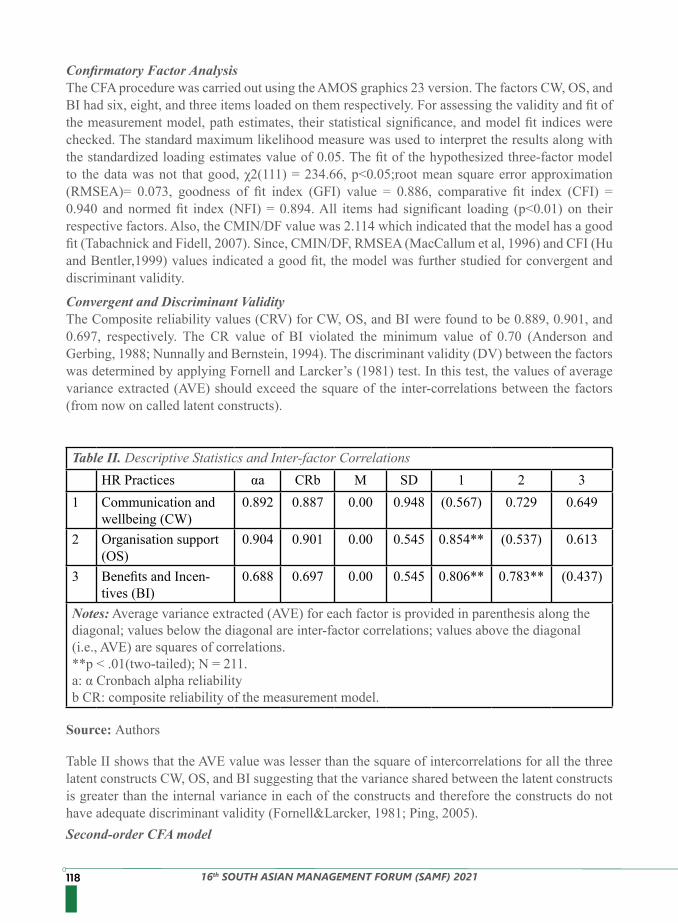
118 16th SOUTH ASIAN MANAGEMENT FORUM (SAMF) 2021
Table II shows that the AVE value was lesser than the square of intercorrelations for all the three latent constructs CW, OS, and BI suggesting that the variance shared between the latent constructs is greater than the internal variance in each of the constructs and therefore the constructs do not have adequate discriminant validity (Fornell&Larcker, 1981; Ping, 2005).Second-order CFA model
Confirmatory Factor AnalysisThe CFA procedure was carried out using the AMOS graphics 23 version. The factors CW, OS, and BI had six, eight, and three items loaded on them respectively. For assessing the validity and fit of the measurement model, path estimates, their statistical significance, and model fit indices were checked. The standard maximum likelihood measure was used to interpret the results along with the standardized loading estimates value of 0.05. The fit of the hypothesized three-factor model to the data was not that good, χ2(111) = 234.66, p<0.05;root mean square error approximation (RMSEA)= 0.073, goodness of fit index (GFI) value = 0.886, comparative fit index (CFI) = 0.940 and normed fit index (NFI) = 0.894. All items had significant loading (p<0.01) on their respective factors. Also, the CMIN/DF value was 2.114 which indicated that the model has a good fit (Tabachnick and Fidell, 2007). Since, CMIN/DF, RMSEA (MacCallum et al, 1996) and CFI (Hu and Bentler,1999) values indicated a good fit, the model was further studied for convergent and discriminant validity.
Convergent and Discriminant ValidityThe Composite reliability values (CRV) for CW, OS, and BI were found to be 0.889, 0.901, and 0.697, respectively. The CR value of BI violated the minimum value of 0.70 (Anderson and Gerbing, 1988; Nunnally and Bernstein, 1994). The discriminant validity (DV) between the factors was determined by applying Fornell and Larcker’s (1981) test. In this test, the values of average variance extracted (AVE) should exceed the square of the inter-correlations between the factors (from now on called latent constructs).
Table II. Descriptive Statistics and Inter-factor CorrelationsHR Practices αa CRb M SD 1 2 3
1 Communication and wellbeing (CW)
0.892 0.887 0.00 0.948 (0.567) 0.729 0.649
2 Organisation support (OS)
0.904 0.901 0.00 0.545 0.854** (0.537) 0.613
3 Benefits and Incen-tives (BI)
0.688 0.697 0.00 0.545 0.806** 0.783** (0.437)
Notes: Average variance extracted (AVE) for each factor is provided in parenthesis along the diagonal; values below the diagonal are inter-factor correlations; values above the diagonal (i.e., AVE) are squares of correlations.**p < .01(two-tailed); N = 211.a: α Cronbach alpha reliabilityb CR: composite reliability of the measurement model.
Source: Authors
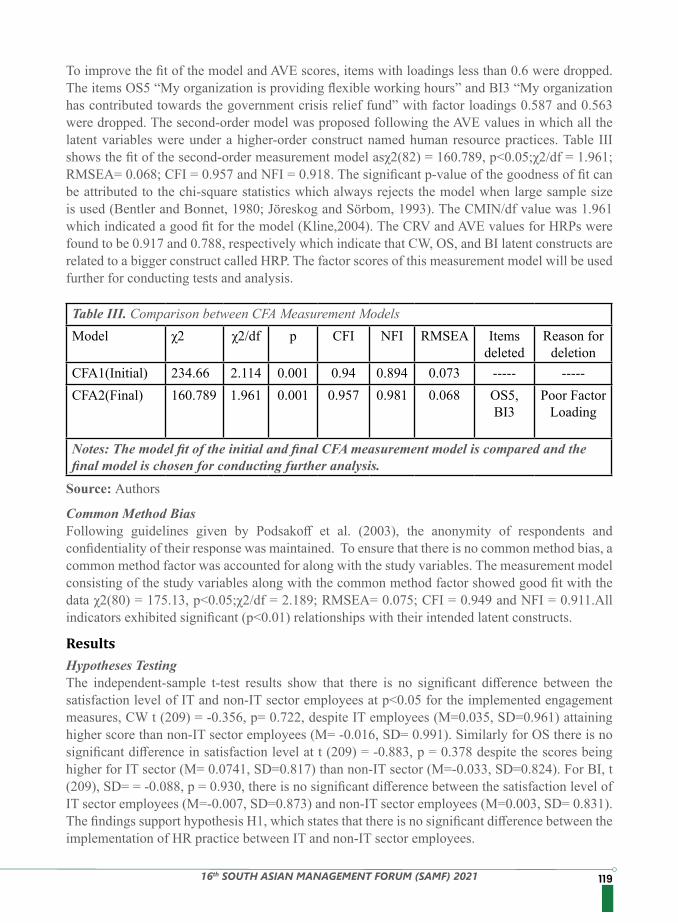
11916th SOUTH ASIAN MANAGEMENT FORUM (SAMF) 2021
To improve the fit of the model and AVE scores, items with loadings less than 0.6 were dropped. The items OS5 “My organization is providing flexible working hours” and BI3 “My organization has contributed towards the government crisis relief fund” with factor loadings 0.587 and 0.563 were dropped. The second-order model was proposed following the AVE values in which all the latent variables were under a higher-order construct named human resource practices. Table III shows the fit of the second-order measurement model asχ2(82) = 160.789, p<0.05;χ2/df = 1.961; RMSEA= 0.068; CFI = 0.957 and NFI = 0.918. The significant p-value of the goodness of fit can be attributed to the chi-square statistics which always rejects the model when large sample size is used (Bentler and Bonnet, 1980; Jöreskog and Sörbom, 1993). The CMIN/df value was 1.961 which indicated a good fit for the model (Kline,2004). The CRV and AVE values for HRPs were found to be 0.917 and 0.788, respectively which indicate that CW, OS, and BI latent constructs are related to a bigger construct called HRP. The factor scores of this measurement model will be used further for conducting tests and analysis.
Table III. Comparison between CFA Measurement ModelsModel χ2 χ2/df p CFI NFI RMSEA Items
deletedReason for
deletionCFA1(Initial) 234.66 2.114 0.001 0.94 0.894 0.073 ----- -----CFA2(Final) 160.789 1.961 0.001 0.957 0.981 0.068 OS5,
BI3Poor Factor
Loading
Notes: The model fit of the initial and final CFA measurement model is compared and the final model is chosen for conducting further analysis.
Source: Authors
Common Method BiasFollowing guidelines given by Podsakoff et al. (2003), the anonymity of respondents and confidentiality of their response was maintained. To ensure that there is no common method bias, a common method factor was accounted for along with the study variables. The measurement model consisting of the study variables along with the common method factor showed good fit with the data χ2(80) = 175.13, p<0.05;χ2/df = 2.189; RMSEA= 0.075; CFI = 0.949 and NFI = 0.911.All indicators exhibited significant (p<0.01) relationships with their intended latent constructs.
Hypotheses TestingThe independent-sample t-test results show that there is no significant difference between the satisfaction level of IT and non-IT sector employees at p<0.05 for the implemented engagement measures, CW t (209) = -0.356, p= 0.722, despite IT employees (M=0.035, SD=0.961) attaining higher score than non-IT sector employees (M= -0.016, SD= 0.991). Similarly for OS there is no significant difference in satisfaction level at t (209) = -0.883, p = 0.378 despite the scores being higher for IT sector (M= 0.0741, SD=0.817) than non-IT sector (M=-0.033, SD=0.824). For BI, t (209), SD= = -0.088, p = 0.930, there is no significant difference between the satisfaction level of IT sector employees (M=-0.007, SD=0.873) and non-IT sector employees (M=0.003, SD= 0.831). The findings support hypothesis H1, which states that there is no significant difference between the implementation of HR practice between IT and non-IT sector employees.
Results
120 16th SOUTH ASIAN MANAGEMENT FORUM (SAMF) 2021
In continuation of the study conducted by Budhwar and Boyne (2004)the findings suggest similarities between HRPs in the IT and non-IT sectors of India. The findings show that the satisfaction of IT sector employees for COVID-19 specific HRPs is the same as that of non-IT sector employees. The probable explanation for this result is the circumstances created by the COVID-19 pandemic which affected all the sectors. After the onset of COVID-19 in January 2020, there was a national lockdown for almost two months which enforced employees from all sectors except healthcare and service to work from home. To keep the employees motivated and enable smooth transition at the workplace, organizations from all sectors implemented HRPs which were customized to meet the needs of employees working remotely or at the workplace. A survey conducted by KPMG (2020) on HR practices in India during the pandemic supports the finding. In the survey, 315 organizations from 20 different sectors including the IT sector participated and their HR initiatives and interventions were studied.
It has been found that in the case of organizational support (OS) practices, 95 percent of the organizations provided facilities related to remote working and 72 percent of them followed the mandate of providing the minimum precautionary measures like the use of sanitizers. Further, in the case of communication and well-being (CW) practices, 70 percent of the organizations conducted virtual formal meetings while 50 percent conducted informal meetings. Moreover, 90 percent of the organizations implemented at least one initiative related to the well-being of employees such as yoga, counseling sessions, or wellness talks. Likewise, under benefits and incentives (BI) practices, almost 70 percent of the organizations did not cut the salary of their employees and 80 percent did not change the insurance cover extended to an employee during the pandemic. Thus, it can be established that organizations from both IT and non-IT sectors implemented COVID-19 specific HRPs to facilitate unhindered working for their employees.
The findings of this study infer one critical point that during tough times, irrespective of the type of sector, organizations work towards a common goal of providing comfort to their employees and keeping them motivated and productive. During the pandemic, organizations adopted and implemented revolutionary HRPs which is an indicator of flexibility. This helped in improving the morale of employees and ultimately influenced them to continue.
The study was conducted with a moderate sample size of 211 employees working in different sectors. To minimize the limitations, the constructs were tested for discriminant and convergent validities. Also, common method bias was controlled by modeling a common method factor. Despite these precautions, the study suffers from a few limitations. The sample size in each sector is not equal in number. Secondly, the study is done with cross-sectional analysis and therefore its results cannot be generalized. This gives a scope to conduct the study with longitudinal analysis and bigger sample size.
Discussion
Implications for practice
Strength, limitations, and scope for further research
12116th SOUTH ASIAN MANAGEMENT FORUM (SAMF) 2021
1. Akinbode, G. A. (2011). Demographic and dispositional characteristics as predictors of organizational citizenship behavior: An appraisal of OCB in non-English culture workgroups. IFE Psychologia: An International Journal, 19(1), 375–403.
2. Albrecht, S. L. (2010). Handbook of employee engagement: perspective, issues, Research, and practice. UK: EE.
3. Anderson, J.C. and Gerbing, D.W. (1988). Structural equation modeling in practice: A review and recommended two-step approach. Psychological Bulletin, 103(3), 411-423.
4. Ayanda, O.J. and Sani, A.D. (2011). Strategic human resource management and organizational performance in the Nigerian manufacturing sector: An empirical investigation. International Journal of Business and Management, 6(9), 46–56.
5. Becker, B.E. andHuselid, M.A. (1998). High-performance work systems and firm performance: A synthesis of research and managerial implications. Human Resource Journal of Management, 37(2), 421–428.
6. Bentler, P.M. and Bonnet, D.C. (1980). Significance Tests and Goodness of Fit in the Analysis of Covariance Structures, Psychological Bulletin, 88 (3), 588-606.
7. Budhwar, P.S. and Boyne, G. (2004). Human Resource Management in the Indian Public and Private Sectors: An Empirical Comparison. The International Journal of Human Resource Management, 15(2), 346-370.
8. Deccan Herald. (2020, April 12). Coronavirus anxiety levels up among employees as appraisals get delayed. Retrieved from https://www.deccanherald.com/national/coronavirus-anxiety-levels-up-among-employees-as-appraisals-get-delayed-824371.html
9. Deery, S., Walsh, J., Zatzick, C.D., and Hayes, A.F. (2017). Exploring the relationship between compressed work hours satisfaction and absenteeism in front-line service work. European Journal of Work and Organizational Psychology, 26(1), 42-52.
10. Fornell, C. and Larcker, D.F. (1981). Evaluating structural equation models with unobservable variables and measurement error. Journal of Marketing Research, 18(1), 39-50.
11. Gellatly, I.R., Hunter, K.H., Currie, L.G. and Irving, P.G. (2009). HRM practices and organizational commitment profiles. The International Journal of Human Resource Management,20(4),869-84.
12. Harter, J.K., Schmidt, F.L. and Hayes, T.L. (2002). Business- the unit-level relationship between employee satisfaction, employee engagement, and business outcomes: A meta-analysis. Journal of Applied Psychology. 87(2), 268-279.
13. Hu, L.T. and Bentler, P.M. (1999). Cut off Criteria for Fit Indexes in Covariance Structure Analysis: Conventional Criteria Versus New Alternatives. Structural Equation Modelling, 6 (1), 1-55.
References
There are only a few studies (Budhwar and Boyne, 2004)that have reported that both private and public sectors have similar HRPs. This study done during the COVID-19 pandemic has again reinforced the findings of the previous studies. Due to circumstances created by the pandemic, the HRPs which were adopted by the IT and non-IT sectors were also similar. This was proved by the similarity in the satisfaction with HRPs related to organizational support (OS), communication and well-being (CW), and benefits and incentives (BI) in IT and non-IT sector employees. This indicates a timely and well-thought action taken by organizations in both IT and non-IT sectors for the safety and well-being of their employees.
Conclusion
122 16th SOUTH ASIAN MANAGEMENT FORUM (SAMF) 2021
14. IBEF. (2021). IT andBPM Industry in India. Retrieved from https://www.ibef.org/industry/information-technology-india.aspx
15. Jöreskog, K. G., &Sörbom, D. (1993). LISREL 8: Structural equation modeling with the SIMPLIS command language. Scientific Software International.
16. Kim, J. (2010). Strategic human resource practices: Introducing alternatives for organization performance improvement in the public sector. Personnel Administrative Review, 70(1), 38–49.
17. Kline, R.B. (2004). Principles and Practice of Structural Equation Modelling. 2nd ed., New York, NY: Guildford.
18. KPMG. (2020, May). Cutting through the crisis. Retrieved from https://assets.kpmg/content/dam/kpmg/in/pdf/2020/05/cutting-through-crisis.pdf
19. Liu, D., Gong, Y., Zhou, J., and Huang, J.C. (2017). Human resource systems, employee creativity, and firm innovation: The moderating role of firm ownership. Academy of Management Journal, 60(3), 1164-1188.
20. Mallick, E., Pradhan, R.K., Tewari, H.R., and Jena, L.K. (2015). Organizational citizenship behavior, job performance, and HR practices: A relational perspective. Management and Labour Studies, 39(4), 1–12.
21. Mint. (2020, March 27). Cognizant India employees to get COVID-19 bonus. Retrieved from https://www.livemint.com/companies/people/cognizant-s-india-employees-to-get-covid-19-bonus-11585292878215.html
22. NASSCOM. (2018). Annual NASSCOM report.Retrieved from https://nasscom.in/sites/default/files/NASSCOM_Annual_Report_2018-19.pdf
23. Nishii, L. H., & Wright, P. (2008). Variability at multiple levels of analysis: Implications for strategic human resource management. The people make the place, 225, 248.
24. Nunnally, J.C. and Bernstein, I.H. (1994).Psychological Theory. McGraw-Hill, New York, NY.25. Ping, R. A. (2005). What is the average variance extracted for a latent variable interaction?
Retrieved fromhttp://home.att.net/wrpingjr/ave1.doc. 26. Podsakoff, P.M., MacKenzie, S.B., Lee, J.-Y. and Podsakoff, N.P. (2003). Common method
biases in behavioral research: a critical review of the literature and recommended remedies. Journal of Applied Psychology, 88 (5), 879-903.
27. Restubog, S.L.D., Bordia, P. and Bordia, S. (2009). The interactive effects of procedural justice and equity sensitivity in predicting responses to psychological contract breach: An interactionist perspective.Journal of Business and Psychology, 24(2), 165-178.
28. Robison, J. (2009, February 19). Building engagement in this economic crisis. Gallup Business Journal. Retrieved from https://news.gallup.com/businessjournal/115213/building-engagement-economic-crisis.aspx
29. Strauss, W. and Howe, N. (2000). Millennials Rising: The Next Great Generation. Vintage, New York, NY.
30. Tabachnick, B. G., Fidell, L. S., & Ullman, J. B. (2007). Using multivariate statistics. 5, 481-498. Boston, MA: Pearson.
31. Tejaswi, M. (2020, April 30). COVID-19 pandemic worsens already bleak employment picture.32. The Economic Times. (2020, September 1).81 % Indian employers sensitised their workforce
on mental wellbeing. Retrieved fromhttps://economictimes.indiatimes.com/jobs/81-indian-employers-sensitised-their-workforce-on-mental-well being/articleshow/77868300.cms?utm_source=contentofinterest&utm_medium=text&utm_campaign=cppst
33. Turnley, W.H. and Feldman, D.C. (2000). Re-examining the effects of psychological contract
12316th SOUTH ASIAN MANAGEMENT FORUM (SAMF) 2021
violations: Unmet expectations and job dissatisfaction as mediators. Journal of Organizational Behaviour,21(1), 25-42.
34. Van Beurden, J., Van De Voorde, K., and Van Veldhoven, M. (2021). The employee perspective on HR practices: A systematic literature review, integration, and outlook, International Journal of Human Resource Management, 32(2), 359-393.
35. Zagenczyk, T.J., Gibney, R., Kiewitz, C. and Restubog, S.L.D. (2009). Mentors, supervisors, and role models: Do they reduce the effects of psychological contract breach?Human Resource Management Journal, 19 (3), 237-259.
124 16th SOUTH ASIAN MANAGEMENT FORUM (SAMF) 2021
16SAMF-030VALUE-BASED GOVERNANCE: A CASE OF CAPACITY
BUILDING INITIATIVE IN NEPALBasanta Raj Sigdel , Nepal Administrative Staff College
Values as enduring beliefs (Kernaghan, 2003) are the individual principles or standards that guide judgment on what is good or proper (OECD, 1996). Values are essential components of organizational culture and the basis of a democratic governance system. In the course of practicing the federal system of governance, Nepal is facing challenges in ensuring cultural transformations that create a driving path for achieving the national vision of prosperity and happiness. This is largely associated with our value system. The study analyzes the perspectives of value-based governance and novel initiatives taken for promoting value-based governance and integrity building- a culture of self-regulation, commitment, and accountability. The study is qualitative and descriptive, based on reflection on practicing organic processes of value derivation and commitments of newly appointed civil servants- Class-III officers of the government of Nepal.
Keywords – Value, Governance, Commitment, Integrity
Abstract
Public service has been facing unprecedented challenges in the course of delivering high‐quality, cost‐effective service to the public as per their changing needs, attracting and retaining a talented workforce, and fostering ethical work culture to contribute to building a resilient, sustainable and prosperous society. In other words, creating high-performance culture is the major quest of public service organizations. Creating a high-performance culture and sustaining desired results is attributed to the ability of those organizations in aligning people and processes to value-based- making public service values a‘ way of life’.Values are regarded as determinants of decisions, actions, and behavior of an individual in personal, social as well as professional life. Values are important and lasting beliefs or ideals shared by the members of a culture about what is good or bad and desirable or undesirable. Wart (1998) argues that there is no such thing as a value-free decision and this makes it more important that public administrators fully understand the values they use when making decisions. Values are generally understood as essential components of organizational culture being instrumental in determining, guiding, and informing behavior (Hofstede and Hofstede 2005; Schein 2004). The concept of values in public service has remained fundamental to all spheres of public administration through the practice, study, and understanding of public administration has evolved considerably over recent decades. In this relation, Jorgensen and Bozeman (2007) argue that ‘there is no more important topic in public administration and policy than public values’.OECD study (1996) in the area of corruption and ethics in public life
Senior Director of Studies at Nepal Administrative Staff College, a leading public sector training institution of the country. Involved for a decade as faculty of Management- Leadership and Strategic Management- in Senior Executive Development Programme, designed to enhance leadership capabilities of Joint Secretaries of the Government of Nepal, and in-service as well as induction training programs to mid and entry level officers. Currentlyheading Management
Changing Paradigm of Public Service: Value-based Governance
12516th SOUTH ASIAN MANAGEMENT FORUM (SAMF) 2021
Learning Group of the College as Department Head, I hold Master’s Degree in Management from Tribhuvan University in First Division with Distinction and have experience of eight years as a Manager in Nepal Bank Limited- the first bank of the Country.
defines values as ‘the individual principles or standards that guide judgment about what is good or proper’. They create the link between the daily work of public servants and the broad aims of democratic government.
Value-based governance is equally important in public as well as private sector organizations. Barret (2006) shows that there is a strong link between financial performance and the alignment of an organization’s cultural values with employees’ values. In other words, who you are and what you stand for is becoming just as important as the quality of products and services you provide. Promoting value-based culture and aligning personal values and civil service values requires effective control measures such as clear policies, procedures, and controls, separation of duties and effective monitoring, audit and reporting, clear mechanisms for reporting, and effective and transparent action against wrongdoing to create the foundation for value-based governance (Heintzman, 2005).
The constitutions set the rules for administrators’ work, including the values serving as guidelines and defined public expectations concerning government activities (Chapman, 1993). Integrity and excellence of public administration are considered instrumental in the effective implementation of the Constitution and its spirit. Ahern (2005) states that “we must hold on to something of the core values of public services, such as integrity, impartiality, diligence, and commitment. If they are lost, it will be too late and too difficult to get them back. I believe that shared values are important as the ‘glue’ which helps to hold the system together − perhaps even more so in State Agencies which have widely different remits and structures”.Public service is accounted for ensuring good governance through effective public policies and
service delivery mechanisms. Inculcating value-based governance can create a substantial impact on public trust and confidence. On the other hand, the weak application of appropriate values can lead to reductions in essential elements of democratic governance and ethical decision-making culture. Hence, promoting value-based decision-making culture is essential for the institutionalization and development of democracy around the world. Barret (2010) explains that values allow us to transcend our parental, ethnic/cultural belief structures by uniting us around shared basic human principles. When people in organizations promote an agreed set of values and understand supporting behaviors, then you no longer need to rely only on bureaucratic procedures setting out what people should or should not do in specific situations. All the rules reduce to one—‘live the values. People can practice for themselves what they need to do, and in so doing become responsible and accountable for their behavior in their personal and professional life.Defining standards of conduct for public officials is a first step toward safeguarding integrity in
public administration. Designing and implementing a Code of Conduct is recognized to achieve this objective and create a common understanding within the public service and with citizens on the values and standards to be followed. The process of defining such values carries importance- whether it is prescribed or is organic, collectively derived, and accepted by the public servants. Further, reinforcement of values is critical making them the way of life of public servants. Hicks and Scanlan (1998) agree that the reinforcement and transmission of common cultural values need to be planned and systematic. Effective leadership, organizational culture, and people management are crucial for achieving high levels of positive values in an organization (Heintzman, 2005).
126 16th SOUTH ASIAN MANAGEMENT FORUM (SAMF) 2021
Nepal entered into a new era of governance with the promulgation of the new constitution in 2015. The transformation from a unitary system to federalism is not only a change in the structural regime but also an alteration in the relationship among state actors and people and a reshaping of national culture in order to fulfill the aspirations for sustainable peace, good governance, development, and prosperity of the nation. The basic philosophy of the federal constitution lies in the fact that public accountability, both vertical and horizontal, is enriched at all tiers in the devolved structure of governance. At all tiers, this aspiration is articulated through public policy and implementation mechanisms established at the bureaucratic level. Since the country has opted to bring government to the doorstep of the people, the role of civil service has become more instrumental, yet challenging in the changed context of governance.
The role of bureaucracy is crucial in governance reform. Governance reform programs and strategies for administrative modernization are deeply rooted in organizational as well as broader political and societal values—a fact that is unduly sidelined in much of the international discourse among academics and practitioners about public sector reform (Schroter and Rober, 2013). Nepal has witnessed political transformations over decades which are largely structural. That required similar reforms in public service. From the first administrative reform report of the Butch Commission, 1948 to the latest Report, 2013 we see that the major reform agenda rests on alterations in structural components. Lack of focus on cultural components to sustain these changes has neutralized the potential outcome of such transformation at the political as well as bureaucratic levels. Bureaucracy, as an instrumental vehicle for translating the vision of political leadership or aspirations of the people in service as well as development delivery, is still struggling to make itself anticipative, adaptive, and forward-looking. Ghimire (2016) argues that the lethargic part of bureaucracy is common and public servants lack commitment and are overwhelmingly influenced by political parties and their ideologies. In such a situation, the governance system envisioned in federalism cannot be functional with the same legacy of process orientation, relying only on compliance and being reactive.
The basic premises of federalization include making the government more efficient and receptive to the demands of the Nepalese people, and one of the main pillars of the new Federal State will be public administration in the form of the institutions and functions of the executive arm of government. In this context, recruiting, educating, and training public administrators is a key imperative for the smooth functioning of the federal system of governance and better delivery of public services. Values need to be inculcated in the way of life of public servants from the very beginning. The relatively stable and long-lasting effect of service values and role understandings is deeply anchored in foundations laid in the formative stages of public sector careers.
Federal System in Nepal: New Era of Governance
Value-Based Governance: Initiatives of NASC through Capacity BuildingNepal Administrative Staff College (NASC) is a premier institution in the country devoted to developing managerial competencies and organizational capabilities of the public sector in order to provide quality services to the people. Training, Research, and Consulting services are the key result areas of NASC. Standard training programs are designed for the officer level to the joint secretary level. The colloquium is organized annually for the Secretary or the Special Class officers in context-specific issues on leadership, public policy, governance, and other pertinent areas of national priorities.
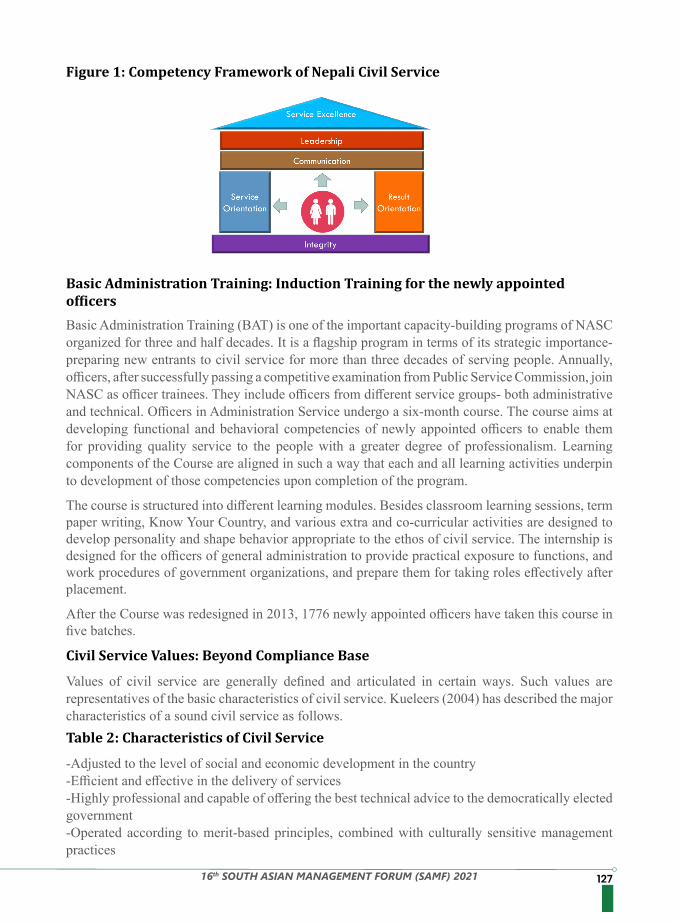
12716th SOUTH ASIAN MANAGEMENT FORUM (SAMF) 2021
Figure 1: Competency Framework of Nepali Civil Service
Basic Administration Training: Induction Training for the newly appointed officers
Civil Service Values: Beyond Compliance Base
Table 2: Characteristics of Civil Service
Basic Administration Training (BAT) is one of the important capacity-building programs of NASC organized for three and half decades. It is a flagship program in terms of its strategic importance- preparing new entrants to civil service for more than three decades of serving people. Annually, officers, after successfully passing a competitive examination from Public Service Commission, join NASC as officer trainees. They include officers from different service groups- both administrative and technical. Officers in Administration Service undergo a six-month course. The course aims at developing functional and behavioral competencies of newly appointed officers to enable them for providing quality service to the people with a greater degree of professionalism. Learning components of the Course are aligned in such a way that each and all learning activities underpin to development of those competencies upon completion of the program.
The course is structured into different learning modules. Besides classroom learning sessions, term paper writing, Know Your Country, and various extra and co-curricular activities are designed to develop personality and shape behavior appropriate to the ethos of civil service. The internship is designed for the officers of general administration to provide practical exposure to functions, and work procedures of government organizations, and prepare them for taking roles effectively after placement.
After the Course was redesigned in 2013, 1776 newly appointed officers have taken this course in five batches.
Values of civil service are generally defined and articulated in certain ways. Such values are representatives of the basic characteristics of civil service. Kueleers (2004) has described the major characteristics of a sound civil service as follows.
-Adjusted to the level of social and economic development in the country-Efficient and effective in the delivery of services-Highly professional and capable of offering the best technical advice to the democratically elected government-Operated according to merit-based principles, combined with culturally sensitive management practices
128 16th SOUTH ASIAN MANAGEMENT FORUM (SAMF) 2021
-Loyal in the execution of the policies of the acting government, while operating in accordance with the Constitution and the laws-Strongly committed to the public interest-Disciplined and intolerant of unproductive or unethical behavior-Honest and devoted to serving the population in an unbiased and impartial manner-Broadly representative of society-Upholding fair administrative practices, transparent in its operations and accountable to the citizens and their representatives-Willing to hire the best people available at each level, based on a fair and transparent recruitment process and to maintain competitive pay practices that will foster a motivational climate for state employees-Strongly in support of proper training and development at all levels-Capable and willing to develop partnerships with various groups and organizations in civil society
Nepali Civil Service Act, 1993 has envisioned making the civil service more competent, vigorous, service-oriented, and responsible. The public Service Commission is the constitutional body to recruit, select and ensure compliance with service conditions of civil service and public organizations. Such regulatory frameworks and institutional mechanisms provide the basis for the behavior of civil servants. Compliance with the ethos of civil service is expected from the civil servants as mandatory and non-compliance would lead to consequences outlined in such regulations.
Compliance-based approaches, however, are regarded as necessary but not sufficient conditions for ensuring good governance and achieving development results as envisioned by the Constitution of a country. If we take an example of corruption—the abuse of public office for private gain continues to flourish in the developed economies despite decades of compliance efforts(Ouzounov, 2004). It is seen worldwide that the amount of publicized corruption may be surprising given the many controls imposed on government officials regulating their conduct. Lagar (1994) observes that the amount of resources and attention devoted to compliance to deter deviant conduct is far more indicative of a culture of compliance than one of corruption. Yet corruption persists. The ever-present news reports of misconduct by government officials amply illustrate that the government’s coercive approach to ethics has neither prevented notorious and outrageous corruption by government officials. That detection, however, is very difficult in the countries like Nepal since informal practices of governance are prevalent and these unwritten ‘rules of the game’ govern politics in practice (NORAD, 2011).
The integrity approach, in contrast to the compliance approach, empowers the individual to make value judgments about right and wrong. It is value-driven rather than rule-driven. It presumes that there are not always, maybe even seldom, bright lines to help one choose the right thing to do. One must learn how to deal with ethical challenges. The value-based approach considers integrity, for example, the individual dimension called standing for something (Calhoun, 1995) and the social dimension- individuals speak up for their values and organizations are aware of the social context in which they work (Agious et.al, 2010).
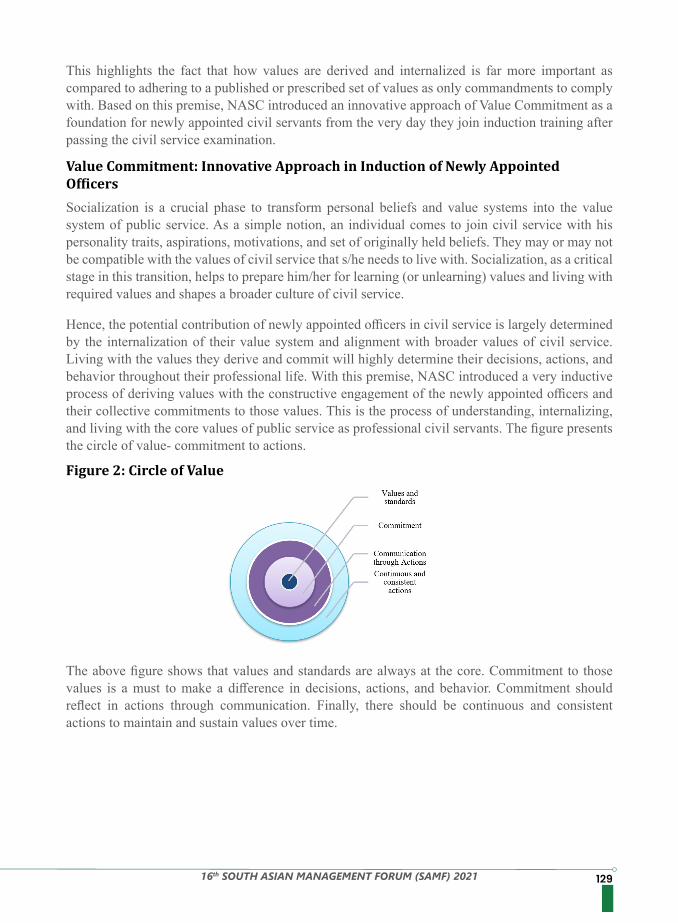
12916th SOUTH ASIAN MANAGEMENT FORUM (SAMF) 2021
This highlights the fact that how values are derived and internalized is far more important as compared to adhering to a published or prescribed set of values as only commandments to comply with. Based on this premise, NASC introduced an innovative approach of Value Commitment as a foundation for newly appointed civil servants from the very day they join induction training after passing the civil service examination.
Socialization is a crucial phase to transform personal beliefs and value systems into the value system of public service. As a simple notion, an individual comes to join civil service with his personality traits, aspirations, motivations, and set of originally held beliefs. They may or may not be compatible with the values of civil service that s/he needs to live with. Socialization, as a critical stage in this transition, helps to prepare him/her for learning (or unlearning) values and living with required values and shapes a broader culture of civil service.
Hence, the potential contribution of newly appointed officers in civil service is largely determined by the internalization of their value system and alignment with broader values of civil service. Living with the values they derive and commit will highly determine their decisions, actions, and behavior throughout their professional life. With this premise, NASC introduced a very inductive process of deriving values with the constructive engagement of the newly appointed officers and their collective commitments to those values. This is the process of understanding, internalizing, and living with the core values of public service as professional civil servants. The figure presents the circle of value- commitment to actions.
The above figure shows that values and standards are always at the core. Commitment to those values is a must to make a difference in decisions, actions, and behavior. Commitment should reflect in actions through communication. Finally, there should be continuous and consistent actions to maintain and sustain values over time.
Value Commitment: Innovative Approach in Induction of Newly Appointed Officers
Figure 2: Circle of Value
130 16th SOUTH ASIAN MANAGEMENT FORUM (SAMF) 2021
1.Orientation by VeteransThe value derivation process begins with an orientation program for the officer trainees by veterans in public service who have consistently demonstrated and lived with public service values in their personal and professional life and contributed to transformation efforts significantly. Prominent personalities and seasoned professionals as ideals of the concerned sector orient the officer trainees.
The resource persons set a broader context of governance in Nepal, changing the role of civil service and civil servants, and shared their learning experiences of how living with values makes a difference in delivering public commitment and achieving development goals. Officer trainees enrich their understanding of these notions along with the strengths of personal commitment in ensuring service excellence.
2.Analyzing a Case of Service SituationOfficer trainees are given a real case or problem situation in public service (especially having dilemma in living with value system e.g. dilemma in citizenship certificate distribution, non-performance of a development project). They analyze the case from multiple aspects by putting themselves into that situation. The basic objective of this exercise is to see how they understand the problem, internalize its severity, dig into the causes as conflicting values, assess multiple realities, and outline solutions considering themselves as decision-makers in that situation. The process is then linked with facilitated group discussion.
3.Value Derivation Group ExerciseIn this third step, officer trainees are divided into groups of 25-27 persons in one group. They are given with few questions to reflect on themselves and internalize individually. It is regarded as rapid-fire and what comes originally to their mind is okay. Short answers and perspectives are shared as an answer without discussion. The questions are as follows:
1.Having different options, why did you choose to be a part of the Nepal Civil Service? 2.Do you expect there will be a change in your proposition at any time during the service period? Why?3.Is public service only employment or something more?4.How much responsible will you think of yourself for your performance?5.Do you like to work in a structured environment?
The Eight Steps Process of Value Derivation
Table 3: Individual Self Reflection Questions
Steps in Brief
1. Orientation on Values by Veterans 2. Case Analysis 3. Value Derivation Exercises 4. Contestation and Consolidation Exercise 5. Framing Value Statements 6. Collective Recitation 7. Monitoring of Behavior 8. Conferral to Government
13116th SOUTH ASIAN MANAGEMENT FORUM (SAMF) 2021
7.Do you provide constructive ideas in any proposal for serving citizens?8.Will you be able to do justice with your position and responsibilities?9.What do you value most in your profession? 10.Whom do you represent in your profession?
1.What services will you have to offer? 2.Who consumes your services? 3.What does each of them expect in your service? 4.What experiences/feelings do they have about your services? 5.Where do you think you need to focus more to increase the satisfaction of your customer? 6.How do you internalize them into your understanding and behavior? 7.How do you articulate them in meaningful terms? 8.How will you deliver and sustain those value propositions? 9.Can we make a common understanding of what we have proposed earlier?
Answer to these questions creates a situation of mind storming- reflecting on self, self-identity, the reason for existence, basic aim of life, and challenging held beliefs and assumptions in a changed context of and role as a civil servant. After completing this stage, the whole classroom group is divided into sub-groups of 5 persons in each for facilitated group discussion. The following questions are asked one by one within stipulated time:
NASC faculties facilitate the discussion to drive them into their inner core and analyze those questions in a meaningful way with adequate reflection on their understanding. A very interesting and noteworthy thing in this process is that all the faculties of NASC go through these processes themselves in the real situation before facilitating officer trainees. This makes the process of internalization more meaningful rather than a consultative one. The discussion summed up with articulation of values as statements and the ways these values are delivered and sustained. 4.Contestation and Consolidation ExerciseThis is the crucial stage in value derivation where the work of subgroups is consolidated into one. There were 397 trainee officers in the 2017 batch and 370 officers in the 2018 batch. The officers were divided into 14 and 12 groups respectively. The respective group including one female officer nominated two representatives from each group. In this stage, the representatives contested every statement expressed as values of civil services and ways to live with them. The sessions lasted for hours and had been so interesting that they resembled a society of diversity where divergent thoughts and beliefs were contested with each other from the simple nomenclature of the concept to their meaningful connotation and practicality to follow in the context of public service. The process was so lively as well as lovely that officer trainees were not consulting what to derive as value statements but they were making their entire efforts to give meaning or say, give life to every statement of values through acceptance and commitment from the inner core. As a learning lab, the process also provided them the opportunities to reflect on and practice skills pertaining to leadership, negotiation, communication, and learning to co-construct ideas from divergent thought processes and compromise, if needed, for the larger benefits of others than sticking on self-interests and individual priority. After the contestation and consolidation session was over, a small group of representatives prepared the draft of value propositions. The draft was shared with all the officer trainees seeking suggestions in language, meaning, and whether this represented the original thoughts as well as collective propositions of the group.
Table 4: Questions for Facilitated Group Discussion
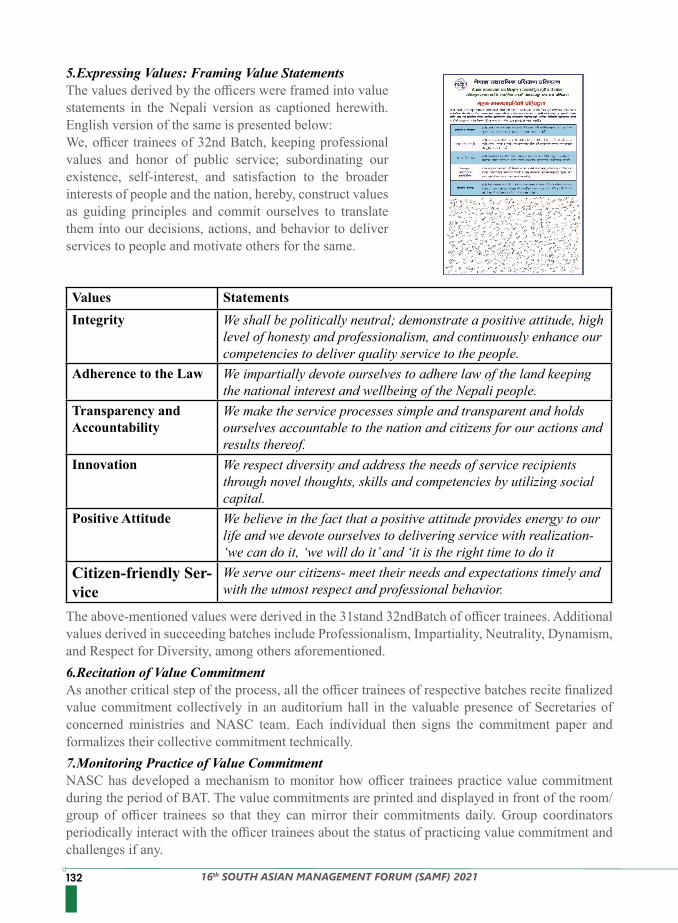
132 16th SOUTH ASIAN MANAGEMENT FORUM (SAMF) 2021
The above-mentioned values were derived in the 31stand 32ndBatch of officer trainees. Additional values derived in succeeding batches include Professionalism, Impartiality, Neutrality, Dynamism, and Respect for Diversity, among others aforementioned.
5.Expressing Values: Framing Value StatementsThe values derived by the officers were framed into value statements in the Nepali version as captioned herewith. English version of the same is presented below:We, officer trainees of 32nd Batch, keeping professional values and honor of public service; subordinating our existence, self-interest, and satisfaction to the broader interests of people and the nation, hereby, construct values as guiding principles and commit ourselves to translate them into our decisions, actions, and behavior to deliver services to people and motivate others for the same.
6.Recitation of Value CommitmentAs another critical step of the process, all the officer trainees of respective batches recite finalized value commitment collectively in an auditorium hall in the valuable presence of Secretaries of concerned ministries and NASC team. Each individual then signs the commitment paper and formalizes their collective commitment technically. 7.Monitoring Practice of Value CommitmentNASC has developed a mechanism to monitor how officer trainees practice value commitment during the period of BAT. The value commitments are printed and displayed in front of the room/group of officer trainees so that they can mirror their commitments daily. Group coordinators periodically interact with the officer trainees about the status of practicing value commitment and challenges if any.
Values StatementsIntegrity We shall be politically neutral; demonstrate a positive attitude, high
level of honesty and professionalism, and continuously enhance our competencies to deliver quality service to the people.
Adherence to the Law We impartially devote ourselves to adhere law of the land keeping the national interest and wellbeing of the Nepali people.
Transparency and Accountability
We make the service processes simple and transparent and holds ourselves accountable to the nation and citizens for our actions and results thereof.
Innovation We respect diversity and address the needs of service recipients through novel thoughts, skills and competencies by utilizing social capital.
Positive Attitude We believe in the fact that a positive attitude provides energy to our life and we devote ourselves to delivering service with realization- ‘we can do it, ‘we will do it’ and ‘it is the right time to do it
Citizen-friendly Ser-vice
We serve our citizens- meet their needs and expectations timely and with the utmost respect and professional behavior.
13316th SOUTH ASIAN MANAGEMENT FORUM (SAMF) 2021
Similarly, Residential Managers and Induction Training Chief are trusted with the responsibility of constantly monitoring and encouraging the behavior of officer trainees; and providing concurrent feedback for deviant behavior with possible alternative ways of demonstrating desired behavior and solving problems. This is also linked with the overall performance assessment of officer trainees.
Values are essential components of organizational culture and instrumental in determining, guiding, and informing behavior. Bureaucracy is the primary vehicle and public servants have an enormous role to deliver better governance to meet changing aspirations of citizens envisioned by the constitution of the country. Leadership, working environment, workable codes of conduct and values statements, and professional socialization mechanisms such as training, risk review, and control mechanisms are considered critical in ensuring value-based governance of the country. Values derivation, commitment, and enforcement should be integrated into the way of life of the public bearers for the purpose. In this connection, the self-driven, inductive, and organic procedure of value commitment, as practiced in Nepal Administrative Staff College at the socialization stage of newly appointed civil servants, would be an entry point and more sustainable way in the course to ensuring value-based governance.
1. Ahern, B. (2005). ‘What Government expects from State Agencies’ (Speech by An Taoiseach, Bertie Ahern TD, at the Association of Chief Executives of State Agencies (ACESA) Seminar: Dublin
2. Calhoun, C. (1995). ‘Standing for Something’, Journal of Philosophy XCii, no. 53. Civil Service Act, 1993 Nepal Law commission4. Ghimire, B. (2016). ‘Beleaguered Administration: A Study of Administrative Reforms in
Nepal’. International Journal of Development Research 06(5):7966-7972 5. Heintzman, R. (2005). Presentation to the Saskatchwan Federal Council. http://www.hrma-
agrh.gc.ca/veobve/documents/HeintzmanPresentation.PPT6. Hicks, C. and Scanlan, G. (1998). ‘Integrating Ethics’ in Sampford, C., Preston, N. and Bois,
C-A. Public Sector Ethics: Finding and Implementing Values (eds) (London: Federation Press/Routledge
7. Hofstede, G. and Hofstede, G.J. (2005). Cultures and Organizations: Software of the mind London: McGraw Hill
8. https://www.valuescentre.com/mapping-values/values/values-based-decision-making9. Kernaghan, K. (2003). ‘Integrating Values into Public Service: The Values Statement as
Centerpiece’. Public Administration Review Vol. 63 (6), pp.711-1910. Keuleers, Patrick (2004). Key issues for consideration when assisting civil service personnel
management reforms in developing countries, Bangkok: UNDP, Sub-Regional Resource
8.Conferral to GovernmentAs a final stage at NASC, the value commitments of the officer trainees are handed over to the concerned ministry in the graduation ceremony. NASC believes this is fiduciary responsibility toward developing a workforce committed and living by core values of civil service contributing ultimately to a value-based governance system in the country. Right Honorable Prime Minister K.P. Sharma Oli graced the Graduation Ceremony of the 32nd Batch Programme. He also endorsed their commitments and added as symbolic assimilation of his ideas in the preamble-Our Nepal, We Nepali, We Servant of the People…. He duly acknowledged the process and output of Value Commitment and urged all the officer trainees to translate them into the way of life.
Conclusion
References
134 16th SOUTH ASIAN MANAGEMENT FORUM (SAMF) 2021
Facility for the Pacific, Northeast, and Southeast Asia.11. Molina, A. D. (2009). Values in public administration: The role of organizational culture.
International Journal of Organization Theory and Behavior, 12(2), 266–279.12. Nepal Administrative Staff College (NASC). (2018). Competency Framework of Civil Service
of Nepal. Lalitpur: Nepal Administrative Staff College.13. New Zealand State Services Commission Values and Standards: Values in the New Zealand
Public Service. Wellington: State Services Commission, 200114. NORAD (2011). Corruption and Anti-Corruption in Nepal: Lessons Learned and Possible
Future Initiatives 15. OECD (1996). ‘Ethics in the Public Service: Current Issues and Practice’ Public Management
Occasional Papers No.1416. Ouzounov, A. (2004). ‘Facing the Challenge: Corruption, State Capture and the Role of
Multinational Business’. 37 J. MARSHALL L. REV. 1181, 118617. Richard Barrett (2006). Building a Values-Driven Organization: A Whole-System Approach to
Cultural Transformation, Boston: Butterworth-Heinemann.18. Schein, E. H. (2004).Organizational Culture and Leadership (3rd Ed.) San Francisco: Jossey
Bass19. Schroter E. and Rober M. (2013). Values, Competencies, and Public Sector Training: The
Value Base of Administrative Modernization, Journal of public affairs education: 21 (1) 25-40 20. Van Wart M. (1998). Changing Public Sector Values. London: Garland Publishing
13516th SOUTH ASIAN MANAGEMENT FORUM (SAMF) 2021
HUMAN RESOURCE MANAGEMENT BUNDLES DURING COVID-19 CRISIS
The purpose of this study is to explore the Human Resource Management (HRM) bundles during the COVID-19 crisis. COVID-19 appears as a pandemic affecting not only the lives of human beings but also disrupting investment, supply chain management, and the financial and operational performance of the organizations. Human Resource Professionals (HRPs) from various parts of the world have adopted lots of hard and soft Human Resource Management (HRM) strategies to combat the crisis due to the pandemic. This study surveyed 141 employees from different industries in order to explore their adoption strategies through the lens of hard and soft HR practices. Findings report HR activities regarding two HR bundles including the cost-saving bundle (incentives, training, and performance evaluation) as hard HR practices and the employee engagement and motivation bundle (communication, support, and encouragement) as soft HRM practices. The findings also inform the HRPs of the HRM bundles and HRM activities that can be used to manage crises during COVID-19 and similar pandemics.
Dr. Farhana Ferdousi, Assistant Professor, Southeast UniversityDr. Mehe Zebunnesa Rahman, Assistant Professor, North South UniversityDr. Abdul Hannan Chowdhury, Professor, North South University
Keywords – Human Resource Management (HRM); Human Resource Professionals (HRPs); HR Bundles; Hard HRM; Soft HRM, COVID-19
Abstract
COVID-19 pandemic has been creating chaos and disruption not only for the human physical, social and mental lives but also for the businesses and other organizations since its outbreak at the end of 2019. Many countries were affected by the devastating effects of the Corona Virus and had to go on lockdown for a few months. In order to ensure employees’ safety and health, many organizations introduced limited working from home as transportation was also restricted to reduce people’s movement. Organizations have to witness challenges and dilemmas due to disruption in the supply chain, productions, operations, and a sharp decline in investments (Shen et al.,2020), and demands which inevitably lead to a reduction in labor demand and the creation of labor surplus (Gunnigle et al., 2013). The resulting financial crisis also created challenges for human resource professionals (HRPs) in the form of aligning firms’ human resource (HR) issues with the strategic needs of the organization in order to survive and remain cost-effective. Changing work arrangements, redesigning job duties, making human resource planning for the changing needs of the organizations, downsizing and maintaining physical and mental health of the survivors, and keeping them motivated and engaged in work were vital issues for the HRPs during the pandemic and even after the pandemic or in new normal. Because the COVID-19 crisis brought about serious physical and mental health consequences for the employees due to social isolation, and uncertainty about their lives, jobs, and future (Rudolph et al., 2020). But research is still very limited in number about the impacts of such a crisis on business performance, especially from the perspective of Human Resource Management practices. Very little is known about how human resources were managed during pandemics like COVID-19.
Introduction
136 16th SOUTH ASIAN MANAGEMENT FORUM (SAMF) 2021
Therefore, this study will attempt to explore the human resource management practices or HR bundles during the pandemic. Research scholars agreed on the fact that HRM practices are more effective when they are “bundled” than used individually (Bello- Pintado, 2015; Ichniowski et al., 1997; Kooij et al., 2014; Macduffie, 1995; Monks and Loughnane, 2006). Because dynamic combinations of HR practices can create more synergistic effects on performance, business outcomes, and competitive advantage (Adhikaram & Priyankara, 2021).
The extant literature has agreed upon the contribution of HRM bundles in increasing manufacturing performance (Macduffie, 1995), firm performance (Gooderham et al., 2008; Perry-Smith and Blum, 2000; Subramony, 2009), ability, motivation (Beltran-Martın and Bou-Llusar, 2018’ Napathorn, 2018) and business outcomes (Subramony, 2009). But there is an argument on which combinations of HRM practices would be consistent depending upon the context (Delery and Doty, 1996; Macduffie, 1995). Although researchers did not find any established HRM bundles or an accepted theory that rightly suggests which bundles are “obligatory” or “optional” in a given situation (Boselie et al., 2001). Rather the success of a particular combination of HRM practices is contingent upon the factors such as the context, industry, employee designations, and organizational settings (Wright and Snell, 1991). A study conducted by Santana et.al. (2017) proposed the adaptation of four complementary HRM bundles during the crises such as flexibility-oriented, efficiency-oriented, niche-oriented, and maintenance-oriented. Technical and behavioral HRM bundles were proposed by Teague and Roche, (2014) in order to survive the effect of rescission and downsizing. Technical HRM includes a set of policies and practices concerned with payroll cost savings and headcount management, whereas behavioral HRM bundles are intended to ensure employees’ motivation and commitment (Teague and Roche, 2014). Cameron (1994) identified deep or depth HRM bundling which incorporates the bundling of a greater number of practices of the same type and the broad or breadth bundling which focuses on implementing greater varieties of different HRM practices. Adikaram et.al., (2021) recommended three key HRM bundles (health and safety bundle, cost-saving bundle, and employee motivation and engagement bundle) to be used in managing employees during a crisis.COVID-19 crisis put HRP in a critical situation, as they were expected to keep employees healthy;
maintain their morale; oversee a vast remote-working experiment; and, as firms retrench, consider whether, when, and how to lay workers off (Caliguiri, 2020 with reference to The Economist, March 24th, 2020). Carnevale and Hatak, (2020) presented HRM challenges and opportunities for HRPs during COVID-19 such as erosion of fit, disproportionate work-family effect, alternative family structures, etc.
Research conducted on the impact of telecommuting during the COVID-19 pandemic showed mixed results in employee job satisfaction and dissatisfaction (Baert, et al., 2020). For example, employees with resident children are less satisfied with the increased teleworking. Findings also reported that more than one in five experiencing increased time spent teleworking (during the COVID-19 crisis) report more conflicts with their housemates (Baert, et al., 2020). However, the report concluded with many positive characteristics (e.g. increased efficiency and better work-life balance) attributed to teleworking, while, at the same time, potentially negative impacts on promotion opportunities and work relationships (Baert, et al., 2020). Rudolph et. al., 2020 focused on the influences of the pandemic crisis on occupational health and safety, work-family issues, telecommuting, virtual teamwork, job insecurity, precarious work, leadership, human resources policy, and the aging workforce,
COVID-19, Crises, and HRM Bundles
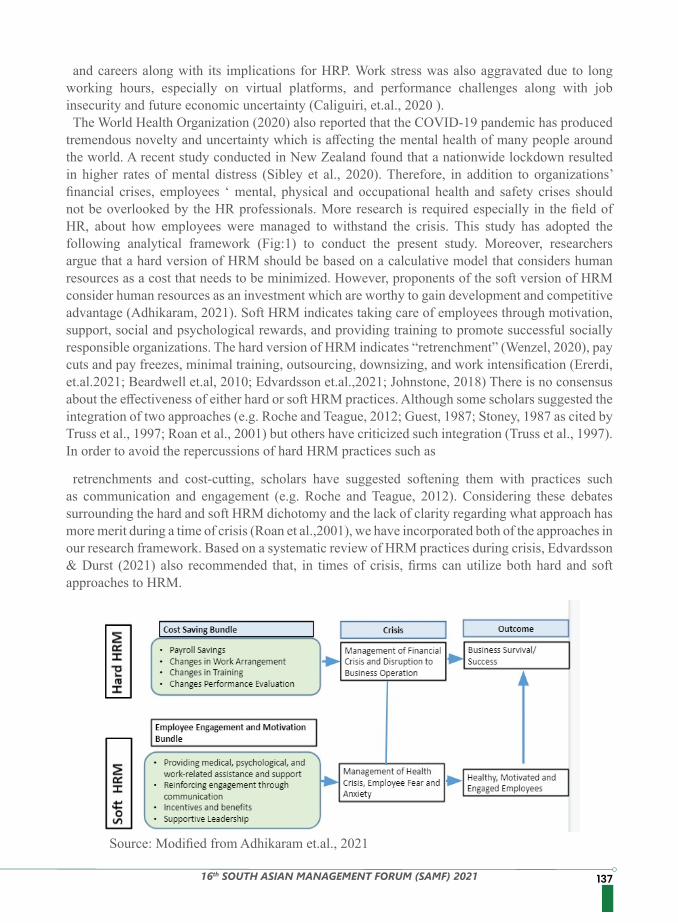
13716th SOUTH ASIAN MANAGEMENT FORUM (SAMF) 2021
and careers along with its implications for HRP. Work stress was also aggravated due to long working hours, especially on virtual platforms, and performance challenges along with job insecurity and future economic uncertainty (Caliguiri, et.al., 2020 ). The World Health Organization (2020) also reported that the COVID-19 pandemic has produced
tremendous novelty and uncertainty which is affecting the mental health of many people around the world. A recent study conducted in New Zealand found that a nationwide lockdown resulted in higher rates of mental distress (Sibley et al., 2020). Therefore, in addition to organizations’ financial crises, employees ‘ mental, physical and occupational health and safety crises should not be overlooked by the HR professionals. More research is required especially in the field of HR, about how employees were managed to withstand the crisis. This study has adopted the following analytical framework (Fig:1) to conduct the present study. Moreover, researchers argue that a hard version of HRM should be based on a calculative model that considers human resources as a cost that needs to be minimized. However, proponents of the soft version of HRM consider human resources as an investment which are worthy to gain development and competitive advantage (Adhikaram, 2021). Soft HRM indicates taking care of employees through motivation, support, social and psychological rewards, and providing training to promote successful socially responsible organizations. The hard version of HRM indicates “retrenchment” (Wenzel, 2020), pay cuts and pay freezes, minimal training, outsourcing, downsizing, and work intensification (Ererdi, et.al.2021; Beardwell et.al, 2010; Edvardsson et.al.,2021; Johnstone, 2018) There is no consensus about the effectiveness of either hard or soft HRM practices. Although some scholars suggested the integration of two approaches (e.g. Roche and Teague, 2012; Guest, 1987; Stoney, 1987 as cited by Truss et al., 1997; Roan et al., 2001) but others have criticized such integration (Truss et al., 1997). In order to avoid the repercussions of hard HRM practices such as
retrenchments and cost-cutting, scholars have suggested softening them with practices such as communication and engagement (e.g. Roche and Teague, 2012). Considering these debates surrounding the hard and soft HRM dichotomy and the lack of clarity regarding what approach has more merit during a time of crisis (Roan et al.,2001), we have incorporated both of the approaches in our research framework. Based on a systematic review of HRM practices during crisis, Edvardsson & Durst (2021) also recommended that, in times of crisis, firms can utilize both hard and soft approaches to HRM.
Source: Modified from Adhikaram et.al., 2021
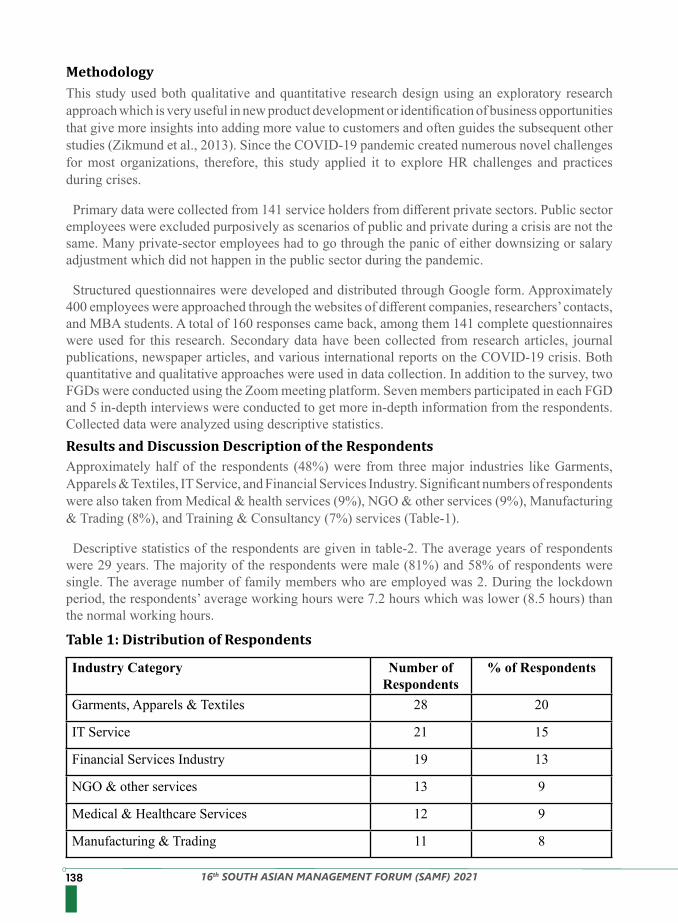
138 16th SOUTH ASIAN MANAGEMENT FORUM (SAMF) 2021
This study used both qualitative and quantitative research design using an exploratory research approach which is very useful in new product development or identification of business opportunities that give more insights into adding more value to customers and often guides the subsequent other studies (Zikmund et al., 2013). Since the COVID-19 pandemic created numerous novel challenges for most organizations, therefore, this study applied it to explore HR challenges and practices during crises.
Primary data were collected from 141 service holders from different private sectors. Public sector employees were excluded purposively as scenarios of public and private during a crisis are not the same. Many private-sector employees had to go through the panic of either downsizing or salary adjustment which did not happen in the public sector during the pandemic.
Structured questionnaires were developed and distributed through Google form. Approximately 400 employees were approached through the websites of different companies, researchers’ contacts, and MBA students. A total of 160 responses came back, among them 141 complete questionnaires were used for this research. Secondary data have been collected from research articles, journal publications, newspaper articles, and various international reports on the COVID-19 crisis. Both quantitative and qualitative approaches were used in data collection. In addition to the survey, two FGDs were conducted using the Zoom meeting platform. Seven members participated in each FGD and 5 in-depth interviews were conducted to get more in-depth information from the respondents. Collected data were analyzed using descriptive statistics.
Approximately half of the respondents (48%) were from three major industries like Garments, Apparels & Textiles, IT Service, and Financial Services Industry. Significant numbers of respondents were also taken from Medical & health services (9%), NGO & other services (9%), Manufacturing & Trading (8%), and Training & Consultancy (7%) services (Table-1).
Descriptive statistics of the respondents are given in table-2. The average years of respondents were 29 years. The majority of the respondents were male (81%) and 58% of respondents were single. The average number of family members who are employed was 2. During the lockdown period, the respondents’ average working hours were 7.2 hours which was lower (8.5 hours) than the normal working hours.
Methodology
Results and Discussion Description of the Respondents
Table 1: Distribution of Respondents
Industry Category Number of Respondents
% of Respondents
Garments, Apparels & Textiles 28 20
IT Service 21 15
Financial Services Industry 19 13
NGO & other services 13 9
Medical & Healthcare Services 12 9
Manufacturing & Trading 11 8
13916th SOUTH ASIAN MANAGEMENT FORUM (SAMF) 2021
Training & Consultancy 10 7
Electronics & Power Industry 9 6
Hotel, Restaurant & Food Industry 7 5
Online & Retail Service Industry 6 4
Education 5 4
Total 141 100%
Table 2: Description of the Respondents
Particulars %
Average Age of the Respondents 29 Years
Gender Male= 114Female= 27
Male= 81%Female= 19%
Education Post-Grad= 71Undergrad= 66
HSC= 2Others= 2
Post-Grad= 50.35%Undergrad= 46.81%
HSC= 1.41%Others= 1.41%
Marital Status Married= 59 Single=82 Married= 42% Sin-gle=58%
Number of Family Members 4.4 Person 9
Number of Working Members 2 Person 8
Average working hours before lockdown 8.5 Hours
Average working hours during lockdown 7.2 Hours
Average Tenure of the Respondents 3.8 Years
Salary Above BDT 1,00,000=4
BDT 51,000-1,00,000= 19
BDT 21,000-50,000=73
BDT 5,000-20,000=45
Above BDT 1,00,000=2.83%
BDT 51,000-1,00,000=13.48%
BDT 21,000-50,000=51.77%
BDT 5,000-20,000=31.91%
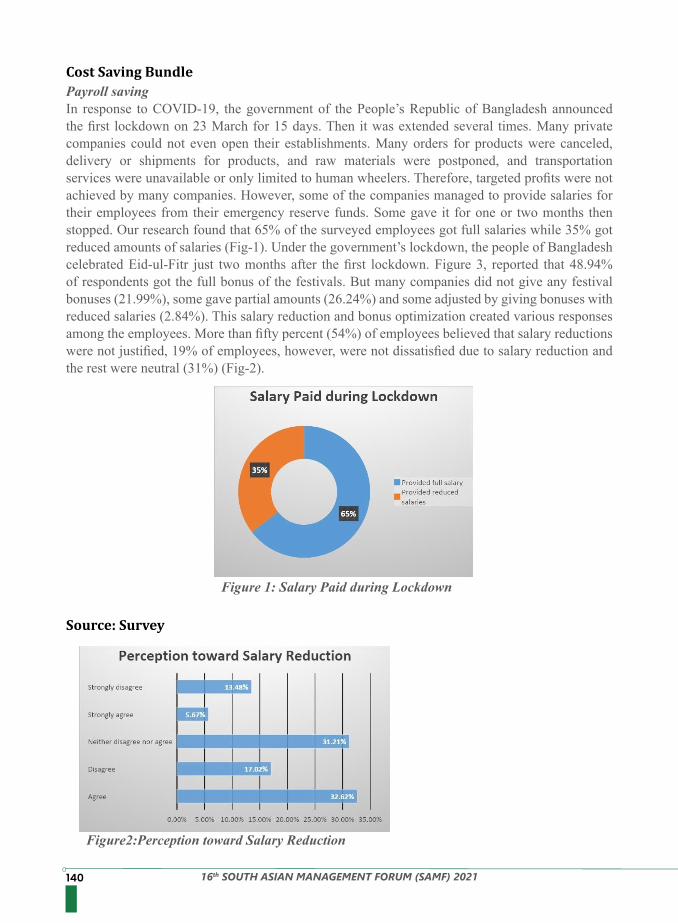
140 16th SOUTH ASIAN MANAGEMENT FORUM (SAMF) 2021
Cost Saving Bundle
Source: Survey
Payroll savingIn response to COVID-19, the government of the People’s Republic of Bangladesh announced the first lockdown on 23 March for 15 days. Then it was extended several times. Many private companies could not even open their establishments. Many orders for products were canceled, delivery or shipments for products, and raw materials were postponed, and transportation services were unavailable or only limited to human wheelers. Therefore, targeted profits were not achieved by many companies. However, some of the companies managed to provide salaries for their employees from their emergency reserve funds. Some gave it for one or two months then stopped. Our research found that 65% of the surveyed employees got full salaries while 35% got reduced amounts of salaries (Fig-1). Under the government’s lockdown, the people of Bangladesh celebrated Eid-ul-Fitr just two months after the first lockdown. Figure 3, reported that 48.94% of respondents got the full bonus of the festivals. But many companies did not give any festival bonuses (21.99%), some gave partial amounts (26.24%) and some adjusted by giving bonuses with reduced salaries (2.84%). This salary reduction and bonus optimization created various responses among the employees. More than fifty percent (54%) of employees believed that salary reductions were not justified, 19% of employees, however, were not dissatisfied due to salary reduction and the rest were neutral (31%) (Fig-2).
Figure 1: Salary Paid during Lockdown
Figure2:Perception toward Salary Reduction
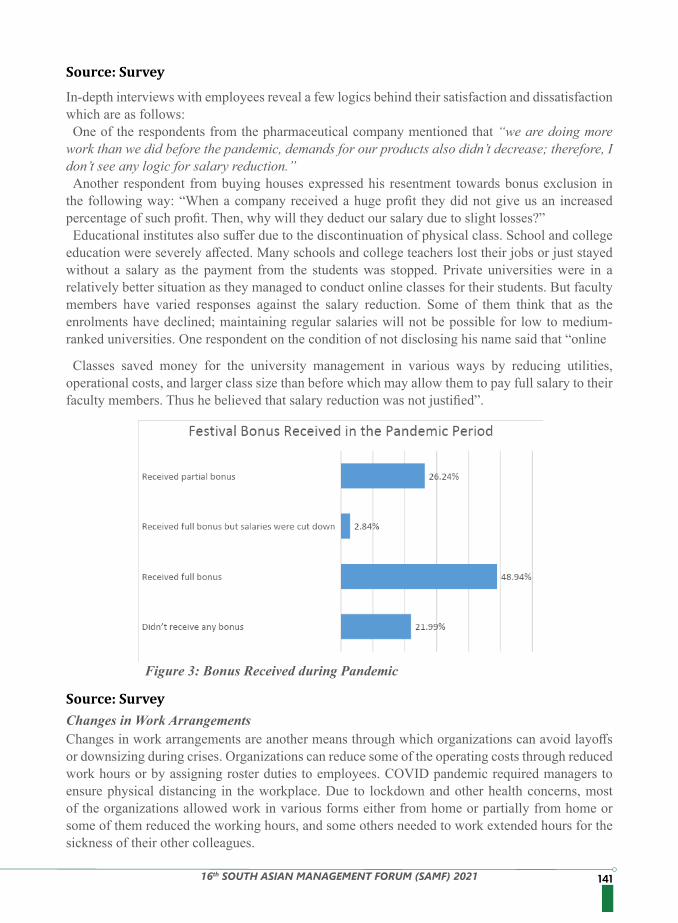
14116th SOUTH ASIAN MANAGEMENT FORUM (SAMF) 2021
Source: Survey
Source: Survey
In-depth interviews with employees reveal a few logics behind their satisfaction and dissatisfaction which are as follows:One of the respondents from the pharmaceutical company mentioned that “we are doing more
work than we did before the pandemic, demands for our products also didn’t decrease; therefore, I don’t see any logic for salary reduction.”Another respondent from buying houses expressed his resentment towards bonus exclusion in
the following way: “When a company received a huge profit they did not give us an increased percentage of such profit. Then, why will they deduct our salary due to slight losses?”Educational institutes also suffer due to the discontinuation of physical class. School and college
education were severely affected. Many schools and college teachers lost their jobs or just stayed without a salary as the payment from the students was stopped. Private universities were in a relatively better situation as they managed to conduct online classes for their students. But faculty members have varied responses against the salary reduction. Some of them think that as the enrolments have declined; maintaining regular salaries will not be possible for low to medium-ranked universities. One respondent on the condition of not disclosing his name said that “online Classes saved money for the university management in various ways by reducing utilities,
operational costs, and larger class size than before which may allow them to pay full salary to their faculty members. Thus he believed that salary reduction was not justified”.
Changes in Work ArrangementsChanges in work arrangements are another means through which organizations can avoid layoffs or downsizing during crises. Organizations can reduce some of the operating costs through reduced work hours or by assigning roster duties to employees. COVID pandemic required managers to ensure physical distancing in the workplace. Due to lockdown and other health concerns, most of the organizations allowed work in various forms either from home or partially from home or some of them reduced the working hours, and some others needed to work extended hours for the sickness of their other colleagues.
Figure 3: Bonus Received during Pandemic
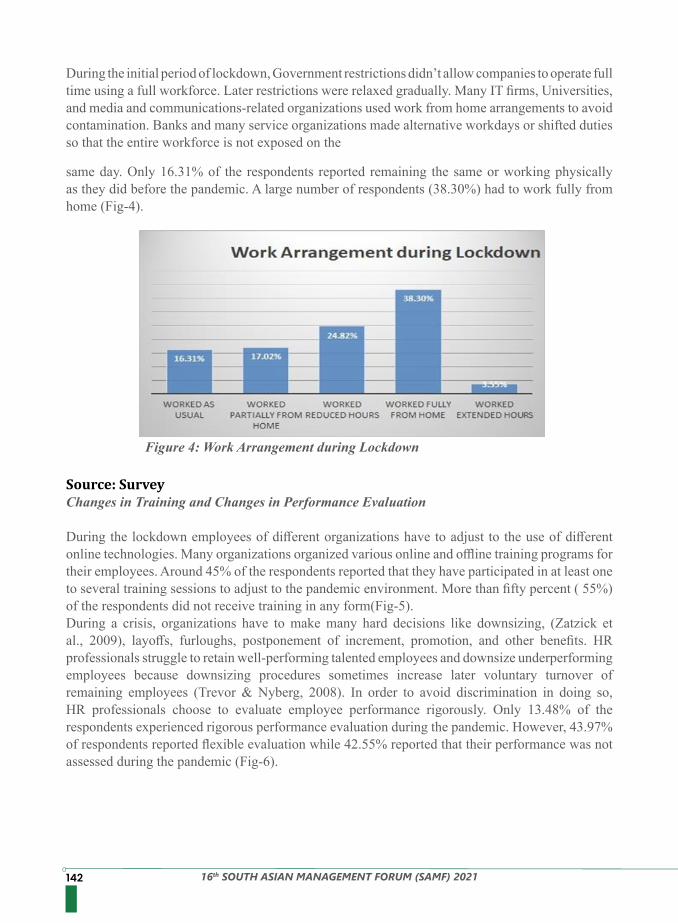
142 16th SOUTH ASIAN MANAGEMENT FORUM (SAMF) 2021
Source: Survey
During the initial period of lockdown, Government restrictions didn’t allow companies to operate full time using a full workforce. Later restrictions were relaxed gradually. Many IT firms, Universities, and media and communications-related organizations used work from home arrangements to avoid contamination. Banks and many service organizations made alternative workdays or shifted duties so that the entire workforce is not exposed on the same day. Only 16.31% of the respondents reported remaining the same or working physically as they did before the pandemic. A large number of respondents (38.30%) had to work fully from home (Fig-4).
Changes in Training and Changes in Performance Evaluation
During the lockdown employees of different organizations have to adjust to the use of different online technologies. Many organizations organized various online and offline training programs for their employees. Around 45% of the respondents reported that they have participated in at least one to several training sessions to adjust to the pandemic environment. More than fifty percent ( 55%) of the respondents did not receive training in any form(Fig-5).During a crisis, organizations have to make many hard decisions like downsizing, (Zatzick et al., 2009), layoffs, furloughs, postponement of increment, promotion, and other benefits. HR professionals struggle to retain well-performing talented employees and downsize underperforming employees because downsizing procedures sometimes increase later voluntary turnover of remaining employees (Trevor & Nyberg, 2008). In order to avoid discrimination in doing so, HR professionals choose to evaluate employee performance rigorously. Only 13.48% of the respondents experienced rigorous performance evaluation during the pandemic. However, 43.97% of respondents reported flexible evaluation while 42.55% reported that their performance was not assessed during the pandemic (Fig-6).
Figure 4: Work Arrangement during Lockdown
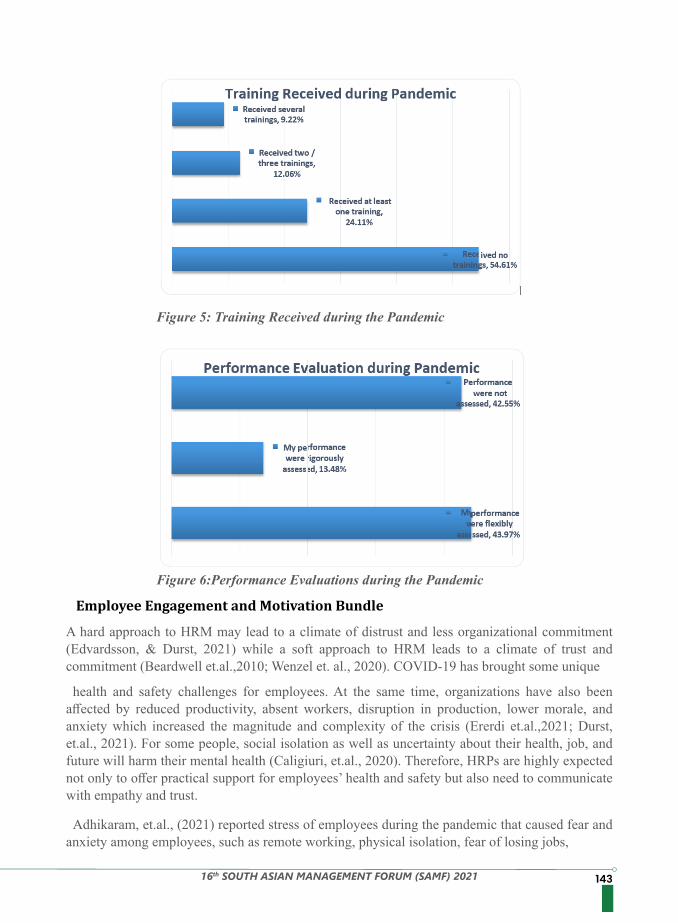
14316th SOUTH ASIAN MANAGEMENT FORUM (SAMF) 2021
Figure 5: Training Received during the Pandemic
Figure 6:Performance Evaluations during the Pandemic
Employee Engagement and Motivation Bundle
A hard approach to HRM may lead to a climate of distrust and less organizational commitment (Edvardsson, & Durst, 2021) while a soft approach to HRM leads to a climate of trust and commitment (Beardwell et.al.,2010; Wenzel et. al., 2020). COVID-19 has brought some unique health and safety challenges for employees. At the same time, organizations have also been
affected by reduced productivity, absent workers, disruption in production, lower morale, and anxiety which increased the magnitude and complexity of the crisis (Ererdi et.al.,2021; Durst, et.al., 2021). For some people, social isolation as well as uncertainty about their health, job, and future will harm their mental health (Caligiuri, et.al., 2020). Therefore, HRPs are highly expected not only to offer practical support for employees’ health and safety but also need to communicate with empathy and trust.
Adhikaram, et.al., (2021) reported stress of employees during the pandemic that caused fear and anxiety among employees, such as remote working, physical isolation, fear of losing jobs,
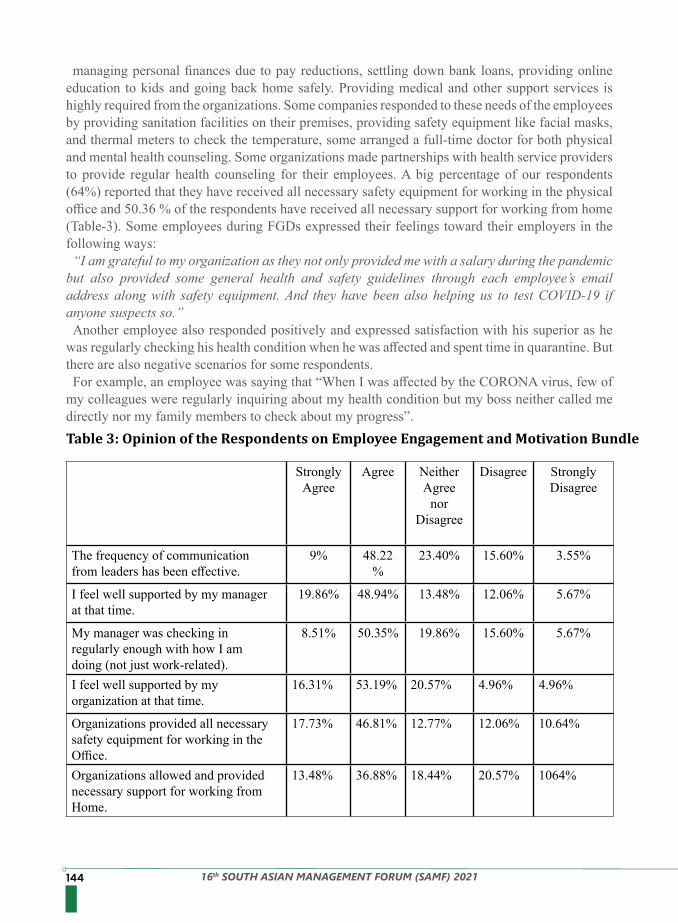
144 16th SOUTH ASIAN MANAGEMENT FORUM (SAMF) 2021
managing personal finances due to pay reductions, settling down bank loans, providing online education to kids and going back home safely. Providing medical and other support services is highly required from the organizations. Some companies responded to these needs of the employees by providing sanitation facilities on their premises, providing safety equipment like facial masks, and thermal meters to check the temperature, some arranged a full-time doctor for both physical and mental health counseling. Some organizations made partnerships with health service providers to provide regular health counseling for their employees. A big percentage of our respondents (64%) reported that they have received all necessary safety equipment for working in the physical office and 50.36 % of the respondents have received all necessary support for working from home (Table-3). Some employees during FGDs expressed their feelings toward their employers in the following ways:“I am grateful to my organization as they not only provided me with a salary during the pandemic
but also provided some general health and safety guidelines through each employee’s email address along with safety equipment. And they have been also helping us to test COVID-19 if anyone suspects so.”Another employee also responded positively and expressed satisfaction with his superior as he
was regularly checking his health condition when he was affected and spent time in quarantine. But there are also negative scenarios for some respondents.For example, an employee was saying that “When I was affected by the CORONA virus, few of
my colleagues were regularly inquiring about my health condition but my boss neither called me directly nor my family members to check about my progress”.Table 3: Opinion of the Respondents on Employee Engagement and Motivation Bundle
StronglyAgree
Agree NeitherAgree
norDisagree
Disagree StronglyDisagree
The frequency of communicationfrom leaders has been effective.
9% 48.22%
23.40% 15.60% 3.55%
I feel well supported by my managerat that time.
19.86% 48.94% 13.48% 12.06% 5.67%
My manager was checking inregularly enough with how I amdoing (not just work-related).
8.51% 50.35% 19.86% 15.60% 5.67%
I feel well supported by myorganization at that time.
16.31% 53.19% 20.57% 4.96% 4.96%
Organizations provided all necessarysafety equipment for working in theOffice.
17.73% 46.81% 12.77% 12.06% 10.64%
Organizations allowed and providednecessary support for working fromHome.
13.48% 36.88% 18.44% 20.57% 1064%
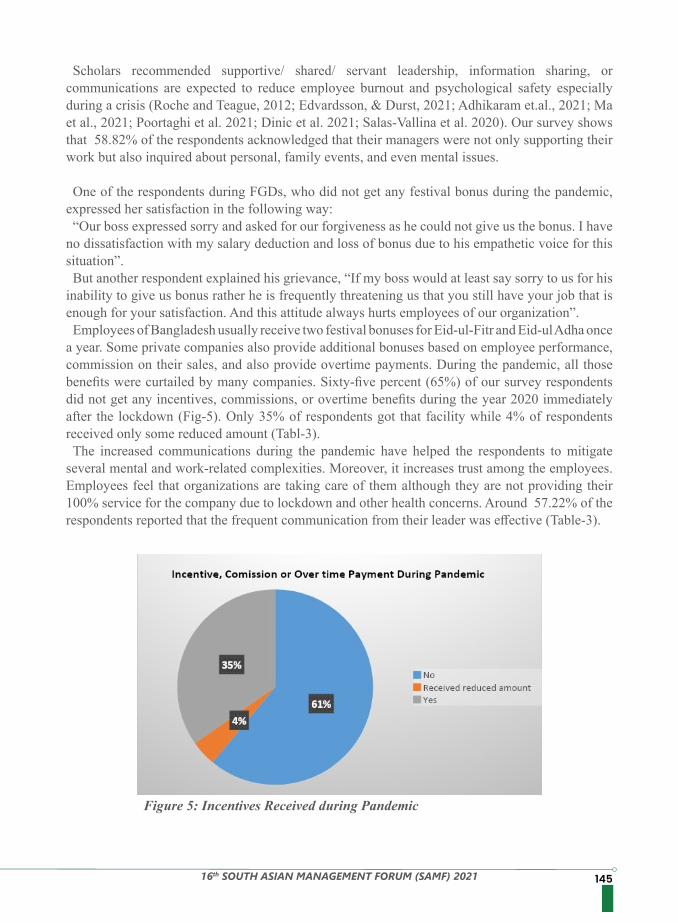
14516th SOUTH ASIAN MANAGEMENT FORUM (SAMF) 2021
Scholars recommended supportive/ shared/ servant leadership, information sharing, or communications are expected to reduce employee burnout and psychological safety especially during a crisis (Roche and Teague, 2012; Edvardsson, & Durst, 2021; Adhikaram et.al., 2021; Ma et al., 2021; Poortaghi et al. 2021; Dinic et al. 2021; Salas-Vallina et al. 2020). Our survey shows that 58.82% of the respondents acknowledged that their managers were not only supporting their work but also inquired about personal, family events, and even mental issues. One of the respondents during FGDs, who did not get any festival bonus during the pandemic,
expressed her satisfaction in the following way:“Our boss expressed sorry and asked for our forgiveness as he could not give us the bonus. I have
no dissatisfaction with my salary deduction and loss of bonus due to his empathetic voice for this situation”.But another respondent explained his grievance, “If my boss would at least say sorry to us for his
inability to give us bonus rather he is frequently threatening us that you still have your job that is enough for your satisfaction. And this attitude always hurts employees of our organization”.Employees of Bangladesh usually receive two festival bonuses for Eid-ul-Fitr and Eid-ul Adha once
a year. Some private companies also provide additional bonuses based on employee performance, commission on their sales, and also provide overtime payments. During the pandemic, all those benefits were curtailed by many companies. Sixty-five percent (65%) of our survey respondents did not get any incentives, commissions, or overtime benefits during the year 2020 immediately after the lockdown (Fig-5). Only 35% of respondents got that facility while 4% of respondents received only some reduced amount (Tabl-3).The increased communications during the pandemic have helped the respondents to mitigate
several mental and work-related complexities. Moreover, it increases trust among the employees. Employees feel that organizations are taking care of them although they are not providing their 100% service for the company due to lockdown and other health concerns. Around 57.22% of the respondents reported that the frequent communication from their leader was effective (Table-3).
Figure 5: Incentives Received during Pandemic
146 16th SOUTH ASIAN MANAGEMENT FORUM (SAMF) 2021
COVID-19 has brought lots of challenges including financial, technological, innovation, and employee-related concerns like employee motivation, engagement, and retention. Although the majority of the employees have come under vaccination, the consequences on physical and mental health remain. Similarly, many companies could not recover from financial and other losses. Therefore, both cost adjustment and employee development and retention will proceed hand in hand. Companies wanting to create employment branding can show more concern for their employees. Because if trust is not developed among employers and employees, companies restructuring and cost adjustment initiatives may not be successful due to a lack of commitment from the employees. HRPs should provide continuous focus on soft HR bundles along with hard HR bundles. Shared communication, servant leadership along with training on sustainability, social responsibility, and organizational citizenship behavior might increase employees’ engagement and commitment to fight against the pandemic and similar other crises due to recession and natural disasters.
1. Adikaram, A.S.; Naotunna, N.; Priyankara, H. Battling COVID-19 with human resource management bundling. Empl. Relat. 2021, 43, 1269–1289.
2. Beardwell, J.; Clark, I. An Introduction to Human Resource Management. In Human Resource Management: A Contemporary Approach, 6th ed.; Beardwell, J., Claydon, T., Eds.; Pearson: London, UK, 2010.
3. Bello-Pintado, A. (2015), “Bundles of HRM practices and performance: empirical evidence from a Latin American context”, Human Resource Management Journal, Vol. 25 No. 3, pp. 311-330.
4. Beltran-Martın, I. and Bou-Llusar, J.C. (2018), “Examining the intermediate role of employee abilities, motivation and opportunities to participate in the relationship between HR bundles and employee performance”, BRQ Business Research Quarterly, Vol. 21 No. 2, pp. 99-110.
5. Boselie, P., Paauwe, J. and Jansen, P. (2001), “Human resource management and performance: lessons from the Netherlands”, The International Journal of Human Resource Management, Vol. 12 No. 7, pp. 1107-1125.
6. Caligiuri, P., De Cieri, H., Minbaeva, D., Verbeke, A. and Zimmermann, A. (2020), “International HRM insights for navigating the COVID-19 pandemic: implications for future research and practice”, Journal of International Business Studies, Vol. 51 No. 5, pp. 697-713.
7. Carnevale, J.B. and Hatak, I. (2020), “Employee adjustment and well-being in the era of COVID- 19: implications for human resource management”, Journal of Business Research, Vol. 116, pp. 183-187.
8. Cameron, K.S. (1994), “Strategies for successful organizational downsizing”, Human Resource Management, Vol. 33 No. 2, pp. 189-211.
9. Dini ́c, M.; Mili ́cevi ́c, M.; Mandi ́c-Rajˇcevi ́c, S.; Tripkovi ́c, K. Health workforce management in the context of the COVID-19 pandemic: A survey of physicians in Serbia. Int. J. Health Plan. Manag. 2021, 36, 92–111. [CrossRef]
10. Durst, S.; Palacios Acuache, M.M.G.; Bruns, G. Peruvian small and medium-sized enterprises and COVID-19: Time for a new start! J. Entrep. Emerg. Econ. 2021, 13, 648–672
11. Delery, J.E. and Doty, D.H. (1996), “Modes of theorizing in strategic human resource management: tests of universalistic, contingency and configurational performance predictions”, Academy of Management Journal, Vol. 39 No. 4, pp. 802-835.
Source: SurveyConcluding Remarks
References
14716th SOUTH ASIAN MANAGEMENT FORUM (SAMF) 2021
12. Ererdi, C.; Nurgabdeshov, A.; Kozhakhmet, S.; Rofcanin, Y.; Demirbag, M. International HRM in the context of uncertainty and crisis: A systematic review of literature (2000–2018). Int. J. Hum. Resour. Manag. 2021. [CrossRef]
13. Edvardsson, I.R.; Óskarsson, G.K. Outsourcing of Human Resources: The Case of Small- and Medium-Sized Enterprises. Merits 2021, 1, 5–15. [CrossRef]
14. Edvardsson, I. R., & Durst, S. (2021). Human Resource Management in Crisis Situations: A Systematic Literature Review. Sustainability, 13(22), 12406.
15. Gunnigle, P., Lavelle, J. and Monaghan, S. (2013), “Weathering the storm? Multinational companies and human resource management through the global financial crisis”, International Journal of Manpower, Vol. 34 No. 3, pp. 214-231.
16. Gooderham, P., Parry, E. and Ringdal, K. (2008), “The impact of bundles of strategic human resource management practices on the performance of European firms”, The International Journal of Human Resource Management, Vol. 19 No. 11, pp. 2041-2056.
17. Ichniowski, C., Shaw, K. and Prennushi, G. (1997), “The effects of human resource management practices on productivity: a study of steel finishing lines”, American Economic Review, Vol. 87 No. 3, pp. 291-313.
18. Johnstone, S. Employment practices, labor flexibility, and the Great Recession: An automotive case study. Econ. Ind. Democr. 2018, 40, 537–559.
19. Kooij, D.T.A.M., Jansen, P.G.W., Dikkers, J.S.E. and Lange, A.H. (2014), “Managing aging workers: a mixed-methods study on bundles of HR practices for aging workers”, The International Journal of Human Resource Management, Vol. 25 No. 15, pp. 2192-2212.
20. Macduffie, J.P. (1995), “Human resource bundles and manufacturing performance: organizational logic and flexible production systems in the world auto industry”, Industrial and Labor Relations Review, Vol. 48 No. 2, pp. 197-221.
21. Monks, K. and Loughnane, M. (2006), “Unwrapping the HRM bundle: HR system design in an Irish power utility”, The International Journal of Human Resource Management, Vol. 17 No. 11, pp. 1926-1941.
22. Ma, Y.; Faraz, N.A.; Ahmed, F.; Iqbal, M.K.; Saeed, U.; Mughal, M.F.; Raza, A. Curbing nurses’ burnout during COVID-19: The roles of servant leadership and psychological safety. J. Nurs. Manag. 2021. [CrossRef] [PubMed]23.
24. Perry-Smith, J.E. and Blum, T.C. (2000), “Work-family human resource bundles and perceived organizational performance”, Academy of Management Journal, Vol. 43 No. 6, pp. 1107-1117.
25. Poortaghi, S.; Shahmari, M.; Ghobadi, A. Exploring nursing managers’ perceptions of nursing workforce management during the outbreak of COVID-19: A content analysis study. BMC Nurs. 2021, 20, 1–10. [CrossRef] [PubMed]
26. Roan, A., Bramble, T. and Lafferty, G. (2001), “Australian Workplace Agreements in practice: the ‘hard’ and ‘soft’ dimensions”, The Journal of Industrial Relations, Vol. 43 No. 4, pp. 387-401.
27. Rudolph, C.W., Allan, B., Clarke, M., Hertel, G., Hirschi, A., Kunze, F., Shockley, K., Shoss, M., Sonnentag, S. and Zacher, H. (2020), “Pandemics: implications for research and practice in industrial and organizational psychology”, Industrial and Organizational Psychology: Perspectives on Science and Practice, Forthcoming, available at: https://psyarxiv.com/k8us2.
28. Roan, A., Bramble, T. and Lafferty, G. (2001), “Australian Workplace Agreements in practice: the ‘hard’ and ‘soft’ dimensions”, The Journal of Industrial Relations, Vol. 43 No. 4, pp. 387-401.
148 16th SOUTH ASIAN MANAGEMENT FORUM (SAMF) 2021
29. Roche, W.K. and Teague, P. (2012), “Business partners and working the pumps: human resource managers in the recession”, Human Relations, Vol. 65 No. 10, pp. 1333-1358.
30. Salas-Vallina, A.; Ferrer-Franco, A.; Herrera, J. Fostering the healthcare workforce during the COVID-19 pandemic: Shared leadership, social capital, and contagion among health professionals. Int. J. Health Plan. Manag. 2020, 35, 1606–1610.
31. Shen, H., Fu, M., Pan, H., Yu, Z. and Chen, Y. (2020), “The impact of the COVID-19 pandemic on firm performance”, Emerging Markets Finance and Trade, Vol. 56 No. 10, pp. 2213-2230.
32. Sibley, C. G., Greaves, L. M., Satherley, N., Wilson, M. S., Overall, N. C., Lee, C. H. J., Milojev, P., Bulbulia, J., Osborne, D., Milfont, T., Houkamau, C. A., Duck, I. M., Vickers-Jones, R., & Barlow, F. K. (2020). Effects of the COVID-19 pandemic and nationwide lockdown on trust, attitudes towards government, and wellbeing. American Psychologist. DOI: 10.1037/amp0000662
33. Santana, M., Valle, R. and Galan, J.L. (2017), “Turnaround strategies for companies in crisis: watch out the causes of decline before firing people”, BRQ Business Research Quarterly, Vol. 20 No. 3, pp. 206-211.
34. Subramony, M. (2009), “A meta-analytic investigation of the relationship between HRM bundles and firm performance”, Human Resource Management, Vol. 48 No. 5, pp. 745-768.
35. Roche, W.K. and Teague, P. (2012), “Business partners and working the pumps: human resource managers in the recession”, Human Relations, Vol. 65 No. 10, pp. 1333-1358.
36. Teague, P. and Roche, W.K. (2014), “Recessionary bundles: HR practices in the Irish economic crisis”, Human Resource Management Journal, Vol. 24 No. 2, pp. 176-192.
37. Truss, C., Gratton, L., Hope-Hailey, V., McGovern, P. and Stiles, P. (1997), “Soft and hard models of human resource management: a reappraisal”, Journal of Management Studies, Vol. 34 No. 1, pp. 53-73.
38. Trevor, C. O., & Nyberg, A. J. (2008). Keeping your headcount when all about you are losing theirs: Downsizing, voluntary turnover rates, and the moderating role of HR practices. Academy of Management Journal, 51(2), 259–276.
39. Wright, P.M. and Snell, S.A. (1991), “Toward an integrative view of strategic human resource management”, Human Resource Management Review, Vol. 1 No. 3, pp. 203-225.
40. Wenzel, M.; Stanske, S.; Lieberman, M.B. Strategic responses to crisis. Strat. Manag. J. 2020, 41, V7–V18.
41. Zatzick, C., Marks, M. L., & Iverson, R. (2009). Which way should you downsize in a crisis? MIT Sloan Management Review, 51, 79–86. DOI: 10.1108/hrmid.2010.04418cad.005
42. Fernández-Castillo, R.; González-Caro, M.; Fernández-García, E.; Porcel-Gálvez, A.; Garnacho- Montero, J. Intensive care nurses’ experiences during the COVID -19 pandemic: A qualitative study. Nurs. Crit. Care 2021, 26, 397–406. [CrossRef]
43. Zikmund, W. G., Carr, J. C., & Griffin, M. (2013). Business Research Methods (Book Only). Cengage Learning.
14916th SOUTH ASIAN MANAGEMENT FORUM (SAMF) 2021
NURTURING GREEN INNOVATIONS THROUGH GREEN TRANSFORMATIONAL LEADERSHIP
B.T.D.N.SenarathDepartment of Operations Management, Faculty of Management, University of Peradeniya, Sri LankaRochelle Anushini BartholomeuszDepartment of Human Resource Management, Faculty of Management, University of Peradeniya, Sri Lanka
The green transformational leadership style is more effective and prominent in driving organizations towards green innovations as it needs to happen only through inspiration and not by force. Thus, the study aimed to investigate the impact of green transformational leadership on green innovations in the Sri Lankan hotel sector. Through convenience sampling, researchers collected data from 172 managerial level employees and utilized the structural modeling equation to analyze data. Findings reveal that green transformational leadership has a 92% impact on green innovations. However, it was evident that the impact of green transformational leadership on the green process innovations was higher than green product innovations in the hotel sector of Sri Lanka.Keywords: Green Innovation, Green Product Innovation, Green Process Innovation, Green
Transformational Leadership, HotelSector
In the past few decades, ecological practices in the hotel sector have been increasingly attractive as a business strategy. Hoteliers eagerly introduced innovative products and services to the economy to create a better green future. But unfortunately, still, the Sri Lankan hotel sector is under pressure as they have been continuously forced to stay ahead with the emerging environmental trends and issues (Pereira et al., 2021). Most of the hotels that contribute to the Sri Lankan economy have already degraded and depleted the country’s ecological resources to a greater extent (Pereira et al., 2021). On the other hand with the COVID-19 outbreak, such green concepts and practices disappeared as hotels were notably impacted by the pandemic and were inactive for a long time. Indeed, hotels are one of the first sectors affected by COVID-19 and mostly the last sector to recover. So with this prevailing situation, hoteliers realized that they should not invest further in infrastructure or research and development as they cannot guarantee favorable revenue (Andrews, 2021).
However, Moramudali and Manawadu (2018) highlighted that greening is no longer a novel notion for hoteliers due to overwhelming demand from key stakeholders, including government and non-government entities, to align its operations with sustainable practices. Since the hotel sector of Sri
Lanka has been acknowledged as a prominent revenue-generating source to the nation, and the discussion on managing the environmental aspects within the industry plays a crucial role in this regard. Unlike before, the perception of modern customers is changing drastically where local and international travelers become more environmentally conscious (Nuskiya et al., 2020). Based on the newest trends, an increasing number of travelers are opting for an environmentally friendly trip. With this scenario, travelers have been inspired to give more priority to eco-friendly hotels. On the other hand, even the hoteliers have recognized the favorable outcomes of going green such as conserving water, energy, and soil. Though green initiatives are being implemented in hotels worldwide, they are still not popular in the Sri Lankan context (Nuskiya et al., 2020).
Introduction
150 16th SOUTH ASIAN MANAGEMENT FORUM (SAMF) 2021
According to Choi et al. (2016), green innovations can be defined as a type of innovation that helps to minimize the environmental impact while protecting biodiversity. In other words, green innovations can be defined as the “innovations that consist of new or modified processes, practices, systems, and products which benefit the environment and contribute to environmental sustainability (Oltra& Jean, 2009, p. 567).
However, going green is challenging and cannot be done overnight. Hence, it is required to determine suitable strategies to inspire and nurture green innovations within and among hotels (Janszen&Janszen, 2000). Along with this notion, Zheng et al. (2019) found that leadership is indispensable in facilitating and motivating organizations to be innovative. But, particularly, Choi et al. (2016) found that transformational leaders are more effective and prominent in driving organizations toward green innovations because it needs to happen only through inspiration and not by force. Such transformational leaders are willing to persuade their followers to meet and exceed environmental goals and objectives (Chen & Chang, 2013). Probably green transformational leaders can motivate employees through environmental vision, environmental plans, green ideas, and green practices. Thus, there are promising avenues for green transformational leaders to become effective in green innovations. According to Chen & Chang (2013, p. 113), “the leaders who motivate followers to achieve environmental goals and inspire followers to perform beyond expected levels of environmental performance” is known as green transformational leadership. Though, Robertson (2018) has stated that the four dimensions of transformational leadership such as idealized influence, inspirational motivation, intellectual stimulation, and individualized consideration could be used successfully to measure green transformational leadership it has not been properly measured and validated yet. Even Khalili (2016) declared that green transformational leadership is ideal in fostering behaviors that would uplift green innovations in the corporate world compared to other leadership styles. Though there are plenty of studies on leadership and green innovations worldwide, there is a scant number of evidence exploring the effect of green transformational leadership on green innovations and in relation to the hotel sector. Further, previous scholars have investigated the effect of green transformational leadership on green innovations as a whole ignoring the classification of product innovation and process innovation. Most importantly, previous scholars have not studied the effect of green transformational leadership on green product innovation and green process innovation using the resource-based theory. Thus, the study will immensely contribute to filling the above-mentioned research gaps.
Innovations play a major role in terms of gaining competitive advantage as the competitiveness of the present VUCA (Volatile, Uncertain, Complex, and Ambiguity) world is rapidly growing than it has been in the past decades. Various scholars have defined the innovations in different ways. Larsen (2005) has defined innovations as the invention or development practices that an organization is implementing to apply technical or organizational novelty into practice. Damanpour (1996) defined innovations as the adoption of an entirely new idea or a behavior pattern in the company. OECD (2005) has classified innovations as product innovations, process innovations, marketing innovations, and organizational innovations. Kucukuglu& Pinar (2015) has identified that green innovations can attract the attention of organizations that focus on high market ratios and competitive advantage. Green innovations can be defined as manufacturing and delivering environmentally friendly products and processes with the espousal of the organizational practices where the organizations trying to reduce the harmful practices (Albort et al, 2016).
LITERATURE REVIEWGreen Innovations
15116th SOUTH ASIAN MANAGEMENT FORUM (SAMF) 2021
A study conducted by Albort et al (2017) has stated that various past research findings have revealed that the organizations that adopt green innovation practices in the organization are more successful than compared to the other organizations in using their resources and capabilities to satisfy the customer requirements while minimizing the wastage. Kemp & Arundel (2018) have identified the main objectives of green innovations are to reduce environmental pollution, increase productivity and decrease wastage by introducing the ways by which they can save the environment through green innovations. Green innovations can be classified in terms of product innovations and process innovations (Singh et al, 2020). Green Product Innovations is defined as manufacturing products that have a positive impact on the environment throughout the product lifecycle (Durif et al, 2010), and green process innovations as the practices or the processes that have been developed or added newly to reduce the environmental effects. (Cheng et al, 2014).
According to Bass (1985), the characteristics and behavior patterns of the leaders can influence the behavior patterns of the subordinates. Among all the leadership styles, transformational leaders can motivate their subordinates to perform beyond their self-interest through the characteristics such as charisma, inspirational motivation, intellectual stimulation, and individualized consideration (Bass, 2000). According to his definition, transformational leaders are capable of providing an inspirational vision for their followers in which they can motivate them more to achieve the goals and objectives of the organization. Moreover, Elkins (2003) has stated that transformational leaders can encourage more creative ideas within the organization and that will help them to work as creativity-enhancing forces in the organization. According to Chen et al (2013), transformational leaders can affect creativity by inspiring green products and services. Once the organizations consist of transformational leaders who motivate and inspire the workforce to come up with environmentally friendly products to come up with solutions to the environmental problems, that will be directly beneficial to the economy and the well-begin of the individuals in the society (Chen, 2008) and these types of leaders are known as Green Transformational Leaders.
The concept of Green Transformational Leadership is defined as the behavior patterns of the leader that inspire the subordinates to accomplish the goals and objectives that concern the environment and motivate the employees to execute their responsibilities beyond the level of expectations that will lead to promoting high performance in terms of green creativity (Bass, 1998).
Several scholars have investigated the relationship between Green Transformational Leadership with Green Innovations and they have come up with new findings that have enriched the value of the existing literature. The current study is based on the resource-based theory. It is an approach of strategy formulation aimed at attaining a competitive advantage based on an organization’s resources. Under this view, Organizations look for competitive advantage within themselves as opposed to looking for a competitive environment outside (Barne,1991). Capabilities refer to an organization’s ability to assemble, integrate, and deploy valued resources (Amit and, Schoemaker, 1993). Firms should concentrate on their core competencies to edge out competitors by creating products that are difficult to copy. Capabilities are embedded in business routines and processes. Thus, the concept of Green Transformational Leadership can be elaborated through this view as the dynamic combination of incentives, persons, and processes utilized by companies to adjust inputs to yields determines organizational capabilities (Alsheikh, 2020).
Green Transformational Leadership
Green Transformational Leadership and Green innovations
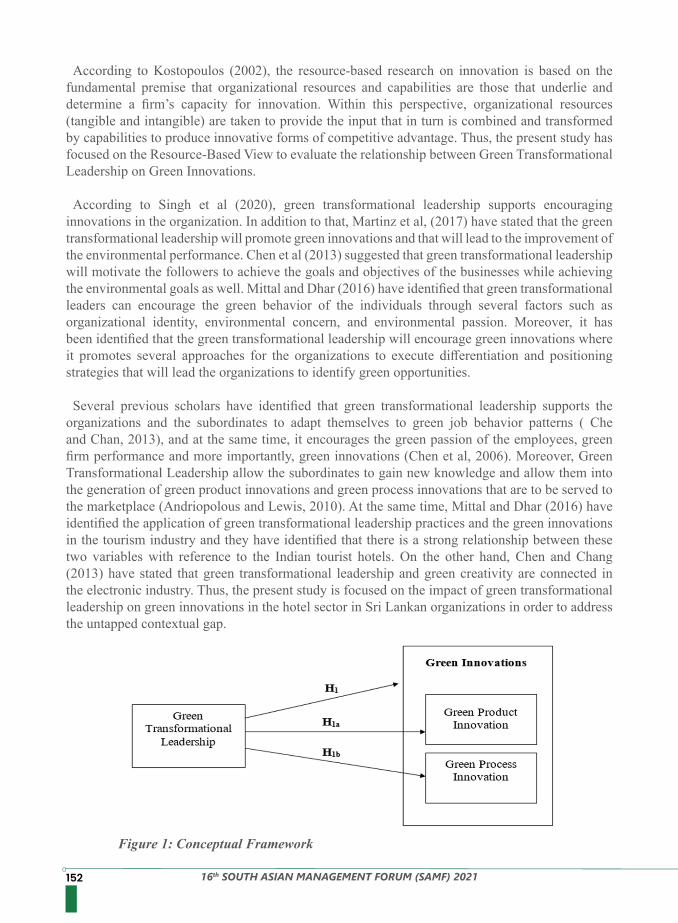
152 16th SOUTH ASIAN MANAGEMENT FORUM (SAMF) 2021
According to Kostopoulos (2002), the resource-based research on innovation is based on the fundamental premise that organizational resources and capabilities are those that underlie and determine a firm’s capacity for innovation. Within this perspective, organizational resources (tangible and intangible) are taken to provide the input that in turn is combined and transformed by capabilities to produce innovative forms of competitive advantage. Thus, the present study has focused on the Resource-Based View to evaluate the relationship between Green Transformational Leadership on Green Innovations.
According to Singh et al (2020), green transformational leadership supports encouraging innovations in the organization. In addition to that, Martinz et al, (2017) have stated that the green transformational leadership will promote green innovations and that will lead to the improvement of the environmental performance. Chen et al (2013) suggested that green transformational leadership will motivate the followers to achieve the goals and objectives of the businesses while achieving the environmental goals as well. Mittal and Dhar (2016) have identified that green transformational leaders can encourage the green behavior of the individuals through several factors such as organizational identity, environmental concern, and environmental passion. Moreover, it has been identified that the green transformational leadership will encourage green innovations where it promotes several approaches for the organizations to execute differentiation and positioning strategies that will lead the organizations to identify green opportunities.
Several previous scholars have identified that green transformational leadership supports the organizations and the subordinates to adapt themselves to green job behavior patterns ( Che and Chan, 2013), and at the same time, it encourages the green passion of the employees, green firm performance and more importantly, green innovations (Chen et al, 2006). Moreover, Green Transformational Leadership allow the subordinates to gain new knowledge and allow them into the generation of green product innovations and green process innovations that are to be served to the marketplace (Andriopolous and Lewis, 2010). At the same time, Mittal and Dhar (2016) have identified the application of green transformational leadership practices and the green innovations in the tourism industry and they have identified that there is a strong relationship between these two variables with reference to the Indian tourist hotels. On the other hand, Chen and Chang (2013) have stated that green transformational leadership and green creativity are connected in the electronic industry. Thus, the present study is focused on the impact of green transformational leadership on green innovations in the hotel sector in Sri Lankan organizations in order to address the untapped contextual gap.
Figure 1: Conceptual Framework
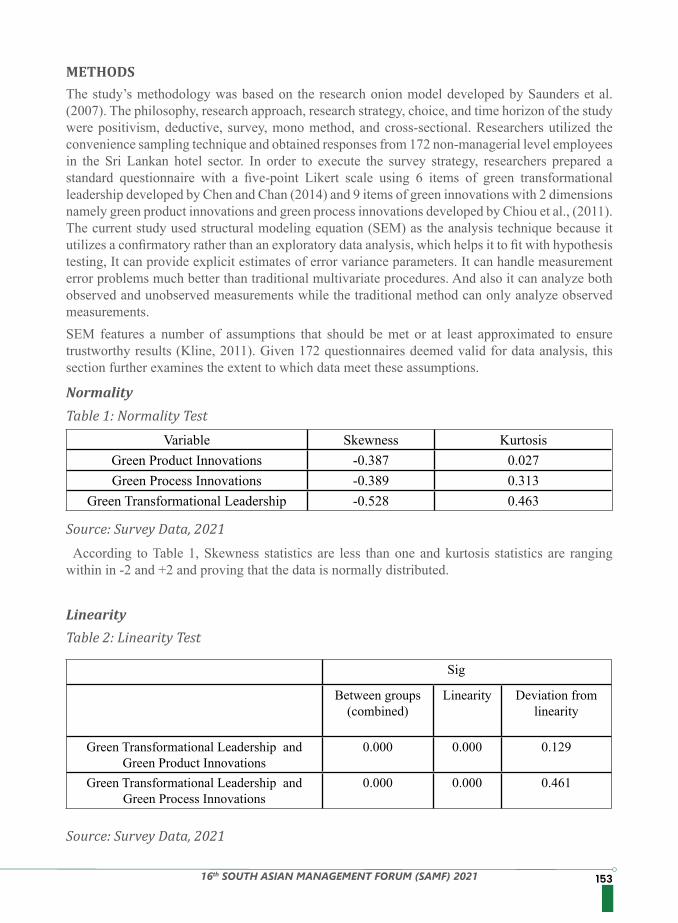
15316th SOUTH ASIAN MANAGEMENT FORUM (SAMF) 2021
The study’s methodology was based on the research onion model developed by Saunders et al. (2007). The philosophy, research approach, research strategy, choice, and time horizon of the study were positivism, deductive, survey, mono method, and cross-sectional. Researchers utilized the convenience sampling technique and obtained responses from 172 non-managerial level employees in the Sri Lankan hotel sector. In order to execute the survey strategy, researchers prepared a standard questionnaire with a five-point Likert scale using 6 items of green transformational leadership developed by Chen and Chan (2014) and 9 items of green innovations with 2 dimensions namely green product innovations and green process innovations developed by Chiou et al., (2011). The current study used structural modeling equation (SEM) as the analysis technique because it utilizes a confirmatory rather than an exploratory data analysis, which helps it to fit with hypothesis testing, It can provide explicit estimates of error variance parameters. It can handle measurement error problems much better than traditional multivariate procedures. And also it can analyze both observed and unobserved measurements while the traditional method can only analyze observed measurements.SEM features a number of assumptions that should be met or at least approximated to ensure trustworthy results (Kline, 2011). Given 172 questionnaires deemed valid for data analysis, this section further examines the extent to which data meet these assumptions.
According to Table 1, Skewness statistics are less than one and kurtosis statistics are ranging within in -2 and +2 and proving that the data is normally distributed.
METHODS
Normality
Linearity
Table 1: Normality Test
Table 2: Linearity Test
Source: Survey Data, 2021
Source: Survey Data, 2021
Variable Skewness KurtosisGreen Product Innovations -0.387 0.027Green Process Innovations -0.389 0.313
Green Transformational Leadership -0.528 0.463
Sig
Between groups(combined)
Linearity Deviation from linearity
Green Transformational Leadership and Green Product Innovations
0.000 0.000 0.129
Green Transformational Leadership and Green Process Innovations
0.000 0.000 0.461
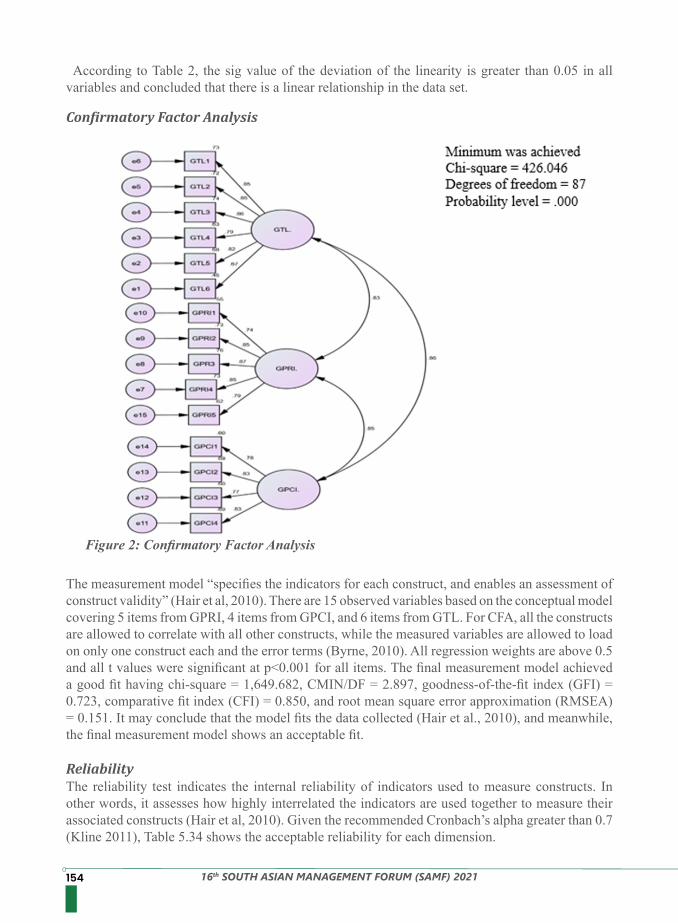
154 16th SOUTH ASIAN MANAGEMENT FORUM (SAMF) 2021
According to Table 2, the sig value of the deviation of the linearity is greater than 0.05 in all variables and concluded that there is a linear relationship in the data set.
The measurement model “specifies the indicators for each construct, and enables an assessment of construct validity” (Hair et al, 2010). There are 15 observed variables based on the conceptual model covering 5 items from GPRI, 4 items from GPCI, and 6 items from GTL. For CFA, all the constructs are allowed to correlate with all other constructs, while the measured variables are allowed to load on only one construct each and the error terms (Byrne, 2010). All regression weights are above 0.5 and all t values were significant at p<0.001 for all items. The final measurement model achieved a good fit having chi-square = 1,649.682, CMIN/DF = 2.897, goodness-of-the-fit index (GFI) = 0.723, comparative fit index (CFI) = 0.850, and root mean square error approximation (RMSEA) = 0.151. It may conclude that the model fits the data collected (Hair et al., 2010), and meanwhile, the final measurement model shows an acceptable fit.
The reliability test indicates the internal reliability of indicators used to measure constructs. In other words, it assesses how highly interrelated the indicators are used together to measure their associated constructs (Hair et al, 2010). Given the recommended Cronbach’s alpha greater than 0.7 (Kline 2011), Table 5.34 shows the acceptable reliability for each dimension.
Confirmatory Factor Analysis
Reliability
Figure 2: Confirmatory Factor Analysis
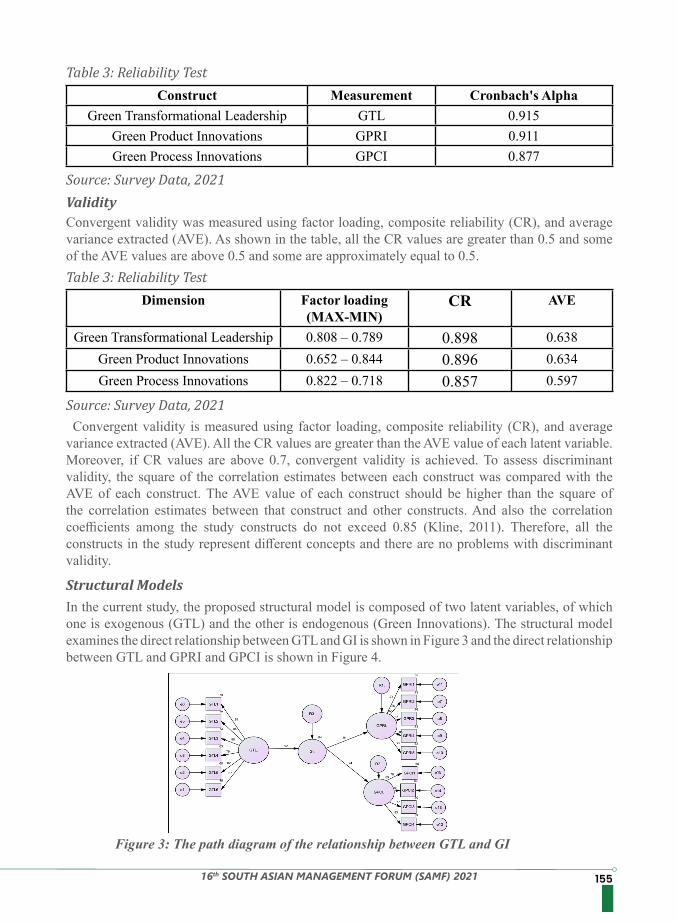
15516th SOUTH ASIAN MANAGEMENT FORUM (SAMF) 2021
Convergent validity was measured using factor loading, composite reliability (CR), and average variance extracted (AVE). As shown in the table, all the CR values are greater than 0.5 and some of the AVE values are above 0.5 and some are approximately equal to 0.5.
Convergent validity is measured using factor loading, composite reliability (CR), and average variance extracted (AVE). All the CR values are greater than the AVE value of each latent variable. Moreover, if CR values are above 0.7, convergent validity is achieved. To assess discriminant validity, the square of the correlation estimates between each construct was compared with the AVE of each construct. The AVE value of each construct should be higher than the square of the correlation estimates between that construct and other constructs. And also the correlation coefficients among the study constructs do not exceed 0.85 (Kline, 2011). Therefore, all the constructs in the study represent different concepts and there are no problems with discriminant validity.
In the current study, the proposed structural model is composed of two latent variables, of which one is exogenous (GTL) and the other is endogenous (Green Innovations). The structural model examines the direct relationship between GTL and GI is shown in Figure 3 and the direct relationship between GTL and GPRI and GPCI is shown in Figure 4.
Validity
Structural Models
Figure 3: The path diagram of the relationship between GTL and GI
Construct Measurement Cronbach's AlphaGreen Transformational Leadership GTL 0.915
Green Product Innovations GPRI 0.911Green Process Innovations GPCI 0.877
Dimension Factor loading (MAX-MIN)
CR AVE
Green Transformational Leadership 0.808 – 0.789 0.898 0.638Green Product Innovations 0.652 – 0.844 0.896 0.634Green Process Innovations 0.822 – 0.718 0.857 0.597
Table 3: Reliability Test
Table 3: Reliability Test
Source: Survey Data, 2021
Source: Survey Data, 2021
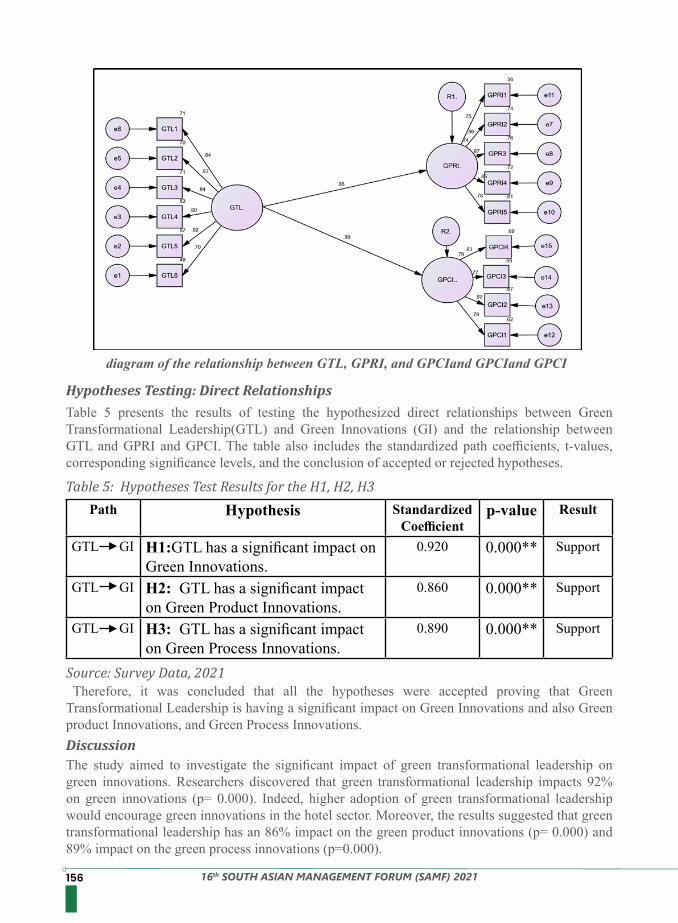
156 16th SOUTH ASIAN MANAGEMENT FORUM (SAMF) 2021
diagram of the relationship between GTL, GPRI, and GPCIand GPCIand GPCI
Hypotheses Testing: Direct Relationships
Discussion
Table 5 presents the results of testing the hypothesized direct relationships between Green Transformational Leadership(GTL) and Green Innovations (GI) and the relationship between GTL and GPRI and GPCI. The table also includes the standardized path coefficients, t-values, corresponding significance levels, and the conclusion of accepted or rejected hypotheses.
Therefore, it was concluded that all the hypotheses were accepted proving that Green Transformational Leadership is having a significant impact on Green Innovations and also Green product Innovations, and Green Process Innovations.
The study aimed to investigate the significant impact of green transformational leadership on green innovations. Researchers discovered that green transformational leadership impacts 92% on green innovations (p= 0.000). Indeed, higher adoption of green transformational leadership would encourage green innovations in the hotel sector. Moreover, the results suggested that green transformational leadership has an 86% impact on the green product innovations (p= 0.000) and 89% impact on the green process innovations (p=0.000).
Path Hypothesis Standardized Coefficient
p-value Result
GTL GI H1:GTL has a significant impact on Green Innovations.
0.920 0.000** Support
GTL GI H2: GTL has a significant impact on Green Product Innovations.
0.860 0.000** Support
GTL GI H3: GTL has a significant impact on Green Process Innovations.
0.890 0.000** Support
Table 5: Hypotheses Test Results for the H1, H2, H3
Source: Survey Data, 2021
15716th SOUTH ASIAN MANAGEMENT FORUM (SAMF) 2021
THEORETICAL IMPLICATIONS
However, it was evident that the impact of green transformational leadership on the green process innovations was higher than green product innovations in the hotel sector of Sri Lanka. One of the main reasons for this finding would be hotels belong to the service sector category and might be focusing more on the development of processes than the products within the industry. Since all the hypotheses were accepted, it proved that the Sri Lankan hotel sector can enhance the level of green innovations in terms of green product innovations and green process innovations by strengthening the green transformational leadership in the workplace. The findings of the present study are consistent with most of the previous studies. For instance, Mital and Dhar (2016) found a positive relationship between the green transformational leadership and green innovation in the tourism sector in India. Similarly, Che and Chan (2013) identified green transformational leadership can effectively support the organization and its subordinates to uplift green job behaviors, green passion, and, green innovations in the Electronic industry. Andriopolous and Lewis (2010), and Ahmed et al. (2020) also proved that green transformational leadership can promote green innovations in product designing and pharmaceutical industries, respectively. Further, innovations would enhance the environmental performance of Small and Medium Enterprises.
According to the resource-based theory, the organization can gain a competitive advantage through its internal resources. According to Ozgul and Zehir (2021) green transformational leadership is a valuable internal resource. On the other hand, there is an opportunity for an organization to gain and sustain a competitive advantage through green innovations (Gürlek and Tuna, 2017) and it could be either green product innovations or green process innovations(Xie et al., 2019). Hence, it is evident that green transformational leadership helps an organization to achieve a competitive advantage through green innovations. Even the researchers of the present study proved that green transformational leadership can be used effectively in order to nurture green innovations.
Further, the study proved that organizations in the hotel sector can achieve a competitive advantage more from green process innovations than green product innovations with the support of green transformational leadership. Further, this investigation advances the development of the existing literature on green transformational leadership, green product innovations, and green process innovations. Green transformational leaders have a great deal of potential to influence employees and in nurturing the desired behaviors. Initially, green transformational leaders need to walk the green talk. Though going green is no more a new concept, there can be green transformational leaders like mushrooms all over the organization. But most of those leaders failed to walk the green talk. Initially, the leader needs to cultivate a positive mindset and a true purpose for his or her green attitude and behavior. At the same time, need to be aware of greenwashing, which means leaders should not try to build false impressions or misleading information that their organization probably the products, processes, or services are environmentally friendly. Leaders need to be role models. Hence, it is vital to initiate a green competence across the top leadership to inspire green behaviors among the employees. And also it is necessary to create programs to reward and recognize the outstanding efforts of leaders in fulfilling innovative strategies to improve the hotel’s environmental sustainability. Further, transformational leaders need to be educated on green-collar jobs and need to be aware of green careers in the workplace.
158 16th SOUTH ASIAN MANAGEMENT FORUM (SAMF) 2021
REFERENCES1. Albort-Morant, G., Leal-Millán, A., &Cepeda-Carrión, G. (2016). The antecedents of green
innovation performance: A model of learning and capabilities. Journal Of Business Research, 69(11), 4912-4917. https://doi.org/10.1016/j.jbusres.2016.04.052
2. Andriopoulos, C., & Lewis, M. (2010). Managing Innovation Paradoxes: Ambidexterity Lessons from Leading Product Design Companies. Long Range Planning, 43(1), 104-122. https://doi.org/10.1016/j.lrp.2009.08.003
3. Bass, B. (2000). The Future of Leadership in Learning Organizations. Journal Of Leadership Studies, 7(3), 18-40. https://doi.org/10.1177/107179190000700302
4. Chen, Y., & Chang, C. (2012). The Determinants of Green Product Development Performance: Green Dynamic Capabilities, Green Transformational Leadership, and Green Creativity. Journal of Business Ethics, 116(1), 107-119.
5. Chen, Y., Lai, S., & Wen, C. (2006). The Influence of Green Innovation Performance on Corporate Advantage in Taiwan. Journal Of Business Ethics, 67(4), 331-339. https://doi.org/10.1007/s10551-006-9025-5
6. Cheng, C., Yang, C., &Sheu, C. (2014). The link between eco-innovation and business performance: a Taiwanese industry context. Journal Of Cleaner Production, 64, 81-90. https://doi.org/10.1016/j.jclepro.2013.09.050
7. Choi, S., Kim, K., Ullah, S., & Kang, S. (2016). How transformational leadership facilitates innovative behavior of Korean workers. Personnel Review, 45(3), 459-479. https://doi.org/10.1108/pr-03- 2014-0058
8. Damanpour, F. (1996). Organizational Complexity and Innovation: Developing and Testing Multiple Contingency Models. Management Science, 42(5), 693-716. https://doi.org/10.1287/mnsc.42.5.693
9. Durif, F., Boivin, C., & Julien, C. (2010). In search of a green product definition. Innovative Marketing, 6(1), 25-33.
10. Elkins, T., & Keller, R. T. (2003). Leadership in research and development organizations: A literature review and conceptual framework. The leadership quarterly, 14(4-5), 587-606.
11. Gürlek, M., & Tuna, M. (2018). Reinforcing competitive advantage through green organizational culture and green innovation. The service industries journal, 38(7-8), 467-491.
12. http://www.uis.unesco.org/Library/Documents/OECDOsloManual05_en.pdf.13. Janszen, F. (2000). The age of Innovation. Making business creativity a competence, not a
coincidence. Financial Times/Prentice Hall.14. Kang, M., & Lee, M. J. (2017). Absorptive capacity, knowledge sharing, and innovative
behavior of R&D employees. Technology Analysis & Strategic Management, 29(2), 219-232
15. Khalili, A. (2016). Linking transformational leadership, creativity, innovation, and innovation- supportive climate. Management Decision.
16. Küçükoğlu, M. T., & Pınar, R. İ. (2015). Positive influences of green innovation on company performance. Procedia-Social and Behavioral Sciences, 195, 1232-1237.
17. Larsen, O. M. (2005). Governing innovation for sustainable development: integration of environmental and innovation policies in Norway (Master’s thesis).
18. Longshore, J., & Bass, B. (1987). Leadership and Performance beyond Expectations. The Academy Of Management Review, 12(4), 756. doi: 10.2307/258081
19. Martinez-Conesa, I., Soto-Acosta, P., &Carayannis, E. G. (2017). On the path towards open innovation: Assessing the role of knowledge management capability and environmental dynamism in SMEs. Journal of Knowledge Management.
15916th SOUTH ASIAN MANAGEMENT FORUM (SAMF) 2021
20. Mittal, S., &Dhar, R. L. (2015). Transformational leadership and employee creativity: mediating role of creative self-efficacy and moderating role of knowledge sharing. Management Decision.
21. Petts, J. (1998). Environmental responsiveness, individuals and organizational learning: SME experience. Journal of environmental planning and management, 41(6), 711-730.
22. Singh, S. K., Del Giudice, M., Chierici, R., &Graziano, D. (2020). Green innovation and environmental performance: The role of green transformational leadership and green human resource management. Technological Forecasting and Social Change, 150, 119762.
23. Tan, C. L., &Nasurdin, A. M. (2011). Human resource management practices and organizational innovation: assessing the mediating role of knowledge management effectiveness. Electronic journal of knowledge management, 9(2), 155.
24. Xie, X., Huo, J., & Zou, H. (2019). Green process innovation, green product innovation, and corporate financial performance: A content analysis method. Journal of Business Research, 101, 697-706.
25. Zehir, C., & ÖZGÜL, B. (2021). The Influence of Green-Transformational Leadership Style on Corporate Sustainability: A Systematic Literature Review and Propositions for Future Studies. Istanbul Management Journal, (90), 1-30.
26. Zheng, J., Wu, G., Xie, H., & Li, H. (2019). Leadership, organizational culture, and innovative behavior in construction projects: The perspective of behavior-value congruence. International Journal of Managing Projects in Business.
160 16th SOUTH ASIAN MANAGEMENT FORUM (SAMF) 2021
SUSTAINABLE EMPLOYEE PERFORMANCE: THE MOTIVATIONAL THEORY OF LIFESPAN DEVELOPMENT PERSPECTIVE
Mahmud Hamid*1, Mohammed Kamruzzaman2 Asma Ul Hosna3
1 Putra Business School, Universiti Putra Malaysia, Malaysia2Assistant Professor, College of Business Administration, IUBAT - International University of Business Agriculture and Technology, Bangladesh3Taman Tenega, Kajang 43000, Malaysia
Sustainable employee performance is crucial for organization sustainability as employees play a key role. Due to the pandemic, new changes in the workplaces have created difficulties for employees and organizations to sustain performance. Employee performance sustainability refers to maintaining performance at a standard for the long term and every organization consists of a diverse age group of employees. Old-age employees are more vulnerable to the virus. Employees tend to be having more fear and less performance due to the pandemic. This study intends to develop a sustainable employee performance conceptual model based on the motivational theory of lifespan development, which intends to serve organizations and employees in terms of sustaining performance both during and after pandemic scenarios. Motivation and Self-efficacy play a driver for sustainable employee performance by helping employees to re-engage with goal attainment mechanisms even in older age. Based on this study, future directions have been provided. On this issue, we hope to provide solid information about sustainable employee performance and potential future paths for further studies.
The majority of attention on the notion of sustainability has been focused on its implications on the physical environment. This poses significant concerns, such as, “What about employees and employee sustainability?” What about human resource management for long-term success? What are the long-term effects of management approaches on employee sustainability? (de Jonge & Peeters, 2019; Patterson, 2001). Employees are important elements of an organization’s sustainability. If we consider the Covid-19 pandemic, where employee performance is hampered a lot due to working from home or working from the office and the fear of having coronavirus (Hamid et al.,2021). In both cases during or after the pandemic, employee performance needs to be sustained for the sake of organizations and economic development as employees or workers play a key role in this matter (Min et al., 2020).
Employees as an individual are different from one another by nature, character, and age. That is the main issue in treating employees at an organization (Heckhausen et.al.,2010). Based on this concept from MTD theory, and considering the post-pandemic situation, this study intends to propose a sustainable employee performance framework based on the motivational theory of lifespan perspective to fulfill the theoretical and managerial gap.
Keywords: Sustainable Employee Performance, Self-Efficacy, Motivation, Covid-19, The Motivational Theory of Lifespan Development.
Introduction
Abstract
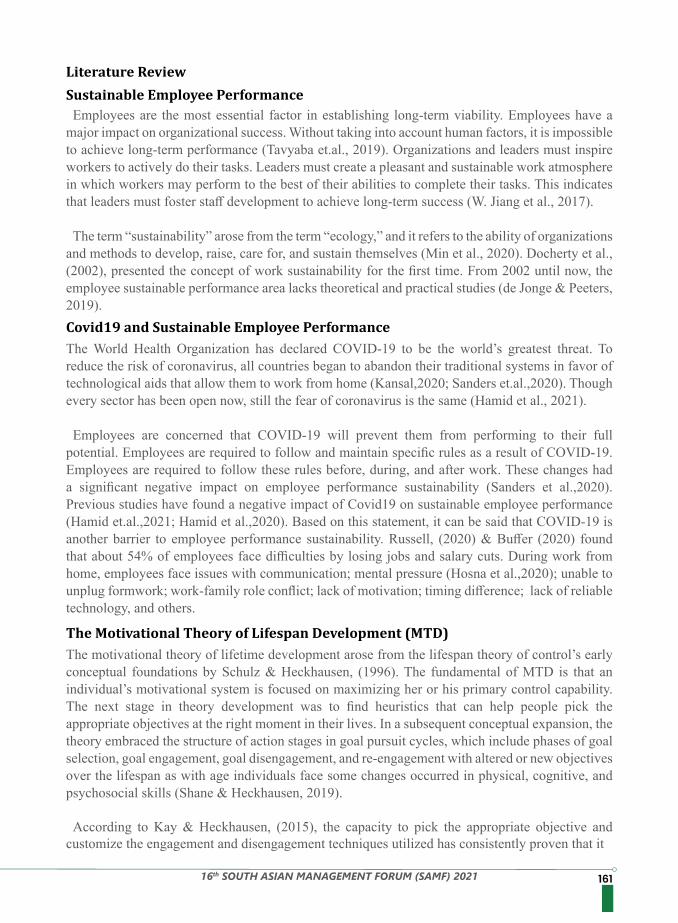
16116th SOUTH ASIAN MANAGEMENT FORUM (SAMF) 2021
Employees are the most essential factor in establishing long-term viability. Employees have a major impact on organizational success. Without taking into account human factors, it is impossible to achieve long-term performance (Tavyaba et.al., 2019). Organizations and leaders must inspire workers to actively do their tasks. Leaders must create a pleasant and sustainable work atmosphere in which workers may perform to the best of their abilities to complete their tasks. This indicates that leaders must foster staff development to achieve long-term success (W. Jiang et al., 2017).
The term “sustainability” arose from the term “ecology,” and it refers to the ability of organizations and methods to develop, raise, care for, and sustain themselves (Min et al., 2020). Docherty et al., (2002), presented the concept of work sustainability for the first time. From 2002 until now, the employee sustainable performance area lacks theoretical and practical studies (de Jonge & Peeters, 2019).
The World Health Organization has declared COVID-19 to be the world’s greatest threat. To reduce the risk of coronavirus, all countries began to abandon their traditional systems in favor of technological aids that allow them to work from home (Kansal,2020; Sanders et.al.,2020). Though every sector has been open now, still the fear of coronavirus is the same (Hamid et al., 2021).
Employees are concerned that COVID-19 will prevent them from performing to their full potential. Employees are required to follow and maintain specific rules as a result of COVID-19. Employees are required to follow these rules before, during, and after work. These changes had a significant negative impact on employee performance sustainability (Sanders et al.,2020). Previous studies have found a negative impact of Covid19 on sustainable employee performance (Hamid et.al.,2021; Hamid et al.,2020). Based on this statement, it can be said that COVID-19 is another barrier to employee performance sustainability. Russell, (2020) & Buffer (2020) found that about 54% of employees face difficulties by losing jobs and salary cuts. During work from home, employees face issues with communication; mental pressure (Hosna et al.,2020); unable to unplug formwork; work-family role conflict; lack of motivation; timing difference; lack of reliable technology, and others.
The motivational theory of lifetime development arose from the lifespan theory of control’s early conceptual foundations by Schulz & Heckhausen, (1996). The fundamental of MTD is that an individual’s motivational system is focused on maximizing her or his primary control capability. The next stage in theory development was to find heuristics that can help people pick the appropriate objectives at the right moment in their lives. In a subsequent conceptual expansion, the theory embraced the structure of action stages in goal pursuit cycles, which include phases of goal selection, goal engagement, goal disengagement, and re-engagement with altered or new objectives over the lifespan as with age individuals face some changes occurred in physical, cognitive, and psychosocial skills (Shane & Heckhausen, 2019).
According to Kay & Heckhausen, (2015), the capacity to pick the appropriate objective and customize the engagement and disengagement techniques utilized has consistently proven that it
Literature ReviewSustainable Employee Performance
Covid19 and Sustainable Employee Performance
The Motivational Theory of Lifespan Development (MTD)
162 16th SOUTH ASIAN MANAGEMENT FORUM (SAMF) 2021
has important consequences for goal achievement, health, and well-being across a range of groups across the lifetime. There is still work to be done. In the study of Shane & Heckhausen, (2019), where authors review the development of MTD till now and found the necessity of studying how individual characteristics are impacted by motivation and self-regulatory actions to achieve their life goals (Cadiz et al., 2019).
According to Pillai et al., (2011), there are three dimensions to self-efficacy: magnitude, strength, and generality. The beliefs about magnitude and strength have been task-oriented and situational. The generality dimension of self-efficacy refers to how far self-efficacy extends to other situations. General self-efficacy focuses on a broader understanding of personal competencies in dealing with a variety of stressful situations (Ilyas et al., 2020).
Self-efficacy influences employee behavior in a variety of scenarios by altering the individual’s expectations. Employees with a sense of self-efficacy are considered to be more resistant to transient effects (Ma et al., 2013; Ren and Chadee, 2017). According to Koij & Kanfer (2019), individuals with high self-efficacy feel that they can handle difficult issues flawlessly, and they are more involved, dedicated, and effective in achieving goals. In that study, the author suggested that self-efficacy can be impactful on individuals’ work performance.
According to Sennewald & Baillie, (2021), the question of how to encourage people to perform more and better work, as well as how to keep them happy and engaged in their jobs, is a continual problem for managers, and project researchers, and a thesis topic for academicians. What inspires one individual may not inspire another. Motivators that work well in one business may be ineffective in another. In response to the shifting job landscape, organizational psychology researchers have given significant efforts to find the essential characteristics that enhance work motivation among workers (Kenfer et al.,2017).
Motivation is commonly thought to influence the direction of behavior, the intensity of action, and the persistence of activity (M. E. Beier et al., 2019). The following are the most important motivational processes for work across the lifespan: Concepts of goal selection, goal attainment, and re-engagement to goal attainment, which particularly depend on the self-efficacy of employees (Locke & Latham, 2002). According to the MTD theory; young individuals are satisfied by extrinsic motivators such as appealing salaries, demanding work, and task incentives, but senior employees are satisfied by intrinsic motivators such as duties, well-being, and social standing (Shane & Heckhausen, 2019). Koij & Kanfer (2019) suggest employees’ motivation for work, which varies based on individual perspectives, has a significant impact on developing employee sustainability.
This is a conceptual study that intends to develop a sustainable employee performance framework based on MTD theory perspective. Sustainable employee performance is complicated as sustainability is a process, not a state (Jackson, 2012). Whether it is a pandemic situation or normal, whether it is work from the office or work from home, employee performance needs to be sustained as it is the key tool for organizational sustainability. With this concept, this study developed a sustainable employee performance framework based on the motivational theory of lifespan development (Fig-1). This model entails that employees at a young age or from entry-level work period, tend to be more active and their primary control strive for goal target and achieve it no matter how challenging and difficult it is (Kay & Heckhausen, 2015).
Self-Efficacy
Motivation
Dcussion of Framework
16316th SOUTH ASIAN MANAGEMENT FORUM (SAMF) 2021
In Fig-1, the blue line indicates the concept of sustaining employee performance through developing self-efficacy among employees. According to Koij & Kanfer, (2019), individuals with proper motivation can develop self-efficacy which helps individuals to engage and re-engage with a goal of sustainable performance (Ren and Chadee, 2017). According to the motivational theory of lifespan development, older people would adopt secondary control techniques when their primary control skills decline with age. Self-efficacy is likely to be involved here, and it may impact primary control capability and employees can achieve performance sustainability over age (Heckhausen, Wrosch, & Schulz, 2010; Z. Jiang et al., 2018).
MTD theory has been developed and applied for developing secondary control among old-age individuals (Heckhausen, Wrosch, & Schulz, 2010; Koij & Kanfer,2019). The SEP model (Fig-1), has been developed by applying the MTD’s previous concept. The SEP model has a significant new and advanced contribution to the development of MTD theory as it has been used to identify the employee’s performance sustainability from a young age to old-age employees through applying self-efficacy.
Organizations and managers from developed and least developed countries can understand the issues regarding employee performance and can apply this conceptual model to develop a sustainable employee performance system at the workplace (de Jonge & Peeters, 2019).
The present study successfully developed a sustainable employee performance model by considering age factors which have been a big issue during the Covid-19 Pandemic. This study intends to describe the sustainable employee performance area and share a conceptual idea that can be performed in the future to fulfill the theoretical and practical gap. There are still numerous gaps in theoretical and empirical understanding concerning performance sustainability.
At the middle-age or mid-level of career, employees face difficulties to set a goal and achieve the goal by overcoming challenges and difficulties (M. E. Beier et al., 2019). From this period to retirement employees tend to be disengaged from goal attainment as primary control capacity has no longer active (Fig-4: red line) and work performance goes down towards unsustainability. With age, individuals gain knowledge and experience but lose physical abilities like’ eyesight, strength, gaining muscle pains, blood pressure, and many more (Shane & Heckhausen, 2019).
Theoretical and Managerial Advancement
Conclusion and Recommendation
Figure 1: Sustainable employee performance model based on the motivational theory of lifespan development perspective. (Source: Researcher)
164 16th SOUTH ASIAN MANAGEMENT FORUM (SAMF) 2021
This study can be a path for the future direction of the sustainable employee performance area. This conceptual model can be generalized through further quantitative or qualitative studies. Interval study can be useful to understand the age factors and their impact on the performance sustainability of employees. Self-efficacy can be measured as a mediator or moderator for SEP. On this special issue, we intend to share the diversity of sustainable employee performance processes and hope that practitioners and organizations might understand human sustainability and its impact on organizations’ long-term achievement.
1. Beier, M. E., Bradford, B. C., Torres, W. J., Shaw, A., & Kim, M. H. (2019). Cognition, motivation, and lifespan development. In Work Across the Lifespan. Elsevier Inc. https://doi.org/10.1016/B978-0-12-812756-8.00007-4
2. Buffer. (2020). State of Remote Work 2020. Retrieved 2021, from https://lp.buffer.com/state-of-remote-work-2020
3. Cadiz, D. M., Rineer, J. R., & Truxillo, D. M. (2019). Lifespan perspectives on job and work design. In Work Across the Lifespan. Elsevier Inc. https://doi.org/10.1016/B978-0-12-812756-8.00011-6
4. de Jonge, J., & Peeters, M. C. W. (2019). The vital worker: Towards sustainable performance at work. International Journal of Environmental Research and Public Health, 16(6), 16–21. https://doi.org/10.3390/ijerph16060910
5. Docherty, P.; Forslin, J.; Shani, A.B., (2002). Creating Sustainable Work Systems: Emerging Perspectives and Practice; Routledge: London, UK.
6. Hamid, M., Abdul Wahab, S., Hosna, A. U., Kamruzzaman, M., & Hasanat, M. W. (2021). What If We Have to Live with COVID-19 ? The Mediating Effect of Self-Entertainment for Sustaining Employees Performance. THE INTERNATIONAL JOURNAL OF BUSINESS & MANAGEMENT, 9(7), 212–220. https://doi.org/10.24940/theijbm/2021/v9/i7/BM2107-052
7. Hamid, M., Wahab, S. A., Hosna, A. U., Hasanat, M. W., & Kamruzzaman, M. (2020). Impact of Coronavirus (COVID-19) and Employees’ Reaction to Changes on Employee Performance of Bangladesh. The International Journal of Business & Management, 8(8). https://doi.org/10.24940/theijbm/2020/v8/i8/bm2008-013
8. Heckhausen, J., Wrosch, C., & Schulz, R. (2010). A motivational theory of life-span development. Psychological Review, 117,32-60.
9. Hosna, A. U., Sazali, P., Wahab, A., Hamid, M., Hasanat, M. W., Haque, A., & Anum, K. (2020). Impact of mental pressure and coronavirus (Covid-19) on the work performance of working mothers of Bangladesh. American International Journal of Business Management, 3(12), 63-69.
10. Ilyas, S., Abid, G., & Ashfaq, F. (2020). Ethical leadership in sustainable organizations: The moderating role of general self-efficacy and the mediating role of organizational trust. Sustainable Production and Consumption, 22, 195–204. https://doi.org/10.1016/j.spc.2020.03.003
11. Jiang, W., Zhao, X., & Ni, J. (2017). The Impact of Transformational Leadership on Employee Sustainable Performance: The Mediating Role of Organizational Citizenship Behavior. Sustainability, 9(9), 1567. https://doi.org/10.3390/su9091567
12. Kansal, K. (2020). Qualitative analysis of Covid-19 on working women. International Journal of Scientific and Research Publications, 10(2020).
13. Kay, J. S., & Heckhausen, J. (2015). Motivational Theory of Lifespan Development. Encyclopedia of Geropsychology, 1–10. https://doi.org/10.1007/978-981-287-080-3
Reference
16516th SOUTH ASIAN MANAGEMENT FORUM (SAMF) 2021
14. Kanfer, R., Frese, M., & Johnson, R. E. (2017). Motivation related to work: A century of progress. Journal of Applied Psychology, 102(3), 338–355. https://doi.org/10.1037/apl0000133
15. Kooij, D. T. A. M., & Kanfer, R. (2019). Lifespan perspectives on work motivation. In Work Across the Lifespan. Elsevier Inc. https://doi.org/10.1016/B978-0-12-812756-8.00020-7
16. Locke, E. A., & Latham, G. P. (2002). Building a practically useful theory of goal setting and task motivation: A 35-year odyssey. American Psychologist, 57(9), 705-717.
17. Ma, Y., Cheng, W., Ribbens, B. A., & Zhou, J. (2013). Linking Ethical Leadership to Employee Creativity: Knowledge Sharing and Self-Efficacy as Mediators. Social Behavior and Personality: An International Journal, 41(9), 1409–1419. https://doi.org/10.2224/sbp.2013.41.9.1409
18. Min, J., Iqbal, S., Khan, M. A. S., Akhtar, S., Anwar, F., & Qalati, S. A. (2020). Impact of supervisory behavior on sustainable employee performance: Mediation of conflict management strategies using PLS-SEM. PloS One, 15(9), e0236650. https://doi.org/10.1371/journal.pone.0236650
19. Pillai, K.G. , Goldsmith, R.E. , Giebelhausen, M. , (2011). Negative moderating effect of general self-efficacy on the relationship between need for cognition and cognitive effort. Psychol. Rep. 109 (1), 127–136.
20. Ren, S., & Chadee, D. (2017). Ethical leadership, self-efficacy and job satisfaction in China: The moderating role of guanxi. Personnel Review, 46(2), 371–388. https://doi.org/10.1108/PR-08-2015-0226
21. Russell, M. (2020). COVID-19 Impact on Events Research: Top-line Results for Suppliers. PCMA. https://www.pcma.org/covid-19-impact-events-research-suppliers-results/
22. Schulz, R., & Heckhausen, J. (1996). A life span model of successful aging. The American Psychologist, 51(7), 702-714.
23. Sanders, K., Nguyen, P. T., Bouckenooghe, D., Rafferty, A., & Schwarz, G. (2020). Unraveling the what and how of organizational communication to employees during COVID-19 pandemic: Adopting an attributional lens. Journal of Applied Behavioral Science, 1(5). https://doi.org/10.1177/0021886320937026
24. Shane, J., & Heckhausen, J. (2019). Motivational theory of lifespan development. In Work Across the Lifespan. Elsevier Inc. https://doi.org/10.1016/B978-0-12-812756-8.00005-0
166 16th SOUTH ASIAN MANAGEMENT FORUM (SAMF) 2021
Purpose: Generally, an organization organizes training and development to enhance employees’ performance. Job satisfaction can be increased by acquiring proper knowledge, skill, and attitude toward the job which has a huge contribution from training. There are a lot of training methods used by the different organizations based on training materials, time, costs, and types of tasks. In this study, it is assumed that there exists a positive impact of training and development methods on employees’ satisfaction in commercial banks in Bangladesh. Methodology: This is empirical research. Both primary and secondary data have been used objectively. Primary data has been collected from the employees of twelve commercial banks. A total number of 250 questionnaires were distributed and 200 representing 80.0% of questionnaires got backed with appropriate filled-up.Results: There are seven most popular and frequently used methods of training and development recognized to determine the impact on employees’ job satisfaction. It is revealed from the present study that informal learning has a significant positive impact on employees’ satisfaction in commercial banks in Bangladesh.
IMPACT OF TRAINING METHODS ON EMPLOYEE SATISFACTION IN COMMERCIAL BANKS OF BANGLADESH
Serena Aktar, Assistant Professor, Department of Business AdministrationNorthern University Bangladesh
Professor Dr. Nazrul IslamProfessor of Management, Dean, Faculty of BusinessNorthern University Bangladesh
Technology has been changing rapidly and the use of technology in the business area is growing day by day. All need to know about the use of technology in this COVID-19 pandemic situation. In this era, training and development have a vital role in achieving business goals. The private commercial banking service is one of the first growing service sectors in Bangladesh. The performance of the employee is the main component of achieving a competitive advantage position in the industry. The performance of employees depends on their job-related knowledge, skill, and attitudes in the commercial banking sector. An employee’s job satisfaction is one of the fundamental components of achieving excellent job performance. In this present study, the researcher wants to identify the most accepted method of training and development that has a significant positive impact on job satisfaction as well as the performance of the employees in the commercial banking sector of Bangladesh.
This study reveals that development leads to better employee performance. Both training and development increase employee performance so organizations need to spend on training and developing their employees for a sustainable long-term competitive edge. Abulraheem (2016) identified that training and development were positively correlated and claimed a statistically significant relationship with employee performance and productivity. Many studies have demonstrated an unusually large impact on job satisfaction due to the motivation of workers, while the level of motivation has an impact on productivity.
Keywords: Commercial Bank, Training and Development Methods, Job SatisfactionIntroduction
16716th SOUTH ASIAN MANAGEMENT FORUM (SAMF) 2021
Unfortunately, job satisfaction has not still received the proper attention from neither scholars nor the managers of various business organizations. Halawi and Haydar (2018) revealed that employees were able to develop inner satisfaction, received positive evaluation feedback, understood how to achieve quality output, and developed a career beyond classwork after training. Saranya (2014) revealed that job satisfaction represents one of the most complex areas that today’s managers face when it comes to managing their employees. They recommended that facets such as pay, promotion, job safety, and security, working conditions, job autonomy, relationship with co-workers, relationship with supervisor, and nature of work affect job satisfaction and performance (Khan, et. al., 2012). They also showed that there is a strong positive relationship between employee job satisfaction and job performance.
After reviewing a good number of researches, the researcher identified that almost all researchers focused on the impact of training and development on employees’ job satisfaction and performance, and they more or less ignored the methods or techniques of training and development. In this present study, it is hypothesized that the training and development method is also an influential factor in increasing job satisfaction and performance in the banking sector of Bangladesh. So, the researcher focuses on the methods of training and development that are very crucial to acquiring job-relevant knowledge, skills, and attitudes. Thus, the main objective of this study focuses on examining the impact of the selected most popular and frequently used methods of training and development on employees’ job satisfaction in commercial banks in Bangladesh. Based on the research objectives, some important statistical measures that were used to summarize the survey data are frequency distribution, descriptive statistics, correlation analysis, regression analysis, and hypothesis testing.
In this globalized and technologically advanced age, some sectors are performing optimally. The commercial banking sector is one of them. The stage of technological advancement is almost at its peak. In this circumstance, proper training and development practices can increase the service quality of the banking employees. In this research, the researchers reviewed some studies in the area of training and development practices in different sectors of business and revealed diverse findings.
The training method is a systematic process or procedure by which knowledge, skill, and ability are developed by the employees of an organization. Most of the organizations are using a combination of different training methods rather than using a single training method. Some training is given to the place of the job while performing, and some of them are given outside of the job place. Based on places of giving training, training is classified into two categories as On-the-Job training and Off-the-Job training. There are a lot of methods under these two categories of training(Janakiram, 2008).
Organizations need to invest in the training and development thereof their employees for a sustainable long-term competitive edge. Okechukwu (2017) found that training and development nature essentially obtained the highest level of satisfaction while training and development facility and evaluation have the lowest level of employees’ satisfaction.
Literature Review
Training Methods
Impact of Training and Development on Satisfaction
168 16th SOUTH ASIAN MANAGEMENT FORUM (SAMF) 2021
Singh and Mohanty (2012) studied that there is no significant relationship between training and employee retention. However, there is a significant positive relationship between employee job satisfaction and retention. Abulraheem and Raja (2016); Uzoamaka and Innocent (2017); Ndamaimunamh and Yazdani, (2013); Quizon, 2014); and Tiwari and Shukla (2018) studied to build upon the previous training literature by providing a detailed examination of training needs assessment and organizational effectiveness based upon development-based strategy.
There is a negative relationship between affective commitment and continuance commitment (Kumar and Vikram, 2017). Anwar and Shukur, (2015) developed a quantitative method to analyze the training and development and identified a positive impact on job satisfaction in private banks. Bhat (2013) analyzed several measures of performance such as compensation, performance appraisal, and organizational commitment. At the same time, “remuneration” and “promotion” are the two crucial factors of job satisfaction. The study suggests that an effective policy on recruitment, job security, service rules, promotional opportunities, regular payments, and retirement benefits on the job satisfaction and attitude of employees in both government and non-government employees should be implemented (Sarker, et al., 2017). Hidayah and Tobing (2018) showed that job satisfaction, motivation, and organizational commitment simultaneously influence employee performance. They revealed that the dual direction of the relationship composes a cycle cause and effect relationship, so satisfaction leads to performance, and performance leads to satisfaction through several mediating factors. Successful organizations apply periodic satisfaction and performance measurement tests to track the level of these important variables and set the corrective actions (Alromaihi, et al., 2017). Wendrila (2015), focused on the relationship between organizational culture and the levels of job satisfaction and how it affects corporate performance as a whole. It highlights how organizational culture helps in creating job satisfaction which would ultimately help in achieving organizational excellence and effectiveness. The above-mentioned research studies influence the researcher to hypothesize the following hypothesis:
H1: There exists a significant positive impact of the selected most important methods of training and development on the employees’ job satisfaction in the commercial banks in Bangladesh.
This is exploratory research. Both secondary and primary have been used purposively. The secondary data has been collected from different published books and journals. The primary data has been collected through a structured questionnaire filled up by the employees of commercial banks in Bangladesh. The researcher primarily used the cluster random sampling method to select 12 commercial banks in Bangladesh for collecting data. Then, the researcher distributed 250 questionnaires among the employees of commercial banks in Bangladesh and got back 200 properly filled up questionnaires. Therefore, the sample size of this study is comprised of 200 employees of the commercial banks situated in Dhaka city in Bangladesh.
The pilot testing interview was conducted with a structured questionnaire for selecting the most used and popular methods of training and development. The questionnaire was divided into two sections. Section I included the demographic-related questions while section II consisted of closed-ended questions using the scale of five-point Likert scales. Section II consisted of training and development methods, job satisfaction, and employees’ work performance based on perceptions.
Research Methodology
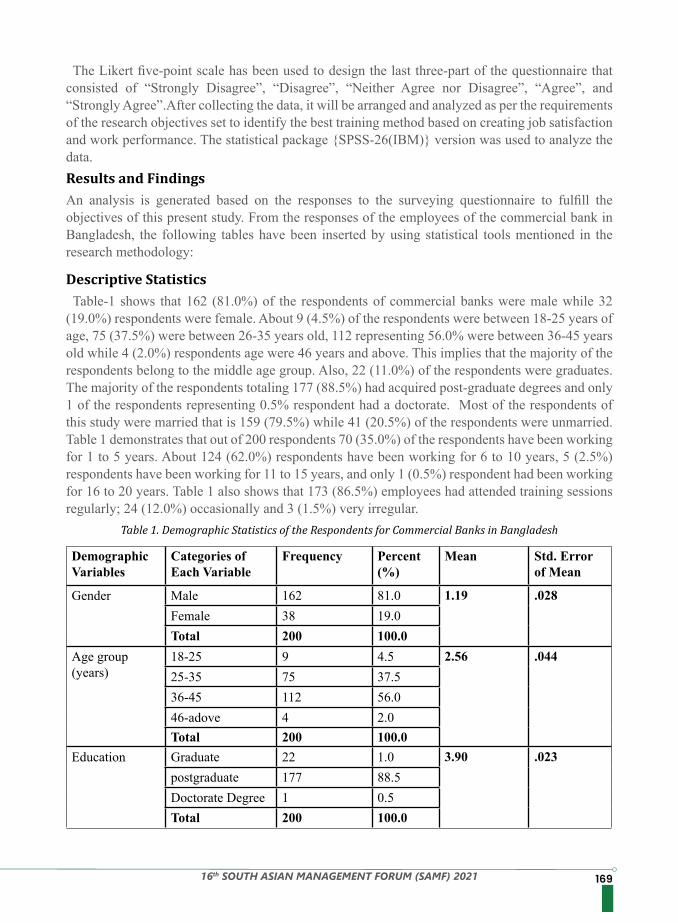
16916th SOUTH ASIAN MANAGEMENT FORUM (SAMF) 2021
The Likert five-point scale has been used to design the last three-part of the questionnaire that consisted of “Strongly Disagree”, “Disagree”, “Neither Agree nor Disagree”, “Agree”, and “Strongly Agree”.After collecting the data, it will be arranged and analyzed as per the requirements of the research objectives set to identify the best training method based on creating job satisfaction and work performance. The statistical package {SPSS-26(IBM)} version was used to analyze the data.
An analysis is generated based on the responses to the surveying questionnaire to fulfill the objectives of this present study. From the responses of the employees of the commercial bank in Bangladesh, the following tables have been inserted by using statistical tools mentioned in the research methodology:
Table-1 shows that 162 (81.0%) of the respondents of commercial banks were male while 32 (19.0%) respondents were female. About 9 (4.5%) of the respondents were between 18-25 years of age, 75 (37.5%) were between 26-35 years old, 112 representing 56.0% were between 36-45 years old while 4 (2.0%) respondents age were 46 years and above. This implies that the majority of the respondents belong to the middle age group. Also, 22 (11.0%) of the respondents were graduates. The majority of the respondents totaling 177 (88.5%) had acquired post-graduate degrees and only 1 of the respondents representing 0.5% respondent had a doctorate. Most of the respondents of this study were married that is 159 (79.5%) while 41 (20.5%) of the respondents were unmarried. Table 1 demonstrates that out of 200 respondents 70 (35.0%) of the respondents have been working for 1 to 5 years. About 124 (62.0%) respondents have been working for 6 to 10 years, 5 (2.5%) respondents have been working for 11 to 15 years, and only 1 (0.5%) respondent had been working for 16 to 20 years. Table 1 also shows that 173 (86.5%) employees had attended training sessions regularly; 24 (12.0%) occasionally and 3 (1.5%) very irregular.
Results and Findings
Descriptive Statistics
Table 1. Demographic Statistics of the Respondents for Commercial Banks in Bangladesh
DemographicVariables
Categories of Each Variable
Frequency Percent (%)
Mean Std. Error of Mean
Gender Male 162 81.0 1.19 .028Female 38 19.0Total 200 100.0
Age group (years)
18-25 9 4.5 2.56 .04425-35 75 37.536-45 112 56.046-adove 4 2.0Total 200 100.0
Education Graduate 22 1.0 3.90 .023postgraduate 177 88.5Doctorate Degree 1 0.5Total 200 100.0
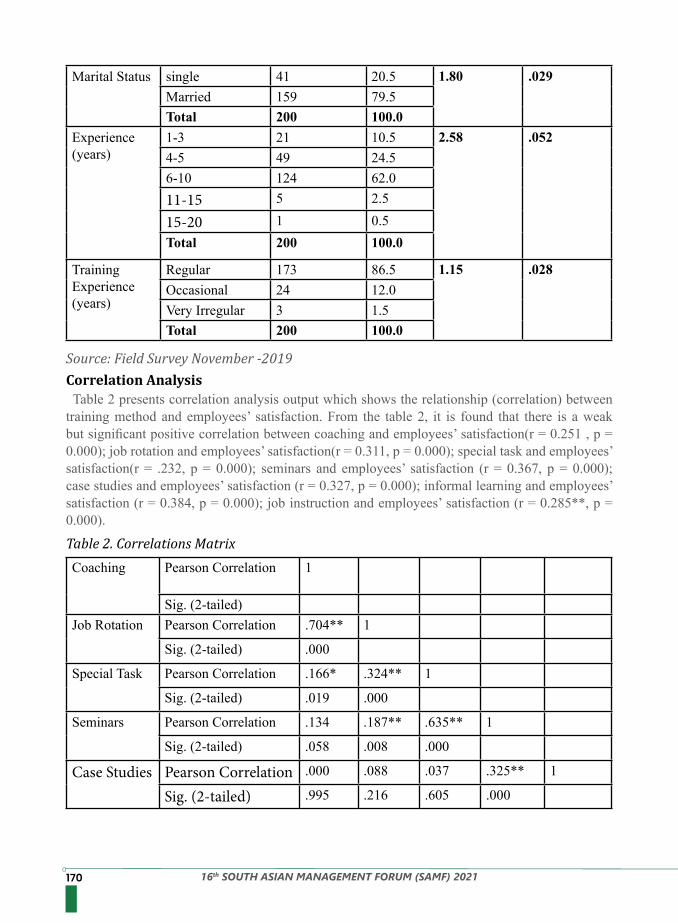
170 16th SOUTH ASIAN MANAGEMENT FORUM (SAMF) 2021
Table 2 presents correlation analysis output which shows the relationship (correlation) between training method and employees’ satisfaction. From the table 2, it is found that there is a weak but significant positive correlation between coaching and employees’ satisfaction(r = 0.251 , p = 0.000); job rotation and employees’ satisfaction(r = 0.311, p = 0.000); special task and employees’ satisfaction(r = .232, p = 0.000); seminars and employees’ satisfaction (r = 0.367, p = 0.000); case studies and employees’ satisfaction (r = 0.327, p = 0.000); informal learning and employees’ satisfaction (r = 0.384, p = 0.000); job instruction and employees’ satisfaction (r = 0.285**, p = 0.000).
Correlation Analysis
Table 2. Correlations Matrix
Marital Status single 41 20.5 1.80 .029Married 159 79.5Total 200 100.0
Experience (years)
1-3 21 10.5 2.58 .0524-5 49 24.56-10 124 62.011-15 5 2.5
15-20 1 0.5Total 200 100.0
Training Experience (years)
Regular 173 86.5 1.15 .028Occasional 24 12.0Very Irregular 3 1.5Total 200 100.0
Source: Field Survey November -2019
Coaching Pearson Correlation 1
Sig. (2-tailed)Job Rotation Pearson Correlation .704** 1
Sig. (2-tailed) .000
Special Task Pearson Correlation .166* .324** 1
Sig. (2-tailed) .019 .000
Seminars Pearson Correlation .134 .187** .635** 1
Sig. (2-tailed) .058 .008 .000
Case Studies Pearson Correlation .000 .088 .037 .325** 1
Sig. (2-tailed) .995 .216 .605 .000
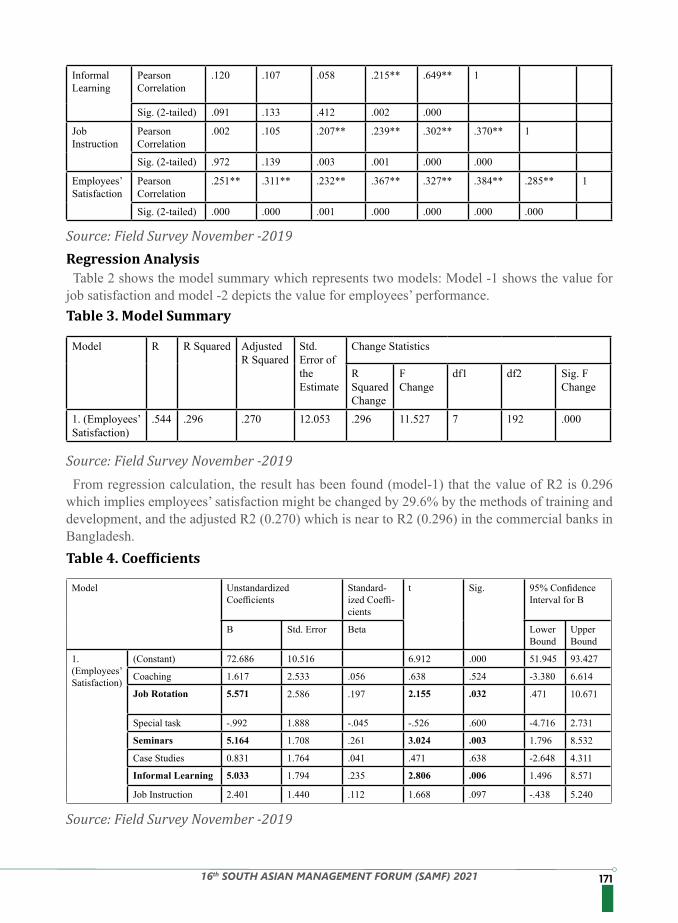
17116th SOUTH ASIAN MANAGEMENT FORUM (SAMF) 2021
Informal Learning
Pearson Correlation
.120 .107 .058 .215** .649** 1
Sig. (2-tailed) .091 .133 .412 .002 .000
Job Instruction
Pearson Correlation
.002 .105 .207** .239** .302** .370** 1
Sig. (2-tailed) .972 .139 .003 .001 .000 .000
Employees’ Satisfaction
Pearson Correlation
.251** .311** .232** .367** .327** .384** .285** 1
Sig. (2-tailed) .000 .000 .001 .000 .000 .000 .000
Source: Field Survey November -2019
Source: Field Survey November -2019
Source: Field Survey November -2019
Table 2 shows the model summary which represents two models: Model -1 shows the value for job satisfaction and model -2 depicts the value for employees’ performance.
From regression calculation, the result has been found (model-1) that the value of R2 is 0.296 which implies employees’ satisfaction might be changed by 29.6% by the methods of training and development, and the adjusted R2 (0.270) which is near to R2 (0.296) in the commercial banks in Bangladesh.
Regression Analysis
Table 3. Model Summary
Table 4. Coefficients
Model R R Squared Adjusted R Squared
Std. Error of the Estimate
Change Statistics
R Squared Change
F Change
df1 df2 Sig. F Change
1. (Employees’ Satisfaction)
.544 .296 .270 12.053 .296 11.527 7 192 .000
Model Unstandardized Coefficients
Standard-ized Coeffi-cients
t Sig. 95% Confidence Interval for B
B Std. Error Beta Lower Bound
Upper Bound
1. (Employees’ Satisfaction)
(Constant) 72.686 10.516 6.912 .000 51.945 93.427
Coaching 1.617 2.533 .056 .638 .524 -3.380 6.614
Job Rotation 5.571 2.586 .197 2.155 .032 .471 10.671
Special task -.992 1.888 -.045 -.526 .600 -4.716 2.731
Seminars 5.164 1.708 .261 3.024 .003 1.796 8.532
Case Studies 0.831 1.764 .041 .471 .638 -2.648 4.311
Informal Learning 5.033 1.794 .235 2.806 .006 1.496 8.571
Job Instruction 2.401 1.440 .112 1.668 .097 -.438 5.240
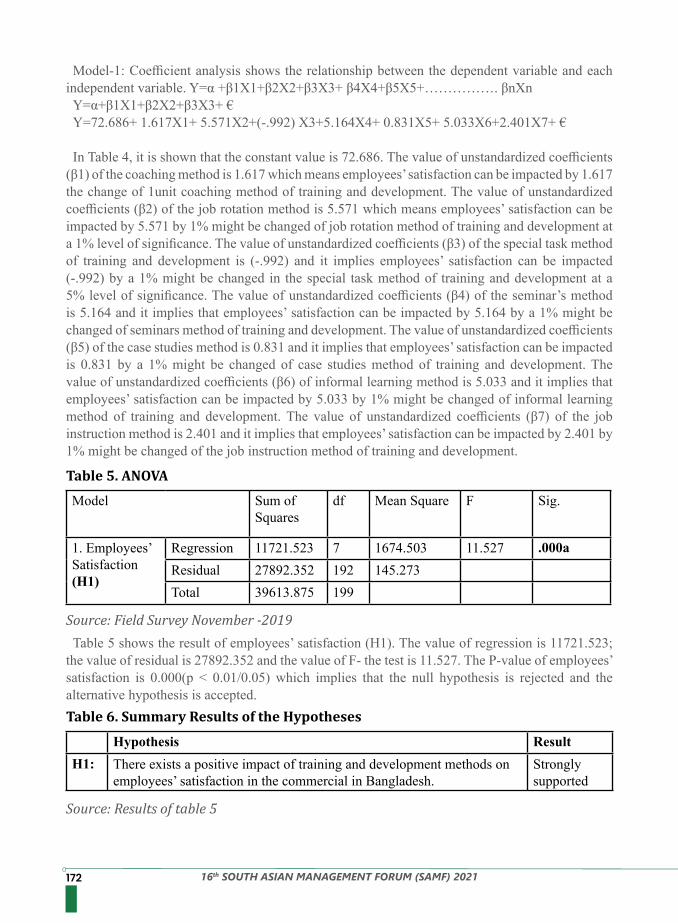
172 16th SOUTH ASIAN MANAGEMENT FORUM (SAMF) 2021
Source: Field Survey November -2019
Source: Results of table 5
Model-1: Coefficient analysis shows the relationship between the dependent variable and each independent variable. Y=α +β1X1+β2X2+β3X3+ β4X4+β5X5+……………. βnXnY=α+β1X1+β2X2+β3X3+ €Y=72.686+ 1.617X1+ 5.571X2+(-.992) X3+5.164X4+ 0.831X5+ 5.033X6+2.401X7+ €
In Table 4, it is shown that the constant value is 72.686. The value of unstandardized coefficients (β1) of the coaching method is 1.617 which means employees’ satisfaction can be impacted by 1.617 the change of 1unit coaching method of training and development. The value of unstandardized coefficients (β2) of the job rotation method is 5.571 which means employees’ satisfaction can be impacted by 5.571 by 1% might be changed of job rotation method of training and development at a 1% level of significance. The value of unstandardized coefficients (β3) of the special task method of training and development is (-.992) and it implies employees’ satisfaction can be impacted (-.992) by a 1% might be changed in the special task method of training and development at a 5% level of significance. The value of unstandardized coefficients (β4) of the seminar’s method is 5.164 and it implies that employees’ satisfaction can be impacted by 5.164 by a 1% might be changed of seminars method of training and development. The value of unstandardized coefficients (β5) of the case studies method is 0.831 and it implies that employees’ satisfaction can be impacted is 0.831 by a 1% might be changed of case studies method of training and development. The value of unstandardized coefficients (β6) of informal learning method is 5.033 and it implies that employees’ satisfaction can be impacted by 5.033 by 1% might be changed of informal learning method of training and development. The value of unstandardized coefficients (β7) of the job instruction method is 2.401 and it implies that employees’ satisfaction can be impacted by 2.401 by 1% might be changed of the job instruction method of training and development.
Table 5 shows the result of employees’ satisfaction (H1). The value of regression is 11721.523; the value of residual is 27892.352 and the value of F- the test is 11.527. The P-value of employees’ satisfaction is 0.000(p < 0.01/0.05) which implies that the null hypothesis is rejected and the alternative hypothesis is accepted.
Table 5. ANOVA
Table 6. Summary Results of the Hypotheses
Model Sum of Squares
df Mean Square F Sig.
1. Employees’ Satisfaction (H1)
Regression 11721.523 7 1674.503 11.527 .000aResidual 27892.352 192 145.273Total 39613.875 199
Hypothesis ResultH1: There exists a positive impact of training and development methods on
employees’ satisfaction in the commercial in Bangladesh.Strongly supported
17316th SOUTH ASIAN MANAGEMENT FORUM (SAMF) 2021
Table-6 shows the summary of the results of the hypotheses. Two hypotheses have been developed and it has been found that both the hypotheses have been accepted. The first hypothesis (H1): there exists a positive impact of training methods (i.e., job instruction, coaching, special task, case studies, informal learning, seminars, and job rotation) on employees’ satisfaction in commercial banks.
In the case of commercial banks, employees have to perform a huge variety of official work and activities. Among them, some activities are related to software and some are clerical but all are related to dealing with money. If anyone performs wrong, there might have the possibility of losing a huge amount of money. So, employees need to be high performers, careful, and skilled and have to keep long stamina and dexterity while transitioning the money. They are supposed to be skillful where training and development can play a vital role. The main focus of this study was to identify the impact of training and development methods on employees’ satisfaction in commercial banks in Bangladesh. In this present study, the seven most popular training and development methods have been identified first which have been used very frequently by the commercial banks of Bangladesh. These seven methods were determined by taking interviews of the employees who were working for more than five years there. After that researcher tried to examine the impact of these seven methods of training and development on job satisfaction in the commercial banks in Bangladesh. It has been revealed that employees of the commercial banks like job rotation, seminars, and informal learning methods of training and development for increasing their job satisfaction.
This study has two limitations. First, it is limited to the seven methods of training and development. It has only considered the private commercial banks in Bangladesh. There are a lot of methods described in different books and studies that can be considered for future research purposes. Other sectors such as pharmaceuticals, insurance, readymade garments, IT, and educational institutes around and /or across the country will be the considerable sectors for further study. It is suggested to use some other statistical tools for examining the impact of training and development methods on employees’ satisfaction. In this research, the researcher could not tie up or link up with previous research studies due to a lack of appropriate literature but it could be a great source of literature for future researchers.
1. Abulraheem S. M. R. (2016). The Impact of Training and Development on Employees Performance and Productivity. International Journal of Management Sciences and Business Research, 5 (7), 36-70.
2. Alromaihi M. A., AlshomalyZ. A. and George D. S. (2017). Job satisfaction and employee performance: a theoretical review of the relationship between the two variables.International Journal of Advanced Research in Management and Social Sciences,6(1),1-16.
3. Bhat Z. H. (2013). Impact of Training on Employee Performance: A Study of Retail Banking Sector in India. Indian Journal of Applied Research, 3(6), 292-293.
4. HalawiA., and Haydar N. (2018). Effects of Training on Employee Performance: A Case Study of Bonjus and Khatib and Alami Companies. International Humanities Studies,5(2),24-45.
5. HidayahT.,andTobing D. S. K. (2018). The Influence of Job Satisfaction, Motivation, and Organizational Commitment to Employee Performance. International journal of scientific and technology research, 7(7),122-127.
Conclusion
Limitation of Present Study and Suggestions for Further Research
Reference
174 16th SOUTH ASIAN MANAGEMENT FORUM (SAMF) 2021
6. Janakiram D. B. (2008), Training and Development, 2nd Edition, Biztantra, New Delhi, India, P.45.
7. Khan A. H., Nawaz M. M.,Aleem M. and Hamed W. (2012). Impact of job satisfaction on employee performance: An empirical study of autonomous Medical Institutions of Pakistan. African Journal of Business Management, 6 (7), 2697-2705.
8. Kumar P. Kishore and Vikram V. (2017). A Study on Motivation for Training, Job Satisfaction, Affective Commitment, and Continuance Commitment. Scholars Journal of Economics, Business, and Management,4(10),709-712.
9. Ndamaimuna M. and Yazdani. R. (2013). The impact of employee training and development on employee productivity. Global Journal of Commerce and Management Perspective, 2(6),91-93.
10. Okechukwu W. (2017). Influence of training and development, employee performance on job satisfaction among the staff of school of Technology Management and Logistics, Universiti Utara Malaysia, Journal of Technology Management and Business, 04 (01) , 1-16.
11. Saranya K. (2014). Influence of Job Satisfaction on Employees’ Performance –A general Perspective. International Journal on Global Business Management and Research,2(2),
12. Sarker M. N.Islam, Sultana A. and Prodhan A. S. (2017). Job satisfaction of employees of public and private organizations in Bangladesh. Journal of Political Science, 1(1), 002-008.
13. Singh R., and Mohanty M. (2012). Impact of Training Practices on Employee Productivity: A Comparative Study. Interscience Management Review, 2 (2) ,87-92.
14. Tiwari S. and Shukla R. (2018). The Impact of Training and Development on Employee Performance with Special Reference to the Indian Banks: An Analytical Study.International Journal of Research in Economics and Social Sciences, 8, 77-83.
15. Uzoamaka E. V. and Innocent I. E. (2017). Effect of Employees Training on Organizational Performance: A Study of Seven-Up Botlling Company, Enugu State Nigeria. International Journal of Economics and Business Management, 3(10), 48- 63
16. WendrilaB. (2015). Impact of Organization Culture on Job Satisfaction and Corporate Performance. Journal of Research in Humanities and Social Science,3(8),14-16.
17516th SOUTH ASIAN MANAGEMENT FORUM (SAMF) 2021
The existing research explores the current human resource management (HRM) practices during the COVID-19 pandemic in Bangladesh’s manufacturing and service sectors work environment. The study surveyed about 24 human resources, administrative employees, and factory managers in Bangladesh’s 24 different manufacturing and service companies. Local companies follow traditional HRM practices based on salary decreases and job cuts. Foreign companies hold on to their vital HRM practices by using adapted flexible technological tools and devices and endure the difficult phase through efficient managing techniques. This study uncovers a new avenue for further research on how companies overcome the crisis management approach to using ideal human resources management to get a competitive advantage in the long run.
Professor Mohammad Khasro Miah, Ph.D.¹ Mabruka Tabassum ¹Mashita Khasro Sarah¹1North South University, Dhaka Bangladesh
After 1930, today in 2020-2021, the entire world is facing a high crisis in the economic sectors where all kinds of industries are going through a difficult time impacting the public job which leads to providing unemployment and lay off (Ali et al., 2020). Apart from collapsing the global health system, COVID-19 has severely impacted the economic sectors (Sajadi, 2020). Particularly in developing countries, people are striving to survive in the health sector and economic sectors. All kinds of industries, offices, markets, education sectors, etc. are disrupted due to the lockdown. Initially, Ready Made Garments (RMG) industry and related businesses were also impacted due to the lockdown, but later, when covid cases decreased a little bit, the RMG workers returned to Dhaka to get their salaries. However, this mass gathering again leads the country towards a more extended lockdown period (Islam & Jahangir, 2020). The unemployment rate and economic growth shortage worsened the RMG workers’ livelihood (World Bank, 2020).
Although the Government initially tried to manage the situation by offering various promotional packages to the entrepreneurs and RMG workers, the situation did not improve that much in the end (Genoni et al., 2020). These problems got spread across the country in the stock markets, industries, manufacturing, tourism, and service sectors. As a result, Bangladesh faced a high economic crisis throughout the country (Rodela et al., 2020). A considerable amount of people became jobless, and a lot of current workers were in fear of losing their jobs. Significantly, the rootworkers and poor people who earn daily were the worst victims of this crisis as they did not have any savings like the upper layer workers.
Keywords: Human Resource Management Practices; Service and Manufacturing Industries; Covid-19; Bangladesh.
Introduction
Abstract
THE IMPACT OF PRODUCTION AND SERVICES INDUSTRIES WORK ENVIRONMENT DURING COVID-19 CRISIS: DISCUSSION
BASED ON HUMAN RESOURCE MANAGEMENT
176 16th SOUTH ASIAN MANAGEMENT FORUM (SAMF) 2021
Most companies released their employees by layoff or cutting their salaries to decrease the overall expense of the companies (Riaz, 2020).The primary purpose of this study is to investigate the COVID-19 impact on the economic recession in Bangladesh. The research shows how companies can handle the COVID-19 situation effectively and efficiently without cutting jobs or salaries. From an HRM management point of view, this paper tries to provide a solution for the industry to continue their business without affecting the employee’s HRM methods.
The study surveyed 24 manufacturing and service companies, in Dhaka Capital city from January 2021 to May 2021, divided into three groups. We followed judgmental sampling for selecting the sample due to COVID-19; we invited selected companies interested in responding to this investigation. The survey was done online through a questionnaire. We interviewed different methods to collect accurate information through WhatsApp, Messenger, and Telephonic conversation due to everyone being very concerned about the health consciousness while maintaining social distance. However, while selecting the sampling companies during the pandemic, the study focused on keeping a blend of different types in terms of sizes, nations, revenue, reputation, etc.
During the COVID-19 crisis, it was challenging to continue the business in a normal phase because many socio-cultural and contextual factors, directly and indirectly, negatively impacted the business (Parveen, M., 2020). The global economic sectors were affected by this COVID- 19 since most countries decided to shut down everything (Macksoud et al., 2020). Bangladesh is also a part of this situation. With the impact of this virus, Bangladesh’s GDP growth rate got reduced from 8.15% to 3.51% from 2019 to 2020 (Bangladesh Bureau of Statistics, 2020), and manufacturing and financial sector growth rates decreased almost by more than 40%. Most of the companies shut down their operation and production during this COVID-19 crisis
because the companies’ sales were drastically declining.
On the other hand, the business’s operational expenses increased due to this pandemic, i.e., expenses were increasing due to a shortage of transportation. Companies had to incur mandatory expenses to continue the operations that they could not cut from their business structure. Otherwise, the operation would have affected transportation, utility facility, etc. Therefore, most companies cut their employee expenses by cutting jobs, laying off, and cutting their salaries, benefits, and bonuses. The overall scenario indicates a grim picture for the future. The sheer volume and percentage of job losses in different sectors were very overwhelming. It means that about 2.53M people became unemployed, additionally due to COVID-19, even by the end of 2021 (Ahmed, Zaman, & Khan, 2020). However, this reduction in employees or benefits had a negative consequence on the overall industry.In our research paper, our main agenda was to identify the way or solution of how a company
can effectively and efficiently handle the COVID-19 situation by not cutting jobs or salaries. We have focused on the industrial working experiment and HRM point of view to find out what other alternatives the industries could have taken to avoid job or salary cuts. As manufacturing and service industries are different, we anticipate differences in actions taken for different industries. The study focuses on giving a guideline to the industry’s operational process for dealing with similar situations in the future from an industrial and HRM point of view.
Significance & Rationality of the Study
MethodologyData Collection and Sampling
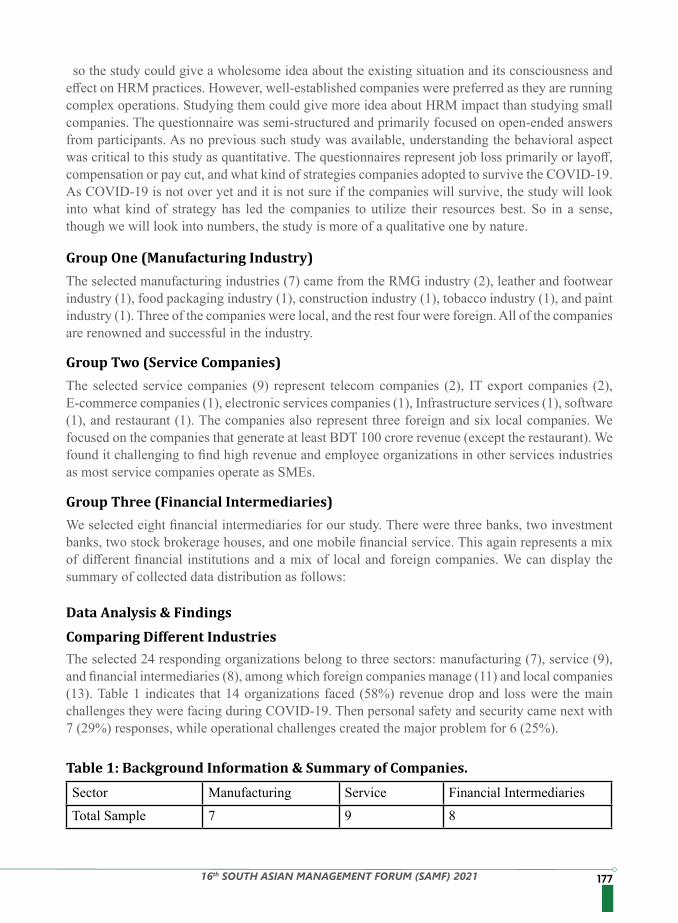
17716th SOUTH ASIAN MANAGEMENT FORUM (SAMF) 2021
so the study could give a wholesome idea about the existing situation and its consciousness and effect on HRM practices. However, well-established companies were preferred as they are running complex operations. Studying them could give more idea about HRM impact than studying small companies. The questionnaire was semi-structured and primarily focused on open-ended answers from participants. As no previous such study was available, understanding the behavioral aspect was critical to this study as quantitative. The questionnaires represent job loss primarily or layoff, compensation or pay cut, and what kind of strategies companies adopted to survive the COVID-19. As COVID-19 is not over yet and it is not sure if the companies will survive, the study will look into what kind of strategy has led the companies to utilize their resources best. So in a sense, though we will look into numbers, the study is more of a qualitative one by nature.
The selected manufacturing industries (7) came from the RMG industry (2), leather and footwear industry (1), food packaging industry (1), construction industry (1), tobacco industry (1), and paint industry (1). Three of the companies were local, and the rest four were foreign. All of the companies are renowned and successful in the industry.
The selected service companies (9) represent telecom companies (2), IT export companies (2), E-commerce companies (1), electronic services companies (1), Infrastructure services (1), software (1), and restaurant (1). The companies also represent three foreign and six local companies. We focused on the companies that generate at least BDT 100 crore revenue (except the restaurant). We found it challenging to find high revenue and employee organizations in other services industries as most service companies operate as SMEs.
We selected eight financial intermediaries for our study. There were three banks, two investment banks, two stock brokerage houses, and one mobile financial service. This again represents a mix of different financial institutions and a mix of local and foreign companies. We can display the summary of collected data distribution as follows:
The selected 24 responding organizations belong to three sectors: manufacturing (7), service (9), and financial intermediaries (8), among which foreign companies manage (11) and local companies (13). Table 1 indicates that 14 organizations faced (58%) revenue drop and loss were the main challenges they were facing during COVID-19. Then personal safety and security came next with 7 (29%) responses, while operational challenges created the major problem for 6 (25%).
Group One (Manufacturing Industry)
Group Two (Service Companies)
Group Three (Financial Intermediaries)
Data Analysis & Findings
Table 1: Background Information & Summary of Companies.
Comparing Different Industries
Sector Manufacturing Service Financial IntermediariesTotal Sample 7 9 8
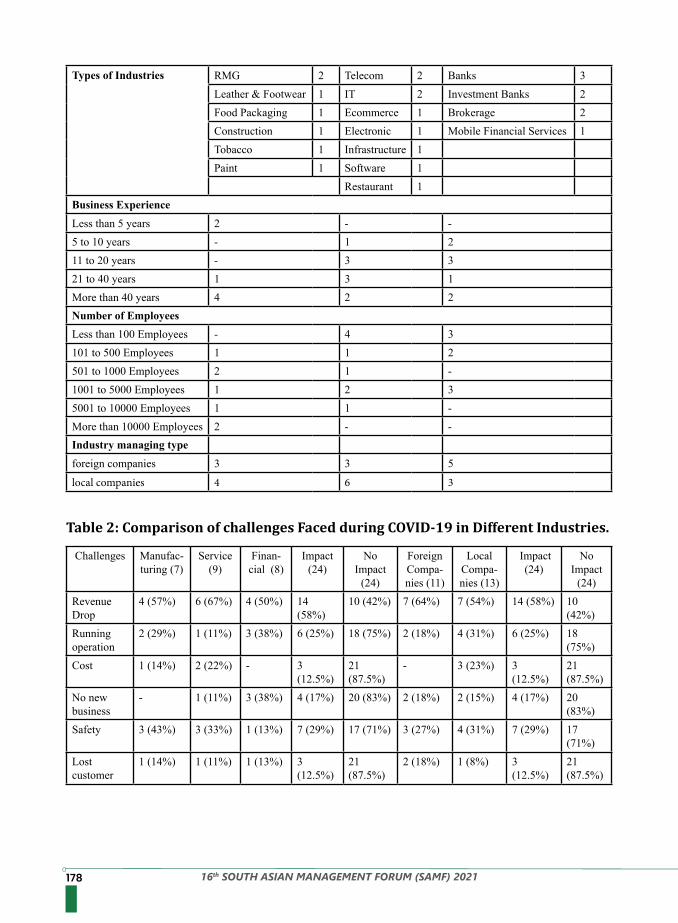
178 16th SOUTH ASIAN MANAGEMENT FORUM (SAMF) 2021
Table 2: Comparison of challenges Faced during COVID-19 in Different Industries.
Types of Industries RMG 2 Telecom 2 Banks 3Leather & Footwear 1 IT 2 Investment Banks 2Food Packaging 1 Ecommerce 1 Brokerage 2Construction 1 Electronic 1 Mobile Financial Services 1Tobacco 1 Infrastructure 1Paint 1 Software 1
Restaurant 1Business ExperienceLess than 5 years 2 - -5 to 10 years - 1 211 to 20 years - 3 321 to 40 years 1 3 1More than 40 years 4 2 2Number of EmployeesLess than 100 Employees - 4 3101 to 500 Employees 1 1 2501 to 1000 Employees 2 1 -1001 to 5000 Employees 1 2 35001 to 10000 Employees 1 1 -More than 10000 Employees 2 - -Industry managing typeforeign companies 3 3 5
local companies 4 6 3
Challenges Manufac-turing (7)
Service (9)
Finan-cial (8)
Impact (24)
No Impact
(24)
Foreign Compa-nies (11)
Local Compa-nies (13)
Impact (24)
No Impact
(24)Revenue Drop
4 (57%) 6 (67%) 4 (50%) 14 (58%)
10 (42%) 7 (64%) 7 (54%) 14 (58%) 10 (42%)
Running operation
2 (29%) 1 (11%) 3 (38%) 6 (25%) 18 (75%) 2 (18%) 4 (31%) 6 (25%) 18 (75%)
Cost 1 (14%) 2 (22%) - 3 (12.5%)
21 (87.5%)
- 3 (23%) 3 (12.5%)
21 (87.5%)
No new business
- 1 (11%) 3 (38%) 4 (17%) 20 (83%) 2 (18%) 2 (15%) 4 (17%) 20 (83%)
Safety 3 (43%) 3 (33%) 1 (13%) 7 (29%) 17 (71%) 3 (27%) 4 (31%) 7 (29%) 17 (71%)
Lost customer
1 (14%) 1 (11%) 1 (13%) 3 (12.5%)
21 (87.5%)
2 (18%) 1 (8%) 3 (12.5%)
21 (87.5%)
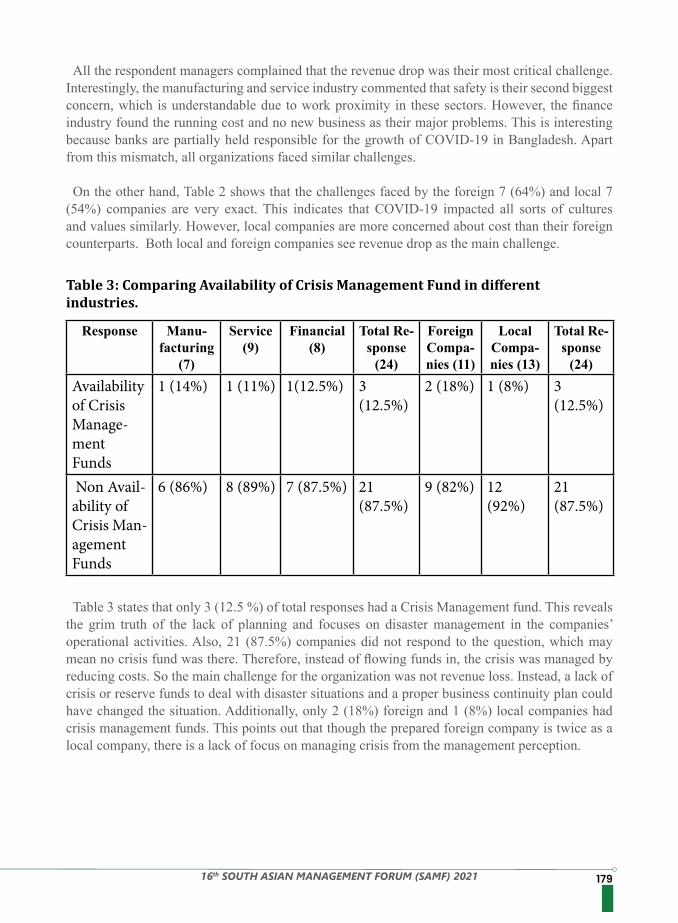
17916th SOUTH ASIAN MANAGEMENT FORUM (SAMF) 2021
All the respondent managers complained that the revenue drop was their most critical challenge. Interestingly, the manufacturing and service industry commented that safety is their second biggest concern, which is understandable due to work proximity in these sectors. However, the finance industry found the running cost and no new business as their major problems. This is interesting because banks are partially held responsible for the growth of COVID-19 in Bangladesh. Apart from this mismatch, all organizations faced similar challenges.
On the other hand, Table 2 shows that the challenges faced by the foreign 7 (64%) and local 7 (54%) companies are very exact. This indicates that COVID-19 impacted all sorts of cultures and values similarly. However, local companies are more concerned about cost than their foreign counterparts. Both local and foreign companies see revenue drop as the main challenge.
Table 3 states that only 3 (12.5 %) of total responses had a Crisis Management fund. This reveals the grim truth of the lack of planning and focuses on disaster management in the companies’ operational activities. Also, 21 (87.5%) companies did not respond to the question, which may mean no crisis fund was there. Therefore, instead of flowing funds in, the crisis was managed by reducing costs. So the main challenge for the organization was not revenue loss. Instead, a lack of crisis or reserve funds to deal with disaster situations and a proper business continuity plan could have changed the situation. Additionally, only 2 (18%) foreign and 1 (8%) local companies had crisis management funds. This points out that though the prepared foreign company is twice as a local company, there is a lack of focus on managing crisis from the management perception.
Table 3: Comparing Availability of Crisis Management Fund in different industries.
Response Manu-facturing
(7)
Service(9)
Financial(8)
Total Re-sponse
(24)
Foreign Compa-nies (11)
Local Compa-nies (13)
Total Re-sponse
(24)Availability of Crisis Manage-ment Funds
1 (14%) 1 (11%) 1(12.5%) 3 (12.5%)
2 (18%) 1 (8%) 3 (12.5%)
Non Avail-ability of Crisis Man-agement Funds
6 (86%) 8 (89%) 7 (87.5%) 21 (87.5%)
9 (82%) 12 (92%)
21 (87.5%)
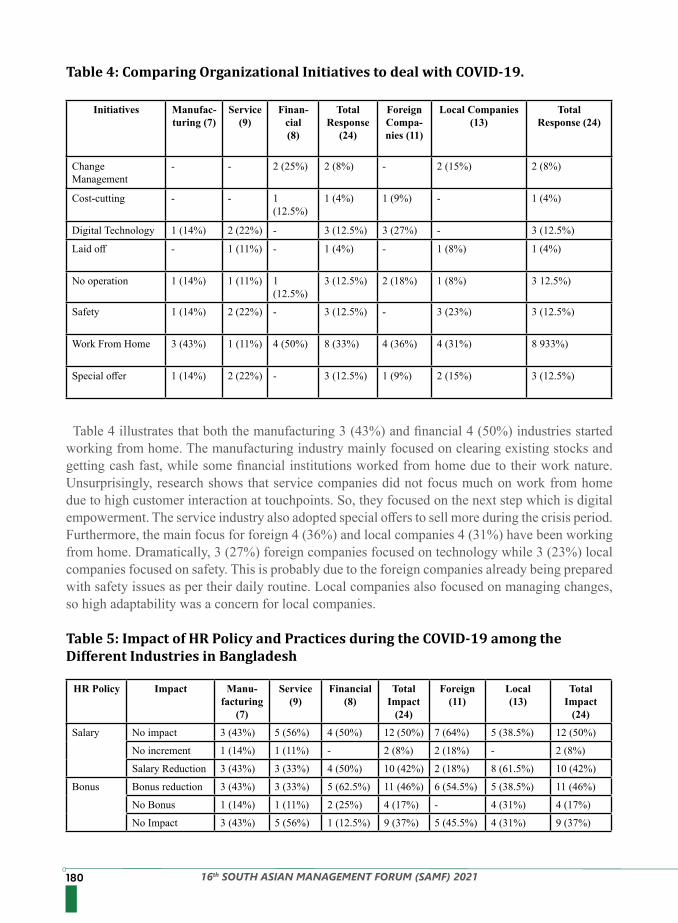
180 16th SOUTH ASIAN MANAGEMENT FORUM (SAMF) 2021
Table 4 illustrates that both the manufacturing 3 (43%) and financial 4 (50%) industries started working from home. The manufacturing industry mainly focused on clearing existing stocks and getting cash fast, while some financial institutions worked from home due to their work nature. Unsurprisingly, research shows that service companies did not focus much on work from home due to high customer interaction at touchpoints. So, they focused on the next step which is digital empowerment. The service industry also adopted special offers to sell more during the crisis period. Furthermore, the main focus for foreign 4 (36%) and local companies 4 (31%) have been working from home. Dramatically, 3 (27%) foreign companies focused on technology while 3 (23%) local companies focused on safety. This is probably due to the foreign companies already being prepared with safety issues as per their daily routine. Local companies also focused on managing changes, so high adaptability was a concern for local companies.
Table 4: Comparing Organizational Initiatives to deal with COVID-19.
Table 5: Impact of HR Policy and Practices during the COVID-19 among the Different Industries in Bangladesh
Initiatives Manufac-turing (7)
Service(9)
Finan-cial(8)
Total Response
(24)
Foreign Compa-nies (11)
Local Companies (13)
TotalResponse (24)
Change Management
- - 2 (25%) 2 (8%) - 2 (15%) 2 (8%)
Cost-cutting - - 1 (12.5%)
1 (4%) 1 (9%) - 1 (4%)
Digital Technology 1 (14%) 2 (22%) - 3 (12.5%) 3 (27%) - 3 (12.5%)
Laid off - 1 (11%) - 1 (4%) - 1 (8%) 1 (4%)
No operation 1 (14%) 1 (11%) 1 (12.5%)
3 (12.5%) 2 (18%) 1 (8%) 3 12.5%)
Safety 1 (14%) 2 (22%) - 3 (12.5%) - 3 (23%) 3 (12.5%)
Work From Home 3 (43%) 1 (11%) 4 (50%) 8 (33%) 4 (36%) 4 (31%) 8 933%)
Special offer 1 (14%) 2 (22%) - 3 (12.5%) 1 (9%) 2 (15%) 3 (12.5%)
HR Policy Impact Manu-facturing
(7)
Service(9)
Financial(8)
Total Impact
(24)
Foreign(11)
Local(13)
TotalImpact
(24)
Salary No impact 3 (43%) 5 (56%) 4 (50%) 12 (50%) 7 (64%) 5 (38.5%) 12 (50%)
No increment 1 (14%) 1 (11%) - 2 (8%) 2 (18%) - 2 (8%)
Salary Reduction 3 (43%) 3 (33%) 4 (50%) 10 (42%) 2 (18%) 8 (61.5%) 10 (42%)
Bonus Bonus reduction 3 (43%) 3 (33%) 5 (62.5%) 11 (46%) 6 (54.5%) 5 (38.5%) 11 (46%)
No Bonus 1 (14%) 1 (11%) 2 (25%) 4 (17%) - 4 (31%) 4 (17%)
No Impact 3 (43%) 5 (56%) 1 (12.5%) 9 (37%) 5 (45.5%) 4 (31%) 9 (37%)
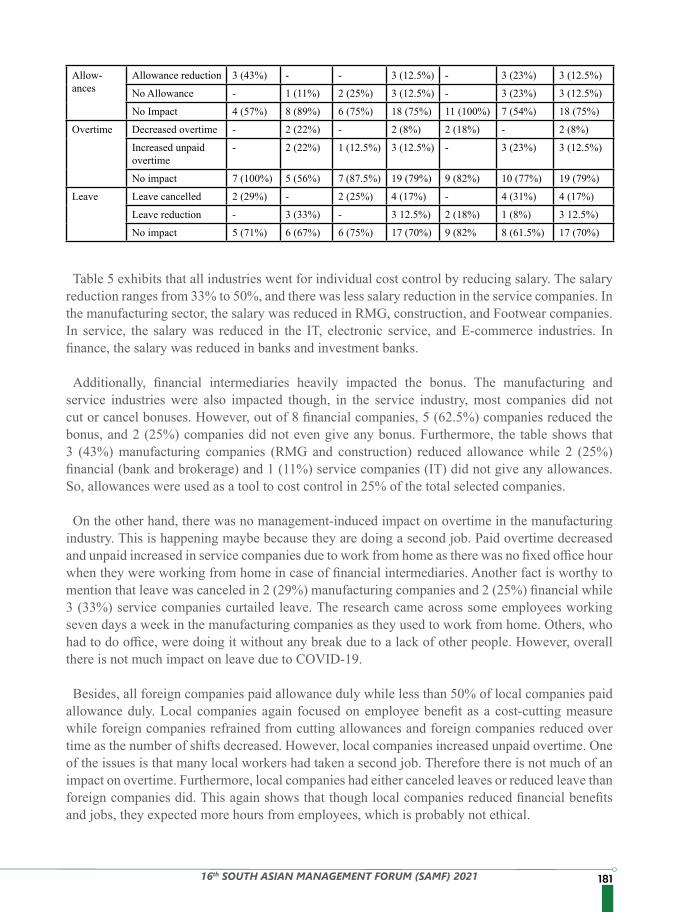
18116th SOUTH ASIAN MANAGEMENT FORUM (SAMF) 2021
Allow-ances
Allowance reduction 3 (43%) - - 3 (12.5%) - 3 (23%) 3 (12.5%)
No Allowance - 1 (11%) 2 (25%) 3 (12.5%) - 3 (23%) 3 (12.5%)
No Impact 4 (57%) 8 (89%) 6 (75%) 18 (75%) 11 (100%) 7 (54%) 18 (75%)
Overtime Decreased overtime - 2 (22%) - 2 (8%) 2 (18%) - 2 (8%)
Increased unpaid overtime
- 2 (22%) 1 (12.5%) 3 (12.5%) - 3 (23%) 3 (12.5%)
No impact 7 (100%) 5 (56%) 7 (87.5%) 19 (79%) 9 (82%) 10 (77%) 19 (79%)
Leave Leave cancelled 2 (29%) - 2 (25%) 4 (17%) - 4 (31%) 4 (17%)
Leave reduction - 3 (33%) - 3 12.5%) 2 (18%) 1 (8%) 3 12.5%)
No impact 5 (71%) 6 (67%) 6 (75%) 17 (70%) 9 (82% 8 (61.5%) 17 (70%)
Table 5 exhibits that all industries went for individual cost control by reducing salary. The salary reduction ranges from 33% to 50%, and there was less salary reduction in the service companies. In the manufacturing sector, the salary was reduced in RMG, construction, and Footwear companies. In service, the salary was reduced in the IT, electronic service, and E-commerce industries. In finance, the salary was reduced in banks and investment banks.
Additionally, financial intermediaries heavily impacted the bonus. The manufacturing and service industries were also impacted though, in the service industry, most companies did not cut or cancel bonuses. However, out of 8 financial companies, 5 (62.5%) companies reduced the bonus, and 2 (25%) companies did not even give any bonus. Furthermore, the table shows that 3 (43%) manufacturing companies (RMG and construction) reduced allowance while 2 (25%) financial (bank and brokerage) and 1 (11%) service companies (IT) did not give any allowances. So, allowances were used as a tool to cost control in 25% of the total selected companies.
On the other hand, there was no management-induced impact on overtime in the manufacturing industry. This is happening maybe because they are doing a second job. Paid overtime decreased and unpaid increased in service companies due to work from home as there was no fixed office hour when they were working from home in case of financial intermediaries. Another fact is worthy to mention that leave was canceled in 2 (29%) manufacturing companies and 2 (25%) financial while 3 (33%) service companies curtailed leave. The research came across some employees working seven days a week in the manufacturing companies as they used to work from home. Others, who had to do office, were doing it without any break due to a lack of other people. However, overall there is not much impact on leave due to COVID-19.
Besides, all foreign companies paid allowance duly while less than 50% of local companies paid allowance duly. Local companies again focused on employee benefit as a cost-cutting measure while foreign companies refrained from cutting allowances and foreign companies reduced over time as the number of shifts decreased. However, local companies increased unpaid overtime. One of the issues is that many local workers had taken a second job. Therefore there is not much of an impact on overtime. Furthermore, local companies had either canceled leaves or reduced leave than foreign companies did. This again shows that though local companies reduced financial benefits and jobs, they expected more hours from employees, which is probably not ethical.
182 16th SOUTH ASIAN MANAGEMENT FORUM (SAMF) 2021
To explore the COVID impact on HRM practices across the companies, the study investigates different industries. This study has analyzed and explored HRM practices in 24 companies, including manufacturing, service, and financial companies. We tried to identify their HRM practices in the area of job assurance, compensation policy, and survivability. We focused on basic salary, bonus, allowance, overtime, and leave in the compensation policy.
The results suggest that companies across all industries used various pay cut costs as a cost reduction measure during COVID-19. However, local companies are cutting more jobs and pay than foreign companies. It is known that during standard time, foreign companies tend to adopt local companies’ practices to their existing strategy and make a hybrid HRM (Miah & Hossain, 2014). However, in times of crisis, it is found here that the local and foreign companies act differently. This may be attributed to fear, lack of experience, etc. However, further study to understand this behavior is needed. Most of the questions were open-ended and focused on understanding the trigger behind the companies’ decisions. COVID-19 was a limitation to conducting a large-scale study. However, the study should understand how local and foreign companies behave differently in times of crisis while they behave similarly in regular times. Further studies such as an industry-wide comparison of HRM practices during average and crisis times should help clarify.
1. Ahmed, A. U., Zaman, A.-U., & Khan, Z. Z. (2020). Post COVID-19 jobs and skills in Bangladesh. Dhaka: Aspire to Innovate
2. Ali, M. J., Bhuiyan, A. B., Zulkifli, N., & Hassan, M. K. (2020). The Covid-19 Pandemic: Conceptual Model for the Global Economic Impacts and Recovery. Available at SSRN 3656243.
3. Bangladesh Bureau of Statistics. (2020). Gross Domestic Product of Bangladesh. Dhaka: Bangladesh Buerau of Statistics.
4. Genoni, M. E., Khan, A. I., Krishnan, N., Palaniswamy, N., & Raza, W. (2020). Losing Livelihoods: The Labor Market Impacts of COVID-19 in Bangladesh.
5. Islam, R., Jahangir, A. R. (2020, April). Corona fallout spells disaster for millions of poor Bangladeshis: Economists. United News of Bangladesh. https://unb.com. bd/category/special/corona-fallout-spells-disaster-for-millions-of-poor-Bangladeshis-economists/48533.
6. Macksoud, L., Schrag, S., Richards, R. E., & Alberts, S. J. (2020). Covid-19 and its impact on the global economy. Retrieved March 27, 2020.
7. Miah, M. K., & Hossain, M. S. (2014). A comparative study of HRM practices between foreign and local garment companies in Bangladesh. South Asian Journal of Human Resources Management, 1(1), 67-89.
8. Parveen, M. (2020). Challenges Faced by Pandemic Covid 19 Crisis: A Case Study in Saudi Arabia. Challenge, 63(6), 349-364.
9. Riaz, A. (2020, April). Bangladesh’s COVID-19 stimulus: Leaving the most vulnerable behind. Atlantic Council. https://www.atlanticcouncil.org/blogs/new-atlanticist/bangladeshs-covid-19-stimulus-leaving-the-most-vulnerable-behind/.
10. Rodela, T. T., Tasnim, S., Mazumder, H., Faizah, F., Sultana, A., & Hossain, M. M. (2020). Economic impacts of coronavirus disease (COVID-19) in developing countries.
Conclusion
References
18316th SOUTH ASIAN MANAGEMENT FORUM (SAMF) 2021
11. Sajadi, M. M., Habibzadeh, P., Vintzileos, A., Shokouhi, S., Miralles-Wilhelm, F., & Amoroso, A. Temperature and latitude analysis to predict potential spread and seasonality for COVID-19; 2020. Available at SSRN.
12. World Bank. (2020). Losing livelihoods: The labor market impacts of COVID-19 in Bangladesh. World Bank. http://documents1.worldbank.org/curated/en/475551600152674960/ppdf/Losing-Livelihoods-The-Labor-Market-Impacts-of COVID-19-in-Bangladesh.pdf.
184 16th SOUTH ASIAN MANAGEMENT FORUM (SAMF) 2021
The study aimed to establish the association between corporate social responsibility and firm performance and observe the CEO power’s role in the association. A sample was collected from thirty-seven organizations from 2014 to 2018 across diversified industry sectors, active in CSR contribution to society. The study employed the fixed effects method and random methods to do the analysis. The empirical analysis indicates underlying conclusions: CSR has a positive effect on firm performance in the manufacturing industry, which is classified into ROA and EPS. Further, CEO power is having a moderating impact on the association between Firm Performance and CSR.
Amit Kumar Gupta, Management Development Institute India
The study intends to understand the association between CSR and FP. Moreover, an attempt shall be made to understand how CEO Power affects this association in emerging economies such as India. The underlying effort is to know whether the firm/organization’s performance is genuinely affected by the CSR initiatives and impacts the external world, which is affected positively and negatively by the existence of these organizations. The idea of the study shall also revolve around exploring the business interest of an organization in implementing CSR and how its CEO/ Highest controlling authority and the ownership structure play a moderator role. In the past few years, sustainable business models have become a prominent issue. Thus internal stakeholders have been paying more attention to social activities (CSR), including Education, Poverty Alleviation, Green Landscape, Afforestation, etc.CSR has been first discussed (Sheldon 2004, 2003) as wilful engagement in activities that benefit society. The history of CSR has been touched by (Carroll, 2017; Lee and Xia, 2006). Before the 1980’s CSR had proven to be a burden on the firm, an initiative that benefitted various stakeholders but at the expense of stockholders(Friedman, 2017, 1970). After the 1980s, CSR was given importance in strategic firm goals after developing stakeholder theory (Freeman, 1984).
At the beginning of the Twenty-First century, CSR became the primary concern for businesses across the globe. CSR, in general terms, is defined as activities that consider both social and economic benefits for the company. The justification is proof of Corporate Social Responsibility considerations for people & sustainability. The study is necessary to exemplify the benefits (both tangible and intangible) of CSR initiatives to the external society in the Indian context, thereby creating value at the lowermost user level.
The idea of CSR started with the belief that corporations could play a lynchpin role in tackling big problems that countries are facing considering their strong economic and social presence in the lives of thousands of people. This movement eventually transitioned from a voluntary activity to
Keywords: CEO power, fixed effect, Random effect, Hausman test
Introduction
Abstract
ASSOCIATION BETWEEN CORPORATE SOCIAL RESPONSIBILITY AND FIRM PERFORMANCE WITH MODERATING EFFECTS OF CEO
POWER: EMPIRICAL EVIDENCE FROM DEVELOPING NATION
18516th SOUTH ASIAN MANAGEMENT FORUM (SAMF) 2021
In India, CSR was mandated as a part of the Company’s Act in 2013, “CSR spends of 2% of average net profits during the three immediately preceding financial years” for firms that meet a certain financial threshold. Organizations “having a net worth of rupees five billion or more, or turnover of rupees ten billion or more or a net profit of rupees fifty million or more during any financial year” are bound to spend a minimum of 2% of normal net profits during the three preceding years for Corporate Social Responsibility tasks. Five years since the law came out, there was plenty of CSR-related discourse related to the monies that were spent as a part of the law, and a detailed understanding of the CSR projects. However, the main reason for the law coming alive, i.e., making businesses socially responsible, is rare. Thus, this requires a deeper assessment. The CRISIL’s Corporate Social Responsibility (Yearbook, 2017), out of 4,939 organizations on BSE and NSE, only One thousand six hundred eighty-eight match the criteria for obligatory spending.
However, the flipside to this is that the expenditure was less than Rs 9,669 crore of the directed spent as 2% of the profit. Moreover, the database released by CRISIL analyzes that only a little more than half Fifty-seven percent (57%) of the organizations conformed with the Two Percent stipulation.
Another interesting aspect that the CRISIL reports investigate is the association between CSR & Ownership Structure. The research about incentive configuration mechanism states that managers with higher ownerships are likely to support corporate social responsibility, which helps in the shareholders’ long-term wealth. The opposite school of thought, in this case, suggests that the power which has been possessed by significant ownership may enhance ‘‘management’s entrenchment.’’ Therefore, this research tries to engage with the complex associations between CSR, Performance,
Firm, and ownership structure. This study also brings out the non-linear as well as interactive effects of these constructs. Overall, this study helps advance the space of CSR by understanding the connection between ownership structure, firm performance, and corporate Social outcomes.
The studies, as indicated by previous research, have been conducted at various Geographical locations naming China, France, Pakistan, the US, etc. Different constructs have been tested, ranging from stock exchange prices, earnings per share, Ownership structure, CEO power, and Board independence to check the effect on the dependent variable, Firm Performance. The sample as observed in the study ranges from 45 to 1000 in number, for which various indices have been referred to to conclude the results. The literature review outcomes are grouped based on the objectives.
Some research highlights a positive association between Corporate Social Responsibility & economic performance. Margolis and Walsh (2003); Orlitzky et al.(2003)showed that an organization’s CSR and FP are positively linked due to a positive environment created. Quazi and Richardson(2012) conducted an assessment of 51 previous studies that are part of Orlitzky et al.(2003) and indicated that sample size has a significant impact on the study conducted for CSR and the association is positive with increasing sample size. Blasi et al.(2018)outcome showed linkages and sectorial specifics. Corporate Social Responsibility engagement, in general, enhances firms’ Earning per share and reduces financial risk, but it depends on the domain of CSR in which the organization is investing. Another study, published by Ishtiaq et al. (2017), aims to establish
Literature Review
Corporate Social Responsibility And Firm Performance
186 16th SOUTH ASIAN MANAGEMENT FORUM (SAMF) 2021
an association between CSR and firm performance. Regression Analysis showed the association by taking stocks of the Pakistan Stock Exchange, and 100 non-financial listed organizations from 2006 to 2015. The study concluded that there is a significant positive correlation between the CSR initiatives and Firm performance, but only ROA is taken as a measure of firm performance.
However, few studies show that Corporate Social Responsibility adversely affects Firm Performance. According to Akben Selcuk and Kiymaz(2017), a negative association between CSR and firm performance was found. After getting control of the debt and size of the firms, it was further found that though highly opened firms are less profitable, more prominent firms have high profits. In a way, nothing conclusive has been established for the Indian context, which is one of the aims to establish through this research.
Dah and Jizi(2018)establish that the board independence has higher CSR disclosure and positively affects the relation between CSR and firm performance. It establishes that higher board freeness positively stimulates the reliability of information disclosed to the outside world, signaling better prospects for the organization. It concluded that there is a positive correlation between firm performance and CSR when the director is free to take decisions. The paper by Xue et al.( 2019) also establishes the effect of family ownership on the CSR initiatives carried out by Small and Medium Enterprises in China.
Peng and Yang(2014)confirm categorically that the ownership concentration, specifically the split between the financial control and cash-flow rights, adversely moderates the relation between CSR and firm performance. The framework of the study listed organizations in Taiwan from the period 1996 to 2006. Similarly, Ishtiaq et al. (2017) also showed that ownership structure weakens the association between CSR and firm performance to a considerable level. The study by(Ducassy and Montandrau, 2015) also attempts to link Corporate social performance with the ownership structure. However, they found mixed results about the association between CSP and ownership structure within French organizations.
Since some of the studies indicated above did not present a conclusive result on the association between CSR and firm performance and also failed to establish the effects of the ownership structure of the relationship, particularly in the Indian context, still more investigations are required
Firms with high revenue tend to publish environmental & social disclosure in their reports, claiming their faith in society. Further, Social impact theory suggests that Corporate Social Responsibility has a positive inter-connection to firms’ performance and increases firms’ social associations. The research found that ROA is essential for CSR and Firm Performance, and the research further confirms that organizations aggressively use ROA and EPS as their performance measurement tool. Empirical studies most of the time use accounting-based performance measurements to search the CSR and FP such as:
•ROA •Asset Turnover
Ceo Power Moderates The Association Between Csr And Firm Performance
Understanding
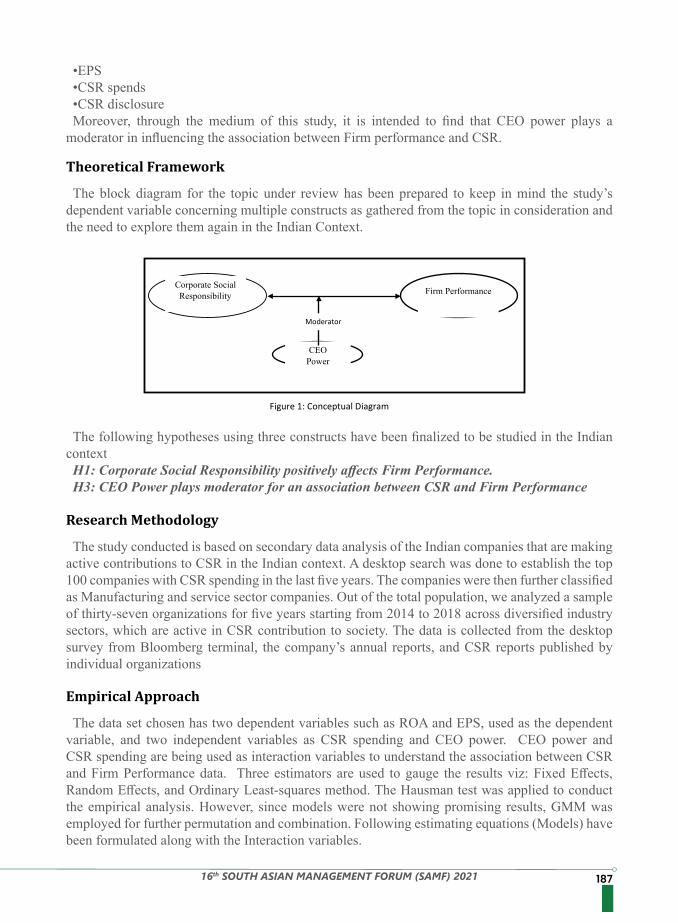
18716th SOUTH ASIAN MANAGEMENT FORUM (SAMF) 2021
•EPS•CSR spends•CSR disclosureMoreover, through the medium of this study, it is intended to find that CEO power plays a
moderator in influencing the association between Firm performance and CSR.
The block diagram for the topic under review has been prepared to keep in mind the study’s dependent variable concerning multiple constructs as gathered from the topic in consideration and the need to explore them again in the Indian Context.
The study conducted is based on secondary data analysis of the Indian companies that are making active contributions to CSR in the Indian context. A desktop search was done to establish the top 100 companies with CSR spending in the last five years. The companies were then further classified as Manufacturing and service sector companies. Out of the total population, we analyzed a sample of thirty-seven organizations for five years starting from 2014 to 2018 across diversified industry sectors, which are active in CSR contribution to society. The data is collected from the desktop survey from Bloomberg terminal, the company’s annual reports, and CSR reports published by individual organizations
The data set chosen has two dependent variables such as ROA and EPS, used as the dependent variable, and two independent variables as CSR spending and CEO power. CEO power and CSR spending are being used as interaction variables to understand the association between CSR and Firm Performance data. Three estimators are used to gauge the results viz: Fixed Effects, Random Effects, and Ordinary Least-squares method. The Hausman test was applied to conduct the empirical analysis. However, since models were not showing promising results, GMM was employed for further permutation and combination. Following estimating equations (Models) have been formulated along with the Interaction variables.
The following hypotheses using three constructs have been finalized to be studied in the Indian contextH1: Corporate Social Responsibility positively affects Firm Performance.H3: CEO Power plays moderator for an association between CSR and Firm Performance
Theoretical Framework
Research Methodology
Empirical Approach
Corporate Social Responsibility Firm Performance
CEO Power
Moderator
Figure 1: Conceptual Diagram
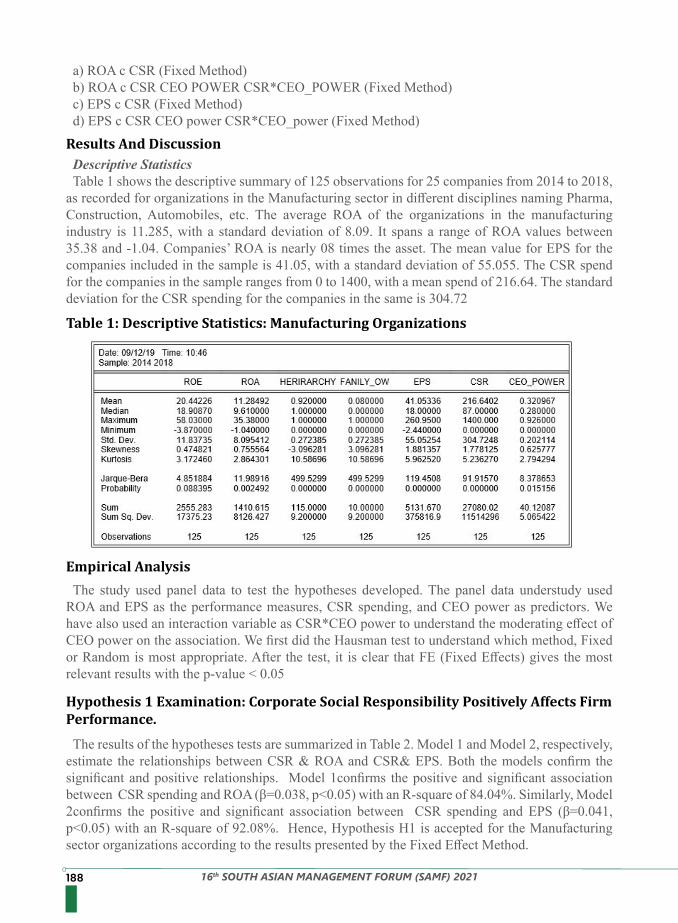
188 16th SOUTH ASIAN MANAGEMENT FORUM (SAMF) 2021
The study used panel data to test the hypotheses developed. The panel data understudy used ROA and EPS as the performance measures, CSR spending, and CEO power as predictors. We have also used an interaction variable as CSR*CEO power to understand the moderating effect of CEO power on the association. We first did the Hausman test to understand which method, Fixed or Random is most appropriate. After the test, it is clear that FE (Fixed Effects) gives the most relevant results with the p-value < 0.05
The results of the hypotheses tests are summarized in Table 2. Model 1 and Model 2, respectively, estimate the relationships between CSR & ROA and CSR& EPS. Both the models confirm the significant and positive relationships. Model 1confirms the positive and significant association between CSR spending and ROA (β=0.038, p<0.05) with an R-square of 84.04%. Similarly, Model 2confirms the positive and significant association between CSR spending and EPS (β=0.041, p<0.05) with an R-square of 92.08%. Hence, Hypothesis H1 is accepted for the Manufacturing sector organizations according to the results presented by the Fixed Effect Method.
a) ROA c CSR (Fixed Method)b) ROA c CSR CEO POWER CSR*CEO_POWER (Fixed Method)c) EPS c CSR (Fixed Method)d) EPS c CSR CEO power CSR*CEO_power (Fixed Method)
Descriptive StatisticsTable 1 shows the descriptive summary of 125 observations for 25 companies from 2014 to 2018,
as recorded for organizations in the Manufacturing sector in different disciplines naming Pharma, Construction, Automobiles, etc. The average ROA of the organizations in the manufacturing industry is 11.285, with a standard deviation of 8.09. It spans a range of ROA values between 35.38 and -1.04. Companies’ ROA is nearly 08 times the asset. The mean value for EPS for the companies included in the sample is 41.05, with a standard deviation of 55.055. The CSR spend for the companies in the sample ranges from 0 to 1400, with a mean spend of 216.64. The standard deviation for the CSR spending for the companies in the same is 304.72
Results And Discussion
Table 1: Descriptive Statistics: Manufacturing Organizations
Empirical Analysis
Hypothesis 1 Examination: Corporate Social Responsibility Positively Affects Firm Performance.
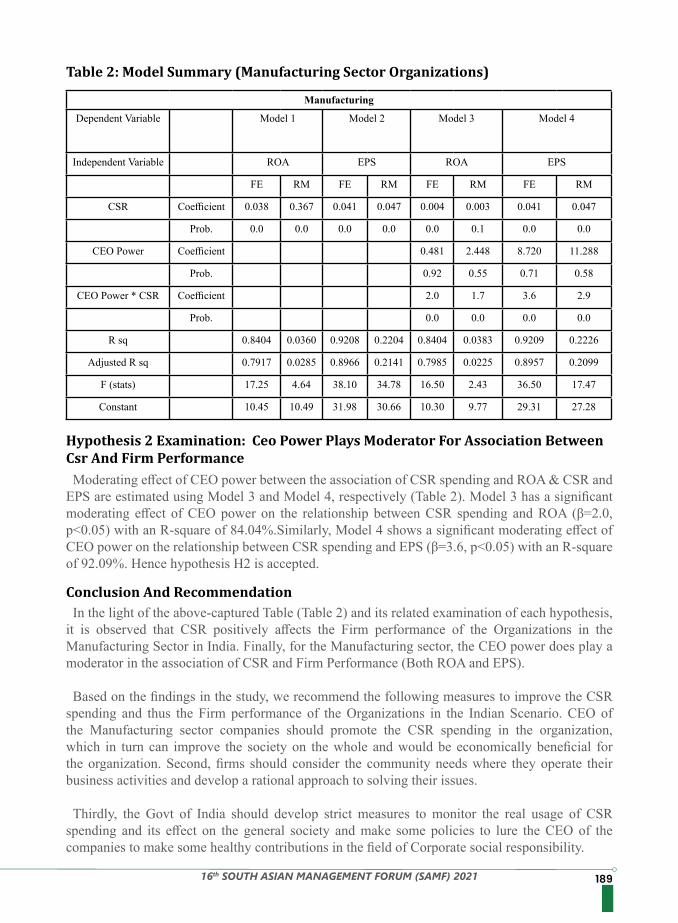
18916th SOUTH ASIAN MANAGEMENT FORUM (SAMF) 2021
Table 2: Model Summary (Manufacturing Sector Organizations)
Hypothesis 2 Examination: Ceo Power Plays Moderator For Association Between Csr And Firm Performance
Conclusion And Recommendation
Manufacturing
Dependent Variable Model 1 Model 2 Model 3 Model 4
Independent Variable ROA EPS ROA EPS
FE RM FE RM FE RM FE RM
CSR Coefficient 0.038 0.367 0.041 0.047 0.004 0.003 0.041 0.047
Prob. 0.0 0.0 0.0 0.0 0.0 0.1 0.0 0.0
CEO Power Coefficient 0.481 2.448 8.720 11.288
Prob. 0.92 0.55 0.71 0.58
CEO Power * CSR Coefficient 2.0 1.7 3.6 2.9
Prob. 0.0 0.0 0.0 0.0
R sq 0.8404 0.0360 0.9208 0.2204 0.8404 0.0383 0.9209 0.2226
Adjusted R sq 0.7917 0.0285 0.8966 0.2141 0.7985 0.0225 0.8957 0.2099
F (stats) 17.25 4.64 38.10 34.78 16.50 2.43 36.50 17.47
Constant 10.45 10.49 31.98 30.66 10.30 9.77 29.31 27.28
Moderating effect of CEO power between the association of CSR spending and ROA & CSR and EPS are estimated using Model 3 and Model 4, respectively (Table 2). Model 3 has a significant moderating effect of CEO power on the relationship between CSR spending and ROA (β=2.0, p<0.05) with an R-square of 84.04%.Similarly, Model 4 shows a significant moderating effect of CEO power on the relationship between CSR spending and EPS (β=3.6, p<0.05) with an R-square of 92.09%. Hence hypothesis H2 is accepted.
In the light of the above-captured Table (Table 2) and its related examination of each hypothesis, it is observed that CSR positively affects the Firm performance of the Organizations in the Manufacturing Sector in India. Finally, for the Manufacturing sector, the CEO power does play a moderator in the association of CSR and Firm Performance (Both ROA and EPS).
Based on the findings in the study, we recommend the following measures to improve the CSR spending and thus the Firm performance of the Organizations in the Indian Scenario. CEO of the Manufacturing sector companies should promote the CSR spending in the organization, which in turn can improve the society on the whole and would be economically beneficial for the organization. Second, firms should consider the community needs where they operate their business activities and develop a rational approach to solving their issues.
Thirdly, the Govt of India should develop strict measures to monitor the real usage of CSR spending and its effect on the general society and make some policies to lure the CEO of the companies to make some healthy contributions in the field of Corporate social responsibility.
190 16th SOUTH ASIAN MANAGEMENT FORUM (SAMF) 2021
References
1. Akben Selcuk, E., Kiymaz, H., 2017. Corporate Social Responsibility and Firm Performance: Evidence from an Emerging Market. Account. Finance. Res. https://doi.org/10.5430/afr.v6n4p42
2. Blasi, S., Caporin, M., Fontini, F., 2018. A Multidimensional Analysis of the Relationship Between Corporate Social Responsibility and Firms’ Economic Performance. Ecol. Econ. 147, 218–229. https://doi.org/10.1016/J.ECOLECON.2018.01.014
3. Carroll, A.B., 2017. A three-dimensional conceptual model of corporate performance, in Corporate Social Responsibility. https://doi.org/10.5465/amr.1979.4498296
4. Dah, M.A., Jizi, M.I., 2018. Board independence and the efficacy of social reporting. J. Int. Account. Res. https://doi.org/10.2308/jiar-51952
5. Ducassy, I., Montandrau, S., 2015. Corporate social performance, ownership structure, and corporate governance in France. Res. Int. Bus. Finance. https://doi.org/10.1016/j.ribaf.2015.02.002
6. Freeman, R.E., 1984. Strategic Management: A Stakeholder Perspective, Pitman: Boston, MA.
7. Friedman, M., 2017. The social responsibility of a business is to increase its profits, in Corporate Social Responsibility. https://doi.org/10.1007/978-3-540-70818-6_14
8. Friedman, M., 1970. A Friedman doctrine - The Social Responsibility of Business Is to Increase Its Profits. N. Y. Times Mag.
9. Ishtiaq, M., Latif, K., Khan, A.N., Noreen, R., 2017. Corporate Social Responsibility and Firm Performance: The Moderating Effect of Ownership Concentration. J. Manag. Sci.
10. Lee, G., Xia, W., 2006. Organizational size and IT innovation adoption: A meta-analysis. Inf. Manag. https://doi.org/10.1016/j.im.2006.09.003
11. Margolis, J.D., Walsh, J.P., 2003. Misery Loves Companies: Rethinking Social Initiatives by Business. Adm. Sci. Q. 48. https://doi.org/10.2307/3556659
12. Orlitzky, M., Schmidt, F.L., Rynes, S.L., 2003. Corporate social and financial performance: A meta-analysis. Organ. Stud. 24, 403–441. https://doi.org/10.1177/0170840603024003910
13. Peng, C.W., Yang, M.L., 2014. The Effect of Corporate Social Performance on Financial Performance: The Moderating Effect of Ownership Concentration. J. Bus. Ethics. https://doi.org/10.1007/s10551-013-1809-9
14. Quazi, A., Richardson, A., 2012. Sources of variation in linking corporate social responsibility and financial performance. Soc. Responsib. J. 8, 242–256. https://doi.org/10.1108/17471111211234860
15. Sheldon, O., 2004. The early sociology of management and organizations. Volume 2, The philosophy of management 296.
16. Sheldon, O., 2003. The philosophy of management.17. Xue, K., Yu, M., Xu, S., 2019. Corporate social responsibility and Chinese family-owned
small- and medium-sized enterprises. Soc. Behav. Pers. https://doi.org/10.2224/sbp.7597
19116th SOUTH ASIAN MANAGEMENT FORUM (SAMF) 2021
CORPORATE DUAL DILEMMA: AGE DISCRIMINATION AND AGE- INCLUSIVE WORKPLACES DURING PANDEMIC TIMES
Samantha Rathnayake, Ph.D. Faculty Member, Postgraduate Institute of Management, University of Sri Jayewardenepura, Sri Lanka. Email: [email protected]
C D Kumar is an entrepreneur and Founder/ Director of MCK Private Ltd., Sri Lanka. Email: [email protected] discrimination is rampant during this pandemic, as the corporate world chooses ‘surgical older worker layoffs’ to become leaner. In the process, its competitive advantage: an Age diverse workforce is lost. Producing Age discrimination, then fighting to prevent the same through building Age inclusive workplaces, is a corporate creation of a dual dilemma. In addition, the critical void in literary knowledge and corporate expertise on the subject is of grave concern. As such, this paper addresses the corporate factors of Age discrimination and the twofold corporate obligation of preventing Age discrimination and building Age-inclusive workplaces. As an exploratory qualitative study of in-depth interviews and focus groups of 32 managers and thematic data analysis, the study yields several insights.Keywords: Age diversity, Age discrimination, Age inclusion
IntroductionAge discrimination is a global phenomenon that has been intensified during these pandemic times. While the corporate sector contributes to it through several corporate policies and practices, the current pandemic has aggravated it further (Agovino, 2020; Ayalon et al., 2021 Bachman, 2020; Homegardner, 2020). The corporate world employs diverse generational cohorts that generate age discrimination through various individual and organizational factors (Gursoy et al., 2013; Lancaster & Stillman, 2002; Zemke et al., 2000). On an individual level, it breeds multiple forms of bias, and on an organizational level, institutionalized bias and unfair resource allocation targeting the different generational cohorts gives birth to Age discrimination (Gursoy et al., 2013; Lancaster & Stillman, 2002; Meyer & Rowan, 1977; North & Fiske, 2016; Perry et al., 1996; Perry & Finkelstein, 1999; Zemke et al., 2000). Currently, a further dimension - the pandemic of older employee layoff has emerged, amplifying Age discrimination. Organizations adopt employee layoff as a common strategy to become leaner, especially during challenging times. However, widespread ‘older employee surgical layoff’ is Age discrimination. Ironically, it is also justified by the notion that they (the older workers) are the worst ‘at risk group’ and hence discriminated against under the guise of favor (Agovino, 2020; Ayalon et al., 2021; Bachman, 2020; Homegardner, 2020). Although Inclusion has been accepted as the remedy for all forms of discrimination, Age inclusion is grossly neglected in the organizational context as inconsistencies, ambiguity and lack of tools for implementation and measurement exist (Jansen et al., 2011; Shore et al., 2011). Hence, while organizations are immersed in their self-created Age discrimination, they are also engaged in the dual struggle: to eradicate Age discrimination and create Age inclusive workplaces, as the generationally diverse workforce is a competitive advantage to be nurtured and built (Baran & Kłos, 2014). Thus, practicing managers and organizations are challenged with the critical dearth of knowledge and expertise in addressing this crucial need (Gordon, 2018).
Literature on Diversity, Discrimination, and Inclusion primarily deals with protected features such as race, color, language, religion, etc., leaving Age discrimination and Age inclusion understudied (Shore et al., 2011). Further, as age
192 16th SOUTH ASIAN MANAGEMENT FORUM (SAMF) 2021
changes with time, it also interacts with all other contextual elements along the timeline, making Age discrimination dynamic (Finkelstein et al., 2015; Fisher et al., 2017). The existing scarce knowledge predominantly on the Western world ignores the rest and does not adequately cover the phenomena; nor has it been tested in an organizational context (Fisher et al., 2017; Jansen et al., 2011; Shore et al., 2011). Age discrimination also does not have a specific underpinning theory but is generally explained through social theories. Similarly, Inclusion does not have a universally agreed-upon definition or an underpinning theory (Jansen et al., 2014; Shore et al., 2011). Thereby, the multifaceted, dynamic theoretical void in the Age discrimination/Age inclusion literature prompts the research questions: ‘How does Age discrimination manifest within organizations? ‘How can inclusion be experienced and what is its role within an age-diverse work-force in organizations?’ and How does the pandemic affect both Age discrimination and Age in-clusion?
Literature ReviewAge DiscriminationDue to global aging, youth joining the workforce decrease while the elderly continue to work beyond retirement age, extending the retirement ceiling, resulting in an age-diverse workforce. A diverse age workforce gives rise to age biases, prejudices, and stereotypes that lead to Age discrim-ination (Gursoy et al., 2013; Lancaster & Stillman, 2002; Zemke et al., 2000), especiallythe areas of recruitment and selection, performance appraisal, training and development, career opportunities, and disciplinary actions and penalties (Cleveland & Shore, 1992; Cox & Nkomo, 1991; Finkelstein et al., 2015; Lawrence, 1990; Maurer & Rafuse, 2001; Shore et al., 2003).The literature on Age discrimination mainly focuses on discrimination of older individuals with a
few works on Reverse ageism which is the discrimination of the younger individuals. Butler (1969) defines Age discrimination as the “systematic stereotyping of and discrimination against older people because they are old….” Several other scholars have highlighted the disproportionate
(Corell et al., 2010) discriminative behavior that creates, sustains, and reinforces disadvantages for specific individuals/groups against certain other individuals/groups (Dovidio et al., 2010) and denial of fundamental dignity as human beings. McConnachie (2014). The construct ‘Discrimination’ does not have a dedicated theory and is generally explained by Social Theories
such as the Social Identity Theory (SIT) (Tajfel & Turner, 1985) and the Self-Categorization The-ory (SCT) (Turner, 1987). BiasBias is the subjective perceptions that are often baseless and constitute a common terminology encompassing prejudices, stereotypes, and discrimination. While stereotypes form the cognitive bias, prejudice is the emotional or attitudinal outcome, and discrimination is the behavioral outcome (Fiske, 2000, 2004; Nelson, 2009). As per this study, individuals of a particular age group, shaped by the confluence of socio-cultural-political-economic-historical events of that era, influence them to hold similar beliefs, values, attitudes, perceptions, preferences, characteristics, and behaviors that are both unique and distinct that set each age group apart from one another (Kupperschmidt, 2000; Mannheim, 1952). An Age diverse workforce would consist of several such specific age groups coming together in the workplace, creating Age-based bias, friction, and conflicts leading to Age discrimination, the study’s dependent variable. Thus the study presents the first proposition.
P1: An Age diverse workforce produces Age discrimination
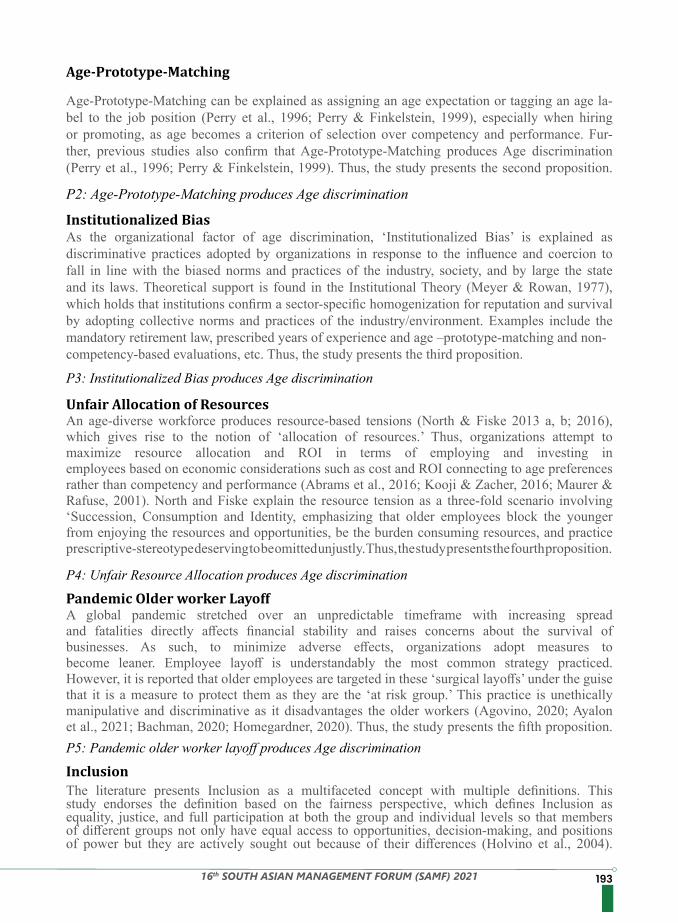
19316th SOUTH ASIAN MANAGEMENT FORUM (SAMF) 2021
Age-Prototype-Matching
Age-Prototype-Matching can be explained as assigning an age expectation or tagging an age la-bel to the job position (Perry et al., 1996; Perry & Finkelstein, 1999), especially when hiring or promoting, as age becomes a criterion of selection over competency and performance. Fur-ther, previous studies also confirm that Age-Prototype-Matching produces Age discrimination (Perry et al., 1996; Perry & Finkelstein, 1999). Thus, the study presents the second proposition.
P2: Age-Prototype-Matching produces Age discrimination
Institutionalized BiasAs the organizational factor of age discrimination, ‘Institutionalized Bias’ is explained as discriminative practices adopted by organizations in response to the influence and coercion to fall in line with the biased norms and practices of the industry, society, and by large the state and its laws. Theoretical support is found in the Institutional Theory (Meyer & Rowan, 1977), which holds that institutions confirm a sector-specific homogenization for reputation and survival by adopting collective norms and practices of the industry/environment. Examples include themandatory retirement law, prescribed years of experience and age –prototype-matching and non- competency-based evaluations, etc. Thus, the study presents the third proposition.
P3: Institutionalized Bias produces Age discrimination
Unfair Allocation of ResourcesAn age-diverse workforce produces resource-based tensions (North & Fiske 2013 a, b; 2016), which gives rise to the notion of ‘allocation of resources.’ Thus, organizations attempt to maximize resource allocation and ROI in terms of employing and investing in employees based on economic considerations such as cost and ROI connecting to age preferences rather than competency and performance (Abrams et al., 2016; Kooji & Zacher, 2016; Maurer & Rafuse, 2001). North and Fiske explain the resource tension as a three-fold scenario involving ‘Succession, Consumption and Identity, emphasizing that older employees block the younger from enjoying the resources and opportunities, be the burden consuming resources, and practice prescriptive-stereotype deserving to be omitted unjustly. Thus, the study presents the fourth proposition.
P4: Unfair Resource Allocation produces Age discrimination
Pandemic Older worker LayoffA global pandemic stretched over an unpredictable timeframe with increasing spread and fatalities directly affects financial stability and raises concerns about the survival of businesses. As such, to minimize adverse effects, organizations adopt measures to become leaner. Employee layoff is understandably the most common strategy practiced. However, it is reported that older employees are targeted in these ‘surgical layoffs’ under the guise that it is a measure to protect them as they are the ‘at risk group.’ This practice is unethically manipulative and discriminative as it disadvantages the older workers (Agovino, 2020; Ayalon et al., 2021; Bachman, 2020; Homegardner, 2020). Thus, the study presents the fifth proposition.P5: Pandemic older worker layoff produces Age discrimination
InclusionThe literature presents Inclusion as a multifaceted concept with multiple definitions. This study endorses the definition based on the fairness perspective, which defines Inclusion as equality, justice, and full participation at both the group and individual levels so that members of different groups not only have equal access to opportunities, decision-making, and positions of power but they are actively sought out because of their differences (Holvino et al., 2004).
194 16th SOUTH ASIAN MANAGEMENT FORUM (SAMF) 2021
The extent to which employees are enabled to participate and contribute and remove obstacles to the full participation and contribution of employees in organizations is another view held by Miller (1998) and Roberson (2006). This study conceptualizes Inclusion to consist of individual components, ‘Uniqueness and Belongingness’ and organizational components ‘Conducive Climate and Supportive Infrastructure.’ The individual component ‘Uniqueness and Belongingness’ are derived from Optimal Distinct Theory (ODT) (Brewer, 1991), which explains the contradicting “human needs for validation (similarity) to others and the need for uniqueness (individuality)” (p. 477). Brewer argues that individuals seek to balance the two contradicting needs by striving to maintain an optimal level of uniqueness and Inclusion in groups to which they belong. The organizational component ‘Conducive Climate’ is derived from synthesizing Diversity Climate (Cox, 1994) and Age Diversity Climate (Boehm et al., 2014). While Diversity Climate stresses the individual and intergroup bias/conflict-free environment supported by appropriate policies, practices, and structural processes, Age Diversity Climate emphasizes employees’ collective perception of fair and non-discriminatory policies, practices, procedures, and rewards towards all age groups. ‘Supportive Infrastructure’ is derived from the definition of Miller (1998) and Roberson (2006), who emphasize infrastructure that facilitates the fullest contribution of all employees.
The researcher argues that Inclusion is the remedy for all forms of bias and discrimination. The sustaining foundation of a fair and non-discriminatory environment has a moderating effect on the relationship between the independent variables producing Age discrimination. Further, Inclusion has a direct causal relationship with Age discrimination as well for the said reasons. Thus, the study presents propositions six to eleven.
P 6: Inclusion inversely moderates the relationship between Bias and Age discrimination.P 7: Inclusion inversely moderates the relationship between Age-Prototype-Matching and Age discrimination.P 8: Inclusion inversely moderates the relationship between Institutionalized Bias and Age discrimination.P 9: Inclusion inversely moderates the relationship between Unfair Resource Allocation and Age discrimination.P 10: Inclusion inversely moderates the relationship between Pandemic Older worker Layoff and Age discrimination.P 11: Inclusion inversely affects Age discrimination.
Concept Indicator Model
19516th SOUTH ASIAN MANAGEMENT FORUM (SAMF) 2021
MethodologyGiven the study’s exploratory nature, as per Saunders et al. (2009), a qualitative methodology under an Interpretivist philosophy was adopted to create new meanings, interpretations, and understandings through people’s lived experiences, performances, and perceptions. These were captured through interactive-in-depth-one-on-one-interviews. An Inductive Approach allowing theory to develop through emerging concepts, themes, and models from interpreting raw data was adopted. As per Creswell and Clarke (2007), interactive-in-depth-one-on-one-interviews were adopted by the study as it is the primary data collecting tool of Interpretivist qualitative research. In addition, two focus groups were conducted as well. An interview guide was developed and utilized for reference and for ordaining consistency, direction and focus. The researchers phrased the questions differently to capture responses from multiple angles to draw rich and complete answers. A convenience sampling strategy was adopted to facilitate trust, rapport, access, availability, and feedback. A total of 32 individuals performing managerial work in the private sector were chosen as the sample for the interactive-in-depth-one-on-one interviews. Another 12 participants were selected for two focus groups of 6 each.
Data AnalysisThematic analysis was carried out as per the seven steps prescribed by Braun and Clarke (2013). These are transcription, familiarization, coding, identifying themes, reviewing themes, defining/naming themes, and writing up the finalized analysis. An excel worksheet was used in compiling the initial coding, secondary coding, categories, and themes linking the constructs. A ‘complete coding’ method was adopted, resulting in 368 initial codes collated to arrive at 57 categories that formed the nine (9) themes. The study’s trustworthiness was ensured by adhering to the criteria prescribed by scholars (Emden et al., 2001; Lincoln & Guba, 1986; Tracy, 2010). Triangulation was carried out (Denzin & Lincoln, 2011), re-addressing key outcomes with several other participants and conducting two focus groups of six (6) individuals each.
DiscussionThe purpose of the study is to explore the ‘Corporate Contribution’ towards Age discrimination with particular emphasis on the pandemic times and the Inclusive mitigating measures. The study was conducted in response to the dual challenge faced by managers and organizations, especially in pandemic times. Firstly, in battling increasing Age discrimination and secondly, in building Age inclusive organizations that nurture an age-diverse workforce, identified to be a competitive advantage. Existing literature on Diversity, Discrimination, and Inclusion predominantly covers protected attributes such as race, color, language, religion, etc. neglecting Age discrimination and Age inclusion, which do not have devoted underpinning theories, creating a noticeable theoretical void. Further, as Discrimination and Inclusion are both social concerns, studies conducted in the organizational context are scarce as no theory has been developed, implemented, tested, or measured in an organizational context. Hence, in response to the multi-faceted void in the literature and the lack of expertise in organizations, this qualitative study guided by Interpretivism and an Inductive approach to theory development from data captured from interactive-in-depth-one-on-one-interviews and focus groups were conducted.As per this study, age diversity is identified, acknowledged, and confirmed by employees in organizations. Findings on the relationship Bias – Age discrimination revealed
196 16th SOUTH ASIAN MANAGEMENT FORUM (SAMF) 2021
revealed that age-based bias is mainly due to work-related-competency/incompetency of the age-diverse workforce that leads to Age discrimination (Baily, 2009; Gursoy et al., 2013). Findings on the Age-Prototype-Matching– Age discrimination relationship reveal that this type of Age discrimination mainly occurs in recruitment and promotions affecting the younger workers and recruitment and training opportunities affecting the older workers (Perry & Finkelstein, 1999). The findings also confirm that the identified diverse characteristics are unique and consistent with the literature that holds that diverse generations possess various skills (Kupperschmidt, 2000). The study also confirms that the ‘Institutionalized Bias’ produced Age discrimination, especially in the training and development domain discriminating the older workers, which is also confirmed by the literature (Meyer & Rowan, 1977). ‘Unfair Allocation of Resources’ produced Age discrimination is revealed to mainly affect the older workers nearing the retirement ceiling as they are rejected as not financially viable or worthy, which is also supported by the literature (Abrams et al., 2016; Kooji & Zacher, 2016; Maurer & Rafuse, 2001; North & Fiske, 2016). Finally, ‘Pandemic Older Worker Layoffs’ targeting older workers is unethical and manipulative as it discriminates (Agovino, 2020; Ayalon et al., 2021; Bachman, 2020; Homegardner, 2020) as older workers could be given the work-from-home option.
Considering the impact of Inclusion, the findings reveal that experiencing uniqueness-an individual factor of Inclusion - mainly focuses on opportunities for employees’ contribution and the necessity to be a part of strategic decision making and other critical organizational processes, support for the achievement of personal/educational/professional/career/financial goals and recognition /appreciation /rewards. The findings confirm that experiencing feelings of Uniqueness is part of individuals’ experience of Inclusion. ‘Belongingness’ is also confirmed by the results to be a part of experiencing Inclusion. Findings reveal that ‘Belongingness’ is expressed as the feeling of being an integral part of the present and future of the organization, enjoying feelings of being cared for, experiencing organizational support in achieving personal/family life goals and dreams, experiencing long-serving and job/financial security and personal wellbeing. Collectively taken, the individual factors of Inclusion, Uniqueness, and Belongingness are confirmed by the findings and supported by the literature (Brewer, 1991; Shore et al., 2011). Under the organizational factor ‘Conducive Climate,’ findings reveal that expressions of respect, a threat-free environment, and fairness/non-discriminatory actions ensure the workplace’s emotional/physical wellbeing. The literature support is found in the works of (Ferdman & Davidson, 2002; Ferdman & Deane, 2013; Holvino et al., 2004). Findings also reveal the need for a supportive performance environment with ‘Supportive Infrastructure,’ enabling them to perform their job role and contribute fully. Findings indicate the ‘Supportive infrastructure’ to include systems, processes, policies, and practices that ensure fair, free and unbiased guidance, instructions, monitoring, measurement, corrective action, feedback, learning and development, and performance evaluation and fair remuneration is provided for all. Holistically, the participants expressed the need to enable employees to perform to the fullest potential and nurture and develop for performance enhancement, and rewarding for the same is expressed strongly by the participants. In doing so, employee consultation and feedback are emphasized as well in the findings. In support of the said findings, scholarly works point out that the removal of all obstacles is necessary to enable full participation and contribution (Roberson, 2006), as well as, everyone needs to be allowed to participate and contribute fully (Miller, 1998) to create and sustain Inclusion.
Thus, considering the role of Inclusion, firstly, the findings reveal that Inclusion mitigates/ eradicates age-based bias as Uniqueness and Belongingness are two features that bring feelings
19716th SOUTH ASIAN MANAGEMENT FORUM (SAMF) 2021
of Inclusion to all individuals in all age groups. This result is also supported by previous studies(Brewer, 1991; Shore et al., 2011). Secondly, through a Conducive Climate and Supportive Infrastructure, Inclusion enables and ensures fair and non-discriminative policies, practices and procedures through a supportive organizational environment for performance and wellbeing. The literature supports this (Boehm et al., 2014; Cox, 1994; Ferdman & Davidson, 2002; Ferdman & Deane, 2013; Holvino et al., 2004; Miller, 1998; Roberson, 2006). Therefore, the findings confirm that Inclusion inversely impacts (moderating factor) the relationship between Bias, Age-prototype- Matching, Institutional Bias, Unfair Resource Allocation, Pandemic Older worker Layoff, and Age discrimination. The study also confirms that Inclusion taken as a whole has an inverse causal relationship with Age discrimination as it directly acts against/mitigates discrimination.
Theoretical Contribution
Limitations and Directions for Future Research
Managerial Implications
This study firstly contributes to the limited literature on Age Discrimination and Age inclusion. The study presents a second theoretical contribution, as it brings the individual factors ‘uniqueness’ and ‘belongingness’ as per the Optimal Distinct Theory (ODT), (Brewer, 1991) and the organizational factor ‘Conducive Climate’ supported by Diversity Climate (Cox, 1994) and Age Diversity Climate (Boehm et al., 2014), and ‘Supportive Infrastructure’ (Roberson, 2006; Miller, 1998) together to address Age inclusion successfully in an organizational context.
The researcher emphasizes that a longitudinal study would bring forth more valuable insights regarding the change of the variables with time and before/after impacts of the inclusive measures taken, factors which the study has not addressed due to time constraints. As age-based-work-related competencies are the root cause of age discrimination, the study recommends research on cross-mentoring on diverse age groups through a longitudinal study.
The study discusses three managerial implications in accordance with the findings. Firstly, given the increasing trend towards diversity in the workforce, awareness creation of expected behaviors and undesirable behaviors must be internalized from the beginning. Employees need to be sensitized to age-related issues. Organizations need to ensure that correct values are internalized and reinforced at the induction/orientation program level and subsequent programs. Taking care of the older employees during the pandemic and equipping them with skills to continue to work with technology-enabled modes from the safety of their homes is a priority. Organizations could benchmark the best practices of inclusive workplaces. Secondly, as the study highlights the lack of work-related competencies as the leading cause of Age discrimination (as each generation brings its own set of competencies), cross-mentoring is recommended to curb the same. Finally, a conducive organizational climate with supportive infrastructure that fosters performance and wellbeing is recommended, including infrastructure, systems, processes and procedures, and supporting policies and practices. It is noteworthy that technology is identified as a critical factor facilitating same as it levels differences providing a common unbiased, non-discriminative platform for all, especially in these pandemic-remote-working contexts.
198 16th SOUTH ASIAN MANAGEMENT FORUM (SAMF) 2021
ConclusionThe study aimed to explore corporate factors producing Age discrimination and mitigation
through Age inclusion, emphasizing the pandemic effect. The study was guided by an Interpretivist philosophy, following a qualitative inductive approach using interactive-in-depth-one-on-one interviews for data collection. Data analysis was carried out through Thematic Analysis following the steps prescribed by Braun and Clarke (2013). While the study contributes toward filling the identified void in the literature, the researcher also shares insights with practicing managers of private sector organizations mainly, catering to the pandemic times. The limitations and future explorations are briefed as well. Finally, this study emerges as a timely and worthwhile endeavor in the face of widespread Age discrimination, especially during the current pandemic, and the critical need for inclusive workplaces nurturing competitively advantageous age-diverse workforce.
References1. Abrams, D., Swift, H. J., & Drury, L. (2016). Old and unemployable? How age-based
stereotypes affect willingness to hire job candidates. Journal of Social Issues, 72(1), 105– 1212. Agovino, T. (2020). COVID-19 Deals a duel threat to older workers. SHRM.3. Ayalon, L., Chasteen, A., Tesch-Römer, C., & Wahl, H. W. (2021) Aging in Times of the
COVID-19 Pandemic: Avoiding Ageism and Fostering Intergenerational Solidarity, The Journals of Gerontology: Series B, 76(2), 49–52. https://doi.org/10.1093/geronb/gbaa051
4. Bachman, E. (2020). COVID-19 Layoff or Pretext for Age discrimination against older employees? Forbs.
5. Baily, C. (2009). Reverse intergenerational learning: A missed opportunity? Artificial Intelligence & Society, 23, 111-115.
6. Baran, M., & Kłos, M. (2014). Managing an intergenerational workforce as a factor of company competitiveness, Journal of International Studies, 7(1), 94-101.
7. Boehm, S. A., Kunze, F., & Bruch, H. (2014). Spotlight on age‐diversity climate: The impact of age‐inclusive HR practices on firm‐level outcomes. Personnel Psychology, 67(3), 667- 704.
8. Braun, V., & Clarke, V. (2013). Thematic analysis. In Encyclopedia of critical psychology (pp. 1947-1952). Springer.
9. Brewer, M. B. (1991). The Social Self: On being the same and different at the same time. Personality and Social Psychology Bulletin, 17, 475-482.
10. Butler, R. N. (1969). Age-ism: Another form of bigotry. Gerontologist, 9(4), 243–246.11. Cleveland, J. N., & Shore, L. M. (1992). Self-and supervisory perspectives on age and work
attitudes and performance. Journal of Applied Psychology, 77(4), 469.12. Correll, J., Judd, C. M., Park, B., & Wittenbrink, B. (2010). Measuring prejudice, stereotypes,
and discrimination. In J.F. Dovidio, M. Hewstone, P. Glick & V.M. Esses (Eds.). The Sage Handbook of Prejudice, Stereotyping, and Discrimination. Sage.
13. Cox, T., Jr. (1994). Cultural diversity in organizations. Berrett-Koehler.14. Cox, T. H., & Nkomo, S. M. (1991). A race and gender-group analysis of the early
career experience of MBAs. Work and Occupations, 18(4), 431-446. https://doi.org/10.1177/0730888491018004004
15. Creswell, J. W., & Clarke, V. L. (2007). Designing and conducting mixed methods research.16. Sage.17. Denzin, N. K., & Lincoln, Y. S. (Eds.). (2011). The Sage handbook of qualitative research.
Sage.18. Dovidio, J. F., Brigham, J. C., Johnson, B. T., & Gaertner, S. L. (2010). Stereotyping, prejudice,
19916th SOUTH ASIAN MANAGEMENT FORUM (SAMF) 2021
and discrimination: Another look. In N. Macrae, C. Stangor & M. Hewstone (Eds.). Stereotypes and Stereotyping. Guilford.
19. Emden, C., Hancock, H., Schubert, S., & Darbyshire, P. (2001). A web of intrigue: The search for quality in qualitative research. Nurse Education in Practice, 1(4), 204-211.
20. Ferdman, B. M., & Davidson, M. N. (2002). Inclusion: What can I and my organization do about it? The Industrial-Organizational Psychologist, 39(4), 80-85.
21. Ferdman, B. M., & Deane, B. R. (2013). Inclusion at societal fault lines: Aboriginal Peoples of Australia. Diversity at work: The practice of Inclusion, 520-545.
22. Finkelstein, L. M., Truxillo, D. M., Fraccaroli, F., & Kanfer, R. (Eds.). (2015). Facing the challenges of a multi-age workforce: A use-inspired approach. Routledge.
23. Fisher, G. G., Truxillo, D. M., Finkelstein, L. M., & Wallace, L. E. (2017). Age discrimination: Potential for adverse impact and differential prediction related to age. Human resource management review, 27(2), 316-327.
24. Fiske, S. T. (2000). Stereotyping, prejudice, and discrimination at the seam between the centuries: Evolution, culture, mind, and brain. European Journal of Social Psychology, 30, 299-322.
25. Fiske, S. T. (2004). Stereotyping, prejudice, and discrimination: Social biases. In S. T. Fiske (Ed.), Social beings: A core motives approach to social psychology (pp. 397 457). Wiley.
26. Gordon, P. A. (2018). Age diversity in the workplace. In Diversity and Inclusion in the global workplace (pp. 31-47). Macmillan.
27. Gursoy, D., Chi, C., & Karadag, E. (2013).Generational difference in work values and attitudes among frontline and service contact employees. International Journal of Hospitality Management, 32(1), 40-48.
28. Homegardner, T. (2020). Will The Current Pandemic Increase Age Discrimination In The Workplace? Retrieved from Forbs site https://www.forbes.com/sites/forbescoachescouncil/2020/06/02/will-the-current- pandemic-increase-age-discrimination-in-the-workplace/
29. Holvino, E., Ferdman, B. M., & Merrill-Sands, D. (2004). Creating and sustaining diversity and Inclusion in organizations: strategies and approaches. The psychology and management of workplace diversity, 245-276. Blackwell.
30. Jansen, W. S., Otten, S., van der Zee, K. I., & Jans, L. (2014). Inclusion: Conceptualization and measurement. European Journal of Social Psychology, 44(4), 370-385.
31. Kooji, D. T., & Zacher, H. (2016). Why and when do learning goal orientation and attitude decrease with age? The role of perceived remaining time and work centrality. Journal of Social Issues72 (1), 146–168.
32. Kupperschmidt, B. R. (2000). Multigeneration employees: strategies for effective management. The Health Care Manager, 19, 65–76.
33. Lancaster, L. C., & Stillman, D. (2002).When generations collide: Who they are, why they clash, how to solve the generational puzzle at work. HarperCollins.
34. Lawrence, B. S. (1990). At the crossroads: A multiple-level explanation of individual attainment. Organization Science, 1(1), 65-85.
35. Lincoln, Y. S., & Guba, E. G. (1986). But is it rigorous? Trustworthiness and authenticity in naturalistic evaluation. New directions for program evaluation, (30), 73-84.
36. Mannheim, K. (1952). The problem of generations. Routledge.37. Maurer, T. J., & Rafuse, N. E. (2001). Learning, not litigating: Managing employee development
and avoiding claims of age discrimination. Academy of Management Perspectives, 15(4), 110-
200 16th SOUTH ASIAN MANAGEMENT FORUM (SAMF) 2021
12138. Meyer, J. W., & Rowan, B. (1977). Institutionalized organizations: Formal structure as myth
and ceremony. American Journal of Sociology, 83(2), 340-363.39. McConnachie, C. (2014). Human Dignity, ‘Unfair Discrimination’ and Guidance. Oxford
Journal of Legal Studies. 34(3), 609–629.40. Miller, F. A. (1998). Strategic culture change: The door to achieving high performance and
Inclusion. Public Personnel Management, 27, 151-160.41. Nelson, T. D. (2009). Ageism. In T. D. Nelson (Ed.), Handbook of prejudice, stereotyping, and
discrimination: 431-440. Psychology Press.42. North, M. S., & Fiske, S. T. (2013 a). A prescriptive intergenerational-tension ageism scale:
succession, identity, and consumption (SIC). Psychological assessment, 25(3), 706.43. North, M. S., & Fiske, S. T. (2013 b). Act your (old) age: Prescriptive, ageist biases over
succession, consumption, and identity. Personality and Social Psychology Bulletin, 39(6), 720-734.
44. North, M. S., & Fiske, S. T. (2016). Resource Scarcity and Prescriptive Attitudes Generate Subtle, Intergenerational Older-Worker Exclusion. Journal of Social Issues, 72(1), 122– 145. https://doi.org/10.1111/JOSI.12159
45. Perry, E. L., Kulik, C. T., & Bourhis, A. C. (1996). Moderating effects of personal and contextual factors in age discrimination. Journal of Applied Psychology, 81, 628-647.
46. Perry, E. L. & Finkelstein, L. M. (1999). Toward a broader view of age discrimination in employment related decisions: a joint consideration of organizational factors and cognitive processes. Human Resource Management Review, 9, 21–49.
47. Roberson, Q. M. (2006). Disentangling the meanings of diversity and Inclusion in organizations. Group & Organization Management, 31(2), 212-236.
48. Saunders, M., Lewis, P., & Thornhill, A. (2009). Understanding research philosophy and approaches to theory development. In Research methods for business students (5th edn., p. 614). Pearson.
49. Shore, L. M., Cleveland, J. N., & Goldberg, C. B. (2003). Work attitudes and decisions as a function of manager age and employee age. Journal of applied psychology, 88(3), 529.
50. Shore, L. M., Randel, A. E., Chung, B. G., Dean, M. A., Ehrhart, K. H., & Singh, G. (2011). Inclusion and diversity in work groups: A review and model for future research. Journal of Management, 37(4), 1262-1289.
51. Tajfel, H. & Turner, J. C. (1985). The Social Identity Theory of Intergroup Behavior. In S. Worchel & W. G. Austin (Eds.), Psychology of Intergroup Relations (2nd ed., pp.7-24). Nelson-Hall.
52. Tracy, S. J. (2010). Qualitative quality: Eight “big-tent” criteria for excellent qualitative research. Qualitative inquiry, 16(10), 837-851.
53. Turner, J. C. (1987). Rediscovering the social group: A self-categorization theory. Basil Blackwell.
54. Zemke, R., Raines, C., & Filipczak, B. (2000). Generations at work: Managing the clash of veterans, boomers, Xers, and Nexters in your workplace. AMA Publications.
20116th SOUTH ASIAN MANAGEMENT FORUM (SAMF) 2021
Due to the adverse impact of the Corona virus disease (COVID) -19 pandemic, the smooth operation of Human Resource Management (HRM) is being hindered in the readymade garments (RMG) of Bangladesh. This study aims at exploring the problems and difficulties of HRM through a qualitative inquiry and the opinions of the senior human resource (HR) managers are considered in this regard. Twelve HR managers from six readymade garments factories of the export processing zone were interviewed to discover the facts related to the issue. The study explored different problems of HRM concerning HR planning, staffing, training motivation, and performance management. Random changes in management-level decisions and managing social distance were discovered as the most pressing problem of HRM during COVID- 19 situation. Top management of the RMGs is advised to invest more in the physical health and safety of the employees and remain sensitive to handle this global crisis with due diligence to stay operational and competitive in the world apparel market
Kazi Nazmul Huda, Associate Professor, Department of Business Administration,Southern University BangladeshMoslehuddin Chowdhury Khaled, Associate Professor,Department of General Management and HRM, Chittagong Independent University
At the moment we are writing this article, the world has changed drastically due to the negative impact of the Corona virus disease (COVID)-19 pandemic. This great human catastrophe has created a dramatic socioeconomic change and made our life upside down (He &Harris, 2020). Even though Bangladesh was comparatively unharmed (Molla et al., 2021), subsequent health and economic threats cannot be overruled. The adverse impact of the virus spread-control interventions including lockdown, shutdown, and physical distancing had collapsed the global supply chain (Gupta et al., 2020; Dev & Sengupta, 2020) and weakened the national economy of many developed countries in North American, Europe and Asia (Açikgöz & Günay, 2020;Ozili & Arun, 2020;Susilawati et al., 2020;Hasanat et al., 2020). The pandemic has not only amplified the fear of death among mankind but also increased the stress of job insecurity and pay cut (Debata et al., 2020).According to the projection by the Asian Development Bank, COVID-19 pandemic may eliminate 3.02 billion USD from Bangladesh and its GDP may fall up to 0.2% to 0.4% (Lalon, 2020).All these may mean loss of existing jobs, loss of new job creation, and or reduction of compensation at all levels.
For Bangladesh, one such very mentionable sector is ready-made garments (RMG) which may be subject to unseen challenges in the next normal world. So far, the export sector of Bangladesh is highly reliant on the RMG contributing much as a driving engine of economic development (Huda, 2016). As an immediate consequence, RMG sector has seen a huge order cancellation by the prominent European and US buyers causing a loss of approximately 1.5 billion USD which is nearly 50% of the export earnings per month (Lalon, 2020).
Since RMG is highly labour intensive, the sector may face an extreme challenge in the people
Keywords: Human Resource Management, COVID- 19, Pandemic, Readymade Garments
Introduction
Abstract
HUMAN RESOURCE MANAGEMENT DURING COVID-19 PANDEMIC: LESSONS LEARNED FROM READYMADE GARMENTS
INDUSTRIES OF BANGLADESH
202 16th SOUTH ASIAN MANAGEMENT FORUM (SAMF) 2021
management dimension. According to Seetharaman (2020) and Nicola et al. (2020), COVID-19 pandemic mostly harmed the physical labour-intensive manufacturing industries. HRM is the most critical function to tackle human, social, and economic crises (Gulua, 2020) and HR leaders have to play a pivotal role to protect the interest of employers and employees during this corona virus calamity (Aurelia & Momin, 2020). The RMG sector of Bangladesh contributes directly to employment generation, foreign exchange earnings, and social empowerment of women. This sector contributes to gross domestic product about 13% (Rahman & Siddiqui, 2015) and employs 4.2 million workers (Islam, 2016) which is around 36% of total employment in the manufacturing industries of Bangladesh. At present 4,600 RMG factories are operating in the country which constitutes the largest manufacturing sector of Bangladesh and ranked in second-largest RMG in the world (Haque et al., 2020).The RMG sector is extremely affected by the most unprecedented human catastrophe COVID-19 (Sen et al., 2020). This 100% export-oriented industry at the verge of destruction due to the downfall of the world economy. According to the BGMEA database, most of the foreign buyers from North America and Europe had revoked confirmed orders which is worth 3.16 billion USD, and 1,142 factories are affected 2.26 million workers became jobless in the first quarter of the year 2020and the estimated loss is around 6 billion USD (Islam et al., 2020).
The impact of this pandemic had highly impaired the economy, relevant linkage industries to RMG, and the livelihood of a worker. COVID-19 pandemic has created a crises event on managing people and has become a matter of great concern for the sustainability of the RMG sector. It is reported by Sen et al. (2020) that 74% of the RMG manufacturers have failed to pay the workers during the layoff. Hence, the RMG workers are amongst the most vulnerable community that are severely affected by lockdown or shutdown and the workers returned to the workplace were not treated well following COVID- 19 protocol (Kabir et al., 2021; Sen et al., 2020). Due to frequent losses in business, the top management of Bangladeshi RMGs started layoff, downsizing, and pay reduction to cover the loss. Such practices have made human resource management very difficult for managers. The main objective of this study is to explore the problems of HRM in the RMGs of Bangladesh during the COVID-19 pandemic considering the opinion of the HR managers of selected factories located inside the Chattogram export processing zone (CEPZ). This study will endeavour to explore the problems and difficulties faced by the HR managers during COVID-19 pandemic and provide policy prescriptions to overcome the looming challenges.
Organizational support to the employees is an inevitable factor concerning the effective practice of HRM during the COVID-19 pandemic. The HR managers should extend their hands to ensure the welfare of the workers during this critical time and must trade with the employers to protect their rights. They should be more empathetic and compassionate to the workers during this catastrophe and should be responsive to tackle this hazardous situation with due diligence (Gigauri, 2020 a). HR leaders should seriously deal with the unjustified layoff and downsizing caused by the frequent lockdown during this pandemic (Gigauri, 2020 b).Akingbola (2020) has researched the nonprofit organization of Canada and marked layoff, health & safety, HR planning as critical challenges of HRM during COVID-19, and HR planning is the most critical function amongst all to manage critical situations (Athamneh, 2018). However, random changes in the work schedule due to lockdown is affecting HR planning significantly (Gigauri, 2020 a).
The socio-psychological effect of COVID-19 pandemic has greatly invaded the mankind (Hossain
Review of Literature
20316th SOUTH ASIAN MANAGEMENT FORUM (SAMF) 2021
The research objective of this study has determined the methodological design of the study. The study has considered a qualitative research approach to explore the problems of HRM during the COVID-19 pandemic. The phenomenological methodology of qualitative research was found appropriate for this study as it tried to explore and interpret the experiential knowledge of the respondents underlying the realities of HRM during the pandemic. It was not a hypothesis-based study. The researchers tried to narrate the situation to develop theoretical knowledge based on primary and secondary data analysis which can be termed as an inductive approach. Primary data were collected through a face-to-face interview using semi-structured questionnaire. An extensive literature review was conducted on HRM challenges during COVID- 19 pandemic using previously published relevant research journals, and reference books to establish a theoretical alignment between the research’s findings with the contemporary concepts. To collect primary data, the purposive sampling techniques were found to be more appropriate as
the respondents must have extensive firsthand experience to provide critical input on the central issues of the research. The informants were senior human resource managers who have long industry experience in ready-made garments. A total of 12 HR managers 06 different RMG factories were interviewed face to face. Each interview session lasted for three hours, and their views were recorded in a notebook. The informants were asked open-end questions on the underlying challenges of HRM functions including human resource planning, recruitment, selection, on-boarding, employee
The methodology of the study
et al., 2020) and this human crisis had caused different occupational stresses which had adversely affected employees’ performance at work (Caligiuri et al., 2020). The panic of the pandemic has increased the level of career shock among jobholders across the world and the employees are more concerned about their future career development (Akkermans et al., 2020).The staffing function of HRM about employee recruitment and selection is highly affected by the pandemic and many large corporates across the globe have withheld employee hiring due to the economic downfall caused by long-term lockdown (Aurelia & Momin, 2020). At the moment, many employers are very selective to the employees who are capable to perform in an adversework environment and business uncertainties (Caligiuri et al., 2020). Organizations in the USA are adopting web-based virtual interviews in the employee selection
process and providing preparatory guidelines to potential candidates (Wolff & Burrows, 2021). According to Aurelia and Momin (2020), formal physical training is fading away from many
organizations due to social-distancing protocol, and training& development programs were conducted in the virtual platform in many organizations in developed countries (Gigauri, 2020 b). Employee maintenance concerning the administration of health and safety is equally challenging for the organizations during this pandemic (Caligiuri et al., 2020). As the COVID-19 pandemic harmed the world economy which slashed the job opportunities across the globe, most employers had accommodated their financial losses reducing the cost of compensation (Elsafty & Ragheb, 2020). Hence, the RMG industries of Bangladesh are not exceptional in this regard (Sen et al., 2020).Existing literature had projected the challenges of HRM during the COVID -19 pandemic though
researches on this issue are very limited. Most of the recent researches mainly focused on the macro-environmental challenges of COVID-19 with special reference to its impact on the world and national economy. Hence, no research is found on the challenges of HRM in the RMG industries of Bangladesh. This study will try to meet the gaps in the existing literature by conducting qualitative research and revealing the problems of HRM practices during the COVID -19 pandemic.
204 16th SOUTH ASIAN MANAGEMENT FORUM (SAMF) 2021
training, motivation, performance management, compensation, and other issues. Data analyses were conducted using a cyclical process and both data collection and analysis were
carried out concomitantly. The researchers had tried to find a similar meaning of the data to cluster the repeated reply of the respondents. The most popular method of qualitative data analysis the “thematic content analysis” was used in this regard to identify the similar type of response shared by the informants. The opinion of the respondents was noted down, congregated, arranged, and categorized to facilitate narrative analysis. However, the arguments were presented in the findings and discussion part of the article.The researchers had developed the following research questions for the interview and the opinion
of the respondents are presented as a synopsis in the findings and discussion part of the paper.a. What are the problems faced by the HR team to formulate HR planning?b. What are the potential problems encountered at the time of employee hiring?c. What are the problems with conducting training & development programs during the COVID-19
pandemic? d. What are the difficulties faced to motivate the employees and to manage their performance?e. What are the problems that emerged in compensation and reward management during a
pandemic? The researchers had faced some limitations as research work on HRM with special reference to COVID-19 pandemic is very limited in the existing literature. Therefore, conducting quantitative research was not suitable due to the deficiency of independent variables.
Most repeated responses by the managers are reported in the findings section of this study. Opinion of the respondents on the HRM problems prevailed in the sample RMGs is also described in detail with special reference to major functions of HRM including, HR planning, HR Acquisition, Employee Training, Motivation, Compensation and Performance management.Problems faced in formulating HR planHR planning is one of the most critical functions of HRM which assists an export-oriented RMG organization in attaining its business objective. According to the opinion of the respondents, the employee turnover rate was very high and unpredictable compared to normal times as workers were afraid of getting infected by COVID-19 virus and they were absent at work without notice. Due to the uncertainty of business, the decisions of top management have changed randomly about the continuation of production, scheduling, payment of the employees, office timing, transportation plan, food distribution plan, and maintaining the health &safety complying with COVID-19 protocol. Such a state of indecisiveness directly hampered HR planning. A slightly similar result was also found in the research conducted by Akingbola (2020). Hence, due to unusual lay off many workers had returned to their villages and changed their professions for survival. Problems faced in employee hiring Maintaining health safety at the time of hiring workers has become very difficult for the HR department due to the scarcity of space to maintain physical distance. Hence, the potential recruits were also found very reluctant in maintaining physical distance due to a lack of knowledge on the adverse health hazard of COVID-19. Most of the potential candidate perceives that COVID-19 will infect rich people only and they are immune naturally. The recruitment team has faced problems hiring efficient candidates due to the shortage of skilled manpower and many efficient workers left the job due to health risks. To maintain the COVID-19 protocol imposed by the government, top management had decided to conduct telephonic interviews instead of physical interviews for hiring
Findings and Discussions
20516th SOUTH ASIAN MANAGEMENT FORUM (SAMF) 2021
workers. Therefore, it was very difficult for the hiring team to conduct the virtual interview and it was also challenging for them to hire the fittest candidate and technically sound workers through a virtual interview session. Due to the fear of infection, a lot of skilled workers did not return from their village. According to many respondents, the RMGs of Bangladesh have faced an acute financial crisis due to the abnormal cancellation of orders from foreign buyers. As a result, for the survival of the business, the top management had curtailed the compensation and benefits of the skilled workers and management employees which has made RMG an unattractive job market. However, it was also a problematic task for the recruitment team to conduct the medical test of the candidates inside the factory premises and many prospective and skilled candidates were rejected during the medical test due to mild cough and fever. Problems faced in Employee Training & DevelopmentDue to the COVID-19 pandemic, organizing and conducting an on-boarding program was also difficult for the HR team as it was very difficult to interact with the novice workers wearing personal protective equipment and it was very difficult for the in-house trainers to interact and communicate with the workers wearing a mask. Due to the physical distancing code, physical training was very difficult as the nature of RMG workers’ training is very technical which demands the physical presence of both trainer and trainee in very close contact. However, it was also difficult for the HR team to ensure timely attendance of the trainees, follow-up of the learning, and to measure the effectiveness of the training. The respondents also shared that it was challenging for the HR team to invite external trainers for offline training and off the job training for the management employees was not conducted. Gigauri (2020 b) also found the same nature of the problem in his research work. Some respondents opined that the training budget was also curtailed to adjust financial losses. Problems faced in Employee Motivation and Performance ManagementIssuing standard personal protective equipment (PPE) for the workers and management employees was difficult at the beginning of the pandemic due to financial constraints and a shortage of PPE in the market. It was equally challenging for the HR team to motivate the workers and non-management employees to wear a mask and other PPE at the workplace. Employee reward management was irregular due to business uncertainty and insufficient budget. It was a great discontent for the employees, as health risk allowance was not declared by the management during this hazardous time. Most of the workers were under tremendous stress of layoff decisions and remained jobless for a long time. Workers were not achieving their targeted production as they were feeling uncomfortable working with PPE and lack of production incentive also had a negative impact on their motivation to perform better. However, frequent absenteeism by the workers due to emergency lockdown curtailed the amount of take-home wage of the workers which had impacted the individual productivity of RMG workers. Problems faced in employee Compensation & Benefits managementThe major problem of compensation management was timely disbursement of salary due to emergency lockdown. Frequent and unplanned layoff decisions by the top management also hampered the layoff and earned leave calculations. Calculation of wages was also difficult for the HR team as they had to adjust the lockdown sessions which were very hasty and unplanned. However, due to the rapid retrenchment of the workers, RMGs had to clear the pay and the benefits which have increased the overhead cost abnormally.
206 16th SOUTH ASIAN MANAGEMENT FORUM (SAMF) 2021
Bangladesh has been successful so far, in managing the COVID spread, deaths, and vaccination across the country, despite having a huge and dense population. Now it has to face the challenge of economy, particularly export oriented sectors as these are dependent on the global supply chain. If global supply chain does not revive on the demand side, there is little to do. However, in the meantime, Bangladesh RMG sector as the leading export sector may take careful preparedness measures to face the unseen challenges, particularly in people management. The study had explored the problems faced by the HR department in managing its major functions including planning, staffing, developing, motivating, and maintaining the HRs of the RMGs. It is revealed from this study that most of the problems are caused due to compliance with the COVID-19 protocol and unprecedented emergency lockdown imposed by the Government. However, global economic turmoil caused by this pandemic affected the RMG business greatly which had a trickle-down impact on the HR operations. Continuing lockdown and shutdown was a justified intervention by the government but it was not strictly maintained in many industrial areas of Bangladesh. To protect this industry from such events as COVID-19 government and the entrepreneurs should jointly invest in diagnosis and healthcare services for the workers. RMGs organizations should ensure a constant supply of PPE for the employees and should take normative-Re-educative strategies to make workers habituated with the new normal. Risk allowance or hazard pay (Akingbola, 2020) could be offered as an incentive to motivate the workers and stay focused on performance. Hence, health-related counselling programs could be included to improve the mental health of the employees during the pandemic.
The study was qualitative in nature and data were collected from a limited sample which may not justify the research outcome comprehensively. Further researchers are suggested to conduct an empirical study on a large sample to develop a reliable model of HRM practice to be effective during the epidemic, pandemic, or any other unprecedented adverse human or manmade disaster.
1. Açikgöz, Ö., & Günay, A. (2020). The early impact of the Covid-19 pandemic on the global and Turkish economy. Turkish Journal of medical sciences, 50(1), 520-526.
2. Akingbola, K. (2020). COVID-19: The prospects for nonprofit human resource 3. management. Canadian Journal of Nonprofit and Social Economy Research, 11(1), 5-5.4. Akkermans, J., Richardson, J., & Kraimer, M. L. (2020). The Covid-19 crisis as a career shock: 5. Implications for careers and vocational behavior, Journal of Vocational Behavior, 119, 1-5. 6. Athamneh, S. (2018). HR Planning for crisis management. In Human resource planning for the
21st century. IntechOpen.7. Aurelia, S., & Momin, M. M. (2020). Global reverberation and prediction for HRM amid and
after COVID-19: A technological viewpoint. Materials Today: Proceedings.8. Caligiuri, P., De Cieri, H., Minbaeva, D., Verbeke, A., & Zimmermann, A. (2020). International
HRM insights for navigating the COVID-19 pandemic: Implications for future research and practice. Journal of International Business Studies,51,697-713.
9. Debata, B., Patnaik, P., & Mishra, A. (2020). COVID‐19 pandemic! It’s impact on people, economy, and environment. Journal of Public Affairs, 20(4), 2372.
10. Dev, S. M., & Sengupta, R. (2020). Covid-19: Impact on the Indian economy. Indira Gandhi 11. Institute of Development Research, Mumbai April.12. Elsafty, A. S., & Ragheb, M. (2020). The role of human resource management towards
Conclusion and Managerial Implication
Limitations and Potentials for Future Research
Reference
20716th SOUTH ASIAN MANAGEMENT FORUM (SAMF) 2021
13. employees retention during Covid-19 pandemic in medical supplies sector-Egypt. Business and Management Studies, 6(2), 50-59.
14. Gigauri, I. (2020 a). Influence of Covid-19 Crisis on Human Resource Management and 15. Companies Response: The Expert Study. International Journal of Management Science and
Business Administration, 6(6), 15-24.16. Gigauri, I. (2020 b). Organizational Support to HRM in Times of the COVID-19 Pandemic
Crisis. European Journal of Marketing and Economics, 3(3), 36-48.17. Gulua, E. (2020). Trends, Challenges, and Opportunities of Human Resource Management.
Innovative Economics and Management, 7(1), 51-67. 18. Gupta, M., Abdelmaksoud, A., Jafferany, M., Lotti, T., Sadoughifar, R., & Goldust, M. (2020).
COVID-19 and economy. Dermatologic Therapy, 33(4), 1-1.19. Hossain, S. F. A., Nurunnabi, M., Sundarasen, S., Chinna, K., Kamaludin, K., Baloch, G. M.,
& Sukayt, A. (2020). Socio-psychological impact on Bangladeshi students during COVID-19. Journal of public health research, 9(S1), 38-44.
20. Haque, M. F., Sarker, M., Rahman, A., Rahman, M., & Rakibuddin, M. (2020). Discrimination of women at RMG sector in Bangladesh. Journal of Social and Political Sciences, 3(1), 112-118
21. Hasanat, M. W., Hoque, A., Shikha, F. A., Anwar, M., Hamid, A. B. A., & Tat, H. H. (2020). 22. The impact of coronavirus (COVID-19) on e-business in Malaysia. Asian Journal of
Multidisciplinary Studies, 3(1), 85-90.23. He, H., & Harris, L. (2020). The impact of Covid-19 pandemic on corporate social responsibility
and marketing philosophy. Journal of business research, 116, 176-182.24. Huda, K. N. (2016). State of Health and Safety Compliance in the Readymade Garments
Industries: An Evaluative Study. IIMS Journal of Management Science, 7(1), 55-66.25. Islam, M. R., Hassan, M. A., Hassan, M. S., Rahman, S., & Nargis, N. (2020). Impact of
Covid- 19 Pandemic on Readymade Garments (RMG) Industry of Bangladesh. International Journal of Management (IJM), 11(7) 1125-1132.
26. Islam, S. (2016). Feminization of Employment and Gender Inequality of Bangladesh Labor 27. Market: The Case of Garment Industries. Developing Country Studies, 6(2), 157–168.28. Kabir, H., Maple, M., & Usher, K. (2021). The impact of COVID-19 on Bangladeshi readymade
garment (RMG) workers. Journal of Public Health, 43(1), 47-52.29. Lalon, R. M. (2020). COVID-19 vs Bangladesh: Is it Possible to Recover the Impending
Economic Distress Amid this Pandemic?. Journal of Economics and Business, 3(2).30. Molla, M. M. A., Disha, J. A., Yeasmin, M., Ghosh, A. K., & Nafisa, T. (2021). Decreasing
transmission and initiation of countrywide vaccination: Key challenges for future management of COVID‐19 pandemic in Bangladesh. The International Journal of Health Planning and Management. https://doi.org/10.1002/hpm.3156
31. Nicola, M., Alsafi, Z., Sohrabi, C., Kerwan, A., Al-Jabir, A., Iosifidis, C., ... & Agha, R. (2020). 32. The socio-economic implications of the coronavirus pandemic (COVID-19): A review.
International journal of surgery, 78, 185-193.33. Ozili, P. K., & Arun, T. (2020). Spillover of COVID-19: impact on the Global 34. Economy. Available at SSRN 3562570. MPRA_paper_99850.pdf (uni-muenchen.de)35. Rahman, M. H., & Siddiqui, S. A. (2015). Female RMG worker: economic contribution in 36. Bangladesh. International Journal of Scientific and Research Publications, 5(9), 1-9.37. Seetharaman, P. (2020). Business models shifts: Impact of Covid-19. International Journal of
Information Management, 54, 1-4.
208 16th SOUTH ASIAN MANAGEMENT FORUM (SAMF) 2021
38. Sen, S., Antara, N., Sen, S., & Chowdhury, S. (2020). The apparel workers are in the highest vulnerability due to COVID-19: a study on the Bangladesh Apparel Industry. Asia Pacific J Multidiscip Res, 8(3), 1-7.
39. Susilawati, S., Falefi, R., & Purwoko, A. (2020). Impact of COVID-19’s Pandemic on the Economy of Indonesia. Budapest International Research and Critics Institute (BIRCI-Journal): Humanities and Social Sciences, 3(2), 1147-1156.
40. Wolff, M., & Burrows, H. (2021). Planning for virtual interviews: residency recruitment during a pandemic. Academic Pediatrics, 21(1), 24-31.
20916th SOUTH ASIAN MANAGEMENT FORUM (SAMF) 2021
Death anxiety refers to the apprehension of one’s death underlying the development and maintenance of numerous psychological conditions. The recent COVID-19 pandemic has triggered a rise in anxiety across the globe. Much of the common men’s behavioral and emotional response to the virus can be understood through the framework of terror management theory, which proposes that fear of death drives much of human behavior. In the context of the current pandemic, death anxiety appears especially relevant. The current understanding of death-related attitude, consequences, and causes are still less comprehensive. Also, there is minimal research on reducing death anxiety. This study aimed to determine the factors constituting death anxiety and to develop a structural model based on the study. The factor analysis of the items yielded three factors that account for 45.12 percent of the total variance. The results of the proposed model confirmed the hypothesis and theoretical validity of the factors. Conclusions drawn from this study will be useful to better understand the perception of death anxiety.
Dr. Aditi VedaAssistant Professor, Shri Vaishnav School of Management, Shri Vaishnav Vidyapeeth Vishwavidyalaya, Indore (M.P.), India, Dr. Upinder DharVice-Chancellor, Shri Vaishnav Vidyapeeth Vishwavidyalaya, Indore (M.P.), India.
Death is a human concern that has been conceptualized as a powerful motivating force behind much creative expression and philosophic inquiry throughout the ages. Death is both an individual act and a societal concern. A person’s relationship to death, the intensity of his attraction to it, his fear of it, and the types of defensive mechanisms he or she builds up in the face of conscious awareness of death, as well as the symbolic meanings given to death all greatly shape both the individual and the culture in which he or she exists. Death is inevitable, yet the individual’s death is merely a part of the human continuum. Death anxiety refers to the apprehension of one’s death. It is the neurotic fear of loss of the self which is an intense state that parallels feelings of helplessness and depression. Man’s awareness of his death produces anxiety that can only be dealt with by recognizing one’s individuality according to existential awareness of death gives him the responsibility for finding meaning in life. Death is a biological, personal,socio-cultural, and existential phenomenon. The biological death is useful to distinguish between the process of aging and the ending called death. Yet when the actual time comes and individual faces death alone the psychological reactions appear to be remarkably similar.
Death anxiety has been conceptualized as fear of death of oneself; fear of death of others; fear of dying of self; and fear of the death of others. Many factors influence death anxiety such as age, sex, culture, religion, physical health, and mental health.
Keywords: Anxiety, Apprehension, Enigmatic, Negativity, Pandemic.
Introduction
Abstract
IMPACT OF PANDEMIC ON THE CONSTITUENTS OF DEATH ANXIETY
210 16th SOUTH ASIAN MANAGEMENT FORUM (SAMF) 2021
Objectives Of The Study
Research Method
Aging is a stage in developmental psychology and is associated with various medical problems, loss of loved ones, and deteriorating cognitive abilities. Old-aged individuals being nearer to the end of life may experience death anxiety or death fear. Missleret al.(2012) revealed that dutch elderly people who were in an assisted living facility had higher levels of fear for others and of the dying process than fear of the unknown. The fear for important others correlated with poor somatic health; and fear of the dying process correlated with low self-esteem, the small goal in life, and poor mental well-being.
Momtazet al.(2015), in a national cross-sectional survey of Malaysianmiddle-aged and older couples, reported that women (52%) had significantly higher spousal death anxiety compared to men(45%). Caregiving issues for older men and financial security for older women could predict increasing spousal death anxiety. Newton-John et al.(2020) have argued that COVID-19 presents unique challenges to our species because of the constant reminders of death. They suggested that the ever-present images of death, daily updates of COVID-19 transmissions, and other cues to death (e.g., face masks) mean that we are essentially living in an ongoing, global mortality salience study. Before governments closed down cities and borders, reports emerged of individuals choosing to self-isolate with loved ones. As individuals scrambled to prevent the threat of COVID-19 in any way they could, online sales of ‘immune boosters’, un-trialed medicines, and similar tonics increased. Anecdotal reports of verbal and physical aggression in grocery stores and racist abuse of individuals with Asian appearance increased as fear swept across the planet purported to Devakumaret al.(2020). The coronavirus disease‐2019 (COVID‐19) epidemic has affected millions of people around the world and posed serious challenges for the global healthcare systems. The disease has also resulted in many psychological problems like anxiety, depression, and other morbidities which need to be addressed.
The study was undertaken to fulfill the following objectives:1) To identify the factors constituting death anxiety.2) To identify the impact of the pandemic on death anxiety.3) To develop a theoretical framework for perception among the public regarding death anxiety.4) To develop a relationship model to understand death anxiety among the public.5) To open up new vistas of research and develop a base for the application of the findings in terms
of implications of the study.
The StudyThe study is exploratory providing insight into the factors constituting death anxiety. The DesignThe study had a randomized design for exploring the perception of people across various levels
of age, occupations, education, gender, the background of residence, and marital status about death anxiety. The impact of extraneous variables is controlled through randomization and elimination.The SampleA sample of 800 people was chosen on a random basis. The sample was collected from the people
residing in urban and rural areas. The tool for data collection was sent through Google form and firm responses were received from 720 elements of the sample in May - June 2021 when the COVID -19 pandemic was at its second peak forcing people to stay under administrative lockdown.
21116th SOUTH ASIAN MANAGEMENT FORUM (SAMF) 2021
Results And Discussion
Table 1: KMO and Bartlett’s Test
The Tools(a) For Data CollectionThe Death Anxiety Scale developed by Mehta and Dhar (1998) was administered for data
collection. The scale having 10 statements has a reliability coefficient of .87 and validity of .93.
(b) For Data AnalysisCoding and Editing Data-First of all, the filled-up instrument was screened for completeness,
and the ones in which the responses to all the statements were complete were selected for further processing. The incomplete response sheets in any respect were rejected at this stage. After that, all the responses were scored and tabulated in MS-Excel. Different Excel sheets were prepared to represent the responses in terms of various socio-demographic variables. The analysis of data was carried out using MS Excel and Statistical Package for Social Science (SPSS 25.0) and SPSS AMOS 21. The responses were subjected to factor analysis by using the principal component method with varimax rotation. In brief, structural equation modeling is a family of multivariate statistical analysis methods used to model a network of complex structural relationships between one or more measured variables and latent constructs. Exploratory factor analysis was applied followed by Structural Equation Modelling (SEM).
KMO measure for sampling adequacy was found to be more than 0.5 (Table 1)which indicates that results from factor analysis are useful. Similarly, the values at the significance level should be less than 0.05 which indicates that the data is suitable for factor analysis.
In this study, it was desirable to identify the various factors constituting death anxiety. Thus, factor analysis was executed for the same using Principal Component Analysis (PCA). The appropriateness of any data for factor analysis depends upon Bartlett’s test of sphericity. The significance value of 0.000 was obtained, which indicates that data do not produce an identity Matrix and thus could be used for factor analysis. The factor analysis resulted in three factors constituting death anxiety that are Apprehension,
Enigmatic, and Negativity (Table 2).
Kaiser-Meyer-Olkin Measure of Sampling Adequacy. .721
Bartlett’s Test of Sphericity Approx. Chi-Square 561.738
df 45
Sig. .000
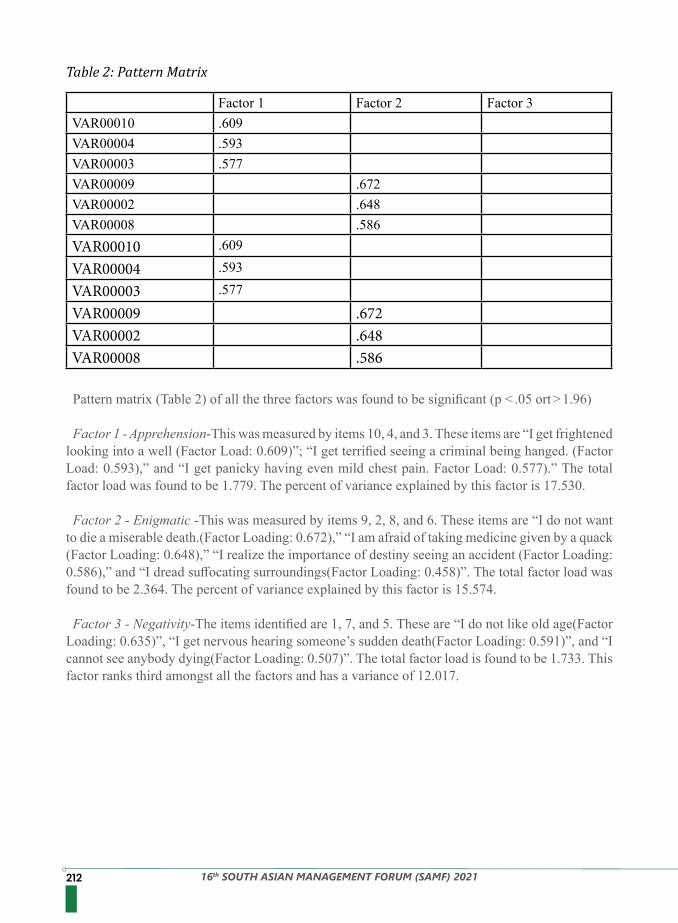
212 16th SOUTH ASIAN MANAGEMENT FORUM (SAMF) 2021
Pattern matrix (Table 2) of all the three factors was found to be significant (p < .05 ort > 1.96)
Factor 1 - Apprehension-This was measured by items 10, 4, and 3. These items are “I get frightened looking into a well (Factor Load: 0.609)”; “I get terrified seeing a criminal being hanged. (Factor Load: 0.593),” and “I get panicky having even mild chest pain. Factor Load: 0.577).” The total factor load was found to be 1.779. The percent of variance explained by this factor is 17.530.
Factor 2 - Enigmatic -This was measured by items 9, 2, 8, and 6. These items are “I do not want to die a miserable death.(Factor Loading: 0.672),” “I am afraid of taking medicine given by a quack (Factor Loading: 0.648),” “I realize the importance of destiny seeing an accident (Factor Loading: 0.586),” and “I dread suffocating surroundings(Factor Loading: 0.458)”. The total factor load was found to be 2.364. The percent of variance explained by this factor is 15.574.
Factor 3 - Negativity-The items identified are 1, 7, and 5. These are “I do not like old age(Factor Loading: 0.635)”, “I get nervous hearing someone’s sudden death(Factor Loading: 0.591)”, and “I cannot see anybody dying(Factor Loading: 0.507)”. The total factor load is found to be 1.733. This factor ranks third amongst all the factors and has a variance of 12.017.
Factor 1 Factor 2 Factor 3VAR00010 .609VAR00004 .593VAR00003 .577VAR00009 .672VAR00002 .648VAR00008 .586VAR00010 .609
VAR00004 .593
VAR00003 .577
VAR00009 .672VAR00002 .648VAR00008 .586
Table 2: Pattern Matrix
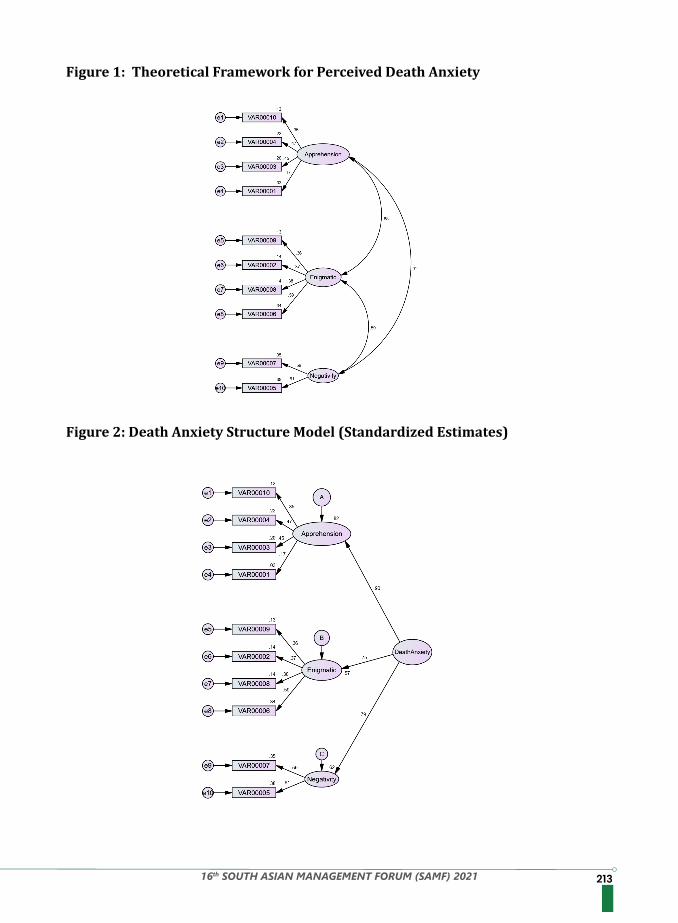
21316th SOUTH ASIAN MANAGEMENT FORUM (SAMF) 2021
Figure 1: Theoretical Framework for Perceived Death Anxiety
Figure 2: Death Anxiety Structure Model (Standardized Estimates)
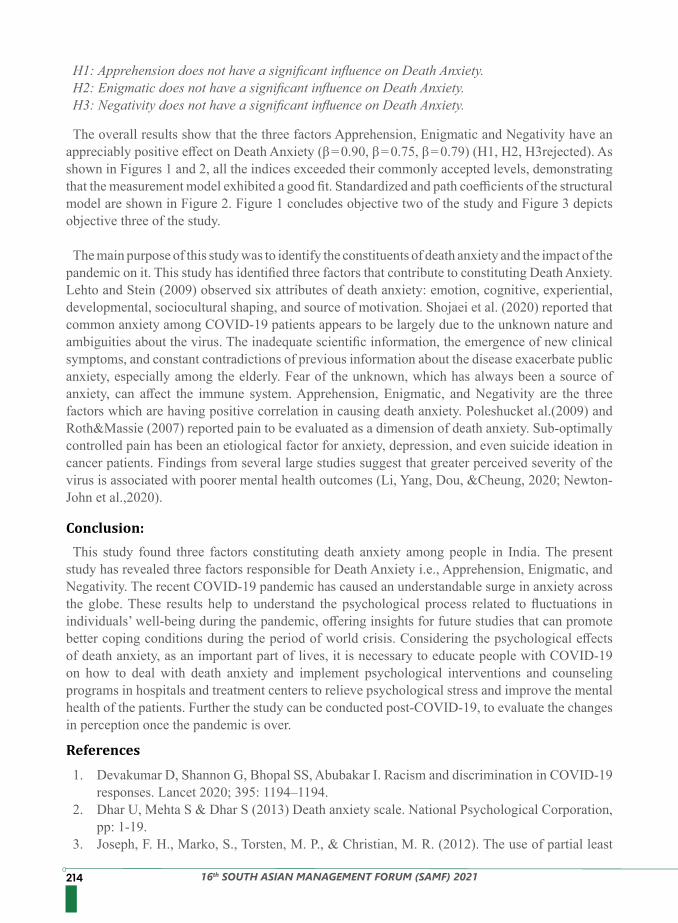
214 16th SOUTH ASIAN MANAGEMENT FORUM (SAMF) 2021
The overall results show that the three factors Apprehension, Enigmatic and Negativity have an appreciably positive effect on Death Anxiety (β = 0.90, β = 0.75, β = 0.79) (H1, H2, H3rejected). As shown in Figures 1 and 2, all the indices exceeded their commonly accepted levels, demonstrating that the measurement model exhibited a good fit. Standardized and path coefficients of the structural model are shown in Figure 2. Figure 1 concludes objective two of the study and Figure 3 depicts objective three of the study.
The main purpose of this study was to identify the constituents of death anxiety and the impact of the pandemic on it. This study has identified three factors that contribute to constituting Death Anxiety. Lehto and Stein (2009) observed six attributes of death anxiety: emotion, cognitive, experiential, developmental, sociocultural shaping, and source of motivation. Shojaei et al. (2020) reported that common anxiety among COVID‐19 patients appears to be largely due to the unknown nature and ambiguities about the virus. The inadequate scientific information, the emergence of new clinical symptoms, and constant contradictions of previous information about the disease exacerbate public anxiety, especially among the elderly. Fear of the unknown, which has always been a source of anxiety, can affect the immune system. Apprehension, Enigmatic, and Negativity are the three factors which are having positive correlation in causing death anxiety. Poleshucket al.(2009) and Roth&Massie (2007) reported pain to be evaluated as a dimension of death anxiety. Sub-optimally controlled pain has been an etiological factor for anxiety, depression, and even suicide ideation in cancer patients. Findings from several large studies suggest that greater perceived severity of the virus is associated with poorer mental health outcomes (Li, Yang, Dou, &Cheung, 2020; Newton-John et al.,2020).
This study found three factors constituting death anxiety among people in India. The present study has revealed three factors responsible for Death Anxiety i.e., Apprehension, Enigmatic, and Negativity. The recent COVID-19 pandemic has caused an understandable surge in anxiety across the globe. These results help to understand the psychological process related to fluctuations in individuals’ well-being during the pandemic, offering insights for future studies that can promote better coping conditions during the period of world crisis. Considering the psychological effects of death anxiety, as an important part of lives, it is necessary to educate people with COVID‐19 on how to deal with death anxiety and implement psychological interventions and counseling programs in hospitals and treatment centers to relieve psychological stress and improve the mental health of the patients. Further the study can be conducted post-COVID-19, to evaluate the changes in perception once the pandemic is over.
1. Devakumar D, Shannon G, Bhopal SS, Abubakar I. Racism and discrimination in COVID-19 responses. Lancet 2020; 395: 1194–1194.
2. Dhar U, Mehta S & Dhar S (2013) Death anxiety scale. National Psychological Corporation, pp: 1-19.
3. Joseph, F. H., Marko, S., Torsten, M. P., & Christian, M. R. (2012). The use of partial least
H1: Apprehension does not have a significant influence on Death Anxiety.H2: Enigmatic does not have a significant influence on Death Anxiety.H3: Negativity does not have a significant influence on Death Anxiety.
Conclusion:
References
21516th SOUTH ASIAN MANAGEMENT FORUM (SAMF) 2021
squares structural equation modeling in strategic management research: A review of past practices and recommendations for future applications. Long Range Planning, 45(5–6), 320–340.
4. Li JB, Yang A, Dou K and Cheung RYM (2020). Self-control moderates the association between perceived severity of the coronavirus disease 2019 (COVID-19) and mental health problems among the Chinese public. PsyArXiv Preprints, doi:10.31234/osf.io/2xadq.
5. Missler, M., Stroebe, M., Geurtsen, L., Mastenbroek, M., Chmoun, S., & Van Der Houwen, K. (2012). Exploring death anxiety among elderly people: A literature review and empirical investigation. OMEGA-Journal of Death and Dying, 64(4), 357-379.
6. Momtaz, Y. A., Haron, S. A., Ibrahim, R., & Hamid, T. A. (2015). Spousal death anxiety in old age: gender perspective. OMEGA-Journal of Death and Dying, 72(1), 69-80.
7. Newton-John, T., Chambers, S., Menzies, R. E., & Menzies, R. G. (2020). Psychological distress and COVID-19: estimations of threat and the relationship with death anxiety. Under review.
8. Poleshuck, E. L., Bair, M. J., Kroenke, K., Watts, A., Tu, X., & Giles, D. E. (2009). Pain and depression in gynecology patients. Psychosomatics, 50(3), 270–276.
9. Roth, A. J., & Massie, M. J. (2007). Anxiety and its management in advanced cancer. Current Opinion in Supportive Palliative Care, 1(1), 50–56.
10. Yao, H., Chen, J. H., & Xu, Y. F. (2020). Patients with mental health disorders in the COVID-19 epidemic.
216 16th SOUTH ASIAN MANAGEMENT FORUM (SAMF) 2021
The healthcare industry is encountering a structural paradigm shift in the way it is operating during the pandemic. This conceptual framework will enhance the sustainability and growth of any hospital. The conceptual framework is based on the digitalization of the hospital work processes which focuses on 1. Building a direct relationship with the consumer2. New sources of digital services to provide healthcare delivery instead of traditional care.Employing feasible digital tools that can be automated, virtualized, and personalized will
intermingle healthcare team members virtually for seamless workflow, minimize errors with amalgamated resources, and efficient supply chain and logistics to achieve and deliver comprehensive and continuum of care.
Biju Velayudhan,Research Scholar, D J Academy for Managerial Excellence,
Dr. J J Savithri, Professor, D J Academy for Managerial Excellence,
B. Kavitha, Health Informatics Supervisor,GKNM Hospital,
The Worldwide COVID-19 pandemic continues to spread with the increasing number of infection cases and in such a situation, seamless healthcare delivery is a great challenge to all healthcare institutions. According to World Health Organization, health service delivery is considered good when equitable access to a comprehensive range of high-quality health services is ensured within an integrated and patient-centric continuum of care. To make healthcare accessible, acceptable, and valuable, digital health transformation can be the best choice for all healthcare institutions.
Digitization of hospitals has become a benchmark in the healthcare system for providing better, low-cost, and efficient services to patients and other stakeholders. The Indian healthcare sector has adopted digital transformation to improve quality and accessibility. The digital healthcare market in India has grown and stood at US$116.61 billion in 2018 and is expected to increase at a Compound Annual Growth Rate(CAGR) of 27.41% to US$485.43 billion by 2024.
Digital health or digital healthcare is a broad, multidisciplinary concept but is certainly the future. Digital technology has improved clinical workflow efficiency concerning standards of healthcare. Due to the pandemic, healthcare systems are facing many challenges like patients are not able to reach health facilities, a shortage of healthcare professionals,
Keywords: Digital Transformation, Sustainability, Economy, Pandemic, Strategies
Introduction
Abstract
THE CONCEPTUAL FRAMEWORK FOR UNLOCKING THE PANDEMIC IMPOSED CHALLENGES IN HEALTHCARE MANAGEMENT AND THE ECONOMY WITH DIGITAL
TRANSFORMATION
21716th SOUTH ASIAN MANAGEMENT FORUM (SAMF) 2021
and the lack of essential and non-essential medical care commodities supply. In general, the actual importance of digital health and technologies in the healthcare sector has been realized only after this pandemic. Even though India is densely populated with more than one billion people with a majority of people connected with smartphones, the impact of information and communication technologies in digital healthcare was not significant until 2019. Nowadays, because of pandemic-induced consumer and behavioral changes, digital health transformation accelerates growth in Indian healthcare through many avenues.
The prospective digital healthcare market is expected to become optimum from both the patient and healthcare provider sides of the ecosystem and enhance new ways to practice medicine. However, through literature review, it is inferred that the use of digitization in hospitals is not well understood and well-structured so a need is raised for the investigators to propose a common framework to support all healthcare team members for digitization by integrating new technologies with aligned clinical work processes and skilled professionals as a solution to those challenges imposed during pandemic which locked the traditional healthcare management and economy.
This framework focuses on the basic concepts which like a direct relationship with the consumer, different sources of digital services, and tools to provide healthcare delivery instead of traditional care. Along with the framework, the investigators also present advantages and challenges for digitization of functions and services and will conclude with implications of the framework for future digitization of the hospital.
1. Getting access to specialty physicians, specialized knowledge, and time-place independent services enables us to overcome the movement of the patients from geographic boundaries.
2. Remote diagnosis through interactive videoconferencing and remote consultation utilizing software applications could overcome the crowd in out-patient clinics.
3. Tele-ICU technologies can positively impact intensive care needs and the mortality rate can be decreased or prevented.
4. E- Prescriptions with smartphone alerts and reminders will improve compliance and aids in less costly care during follow-ups.
5. E-Referral models will reduce waiting times and mass gatherings at clinics
A conceptual framework is a construct in which each concept plays an integral role. It is a written or visual representation of an expected relationship between the variables to be related or studied. After reviewing the existing studies and literature about the digitization of healthcare by integrating new technologies and with the essence of their practical experience the investigators created a framework to elucidate the selected concepts of unlocking the pandemic imposed challenges in healthcare management and economy with digital transformation with a belief that this will be a useful guide to the healthcare industry.
Need For Digital Health Transformation During Pandemic
Conceptual Framework
218 16th SOUTH ASIAN MANAGEMENT FORUM (SAMF) 2021
In a hospital, the consumer/Patient/Client/Customer is the prime resource. A Healthcare consumer means a person who is the receiver of health-related services and he/she is a person in a health information system. But there is a big confusion in healthcare, that is the difference between “Patient” and “Consumer”. “Patients” receive care while “Consumers” make daily decisions that have huge implications on their health and the healthcare industry.
During this pandemic, a hospital must build trust and win confidence among their customers to keep up the quality of care management and economy. An analytical review of randomized controlled and quasi-experimental trials by Revere and Dunbar (2001) shows that computer-generated interventions that used customized or tailored information disseminated by a variety of delivery devices are statistically significant in bringing out positive behavioral outcomes. Thus empirical evidence from our first decade of research on e-health interventions is encouraging e-communications. In a study of 80 clinical trials of patient-provider electronic communication, Mitchell et.al., (1997) found that 63 percent of trials show significantly improved outcomes for the prevention and management of diabetes, osteoarthritis, and other conditions. By integrating technology consumer relationships can be maintained by adopting the concept of Consumer Health Informatics (CHI). This will help to bridge the gap between patients and health resources. CHI applications may effectively engage consumers, enhance traditional clinical interventions and improve both intermediate and clinical health outcomes.
Consumer Health Informatics has the potential to provide frameworks and strategies for designing effective health communication tools that empower users and improve their health decisions and foster better outcomes. For effective uses of the concept of Consumer Health Informatics, the following has to be considered
Consumer health vocabularies(CHV)- Patients often have difficulty in understanding the professional language due to a gap in their domain knowledge. Consumer health vocabularies are a collection of simple, easy, and clear terms that laymen prefer to use rather than an equivalent professional medical term. Identifying the existing resources to begin exploring and developing a “first-generation” open-access CHV, is an important tool for consumer health informatics.
Consumer health information technologies include electronic personal health records, smart cards, clinical e-mail communication, online pharmacies, interactive health communication technologies (IHC), health information literacy, consumer-friendly language, Internet-based strategies and resources, Smartphone applications, Self-Management Systems, Patient Portals, Peer Interaction Systems, Tele-medicine and e-Learning, mobile health are all consumer e-health ICT tools which facilitates the delivery of quality healthcare to potential to promote the desired consumer.E-health communication, health promotion efforts that are mediated by computers and other
digital technologies, may have a great potential to promote desired behavior changes through unique features such as mass customization, interactivity, and convenience.
Building Direct Relationship With Consumer
E-Communication
Consumer Health Informatics
21916th SOUTH ASIAN MANAGEMENT FORUM (SAMF) 2021
Teleconsultation is an essential tool used during a pandemic. Interactions that happen between a clinician and a patient to provide diagnostic or therapeutic advice through electronic means are known as teleconsultation. E-consultation is also commonly referred to as telemedicine/ telehealth/ telepresence. They are a very useful approach in the pandemic situations and are used to provide telecare, offer remote assistance, and help to manage the patients and follow up.
To adopt teleconsultation as a tool, the health professional requires basic knowledge of the use of technologies, understanding of the limitations inherent to teleconsultation, and when, where, and how to connect with hardware and software appropriately. It is essential to have an internet connection, a suitable computer with audio and video device, and a phone to get connected.
Laboratory Information Management System enables automated investigation request and results processing through seamless integration with various types of technologically advanced lab machines, making the entire process effective and efficient. The faster data analysis and diagnosis enable clinicians to serve many patients within a limited time interval, avoid crowds in hospitals as per pandemic protocols, and lead to an increase in productivity in the health facility. Laboratory information management systems coordinated functionalities result in implementing the integration of artificial intelligence and algorithms to enhance more comprehensive clinical decisions for quality healthcare services. Digital patient portals provide an opportunity to collaborate with patients, labs, and hospitals.
The process of electronically generating and sending a medicine prescription order to a pharmacy directly from point of care. An electronically transmitted prescription will save time for the patient, improves accuracy, and enhances patient safety and quality of care. There is software for e-prescription which aids patient convenience and guarantees legibility
In this technological era, it is not an easy task to directly manage human endangering health events with technology integration. But advanced technologies would help in developing a strong communication infrastructure for the smart healthcare system in terms of extreme reliability, ultra massive connectivity, connection continuity, network scalability, and flexibility for rapid response for monitoring and taking preventive actions in pandemic situations.
The use of information technology in behavior health education interventions, recovery support, and preventative health programs has gained wide acceptance after this pandemic. Technology-assisted care in treatment improved protocols can play a major role in promotive, preventive, and rehabilitation care.
The digital revolution has resulted in many health applications which enables a patient to monitor their health status by themselves and follow up periodically
E-Consultations:
E-Investigations:
E- Prescription:
E- Emergency Interventions (Home-Based Care):
Guidance And Counselling:
E- Follow-Up:
220 16th SOUTH ASIAN MANAGEMENT FORUM (SAMF) 2021
The healthcare industry is undergoing radical change due to new and emerging technological advancements on how, where, and when healthcare services are to be delivered. The hospital information system is the pillar of digital transformation. Hospital policies have to be revised to leverage a comprehensive spectrum of digitization.
Due to this pandemic, the mobile phone infrastructure has been leveraged to mitigate some of these challenges in health service delivery. Several applications on mobile devices have been used to provide training content on-demand, enable communication between different cadres of health workers, implement clinical decision support systems, and provided work-planning and scheduling tools. Globally, the following are the digital health tools commonly used during this pandemic.
1. Consumer Mobile Apps2. Consumer Wearables3. Connected Biometric Sensors4. Smartphone Cameras5. Clinical Trial Patient Information Collection Tools6. In-Home Connected Virtual Assistants7. Telemedicine and Virtual Physician Aids8. Personal Health records9. Web-based Interactive Programs10. Text Messaging or Email11. Health System Disease Management applications
Some e-therapeutic tools are more effective in integrating evidence-based content and evidenced-based approaches for technology-dependent health care delivery. Due to this pandemic, the application of information and communication technology is used to provide digital health interventions to prevent disease and improve quality of life. In the future, digital health will be viewed with Artificial Intelligence(AI) and promise more consumer-focused prevention-oriented care. Advances in AI, robotics, big data, and machine learning may bring major changes in digital health care. The rapid advancement of new digital technology integration in the health care industry undoubtedly will lead to transformation across the country and worldwide.
Digital health is a cultural transformation of traditional healthcare. The Digital revolution has transformed our lives and societies with unprecedented speed and scale, delivering immense opportunities as intimidating challenges. The healthcare industry comprises patients, healthcare professionals, healthcare organizations, healthcare delivery processes, governmental and non-governmental healthcare organizations, and new digital healthcare delivery services. Beyond a broad perspective of digital health, transformation is complex, digital health promises many opportunities for healthcare delivery services which are considered a boon during the crises like a pandemic. With a multi-method approach, the digital health applications are mapped to various processes in the healthcare delivery system.
Resource Management:
New Sources Of Digital Services To Provide Healthcare Delivery Instead Of Traditional Care
Develop/ Revise The Policies To Support Digitization:
Re-Structuring Of The Existing It Infrastructure:
22116th SOUTH ASIAN MANAGEMENT FORUM (SAMF) 2021
Within the hospital, the role of data security is to ensure the ongoing safe and secure use of patient data. Data privacy is a primary concern for healthcare organizations. Data security functions to prevent a data breach, reduce the risk of data exposure, and for regulatory compliance purposes.
To implement an effective digital health ecosystem and to achieve the organization’s goals it is essential to have a skilled workforce. Training and building the capacity of health care professionals programs have to be conducted and knowledge networks and technical guidance have to be shared to strengthen digital health in resource-constrained health organizations.
The delivery of high-quality efficient healthcare services is a cornerstone of any hospital and during a pandemic, various factors can affect such service delivery. Digital health strategies will be helpful to mitigate the constraints. The following challenges can be faced while encouraging digital strategies for health service delivery in a hospital/ healthcare setting:
Transforming the healthcare practice to online appointments, and digitally supported remote treatment services leads to maintaining uninterrupted client relationships, Continuity of clinical care flow, Seamless clinical health functions in the hospital, and Economical Stability of the hospital. Digital platforms are technology-enabled business models that act as the bridge between disconnected nodes of hospital functions due to pandemics and it improves the principles of scalability, accessibility, and confidentiality. Digital transformation in healthcare contributes to patient-doctor communication, patient monitoring, e-prescription, patient admission rate prediction, strategic planning, preventing human errors, remote patient monitoring, risk assessment, general health condition prediction, better patient experience, pain education techniques, pathology image analytics, drug and vaccine research, waiting for time reduction and medication alerts.
• The effectiveness of interventions and health outcomes• Improvement in health system efficiencies for delivery of service• The human capacity required to implement and support digital health strategies.• Access to health services according to patients’ needs and desires from required departments
may be difficult due to logistical and financial barriers.
Overall, digital technology has transformed healthcare. Artificial intelligence, machine learning, deep learning, blockchain, healthcare mobile apps, wearable, and many other advancements will bring about change in the healthcare industry. Friedman in his study reveals that for less expensive healthcare, virtual visit with doctors and nurses sitting in front of a desktop or laptop and bed-less hospitals will be the future of healthcare.
Data Security:
Capacity Building:
Quality Control:
Healthcare Management And Economy With Digital Transformation:
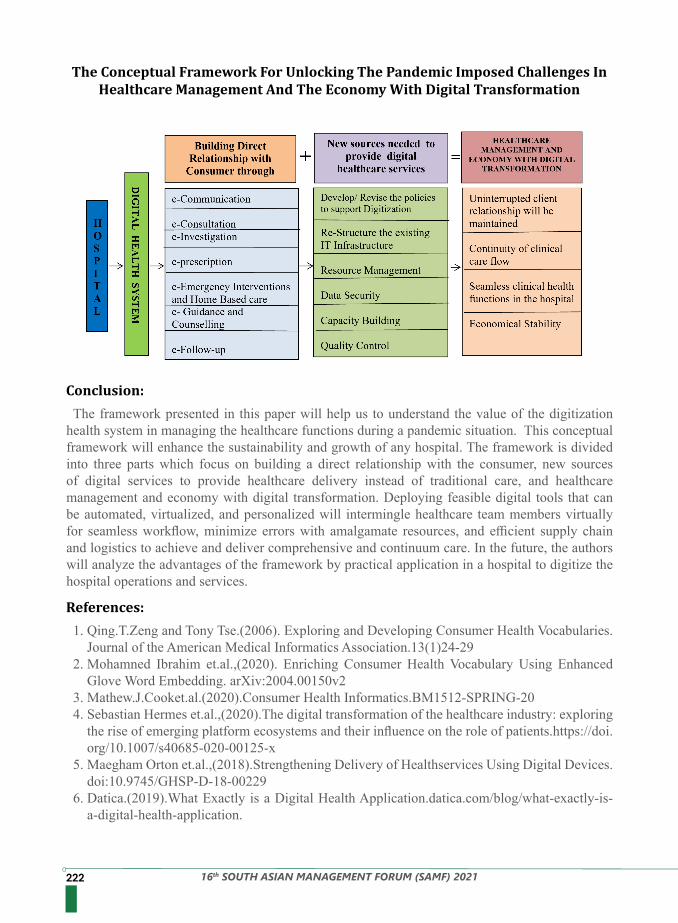
222 16th SOUTH ASIAN MANAGEMENT FORUM (SAMF) 2021
The framework presented in this paper will help us to understand the value of the digitization health system in managing the healthcare functions during a pandemic situation. This conceptual framework will enhance the sustainability and growth of any hospital. The framework is divided into three parts which focus on building a direct relationship with the consumer, new sources of digital services to provide healthcare delivery instead of traditional care, and healthcare management and economy with digital transformation. Deploying feasible digital tools that can be automated, virtualized, and personalized will intermingle healthcare team members virtually for seamless workflow, minimize errors with amalgamate resources, and efficient supply chain and logistics to achieve and deliver comprehensive and continuum care. In the future, the authors will analyze the advantages of the framework by practical application in a hospital to digitize the hospital operations and services.
1. Qing.T.Zeng and Tony Tse.(2006). Exploring and Developing Consumer Health Vocabularies. Journal of the American Medical Informatics Association.13(1)24-29
2. Mohamned Ibrahim et.al.,(2020). Enriching Consumer Health Vocabulary Using Enhanced Glove Word Embedding. arXiv:2004.00150v2
3. Mathew.J.Cooket.al.(2020).Consumer Health Informatics.BM1512-SPRING-204. Sebastian Hermes et.al.,(2020).The digital transformation of the healthcare industry: exploring
the rise of emerging platform ecosystems and their influence on the role of patients.https://doi.org/10.1007/s40685-020-00125-x
5. Maegham Orton et.al.,(2018).Strengthening Delivery of Healthservices Using Digital Devices.doi:10.9745/GHSP-D-18-00229
6. Datica.(2019).What Exactly is a Digital Health Application.datica.com/blog/what-exactly-is-a-digital-health-application.
Conclusion:
References:
The Conceptual Framework For Unlocking The Pandemic Imposed Challenges In Healthcare Management And The Economy With Digital Transformation
22316th SOUTH ASIAN MANAGEMENT FORUM (SAMF) 2021
7. Qiang Wanget.al.,(2021). Integrating Digital Technologies and Public Health to Fight Covid-19 Pandemic: Key Technologies, Application, Challenges and outlook of Digital Healthcare.http://doi.org/10.3390/ijerph18116053.
8. Bertalan Mesko et.al.,(2017).Digital health is a cultural transformation of traditional healthcare.doi:10.21037/mhealth2017.08.07.
9. SanjivKumar.(2018).Digitization of Hospital Services and Operations: A Conceptual Framework.doi:10.24321/2455.9199.
10. India Brand Equity Foundation.(2020).Digital Healthcare To Witness Exponential Growth in India. IBEF, Knowledge Centre.
11. Abhishek Trigunait.(2021). Digital transformation can accelerate growth in the Indian Healthcare landscape through these avenues. Data Quest.Tech4Growth.
12. Samar.F.Farid.(2019).Conceptual Framework of the impact of Health Technology on Healthcare System.doi:10.3389/fphar.2019.00933.
13. Ministry of Health, New Zealanders.(2020). Digital health Strategic Framework.Digital Health Strategic Framework.
14. Pan America Health Organization and World Health organization. Teleconsultations during a Pandemic.fact Sheet. www3.paho.org.
15. Majed Al Dogether et.al.,(2016). The Impact of automating laboratory request forms on the quality of healthcare services.Vol.9(6). Journal of Infection and Public Health.
16. Sudarshan Jain.(2020). Healthcare goes mobile: Evolution of teleconsultation and e-pharmacy in new normal. Ernst and Young LLP
17. Rockville. (2015). Using Technology-Based Therapeutic Tools in Behavioural Health Services. No.60.Treatment Improvement Protocol (TIP) Series.
18. Akash Takyar. (2021).The Impact of Digital transformation in Healthcare.LeewayHertz.com
224 16th SOUTH ASIAN MANAGEMENT FORUM (SAMF) 2021
Similar to other nations, Bangladesh’s economy has already been experiencing ruthless and adverse effects in every corner of the economy due to COVID-19. Furthermore, the profound effects, observed in the large contributory segment that is SMEs, are deeply hearted. The research aims to find recovery strategies for small and medium enterprises (SMEs) of Bangladesh to face the challenges of COVID 19 impact. It is a review of the literature published so far, and a survey on selected SMEs pursued to get real pictures of the issues reviewed. The research revealed that the managers and entrepreneurs of SMEs have been struggling to find recovery strategies in facing the effects of COVID-19, obviously with the help of Government, NGOs, and other national and international agencies.
Keywords: COVID 19, SME, Impact, and Strategy.
Dr. Mohammed Abdullah Mamun,Professor, Department of Management, Faculty of Business Administration, University of Chittagong,
The COVID-19 pandemic has evolved into health, socioeconomic and humanitarian crises of unprecedented scale and impact (Lim, 2021). The impact of COVID-19 has introduced a strong burning platform for change in many unforeseen areas with many organizations and individuals that have struggled or have been simply unable to cope with the pace of change they have encountered. Organizations have been forced to do business differently and, with most staff required to work remotely or from home, business processes have had to change rapidly for organizations to survive. It has affected not only livelihoods but also every economic activity, especially business enterprises including small-medium enterprises (SMEs) (Sansa, 2020; Ruiz Estrada et al., 2020). The study (Le H. et al., 2020) disclosed that SMEs were experiencing trouble due to interest payment, stagnant inventory, workers’ wages, and rental costs during this pandemic.The potential impact of COVID-19 on the economy is a wide discussant issue in recent times all
over the world and Bangladesh is not an exception in this regard (Qamruzzaman, 2020). Similar to other nations, Bangladesh’s economy has already been experiencing ruthless and adverse effects. Furthermore, the profound effects, observed in the large contributory segment that is SMEs, are deeply hearted and still passing with the negative sign of COVID-19. SMEs play major roles in most economies as they drive growth, provide employment, and open new markets. However, even though SMEs are major contributors to economic growth, they are often the most vulnerable when there are major public crises (Qamruzzaman, 2020).As a consequence of the slowdown in economic activity in the fourth quarter of 2020 and projected
slow, but partial recovery in 2021, the OECD estimated there would be long-lasting effects on the global economy, including (CRS, 2021):
Abstract
Introduction and Aims
Introduction
RECOVERY STRATEGIES FOR COVID 19 IMPACT ON BANGLADESHI SMALL & MEDIUM ENTERPRISES (SME)
22516th SOUTH ASIAN MANAGEMENT FORUM (SAMF) 2021
The research introduction compels the aim of the research as exploring the impacts of COVID 19 on Bangladeshi SMEs and the strategies for recovery of such impacts to be recommended thereby. Hence this study can be considered a step toward improving Bangladeshi SMEs’ sustainable business competitiveness. The primary objective of this research is to examine the impacts of COVID 19 on SMEs of Bangladesh to recommend strategies important in facing the short term and long-term challenges.
Output was projected to remain around 5% below pre-crisis expectations in many countries in 2022, raising the specter of substantial permanent costs, disproportionately affecting vulnerable populations.• Smaller firms and entrepreneurs are more likely to go out of business.Many low-wage earners who lost their jobs and are only covered by unemployment insurance, at
best, with poor prospects of finding new jobs quickly.• People living in poverty and usually less well covered by social safety nets experienced a
deterioration in their living standards.• Children and youth from less well-off backgrounds and less qualified adult workers struggled to
learn and work from home, with potentially long-lasting damage.In Bangladesh, the consequences of COVID -19 were found almost the same as above, while
many small and medium-sized enterprises went out of business due to major disruptions in sales and work stoppages during the lockdown period. Millions of low-income employees lost their jobs thereby and the living standards of families in urban areas were found degraded due to the loss of jobs and earnings. SMEs serve alternative channels for global growth. There is an epidemic at the time of writing
on a deadly new coronavirus known as COVID-19 which has the potential to influence SMEs’ financial status(Islam, A. et al. 2020).
While the pandemic is impacting businesses of all sizes, micro, small, and medium enterprises (MSMEs) are hit especially hard due to pre-existing vulnerabilities and their lower resilience. The MSME sector is a key driver of the national economy in Bangladesh (Kader, Ananya Wahid, and Pattanayak, Manoranjan, 2020). Contributing 25 percent to the country’s GDP, MSMEs play a crucial role in income generation and resource utilization. According to the Economic Census and Enterprise Survey, both conducted in 2013, some 99 percent of all non-farm enterprises fall into the micro and small enterprises categories, employing 20.3 million Bangladeshi workers (Kader, Ananya Wahid &Pattanayak, Manoranjan, 2020).
The pandemic has hit Bangladesh’s economy and labor market especially hard. All businesses, particularly in the manufacturing sector, are facing challenges, with a real threat of a substantial decline in revenues and job losses. It is even more challenging for micro, small and medium enterprises (MSMEs) to sustain their business operations (UNIDO, 2020).
SMEs are the bloodline of Bangladesh’s economy which directly creates jobs for 7.8 million people and provides 31.2 million livelihoods. These enterprises contribute 25% of our GDP but may contribute more. The COVID-19 pandemic has infected every field of life and industry, but the toughest blow has struck Bangladesh’s already vulnerable SMEs. SMEs are more vulnerable because they tend to have smaller sources of resources, fewer assets, and smaller production levels than larger companies. (Islam, A. et al. 2020).
Aims of the Study
226 16th SOUTH ASIAN MANAGEMENT FORUM (SAMF) 2021
Literature ReviewImpact of COVID-19 on SMEs of BangladeshThe global arena is currently facing a highly contagious disease named Coronavirus disease
2019 (COVID-19), caused by severe acute respiratory syndrome coronavirus 2 (SARS-CoV-2). Over 200 countries and territories around the world have been affected by this infectious disease. Originated in Wuhan, China, in December 2019 and soon spread rapidly worldwide to create one of the biggest health and economic crises in humankind’s history. So far, around 90 million people have been affected by Covid-19, and around 1.9 million people died worldwide. (Ahmed, Faruque 2021). Among developing and emerging economies, the economic downturn is projected to most
negatively affect countries that rely on commodity exports to support annual economic growth. In addition to lower prices for commodity exports and reduced global demand for exports, developing countries are projected to be negatively affected by reduced remittances, weaker currencies, and tighter financial conditions (CRS, 2021).
The global economy is hard hit, and almost all the countries felt the negative shock of Covid-19. The global economic growth in the first half of 2020 has been severely affected, and the global economic growth projection was at -4.9% in 2020. With the vaccine, the world economy can see a faster recovery than expected but may still face challenges soon(Ahmed, Faruque 2021).
The pandemic has disrupted lives across all countries and communities and negatively affected global economic growth in 2020 beyond anything experienced in nearly a century. Estimates indicate the virus reduced global economic growth in 2020 to an annualized rate of -3.4% to -7.6%, with a recovery of 4.2% to 5.6% projected for 2021. Global trade is estimated to have fallen by 5.3% in 2020 but is projected to grow by 8.0% in 2021 (CRS, 2021). The World Bank in its report on Global Economic Prospects (GEP, June 2020)predicted Bangladesh’s GDP growth at 1.6percent in 2020 and 1 percent in 2021, a significant dip from a rate that hovered around8 percent over the previous two years.Concerning the Covid-19 pandemic crisis, it is categorized as a ‘sudden threat’ which happens
unexpectedly and not only affects health conditions but significantly causes global economic shock. For small enterprises, major hurdles faced by them are disruption of business operations where temporary closure during the lockdown period, and some sectors had permanently closed due to financial problems (Hamdan, Kassim& Lai 2021).
SMEs, according to Runyan (2006), are most severely impacted in crises because of their lower levels of vigilance, higher susceptibility, higher reliance on government and local agencies, and the greater emotional and financial impact on the owners.For micro-enterprises, the impacts of this outbreak have tremendously affected their business
activities. Among the hurdles faced by micro-entrepreneurs such as problems in cash flow due to losses of daily income, operation disruption, laying off workers, and supply chain disruption(Hamdan, Kassim& Lai 2021).
Bangladesh’s small and medium-sized businesses have suffered as they are reliant on a limited cash period that was disrupted by supply chain instability and lack of revenue. Some new studies indicate that 28% of Bangladeshi SMEs have experienced a significant fall in their sales by more than 50% (Islam, A. et al. 2020).
22716th SOUTH ASIAN MANAGEMENT FORUM (SAMF) 2021
Research Approach
Microenterprises and SMEs have been hit hardest by the COVID-19 pandemic and restriction measures. By industry, the textile, apparel, and leather industries were affected the most: around 50 percent of firms operating in these industries reported that between 51 percent and 100 percent of the workforce could not come to work due to the restrictions imposed by the government to contain COVID-19. The shortage of cash flow was reported as being the biggest problem businesses faced due to government restrictions (UNIDO, 2020).
The survey (UNIDO, 2020) shows that 60 percent of firms expect revenue losses of more than 50 percent in 2020 compared to 2019. Large and medium as well as high-tech firms expect lesser losses compared to other firms. In terms of operations being adversely affected at least 67 percent of surveyed firms are affected by shocks like reduction in hours worked and availability of inputs (supply-side shocks), reduction in demand (demand-side shocks), and decrease in cash flow and availability of financial services (liquidity shocks). These shocks have varied effects on different sectors of the economy(Kader, Ananya Wahid &Pattanayak, Manoranjan, 2020).
The motivation of the study is to find out the present state of SMEs, as well as the potential challenges, which might create difficulty to reopen or continue their operations in due course. To do so, both primary and secondary data have been used with descriptive statistics tools. A number of macro agents have been experiencing losses since COVID-19 engrossed the economy, especially Small enterprises is one of them (Qamruzzaman, 2020). SMEs, according to Fitriyani et al. (2020), have bitter experiences during a pandemic due to immense reliance on supply chains that are now almost stopped, increases in raw materials, and readiness to face changes in the way they do the transaction. Therefore, in the study of Hadi (2020), the study findings suggested that Revitalization Strategies for SMEs are inevitable because support from different agents will be a prerequisite to reopening business operations.
The research is a review of the literature published so far on the issues both as research reports by national and international agencies and also as articles in leading journals. In addition, observations from entrepreneurs and managers of selected SMEs are analyzed to achieve the objectives of the research. So, in the attempt to have opinions on the issues researched in the above section, a total of thirty
(30) SMEs are studied in this research. In this data collection, the respondents are interviewed to give opinions on the impacts of COVID 19 and the strategies formulated to get recovery from the impacts of the same. The SMEs chosen are by convenience according to access to the firm’s authority and preferred area of choice while the scope of the study is the SMEs operating in the Chottogram district. The number of SMEs studied is not representative of the total number of firms in each sector obviously (Table 1).
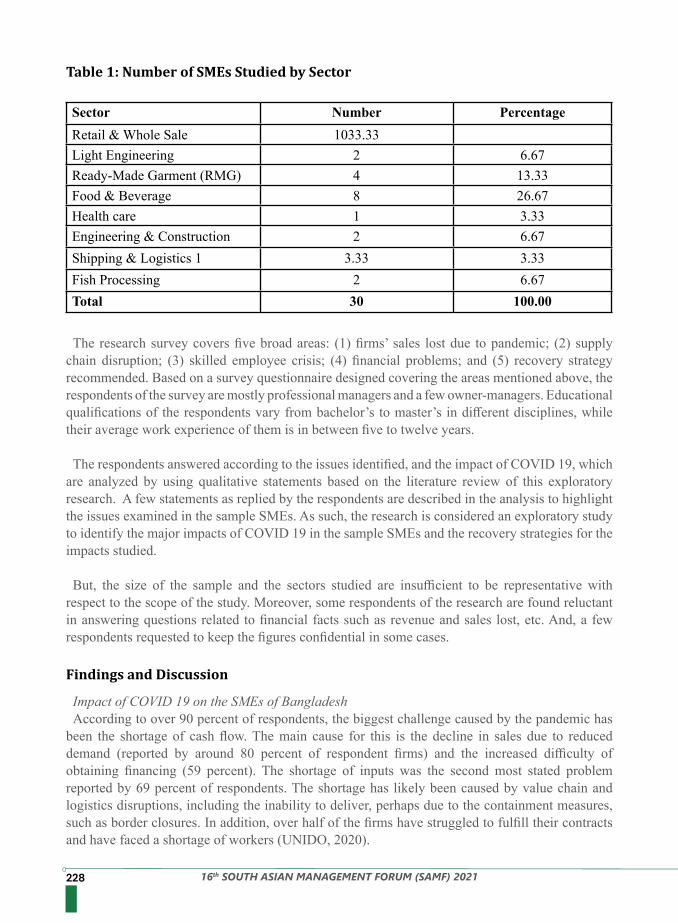
228 16th SOUTH ASIAN MANAGEMENT FORUM (SAMF) 2021
Table 1: Number of SMEs Studied by Sector
Findings and Discussion
Sector Number PercentageRetail & Whole Sale 1033.33Light Engineering 2 6.67Ready-Made Garment (RMG) 4 13.33Food & Beverage 8 26.67Health care 1 3.33Engineering & Construction 2 6.67Shipping & Logistics 1 3.33 3.33Fish Processing 2 6.67Total 30 100.00
The research survey covers five broad areas: (1) firms’ sales lost due to pandemic; (2) supply chain disruption; (3) skilled employee crisis; (4) financial problems; and (5) recovery strategy recommended. Based on a survey questionnaire designed covering the areas mentioned above, the respondents of the survey are mostly professional managers and a few owner-managers. Educational qualifications of the respondents vary from bachelor’s to master’s in different disciplines, while their average work experience of them is in between five to twelve years.
The respondents answered according to the issues identified, and the impact of COVID 19, which are analyzed by using qualitative statements based on the literature review of this exploratory research. A few statements as replied by the respondents are described in the analysis to highlight the issues examined in the sample SMEs. As such, the research is considered an exploratory study to identify the major impacts of COVID 19 in the sample SMEs and the recovery strategies for the impacts studied.
But, the size of the sample and the sectors studied are insufficient to be representative with respect to the scope of the study. Moreover, some respondents of the research are found reluctant in answering questions related to financial facts such as revenue and sales lost, etc. And, a few respondents requested to keep the figures confidential in some cases.
Impact of COVID 19 on the SMEs of BangladeshAccording to over 90 percent of respondents, the biggest challenge caused by the pandemic has
been the shortage of cash flow. The main cause for this is the decline in sales due to reduced demand (reported by around 80 percent of respondent firms) and the increased difficulty of obtaining financing (59 percent). The shortage of inputs was the second most stated problem reported by 69 percent of respondents. The shortage has likely been caused by value chain and logistics disruptions, including the inability to deliver, perhaps due to the containment measures, such as border closures. In addition, over half of the firms have struggled to fulfill their contracts and have faced a shortage of workers (UNIDO, 2020).
22916th SOUTH ASIAN MANAGEMENT FORUM (SAMF) 2021
For SMEs, each crisis is a source of awareness (Mikušová and Horváthová, 2019). A professionally assessed crisis management approach includes evaluating decisions and responses and their consequences, examining the attitudes of crisis team members and employees in general, and more. It should not only be about catching the suspects. However, considering the omnipresence and scale of crises, such as the ongoing COVID-19 pandemic outbreak, we contend that further analysis is required in times of crisis to explore strategy formulation. In particular, while complexity has fallen out of favor in many strategic management models (Alvarez et al., 2018), it is an important part of crisis responses. That makes it difficult, if not impossible, for managers to know ex-ante what strategic approach would lead firms to survive a crisis and rebound from the shock (Pearson and Clair, 1998). Therefore, we urge future studies to explore more closely the internal and external enablers (and disablers) that lead managers and workers to respond adequately to the situational circumstances triggered by crises (Amoiradis and Stankova, 2020).
But, despite playing a pivotal role as Bangladesh’s economic engine, MSMEs face several challenges as mentioned in the report (Kader, Ananya Wahid &Pattanayak, Manoranjan, 2020) were; access to finance, access to technology, lack of investment finance, lack of working capital, lack of skilled workforce, maintaining quality, leveraging global value chains ineffectively and supply-chain finance.
The research report prepared by the authors (Shaoli, Khurshed, &Samveet 2020) assessed the impact of COVID 19 on Bangladesh SMEs with respect to revenues and cost, supply chains, business activities, and product range, and liquidity management. In this study the authors ( Shaoli, Khurshed, &Samveet 2020)revealed that 96%of MSMEs reported a decrease in income; The loss in business was in the range of 10%to 100%withamedian value of 82%. Customer footfall decreased by 67 %.In this study, the authors(Shaoli, Khurshed, &Samveet 2020) also mentioned that the impact was most severe among service-based businesses and retailers who sell non-essential items. The most impacted retailers were from services such as; tailoring, catering, and laundry, among others. Most business owners lack a secondary source of income – only 7% had financial support from their families in the villages in the form of livestock and agriculture.
Sales lost due to COVID-19The impact on sales has been large and widespread; 94 percent of firms experienced a decline in
sales 30 days before the survey relative to the same period in 2019. The estimated average change in sales was -52percent. Further, the decline in sales for firms in the fashion and clothing and retail or wholesale sectors was significantly larger when compared to firms in agriculture, fishing, or mining(Kader, Ananya Wahid &Pattanayak, Manoranjan, 2020).Most of the samples studied reported lost sales due to lockdown and work stoppage during the
pandemic. Some of the respondents did not give facts regarding the lost sales while a few of them requested to keep the figures confidential. Average sales lost as responded by the managers of the sample SMEs is varying from 45% to 58%. Major reasons for such lost sales, as mentioned by the respondents, are; pandemic lockdown, work stoppage due to the absence of workers, supply chain disruption, working capital difficulty, consumption reduction, and so on.
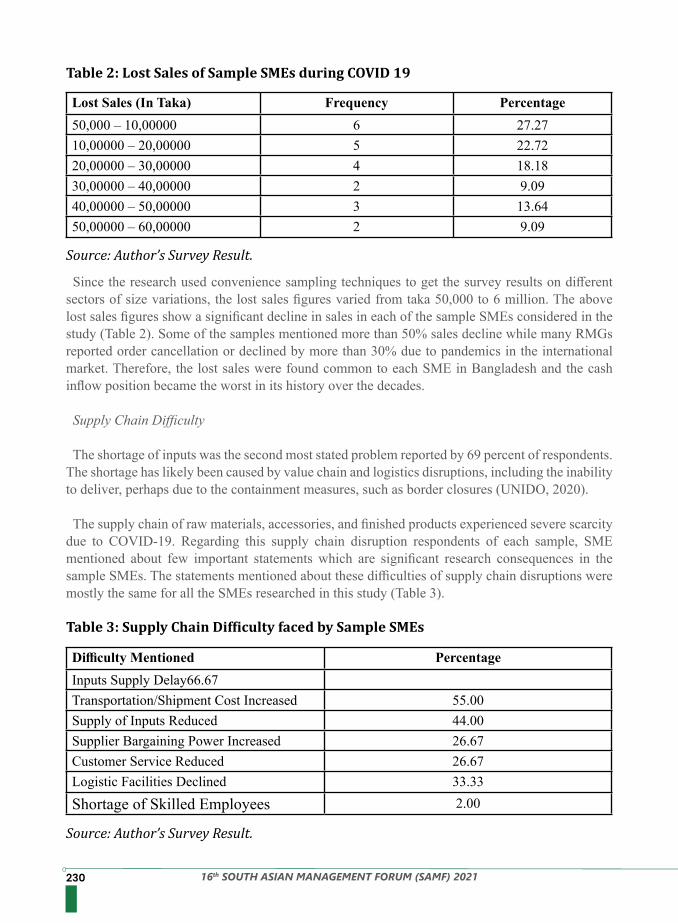
230 16th SOUTH ASIAN MANAGEMENT FORUM (SAMF) 2021
Since the research used convenience sampling techniques to get the survey results on different sectors of size variations, the lost sales figures varied from taka 50,000 to 6 million. The above lost sales figures show a significant decline in sales in each of the sample SMEs considered in the study (Table 2). Some of the samples mentioned more than 50% sales decline while many RMGs reported order cancellation or declined by more than 30% due to pandemics in the international market. Therefore, the lost sales were found common to each SME in Bangladesh and the cash inflow position became the worst in its history over the decades.
Supply Chain Difficulty
The shortage of inputs was the second most stated problem reported by 69 percent of respondents. The shortage has likely been caused by value chain and logistics disruptions, including the inability to deliver, perhaps due to the containment measures, such as border closures (UNIDO, 2020).
The supply chain of raw materials, accessories, and finished products experienced severe scarcity due to COVID-19. Regarding this supply chain disruption respondents of each sample, SME mentioned about few important statements which are significant research consequences in the sample SMEs. The statements mentioned about these difficulties of supply chain disruptions were mostly the same for all the SMEs researched in this study (Table 3).
Table 2: Lost Sales of Sample SMEs during COVID 19
Table 3: Supply Chain Difficulty faced by Sample SMEs
Source: Author’s Survey Result.
Source: Author’s Survey Result.
Lost Sales (In Taka) Frequency Percentage50,000 – 10,00000 6 27.2710,00000 – 20,00000 5 22.7220,00000 – 30,00000 4 18.1830,00000 – 40,00000 2 9.0940,00000 – 50,00000 3 13.6450,00000 – 60,00000 2 9.09
Difficulty Mentioned Percentage Inputs Supply Delay66.67Transportation/Shipment Cost Increased 55.00Supply of Inputs Reduced 44.00Supplier Bargaining Power Increased 26.67Customer Service Reduced 26.67Logistic Facilities Declined 33.33Shortage of Skilled Employees 2.00
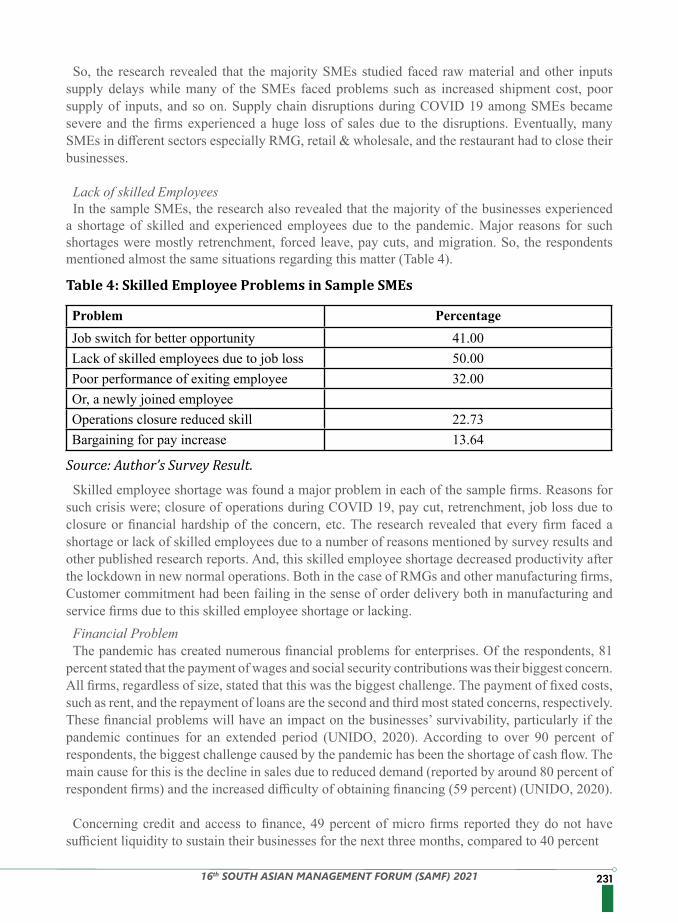
23116th SOUTH ASIAN MANAGEMENT FORUM (SAMF) 2021
Skilled employee shortage was found a major problem in each of the sample firms. Reasons for such crisis were; closure of operations during COVID 19, pay cut, retrenchment, job loss due to closure or financial hardship of the concern, etc. The research revealed that every firm faced a shortage or lack of skilled employees due to a number of reasons mentioned by survey results and other published research reports. And, this skilled employee shortage decreased productivity after the lockdown in new normal operations. Both in the case of RMGs and other manufacturing firms, Customer commitment had been failing in the sense of order delivery both in manufacturing and service firms due to this skilled employee shortage or lacking.Financial Problem The pandemic has created numerous financial problems for enterprises. Of the respondents, 81
percent stated that the payment of wages and social security contributions was their biggest concern. All firms, regardless of size, stated that this was the biggest challenge. The payment of fixed costs, such as rent, and the repayment of loans are the second and third most stated concerns, respectively. These financial problems will have an impact on the businesses’ survivability, particularly if the pandemic continues for an extended period (UNIDO, 2020). According to over 90 percent of respondents, the biggest challenge caused by the pandemic has been the shortage of cash flow. The main cause for this is the decline in sales due to reduced demand (reported by around 80 percent of respondent firms) and the increased difficulty of obtaining financing (59 percent) (UNIDO, 2020).
Concerning credit and access to finance, 49 percent of micro firms reported they do not have sufficient liquidity to sustain their businesses for the next three months, compared to 40 percent
So, the research revealed that the majority SMEs studied faced raw material and other inputs supply delays while many of the SMEs faced problems such as increased shipment cost, poor supply of inputs, and so on. Supply chain disruptions during COVID 19 among SMEs became severe and the firms experienced a huge loss of sales due to the disruptions. Eventually, many SMEs in different sectors especially RMG, retail & wholesale, and the restaurant had to close their businesses.
Lack of skilled EmployeesIn the sample SMEs, the research also revealed that the majority of the businesses experienced
a shortage of skilled and experienced employees due to the pandemic. Major reasons for such shortages were mostly retrenchment, forced leave, pay cuts, and migration. So, the respondents mentioned almost the same situations regarding this matter (Table 4).
Table 4: Skilled Employee Problems in Sample SMEs
Source: Author’s Survey Result.
Problem Percentage Job switch for better opportunity 41.00Lack of skilled employees due to job loss 50.00Poor performance of exiting employee 32.00Or, a newly joined employeeOperations closure reduced skill 22.73Bargaining for pay increase 13.64
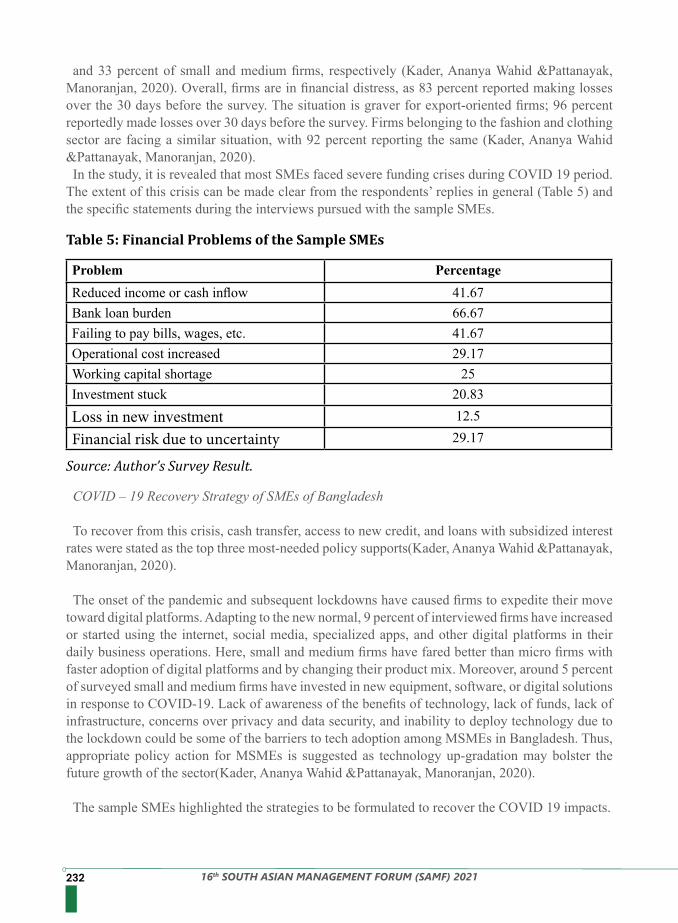
232 16th SOUTH ASIAN MANAGEMENT FORUM (SAMF) 2021
and 33 percent of small and medium firms, respectively (Kader, Ananya Wahid &Pattanayak, Manoranjan, 2020). Overall, firms are in financial distress, as 83 percent reported making losses over the 30 days before the survey. The situation is graver for export-oriented firms; 96 percent reportedly made losses over 30 days before the survey. Firms belonging to the fashion and clothing sector are facing a similar situation, with 92 percent reporting the same (Kader, Ananya Wahid &Pattanayak, Manoranjan, 2020).In the study, it is revealed that most SMEs faced severe funding crises during COVID 19 period.
The extent of this crisis can be made clear from the respondents’ replies in general (Table 5) and the specific statements during the interviews pursued with the sample SMEs.
COVID – 19 Recovery Strategy of SMEs of Bangladesh To recover from this crisis, cash transfer, access to new credit, and loans with subsidized interest
rates were stated as the top three most-needed policy supports(Kader, Ananya Wahid &Pattanayak, Manoranjan, 2020).
The onset of the pandemic and subsequent lockdowns have caused firms to expedite their move toward digital platforms. Adapting to the new normal, 9 percent of interviewed firms have increased or started using the internet, social media, specialized apps, and other digital platforms in their daily business operations. Here, small and medium firms have fared better than micro firms with faster adoption of digital platforms and by changing their product mix. Moreover, around 5 percent of surveyed small and medium firms have invested in new equipment, software, or digital solutions in response to COVID-19. Lack of awareness of the benefits of technology, lack of funds, lack of infrastructure, concerns over privacy and data security, and inability to deploy technology due to the lockdown could be some of the barriers to tech adoption among MSMEs in Bangladesh. Thus, appropriate policy action for MSMEs is suggested as technology up-gradation may bolster the future growth of the sector(Kader, Ananya Wahid &Pattanayak, Manoranjan, 2020).
The sample SMEs highlighted the strategies to be formulated to recover the COVID 19 impacts.
Table 5: Financial Problems of the Sample SMEs
Problem Percentage Reduced income or cash inflow 41.67Bank loan burden 66.67Failing to pay bills, wages, etc. 41.67Operational cost increased 29.17Working capital shortage 25Investment stuck 20.83Loss in new investment 12.5
Financial risk due to uncertainty 29.17
Source: Author’s Survey Result.
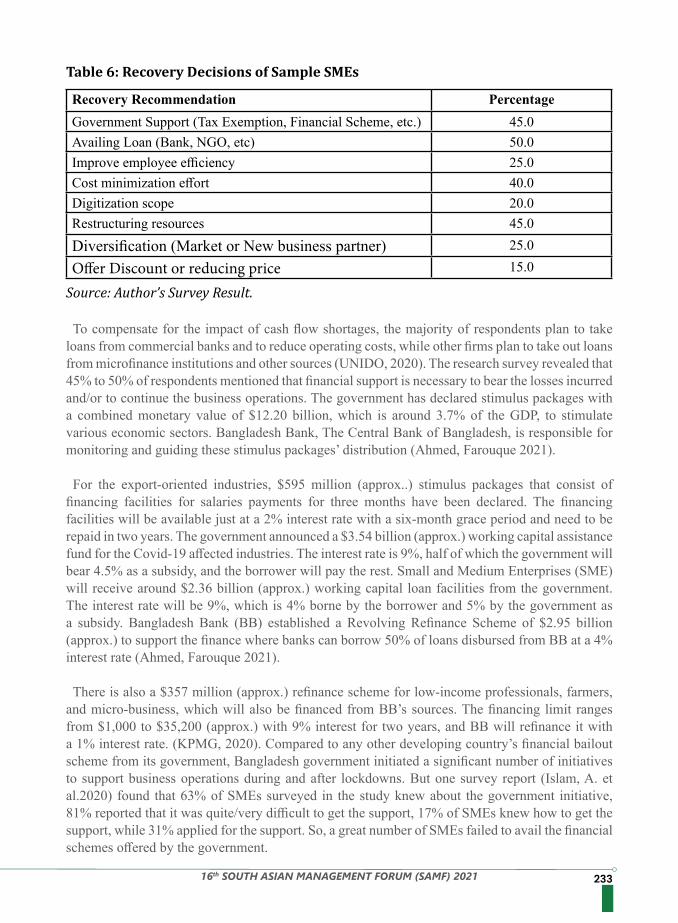
23316th SOUTH ASIAN MANAGEMENT FORUM (SAMF) 2021
To compensate for the impact of cash flow shortages, the majority of respondents plan to take loans from commercial banks and to reduce operating costs, while other firms plan to take out loans from microfinance institutions and other sources (UNIDO, 2020). The research survey revealed that 45% to 50% of respondents mentioned that financial support is necessary to bear the losses incurred and/or to continue the business operations. The government has declared stimulus packages with a combined monetary value of $12.20 billion, which is around 3.7% of the GDP, to stimulate various economic sectors. Bangladesh Bank, The Central Bank of Bangladesh, is responsible for monitoring and guiding these stimulus packages’ distribution (Ahmed, Farouque 2021).
For the export-oriented industries, $595 million (approx..) stimulus packages that consist of financing facilities for salaries payments for three months have been declared. The financing facilities will be available just at a 2% interest rate with a six-month grace period and need to be repaid in two years. The government announced a $3.54 billion (approx.) working capital assistance fund for the Covid-19 affected industries. The interest rate is 9%, half of which the government will bear 4.5% as a subsidy, and the borrower will pay the rest. Small and Medium Enterprises (SME) will receive around $2.36 billion (approx.) working capital loan facilities from the government. The interest rate will be 9%, which is 4% borne by the borrower and 5% by the government as a subsidy. Bangladesh Bank (BB) established a Revolving Refinance Scheme of $2.95 billion (approx.) to support the finance where banks can borrow 50% of loans disbursed from BB at a 4% interest rate (Ahmed, Farouque 2021).
There is also a $357 million (approx.) refinance scheme for low-income professionals, farmers, and micro-business, which will also be financed from BB’s sources. The financing limit ranges from $1,000 to $35,200 (approx.) with 9% interest for two years, and BB will refinance it with a 1% interest rate. (KPMG, 2020). Compared to any other developing country’s financial bailout scheme from its government, Bangladesh government initiated a significant number of initiatives to support business operations during and after lockdowns. But one survey report (Islam, A. et al.2020) found that 63% of SMEs surveyed in the study knew about the government initiative, 81% reported that it was quite/very difficult to get the support, 17% of SMEs knew how to get the support, while 31% applied for the support. So, a great number of SMEs failed to avail the financial schemes offered by the government.
Table 6: Recovery Decisions of Sample SMEs
Recovery Recommendation Percentage Government Support (Tax Exemption, Financial Scheme, etc.) 45.0Availing Loan (Bank, NGO, etc) 50.0Improve employee efficiency 25.0Cost minimization effort 40.0Digitization scope 20.0Restructuring resources 45.0Diversification (Market or New business partner) 25.0
Offer Discount or reducing price 15.0
Source: Author’s Survey Result.
234 16th SOUTH ASIAN MANAGEMENT FORUM (SAMF) 2021
It is interesting to note that the share of respondents considering taking loans from commercial banks increases with firm size. Over 85 percent of large firms and 66 percent of SMEs are considering taking loans from commercial banks, while only 41 percent of micro-enterprises areconsidering this option. The reason may be because micro-enterprises face difficulties accessing
commercial banks, as they do not have the necessary assets as collateral. Hence, nearly 50 percent of micro-enterprises are contemplating taking loans from microfinance institutions, though the interest rate is high compared to that offered by commercial banks (UNIDO, 2020).
Apart from the above financial scheme scenario, the study respondents mentioned cost minimization efforts to offer lower prices or discounts, market diversification, new business partner searching, restructuring or downsizing, and digitization to do the online operation (Table 6); as their preferred recovery strategies to the impacts of COVID-19 experienced so far.
The findings of this study show that COVID-19 has affected Bangladesh’s SMEs severely. Over 90 percent of respondents reported in the study (UNIDO, 2020) that cash flow shortages have the most severe impact of the pandemic on their business due to the reduction in sales, and over 85 percent of respondents expected high to extreme losses of revenue. To bolster the manufacturing sector in these uncertain times, it is important to analyze the driving force of consumer demand in the context of the pandemic. An analysis can determine the direction of product development and innovation to match customers’ needs and demand as well as shape the marketing communication strategy to stimulate demand for goods and services, thereby, to re-establish the disrupted markets (UNIDO,2020).
To build a resilient and competitive industrial sector and to achieve inclusive and sustainable industrial development, it is important to develop relevant policies to mitigate the pandemic’s impact. The coordination of joint efforts between the government and the international community is crucial to supporting Bangladesh’s recovery. Based on the findings of this survey, several actions were identified as potential strategic guidance for the government and relevant stakeholders in supporting Bangladesh’s private sector (UNIDO, 2020).
While the pandemic is impacting businesses of all sizes, micro, small, and medium enterprises (MSMEs) are hit especially hard due to pre-existing vulnerabilities and their lower resilience. The revenue loss, supply disruption, productivity problems, inventory shortage, and contractual penalties are the main challenges as evident from important reports published so far. The employees of SMEs lose wages, and other benefits such as paid leave, performance incentives, and other allowances due to the pandemic impacts such as pay cuts, retrenchment, etc. So, the business operations of SMEs in Bangladesh have experienced unprecedented difficulties during the COVID 19 situation. Measures taken to lessen the effects of the pandemic on SMEs by the government and other
agencies are considered significant attempts so far. Even though, such measures responding to the impacts and facing challenges for SMEs were found insufficient. Reasons for this scenario are many while important ones are lockdown and restrictions from the authority as the pandemic continues for a long time.
Conclusion
23516th SOUTH ASIAN MANAGEMENT FORUM (SAMF) 2021
The research revealed that the managers and entrepreneurs of SMEs have been struggling to find recovery strategies in facing the effects of COVID-19 obviously, with the help of Government, NGOs, and other national and international agencies. Important recovery strategies mentioned are digitalization, innovation, automation, and
partnership by mobilizing limited resources to find cost minimization, improving coordination, and do necessary changes in operations, marketing, distribution, and so on.
1. Ahmed, Faruque (2021). Macroeconomic Impact of Covid-19: A case study on Bangladesh. IOSR Journal of Economics and Finance, 12 (1), 24-29.
2. Alvarez, S., Afuah, A., & Gibson, C. (2018). Editors’ Comments: Should Management Theories Take Uncertainty Seriously? Academy Of Management Review, 43(2), 169-172.
3. Amoiradis, C., &Stankova, M. (2020). THE SYSTEMIC CRISIS AND THE NEED FOR SUSTAINABILITY: AN OVERVIEW. Management Research & Practice, 12(1).
4. CRS, (2021). Global Economic Effects of COVID-19. Congressional Research Service.5. Hadi S. (2020) Revitalization Strategy for Small and Medium Enterprises after Corona Virus
Disease Pandemic (Covid-19) in Yogyakarta. 9.6. Hamdan, Nur Hazirah Binti., Kassim, Salina Binti Hj&Lai, P. C. (2021). The COVID-19
pandemic crisis on micro-entrepreneurs in Malaysia: impact and mitigation approaches. Journal of Global Business and Social Entrepreneurship, 7 (20), 52-64.
7. Hassan, Shaoli,.Khurshed, Nabila,& Sahoo, Samveet (2020).Impact of COVID-19 pandemic on micro, small & medium enterprises (MSMEs). Bangladesh Report. Micro Save Consulting.
8. Islam, A. et al. (2020). Adjusting a strategic cash-flow model for Bangladeshi Small and Medium Enterprises: The art of surviving COVID-19 emergency. Business Excellence and Management, 10 (1), 193-214.
9. Kader, Ananya Wahid &Pattanayak, Manoranjan, (2020).Business Pulse Survey: Impact of covid-19 on MSMEs in Bangladesh.International Finance Corporation
10. KPMG Global. (2020, April 13). Bangladesh- Measures in response to COVID-19 -. KPMG; Retrieved from https://home.kpmg/xx/en/home/insights/2020/04/bangladesh-government-and-institution-measures-in-response-to-covid.html
11. Le H, Nguyen T, Ngo C, et al. (2020) Policy-related factors affecting the survival and development of SMEs in the context of Covid 19 pandemic. Management Science Letters 10: 3683-3692.
12. Lim, Lin Lean (2021). The socioeconomic impacts of COVID-19 in Malaysia: Policy review and guidance for protecting the most vulnerable and supporting enterprises. International Labor Organization.
13. Mikušová, M., &Horváthová, P. (2019). Prepared for a crisis? Basic elements of crisis management in an organization. Economic research-Ekonomskaistraživanja, 32(1): 1844-1868.
14. Pearson, C. M., & Clair, J. A. (1998). Reframing crisis management. Academy of Management Review, 23(1): 151-182.
15. Qamruzzaman, M. (2020). COVID-19 Impact on SMEs in Bangladesh: An Investigation of What They Are Experiencing and How They Are Managing?Retrieved at https://papers.ssrn.com/sol3/papers.cfm?abstract_id=3654126.
16. Ruiz Estrada MA, Koutronas E and Lee M. (2020) Stagpression: The economic and financial impact of Covid-19 Pandemic. Available at SSRN 3593144.
Reference
236 16th SOUTH ASIAN MANAGEMENT FORUM (SAMF) 2021
17. Runyan RC. (2006) Small business in the face of crisis: identifying barriers to recovery from a natural disaster 1. Journal of Contingencies and crisis management 14: 12-26.
18. Sansa NA. (2020) The Impact of the COVID-19 on the Financial Markets: Evidence from China and USA. Electronic Research Journal of Social Sciences and Humanities 2.
19. UNIDO, (2020). Impact Assessment Of COVID-19 On Bangladesh’s Manufacturing Firms. United Nations Industrial Development Organization.
23716th SOUTH ASIAN MANAGEMENT FORUM (SAMF) 2021
The main objective of this paper was to study university students’ smoking behaviors and evaluate the factors that influence them. This paper also contributes to measuring the level of consciousness and awareness among university students regarding smoking under the present Covid-19 situation. A self-directed survey was designed to gather information from 229 students to analyze the predictors of tobacco smoking and their associations with it. The primary drivers of smoking tobacco initiation were stress and the influence of friends, with family members of tobacco smokers playing a crucial indirect influence in initiation. To mitigate this global concern, anti-smoking commercials like LED TV billboards and ads or pop-ups on social media networks should be promoted.
Tobacco continues to be one of the world’s most serious public health issues, killing more than 8 million people each year. Tobacco usage is directly responsible for about 7 million of these fatalities, while approximately 1.2 million are due to non-smokers being subjected to passive smoking. All categories of tobacco are toxic and there is no acceptable amount of tobacco consumption. Some tobacco products include water pipe tobacco, assorted smokeless tobacco products, roll-your-own tobacco, cigars, chewing tobacco, cigarillos, kreteks, and bidis[12]. Cigarettes are deemed to be demerit goods, often referred to as “merit bad”. This indicates that the use of these goods influences the consumer and the third party[7]. Bangladesh is one of the high-achieving countries recognized for various tobacco control measures, namely taxes on tobacco products, anti-tobacco mass media promotions, and healthcare warning labels. The benchmark considered to be a best practice by WHO is at least an increment of 75% tax on tobacco market value. Bangladesh’s high level of tobacco taxation achievement is offset by a rise in per capita tobacco consumption. As tobacco prices rise, overall cigarette intake is anticipated to decline. Contrarily, an increase in consumers’ income could significantly raise their potential to afford more cigarettes and increase the demand for cigarettes[5].
When it was revealed that smokers were more likely than non-smokers to acquire the serious disease from COVID-19, it prompted millions of smokers to quit smoking. However, quitting can be extremely difficult without proper assistance. As a result, WHO established a year-long campaign with the theme “Commit to Quit” for World No Tobacco Day. The program focuses on empowering 100 million tobacco users to quit by building support networks and improving access to services that have been shown to aid tobacco users to quit efficiently[4]. The motive behind choosing this particular topic is that university students are quite a high-risk group for engaging in unhealthy activities, such as smoking and illegal drug use.
Keywords: Tobacco Consumption, Student Health, Covid-19 & Smoking, Tobacco Control, Policy, and Regulations.
Ananya Nandy¹, Aditi Barua²12 School of Business Administration,East Delta University, Chattogram, Bangladesh
Abstract
Introduction
PREDICTORS AND PREVALENCE OF TOBACCO SMOKING DURING COVID-19 AMONG UNIVERSITY STUDENTS
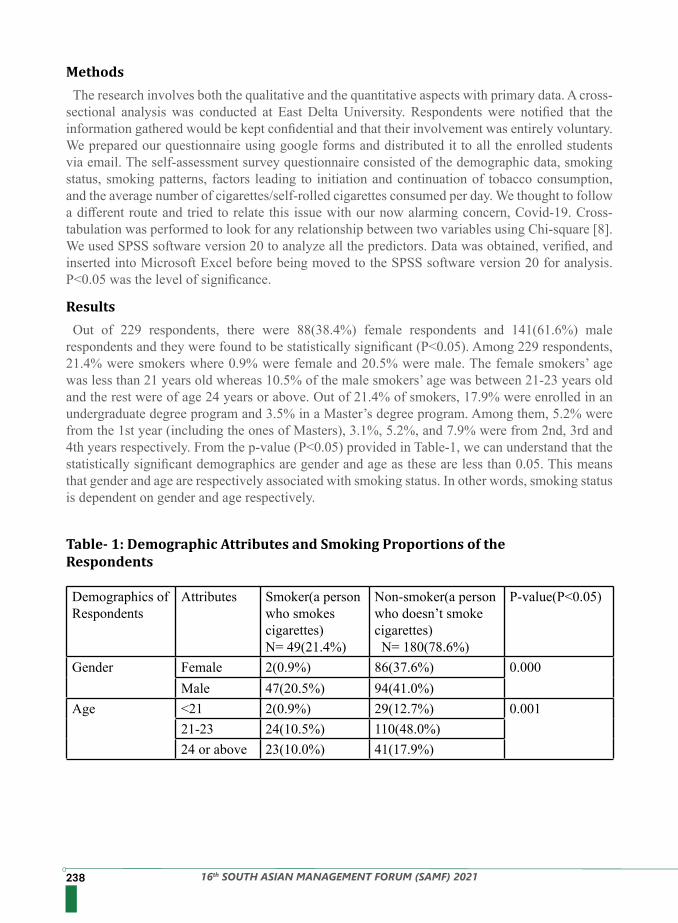
238 16th SOUTH ASIAN MANAGEMENT FORUM (SAMF) 2021
Methods
Results
Table- 1: Demographic Attributes and Smoking Proportions of the Respondents
The research involves both the qualitative and the quantitative aspects with primary data. A cross-sectional analysis was conducted at East Delta University. Respondents were notified that the information gathered would be kept confidential and that their involvement was entirely voluntary. We prepared our questionnaire using google forms and distributed it to all the enrolled students via email. The self-assessment survey questionnaire consisted of the demographic data, smoking status, smoking patterns, factors leading to initiation and continuation of tobacco consumption, and the average number of cigarettes/self-rolled cigarettes consumed per day. We thought to follow a different route and tried to relate this issue with our now alarming concern, Covid-19. Cross-tabulation was performed to look for any relationship between two variables using Chi-square [8]. We used SPSS software version 20 to analyze all the predictors. Data was obtained, verified, and inserted into Microsoft Excel before being moved to the SPSS software version 20 for analysis. P<0.05 was the level of significance.
Out of 229 respondents, there were 88(38.4%) female respondents and 141(61.6%) male respondents and they were found to be statistically significant (P<0.05). Among 229 respondents, 21.4% were smokers where 0.9% were female and 20.5% were male. The female smokers’ age was less than 21 years old whereas 10.5% of the male smokers’ age was between 21-23 years old and the rest were of age 24 years or above. Out of 21.4% of smokers, 17.9% were enrolled in an undergraduate degree program and 3.5% in a Master’s degree program. Among them, 5.2% were from the 1st year (including the ones of Masters), 3.1%, 5.2%, and 7.9% were from 2nd, 3rd and 4th years respectively. From the p-value (P<0.05) provided in Table-1, we can understand that the statistically significant demographics are gender and age as these are less than 0.05. This means that gender and age are respectively associated with smoking status. In other words, smoking status is dependent on gender and age respectively.
Demographics of Respondents
Attributes Smoker(a person who smokes cigarettes)N= 49(21.4%)
Non-smoker(a person who doesn’t smoke cigarettes) N= 180(78.6%)
P-value(P<0.05)
Gender Female 2(0.9%) 86(37.6%) 0.000Male 47(20.5%) 94(41.0%)
Age <21 2(0.9%) 29(12.7%) 0.00121-23 24(10.5%) 110(48.0%)24 or above 23(10.0%) 41(17.9%)
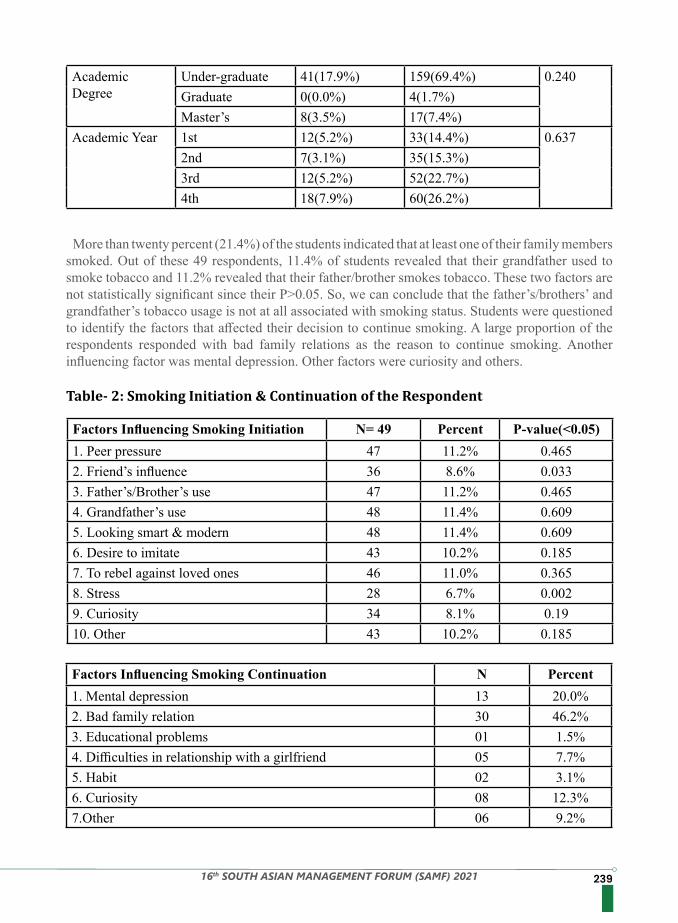
23916th SOUTH ASIAN MANAGEMENT FORUM (SAMF) 2021
Table- 2: Smoking Initiation & Continuation of the Respondent
More than twenty percent (21.4%) of the students indicated that at least one of their family members smoked. Out of these 49 respondents, 11.4% of students revealed that their grandfather used to smoke tobacco and 11.2% revealed that their father/brother smokes tobacco. These two factors are not statistically significant since their P>0.05. So, we can conclude that the father’s/brothers’ and grandfather’s tobacco usage is not at all associated with smoking status. Students were questioned to identify the factors that affected their decision to continue smoking. A large proportion of the respondents responded with bad family relations as the reason to continue smoking. Another influencing factor was mental depression. Other factors were curiosity and others.
Academic Degree
Under-graduate 41(17.9%) 159(69.4%) 0.240Graduate 0(0.0%) 4(1.7%)Master’s 8(3.5%) 17(7.4%)
Academic Year 1st 12(5.2%) 33(14.4%) 0.6372nd 7(3.1%) 35(15.3%)3rd 12(5.2%) 52(22.7%)4th 18(7.9%) 60(26.2%)
Factors Influencing Smoking Initiation N= 49 Percent P-value(<0.05)1. Peer pressure 47 11.2% 0.4652. Friend’s influence 36 8.6% 0.0333. Father’s/Brother’s use 47 11.2% 0.4654. Grandfather’s use 48 11.4% 0.6095. Looking smart & modern 48 11.4% 0.6096. Desire to imitate 43 10.2% 0.1857. To rebel against loved ones 46 11.0% 0.3658. Stress 28 6.7% 0.0029. Curiosity 34 8.1% 0.1910. Other 43 10.2% 0.185
Factors Influencing Smoking Continuation N Percent1. Mental depression 13 20.0%2. Bad family relation 30 46.2%3. Educational problems 01 1.5%4. Difficulties in relationship with a girlfriend 05 7.7%5. Habit 02 3.1%6. Curiosity 08 12.3%7.Other 06 9.2%
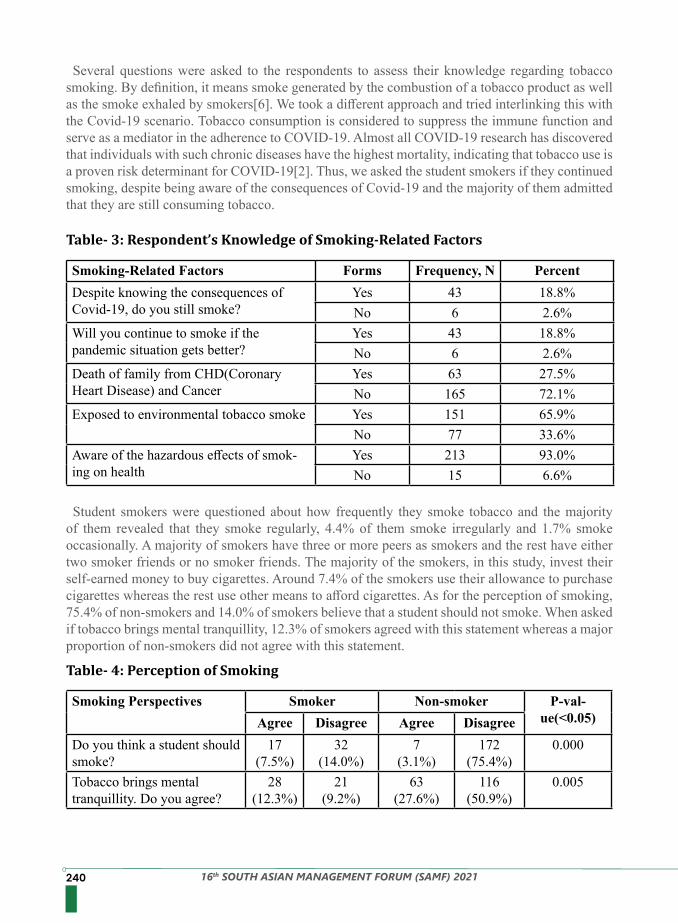
240 16th SOUTH ASIAN MANAGEMENT FORUM (SAMF) 2021
Several questions were asked to the respondents to assess their knowledge regarding tobacco smoking. By definition, it means smoke generated by the combustion of a tobacco product as well as the smoke exhaled by smokers[6]. We took a different approach and tried interlinking this with the Covid-19 scenario. Tobacco consumption is considered to suppress the immune function and serve as a mediator in the adherence to COVID-19. Almost all COVID-19 research has discovered that individuals with such chronic diseases have the highest mortality, indicating that tobacco use is a proven risk determinant for COVID-19[2]. Thus, we asked the student smokers if they continued smoking, despite being aware of the consequences of Covid-19 and the majority of them admitted that they are still consuming tobacco.
Student smokers were questioned about how frequently they smoke tobacco and the majority of them revealed that they smoke regularly, 4.4% of them smoke irregularly and 1.7% smoke occasionally. A majority of smokers have three or more peers as smokers and the rest have either two smoker friends or no smoker friends. The majority of the smokers, in this study, invest their self-earned money to buy cigarettes. Around 7.4% of the smokers use their allowance to purchase cigarettes whereas the rest use other means to afford cigarettes. As for the perception of smoking, 75.4% of non-smokers and 14.0% of smokers believe that a student should not smoke. When asked if tobacco brings mental tranquillity, 12.3% of smokers agreed with this statement whereas a major proportion of non-smokers did not agree with this statement.
Smoking-Related Factors Forms Frequency, N PercentDespite knowing the consequences of Covid-19, do you still smoke?
Yes 43 18.8%No 6 2.6%
Will you continue to smoke if the pandemic situation gets better?
Yes 43 18.8%No 6 2.6%
Death of family from CHD(Coronary Heart Disease) and Cancer
Yes 63 27.5%No 165 72.1%
Exposed to environmental tobacco smoke Yes 151 65.9%No 77 33.6%
Aware of the hazardous effects of smok-ing on health
Yes 213 93.0%No 15 6.6%
Smoking Perspectives Smoker Non-smoker P-val-ue(<0.05)Agree Disagree Agree Disagree
Do you think a student should smoke?
17(7.5%)
32(14.0%)
7(3.1%)
172(75.4%)
0.000
Tobacco brings mental tranquillity. Do you agree?
28(12.3%)
21(9.2%)
63(27.6%)
116(50.9%)
0.005
Table- 3: Respondent’s Knowledge of Smoking-Related Factors
Table- 4: Perception of Smoking
24116th SOUTH ASIAN MANAGEMENT FORUM (SAMF) 2021
Smoker respondents were questioned if they faced any sort of health problems while consuming/smoking tobacco. Respondents were asked if the warning labels on cigarette packs ever discouraged them to smoke tobacco. The results indicate that such policies are not effective in reducing the level of tobacco consumption. As per studies, visual warnings dramatically raise everyone’s awareness of the dangers of tobacco usage. Since the warning labels are not effective enough to reduce the rate of tobacco consumption, we can take a different approach instead[12].
The observations of our study demonstrate that students initiated smoking tobacco around their adolescent years and throughout their university years. Our findings imply that age and gender are the significant determinants associated with smoking tobacco. As per WHO, most students begin using tobacco at a young age, commonly in high school[3]. This could be due to the ease of availability and affordability of tobacco products in various areas of Chattogram. Furthermore, kids can purchase cigarettes or any tobacco products whenever they desire because there are no age limitations. We discovered in our study that tobacco consumption was prevalent among about 21.4% of students, with males accounting for the majority of smokers, probably because females had limited opportunity to smoke because of cultural and social constraints. Our data revealed that there were fewer female smokers than male smokers, supporting our hypothesis that, due to patriarchal domination in our country, the female population does not have the opportunity to participate in such activities. Stress and friend’s influence are the primary drivers of tobacco smoking initiation, with family members of tobacco smokers playing an important indirect influence in initiation.The majority of the students in this study reported that the main reason for initiating smoking
is father’s/brother’s and grandfather’s tobacco usage. Tobacco consumption has been linked to a higher risk of serious sickness and mortality from a variety of respiratory illnesses. In the COVID-19 pandemic, there has been speculation concerning the clinical effects on smokers and if they are equally prone to contamination[13]. Tobacco smokers may be more sensitive to COVID-19 because smoking requires a finger to lip interaction, which enhances the likelihood of virus transmission from hand to mouth. Tobacco use decreases lung function, making it more difficult for the immune system to withstand this virus and other respiratory illnesses. According to available studies, smokers are at a higher risk of experiencing catastrophic COVID-19 results and death[14].
The use of tobacco is a cause of economic loss. Do you agree?
26(11.4%)
23(10.1%)
142(62.3%)
37(16.2%)
0.000
Do you think one should smoke even after knowing the consequences of Covid-19?
5(2.2%)
44(19.3%)
16(7.0%)
163(71.5%)
0.786
Table- 5: Health Problems
Discussions
Loss of Appetite Chest Pain Breathing Problem CoughFrequency 1 2 1 11Percent 0.4% 0.9% 0.4% 4.8%
242 16th SOUTH ASIAN MANAGEMENT FORUM (SAMF) 2021
Limitations
Conclusions
References
We collected cross-sectional data within a small area and with relatively small sample size. The data collected in this study were all self-reported. This may be prone to bias. Since our sample area and sample size are relatively small, our findings may not reflect that of other areas of the country. This study was limited to one out of all the universities in Chattogram, Bangladesh. The study was solely based on tobacco smoking. No data were obtained or mentioned concerning illegal drug use or any non-tobacco products. This study focused only on university students. It did not involve any school-going students or non-students. This needs to be explored further in the future.
Given the health dangers associated with tobacco smoking, WHO urges quitting[14]. Mass awareness programs should be launched so that smokers and non-smokers and passive smokers are aware of the hazardous implications of smoking and how this impacts not only the smoker but everyone around him/her. Because social campaigns cannot be carried out at this critical period, online anti-smoking campaigns should be carried out. In addition to initiatives, anti-smoking commercials should be implemented. Each university should provide academic counseling on tobacco smoking or offer a Smoking Prevention Clinic Program so that smokers who want to quit or need assistance can get the aid they need. To reduce cigarette consumption, the government should impose age restrictions and levy a higher charge on cigarette goods. Even if such legislative safeguards are in place, NID verification should be enforced if smokers want to purchase tobacco products. No one would be able to buy cigarettes or tobacco goods if their NID cards are not produced. The government should establish and improve tobacco control legislation and initiatives. Bangladesh intends to raise cigarette prices to minimize smoking and enhance tax revenue[9].
1. Grover, S., Mohanty, V., Jain, S., Anand, T., & Aghi, M. B. (2020). “YES it’s the Perfect Time to Quit”: Fueling Tobacco Cessation in India during COVID-19 Pandemic. Tobacco Use Insights, 13, 1179173X20960447.
2. Hossain, S., Hossain, S., Ahmed, F., Islam, R., Sikder, T., & Rahman, A. (2017). Prevalence of tobacco smoking and factors associated with the initiation of smoking among university students in Dhaka, Bangladesh. Central Asian journal of global health, 6(1).
3. Krech, D. (2021). Quit tobacco to be a winner. https://www.who.int/news-room/commentaries/detail/quit-tobacco-to-be-a-winner.
4. Nigar Nargis, N., Hussain, A. K. M. G., Goodchild, M., Quahd, C. K. A., & Fongd, G. T. A. Decade of cigarette taxation in Bangladesh: lessons learnt for tobacco control (2019) Bulletin of the WHO 97: 221-229.
5. NCI Dictionary of Cancer Terms. National Cancer Institute. https://www.cancer.gov/publications/dictionaries/cancer-terms/def/secondhand-smoke.
6. Para, M. N. A. (2014). Negative externalities in demerit goods as a cause of market failure–case study of British American Tobacco.
7. Tarafdar, M. M. A., Nahar, S., Rahman, M. M., Hussain, S. M. A., & Zaki, M. (2009). Prevalence and determinants of smoking among the college students in selected District of Bangladesh. Bangladesh Medical Journal, 38(1), 3-8.
24316th SOUTH ASIAN MANAGEMENT FORUM (SAMF) 2021
8. The Financial Express. Cigarette prices rise (2021). The Financial Express. https://thefinancialexpress.com.bd/economy/cigarette-prices-rise-1622720649.
9. World Health Organization (2020a). Tobacco. Who.int. https://www.who.int/news-room/fact-sheets/detail/tobacco.
10. World Health Organization (2020b). Smoking and COVID-19: Scientific brief. Apps.who.int. https://apps.who.int/iris/bitstream/handle/10665/332895/WHO-2019-nCoV-Sci_Brief-Smoking-2020.2-eng.pdf?sequence=1&isAllowed=y.
11. World Health Organization (2020c). Coronavirus disease (COVID-19): Tobacco. Who.int. https://www.who.int/news-room/q-a-detail/coronavirus-disease-covid-19-tobacco.
244 16th SOUTH ASIAN MANAGEMENT FORUM (SAMF) 2021
The main objective of this paper is to analyze consumers’ perspectives regarding COVID- 19 induced medical wastes. We collected data from households through a well-designed survey questionnaire. We then applied the heterogeneity augmented Probit estimation approach for the empirical investigation. We reveal that the government’s community-level awareness programs have a significant impact on consumers’ awareness intensity. On average, a moderate and high level of community-level awareness programs can increase consumer awareness by 26.6% and 36.2%, respectively. We have further found evidence that the COVID-19 infection rate within households also changes the perception of the consumers regarding medical wastes. On the contrary, awareness level does not depend on gender, income, and education. We propose some policies to improve consumer awareness
Bangladesh is a growing economy with landmark improvements in GDP growth, life expectancy, and per capita income along with increased government spending on health, education, and other services. Bangladesh has also made remarkable progress in the reduction of poverty supported by sustained economic growth (World Bank, 2021). Before COVID-19, Bangladesh was able to achieve about a 7% annual growth rate of GDP. But due to the COVID-19 pandemic, the GDP growth has reduced to 5.2% in 2020 and 6.1% in 2021(Bangladesh Bank, 2021). There are long-term negative impacts of COVID-19 on the health, female labor participation rate, poverty, education, and financial sector of Bangladesh.
Bangladesh has made remarkable progress in achieving SDGs. To face climate change impact (SDG-13) and disaster, the government has undertaken various climate change programs, strategies, and plans and formulated different actions. In contrast to the neighboring countries, Bangladesh is way ahead in improving sanitation (SDG-3) and the removal of open defecation. (Dutta & Bhaskar, 2018). Bangladesh is also moving very fast to achieve SDG- 7(access to clean and affordable energy for all). Although Bangladesh is making rapid progress toward its SDGs, there is a lack of efficient policies that are yet to be undertaken to tackle the COVID-19 medical wastage in Bangladesh. Findings from several studies show that Covid-19
can have serious negative impacts on some of the SDGs (Bherwani et al., 2021; Paul, 2021; Saadat, 2021).
Keywords: COVID-19, Waste management, Consumer awareness, Bangladesh
Sakib Bin AminNorth South University,BangladeshYaron Nezleen Amin (Presenting author) North South University, Bangladesh Farhan KhanNorth South University, Bangladesh
Abstract
Introduction
CONSUMER AWARENESS, COVID-19 AND MEDICAL WASTAGE: THE CASE OF BANGLADESH
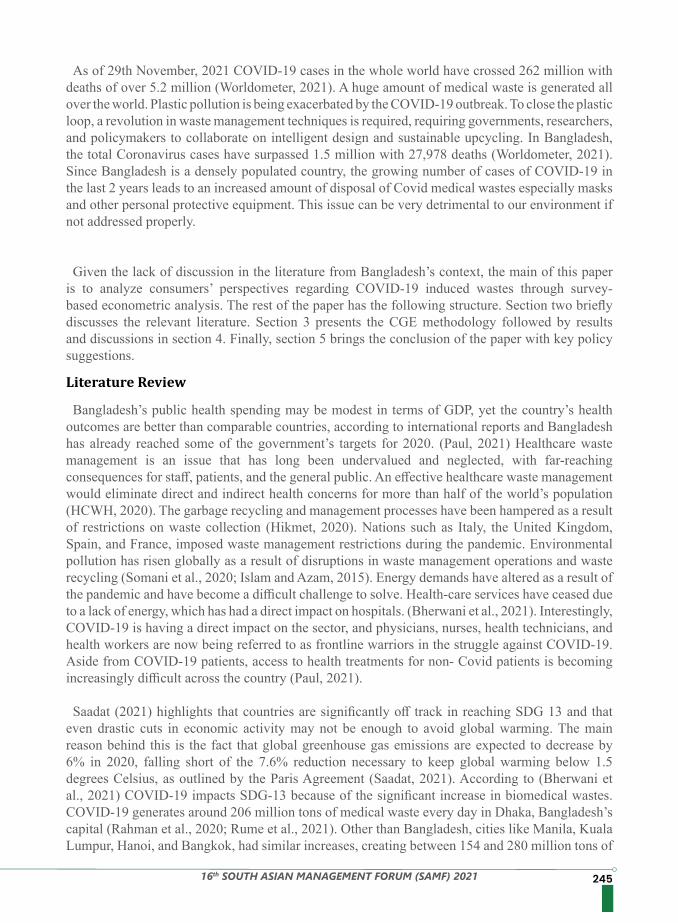
24516th SOUTH ASIAN MANAGEMENT FORUM (SAMF) 2021
As of 29th November, 2021 COVID-19 cases in the whole world have crossed 262 million with deaths of over 5.2 million (Worldometer, 2021). A huge amount of medical waste is generated all over the world. Plastic pollution is being exacerbated by the COVID-19 outbreak. To close the plastic loop, a revolution in waste management techniques is required, requiring governments, researchers, and policymakers to collaborate on intelligent design and sustainable upcycling. In Bangladesh, the total Coronavirus cases have surpassed 1.5 million with 27,978 deaths (Worldometer, 2021). Since Bangladesh is a densely populated country, the growing number of cases of COVID-19 in the last 2 years leads to an increased amount of disposal of Covid medical wastes especially masks and other personal protective equipment. This issue can be very detrimental to our environment if not addressed properly.
Given the lack of discussion in the literature from Bangladesh’s context, the main of this paper is to analyze consumers’ perspectives regarding COVID-19 induced wastes through survey-based econometric analysis. The rest of the paper has the following structure. Section two briefly discusses the relevant literature. Section 3 presents the CGE methodology followed by results and discussions in section 4. Finally, section 5 brings the conclusion of the paper with key policy suggestions.
Bangladesh’s public health spending may be modest in terms of GDP, yet the country’s health outcomes are better than comparable countries, according to international reports and Bangladesh has already reached some of the government’s targets for 2020. (Paul, 2021) Healthcare waste management is an issue that has long been undervalued and neglected, with far-reaching consequences for staff, patients, and the general public. An effective healthcare waste management would eliminate direct and indirect health concerns for more than half of the world’s population (HCWH, 2020). The garbage recycling and management processes have been hampered as a result of restrictions on waste collection (Hikmet, 2020). Nations such as Italy, the United Kingdom, Spain, and France, imposed waste management restrictions during the pandemic. Environmental pollution has risen globally as a result of disruptions in waste management operations and waste recycling (Somani et al., 2020; Islam and Azam, 2015). Energy demands have altered as a result of the pandemic and have become a difficult challenge to solve. Health-care services have ceased due to a lack of energy, which has had a direct impact on hospitals. (Bherwani et al., 2021). Interestingly, COVID-19 is having a direct impact on the sector, and physicians, nurses, health technicians, and health workers are now being referred to as frontline warriors in the struggle against COVID-19. Aside from COVID-19 patients, access to health treatments for non- Covid patients is becoming increasingly difficult across the country (Paul, 2021). Saadat (2021) highlights that countries are significantly off track in reaching SDG 13 and that
even drastic cuts in economic activity may not be enough to avoid global warming. The main reason behind this is the fact that global greenhouse gas emissions are expected to decrease by 6% in 2020, falling short of the 7.6% reduction necessary to keep global warming below 1.5 degrees Celsius, as outlined by the Paris Agreement (Saadat, 2021). According to (Bherwani et al., 2021) COVID-19 impacts SDG-13 because of the significant increase in biomedical wastes. COVID-19 generates around 206 million tons of medical waste every day in Dhaka, Bangladesh’s capital (Rahman et al., 2020; Rume et al., 2021). Other than Bangladesh, cities like Manila, Kuala Lumpur, Hanoi, and Bangkok, had similar increases, creating between 154 and 280 million tons of
Literature Review
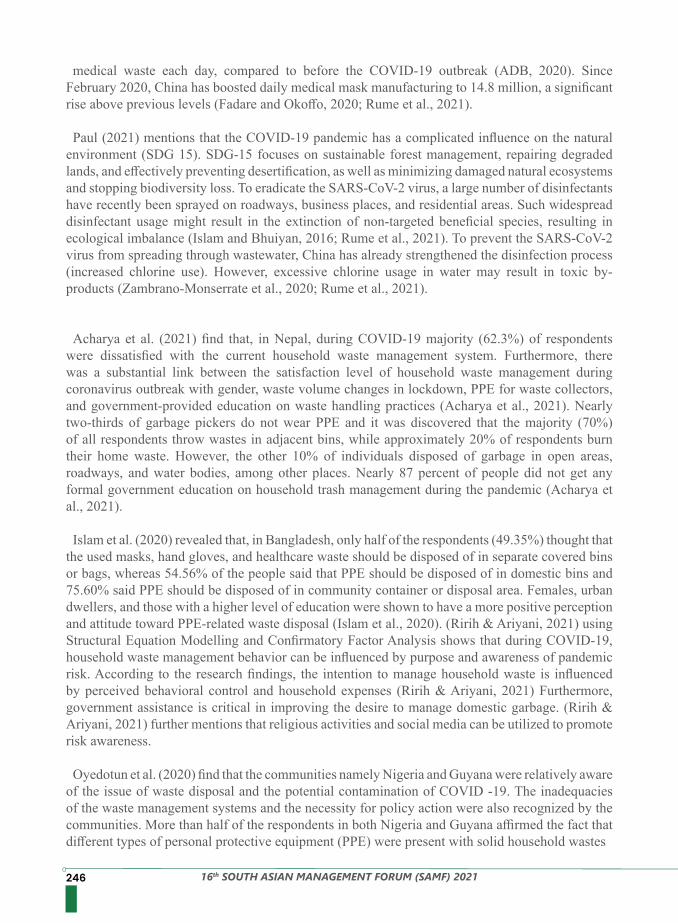
246 16th SOUTH ASIAN MANAGEMENT FORUM (SAMF) 2021
medical waste each day, compared to before the COVID-19 outbreak (ADB, 2020). Since February 2020, China has boosted daily medical mask manufacturing to 14.8 million, a significant rise above previous levels (Fadare and Okoffo, 2020; Rume et al., 2021).
Paul (2021) mentions that the COVID-19 pandemic has a complicated influence on the natural environment (SDG 15). SDG-15 focuses on sustainable forest management, repairing degraded lands, and effectively preventing desertification, as well as minimizing damaged natural ecosystems and stopping biodiversity loss. To eradicate the SARS-CoV-2 virus, a large number of disinfectants have recently been sprayed on roadways, business places, and residential areas. Such widespread disinfectant usage might result in the extinction of non-targeted beneficial species, resulting in ecological imbalance (Islam and Bhuiyan, 2016; Rume et al., 2021). To prevent the SARS-CoV-2 virus from spreading through wastewater, China has already strengthened the disinfection process (increased chlorine use). However, excessive chlorine usage in water may result in toxic by-products (Zambrano-Monserrate et al., 2020; Rume et al., 2021).
Acharya et al. (2021) find that, in Nepal, during COVID-19 majority (62.3%) of respondents were dissatisfied with the current household waste management system. Furthermore, there was a substantial link between the satisfaction level of household waste management during coronavirus outbreak with gender, waste volume changes in lockdown, PPE for waste collectors, and government-provided education on waste handling practices (Acharya et al., 2021). Nearly two-thirds of garbage pickers do not wear PPE and it was discovered that the majority (70%) of all respondents throw wastes in adjacent bins, while approximately 20% of respondents burn their home waste. However, the other 10% of individuals disposed of garbage in open areas, roadways, and water bodies, among other places. Nearly 87 percent of people did not get any formal government education on household trash management during the pandemic (Acharya et al., 2021).
Islam et al. (2020) revealed that, in Bangladesh, only half of the respondents (49.35%) thought that the used masks, hand gloves, and healthcare waste should be disposed of in separate covered bins or bags, whereas 54.56% of the people said that PPE should be disposed of in domestic bins and 75.60% said PPE should be disposed of in community container or disposal area. Females, urban dwellers, and those with a higher level of education were shown to have a more positive perception and attitude toward PPE-related waste disposal (Islam et al., 2020). (Ririh & Ariyani, 2021) using Structural Equation Modelling and Confirmatory Factor Analysis shows that during COVID-19, household waste management behavior can be influenced by purpose and awareness of pandemic risk. According to the research findings, the intention to manage household waste is influenced by perceived behavioral control and household expenses (Ririh & Ariyani, 2021) Furthermore, government assistance is critical in improving the desire to manage domestic garbage. (Ririh & Ariyani, 2021) further mentions that religious activities and social media can be utilized to promote risk awareness.
Oyedotun et al. (2020) find that the communities namely Nigeria and Guyana were relatively aware of the issue of waste disposal and the potential contamination of COVID -19. The inadequacies of the waste management systems and the necessity for policy action were also recognized by the communities. More than half of the respondents in both Nigeria and Guyana affirmed the fact that different types of personal protective equipment (PPE) were present with solid household wastes
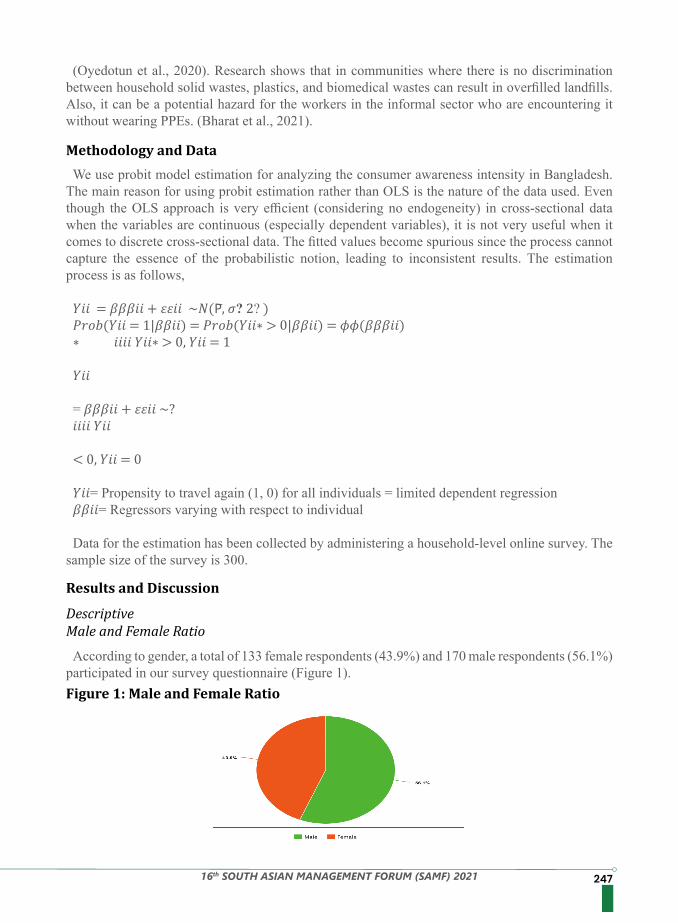
24716th SOUTH ASIAN MANAGEMENT FORUM (SAMF) 2021
(Oyedotun et al., 2020). Research shows that in communities where there is no discrimination between household solid wastes, plastics, and biomedical wastes can result in overfilled landfills. Also, it can be a potential hazard for the workers in the informal sector who are encountering it without wearing PPEs. (Bharat et al., 2021).
According to gender, a total of 133 female respondents (43.9%) and 170 male respondents (56.1%) participated in our survey questionnaire (Figure 1).
We use probit model estimation for analyzing the consumer awareness intensity in Bangladesh. The main reason for using probit estimation rather than OLS is the nature of the data used. Even though the OLS approach is very efficient (considering no endogeneity) in cross-sectional data when the variables are continuous (especially dependent variables), it is not very useful when it comes to discrete cross-sectional data. The fitted values become spurious since the process cannot capture the essence of the probabilistic notion, leading to inconsistent results. The estimation process is as follows,
𝑌𝑖𝑖 = 𝛽𝛽𝛽𝑖𝑖 + 𝜀𝜀𝑖𝑖 ~𝑁(𝖯̅, 𝜎? 2? )𝑃𝑟𝑜𝑏(𝑌𝑖𝑖 = 1|𝛽𝛽𝑖𝑖) = 𝑃𝑟𝑜𝑏(𝑌𝑖𝑖∗ > 0|𝛽𝛽𝑖𝑖) = 𝜙𝜙(𝛽𝛽𝛽𝑖𝑖)∗ 𝑖𝑖𝑖𝑖 𝑌𝑖𝑖∗ > 0, 𝑌𝑖𝑖 = 1 𝑌𝑖𝑖 = 𝛽𝛽𝛽𝑖𝑖 + 𝜀𝜀𝑖𝑖 ~?𝑖𝑖𝑖𝑖 𝑌𝑖𝑖 < 0, 𝑌𝑖𝑖 = 0 𝑌𝑖𝑖= Propensity to travel again (1, 0) for all individuals = limited dependent regression𝛽𝛽𝑖𝑖= Regressors varying with respect to individual
Data for the estimation has been collected by administering a household-level online survey. The sample size of the survey is 300.
Methodology and Data
Results and Discussion
Figure 1: Male and Female Ratio
DescriptiveMale and Female Ratio
248 16th SOUTH ASIAN MANAGEMENT FORUM (SAMF) 2021
EducationThe highest degree of education of the majority of the respondents (93.4%) was the Bachelor’s
degree while 19 respondents (6.3%) stated that they have completed their Master’s degree. (Figure 2).
IncomeWe can divide our respondents into 6 categories according to the respondents’ household monthly
income. The majority of the respondents (23.1%) informed us that their family income is less than BDT 10K while only 9.9 % of respondents’ household income was above BDT 200K (Figure 3).
Figure 2: Education Level
Figure 3: Household Income
Probit Estimation ResultsThis section shows the probit estimates of the variables affecting the consumer awareness of
COVID-19 induced medical wastages (Table 1). Our findings reveal that the variable gender is not significant. Therefore, gender is not a determinant of consumer awareness regarding COVID-19 waste medical waste management. According to our estimation, the likelihood (or probability) of awareness is 4.6% in the case of males, which is more than the percentage of females, regarding the COVID-19 waste management guideline. On the other hand, the variable “Separate Basket or Bins” is significant. Respondents who agreed to have a separate basket for waste collection tend to be 12.1% more aware of the COVID-19 waste management compared to those who do not have such an arrangement for waste collection.
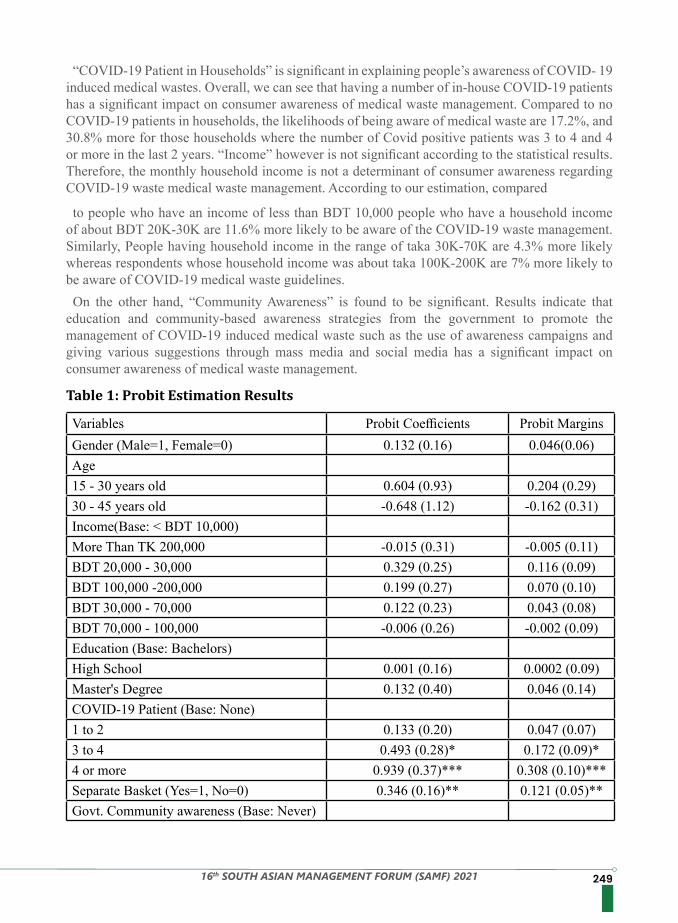
24916th SOUTH ASIAN MANAGEMENT FORUM (SAMF) 2021
Table 1: Probit Estimation Results
“COVID-19 Patient in Households” is significant in explaining people’s awareness of COVID- 19 induced medical wastes. Overall, we can see that having a number of in-house COVID-19 patients has a significant impact on consumer awareness of medical waste management. Compared to no COVID-19 patients in households, the likelihoods of being aware of medical waste are 17.2%, and 30.8% more for those households where the number of Covid positive patients was 3 to 4 and 4 or more in the last 2 years. “Income” however is not significant according to the statistical results. Therefore, the monthly household income is not a determinant of consumer awareness regarding COVID-19 waste medical waste management. According to our estimation, compared
to people who have an income of less than BDT 10,000 people who have a household income of about BDT 20K-30K are 11.6% more likely to be aware of the COVID-19 waste management. Similarly, People having household income in the range of taka 30K-70K are 4.3% more likely whereas respondents whose household income was about taka 100K-200K are 7% more likely to be aware of COVID-19 medical waste guidelines.On the other hand, “Community Awareness” is found to be significant. Results indicate that
education and community-based awareness strategies from the government to promote the management of COVID-19 induced medical waste such as the use of awareness campaigns and giving various suggestions through mass media and social media has a significant impact on consumer awareness of medical waste management.
Variables Probit Coefficients Probit MarginsGender (Male=1, Female=0) 0.132 (0.16) 0.046(0.06)Age15 - 30 years old 0.604 (0.93) 0.204 (0.29)30 - 45 years old -0.648 (1.12) -0.162 (0.31)Income(Base: < BDT 10,000)More Than TK 200,000 -0.015 (0.31) -0.005 (0.11)BDT 20,000 - 30,000 0.329 (0.25) 0.116 (0.09)BDT 100,000 -200,000 0.199 (0.27) 0.070 (0.10)BDT 30,000 - 70,000 0.122 (0.23) 0.043 (0.08)BDT 70,000 - 100,000 -0.006 (0.26) -0.002 (0.09)Education (Base: Bachelors)High School 0.001 (0.16) 0.0002 (0.09)Master's Degree 0.132 (0.40) 0.046 (0.14)COVID-19 Patient (Base: None)1 to 2 0.133 (0.20) 0.047 (0.07)3 to 4 0.493 (0.28)* 0.172 (0.09)*4 or more 0.939 (0.37)*** 0.308 (0.10)***Separate Basket (Yes=1, No=0) 0.346 (0.16)** 0.121 (0.05)**Govt. Community awareness (Base: Never)
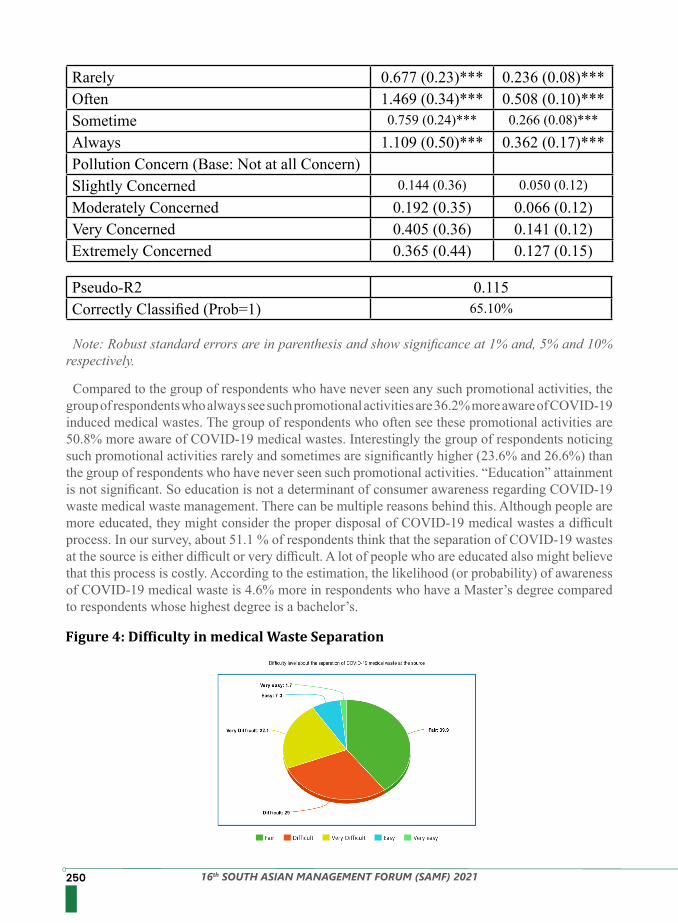
250 16th SOUTH ASIAN MANAGEMENT FORUM (SAMF) 2021
Rarely 0.677 (0.23)*** 0.236 (0.08)***Often 1.469 (0.34)*** 0.508 (0.10)***Sometime 0.759 (0.24)*** 0.266 (0.08)***Always 1.109 (0.50)*** 0.362 (0.17)***Pollution Concern (Base: Not at all Concern)Slightly Concerned 0.144 (0.36) 0.050 (0.12)Moderately Concerned 0.192 (0.35) 0.066 (0.12)Very Concerned 0.405 (0.36) 0.141 (0.12)Extremely Concerned 0.365 (0.44) 0.127 (0.15)
Pseudo-R2 0.115Correctly Classified (Prob=1) 65.10%
Note: Robust standard errors are in parenthesis and show significance at 1% and, 5% and 10% respectively.
Compared to the group of respondents who have never seen any such promotional activities, the group of respondents who always see such promotional activities are 36.2% more aware of COVID-19 induced medical wastes. The group of respondents who often see these promotional activities are 50.8% more aware of COVID-19 medical wastes. Interestingly the group of respondents noticing such promotional activities rarely and sometimes are significantly higher (23.6% and 26.6%) than the group of respondents who have never seen such promotional activities. “Education” attainment is not significant. So education is not a determinant of consumer awareness regarding COVID-19 waste medical waste management. There can be multiple reasons behind this. Although people are more educated, they might consider the proper disposal of COVID-19 medical wastes a difficult process. In our survey, about 51.1 % of respondents think that the separation of COVID-19 wastes at the source is either difficult or very difficult. A lot of people who are educated also might believe that this process is costly. According to the estimation, the likelihood (or probability) of awareness of COVID-19 medical waste is 4.6% more in respondents who have a Master’s degree compared to respondents whose highest degree is a bachelor’s.
Figure 4: Difficulty in medical Waste Separation
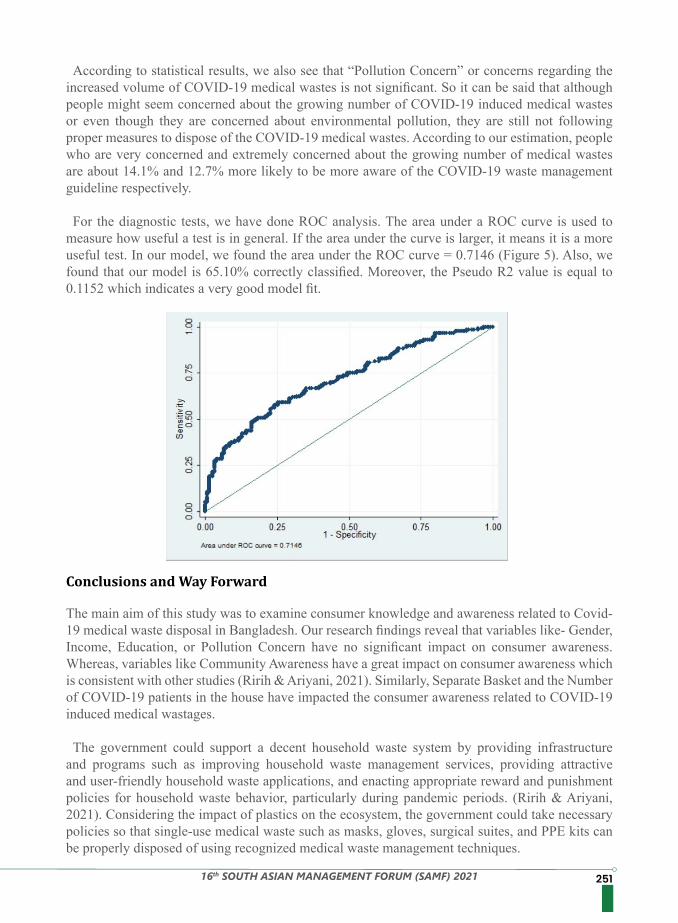
25116th SOUTH ASIAN MANAGEMENT FORUM (SAMF) 2021
According to statistical results, we also see that “Pollution Concern” or concerns regarding the increased volume of COVID-19 medical wastes is not significant. So it can be said that although people might seem concerned about the growing number of COVID-19 induced medical wastes or even though they are concerned about environmental pollution, they are still not following proper measures to dispose of the COVID-19 medical wastes. According to our estimation, people who are very concerned and extremely concerned about the growing number of medical wastes are about 14.1% and 12.7% more likely to be more aware of the COVID-19 waste management guideline respectively. For the diagnostic tests, we have done ROC analysis. The area under a ROC curve is used to
measure how useful a test is in general. If the area under the curve is larger, it means it is a more useful test. In our model, we found the area under the ROC curve = 0.7146 (Figure 5). Also, we found that our model is 65.10% correctly classified. Moreover, the Pseudo R2 value is equal to 0.1152 which indicates a very good model fit.
The main aim of this study was to examine consumer knowledge and awareness related to Covid- 19 medical waste disposal in Bangladesh. Our research findings reveal that variables like- Gender, Income, Education, or Pollution Concern have no significant impact on consumer awareness. Whereas, variables like Community Awareness have a great impact on consumer awareness which is consistent with other studies (Ririh & Ariyani, 2021). Similarly, Separate Basket and the Number of COVID-19 patients in the house have impacted the consumer awareness related to COVID-19 induced medical wastages.
The government could support a decent household waste system by providing infrastructure and programs such as improving household waste management services, providing attractive and user-friendly household waste applications, and enacting appropriate reward and punishment policies for household waste behavior, particularly during pandemic periods. (Ririh & Ariyani, 2021). Considering the impact of plastics on the ecosystem, the government could take necessary policies so that single-use medical waste such as masks, gloves, surgical suites, and PPE kits can be properly disposed of using recognized medical waste management techniques.
Conclusions and Way Forward
252 16th SOUTH ASIAN MANAGEMENT FORUM (SAMF) 2021
The US Food and Drug Administration advised healthcare practitioners to use reusable surgical gowns instead of PPE kits. Personal COVID-19 protective materials should also be disposed of separately in separate bins and recycled at an authorized medical waste management facility (US FDA, 2020). Research shows that these techniques may aid in the reduction of plastic pollution caused by single-use plastic during pandemics (Singh et al., 2021). In developing countries, like Bangladesh, where there are limited resources, interim treatment options can be undertaken following the WHO guidelines.
Different segregation methods can be followed, except for sharps waste and treated waste with regular solid waste. The Bangladesh government could also focus heavily on capacity development. Even though some households separate medical wastes these days; however as most waste collectors know nothing more than handling household wastes during the COVID-19 pandemic, it has become crucial to train them to handle medical wastage. Also, the number of waste management agencies and the number of workers in those agencies should be increased to manage the growing number of medical wastes due to Covid-19. Radio, Television, and media can play a significant role in creating awareness and informing the general public about the proper ways of handling medical waste. It is important to raise awareness of the possible dangers of COVID-19-related medical waste disposal among community members, including slum dwellers, and train volunteers, workers, healthcare providers, and professionals involved in medical waste management.
At the regional level, plans should be made to coordinate resources for disposal capacity across the region in the event of an emergency. Medical waste can be quickly sent to disposal facilities in nearby cities in the event of a medical emergency, allowing for cooperative prevention and control. As a result, during severe public emergencies, coordinating infrastructure at the regional level could be stressed. The administration could estimate the spatial distribution pattern of medical waste production, identify storage needs, establish a regional dispatching center, address the shortage of storage space in small hospitals while increasing storage space in large hospitals, and devise a strategy for sharing storage space across the region. Vehicles transporting medical waste from hospitals could have a non-absorbent, sealed load area that can be secured, disinfected, and kept separate from the driver’s cabin. (Faisal et al., 2021). The government could prioritize the development and analysis of sustainable waste management chains, which include logistics, recycling, and treatment technologies and policies. It is very important to construct mobile treatment units near hospitals and healthcare centers to address the overflow of medical waste (Djalante et al., 2020; You et al., 2020). Faisal et al. (2021) suggest that the government could offer yellow medical bags and collection services to ensure adequate (a) packaging and storage, (b) collection and transportation, and (c) refinement and removal of the waste through a secure disposal mechanism.
Bangladesh can take lessons from a few model cities in India and China about how to manage the Covid-19 wastes efficiently. In our neighboring country India, The National Institute for Interdisciplinary Science and Technology (NIIST) of India has recently developed a technology called “Disinfection- Solidification System for pathogenic Biomedical Waste Disposal”. The specialty of this technology is that it enables the disinfection of wastes and solidification instantly when mixed. According to NIIST, the transportation and disposal of such disinfected pathogenic wastes are easier and safer for healthcare facilities. (The Hindu, 2021). The Covid waste management in Surat a city in the state of Gujarat which is often called
25316th SOUTH ASIAN MANAGEMENT FORUM (SAMF) 2021
“The Diamond City” or “The Green City” can be a great inspiration for us too. “Dhanvari Raths” or mobile vans in the cities like Surat or Ahmedabad are successfully providing healthcare services to millions. Surat Municipal Corporation made sure that the COVID-19 induced medical wastes generated by the mobile vans of “Dhanvantari Raths” was collected from the site on time and sent to urban health centers. Also, it was processed for further scientific disposal (Times of India, 2020). In Bangladesh, it is also necessary to create a comprehensive medical data system like that of Wuhan, China. As medical waste data improved gradually, Wuhan began to build a medical waste management plan and began to efficiently deploy resources to strengthen the medical waste management system. Chen et al. (2021) opine medical data may be used to visualize various scenarios and predict waste generation trends, guiding medical waste management and quickly boosting the capacity and resilience of urban medical treatment in the event of severe public emergencies. Moreover, to facilitate dynamic medical waste monitoring and transfer scheduling, a smart software system has been built in Wuhan, China. The technology will provide a notification to the waste management department that a transfer is necessary, decreasing the danger. Furthermore, due to the execution of streamlined procedures and the provision of tax incentives and other policies to encourage waste disposal firms, the legislative process has been considerably accelerated to facilitate the implementation of medical waste treatment projects (HubeiDaily, 2020a; Chen et al., 2021). For example, in Wuhan, a waste charge regulation was recently established using this new procedure to specify stakeholders’ duties for medical waste treatment (The government of Wuhan, 2020; Chen et al., 2021). Municipal agencies, medical authorities, and non-governmental organizations (NGOs) collect, transport, and manage medical wastes in Dhaka. However, these stakeholders’ capacities are insufficient to meet the current issues related to garbage collection, transportation, and environmentally friendly waste disposal (Faisal et al., 2021). To adopt new approaches to a state-of-the-art, safe, and cost-effective MW management system in Dhaka city, hospital administration, local authorities, and other NGOs must work together and quickly (Faisal et al.,2021).
The survey questionnaire that we undertook in our research was from the viewpoint of consumers at the household level only. Future research on this subject of interest must consider many different variables and they should consider the viewpoint of COVID-19 waste management from existing hospitals and existing informal sector in Bangladesh. Also taking into consideration the waste management at different levels like- urban, rural, etc. can help foster more accurate results.
1. Acharya, A., Bastola, G., Modi, B., Marhatta, A., Belbase, S., Lamichhane, G., Gyawali, N., & Dahal, R. K. (2021). The impact of COVID-19 outbreak and perceptions of people towards household waste management chain in Nepal. Geoenvironmental Disasters, 8(1). https://doi.org/10.1186/s40677-021-00188-w
2. Asian Development Bank (ADB), 2020. Managing infectious medical waste during the COVID- 19 pandemic. https://www.adb.org/publications/managing-medical-waste-covid19
3. Bangladesh Bank. (2021). Monetary Policy Statement - Fiscal Year 2021–2022. Monetary Policy Department , Bangladesh Bank. https://www.bb.org.bd/en/index.php/monetaryactivity/monetarypolicy
4. Bharat, G. K., Adam, H. N., & Noklebye, E. (2021, February 24). A Sustainable Development Agenda: Plastic and Biomedical Waste Post COVID-19. TERI. Retrieved November 1, 2021, from https://www.teriin.org/article/sustainable-development-agenda-plastic-and-
References
254 16th SOUTH ASIAN MANAGEMENT FORUM (SAMF) 2021
biomedical-waste-post-COVID-195. Bherwani, H., Gautam, S., & Gupta, A. (2021). Qualitative and quantitative analyses of
impact of COVID-19 on sustainable development goals (SDGs) in Indian subcontinent with a focus on air quality. International Journal of Environmental Science and Technology, 18(4), 1019–1028. https://doi.org/10.1007/s13762-020-03122-z
6. Chen, C., Chen, J., Fang, R., Ye, F., Yang, Z., Wang, Z., Shi, F., & Tan, W. (2021). What medical waste management system may cope With COVID-19 pandemic: Lessons from Wuhan. Resources, Conservation and Recycling, 170. https://doi.org/10.1016/j.resconrec.2021.105600
7. Dutta, S., & Bhaskar, S. (2018, January 4). World Toilet Day 2017: India Fares Worse Than China And Bangladesh As More Than Half The Population Still Lacks Access To Basic Sanitation, WaterAid Report. NDTV-Dettol Banega Swasth Swachh India. Retrieved November 7, 2021, from https://swachhindia.ndtv.com/world-toilet-day-2017-india-fares- worse-than-china-and-bangladesh-as-more-than-half-the-population-still-lacks-access-to- basic-sanitation-wateraid-report-14957/
8. Fadare, O. O., & Okoffo, E. D. (2020b). COVID-19 face masks: A potential source of microplastic fibers in the environment. Science of The Total Environment, 737, 140279. https://doi.org/10.1016/j.scitotenv.2020.140279
9. Faisal, G., Hoque, M., Rahman, M., & Islam, M. (2021). Challenges in medical waste management amid COVID-19 pandemic in a megacity Dhaka. Journal of Advanced Biotechnology and Experimental Therapeutics, 4(1), 106. https://doi.org/10.5455/jabet.2021.d111
10. HCWH. Health Care Waste Management and the Sustainable Development Goals (SDGs). (2020). Available online at: https://noharm-global.org/issues/global/healthcare-waste- management-and-sustainable-development-goals
11. Hikmet, A., 2020. Waste pickers: we cannot make ends meet only with food aid. Retrieved from https://buff.ly/2X83iGb (accessed 28 November 2021).
12. HubeiDaily, 2020a. Wuhan chemical industry district tax service helps renewable energy enterprises to get 1.38-million-yuan policy dividend. http://news.hubeidaily.net/w eb/1512/202012/01/791164.html. (Accessed 16 December 2020).
13. HubeiDaily, 2020b. Wuhan qianzishan medical waste disposal plant and other 13 projects have started. http://news.cnhubei.com/content/2020-09/23/content_1335 4029.html. (Accessed 16 December 2020)
14. Islam, S. M. D. U., Safiq, M. B., Bodrud-Doza, M., & Mamun, M. A. (2020). Perception and Attitudes Toward PPE-Related Waste Disposal Amid COVID-19 in Bangladesh: An Exploratory Study. Frontiers in Public Health, 8. https://doi.org/10.3389/fpubh.2020.592345
15. Islam, S.M.D., Bhuiyan, M.A.H., 2016. Impact scenarios of shrimp farming in coastal region of Bangladesh: an approach of an ecological model for sustainable management.
16. Aquacult. Int. 24 (4), 1163–1190.17. Islam, S.M.D., Azam, G., 2015. Seasonal variation of physicochemical and toxic properties
in three major rivers; Shitalakhya, Buriganga, and Turag around Dhaka city, Bangladesh. J. Biodivers. Environ. Sci. 7 (3), 120–131.
18. Oyedotun, T. D. T., Kasim, O. F., Famewo, A., Oyedotun, T. D., Moonsammy, S., Ally, N., & Renn-Moonsammy, D. M. (2020). Municipal waste management in the era of COVID- 19: Perceptions, practices, and potentials for research in developing countries. Research in Globalization, 2, 100033. https://doi.org/10.1016/j.resglo.2020.100033
25516th SOUTH ASIAN MANAGEMENT FORUM (SAMF) 2021
19. Paul, T. C. (2021, May 7). What COVID-19 means for SDGs in Bangladesh. The Financial Express. https://www.thefinancialexpress.com.bd/views/what-COVID-19-means-for- sdgs-in-bangladesh-1620407527
20. Rahman, M.M., Bodrud-Doza, M., Griffiths, M.D., Mamun, M.A., 2020. Biomedical Waste amid COVID-19: Perspectives from Bangladesh. The Lancel Global Health
21. Ririh, K. R., & Ariyani, L. (2021). The Effects of Intention and Risk Awareness on Household Waste Management Behavior During COVID-19 Outbreak. Jurnal Ilmiah Teknik Industri, 20(1), 32–44. https://doi.org/10.23917/jiti.v20i1.13758
22. Rume, T., & Islam, S. D. U. (2020b). Environmental effects of COVID-19 pandemic and potential strategies of sustainability. Heliyon, 6(9), e04965. https://doi.org/10.1016/j.heliyon.2020.e04965
23. R. Djalante, R. Shaw, A. DeWit, Prog. Disaster Sci. 6, 100080 (2020). 12.United Nations, ”Sustainable development goal 11: Make cities and human settlements inclusive, safe, resilient, and sustainable” (2020)
24. Saadat, S. Y. (2021, January 23). COVID-19 and SDG 13: Countering Climate Change. The Daily Star. https://www.thedailystar.net/opinion/news/COVID-19-and-sdg-13- countering-climate-change- 032701?fbclid=IwAR1S0VSoU_EcV86vIquVdpQdeOG1er_TMm5ejP7pQpuAlX8HYO 5gk-FRlKM
25. Singh, V., & Mishra, V. (2021, September 1). Environmental impacts of coronavirus disease 2019 (COVID-19). PubMed Central (PMC). https://www.ncbi.nlm.nih.gov/pmc/articles/PMC8226008/#bb0020
26. Somani M., Srivastava A.N., Gummadivalli S.K., Sharma A. Indirect implications of COVID-19 towards sustainable environment: an investigation in Indian context. Biores. Technol. Rep. 2020;11 doi: 10.1016/j.biteb.2020.100491
27. Suthar, H. (2021, May 14). Phenomenal Increase in Medical Waste Amid Second Covid Wave Poses Challenge For Surat. News18. https://www.news18.com/news/india/phenomenal- increase-in-medical-waste-amid-second-covid-wave-poses-challenge-for-surat- 3736925.html
28. The Hindu. (2021, August 18). NIIST develops system for safe medical waste disposal. The Hindu. https://www.thehindu.com/news/national/kerala/niist-develops-system-for-safe- medical-waste-disposal/article35983886.ece
29. The government of Wuhan, 2019a. Wuhan overview. http://www.wuhan.gov.cn/zjwh/. (Accessed 4 November 2021).
30. The government of Wuhan, 2019b. Wuhan Social Services - Health. http://www.wuhan. gov.cn/zjwh/shsy/202003/t20200316_976491.shtml. (Accessed 4 December 2020).
31. The government of Wuhan, 2020. Wuhan domestic waste classification management regulations Times of India. (2020, December 3). Surat tackles Covid waste best: Study. The Times of India. https://timesofindia.indiatimes.com/city/surat/surat-tackles-covid-waste-best- study/articleshow/79535782.cms
32. US FDA, 2020. Surgical Mask and Gown Conservation Strategies - Letter to Health Care Providers. https://www.fda.gov/medical-devices/letters-health-care-providers/surgical- mask-and-gown-conservation-strategies-letter-health-care-providers (accessed 29 November 2021)
33. World Bank. (2021, October 3). Overview. Retrieved November 22, 2021, from https://www.worldbank.org/en/country/bangladesh/overview#1
34. Worldometer. (2021, November 29). Bangladesh COVID: 1,575,784 Cases and 27,978
256 16th SOUTH ASIAN MANAGEMENT FORUM (SAMF) 2021
Deaths -35. Worldometer. Retrieved November 29, 2021, from https://www.worldometers.info/
coronavirus/country/bangladesh/36. You, S., Sonne, C. and Ok, Y. S. (2020) COVID-19’s unsustainable waste management.
Science, 368(6498), p. 1438. (doi: 10.1126/science.abc7778)37. Yuan, X., Wang, X., Sarkar, B. et al. The COVID-19 pandemic necessitates a shift to a plastic
circular economy. Nat Rev Earth Environ 2, 659–660 (2021). https://doi.org/10.1038/s43017-021-00223-2
38. Zambrano-Monserrate, M.A., Ruanob, M.A., Sanchez-Alcalde, L., 2020. Indirect effects of COVID-19 on the environment. Sci. Total Environ. 728, 138813
25716th SOUTH ASIAN MANAGEMENT FORUM (SAMF) 2021
An advertisement, a notice or announcement placed in a public medium with the intent of promoting a service, product, or event, and innovative advertising, of course, plays a critical role in influencing consumers’ acceptance of fast sports accessories. In order to reach audiences more efficiently, the advertising industry is shifting away from conventional media and toward digital media. The sports accessories industry is experiencing a boom. Quick accessories are in high demand because they are convenient and fit into consumers’ lifestyles. With Indian consumers’ changing lifestyles, more educated and affluent people are more likely to buy, especially at brands that are promoting sports accessories. Customers have a range of accessory patterns and brands to choose from, in addition to the highly promoted media and information technology visibility. In the given circumstance, this study aims to look into the impact of creative ads on customers’ acceptance as well as the most important factors that affect their acceptance.This research was carried out in a few selected sports accessories showrooms in Bangalore
Shopping malls. The sampling technique used in this analysis was convenience sampling. The survey questionnaire was used to collect data in this study. Descriptive and predictive approaches were used to analyze the data obtained. Descriptive analysis was used to assess the gender, age group, Occupation, and Income. The frequency is used to get the results. The influence of the independent and dependent variables, namely creative ads and social media members’ (consumers) acceptance, was determined using multiple linear regression
Mallieswari R,Ramaiah Institute of the Management, Bangalore
Keywords: Innovative Advertising. Lifestyles, Social Media, Customers’ Acceptance, Sports Accessories
Creative media advertising is a new type of out-of-the-box marketing communication in which the medium is carefully selected to convey information about the business. Advertisers can use it as a tactic to stand out and develop effective commercials. Many advertisers’ questions nowadays may be answered by creative media advertising. It introduces a novel advertising format that captures consumers’ attention. Creative advertising is an advertising approach in which a non-traditional medium is employed in a unique way for the goal of advertising.Interactive media advertising is one type of innovative marketing information exchange that
can be differentiated from others: using an innovative medium allows marketers to emphasize specific aspects of their brand. Dahlén (2005) was the first to apply the theory of innovative media advertising. He described an innovative medium as a non-traditional, unique form of media that wants to communicate the message inherently.
Most significantly, the platform will not only be novel but it should also be selected to convey the message specifically. There must be a clear connection between the brand’s concept and the media that consumers can recognize.
Introduction
Abstract
MODELING OF CREATIVE ADVERTISING IMPACT ON SOCIAL MEDIA MEMBERS’ ACCEPTANCE OF SPORTS ACCESSORIES
258 16th SOUTH ASIAN MANAGEMENT FORUM (SAMF) 2021
Review of literature
Social Media Members’ Acceptance of Sports Accessories
A straw marketing a yoga center displaying a woman raising her hands upon the stretching portion of the straw is an example of a creative medium. Whenever the straw is stretched, she bends over, implying that joining a yoga center will make one more flexible (Eelen& Seiler, 2015).
Interactive media promotion differs from other sorts of unusual brand communication in two ways: it uses a medium that was not initially thought a typical medium for advertising and it reinforces the key selling points. Creative advertising can be used as a means of viral marketing. There can be an overlap between the concepts of street marketing and creative media advertisements, but they are not the same. Creative media advertisements can be an instance of street marketing when encountered outdoors, but not all street marketing actions are creative media advertisements. Various studies found that the effect of creative media advertising on the consumers’ responses
shows is positive; creative messages get more attention and lead to positive attitudes about the products being marketed. A creative advertisement is artistic, professionally done, and has original ideas. Smith and Yang (2004) argue in a research article that sales promotion helps to capture better attention of the customer since differentiation provides a distinction with far fewer ad campaigns. According to practitioners, the only characteristic that differentiates promotion from a salesperson’s
blunt and frequently useless pitch is creativity. It is also noted that watching TV can offer the greatest possibility for creative advertising. Ideally, both the creative and the intended audience need to view an advertisement as creative. Subsequently, advertising has core competencies to become more effective because effective marketing communications have become an essential part of a firm’s success in introducing and promoting products and services. Advertisers’ use of criteria such as recreation and attractiveness advertising determines the effectiveness of their advertising.There is great interest in understanding advertising creativity and its capacity to generate attention,
awareness, or a favorable attitude toward the advertised brand. Creativity helps advertising to convey the message differently, depending on the medium in which it is developed. According to the perception of unexpectedness, creativity in advertising is also defined as an act that can produce an effective surprise. Creative advertising positively affects advertising effectiveness. Ideally, both the creative and the intended audience need to view an advertisement as creative.
Multiple authors have characterized sports marketing over the years. Sports accessories marketing, according to Beech and Chadwick (2007), is “an evolving process in which competitions with an unknown outcome are showcased in order to maximize the potential for the concurrent accomplishment of primary and secondary objectives among sport accessories shoppers, sport accessories businesses, and other associated individuals and institutions.” Individuals are subjected to sports accessories marketing practically always, from these authors, whether they are reading the news or tabloid, viewing sports television programs, or merely walking along the street through promotional communication means such as signage and advertisements. To assess the influence of social media in the field of sports marketing, Gaurav Kumar Gadiraju (2016) accomplished a thorough examination of sports marketing and the growing popularity of social media marketing for sports brands around the world. Nike, Inc. is one such company. This company’s focus has shifted to digital marketing. As social media marketing became more popular, traditional marketing methods such as print, radio, and television began to fade away. The study focuses on the evolution of marketing techniques from traditional to digital over time.
25916th SOUTH ASIAN MANAGEMENT FORUM (SAMF) 2021
Creative Media Advertising
Background of the Study
Sports firms today rely on social media and digital marketing for their continued growth and success, knowing that social media acts as a platform for players and spectators to interact with their favorite sports. (NayanaNimkar and Rattan Singh, 2020). The way players, coaches, clubs, federations, sports firms, and other industry actors engage has changed as a result of social media. While research study on the usage of social media and the impact of sport has increased in recent years, digital platforms have not been studied from a bibliometric standpoint. As a result, this study used descriptive bibliometric software to investigate the scientific production of social media in sports (López-Carril, S, et al, 2020).
Creativity plays a very important role in capturing the attention of the people, which promotes the selling of a product through advertising, where illustration and photographs are some elements required to carry that message to the target audience. However, these creative advertisements sometimes cannot make the desired persuasion due to a lack of definite advertising appeal. The advertisement campaign is an evaluation that attempts to establish a link between the things offered and the goal that viewers have. Attention is enhanced if the type of creativity used is directly related to the product that is being promoted, therefore increasing advertising effectiveness and gaining positive responses.
With this background, the present study has been undertaken to understand the influence of creativity in advertisements for sports accessories through social media members.
Creative media marketing could be the response to many advertisers’ concerns these days. It introduces a novel advertising structure that captures customers’ attention despite an overabundance of marketing communications known as ‘advertising clutter’ (Rauwers and Van Noort 2015). Consumers’ opinions toward advertising have gotten progressively negative over time as a result of this advertising congestion ((Speck and Elliott 1997). The use of CM ads may be able to mitigate these detrimental impacts. A CM ad is placed on a media channel that is (1) not usually utilized for advertising and (2) has a strong association with the advertised brand (Dahl en 2005). Because CM commercials are not displayed in typical advertising mediums such as newspapers, they may be more difficult to recognize as advertisements (Obermiller, Spangenberg, and MacLachlan 2005), resulting in positive advertising impacts.
A rising body of research (Meijers, Eelen, and Voorveld 2016) reveals that CM advertising outperforms conventional media advertising (TM advertising) in terms of boosting affective and behavioral reactions (Dahl en, Friberg and Nilsson 2009; Meijers et al. 2016). By focusing on three key issues that have not been adequately addressed in previous research, this study adds to the current understanding of the effects of CM advertising. The study’s initial goal is to replicate and extend prior findings by looking at the impact of CM advertising in a real-world scenario. This is critical in presenting a true experience to customers, as a real experience prompts people to think more deeply about the advertisement and allows them to use environmental signals to figure out the medium-brand relationship (Rauwers and Van Noort 2015). Creative media advertising (CMA) is a marketing technique in which a non-traditional medium is used creatively for advertising. Marketers are interested in this unique advertising tactic, but little is known about its persuasive impact on consumers’ cognitive, emotive, and behavioral responses, as well as the mechanisms that underpin them (FabienneRauwers et al, 2018).
260 16th SOUTH ASIAN MANAGEMENT FORUM (SAMF) 2021
Creativity can enhance positive attitudes toward the product being promoted, which grabs the attention and interest of the social media members but at the same time, it may fail to give a clear message related to the product. The study also analyses the reaction of the social media members toward creative advertising of sports accessories.
• How do creative advertisements affect social media members’ acceptance of sports accessories?• What would be the influence of creative advertisements on social media members buying
behavior toward sports accessories?
The study focused on social media users who bought sports equipment from 10 different sports accessories stores in selected shopping malls in Bangalore, India.
This study reveals several limitations and shortages, rationale including the use of stratified random sampling in future studies, which is more directly applicable and capable of conducting a countrywide investigation. In terms of the measurement challenge, future studies may utilize many items to strengthen their social media member’s acceptance of sports accessories to get better reliability.
The sample size for this study was determined following the rule of thumb. Uma Sekeran (2000) advised that for most studies, sample sizes of greater than 30 but fewer than 500 should be used. As a result, the sample size for this study has been set at 250. A simple selection of 50 responders was made from ten Sports Accessories showrooms in a mall in Bangalore, India.
The survey is divided into two sections: part A, which asks about innovative advertising and customer approval, and section B, which asks about social media members’ acceptance of sports accessories. In Section B, the responders’ demographic profile was requested. For the demographic section, a nominal scale was employed. The Likert scale has also been used for additional questions in the questionnaire’s section A. The questions have five response options, ranging from strongly disagree to strongly agree on a scale of 1 to 5, with 1 being the most strongly disagreed with and 5 representing the most strongly agreed with. The respondent should check the levels on the questions.
In order to examine creative advertising’s impact on social media member’s acceptance of sports accessories, the hypothesis of this study is as follows: H0: The acceptability of sports accessories by social media members is not impacted by creative
advertising.H1: The acceptability of sports accessories by social media members is impacted by creative
advertising.
Research Questions
Hypothesis
Methodology
Study Limitations
Sampling
Measurements
Scope of the study
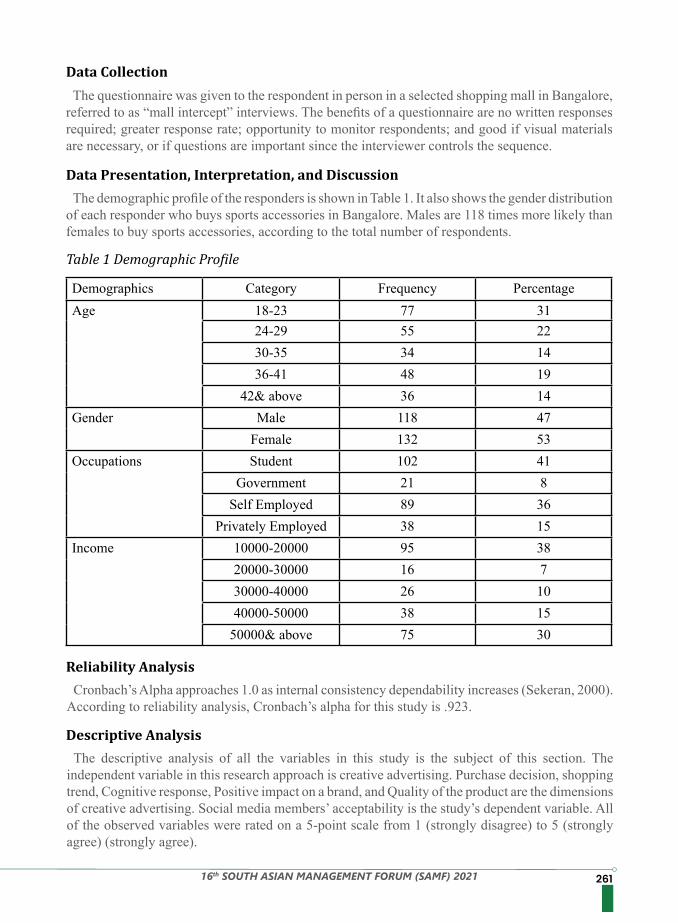
26116th SOUTH ASIAN MANAGEMENT FORUM (SAMF) 2021
The questionnaire was given to the respondent in person in a selected shopping mall in Bangalore, referred to as “mall intercept” interviews. The benefits of a questionnaire are no written responses required; greater response rate; opportunity to monitor respondents; and good if visual materials are necessary, or if questions are important since the interviewer controls the sequence.
The demographic profile of the responders is shown in Table 1. It also shows the gender distribution of each responder who buys sports accessories in Bangalore. Males are 118 times more likely than females to buy sports accessories, according to the total number of respondents.
Cronbach’s Alpha approaches 1.0 as internal consistency dependability increases (Sekeran, 2000). According to reliability analysis, Cronbach’s alpha for this study is .923.
The descriptive analysis of all the variables in this study is the subject of this section. The independent variable in this research approach is creative advertising. Purchase decision, shopping trend, Cognitive response, Positive impact on a brand, and Quality of the product are the dimensions of creative advertising. Social media members’ acceptability is the study’s dependent variable. All of the observed variables were rated on a 5-point scale from 1 (strongly disagree) to 5 (strongly agree) (strongly agree).
Data Collection
Data Presentation, Interpretation, and Discussion
Reliability Analysis
Descriptive Analysis
Table 1 Demographic Profile
Demographics Category Frequency PercentageAge 18-23 77 31
24-29 55 2230-35 34 1436-41 48 19
42& above 36 14Gender Male 118 47
Female 132 53Occupations Student 102 41
Government 21 8Self Employed 89 36
Privately Employed 38 15Income 10000-20000 95 38
20000-30000 16 730000-40000 26 1040000-50000 38 15
50000& above 75 30
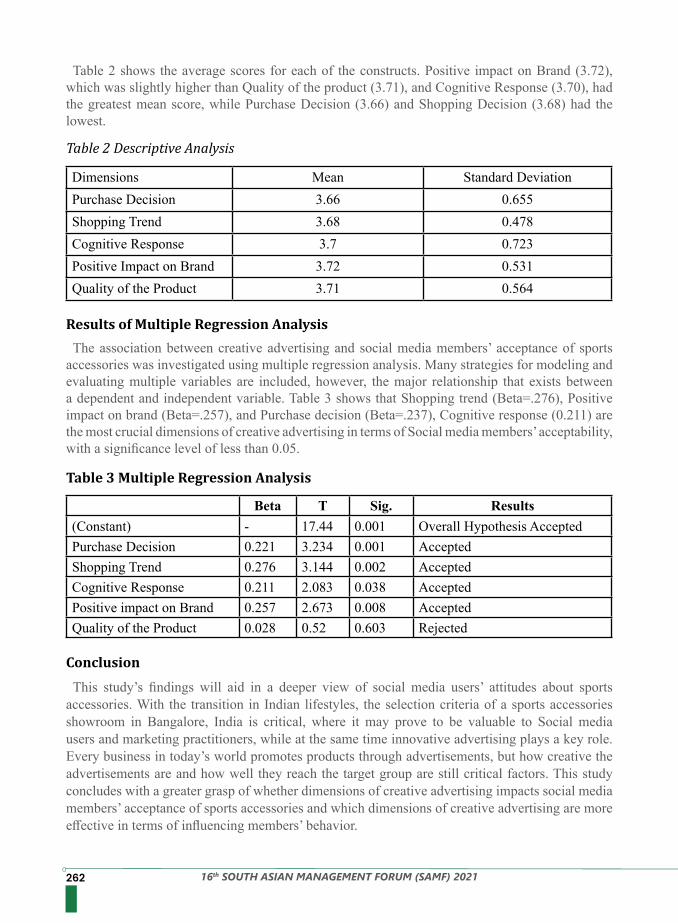
262 16th SOUTH ASIAN MANAGEMENT FORUM (SAMF) 2021
Table 2 shows the average scores for each of the constructs. Positive impact on Brand (3.72), which was slightly higher than Quality of the product (3.71), and Cognitive Response (3.70), had the greatest mean score, while Purchase Decision (3.66) and Shopping Decision (3.68) had the lowest.
The association between creative advertising and social media members’ acceptance of sports accessories was investigated using multiple regression analysis. Many strategies for modeling and evaluating multiple variables are included, however, the major relationship that exists between a dependent and independent variable. Table 3 shows that Shopping trend (Beta=.276), Positive impact on brand (Beta=.257), and Purchase decision (Beta=.237), Cognitive response (0.211) are the most crucial dimensions of creative advertising in terms of Social media members’ acceptability, with a significance level of less than 0.05.
Table 2 Descriptive Analysis
Dimensions Mean Standard DeviationPurchase Decision 3.66 0.655Shopping Trend 3.68 0.478Cognitive Response 3.7 0.723Positive Impact on Brand 3.72 0.531Quality of the Product 3.71 0.564
Results of Multiple Regression Analysis
Table 3 Multiple Regression Analysis
Beta T Sig. Results(Constant) - 17.44 0.001 Overall Hypothesis Accepted Purchase Decision 0.221 3.234 0.001 Accepted Shopping Trend 0.276 3.144 0.002 Accepted Cognitive Response 0.211 2.083 0.038 Accepted Positive impact on Brand 0.257 2.673 0.008 Accepted Quality of the Product 0.028 0.52 0.603 Rejected
This study’s findings will aid in a deeper view of social media users’ attitudes about sports accessories. With the transition in Indian lifestyles, the selection criteria of a sports accessories showroom in Bangalore, India is critical, where it may prove to be valuable to Social media users and marketing practitioners, while at the same time innovative advertising plays a key role. Every business in today’s world promotes products through advertisements, but how creative the advertisements are and how well they reach the target group are still critical factors. This study concludes with a greater grasp of whether dimensions of creative advertising impacts social media members’ acceptance of sports accessories and which dimensions of creative advertising are more effective in terms of influencing members’ behavior.
Conclusion
26316th SOUTH ASIAN MANAGEMENT FORUM (SAMF) 2021
Furthermore, the research can provide insight into how the industry can create a good advertisement with useful dimensions. Consumers may receive benefits such as a good value for their money while purchasing a variety of sports accessories that meet their expectations, and a pleasant experience with each visit. Based on the findings, it is possible to conclude that creative advertising has an impact on social media members’ acceptance of the sports accessories industry, which is supported by an overall significant value of 0.001.Overall, this study demonstrates that creative advertising influences customers’ acceptance.
However, product quality is insignificant in terms of customers’ acceptance. The shopping trend with the highest beta value indicates the most important dimension to consider. When creating advertisements for their businesses, the sports accessories industry should prioritize this dimension.
1. Amabile, T. M. (1996). Creativity in context. Boulder: Westview.2. Batra, R., &Stayman, D. M. (1990). The role of mood in advertising effectiveness.Journal of
Consumer Research, 17, 203–2143. Wang et al. (2002). Understanding consumers’ attitude toward advertising. In EightAmericas
Conference on Information Systems, pages 1143–11484. Clow, K., Roy, D. and Baack, D. (2001) ‘Content Analysis of Creative MessageStrategies in Service
Advertisements’, in Charles R. Taylor (ed.) The Proceedings of the 2001 Conference of the American Academy of Advertising, pp. 48–55. Villanova, PA: American Academy of Advertising.
5. Deshpande, R., &Stayman, D. (1994). A tale of two cities: Distinctiveness theory and advertising effectiveness. Journal of Marketing Research, 31, 57–64.
6. Doug Stayman (1994). “A Tale of Two Cities: Distinctiveness Theory and Advertising Effectiveness.” Journal of Marketing Research, 31(January), 57-64.
7. Duke, L. (2000). ‘Like an Idea, Only Better: How Do Advertising Educators and Practitioners Define and Use the Creative Concept?’, in Mary A. Shaver (ed.) The Proceedings of the 2000 Conference of the American Academy of Advertising, pp.114–15.East Lansing, MI: American Academy of Advertising
8. Eelen, J., Rauwers, F., Wottrich, V. M., Voorveld, H. A., & van Noort, G.(forthcoming). Consumer Responses to Creative Media Advertising: A Literature Review. In P. De Pelsmacker (Ed.), Advertising in new formats and media: Current research and implications for marketers. Emerald Publishing.
9. Forehand, M, R., & Rohit, D. (1997). “Elicited Distinctiveness and TargetedAdvertising Response,” working paper. The University of Washington.
10. Gulas, C. S & Weinberger, M. E. (2006). Humor in advertising: A comprehensive analysis. Book of Harvard business review, Journal of Advertising, 34(3), 47–57.
11. Holbrook, M., &Batra, R. (1987). Assessing the role of emotions as mediators of consumer responses to advertising. J Consum Res; 14, 404–20
12. Moraga-González, J. L. (2000). Quality uncertainty and informative advertising.International Journal of Industrial Organization, 18(4), 615-640.
13. Kennedy, A. J. (1972). “An Experimental Study of the Effect of Humorous MessageContent upon Ethos and Persuasiveness.” Ph. D. dissertation, University of Michigan
14. Kim, H. G., & Leckenby, J. (2002). ‘Creative Factors in Interactive Advertising’, In Avery M. Abemethy (ed.). The Proceedings of the 2002 Conference of the AmericanAcademy of Advertising, pp. 58–63. Auburn, AL: American Academy of Advertising.
15. Kover et al. (1995). “Creativity Vs. Effectiveness? An Integrative Classification for Advertising.”
References
264 16th SOUTH ASIAN MANAGEMENT FORUM (SAMF) 2021
Journal of Advertising Research, 35(November/December), 29–38.16. Lampton, W. E. (1971). “The Effect of Humor in Persuasivel Sermon.” Paper presented at Speech
Communication Association, San Francisco.17. Lavidge, R. J., & Steiner, G. A. (1961). A model for predictive measurements of advertising
effectiveness. Journal of Marketing, 25(6), 59–62.18. MacKenzie, S. B. (1986). The role of attention in mediating the effect of advertising on attribute
importance. J. Consumer Res., 13(2), 174–195.19. MacKenzie et al. (1986). The role of attitude toward the ad as a mediator of advertising effectiveness:
A test of competing explanations. J. Marketing Res.,23(May), 130–143.20. Mattsson, J., &Helmersson, H. (2007). ‘Eating Fast Food: Attitudes of High School Students’.
International Journal of Consumer Studies, 31(1), 117-121.21. Olney et al. (1991). Consumer responses to advertising: the effects of ad content, emotions and
attitude toward the ad on viewing time. J Consum Res., 17(March),440–53.22. Olney et al. (1991). Consumer responses to advertising: The effects of ad content, emotions, and
attitude toward the ad on viewing time. Journal of Consumer Research,17, 440–45323. Perreault, R. M. (1972). “A Study of the Effects of HuMor in Advertising as Can BeMeasured by
Product Recall Tests.” M.A. thesis, University of, Georgia.24. Pieters et al. (2002). Breaking through the clutter: Benefits of advertisement originality and
familiarity for brand attention and memory. Management Sci., 48(6)765–781.25. Rattan Singh, andNayanaNimkar (2020), Digital Marketing and Social Media: The Growth of
Sports Industry in India, Digital marketing and social media in sports industry , Vol. 23 Issue 1726. Reid et al. (1998). ‘Top-Level Agency Creatives Look at Advertising Creativity Then and Now’.
Journal of Advertising, 27(Summer), 1–1527. Smith et al. (2008). The impact of advertising creativity on the hierarchy-of-effects.J. Advertising,
37(4), 47–61.28. Smith et al. (2007). Modeling the determinants and effects of creativity in advertising. Marketing
Sci., 26(6), 819–833.29. Sternberg, R. J. (1999). The Handbook of Creativity. Cambridge: CambridgeUniversity Press.30. Sternthal, B., and Craig, C. S. (1973). “Humor in Advertising.” Journal of Marketing,37(October),
12-18.31. Svetlik, J. (2012). The Essence of Advertising (1st Edition). Bratislava: Eurokódex.Tellis, G. J.
(2004). Affective Advertising: Understanding When, How and WhyAdvertising Works (Marketing for a New Century). Thousand Oaks: Sage Publications.
32. Till, B. D., &Baack, D. W. (2005). “Recall and Persuasion Does Creativity Matter? Journal of Advertising, 34(3), 47-57.
33. Wilcock et al. (2004). ‘Consumer Attitudes, Knowledge and Behavior: A Review of Food Safety Issues.’ Trends in Food Science. & Technology, 15, 56-66.
34. Xiaojing, Y. (2004). “Toward a General Theory of Creativity in Advertising: Examining the Role of Divergence.” Marketing Theory, 4(1/2), 29–55.
35. Yap, S. F., & Kew, M. L. (2007). Service quality and customer satisfaction: antecedents of customer repatronage intentions. Sunway Academic Journal, 4, 59-73.Zhang et al. (2002)
36. Zhang, Y. (1996). Responses to humorous advertising: the moderating effect of need for cognition. J Advert., 25, 15–32.
37. Zinkhan, G. M. (1993). ‘Creativity in Advertising: Creativity in the Journal ofAdvertis-ing.’ Journal of Advertising, 22(June), 1–4.
26516th SOUTH ASIAN MANAGEMENT FORUM (SAMF) 2021
This paper summarizes the outcomes of a study that investigated the aspects that encourage customers or discourage them to shop online. In order to obtain validated and accurate results, the study combined consumers’ perceived risk with the Theory of Planned Behavior (TPB). There is various research that looks into elements that influence consumer behavior without taking into account the consumers’ perceived risks. This study, on the other hand, looked at both internal and external factors that influence internet shopping. Samples from different social classes have been considered and analyzed in updated statistical software. Customers’ feedback was obtained using a pre-structured validated questionnaire, and a total of 338 responses from Bangladesh were collected. The structural Equation Model (SEM) was used to verify the presented hypotheses and model. Consumers’ intention to shop online is strongly influenced by perceived risk, consumer attitude, perceived behavioral control, and subjective standards, according to the findings.
Md Raju Biswas, Faculty of Economics and Management, Dalian University of Technology Yu Jingtao, Associate Professor , School of Economics and Management, Dalian University of Technology, ChinaMohammed Kamruzzaman, Assistant Professor , International University of Business Agriculture and Technology, Uttara, Dhaka
Online retailing has got rapid popularity among Bangladeshi consumers because of immense development in all aspects in recent years. Online retailing refers to buying dailies using online media. Online shopping accounted for 14.1% of the total worldwide retail business in 2019, which was 8.7% in 2016, and before the pandemic (COVID-19) it was expected that online retailing will reach 22% by 2023(Coppola, Jul 7, 2021), (McNair & Pearl, 2018). With the dramatic advancement of infrastructures, internet technologies, and logistics support, online shopping is rapidly being popularized in Bangladesh. Over the years, online shopping has got popularized so rapidly worldwide. Since this rising market has joined the most common form of shopping these days, the Bangladeshi market has been investigated for researching consumers’ online buying behavior in this project. Consumers in Bangladesh have begun to choose online buying over traditional methods of shopping in recent years (Saha et al., 2020).
Introduction
Abstract
AN EMPIRICAL STUDY BASED ON AN EXTENDED THEORY OF PLANNED BEHAVIOR: EXPLORING THE FACTORS INFLUENCE
CONSUMERS’ ONLINE BUYING INTENTIONS.
Keywords: Consumers, online buying behavior, factors affecting consumer’s behavior; Theory of Planned Behavior.
266 16th SOUTH ASIAN MANAGEMENT FORUM (SAMF) 2021
The current trend must continue beyond the pandemic phase. Beyond the pandemic, the internet sales trend will be entirely dependent on consumer behavior(Repko, 2021). Repko (2021) has stated that drastic changes are required in the e-commerce industry and that the risk connected with online retailing includes security issues, associate influence, and technological hurdles, which are the top concerns for consumers on the road. According to Alam (2020), the e-commerce business is battling distrust in companies, the chance of being tricked by fraudulent products, broken products, poor product quality, and the fear of not receiving products at all. In order to have a viable e-commerce business in Bangladesh, the President of Consumers Association of Bangladesh (CAB) recommended to address consumer concerns and take prompt action to alleviate negative consumer concerns(Mahmud, 2020).
This study took into account the Theory of Planned Behavior (TPB), which has been frequently used to analyze consumers’ psychology. Consumer behavior is influenced by both internal and external elements, most notably their attitude, environmental influence, and perceived behavioral control(Ajzen, 1991). To predict consumer attitudes, TPB used both internal and external elements (attitude, subjective norms, and perceived behavioral control) as antecedents. Based on the notion of planned behavior, Athiyaman (2002)and Laohapensang (2009)researched consumer behavior and found TPB workable. However, in order to increase the study’s robustness, the researchers included customers’ perceptions of risk as another antecedent, as risk connected with online purchases has a major impact on consumer behavior.
This paper is organized with a theoretical framework and hypothesis development, followed by hypothesis testing and analysis of the findings.
Scholars are found to use many theories to study consumers purchasing intentions. Consumers’ purchase intentions are influenced not just by the consumers themselves, but also by their surroundings. As the customer cannot touch or feel the product online, they prefer to listen who have experienced online shopping(Athiyaman, 2002). Furthermore, customers’ inclination to shop online is influenced by their attitude toward online purchasing(Athiyaman, 2002). One of the most popular theories for studying consumer purchasing behavior is the Theory of Planned Behavior (TPB)(Alam et al., 2020). TPB, which is a modification of the theory of reasoned action, asserts that a customer’s intention is influenced not just by the consumer but also by the environment. TPB includes both internal and external elements that may have an impact(Ajzen, 1991). Athiyaman (2002) and Laohapensang (2009) used the Theory of Planned Behavior to research consumers’ buying intentions, meanwhile, George (2002) used TPB to investigate the impact of privacy as well as trustworthiness on consumers’ decision to shop online. This study, however, introduced perceived risk as another element that influences customer decisions. Because internet shopping does not necessitate physical interaction, shoppers are more concerned about potential risks. They prefer to shop in traditional ways to minimize the risks connected with internet purchasing(Lee & Tan, 2003), which limits the acceptance of online shopping (Barnes et al., 2007). Consumers’ intention is mostly influenced by the risk connected to products and finance(Alam, 2020). The risk connected with internet purchases, according to Ariffin et al. (2018),Masoud (2013) , and Bhatnagar et al. (2000), works against the consumer’s decision. As a result, the following is our hypothesis in this regard:
Theoretical Framework and Hypothesis Development: Modified TPB towards intention to shop online:
26716th SOUTH ASIAN MANAGEMENT FORUM (SAMF) 2021
H1: Perceived risk will reduce consumers’ intention to shop online. Besides consumers’ intention, perceived risk also affects consumers’ attitudes to shopping online.
According to Schlosser (2003), a consumer’s perceived risk can result in a negative experience, which can directly influence the consumer’s attitude, which in turn affects the consumer’s motivation to shop online. A positive attitude assists customers in making positive decisions about any action, and a positive attitude can only be established when consumers have had no negative experiences with that behavior. As a result, depending on the risk, a favorable or unfavorable attitude toward the activity will be created(Bai et al., 2018). Consumer attitudes will be unfavorable if they make losses or the possibility of losses, according to San Martín and Camarero (2009). As a result, our second hypothesis is:H2: Perceived risk will have a negative impact on our attitude.
The individual’s evaluation, feelings, and preferences toward specific things are referred to as attitude. It’s also possible to say that a person’s feelings regarding things they enjoy or detest. The attitude, once shaped, is relatively resilient and stable. People’s resistance to anything decreases when they have a good attitude about it, and they actively think of ways to overcome some objective difficulties, making them feel like they have finished the behavior. The perceived difficulty of the task will diminish, while the perceived feasibility of the task will grow. Tommasetti et al. (2018) investigated the impact of risk connected with online buying on consumers’ propensity to shop online and discovered that consumers’ attitudes were negatively impacted by perceived risk. Belleau et al. (2007)discovered that customers who have a positive attitude are more likely to be inclined to buy products and services. As a result, our third hypothesis is as follows:H3: The attitude of consumers is significantly affecting the consumers’ intention to do online
shopping.
Subjective norms and attitudes have a direct impact on the intention to engage in any behavior. Some investigations have discovered that the surrounding environment has a direct impact on consumers’ attitudes, whereas the surrounding environment has an indirect impact on intentions (Bamberg et al., 2007); and (Bratt, 1999). Realistically, the people and environments around him have an impact on a person’s attitude(Petty & Cacioppo, 1996). Festinger (1954) claimed that forming an attitude toward a single object is difficult. Subjective norms have been found in certain research to have a direct impact on attitudes and an indirect impact on behavior intentions (Bamberg et al., 2007). They believe that the people around him influence a person’s attitude toward things and perception of the difficulties of completing them. In other words, everyone has a different attitude toward the same subject, which explains why there are so many mainstream concepts in society that most people follow and accept, and which are the consequence of individuals communicating and exchanging information. People frequently adopt matching attitudes as a result of the influence of their surroundings(Park & Ha, 2014). As a result, the following possibilities are proposed in this article:H4: Subjective norms will positively affect consumers’ attitudes towards online shopping.
A person with subjective initiative, according to the notion, has a particular amount of social cognition. Social cognition refers to how people think about themselves and the social world, or how they choose, perceive, comprehend, and apply social knowledge to create judgments and decisions(Ajzen, 1985). People’s social cognition, in other words, is the processing of social information by people in order to reflect on and change their conduct.
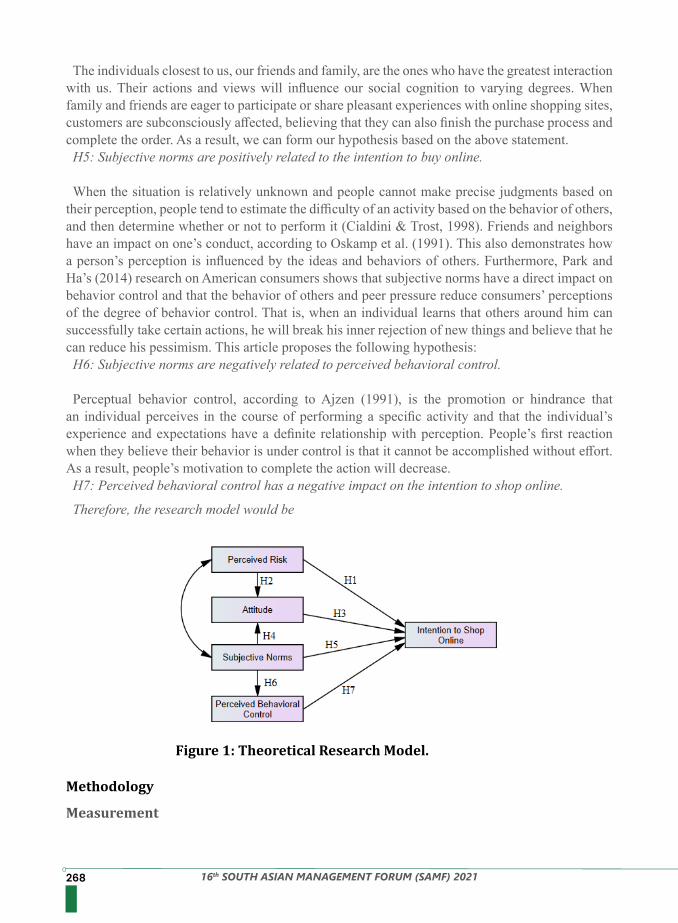
268 16th SOUTH ASIAN MANAGEMENT FORUM (SAMF) 2021
The individuals closest to us, our friends and family, are the ones who have the greatest interaction with us. Their actions and views will influence our social cognition to varying degrees. When family and friends are eager to participate or share pleasant experiences with online shopping sites, customers are subconsciously affected, believing that they can also finish the purchase process and complete the order. As a result, we can form our hypothesis based on the above statement. H5: Subjective norms are positively related to the intention to buy online.
When the situation is relatively unknown and people cannot make precise judgments based on their perception, people tend to estimate the difficulty of an activity based on the behavior of others, and then determine whether or not to perform it (Cialdini & Trost, 1998). Friends and neighbors have an impact on one’s conduct, according to Oskamp et al. (1991). This also demonstrates how a person’s perception is influenced by the ideas and behaviors of others. Furthermore, Park and Ha’s (2014) research on American consumers shows that subjective norms have a direct impact on behavior control and that the behavior of others and peer pressure reduce consumers’ perceptions of the degree of behavior control. That is, when an individual learns that others around him can successfully take certain actions, he will break his inner rejection of new things and believe that he can reduce his pessimism. This article proposes the following hypothesis:H6: Subjective norms are negatively related to perceived behavioral control.
Perceptual behavior control, according to Ajzen (1991), is the promotion or hindrance that an individual perceives in the course of performing a specific activity and that the individual’s experience and expectations have a definite relationship with perception. People’s first reaction when they believe their behavior is under control is that it cannot be accomplished without effort. As a result, people’s motivation to complete the action will decrease.H7: Perceived behavioral control has a negative impact on the intention to shop online.
Therefore, the research model would be
Figure 1: Theoretical Research Model.
Methodology
Measurement
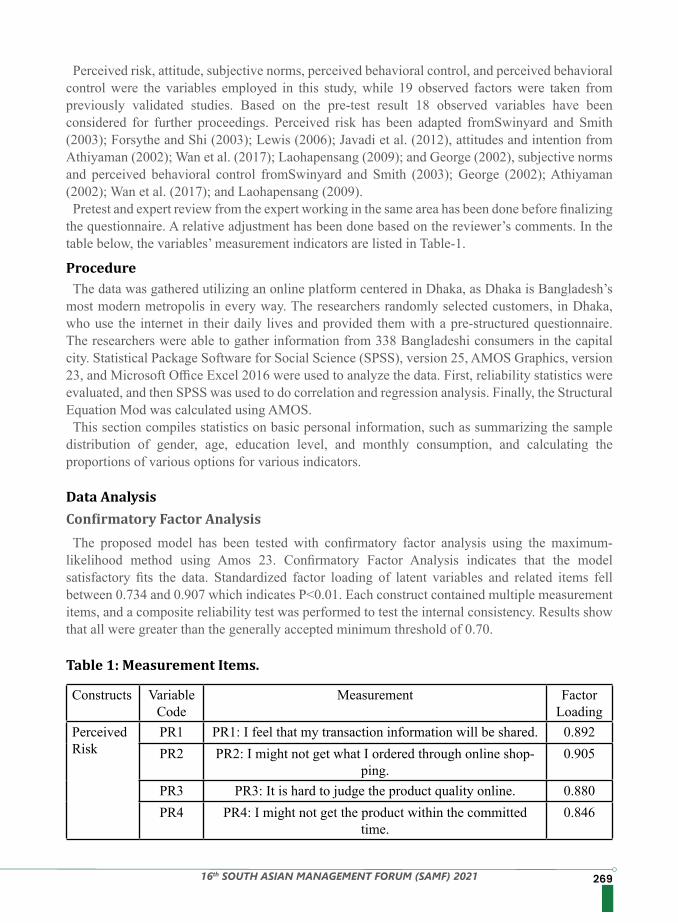
26916th SOUTH ASIAN MANAGEMENT FORUM (SAMF) 2021
Perceived risk, attitude, subjective norms, perceived behavioral control, and perceived behavioral control were the variables employed in this study, while 19 observed factors were taken from previously validated studies. Based on the pre-test result 18 observed variables have been considered for further proceedings. Perceived risk has been adapted fromSwinyard and Smith (2003); Forsythe and Shi (2003); Lewis (2006); Javadi et al. (2012), attitudes and intention from Athiyaman (2002); Wan et al. (2017); Laohapensang (2009); and George (2002), subjective norms and perceived behavioral control fromSwinyard and Smith (2003); George (2002); Athiyaman (2002); Wan et al. (2017); and Laohapensang (2009). Pretest and expert review from the expert working in the same area has been done before finalizing
the questionnaire. A relative adjustment has been done based on the reviewer’s comments. In the table below, the variables’ measurement indicators are listed in Table-1.
The data was gathered utilizing an online platform centered in Dhaka, as Dhaka is Bangladesh’s most modern metropolis in every way. The researchers randomly selected customers, in Dhaka, who use the internet in their daily lives and provided them with a pre-structured questionnaire. The researchers were able to gather information from 338 Bangladeshi consumers in the capital city. Statistical Package Software for Social Science (SPSS), version 25, AMOS Graphics, version 23, and Microsoft Office Excel 2016 were used to analyze the data. First, reliability statistics were evaluated, and then SPSS was used to do correlation and regression analysis. Finally, the Structural Equation Mod was calculated using AMOS.This section compiles statistics on basic personal information, such as summarizing the sample
distribution of gender, age, education level, and monthly consumption, and calculating the proportions of various options for various indicators.
The proposed model has been tested with confirmatory factor analysis using the maximum-likelihood method using Amos 23. Confirmatory Factor Analysis indicates that the model satisfactory fits the data. Standardized factor loading of latent variables and related items fell between 0.734 and 0.907 which indicates P<0.01. Each construct contained multiple measurement items, and a composite reliability test was performed to test the internal consistency. Results show that all were greater than the generally accepted minimum threshold of 0.70.
Procedure
Data Analysis
Table 1: Measurement Items.
Confirmatory Factor Analysis
Constructs Variable Code
Measurement Factor Loading
Perceived Risk
PR1 PR1: I feel that my transaction information will be shared. 0.892PR2 PR2: I might not get what I ordered through online shop-
ping. 0.905
PR3 PR3: It is hard to judge the product quality online. 0.880PR4 PR4: I might not get the product within the committed
time.0.846
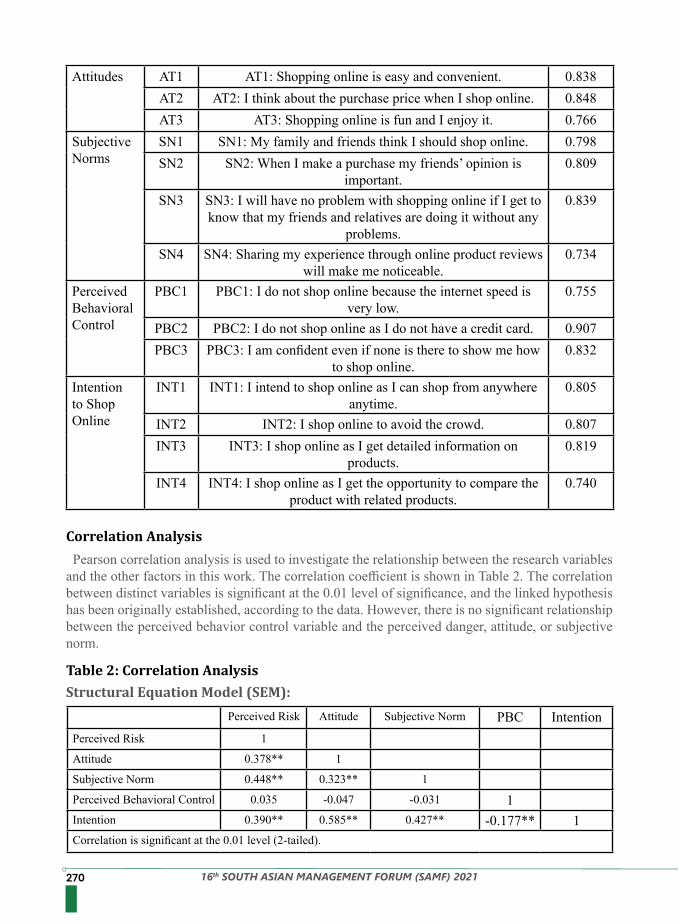
270 16th SOUTH ASIAN MANAGEMENT FORUM (SAMF) 2021
Correlation Analysis
Table 2: Correlation Analysis Structural Equation Model (SEM):
Pearson correlation analysis is used to investigate the relationship between the research variables and the other factors in this work. The correlation coefficient is shown in Table 2. The correlation between distinct variables is significant at the 0.01 level of significance, and the linked hypothesis has been originally established, according to the data. However, there is no significant relationship between the perceived behavior control variable and the perceived danger, attitude, or subjective norm.
Attitudes AT1 AT1: Shopping online is easy and convenient. 0.838AT2 AT2: I think about the purchase price when I shop online. 0.848AT3 AT3: Shopping online is fun and I enjoy it. 0.766
Subjective Norms
SN1 SN1: My family and friends think I should shop online. 0.798SN2 SN2: When I make a purchase my friends’ opinion is
important.0.809
SN3 SN3: I will have no problem with shopping online if I get to know that my friends and relatives are doing it without any
problems.
0.839
SN4 SN4: Sharing my experience through online product reviews will make me noticeable.
0.734
Perceived Behavioral Control
PBC1 PBC1: I do not shop online because the internet speed is very low.
0.755
PBC2 PBC2: I do not shop online as I do not have a credit card. 0.907PBC3 PBC3: I am confident even if none is there to show me how
to shop online.0.832
Intention to Shop Online
INT1 INT1: I intend to shop online as I can shop from anywhere anytime.
0.805
INT2 INT2: I shop online to avoid the crowd. 0.807INT3 INT3: I shop online as I get detailed information on
products.0.819
INT4 INT4: I shop online as I get the opportunity to compare the product with related products.
0.740
Perceived Risk Attitude Subjective Norm PBC IntentionPerceived Risk 1
Attitude 0.378** 1
Subjective Norm 0.448** 0.323** 1
Perceived Behavioral Control 0.035 -0.047 -0.031 1Intention 0.390** 0.585** 0.427** -0.177** 1Correlation is significant at the 0.01 level (2-tailed).
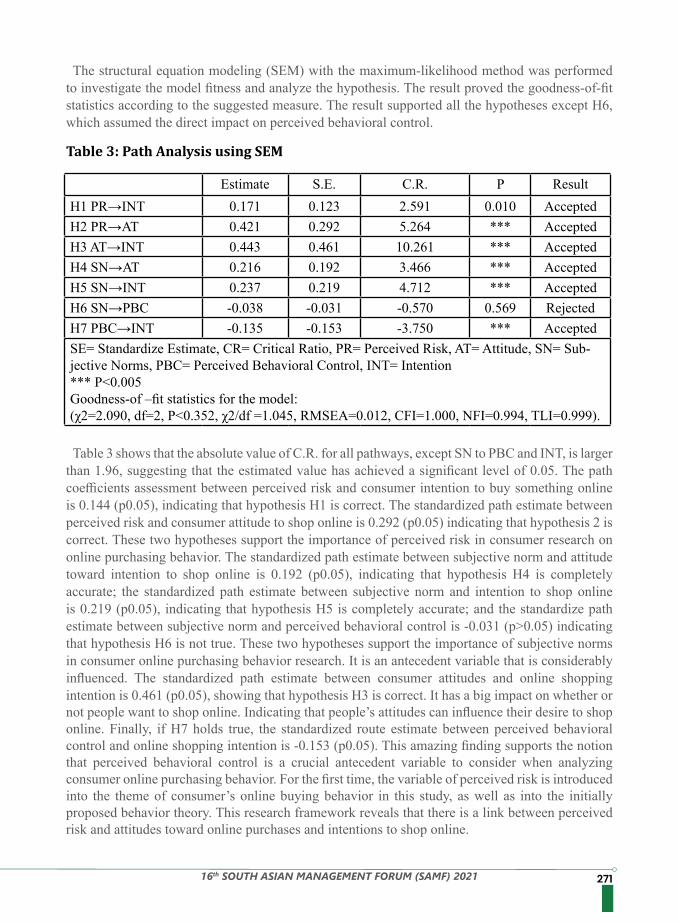
27116th SOUTH ASIAN MANAGEMENT FORUM (SAMF) 2021
The structural equation modeling (SEM) with the maximum-likelihood method was performed to investigate the model fitness and analyze the hypothesis. The result proved the goodness-of-fit statistics according to the suggested measure. The result supported all the hypotheses except H6, which assumed the direct impact on perceived behavioral control.
Table 3 shows that the absolute value of C.R. for all pathways, except SN to PBC and INT, is larger than 1.96, suggesting that the estimated value has achieved a significant level of 0.05. The path coefficients assessment between perceived risk and consumer intention to buy something online is 0.144 (p0.05), indicating that hypothesis H1 is correct. The standardized path estimate between perceived risk and consumer attitude to shop online is 0.292 (p0.05) indicating that hypothesis 2 is correct. These two hypotheses support the importance of perceived risk in consumer research on online purchasing behavior. The standardized path estimate between subjective norm and attitude toward intention to shop online is 0.192 (p0.05), indicating that hypothesis H4 is completely accurate; the standardized path estimate between subjective norm and intention to shop online is 0.219 (p0.05), indicating that hypothesis H5 is completely accurate; and the standardize path estimate between subjective norm and perceived behavioral control is -0.031 (p>0.05) indicating that hypothesis H6 is not true. These two hypotheses support the importance of subjective norms in consumer online purchasing behavior research. It is an antecedent variable that is considerably influenced. The standardized path estimate between consumer attitudes and online shopping intention is 0.461 (p0.05), showing that hypothesis H3 is correct. It has a big impact on whether or not people want to shop online. Indicating that people’s attitudes can influence their desire to shop online. Finally, if H7 holds true, the standardized route estimate between perceived behavioral control and online shopping intention is -0.153 (p0.05). This amazing finding supports the notion that perceived behavioral control is a crucial antecedent variable to consider when analyzing consumer online purchasing behavior. For the first time, the variable of perceived risk is introduced into the theme of consumer’s online buying behavior in this study, as well as into the initially proposed behavior theory. This research framework reveals that there is a link between perceived risk and attitudes toward online purchases and intentions to shop online.
Table 3: Path Analysis using SEM
Estimate S.E. C.R. P ResultH1 PR→INT 0.171 0.123 2.591 0.010 AcceptedH2 PR→AT 0.421 0.292 5.264 *** AcceptedH3 AT→INT 0.443 0.461 10.261 *** AcceptedH4 SN→AT 0.216 0.192 3.466 *** AcceptedH5 SN→INT 0.237 0.219 4.712 *** AcceptedH6 SN→PBC -0.038 -0.031 -0.570 0.569 RejectedH7 PBC→INT -0.135 -0.153 -3.750 *** AcceptedSE= Standardize Estimate, CR= Critical Ratio, PR= Perceived Risk, AT= Attitude, SN= Sub-jective Norms, PBC= Perceived Behavioral Control, INT= Intention *** P<0.005 Goodness-of –fit statistics for the model: (χ2=2.090, df=2, P<0.352, χ2/df =1.045, RMSEA=0.012, CFI=1.000, NFI=0.994, TLI=0.999).
272 16th SOUTH ASIAN MANAGEMENT FORUM (SAMF) 2021
Our findings reveal that consumers’ attitudes, subjective norms, perceived behavioral control, and perceived risk connected with online purchasing intention all are highly connected with online purchasing intention. This means that both internal and external factors have a significant impact on consumer intent. Our research coupled perceived risk with other internal and external elements and discovered that perceived risk had a direct impact on customers’ attitudes and intentions. In this context, authorities must sort out the most serious risks related to online buying and devise risk-reduction initiatives. As a result, our findings can assist them in understanding consumers’ risk perceptions and developing risk mitigation techniques. Consumers will be more likely to shop online in a zero-risk atmosphere. Consumer-friendly rules and proper implementation are required to earn customers’ trust. Consumer behavior has a significant influence on their desire to complete specific tasks. Consumers’ intent to shop online is influenced by perceived risk, subjective standards, and attitudes, according to this study. Consumers frequently seek out the helpful counsel of their friends and family. They want to hear from someone who has already done some internet shopping, especially before making a purchasing choice. As a result, it’s crucial to build brand trust. Once a buyer has been duped, he may try to persuade others not to buy that particular branded product. As a result, e-sellers must be more mindful of upholding their product and service commitments. Furthermore, consumers were observed to be concerned about the effective completion of order placement, according to the study. They are discovered to begin purchasing online if they believe they can complete the entire transaction without difficulty. In this situation, improved internet accessibility, technology, and user-friendly e-commerce sites can all help to persuade customers to buy online. To mitigate the problems identified in our research, joint and collaborative efforts are required to create consumer trust. Policymakers must sort out the variables affecting consumers’ online shopping and take the required steps as soon as possible to develop and sustain the expansion of e-commerce.
1. Ajzen, I. (1985). From intentions to actions: A theory of planned behavior. In Action control (pp. 11-39). Springer.
2. Ajzen, I. (1991). The theory of planned behavior. Organizational behavior and human decision processes, 50(2), 179-211.
3. Alam, K. M. S. (2020). Present challenges and future steps for e-commerce in Bangladesh. The Daily Star Retrieved October 1 from https://www.thedailystar.net/opinion/news/present-challenges-and-future-steps-e-commerce-bangladesh-1980905
4. Alam, S. S., Ahmad, M., Ho, Y.-H., Omar, N. A., & Lin, C.-Y. (2020). Applying an Extended Theory of Planned Behavior to Sustainable Food Consumption. Sustainability, 12(20), 8394.
5. Ariffin, S. K., Mohan, T., & Goh, Y.-N. (2018). Influence of consumers’ perceived risk on consumers’ online purchase intention. Journal of Research in Interactive Marketing.
6. Athiyaman, A. (2002). Internet users’ intention to purchase air travel online: an empirical investigation. Marketing intelligence & planning.
7. Bai, H., Wang, J., & Zeng, A. Z. (2018). Exploring Chinese consumers’ attitude and behavior toward smartphone recycling. Journal of Cleaner Production, 188, 227-236.
8. Bamberg, S., Hunecke, M., & Blöbaum, A. (2007). Social context, personal norms and the use of public transportation: Two field studies. Journal of environmental psychology, 27(3), 190-203.
Result Analysis & Policy Implication
References
27316th SOUTH ASIAN MANAGEMENT FORUM (SAMF) 2021
9. Barnes, S. J., Bauer, H. H., Neumann, M. M., & Huber, F. (2007). Segmenting cyberspace: a customer typology for the internet. European journal of marketing.
10. Belleau, B. D., Summers, T. A., Xu, Y., & Pinel, R. (2007). Theory of reasoned action: Purchase intention of young consumers. Clothing and Textiles Research Journal, 25(3), 244-257.
11. Bhatnagar, A., Misra, S., & Rao, H. R. (2000). On risk, convenience, and Internet shopping behavior. Communications of the ACM, 43(11), 98-105.
12. Bratt, C. (1999). The impact of norms and assumed consequences on recycling behavior. Environment and Behavior, 31(5), 630-656.
13. Cialdini, R. B., & Trost, M. R. (1998). Social influence: Social norms, conformity, and compliance.
14. Coppola, D. (Jul 7, 2021). Worldwide e-commerce share of retail sales 2015-2024. https://www.statista.com/statistics/534123/e-commerce-share-of-retail-sales-worldwide/
15. Festinger, L. (1954). A theory of social comparison processes. Human Relations, 7(2), 117-140.
16. Forsythe, S. M., & Shi, B. (2003). Consumer patronage and risk perceptions in Internet shopping. Journal of Business Research, 56(11), 867-875.
17. George, J. F. (2002). Influences on the intent to make Internet purchases. Internet Research. 18. Javadi, M. H. M., Dolatabadi, H. R., Nourbakhsh, M., Poursaeedi, A., & Asadollahi, A.
R. (2012). An analysis of factors affecting on online shopping behavior of consumers. International journal of marketing studies, 4(5), 81.
19. Laohapensang, O. (2009). Factors influencing internet shopping behavior: a survey of consumers in Thailand. Journal of fashion marketing and management: An international journal.
20. Lee, K. S., & Tan, S. J. (2003). E-retailing versus physical retailing: A theoretical model and empirical test of consumer choice. Journal of Business Research, 56(11), 877-885.
21. Lewis, M. (2006). The effect of shipping fees on customer acquisition, customer retention, and purchase quantities. Journal of Retailing, 82(1), 13-23.
22. Mahmud, N. (2020, November 3, 2020). E-commerce would be a $3b industry by 2023. Dhaka Tribune https://www.dhakatribune.com/business/2020/11/03/e-commerce-market-will-be-3-billion-big-by-2023#:~:text=In%202020%2C%20thanks%20to%20the,Bangladesh%20Association%20of%20Software%20and
23. Masoud, E. Y. (2013). The effect of perceived risk on online shopping in Jordan. European Journal of Business and Management, 5(6), 76-87.
24. McNair, C., & Pearl, M. (2018). Worldwide retail and e-commerce sales: marketer’s updated forecast and new m-commerce estimates for 2016–2021. Industry Report, eMarketing.
25. Oskamp, S., Harrington, M. J., Edwards, T. C., Sherwood, D. L., Okuda, S. M., & Swanson, D. C. (1991). Factors influencing household recycling behavior. Environment and Behavior, 23(4), 494-519.
26. Park, J., & Ha, S. (2014). Understanding consumer recycling behavior: Combining the theory of planned behavior and the norm activation model. Family and consumer sciences research journal, 42(3), 278-291.
27. Petty, R. E., & Cacioppo, J. T. (1996). Attitudes and persuasion: Classic and contemporary approaches. Boulder, Co. In Westview Press.
28. Repko, M. (2021). Consumers spent $900 billion more online in 2020. Here’s who will keep the biggest gains. CNBC. Retrieved September 10 from https://www.cnbc.com/2021/04/06/
274 16th SOUTH ASIAN MANAGEMENT FORUM (SAMF) 2021
consumers-spent-900-billion-more-online-in-2020-mastercard-report-says.html29. Saha, S. K., Zhuang, G., & Li, S. (2020). Will consumers pay more for efficient delivery? An
empirical study of what affects E-customers’ satisfaction and willingness to pay on online shopping in Bangladesh. Sustainability, 12(3), 1121.
30. San Martín, S., & Camarero, C. (2009). How perceived risk affects online buying. Online Information Review.
31. Schlosser, A. E. (2003). Experiencing products in the virtual world: the role of goal and imagery in influencing attitudes versus purchase intentions. Journal of consumer research, 30(2), 184-198.
32. Swinyard, W. R., & Smith, S. M. (2003). Why people (don’t) shop online: A lifestyle study of the internet consumer. Psychology & Marketing, 20(7), 567-597.
33. Tommasetti, A., Singer, P., Troisi, O., & Maione, G. (2018). Extended theory of planned behavior (ETPB): investigating customers’ perception of restaurants’ sustainability by testing a structural equation model. Sustainability, 10(7), 2580.
34. Wan, C., Shen, G. Q., & Choi, S. (2017). Experiential and instrumental attitudes: Interaction effect of attitude and subjective norm on recycling intention. Journal of environmental psychology, 50, 69-79.
35. 36. San Martín, S., & Camarero, C. (2009). How perceived risk affects online buying. Online
Information Review. 37. Schlosser, A. E. (2003). Experiencing products in the virtual world: the role of goal and
imagery in influencing attitudes versus purchase intentions. Journal of consumer research, 30(2), 184-198.
38. Swinyard, W. R., & Smith, S. M. (2003). Why people (don’t) shop online: A lifestyle study of the internet consumer. Psychology & Marketing, 20(7), 567-597.
39. Tommasetti, A., Singer, P., Troisi, O., & Maione, G. (2018). Extended theory of planned behavior (ETPB): investigating customers’ perception of restaurants’ sustainability by testing a structural equation model. Sustainability, 10(7), 2580.
40. Wan, C., Shen, G. Q., & Choi, S. (2017). Experiential and instrumental attitudes: Interaction effect of attitude and subjective norm on recycling intention. Journal of environmental psychology, 50, 69-79.
27516th SOUTH ASIAN MANAGEMENT FORUM (SAMF) 2021
PurposeThe major goal of this study is to determine the impact of covid 19 and identify the factors which
influence consumers’ online and offline buying behavior in South Asian nations during the Covid 19 crisis.
DesignTo achieve the goals, a review of conceptual and empirical studies on consumer buying behavior
toward online and offline shopping was conducted. A term-based search technique was used to perform the literature evaluation, which was limited to a certain period and specific internet databases. Following a thorough assessment of the literature, 90 publications were selected as being relevant. Based on similarities and patterns, the variables that impact customers’ online and physical purchase intents were grouped. The study has used narrative examples from the empirical review to explain and elaborate on the elements of the conceptual framework.
FindingsDuring the Covid 19 crisis in South Asian countries, the article offers a conceptual framework
for analyzing the factors that impact purchase behavior toward online and offline shopping. The study reveals that during the Covid 19 crisis, several major variables, related to online and offline shopping affected buying behavior in South Asian nations.
Research limitations/implications The main limitation is that this study is conceptual, with no empirical validation of the link
between variables. Because of the term-based search method used, the number of articles identified is restricted. In addition, the selected framework needs a corresponding assignment to a well-defined topic, which is not always accessible.
Future DirectionIt would be interesting to see if the variables stated above were to be looked into more in the
future. Further study might help to demonstrate a link between the aforementioned variables and give empirical evidence for future research topics.
Originality This study is noteworthy because it looks at the factors that impact customer buying behavior both
online and offline in South Asian countries during the Covid 19 crisis. This is the first thorough analysis of data that includes both online and offline consumer purchase behavior in South Asian nations, as far as the author is aware. It not only collects consumer purchasing behavior literature but also analyses significant gaps in the field, enabling more effective future research.Paper Type: Literature Review
Priyabrata Roy¹, Faculty of Management & CommerceDhananjoy Datta¹, Faculty of Management & CommerceBiplab Halder¹, Vice chancellor¹The ICFAI University, Tripura, India.
Abstract
IMPACT OF COVID-19 ON CONSUMER BUYING BEHAVIOR TOWARD ONLINE AND OFFLINE SHOPPING IN SOUTH ASIAN
COUNTRIES: A REVIEW, SYNTHESIS, AND CONCEPTUAL FRAMEWORK
276 16th SOUTH ASIAN MANAGEMENT FORUM (SAMF) 2021
KeyWords: Consumer behavior, Consumer buying, South Asia, Online shopping, Offline shopping, COVID 19.
People used to buy products and services in markets and retail facilities (Tauber, 1972). Offline shopping refers to a state where customers go to a store or a retail location to buy goods or services (Gupta & Sahu, 2015). The process of buying and selling products and services through the internet is known as online shopping. Various researches have been carried out in the past to better understand customer behavior and to identify all of the elements that influence it. In late 2019, COVID - 19, the world’s biggest pandemic, struck. The Coronavirus disease 2019, also known as COVID 19, is a new virus that is affecting lives around the world (AL-Hawari et al., 2021). COVID 19 is a respiratory infection that originated in Wuhan, China, and has since spread to over 100 countries around the world including South Asia like India, Bangladesh, Pakistan, Nepal, Bhutan, Afghanistan, the Maldives, and Sri Lanka (Gazali, 2020). The COVID 19 outbreak has had a major impact on people’s lives and behavior, causing health and economic problems worldwide through reduced economic activity, rising unemployment, and lower consumption (Mirchevska et al., 2021). Individuals, businesses, and consumers have all been affected by the current COVID-19 outbreak (A. Sharma & Mehta, 2020). Consumers are trying to change their daily behaviors to maintain social distance and prevent catching the deadly disease, and their reliance on digital platforms has grown (Parth et al., 2020). The purpose of this study is to see how the COVID-19 outbreak has affected consumer shopping habits, both online and offline in South Asian countries (Sayyida et al., 2021). To better understand the South Asian region’s consumer buying behavior in both online and offline shopping, a review of current empirical study was conducted. “Consumer behaviour,” “online shopping,” “offline shopping,” “consumer buying behaviour,” “South Asia”, “pandemic” and “Covid 19” were the keywords, key focus as well, in the study. All of these words were used interchangeably in the study. The current study serves as a link between future research and past studies on consumer buying behaviour preceding to and during the Covid 19 pandemic, both online and offline mode. It informs readers on the many factors that impact South Asian countries consumer buying behaviour in both normal and pandemic scenarios, both offline and online shopping.The current study serves as a link between future research and past studies on consumer buying behaviour, both online and offline, prior to and during the Covid 19 pandemic.
Introduction
Objectives
The objectives of the study are:• To gain a better understanding of consumer buying behavior toward online and offline shopping
in South Asian countries.• To investigate the influence of the COVID-19 on consumer buying behavior toward online and
offline shopping in South Asian countries.• To identify the factors that affect consumer buying behavior towards online and offline shopping
during covid 19 pandemic situation in South Asian countries.
27716th SOUTH ASIAN MANAGEMENT FORUM (SAMF) 2021
This study discusses various research findings with the literature on consumer purchasing behavior. The researchers looked through journal index databases to find relevant papers. Then, based on the titles and abstracts, it was determined which study to focus on. The keywords “consumer behavior,” “online shopping,” “offline shopping,” “consumer buying behavior,” “South Asia,” and “Covid 19” were all utilized in the literature study. The most relevant 60 articles were chosen from January 2020 to August 2021. Every study article was re-examined in its entirety to exclude any that appeared to have no evident link to consumer buying behavior and Covid 19.
The following six (6) categories were used to categorize all of the literature: (i) Adoption of Online Shopping (ii) Purchase Intention (iii) Impulsive Purchase (iv) Product Specific Buying (v) Adoption of Technology and (vi) Changing Business Scenario.
It is impossible to exaggerate the importance of quality in influencing a consumer’s decision to purchase a product (Chetana, 2020). Consumer behavior shifted in chronological order from January 2020 to March 2021, as significant developments in the epidemic altered purchasing decisions. As a result of the ongoing shift, the online business environment has suffered permanent changes (Riedell, 2021). Gender, age, marital status, and graduation status influence online shopping, as do shipping and payment choices. It was recognized during the Covid-19 time that social media had the tremendous financial potential for online shopping. When it comes to internet purchasing, there is a link between trust and satisfaction (Parlakkiliç et al., 2020). Customers’ purchasing patterns for vital, health, and safety items, as well as other key services, shift from traditional to online shopping in the case of a pandemic (China Babu & Kumar, n.d.). Consumers are learning to manage their work, leisure, and education limits by utilizing improved technologies (M. H. Sharma & Sharma, 2020). Although the same risk factors were demonstrated to be unfavorable in typical conditions, people’s perceptions of danger while buying online improved during the Covid-19 epidemic. Furthermore, when Covid-19 was recognized, marketing strategy had an impact on internet sales. When Covid-19 was unknown, however, marketing strategy had little effect (Pham et al., 2020). Perceived utility (PU), risk-taking proclivity, perceived behavioral control (PBC), perceived lack of alternatives, and government assistance all influenced consumers’ intentions to adopt online shopping during the COVID 19 outbreak. Meanwhile, customers’ attitudes toward online shopping were unaffected by perceived ease of use (PEOU), subjective norms (SN), perceived external pressure, perceived risk, and perceived penal breaches (Salem & Md Nor, 2020). During the Covid-19 epidemic, there was a major shift in consumer buying behavior (Kuna, 2020).
Methodology And Approach To The Literature
Discussion
Adoption Of Online Shopping
Purchase IntentionAfter the pandemic in early 2021, people had to adjust to their new normal. Many things alter when
individuals are faced with this situation, as seen by their lifestyle, such as how they get essentials or communicate with one another. Given the existence of a COVID 19 scenario, a study found that even some buyers choose to buy offline. Product quality, a better delivery route, appropriate pricing, and technological help are all significant factors in an internet business’s future growth and upkeep (Hakim et al., 2021). Covid-19 signaled a substantial shift in food consumption, purchasing, and eating patterns as customer worries about safety, health, and financial issues developed.
278 16th SOUTH ASIAN MANAGEMENT FORUM (SAMF) 2021
Impulsive Purchase
Product Specific Buying
During times of pandemic, people engage in panic buying, with the majority opting to spend money on healthcare and pharmaceutical products (Roundha & Pabalkar, 2021). In a previous study, purchase intentions, panic buying owing to lockdown, and increasing COVID cases, to name a few, were all evaluated ( Proquest, n.d.). Panic buying or panic shopping occurs as a result of the fear of a Coronavirus pandemic (Rosita, 2020). Consumer psychology and risk perceptions impact impulsive buying. The fear of a coming pandemic can be heightened by panic and the news media. The financial status of consumers has an impact on their impulsive buying behavior (R Kaur & Sharma, 2020). Consumer panic buying is influenced by five factors: herd behavior, social media exposure, anxiety sensitivity, cost, and product availability (Gazali, 2020). A study looked at the phenomena of impulsive purchasing during pandemics and the factors that lead to it, uncovering information on online impulse buying, the influence of marketing on impulse purchases, and pricing concerns during impulse purchases (Thakur et al., 2020). Personalized recommendations, visual beauty, and system usability all have an impact on impulsive purchase intent by affecting perceived arousal and enjoyment (Zhang et al., 2020).
Consumers’ purchase intentions were most favorably influenced by their perceived health, followed by their faith in imported organic items. Consumers’ buying intentions had a favorable impact on their subsequent shopping habits. People with higher education and a higher monthly income are more inclined to purchase imported organic food (Huong & Nguyen, 2021). Demographic variables strongly impact consumer sentiments toward organic food. COVID-19 promotes a healthy lifestyle as well as the intake of nutritious meals. When we look at the good aspects of COVID-19, we can see that it has a favorable influence on customers’ perceptions of organic food in India (Rashid et al., n.d.).
Consumers’ satisfaction is influenced by system quality, product quality, brand features, and economics when purchasing fresh food online (LEE, 2020). COVID-19 The epidemic is affecting the number of individuals who use the internet to buy organic food. There were also changes in the type and quantity of organic food consumed. Furthermore, internet users’ socio-demographic characteristics impact their use of organic foods (Ćirić et al., 2020). During the lockdown, people made more purchases, and COVID-19 acted as a stimulant for online shopping intention as a predictor of behavior (Elshahed & Elsafty, 2021). Online sales account for less than 30% of overall retail sales, whereas offline sales account for more than 70% of total retail sales (Sayyida et al., 2021). According to the study, while subjective norm has no direct impact on purchase intent, health value does. According to statistics, one’s thinking has a big influence on their buying intent. As a result, the relationship between health value and subjective norms and purchase intention may be altered by attitude (Hidayat et al., 2021). People prefer to buy fresh fish online rather than in the market, according to a noticeable trend in customer behavior. Customers’ purchase decisions for fresh fish delivered online are influenced by a variety of cultural, social, emotional, and psychological aspects (Farradia & Sunarno, 2020). According to a study on changes in fish consumption behavior, the majority of consumers’ purchasing processes have not changed, indicating that they continue to prefer to shop offline. The majority of consumers’ preferred purchase locations have remained consistent, i.e., traditional marketplaces (Putri et al., 2021). At COVID-19, it will be crucial to recognize that online food vendors will encounter significant problems in retaining existing customers. During COVID-19, businesses should reach out to their
27916th SOUTH ASIAN MANAGEMENT FORUM (SAMF) 2021
Adoption of Technology
Changing Business Scenario
consumers through their websites, social media, and other online channels, expressing their worry and support for the pandemic scenario. As COVID-19 becomes the new normal and merchants begin to offer services, they must follow regulatory standards for consumer safety, cleanliness, and protection, particularly when it comes to the product packaging and delivery to customers’ homes (Meshram, 2020). In instances such as pandemics, it is critical to install mobile monitoring devices to ensure the sustainability of the food chain (Haskaraca & Bostanci, 2020). A range of factors impacts customer behaviour, including price, convenience, flavour, and nutrition (Chaurasiya et al., 2020). Cosmetic buying behaviour among Indian working women did not change during COVID-19. Furthermore, previously bought cosmetics goods, such as makeup, are no longer purchased since customers do not perceive a need for them in the current COVID-19 environment. On the contrary, the purchase of some cosmetic products has increased in the COVID-19 environment (A. Sharma & Mehta, 2020). Higher-income households are more likely to make online purchases and spend more on home delivery during the COVID-19 lockdown. Higher degrees of technology use are also associated with higher levels of delivery and spending. Food and groceries are often delivered the same day or the following day. Those who are concerned about product prices in offline stores are less likely to have a substantial number of home deliveries, but those who are concerned about their health are more likely to spend more money and have a greater number of home deliveries (Unnikrishnan & Figliozzi, 2020). Satisfaction and attitude both have an impact on trust. Customer satisfaction is the most essential factor in determining purchase intentions and word-of-mouth (WOM) (Cachero-Martínez, 2020). In the case of a COVID-19 pandemic, a high-risk attitude will lead to a demand for items that defy logic. This provided us with an unique perspective on the negative features of risk perception (Long & Khoi, 2020).
The influence of COVID-19 on online business practices and consumer behavior, as well as online trends and online firms’ ever-expanding reach, were explored in this study (Afridi et al., 2021). As a result of the COVID-19 outbreak, some significant changes in consumer preferences have been discovered; however, the changes are not significant enough to cause major changes in strategic patterns; instead, the researcher recommends that marketers investigate some new components for attracting customers (Dr. Ritika Singh, 2021). The consumer has a steady experience of engagement with specific brands after the initial encounters in the digital space, yet they disappoint consumers; entrepreneurs were not prepared for such a quick shift (Rahmanov et al., 2021). Two retail marketing tactics that increase sales are price promotions and prominent positioning (Hecht et al., 2020).
Online shopping is no longer a passing trend since it brings several financial and consumer benefits to many different sorts of enterprises. Due to its primary safety purpose, online shopping is extremely vital during this epidemic (Jayan & Xavier, N.D.). The long-term, short-term, and mid-to-long-term effects of the situation caused by COVID-19 on consumer behavior when using the service were investigated (Et. al., 2021). Even in the post-COVID-19 era, businesses can use a variety of tactics to get things back to normal. The ability to influence consumer behavior is critical to organizations. Companies can also use this period to re-select employees, tighten standards, and develop stronger long-term strategies. Companies can also check if their products are currently available. Which companies seize the opportunity to maintain a strong consumer position and help their businesses emerge from the crisis? Beyond promises, businesses in the post-COVID era face
280 16th SOUTH ASIAN MANAGEMENT FORUM (SAMF) 2021
Constructing A Conceptual Framework
many challenges, especially when COVID-19 translations aren’t yet complete. The most troubling aspect of the company is its finances, its employees, and especially consumer behavior after the Covid19 enforcement. Consumers are now choosing safer products and are more aware of the risks than ever before (Tien et al., 2021). Users agreed that utilizing social media to communicate information and make purchases is necessary.
Although internet marketing and shopping will soon return to normal, the pandemic’s losses and adaptations must be taken into account (Prof. Reema Shah Prof. Upendra More, 2021). An advertising technique focused largely on drawing the public’s attention to emerging consumer and consumer behavior trends. Cost reduction, prioritization of basic needs fulfillment, changing the structure of the consumer basket, expanding digitalization, increasing home delivery, reorienting toward local shopping, omni-channel services, and emphasizing the value of green content are just a few of the key issues addressed. The studies additionally attempt to adapt, develop, and decorate advertising, specifically advertising policy, in reaction to adjustments in consumer behavior. To gain those goals, virtual advertising strategies, in addition to product, communication, distribution, and fee plans and strategies which are tailor-made to the brand new reality, can be necessary (Danciu, n.d.). Convenience, fee options, incentives, and different elements all affect online shopping (Prof. Reema Shah Prof. Upendra More, 2021). Internet advertising and shopping will hastily end up commonplace, however, the epidemic`s loss and shrinking should now no longer be overlooked (Pal, 2020). There was a significant negative correlation between consumption and morbidity, whereas there was a positive correlation in the surrounding areas. However, the study did not find any indication of a link between the impact of COVID-19 and changes in customer behavior (Jo et al., 2020). The study identified four categories of consumers based on their post-pandemic behavioral responses. Returning to the origin, the new normal, relatively new normal, and recycled consumer group are four types of consumer groups (Nuradli Ridzwan Shah Mohd Dali et al., 2020).
The goal of this research is to find out what factors impacted consumer buying behavior in South Asian nations before and during the COVID-19 outbreak. The study focused on the literature’s contribution to consumers’ buying behavior concerns. At this point, it’s critical to identify areas of research that haven’t been addressed yet in the study and the gaps that need to be filled. Here is also a need to develop a conceptual model that will help us better comprehend South Asian consumers’ buying habits. For that purpose, the accompanying diagram depicts an early conceptual model based on research into the online and offline shopping habits of South Asian consumers. The model includes a variety of study hypotheses and future goals to encourage anybody interested in consumer buying behavior research to engage and better understand this complicated issue (Peachey et al., 2015). The suggested conceptual model is illustrated in the graphic below, which was developed based on a review of the literature on consumer buying behavior in both online and offline shopping in South Asia. Because consumer buying behavior is a dynamic process driven by a multitude of factors in South Asian nations, obtaining all of the information needed to understand it will be challenging. On the other hand, the purpose of the study is to create a framework that can be analyzed, questioned, and built upon. In this sense, all contributions are much appreciated.
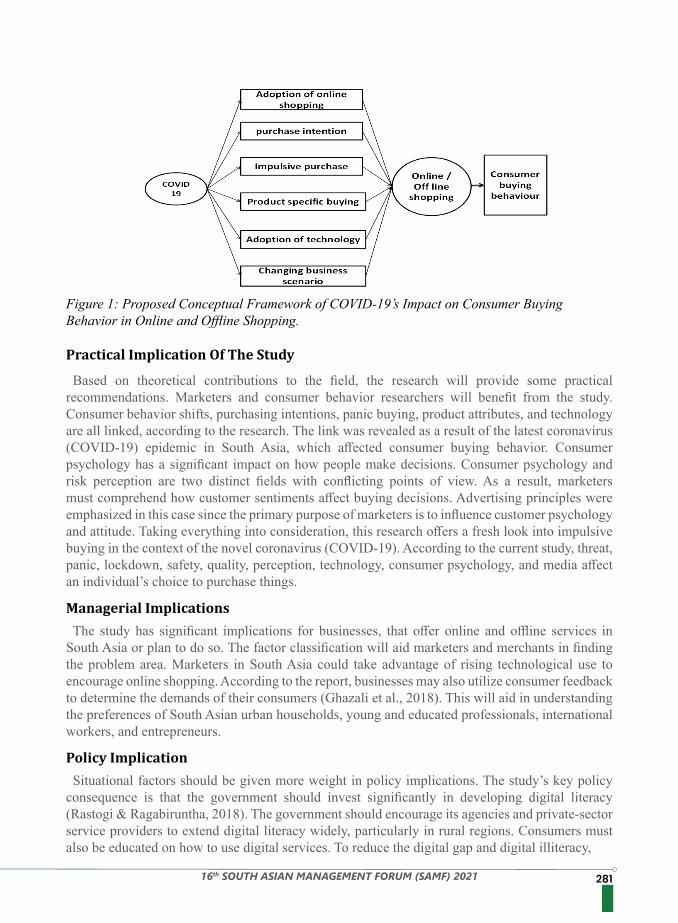
28116th SOUTH ASIAN MANAGEMENT FORUM (SAMF) 2021
Practical Implication Of The Study
Managerial Implications
Policy Implication
Based on theoretical contributions to the field, the research will provide some practical recommendations. Marketers and consumer behavior researchers will benefit from the study. Consumer behavior shifts, purchasing intentions, panic buying, product attributes, and technology are all linked, according to the research. The link was revealed as a result of the latest coronavirus (COVID-19) epidemic in South Asia, which affected consumer buying behavior. Consumer psychology has a significant impact on how people make decisions. Consumer psychology and risk perception are two distinct fields with conflicting points of view. As a result, marketers must comprehend how customer sentiments affect buying decisions. Advertising principles were emphasized in this case since the primary purpose of marketers is to influence customer psychology and attitude. Taking everything into consideration, this research offers a fresh look into impulsive buying in the context of the novel coronavirus (COVID-19). According to the current study, threat, panic, lockdown, safety, quality, perception, technology, consumer psychology, and media affect an individual’s choice to purchase things.
The study has significant implications for businesses, that offer online and offline services in South Asia or plan to do so. The factor classification will aid marketers and merchants in finding the problem area. Marketers in South Asia could take advantage of rising technological use to encourage online shopping. According to the report, businesses may also utilize consumer feedback to determine the demands of their consumers (Ghazali et al., 2018). This will aid in understanding the preferences of South Asian urban households, young and educated professionals, international workers, and entrepreneurs.
Situational factors should be given more weight in policy implications. The study’s key policy consequence is that the government should invest significantly in developing digital literacy (Rastogi & Ragabiruntha, 2018). The government should encourage its agencies and private-sector service providers to extend digital literacy widely, particularly in rural regions. Consumers must also be educated on how to use digital services. To reduce the digital gap and digital illiteracy,
Figure 1: Proposed Conceptual Framework of COVID-19’s Impact on Consumer Buying Behavior in Online and Offline Shopping.
282 16th SOUTH ASIAN MANAGEMENT FORUM (SAMF) 2021
Given the growing interest in the subject of consumer behavior, we are pleased to recommend further study avenues, which represent a potential for further exploration. Another key suggestion is to conduct in-depth empirical studies on the utilization of various strategies/approaches to understanding consumer buying behavior. Furthermore, as this page demonstrates, no research goes into depth on this topic. Similarly, no research on users’ post-adoption behavior has been found. Researchers should pay more attention to the elements that continue to impact people when
Theoretical Contribution
Limitations
Recommendation For Future Research
a conducive ecology is required. The government should put pressure on app companies to provide digital tools in regional languages as well (D’souza, 2018). Even in remote locations, the institutional architecture should provide appropriate internet access. The government should endeavor to build a favorable ecosystem to boost internet access, encourage merchants to give online purchasing choices to their consumers, and raise knowledge about the availability and usage of the internet (Sobti, 2019).
This study adds to the literature by presenting what is now known – and what is not – regarding the link between variables and consumer buying behavior. The study seeks to address the gap by emphasizing fundamental barriers to consumer purchasing behavior. It elucidates certain essential consequences in the relevant field of study. The study of the major ideas used as the foundation for investigations is also a contribution to research in the field. From a theoretical standpoint, the study is unusual in that we are among the first to compile all of the pertinent papers that have been included in the review. Furthermore, because it is based on the results of prior investigations, it gives a thorough assessment of the existing literature. The study is also useful in establishing the aspects on which little research has been conducted.
Despite the fact that this study achieved its goals, it had flaws. The emphasis of this study was on literature written mostly in English. The study analyses 60 articles on consumer’s buying behavior material from several database sources using only a few keywords. The relevance of consumer buying behavior toward online and offline shopping in the context of business management is the emphasis of this study, rather than cross-industry applicability. Future studies may cover a wide variety of topics since the extent and potential of consumer buying behavior toward online and offline shopping are not limited to the business and management environment. The literature is restricted to the domain of South Asian consumer buying behavior. The papers for the research design were chosen using keyword searches, which limited the scope of the study. While inserting additional keywords in the sample may enhance coverage, it also introduces noise (inappropriate articles) and complicates implementation. The presented research idea is supported by current literature, but its validity and reliability have not been validated, thus future researchers are encouraged to examine it using statistical techniques. To understand, relate, and interpret his or her own and respondents’ experiences, social constructionism necessitates participation in research. Therefore, the authors’ results may be skewed, and they cannot be applied to a wide population. As a result, future researchers might be able to use quantitative data gathering and analysis approaches to confirm the consumer buying behavior hypothesis for both online and offline shopping (Naeem, 2020). The empirical evidence among the selected variables has not been established in this study. Further study on the relationship between these characteristics and customer buying behavior in both online and offline shopping would be intriguing. (Gazali, 2020).
28316th SOUTH ASIAN MANAGEMENT FORUM (SAMF) 2021
Conclusion
References
they switch to an online or offline mode. Finally, we highlighted that the presence of a retailer and service provider, as well as their influence on the customer purchasing process, should be properly exploited in future studies. Researchers are encouraged to look at how businesses and marketers provide solutions to their products.
The COVID-19 pandemic is reported to have influenced global consumer behavior, with South Asian consumer buying patterns shifting as a result of the epidemic (Ali, 2020). The article’s main purpose is to look at the elements that impact consumer buying behavior in South Asia. It provides information on consumer shopping habits. By providing a conceptual framework for analyzing consumer behavior during the COVID-19 epidemic in South Asia. This study contributes to our existing understanding of consumer purchasing. Practitioners, government officials, and researchers will all benefit from the study. They may prepare the necessary activities to ensure that the demand-supply balance is maintained in the event of a crisis. Additionally, the government as a policymaker will profit from this research. The study will also assist the researcher in designing and expanding the present study to better understand consumer buying behavior in both online and offline shopping (Gazali, 2020). Time-series and longitudinal methods, for example, may be employed in the future. The study focused on the elements that influence consumer buying behavior in South Asia. Therefore, this study was conducted to fill the gap. There are two key insights from our study. First, the factors are found through an extensive literature review of studies. The second insight is the classification of factors to provide a thoughtful understanding of the influence of each factor. Today, more and more organizations are engaging themselves in online infrastructure and people are showing an increased willingness to adopt such an online mode for shopping. However, most of the previous studies have reported that the positive attitude of consumers is not reflected in actual use and most consumers are reluctant to shop online. This study addresses the need for review studies to look up literature available for a variety of reasons. In addition, the author provides a possible explanation for the discrepancies observed in online shopping. The study has also identified the factors that have been the most noticed and mostly overlooked in the literature.
1. Afridi, F. E. A., Jan, S., Ayaz, B., & Irfan, M. (2021). The impact of Covid-19 on E-business practices and consumer buying behavior in a developing country. Amazonia Investiga, 10(38), 97–112. https://doi.org/10.34069/AI/2021.38.02.9
2. Ali, B. (2020). Impact of COVID-19 on consumer buying behavior toward online shopping in Iraq. Ali, BJ (2020). Impact of COVID-19 on Consumer Buying Behavior toward Online Shopping in Iraq. Economic Studies Journal, 18(42), 267–280.
3. Cachero-Martínez, S. (2020). Consumer Behaviour towards Organic Products: The Moderating Role of Environmental Concern. Journal of Risk and Financial Management, 13(12), 330. https://doi.org/10.3390/jrfm13120330
4. Chaurasiya, R., Pandey, R., Verma, P., Kek, X. H., Kee, D. M. H., Yeoh, X. Y., Wah, P. J., & Rokiah, R. (2020). Consumer Behavior towards Ready-to-Eat (RTE) Market: A Study of MTR Foods. International Journal of Applied Business and International Management (IJABIM), 5(2), 66–72. http://ejournal.aibpm.org/index.php/IJABIM/article/view/859
5. Chetana, M. R. (2020). Factors Causing Transform in Consumer Behaviour During Covid-19 Pandemic-a Study. 514(12), 27–37.
6. China Babu, G., & Kumar, S. (n.d.). A Study on Consumer Behavior pattern shift in the
284 16th SOUTH ASIAN MANAGEMENT FORUM (SAMF) 2021
period of Corona (COVID-19) Pandemic.7. Cho, C.-H., Kang, J., & Cheon, H. J. (2006). Online shopping hesitation. CyberPsychology
& Behavior, 9(3), 261–274.8. Choudhuri, S. (2021). Impact Of Covid-19-Creating A Panic Buying. Academy of Marketing
Studies Journal, 25, 1–8.9. Ćirić, M., Ilić, D., Ignjatijević, S., & Brkanlić, S. (2020). Consumer behavior in online
shopping organic food during the Covid-19 pandemic in Serbia. Food and Feed Research, 47(2), 149–158. https://doi.org/10.5937/ffr47-28815
10. D’souza, R. (2018). Cashless India: getting incentives right. ORF Occasional Paper, Mumbai: Observer Research Foundation.
11. Danciu, V. (n.d.). Adapting and Modernizing the Post-Covid Marketing Policy Under the Impact of Consumption Challenges. https://doi.org/10.24818/REJ/2021/79/01
12. Dr. Ritika Singh, et. al. (2021). Challenges of Marketing in COVID-19 Scenario: A Neuro-marketing Approach. Turkish Journal of Computer and Mathematics Education (TURCOMAT), 12(12), 4192–4199. https://www.turcomat.org/index.php/turkbilmat/article/view/8306
13. Dulam, R., Furuta, K., & Kanno, T. (2021). Quantitative decision-making model to analyze the post-disaster consumer behavior. International Journal of Disaster Risk Reduction, 61, 102329. https://doi.org/10.1016/J.IJDRR.2021.102329
14. Elshahed, M., & Elsafty, A. (2021). The Changes in Online Buying Intention as a Determinant of Behavior During COVID-19 Pandemic in the Ready-Made Garments Industry in Egypt. Article in International Journal of Business and Management, 16(5), 2021. https://doi.org/10.5539/ijbm.v16n5p1
15. EShop World. (2019). Global Ecommerce Market Ranking 2019. November 2018, 1–19. https://www.worldretailcongress.com/__media/Global_ecommerce_Market_Ranking_2019_001.pdf
16. Et. al., S. J. (2021). Impact of Covid 19 Induced Conditions on the Consumer Behavior on A Short, Mid, and Long Term, for Consumption of Services. Turkish Journal of Computer and Mathematics Education (TURCOMAT), 12(2), 1906–1923. https://doi.org/10.17762/turcomat.v12i2.1772
17. Farradia, Y., & Sunarno, M. T. D. (2020). Consumer Purchase Decision on Fresh Fish in the New Norm: Preliminary Case Study in Indonesia. Journal of Social Transformation and Regional Development, 2(1), 52–60. https://doi.org/10.30880/jstard.2020.02.01.006
18. Gazali, H. M. (2020). The Covid-19 Pandemic: Factors Triggering Panic Buying Behaviour Among Consumers In Malaysia. Labuan Bulletin of International Business and Finance (LBIBF), 84–95. https://jurcon.ums.edu.my/ojums/index.php/lbibf/article/view/2690
19. Ghazali, E. M., Mutum, D. S., Chong, J. H., & Nguyen, B. (2018). Do consumers want mobile commerce? A closer look at M-shopping and technology adoption in Malaysia. Asia Pacific Journal of Marketing and Logistics.
20. Gupta, A., & Sahu, G. P. (2015). Entrepreneurial Challenges in the 21st Century. In H. R. Kaufmann & S. M. R. Shams (Eds.), International Journal of Customer Relationship Marketing and Management (Vol. 3, Issue 1). Palgrave Macmillan UK. https://doi.org/10.1057/9781137479761
21. Hakim, M. A., Bhadra, S., Shawan Uddin, M., & Rahman, M. O. (2021). Consumers Buying Perceptions During Covid 19 In Bangladesh: A Study In Dhaka City. International Journal of Islamic Management and Business, 9.
22. HASKARACA, G., & BOSTANCI, E. (2020). Changes in the Online Food and Meat Shopping
28516th SOUTH ASIAN MANAGEMENT FORUM (SAMF) 2021
Habits of Turkish Adults During Covid-19 Pandemic. Icontech International Journal, 4(3), 65–79. https://doi.org/10.46291/icontechvol4iss3pp65-79
23. Hecht, A. A., Perez, C. L., Polascek, M., Thorndike, A. N., Franckle, R. L., & Moran, A. J. (2020). Influence of food and beverage companies on retailer marketing strategies and consumer behavior. International Journal of Environmental Research and Public Health, 17(20), 1–34. https://doi.org/10.3390/ijerph17207381
24. Hidayat, S., Wibowo, W., Gunawan, Y. L., Dewi, G. C., & Wijayaningtyas, M. (2021). Factors Influencing Purchase Intention of Healthcare ProductsDuring the COVID-19 Pandemic: An Empirical Study in Indonesia.
25. Huong, D., & Nguyen, A. (2021). Factors Affecting Consumers’ Actual Buying Behaviors Towards Imported Organic Food in Vietnam. http://www.plagiarism.aau.dk/Rules+and+Regulations/
26. IMPACT OF COVID-19 - CREATING A PANIC BUYING - ProQuest. (n.d.). Retrieved July 23, 2021, from https://www.proquest.com/openview/8054a398e1962b5384f8fc09e5bf2ba2/1?pq-origsite=gscholar&cbl=38744
27. JAYAN, M. S. V. L., & XAVIER, M. S. L. (n.d.). An Empirical Study On The Online Shopping Acceptance: Pre And Post Covid-19 Outbreak.
28. Jo, H., Shin, E., & Kim, H. (2020). Changes in Consumer Behaviour in the Post-COVID-19 Era in Seoul, South Korea. https://doi.org/10.3390/su13010136
29. Kaur, R, & Sharma, M. B. (2020). Impulsive Buying Behavior for Essential Goods: Covid-19. Journal of Critical Reviews, 7(08), 3126–3135. http://www.jcreview.com/fulltext/197-1601010082.pdf
30. Kaur, Ratinder, & Sharma, M. B. (n.d.). Journal Of Critical Reviews Impulsive Buying Behavior For Essential Goods: Covid-19. Retrieved July 22, 2021, from https://orcid.org/00000002-5631-2092
31. Kuna, A. (2020). Impact of Covid – 19 on Food Purchasing, Eating Behaviors and Perceptions of Food Safety in Consumers of Telangana and Andhra Pradesh of India. International Journal of Agriculture Environment and Biotechnology, 13(4). https://doi.org/10.30954/0974-1712.04.2020.3
32. LEE, S.-H. M.-K. S.-S. (2020). Consumers’ Choice for Fresh Food at Online Shopping in the Time of Covid19. Journal of Distribution Science, 18(9), 45–53. https://doi.org/10.15722/JDS.18.9.202009.45
33. Long, N. N., & Khoi, B. H. (2020). An empirical study about the intention to hoard food during COVID-19 pandemic. Eurasia Journal of Mathematics, Science and Technology Education, 16(7). https://doi.org/10.29333/EJMSTE/8207
34. Meshram, J. (2020). How COVID-19 affected the online grocery buying experiences-A study of select cities of Mumbai and Pune. November.
35. Mirchevska, T. P., Daniloska, N., Boshkovska, D., & Petkovski, V. (2021). Change in Consumers’ Behavior during the COVID 19 pandemic as an opportunity to foster Digital Entrepreneurship in the Republic of North Macedonia. Economic Analysis, 54(1), 60–70. https://doi.org/10.28934/EA.21.54.1.PP60-70
36. Mishra, S. J., Rout, D., Sarkar, P., & Naik, P. (2021). Consumer Behaviour Towards Online Shopping And Its Impact In Bhubaneswar During COVID-19. Journal of Applied Science and Computations, VIII(V), 29–44.
37. Namli, U. (2021). Behavioral Changes among Street Level Drug Trafficking Organizations and the Fluctuation in Drug Prices Before and During the Covid-19 Pandemic. American Journal of Qualitative Research, 5(1), 1–22. https://doi.org/10.29333/AJQR/9691
286 16th SOUTH ASIAN MANAGEMENT FORUM (SAMF) 2021
38. Nugroho, A. B., Ravenska, N., & Zulvia, P. (2021). Lifestyle Patterns During the Covid-19 Pandemic. 2nd International Conference on Administration Science 2020 (ICAS 2020), 78–82.
39. Nuradli Ridzwan Shah Mohd Dali, Hanifah Abdul Hamid, Wan Rasyidah Wan Nawang, & Wan Nur Fazni Wan Mohamad Nazarie. (2020). Post Pandemic Consumer Behavior: Conceptual Framework. The Journal of Muamalat and Islamic Finance Research, 17(May), 13–24. https://doi.org/10.33102/jmifr.v17i3.280
40. Pal, S. K. (2020). Study of Changes in Consumer Behaviour Towards Online Shopping Before and After Covid-19. 17(12), 1547–1562.
41. PARLAKKILIÇ, A., ÜZMEZ, M., & MERTOĞLU, S. (2020). Digital Transformation Of E-Commerce: How Did Covid-19 Affect Customers’ Online Shopping Behaviors? Dijital Çağda İşletmecilik Dergisi, 3(2), 117–122. https://doi.org/10.46238/JOBDA.823955
42. Parth, S. S., Tanaya, J., & Anand, B. (2020). Understanding the Consumer Buying Behaviour Towards Online Buying for Essential Goods During Covid Outbreak. Bi-Lingual International Research Journal, 10(39), 183–191.
43. Peachey, J. W., Zhou, Y., Damon, Z. J., & Burton, L. J. (2015). Forty years of leadership research in sport management: A review, synthesis, and conceptual framework. Journal of Sport Management, 29(5), 570–587.
44. Pham, V. K., Nguyen, T. Le, Do, T. T. H., Tang, M. H., & Thu Hoai, H. Le. (2020). A Study on Switching Behavior Toward Online Shopping of Vietnamese Consumer During the Covid-19 Time. SSRN Electronic Journal. https://doi.org/10.2139/ssrn.3651300
45. Prof. Reema Shah Prof. Upendra More, P. R. P. (2021). " Pre- and Post- analysis of Consumer behavior during Covid-19 lockdown for Online Shopping" PalArch’s Journal of Archaeology of Egypt / Egyptology, 18(7 SE-), 2288–2301. https://archives.palarch.nl/index.php/jae/article/view/8448
46. Putri, D. R., Anna, Z., Rizal, A., & Suryana, A. A. H. (2021). Fish Consumption Behavioral Changes during COVID-19 Pandemic in Bandung City (Case Study in Regol District). Asian Journal of Fisheries and Aquatic Research, July, 27–36. https://doi.org/10.9734/ajfar/2021/v13i130257
47. Rahmanov, F., Mursalov, M., & Rosokhata, A. (2021). Consumer behavior in digital era: impact of COVID 19. Marketing and Management of Innovations, 5(2), 243–251. https://doi.org/10.21272/MMI.2021.2-20
48. Rashid, C., Rahman, M., Chaturvedi, A., & Chand, R. (n.d.). Impact of the COVID-19 on Consumer Behavior Towards Organic Food in India. https://doi.org/10.1007/978-981-33-4236-1_8
49. Rastogi, S., & Ragabiruntha, E. (2018). Financial inclusion and socioeconomic development: gaps and solution. International Journal of Social Economics.
50. Riedell, G. (2021). Consumer Behavior and Coronavirus: How the Pandemic Transformed the American Shopper. Supply Chain Management Undergraduate Honors Theses. https://scholarworks.uark.edu/scmtuht/13
51. Rosita, R. (2020). International Journal of Multi Science Panic Buying in the Covid – 19 Pandemic Era in Indonesia. International Journal of Multi Science, 1(6), 60–70.
52. Roundha, S., & Pabalkar, V. (2021). Consumer’S Impulsive Buying Behavior on E-Commerce Platform: an Exploratory Study on the Influence of External and Internal Factors. International Journal of Modern Agriculture, 10(2), 2021. http://www.modern-journals.com/index.php/ijma/article/view/768
28716th SOUTH ASIAN MANAGEMENT FORUM (SAMF) 2021
53. Salem, M. A., & Md Nor, K. (2020). The Effect Of COVID-19 On Consumer Behaviour In Saudi Arabia: Switching From Brick And Mortar Stores To E-Commerce. International Journal of Scientific & Technology Research, 9(August), 7. www.ijstr.org
54. Sayyida, S., Hartini, S., Gunawan, S., & Husin, S. N. (2021). The Impact of the Covid-19 Pandemic on Retail Consumer Behavior. APTISI Transactions on Management (ATM), 5(1), 79–88. https://doi.org/10.33050/ATM.V5I1.1497
55. Sharma, A., & Mehta, D. M. (2020). Effect of covid-19 consumer buying behavior towards cosmetics: study based on working females, page, 17 (9) (2020). Palarch’s Journal of Archaeology of Egypt/ Egyptology, 17(9), 5155–5175. https://www.archives.palarch.nl/index.php/jae/article/view/4802
56. Sharma, M. H., & Sharma, D. S. (2020). A Marketing Transformation from Societal to Digital-Impact of COVID-19 on Consumer’s Buying Preferences. IBMRD’s Journal of Management & …, 9(2), 25–32. http://ibmrdjournal.com/index.php/ibmrd/article/view/156628
57. Shetty, M., & Shetty, M. (2021). Impact of Covid-19 on Online Shopping Behaviour-a Study With Reference To Mumbai Region. Episteme.Net.In, 10(1), 39–46. http://episteme.net.in/content/73/3910/attachments/5-OnlineShopping.pdf
58. Sihombing, S. O., & Juliana, J. (2021). The Identification of Personal Values and Buying Behavior of Youth During Covid-19 Pandemic in the Indonesian Context. Proceedings of the Ninth International Conference on Entrepreneurship and Business Management (ICEBM 2020), 174(Icebm 2020), 360–367. https://doi.org/10.2991/aebmr.k.210507.055
59. Sneha Roundhal, et. al. (2021). Consumer’s Impulsive Buying Behavior On E-Commerce Platform: An Exploratory Study On The Influence Of External And Internal Factors. International Journal of Modern Agriculture, 10(2), 465–483. http://www.modern-journals.com/index.php/ijma/article/view/768
60. Sobti, N. (2019). Impact of demonetization on diffusion of mobile payment service in India: Antecedents of behavioral intention and adoption using extended UTAUT model. Journal of Advances in Management Research.
61. Tauber, E. M. (1972). Marketing notes and communications: Why do people shop? Journal of Marketing, 36(4), 46–49.
62. Thakur, C., Diwekar, A., Reddy, B. J., & Gajjala, N. (2020). A Study of the Online Impulse Buying Behaviour during COVID-19 Pandemic. International Journal of Research in Engineering, Science and Management, 3(9), 86–90. https://doi.org/10.47607/ijresm.2020.294
63. Tien, N. H., Ngoc, N. M., Ba, D., & Anh, H. (2021). Change of consumer behavior in the post Covid-19 period. International Journal of Multidisciplinary Research and Growth Evaluation, 53–58.
64. Unnikrishnan, A., & Figliozzi, M. A. (2020). A Study of the Impact of COVID-19 on Home Delivery Purchases and Expenditures.
65. Zhang, W., Leng, X., & Liu, S. (2020). Research on mobile impulse purchase intention in the perspective of system users during COVID-19. Personal and Ubiquitous Computing 2020, 1–9. https://doi.org/10.1007/S00779-020-01460-W
288 16th SOUTH ASIAN MANAGEMENT FORUM (SAMF) 2021
Narain Gupta, Management Development Institute Gurgaon, Gurugram, 122001, Haryana, India
Keywords: Cross border business, India, pandemic crisis, manufacturing, services
Abstract
Introduction and motivation
THE PANDEMIC AND THE CROSS BORDER TRADE – AN INDIAN BUSINESS PERSPECTIVE
This paper primarily focuses on the impact of the pandemic on cross-border trade. We used the CMIE (Centre for Monitoring Indian Economy) data to make inferences about the pandemic impact. We also reviewed the relevant literature and news items to draw inferences. The cross-border lockdowns, rules, and restrictions of quarantine have been the primary factor in the crisis and impact on businesses. The shipping, tourism, hotel, healthcare sector, and core manufacturing industries were analyzed for their performance over the past 5 years. The study indicates that the impact on the private sector has been significantly more than on the products regulated by the government. Also, the pandemic impact is more visible in FY21 than in FY20.
The start of Covid-19 in Jan 2020 went unnoticed by the world in its initial months. India sensed the serious implications of the pandemic in March 2020. The series of endless lockdowns in countries led to uncertainties and a significant impact on businesses. Economies depend on its exports, which saw a hit due to travel restrictions and quarantine norms. The Covid cases on the ships led to delays in loading, travel, and delivery of goods from one country to another. The pandemic crisis has changed the way businesses are done. It has brought new experiences, challenges, innovative ideas, and opportunities.There are plenty of studies reporting the cross-border implications. The pandemic is yet not over,
and the uncertainty of its resurgence remains across the globe. The global supply chains have witnessed an impact in 2021. This study is more timely because the impact of a crisis on the supply chain is usually more visible after a few quarters. The bullwhip effect of delay in information sharing, and delays in the movement of supplies from tier 2 suppliers to tier 1 suppliers, and then to manufacturers takes time. The manufacturers many a time maintain the inventories for a few weeks to cover their operations from the risks of inbound supplies.Shanghai, the largest seaport in the world has seen a fall in revenue from USD 5.7 billion in
2018 to USD 3.7 billion in 2020 (Statistica). The total world’s TEU throughput in 2015 was 700 million TEU, which significantly increased to 811 million TEU in 2019, and it lost the growth in the pandemic years (stats.unctad).
In this study, we conducted a limited but relevant review of literature, reviewed the reputed news sources, and collected data from CMIE (Centre for Monitoring Indian Economy). We make our arguments of the impact on cross-border trade by the time series trends in the most impacted industries due to the pandemic and the one which has a direct impact on the cross-border trade. We plan to further collect data from other countries, their exports, imports, and other macro-economic data such as GDP, and shipping volumes to gauge the overall impact. The pandemic
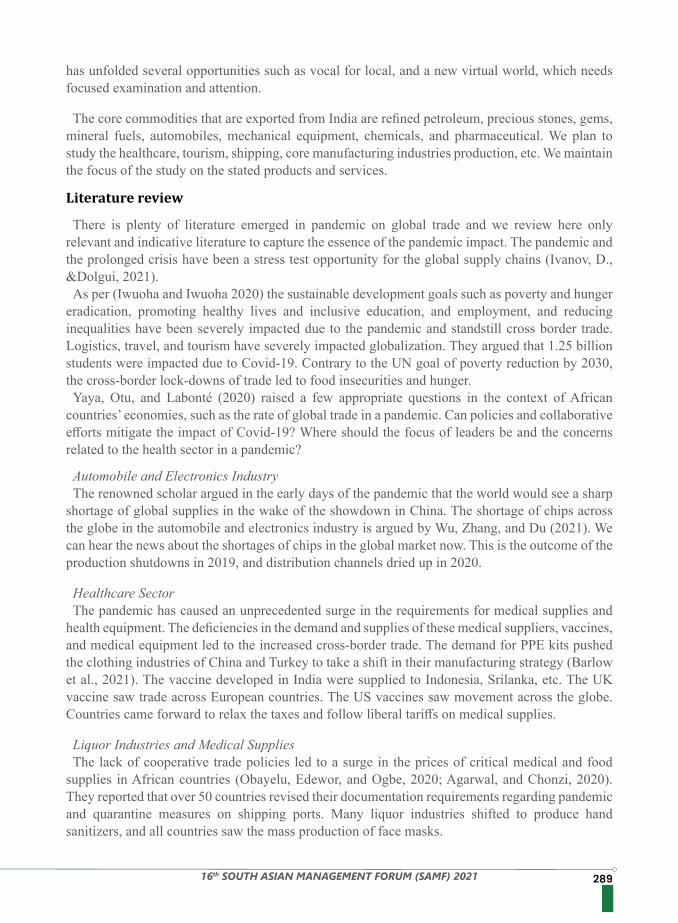
28916th SOUTH ASIAN MANAGEMENT FORUM (SAMF) 2021
has unfolded several opportunities such as vocal for local, and a new virtual world, which needs focused examination and attention.
The core commodities that are exported from India are refined petroleum, precious stones, gems, mineral fuels, automobiles, mechanical equipment, chemicals, and pharmaceutical. We plan to study the healthcare, tourism, shipping, core manufacturing industries production, etc. We maintain the focus of the study on the stated products and services.
There is plenty of literature emerged in pandemic on global trade and we review here only relevant and indicative literature to capture the essence of the pandemic impact. The pandemic and the prolonged crisis have been a stress test opportunity for the global supply chains (Ivanov, D., &Dolgui, 2021).As per (Iwuoha and Iwuoha 2020) the sustainable development goals such as poverty and hunger
eradication, promoting healthy lives and inclusive education, and employment, and reducing inequalities have been severely impacted due to the pandemic and standstill cross border trade. Logistics, travel, and tourism have severely impacted globalization. They argued that 1.25 billion students were impacted due to Covid-19. Contrary to the UN goal of poverty reduction by 2030, the cross-border lock-downs of trade led to food insecurities and hunger.Yaya, Otu, and Labonté (2020) raised a few appropriate questions in the context of African
countries’ economies, such as the rate of global trade in a pandemic. Can policies and collaborative efforts mitigate the impact of Covid-19? Where should the focus of leaders be and the concerns related to the health sector in a pandemic?
Automobile and Electronics IndustryThe renowned scholar argued in the early days of the pandemic that the world would see a sharp
shortage of global supplies in the wake of the showdown in China. The shortage of chips across the globe in the automobile and electronics industry is argued by Wu, Zhang, and Du (2021). We can hear the news about the shortages of chips in the global market now. This is the outcome of the production shutdowns in 2019, and distribution channels dried up in 2020.
Healthcare SectorThe pandemic has caused an unprecedented surge in the requirements for medical supplies and
health equipment. The deficiencies in the demand and supplies of these medical suppliers, vaccines, and medical equipment led to the increased cross-border trade. The demand for PPE kits pushed the clothing industries of China and Turkey to take a shift in their manufacturing strategy (Barlow et al., 2021). The vaccine developed in India were supplied to Indonesia, Srilanka, etc. The UK vaccine saw trade across European countries. The US vaccines saw movement across the globe. Countries came forward to relax the taxes and follow liberal tariffs on medical supplies.
Liquor Industries and Medical SuppliesThe lack of cooperative trade policies led to a surge in the prices of critical medical and food
supplies in African countries (Obayelu, Edewor, and Ogbe, 2020; Agarwal, and Chonzi, 2020). They reported that over 50 countries revised their documentation requirements regarding pandemic and quarantine measures on shipping ports. Many liquor industries shifted to produce hand sanitizers, and all countries saw the mass production of face masks.
Literature review
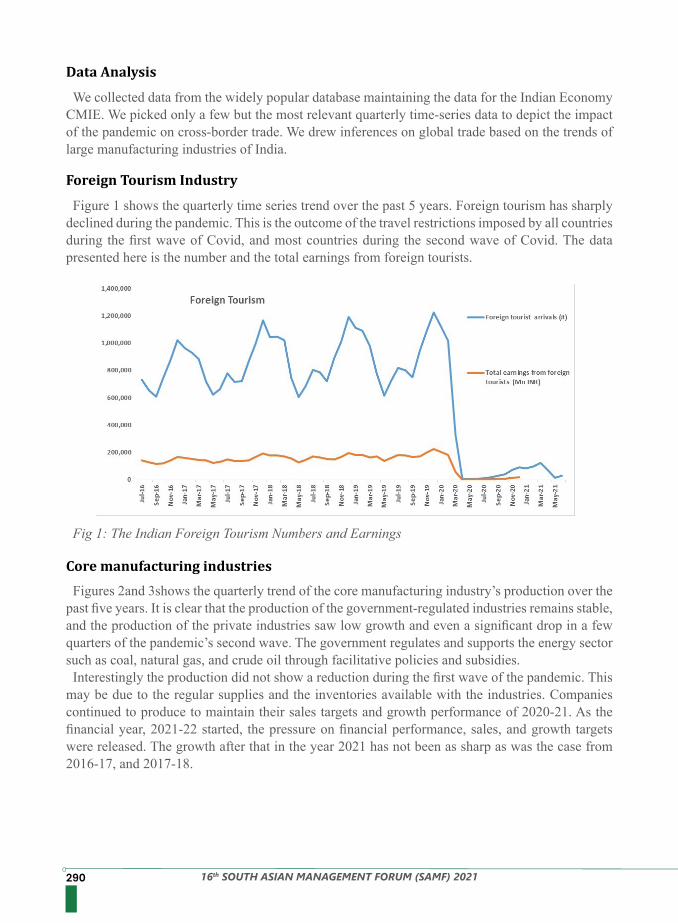
290 16th SOUTH ASIAN MANAGEMENT FORUM (SAMF) 2021
We collected data from the widely popular database maintaining the data for the Indian Economy CMIE. We picked only a few but the most relevant quarterly time-series data to depict the impact of the pandemic on cross-border trade. We drew inferences on global trade based on the trends of large manufacturing industries of India.
Figure 1 shows the quarterly time series trend over the past 5 years. Foreign tourism has sharply declined during the pandemic. This is the outcome of the travel restrictions imposed by all countries during the first wave of Covid, and most countries during the second wave of Covid. The data presented here is the number and the total earnings from foreign tourists.
Figures 2and 3shows the quarterly trend of the core manufacturing industry’s production over the past five years. It is clear that the production of the government-regulated industries remains stable, and the production of the private industries saw low growth and even a significant drop in a few quarters of the pandemic’s second wave. The government regulates and supports the energy sector such as coal, natural gas, and crude oil through facilitative policies and subsidies.Interestingly the production did not show a reduction during the first wave of the pandemic. This
may be due to the regular supplies and the inventories available with the industries. Companies continued to produce to maintain their sales targets and growth performance of 2020-21. As the financial year, 2021-22 started, the pressure on financial performance, sales, and growth targets were released. The growth after that in the year 2021 has not been as sharp as was the case from 2016-17, and 2017-18.
Fig 1: The Indian Foreign Tourism Numbers and Earnings
Data Analysis
Foreign Tourism Industry
Core manufacturing industries
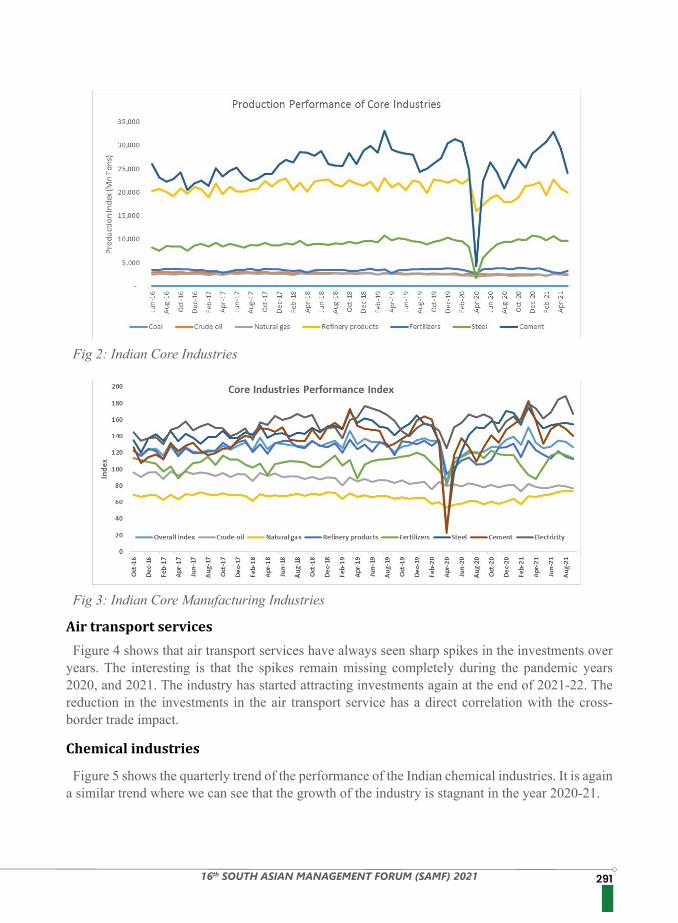
29116th SOUTH ASIAN MANAGEMENT FORUM (SAMF) 2021
Air transport services
Chemical industries
Fig 2: Indian Core Industries
Fig 3: Indian Core Manufacturing Industries
Figure 4 shows that air transport services have always seen sharp spikes in the investments over years. The interesting is that the spikes remain missing completely during the pandemic years 2020, and 2021. The industry has started attracting investments again at the end of 2021-22. The reduction in the investments in the air transport service has a direct correlation with the cross-border trade impact.
Figure 5 shows the quarterly trend of the performance of the Indian chemical industries. It is again a similar trend where we can see that the growth of the industry is stagnant in the year 2020-21.
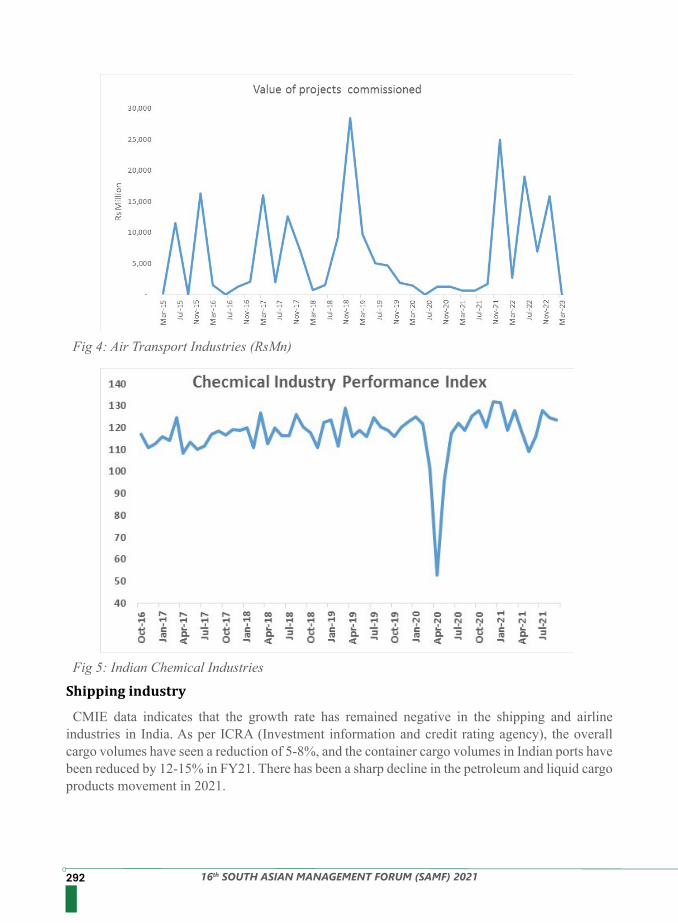
292 16th SOUTH ASIAN MANAGEMENT FORUM (SAMF) 2021
Shipping industry
Fig 4: Air Transport Industries (RsMn)
Fig 5: Indian Chemical Industries
CMIE data indicates that the growth rate has remained negative in the shipping and airline industries in India. As per ICRA (Investment information and credit rating agency), the overall cargo volumes have seen a reduction of 5-8%, and the container cargo volumes in Indian ports have been reduced by 12-15% in FY21. There has been a sharp decline in the petroleum and liquid cargo products movement in 2021.
29316th SOUTH ASIAN MANAGEMENT FORUM (SAMF) 2021
The study is timely to capture the pandemic impacts over the last 20 months. It comprehends the trade impact status and brings new insights on cross order trade from the Indian industries’ time series data. We observed a significant impact of the Covid on the products in the private sector, while the impact has been less severe on the products regulated by the government. The Covid has also impacted the global shipping volumes, which can be inferred from the impact on Indian ports impacts. The travel restrictions and various quarantine rules have restricted the movement of people, and goods and badly impacted the economies. The industries maintained stable production and performance in FY20, the more significant impact is visible in FY21. The probable reasons for this can be the stable supply chains, inventories, supplies, and the performance targets of the firms in FY20.The pandemic has also left several positive opportunities. The negative impact of the Covid on
cross-border trade has forced the industries and governments to look for local solutions. This led to the prosperity of the domestic industries(Covid-19: Challenge to SDG and Globalization). The services industries not only remain largely unaffected but explored new avenues to operate virtually.This study was able to collect data from only the Indian economy. It is recommended that the
future scholars collect the similar data from other major developing economies such as China, and South Asian countries, and also from a few developed economies such as the USA, the UK, Germany, France, and Australia to make a comparison of the cross order impact. The study did not cover the services industries because it was less impacted by the pandemic. The scholars may study the opportunities unfolded by the pandemic from virtual operations such as environmental savings, time and cost savings due to less travel, real estate, and even more work-life balance, less stressful life, and more socialization opportunities in the society.
1. Agarwal, P., &Chonzi, M. (2020). Impact of COVID-19 on international trade: Lessons for African LDCs. Available at SSRN 3693901.
2. Barlow, P., van Schalkwyk, M. C., McKee, M., Labonté, R., &Stuckler, D. (2021). COVID-19 and the collapse of global trade: building an effective public health response. The Lancet Planetary Health, 5(2), e102-e107.
3. Iwuoha, J. C., & Jude-Iwuoha, A. U. (2020). COVID-19: Challenge to SDG and Globalization. Electronic Research Journal of Social Sciences and Humanities, 2.
4. Ivanov, D., &Dolgui, A. (2021). Stress testing supply chains and creating viable ecosystems. Operations Management Research, 1-12.
5. Obayelu, A. E., Edewor, S. E., &Ogbe, A. O. (2020). Trade effects, policy responses, and opportunities of COVID-19 outbreak in Africa. Journal of Chinese Economic and Foreign Trade Studies.
6. Wu, X., Zhang, C., & Du, W. (2021, July). An analysis on the crisis of “chips shortage” in automobile industry——Based on the double influence of COVID-19 and trade friction. In Journal of Physics: Conference Series (Vol. 1971, No. 1, p. 012100). IOP Publishing.
7. Yaya, S., Otu, A., &Labonté, R. (2020). Globalization in the time of COVID-19: repositioning Africa to meet the immediate and remote challenges. Globalization and Health, 16(1), 1-7.
References
Conclusion, future directions, limitations
294 16th SOUTH ASIAN MANAGEMENT FORUM (SAMF) 2021
Abstract
Introduction
FACTORS AFFECTING ORGANIZATIONAL ASPECTS ON SALES PEOPLES’ PERFORMANCE: THE MODERATING EFFECT OF SALES
PEOPLES’ POLITICAL SKILL
The mobile telecommunication service market is notable in the market environments which are mostly unstable due to extended market challenges and changes. Thus, the concerns for the marketers are essential to consider the choice of the buyers and also to satisfy them. By considering these, the purpose of this research has been set to focus on the sales persons’ performance influencing variables related to mobile telecommunication service companies. Here the study was conducted by using both primary and secondary sources of data. The survey used a structured questionnaire having five-point scales, 1 representing ‘Fully Disagreed’ and 5 being ‘Fully Agreed’. Data were analyzed by using descriptive and inferential statistical tools. Descriptive statistics are used to describe the characteristics of mobile service providers in Bangladesh and inferential statistics are used to identify the issues by which sales person’s performance in Bangladesh is affected. Structural Equation Modeling (SEM) was used to analyze the data. The convenient sampling method was used to collect the data from active salespeople. Motivation, organizational commitment, compensation, and salespeople’s political skill are expected to have an important connection with the performance of the salesmen, while, satisfaction from the job may not have any major impact on the performance of the salespeople. This study is a basis for further research in the high rising mobile telecommunication industry.
The market environment is very much unstable in the mobile telecommunication industry in Bangladesh due to huge competition and rapid changes. Mobile companies are looking for satisfying buyers and influencing their purchasing choices through several marketing strategies. So the purpose of the study is set to identify the influencing factors on the performance of the salespersons in the mobile telecommunication industry in Bangladesh. The salespeople’s job is drawing special concentration because the success of business organizations like the telecommunication industry highly depends on this. For this reason, various psychological researches were done by which important factors of sales performance have been identified (Vinchur, Shippmann, Switzer, & Roth, 1998). In adding together, in the telecommunication sector, attractive salespeople’s performance through sales force motivation is a growing issue (Dutt, 2015). Besides, the telecommunication industry is growing rapidly despite the economic recession and high competition (Uddin et al., 2013). Therefore, sales people’s higher performance in the mobile service company is very essential to generate more profit in the organizations. Besides, this study is important since an effective
Keywords: Bangladesh, Sales Person, Performance, Organizational Commitment, Motivation, Political Skill, Job Satisfaction.
Mohitul Ameen Ahmed Mustafi1
PhD. Research FellowMd. Shah Ali Dolon1
PhD. Research FellowMd. Sayem Al Amin1
PhD. Research Fellow1PhD. Research Fellow, Logistic Engineering & Management, Chang’an University, China
29516th SOUTH ASIAN MANAGEMENT FORUM (SAMF) 2021
Significance
Review of LiteratureSales People’s Performance
Empirical studies (Payne et al., 2001) show that sales representatives maintain prompts expanded sales quality which expands sales. Moreover, salespeople’s performance is important for the future growth and success of all industries (Magandini and Ngwenya, 2015). Developing advanced business sector needs makes it difficult for clients to communicate their future needs and prerequisites. This study is very significant, since there are a few empirical evidences on salespeople’s performance in the telecommunication industry in Bangladesh, specifically how the political skill of the salespeople affects the performance in an organization. This study will contribute to developing an effective performance of the salespeople in the telecommunication industry and will also help future studies as supporting evidence. Salespeople’s higher performance in the mobile service company is essential to generate profit for the organizations. Besides, this study is important since the effective performance of the salespeople is essential for developing a business organization (Dutt, 2015).
The awareness of sales management practices is a component of business firms that achieve high levels of efficiency (Parvinen et al., 2013). This is critical in identifying the factors associated with improved salespeople performance in order to improve sales management or administration activities and build a company’s competitive advantage (Román and Rodrguez, 2015). The previous study investigated the effect of other hierarchical and administration-related elements, other than salespeople performance, on demonstrating an understanding of the adequacy of sales firms (Buciuniene and Skudiene, 2015; Hossain et al., 2016; Dey et al., 2016). Furthermore, salespeople’s performance is one of the most important factors influencing sales volume, productivity, customer loyalty, and unanticipated expenses (Buciuniene and Skudiene, 2015). According to Miao and Evans (2013), salespeople’s performance in the business organization is critical because they deal with critical financial, product, and client data that can easily be exchanged from one organization to the next. As a result, business people’s inspiration and responsibility to organizations are critical factors in the long-term success of organizations. Furthermore, this research will aid in determining salespeople’s compensation, job satisfaction, intrinsic motivation, external (extrinsic) motivation, and organizational commitment (Zain and Dahari, 2011; Zain and Jan 2014). Furthermore, salespeople’s performance is critical for organizations (Rahman et al., 2014) because they deal with critical finance, product or item, and client information that can simply be exchanged from one organization to the next. As a result, salespeople’s performance and responsibility to the organization are critical variables in the organization’s long-haul success (Buciuniene and Skudiene, 2015).
performance of the salespeople is essential for developing a business organization (Dutt, 2015), but there is no comprehensive study on salespeople performance in the telecommunication industry in Bangladesh (Uddin et al., 2013; Ahmed and Rouf, 2015). However, along with these statements, the rationalization of this study will examine the aspects that affect the higher performance of the salespeople working in the telecommunication industry in Bangladesh. Furthermore, effective and efficient performance of salespeople in the telecommunication industry is a major aspect globally, but researchers have given very little attention to this sector, particularly in the context of Bangladesh where a few empirical studies have been conducted in this area. Thus, this study is expected to contribute to filling this gap by conducting an exploratory study on salespeople’s performance in the telecommunication industry in Bangladesh.
296 16th SOUTH ASIAN MANAGEMENT FORUM (SAMF) 2021
Job Satisfaction
Organizational Commitment
Compensation
Job satisfaction is a synthesis of feelings about the work environment, workload, pay, organizational culture, job security, and so on. However, validation of job satisfaction of salespeople’s performance is a stumbling block in the overall style. In Bangladesh, a thoughtful examination of various aspects of job satisfaction has been conceived. The empirical study, according to Mittal, Gera, and Singhvi (2012), precisely concentrates on the measurements of salespeople performance as perceived by sales experts in India and observationally tested the forerunner relationship of sales peoples’ recognitions with their overall satisfaction with sales force automation devices. Previous research indicates that a variety of factors, including recognition of effort and results (Jensen, McMullen, and Stark 2008), personal growth and ability, leadership and supervisor feedback (Buciuniene and Skudiene, 2008), financial compensation and incentives, employee autonomy, and teamwork, have a strong influence on salespeople’s performance and lead to a stronger relationship with the organization.H1: Job satisfaction is significantly related to the performance of the salespeople.
When it comes to making decisions about their employees, company managers and leaders frequently face a lack of information. Employee commitment and engagement in their work information are extremely useful for management in making effective decisions (Einolander & Jarno, 2015). Other forms of commitment, such as occupation, job, workgroup, union, and work itself, have already been influenced by the conceptual and operational development of organizational commitment (Cohen, 2007).H2: Organizational commitment has a positive impact on salespeople’s performance.
Compensation is the sum of cash and non-cash benefits received by an employee from his or her employer in exchange for the work performed in the organization. It is one of the most significant amounts of money that businesses spend on their employees. Compensation is more than just an employee’s regular pay. It also includes some other types of remuneration. Although effective management and motivation of a company’s sales force are important to the advertising and marketing success of numerous products, little is thought about the empirical significance of one component of the sales management arsenal: salespeople compensation in the business organization. Rouziès (2011) provides extremely aggregate observational confirmation on sales force compensation hones that is largely consistent with forecasts in the quantitative analytical literature; however, the information is excessively collective, making conclusive statements impossible. In the prompt sales compensation plan, salespeople’s performance is rewarded, for the most part by taking into account the brief deals they have made, and thus the plan can inspire the salespeople to offer a specific product that is profitable for the organization. However, according to Segalla, Rouziès, Besson, and Weitz (2006), the requirement for salespeople’s compensation and the weight to make a sale may push salespeople to focus more on advancing a specific type of product. To address this issue, organizations could provide long-term compensation to salespeople rather than a high immediate remuneration (Ryals and Rogers, 2005). Some companies, in a long-term payment plan, only pay salespeople a small portion of their salary each period. According to Bomers, Cole, and Reimink (2016), the advantage of this salespeople compensation practice is that it requires sales operators to continue providing services to clients at all times, making them less fleeting cantered.
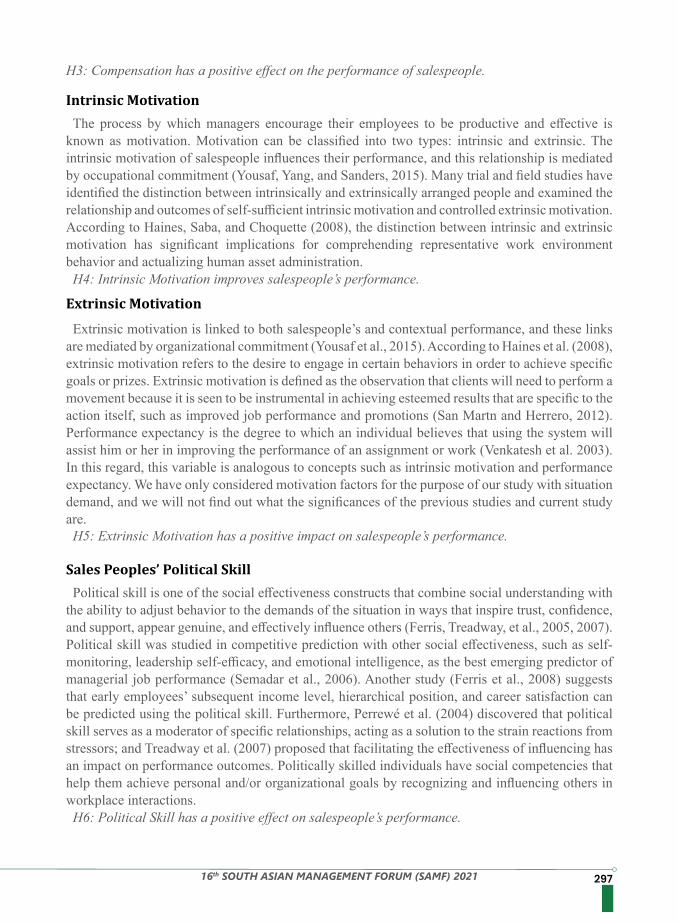
29716th SOUTH ASIAN MANAGEMENT FORUM (SAMF) 2021
Intrinsic Motivation
Extrinsic Motivation
Sales Peoples’ Political Skill
The process by which managers encourage their employees to be productive and effective is known as motivation. Motivation can be classified into two types: intrinsic and extrinsic. The intrinsic motivation of salespeople influences their performance, and this relationship is mediated by occupational commitment (Yousaf, Yang, and Sanders, 2015). Many trial and field studies have identified the distinction between intrinsically and extrinsically arranged people and examined the relationship and outcomes of self-sufficient intrinsic motivation and controlled extrinsic motivation. According to Haines, Saba, and Choquette (2008), the distinction between intrinsic and extrinsic motivation has significant implications for comprehending representative work environment behavior and actualizing human asset administration.H4: Intrinsic Motivation improves salespeople’s performance.
Extrinsic motivation is linked to both salespeople’s and contextual performance, and these links are mediated by organizational commitment (Yousaf et al., 2015). According to Haines et al. (2008), extrinsic motivation refers to the desire to engage in certain behaviors in order to achieve specific goals or prizes. Extrinsic motivation is defined as the observation that clients will need to perform a movement because it is seen to be instrumental in achieving esteemed results that are specific to the action itself, such as improved job performance and promotions (San Martn and Herrero, 2012). Performance expectancy is the degree to which an individual believes that using the system will assist him or her in improving the performance of an assignment or work (Venkatesh et al. 2003). In this regard, this variable is analogous to concepts such as intrinsic motivation and performance expectancy. We have only considered motivation factors for the purpose of our study with situation demand, and we will not find out what the significances of the previous studies and current study are. H5: Extrinsic Motivation has a positive impact on salespeople’s performance.
Political skill is one of the social effectiveness constructs that combine social understanding with the ability to adjust behavior to the demands of the situation in ways that inspire trust, confidence, and support, appear genuine, and effectively influence others (Ferris, Treadway, et al., 2005, 2007). Political skill was studied in competitive prediction with other social effectiveness, such as self-monitoring, leadership self-efficacy, and emotional intelligence, as the best emerging predictor of managerial job performance (Semadar et al., 2006). Another study (Ferris et al., 2008) suggests that early employees’ subsequent income level, hierarchical position, and career satisfaction can be predicted using the political skill. Furthermore, Perrewé et al. (2004) discovered that political skill serves as a moderator of specific relationships, acting as a solution to the strain reactions from stressors; and Treadway et al. (2007) proposed that facilitating the effectiveness of influencing has an impact on performance outcomes. Politically skilled individuals have social competencies that help them achieve personal and/or organizational goals by recognizing and influencing others in workplace interactions.H6: Political Skill has a positive effect on salespeople’s performance.
H3: Compensation has a positive effect on the performance of salespeople.
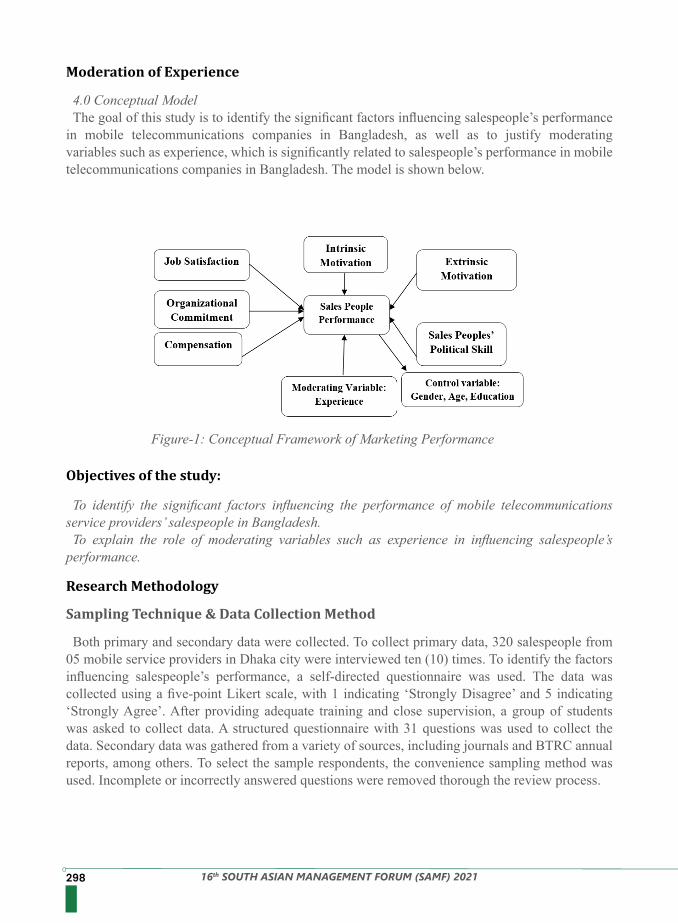
298 16th SOUTH ASIAN MANAGEMENT FORUM (SAMF) 2021
Moderation of Experience
Objectives of the study:
Research Methodology
Sampling Technique & Data Collection Method
4.0 Conceptual ModelThe goal of this study is to identify the significant factors influencing salespeople’s performance
in mobile telecommunications companies in Bangladesh, as well as to justify moderating variables such as experience, which is significantly related to salespeople’s performance in mobile telecommunications companies in Bangladesh. The model is shown below.
To identify the significant factors influencing the performance of mobile telecommunications service providers’ salespeople in Bangladesh.To explain the role of moderating variables such as experience in influencing salespeople’s
performance.
Both primary and secondary data were collected. To collect primary data, 320 salespeople from 05 mobile service providers in Dhaka city were interviewed ten (10) times. To identify the factors influencing salespeople’s performance, a self-directed questionnaire was used. The data was collected using a five-point Likert scale, with 1 indicating ‘Strongly Disagree’ and 5 indicating ‘Strongly Agree’. After providing adequate training and close supervision, a group of students was asked to collect data. A structured questionnaire with 31 questions was used to collect the data. Secondary data was gathered from a variety of sources, including journals and BTRC annual reports, among others. To select the sample respondents, the convenience sampling method was used. Incomplete or incorrectly answered questions were removed thorough the review process.
Figure-1: Conceptual Framework of Marketing Performance
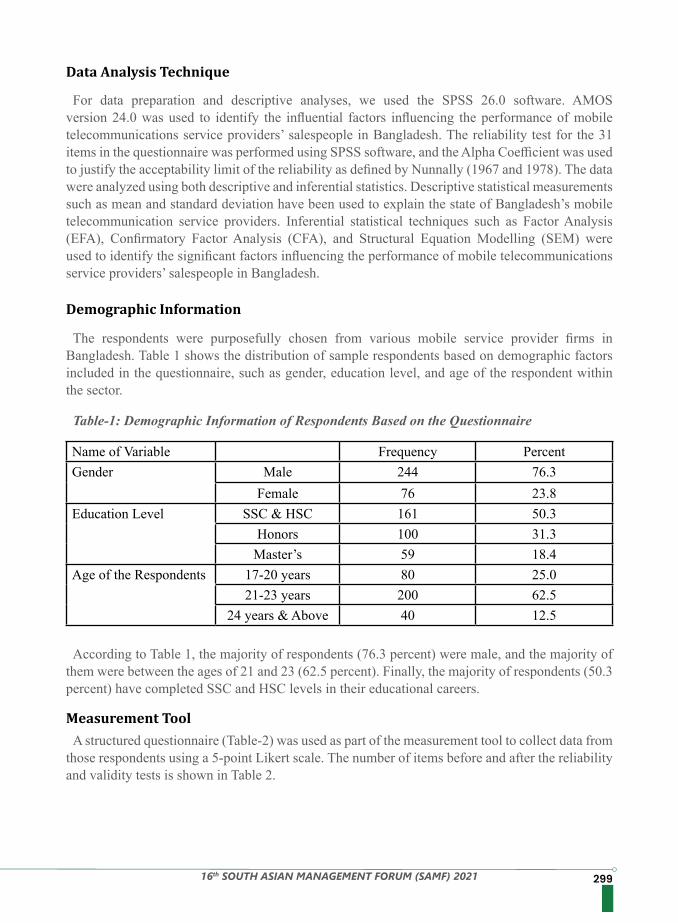
29916th SOUTH ASIAN MANAGEMENT FORUM (SAMF) 2021
Data Analysis Technique
Demographic Information
Measurement Tool
For data preparation and descriptive analyses, we used the SPSS 26.0 software. AMOS version 24.0 was used to identify the influential factors influencing the performance of mobile telecommunications service providers’ salespeople in Bangladesh. The reliability test for the 31 items in the questionnaire was performed using SPSS software, and the Alpha Coefficient was used to justify the acceptability limit of the reliability as defined by Nunnally (1967 and 1978). The data were analyzed using both descriptive and inferential statistics. Descriptive statistical measurements such as mean and standard deviation have been used to explain the state of Bangladesh’s mobile telecommunication service providers. Inferential statistical techniques such as Factor Analysis (EFA), Confirmatory Factor Analysis (CFA), and Structural Equation Modelling (SEM) were used to identify the significant factors influencing the performance of mobile telecommunications service providers’ salespeople in Bangladesh.
The respondents were purposefully chosen from various mobile service provider firms in Bangladesh. Table 1 shows the distribution of sample respondents based on demographic factors included in the questionnaire, such as gender, education level, and age of the respondent within the sector.
According to Table 1, the majority of respondents (76.3 percent) were male, and the majority of them were between the ages of 21 and 23 (62.5 percent). Finally, the majority of respondents (50.3 percent) have completed SSC and HSC levels in their educational careers.
A structured questionnaire (Table-2) was used as part of the measurement tool to collect data from those respondents using a 5-point Likert scale. The number of items before and after the reliability and validity tests is shown in Table 2.
Table-1: Demographic Information of Respondents Based on the Questionnaire
Name of Variable Frequency PercentGender Male 244 76.3
Female 76 23.8Education Level SSC & HSC 161 50.3
Honors 100 31.3Master’s 59 18.4
Age of the Respondents 17-20 years 80 25.021-23 years 200 62.5
24 years & Above 40 12.5
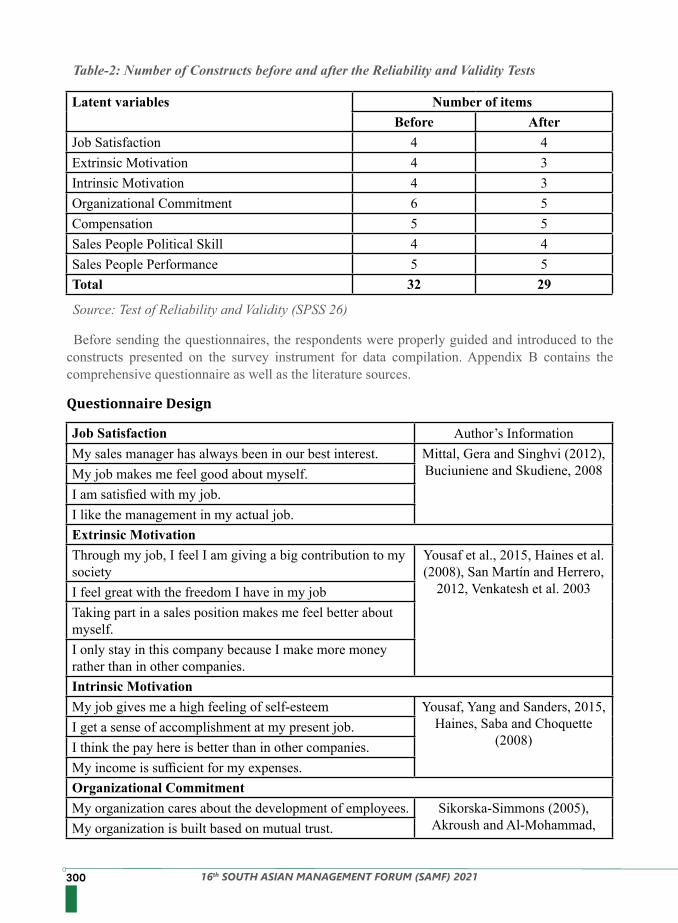
300 16th SOUTH ASIAN MANAGEMENT FORUM (SAMF) 2021
Table-2: Number of Constructs before and after the Reliability and Validity Tests
Source: Test of Reliability and Validity (SPSS 26)
Latent variables Number of itemsBefore After
Job Satisfaction 4 4Extrinsic Motivation 4 3Intrinsic Motivation 4 3Organizational Commitment 6 5Compensation 5 5Sales People Political Skill 4 4Sales People Performance 5 5Total 32 29
Job Satisfaction Author’s InformationMy sales manager has always been in our best interest. Mittal, Gera and Singhvi (2012),
Buciuniene and Skudiene, 2008My job makes me feel good about myself.I am satisfied with my job.I like the management in my actual job.Extrinsic MotivationThrough my job, I feel I am giving a big contribution to my society
Yousaf et al., 2015, Haines et al. (2008), San Martín and Herrero,
2012, Venkatesh et al. 2003I feel great with the freedom I have in my jobTaking part in a sales position makes me feel better about myself.I only stay in this company because I make more money rather than in other companies.Intrinsic MotivationMy job gives me a high feeling of self-esteem Yousaf, Yang and Sanders, 2015,
Haines, Saba and Choquette (2008)
I get a sense of accomplishment at my present job.I think the pay here is better than in other companies.My income is sufficient for my expenses.Organizational CommitmentMy organization cares about the development of employees. Sikorska-Simmons (2005),
Akroush and Al-Mohammad,My organization is built based on mutual trust.
Before sending the questionnaires, the respondents were properly guided and introduced to the constructs presented on the survey instrument for data compilation. Appendix B contains the comprehensive questionnaire as well as the literature sources.
Questionnaire Design
30116th SOUTH ASIAN MANAGEMENT FORUM (SAMF) 2021
My organization has a high degree of support for its employees.
(2010); Rahman et al., (2014). Buciuniene and Skudiene (2015) Cogliser et al., 2009; Boles et al.,
2012;I am extremely happy to be part of this organization.I like the leadership and management style of my organization.CompensationI am satisfied with the remuneration I get compared to my performance.
Rouziès (2011), Segalla, Rouziès, Besson and Weitz (2006), Ryals and Rogers, 2005, Bomers, Cole and
Reimink (2016)
The sales compensation plan rewards for performance in areas I can control.I like the remuneration I get in my job.There is a clear link between my performance and my compensation.My salary and other compensation packages are good in comparison with others.Sales People Political SkillThe influence of those who work with me in the factory inspires me more
Ferris, Treadway et al., 2005, 2007, Semadar et al., 2006, Ferris et al., 2008, Perrewé et al., (2004), Treadway et
al., (2007)
Social intelligence helps me to work faster Networking capabilities help me sell products I think the issue of strong sincerity in selling the product is very important Sales People PerformanceI quickly sell high volumes of new products. Parvinen et al., 2013, Román
and Rodríguez, 2015,; Hossain et al., 2016; Dey et al., 2016, Miao and Evans (2013), Zain and Dahari, 2011; Zain and Jan, 2014,
Zain and Dahari, 2011
I can reach the sales targets set by my manager.I bring a high market share for my company.I am one of the highest achievers in my department.I am one of the highest performers in terms of plan-ning and time management in my team.
In terms of skewness, our indicators of latent factors had a fairly normal distribution. Kurtosis values ranged between 1.061 and.93. While this violates strict normality rules, it is within more relaxed rules, as suggested by Sposito et al. (1983), who recommend 3.3 as the upper normality threshold (Table 3).
The data showed a fairly normal distribution that permitted the researchers to continue the study.
Data AnalysisNormality of the Data

302 16th SOUTH ASIAN MANAGEMENT FORUM (SAMF) 2021
Multivariate Normality
7.3 Preliminary analysisTable 4: displays the descriptive statistics for the variables, including means, standard deviations,
reliabilities, and zero-order correlations. The estimated path connected all of the study’s key variables.
Figure-1: Multivariate Normality of SalesPeople Performance
Table 04: Correlations
Mean SD Gender Age Educa-tion
Experi-ence
SPP SPPS EXT_MOT
INT_MOT JS COM OC
Gen-der
1.24 0.43 1.00
Age 1.88 0.60 -.325** 1.00
Educa-tion
2.18 1.01 -0.09 .401** 1.00
Expe-rience
4.33 2.75 -0.02 0.10 .172** 1.00
SPP 3.58 0.76 0.04 0.02 -.142* 0.00 1.00
SPPS 2.95 0.61 -0.03 -0.07 -0.02 .157** .427** 1.00
EXT_MOT
3.23 0.47 0.01 0.04 0.00 0.07 .537** .403** 1.00
INT_MOT
2.47 0.58 -0.09 -0.03 0.03 .226** .316** .692** .371** 1.00
JS 2.41 1.01 -.252** 0.10 0.07 .196** 0.09 .268** .130* .442** 1.00
COM 2.22 0.74 -0.02 -0.01 0.04 .249** .216** .254** .206** .402** .260** 1.00
OC 1.76 0.82 .146** 0.02 -0.05 -.170** -.16** -.38** -.184** -.472** -.62** -0.08 1
**. Correlation is significant at the 0.01 level (2-tailed). *. Correlation is significant at the 0.05 level (2-tailed).
Notes: N=320. SPP, SPPS, EXT_MOT, IN_MOT, JS, COM, and OC are factors of Sales People’s Performance. Age group (years): 17-20 years=1, 21-23 years=2, 24 years and above=3.
The authors used a cook’s distance analysis (figure-1) to see if there were any (multivariate) influential outliers. In this study, no case of a cook’s distance greater than one was found. The majority of the cases had a p-value of less than 0.05. This result indicates that all of the items are distributed normally
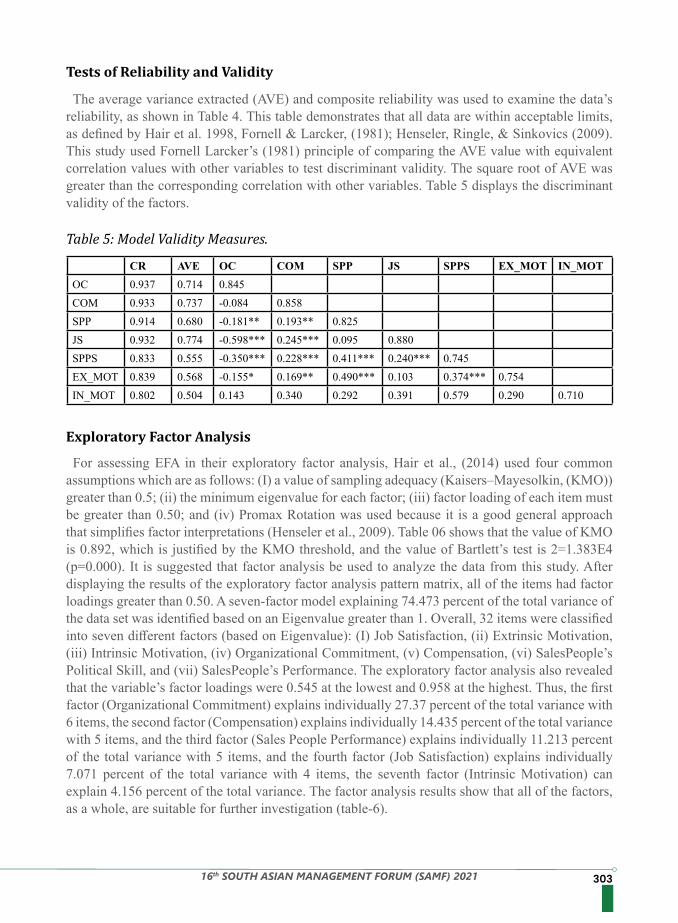
30316th SOUTH ASIAN MANAGEMENT FORUM (SAMF) 2021
Tests of Reliability and Validity
Exploratory Factor Analysis
Table 5: Model Validity Measures.
The average variance extracted (AVE) and composite reliability was used to examine the data’s reliability, as shown in Table 4. This table demonstrates that all data are within acceptable limits, as defined by Hair et al. 1998, Fornell & Larcker, (1981); Henseler, Ringle, & Sinkovics (2009). This study used Fornell Larcker’s (1981) principle of comparing the AVE value with equivalent correlation values with other variables to test discriminant validity. The square root of AVE was greater than the corresponding correlation with other variables. Table 5 displays the discriminant validity of the factors.
For assessing EFA in their exploratory factor analysis, Hair et al., (2014) used four common assumptions which are as follows: (I) a value of sampling adequacy (Kaisers–Mayesolkin, (KMO)) greater than 0.5; (ii) the minimum eigenvalue for each factor; (iii) factor loading of each item must be greater than 0.50; and (iv) Promax Rotation was used because it is a good general approach that simplifies factor interpretations (Henseler et al., 2009). Table 06 shows that the value of KMO is 0.892, which is justified by the KMO threshold, and the value of Bartlett’s test is 2=1.383E4 (p=0.000). It is suggested that factor analysis be used to analyze the data from this study. After displaying the results of the exploratory factor analysis pattern matrix, all of the items had factor loadings greater than 0.50. A seven-factor model explaining 74.473 percent of the total variance of the data set was identified based on an Eigenvalue greater than 1. Overall, 32 items were classified into seven different factors (based on Eigenvalue): (I) Job Satisfaction, (ii) Extrinsic Motivation, (iii) Intrinsic Motivation, (iv) Organizational Commitment, (v) Compensation, (vi) SalesPeople’s Political Skill, and (vii) SalesPeople’s Performance. The exploratory factor analysis also revealed that the variable’s factor loadings were 0.545 at the lowest and 0.958 at the highest. Thus, the first factor (Organizational Commitment) explains individually 27.37 percent of the total variance with 6 items, the second factor (Compensation) explains individually 14.435 percent of the total variance with 5 items, and the third factor (Sales People Performance) explains individually 11.213 percent of the total variance with 5 items, and the fourth factor (Job Satisfaction) explains individually 7.071 percent of the total variance with 4 items, the seventh factor (Intrinsic Motivation) can explain 4.156 percent of the total variance. The factor analysis results show that all of the factors, as a whole, are suitable for further investigation (table-6).
CR AVE OC COM SPP JS SPPS EX_MOT IN_MOTOC 0.937 0.714 0.845COM 0.933 0.737 -0.084 0.858SPP 0.914 0.680 -0.181** 0.193** 0.825JS 0.932 0.774 -0.598*** 0.245*** 0.095 0.880SPPS 0.833 0.555 -0.350*** 0.228*** 0.411*** 0.240*** 0.745EX_MOT 0.839 0.568 -0.155* 0.169** 0.490*** 0.103 0.374*** 0.754IN_MOT 0.802 0.504 0.143 0.340 0.292 0.391 0.579 0.290 0.710
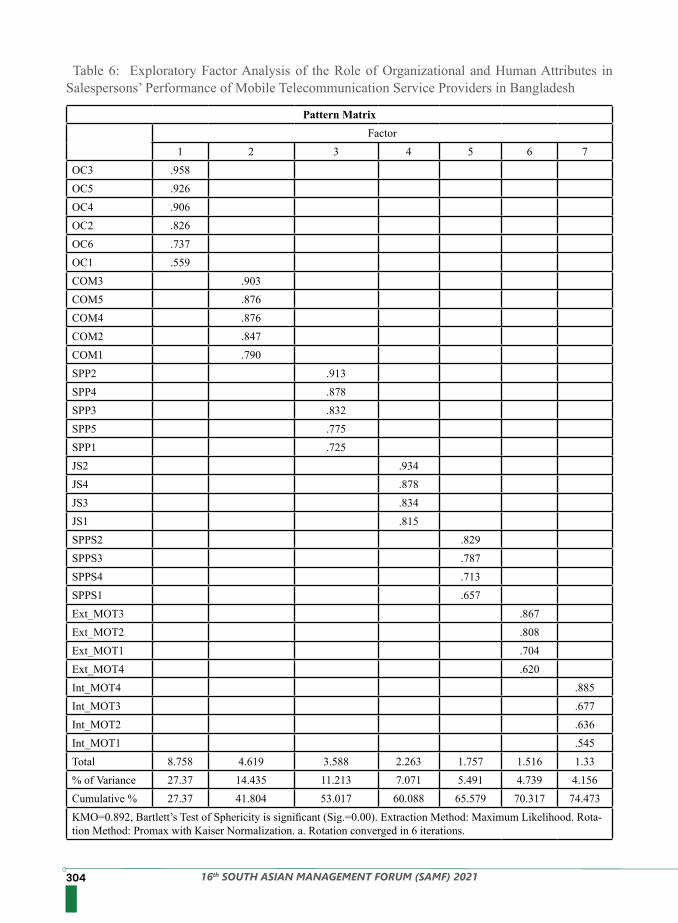
304 16th SOUTH ASIAN MANAGEMENT FORUM (SAMF) 2021
Table 6: Exploratory Factor Analysis of the Role of Organizational and Human Attributes in Salespersons’ Performance of Mobile Telecommunication Service Providers in Bangladesh
Pattern MatrixFactor
1 2 3 4 5 6 7OC3 .958OC5 .926OC4 .906OC2 .826OC6 .737OC1 .559COM3 .903COM5 .876COM4 .876COM2 .847COM1 .790SPP2 .913SPP4 .878SPP3 .832SPP5 .775SPP1 .725JS2 .934JS4 .878JS3 .834JS1 .815SPPS2 .829SPPS3 .787SPPS4 .713SPPS1 .657Ext_MOT3 .867Ext_MOT2 .808Ext_MOT1 .704Ext_MOT4 .620Int_MOT4 .885Int_MOT3 .677Int_MOT2 .636Int_MOT1 .545Total 8.758 4.619 3.588 2.263 1.757 1.516 1.33% of Variance 27.37 14.435 11.213 7.071 5.491 4.739 4.156Cumulative % 27.37 41.804 53.017 60.088 65.579 70.317 74.473KMO=0.892, Bartlett’s Test of Sphericity is significant (Sig.=0.00). Extraction Method: Maximum Likelihood. Rota-tion Method: Promax with Kaiser Normalization. a. Rotation converged in 6 iterations.
30516th SOUTH ASIAN MANAGEMENT FORUM (SAMF) 2021
Confirmatory factor analysis (CFA) is a statistical technique that is used to confirm the factor structure of a set of observed variables. CFA enables researchers to test the hypothesis that there is a relationship between observed variables and their underlying latent constructs.CMIN/DF: To determine overall model fit, the difference between the two matrices is expressed
in, with degrees of freedom (d/f) equating to the number of covariances because is a “badness-of-fit” index, dividing by d/f is known as a normed chi-square (NC). The value should be small enough in relation to d/f, /d/f to be considered acceptable (2.0, 3.0, or even 5.0). In CFA, we find CMIN/DF to be 1.689 less than 5, which is well within the recommended value and thus acceptable Marsh and Hocevar (1985). GFI: The goodness-of-fit index (GFI) represents the model’s overall degree of fit. It is a non-
statistical measure with a value ranging from 0 (poor fit) to 1.0. (Perfect fit). A better fit is indicated by higher values. The GFI in the CFA for the overall model is 0.875, which is greater than the recommended value of (>0.80), and thus deemed to be a good fit and acceptable as recommended by Baumgartner and Hombur (1995); and Doll et al (1994). AGFI: The adjusted goodness-of-fit is an extension of the GFI that takes into account the
proposed model’s degree of freedom in comparison to the degree of freedom in the null model. A value greater than or equal to 0.80 is recommended as an acceptable level for AGFI. The AGFI was found to be 0.850 in the below CFA for the overall model, which is greater than the recommended value of (>0.8) and thus deemed to be a good fit and acceptable as recommended by Baumgartner and Homburg (1995); and Doll et al (1994). CFI: The comparative fit index is another measure that represents comparisons between the
estimated model and a null or independence model (CFI). The values range from 0 to 1.0, with larger values indicating higher levels of goodness-of-fit. The CFI in the below CFA for the overall model was found to be 0.957, which is less than the recommended value of (>0.90) and thus deemed to be a good fit that is acceptable as recommended by Bentler (1990). RMR: The root means square residual is simply the mean absolute value of the covariance
residuals resulting from the difference between the sample and model covariance matrices (Hooper et al. 2008). The standardized root means square residual removes this ambiguity and ranges from 0 to 1, with a value of 0.08 or less indicating an acceptable model (Hu & Bentler, 1998). The RMR value in the below CFA for the overall model was found to be 0.043, which is less than the recommended value of (0.08) and thus deemed to be a good fit and acceptable as recommended by (Hu & Bentler 1998).RMSEA: The root means the square error of approximation is another measure that attempts
to correct for the chi-square statistic’s tendency to reject any specified model with a sufficiently large sample size (RMSEA). The value represents the goodness-of-fit that could be expected if the model were estimated in the entire population rather than just the sample used for estimation (Hair et al. 2010). Values in the range of 0.05 to 0.08 are considered acceptable. Following an empirical examination of several measures, it was discovered that the RMSEA was best suited for use in a confirmatory model strategy with larger samples (Ringdon, 1996). The RMSEA value was found to be 0.046 in the CFA for the overall model (figure-6.2 and table-6.8), which is less than the recommended value of (0.08) and thus deemed to be a good fit and acceptable as recommended by Browne and Cudeck (1993).
Results of Measurement model
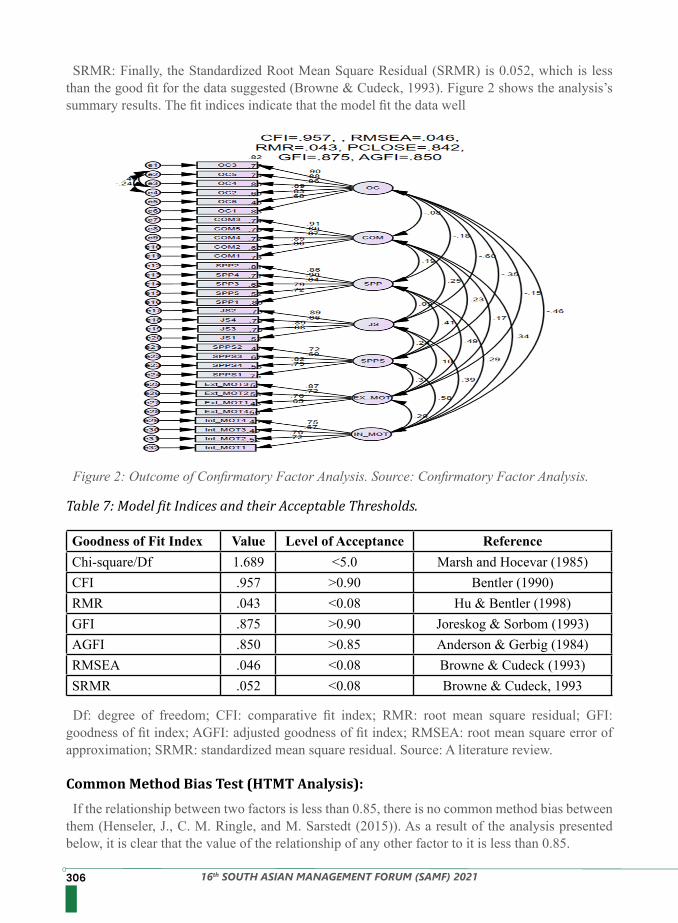
306 16th SOUTH ASIAN MANAGEMENT FORUM (SAMF) 2021
SRMR: Finally, the Standardized Root Mean Square Residual (SRMR) is 0.052, which is less than the good fit for the data suggested (Browne & Cudeck, 1993). Figure 2 shows the analysis’s summary results. The fit indices indicate that the model fit the data well
Df: degree of freedom; CFI: comparative fit index; RMR: root mean square residual; GFI: goodness of fit index; AGFI: adjusted goodness of fit index; RMSEA: root mean square error of approximation; SRMR: standardized mean square residual. Source: A literature review.
If the relationship between two factors is less than 0.85, there is no common method bias between them (Henseler, J., C. M. Ringle, and M. Sarstedt (2015)). As a result of the analysis presented below, it is clear that the value of the relationship of any other factor to it is less than 0.85.
Figure 2: Outcome of Confirmatory Factor Analysis. Source: Confirmatory Factor Analysis.
Table 7: Model fit Indices and their Acceptable Thresholds.
Goodness of Fit Index Value Level of Acceptance ReferenceChi-square/Df 1.689 <5.0 Marsh and Hocevar (1985)CFI .957 >0.90 Bentler (1990)RMR .043 <0.08 Hu & Bentler (1998)GFI .875 >0.90 Joreskog & Sorbom (1993)AGFI .850 >0.85 Anderson & Gerbig (1984)RMSEA .046 <0.08 Browne & Cudeck (1993)SRMR .052 <0.08 Browne & Cudeck, 1993
Common Method Bias Test (HTMT Analysis):
30716th SOUTH ASIAN MANAGEMENT FORUM (SAMF) 2021
Variance inflation factors (VIFs) range from 1 to 10 and beyond. The VIF tells us what percentage of the variance is inflated for each coefficient. In general, 1 represents not correlated, 1–5 moderately correlated, and greater than 5 highly correlated. VIFs were calculated to examine the influence of multicollinearity among the variables and found to have a maximum value of 2.372 (Table 9), which is within the permissible limit as recommended by Hair et al (1998).
A multivariate analysis technique (covariance-based structural equation modeling) was used to identify significant relationships between the seven constructs: job satisfaction (JS), extrinsic motivation (Ex_MOT), intrinsic motivation (In_MOT), organizational commitment (OC), compensation (COM), sales people’s political skill (SPPS), and sales people’s performance. As a result (Table 10), two hypotheses were found to be highly significant because their t values are greater than 1.96 and their p values are less than 0.01. H5 is supported because the relationship between extrinsic motivation and salespeople performance (SPP) was found to be significant at the 1% level (β = 0.542, critical value = 8.269, p 0.01). H5 is supported because the relationship between extrinsic motivation and Sustainable salespeople performance (SPP) was found to be significant at the 1% level (β = 0.542, t value = 8.269, p 0.01). Since the relationship between salespeople’s political skills and performance (SPP) was found to be significant (β = 0.323, critical value= 4.183, p 0.01), H6 is supported. H3 is somewhat supported because the relationship between compensation and salespeople performance (SPP) was found to be marginally significant at a 10% level of significance (β = 0.323, critical value= 4.183, p 0.01).
Dependent Variable: SPP
As a result, we can conclude that there is no common method bias in our analysis, as defined by correlation metrics (Table 8).
Table 8: HTMT Analysis
Table 9: Variance Inflation Factor (VIF) and Tolerance in Multicollinearity.
Multicollinearity Test
Structural model
OC COM SPP JS SPPS EX_MOT IN_MOTOCCOM 0.108SPP 0.174 0.199JS 0.621 0.247 0.107SPPS 0.349 0.220 0.400 0.227EX_MOT 0.148 0.159 0.500 0.097 0.371IN_MOT 0.473 0.343 0.277 0.385 0.571 0.291
IN_MOT EX_MOT SPPS JS COM OCTolerance 0.422 0.807 0.503 0.53 0.798 0.472VIF 2.372 1.24 1.986 1.886 1.254 2.118
308 16th SOUTH ASIAN MANAGEMENT FORUM (SAMF) 2021
Intrinsic motivation, job satisfaction, and organizational commitment, on the other hand, were not significant. As a result, those values have no significant impact on the performance of mobile telecommunication service providers’ salespeople in Bangladesh. Hair et al. (2014), Hair et al. (2010), and Henseler (2009) proposed in scholarly research on marketing issues that R2 values of 0.75, 0.50, or 0.25 for endogenous latent variables can be described as substantial, moderate, or weak, respectively. Cohen (1988), on the other hand, recommended R2 values ranging from 0.02 to 0.12 as weak, 0.13 to 0.25 as moderate, and 0.26 or higher as the higher effect size. Chin (1988) proposed R2 values for endogenous variables of 0.19 as weak, 0.33 as moderate, and 0.26 as significant. Furthermore, Falk and Miller (1992) proposed that R2 values be greater than 0.10 in order to be considered for the variance explained by a specific endogenous latent construct. This study’s path diagram revealed that six factors, including (I) job satisfaction, (ii) extrinsic motivation, (iii) intrinsic motivation, (iv) organizational commitment, (v) compensation, and (vi) salespeople political skill, explained 30.9 percent of salespeople performance of mobile telecommunication service providers in Bangladesh. Hair et al. (2014), Hair et al. (2010) and Henseler (2009), Cohen (1988), and Chin (1988) all support this R2 value.
Job Satisfaction=JS, Extrinsic Motivation= EX_MOT, Intrinsic Motivation= In_MOT, Organizational Commitment=OC, Compensation=COM, Sales People Political Skill=SPPS, and Sales People Performance=SPP.
Chart No 03: Structural Equation Modelling of Salespeople Performance.
Table 10: Hypothesis Testing
Hypothesis Estimate S.E. C.R. P CommentH1 SPP<---JS -.064 .045 -1.408 .159 Not SupportedH2 SPP<---OC -.093 .061 -1.534 .125 Not SupportedH3 SPP<---COM .091 .051 1.800 .072 Somewhat SupportedH4 SPP<---IN_MOT -.017 .080 -.215 .830 Not SupportedH5 SPP<---EX_MOT .542 .066 8.269 *** SupportedH6 SPP<---SPPS .323 .077 4.183 *** SupportedH7 SPP<---Gender .081 .083 .974 .330 Not SupportedH8 SPP<---Age .039 .018 2.145 .032 SupportedH9 SPP<---Education -.099 .036 -2.719 .007 Supported
R2 value 0.309
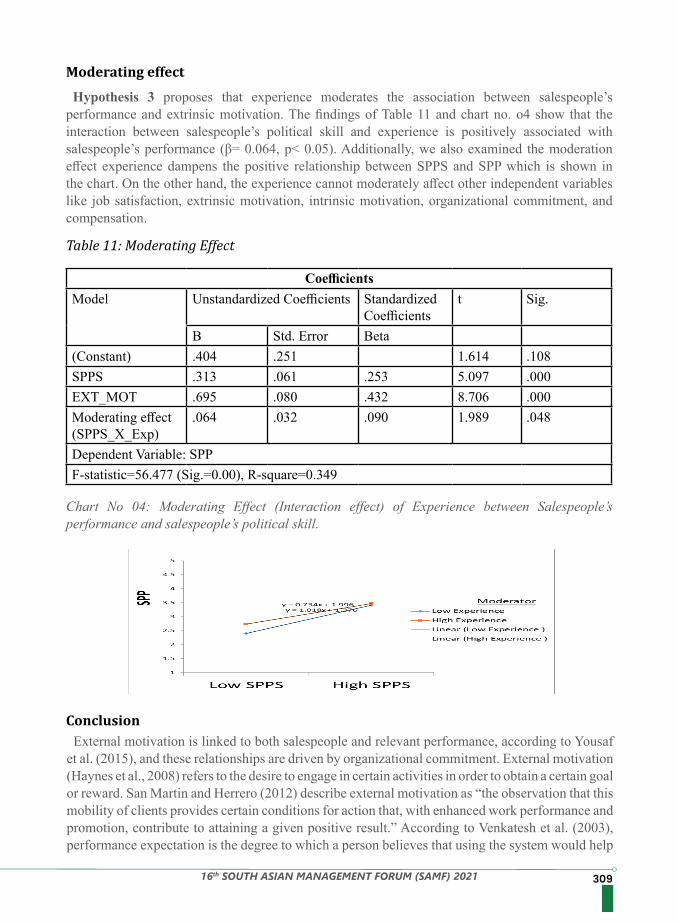
30916th SOUTH ASIAN MANAGEMENT FORUM (SAMF) 2021
Hypothesis 3 proposes that experience moderates the association between salespeople’s performance and extrinsic motivation. The findings of Table 11 and chart no. o4 show that the interaction between salespeople’s political skill and experience is positively associated with salespeople’s performance (β= 0.064, p< 0.05). Additionally, we also examined the moderation effect experience dampens the positive relationship between SPPS and SPP which is shown in the chart. On the other hand, the experience cannot moderately affect other independent variables like job satisfaction, extrinsic motivation, intrinsic motivation, organizational commitment, and compensation.
External motivation is linked to both salespeople and relevant performance, according to Yousaf et al. (2015), and these relationships are driven by organizational commitment. External motivation (Haynes et al., 2008) refers to the desire to engage in certain activities in order to obtain a certain goal or reward. San Martin and Herrero (2012) describe external motivation as “the observation that this mobility of clients provides certain conditions for action that, with enhanced work performance and promotion, contribute to attaining a given positive result.” According to Venkatesh et al. (2003), performance expectation is the degree to which a person believes that using the system would help
Chart No 04: Moderating Effect (Interaction effect) of Experience between Salespeople’s performance and salespeople’s political skill.
Table 11: Moderating Effect
Moderating effect
Conclusion
CoefficientsModel Unstandardized Coefficients Standardized
Coefficientst Sig.
B Std. Error Beta(Constant) .404 .251 1.614 .108SPPS .313 .061 .253 5.097 .000EXT_MOT .695 .080 .432 8.706 .000Moderating effect (SPPS_X_Exp)
.064 .032 .090 1.989 .048
Dependent Variable: SPPF-statistic=56.477 (Sig.=0.00), R-square=0.349
310 16th SOUTH ASIAN MANAGEMENT FORUM (SAMF) 2021
him complete an assignment or improve his work performance. We can observe from this study that only when there is external motivation do salespeople perform harder and their productivity increases day by day. As a result of the preceding debate, we can infer that everyone in the corporation is attempting to focus on external motivation, which considerably increases the productivity of the salesmen, who, at the end of the day, are the true leaders of the company. With them, the company will be able to sell more things and earn more money. According to Ferris, Tradeway, et al. (2005), political skill is defined as the integration of social understanding and the ability to adjust to the demands of the circumstance, as well as believable behavior that inspires confidence and support. It communicates prestige and has a strong influence on others. Other social functions, such as self-observation, leadership self-efficacy, and mental intelligence, were compared to political competence as the best developing indicators of management work success (Semader et al., 2006). According to the results of this survey, if only one salesman has political skills, the other salespeople will work harder and their productivity will improve day by day. Being a relative has the advantage of allowing him to think of the company as his own, allowing him to take ownership and leadership. As a result of the preceding debate, we can infer that everyone in the business should try to focus on the political skills that considerably boost salespeople’s productivity because, at the end of the day, they are the actual thing in the organization. The company will sell products with them, i.e., establish ownership, which will lead to more leadership and profit.
Reference: 1. Ahmed, J. & Abdur, R. (2015). Controlled, uncontrolled communication, brand name, and
brand attitude: A relational study on cellular telecom sector of Bangladesh. American Journal of Trade and Policy, 2(1), 15-21.
2. Akroush, M.N. & Samer, M.A. (2010). The effect of marketing knowledge management on organizational performance: An empirical investigation of the telecommunications organizations in Jordan. International Journal of Emerging Markets, 5(1), 38-77.
3. Anderson, J. C., & Gerbing, D. W. (1984). The effect of sampling error on convergence, improper solutions, and goodness-of-fit indices for maximum likelihood confirmatory factor analysis. Psychometrika, 49(2), 155-173.
4. Bentler, P.M. (1990). ‘Comparative fit indexes in structural models’. Psychological Bulletin, Vol. 107, No. 2, pp. 238-246.
5. Boles, J.S., George, W.D., Vincent, O., Dominique, R. & William, A.W. (2012). Salesforce turnover and retention: A research agenda. Journal of Personal Selling and Sales Management, 32(1), 131-140.
6. Bomers, J.V., Cole, P.J. & Reimink, T.J. (2016). 2015 Financial institutions compensation survey: Supply and demand drives compensation strategies. American Bankers Association. 108(1), 41.
7. Browne, M. W., & Cudeck, R. (1992). Alternative ways of assessing model fit. Sociological Methods & Research, 21(2), 230-258.
8. Buciuniene, I. & Vida, Š. (2008). Impact of leadership styles on employee’s organizational commitment in Lithuanian manufacturing companies. SEE Journal of Economics and Business, 3(2), 57-65.
9. Buciuniene, I. & Vida, S. (2015). Factors influencing salespeople motivation and relationship with the organization in b2b sector. Engineering Economics, 64(4), 78-85.
10. Chin, W.W. (1988). The partial least square approach to structural equation modeling. Modern Methods for Business Research (Book Chapter-10), (pp. 295-336), Laurence Erlbaum
31116th SOUTH ASIAN MANAGEMENT FORUM (SAMF) 2021
Associates, Mahwah. 11. Cogliser, C.C., Chester, A.S., Terri, A.S. & William, L.G. (2009). Balance in leader and
follower perceptions of leader-member exchange: Relationships with performance and work attitudes. The Leadership Quarterly, 20(3), 452-465.
12. Cohen, J. (1988). Statistical Power Analysis for the Behavioral Sciences. Hillsdale: Erlbaum.13. Dey, B.L., Ameet, P., Mike, S., Sanjay, B. & Helen, W.B. (2016). Co-creation of value at the
bottom of the pyramid: Analysing Bangladeshi farmer’s use of mobile telephony. Journal of Retailing and Consumer Services, 29, 40-48.
14. Falk, R. F. and Miller, N. B. (1992). A Primer for Soft Modeling. The University of Akron Press: Akron, Ohio.
15. Ferris, G. R., Blickle, G., Schneider, P. B., Kramer, J., Zettler, I., Solga, J., et al (2008). Political skill construct and criterion-related validation: A two-study investigation. Journal of Managerial Psychology, 23, 744–771.
16. Ferris, G. R., Treadway, D. C., Kolodinsky, R. W., Hochwarter, W. A., Kacmar, C. J., Douglas, C., et al (2005). Development and validation of the political skill inventory. Journal of Management, 31, 126–152.
17. Ferris, G. R., Treadway, D. C., Perrewé, P. L., Brouer, R. L., Douglas, C., & Lux, S. (2007). Political skill in organizations. Journal of Management, 33, 290–320.
18. Field, A. (2000). Discovering Statistics Using SPSS for Windows. Sage Publications: Thousand Oaks, London/New Delhi.
19. Fornell, C. and Larcker, D. F. (1981). Structural equation models with unobservable variables and measurement error: Algebra and statistics. Journal of Marketing Research, 382-388.
20. Haines, III., Victor, Y., Tania, S. & Evelyne, C. (2008). Intrinsic motivation for an international assignment. International Journal of Manpower, 29(5), 443-461.
21. Hair, J. F. J., Anderson, R. E., Tatham, R. L., Black, W. C. (1998). Multivariate Data Analysis (5th Edition). Prentice-Hall: Upper Saddle River, New Jersey, USA.
22. Hair, J. F., Black, W. C, Babin, B. J. and Anderson, R. E. (2014). Multivariate Data Analysis. Pearson Education Limited: California, USA.
23. Hair, J., F. Jr., Black, W. C., Babin, B. J. and Anderson, R. E. (2010). Multivariate Data Analysis: A Global Perspective (7th Edition). Pearson Prentice Hall: New Jersey, USA.
24. Hair, J.F., Anderson, R.E., Tatham, R.L., and Black, W.C. (1998). Multivariate Data Analysis (5th Eds.), Prentice-Hall, New Jersey.
25. Henseler, J., C. M. Ringle, and M. Sarstedt (2015). A New Criterion for Assessing Discriminant Validity in Variance-based Structural Equation Modeling, Journal of the Academy of Marketing Science, 43 (1), 115-135.
26. Henseler, J., Ringle, C. M. and Sinkovics, R. R. (2009). The use of partial least squares path modeling in international marketing. Advances in International Marketing, 20, 277-319.
27. Hossain, A., Jakia, S. & Fahami, A.M. (2016). Addressing the factors influencing customer satisfaction of 3G mobile phone services: A case of Dhaka city, Bangladesh. Global Journal of Management and Business Research, 16(2), 1-9.
28. Hu, L. and Bentler, P. (1999). ‘Cutoff criteria for fit indices in covariance structure analysis: conventional criteria versus new alternatives’. Structural Equation Modeling, Vol. 6, pp. 1-55.
29. Jensen, D., Tom, M. & Mel, S. (2008). The manager’s guide to rewards. New York.30. Jöreskog, K. G., & Sörbom, D. (1993). LISREL 8: Structural equation modeling with the
SIMPLIS command language. Scientific Software International.31. Kumar, B.P. & Vijai, N.G. (2009). Effect of age and experience on job satisfaction and
312 16th SOUTH ASIAN MANAGEMENT FORUM (SAMF) 2021
organizational commitment. The ICFAI University Journal of Organizational Behaviour, 8(1), 28-36.
32. 33. Magandini, M. & Tendai, N. (2015). The effects of salesman personality on sales performance
of internet service provider in the telecommunication industry: Zimbabwean perspective. British Journal of Marketing Studies, 3(1), 11-21.
34. Marsh, H.W. and Hocevar, D. (1985). ‘Application of confirmatory factor analysis to the study of self-concept: First-and higher-order factor models and their invariance across groups’. Psychological Bulletin, Vol. 97, No. 3, pp. 562-582.
35. Miao, C.F. & Kenneth, R.E. (2013). The interactive effects of sales control systems on salesperson performance: A job demands-resources perspective. Journal of the Academy of Marketing Science, 41(1), 73-90.
36. Mittal, S., Rajat, G. & Singhvi, S.R. (2012). Study on salesperson’s task-related performance benefits perceptions and satisfaction with sales force automation. Asia-Pacific Journal of Management Research and Innovation, 8(4), 429-440.
37. Parvinen, P., Jaakko, A., Sami, K. & Joel, H. (2013). Sales activity systematization and performance: Differences between product and service firms. Journal of Business & Industrial Marketing, 28(6), 494-505.
38. Payne, A., Sue, H. & Pennie, F. (2001). “Relationship value management: Exploring the integration of employee, customer and shareholder value and enterprise performance models. Journal of Marketing Management, 17 (8), 785-817.
39. Perrewé, P. L., Zellars, K. L., Ferris, G. R., Rossi, A. M., Kacmar, C. J., & Ralston, D. A. (2004). Neutralizing job stressors: Political skill as an antidote to the dysfunctional consequences of role conflict stressors. Academy of Management Journal, 47, 141–152.
40. Rahman, M.K., Abdul, H.K., Al-Mamun, A. & Abdul, J., (2014). Ethical implications of sales promotion in Malaysia: Islamic perspective. Journal of Business Law and Ethics, 2(1), 13-27.
41. Rahman, M.K., Masilah, M. & Abdul, H.K. (2014). What motivational factors influence student’s interest in sales career? An empirical investigation in Malaysia. IOSR Journal of Business and Management, 16(3), 73-79.
42. Román, S. & Rocío, R. (2015). The influence of sales forces technology use on outcome performance. Journal of Business & Industrial Marketing, 30(6), 771-783.
43. Rouziès, D. (2011). Salesforce compensation. Sales Management–A multinational perspective, Basingstoke, 413-432.
44. San, M.H. & Ángel, H. (2012). Influence of the user’s psychological factors on the online purchase intention in rural tourism: Integrating innovativeness to the UTAUT framework. Tourism Management, 33(2), 341-350.
45. Segalla, M., Dominique, R., Madeleine, B. & Barton, A.W. (2006). A cross-national investigation of incentive sales compensation. International Journal of Research in Marketing, 23(4), 419-433.
46. Semadar, A., Robbins, G., & Ferris, G. R. (2006). Comparing the validity of multiple social effectiveness constructs in the prediction of managerial job performance. Journal of Organizational Behaviour, 27, 443–461.
47. Sikorska, S.E. (2005). Predictors of organizational commitment among staff in assisted living. The Gerontologist, 45(2), 196-205.
48. Sposito, V. A., Hand, M. L., & Skarpness, B. (1983). On the efficiency of using the sample kurtosis in selecting optimal lp estimators. Communications in Statistics-simulation and
31316th SOUTH ASIAN MANAGEMENT FORUM (SAMF) 2021
Computation, 12(3), 265-272.49. Treadway, D. C., Ferris, G. R., Duke, A. B., Adams, G., & Thatcher, J. B. (2007). The
moderating role of subordinate political skill on supervisors’ impressions of subordinate ingratiation and ratings of interpersonal facilitation. Journal of Applied Psychology, 92, 848–855.
50. Uddin, M.J., Rumana, H.L. & Saad, M.H. (2013). Impact of organizational culture on employee performance and productivity: A case study of telecommunication sector in Bangladesh. International Journal of Business and Management, 8(2), 63-77.
51. Venkatesh, V., Michael, G.M., Gordon, B.D. & Fred, D.D. (2003). User acceptance of information technology: Toward a unified view. MIS Quarterly, 27, 425-478.
52. Vinchur, A. J., Schippmann, J. S., Switzer III, F. S., & Roth, P. L. (1998). A meta-analytic review of predictors of job performance for salespeople. Journal of applied psychology, 83(4), 586.
53. Yousaf, A., Huadong, Y. & Karin, S. (2015). Effects of intrinsic and extrinsic motivation on task and contextual performance of Pakistani professionals: The mediating role of commitment foci. Journal of Managerial Psychology, 30(2), 133-150.
54. Zain, O.M. & Muhammad, T.J. (2014). The extent of factors influencing automobile salesperson’s career tenure in Malaysia. Asian Journal of Business Research, 4(1), 43-63.
55. Zain, O.M. & Zainurin, D. (2011). Determinants of salespersons tenure in sales career: A study on car sales executives in Malaysia. The Fifth Facing East/Facing West Conference, 10th-11th June 2011, Kalamazoo, Michigan, USA, 1-21.
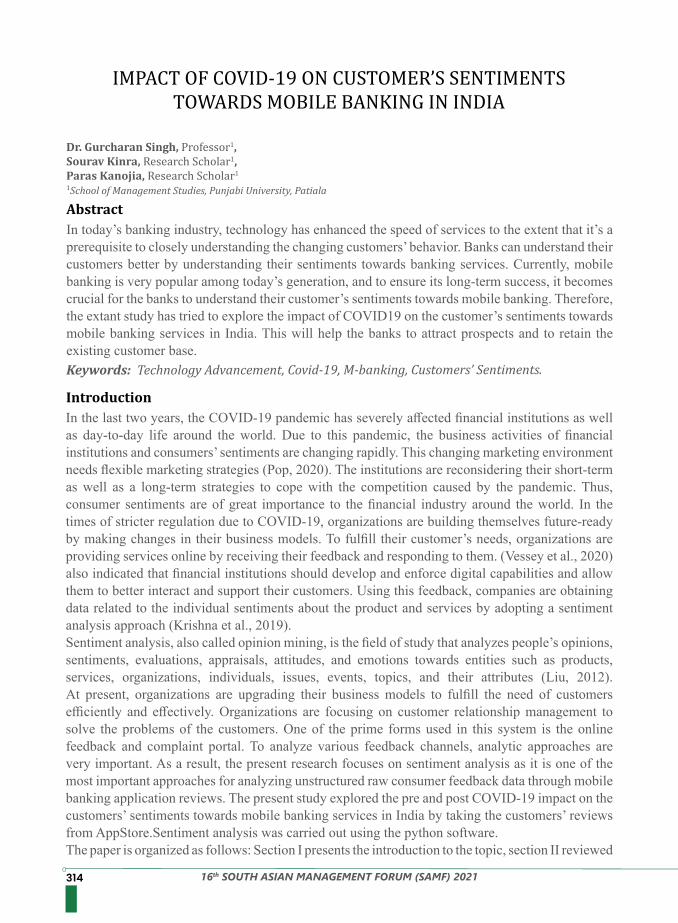
314 16th SOUTH ASIAN MANAGEMENT FORUM (SAMF) 2021
In today’s banking industry, technology has enhanced the speed of services to the extent that it’s a prerequisite to closely understanding the changing customers’ behavior. Banks can understand their customers better by understanding their sentiments towards banking services. Currently, mobile banking is very popular among today’s generation, and to ensure its long-term success, it becomes crucial for the banks to understand their customer’s sentiments towards mobile banking. Therefore, the extant study has tried to explore the impact of COVID19 on the customer’s sentiments towards mobile banking services in India. This will help the banks to attract prospects and to retain the existing customer base.
In the last two years, the COVID-19 pandemic has severely affected financial institutions as well as day-to-day life around the world. Due to this pandemic, the business activities of financial institutions and consumers’ sentiments are changing rapidly. This changing marketing environment needs flexible marketing strategies (Pop, 2020). The institutions are reconsidering their short-term as well as a long-term strategies to cope with the competition caused by the pandemic. Thus, consumer sentiments are of great importance to the financial industry around the world. In the times of stricter regulation due to COVID-19, organizations are building themselves future-ready by making changes in their business models. To fulfill their customer’s needs, organizations are providing services online by receiving their feedback and responding to them. (Vessey et al., 2020) also indicated that financial institutions should develop and enforce digital capabilities and allow them to better interact and support their customers. Using this feedback, companies are obtaining data related to the individual sentiments about the product and services by adopting a sentiment analysis approach (Krishna et al., 2019). Sentiment analysis, also called opinion mining, is the field of study that analyzes people’s opinions, sentiments, evaluations, appraisals, attitudes, and emotions towards entities such as products, services, organizations, individuals, issues, events, topics, and their attributes (Liu, 2012). At present, organizations are upgrading their business models to fulfill the need of customers efficiently and effectively. Organizations are focusing on customer relationship management to solve the problems of the customers. One of the prime forms used in this system is the online feedback and complaint portal. To analyze various feedback channels, analytic approaches are very important. As a result, the present research focuses on sentiment analysis as it is one of the most important approaches for analyzing unstructured raw consumer feedback data through mobile banking application reviews. The present study explored the pre and post COVID-19 impact on the customers’ sentiments towards mobile banking services in India by taking the customers’ reviews from AppStore.Sentiment analysis was carried out using the python software.The paper is organized as follows: Section I presents the introduction to the topic, section II reviewed
IMPACT OF COVID-19 ON CUSTOMER’S SENTIMENTS TOWARDS MOBILE BANKING IN INDIA
Abstract
Introduction
Dr. Gurcharan Singh, Professor1, Sourav Kinra, Research Scholar1,Paras Kanojia, Research Scholar1
1School of Management Studies, Punjabi University, Patiala
Keywords: Technology Advancement, Covid-19, M-banking, Customers’ Sentiments.
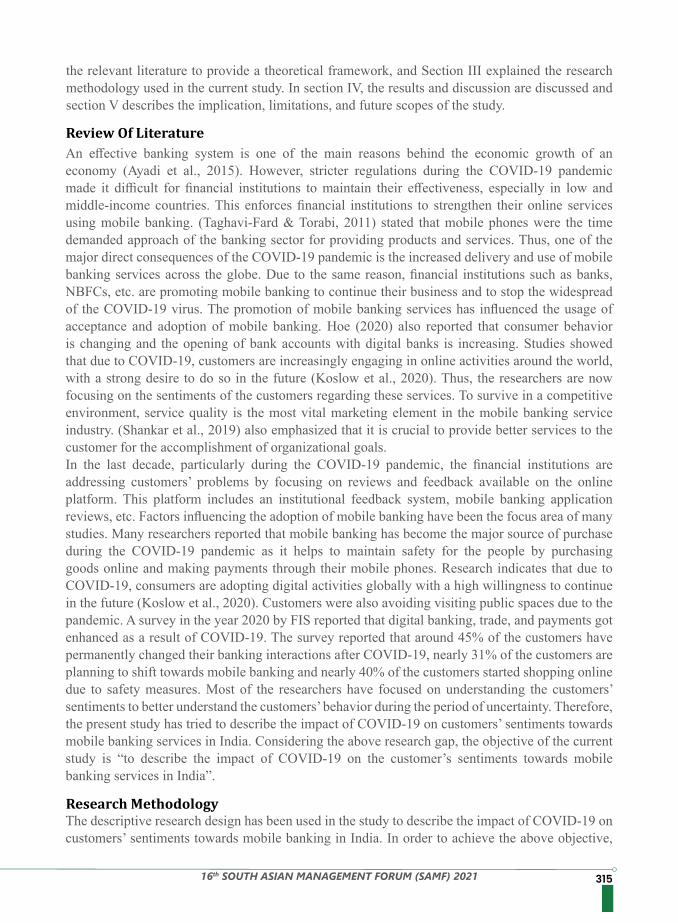
31516th SOUTH ASIAN MANAGEMENT FORUM (SAMF) 2021
An effective banking system is one of the main reasons behind the economic growth of an economy (Ayadi et al., 2015). However, stricter regulations during the COVID-19 pandemic made it difficult for financial institutions to maintain their effectiveness, especially in low and middle-income countries. This enforces financial institutions to strengthen their online services using mobile banking. (Taghavi-Fard & Torabi, 2011) stated that mobile phones were the time demanded approach of the banking sector for providing products and services. Thus, one of the major direct consequences of the COVID-19 pandemic is the increased delivery and use of mobile banking services across the globe. Due to the same reason, financial institutions such as banks, NBFCs, etc. are promoting mobile banking to continue their business and to stop the widespread of the COVID-19 virus. The promotion of mobile banking services has influenced the usage of acceptance and adoption of mobile banking. Hoe (2020) also reported that consumer behavior is changing and the opening of bank accounts with digital banks is increasing. Studies showed that due to COVID-19, customers are increasingly engaging in online activities around the world, with a strong desire to do so in the future (Koslow et al., 2020). Thus, the researchers are now focusing on the sentiments of the customers regarding these services. To survive in a competitive environment, service quality is the most vital marketing element in the mobile banking service industry. (Shankar et al., 2019) also emphasized that it is crucial to provide better services to the customer for the accomplishment of organizational goals.In the last decade, particularly during the COVID-19 pandemic, the financial institutions are addressing customers’ problems by focusing on reviews and feedback available on the online platform. This platform includes an institutional feedback system, mobile banking application reviews, etc. Factors influencing the adoption of mobile banking have been the focus area of many studies. Many researchers reported that mobile banking has become the major source of purchase during the COVID-19 pandemic as it helps to maintain safety for the people by purchasing goods online and making payments through their mobile phones. Research indicates that due to COVID-19, consumers are adopting digital activities globally with a high willingness to continue in the future (Koslow et al., 2020). Customers were also avoiding visiting public spaces due to the pandemic. A survey in the year 2020 by FIS reported that digital banking, trade, and payments got enhanced as a result of COVID-19. The survey reported that around 45% of the customers have permanently changed their banking interactions after COVID-19, nearly 31% of the customers are planning to shift towards mobile banking and nearly 40% of the customers started shopping online due to safety measures. Most of the researchers have focused on understanding the customers’ sentiments to better understand the customers’ behavior during the period of uncertainty. Therefore, the present study has tried to describe the impact of COVID-19 on customers’ sentiments towards mobile banking services in India. Considering the above research gap, the objective of the current study is “to describe the impact of COVID-19 on the customer’s sentiments towards mobile banking services in India”.
The descriptive research design has been used in the study to describe the impact of COVID-19 on customers’ sentiments towards mobile banking in India. In order to achieve the above objective,
Review Of Literature
Research Methodology
the relevant literature to provide a theoretical framework, and Section III explained the research methodology used in the current study. In section IV, the results and discussion are discussed and section V describes the implication, limitations, and future scopes of the study.
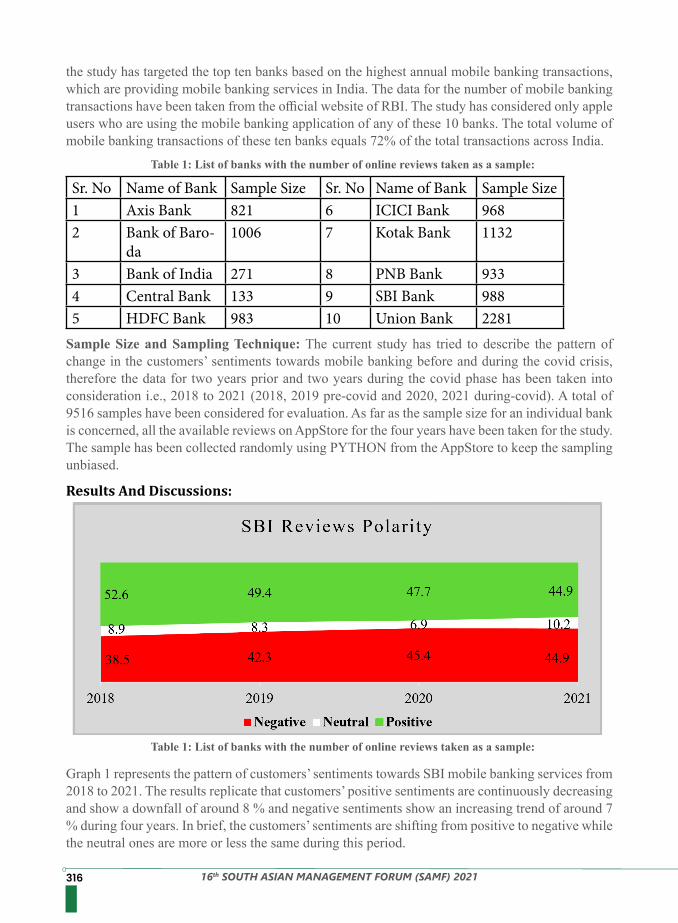
316 16th SOUTH ASIAN MANAGEMENT FORUM (SAMF) 2021
the study has targeted the top ten banks based on the highest annual mobile banking transactions, which are providing mobile banking services in India. The data for the number of mobile banking transactions have been taken from the official website of RBI. The study has considered only apple users who are using the mobile banking application of any of these 10 banks. The total volume of mobile banking transactions of these ten banks equals 72% of the total transactions across India.
Sample Size and Sampling Technique: The current study has tried to describe the pattern of change in the customers’ sentiments towards mobile banking before and during the covid crisis, therefore the data for two years prior and two years during the covid phase has been taken into consideration i.e., 2018 to 2021 (2018, 2019 pre-covid and 2020, 2021 during-covid). A total of 9516 samples have been considered for evaluation. As far as the sample size for an individual bank is concerned, all the available reviews on AppStore for the four years have been taken for the study. The sample has been collected randomly using PYTHON from the AppStore to keep the sampling unbiased.
Table 1: List of banks with the number of online reviews taken as a sample:
Table 1: List of banks with the number of online reviews taken as a sample:
Sr. No Name of Bank Sample Size Sr. No Name of Bank Sample Size1 Axis Bank 821 6 ICICI Bank 9682 Bank of Baro-
da1006 7 Kotak Bank 1132
3 Bank of India 271 8 PNB Bank 9334 Central Bank 133 9 SBI Bank 9885 HDFC Bank 983 10 Union Bank 2281
Graph 1 represents the pattern of customers’ sentiments towards SBI mobile banking services from 2018 to 2021. The results replicate that customers’ positive sentiments are continuously decreasing and show a downfall of around 8 % and negative sentiments show an increasing trend of around 7 % during four years. In brief, the customers’ sentiments are shifting from positive to negative while the neutral ones are more or less the same during this period.
Results And Discussions:
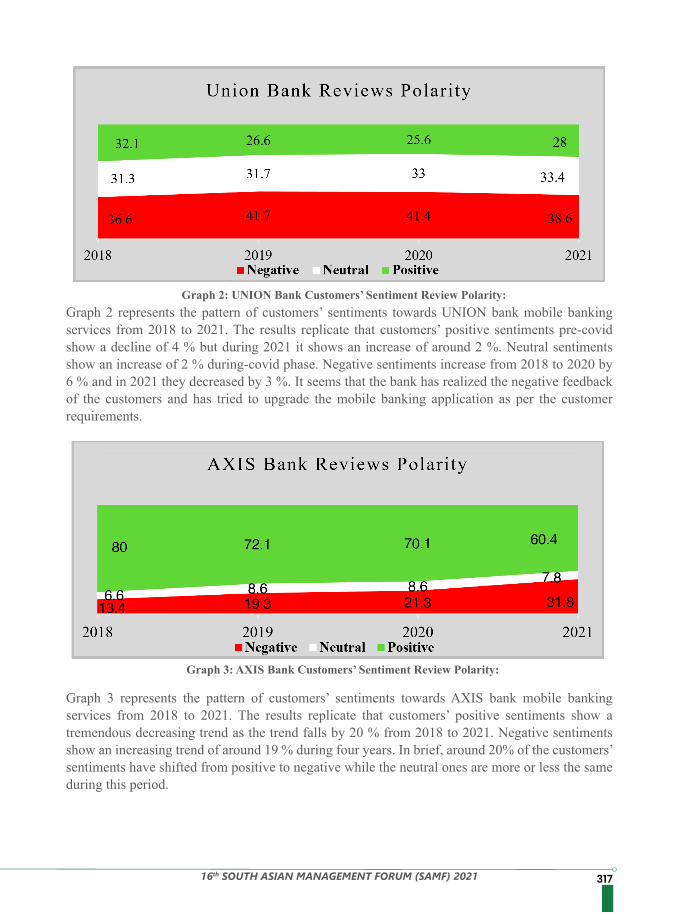
31716th SOUTH ASIAN MANAGEMENT FORUM (SAMF) 2021
Graph 2: UNION Bank Customers’ Sentiment Review Polarity:
Graph 3: AXIS Bank Customers’ Sentiment Review Polarity:
Graph 2 represents the pattern of customers’ sentiments towards UNION bank mobile banking services from 2018 to 2021. The results replicate that customers’ positive sentiments pre-covid show a decline of 4 % but during 2021 it shows an increase of around 2 %. Neutral sentiments show an increase of 2 % during-covid phase. Negative sentiments increase from 2018 to 2020 by 6 % and in 2021 they decreased by 3 %. It seems that the bank has realized the negative feedback of the customers and has tried to upgrade the mobile banking application as per the customer requirements.
Graph 3 represents the pattern of customers’ sentiments towards AXIS bank mobile banking services from 2018 to 2021. The results replicate that customers’ positive sentiments show a tremendous decreasing trend as the trend falls by 20 % from 2018 to 2021. Negative sentiments show an increasing trend of around 19 % during four years. In brief, around 20% of the customers’ sentiments have shifted from positive to negative while the neutral ones are more or less the same during this period.
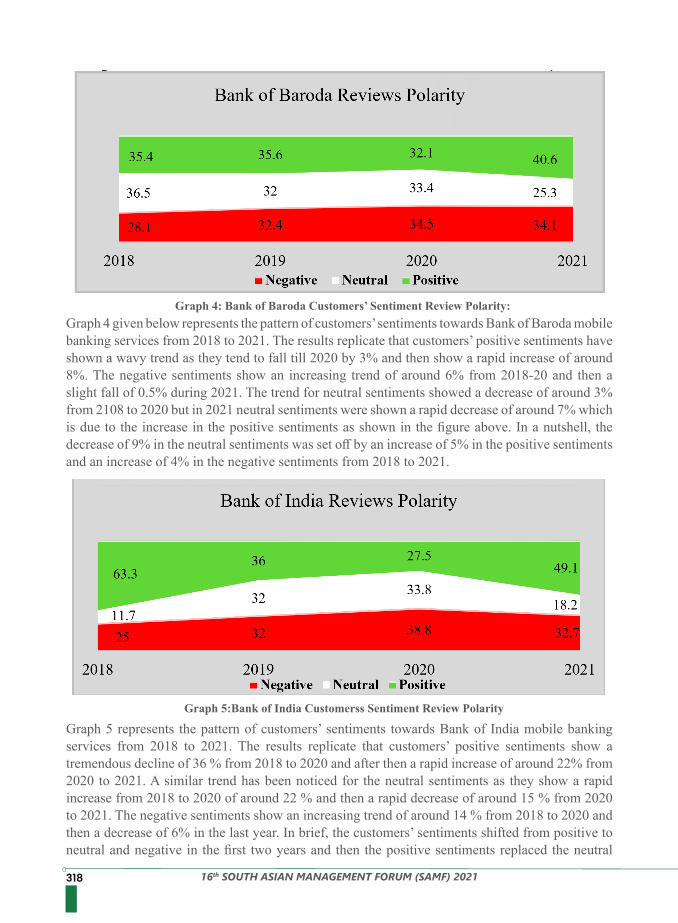
318 16th SOUTH ASIAN MANAGEMENT FORUM (SAMF) 2021
Graph 4: Bank of Baroda Customers’ Sentiment Review Polarity:
Graph 5:Bank of India Customerss Sentiment Review Polarity
Graph 4 given below represents the pattern of customers’ sentiments towards Bank of Baroda mobile banking services from 2018 to 2021. The results replicate that customers’ positive sentiments have shown a wavy trend as they tend to fall till 2020 by 3% and then show a rapid increase of around 8%. The negative sentiments show an increasing trend of around 6% from 2018-20 and then a slight fall of 0.5% during 2021. The trend for neutral sentiments showed a decrease of around 3% from 2108 to 2020 but in 2021 neutral sentiments were shown a rapid decrease of around 7% which is due to the increase in the positive sentiments as shown in the figure above. In a nutshell, the decrease of 9% in the neutral sentiments was set off by an increase of 5% in the positive sentiments and an increase of 4% in the negative sentiments from 2018 to 2021.
Graph 5 represents the pattern of customers’ sentiments towards Bank of India mobile banking services from 2018 to 2021. The results replicate that customers’ positive sentiments show a tremendous decline of 36 % from 2018 to 2020 and after then a rapid increase of around 22% from 2020 to 2021. A similar trend has been noticed for the neutral sentiments as they show a rapid increase from 2018 to 2020 of around 22 % and then a rapid decrease of around 15 % from 2020 to 2021. The negative sentiments show an increasing trend of around 14 % from 2018 to 2020 and then a decrease of 6% in the last year. In brief, the customers’ sentiments shifted from positive to neutral and negative in the first two years and then the positive sentiments replaced the neutral
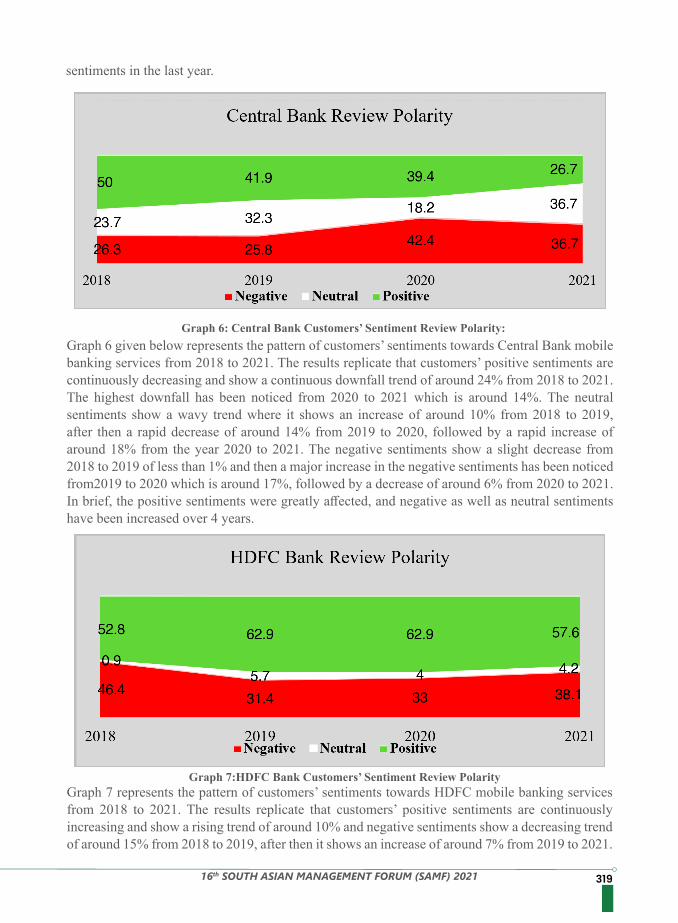
31916th SOUTH ASIAN MANAGEMENT FORUM (SAMF) 2021
Graph 6: Central Bank Customers’ Sentiment Review Polarity:
Graph 7:HDFC Bank Customers’ Sentiment Review Polarity
Graph 6 given below represents the pattern of customers’ sentiments towards Central Bank mobile banking services from 2018 to 2021. The results replicate that customers’ positive sentiments are continuously decreasing and show a continuous downfall trend of around 24% from 2018 to 2021. The highest downfall has been noticed from 2020 to 2021 which is around 14%. The neutral sentiments show a wavy trend where it shows an increase of around 10% from 2018 to 2019, after then a rapid decrease of around 14% from 2019 to 2020, followed by a rapid increase of around 18% from the year 2020 to 2021. The negative sentiments show a slight decrease from 2018 to 2019 of less than 1% and then a major increase in the negative sentiments has been noticed from2019 to 2020 which is around 17%, followed by a decrease of around 6% from 2020 to 2021. In brief, the positive sentiments were greatly affected, and negative as well as neutral sentiments have been increased over 4 years.
Graph 7 represents the pattern of customers’ sentiments towards HDFC mobile banking services from 2018 to 2021. The results replicate that customers’ positive sentiments are continuously increasing and show a rising trend of around 10% and negative sentiments show a decreasing trend of around 15% from 2018 to 2019, after then it shows an increase of around 7% from 2019 to 2021.
sentiments in the last year.
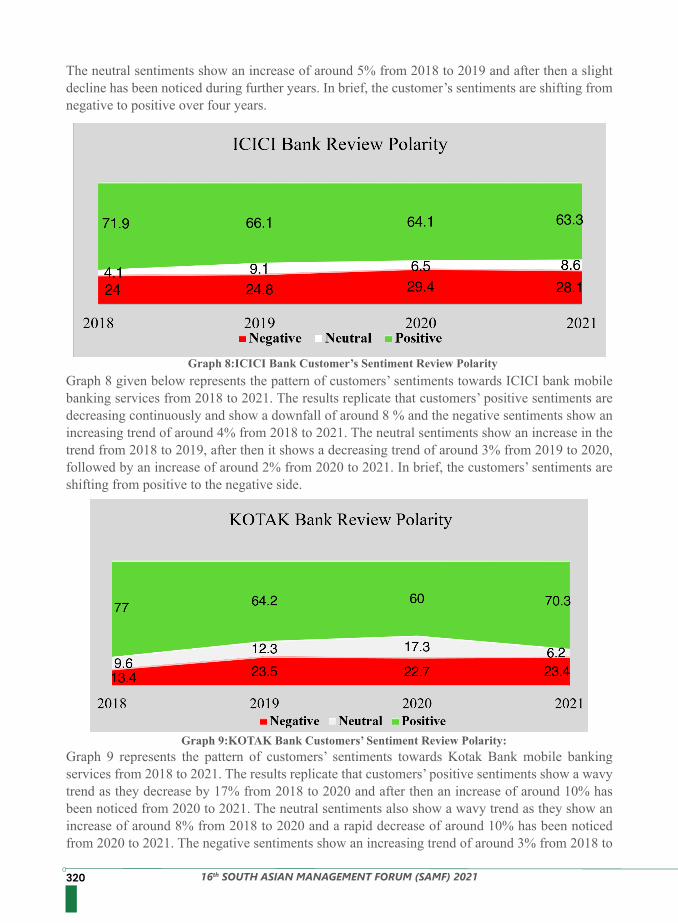
320 16th SOUTH ASIAN MANAGEMENT FORUM (SAMF) 2021
The neutral sentiments show an increase of around 5% from 2018 to 2019 and after then a slight decline has been noticed during further years. In brief, the customer’s sentiments are shifting from negative to positive over four years.
Graph 8:ICICI Bank Customer’s Sentiment Review Polarity
Graph 9:KOTAK Bank Customers’ Sentiment Review Polarity:
Graph 8 given below represents the pattern of customers’ sentiments towards ICICI bank mobile banking services from 2018 to 2021. The results replicate that customers’ positive sentiments are decreasing continuously and show a downfall of around 8 % and the negative sentiments show an increasing trend of around 4% from 2018 to 2021. The neutral sentiments show an increase in the trend from 2018 to 2019, after then it shows a decreasing trend of around 3% from 2019 to 2020, followed by an increase of around 2% from 2020 to 2021. In brief, the customers’ sentiments are shifting from positive to the negative side.
Graph 9 represents the pattern of customers’ sentiments towards Kotak Bank mobile banking services from 2018 to 2021. The results replicate that customers’ positive sentiments show a wavy trend as they decrease by 17% from 2018 to 2020 and after then an increase of around 10% has been noticed from 2020 to 2021. The neutral sentiments also show a wavy trend as they show an increase of around 8% from 2018 to 2020 and a rapid decrease of around 10% has been noticed from 2020 to 2021. The negative sentiments show an increasing trend of around 3% from 2018 to
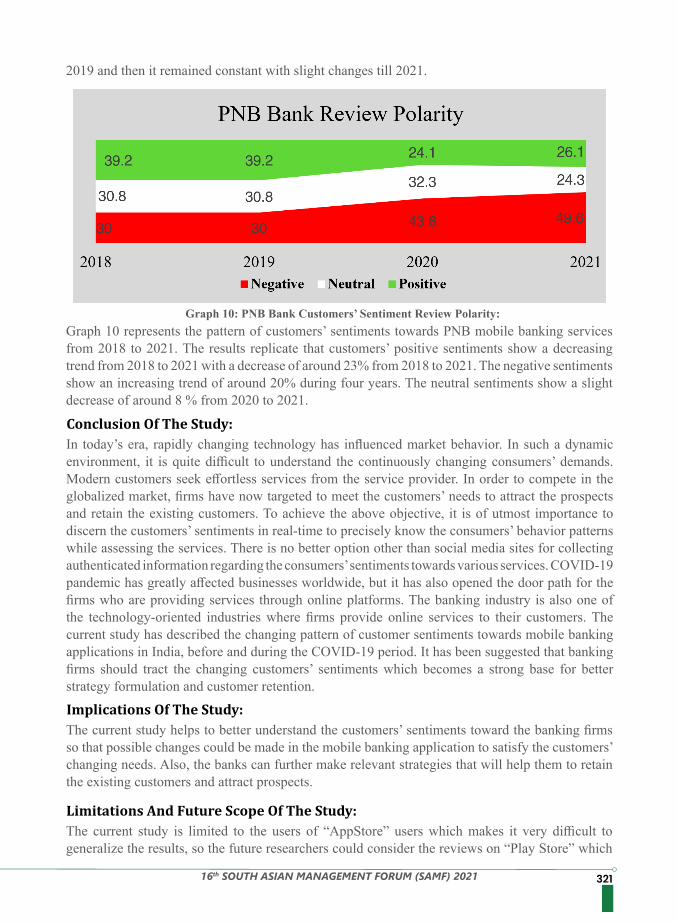
32116th SOUTH ASIAN MANAGEMENT FORUM (SAMF) 2021
Graph 10: PNB Bank Customers’ Sentiment Review Polarity:Graph 10 represents the pattern of customers’ sentiments towards PNB mobile banking services from 2018 to 2021. The results replicate that customers’ positive sentiments show a decreasing trend from 2018 to 2021 with a decrease of around 23% from 2018 to 2021. The negative sentiments show an increasing trend of around 20% during four years. The neutral sentiments show a slight decrease of around 8 % from 2020 to 2021.
2019 and then it remained constant with slight changes till 2021.
In today’s era, rapidly changing technology has influenced market behavior. In such a dynamic environment, it is quite difficult to understand the continuously changing consumers’ demands. Modern customers seek effortless services from the service provider. In order to compete in the globalized market, firms have now targeted to meet the customers’ needs to attract the prospects and retain the existing customers. To achieve the above objective, it is of utmost importance to discern the customers’ sentiments in real-time to precisely know the consumers’ behavior patterns while assessing the services. There is no better option other than social media sites for collecting authenticated information regarding the consumers’ sentiments towards various services. COVID-19 pandemic has greatly affected businesses worldwide, but it has also opened the door path for the firms who are providing services through online platforms. The banking industry is also one of the technology-oriented industries where firms provide online services to their customers. The current study has described the changing pattern of customer sentiments towards mobile banking applications in India, before and during the COVID-19 period. It has been suggested that banking firms should tract the changing customers’ sentiments which becomes a strong base for better strategy formulation and customer retention.
The current study helps to better understand the customers’ sentiments toward the banking firms so that possible changes could be made in the mobile banking application to satisfy the customers’ changing needs. Also, the banks can further make relevant strategies that will help them to retain the existing customers and attract prospects.
The current study is limited to the users of “AppStore” users which makes it very difficult to generalize the results, so the future researchers could consider the reviews on “Play Store” which
Conclusion Of The Study:
Implications Of The Study:
Limitations And Future Scope Of The Study:
322 16th SOUTH ASIAN MANAGEMENT FORUM (SAMF) 2021
will help them generalize the results in a better way.
Secondly, the study has considered the mobile banking application of the top ten banks for this study as it contributes a major portion of the total banking transactions, but future researchers could also consider other banks to extend the study to a larger extent. Lastly, the current study is descriptive and mainly focused on the patterns of customers’ sentiments toward mobile banking but future researchers could explore the reasons for the pattern discussed in the study.
1. Ayadi, R., Arbak, E., Naceur, S. B., & De Groen, W. P. (2015). Financial development, bank efficiency, and economic growth across the Mediterranean. In Economic and social development of the Southern and Eastern Mediterranean countries (pp. 219-233). Springer, Cham.
2. Hoe, L. K. (2020). COVID-19: opportunities and challenges for digital banks, PWC Malaysia.3. Koslow L, Jean LJ, Tsusaka M, et al. (2020) COVID-19 Consumer sentiment snapshot: Special
feature-Asia-Pacific, Boston Consulting Group (BCG). Available from: https://www.bcg.com/publications/2020/covid19-consumer-sentiment-special-feature-asia-pacific.
4. Krishna, G. J., Ravi, V., Reddy, B. V., Zaheeruddin, M., Jaiswal, H., Teja, P. S. R., & Gavval, R. (2019, October). Sentiment Classification of Indian Banks’ Customer Complaints. In TENCON 2019-2019 IEEE Region 10 Conference (TENCON) (pp. 429-434). IEEE
5. Liu, B. (2012). Sentiment analysis and opinion mining. Synthesis lectures on human language technologies, 5(1), 1-167.
6. Pop, N.A., (2020). Contemporary Directions in the Development of Romanian Academic Marketing in Favor of Increasing the Performance of the Organization. In: Fotea S., Fotea I., Văduva S. (eds) Challenges and Opportunities to Develop Organizations Through Creativity, Technology and Ethics. GSMAC 2019. Springer Proceedings in Business and Economics. Springer, Cham, 17-35, https://doi.org/10.1007/978-3-030-43449-6_2.
7. Shankar, A., Datta, B., & Jebarajakirthy, C. (2019). Are the Generic Scales Enough to Measure Service Quality of Mobile Banking? A Comparative Analysis of Generic Service Quality Measurement Scales to Mobile Banking Context. Services Marketing Quarterly, 44, 224-244. https://doi.org/10.1080/15332969.2019.1630176
8. Taghavi-Fard, M. T., & Torabi, M. (2011). The Factors Affecting the Adoption of Mobile Banking Services by Customers and Rank Them (Case Study: Bank Tejarat In Tehran, Iran). Journal Excavations Business Management, 3, 136-162.
9. Vessey, S., Ott, C., Dimidschstein, F., (2020). How banks can strategically respond to Covid-19 challenges, Consultancy.eu, Retrieved from https://www.consultancy.eu/news/4096/how-banks-can-strategically-respond-to-covid-19-challenges.
References
32316th SOUTH ASIAN MANAGEMENT FORUM (SAMF) 2021
The article tries to understand the impact of Covid-19 on the use of Fintech in Bangladesh by studying the consumer behavior of urban people. Generally, people are not enough habituated to Fintech. But during the time of the covid-19 pandemic and lockdown, they were bound to use various services of fintech. That is why the main objective of this study is to identify and investigate whether covid-19 is a blessing or curse for the use of Fintech, especially by the urban consumers of Bangladesh. The study obtained the opinions of 160 samples from the consumers who are currently using Fintech and living in Dhaka city through a survey questionnaire. All data have been collected from primary and secondary sources. The study finds that consumers are using Fintech during the time of pandemic more than past and it seems that the changes are a blessing for the use of Fintech. Furthermore, Covid-19 helped fintech in its growth, that is why it is high time for the urban people to capitalize on all the benefits of Fintech as much as possible to survive and succeed in the new normal life. However, the outcomes of this article are limited by the size of the sample and the robustness of the analysis.
Financial technology, commonly used as FinTech, refers to the use of technology or technological innovation in financial sectors. It is a rapidly growing industry around the world. It makes many things easier such as online shopping, digital payment, and also daily life transaction. New technology or technology-based application can disrupt the traditional financial market, which is developed by financial services, and also it can be used for payment and other complex issues like AI and big data (Harahap et al., 2017). Fintech is a newly introduced platform, that imparts financial services through technologies to different types of users (Schueffel, 2016).The area of Fintech is very wide. According to Matthew Blake, Peter Vanham& Dustin Hughes, Fintech is a broad idea that can use technology to deliver financial services according to users’ choice and convenience. Priya&Anusha, 2019 include mobile banking, online banking, transfer of money, one-to-one transaction, blockchain, wallets, etc. to Fintech. Fintech is undertaking a wide range of work in the financial and banking landscape (Jagtiani& Lemieux 2017). Some scholars portray the area of fintech. They define e-payment, e-transfer, crowdfunding (Chisthi 2016; Jiang et al 2018; Hendriyani&Raharja, 2019) cryptocurrencies (Goldstein et al., 2019), and crowdsource (Kunz &Muralidhar, 2017; Camacho et al 2019; Sul, 2020) as part of fintech.Fintech is defined as “The fusion of Information Technology and Finance for providing the financial services at affordable cost with a seamless user-friendly experience” (Rabbani et al., 2020). Fintech makes each part of finance effective and efficient by using technology.Bofondi&Gobbi (2017) say fintech boosts the flexibility and efficiency of financial services, Fintech saves time and cost by using digital technology. It gives flexibility to all users by allowing business transactions from anywhere at any time (Anshari, Almunawar, Masri&Hamdan, 2019). Giving greater flexibility to the user and adapting to the existing one is the nature of Fintech. (Fuster et al. (2019). Fintech is an important determinant of the cyclical position of the economy, and also an indicator of economic
Covid-19 is a Blessings for the Users of Fintech: Evidence from the Urban Consumers in Bangladesh
ABSTRACT
Introduction
AshiqunNabi, Assistant Professor1, Md. Osama Adnan1
1Department of Business Administration, Manarat International University, Dhaka, Bangladesh
Keywords: Pandemic, Fintech, Urban Consumer Behavior.
324 16th SOUTH ASIAN MANAGEMENT FORUM (SAMF) 2021
On the Last of December 2019, an unknown virus was detected in the city of China, Wuhan. Within a few months, it got spread out around the globe. The government of many countries went on the lockdown to control the pandemic at a level. Though this pandemic mainly creates a health crisis, it affects the economy too. With decreasing production, disruption in supply chains, loss of income, and disruption in the flow of credit; they greatly impacted the whole economy (Fernandes, 2020). There are two causes. The escalation of the virus forced governments around the world to go for lockdowns, social distancing, and quarantines. As a result, economic activities and financial markets had stepped down. And the other is the rate of growing virus generated fear and encouraged the market to opt for safety in consumption and investments (Ozili, 2020). Such situations directly and indirectly affected human behavior and economic activity (Bartik et al., 2020; Nicola et al., 2020; Chetty et al., 2020). That situation forced many people to continue their life in segregation (Beaunoyer et al., 2020).
Lockdown emphasized people adapt to Fintech. Acceptance of Fintech to consumers and banks increased for covid-19 (Tut, 2020). The use of digital financial services and eCommerce has grown abnormally, due to social distancing. (Beaunoyer et al., 2020). During the time of lockdown, people were used to maintaining social distancing; they are still used to it even after the lockdown. And, Social distancing creates a new scope and chance for many Fintech companies to grow. (Nader Alber1 & Mohamed Dabour 2020). During the time of the pandemic, FinTech can energize government responses and enable secure ways for governments and providers to show up to frail masses quickly and gainfully, by reducing the dependence on actual cash-related interchanges and the prerequisite for cash (Appaya et al., 2020).
Objectives of the studyThe study aimed to see the effects of Covid-19 on Fintech by collecting and analyzing data from the Fintech users of the urban area during the pandemic. Specific objectives…• To study consumers’ Fintech behavior during the pandemic.• To find the users’ preference on Fintech based on their experience.• To explore the regularity of using Fintech in the pre-pandemic period and during the pandemic.
ParticipantsThe participants of the survey were unpaid volunteers, who live in the urban areas of Bangladesh. The sample incorporates 180 Bangladeshi adults aged 18-50 (M= 34; SD= 9.66), with 114 men (65.6%) and 66 women (34.4%) with four age groups. 162 (84.4% of sample) participants from 18-25 (M=21.7; SD=2.44),18 (15.6% of sample) participants from 26-35 (M=30.5; SD=3.02). Participants are from two backgrounds: 114 students (62.5%) and 66 job holders (37.5%). All participants stated themselves to be in good physical and mental health at the time of the survey.
MaterialThe test material consisted of the scenario of 6 use behavior in which participants gave their opinions on Fintech using experience, future preference, and behavior in form of three options as agree, neutral, disagree for user experience, future preference, and regular (over 40% transaction
Covid 19 and Economy
Covid 19 and Fintech
Methods
growth (Aditya et al. 2019, Baker 2018, Galbraith and Tkacz, 2007).
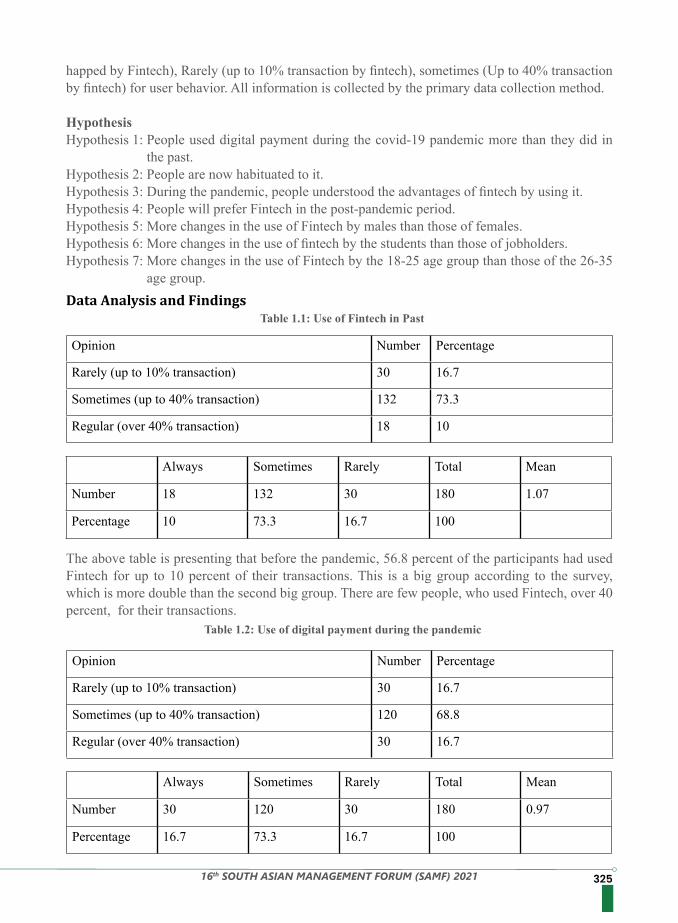
32516th SOUTH ASIAN MANAGEMENT FORUM (SAMF) 2021
happed by Fintech), Rarely (up to 10% transaction by fintech), sometimes (Up to 40% transaction by fintech) for user behavior. All information is collected by the primary data collection method.
HypothesisHypothesis 1: People used digital payment during the covid-19 pandemic more than they did in
the past.Hypothesis 2: People are now habituated to it.Hypothesis 3: During the pandemic, people understood the advantages of fintech by using it.Hypothesis 4: People will prefer Fintech in the post-pandemic period. Hypothesis 5: More changes in the use of Fintech by males than those of females.Hypothesis 6: More changes in the use of fintech by the students than those of jobholders.Hypothesis 7: More changes in the use of Fintech by the 18-25 age group than those of the 26-35
age group.Data Analysis and Findings
Table 1.1: Use of Fintech in Past
Table 1.2: Use of digital payment during the pandemic
Opinion Number Percentage
Rarely (up to 10% transaction) 30 16.7
Sometimes (up to 40% transaction) 132 73.3
Regular (over 40% transaction) 18 10
Opinion Number Percentage
Rarely (up to 10% transaction) 30 16.7
Sometimes (up to 40% transaction) 120 68.8
Regular (over 40% transaction) 30 16.7
Always Sometimes Rarely Total Mean
Number 18 132 30 180 1.07
Percentage 10 73.3 16.7 100
Always Sometimes Rarely Total Mean
Number 30 120 30 180 0.97
Percentage 16.7 73.3 16.7 100
The above table is presenting that before the pandemic, 56.8 percent of the participants had used Fintech for up to 10 percent of their transactions. This is a big group according to the survey, which is more double than the second big group. There are few people, who used Fintech, over 40 percent, for their transactions.
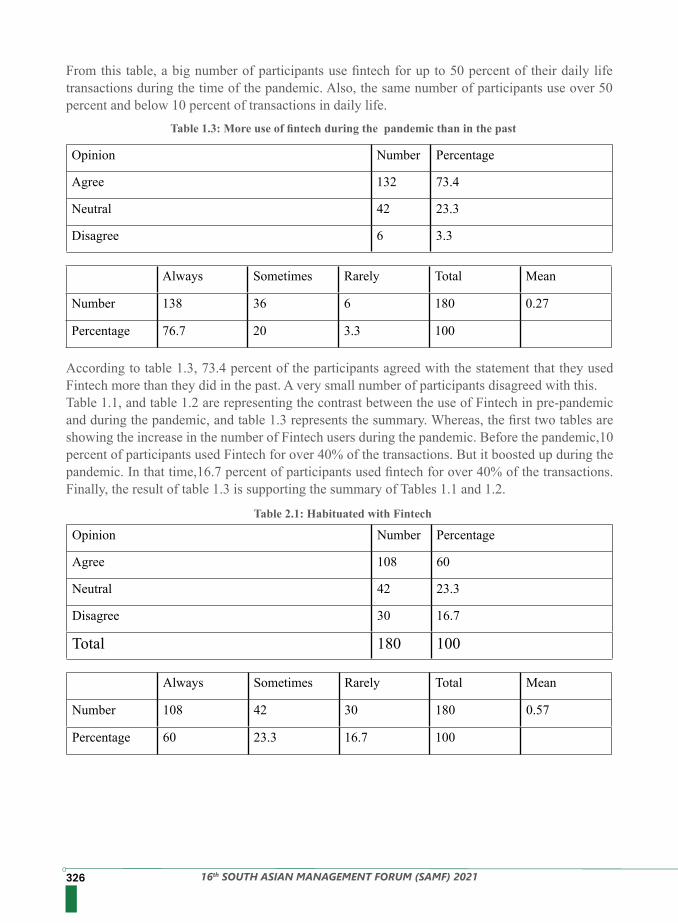
326 16th SOUTH ASIAN MANAGEMENT FORUM (SAMF) 2021
Table 2.1: Habituated with Fintech
Table 1.3: More use of fintech during the pandemic than in the past
Opinion Number Percentage
Agree 132 73.4
Neutral 42 23.3
Disagree 6 3.3
Opinion Number Percentage
Agree 108 60
Neutral 42 23.3
Disagree 30 16.7
Total 180 100
Always Sometimes Rarely Total Mean
Number 138 36 6 180 0.27
Percentage 76.7 20 3.3 100
Always Sometimes Rarely Total Mean
Number 108 42 30 180 0.57
Percentage 60 23.3 16.7 100
From this table, a big number of participants use fintech for up to 50 percent of their daily life transactions during the time of the pandemic. Also, the same number of participants use over 50 percent and below 10 percent of transactions in daily life.
According to table 1.3, 73.4 percent of the participants agreed with the statement that they used Fintech more than they did in the past. A very small number of participants disagreed with this. Table 1.1, and table 1.2 are representing the contrast between the use of Fintech in pre-pandemic and during the pandemic, and table 1.3 represents the summary. Whereas, the first two tables are showing the increase in the number of Fintech users during the pandemic. Before the pandemic,10 percent of participants used Fintech for over 40% of the transactions. But it boosted up during the pandemic. In that time,16.7 percent of participants used fintech for over 40% of the transactions. Finally, the result of table 1.3 is supporting the summary of Tables 1.1 and 1.2.
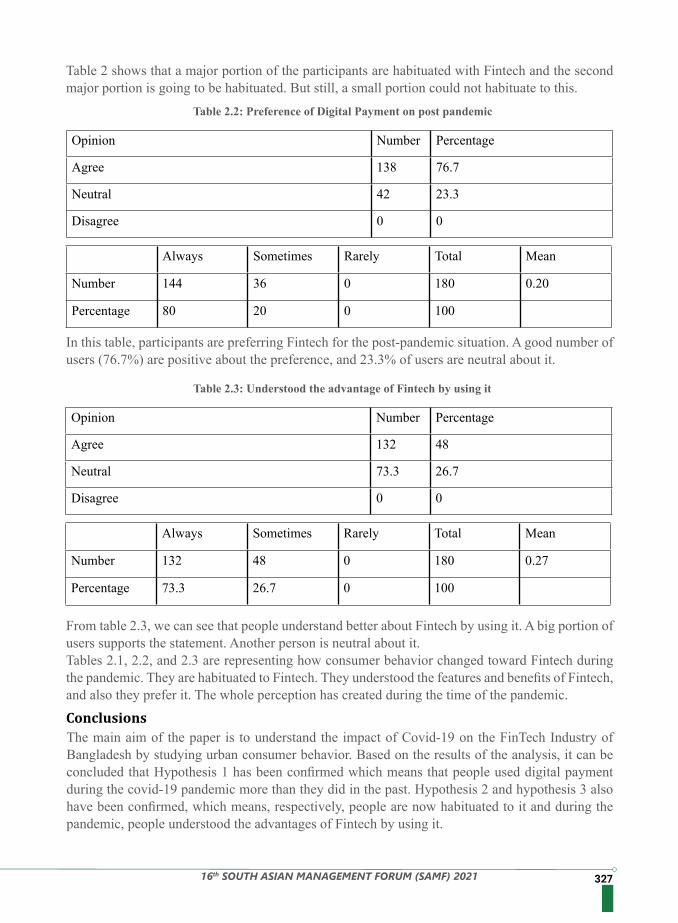
32716th SOUTH ASIAN MANAGEMENT FORUM (SAMF) 2021
Table 2 shows that a major portion of the participants are habituated with Fintech and the second major portion is going to be habituated. But still, a small portion could not habituate to this.
From table 2.3, we can see that people understand better about Fintech by using it. A big portion of users supports the statement. Another person is neutral about it.Tables 2.1, 2.2, and 2.3 are representing how consumer behavior changed toward Fintech during the pandemic. They are habituated to Fintech. They understood the features and benefits of Fintech, and also they prefer it. The whole perception has created during the time of the pandemic.
In this table, participants are preferring Fintech for the post-pandemic situation. A good number of users (76.7%) are positive about the preference, and 23.3% of users are neutral about it.
Table 2.2: Preference of Digital Payment on post pandemic
Table 2.3: Understood the advantage of Fintech by using it
Opinion Number Percentage
Agree 138 76.7
Neutral 42 23.3
Disagree 0 0
Opinion Number Percentage
Agree 132 48
Neutral 73.3 26.7
Disagree 0 0
Always Sometimes Rarely Total Mean
Number 144 36 0 180 0.20
Percentage 80 20 0 100
Always Sometimes Rarely Total Mean
Number 132 48 0 180 0.27
Percentage 73.3 26.7 0 100
The main aim of the paper is to understand the impact of Covid-19 on the FinTech Industry of Bangladesh by studying urban consumer behavior. Based on the results of the analysis, it can be concluded that Hypothesis 1 has been confirmed which means that people used digital payment during the covid-19 pandemic more than they did in the past. Hypothesis 2 and hypothesis 3 also have been confirmed, which means, respectively, people are now habituated to it and during the pandemic, people understood the advantages of Fintech by using it.
Conclusions
328 16th SOUTH ASIAN MANAGEMENT FORUM (SAMF) 2021
1. Harahap, B. A., Idham, P. B., M, A. C., Rakhman, R. N., Harahap, B. A., Idham, P. B., M, A. C., &Rakhman, R. N. (2017). Working paper perkembangan financial technology terkait central bank digital currency (cbdc) terhadaptransmisikebijakanmoneterdanmakroekonomiPerkembangan Financial Technology terkait Central Bank Digital Currency (CBDC) terhadapTransmisiKebijakanMoneterdanMakroekonomi. 0–80.
2. Priya, P. K., and Anusha, K. (2019, September). Fintech Issues and Challenges in India. International Journal of Recent Technology and Engineering, 8 (3), 904 - 908.
3. Schueffel, P. (2016), “Taming the beast: a scientific definition of fintech,” Journal of Innovation Management, 4(4), 32-54.
4. Rabbani, M.R., Khan, S., Thalassinos, I.E. (2020), “FinTech, Blockchain, and Islamic Finance: An Extensive Literature Review,” International Journal of Economics and Business Administration, 8(2), 65-86.
5. Anshari, M., Almunawar, M.N., Masri, M., and Hamdan, M., Digital Marketplace and FinTech to Support Agriculture Sustainability, Energy Procedia 156 (2019) 234–238.
6. Bofondi, M., and Gobbi, G. (2017). The big promise of FinTech. European Economy – Banks, Regulation, and the Real Sector, this issue.
7. Fuster, A., Plosser, M., Schnabl, P., & Vickery, J. (2019). The role of technology in mortgage lending. The Review of Financial Studies, 32(5), 1854–1899.
8. Aditya, A., S. Aron-Dine, W. Dunn, L. Feiverson, P. Lengermann, and C. Sahm (2019). From transaction data to economic statistics: constructing real-time, high-frequency, geographical measures of consumers spending. Finance and Economics Discussion Series 2019-057. Board of Governors of the Federal Reserve.
9. Jagtiani, J., & Lemieux, C. (2018). Do fintech lenders penetrate areas that are underserved by traditional banks? Journal of Economics and Business, 100, 43–54.
10. Camacho, N., Nam, H., Kannan, P. K., &Stremersch, S. (2019). Tournaments to crowdsource innovation: The role of moderator feedback and participation intensity. Journal of Marketing, 83(2), 138-157.
11. Chishti, S. (2016). How peer to peer lending and crowdfunding drive the fintech revolution in the UK. In Banking beyond banks and money (pp. 55-68). Springer, Cham.
12. Goldstein, I., Jiang, W., &Karolyi, G. A. (2019). To FinTech and beyond. The Review of Financial Studies, 32(5), 1647-1661.
13. Hendriyani, C., &Raharja, S. U. J. (2019). Business Agility Strategy: Peer-to-Peer Lending of Fintech Startup in the Era of Digital Finance in Indonesia. Review of Integrative Business and Economics Research, 8, 239-246.
14. Jiang, J., Liao, L., Wang, Z., & Zhang, X. (2018). Government Affiliation and Fintech Industry: The Peer-to-Peer Lending Platforms in China. Working Paper SSRN 3116516.
15. Kunz, S., &Muralidhar, A. (2017). InvestTech and Crowdsourcing Best Ideas: Investment Strategies for a Low-Yield Environment. Working paper SSRN 2899425.
16. Sul, E. (2020). Effects of FinTech and Crowdsourced Forecasting on Firms: Evidence from Estimize. Working paper SSRN 3573152.
17. Fernandes, N. (2020). Economic effects of coronavirus outbreak (COVID-19) on the world economy. Available at SSRN 3557504.
18. Ozili, P. K., &Arun, T. (2020), “Spillover of COVID-19: impact on the Global Economy,” Available at SSRN 3562570.
19. Bartik, A. W., Bertrand, M., Cullen, Z. B., Glaeser, E. L., Luca, M., & Stanton, C. T. (2020).
References
32916th SOUTH ASIAN MANAGEMENT FORUM (SAMF) 2021
How are small businesses adjusting to covid-19? Early evidence from a survey (No. w26989). National Bureau of Economic Research.
20. Chetty, R., Friedman, J. N., Hendren, N., &Stepner, M. (2020). How did covid-19 and stabilization policies affect spending and employment? A new real-time economic tracker based on private sector data (No. w27431). National Bureau of Economic Research.
21. Nicola, M., Alsafi, Z., Sohrabi, C., Kerwan, A., Al-Jabir, A., Iosifidis, C., ...& Agha, R. (2020). The socio-economic implications of the coronavirus and COVID-19 pandemic: A review. International Journal of Surgery.
22. Beaunoyer, E., Dupéré, S., &Guitton, M. J. (2020). COVID-19 and digital inequalities: Reciprocal impacts and mitigation strategies. Computers in Human Behavior.
23. Nader A.,& Mohamed D. (2020). The Dynamic Relationship between FinTech and Social Distancing under COVID-19 Pandemic: Digital Payments Evidence
24. Appaya, S., Gradstein, H., &Mathurin-Andrew, T. (2020). Fintech can help in the response to COVID-19. But where should policymakers start?
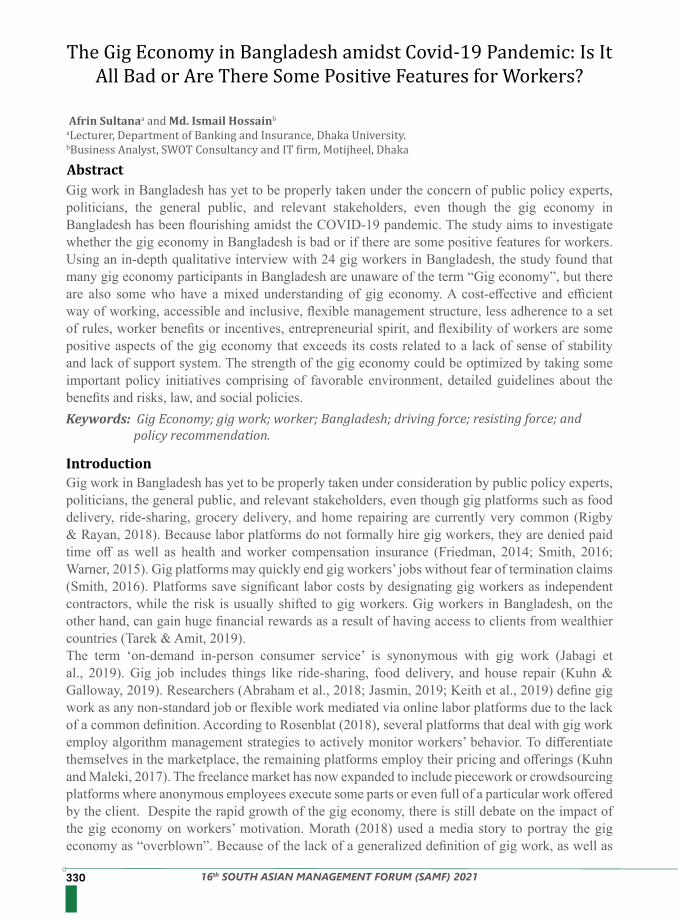
330 16th SOUTH ASIAN MANAGEMENT FORUM (SAMF) 2021
Gig work in Bangladesh has yet to be properly taken under the concern of public policy experts, politicians, the general public, and relevant stakeholders, even though the gig economy in Bangladesh has been flourishing amidst the COVID-19 pandemic. The study aims to investigate whether the gig economy in Bangladesh is bad or if there are some positive features for workers. Using an in-depth qualitative interview with 24 gig workers in Bangladesh, the study found that many gig economy participants in Bangladesh are unaware of the term “Gig economy”, but there are also some who have a mixed understanding of gig economy. A cost-effective and efficient way of working, accessible and inclusive, flexible management structure, less adherence to a set of rules, worker benefits or incentives, entrepreneurial spirit, and flexibility of workers are some positive aspects of the gig economy that exceeds its costs related to a lack of sense of stability and lack of support system. The strength of the gig economy could be optimized by taking some important policy initiatives comprising of favorable environment, detailed guidelines about the benefits and risks, law, and social policies.
Gig work in Bangladesh has yet to be properly taken under consideration by public policy experts, politicians, the general public, and relevant stakeholders, even though gig platforms such as food delivery, ride-sharing, grocery delivery, and home repairing are currently very common (Rigby & Rayan, 2018). Because labor platforms do not formally hire gig workers, they are denied paid time off as well as health and worker compensation insurance (Friedman, 2014; Smith, 2016; Warner, 2015). Gig platforms may quickly end gig workers’ jobs without fear of termination claims (Smith, 2016). Platforms save significant labor costs by designating gig workers as independent contractors, while the risk is usually shifted to gig workers. Gig workers in Bangladesh, on the other hand, can gain huge financial rewards as a result of having access to clients from wealthier countries (Tarek & Amit, 2019).The term ‘on-demand in-person consumer service’ is synonymous with gig work (Jabagi et al., 2019). Gig job includes things like ride-sharing, food delivery, and house repair (Kuhn & Galloway, 2019). Researchers (Abraham et al., 2018; Jasmin, 2019; Keith et al., 2019) define gig work as any non-standard job or flexible work mediated via online labor platforms due to the lack of a common definition. According to Rosenblat (2018), several platforms that deal with gig work employ algorithm management strategies to actively monitor workers’ behavior. To differentiate themselves in the marketplace, the remaining platforms employ their pricing and offerings (Kuhn and Maleki, 2017). The freelance market has now expanded to include piecework or crowdsourcing platforms where anonymous employees execute some parts or even full of a particular work offered by the client. Despite the rapid growth of the gig economy, there is still debate on the impact of the gig economy on workers’ motivation. Morath (2018) used a media story to portray the gig economy as “overblown”. Because of the lack of a generalized definition of gig work, as well as
The Gig Economy in Bangladesh amidst Covid-19 Pandemic: Is It All Bad or Are There Some Positive Features for Workers?
Abstract
Introduction
Afrin Sultanaa and Md. Ismail Hossainb
aLecturer, Department of Banking and Insurance, Dhaka University.bBusiness Analyst, SWOT Consultancy and IT firm, Motijheel, Dhaka
Keywords: Gig Economy; gig work; worker; Bangladesh; driving force; resisting force; and policy recommendation.
33116th SOUTH ASIAN MANAGEMENT FORUM (SAMF) 2021
This research solely focuses on understanding the experiences, knowledge, and perceptions of gig workers in Bangladesh obtained from doing day-to-day activities pertinent to gig work (Bhattacharya & Raghuvanshi, 2018; Tarek & Amit, 2019; and Ahsan, 2020). Thus, self-determination theory is employed to draw a succinct literature review. The self-determination theory has a strong foundation for understanding human motivation and personality (Howard et al., 2016). This established theoretical framework is comprised of two primary forms of motivation including intrinsic motivation and extrinsic motivation (Rigby & Rayan, 2018). Our study defined intrinsic motivation from a practical perspective. If gig workers do their work for their stake because their job is interesting and a source of spontaneous satisfaction, intrinsic motivation comes ahead (Islam et al., 2019). Conversely, extrinsic motivation is linked to doing a job for instrumental reasons such as money, incentives, and tangible rewards (Bhattacharya & Raghuvanshi, 2018). When gig workers in Bangladesh work for satisfying their financial requirements, extrinsic motivation is the prime reason for doing this job (Radovic, 2021). Past studies (e.g., Islam et al., 2019; Berger et al., 2019) have shown that financial motivation is the prime reason for doing gig work. However, a question arises whether the satisfying financial requirement is the only determinant of job satisfaction, employee engagement, and organizational commitment. The answer is that financial requirement is just a form of extrinsic motivation. Evidence shows that intrinsic motivation is the most influential factor that leads to job satisfaction, and positive organizational outcomes (Rigby & Rayan, 2018). Gig workers in Bangladesh perform their job for extrinsic motivation rather than intrinsic motivation because, in Bangladesh, gig work is not perceived as a symbol of social prestige like other established jobs in private and public sectors (Tarek & Amit, 2019). Most of the graduates in Bangladesh consider public jobs such as Bangladesh Civil Service (BCS), Bank jobs, and Government sector jobs as key means of gaining social status and social recognition because of the established culture in Bangladesh (Radovic, 2021). Therefore, empirical findings related to gig work and its impact on satisfaction and well-being are not suitable for Bangladesh. Culturally, Bangladesh is comprised of traditional beliefs, bureaucratic culture, subjective influence known as peer pressure, family decision, and social recognition (Bhattacharya & Raghuvanshi, 2018). Job seekers try to get a job that has social recognition. Here, gig work is yet to gain an acceptable social recognition in Bangladesh because of the nature of the job which could be characterized by job insecurity, volatile earnings, excessive workload, and algorithm-based control mechanism (Berger et al., 2019). On the one hand, gig work causes job insecurity, earnings uncertainty, job stress, and deterioration of self-confidence (Gleim et al., 2019). On the other hand, gig work has been a key means of earning money quickly (Keith et al., 2020). For instance, because of the pandemic, many employed workers were forced to leave their job. In addressing financial requirements, they joined gig platforms, such as food delivery, ride-sharing, freelancing, and piecework. Although gig work is a source of generating money, job autonomy is not established in the context of Bangladesh (Novitz, 2020).
Literature Review
methodological obstacles, assessing the workload of gig workers using typical household surveys and procedures is becoming increasingly challenging (Abraham et al., 2018; Jarmin, 2019). Given that this study aims to conduct in-depth qualitative research to get the answer to three important questions: (1) What is the understanding of gig workers about the gig economy? (2) How do gig workers perceive the positive and negative impacts that the gig economy in Bangladesh has had? (3) How can the gig economy be a good place to work?
332 16th SOUTH ASIAN MANAGEMENT FORUM (SAMF) 2021
Most of the gig workers in Bangladesh belong to the generation “Millennials” who have the family burden, and social burdens (Kumar et al., 2019). To overcome the curse of unemployment, many young people have joined the gig work (Ahsan, 2020). They are indeed earning money, but their satisfaction is still a subject of debate because of the lack of acceptance of gig work as a social recognition in Bangladesh properly (Bhattacharya & Raghuvanshi, 2018; Tolba, 2021).
Figure 1 Conceptual Framework of the study
Our study is exploratory because the research questions paid special attention to getting answers to value-added questions designed by what, how, and why rather than how many and other quantifiable questions. Exploratory interviews were highly suitable (Zikmund et al., 2013) because of their necessity to gain in-depth subjective information from participants (Saunders et al., 2009). We asked several probing questions like “what is your take on the gig economy in Bangladesh?”, “What is your opinion on the gig economy”, “In your opinion, what are the negative impacts that the gig economy has had?”, and “Can you exemplify both negative and positive impacts?”. The real benefits of asking some questions are that they helped generate a structure for reference and conceded us to explore deeper insights (Cooper et al., 2006; Zikmund et al., 2013; Saunders et al., 2009; Bell et al., 2018). The qualitative method was used to discover the hidden meanings of the research phenomenon.We conducted in-depth qualitative semi-structured interviews with 24 gig workers in Bangladesh (details are included in participant characteristics). The period of participants’ recruitment was between July 2021 and October 2021. Participants were recruited using face-to-face conversation techniques. All interviews were conducted face to face in public locations in Dhaka city such as local restaurants, parks, and footpaths. Most importantly, most of our participants were not experts in English, and therefore, the semi-structured questions were written in English and later converted into Bangla, and then again the answers were converted to English version after the interviews. Two researchers of this project interviewed participants, according to their convenience. Before doing interviews, the semi-structured interview questions were cross-checked and validated by the experts in this field. The semi-structured interviews were designed in two parts comprising of participants’ characteristics (Part A) and main questions related to the gig economy (Part B). The duration of the interview was an average of 2 hours in length. Participants were asked to give consent in recording the interview. Unfortunately, many of them did not provide consent. As a
Methodology
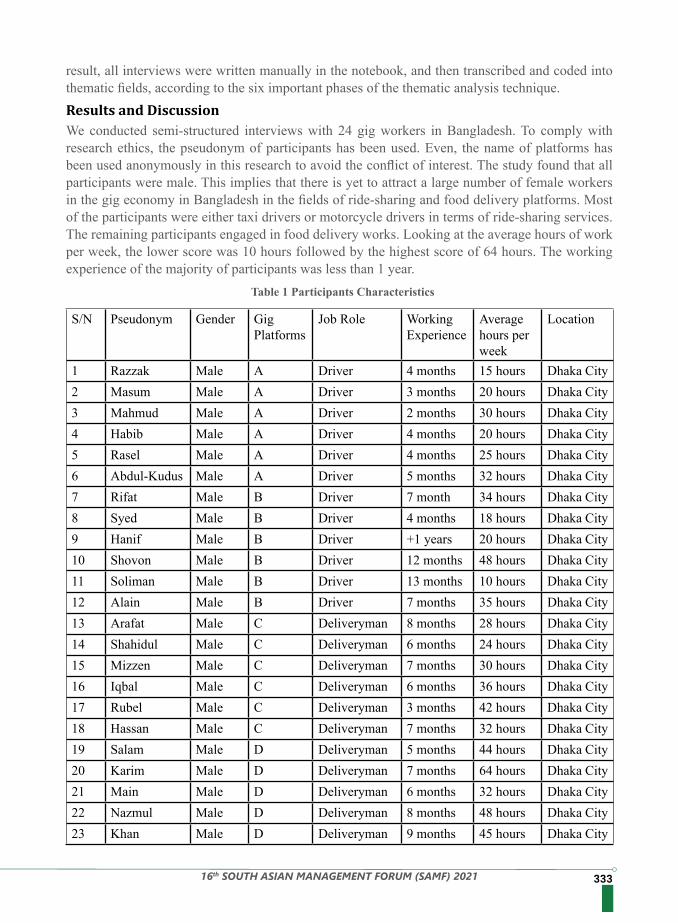
33316th SOUTH ASIAN MANAGEMENT FORUM (SAMF) 2021
Table 1 Participants Characteristics
We conducted semi-structured interviews with 24 gig workers in Bangladesh. To comply with research ethics, the pseudonym of participants has been used. Even, the name of platforms has been used anonymously in this research to avoid the conflict of interest. The study found that all participants were male. This implies that there is yet to attract a large number of female workers in the gig economy in Bangladesh in the fields of ride-sharing and food delivery platforms. Most of the participants were either taxi drivers or motorcycle drivers in terms of ride-sharing services. The remaining participants engaged in food delivery works. Looking at the average hours of work per week, the lower score was 10 hours followed by the highest score of 64 hours. The working experience of the majority of participants was less than 1 year.
Results and Discussion
result, all interviews were written manually in the notebook, and then transcribed and coded into thematic fields, according to the six important phases of the thematic analysis technique.
S/N Pseudonym Gender GigPlatforms
Job Role Working Experience
Average hours per week
Location
1 Razzak Male A Driver 4 months 15 hours Dhaka City2 Masum Male A Driver 3 months 20 hours Dhaka City3 Mahmud Male A Driver 2 months 30 hours Dhaka City4 Habib Male A Driver 4 months 20 hours Dhaka City5 Rasel Male A Driver 4 months 25 hours Dhaka City6 Abdul-Kudus Male A Driver 5 months 32 hours Dhaka City7 Rifat Male B Driver 7 month 34 hours Dhaka City8 Syed Male B Driver 4 months 18 hours Dhaka City9 Hanif Male B Driver +1 years 20 hours Dhaka City10 Shovon Male B Driver 12 months 48 hours Dhaka City11 Soliman Male B Driver 13 months 10 hours Dhaka City12 Alain Male B Driver 7 months 35 hours Dhaka City13 Arafat Male C Deliveryman 8 months 28 hours Dhaka City14 Shahidul Male C Deliveryman 6 months 24 hours Dhaka City15 Mizzen Male C Deliveryman 7 months 30 hours Dhaka City16 Iqbal Male C Deliveryman 6 months 36 hours Dhaka City17 Rubel Male C Deliveryman 3 months 42 hours Dhaka City18 Hassan Male C Deliveryman 7 months 32 hours Dhaka City19 Salam Male D Deliveryman 5 months 44 hours Dhaka City20 Karim Male D Deliveryman 7 months 64 hours Dhaka City21 Main Male D Deliveryman 6 months 32 hours Dhaka City22 Nazmul Male D Deliveryman 8 months 48 hours Dhaka City23 Khan Male D Deliveryman 9 months 45 hours Dhaka City
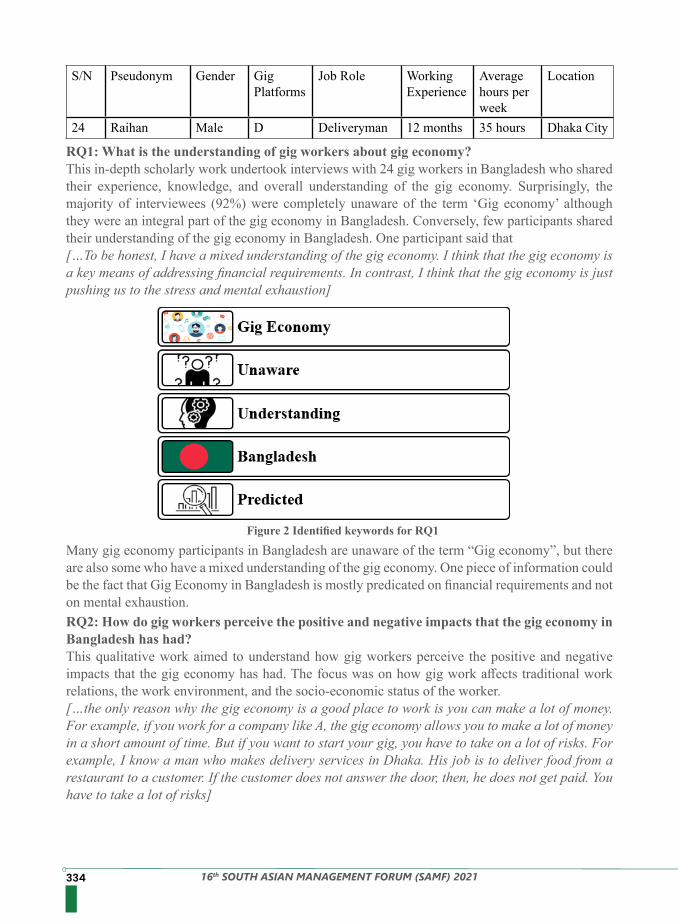
334 16th SOUTH ASIAN MANAGEMENT FORUM (SAMF) 2021
S/N Pseudonym Gender GigPlatforms
Job Role Working Experience
Average hours per week
Location
24 Raihan Male D Deliveryman 12 months 35 hours Dhaka City
RQ1: What is the understanding of gig workers about gig economy?This in-depth scholarly work undertook interviews with 24 gig workers in Bangladesh who shared their experience, knowledge, and overall understanding of the gig economy. Surprisingly, the majority of interviewees (92%) were completely unaware of the term ‘Gig economy’ although they were an integral part of the gig economy in Bangladesh. Conversely, few participants shared their understanding of the gig economy in Bangladesh. One participant said that […To be honest, I have a mixed understanding of the gig economy. I think that the gig economy is a key means of addressing financial requirements. In contrast, I think that the gig economy is just pushing us to the stress and mental exhaustion]
RQ2: How do gig workers perceive the positive and negative impacts that the gig economy in Bangladesh has had?This qualitative work aimed to understand how gig workers perceive the positive and negative impacts that the gig economy has had. The focus was on how gig work affects traditional work relations, the work environment, and the socio-economic status of the worker. […the only reason why the gig economy is a good place to work is you can make a lot of money. For example, if you work for a company like A, the gig economy allows you to make a lot of money in a short amount of time. But if you want to start your gig, you have to take on a lot of risks. For example, I know a man who makes delivery services in Dhaka. His job is to deliver food from a restaurant to a customer. If the customer does not answer the door, then, he does not get paid. You have to take a lot of risks]
Many gig economy participants in Bangladesh are unaware of the term “Gig economy”, but there are also some who have a mixed understanding of the gig economy. One piece of information could be the fact that Gig Economy in Bangladesh is mostly predicated on financial requirements and not on mental exhaustion.
Figure 2 Identified keywords for RQ1
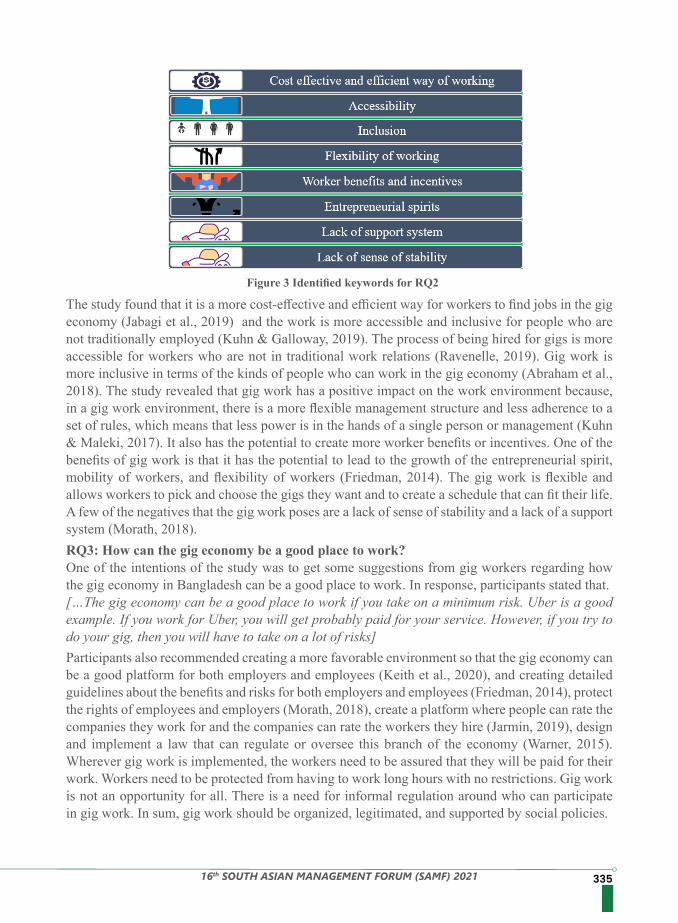
33516th SOUTH ASIAN MANAGEMENT FORUM (SAMF) 2021
RQ3: How can the gig economy be a good place to work?One of the intentions of the study was to get some suggestions from gig workers regarding how the gig economy in Bangladesh can be a good place to work. In response, participants stated that. […The gig economy can be a good place to work if you take on a minimum risk. Uber is a good example. If you work for Uber, you will get probably paid for your service. However, if you try to do your gig, then you will have to take on a lot of risks]
The study found that it is a more cost-effective and efficient way for workers to find jobs in the gig economy (Jabagi et al., 2019) and the work is more accessible and inclusive for people who are not traditionally employed (Kuhn & Galloway, 2019). The process of being hired for gigs is more accessible for workers who are not in traditional work relations (Ravenelle, 2019). Gig work is more inclusive in terms of the kinds of people who can work in the gig economy (Abraham et al., 2018). The study revealed that gig work has a positive impact on the work environment because, in a gig work environment, there is a more flexible management structure and less adherence to a set of rules, which means that less power is in the hands of a single person or management (Kuhn & Maleki, 2017). It also has the potential to create more worker benefits or incentives. One of the benefits of gig work is that it has the potential to lead to the growth of the entrepreneurial spirit, mobility of workers, and flexibility of workers (Friedman, 2014). The gig work is flexible and allows workers to pick and choose the gigs they want and to create a schedule that can fit their life. A few of the negatives that the gig work poses are a lack of sense of stability and a lack of a support system (Morath, 2018).
Participants also recommended creating a more favorable environment so that the gig economy can be a good platform for both employers and employees (Keith et al., 2020), and creating detailed guidelines about the benefits and risks for both employers and employees (Friedman, 2014), protect the rights of employees and employers (Morath, 2018), create a platform where people can rate the companies they work for and the companies can rate the workers they hire (Jarmin, 2019), design and implement a law that can regulate or oversee this branch of the economy (Warner, 2015). Wherever gig work is implemented, the workers need to be assured that they will be paid for their work. Workers need to be protected from having to work long hours with no restrictions. Gig work is not an opportunity for all. There is a need for informal regulation around who can participate in gig work. In sum, gig work should be organized, legitimated, and supported by social policies.
Figure 3 Identified keywords for RQ2
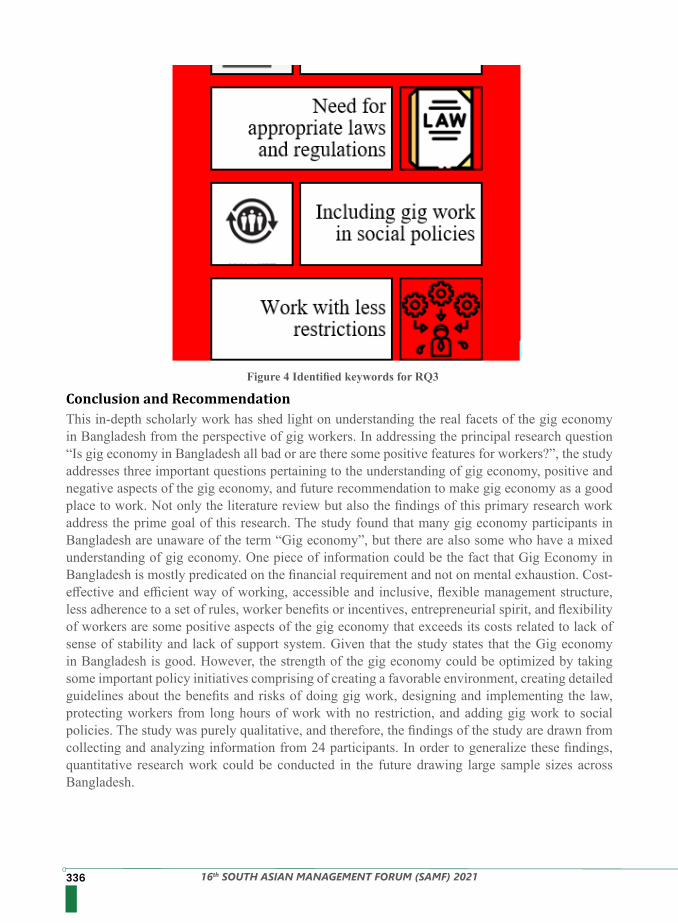
336 16th SOUTH ASIAN MANAGEMENT FORUM (SAMF) 2021
Figure 4 Identified keywords for RQ3
This in-depth scholarly work has shed light on understanding the real facets of the gig economy in Bangladesh from the perspective of gig workers. In addressing the principal research question “Is gig economy in Bangladesh all bad or are there some positive features for workers?”, the study addresses three important questions pertaining to the understanding of gig economy, positive and negative aspects of the gig economy, and future recommendation to make gig economy as a good place to work. Not only the literature review but also the findings of this primary research work address the prime goal of this research. The study found that many gig economy participants in Bangladesh are unaware of the term “Gig economy”, but there are also some who have a mixed understanding of gig economy. One piece of information could be the fact that Gig Economy in Bangladesh is mostly predicated on the financial requirement and not on mental exhaustion. Cost-effective and efficient way of working, accessible and inclusive, flexible management structure, less adherence to a set of rules, worker benefits or incentives, entrepreneurial spirit, and flexibility of workers are some positive aspects of the gig economy that exceeds its costs related to lack of sense of stability and lack of support system. Given that the study states that the Gig economy in Bangladesh is good. However, the strength of the gig economy could be optimized by taking some important policy initiatives comprising of creating a favorable environment, creating detailed guidelines about the benefits and risks of doing gig work, designing and implementing the law, protecting workers from long hours of work with no restriction, and adding gig work to social policies. The study was purely qualitative, and therefore, the findings of the study are drawn from collecting and analyzing information from 24 participants. In order to generalize these findings, quantitative research work could be conducted in the future drawing large sample sizes across Bangladesh.
Conclusion and Recommendation
33716th SOUTH ASIAN MANAGEMENT FORUM (SAMF) 2021
1. Abraham, K. G., Haltiwanger, J. C., Sandusky, K., & Spletzer, J. R. (2018). Measuring the gig economy: Current knowledge and open issues.
2. Ahsan, M. (2020). Entrepreneurship and ethics in the sharing economy: A critical perspective. Journal of Business Ethics, 161(1), 19-33.
3. Bell, E., Bryman, A., & Harley, B. (2018). Business research methods. Oxford university press.4. Berger, T., Frey, C. B., Levin, G., & Danda, S. R. (2019). Uber happy? Work and well-being in
the ‘gig economy. Economic Policy, 34(99), 429-477.5. Bhattacharya, S., & Raghuvanshi, S. (2018). Social transformation led by Gig economy.
International Journal of Education and Management Studies, 8(3), 354-357.6. Cooper, D. R., Schindler, P. S., & Sun, J. (2006). Business research methods (Vol. 9, pp.
1-744). New York: Mcgraw-hill.7. Friedman, G. (2014). Workers without employers: shadow corporations and the rise of the gig
economy. Review of Keynesian Economics, 2(2), 171-188.8. Gleim, M. R., Johnson, C. M., & Lawson, S. J. (2019). Sharers and sellers: A multi-group
examination of gig economy workers’ perceptions. Journal of Business Research, 98, 142-152.9. Howard, J., Gagné, M., Morin, A. J., & Van den Broeck, A. (2016) Motivation profiles at work:
A self-determination theory approach. Journal of Vocational Behavior, 95, 74-89.10. Islam, S., Huda, E., Nasrin, F., & Freelanch Researcher, M. B. A. (2019). Ride-sharing service
in Bangladesh: contemporary states and prospects. International Journal of Business and Management, 14(9), 65-75.
11. Jabagi, N., Croteau, A. M., Audebrand, L. K., & Marsan, J. (2019). Gig-workers’ motivation: thinking beyond carrots and sticks. Journal of Managerial Psychology.
12. Jarmin, R. S. (2019). Evolving measurement for an evolving economy: Thoughts on 21st century US economic statistics. Journal of Economic Perspectives, 33(1), 165-84.
13. Keith, M. G., Harms, P. D., & Long, A. C. (2020). Worker health and well-being in the gig economy: a proposed framework and research agenda. In Entrepreneurial and Small Business Stressors, Experienced Stress, and Well-Being. Emerald Publishing Limited.
14. Kuhn, K. M., & Galloway, T. L. (2019). Expanding perspectives on gig work and gig workers. Journal of Managerial Psychology.
15. Kuhn, K. M., & Maleki, A. (2017). Micro-entrepreneurs, dependent contractors, and instaserfs: Understanding online labor platform workforces. Academy of Management Perspectives, 31(3), 183-200.
16. Kumar, R., Chun, Y., & Rahman, A. (2019). The impacts of ride-sharing on traditional transportation sectors:“A case study of Dhaka, Bangladesh”. IOSR Journal of Business and Management, 21(5), 16-25.
17. Morath, E. (2018). Was the gig economy overblown? Wall Street Journal18. Novitz, T. (2020). The potential for international regulation of gig economy issues. King’s
Law Journal, 31(2), 275-286.19. Radović, M. (2021). The Transformation of Work in a Global Knowledge Economy. In
Entrepreneurship and Work in the Gig Economy (pp. 63-73). Routledge.20. Ravenelle, A. J. (2019). “We’re not uber:” control, autonomy, and entrepreneurship in the gig
economy. Journal of Managerial Psychology.21. Rigby, C. S., & Ryan, R. M. (2018). Self-determination theory in human resource development:
New directions and practical considerations. Advances in Developing Human Resources,
References
338 16th SOUTH ASIAN MANAGEMENT FORUM (SAMF) 2021
20(2), 133-147.22. Rosenblat, A. (2018). Uberland: How algorithms are rewriting the rules of work. Univ of
California Press.23. Saunders, M., Lewis, P., Thornhill, A., & Wilson, J. (2009). Business research methods.
Financial Times, Prentice Hall: London.24. Smith, A. (2016). Gig work, online selling, and home sharing. Pew Research Center. [Online]
retrieved from>https://www.pewresearch.org/internet/2016/11/17/gig-work-online-selling-and-home-sharing/ [Accessed: 20th October 2021]
25. Tarek, M. O. R., & Amit, S. (2019). Sharing Economy: conceptualization; motivators and barriers; and avenues for research in Bangladesh. The Business & Management Review, 10(5), 47-57.
26. Tolba, H. A. S. M. (2021). How The GIG-Economy is Reshaping the World Labor Market. Turkish Journal of Computer and Mathematics Education (TURCOMAT), 12(6), 5246-5261.
27. Warner, M.R. (2015). Asking tough questions about the gig economy. Washington Post, p. B1.28. Zikmund, W. G., Babin, B. J., Carr, J. C., & Griffin, M. (2013). Business Research Method. 9th
Global Edition. South-Western: Cengage Learning.
33916th SOUTH ASIAN MANAGEMENT FORUM (SAMF) 2021
Where we find the evidence of strong large companies in developed countries have better control over their working capital management; the firms in the developing countries are still going through their development phases and growing pains, and unlike their compatriots in the developed world, might have significantly limited access to capital and inefficient management of inventory and receivables. Therefore, the purpose of this paper is to closely examine the difficulties of identifying an optimal working capital policy or strategy.
If one scans the horizon for articles related to working capital management, most of the articles will be about small businesses and/or have a setting in the relatively smaller economies of the world. There are only a handful of articles focused on the USA and there may be a good reason for that. The US and large European firms are well-capitalized and likely have settled on their respective working capital strategies and policies based on years of history, experience, knowledge, and skills of the executives, and technology support. On the other hand, the firms in the developing countries are still going through their development phases and growing pains, and unlike their compatriots in the developed world, might have significantly limited access to capital. The same thing may be true for a relatively new firm in the developed world, and therefore, examining what has been happening in the developing world through the prism of the published articles could be insightful. Not surprisingly, practices regarding liquidity and working capital management in emerging economies represent major departures from developed economies. Significant variation in practices prevails in the developed world also. Weinraub & Visscher, (1998)examined aggressive and conservative working capital management practices in ten different industrial groups in the USA. They concluded that industries following relatively aggressive capital asset management policies also follow conservative liability management policies at the same time. Howorth and Westhead (2003) examined 11 working capital management routines of a large sample of UK small companies and reported that practices for implementing routines are very different. Interestingly, practitioners and experts often report that US firms overinvest in working capital (Hill, Kelly, & Highfield, 2010; Kieschnick, LaPlante, & Moussawi, 2006). One will get a similar picture reading through various articles examining working capital in developing countries implying the firms are inefficiently managing working capital because they overinvest in inventory and accounts receivable. Fairly often, authors suggest actions that will result in more efficient working capital management.The purpose of this paper is to closely examine the difficulties of identifying an optimal working capital policy or strategy. We need to clearly distinguish between working capital policy and working capital management. Authors have often used the terms “aggressive,” “effective”, and “efficient” to describe working capital management. We understand the term “efficient” and “effective” to mean timely recovery pattern of accounts receivable. Using the term “aggressive” with respect to receivables collection is probably not right as the authors are probably suggesting
Strategies and Policies for Managing Working Capital
Abstract
Introduction
Sharif N. Ahkam1
Nazmun Nahar1
Shabnin Rahman Shorna1
1North South University
Keywords: Liquidity, Current Ratio, Working Capital, Return on Assets, Regression analysis
340 16th SOUTH ASIAN MANAGEMENT FORUM (SAMF) 2021
that management closely monitor collections. The specific questions addressed in this paper are: (1) What are the policy aspects and strategy aspects of working capital management? (2) How do we identify what the optimal policy or strategy is? (3) Can we always characterize overinvestment in current assets overinvestment? (4) What summary conclusion can we draw from all the studies? This is a follow-up to work on working capital. The paper is organized as follows. In the next section (section II), we provide a brief of the issues in working capital management studies. In section III, we provide a literature review. In section IV, we discuss the difficulties of identifying optimal working capital levels. We layout the models we test and the data we use. In section V, we present the results and provide interpretations of the findings. The paper is wrapped up with the conclusion section. The paper is concluded with some generalized statements that will be helpful to practitioners. We will review the literature on working capital management and draw meaningful conclusions from them.
II. Some Critical Issues Regarding Working Capital
Managing working capital on a regular basis most likely focuses on receivables management since accounts payable will not be delayed without damaging relationships with suppliers. Managing inventory points to efforts of maintaining inventory at or near a target level. If the actual level falls below the target level, it may be due to unexpected demand for extra production, not an entirely undesirable situation. A blip does not necessarily imply inefficiency. A sudden rise in the level may be due to events beyond management’s control. If the rise is due to a fall in the demand for products, that is certainly a warning bell. But generally, inventory is not as malleable as accounts receivable. The textbook concept of a conservative working capital policy implies that current and temporary assets are financed utilizing long-term (permanent) sources as much as the policy allows. The aggressive policy will do the opposite, it will rely on short-term sources to finance short-term assets as much as possible. Since short-term financing is normally cheaper, it will save financing cost and hence increase profit, provided that the mismatch does not result in financial distress cost exceeding the savings. These definitions do not exactly point to managing working capital, rather it just provides the policy alternatives. Establishing and following an aggressive policy may be done by (1) relying on a higher level of short-term borrowing (reducing reliance on the permanent sources and risking problems in matching inflows with outflow obligations), (2) perhaps being a ‘slow payer’ to suppliers, (3) or both. It can also be achieved by requiring customers to pay quickly with a policy change and hold inventories (INV) for a shorter period without doing anything with accounts payable (AP). This will lower external short-term funding needs which technically will be a movement toward a more conservative practice. If a management is to change its routines in managing working capital, the policy has to be changed first. If networking capital is defined as accounts receivable (AR) + Inventory (INV) – Accounts payable (AP), there are six different combinations to move to a more conservative (or aggressive) stance, and if a change in AP level is combined with a change in AR or INV, or both, we will not know whether the firm’s policy has become more conservative or aggressive without actually computing the numbers. If we measure the corresponding numbers in terms of days, we obtain the cash conversion cycle or net trading cycle. Lengthening payable is not advised by most authors. Authors also have not considered the fact that, aside from boosting trade credits and discounts that may move inventory faster and lower inventory balance, it is more a function of the production and logistics system and is not quickly adjustable without sacrificing some profit. Lowering inventory
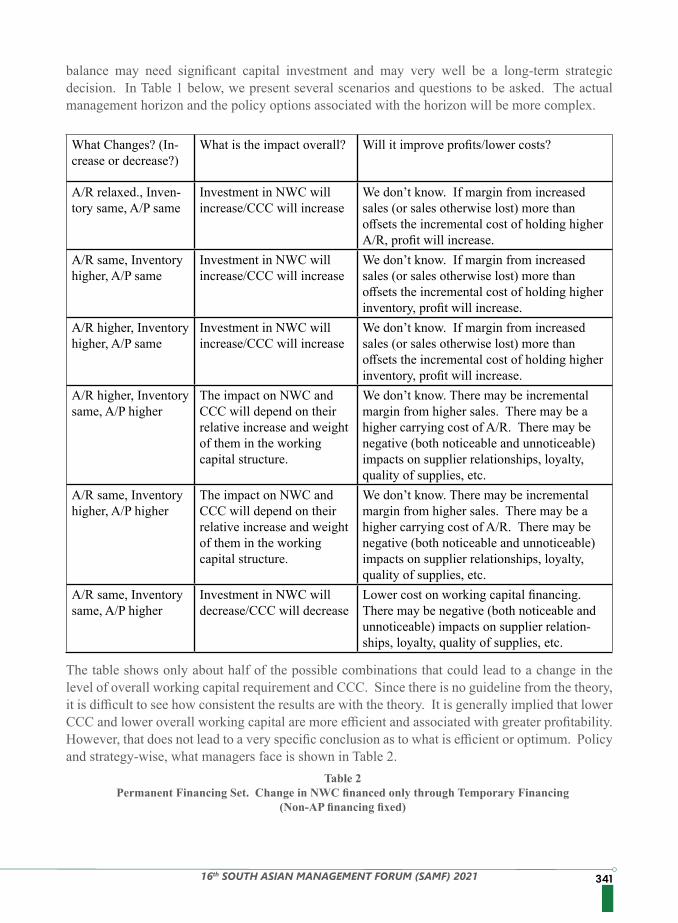
34116th SOUTH ASIAN MANAGEMENT FORUM (SAMF) 2021
balance may need significant capital investment and may very well be a long-term strategic decision. In Table 1 below, we present several scenarios and questions to be asked. The actual management horizon and the policy options associated with the horizon will be more complex.
The table shows only about half of the possible combinations that could lead to a change in the level of overall working capital requirement and CCC. Since there is no guideline from the theory, it is difficult to see how consistent the results are with the theory. It is generally implied that lower CCC and lower overall working capital are more efficient and associated with greater profitability. However, that does not lead to a very specific conclusion as to what is efficient or optimum. Policy and strategy-wise, what managers face is shown in Table 2.
What Changes? (In-crease or decrease?)
What is the impact overall? Will it improve profits/lower costs?
A/R relaxed., Inven-tory same, A/P same
Investment in NWC will increase/CCC will increase
We don’t know. If margin from increased sales (or sales otherwise lost) more than offsets the incremental cost of holding higher A/R, profit will increase.
A/R same, Inventory higher, A/P same
Investment in NWC will increase/CCC will increase
We don’t know. If margin from increased sales (or sales otherwise lost) more than offsets the incremental cost of holding higher inventory, profit will increase.
A/R higher, Inventory higher, A/P same
Investment in NWC will increase/CCC will increase
We don’t know. If margin from increased sales (or sales otherwise lost) more than offsets the incremental cost of holding higher inventory, profit will increase.
A/R higher, Inventory same, A/P higher
The impact on NWC and CCC will depend on their relative increase and weight of them in the working capital structure.
We don’t know. There may be incremental margin from higher sales. There may be a higher carrying cost of A/R. There may be negative (both noticeable and unnoticeable) impacts on supplier relationships, loyalty, quality of supplies, etc.
A/R same, Inventory higher, A/P higher
The impact on NWC and CCC will depend on their relative increase and weight of them in the working capital structure.
We don’t know. There may be incremental margin from higher sales. There may be a higher carrying cost of A/R. There may be negative (both noticeable and unnoticeable) impacts on supplier relationships, loyalty, quality of supplies, etc.
A/R same, Inventory same, A/P higher
Investment in NWC will decrease/CCC will decrease
Lower cost on working capital financing. There may be negative (both noticeable and unnoticeable) impacts on supplier relation-ships, loyalty, quality of supplies, etc.
Table 2Permanent Financing Set. Change in NWC financed only through Temporary Financing
(Non-AP financing fixed)
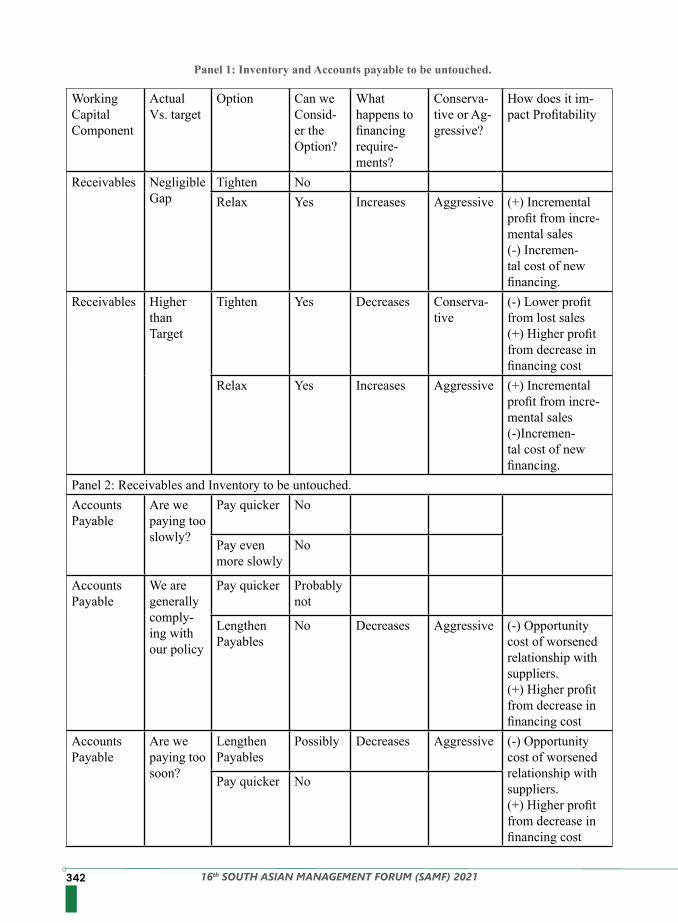
342 16th SOUTH ASIAN MANAGEMENT FORUM (SAMF) 2021
Panel 1: Inventory and Accounts payable to be untouched.
Working Capital Component
Actual Vs. target
Option Can we Consid-er the Option?
What happens to financing require-ments?
Conserva-tive or Ag-gressive?
How does it im-pact Profitability
Receivables Negligible Gap
Tighten NoRelax Yes Increases Aggressive (+) Incremental
profit from incre-mental sales(-) Incremen-tal cost of new financing.
Receivables Higher than Target
Tighten Yes Decreases Conserva-tive
(-) Lower profit from lost sales(+) Higher profit from decrease in financing cost
Relax Yes Increases Aggressive (+) Incremental profit from incre-mental sales(-)Incremen-tal cost of new financing.
Panel 2: Receivables and Inventory to be untouched.Accounts Payable
Are we paying too slowly?
Pay quicker No
Pay even more slowly
No
Accounts Payable
We are generally comply-ing with our policy
Pay quicker Probably not
Lengthen Payables
No Decreases Aggressive (-) Opportunity cost of worsened relationship with suppliers. (+) Higher profit from decrease in financing cost
Accounts Payable
Are we paying too soon?
Lengthen Payables
Possibly Decreases Aggressive (-) Opportunity cost of worsened relationship with suppliers.(+) Higher profit from decrease in financing cost
Pay quicker No
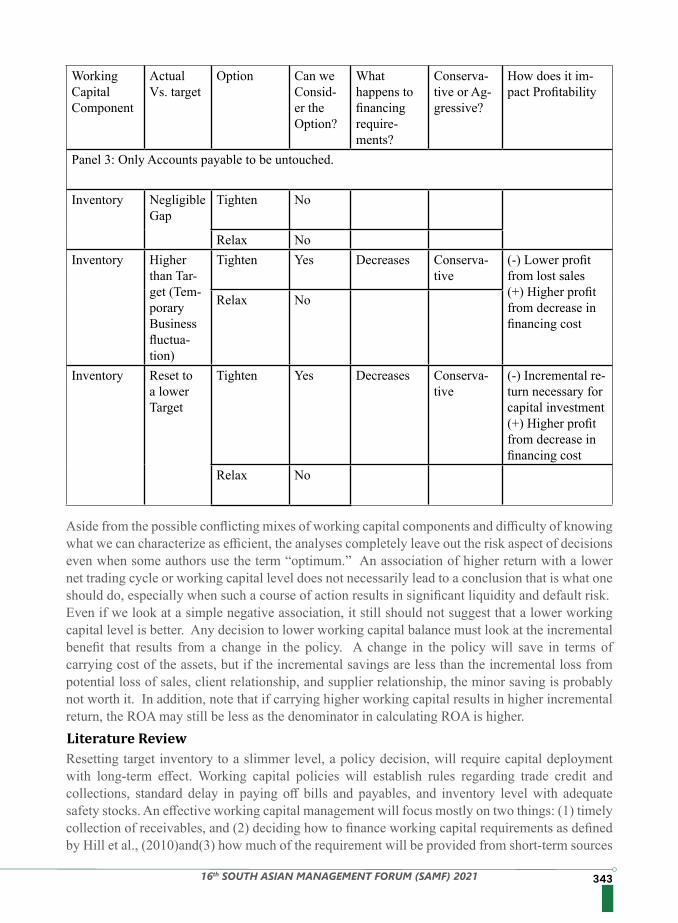
34316th SOUTH ASIAN MANAGEMENT FORUM (SAMF) 2021
Working Capital Component
Actual Vs. target
Option Can we Consid-er the Option?
What happens to financing require-ments?
Conserva-tive or Ag-gressive?
How does it im-pact Profitability
Panel 3: Only Accounts payable to be untouched.
Inventory Negligible Gap
Tighten No
Relax NoInventory Higher
than Tar-get (Tem-porary Business fluctua-tion)
Tighten Yes Decreases Conserva-tive
(-) Lower profit from lost sales(+) Higher profit from decrease in financing cost
Relax No
Inventory Reset to a lower Target
Tighten Yes Decreases Conserva-tive
(-) Incremental re-turn necessary for capital investment(+) Higher profit from decrease in financing cost
Relax No
Aside from the possible conflicting mixes of working capital components and difficulty of knowing what we can characterize as efficient, the analyses completely leave out the risk aspect of decisions even when some authors use the term “optimum.” An association of higher return with a lower net trading cycle or working capital level does not necessarily lead to a conclusion that is what one should do, especially when such a course of action results in significant liquidity and default risk.Even if we look at a simple negative association, it still should not suggest that a lower working capital level is better. Any decision to lower working capital balance must look at the incremental benefit that results from a change in the policy. A change in the policy will save in terms of carrying cost of the assets, but if the incremental savings are less than the incremental loss from potential loss of sales, client relationship, and supplier relationship, the minor saving is probably not worth it. In addition, note that if carrying higher working capital results in higher incremental return, the ROA may still be less as the denominator in calculating ROA is higher.
Resetting target inventory to a slimmer level, a policy decision, will require capital deployment with long-term effect. Working capital policies will establish rules regarding trade credit and collections, standard delay in paying off bills and payables, and inventory level with adequate safety stocks. An effective working capital management will focus mostly on two things: (1) timely collection of receivables, and (2) deciding how to finance working capital requirements as defined by Hill et al., (2010)and(3) how much of the requirement will be provided from short-term sources
Literature Review
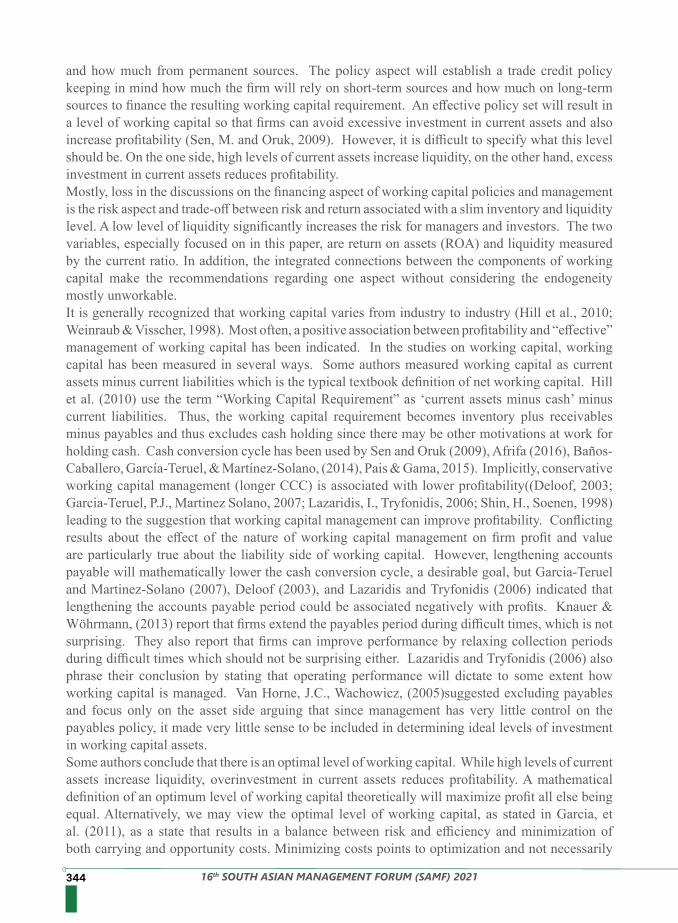
344 16th SOUTH ASIAN MANAGEMENT FORUM (SAMF) 2021
and how much from permanent sources. The policy aspect will establish a trade credit policy keeping in mind how much the firm will rely on short-term sources and how much on long-term sources to finance the resulting working capital requirement. An effective policy set will result in a level of working capital so that firms can avoid excessive investment in current assets and also increase profitability (Sen, M. and Oruk, 2009). However, it is difficult to specify what this level should be. On the one side, high levels of current assets increase liquidity, on the other hand, excess investment in current assets reduces profitability. Mostly, loss in the discussions on the financing aspect of working capital policies and management is the risk aspect and trade-off between risk and return associated with a slim inventory and liquidity level. A low level of liquidity significantly increases the risk for managers and investors. The two variables, especially focused on in this paper, are return on assets (ROA) and liquidity measured by the current ratio. In addition, the integrated connections between the components of working capital make the recommendations regarding one aspect without considering the endogeneity mostly unworkable.It is generally recognized that working capital varies from industry to industry (Hill et al., 2010; Weinraub & Visscher, 1998). Most often, a positive association between profitability and “effective” management of working capital has been indicated. In the studies on working capital, working capital has been measured in several ways. Some authors measured working capital as current assets minus current liabilities which is the typical textbook definition of net working capital. Hill et al. (2010) use the term “Working Capital Requirement” as ‘current assets minus cash’ minus current liabilities. Thus, the working capital requirement becomes inventory plus receivables minus payables and thus excludes cash holding since there may be other motivations at work for holding cash. Cash conversion cycle has been used by Sen and Oruk (2009), Afrifa (2016), Baños-Caballero, García-Teruel, & Martínez-Solano, (2014), Pais & Gama, 2015). Implicitly, conservative working capital management (longer CCC) is associated with lower profitability((Deloof, 2003; Garcia-Teruel, P.J., Martinez Solano, 2007; Lazaridis, I., Tryfonidis, 2006; Shin, H., Soenen, 1998) leading to the suggestion that working capital management can improve profitability. Conflicting results about the effect of the nature of working capital management on firm profit and value are particularly true about the liability side of working capital. However, lengthening accounts payable will mathematically lower the cash conversion cycle, a desirable goal, but Garcia-Teruel and Martinez-Solano (2007), Deloof (2003), and Lazaridis and Tryfonidis (2006) indicated that lengthening the accounts payable period could be associated negatively with profits. Knauer & Wöhrmann, (2013) report that firms extend the payables period during difficult times, which is not surprising. They also report that firms can improve performance by relaxing collection periods during difficult times which should not be surprising either. Lazaridis and Tryfonidis (2006) also phrase their conclusion by stating that operating performance will dictate to some extent how working capital is managed. Van Horne, J.C., Wachowicz, (2005)suggested excluding payables and focus only on the asset side arguing that since management has very little control on the payables policy, it made very little sense to be included in determining ideal levels of investment in working capital assets.Some authors conclude that there is an optimal level of working capital. While high levels of current assets increase liquidity, overinvestment in current assets reduces profitability. A mathematical definition of an optimum level of working capital theoretically will maximize profit all else being equal. Alternatively, we may view the optimal level of working capital, as stated in Garcia, et al. (2011), as a state that results in a balance between risk and efficiency and minimization of both carrying and opportunity costs. Minimizing costs points to optimization and not necessarily
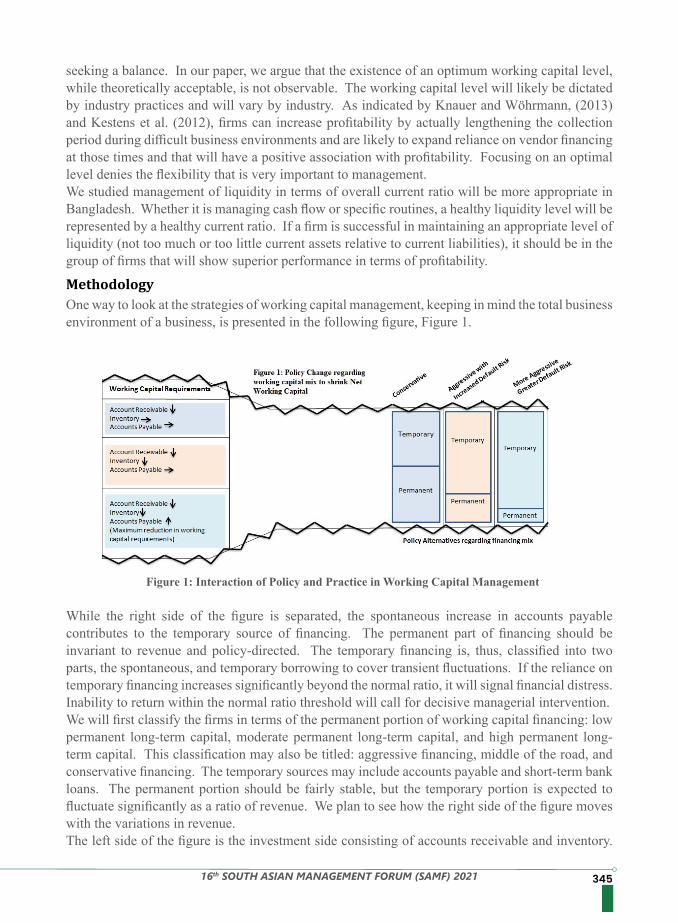
34516th SOUTH ASIAN MANAGEMENT FORUM (SAMF) 2021
seeking a balance. In our paper, we argue that the existence of an optimum working capital level, while theoretically acceptable, is not observable. The working capital level will likely be dictated by industry practices and will vary by industry. As indicated by Knauer and Wöhrmann, (2013) and Kestens et al. (2012), firms can increase profitability by actually lengthening the collection period during difficult business environments and are likely to expand reliance on vendor financing at those times and that will have a positive association with profitability. Focusing on an optimal level denies the flexibility that is very important to management. We studied management of liquidity in terms of overall current ratio will be more appropriate in Bangladesh. Whether it is managing cash flow or specific routines, a healthy liquidity level will be represented by a healthy current ratio. If a firm is successful in maintaining an appropriate level of liquidity (not too much or too little current assets relative to current liabilities), it should be in the group of firms that will show superior performance in terms of profitability.
One way to look at the strategies of working capital management, keeping in mind the total business environment of a business, is presented in the following figure, Figure 1.
Figure 1: Interaction of Policy and Practice in Working Capital Management While the right side of the figure is separated, the spontaneous increase in accounts payable contributes to the temporary source of financing. The permanent part of financing should be invariant to revenue and policy-directed. The temporary financing is, thus, classified into two parts, the spontaneous, and temporary borrowing to cover transient fluctuations. If the reliance on temporary financing increases significantly beyond the normal ratio, it will signal financial distress. Inability to return within the normal ratio threshold will call for decisive managerial intervention.We will first classify the firms in terms of the permanent portion of working capital financing: low permanent long-term capital, moderate permanent long-term capital, and high permanent long-term capital. This classification may also be titled: aggressive financing, middle of the road, and conservative financing. The temporary sources may include accounts payable and short-term bank loans. The permanent portion should be fairly stable, but the temporary portion is expected to fluctuate significantly as a ratio of revenue. We plan to see how the right side of the figure moves with the variations in revenue.The left side of the figure is the investment side consisting of accounts receivable and inventory.
Methodology
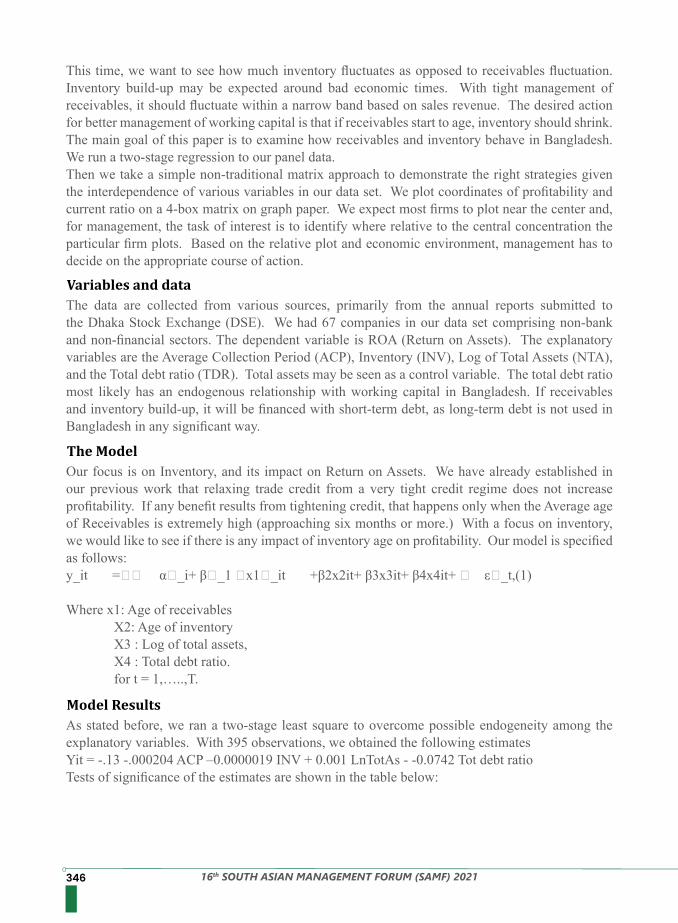
346 16th SOUTH ASIAN MANAGEMENT FORUM (SAMF) 2021
This time, we want to see how much inventory fluctuates as opposed to receivables fluctuation. Inventory build-up may be expected around bad economic times. With tight management of receivables, it should fluctuate within a narrow band based on sales revenue. The desired action for better management of working capital is that if receivables start to age, inventory should shrink. The main goal of this paper is to examine how receivables and inventory behave in Bangladesh. We run a two-stage regression to our panel data.Then we take a simple non-traditional matrix approach to demonstrate the right strategies given the interdependence of various variables in our data set. We plot coordinates of profitability and current ratio on a 4-box matrix on graph paper. We expect most firms to plot near the center and, for management, the task of interest is to identify where relative to the central concentration the particular firm plots. Based on the relative plot and economic environment, management has to decide on the appropriate course of action.
The data are collected from various sources, primarily from the annual reports submitted to the Dhaka Stock Exchange (DSE). We had 67 companies in our data set comprising non-bank and non-financial sectors. The dependent variable is ROA (Return on Assets). The explanatory variables are the Average Collection Period (ACP), Inventory (INV), Log of Total Assets (NTA), and the Total debt ratio (TDR). Total assets may be seen as a control variable. The total debt ratio most likely has an endogenous relationship with working capital in Bangladesh. If receivables and inventory build-up, it will be financed with short-term debt, as long-term debt is not used in Bangladesh in any significant way.
As stated before, we ran a two-stage least square to overcome possible endogeneity among the explanatory variables. With 395 observations, we obtained the following estimatesYit = -.13 -.000204 ACP –0.0000019 INV + 0.001 LnTotAs - -0.0742 Tot debt ratioTests of significance of the estimates are shown in the table below:
Our focus is on Inventory, and its impact on Return on Assets. We have already established in our previous work that relaxing trade credit from a very tight credit regime does not increase profitability. If any benefit results from tightening credit, that happens only when the Average age of Receivables is extremely high (approaching six months or more.) With a focus on inventory, we would like to see if there is any impact of inventory age on profitability. Our model is specified as follows: y_it = α_i+ β_1 x1_it +β2x2it+ β3x3it+ β4x4it+ ε_t,(1)
Where x1: Age of receivables X2: Age of inventory X3 : Log of total assets, X4 : Total debt ratio. for t = 1,…..,T.
Variables and data
Model Results
The Model
34716th SOUTH ASIAN MANAGEMENT FORUM (SAMF) 2021
The results indicate that bigger firms are profitable and high ACP negatively impacts profitability. A high total debt ratio also negatively impacts profitability. However, the average inventory balance does not seem to impact profitability at all. This provides a strong signal that managing inventory is not a critical component of working capital management and the focus should be on managing the age of receivables (ACP).We wish to juxtapose the trend in Inventory with receivables.
A comparison of the figures shows that the average age of inventory has remained a relatively narrow band as opposed to the average age of receivables. The age of inventory seems to increase at the end of the figure when ACP also seems to rise. As a result, it is not consistent with the recommendation that if ACP increases, the age of inventory reduction may work as an offset. It may be worthwhile to examine the trends around the subprime loan crisis time of 2007. We can see the age of inventory declining, probably in response to the financial challenges at that time.
Variable Coefficient St. Error t-statistics ProbC -0.1307 0.05836 -2.24 0.0256ACP -0000204 3.89E-05 -5.25 0.00Inventory -1.90E-06 2.93E-06 -0.65 .5173Log Total Assets 0.010946 0.002629 4.16 0.00Total Debt Ratio -0.0742 0.01826 -4.06 0.0001
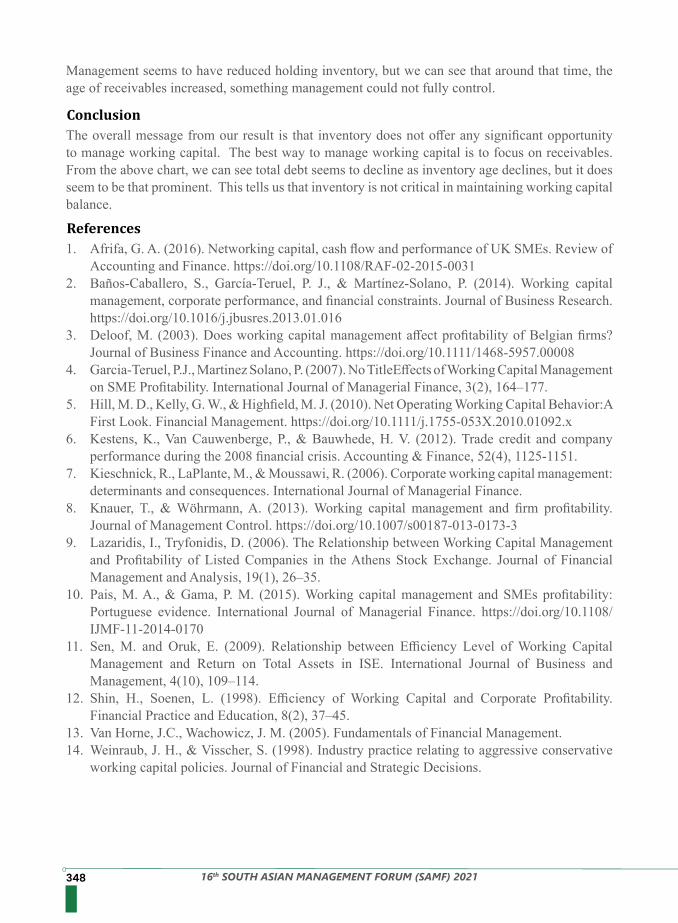
348 16th SOUTH ASIAN MANAGEMENT FORUM (SAMF) 2021
Management seems to have reduced holding inventory, but we can see that around that time, the age of receivables increased, something management could not fully control.
The overall message from our result is that inventory does not offer any significant opportunity to manage working capital. The best way to manage working capital is to focus on receivables. From the above chart, we can see total debt seems to decline as inventory age declines, but it does seem to be that prominent. This tells us that inventory is not critical in maintaining working capital balance.
1. Afrifa, G. A. (2016). Networking capital, cash flow and performance of UK SMEs. Review of Accounting and Finance. https://doi.org/10.1108/RAF-02-2015-0031
2. Baños-Caballero, S., García-Teruel, P. J., & Martínez-Solano, P. (2014). Working capital management, corporate performance, and financial constraints. Journal of Business Research. https://doi.org/10.1016/j.jbusres.2013.01.016
3. Deloof, M. (2003). Does working capital management affect profitability of Belgian firms? Journal of Business Finance and Accounting. https://doi.org/10.1111/1468-5957.00008
4. Garcia-Teruel, P.J., Martinez Solano, P. (2007). No TitleEffects of Working Capital Management on SME Profitability. International Journal of Managerial Finance, 3(2), 164–177.
5. Hill, M. D., Kelly, G. W., & Highfield, M. J. (2010). Net Operating Working Capital Behavior:A First Look. Financial Management. https://doi.org/10.1111/j.1755-053X.2010.01092.x
6. Kestens, K., Van Cauwenberge, P., & Bauwhede, H. V. (2012). Trade credit and company performance during the 2008 financial crisis. Accounting & Finance, 52(4), 1125-1151.
7. Kieschnick, R., LaPlante, M., & Moussawi, R. (2006). Corporate working capital management: determinants and consequences. International Journal of Managerial Finance.
8. Knauer, T., & Wöhrmann, A. (2013). Working capital management and firm profitability. Journal of Management Control. https://doi.org/10.1007/s00187-013-0173-3
9. Lazaridis, I., Tryfonidis, D. (2006). The Relationship between Working Capital Management and Profitability of Listed Companies in the Athens Stock Exchange. Journal of Financial Management and Analysis, 19(1), 26–35.
10. Pais, M. A., & Gama, P. M. (2015). Working capital management and SMEs profitability: Portuguese evidence. International Journal of Managerial Finance. https://doi.org/10.1108/IJMF-11-2014-0170
11. Sen, M. and Oruk, E. (2009). Relationship between Efficiency Level of Working Capital Management and Return on Total Assets in ISE. International Journal of Business and Management, 4(10), 109–114.
12. Shin, H., Soenen, L. (1998). Efficiency of Working Capital and Corporate Profitability. Financial Practice and Education, 8(2), 37–45.
13. Van Horne, J.C., Wachowicz, J. M. (2005). Fundamentals of Financial Management.14. Weinraub, J. H., & Visscher, S. (1998). Industry practice relating to aggressive conservative
working capital policies. Journal of Financial and Strategic Decisions.
Conclusion
References
34916th SOUTH ASIAN MANAGEMENT FORUM (SAMF) 2021
The emergence of the contradictory approach to investing decisions is reflected in Behavioral Finance. Investment behavior has witnessed a huge change after the pandemic and the investors are leading a new trend in the pattern of investment. The Investment avenues include both real assets and financial assets. Investment is based on savings and these investment portfolios take their shape as per the investors’ attitude. The priority on which to invest at what percentage lies with the investors’ desire and one such desirable, attractive, and emotional investment is GOLD. The perception of Gold in an Indian Investor is different when compared to other avenues of investment. This paper examines the pattern of Gold investment during the pandemic – Covid 19 by individual investors. The paper is based on the primary data analyzed through the questionnaire prepared for studying the determinants of investors in gold. This paper highlights the gold investment plan structured by an investor in their portfolio. The statistical tests conducted include Cross-tabulation, Chi-square, and ANOVA tests.
The outburst of the pandemic, Covid-19, has affected the entire globe and has an impact on the ground level of income impacting the investment pattern. The determinants of gold investment include Prices of gold, Inflation rates, Interest rates, Demand-Supply factors, the Indian Jewelry Market, Import Duty, and Government Reserves. The negative impact of this pandemic has damaged numerous businesses and resulted in the shift of many investment decisions. The priorities of investment seem to be drafting its tendency and the new normal conditions motivate a new trend in investment pattern.
People choose their avenues depending upon specific income, risk, and return preferences. In India, today, the various avenues include Bank Deposits, Government Securities, Insurance, Public Provident Funds, Real Estate Companies, Commodities, Mutual Funds, Debt, and Equity. With this wide range of investment alternatives available, broadly it can be categorized into financial and real assets. Indian investors are found inclined toward one special type of avenue among the different types of investment avenues that makes the basket of the investor portfolio strong and risk-free. The most appreciated investment avenue among them is the yellow metal - gold. Gold is attached to many investors as an emotional/sentimental asset and sometimes as a psychological asset too. This asset is extracted from the mines as a natural resource and historically has been in abundance in India.
Gold has a special place in Indian culture and was always considered auspicious for presenting gold as a gift or purchasing for oneself, almost all occasions like weddings, baby showers, naming ceremonies, birthdays, housewarming ceremonies, etc. The legendarily supreme and enigma nature
The Impact of Pandemic on Investment Behavior: Specifically on Gold Investment in India
Abstract
Introduction
Mrs. Prathibha Vikram, Research Scholar, Visvesvaraya Technological UniversityDr. Rajendra Kumar Sinha, Professor & Chairperson - Centre for Excellence in Banking, Jagdish Sheth School of Management
Keywords: Investment Patterns, Gold Investments, Pandemic Period, Gold Price
350 16th SOUTH ASIAN MANAGEMENT FORUM (SAMF) 2021
of Gold makes it even more special for traders and consumers to deal with this special attractive asset. Indian Culture has evidenced this asset class from various times with reference to Vedas, Epics, Puranas, Upanishads, and many more ancient scripts. India stands as one of the largest consumers of Gold in the world.
The re-allocations of portfolios during the pandemic situation are well-drafted in this paper (Suryavamshi, Himanshu, and Mushir, 2021). The behavior of investors during the pandemic, on shifting risky assets to risk-free assets varies from investor to investor. The variables affecting the investment avenues to be selected by the individual investor for diversifying the portfolio are compared between gold and stocks as safer and risky investments respectively. (Marwaha Kanika and Arora Sangeeta, 2015) The study compares the variables preferred by Individual Investors for Gold (Safer Investment) Vs Stocks (Risky Investment). The long and short-run determinants of the price of gold (Levin, E.J. and Montagnoli, A. and Wright, R.E., 2006) studied the rise of the gold price, examined for over a hundred years with various iterations of gold standards and its significant short term fluctuations.
The reaction of the Indian stock market is influenced by the Indian gold market (Mukhuti Somnath and Bhunia Amalendu, 2013). The prices of gold influence the Stock market index in India (Sensex and Nifty) which was compared with data for two decades using Time series data applying a bivariate and multivariate co-integration test. Gold which is considered a safe haven and solid asset is examined with a national crisis, bank failures, and rupee depreciation along with other macro factors. The determinants of gold prices are based on empirical analysis and implications, (Imad B. Baalbaki, Said Elfakhani, and Hind Rizk, 2009). This paper considered factors affecting gold supply and demand by employing a model starting from 1971 to 1998 and factor analysis for a later period between 1991 to 2001. This paper emphasized the impact of gold prices related to the financial crisis of the world and the credit crunch where governments restore to stabilize the currency. The price of gold based on error correction (Gangopadhyay K, Jangir A, and Sensarma R, 2016) identifies investment decisions and the major movers of the data by inflation hedge. The role of behavioral finance in deciding on investment in India (Vinay Kandpal and Rajat Mehrotra, 2018) describes how a wise investment decision requires the entire investor’s factors considered like financial goals, spending habits, perception towards investments, period, lifestyle changes, liquidity and expected returns.
A study on various forms of gold investment (Nishad Nawaz and Sudindra V R, 2013) highlights the various forms in which an investor can opt to choose gold. The gold form is not reserved only for jewels but spreads over gold coins, gold idols, bullions, ETF, gold mutual funds, e-gold, etc. The financial decision made amidst the pandemic (Aslishan Gizem Korkmaz, Pengpeng Yue, and Haigang Zhou, 2020) period will surely change the household portfolio pattern and there will be a shift in the risk behavior of the investors. The Linear probability models are used to analyze the household-level effects of Covid19.
Review Of Literature
This paper studies the variations brought in by the pandemic in the investors’ decisions. To analyze if there is a significant change in gold investments and to study the shift in these patterns due to these price fluctuations.
Research Gaps
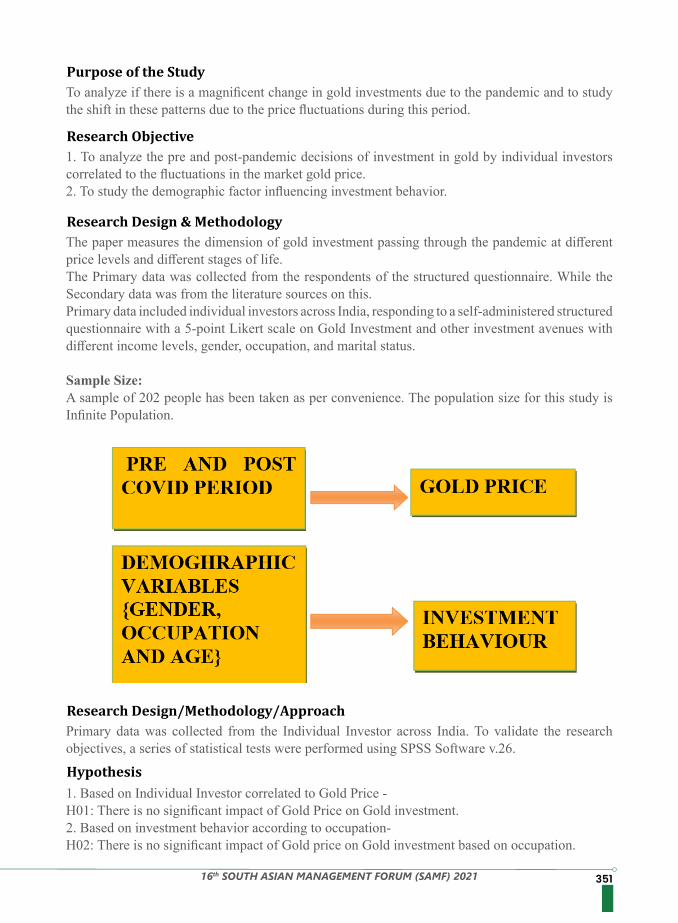
35116th SOUTH ASIAN MANAGEMENT FORUM (SAMF) 2021
To analyze if there is a magnificent change in gold investments due to the pandemic and to study the shift in these patterns due to the price fluctuations during this period.
1. To analyze the pre and post-pandemic decisions of investment in gold by individual investors correlated to the fluctuations in the market gold price.2. To study the demographic factor influencing investment behavior.
Primary data was collected from the Individual Investor across India. To validate the research objectives, a series of statistical tests were performed using SPSS Software v.26.
1. Based on Individual Investor correlated to Gold Price -H01: There is no significant impact of Gold Price on Gold investment.2. Based on investment behavior according to occupation-H02: There is no significant impact of Gold price on Gold investment based on occupation.
The paper measures the dimension of gold investment passing through the pandemic at different price levels and different stages of life. The Primary data was collected from the respondents of the structured questionnaire. While the Secondary data was from the literature sources on this. Primary data included individual investors across India, responding to a self-administered structured questionnaire with a 5-point Likert scale on Gold Investment and other investment avenues with different income levels, gender, occupation, and marital status.
Sample Size:A sample of 202 people has been taken as per convenience. The population size for this study is Infinite Population.
Purpose of the Study
Research Objective
Research Design/Methodology/Approach
Hypothesis
Research Design & Methodology
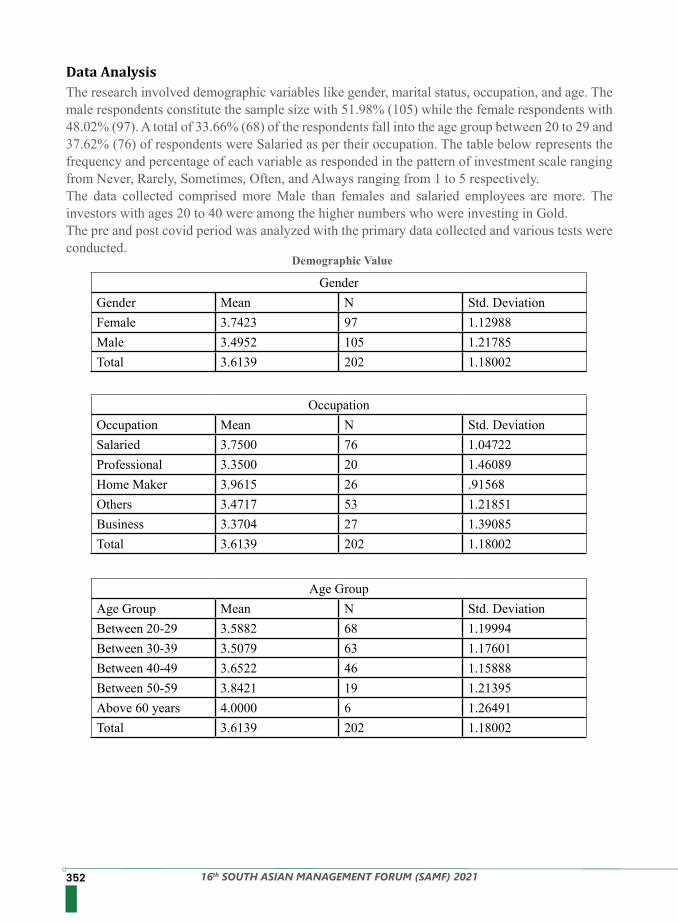
352 16th SOUTH ASIAN MANAGEMENT FORUM (SAMF) 2021
Demographic Value
GenderGender Mean N Std. DeviationFemale 3.7423 97 1.12988Male 3.4952 105 1.21785Total 3.6139 202 1.18002
OccupationOccupation Mean N Std. DeviationSalaried 3.7500 76 1.04722Professional 3.3500 20 1.46089Home Maker 3.9615 26 .91568Others 3.4717 53 1.21851Business 3.3704 27 1.39085Total 3.6139 202 1.18002
Age GroupAge Group Mean N Std. DeviationBetween 20-29 3.5882 68 1.19994Between 30-39 3.5079 63 1.17601Between 40-49 3.6522 46 1.15888Between 50-59 3.8421 19 1.21395Above 60 years 4.0000 6 1.26491Total 3.6139 202 1.18002
The research involved demographic variables like gender, marital status, occupation, and age. The male respondents constitute the sample size with 51.98% (105) while the female respondents with 48.02% (97). A total of 33.66% (68) of the respondents fall into the age group between 20 to 29 and 37.62% (76) of respondents were Salaried as per their occupation. The table below represents the frequency and percentage of each variable as responded in the pattern of investment scale ranging from Never, Rarely, Sometimes, Often, and Always ranging from 1 to 5 respectively.The data collected comprised more Male than females and salaried employees are more. The investors with ages 20 to 40 were among the higher numbers who were investing in Gold.The pre and post covid period was analyzed with the primary data collected and various tests were conducted.
Data Analysis
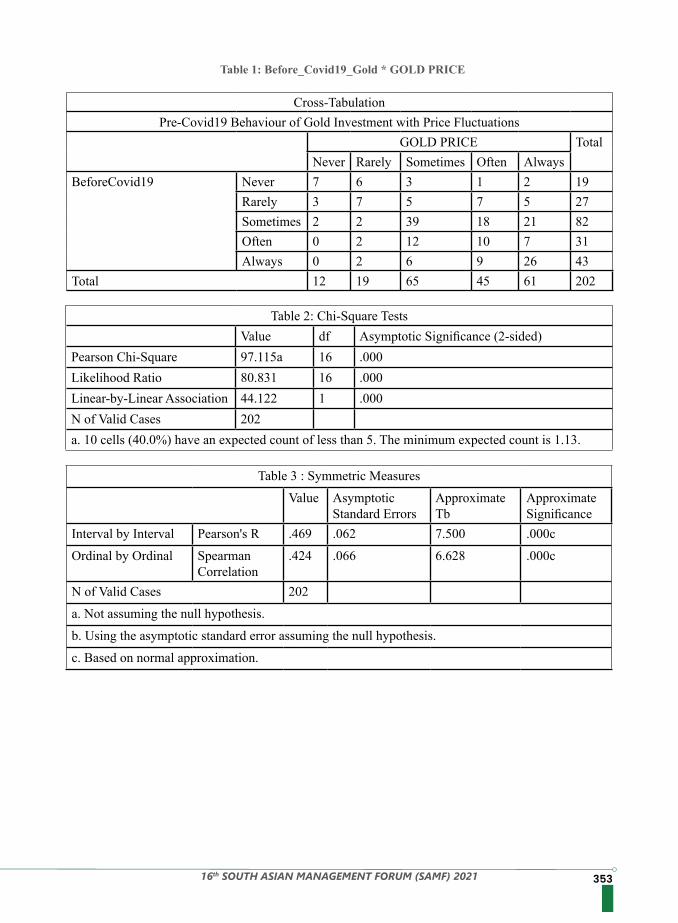
35316th SOUTH ASIAN MANAGEMENT FORUM (SAMF) 2021
Table 1: Before_Covid19_Gold * GOLD PRICE
Cross-TabulationPre-Covid19 Behaviour of Gold Investment with Price Fluctuations
GOLD PRICE TotalNever Rarely Sometimes Often Always
BeforeCovid19 Never 7 6 3 1 2 19Rarely 3 7 5 7 5 27Sometimes 2 2 39 18 21 82Often 0 2 12 10 7 31Always 0 2 6 9 26 43
Total 12 19 65 45 61 202
Table 2: Chi-Square TestsValue df Asymptotic Significance (2-sided)
Pearson Chi-Square 97.115a 16 .000Likelihood Ratio 80.831 16 .000Linear-by-Linear Association 44.122 1 .000N of Valid Cases 202a. 10 cells (40.0%) have an expected count of less than 5. The minimum expected count is 1.13.
Table 3 : Symmetric Measures
Value Asymptotic Standard Errors
Approximate Tb
Approximate Significance
Interval by Interval Pearson's R .469 .062 7.500 .000c
Ordinal by Ordinal Spearman Correlation
.424 .066 6.628 .000c
N of Valid Cases 202
a. Not assuming the null hypothesis.
b. Using the asymptotic standard error assuming the null hypothesis.
c. Based on normal approximation.
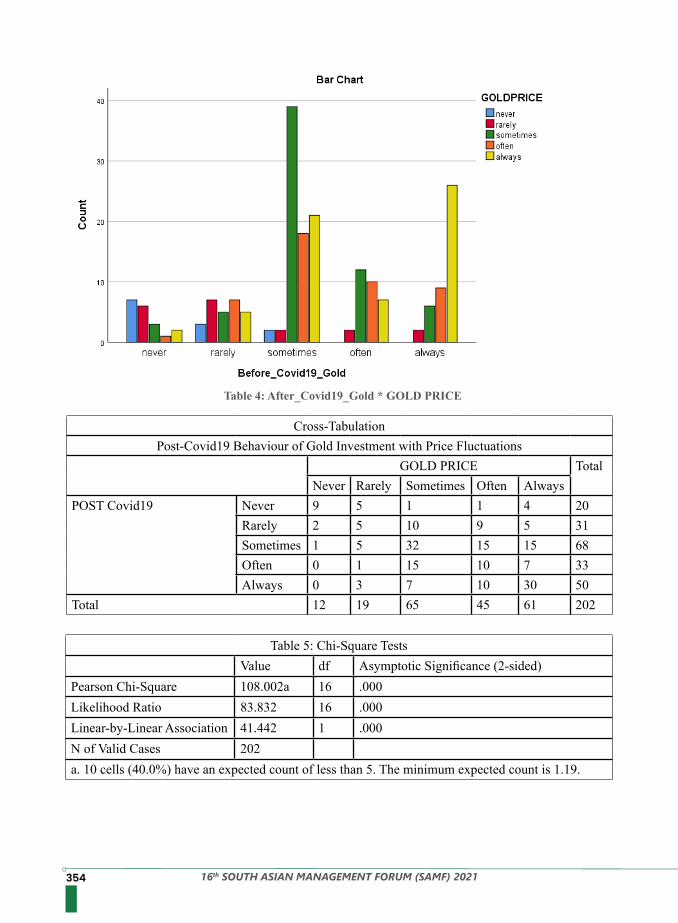
354 16th SOUTH ASIAN MANAGEMENT FORUM (SAMF) 2021
Table 4: After_Covid19_Gold * GOLD PRICE
Cross-TabulationPost-Covid19 Behaviour of Gold Investment with Price Fluctuations
GOLD PRICE TotalNever Rarely Sometimes Often Always
POST Covid19 Never 9 5 1 1 4 20Rarely 2 5 10 9 5 31Sometimes 1 5 32 15 15 68Often 0 1 15 10 7 33Always 0 3 7 10 30 50
Total 12 19 65 45 61 202
Table 5: Chi-Square TestsValue df Asymptotic Significance (2-sided)
Pearson Chi-Square 108.002a 16 .000Likelihood Ratio 83.832 16 .000Linear-by-Linear Association 41.442 1 .000N of Valid Cases 202a. 10 cells (40.0%) have an expected count of less than 5. The minimum expected count is 1.19.
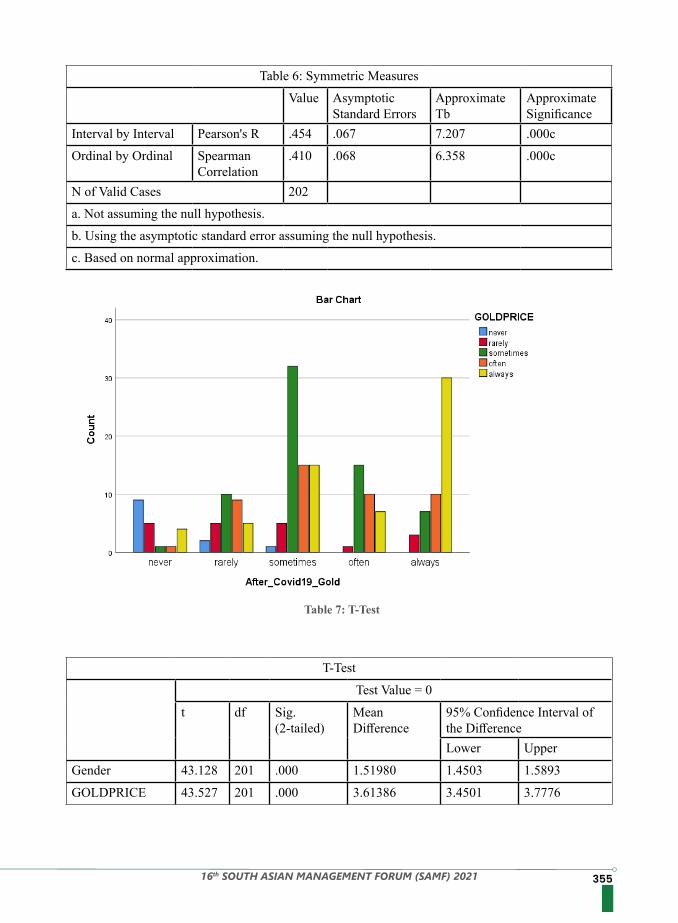
35516th SOUTH ASIAN MANAGEMENT FORUM (SAMF) 2021
Table 7: T-Test
Table 6: Symmetric Measures
Value Asymptotic Standard Errors
Approximate Tb
Approximate Significance
Interval by Interval Pearson's R .454 .067 7.207 .000c
Ordinal by Ordinal Spearman Correlation
.410 .068 6.358 .000c
N of Valid Cases 202
a. Not assuming the null hypothesis.
b. Using the asymptotic standard error assuming the null hypothesis.
c. Based on normal approximation.
T-Test
Test Value = 0
t df Sig. (2-tailed)
Mean Difference
95% Confidence Interval of the DifferenceLower Upper
Gender 43.128 201 .000 1.51980 1.4503 1.5893
GOLDPRICE 43.527 201 .000 3.61386 3.4501 3.7776
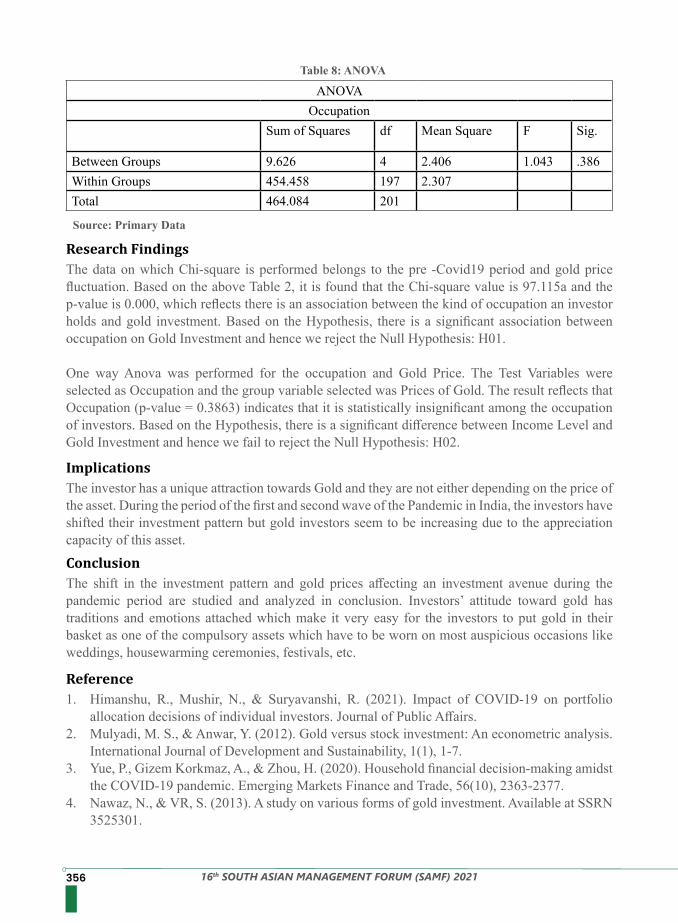
356 16th SOUTH ASIAN MANAGEMENT FORUM (SAMF) 2021
Table 8: ANOVA
Source: Primary Data
ANOVAOccupation
Sum of Squares df Mean Square F Sig.
Between Groups 9.626 4 2.406 1.043 .386Within Groups 454.458 197 2.307Total 464.084 201
The data on which Chi-square is performed belongs to the pre -Covid19 period and gold price fluctuation. Based on the above Table 2, it is found that the Chi-square value is 97.115a and the p-value is 0.000, which reflects there is an association between the kind of occupation an investor holds and gold investment. Based on the Hypothesis, there is a significant association between occupation on Gold Investment and hence we reject the Null Hypothesis: H01.
One way Anova was performed for the occupation and Gold Price. The Test Variables were selected as Occupation and the group variable selected was Prices of Gold. The result reflects that Occupation (p-value = 0.3863) indicates that it is statistically insignificant among the occupation of investors. Based on the Hypothesis, there is a significant difference between Income Level and Gold Investment and hence we fail to reject the Null Hypothesis: H02.
The investor has a unique attraction towards Gold and they are not either depending on the price of the asset. During the period of the first and second wave of the Pandemic in India, the investors have shifted their investment pattern but gold investors seem to be increasing due to the appreciation capacity of this asset.
The shift in the investment pattern and gold prices affecting an investment avenue during the pandemic period are studied and analyzed in conclusion. Investors’ attitude toward gold has traditions and emotions attached which make it very easy for the investors to put gold in their basket as one of the compulsory assets which have to be worn on most auspicious occasions like weddings, housewarming ceremonies, festivals, etc.
1. Himanshu, R., Mushir, N., & Suryavanshi, R. (2021). Impact of COVID‐19 on portfolio allocation decisions of individual investors. Journal of Public Affairs.
2. Mulyadi, M. S., & Anwar, Y. (2012). Gold versus stock investment: An econometric analysis. International Journal of Development and Sustainability, 1(1), 1-7.
3. Yue, P., Gizem Korkmaz, A., & Zhou, H. (2020). Household financial decision-making amidst the COVID-19 pandemic. Emerging Markets Finance and Trade, 56(10), 2363-2377.
4. Nawaz, N., & VR, S. (2013). A study on various forms of gold investment. Available at SSRN 3525301.
Research Findings
Implications
Conclusion
Reference
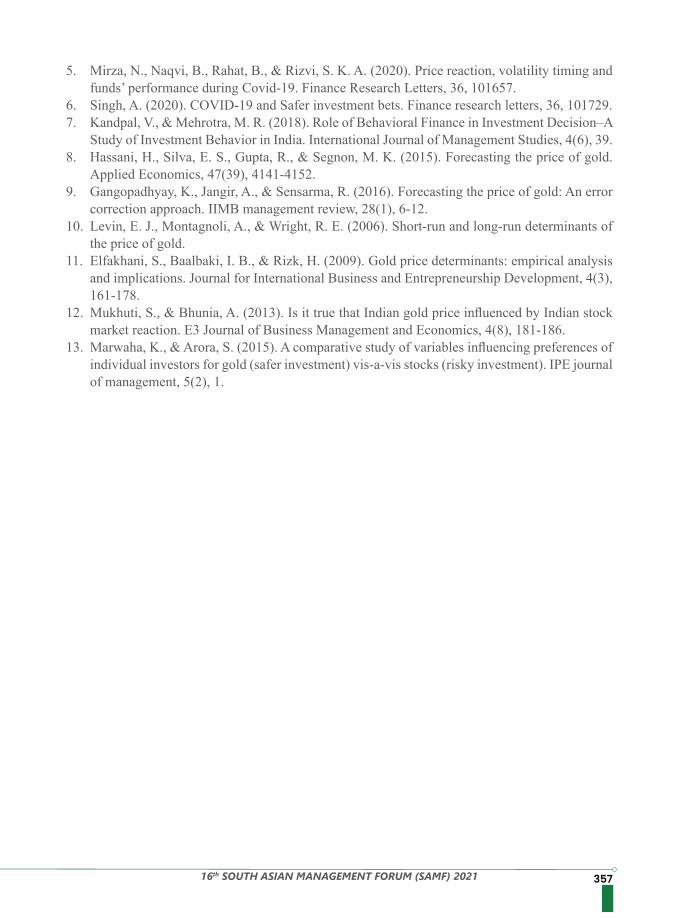
35716th SOUTH ASIAN MANAGEMENT FORUM (SAMF) 2021
5. Mirza, N., Naqvi, B., Rahat, B., & Rizvi, S. K. A. (2020). Price reaction, volatility timing and funds’ performance during Covid-19. Finance Research Letters, 36, 101657.
6. Singh, A. (2020). COVID-19 and Safer investment bets. Finance research letters, 36, 101729.7. Kandpal, V., & Mehrotra, M. R. (2018). Role of Behavioral Finance in Investment Decision–A
Study of Investment Behavior in India. International Journal of Management Studies, 4(6), 39.8. Hassani, H., Silva, E. S., Gupta, R., & Segnon, M. K. (2015). Forecasting the price of gold.
Applied Economics, 47(39), 4141-4152.9. Gangopadhyay, K., Jangir, A., & Sensarma, R. (2016). Forecasting the price of gold: An error
correction approach. IIMB management review, 28(1), 6-12.10. Levin, E. J., Montagnoli, A., & Wright, R. E. (2006). Short-run and long-run determinants of
the price of gold.11. Elfakhani, S., Baalbaki, I. B., & Rizk, H. (2009). Gold price determinants: empirical analysis
and implications. Journal for International Business and Entrepreneurship Development, 4(3), 161-178.
12. Mukhuti, S., & Bhunia, A. (2013). Is it true that Indian gold price influenced by Indian stock market reaction. E3 Journal of Business Management and Economics, 4(8), 181-186.
13. Marwaha, K., & Arora, S. (2015). A comparative study of variables influencing preferences of individual investors for gold (safer investment) vis-a-vis stocks (risky investment). IPE journal of management, 5(2), 1.
358 16th SOUTH ASIAN MANAGEMENT FORUM (SAMF) 2021
This paper aims to develop a theory that could describe the stock market to ordinary investors. To do so, this study followed a qualitative approach and personally interviewed 112 ordinary investors in Chattogram, Bangladesh. An inductive codebook is generated from the interview texts by following the line-by-line coding system. Those codes are categorized manually and a grounded theory is developed by transforming codes-to-theory. Apparently, it disclosed that the stock market is a potential secondary source of income for most of the ordinary investors. A significant number of ordinary investors are influenced by their friends to participate in this market and they are particularly interested in capital gain, not the earnings from dividends. This systematically developed grounded theory might prove beneficiary for the potential issuers of securities while mapping their target investors, pilot fishing, and organizing roadshows to attract the investors. It might be a strategic supplement too for the international investors who are/will be investing in developing countries like Bangladesh and considering the stock market as an efficient exit strategy. Finally, this paper will help the regulators and policymakers to better understand the investor’s perspective for ensuring good governance in the capital market.
What theoretical model could describe the stock market to ordinary investors? Answering this question is pretty challenging. There are a number of factors that determine the investment decision of households or ordinary investors in the stock market which included but are not limited to financial literacy, financial worthiness, risk appetite, return experience from the stock market, trust in the market, alternative investment opportunity and so on (Raut, 2020; Sivaramakrishnan et al., 2017). The literature on what stimulates them (ordinary investors) toward the stock market is abundant but what it (stock market) means to them is still obscure, especially in the context of Bangladesh. To shed light on this, I applied a grounded theory approach and tried to disclose the meaning of the stock market to them (ordinary investors) via an inductive coding system. The outcome of this research is that the systematically developed grounded theory might be a strategic policy feed and prove important for different stakeholders. Whether to craft/upgrade the regulatory framework for the development of the stock market or to protect the investors’ interest and ensure good governance in the capital market, the perspective of ordinary investors should be better understood. This understanding is also crucial for enhancing their (ordinary investors) participation in the stock market. Apparently, the enhanced participation of ordinary investors will not only boost the investments in the capital market but also contribute to the country’s development through capital formation. According to Central Depository Bangladesh Limited (CDBL), as of June 2021, there are about 2.53 million active Beneficiary Owner (BO) accounts under the Dhaka Stock Exchange (DSE) and Chittagong Stock Exchange (CSE). Due to regulatory compliance, an individual can’t hold
What does the stock market mean to ordinary investors?-A systematic development of grounded theory in the
context of Bangladesh
Abstract
Introduction
Mohammad Jalal Uddin*
*Independent Researcher & Analyst, Chittagong Research Group, Bangladesh
Keywords: Bangladesh; Grounded Theory; Ordinary Investors; Stock Market
1https://thefinancialexpress.com.bd/economy/bangladesh/bb-sets-90pc-interest-rate-on-allloans-1582562026
35916th SOUTH ASIAN MANAGEMENT FORUM (SAMF) 2021
Numerous studies have been conducted by modeling different parameters of the stock market in the context of Bangladesh and those are particularly concerned about the market efficiency (Zaman, 2019; Mobarek et al., 2008), firm/sector performance (Chowdhury et al., 2019; Imam and Malik, 2007), corporate governance (Uddin et al., 2021; Farooque et al., 2007), volatility/market movement (Bashed et al., 2007), market manipulation, regulatory weakness, market crash (Rahman et al., 2017; Jahur et al., 2014), investor behavior (Dhar et al., 2017) and so on. But till now it’s
Literature Review
more than two BO accounts, both in a single name and joint format. If, on average, everyone holds two BO accounts, then the number of active ordinary investors in Bangladesh will be about 1.26 million, which is the population of this research plot as well. However, the confidence level of ordinary investors toward the stock market shifts with the share price movement. That means when the market is bullish, investors get confidence and invest more by buying stocks. Inversely, when the market is bearish then investors lose confidence and want to sell the shares. But the wise investment strategy should be reversed. This ultimately leads to the autonomous shift in belief among ordinary investors. Highly overvalued securities in the market, the high-risk appetite of ordinary investors, narrow de-risking initiatives by regulators, poor underwriting quality, limited alternative investment opportunities in the financial economy (e.g. very low rate of term deposit in commercial banks), and so on made the country’s stock markets more expensive compared to the earnings of most of the listed companies. Moreover, the pandemic (COVID-19) pushed economic fallout and enhanced the indebt-ness of businesses/households compared to their earnings/household income. But the consistent regulatory reform and recent issuance of large-cap securities (e.g. ROBI AXIATA, WALTON HI-TECH INDUSTRIES) are leading the country’s stock exchanges, even in the global pandemic situation. Alternative, imposing a ceiling on the lending rate1 by the central bank of the country forced the commercial banks to lower the interest rate on different deposit products (e.g. Term deposit, Scheme, etc.) and stimulated the households to shift their investment toward the capital market with the intention of ‘Search for yield’.The journey of ordinary investors in the stock market of Bangladesh is not cozy at all. Before fading the memory of the 1996 stock market crash, Bangladesh experienced the replication of such a phenomenon in 2010-2011 (Naoaj et al., 2021). This cost even the lives of ordinary investors2. When things are going well in the market, there is a tendency to kind of extrapolate and become over-optimistic. This catches the attention of manipulators and reactivates their devil wings. Suspects (manipulators) included the listed companies, brokerage houses, and even the former head of the country’s premium bourse3 (e.g. DSE). In such dynamics, playing with numbers and applying rocket science in the stock market research is not enough to support the policymakers. Understanding the investor’s psychology through robust qualitative tools might be a cognitive need. Therefore developing a grounded theory on “what the stock market means to ordinary investors” through mining the opinions of ordinary investors might be a strategic fit.The structure of this paper is as follows. Section 2 presents the review of relevant literature. Section 3 explained how this study was conducted. Section 4 highlights the experiments and data analysis which includes descriptive statistics, demographic analysis, word cloud analysis, interview length analysis, and transformation of Codes-to-Theory with a refined codebook as a subsection. Finally, it is wrapped up by concluding remarks.
2 https://www.thedailystar.net/news-detail-2210103 https://www.thedailystar.net/business/tribunal-moves-1996-stock-scam-1225394 https://www.tbsnews.net/economy/stocks/122-lakh-bo-accounts-closed-june-270328
360 16th SOUTH ASIAN MANAGEMENT FORUM (SAMF) 2021
rare to investigate what this market means to general participants? Filling this research gap and discovering the true meaning of the capital market toward ordinary investors through a systematic approach might be demanding. To understand the motives of millions4 of ordinary investors toward the stock exchanges here in Bangladesh, this study investigated what the stock market means to ordinary investors. The essence of this study lies in the famous book ‘The Discovery of Grounded Theory: Strategies for Qualitative Research’ by the founders of the grounded theory, Barney Glaser and Anselm Strauss (1967). Draucker et al (2007) warned about the lack of guidance for researchers to apply the processes of grounded theory in their investigations. But I’m fortunate enough to learn about the step-by-step development of grounded theory from Ms. Susan Silbey, Professor of Sociology and Anthropology at Massachusetts Institute of Technology (MIT), through the platform of EdX.Thanks to the advancement of distance learning facilities as well. However, developing theory is a complex process (Bitar et al., 2007) that further intensifies in the case of the capital market where researchers are busy with developing the dynamic models and playing with large quantitative data sets. The key objective of this paper is to bring forth the homogenous perception of ordinary investors via grounded theory. This country-specific developed grounded theory might be a strategic supplement to the primary preamble of behavioral finance that the investors are subject to sentiment (De Long et al, 1990). If understanding the sentiment of investors is the key concern of behavioral finance then the meaning of this market to them (ordinary investors) is the latent driver of this sentiment. Grinblatt and Keloharju (2001) treated ordinary investors as less sophisticated investors in the stock market and identified their greatest contrarian behavior in the market. Ordinary investors are mostly domestic investors. Chiang et al. (2012) investigated the investment behavior from domestic, international, and institutional perspectives and found irrational behavior among the ordinary investors when markets disperse from equilibrium. Balloch et al (2014) revealed that the economic shocks and future expectations are the key behavioral motives of households’ decision to involve themselves with the stock market. Behavioral determinants of a household’s investment decision in the stock exchange may not influence the performance of individual listed companies but they do influence the price fluctuations of that company’s stock, which was found by many heuristic studies (Cao et al., 2021). Investment decisions of significant amounts of ordinary investors are influenced by psychological factors and are predominantly subject to different sorts of biases like overconfidence, conservatism, herding, regret, and availability bias (Bakar and Yi, 2016). But measuring this abstract terminology (e.g. Investors’ behavior) and expressing this in dollar figures is difficult. As a result, we can’t control the things which can’t be measured. Baker and Wurgler, (2007) argued that measuring investors’ behavior is very much feasible. Langevoort (1997) highlighted the contribution of securities law to dominate the investors’ behavior in the stock market and, in his view, it’s not the company but the top management who conceals the bad information from the investors. However, this is kind of true that this research theme falls under the domain of behavioral finance, and betting against behaviourally biased investors (Shleifer and Vishny, 1997) is risky and costly for rational investors. Keller and Pastusiak (2016) advocated that the stock recommendation published by broker houses hinders the neutral investment decision-making by ordinary investors. This also discourages them to follow their judgment and enlarges the so-called ‘Guru effect’ in the market dynamics. But from time to time publishing stock recommendations by broker houses is not common in Bangladesh. Considering the current context of the financial markets of Bangladesh, most of the stocks of listed companies here are income stocks, not growth stocks. The expectation of ordinary investors from those income stocks is capital gain, not the earnings from a dividend that results from the problem of Mental Accounting
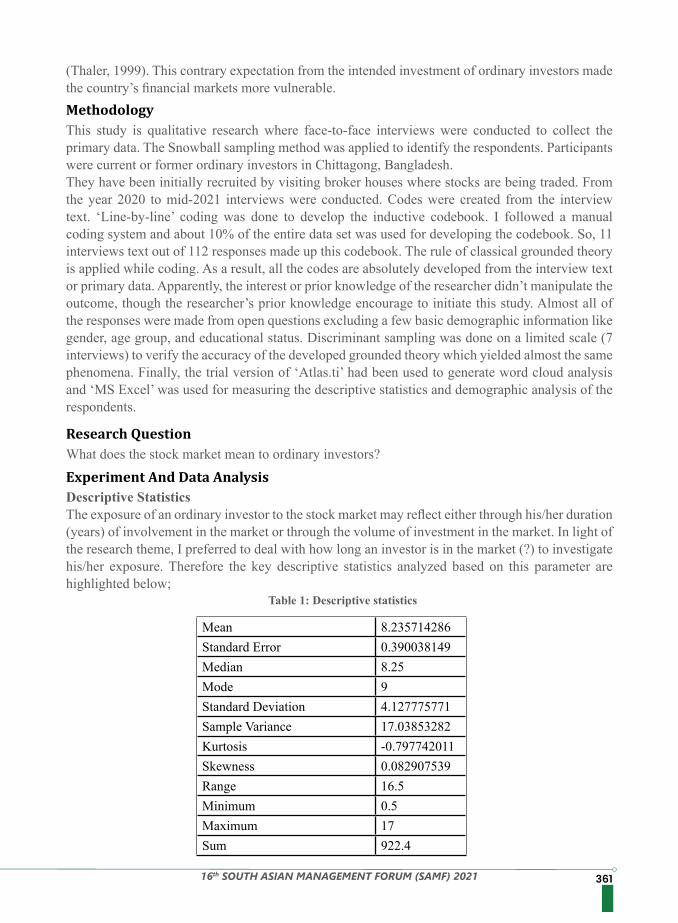
36116th SOUTH ASIAN MANAGEMENT FORUM (SAMF) 2021
(Thaler, 1999). This contrary expectation from the intended investment of ordinary investors made the country’s financial markets more vulnerable.
This study is qualitative research where face-to-face interviews were conducted to collect the primary data. The Snowball sampling method was applied to identify the respondents. Participants were current or former ordinary investors in Chittagong, Bangladesh. They have been initially recruited by visiting broker houses where stocks are being traded. From the year 2020 to mid-2021 interviews were conducted. Codes were created from the interview text. ‘Line-by-line’ coding was done to develop the inductive codebook. I followed a manual coding system and about 10% of the entire data set was used for developing the codebook. So, 11 interviews text out of 112 responses made up this codebook. The rule of classical grounded theory is applied while coding. As a result, all the codes are absolutely developed from the interview text or primary data. Apparently, the interest or prior knowledge of the researcher didn’t manipulate the outcome, though the researcher’s prior knowledge encourage to initiate this study. Almost all of the responses were made from open questions excluding a few basic demographic information like gender, age group, and educational status. Discriminant sampling was done on a limited scale (7 interviews) to verify the accuracy of the developed grounded theory which yielded almost the same phenomena. Finally, the trial version of ‘Atlas.ti’ had been used to generate word cloud analysis and ‘MS Excel’ was used for measuring the descriptive statistics and demographic analysis of the respondents.
What does the stock market mean to ordinary investors?
Descriptive StatisticsThe exposure of an ordinary investor to the stock market may reflect either through his/her duration (years) of involvement in the market or through the volume of investment in the market. In light of the research theme, I preferred to deal with how long an investor is in the market (?) to investigate his/her exposure. Therefore the key descriptive statistics analyzed based on this parameter are highlighted below;
Methodology
Research Question
Experiment And Data Analysis
Table 1: Descriptive statistics
Mean 8.235714286Standard Error 0.390038149Median 8.25Mode 9Standard Deviation 4.127775771Sample Variance 17.03853282Kurtosis -0.797742011Skewness 0.082907539Range 16.5Minimum 0.5Maximum 17Sum 922.4
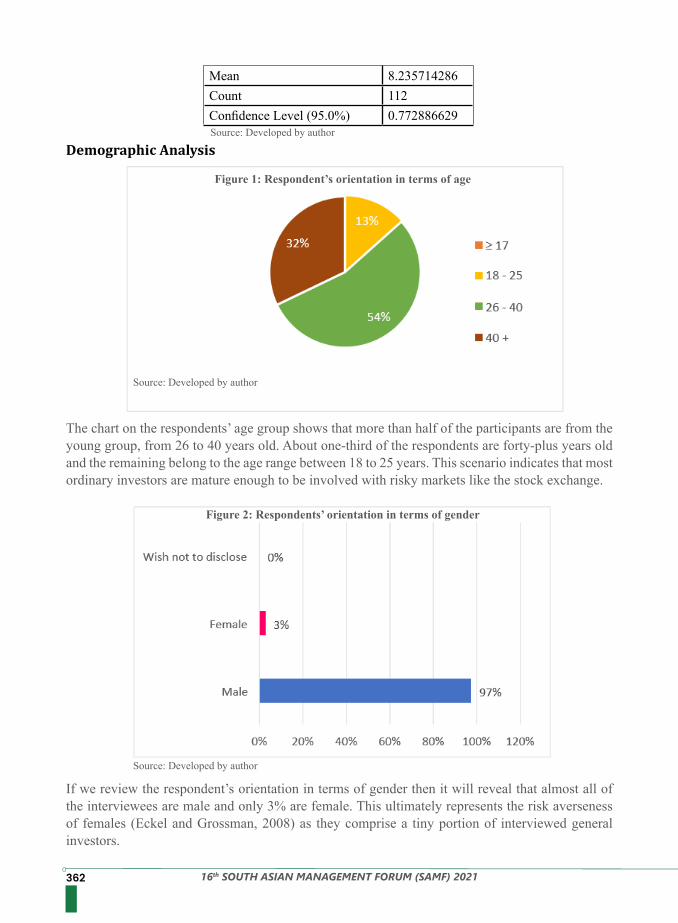
362 16th SOUTH ASIAN MANAGEMENT FORUM (SAMF) 2021
Mean 8.235714286Count 112Confidence Level (95.0%) 0.772886629Source: Developed by author
The chart on the respondents’ age group shows that more than half of the participants are from the young group, from 26 to 40 years old. About one-third of the respondents are forty-plus years old and the remaining belong to the age range between 18 to 25 years. This scenario indicates that most ordinary investors are mature enough to be involved with risky markets like the stock exchange.
If we review the respondent’s orientation in terms of gender then it will reveal that almost all of the interviewees are male and only 3% are female. This ultimately represents the risk averseness of females (Eckel and Grossman, 2008) as they comprise a tiny portion of interviewed general investors.
Demographic Analysis
Source: Developed by author
Source: Developed by author
Figure 1: Respondent’s orientation in terms of age
Figure 2: Respondents’ orientation in terms of gender
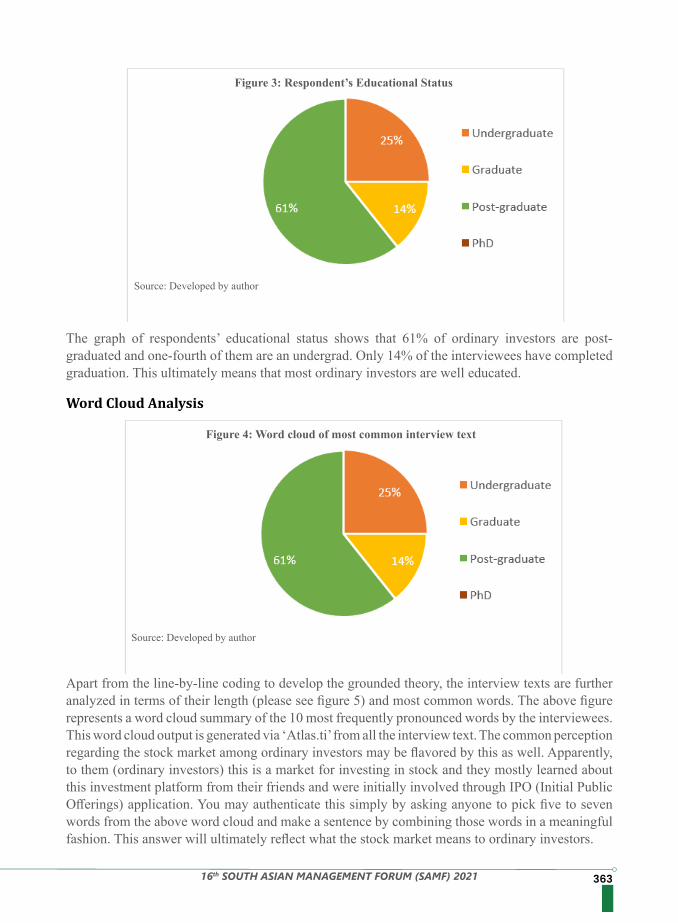
36316th SOUTH ASIAN MANAGEMENT FORUM (SAMF) 2021
The graph of respondents’ educational status shows that 61% of ordinary investors are post-graduated and one-fourth of them are an undergrad. Only 14% of the interviewees have completed graduation. This ultimately means that most ordinary investors are well educated.
Word Cloud Analysis
Source: Developed by author
Source: Developed by author
Figure 3: Respondent’s Educational Status
Figure 4: Word cloud of most common interview text
Apart from the line-by-line coding to develop the grounded theory, the interview texts are further analyzed in terms of their length (please see figure 5) and most common words. The above figure represents a word cloud summary of the 10 most frequently pronounced words by the interviewees. This word cloud output is generated via ‘Atlas.ti’ from all the interview text. The common perception regarding the stock market among ordinary investors may be flavored by this as well. Apparently, to them (ordinary investors) this is a market for investing in stock and they mostly learned about this investment platform from their friends and were initially involved through IPO (Initial Public Offerings) application. You may authenticate this simply by asking anyone to pick five to seven words from the above word cloud and make a sentence by combining those words in a meaningful fashion. This answer will ultimately reflect what the stock market means to ordinary investors.
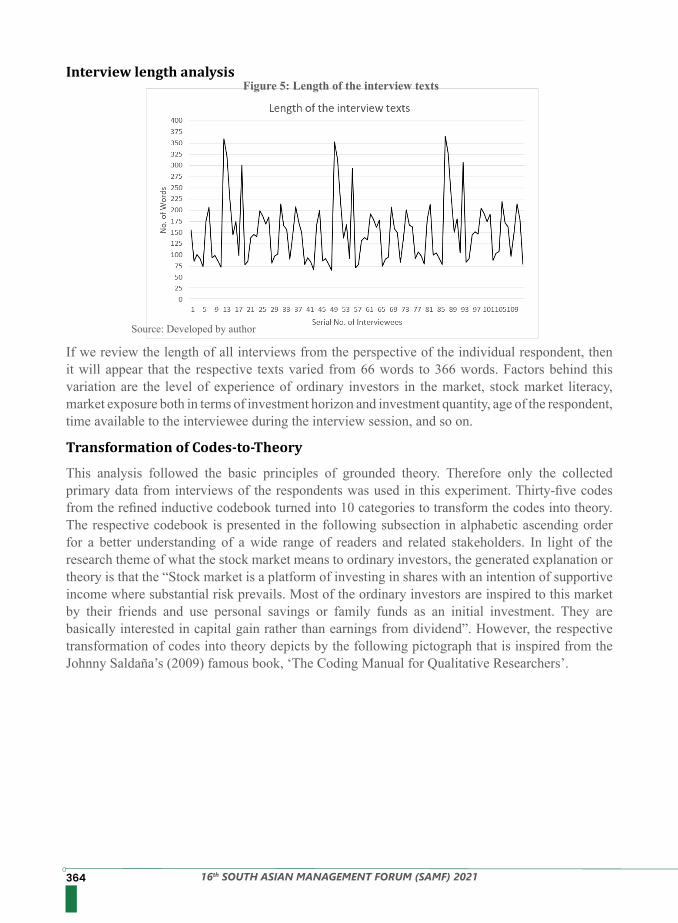
364 16th SOUTH ASIAN MANAGEMENT FORUM (SAMF) 2021
Interview length analysis
Transformation of Codes-to-Theory
Source: Developed by author
Figure 5: Length of the interview texts
If we review the length of all interviews from the perspective of the individual respondent, then it will appear that the respective texts varied from 66 words to 366 words. Factors behind this variation are the level of experience of ordinary investors in the market, stock market literacy, market exposure both in terms of investment horizon and investment quantity, age of the respondent, time available to the interviewee during the interview session, and so on.
This analysis followed the basic principles of grounded theory. Therefore only the collected primary data from interviews of the respondents was used in this experiment. Thirty-five codes from the refined inductive codebook turned into 10 categories to transform the codes into theory. The respective codebook is presented in the following subsection in alphabetic ascending order for a better understanding of a wide range of readers and related stakeholders. In light of the research theme of what the stock market means to ordinary investors, the generated explanation or theory is that the “Stock market is a platform of investing in shares with an intention of supportive income where substantial risk prevails. Most of the ordinary investors are inspired to this market by their friends and use personal savings or family funds as an initial investment. They are basically interested in capital gain rather than earnings from dividend”. However, the respective transformation of codes into theory depicts by the following pictograph that is inspired from the Johnny Saldaña’s (2009) famous book, ‘The Coding Manual for Qualitative Researchers’.
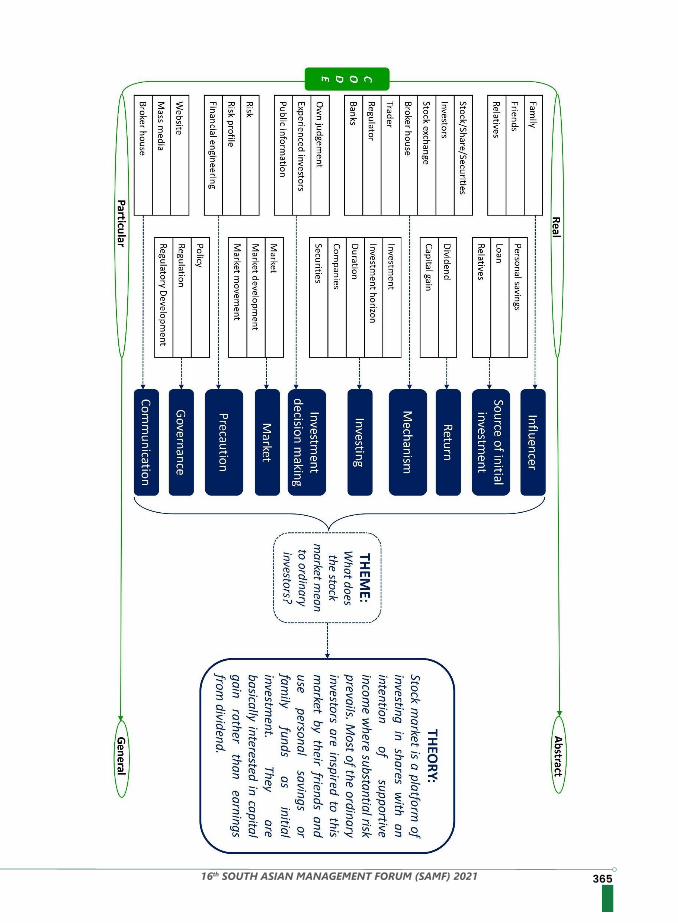
36516th SOUTH ASIAN MANAGEMENT FORUM (SAMF) 2021
366 16th SOUTH ASIAN MANAGEMENT FORUM (SAMF) 2021
Refined Codebook
1. BANGLADESH: The plot of this study.2. “Considering the context of Bangladesh, even the very small investors can invest along with
large investors, which is great” (2020:019)3. BANK: The intermediary that facilitates fund channeling among issuers (Company),
stockbrokers, investors, and other stakeholders.4. “Now cash dividends are directed posted to my bank account that linked with my BO account”
(2020:005)5. BORROWED MONEY/LOAN: Investment made other than individual wealth that involves
higher costing.6. “Investment with borrowed money is huge tension and always a fear of downside risk”
(2000:007)7. “My initial investment was a loan amount” (2021:105)8. BROKER HOUSE: The intermediary that facilitates investors to buy/sell a stock, submit IPO,
and provide different related services including margin.9. “During the year 2009-2010, I used to visit my Broker House at least once a week but now this
is not needed” (2020:031)10. CAPITAL GAIN: The return or benefit made by speculating the price fluctuation of stocks.11. “Ordinary investors are mostly short-term oriented and look for capital gain only” (2021:086)12. COMPANIES: The issuers of the securities in which investments are being made.13. “Fundamentally strong companies are coming to market” (2020:013)14. DIVIDEND: The return/benefit from the intended investment.15. “I generally prefer stock dividend than the cash dividend” (2020:008)16. DURATION: Investment horizon or the tenure of investment on a particular security.17. “Most of the general investors opt for short-term investment” (2020:027)18. EXPECTATION: Something to happen according to your desire. For example, the share price
of a certain company to reach a certain threshold within an assumed period.19. “I thought the share price of ROBI will hit at least BDT 100 but it is currently trading less than
half of my expectation” (2021:103)20. “You can’t believe the market and it often moves in inverse direction” (2020:016)21. EXPERIENCED INVESTOR: The investor who involve with the share market for a longer
period.22. “I do follow an experienced investor and use my judgment too for investment decision making”
(2020:043)23. FAMILY: Closely related kit and kin of an ordinary investor like parents, siblings, spouse, etc.24. “My initial investment was from my family member” (2020:061)25. 26. FINANCIAL ENGINEERING: The art of crafting financial techniques for optimizing the risk
and return on investment.27. “Introducing hedging product like ‘Protective Put’ through appropriate financial engineering”
(2021:79)28. FRIEND: The influence of an ordinary investor with a non-blooded relationship who played an
acute role to introduce or stimulate him/her (investor) toward the stock market.29. “I learned about the share market from my friend” (2020:002)30. FUTURE PLAN: The intention of an ordinary investor regarding his/her upcoming endeavor
36716th SOUTH ASIAN MANAGEMENT FORUM (SAMF) 2021
in the stock market. For example, wish to quit from market within next 5 years.31. “I haven’t participated in any training program offering by BICM for investors but hope to take
part in future” (2020:037)32. HOLD: The state of retaining the current position like keeping the securities for future action
rather than buying or selling for the time being.33. “This is really frustrating when you hold a share for a longer period but it is not performing.
When I sell it then this is performing rapidly” (2020:053)34. INACTIVE INVESTOR: Investor who has no current exposure to the market.35. “I used to be an active investor but currently I have no investment” (2021:089)36. INITIATIVE: The course of action for certain development or regulation.37. “Training for investors under the BICM (Bangladesh Institute of Capital Market) is a good
initiative and I have a plan to take part in this training program in the near future ” (2021:074)38. INVEST/INVESTMENT: Deployment of an asset for anticipated return. This asset might be
from the own source (equity) or the others (debt).39. “The ultimate motive of any investor here in the stock market is to make money and I generally
look for profiting from price development on my investment, not the dividend earnings” (2020:014)
40. INVESTMENT HORIZON: The duration or timeframe of a particular investment.41. “The propensity of quick gain or gaining from short term investment among the large portion
of ordinary investors is one of the key drivers of high market vulnerability ” (2020:026)42. INVESTOR: The person who deploys his/her money in the stock market.43. “Rich investor may realize a profit from a fractional price change” (2020:032)44. IPO: Initial Public Offering (IPO) is the process of listing companies on the stock exchanges
for publicly trading their securities.45. “The policy reform on IPO distribution with the provision of maintaining minimum investment
seems beneficiary for making the market dynamic and vibrant” (2021:080)46. MANIPULATION: The unethical and illegal act of mending a systematic order for the own
interest by the decision-maker or the personnel from the regulatory body.47. “Earlier, the market was in very vulnerable condition with high manipulation effect. Still, the
existence of a widely accused person on the top of the policymaking body spreads fear among the ordinary investors” (2020:025)
48. MARKET: A robust platform that facilitates the transfer of ownership of securities by counting the current development (positive or negative) of listed securities.
49. “Market is always right and it highlights the prospects of different securities through their current price” (2021:071)
50. MARKET DEVELOPMENT: Upgrading positively.51. “I see positive market development from the regulatory perspective” (2021:004)52. “Currently I have no investment, but if the market develops then I might think about reinvesting”
(2021:099)53. MARKET MOVEMENT: Changing the share price in either direction, increase or decrease.54. “Abnormal market movement like flash crash creates panic among the ordinary investors”
(2020:009)55. MONEY: The most liquid form of wealth that is invested in for return.56. “General investors invest money in the stock market mostly for extra earnings, which is not the
primary source of their earnings” (2020:013)57. MASS MEDIA: The mean of disseminating information to a wider range of audiences e.g. TV,
368 16th SOUTH ASIAN MANAGEMENT FORUM (SAMF) 2021
Newspaper, etc.58. “Newspaper and broker house were the primary source of information for general investor
regarding upcoming IPO. Now everything on the mobile phone.” (2020:052)59. OWN JUDGEMENT: Using self-perception and view to make a certain decision.60. “For making an investment decision, I do follow an experienced investor but use my own
judgment too” (2020:023)61. PERSONAL SAVINGS: The fund that absolutely belongs to a person, not from any sort of
debt.62. “Personal savings was the source of my initial investment in the share market” (2020:046)63. POLICY: Course of action formulate or amend to ensure good governance.64. “Everything looks good in the market, especially the recent IPO policy” (2021:083)65. PUBLIC INFORMATION: The information that becomes widely available to the general
public at a time.66. “Public information no more influence the share price due to manipulation effect” (2020:025)67. REGULATION/REGULATOR: Act and law in force to ensure the proper functioning and
ensure good governance in the market.68. “I see positive market development from the regulatory perspective” (2021:068)69. REGULATORY DEVELOPMENT: Upgradation of existing regulations by considering the
context.70. “Consistent regulatory reform is something good happening in the market ”71. (2021:078)72. RELATIVES: Closely related kit and kin of an ordinary investor other than a family member
like cousin.73. “My relative used to get involved with share market” (2020:031)74. RISK: The probability of losing the market value of a share.75. “High-value shares possess higher downside risk” (2021:091)76. RISK PROFILE: The sketch of various risk factors of a particular stock.77. “Ordinary investors don’t understand the risk profile of their investment in most cases”
(2021:100)78. STOCK/SHARE/ SECURITIES: The tradeable portion of ownership of listed companies.79. “To invest in any sector, a share is the convenient and powerful mean” (2020:006)80. STOCK EXCHANGE: The authorized body to facilitate the stock market.81. “I think all broker house should have membership of both Dhaka and Chittagong Stock
Exchange” (2021:064)82. TRADER: Authorized person to place the trading order (buy/sale) that asked by the investor83. “I generally purchase stock by calling the trader of my broker house” (2020:013)84. WEBSITE: The online platform of the stock exchange from where different stakeholders may
get the available information on a real-time basis like the current market price, subject to market opening.
85. “I frequently visit the website of Chittagong Stock Exchange for the live share price and other information like upcoming IPO” (2021:88)
Summary And ConclusionThis paper provides a clear idea of what the stock market means to ordinary investors from the perspective of a developing country. Through different types of qualitative analysis, it identified
5 https://roadshow.sec.gov.bd/
36916th SOUTH ASIAN MANAGEMENT FORUM (SAMF) 2021
References1. Baker M. and Wurgler J. (2007). Investor Sentiment in the Stock Market. Journal of Economic
Perspectives, Volume 21, Number 22. Bakar S. and Yi A. N. C. (2016). The Impact of Psychological Factors on Investors’ Decision
Making in Malaysian Stock Market: A Case of Klang Valley and Pahang. Procedia Economics and Finance, 35 pp. 319 – 328
3. Balloch A., Nicolae A. and Philip D. (2014). Stock Market Literacy, Trust, and Participation.4. Review of Finance, pp. 1–39 doi:10.1093/rof/rfu0405. Basher S. A., Hassan M. K. and Islam M. I. (2007). Time-varying volatility and equity returns
in Bangladesh stock market. Applied Financial Economics, Vol. 176. Cao G. and Shan D. (2013). The Effect of Exit Strategy on Optimal Portfolio Selection with
Birandom Returns. Journal of Applied Mathematics, http://dx.doi.org/10.1155/2013/2365797. Cao M. M., Nguyen N. T. and Tran T. T. (2021). Behavioral Factors on Individual Investors’
Decision Making and Investment Performance: A Survey from the Vietnam Stock Market. Journal of Asian Finance, Economics and Business, Vol 8 No 3
8. Chiang S. J., Tsai L. J., Shu P. G. and Chen S. L. (2012). The trading behavior of foreign, domestic institutional and domestic individual investors: Evidence from the Taiwan stock market. Pacific-Basin Finance Journal, 20 pp. 745–754
9. Chowdhury T., Dovash R. H. and Islam S. (2019). Determinants of Stock Price of Financial
that the capital market is not the primary source of earning livelihood for ordinary investors. The development of inductive codes exclusively from interview texts and subsequent transformation of codes to theory helped to reveal this phenomenon. The growing number of international investors are eagerly interested to invest in Bangladesh as a lucrative investment destination. Policymakers are also consistently trying to attract international investors, for example, a recent roadshow5 in the USA titled, ‘The Rise of Bengal Tiger: Potential of Trade and Investment in Bangladesh’. As a smooth exit strategy, the stock market is a popular and efficient means (Cao and Shan, 2013) for international investors. Therefore, knowing the perception of mass participants of this mean is complementary. In this regard, the outcome of this study might be a strategic fit.Developing a theoretical model to describe the stock market for millions of ordinary investors might be interesting. This requires passionate endeavor and a prudent analytical mind-set. Over two years, I tried to gain the required skill in appropriate research techniques and applied those techniques to execute this study in a meaningful manner. A large portion of the designated period was consumed to conduct the interviews and compile the interview texts. Apparently, this study found that (a) the stock market is a potential secondary source of income for most of the ordinary investors, (b) the majority of the ordinary investors are influenced by their friends to participate in this market, (c) ordinary investors particularly interested in capital gain, not the earnings from dividend and (d) IPO was the handiest mean to lure significant amount of ordinary investors toward the stock market in Bangladesh, which is no more pleasant due to change in allotment policy. Those findings might prove very significant both from theoretical and practical perspectives. The stock market is not the mainstream of earning livelihood for ordinary investors, which needs to be considered while crafting/defining respective policies and regulations. Potential issuers of securities in the stock market might be beneficiaries from this systematically developed grounded theory while mapping their target investors, pilot fishing, and organizing roadshows to attract the investment. However, the outcome of this endeavor might get limited on the ground of the small sample size and concentrated location for data collection.
370 16th SOUTH ASIAN MANAGEMENT FORUM (SAMF) 2021
Sector - A Study on Banks and Non-Bank Financial Institutions in Bangladesh. International Journal of Business and Technopreneurship, Volume 9, No. 1
10. Claire B. Draucker, Donna S. Martsolf, Ross R. and Thomas B. Rusk (2007). Theoretical11. Sampling and Category Development in Grounded Theory. Qualitative Health Research,
Volume 17 Number 8, pp. 1137-114812. De Long, J., Shleifer, A., Summers, L., & Waldmann, R. (1990). Noise Trader Risk in Financial
Markets. Journal of Political Economy, 98(4), 703-738. Retrieved August 3, 2021, from http://www.jstor.org/stable/2937765
13. Dhar S., Salema SM. K. and Saha A. (2017). Factors affecting individual investor behavior: empirical evidence from mutual fund investors in Dhaka city. Management Development, Vol 31 No. 3 & 4
14. Eckel C. C., and Grossman P. J. (2008). Chapter 113 Men, Women and Risk Aversion: Experimental Evidence. Handbook of Experimental Economics Results, 1061– 1073. doi:10.1016/s1574-0722(07)00113-8
15. Farooque O. A., Zijl T. V., Dunstan K. and Karim A. W. (2007). Corporate Governance in Bangladesh: Link between Ownership and Financial Performance. Corporate Governance: An International Review, 15(6), 1453–1468. doi:10.1111/j.1467- 8683.2007.00657.x
16. George, D. & Mallery, M. (2010). SPSS for Windows Step by Step: A Simple Guide and Reference, 17.0 update (10a ed.) Boston: Pearson.
17. George W. Bitar , Roy A. Bean & J. Maria Bermúdez (2007) Influences and Processes in Theoretical Orientation Development: A Grounded Theory Pilot Study. The American Journal of Family Therapy, 35:2, 109-121, DOI: 10.1080/01926180600553407
18. Glaser, B., & Strauss, A. (1967). The discovery of grounded theory: Strategies for Qualitative Research. Chicago: Aldine.
19. Grinblatt M. and Keloharju M. (2001). What Makes Investors Trade? The Journal of Finance, VOL. LVI, No. 2
20. Imam, M. O. and Malik M. (2007), Firm Performance and Corporate Governance through Ownership Structure: Evidence from Bangladesh Stock Market. International Review of Business Research Papers, Vol. 3, No.4, pp. 88-110
21. Jahur M. S., Quadir N. and Khan M. A. (2014). Determinants of stock market performance in Bangladesh. Indonesian Management and Accounting Research, Vol. 13, No. 1
22. Keller J. and Pastusiak R. (2016). The psychology of investing: stock market recommendations and their impact on investors’ decisions (the example of the Polish stock market). Acta Oeconomica, Vol. 66 (3), pp. 419–437
23. Langevoort D. C. (1997). Organized Illusions: A Behavioral Theory of Why Corporations Mislead Stock Market Investors (And Cause Other Social Harms). University of Pennsylvania Law Review, Vol. 146, No. 1, pp. 101-172
24. Lee H., Kweon E., Kim M and Chai S. (2017). Does Implementation of Big Data Analytics Improve Firms’ Market Value? Investors’ Reaction in Stock Market. Sustainability, 9, 978; doi:10.3390/su9060978
25. Mobarek, A., Mollah, A. S., & Bhuyan, R. (2008). Market Efficiency in Emerging Stock26. Market. Journal of Emerging Market Finance, 7(1), 17– 41.
doi:10.1177/09726527070070010227. Naoaj, M. S., Khan A. and Nazmul A. (2021). The Emerging Asia Pacific Capital Markets:
Bangladesh. CFA Institute Research Foundation Briefs, doi.org/10.2139/ssrn.380743828. Osowska E. and Wójcik P. (2020). The impact of the Content of Federal Open Market
37116th SOUTH ASIAN MANAGEMENT FORUM (SAMF) 2021
Committee post-meeting statements on financial markets – text-mining approach. Working papers 33/2020 (339), University of Warsaw.
29. Rahman M. T., Hossain S. Z., and Habibullah M. (2017). Stock Market Crash in Bangladesh: The Moneymaking Psychology of Domestic Investors. American Journal of Theoretical and Applied Business, no. 3: 43–53,
30. Raut, R. K. (2020). Past behaviour, financial literacy and investment decision-making process of individual investors. International Journal of Emerging Markets, 15(6), 1243– 1263. doi:10.1108/ijoem-07-2018-0379
31. Saldaña J. (2009). The Coding Manual for Qualitative Researchers. SAGE Publications Ltd.32. Sivaramakrishnan, S., Srivastava, M., & Rastogi, A. (2017). Attitudinal factors, financial
literacy, and stock market participation. International Journal of Bank Marketing, 35(5), 818–841. doi:10.1108/ijbm-01-2016-0012
33. Thaler, R. H. (1999). Mental accounting matters. Journal of Behavioral Decision Making, 12(3),183–206. doi:10.1002/(sici)1099-0771(199909)12:3<183::aid-
34. bdm318>3.0.co;2-f35. Uddin, M. N., Hosen, M., Chowdhury, M. M., Tabassum, T., & Mazumder, M. A. (2021). Does
Corporate Governance Influence Firm Value in Bangladesh? A Panel Data Analysis. E&M Economics and Management, 24(2), 84–100. https://doi.org/10.15240/ tul/001/2021-2-006
36. Zaman S. (2019). Weak form market efficiency test of Bangladesh Stock Exchange: an empirical evidence from Dhaka Stock Exchange and Chittagong Stock Exchange. Journal of Economics, Business, and Accountancy Ventura, Vol. 21, No. 3
372 16th SOUTH ASIAN MANAGEMENT FORUM (SAMF) 2021
Fintech has been playing a significant role in reshaping the financial and banking landscapes at present era. However, in recent time these reforms are hindered by Covid-19 pandemic throughout the world that fascinates the researchersto a great extent to research on. The purpose of this research article is to analyze the published articles during the pandemic (2020-2021) on the impact of Covid-19 on fintech. Two keywords were used to conduct an initial search process. Primarily, 144 articles have found and then 74 articles were eliminated through systematic review process. Dimension database is used to search all open access articles to carry out a bibliometic analysis with biblioshyni of R. The findings of this research may significantly contribute in the fintech literature.
In today’s world, the financial service industry significantly facilitates financial-economic activities (Nawayseh, 2020; Tushar, Rahman, Thakur, & Hossain, 2022). Technological advancement in financial industry provides more efficient and innovative services from the last decades to accelerate the process. Financial Technology (Fin-tech) witnessed the revolutionary paradigm shift in the industry by offering less expensive, more convenient, efficient, and secure services to the consumer and service provider. For long-term success and widespread acceptability, the FinTech evolution is still tricky, and more time and effort are required, especially for consumer financial services (Bharadwaj, Jack & Suri, 2019). Balancing possible risks and advantages in FinTech advances is especially pressing in developing countries. People with few socioeconomic factors are less likely to seek out financial information and are less knowledgeable about financial items (Mohsinet al., 2021; Narteh, Mahmoud, &Amoh, 2017; Tushar, 2017).At this time, the world is dealing with the COVID-19 pandemic, which will have significant worldwide, medium-term, and long-term effects on health services and the economy (Fu& Mishra, 2020). However, due to the pandemic’s characteristics and rapid spread, societies have had to implement social distancing or stricter lockdown regulations imposed by the government. This has been true both in locations where COVID-19 has spread and in areas where it hasn’t. Despite the significant financial and human costs associated with its spread, COVID-19 has produced some benefits and may have some positive effects (Fu& Mishra, 2020). Notably, many nations have already begun implementing measures to sustain their economies throughout the crisis in response to these difficulties, including encouraging individuals to use FinTech applications to complete their financial transactions both during and after the lockdown (Khan, Hassan, Rabbani, &Atif, 2021; Nawayseh, 2020).This study’s objective is to conduct a bibilometric analysis of the articles published during the pandemic (2020-2021) on the impact of Covid-19 on fintech. The remainder of this study is organized as follows. Section 2 presents the methodology of selecting articles and analyzing processes. Section 3 describes the findings of the bibliometric analysis and discussion. Section 4 presents the conclusion and limitations and suggests future directions.
The Impact of Covid-19 on Fintech: A Bibliometric Analysis
Abstract
Introduction
Shaikh Sabbir Ahmed Waliullah, Assistant Professor1
Hasanuzzaman Tushar, Assistant Professor1
1College of Business Administration, International University of Business Agriculture and Technology, Bangladesh
Keywords: Fintech, Covid-19, Bibliometric analysis
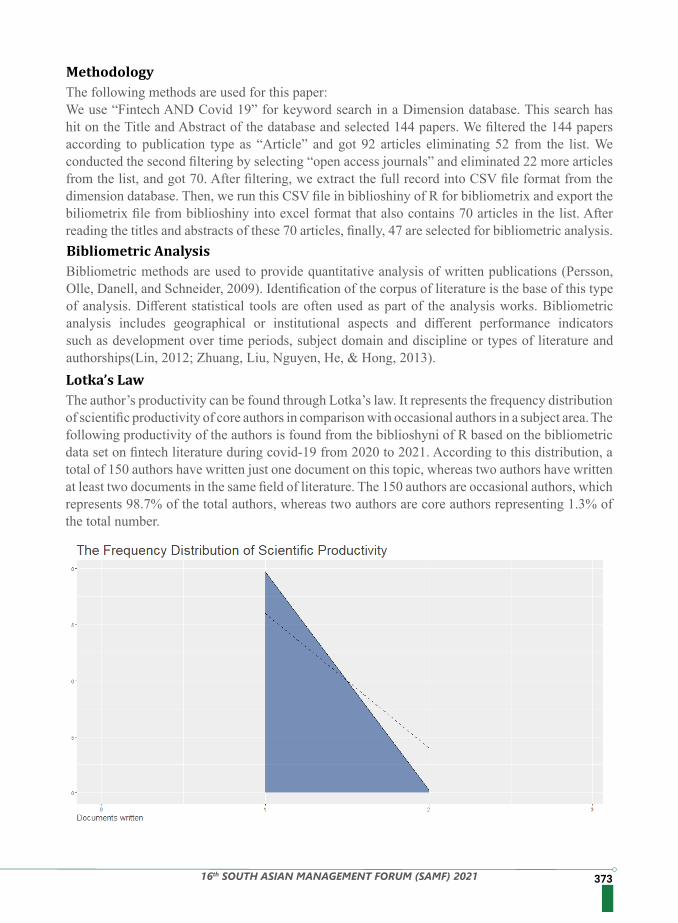
37316th SOUTH ASIAN MANAGEMENT FORUM (SAMF) 2021
The following methods are used for this paper:We use “Fintech AND Covid 19” for keyword search in a Dimension database. This search has hit on the Title and Abstract of the database and selected 144 papers. We filtered the 144 papers according to publication type as “Article” and got 92 articles eliminating 52 from the list. We conducted the second filtering by selecting “open access journals” and eliminated 22 more articles from the list, and got 70. After filtering, we extract the full record into CSV file format from the dimension database. Then, we run this CSV file in biblioshiny of R for bibliometrix and export the biliometrix file from biblioshiny into excel format that also contains 70 articles in the list. After reading the titles and abstracts of these 70 articles, finally, 47 are selected for bibliometric analysis.
Bibliometric methods are used to provide quantitative analysis of written publications (Persson, Olle, Danell, and Schneider, 2009). Identification of the corpus of literature is the base of this type of analysis. Different statistical tools are often used as part of the analysis works. Bibliometric analysis includes geographical or institutional aspects and different performance indicators such as development over time periods, subject domain and discipline or types of literature and authorships(Lin, 2012; Zhuang, Liu, Nguyen, He, & Hong, 2013).
The author’s productivity can be found through Lotka’s law. It represents the frequency distribution of scientific productivity of core authors in comparison with occasional authors in a subject area. The following productivity of the authors is found from the biblioshyni of R based on the bibliometric data set on fintech literature during covid-19 from 2020 to 2021. According to this distribution, a total of 150 authors have written just one document on this topic, whereas two authors have written at least two documents in the same field of literature. The 150 authors are occasional authors, which represents 98.7% of the total authors, whereas two authors are core authors representing 1.3% of the total number.
Methodology
Bibliometric Analysis
Lotka’s Law
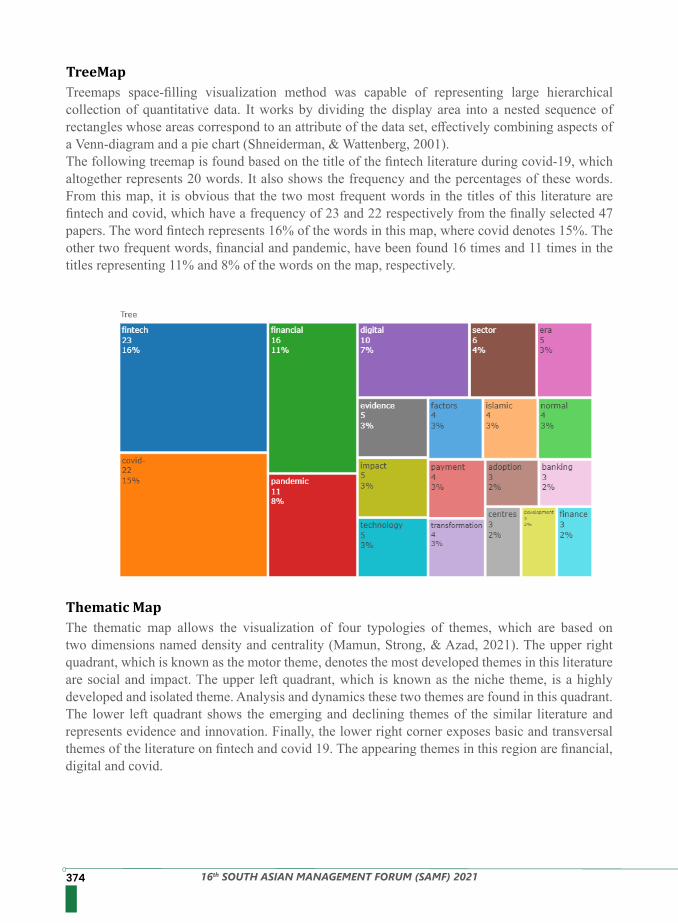
374 16th SOUTH ASIAN MANAGEMENT FORUM (SAMF) 2021
Treemaps space-filling visualization method was capable of representing large hierarchical collection of quantitative data. It works by dividing the display area into a nested sequence of rectangles whose areas correspond to an attribute of the data set, effectively combining aspects of a Venn-diagram and a pie chart (Shneiderman, & Wattenberg, 2001).The following treemap is found based on the title of the fintech literature during covid-19, which altogether represents 20 words. It also shows the frequency and the percentages of these words. From this map, it is obvious that the two most frequent words in the titles of this literature are fintech and covid, which have a frequency of 23 and 22 respectively from the finally selected 47 papers. The word fintech represents 16% of the words in this map, where covid denotes 15%. The other two frequent words, financial and pandemic, have been found 16 times and 11 times in the titles representing 11% and 8% of the words on the map, respectively.
TreeMap
The thematic map allows the visualization of four typologies of themes, which are based on two dimensions named density and centrality (Mamun, Strong, & Azad, 2021). The upper right quadrant, which is known as the motor theme, denotes the most developed themes in this literature are social and impact. The upper left quadrant, which is known as the niche theme, is a highly developed and isolated theme. Analysis and dynamics these two themes are found in this quadrant. The lower left quadrant shows the emerging and declining themes of the similar literature and represents evidence and innovation. Finally, the lower right corner exposes basic and transversal themes of the literature on fintech and covid 19. The appearing themes in this region are financial, digital and covid.
Thematic Map
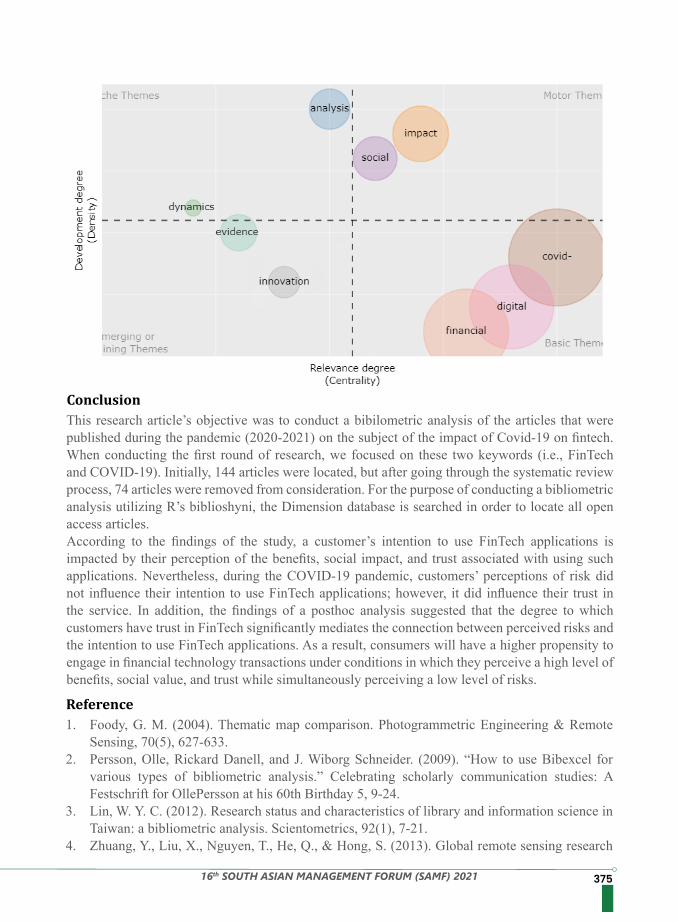
37516th SOUTH ASIAN MANAGEMENT FORUM (SAMF) 2021
This research article’s objective was to conduct a bibilometric analysis of the articles that were published during the pandemic (2020-2021) on the subject of the impact of Covid-19 on fintech. When conducting the first round of research, we focused on these two keywords (i.e., FinTech and COVID-19). Initially, 144 articles were located, but after going through the systematic review process, 74 articles were removed from consideration. For the purpose of conducting a bibliometric analysis utilizing R’s biblioshyni, the Dimension database is searched in order to locate all open access articles.According to the findings of the study, a customer’s intention to use FinTech applications is impacted by their perception of the benefits, social impact, and trust associated with using such applications. Nevertheless, during the COVID-19 pandemic, customers’ perceptions of risk did not influence their intention to use FinTech applications; however, it did influence their trust in the service. In addition, the findings of a posthoc analysis suggested that the degree to which customers have trust in FinTech significantly mediates the connection between perceived risks and the intention to use FinTech applications. As a result, consumers will have a higher propensity to engage in financial technology transactions under conditions in which they perceive a high level of benefits, social value, and trust while simultaneously perceiving a low level of risks.
1. Foody, G. M. (2004). Thematic map comparison. Photogrammetric Engineering & Remote Sensing, 70(5), 627-633.
2. Persson, Olle, Rickard Danell, and J. Wiborg Schneider. (2009). “How to use Bibexcel for various types of bibliometric analysis.” Celebrating scholarly communication studies: A Festschrift for OllePersson at his 60th Birthday 5, 9-24.
3. Lin, W. Y. C. (2012). Research status and characteristics of library and information science in Taiwan: a bibliometric analysis. Scientometrics, 92(1), 7-21.
4. Zhuang, Y., Liu, X., Nguyen, T., He, Q., & Hong, S. (2013). Global remote sensing research
Conclusion
Reference
376 16th SOUTH ASIAN MANAGEMENT FORUM (SAMF) 2021
trends during 1991–2010: a bibliometric analysis. Scientometrics, 96(1), 203-219. 5. Mamun, M. A. A., Strong, C. A., & Azad, M. A. K. (2021). Islamic marketing: A literature
review and research agenda. International Journal of Consumer Studies, 45(5), 964-984. 6. Al Nawayseh, M. K. (2020). Fintech in COVID-19 and beyond: what factors are affecting
customers’ choice of fintech applications?. Journal of Open Innovation: Technology, Market, and Complexity, 6(4), 153.
7. Tushar, H., Rahman, S., Thakur, S., & Hossain, M. S. (2022). The Ubiquitous Role of Mobile Technology Application in the Australian Open. In Digital Transformation and Innovation in Tourism Events (pp. 119-131). Routledge.
8. Bharadwaj, P., Jack, W., &Suri, T. (2019). Fintech and household resilience to shocks: Evidence from digital loans in Kenya (No. w25604). National Bureau of Economic Research.
9. Narteh, B., Mahmoud, M. A., &Amoh, S. (2017). Customer behavioural intentions towards mobile money services adoption in Ghana. The Service Industries Journal, 37(7-8), 426-447.
10. Tushar, H. (2017). The role of ethical leadership in developing sustainable organization. Australasian Journal of Law, Ethics, and Governance (AJLEG), 2(2), 83-95.
11. Mohsin, A. K. M., Lei, H., Tushar, H., Hossain, S. F. A., Hossain, M. E., &Sume, A. H. (2021). Cultural and institutional distance of China’s outward foreign direct investment toward the “Belt and Road” countries. The Chinese Economy, 54(3), 176-194.
12. Khan, S., Hassan, M. K., Rabbani, M. R., &Atif, M. (2021). An artificial intelligence-based Islamic FinTech model on Qardh-Al-Hasan for COVID 19 affected SMEs. Islamic Perspective for Sustainable Financial System, 234-249.
13. Fu, J., & Mishra, M. (2020). The global impact of COVID-19 on FinTech adoption. Swiss Finance Institute Research Paper, (20-38)
14. Shneiderman, B., & Wattenberg, M. (2001, October). Ordered treemap layouts. In IEEE Symposium on Information Visualization, 2001. INFOVIS 2001. (pp. 73-78). IEEE.
37716th SOUTH ASIAN MANAGEMENT FORUM (SAMF) 2021
Thinking is one of the most fascinating abilities possessed by humans. Thinking orientation means the way a person thinks. It has been established that there are three orientations of thinking: left brain, right brain, and whole-brain thinking. Any situation requires thinking and the way one thinks has an impact on his/her personality, occupation, relationships, emotions, problem-solving, and decision making. This paper thoroughly reviews a number of studies to figure out what, why, and how of thinking orientation and its importance as a research variable in the field of social sciences. Thinking orientation as a variable was searched over Google Scholar, ERIC, EBSCO, ScienceDirect, and PubMed. The search included keywords like right-brain thinking, left-brain thinking, thinking orientation, Brain Hemisphericity, whole brain, split-brain, thinking, cognition, and handedness amongst others. After reviewing several studies on thinking orientation, it can be concluded that various relationships between thinking orientation and other variables like leadership, creativity, emotional intelligence, learning, personality, and language acquisition in children have been established in the past. The findings of the review suggest that thinking orientation is a potential variable that can be chosen for further study with a number of variables of psychological nature like happiness, problem-solving, resilience, and emotional regulation. People can be facilitated to shape their thinking styles for happier outcomes in their day-to-day transactions.
Thinking is one of the most fascinating abilities possessed by humans. Thinking requires effort and has miraculous benefits. Researchers have concluded that thinking improves brain function and memory retention in individuals. It is with ‘thinking’ that humans can solve the biggest problems of life. Researchers have categorized thinking into three parts: left, right, and whole-brain thinking. The left hemisphere of the brain is responsible for the processing of factual information while the right hemisphere is responsible for processing creative thoughts (Jackson, 1997).Over the years, the functioning of the human brain has been an interesting topic of research across disciplines. To start, the first name comes from the Greek physician Hippocrates. He introduced the concept of the duality of the human brain. The French philosopher Rene Descartes gave the idea of the whole brain to yield a unified mental world. Wigan (1844) continued the research and discovered brain duality suggesting that the brain’s left hemisphere regulates the motor action of the right side of the body and the right hemisphere controls the left side of the body. Since then, there have been many advancements in the understanding of the human brain. In behavioral sciences, Hemisphericity means the role and dominance of the right and left hemispheres in the human brain. Each hemisphere has varying roles and characteristics which lead to different thinking orientations in humans. One of the significant and the most popular research studies which have been widely appreciated is the “split-brain research” by Roger W. Sperry for which he received the Nobel prize in Psychology and Medicine in 1981. Sperry concluded that the
THINKING ORIENTATION FOR HAPPIER OUTCOMES
Abstract
Introduction
Sarika Patel, Research Scholar1, Upinder Dhar, Vice Chancellor1,1Shri Vaishnav Vidyapeeth Vishwavidyalaya2Management Development Institute Gurgaon
Keywords: Thinking styles, Hemisphericity, Lateral thinking, Hermann’s brain dominance model, Emotions
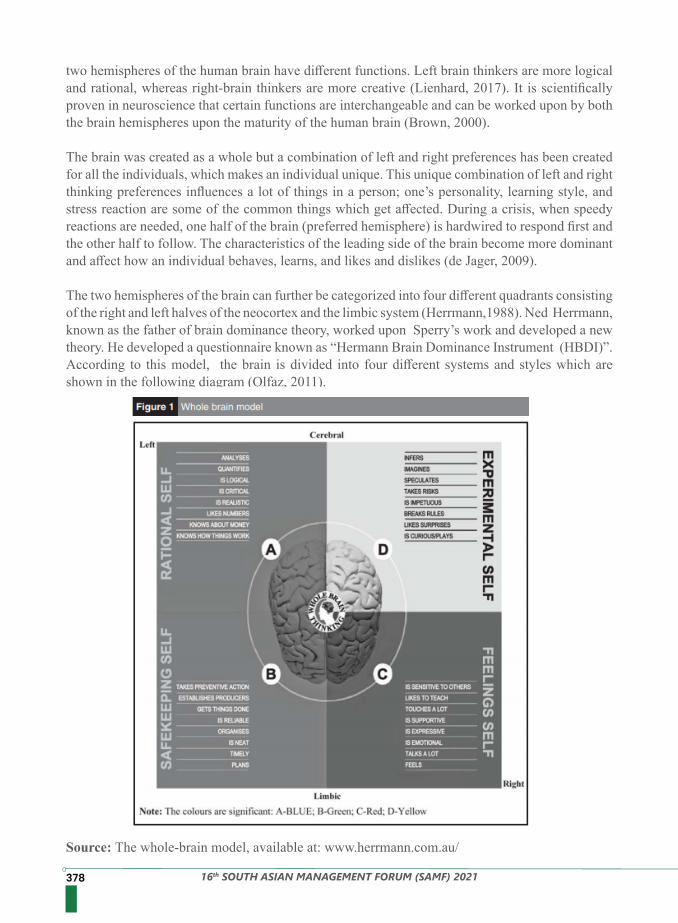
378 16th SOUTH ASIAN MANAGEMENT FORUM (SAMF) 2021
two hemispheres of the human brain have different functions. Left brain thinkers are more logical and rational, whereas right-brain thinkers are more creative (Lienhard, 2017). It is scientifically proven in neuroscience that certain functions are interchangeable and can be worked upon by both the brain hemispheres upon the maturity of the human brain (Brown, 2000).
The brain was created as a whole but a combination of left and right preferences has been created for all the individuals, which makes an individual unique. This unique combination of left and right thinking preferences influences a lot of things in a person; one’s personality, learning style, and stress reaction are some of the common things which get affected. During a crisis, when speedy reactions are needed, one half of the brain (preferred hemisphere) is hardwired to respond first and the other half to follow. The characteristics of the leading side of the brain become more dominant and affect how an individual behaves, learns, and likes and dislikes (de Jager, 2009).
The two hemispheres of the brain can further be categorized into four different quadrants consisting of the right and left halves of the neocortex and the limbic system (Herrmann,1988). Ned Herrmann, known as the father of brain dominance theory, worked upon Sperry’s work and developed a new theory. He developed a questionnaire known as “Hermann Brain Dominance Instrument (HBDI)”. According to this model, the brain is divided into four different systems and styles which are shown in the following diagram (Olfaz, 2011).
Source: The whole-brain model, available at: www.herrmann.com.au/
37916th SOUTH ASIAN MANAGEMENT FORUM (SAMF) 2021
Why is Whole-brain thinking so important?
Whole-brain thinking can help in any situation that needs thinking outside of a quadrant’s particular mode. Decision-making, problem-solving, increasing team interactions, performance, and communication are all areas where whole-brain thinking is widely used. WBT (whole-brain thinking) is effective at aligning development with strategic goals. (Deshpande & Baxi, 2011)
1. What is the current understanding of thinking orientation as a research variable?2. Which variables have been studied with thinking orientation so far?3. Is thinking orientation related to emotions and their regulation, if yes, how?4. What is the scope of further research on thinking orientation?
De Bono (1967) invented the term lateral thinking. Lateral thinking focuses on the creation of fresh perspectives and ideas in particular. It entails, in general, thinking outside the box. The purpose of lateral thinking is to overcome the limitations by providing a means to restructure the line of thought, and putting information together in new ways to give new ideas. According to Wonder and Donovar (1984), human beings have two distinct thinking processes, vertical and lateral. The left hemisphere is concerned with vertical thinking which comprises analytical and verbal thinking processes. The right hemisphere is concerned with lateral thinking consisting of intuitive and visual thinking processes. Pioneer of creativity research, Torrance (1982) conducted an interdisciplinary research that identified the importance of two types of information processing approaches that appear to parallel the left and right hemispheres’ specialized cerebral tasks. The right side of the brain was found to be positively and significantly connected to measures of creative style (Gowan, 1979). According to Torrance and Mourad (1979), creativity and effectiveness are typically the outcomes of a type of information processing approach in which both hemispheres work together. Whole-brained thinkers are good at assimilation of information and concerns because they understand the big picture, which includes a plethora of interrelated circumstances that affect one another at the same time (Carthey, 1993).
Several other studies indicated that the right brain and integrative brain skills make effective leaders (Johnson & Daumer, 1993). According to many studies, the most effective and innovative leaders blend left and right brain processing, making them more adaptable to change, better able to recover energy resources, more successful, and less prone to job burnout (Kean, Leary, & Toth, 1993). Whole-brain thinking, which is the consequence of training in integrating the hemispheres, leads to superior leadership performance (Hooper, 1992). According to another study, partners in public accounting companies tend to think with their whole brains, whereas lower levels of management (staff auditors and managers) tend to think with their left brains (Clayton & Kimbrell, 2007).
Another research focused on identifying the relationship between emotional intelligence and thinking orientation suggested that college-going students with whole-brain thinking orientation were found to have significantly higher emotional intelligence in comparison to those with right-brain thinking orientation and left brain thinking orientation. Further, emotional intelligence is the function of whole-brain thinking, where both the hemispheres are applied simultaneously to work on a problem or situation. The left brain is termed as the driver of analytical and quantitative aspects of human thinking, whereas the right brain is considered the driver of intuitive, emotive,
Research Questions
Review of Literature
380 16th SOUTH ASIAN MANAGEMENT FORUM (SAMF) 2021
Construction engineers in the State Department of Engineering Construction are mostly left-brained, whereas design engineers are mostly right-brained, according to reports. This contrast in orientation helps to explain why the State Department of Engineering Construction’s design and construction engineers can’t seem to agree on matters like drawing implementation. Engineers who are dominant in the left hemisphere are also believed to want more organizational changes than their peers who are dominant in the right hemisphere. Researchers feel that in large organizations, a 50–50 distribution of hemisphericity is ideal (Singh, 2002).
The concept of whole-brain thinking (WBT) and the Herrmann Brain Dominance Inventory profiles have developed a high level of acceptance among managers at all levels, according to the
and creative aspects of human thinking. By blending a mix of both skills, individuals can enhance their chances for success in life (Mishra & Dhar, 2001).
Adelstein et al. (2011) investigated how personality qualities are mirrored in the brain’s functional architecture. Personality refers to a person’s consistent behavioral responses to a variety of stimuli in the environment. They studied the neurological correlates of the five-factor personality traits using resting-state functional connectivity (RSFC). Each domain of personality predicted RSFC with a unique pattern of brain regions based on seed regions located within two cognitive and affective ‘hubs’ in the brain—the anterior cingulate and precuneus. Personality qualities were largely linked to functional linkages, which were present in varying degrees among people. This shows that, while a fundamental and core functional architecture is retained across individuals, varied connections outside of that core, account for inter-individual personality differences that drive diverse responses.
Source: Personality trait measures predicted RSFC (Adelstein et al. 2011)
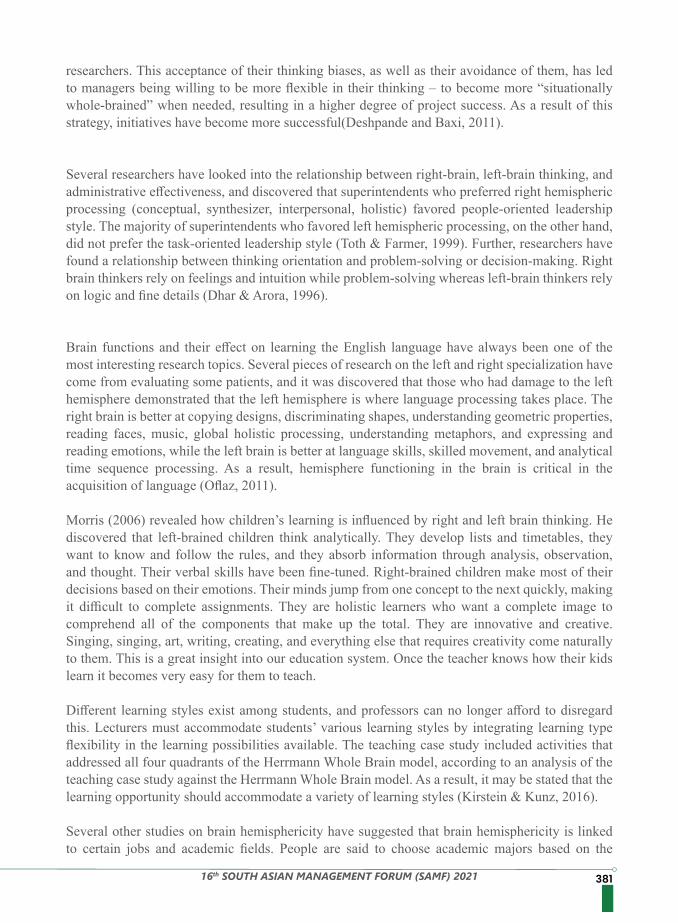
38116th SOUTH ASIAN MANAGEMENT FORUM (SAMF) 2021
researchers. This acceptance of their thinking biases, as well as their avoidance of them, has led to managers being willing to be more flexible in their thinking – to become more “situationally whole-brained” when needed, resulting in a higher degree of project success. As a result of this strategy, initiatives have become more successful(Deshpande and Baxi, 2011).
Several researchers have looked into the relationship between right-brain, left-brain thinking, and administrative effectiveness, and discovered that superintendents who preferred right hemispheric processing (conceptual, synthesizer, interpersonal, holistic) favored people-oriented leadership style. The majority of superintendents who favored left hemispheric processing, on the other hand, did not prefer the task-oriented leadership style (Toth & Farmer, 1999). Further, researchers have found a relationship between thinking orientation and problem-solving or decision-making. Right brain thinkers rely on feelings and intuition while problem-solving whereas left-brain thinkers rely on logic and fine details (Dhar & Arora, 1996).
Brain functions and their effect on learning the English language have always been one of the most interesting research topics. Several pieces of research on the left and right specialization have come from evaluating some patients, and it was discovered that those who had damage to the left hemisphere demonstrated that the left hemisphere is where language processing takes place. The right brain is better at copying designs, discriminating shapes, understanding geometric properties, reading faces, music, global holistic processing, understanding metaphors, and expressing and reading emotions, while the left brain is better at language skills, skilled movement, and analytical time sequence processing. As a result, hemisphere functioning in the brain is critical in the acquisition of language (Oflaz, 2011).
Morris (2006) revealed how children’s learning is influenced by right and left brain thinking. He discovered that left-brained children think analytically. They develop lists and timetables, they want to know and follow the rules, and they absorb information through analysis, observation, and thought. Their verbal skills have been fine-tuned. Right-brained children make most of their decisions based on their emotions. Their minds jump from one concept to the next quickly, making it difficult to complete assignments. They are holistic learners who want a complete image to comprehend all of the components that make up the total. They are innovative and creative. Singing, singing, art, writing, creating, and everything else that requires creativity come naturally to them. This is a great insight into our education system. Once the teacher knows how their kids learn it becomes very easy for them to teach.
Different learning styles exist among students, and professors can no longer afford to disregard this. Lecturers must accommodate students’ various learning styles by integrating learning type flexibility in the learning possibilities available. The teaching case study included activities that addressed all four quadrants of the Herrmann Whole Brain model, according to an analysis of the teaching case study against the Herrmann Whole Brain model. As a result, it may be stated that the learning opportunity should accommodate a variety of learning styles (Kirstein & Kunz, 2016).
Several other studies on brain hemisphericity have suggested that brain hemisphericity is linked to certain jobs and academic fields. People are said to choose academic majors based on the
382 16th SOUTH ASIAN MANAGEMENT FORUM (SAMF) 2021
Research Method
compatibility of these disciplinary domains’ standards with the individual’s hemisphere dominance. New research in this area looked at the association between brain hemisphericity and majors and found that students majoring in humanities preferred right-hemispheric dominance, whilst students majoring in natural sciences and social sciences preferred left-hemispheric dominance (Saleh, 2001).
Another study of the differences in communication strategy use among left-brained, right-brained, and whole-brained learners in oral narration discovered that brain hemisphere dominance plays an important influence in learners’ communication strategy choices. Message abandonment, literal translation, retrieval, omission, and self-repetition strategies were used most frequently by left-brained learners, whereas message reduction, circumlocution, approximation, mime, similar-sounding words, and self-repair strategies were used most frequently by right-brained learners. Fillers, all-purpose terms, verbal strategy markers, message replacement, self-rephrasing, and restructuring strategies were observed to be used most frequently by whole-brained learners. As a result, it can be inferred that varied hemisphere brain dominance implies individual variances in cognitive styles (Ka-J & Teo, 2016).
One of the earliest researches on brain hemisphericity was to understand the influence of brain dominance on self-actualization. It was found that the self-actualizing personality is primarily right-brain-dominant, both right limbic and right cerebral, with selected input from the left limbic quadrant. Left-brain cerebral dominance was shown to hurt self-actualization (Bernhoft, 1987). A number of studies have examined how an advertisement message affects those who are left or right-brain-dominant. According to the findings of a study, the type of advertisements employed in print advertisements: “informational” versus “visual” impacts left-brain and right-brain dominant individuals differently. Furthermore, the success of an advertisement is determined by both the appeals utilized and the respondent’s brain dominance orientation (Hanna, Wagle, and Kizilbash, 1999).
Handedness and asymmetry of the brain are thought to be unique to humans, and are linked to complementary brain functions like the left brain is specialized for language and logic while the right brain is specialized for creativity and intuition. Indeed, asymmetries are common among animals, allowing for the gradual evolution of asymmetrical functions like language and tool use. Handedness and asymmetry of the brain are inborn and partially genetically controlled, though the gene or genes responsible are unknown. Cognitive and emotional problems are sometimes linked to deviations from the “norm” of right-handedness and left-brain language dominance, though these asymmetries are more often absent than reversed (Corballis, 2014).
It can be concluded that thinking orientation as a variable has been widely studied in relation to variables like education, leadership style, personality, emotional intelligence, creativity, language, advertisement, communication, learning styles, and self-actualization.
Thinking orientation as a variable was searched over Google Scholar, ERIC, EBSCO, ScienceDirect, and PubMed.The search included keywords like right-brain thinking, left-brain thinking, thinking orientation, Brain Hemisphericity, whole-brain, split-brain, thinking, cognition, and handedness amongst
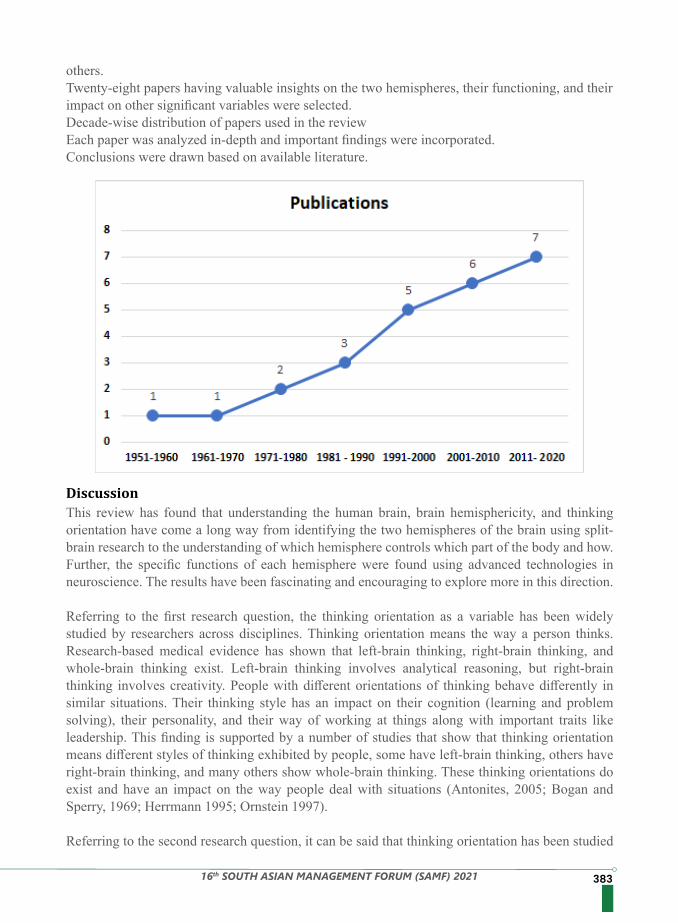
38316th SOUTH ASIAN MANAGEMENT FORUM (SAMF) 2021
others.Twenty-eight papers having valuable insights on the two hemispheres, their functioning, and their impact on other significant variables were selected.Decade-wise distribution of papers used in the review Each paper was analyzed in-depth and important findings were incorporated.Conclusions were drawn based on available literature.
DiscussionThis review has found that understanding the human brain, brain hemisphericity, and thinking orientation have come a long way from identifying the two hemispheres of the brain using split-brain research to the understanding of which hemisphere controls which part of the body and how. Further, the specific functions of each hemisphere were found using advanced technologies in neuroscience. The results have been fascinating and encouraging to explore more in this direction.
Referring to the first research question, the thinking orientation as a variable has been widely studied by researchers across disciplines. Thinking orientation means the way a person thinks. Research-based medical evidence has shown that left-brain thinking, right-brain thinking, and whole-brain thinking exist. Left-brain thinking involves analytical reasoning, but right-brain thinking involves creativity. People with different orientations of thinking behave differently in similar situations. Their thinking style has an impact on their cognition (learning and problem solving), their personality, and their way of working at things along with important traits like leadership. This finding is supported by a number of studies that show that thinking orientation means different styles of thinking exhibited by people, some have left-brain thinking, others have right-brain thinking, and many others show whole-brain thinking. These thinking orientations do exist and have an impact on the way people deal with situations (Antonites, 2005; Bogan and Sperry, 1969; Herrmann 1995; Ornstein 1997).
Referring to the second research question, it can be said that thinking orientation has been studied
384 16th SOUTH ASIAN MANAGEMENT FORUM (SAMF) 2021
Conclusion
Implications
Thinking orientation is a potential and under-explored variable in the field of social science research. It has been studied with a number of variables like academic achievement, learning, language acquisition, stress, and effective leadership amongst others in the past. There is not enough literature available on its relationship or impact on emotional regulation and/or emotional well-being. There are a lot of scopes to undertake significant work on this variable in relation to some other variables preferably those which are more psychological in nature.
Understanding thinking orientation as a variable will give new insights into it. Studying it with psychological constructs like emotional regulation, happiness, and problem-solving will open new
mainly with creativity, problem-solving, learning, leadership, self-actualization, occupations people choose, workplace stress, language acquisition, learning in kids, education management, and relationships. Right-brain thinking and whole-brain thinking have more advantages over left-brain thinking for the simple reason that creative thinking has more scope for problem-solving than a logical way of thinking. Both creative thinking and logical thinking can do wonders to solve complex problems of life (Lumsdaine & Lumsdaine, 1994). Also, more research on this variable has been carried out in the field of neuroscience, focusing on thinking orientation as a biological variable.
Referring to the third research question, it has been found that thinking preferences are linked to emotions, there is an understanding of how left vs right brain thinkers process emotions and which hemisphere is better at understanding emotions or more precisely at emotional regulation. Hemisphericity, or an individual’s preference for processing information in the left or right hemisphere mode, has been linked to a variety of differences in regulating emotions. Inhibition of emotional expression, a sense of tension, and increased impulsivity have all been linked to the right hemisphere. These findings point to a link between right hemisphericity and emotional regulation issues (Gupta, Dubey, Saxena & Pandey 2011). Several other researchers have attempted to understand the association between the two, but the available literature is not enough to conclude something substantial on this. Hence, more research is needed in this area.
Also, is the idea of “thinking with the left/ right side of the brain” a myth? The absence of proof does not imply that the contrary is true. However, evidence refuting the left/right brain theory is mounting. Brain scans show that activity on both sides of the brain is identical independent of personality, according to a study from the University of Utah. They analyzed the brain scans of over 1,000 young people aged 7 to 29 years old and separated different sections of the brain into 7,000 regions to see if one side of the brain was more active or connected than the other. There was no evidence of “sidedness. The authors concluded that the idea that certain people are more left-brained or right-brained is more of a metaphor than an anatomically precise depiction (Shmerling, 2019).Finally, discussing the fourth research question, it can be concluded that there are a lot of scopes for research on this interesting variable. Various constructs from the field of social science like emotional regulation, motivation, better interpersonal relationships, stress management, happiness, resilience, etc. can be explored. The way a person thinks can have a lot of impact on several aspects of his/her personality and thus it is an important construct to work on.
38516th SOUTH ASIAN MANAGEMENT FORUM (SAMF) 2021
areas of research and will help in understanding human nature in a better way. People can be facilitated to shape their thinking styles for happier outcomes in their daily lives. This review is an exploration considering a specific objective of understanding what is thinking orientation and how it has been studied so far as well as to see if there is any connection to emotional regulation. Thus, further work can be done on the same theme with a larger number of studies available in the scientific literature. The in-depth review of literature can bring in different perspectives to understand the construct from the point of view of the disciplines other than neuroscience and medicine. Empirical studies with new constructs from various streams of social sciences are recommended for improving the scope of research in this field. Studies can be designed to explore the relationship between thinking orientation and the variables like perceived fear, stress proneness, learned helplessness, self-efficacy, and learned optimism to name a few.
References1. Adelstein JS, Shehzad Z, Mennes M, DeYoung CG, Zuo X-N, Kelly C, et al. (2011) Personality
Is Reflected in the Brain’s Intrinsic Functional Architecture. PLoS ONE 6(11): e27633. https://doi.org/10.1371/journal.pone.0027633
2. Antonites, A. J. (2005). An action learning approach to entrepreneurial creativity, innovation, and opportunity finding (Doctoral dissertation, University of Pretoria).
3. Bernhoft, F. O. (1987). Brain Dominance & Self-Actualization.4. Brown, H.D. (2000). Principles of language learning and teaching. (4th ed). NY: Longman.5. Carthey, J. (1973). Relationship between learning styles and academic achievement and brain
hemispheric dominance and academic performance in business. MS thesis, Winona State University.
6. Corballis, M. C. (2014). Left brain, right brain: facts and fantasies. PLoS biology, 12(1), e1001767.
7. Dhar, U., & Arora, B. (1996). Thinking, experience, and job stress (an empirical study). Psycho-lingua, 26(2), 111-116.
8. de Jager, M. (2009). Left Brain, Right Brain, or Whole Brain?. Mind Moves Institute, Johannesburg, South Africa.
9. Edward M. Jackson (1997) Thinking, Journal of Toxicology: Cutaneous and Ocular Toxicology, 16:3, 133-134, DOI: 10.3109/15569529709048890
10. Gowan, J.C. (1979). The production of creativity through right hemisphere imagery. The Journal of Creative Behavior, 13, 39-51.
11. Gupta, G., Dubey, A., Saxena, P., & Pandey, R. (2011). Individual differences in hemispheric preference and emotion regulation difficulties. Industrial psychiatry journal, 20(1), 32.
12. Hanna, N., Wagle, J. and Kizilbash, A.H. (1999), “BRAIN DOMINANCE AND THE INTERPRETATION OF ADVERTISING MESSAGES”, International Journal of Commerce and Management, Vol. 9 No. 3/4, pp. 19-32. https://doi.org/10.1108/eb047387
13. Herrmann, N. (1988). The creative brain. Lake Lure, NC: Brain Books.14. Hooper, D. (1992). Success depends on leaders’ whole-brain thinking. School Administrator,
49(6), 14-17.15. Lumsdaine, E., & Lumsdaine, M. (1994). Creative problem-solving. IEEE Potentials, 13(5),
4-9.16. Ka-J, W., & Teo, A. (2016). Communication Strategy Use in an Oral Narrative Task among
English Learners with Different Hemispheric Brain Dominance. LEARN Journal: Language Education and Acquisition Research Network, 9(2), 188-198.
386 16th SOUTH ASIAN MANAGEMENT FORUM (SAMF) 2021
17. Kean, B., Leary, P., & Toth, P. (1992-93). School principals, left-brain, right-brain leadership. National FORUM of Applied Educational Research Journal, 5(2), 69-73.
18. Lienhard, Dina A., “Roger Sperry’s Split Brain Experiments (1959–1968)”. Embryo Project Encyclopedia (2017-12-27). ISSN: 1940-5030
19. Kirstein, M. and Kunz, R. (2016), “A Whole Brain® learning approach to an undergraduate auditing initiative – an exploratory study”, Meditari Accountancy Research, Vol. 24 No. 4, pp. 527-544. https://doi.org/10.1108/MEDAR-02-2014-0029
20. Mishra, P., & Dhar, U. (2001). Emotional Intelligence as a correlate of Thinking Orientation among future managers. Indian Journal of Industrial Relations, 323-338.
21. Morris, M. (2006). The SPD Companion. Right Brain vs. Left Brain Learning Styles, 10.22. Oflaz, M. (2011). The effect of right and left brain dominance in language learning. Procedia-
Social and Behavioral Sciences, 15, 1507-1513.23. Ornstein, R. (1977). The Education of the Intuitive Mode: The Psychology of Consciousness.24. Saleh, A. (2001). Brain Hemisphericity And Academic Majors: A Correlation Study. College
Student Journal. 7 – 925. Shmerling, R. (2019), Right brain/ left brain, right? Harvard Health Publishing. Harvard
Medical School. Retrieved from: https://www.health.harvard.edu/blog/right-brainleft-brain-right-2017082512222
26. Torrance, E.P. (1982). Hemisphericity and creative functioning. Journal of Research and Development in Education, 15, 29-37.
27. Torrance E.P., & Mourad, S. (1979). Role of hemisphericity in performance on selected measures of creativity. The Gifted Child Quarterly, 23(1), 44-45.
28. Toth, P. E., & Farmer, T. S. (1999). Brain hemispheric characteristics and leadership style of school superintendents. In the National Forum of Applied Educational Research Journals (Vol. 13, No. 3, pp. 1-10).
38716th SOUTH ASIAN MANAGEMENT FORUM (SAMF) 2021
The paper aims to study the lessons learned during the COVID-19 pandemic and post-scenario strategies for supply chain management (SCM) in India. Given that COVID-19 has severely created various operational and financial challenges for businesses worldwide, including India, the study’s trigger is that the supply chain is one of the vital strategic industrial segments. The research relies on secondary sources-research publications, and consulting reports supported by field experience. The article reviews COVID-19’s impact on the Indian supply chain, particularly disruption, experience learned, and future strategies. Based on a review of strategic SCM of leading top e-commerce companies-five B2B and five B2C companies, the researchers propose a strategic SCM model to counter similar situations in the future.
Worldwide e-commerce retail sales have reached US$4.2 trillion in 2020 up from US$2.4 trillion in 2017 and US$1.5 trillion in 2015 and are forecast to reach US$6.6 trillion by 20231 growing at a compound annual growth rate (CAGR) of 20.34% during 2015-2023. India has poised a little more growth rate at 26.19% during the same period. Such exponential growth is directly associated with changing technology landscape-internet penetration and the use of mobile devices/ smartphones2. The forecasted scenario of growth parameters got changed because of the onslaught COVID-19 pandemic throughout the globe making people’s lives miserable. The supply chain industry hugely affected the health sector among others3. Under these conditions, the e-commerce supply chain has played a pioneering role (Sodhi & Tang, 2020).
Following the COVID-19 pandemic, supply chains have faced many shocks, both at the outbreak’s start and throughout the long term. The reason for this is the high level of uncertainty in demand and supply dynamics, both in the short and long term. During the COVID-19 pandemic, supply networks with delayed demand and shutdown capacity are particularly vulnerable to interruption. When it comes to supply chain management, some unknown facts remain unnoticed. What will happen when the epidemic is over, and life returns to normal?(Cappelli &Cini, 2020; Katsaliaki et al., 2021; Kumar et al., 2020;Ivanov, 2021).
The study’s objective is to analyze the lessons learned during the COVID-19 pandemic and post-scenario strategies for India’s supply chain management (SCM). The research relies on secondary sources-research publications, and consulting reports supported by field experience. The article reviews COVID-19’s impact on the Indian supply chain, particularly disruption, knowledge learned, and future strategies. The study examines the strategic SCM of leading e-commerce companies-five B2B (OpenCart, Shopify Plus, Magento Commerce, BigCommerce, and InsiteCommerce) and
POST-COVID 19 LESSONS FOR E-COMMERCE SUPPLY CHAINS IN INDIA: STRATEGIC ISSUES
Abstract
Introduction
Research Issues
Objectives And Methods
Bisleshana Brahma Prakash1 and Anjali Panda2
1Amazon, Hyderabad, India, 2Assistant Professor, DAV School of Management, Utkal University, India
Keywords: E-commerce, Supply chain, COVID-19 pandemic
388 16th SOUTH ASIAN MANAGEMENT FORUM (SAMF) 2021
COVID 19 Impacts on Supply ChainCOVID 19 created various operational and financial challenges for Indian businesses4. During the lockdown, approximately 71.31% of the companies dealt with reduced cash flows with the manufacturing sector being the worst hit. Additionally, delay and cancellation of projects have also been a significant cause of concern, especially in the tertiary sectors. These difficulties have taught companies to adapt, forcing them to change their long-term strategies from the lock-down to the post-lockdown era. With restored consumer confidence and targeted government intervention, companies have moved away from short-term cost-cutting measures – noted fewer cases of delayed compensation (11.5 percent) and wage cuts (43 percent) in the post-lock era relative to the lock-down period (19.4 percent & 57 percent, respectively). Businesses are now planning long-term by reducing fixed expenses, such as marketing costs, and switching to low-cost raw material sources in the post-lock process. However, emphasis on virtual meetings remained constant over the two periods of time, indicating that remote work may be a “new normal”.Supply Chain Disruption during COVID- 19Supply chains during the pandemic are more fragile for products that travel long distances before reaching their final point of sale. Disruption in any health supply chain and food supply chain has impacted more5across countries including India(Mahajan &Tomar, 2020). The global shortage of ventilators and Personal Protective Equipment (PPE)6has become a significant concern as the coronary virus infection spread worldwide. For example, in India, there is a monopoly on the purchasing process for PPE by a single government-owned agency which has constituted a severe scarcity.The lock-down in India runs through four phases -Phase 1 (25 March – 14 April), Phase 2 (15 April – 3 May), Phase 3 (4–17 May), and Phase 4 (18–31 May) while unlocking started from 1 June 2020 (Unlock 1:1–30 June, Unlock 2: 1–31 July, Unlock 3: 1–31 August, Unlock 4:1–30 September, Unlock 5: 1–31 October, Unlock 6:1–30 November, and Unlock 7:1-31 December). However, we divide the disruption period into three stages, viz., lock-down (25 March-31 May), Pre-new normal (1 June-31 October), New-normal (Post October), and second-wave (April-June, 2021) for analysis purposes. Figure 1 exhibits the first wave of challenges faced by the supply chain after the imposition of the national lockdown. Figure 1. Disruption experienced during COVID-19
Analysis And Discussions
five B2C companies (Amazon, Alibaba, Flipkart, DHL, and Home Depot). The review outcome, supported by field experience, helps propose a strategic SCM model to counter similar situations in the future. The proposed model suggests how the unexpected disruption due to the COVID-19 pandemic will require rethinking the company’s supply chain structure with the new normal and even after the second wave.
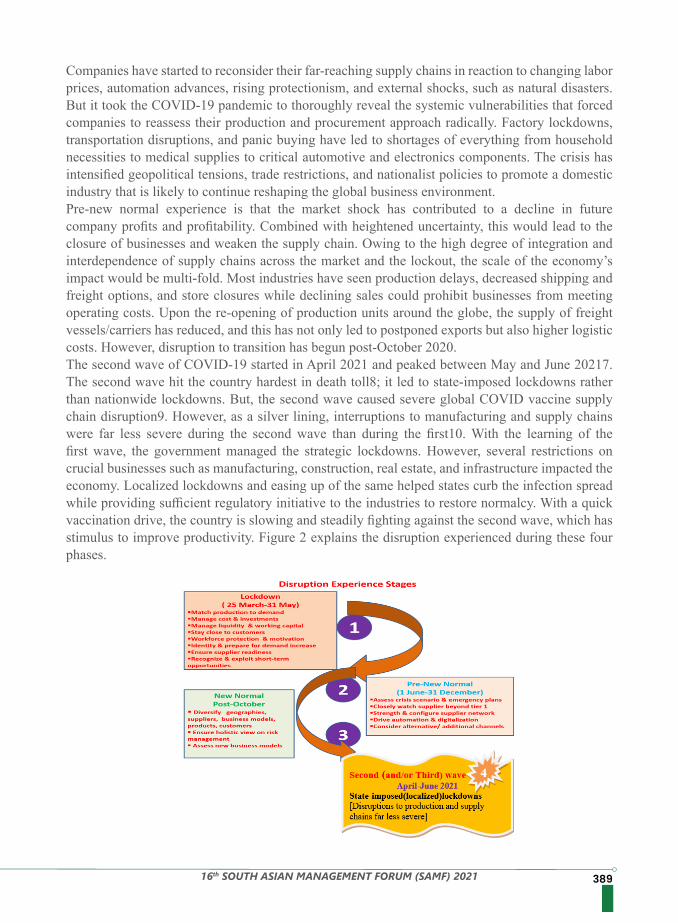
38916th SOUTH ASIAN MANAGEMENT FORUM (SAMF) 2021
Companies have started to reconsider their far-reaching supply chains in reaction to changing labor prices, automation advances, rising protectionism, and external shocks, such as natural disasters. But it took the COVID-19 pandemic to thoroughly reveal the systemic vulnerabilities that forced companies to reassess their production and procurement approach radically. Factory lockdowns, transportation disruptions, and panic buying have led to shortages of everything from household necessities to medical supplies to critical automotive and electronics components. The crisis has intensified geopolitical tensions, trade restrictions, and nationalist policies to promote a domestic industry that is likely to continue reshaping the global business environment.Pre-new normal experience is that the market shock has contributed to a decline in future company profits and profitability. Combined with heightened uncertainty, this would lead to the closure of businesses and weaken the supply chain. Owing to the high degree of integration and interdependence of supply chains across the market and the lockout, the scale of the economy’s impact would be multi-fold. Most industries have seen production delays, decreased shipping and freight options, and store closures while declining sales could prohibit businesses from meeting operating costs. Upon the re-opening of production units around the globe, the supply of freight vessels/carriers has reduced, and this has not only led to postponed exports but also higher logistic costs. However, disruption to transition has begun post-October 2020.The second wave of COVID-19 started in April 2021 and peaked between May and June 20217. The second wave hit the country hardest in death toll8; it led to state-imposed lockdowns rather than nationwide lockdowns. But, the second wave caused severe global COVID vaccine supply chain disruption9. However, as a silver lining, interruptions to manufacturing and supply chains were far less severe during the second wave than during the first10. With the learning of the first wave, the government managed the strategic lockdowns. However, several restrictions on crucial businesses such as manufacturing, construction, real estate, and infrastructure impacted the economy. Localized lockdowns and easing up of the same helped states curb the infection spread while providing sufficient regulatory initiative to the industries to restore normalcy. With a quick vaccination drive, the country is slowing and steadily fighting against the second wave, which has stimulus to improve productivity. Figure 2 explains the disruption experienced during these four phases.
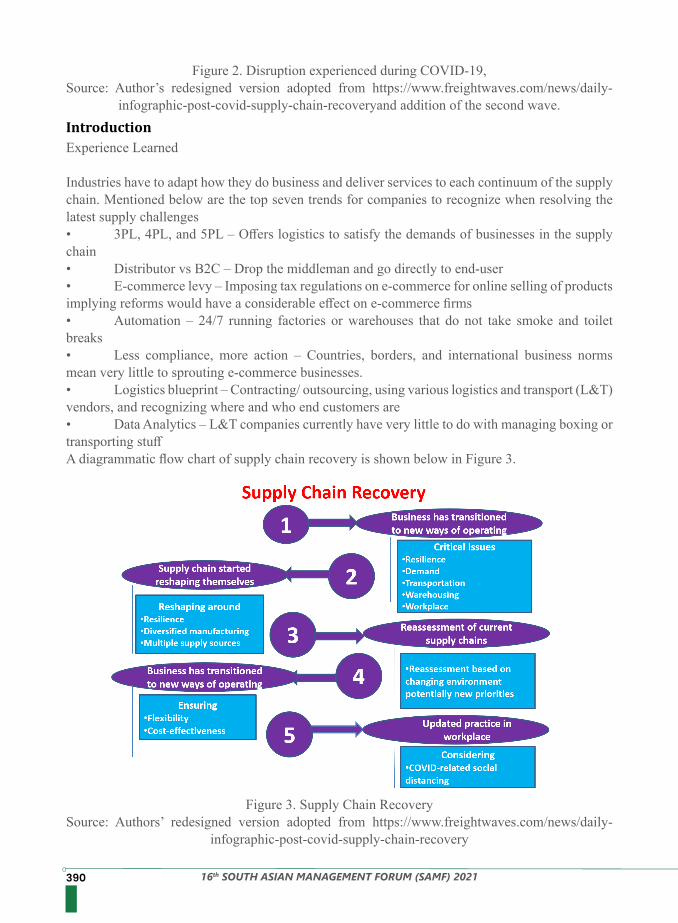
390 16th SOUTH ASIAN MANAGEMENT FORUM (SAMF) 2021
Figure 2. Disruption experienced during COVID-19, Source: Author’s redesigned version adopted from https://www.freightwaves.com/news/daily-
infographic-post-covid-supply-chain-recoveryand addition of the second wave.
Experience Learned
Industries have to adapt how they do business and deliver services to each continuum of the supply chain. Mentioned below are the top seven trends for companies to recognize when resolving the latest supply challenges• 3PL, 4PL, and 5PL – Offers logistics to satisfy the demands of businesses in the supply chain • Distributor vs B2C – Drop the middleman and go directly to end-user • E-commerce levy – Imposing tax regulations on e-commerce for online selling of products implying reforms would have a considerable effect on e-commerce firms• Automation – 24/7 running factories or warehouses that do not take smoke and toilet breaks• Less compliance, more action – Countries, borders, and international business norms mean very little to sprouting e-commerce businesses.• Logistics blueprint – Contracting/ outsourcing, using various logistics and transport (L&T) vendors, and recognizing where and who end customers are• Data Analytics – L&T companies currently have very little to do with managing boxing or transporting stuffA diagrammatic flow chart of supply chain recovery is shown below in Figure 3.
Figure 3. Supply Chain Recovery Source: Authors’ redesigned version adopted from https://www.freightwaves.com/news/daily-
infographic-post-covid-supply-chain-recovery
Introduction
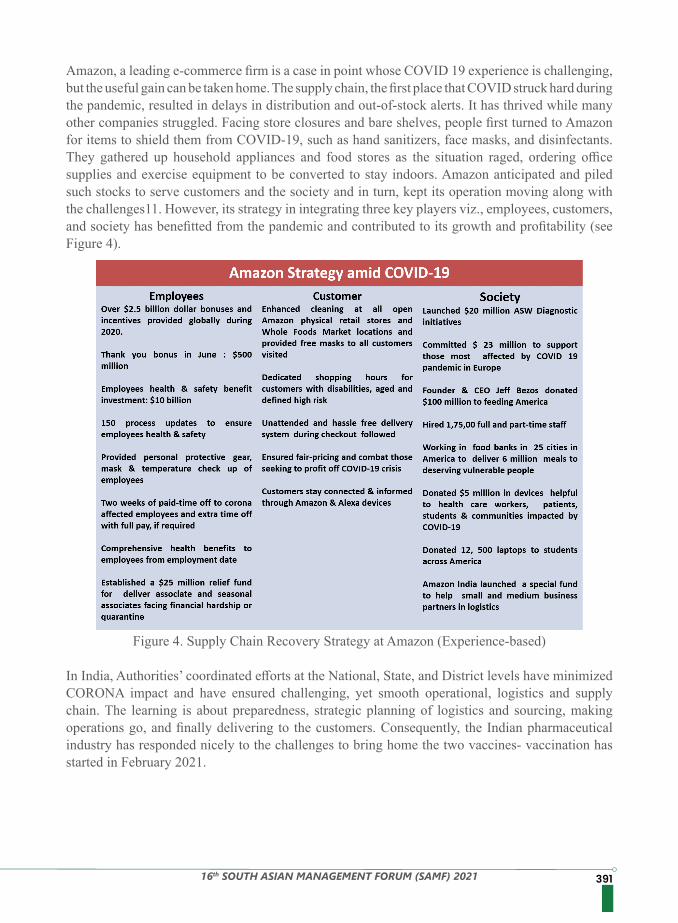
39116th SOUTH ASIAN MANAGEMENT FORUM (SAMF) 2021
Amazon, a leading e-commerce firm is a case in point whose COVID 19 experience is challenging, but the useful gain can be taken home. The supply chain, the first place that COVID struck hard during the pandemic, resulted in delays in distribution and out-of-stock alerts. It has thrived while many other companies struggled. Facing store closures and bare shelves, people first turned to Amazon for items to shield them from COVID-19, such as hand sanitizers, face masks, and disinfectants. They gathered up household appliances and food stores as the situation raged, ordering office supplies and exercise equipment to be converted to stay indoors. Amazon anticipated and piled such stocks to serve customers and the society and in turn, kept its operation moving along with the challenges11. However, its strategy in integrating three key players viz., employees, customers, and society has benefitted from the pandemic and contributed to its growth and profitability (see Figure 4).
Figure 4. Supply Chain Recovery Strategy at Amazon (Experience-based)
In India, Authorities’ coordinated efforts at the National, State, and District levels have minimized CORONA impact and have ensured challenging, yet smooth operational, logistics and supply chain. The learning is about preparedness, strategic planning of logistics and sourcing, making operations go, and finally delivering to the customers. Consequently, the Indian pharmaceutical industry has responded nicely to the challenges to bring home the two vaccines- vaccination has started in February 2021.
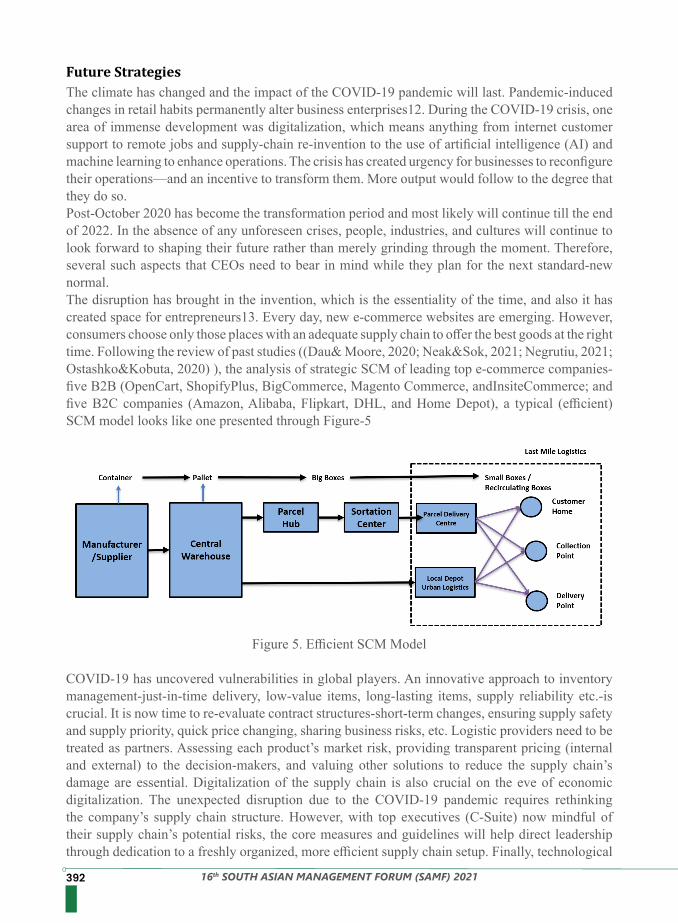
392 16th SOUTH ASIAN MANAGEMENT FORUM (SAMF) 2021
The climate has changed and the impact of the COVID-19 pandemic will last. Pandemic-induced changes in retail habits permanently alter business enterprises12. During the COVID-19 crisis, one area of immense development was digitalization, which means anything from internet customer support to remote jobs and supply-chain re-invention to the use of artificial intelligence (AI) and machine learning to enhance operations. The crisis has created urgency for businesses to reconfigure their operations—and an incentive to transform them. More output would follow to the degree that they do so.Post-October 2020 has become the transformation period and most likely will continue till the end of 2022. In the absence of any unforeseen crises, people, industries, and cultures will continue to look forward to shaping their future rather than merely grinding through the moment. Therefore, several such aspects that CEOs need to bear in mind while they plan for the next standard-new normal.The disruption has brought in the invention, which is the essentiality of the time, and also it has created space for entrepreneurs13. Every day, new e-commerce websites are emerging. However, consumers choose only those places with an adequate supply chain to offer the best goods at the right time. Following the review of past studies ((Dau& Moore, 2020; Neak&Sok, 2021; Negrutiu, 2021; Ostashko&Kobuta, 2020) ), the analysis of strategic SCM of leading top e-commerce companies-five B2B (OpenCart, ShopifyPlus, BigCommerce, Magento Commerce, andInsiteCommerce; and five B2C companies (Amazon, Alibaba, Flipkart, DHL, and Home Depot), a typical (efficient) SCM model looks like one presented through Figure-5
Figure 5. Efficient SCM Model
COVID-19 has uncovered vulnerabilities in global players. An innovative approach to inventory management-just-in-time delivery, low-value items, long-lasting items, supply reliability etc.-is crucial. It is now time to re-evaluate contract structures-short-term changes, ensuring supply safety and supply priority, quick price changing, sharing business risks, etc. Logistic providers need to be treated as partners. Assessing each product’s market risk, providing transparent pricing (internal and external) to the decision-makers, and valuing other solutions to reduce the supply chain’s damage are essential. Digitalization of the supply chain is also crucial on the eve of economic digitalization. The unexpected disruption due to the COVID-19 pandemic requires rethinking the company’s supply chain structure. However, with top executives (C-Suite) now mindful of their supply chain’s potential risks, the core measures and guidelines will help direct leadership through dedication to a freshly organized, more efficient supply chain setup. Finally, technological
Future Strategies
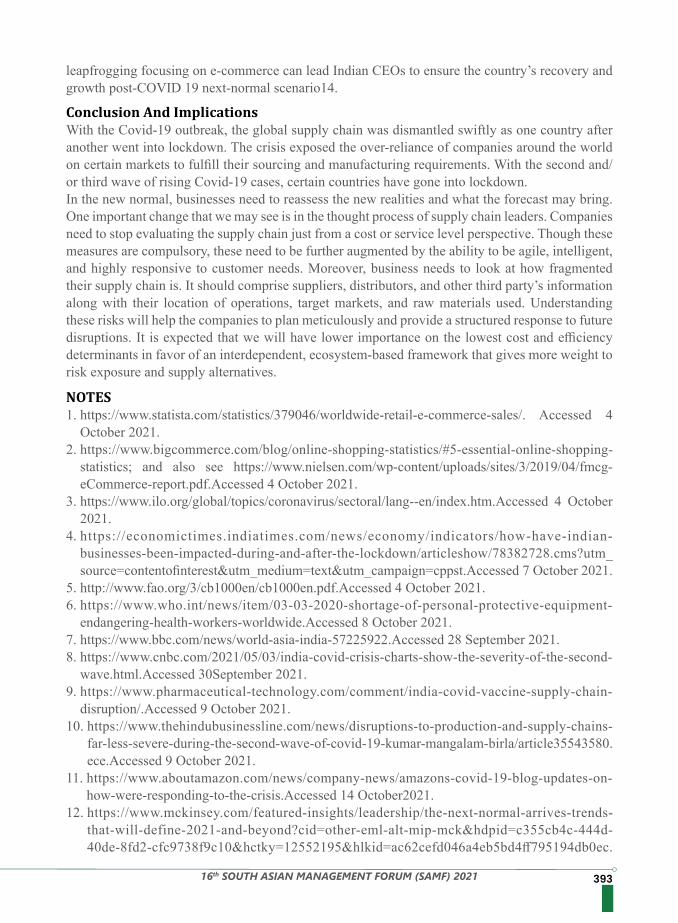
39316th SOUTH ASIAN MANAGEMENT FORUM (SAMF) 2021
leapfrogging focusing on e-commerce can lead Indian CEOs to ensure the country’s recovery and growth post-COVID 19 next-normal scenario14.
With the Covid-19 outbreak, the global supply chain was dismantled swiftly as one country after another went into lockdown. The crisis exposed the over-reliance of companies around the world on certain markets to fulfill their sourcing and manufacturing requirements. With the second and/or third wave of rising Covid-19 cases, certain countries have gone into lockdown.In the new normal, businesses need to reassess the new realities and what the forecast may bring. One important change that we may see is in the thought process of supply chain leaders. Companies need to stop evaluating the supply chain just from a cost or service level perspective. Though these measures are compulsory, these need to be further augmented by the ability to be agile, intelligent, and highly responsive to customer needs. Moreover, business needs to look at how fragmented their supply chain is. It should comprise suppliers, distributors, and other third party’s information along with their location of operations, target markets, and raw materials used. Understanding these risks will help the companies to plan meticulously and provide a structured response to future disruptions. It is expected that we will have lower importance on the lowest cost and efficiency determinants in favor of an interdependent, ecosystem-based framework that gives more weight to risk exposure and supply alternatives.
1. https://www.statista.com/statistics/379046/worldwide-retail-e-commerce-sales/. Accessed 4 October 2021.
2. https://www.bigcommerce.com/blog/online-shopping-statistics/#5-essential-online-shopping-statistics; and also see https://www.nielsen.com/wp-content/uploads/sites/3/2019/04/fmcg-eCommerce-report.pdf.Accessed 4 October 2021.
3. https://www.ilo.org/global/topics/coronavirus/sectoral/lang--en/index.htm.Accessed 4 October 2021.
4. https://economictimes.indiatimes.com/news/economy/indicators/how-have-indian-businesses-been-impacted-during-and-after-the-lockdown/articleshow/78382728.cms?utm_source=contentofinterest&utm_medium=text&utm_campaign=cppst.Accessed 7 October 2021.
5. http://www.fao.org/3/cb1000en/cb1000en.pdf.Accessed 4 October 2021.6. https://www.who.int/news/item/03-03-2020-shortage-of-personal-protective-equipment-
endangering-health-workers-worldwide.Accessed 8 October 2021.7. https://www.bbc.com/news/world-asia-india-57225922.Accessed 28 September 2021.8. https://www.cnbc.com/2021/05/03/india-covid-crisis-charts-show-the-severity-of-the-second-
wave.html.Accessed 30September 2021.9. https://www.pharmaceutical-technology.com/comment/india-covid-vaccine-supply-chain-
disruption/.Accessed 9 October 2021.10. https://www.thehindubusinessline.com/news/disruptions-to-production-and-supply-chains-
far-less-severe-during-the-second-wave-of-covid-19-kumar-mangalam-birla/article35543580.ece.Accessed 9 October 2021.
11. https://www.aboutamazon.com/news/company-news/amazons-covid-19-blog-updates-on-how-were-responding-to-the-crisis.Accessed 14 October2021.
12. https://www.mckinsey.com/featured-insights/leadership/the-next-normal-arrives-trends-that-will-define-2021-and-beyond?cid=other-eml-alt-mip-mck&hdpid=c355cb4c-444d-40de-8fd2-cfc9738f9c10&hctky=12552195&hlkid=ac62cefd046a4eb5bd4ff795194db0ec.
Conclusion And Implications
NOTES
394 16th SOUTH ASIAN MANAGEMENT FORUM (SAMF) 2021
1. Cappelli, A., &Cini, E. (2020). Will the COVID-19 pandemic make us reconsider the relevance of short food supply chains and local productions? Trends in Food Science & Technology, 99, 566–567. https://doi.org/10.1016/j.tifs.2020.03.041
2. Dau, L. A., & Moore, E. M. (2020). Local Business Recovery and Resilience in New England: Response to COVID-19. GRI Whitepaper Series (pp. 1–31). Retrieved from https://globalresilience.northeastern.edu/app/uploads/2020/11/GRI_COVID-19_SI-Report-2020-8.pdf
3. Kumar, A., Luthra, S., Kumar Mangla, S., &Kazancoglu, Y. (2020). COVID-19 impact on sustainable production and operations management. Sustainable Operations and Computers, 1, 1–7. https://doi.org/10.1016/j.susoc.2020.06.001
4. Katsaliaki, K., Galetsi, P., & Kumar, S. (2021). Supply chain disruptions and resilience: a major review and future research agenda. Annals of Operations Research, 1-38,https://doi.org/10.1007/s10479-020-03912-1
5. Mahajan, K., &Tomar, S. (2020). COVID ‐19 and Supply Chain Disruption: Evidence from Food Markets in India. American Journal of Agricultural Economics, 103(1). https://doi.org/10.1111/ajae.12158
6. Neak, C., &Sok, S. (2021). Cambodia’s Response to COVID-19 and Its Impacts on Cambodia–China Relations. The Reshaping of China-Southeast Asia Relations in Light of the COVID-19 Pandemic, 51–67. https://doi.org/10.1007/978-981-33-4416-7_4
7. Negrutiu, C. (2021). Major Trends and New Business Models in Supply Chain and Entrepreneurship After the Covid-19 Crisis. Studia Universitatis „VasileGoldis” Arad – Economics Series, 31(1), 84–96. https://doi.org/10.2478/sues-2021-0005
8. Ostashko, T., &Kobuta, I. (2020). Changes in world trade and trade policy in the time of the COVID-19 pandemic: challenges and opportunities for Ukraine. Economy and Forecasting, 2020(3), 5–19. https://doi.org/10.15407/econforecast2020.03.005
9. Sodhi, M. S., & Tang, C. S. (2020). Supply Chain Management for Extreme Conditions: Research Opportunities. Journal of Supply Chain Management, 57(1). https://doi.org/10.1111/jscm.12255
10. Ivanov, D. (2021). Exiting the COVID-19 pandemic: after-shock risks and avoidance of disruption tails in supply chains. Annals of Operations Research, 1-18. https://doi.org/10.1007/s10479-021-04047-7
REFERENCES
Accessed 4 October 2021.13. https://www.bcg.com/en-in/publications/2020/resilience-in-global-supply-chains. Accessed 10
October 2021.14. https://www.warc.com/newsandopinion/opinion/e-commerce-in-india-where-do-we-go-from-
here/4191. Accessed 15 October 2021.
39516th SOUTH ASIAN MANAGEMENT FORUM (SAMF) 2021
This study examines the factors challenging youth entrepreneurship in the Maldives. The participants were entrepreneurs who either currently operate a business or had run a business and stopped. Three hundred and ten samples were chosen for this study using the purposive sampling method. The analysis was made using descriptive statistics. The research has found that factors such as Education and Training, Finance, Market dynamics, Information and Communication Technology, and Policies and regulations challenge youth entrepreneurship in the Maldives in several ways. The findings will help concerned departments devise better strategies to boost the entrepreneurial start-ups in the Maldives and make it a more business-friendly economy.
Azhadh Rameez, AssistantManager, State Electric Company Ltd., Republic of MaldivesShajeer Sainudeen,Lecturer, Villa College, Republic of Maldives
Educated, employed, and productive Youth is generally considered the trigger of a country’s economic development. It has become evident from the growth of many developed countries worldwide that entrepreneurship plays an essential role in social stability and economic prosperity ( Muthuraman and Haziazi, 2019). Furthermore, engagement of young people in entrepreneurship encourages Youth to gain economic independence and promote self-sufficiency to minimize their dependence on government welfare measures (Fatoki and Chindoga, 2011). It can boost youth start-ups, which helps them live by earning themselves (Uddin et al., 2015). World Health Organization defines Youth as individuals between the ages of 15 to 24 years (Mehari and Belay, 2017), but in The Maldives, the term has been defined as men and women between 18 to 34 years old (Demmke, 2017). In the Maldives, almost 54% of the labor force consists of people aged 18 to 34, and most of them become employees in their early twenties (Demmke, 2017). The study also states the critical need to provide opportunities for youth involvement to address their aspirations and ambitions. Through Youth Manifesto, former president of Maldives, Yameen Abdul Gayoom has started initiatives to help and support the Youth to start new Micro Small Medium Entrepreneurship (MSME’s) (UNDP Maldives, 2014). There are no comprehensive studies conducted in the Republic of Maldives to explore the challenges faced by youth entrepreneurs. Being the first-ever study of this kind will allow policymakers to understand the areas where reforms need to take place in order to promote youth entrepreneurship (Gribben, 2018) and help the government develop and implement suitable policies and procedures to aid the formulation of new businesses amongst the Youth (S. Muthuraman et al., 2017).
Keywords: Youth Entrepreneurship, Education and training, Finance, Market dynamics, ICT, and policies and regulations.
Introduction
Abstract
A QUANTITATIVE STUDY ON THE CHALLENGES FACED BY YOUTH ENTREPRENEURSHIP IN THE MALDIVES
396 16th SOUTH ASIAN MANAGEMENT FORUM (SAMF) 2021
Review of Literature
Education and Training
Finance
Market Dynamics
Entrepreneurs can be described as a person, a group of people, a team, or even an organization, and they are people who initiate change (Bolton and Thompson, 2004). Shane (2003) defines entrepreneurship as “an activity that involves the discovery, evaluation, and exploitation of opportunities to introduce new goods and services, ways of organizing, markets, processes, and raw materials through organizing efforts that previously had not existed” (p. 4). In the view of Bjerke (2007), it is a process “to come up with new applications which others can use (as well) to fill a need and/or satisfy some demand, existing or created” (p.16-18).
Education and literacy play a vital role in accessing opportunities and negotiating for the best choices available in the environment. (Bushell, 2008). Shepherd and DeTienne (2005) recommend that entrepreneurship education helps students learn, identify, and discover the possible business opportunities in the market as knowledge heightens the innovativeness of the available opportunities associated with the technology. One of the significant challenges entrepreneurs in developing countries face is a lack of education and training opportunities (Herringtion et al., 2010; Mehari and Belay, 2017; Premaratne and Kudaliyanage, 2016; Shepherd and DeTienne, 2005). Effective training and Education positively impact the attitude of Youth to start up and expand their businesses (Geraldine et al., 2011; Pillania et al., 2010). It is important to explore the depth of challenges faced by youth entrepreneurs in the Maldives in the context of Education and training.
Fundamental bottlenecks for Youth in terms of finance are high fees and interest rates of loans, lack of collateral securities, and non-customized banking products to suit their requirements (Geraldine et al., 2011; Okirigiti and Raffey, 2015; UNCTAD, 2015), and it resulted in the inability of Youth in mobilizing capital for start-up and development of ventures (Mehari and Belay, 2017; Fatoki and Chindoga, 2011; Okirigiti and Raffey, 2015). Uddin et al. (2015) found the difficulties of young entrepreneurs in mobilizing fund while running an ongoing business especially due to the age discrimination evident from banking and financial institutions. It is also reported that the factors such as market demand, access to finance, and financial risks are the discouraging factors for youth entrepreneurship (Uddin et al., 2015; Pretorius and Shaw, 2004). Lack of security to obtain loans from banks/creditors, unfamiliarity with debt financing and limited knowledge about start-up financing opportunities stand as the challenges of youth entrepreneurship (Geraldine et al., 2011). Youth often start businesses using their funds or rely on their friends and family (D. S. Muthuraman and Al Haziazi, 2019).
Market dynamics consider the level of competition, access to the market, information related to the demand, sudden fall in demand, the price level in the market, market entry barriers, and networks that determine entrepreneurial success (Alam, 2019; Geraldine et al., 2011). Market linkage and symmetric information of the market also have been reported as factors that need further developments in the Maldives (Premaratne and Kudaliyanage, 2016). A high level of competition in the market also discourages youth entrepreneurship (Geraldine et al., 2011; Okirigiti and Raffey, 2015). It is imperative to explore the challenges youth entrepreneurs face in the Maldives related to the market dynamics.
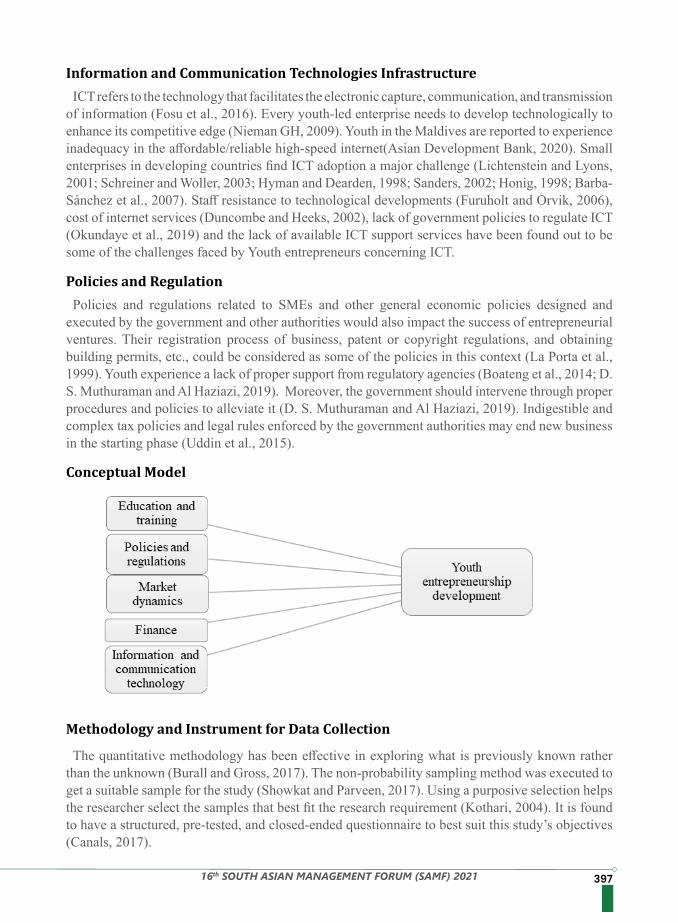
39716th SOUTH ASIAN MANAGEMENT FORUM (SAMF) 2021
Information and Communication Technologies Infrastructure
Policies and Regulation
Conceptual Model
Methodology and Instrument for Data Collection
ICT refers to the technology that facilitates the electronic capture, communication, and transmission of information (Fosu et al., 2016). Every youth-led enterprise needs to develop technologically to enhance its competitive edge (Nieman GH, 2009). Youth in the Maldives are reported to experience inadequacy in the affordable/reliable high-speed internet(Asian Development Bank, 2020). Small enterprises in developing countries find ICT adoption a major challenge (Lichtenstein and Lyons, 2001; Schreiner and Woller, 2003; Hyman and Dearden, 1998; Sanders, 2002; Honig, 1998; Barba-Sánchez et al., 2007). Staff resistance to technological developments (Furuholt and Orvik, 2006), cost of internet services (Duncombe and Heeks, 2002), lack of government policies to regulate ICT (Okundaye et al., 2019) and the lack of available ICT support services have been found out to be some of the challenges faced by Youth entrepreneurs concerning ICT.
Policies and regulations related to SMEs and other general economic policies designed and executed by the government and other authorities would also impact the success of entrepreneurial ventures. Their registration process of business, patent or copyright regulations, and obtaining building permits, etc., could be considered as some of the policies in this context (La Porta et al., 1999). Youth experience a lack of proper support from regulatory agencies (Boateng et al., 2014; D. S. Muthuraman and Al Haziazi, 2019). Moreover, the government should intervene through proper procedures and policies to alleviate it (D. S. Muthuraman and Al Haziazi, 2019). Indigestible and complex tax policies and legal rules enforced by the government authorities may end new business in the starting phase (Uddin et al., 2015).
The quantitative methodology has been effective in exploring what is previously known rather than the unknown (Burall and Gross, 2017). The non-probability sampling method was executed to get a suitable sample for the study (Showkat and Parveen, 2017). Using a purposive selection helps the researcher select the samples that best fit the research requirement (Kothari, 2004). It is found to have a structured, pre-tested, and closed-ended questionnaire to best suit this study’s objectives (Canals, 2017).
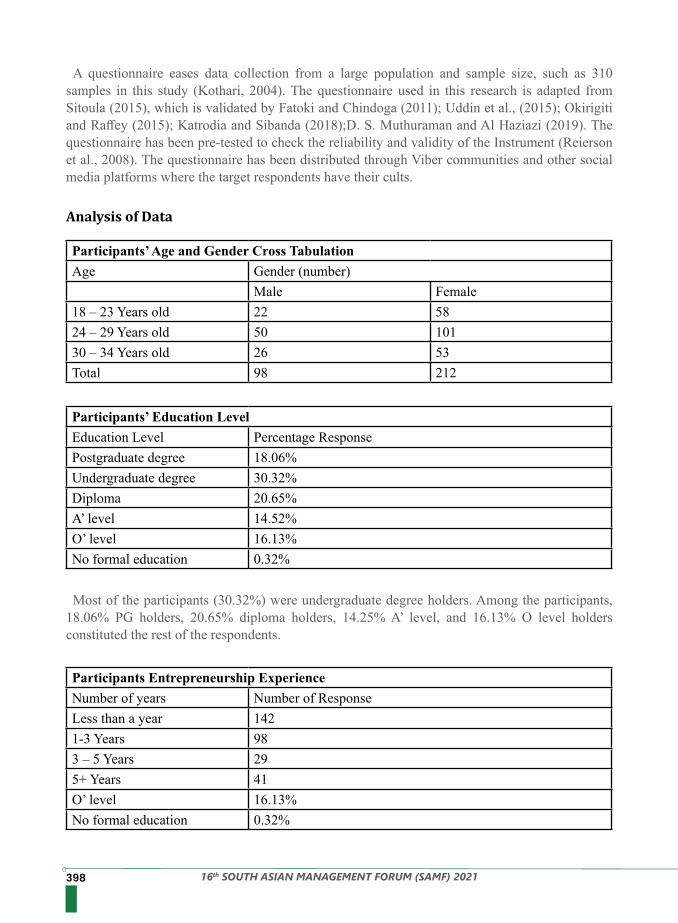
398 16th SOUTH ASIAN MANAGEMENT FORUM (SAMF) 2021
A questionnaire eases data collection from a large population and sample size, such as 310 samples in this study (Kothari, 2004). The questionnaire used in this research is adapted from Sitoula (2015), which is validated by Fatoki and Chindoga (2011); Uddin et al., (2015); Okirigiti and Raffey (2015); Katrodia and Sibanda (2018);D. S. Muthuraman and Al Haziazi (2019). The questionnaire has been pre-tested to check the reliability and validity of the Instrument (Reierson et al., 2008). The questionnaire has been distributed through Viber communities and other social media platforms where the target respondents have their cults.
Most of the participants (30.32%) were undergraduate degree holders. Among the participants, 18.06% PG holders, 20.65% diploma holders, 14.25% A’ level, and 16.13% O level holders constituted the rest of the respondents.
Analysis of Data
Participants’ Age and Gender Cross TabulationAge Gender (number)
Male Female18 – 23 Years old 22 5824 – 29 Years old 50 10130 – 34 Years old 26 53Total 98 212
Participants’ Education LevelEducation Level Percentage ResponsePostgraduate degree 18.06%Undergraduate degree 30.32%Diploma 20.65%A’ level 14.52%O’ level 16.13%No formal education 0.32%
Participants Entrepreneurship ExperienceNumber of years Number of ResponseLess than a year 1421-3 Years 983 – 5 Years 295+ Years 41O’ level 16.13%No formal education 0.32%
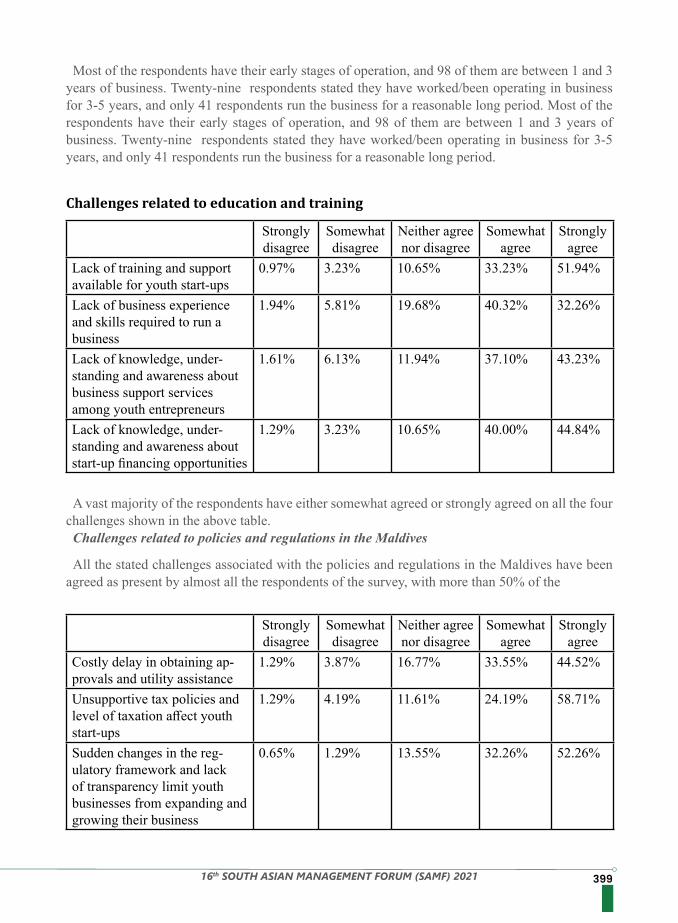
39916th SOUTH ASIAN MANAGEMENT FORUM (SAMF) 2021
Most of the respondents have their early stages of operation, and 98 of them are between 1 and 3 years of business. Twenty-nine respondents stated they have worked/been operating in business for 3-5 years, and only 41 respondents run the business for a reasonable long period. Most of the respondents have their early stages of operation, and 98 of them are between 1 and 3 years of business. Twenty-nine respondents stated they have worked/been operating in business for 3-5 years, and only 41 respondents run the business for a reasonable long period.
A vast majority of the respondents have either somewhat agreed or strongly agreed on all the four challenges shown in the above table.Challenges related to policies and regulations in the Maldives
All the stated challenges associated with the policies and regulations in the Maldives have been agreed as present by almost all the respondents of the survey, with more than 50% of the
Challenges related to education and training
Strongly disagree
Somewhat disagree
Neither agree nor disagree
Somewhat agree
Strongly agree
Lack of training and support available for youth start-ups
0.97% 3.23% 10.65% 33.23% 51.94%
Lack of business experience and skills required to run a business
1.94% 5.81% 19.68% 40.32% 32.26%
Lack of knowledge, under-standing and awareness about business support services among youth entrepreneurs
1.61% 6.13% 11.94% 37.10% 43.23%
Lack of knowledge, under-standing and awareness about start-up financing opportunities
1.29% 3.23% 10.65% 40.00% 44.84%
Strongly disagree
Somewhat disagree
Neither agree nor disagree
Somewhat agree
Strongly agree
Costly delay in obtaining ap-provals and utility assistance
1.29% 3.87% 16.77% 33.55% 44.52%
Unsupportive tax policies and level of taxation affect youth start-ups
1.29% 4.19% 11.61% 24.19% 58.71%
Sudden changes in the reg-ulatory framework and lack of transparency limit youth businesses from expanding and growing their business
0.65% 1.29% 13.55% 32.26% 52.26%
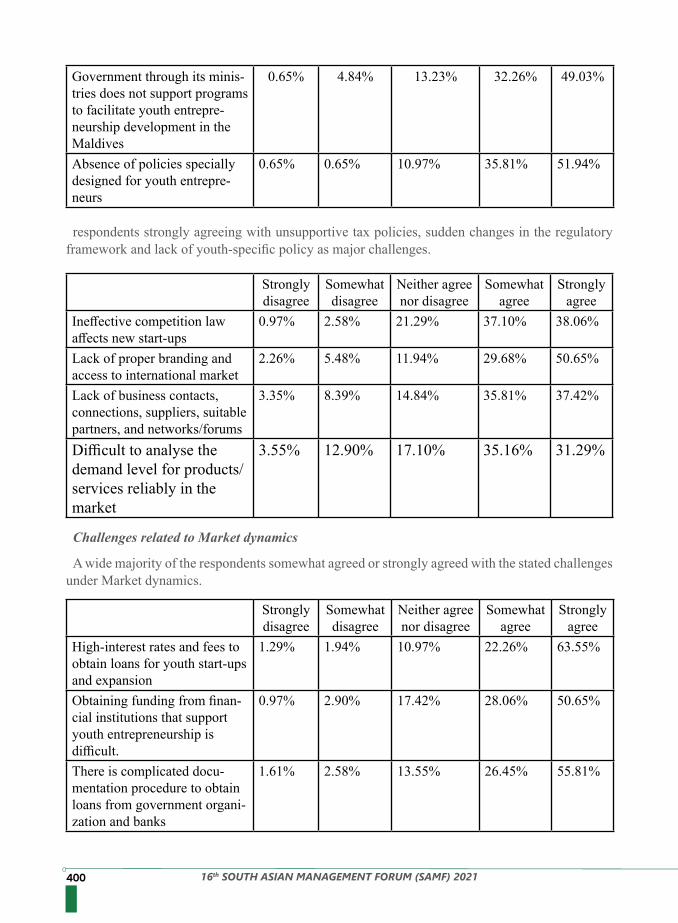
400 16th SOUTH ASIAN MANAGEMENT FORUM (SAMF) 2021
Government through its minis-tries does not support programs to facilitate youth entrepre-neurship development in the Maldives
0.65% 4.84% 13.23% 32.26% 49.03%
Absence of policies specially designed for youth entrepre-neurs
0.65% 0.65% 10.97% 35.81% 51.94%
respondents strongly agreeing with unsupportive tax policies, sudden changes in the regulatory framework and lack of youth-specific policy as major challenges.
Challenges related to Market dynamics
A wide majority of the respondents somewhat agreed or strongly agreed with the stated challenges under Market dynamics.
Strongly disagree
Somewhat disagree
Neither agree nor disagree
Somewhat agree
Strongly agree
Ineffective competition law affects new start-ups
0.97% 2.58% 21.29% 37.10% 38.06%
Lack of proper branding and access to international market
2.26% 5.48% 11.94% 29.68% 50.65%
Lack of business contacts, connections, suppliers, suitable partners, and networks/forums
3.35% 8.39% 14.84% 35.81% 37.42%
Difficult to analyse the demand level for products/services reliably in the market
3.55% 12.90% 17.10% 35.16% 31.29%
Strongly disagree
Somewhat disagree
Neither agree nor disagree
Somewhat agree
Strongly agree
High-interest rates and fees to obtain loans for youth start-ups and expansion
1.29% 1.94% 10.97% 22.26% 63.55%
Obtaining funding from finan-cial institutions that support youth entrepreneurship is difficult.
0.97% 2.90% 17.42% 28.06% 50.65%
There is complicated docu-mentation procedure to obtain loans from government organi-zation and banks
1.61% 2.58% 13.55% 26.45% 55.81%
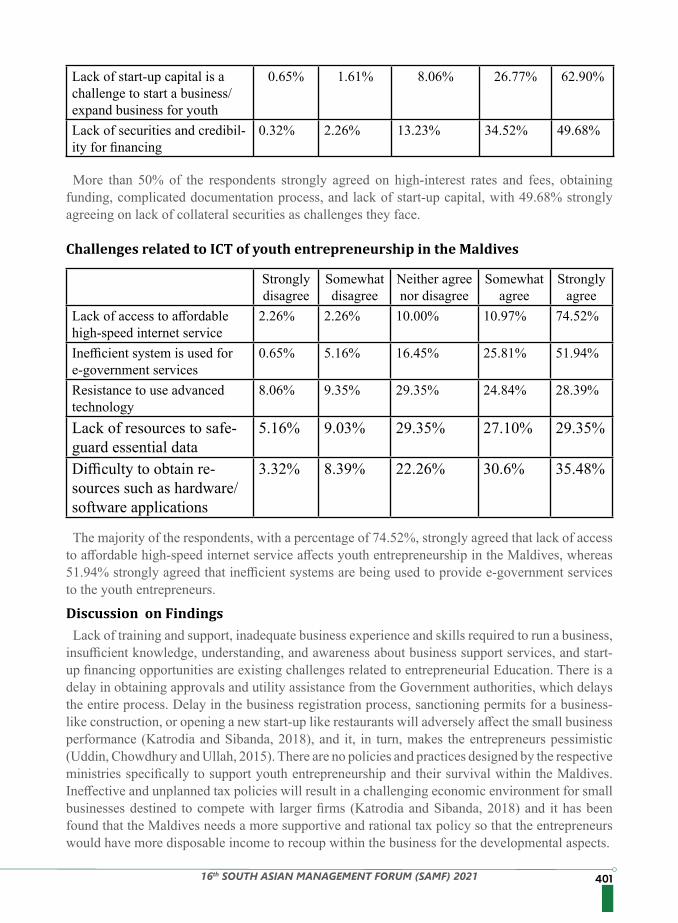
40116th SOUTH ASIAN MANAGEMENT FORUM (SAMF) 2021
Lack of start-up capital is a challenge to start a business/expand business for youth
0.65% 1.61% 8.06% 26.77% 62.90%
Lack of securities and credibil-ity for financing
0.32% 2.26% 13.23% 34.52% 49.68%
More than 50% of the respondents strongly agreed on high-interest rates and fees, obtaining funding, complicated documentation process, and lack of start-up capital, with 49.68% strongly agreeing on lack of collateral securities as challenges they face.
The majority of the respondents, with a percentage of 74.52%, strongly agreed that lack of access to affordable high-speed internet service affects youth entrepreneurship in the Maldives, whereas 51.94% strongly agreed that inefficient systems are being used to provide e-government services to the youth entrepreneurs.
Lack of training and support, inadequate business experience and skills required to run a business, insufficient knowledge, understanding, and awareness about business support services, and start-up financing opportunities are existing challenges related to entrepreneurial Education. There is a delay in obtaining approvals and utility assistance from the Government authorities, which delays the entire process. Delay in the business registration process, sanctioning permits for a business-like construction, or opening a new start-up like restaurants will adversely affect the small business performance (Katrodia and Sibanda, 2018), and it, in turn, makes the entrepreneurs pessimistic (Uddin, Chowdhury and Ullah, 2015). There are no policies and practices designed by the respective ministries specifically to support youth entrepreneurship and their survival within the Maldives. Ineffective and unplanned tax policies will result in a challenging economic environment for small businesses destined to compete with larger firms (Katrodia and Sibanda, 2018) and it has been found that the Maldives needs a more supportive and rational tax policy so that the entrepreneurs would have more disposable income to recoup within the business for the developmental aspects.
Strongly disagree
Somewhat disagree
Neither agree nor disagree
Somewhat agree
Strongly agree
Lack of access to affordable high-speed internet service
2.26% 2.26% 10.00% 10.97% 74.52%
Inefficient system is used for e-government services
0.65% 5.16% 16.45% 25.81% 51.94%
Resistance to use advanced technology
8.06% 9.35% 29.35% 24.84% 28.39%
Lack of resources to safe-guard essential data
5.16% 9.03% 29.35% 27.10% 29.35%
Difficulty to obtain re-sources such as hardware/software applications
3.32% 8.39% 22.26% 30.6% 35.48%
Challenges related to ICT of youth entrepreneurship in the Maldives
Discussion on Findings
402 16th SOUTH ASIAN MANAGEMENT FORUM (SAMF) 2021
Sudden changes in the regulations and lack of transparency in the regulations are creating challenges for the youth entrepreneurs (Uddin, Chowdhury and Ullah, 2015). Besides, lack of ministerial support, high-interest rates, and fees associated with loans and advances are also affecting the Youth. Lack of collateral securities is one of the prominent obstacles faced by Youth, and it, in turn, adversely impacts their credit rating (Uddin, Chowdhury, and Ullah, 2015). A short grace period of bank loans, complicated documentation procedures, lack of start-up capital, lack of access to finance, and low support from Government/Financial institutions exist and adversely impact entrepreneurial growth. The absence of an explicit legal framework to prevent unhealthy competition leads small firms to compete with large firms and they find it challenging to build up supplier connections and find strategic partners to expand the business (Uddin, Chowdhury and Ullah, 2015; Muthuraman and Al Haziazi, 2019). Youth entrepreneurs face discrimination from suppliers and customers regarding trust and confidence, especially during the early stage of operations. They do not have a centralized mechanism to forecast demand and plan accordingly as there is a lack of information transparency. They are facing issues with internet connectivity in terms of accessibility and affordability due to its high cost, which disables them from setting up e-commerce businesses (Lawrence and Tar, 2020). The cost of e-commerce outweighs its benefit here. The e-government services related to business registration and related services are also accounted to be very poor due to the insufficient investment by the respective departments (Edmiston, 2003). Youth entrepreneurs are very IT-friendly, but their old and senior employees are reluctant to get updated with the technological tools and reluctant to participate in the training as well. The research also depicts the difficulty of entrepreneurs in obtaining technical software and other applications which are essential for business functions.
It is crucial for government bodies as they play a significant role in the advancement of youth businesses. The findings help public authorities and independent bodies recognize the flaws of existing policies and practices and identify the areas that require sudden government intervention to enhance youth entrepreneurship. Reducing secretarial hurdles and simplifying the necessary documentation procedures to acquire services from authorities will ease the access to loans provided by government organizations and banks. Competitive policies could be amended to ease the operations of small businesses. In many cases, youth entrepreneurs lack the financial capacity to enlist accountants/consultants, and consequently, they may find it challenging to follow sudden changes in guidelines and regulations. Hence, reducing the frequent change in business regulations will allow businesses to implement plans consistently without affecting them. It undermines the need for transparent regulatory arrangements that will encourage fair practice among youth entrepreneurs. It is fundamental to include youth in policy revision and implementation for prospective youth entrepreneurship development in the country. To enhance Youth’s entrepreneurial skills and abilities, training institutions need to develop training and educational programs that help to invigorate an innovative and entrepreneurial mindset among youngsters. The educational programs could include youth-led training and resources, enterprise education, and a youth council setting. Overall, this research helps government and respective departments recognize and feed on the requirement of a vibrant youth pioneering economy.
Implications of Findings
40316th SOUTH ASIAN MANAGEMENT FORUM (SAMF) 2021
The respondents of this research were youth entrepreneurs who currently operate or had run a business in the past and no prospective entrepreneurs who have faced some challenges but have not yet started up their business. However, the reason for the exclusion of that category is that it may be difficult to get information about the business experience, and there are no statistics available to reach out the prospective entrepreneurs. Sector-wise categorization has not been done for this study to get to know more detailed challenges entrepreneurs face in different sectors such as fast-moving consumer goods, education, tourism, hospitality, etc.
There are still scopes for conducting research in a similar field by incorporating prospective entrepreneurs in the respondents’ portfolios and categorizing the industry sectors while collecting the data. This research has not intended to study the impact of unemployment among the youth of the Maldives and resulted in entrepreneurial choice. Raising unemployment is one of the reasons why people tend to choose entrepreneurship as their source of income (Gawel, 2010). Statistics Maldives (2019) shows that the unemployment rate in the Maldives is 5.3%. Also, there could be some external economic pressure rather than entrepreneurial interest or willingness to lead some people to enter businesses (Korunka et al., 2003). It is an area of research to see the intention of people in the Maldives to start their entrepreneurial ventures in real entrepreneurial affinity or unemployment and resulting financial insecurity.
1. Alam, A. (2019). Youth entrepreneurship: concepts and evidence.2. Asian Development Bank. (2020). Asian Development Outlook 2020 (pp. 40-44). Asian
Development Bank Institute.3. Barba-Sánchez, V., Martínez-Ruiz, M. D. P., & Jiménez-Zarco, A. I. (2007). Drivers, benefits
and challenges of ICT adoption by small and medium sized enterprises (SMEs): A literature review. Problems and Perspectives in Management, 5(1), 103–114.
4. Bjerke, B. (2007). Understanding entrepreneurship. In Understanding Entrepreneurship. Edward Elgar Publishing Limited. https://doi.org/10.4324/9780429402319-11
5. Boateng, G. O., Polytechnic, T., Boateng, A. A., & Bampoe, H. S. (2014). Barriers To Youthful Entrepreneurship in Rural Areas of Ghana. Global Journal of Business Research, 8(3), 109–120.
6. Bolton, B., & Thompson, J. (2004). Entrepreneurs: Talent, Temperament, Technique. In Elsevier Butterworth-Heinemann (2nd ed.). Elsevier Butterworth-Heinemann. https://books.mec.biz/tmp/books/C6P4FQOXVQCMFW6L8N37.pdf
7. Burall, N.A. and Gross, C. (2017) Quantitative Research, Purpose of. In: The SAGE Encyclopedia of Communication Research Methods. Thousand Oaks: . pp. 1378–1380. doi:10.4135/9781483381411.n476.
8. Bushell, B. (2008). Women entrepreneurs in Nepal: What prevents them from leading the sector? Gender and Development, 16(3), 549–564. https://doi.org/10.1080/13552070802465441
9. Canals, L. (2017). Instruments for gathering data. In Instruments for gathering data. In E. Moore & M. Dooly (Eds), Qualitative approaches to research on plurilingual Education (pp. 390–401). Research-publishing.net. https://doi.org/10.14705/rpnet.2017.emmd2016.637
10. Demmke, A. (2017). Thematic Analysis on Youth in the Maldives based on 2014 Population and Housing Census data. https://maldives.unfpa.org/sites/default/files/pub-pdf/unfpa_
Limitations
Future Research
References
404 16th SOUTH ASIAN MANAGEMENT FORUM (SAMF) 2021
youth_analysis_web %281%29_0.pdf11. Duncombe, R., & Heeks, R. (2002). Enterprise across the digital divide: Information systems
and rural microenterprise in Botswana. Journal of International Development, 14(1), 61–74. https://doi.org/10.1002/jid.869
12. Edmiston, K. (2003). State And Local E-Government. The American Review Of Public Administration, 33(1), 20-45. https://doi.org/10.1177/0275074002250255
13. Fatoki, O., & Chindoga, L. (2011). An Investigation Into the Obstacles To Youth Entrepreneurship in South Africa. International Business Research, 4(2), 161–169. https://doi.org/10.5539/ibr.v4n2p161
14. Fosu, S., Danso, A., Ahmad, W., & Coffie, W. (2016). Information asymmetry, leverage and firm value: Do crisis and growth matter? International Review of Financial Analysis, 46, 140–150. https://doi.org/10.1016/j.irfa.2016.05.002
15. Furuholt, B., & Orvik, T. U. (2006). Implementation of Information Technology in Africa: Understanding and Explaining the Results of Ten Years of Implementation Effort in a Tanzanian Organization. Information Technology for Development, 12(1), 45–62. https://doi.org/10.1002/itdj
16. Gawel, A. (2010). The Relationship between Entrepreneurship and Unemployment in the Business Cycle. JOURNAL OF INTERNATIONAL STUDIES, 3(1), 59-69. https://doi.org/10.14254/2071-8330.2010/3-1/7
17. Geraldine, C. K. L., Selvadurai, S., & Hamid, A. B. D. (2011). Youth Entrepreneurship Characteristics and Challenges Faced by Youth Entrepreneurs in Malaysia. Malaysian Journal of Youth Studies, 5, 1–38.
18. Gribben, A. A. (2018). Tackling policy frustrations to youth entrepreneurship in the Western Balkans. Small Enterprise Research, 25(2), 183–191. https://doi.org/10.1080/13215906.2018.1479294
19. Herringtion, M., Kew, J., & Kew, P. (2010). Tracking Entrepreneurship in South Africa: a Gem Perspective. Graduate School of Business, University of Cape Town.
20. Honig, B. (1998). What Determines Success? Examining the Human, Financial, and Social Capital of Jamaican Microentrepreneurs. Journal of Business Venturing, 13(5), 371–394. https://doi.org/10.1016/S0883-9026(97)00036-0
21. Hyman, E. L., & Dearden, K. (1998). Comprehensive impact assessment systems for NGO microenterprise development programs. World Development, 26(2), 261–276. https://doi.org/10.1016/S0305-750X(97)10022-5
22. Katrodia, A., & Sibanda, R. (2018). Challenges Experienced by Young Entrepreneurs Entering the Small and Medium Enterprise Sector (SME) In Rajkot Region, Gujarat-India. Academy of Entrepreneurship Journal, 24(4), 1–14.
23. Kothari, C. R. (2004). Research methodology : methods & techniques (2nd ed.). New Age International (P) Ltd.
24. Korunka, C., Frank, H., Lueger, M. and Mugler, J. (2003) The Entrepreneurial Personality in the Context of Resources, Environment, and the Startup Process—A Configurational Approach. Entrepreneurship Theory and Practice. 28 (1), pp. 23–42. doi:10.1111/1540-8520.00030.
25. La Porta, R., Lopez-de-Silanes, F., & Shleifer, A. (1999). Corporate ownership around the world. The Journal of Finance, 54(2), 471–517. https://doi.org/10.1111/0022-1082.00115
26. Lawrence, J., & Tar, U. (2020). Barriers to e-commerce in developing countries. Information, Society And Justice, 3(1), 23-35. https://doi.org/ISSN 1756-1078
40516th SOUTH ASIAN MANAGEMENT FORUM (SAMF) 2021
27. Lichtenstein, G. A., & Lyons, T. S. (2001). The entrepreneurial development system: Transforming business talent and community economies. Economic Development Quarterly, 15(1), 3–20. https://doi.org/10.1177/089124240101500101
28. Mehari, A. T., & Belay, C. F. (2017). Challenges and prospects of entrepreneurship development and job creation for Youth unemployed: evidence from Addis Ababa and Dire Dawa city administrations, Ethiopia. Journal of Innovation and Entrepreneurship, 6(1). https://doi.org/10.1186/s13731-017-0070-3
29. Muthuraman, D. S., & Al Haziazi, D. M. (2019). Entrepreneurial Growth: Challenges to Young Omani Entrepreneurs. International Journal of Business and Applied Social Science, 5(7). https://doi.org/10.33642/ijbass.v5n7p10
30. Muthuraman, S., Subramanian, K., Al-Haziazi, M., & Sherimon, P. C. (2017). Entrepreneurial intent of prospective graduates in Sultanate of Oman. Omani Journal of Applied Sciences (OJAS) Annual Refereed Scientific Journal, 6(1), 653–661.
31. Nieman GH, N. (2009). Entrepreneurship. A South African Perspective (2nd ed.). Van Schaik.32. Okirigiti, C. A., & Raffey, M. A. (2015). Challenges Facing Youth Entrepreneurs in Slums
in Kenya: A case of Kisumu Ndogo Slums in Eldoret Municipality Kenya. European Open Business & Management Journal, 1(1), 1–10. http://eurpub.com/Journals.phphttp://eurpub.com/Journals.php%0Ahttp://eurpub.com/Journals.phphttp://eurpub.com/Journals.php%0Ahttp://eurpub.com/Journals.php
33. Okundaye, K., Fan, S. K., & Dwyer, R. J. (2019). Impact of information and communication technology in Nigerian small-to-medium-sized enterprises. Journal of Economics, Finance and Administrative Science, 24(47), 29–46. https://doi.org/10.1108/JEFAS-08-2018-0086
34. Pillania, R. K., Lall, M., & Sahai, S. (2010). Motives for starting business: Indian women entrepreneurs perspectives. International Journal of Indian Culture and Business Management, 3(1), 48. https://doi.org/10.1504/ijicbm.2010.029528
35. Premaratne, S. P., & Kudaliyanage, G. (2016). Issues, Challenges, and Prospects of Women-owned Small and Medium Scale Enterprises in the Maldives. International Journal of Scientific and Research Publications, 6(9), 771–781. https://www.theseus.fi/handle/10024/95947
36. Pretorius, M., & Shaw, G. (2004). Business plans in bank decision-making when financing new ventures in South Africa. South African Journal of Economic and Management Sciences, 7(2), 221–241. https://doi.org/10.4102/sajems.v7i2.1377
37. Reierson, D. J., Coons, S. J., & Plaza, C. M. (2008). SPECIAL ARTICLES Best Practices for Survey Research Reports: A Synopsis for Authors and Reviewers. American Journal of Pharmaceutical Education, 72(1).
38. Sanders, C. K. (2002). The impact of microenterprise assistance programs: A comparative study of program participants, nonparticipants, and other low-wage workers. Social Service Review, 76(2), 321–339. https://doi.org/10.1086/339664
39. Schreiner, M., & Woller, G. (2003). Microenterprise development programs in the United States and in the developing world. World Development, 31(9), 1567–1580. https://doi.org/10.1016/S0305-750X(03)00112-8
40. Shane, S. (2003). A general theory of entrepreneurship: the individual-opportunity nexus. Edward Elgar.
41. Shepherd, D. A., & DeTienne, D. R. (2005). Prior Knowledge, Potential Financial Reward,
406 16th SOUTH ASIAN MANAGEMENT FORUM (SAMF) 2021
and Opportunity Identification. Entrepreneurship Theory and Practice: SAGE Journals, 29, 91–112.
42. Showkat, N., & Parveen, H. (2017). Probability and Non Probability Sampling. Asian Research Journal Of Business Management, 4(4). https://doi.org/10.24214/arjbm/4/4/113124
43. SITOULA, T. (2015). Challenges and Prospects of Youth Entrepreneurship in Kathmandu. November, 1–123.
44. Statisticsmaldives (2019) Available from: http://statisticsmaldives.gov.mv/nbs/wp-content/uploads/2020/09/Employment-Indicators-Infographics-v3.pdf [Accessed 24 December 2020].
45. Uddin, M. M., Chowdhury, M. M., & Ullah, M. M. (2015). Barriers and Incentives for Youth Entrepreneurship Start-Ups: Evidence from Bangladesh. Global Journal of Management and Business Research, 15(4), 38–49.
46. UNDP Maldives. (2014). Maldives Youth Entrepreneurship Programme ‘GET SET MV’ launched. UNDP in the Maldives. Retrieved 17 February 2021, from https://www.mv.undp.org/content/maldives/en/home/presscenter/articles/2014/11/17/maldives-youth-entrepreneurship-programme-get-set-mv-launched.html.
47. UNCTAD. (2015). Policy guide on youth entrepreneurship.
40716th SOUTH ASIAN MANAGEMENT FORUM (SAMF) 2021
Women entrepreneurs represent the fastest-growing category of entrepreneurs with a growing number of start-ups receiving funding from investors. Although the motivation to pursue entrepreneurial start-up initiatives may be different, they may end up in different outcomes. Despite the significant contribution of women entrepreneurs to the economy of the nation, there are very few research studies focussing on their entrepreneurial journey. This paper is a response to the call for research that is needed in women’s entrepreneurship in India and uses a case-based approach to understand what drives women toward entrepreneurship and if entrepreneurship was seen as a necessity or an opportunity in their entrepreneurial journey, and the key factors/drivers which impacted the growth of the enterprises are studied. About 10 tech start-ups led by women are studied to understand the motive and key contributing drivers including the pandemic. Theoretical and Policy implications are discussed.
Srinivas JosyulaAssociate Professor, Indian Institute of Management, IndiaSita Vanka,Professor, School of Management Studies, &Joint Professor, Centre for Women’s Studies,University of Hyderabad, Hyderabad,Telangana, India.
Globally, the entrepreneurial movement is gaining ground and has emerged as a developmental inspiration (LaVan and Murphy, 2007; Maden, 2015) and is embedded in the concepts of innovation and economic development. The recent policy impetus has given momentum to this initiative leading to a start-up revolution, which has changed the course of entrepreneurship, altered the way it has been defined, and set new paradigms of devel-opment in economic, social, and environmental spheres. The entrepreneurial boom is further gaining more prominence in the developing world, where women are leading the brigade and evidence confirms that they represent the fastest-growing category of entrepreneurship and have been receiving increased attention from scholars and policymakers, with a growing number of start-ups receiving funding from investors (Bardasi et.al, 2011).The spirit of entrepreneurship and enterprising nature indeed exists in all human beings irrespective of gender. According to Cabrera and Mauricio (2017), the economic growth of the nation would be lop-sided without the involvement of women in entrepreneurial activities, as women constitute approximately half of the population, and the domain of entrepreneurship is not confined to any particular gender.
The World Bank acknowledged the role of women-owned and led businesses as strong catalysts for economic growth, improving the lives of everyone and having a meaningful impact on the labor force, economic growth, and the well-being of their societies. (www. worldbank.org). Literature shows a positive correlation between entrepreneurship (measured as the number of enterprises/ start-ups) and economic growth. (Westlund, 2011). The women are almost equal in number but there remains a wide disparity in their economic status across the world. Therefore, there is a need to unearth the reasons for this disparity and identify measures to promote the status of women. India is no exception to this fact.
Introduction
Abstract
WOMEN-LED TECH START-UPS IN INDIA – A CASE-BASED STUDY
408 16th SOUTH ASIAN MANAGEMENT FORUM (SAMF) 2021
Start-up entrepreneurship is crucial because it brings innovation, new jobs, and competitive dynamics into the business environment and enterprises. Global data shows that start-ups are creating more jobs in nations than the large companies or enterprises. Most of the technology giant companies outsource their tasks to start-ups. Rapid advancements in technology and innovation have led to a rise in tech start-ups. India ranks fourth with 21 unicorns in the global unicorn ranking and holds 20th position in the global start-up ecosystem (Business Line, 2021), thus highlighting the need to build, nurture, and develop a scalable ecosystem. Evidence confirms that start-ups have been receiving increased attention across the country, with a growing number of start-ups receiving funding from investors (Statistica, 2020) However, the mechanisms by which entrepreneurship exerts its positive influence are not obvious. The net result of start-ups on employment or GDP can be negative, at least in the short run, since efficientnew companies may lead to closures of less efficient ones. Economic entrepreneurship in the form of start-ups creates unobserved supply-side effects on the firm level (Fritsch & Mueller 2004) and entrepreneurial social capital on the community level (Westlund & Bolton 2003) thus highlighting the need to investigate the start-up ecosystem. Further, evidence also indicates that the percentage of female entrepreneurs is significantly less compared to their male counterparts. This imbalance can be seen even in the funding. In Europe, only 3% of the funding was secured by women against 90.8% of all male founders (EIT Urban Mobility, 2021). Crunchbase reports that female-founded start-ups have seen a 27% decrease in venture funding over the same period. (Crunchbase, 2021).
The situation in India is no different. Women make up almost half of the population in India. India has a total of 58.5 million entrepreneurs, out of which 8.05 million, comprising only 14%, are women entrepreneurs by 2020. ( www.economictimes.com). In addition, women-founded tech start-ups in India declined by 24% in 2020 due to the pandemic. (Makers India, 2020) Despite their contribution, there are very few research studies that had been carried out on women entrepreneurs (Ahl, 2006; Anggadwita et al., 2017). Further, literature on entrepreneurship in emerging markets appears limited to their contribution to mainstream entrepreneurship theory (Pathak and Laplume, 2014). It thus becomes imperative to examine the start-up ecosystem along with the contribution of female founders to the start-up revolution in India. Given this gap, a case-based approach was followed to explore the role of women-led tech start-ups in India. The study seeks to highlight their motivation, experience, opinions, and perceptions on their entrepreneurial journey in the technology space.
Women entrepreneurs are often prevented from running competitive businesses by their relatively low education and skill levels, which generally limit their access to various support services. Despite many shortcomings and constraints, women have been able to create their enterprises, even in countries where economic decisions would normally be taken by the male head of the household. India is a good example of this phenomenon (World Bank, 1995). Evidence suggests that the change of a woman in India, from the traditional role of a homemaker to the modern role of an entrepreneur is slowly but surely taking place on account of several factors.
Recent research focused on the assessment of the policies and schemes undertaken by the government to empower women through entrepreneurship and argued for a gender
The Context
The Context
40916th SOUTH ASIAN MANAGEMENT FORUM (SAMF) 2021
perspective (Munshi, et.al, 2011) to stop women from portraying women’s entrepreneurship negatively ( Gupta, 2013). The need for a regular assessment ( Bharti, 2014) laments that women are still at a nascent stage with only 7.36% of all enterprises owned and managed by them, and argues for better participation from women ( Garg and Agarwal, 2017). Evidence also reveals studies assessing policies in Indian states (Agarwal and Lenka, 2018). Based on secondary data, research evidences a bird’s eye view of the literature on entrepreneurship, particularly on female entrepreneurship, globally as well as with a specific focus on India. The challenges and the problems encountered by women were also the focus of the studies (Anjana Bose, 2020) along with the social and cognitive aspects in some studies. ( Arafat, et.al, 2021). Studies also highlighted the micro and macro elements (Scenholm et. al, 2013) which explained the variation in different countries and the reasons for variation in the entrepreneurship level including India(Choudhury et. al, 2019). However, recognizing the power of technology, women venturing into the science and technology domain for a novel career is a recent phenomenon (Etzkowitz, 2013), which was recently captured by studies on women founders in high tech incubators(Gupta and Etzkowitz, 2021). The literature scan thus reveals that women venturing into the technology domain is recent, but a welcome phenomenon, worth investigating (Agarwal and Lenka, 2017) with women pivoting their business models post- COVID (Manalova et.al. 2020) merging opportunity and necessity-based women entrepreneurship in the context of business growth (Sindwani and Dhawan, 2020). Yet several questions remain partly answered (Jennings and Brush, 2013; Kuratko and Morris, 2018) despite a growing body of knowledge on the subject.
A Case-based approach was followed because of the potential advantage that it may accrue to entrepreneurs who have success stories/ lessons giving the potential individuals a real example of encouraging them to the passion-filled, thriving business world. This might trigger people to see opportunities around them from a different perspective. Evidence also demonstrates illustrative or educational stories but is not inspirational (Sellers, 2014). Literature relating to women-led tech start-ups also did not evidence clear boundaries between the phenomenon and the context (Yin 2002). This paper addresses this deficiency and used both primary and secondary data to examine the women-led tech start-ups in India. About 8 women-led tech start-ups were studied, which was supplemented by interviewing 2 tech start-ups led by women across India. A discussion included demographic data and their opinions and perceptions on their motivation, opportunity identification, and evaluation challenges faced at different stages of the lifecycle of their ventures along with the impact of the pandemic and plans for the future. The mitigation plans and their accomplishment in the growth of the enterprise were also discussed. In addition, the demographic data in terms of their age, academic qualification, experience, and background along with some details about their company, type of the company, location, year of establishment, sector, and training received were collected. However, for privacy purposes, the names of the entrepreneurs were disguised purposely. While the demographic data was presented in a tabular format, the opinions and perceptions were analyzed to achieve the objectives of the study.
The study aimed at examining their opinions and perceptions on their entrepreneurial journey. Hence, the responses from the women entrepreneurs were content analyzed. The information about demographic data was presented descriptively.
Methodology
Analysis
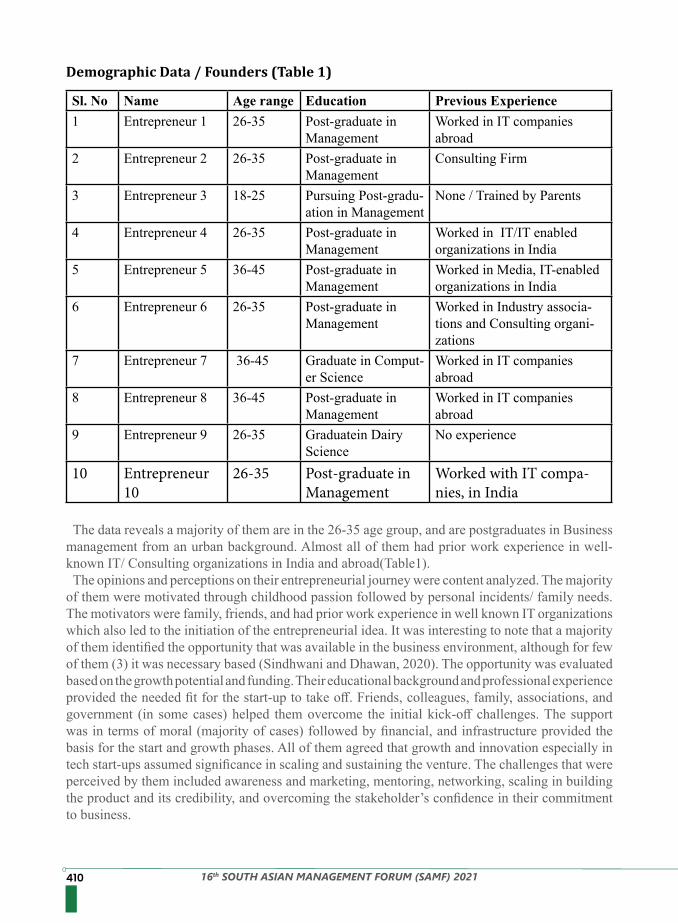
410 16th SOUTH ASIAN MANAGEMENT FORUM (SAMF) 2021
Demographic Data / Founders (Table 1)
Sl. No Name Age range Education Previous Experience1 Entrepreneur 1 26-35 Post-graduate in
Management Worked in IT companies abroad
2 Entrepreneur 2 26-35 Post-graduate in Management
Consulting Firm
3 Entrepreneur 3 18-25 Pursuing Post-gradu-ation in Management
None / Trained by Parents
4 Entrepreneur 4 26-35 Post-graduate in Management
Worked in IT/IT enabled organizations in India
5 Entrepreneur 5 36-45 Post-graduate in Management
Worked in Media, IT-enabled organizations in India
6 Entrepreneur 6 26-35 Post-graduate in Management
Worked in Industry associa-tions and Consulting organi-zations
7 Entrepreneur 7 36-45 Graduate in Comput-er Science
Worked in IT companies abroad
8 Entrepreneur 8 36-45 Post-graduate in Management
Worked in IT companies abroad
9 Entrepreneur 9 26-35 Graduatein Dairy Science
No experience
10 Entrepreneur 10
26-35 Post-graduate in Management
Worked with IT compa-nies, in India
The data reveals a majority of them are in the 26-35 age group, and are postgraduates in Business management from an urban background. Almost all of them had prior work experience in well-known IT/ Consulting organizations in India and abroad(Table1).The opinions and perceptions on their entrepreneurial journey were content analyzed. The majority
of them were motivated through childhood passion followed by personal incidents/ family needs. The motivators were family, friends, and had prior work experience in well known IT organizations which also led to the initiation of the entrepreneurial idea. It was interesting to note that a majority of them identified the opportunity that was available in the business environment, although for few of them (3) it was necessary based (Sindhwani and Dhawan, 2020). The opportunity was evaluated based on the growth potential and funding. Their educational background and professional experience provided the needed fit for the start-up to take off. Friends, colleagues, family, associations, and government (in some cases) helped them overcome the initial kick-off challenges. The support was in terms of moral (majority of cases) followed by financial, and infrastructure provided the basis for the start and growth phases. All of them agreed that growth and innovation especially in tech start-ups assumed significance in scaling and sustaining the venture. The challenges that were perceived by them included awareness and marketing, mentoring, networking, scaling in building the product and its credibility, and overcoming the stakeholder’s confidence in their commitment to business.
41116th SOUTH ASIAN MANAGEMENT FORUM (SAMF) 2021
Conclusion
References
Some of them perceived complexity in running a business, building a team, lack of business models in tech start-ups, etc. Success, according to them is recognition, discovering passion, bridging the gender and diversity gap, the ability to use emerging technologies/ leverage the digital boom, and contributing to the start-up ecosystem in India. Surprisingly enough the pandemic has increased their reach in business. Two (2) of them, however, revealed that they were affected by the pandemic and had a second business to tide over the situation. Having enjoyed autonomy and equality in their entrepreneurial journey and putting the venture on the growth path, in contrast to the results in the literature, a beginning is being made by women in acquiring related start-ups, after achieving success in their enterprises (Roy et al., 2021).
This study attempted to highlight the entrepreneurial experience of women in the high-tech space in India. Despite, a small proportion of women entrepreneurs in the entrepreneurial ecosystem, coupled with the gender dynamics among the young, educated middle-class women in India, the results of the study demonstrated success in the male-dominated entrepreneurial domain. Women are slowly but surely negotiating their identity in the tech start-up space (Gupta and Etzaowitz, 2021). The findings are significant in the Indian context, and not only to role model other women to emulate the success but also provide insights to the policymakers to encourage more women to participate, to enhance economic growth and international competitiveness (OECD, 2010), as equal partners through innovation and entrepreneurship. Their participation is important in tech start-ups for potential novel careers and overcoming the gender constraints, paving the way for self-reliance leading to Atmanirbhar Bharat, a program to encourage people to take up entrepreneurship. Although the study is case-based, drawing from both primary and secondary sources, it contributed to the showcasing of the risk-taking ability of women in the growing tech start-up space in India against the gendered expectations of the Indian socio-cultural context, using the opportunity based approach (Sindhwani and Dhawan, 2020). Future research could further develop these initial findings by conducting similar studies using larger samples and documenting the real-time entrepreneurial experiences of women in the tech startup space in India and South Asian countries.
1. Lenka, U. and Agarwal, S. (2017), “Role of Women entrepreneurs and NGOs in promoting entrepreneurship: case studies from Uttarakhand, India”, Journal of Asia Business Studies, Vol. 11 No. 4, pp. 451-465.2. LaVan, H. and Murphy, P.J. (2007), “Southeast Asian culture, human development, and business
competitiveness”, Journal of Asia Business Studies, Vol. 2 No. 1, pp. 14-22.3. Saumya Sindhwania and Ankita Dhawan, 2020: Women Entrepreneurs In Emerging Markets:
Are Opportunity And Necessity Based Women Entrepreneurs Any Different? Multidisciplinary Business Review. Rev. | Vol. 14, N 1, 2021, pp. 108-119,4. Bardasi, E., Sabarwal, S., & Terrell, K. (2011). How do female entrepreneurs perform? Evidence
from three developing regions. Small Business Economics, 37(4), 417-4415. Cabrera, E.M. and Mauricio, D. (2017), “Factors affecting the success of women’s
entrepreneurship: a review of literature”, International Journal of Gender and Entrepreneurship, Vol. 9 No. 1, pp. 31-65.6. Agarwal, Sucheta & Lenka, Usha. (2018). Why research is needed in women entrepreneurship
in India: A viewpoint. International Journal of Social Economics. 45. 10.1108/IJSE-07-2017-0298.
412 16th SOUTH ASIAN MANAGEMENT FORUM (SAMF) 2021
7. Cabrera, E.M. and Mauricio, D. (2017), “Factors affecting the success of women’s entrepreneurship: a review of literature”, International Journal of Gender and Entrepreneurship, Vol. 9 No. 1, pp. 31-658. The World Bank ( 2014) Voice Agency and Empowering women and girls for shared prosperity. 9. Westlund, Hans & Olsson, Amy. (2011). Economic Entrepreneurship, Start-ups and their
Effects on Local Development: The Case of Sweden.10. List of Top Unicorn Start-ups in India | Business Line, Nov 24, 202111. Statistica 2020, www.statistica.com12. Fritsch, M., & Mueller, P. (2004). Effects of new business formation on regional development
over time. Regional Studies, 38(8), 961-975.13. (Westlund & Bolton 2003) : Westlund, Hans & Bolton, Roger. (2003). Local Social Capital
and Entrepreneurship. Small Business Economics. 21. 77-113. 10.1023/A:1025024009072.14. EIT URBAN MOBLITY, Start-up Investment. 17 Feb 2021 (https://www.eiturbanmobility.
eu/eit-urban-moblity-startup-investment-2021/)15. Crunchbase report, Global VC Funding To Female Founders Dropped Dramatically This Year.
December 21, 2020 (https://news.crunchbase.com/news/global-vc-funding-to-female-founders/)16.Women Entrepreneurship: Unsung saga of economic warriors. ETGovernment
February 01,2020, (https://government.economictimes.indiatimes.com/news/economy/women-entrepreneurship-unsung-saga-of-economic-warriors/73825285)17. Makers India (2020)Women-founded tech start-ups in India. Makers India Report Friday,
Oct 30, 2020 (https://www.thenewsminute.com/article/women-founded-tech-startups-india-see-24-decline-funding-h1-2020-136503)18. Ahl, H. (2006). Why research on women entrepreneurs needs new direction. Entrepreneurship
Theory & Practice, 30, 595–621 19. Anggadwita, G., Ramadani, V, D.T. Alamanda, V. Ratten and M. Hashani ( 2017) Socio-
cultural environments and emerging economy entrepreneurship- Women Entrepreneurs in Indonesia. Journal of Entrepreneurship in Emerging Economies. 6th March, 2017. DOI:10.1108/JEEE-03-2016-001120. Pathak,S , Laplume, AO, (2014) Entrepreneurship in Transition economies – The Role of
corruption and individual attributes. The Journal of Balkan and Near Eastern Studies. Vol. 17 ( 4) , 427-44621. World Bank Report (1995) Workers in an Integrated World. New York: Oxford University
Press.22. Sucheta Agarwal and Usha Lenka, (2018) Why research is needed in women entrepreneurship
in India: A viewpoint. International Journal of Social Economics 45(1), DOI: 10.1108/IJSE-07-2017-029823. Bharti, N. (2014). Financial System Approaches to Microenterprise Development: A
Comparison of SHG Bank Linkage and MFI Model in Maharashtra. International Journal of Rural Management, 10(2), 121-145.24. Munshi, S., Munshi, A., & Singh, V. P. (2011). A Study on Trends Visible in Women
Entrepreneur in India and Globally. Asia Pacific Business Review,7(3), 155-166. 25. Gupta, D. D. (2013). The effect of gender on women-led small enterprises: The case of India.
South Asian Journal of Business and Management Cases, 2(1), 61-75.26. Anjana Bose, ( 2019) A Study of Women Entrepreneurs in India. International Journal of
Management (IJM) Volume 10, Issue 4, July-August 2019, pp. 132–140.
41316th SOUTH ASIAN MANAGEMENT FORUM (SAMF) 2021
27. S. Garg and Parul Agarwal, (2017) Problems and Prospects of Women Entrepreneurship A Review of Literature. IOSR Journal of Business and Management. DOI- 10.9790/487x-1901065560. 28. Report of the UNDP (2004) Unleashing Entrepreneurship- Making Business work for the
poor. New York: USA.29. Mohd. Yasir Arafat, Javed Ali and Anil Kumar Dwivedi, ( 2021) Social and Cognitive
Aspects of Women Entrepreneurs: Evidence from India, Vikalpa, May 28, 2021, https://doi.org/10.1177/0256090921101545730. Chaudhuri, S., Ghosh, R. and Abichandani, Y. (2020), “Exploring the risky terrain of
entrepreneurship with support from developmental relationships: narratives from Indian women entrepreneurs”, Advances in Developing Human Resources, Vol. 22 No. 2, pp. 137-14931. Etzkowitz, H. (2013), “Research groups as ‘quasi-firms’: The invention of the entrepreneurial
university”, Research Policy, Vol. 32 No. 1, pp. 109-12132. Gupta, Namrata, and Etzkowitz, H. (2021) Women founders in a high-tech incubator:
negotiating entrepreneurial identity in the Indian socio-cultural context. International Journal of Gender and Entrepreneurship. Vol. 32 (4).33. Agarwal, S. and Lenka, U. (2018), “Why research is needed in women entrepreneurship in
India: a viewpoint”, International Journal of Social Economics, Vol. 45 No. 7, pp. 1042-1057, DOI: 10.1108/ IJSE-07-2017-0298. 34. Manalova, Tatiana, Brush CG, Edelman L.F, Elam, A (2020) Pivoting to Stay the Course –
How woman entrepreneurs take advantage of opportunities created by the Covid 19 pandemic. International Small Business Journal Research in Entrepreneurship.35. Sindwani, Soumya and Dhawan, Ankita (2020) Women Entrepreneurs in Emerging markets-
Are Opportunity and necessity Based Women any different? Multidisciplinary Business. Review. Vol. 14, N° 1, 2021, pp. 108-119.36. Jennings, JE, and Brush, C (2013) Research on Women Entrepreneurs- Challenges to the
broader entrepreneurship literature. The Academy of Management Annals, Vol. 7 (1) 37. Sellers, K.D.(2014) From start-up to success- An entrepreneurial Case Study. Unpublished
thesis https:// dc.etsu.edu/ honors/242.38. Yin, R.K. (2002) Applications of Case Study Research. Sage Publications, Thousand Oaks,
22-28. 39. Roy, Subhadip & Mohapatra, Subhalaxmi & Banerjee, Dina. (2021). I mean business:
exploring women entrepreneurs’ journey in India from an emancipation perspective. Journal of Entrepreneurship in Emerging Economies. ahead-of-print. 10.1108/JEEE-10-2020-0357.40. Organization for Economic Cooperation and Development (2010) Education at a Glance.
Paris: France, p.469
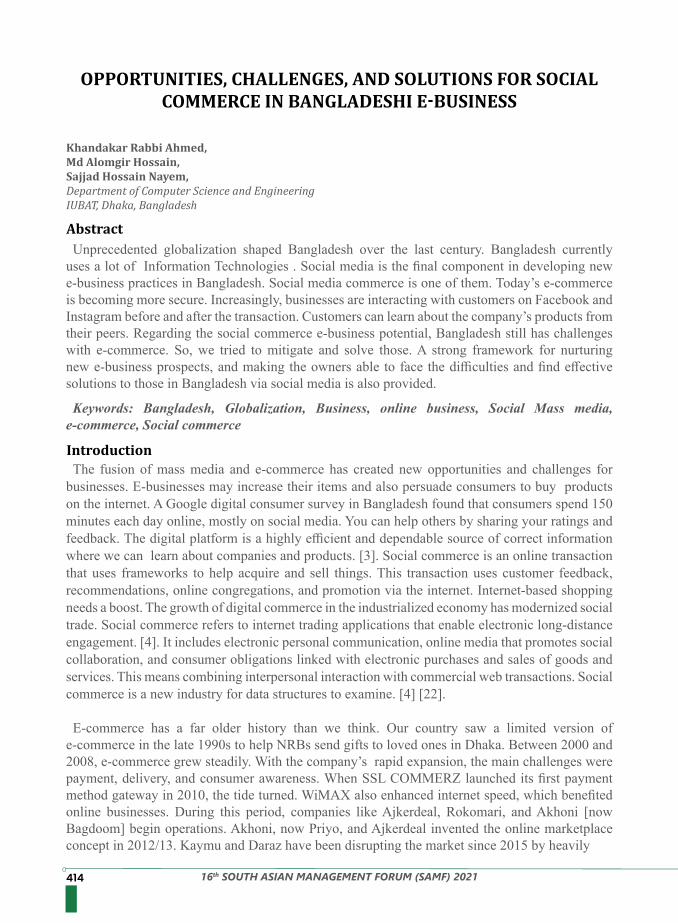
414 16th SOUTH ASIAN MANAGEMENT FORUM (SAMF) 2021
Unprecedented globalization shaped Bangladesh over the last century. Bangladesh currently uses a lot of Information Technologies . Social media is the final component in developing new e-business practices in Bangladesh. Social media commerce is one of them. Today’s e-commerce is becoming more secure. Increasingly, businesses are interacting with customers on Facebook and Instagram before and after the transaction. Customers can learn about the company’s products from their peers. Regarding the social commerce e-business potential, Bangladesh still has challenges with e-commerce. So, we tried to mitigate and solve those. A strong framework for nurturing new e-business prospects, and making the owners able to face the difficulties and find effective solutions to those in Bangladesh via social media is also provided.
Keywords: Bangladesh, Globalization, Business, online business, Social Mass media, e-commerce, Social commerce
Khandakar Rabbi Ahmed,Md Alomgir Hossain, Sajjad Hossain Nayem, Department of Computer Science and EngineeringIUBAT, Dhaka, Bangladesh
The fusion of mass media and e-commerce has created new opportunities and challenges for businesses. E-businesses may increase their items and also persuade consumers to buy products on the internet. A Google digital consumer survey in Bangladesh found that consumers spend 150 minutes each day online, mostly on social media. You can help others by sharing your ratings and feedback. The digital platform is a highly efficient and dependable source of correct information where we can learn about companies and products. [3]. Social commerce is an online transaction that uses frameworks to help acquire and sell things. This transaction uses customer feedback, recommendations, online congregations, and promotion via the internet. Internet-based shopping needs a boost. The growth of digital commerce in the industrialized economy has modernized social trade. Social commerce refers to internet trading applications that enable electronic long-distance engagement. [4]. It includes electronic personal communication, online media that promotes social collaboration, and consumer obligations linked with electronic purchases and sales of goods and services. This means combining interpersonal interaction with commercial web transactions. Social commerce is a new industry for data structures to examine. [4] [22].
E-commerce has a far older history than we think. Our country saw a limited version of e-commerce in the late 1990s to help NRBs send gifts to loved ones in Dhaka. Between 2000 and 2008, e-commerce grew steadily. With the company’s rapid expansion, the main challenges were payment, delivery, and consumer awareness. When SSL COMMERZ launched its first payment method gateway in 2010, the tide turned. WiMAX also enhanced internet speed, which benefited online businesses. During this period, companies like Ajkerdeal, Rokomari, and Akhoni [now Bagdoom] begin operations. Akhoni, now Priyo, and Ajkerdeal invented the online marketplace concept in 2012/13. Kaymu and Daraz have been disrupting the market since 2015 by heavily
Introduction
Abstract
OPPORTUNITIES, CHALLENGES, AND SOLUTIONS FOR SOCIAL COMMERCE IN BANGLADESHI E-BUSINESS
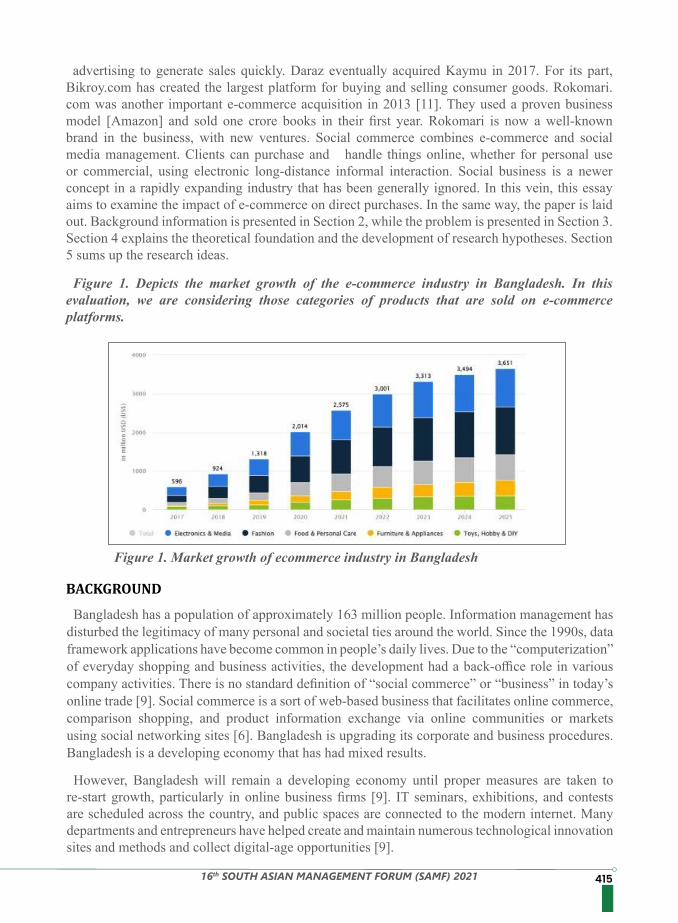
41516th SOUTH ASIAN MANAGEMENT FORUM (SAMF) 2021
Bangladesh has a population of approximately 163 million people. Information management has disturbed the legitimacy of many personal and societal ties around the world. Since the 1990s, data framework applications have become common in people’s daily lives. Due to the “computerization” of everyday shopping and business activities, the development had a back-office role in various company activities. There is no standard definition of “social commerce” or “business” in today’s online trade [9]. Social commerce is a sort of web-based business that facilitates online commerce, comparison shopping, and product information exchange via online communities or markets using social networking sites [6]. Bangladesh is upgrading its corporate and business procedures. Bangladesh is a developing economy that has had mixed results.
However, Bangladesh will remain a developing economy until proper measures are taken to re-start growth, particularly in online business firms [9]. IT seminars, exhibitions, and contests are scheduled across the country, and public spaces are connected to the modern internet. Many departments and entrepreneurs have helped create and maintain numerous technological innovation sites and methods and collect digital-age opportunities [9].
advertising to generate sales quickly. Daraz eventually acquired Kaymu in 2017. For its part, Bikroy.com has created the largest platform for buying and selling consumer goods. Rokomari.com was another important e-commerce acquisition in 2013 [11]. They used a proven business model [Amazon] and sold one crore books in their first year. Rokomari is now a well-known brand in the business, with new ventures. Social commerce combines e-commerce and social media management. Clients can purchase and handle things online, whether for personal use or commercial, using electronic long-distance informal interaction. Social business is a newer concept in a rapidly expanding industry that has been generally ignored. In this vein, this essay aims to examine the impact of e-commerce on direct purchases. In the same way, the paper is laid out. Background information is presented in Section 2, while the problem is presented in Section 3. Section 4 explains the theoretical foundation and the development of research hypotheses. Section 5 sums up the research ideas.
Figure 1. Depicts the market growth of the e-commerce industry in Bangladesh. In this evaluation, we are considering those categories of products that are sold on e-commerce platforms.
Figure 1. Market growth of ecommerce industry in Bangladesh
BACKGROUND
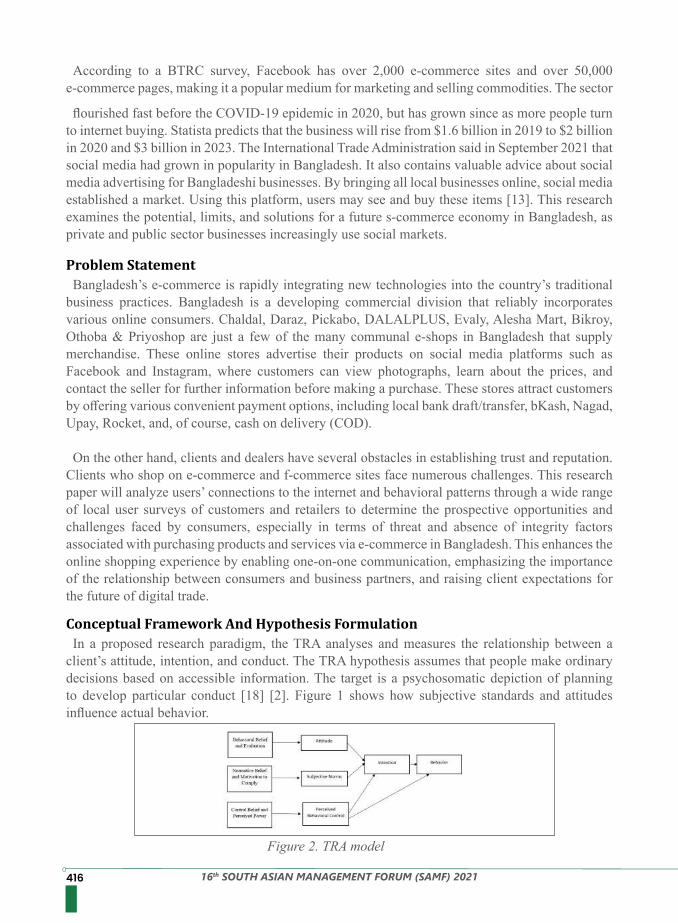
416 16th SOUTH ASIAN MANAGEMENT FORUM (SAMF) 2021
According to a BTRC survey, Facebook has over 2,000 e-commerce sites and over 50,000 e-commerce pages, making it a popular medium for marketing and selling commodities. The sector flourished fast before the COVID-19 epidemic in 2020, but has grown since as more people turn
to internet buying. Statista predicts that the business will rise from $1.6 billion in 2019 to $2 billion in 2020 and $3 billion in 2023. The International Trade Administration said in September 2021 that social media had grown in popularity in Bangladesh. It also contains valuable advice about social media advertising for Bangladeshi businesses. By bringing all local businesses online, social media established a market. Using this platform, users may see and buy these items [13]. This research examines the potential, limits, and solutions for a future s-commerce economy in Bangladesh, as private and public sector businesses increasingly use social markets.
Bangladesh’s e-commerce is rapidly integrating new technologies into the country’s traditional business practices. Bangladesh is a developing commercial division that reliably incorporates various online consumers. Chaldal, Daraz, Pickabo, DALALPLUS, Evaly, Alesha Mart, Bikroy, Othoba & Priyoshop are just a few of the many communal e-shops in Bangladesh that supply merchandise. These online stores advertise their products on social media platforms such as Facebook and Instagram, where customers can view photographs, learn about the prices, and contact the seller for further information before making a purchase. These stores attract customers by offering various convenient payment options, including local bank draft/transfer, bKash, Nagad, Upay, Rocket, and, of course, cash on delivery (COD).
On the other hand, clients and dealers have several obstacles in establishing trust and reputation. Clients who shop on e-commerce and f-commerce sites face numerous challenges. This research paper will analyze users’ connections to the internet and behavioral patterns through a wide range of local user surveys of customers and retailers to determine the prospective opportunities and challenges faced by consumers, especially in terms of threat and absence of integrity factors associated with purchasing products and services via e-commerce in Bangladesh. This enhances the online shopping experience by enabling one-on-one communication, emphasizing the importance of the relationship between consumers and business partners, and raising client expectations for the future of digital trade.
In a proposed research paradigm, the TRA analyses and measures the relationship between a client’s attitude, intention, and conduct. The TRA hypothesis assumes that people make ordinary decisions based on accessible information. The target is a psychosomatic depiction of planning to develop particular conduct [18] [2]. Figure 1 shows how subjective standards and attitudes influence actual behavior.
Figure 2. TRA model
Problem Statement
Conceptual Framework And Hypothesis Formulation
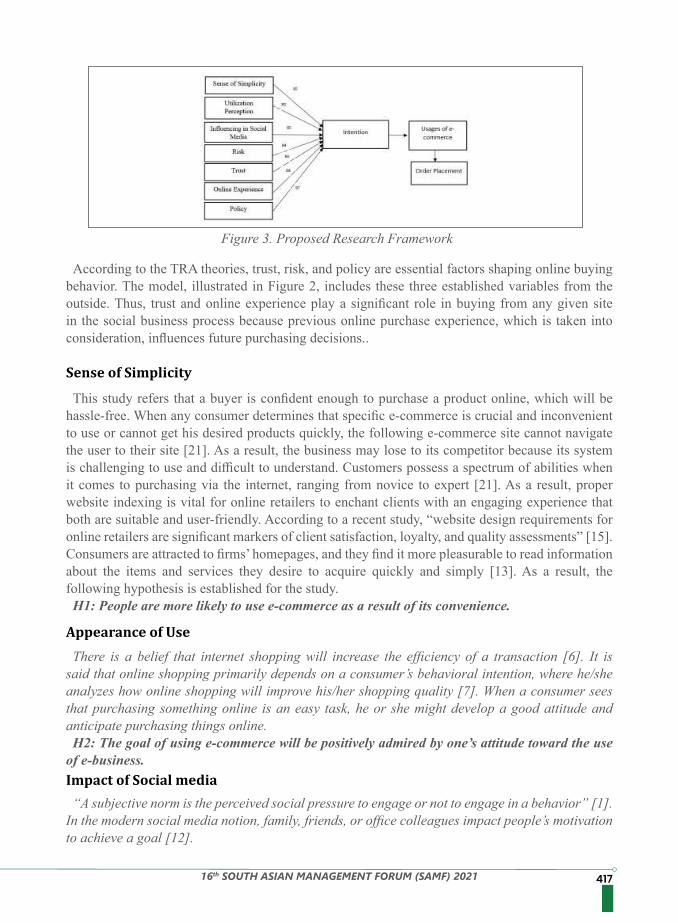
41716th SOUTH ASIAN MANAGEMENT FORUM (SAMF) 2021
According to the TRA theories, trust, risk, and policy are essential factors shaping online buying behavior. The model, illustrated in Figure 2, includes these three established variables from the outside. Thus, trust and online experience play a significant role in buying from any given site in the social business process because previous online purchase experience, which is taken into consideration, influences future purchasing decisions..
This study refers that a buyer is confident enough to purchase a product online, which will be hassle-free. When any consumer determines that specific e-commerce is crucial and inconvenient to use or cannot get his desired products quickly, the following e-commerce site cannot navigate the user to their site [21]. As a result, the business may lose to its competitor because its system is challenging to use and difficult to understand. Customers possess a spectrum of abilities when it comes to purchasing via the internet, ranging from novice to expert [21]. As a result, proper website indexing is vital for online retailers to enchant clients with an engaging experience that both are suitable and user-friendly. According to a recent study, “website design requirements for online retailers are significant markers of client satisfaction, loyalty, and quality assessments” [15]. Consumers are attracted to firms’ homepages, and they find it more pleasurable to read information about the items and services they desire to acquire quickly and simply [13]. As a result, the following hypothesis is established for the study.H1: People are more likely to use e-commerce as a result of its convenience.
There is a belief that internet shopping will increase the efficiency of a transaction [6]. It is said that online shopping primarily depends on a consumer’s behavioral intention, where he/she analyzes how online shopping will improve his/her shopping quality [7]. When a consumer sees that purchasing something online is an easy task, he or she might develop a good attitude and anticipate purchasing things online.H2: The goal of using e-commerce will be positively admired by one’s attitude toward the use
of e-business.
“A subjective norm is the perceived social pressure to engage or not to engage in a behavior” [1]. In the modern social media notion, family, friends, or office colleagues impact people’s motivation to achieve a goal [12].
Sense of Simplicity
Appearance of Use
Impact of Social media
Figure 3. Proposed Research Framework
418 16th SOUTH ASIAN MANAGEMENT FORUM (SAMF) 2021
Here, “it is found those social motives such as Social experiences outside the home; communication with others with similar interests; membership of peer groups; and status and authority were valid for e-shopping”. According to George ‘a person’s social, relational and other positive activity will be reasonable for changing other people’s activity likewise society’s people, friends, and family. As a result, if the individuals find others view online shopping as a socially acceptable activity, the individual is more likely to participate.Additionally, most consumers depend on and read social reviews and feedback about their beloved
or wanted goods posted online by their friends before buying a product. This suggests a favorable influence on purchasing decisions [2]. For this, the hypothesis goes like this:H3: Social media bears an excellent impact on purchasing the product online.
Risk
Trust
Online Experience
The vulnerability is “the purchaser’s perception of unpredictability or unreliability regarding adverse product and service results” [12]. Even though the internet is a fertile ground for criminal activity, where consumers’ personal information is at risk. Due to the convergence of e-commerce and social media, the internet has become a vital component of daily life. Information is hacked and monitored, and it is common for online actions to involve hazards and risks. Analysts have observed a detrimental impact on consumers’ propensity to consider e-commerce in numerous researches on movements [25] [5]. As a result, the hypothesis goes:H4: The behavioral intention to use e-commerce will be negatively affected by risk.
The lack of trust is the primary reason why shoppers are hesitant to make purchases online [20]. However, it might be difficult for buyers to trust reviews and comments during the shopping process because merchants may provide misleading information, such as false statements or phone remarks. The lack of trust is the primary reason why shoppers are hesitant to make purchases online [20]. Customers may find it challenging to put their faith in online evaluations and comments since merchants may post inaccurate or misleading information. There is an unequal playing field, as well as concern of exploitation. The issue of trust can be seen in three different ways, “competence which is the ability of the trustee to do what the trustor needs, benevolence which refers to trustee caring, motivation to act in the trustor’s interests, and integrity which refers to the trustee’s honesty and promise-keeping” [20], [1]. The term “trust” refers to positive thoughts about an online company outlet that tries to improve a consumer’s desire to shop online for goods and services. For this reason, the hypothesis goes:H5: The desire to engage in e-commerce will be influenced positively by the trust.
Consumers are almost certain to return to a website after a pleasant first encounter. However, if a male has a bad encounter with a website, he is virtually sure going to avoid it at all costs the next time around. Many empirical studies have been carried out, including customer purchasing experiences and their appraisal in light of notable online companies [12] and [16]. It has since become commonplace for people to conduct business online, and the internet has been labeled
as a dangerous open platform where personal information can be compromised. E-consumers, therefore, value awareness skills, which can only be acquired through extensive exposure to e-commerce [12]. As a result, we can form the following hypothesis:
41916th SOUTH ASIAN MANAGEMENT FORUM (SAMF) 2021
Policy
Conclusion
References
H6: An enjoyable online shopping experience increases the likelihood that potential customers will make use of e-commerce services in the future.
The Cabinet approved the draft “National Digital Commerce Policy 2018”. The policy intends to reestablish faith in e-commerce platforms in Bangladesh. Bangladesh’s e-commerce community has favorably received the policy. E-commerce websites should see updated terms and conditions to enforce consumer rights. It will be a few days before mobile payments, and digital transactions become safer. The Commerce Ministry’s Central Commerce Cell will deal with piracy and hacking. This policy will be enforced by the Central Commerce Cell across all e-commerce sites. The e-Commerce Association of Bangladesh (e-CAB) had been lobbying for e-commerce reform for several years. This initiative was designed to create a viable industry and increase exports, ultimately producing jobs for Bangladeshi youth. The policy also promises reputable e-commerce vendors. E-commerce websites must implement codes of behavior for website design and consumer rights. To respect and enforce copyrights, mobile operators will be required to enforce net neutrality and digital rights. To restore customer confidence in the e-commerce industry, the government plans to launch offline marketing in various regions around the country. The ICT ministry will also implement a legal structure to increase consumer satisfaction when shopping online. To increase security, every transaction requires a digital signature from the e-commerce website using e-commerce hosting. To further enhance the e-commerce sector in the future, a center of excellence will be established. For this, the following will be the hypothesis:H7: Core Conduct will be beneficial for increasing consumer satisfaction in e-commerce.
The paper’s scope is defined by two exceptional endpoints. There are several people and their connections who buy through social media interaction and interact with each other on an internet firm website that this paper will focus upon. In addition, the inquiry is aimed to learn more about the habits of the company’s customers. In Bangladesh’s commercial centers, trust, risk, and online experience all play a role in ensuring that customers are satisfied with their current and future business agreements and e-business opportunities.Users would be able to buy products from a company’s online store by connecting it to a social
networking site. This investigation will focus on the general election of social commerce, its impact on e-commerce, its potential benefits, and neighborhood markets in Bangladesh. The article will undertake a cross-sectional survey across Bangladesh’s major metropolitan urban centers to meet the objectives. The study’s findings will provide enormous utilization, possible prospects, hurdles, or difficulties, and solutions to the challenges of incorporating social networking sites into Bangladesh’s e-commerce for both dealers and customers.
1. Ajzen, I. (1991). The theory of planned behavior. Organizational Behavior and Human Decision Processes, 50, 179–211.
2. Azjen, I. (1980). Understanding attitudes and predicting social behavior. Englewood Cliffs.3. Bai, Y., Yao, Z., & Dou, Y. F. (2015). Effect of social commerce factors on user purchase
behavior: An empirical investigation from renren. com. International Journal of Information Management, 35(5), 538-550.
420 16th SOUTH ASIAN MANAGEMENT FORUM (SAMF) 2021
4. Busalim, A. H. (2016). Understanding social commerce: A systematic literature review and directions for further research. International Journal of Information Management, 36(6), 1075-1088.
5. Chen, L. H. (2008). Job satisfaction among information system (IS) personnel. Computers in human behavior, 24(1), 105-118.
6. Chiu, C. M., Chang, C. C., Cheng, H. L., & Fang, Y. H. (2009). Determinants of customer repurchase intention in online shopping. Online information review.
7. Davis, F. D. (1989). Perceived usefulness, perceived ease of use, and user acceptance of information technology. MIS Quarterly, 319-340.
8. George, J. F. (2004). The theory of planned behavior and Internet purchasing. Internet research.9. Gefen, D., Karahanna, E., & Straub, D. W. (2003). Trust and TAM in online shopping: An
integrated model. MIS Quarterly, 51-90.10. Highlights Economic indicators for Bangladesh 2021-2022, [Online]. Available: https://www.
adb.org/countries/bangladesh/economy11. https://medium.com/@r_moslem/a-brief-history-of-e-commerce-in-bangladesh-
e9ec27e29caf12. Jayawardhena, C. D. B. M. C., Wright, L. T., Dennis, C., Merrilees, B., Jayawardhena, C., &
Wright, L. T. (2009). European Journal of Marketing E-consumer behaviour. Eur. J. Mark. Int. J. Serv. Ind. Manag. Int. J. Retail & Distrib. Manag. Iss J. Consum. Mark.
13. Kim, S., & Park, H. (2013). Effects of various characteristics of social commerce (s- commerce) on consumers’ trust and trust performance. International Journal of Information Management, 33(2), 318-332.
14. Lin, X., Li, Y., & Wang, X. (2017). Social commerce research: Definition, research themes and the trends. International Journal of Information Management, 37(3), 190-201.
15. Lee, G. G., & Lin, H. F. (2005). Customer perceptions of e‐service quality in online shopping. International Journal of Retail & Distribution Management.
16. Li-Ming, A. K., Wai, T. B., Hussin, M., & Mat, N. K. N. (2013). The predictors of attitude towards online advertising. International Journal of Applied Psychology, 3(1), 7-12.
17. Jotkar, M., Swaminathan, G., Theofilis, V., & Govindarajan, R. (2012). On global instability of variable aspect ratio channel flows. In 42nd AIAA Fluid Dynamics Conference and Exhibit (p. 3273).
18. Fishbein, M., & Ajzen, I. (1977). Belief, attitude, intention, and behavior: An introduction to theory and research. Philosophy and Rhetoric, 10(2).
19. Mukhtar, A., & Butt, M. M. (2012). Intention to choose Halal products: the role of religiosity. Journal of Islamic Marketing.
20. McKnight, D. H., Choudhury, V., & Kacmar, C. (2002). The impact of initial consumer trust on intentions to transact with a website: a trust-building model. The journal of strategic information systems, 11(3-4), 297-323.
21. Pearson, J. M., Pearson, A., & Green, D. (2007). Determining the importance of key criteria in web usability. Management Research News.
22. P. Pierce, “Social Commerce: Factors that stimulate sellers to,” 2016.23. Reichheld, F. F., & Schefter, P. (2000). E-loyalty: your secret weapon on the web. Harvard
business review, 78(4), 105-113.24. Triandis, H. C. (1980). Reflections on trends in cross-cultural research. Journal of cross-
cultural psychology, 11(1), 35-58.
42116th SOUTH ASIAN MANAGEMENT FORUM (SAMF) 2021
25. Wu, J. H., & Wang, S. C. (2005). What drives mobile commerce?: An empirical evaluation of the revised technology acceptance model. Information & management, 42(5), 719-729.
26. Nadeem, W., Tan, T. M., Tajvidi, M., & Hajli, N. (2021). How do experiences enhance brand relationship performance and value co-creation in social commerce? The role of consumer engagement and self-brand-connection. Technological Forecasting and Social Change, 171, 120952.

422 16th SOUTH ASIAN MANAGEMENT FORUM (SAMF) 2021
978-984-35-1624-4

978-984-35-1624-4


![[Acronym] Proceedings - UFG](https://static.fdokumen.com/doc/165x107/631430486ebca169bd0abf4b/acronym-proceedings-ufg.jpg)