
Proceedings - EMIS
293
The first Digital Enterprise Computing Conference DEC 15 at the Herman Hollerith Center in Böblingen brings together students, researchers, and prac- titioners to discuss solutions, experiences, and future developments for the digital transformation. Digitization of business and IT defines the conference agenda: Digital Business, Digital Enterprise Architecture, Business Process Management, Adaptive Case Management, Big Data, and Applications. ISSN 1617-5468 ISBN 978-3-88579-638-1 Gesellschaft für Informatik e.V. (GI) publishes this series in order to make available to a broad public recent findings in informatics (i.e. computer science and informa- tion systems), to document conferences that are organized in co- operation with GI and to publish the annual GI Award dissertation. Broken down into • seminars • proceedings • dissertations • thematics current topics are dealt with from the vantage point of research and development, teaching and further training in theory and practice. The Editorial Committee uses an intensive review process in order to ensure high quality contributions. The volumes are published in German or English. Information: http://www.gi.de/service/publikationen/lni/ 244 GI-Edition Lecture Notes in Informatics Alfred Zimmermann, Alexander Rossmann (Eds.) Digital Enterprise Computing (DEC 2015) Böblingen, Germany June 25-26, 2015 Proceedings A. Zimmermann, A. Roßmann (Eds.): DEC 2015 30255594_GI_P_244_Cover.indd 1 28.05.15 08:42
-
Upload
khangminh22 -
Category
Documents
-
view
2 -
download
0
Transcript of Proceedings - EMIS
The first Digital Enterprise Computing Conference DEC 15 at the Herman Hollerith Center in Böblingen brings together students, researchers, and prac-titioners to discuss solutions, experiences, and future developments for the digital transformation. Digitization of business and IT defines the conference agenda: Digital Business, Digital Enterprise Architecture, Business Process Management, Adaptive Case Management, Big Data, and Applications.
ISSN 1617-5468ISBN 978-3-88579-638-1
Gesellschaft für Informatik e.V. (GI)
publishes this series in order to make available to a broad public recent findings in informatics (i.e. computer science and informa-tion systems), to document conferences that are organized in co-operation with GI and to publish the annual GI Award dissertation.
Broken down into• seminars• proceedings• dissertations• thematicscurrent topics are dealt with from the vantage point of research and development, teaching and further training in theory and practice.The Editorial Committee uses an intensive review process in order to ensure high quality contributions.
The volumes are published in German or English.
Information: http://www.gi.de/service/publikationen/lni/
244
GI-EditionLecture Notes in Informatics
Alfred Zimmermann, Alexander Rossmann (Eds.)
Digital Enterprise Computing (DEC 2015)
Böblingen, Germany June 25-26, 2015
Proceedings
A. Z
imm
erm
ann
, A. R
oß
man
n (
Eds.
): D
EC 2
015
30255594_GI_P_244_Cover.indd 1 28.05.15 08:42


Alfred Zimmermann, Alexander Rossmann (Eds.)
Digital Enterprise Computing(DEC 2015)
June 25-26, 2015Böblingen, Germany
Gesellschaft für Informatik e.V. (GI)

Lecture Notes in Informatics (LNI) - ProceedingsSeries of the Gesellschaft für Informatik (GI)
Volume P-244
ISBN 978-3-88579-638-1ISSN 1617-5468
Volume EditorsProf. Dr. Alfred Zimmermann
Reutlingen UniversityHerman Hollerith CenterDanziger Str. 6, 71043 Bö[email protected]
Prof. Dr. Alexander RossmannReutlingen UniversityHerman Hollerith CenterDanziger Str. 6, 71043 Bö[email protected]
Series Editorial BoardHeinrich C. Mayr, Alpen-Adria-Universität Klagenfurt, Austria(Chairman, [email protected])Dieter Fellner, Technische Universität Darmstadt, GermanyUlrich Flegel, Hochschule für Technik, Stuttgart, GermanyUlrich Frank, Universität Duisburg-Essen, GermanyJohann-Christoph Freytag, Humboldt-Universität zu Berlin, GermanyMichael Goedicke, Universität Duisburg-Essen, GermanyRalf Hofestädt, Universität Bielefeld, GermanyMichael Koch, Universität der Bundeswehr München, GermanyAxel Lehmann, Universität der Bundeswehr München, GermanyPeter Sanders, Karlsruher Institut für Technologie (KIT), GermanySigrid Schubert, Universität Siegen, GermanyIngo Timm, Universität Trier, GermanyKarin Vosseberg, Hochschule Bremerhaven, GermanyMaria Wimmer, Universität Koblenz-Landau, Germany
DissertationsSteffen Hölldobler, Technische Universität Dresden, GermanySeminarsReinhard Wilhelm, Universität des Saarlandes, GermanyThematicsAndreas Oberweis, Karlsruher Institut für Technologie (KIT), Germany
Gesellschaft für Informatik, Bonn 2015printed by Köllen Druck+Verlag GmbH, Bonn
PrefaceWelcome to the first Digital Enterprise Computing Conference DEC 15 at the HermanHollerith Center in Böblingen. We are pleased to host this annual conference, bringingtogether students, researchers, and practitioners to discuss solutions, experiences, andfuture developments for the current and next digital transformation. The digital trans-formation requires close cooperation between various partners from science, businessand society.
We are living in an increasingly networked, interdependent, and fragile world. Opportu-nities coming from information technology and new tailored business models have to beexplored and adjusted as part of a joined work in research, education, and real businessand industrial practice. Product, process, and business model innovations have becomeessential to capture these new opportunities. Together with our partners we are support-ing this challenging movement and transformation of society, business, and academia atthe Herman Hollerith Center Böblingen by practicing rigor science and collaborativeresearch, teaching, and practice.
Information, data and knowledge are fundamental concepts of our everyday activities.The digital economy requires new concepts of digital enterprise computing. This in-cludes an interdisciplinary combination of approaches from computer science, econom-ics and other relevant disciplines. New architectures and methods for both business andIT are integrating Mobility Systems, Internet of Things, Industry 4.0, Social Networks,Collaborative Business Models and Processes, Decision Systems, Big Data, and CloudEcosystems. They inspire current and future business strategies and create new opportu-nities for the digital transformation towards next digital products and services. The digi-tal transformation addresses both the continuous evolution of business operating modelsand IT as well as their disruptive change. Digitization of business and IT defines ourconference agenda by topics like Digital Business, Digital Enterprise Architecture, Busi-ness Process Management, Adaptive Case Management, Big Data, and Applications.
First of all we thank the District Administrator of Böblingen for initiating and giving allthe support for the Herman Hollerith Center as a home for science, research, and prac-tice, as well as for this conference. We are grateful to all the sponsors and supporters fortheir continuous assistance and help. We would like to thank the program committeemembers for their responsibility and help to compose the technical program of DEC 15,as well as our diligent authors and presenters, and the communicating audience.
We hope you will enjoy this DEC 15 Conference at the Herman Hollerith CenterBöblingen and find it productive and inspiring. We wish you an interesting program withhelpful contacts, and best conversations.
Alfred Zimmermann, Alexander Rossmann
Chairs of DEC 15, Herman Hollerith Center Böblingen, Germany
Böblingen, June 25-26, 2015

Conference Chairs
Alfred Zimmermann Reutlingen UniversityAlexander Rossmann Reutlingen University
Program Committee
Karlheinz Blank T-Systems StuttgartWolfgang Blochinger Reutlingen UniversityOliver Bossert McKinsey FrankfurtTilo Böhmann University of HamburgCristobal Curio Reutlingen UniversityUwe Dumslaff Capgemini MünchenBogdan Franczyk University of LeipzigRul Gunzenhäuser University of StuttgartMenno Harms HP BöblingenMichael Herrmann MB Bank StuttgartDieter Hertweck Reutlingen UniversityLudwig Hieber University of StuttgartKunt Hinkelmann FHNW SwitzerlandRobert Hirschfeld HPI PotsdamHelmut Krcmar TU MünchenPawel Lula Cracow University of EconomicsAlexander Mädche University of MannheimMartin Mähler IBM BöblingenMarco Mevius HTWG KonstanzAndreas Oberweis KIT KarlsruheIlia Petrov Reutlingen UniversityGunther Piller Mainz UniversityErhard Plödereder University of StuttgartMichael Pretz Daimler StuttgartWilfried Reimann Daimler StuttgartRené Reiners Fraunhofer FIT St. AugustinRalf Reussner KIT / FZI KarlsruheAlexander Rossmann Reutlingen UniversityKurt Sandkuhl University of RostockRainer Schmidt München UniversityChristian Schweda Reutlingen UniversityAlbrecht Stäbler Novatec EchterdingenGottfried Vossen University of MünsterAlfred Zimmermann Reutlingen University
Local Organizing Team
Constanze Fellner Sandra LäuferDierk Jugel Gerald Stei

Key Notes
Uwe Dumslaff, Capgemini MünchenLeading Digital: Linking Technology and Business Innovation
Rainer Schmidt, Munich University of Applied SciencesDecisions as a Service - as a Base for Digitization of Business Models and Processes
Albrecht Stäbler, Novatec GmbH EchterdingenEventual Consistency: New Paradigms for Software Development andArchitectures for the Digital Transformation
Alfred Zimmermann, Reutlingen UniversityDigital Enterprise Architecture for Digital Transformation
Wilfried Reimann, Daimler AG StuttgartDigital Transformation in the Automotive Industry
Oliver Bossert, McKinsey & Company, Inc. FrankfurtThe New Role of Technology and Architecture in Digital Transformations
Christian M. Schweda, Reutlingen UniversityIT Between Magical Lemon and Technical Support


Directory
Digital Business
Philipp Küller, Dieter Hertweck, Helmut KrcmarEnergiegenossenschaften - Geschäftsmodelle und Wertschöpfungsnetzwerke ...... 15
Alexander Rossmann, Gerald SteiCustomer Services in the Digital Transformation: Social Media versus HotlineChannel Performance ............................................................................................. 27
Sheherazade Benzerga, Michael Pretz, Andreas Riegg, Ahmed Bounfur,Wilfried ReimannAppflation – A Phenomenon to be considered for Future Digital Services ........... 39
Alexander Rossmann, Gerald SteiUser Engagement in Corporate Facebook Communities ....................................... 51
Manuel Breu, Klaus Berndl, Thomas Heimanni*Gov a Feeling - Ein Studienportal für das interaktive Heute .............................. 63
Alexander Rossmann, Gerald SteiSales 2.0 in Business-to-Business (B2B) Networks: Conceptualization andImpact of Social Media in B2B Sales Relationship ................................................ 67
Tim KornherrDisruptive Innovationsmethoden im automotiven Produktentstehungsprozess ..... 79
Steffen Brümmel, Martin Schößler, Birger LantowHerausforderungen der Projektfertigung – eine Fallstudie zur Informations-bedarfsanalyse ........................................................................................................ 85
Marcel Estel, Laura FischerFeasibility of Bluetooth iBeacons for Indoor Localization .................................... 97
Digital Enterprise Architecture
Peter Weierich, David Weich, Sebastian AbeckIdentitäts- und Zugangsmanagement für Kundenportale – EineBestandsaufnahme .................................................................................................. 111
Mark Hansen, Tim Piontek, Matthias WißotzkiIT Operation Management - A Systematic Literature Review of ICIS, EDOCand BISE ................................................................................................................. 115

Matthias Wißotzki, Christina Köpp, Paul StelzerRollenkonzepte im Enterprise Architecture Management ...................................... 127
Alfred Zimmermann, Rainer Schmidt, Kurt Sandkuhl, Dierk Jugel,Michael Möhring, Matthias WißotzkiEnterprise Architecture Management for the Internet of Things ........................... 139
Dierk Jugel, Stefan Kehrer, Christian M. Schweda, Alfred ZimmermannProviding EA Decision Support for Stakeholders by Automated Analyses ............ 151
Konstantin Govedarski, Claudius Hauptman, Christian SchwedaBottom-up EA Management Governance using Recommender Systems ................ 163
Thomas Hamm, Stefan KehrerGoal-oriented Decision Support in Collaborative Enterprise Architecture .......... 175
Alfred Zimmermann, Rainer Schmidt, Dierk Jugel and Michael MöhringEvolving Enterprise Architectures for Digital Transformations ............................ 183
Christoph Wenzel, Dierk Jugel, Baris Cubukcuoglu, Sebastian Breitbach,Tobias Gorhan, Daniel HammerKonzeption und prototypische Umsetzung eines Architekturcockpits .................... 195
Adaptive Business Processes
Felix Schiele, Fritz Laux, Thomas ConnollyImproving the Understanding of Business Processes ............................................ 209
Eberhard Heber, Holger Hagen, Martin SchmollingerApplication of Process Mining for Improving Adaptivity in CaseManagement Systems .............................................................................................. 221
Danielle Collenbusch, Anja Sauter, Ipek Tastekil, Denise UsluExperiencing Adaptive Case Management Capabilities with Cognoscenti ........... 233

Big Data
Andreas TönneOn Practical Implications of Trading ACID for CAP in the Big DataTransformation of Enterprise Applications ............................................................ 247
Michael Schaidnagel, Fritz Laux, Thomas ConnollyUsing Feature Construction for dimensionality reduction in Big Data scenariosto allow real time classification of sequence data .................................................. 259
Heiko Bonhorst, Patrick Kopf, Fekkry MeawadAutomatisiertes Data Discovery innerhalb eines Provisionierungstools ............... 271


Digital Business

Alfred Zimmermann, Alexander Rossmann (Hrsg.): Digital Enterprise Computing 2015,Lecture Notes in Informatics (LNI), Gesellschaft für Informatik, Bonn 2015 15
Energiegenossenschaften - Geschäftsmodelle undWertschöpfungsnetzwerke
Philipp Küller1, Dieter Hertweck2 und Helmut Krcmar3
Abstract: Die Energiewende bietet reichlich Fragen für verschiedenste Wissenschaftsdisziplineneinschließlich der Informatik und Wirtschaftsinformatik (WI). Bedauerlicherweise wurde bisher derBereich der regionalen Energiegenossenschaften und kleinerer Energieversorgungsunternehmenweitgehend von der WI-Forschung vernachlässigt. Der vorliegende Beitrag stellt die aktuelle Situa-tion dieser Organisationen dar und konzentriert sich auf die bestehende Wissenslücke von Ge-schäftsmodellen (GM) für Energiegenossenschaften (EG) als Zusammenschluss aus Privatpersonenoder kleinen Unternehmen, welche primär regionale, erneuerbare Energie produzieren. Die Modell-und Theorieentwicklung basiert auf der klassischen Literaturrecherche, Fallstudien in der Energie-wirtschaft (EW), sowie grafischer Modellierung. Als Ergebnis wird das Referenzgeschäftsmodelleiner EG als morphologischer Business Model Canvas vorgestellt. Dieses singuläre GM wird umdie Darstellung des Wertschöpfungsnetzwerks, welches die strukturelle Einbindung der Akteure indas digitale Ökosystem der EG berücksichtigt, erweitert. Das aus der Forschung resultierende Refe-renzmodell dient der kritischen Überprüfung empirisch vorfindbarer GM und zur weiteren Entwick-lung von Unternehmensarchitekturen digitaler Unternehmensverbünde.
Keywords: Geschäftsmodelle, Wertschöpfungsnetzwerke, Energiegenossenschaften, Business Mo-del Canvas, e3value, Fallstudien
1 EinleitungNoch in der ersten Hälfte des 20. Jahrhunderts spielten ungefähr 6.000 Energiegenossen-schaften (EG) eine wesentliche Rolle im deutschen Energiesystem [HM13]. Änderungender politischen und sozialen Rahmenbedingungen führten über Jahre dazu, dass sich dieseetablierten Strukturen nahezu gänzlich zu Gunsten eines monopolistischen Energiesys-tems auflösten [LUB12, Dir06]. Heutzutage erfahren EG eine wahre Wiedergeburt: In denvergangenen 10 Jahren stieg die Anzahl von einigen wenigen EG auf über 700 EG [HM13,DGR14].
Der Trend zur Rekommunalisierung im Rahmen der Konzessionsvergabe sorgte zudemfür eine wachsende Zahl von regional agierender Energieversorgungsunternehmen[BB10]. Zusammen gelten die EG und regionale Energieversorger als die treibendenKräfte der deutschen Energiewende [Ede12, Her08]. Die wachsende Zahl von EG, dieRekommunalisierung, sowie der Markteintritt branchenfremder Akteure [Hue14, dpa13]
1 Hochschule Heilbronn, Max-Planck-Str. 39, 74081 Heilbronn, [email protected] Hochschule Reutlingen, Danziger Str. 6, 71034 Böblingen, [email protected] Technische Universität München, Boltzmannstr. 3, 85748 Garching, [email protected]
16 Philipp Küller et al.
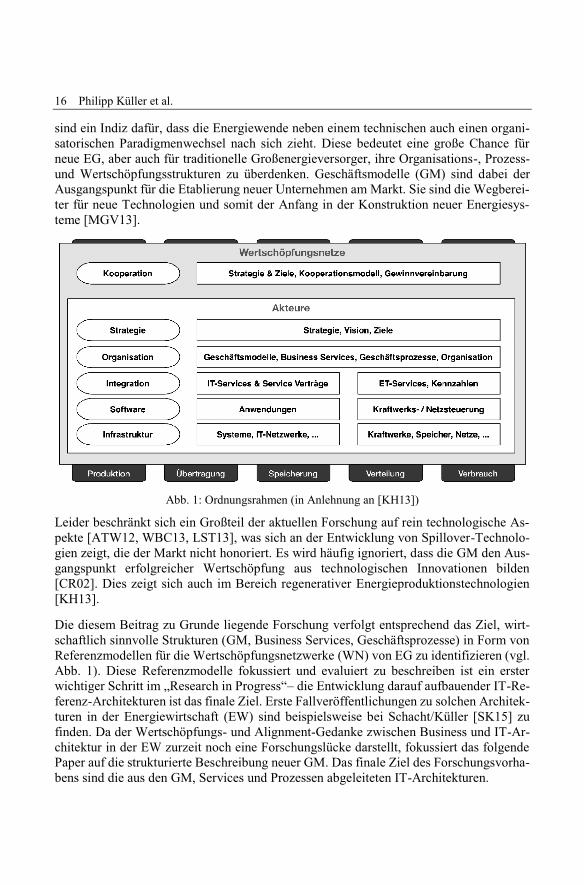
sind ein Indiz dafür, dass die Energiewende neben einem technischen auch einen organi-satorischen Paradigmenwechsel nach sich zieht. Diese bedeutet eine große Chance fürneue EG, aber auch für traditionelle Großenergieversorger, ihre Organisations-, Prozess-und Wertschöpfungsstrukturen zu überdenken. Geschäftsmodelle (GM) sind dabei derAusgangspunkt für die Etablierung neuer Unternehmen am Markt. Sie sind die Wegberei-ter für neue Technologien und somit der Anfang in der Konstruktion neuer Energiesys-teme [MGV13].
Abb. 1: Ordnungsrahmen (in Anlehnung an [KH13])
Leider beschränkt sich ein Großteil der aktuellen Forschung auf rein technologische As-pekte [ATW12, WBC13, LST13], was sich an der Entwicklung von Spillover-Technolo-gien zeigt, die der Markt nicht honoriert. Es wird häufig ignoriert, dass die GM den Aus-gangspunkt erfolgreicher Wertschöpfung aus technologischen Innovationen bilden[CR02]. Dies zeigt sich auch im Bereich regenerativer Energieproduktionstechnologien[KH13].
Die diesem Beitrag zu Grunde liegende Forschung verfolgt entsprechend das Ziel, wirt-schaftlich sinnvolle Strukturen (GM, Business Services, Geschäftsprozesse) in Form vonReferenzmodellen für die Wertschöpfungsnetzwerke (WN) von EG zu identifizieren (vgl.Abb. 1). Diese Referenzmodelle fokussiert und evaluiert zu beschreiben ist ein ersterwichtiger Schritt im „Research in Progress“– die Entwicklung darauf aufbauender IT-Re-ferenz-Architekturen ist das finale Ziel. Erste Fallveröffentlichungen zu solchen Architek-turen in der Energiewirtschaft (EW) sind beispielsweise bei Schacht/Kuller [SK15] zufinden. Da der Wertschöpfungs- und Alignment-Gedanke zwischen Business und IT-Ar-chitektur in der EW zurzeit noch eine Forschungslücke darstellt, fokussiert das folgendePaper auf die strukturierte Beschreibung neuer GM. Das finale Ziel des Forschungsvorha-bens sind die aus den GM, Services und Prozessen abgeleiteten IT-Architekturen.
Energiegenossenschaften - Geschäftsmodelle und Wertschöpfungsnetzwerke 17
2 State of the Art
2.1 Energiegenossenschaften
Der internationale Genossenschaftsverband beschreibt Genossenschaften als eigenstän-dige Verbände von Personen, die sich freiwillig zusammenfinden, um gemeinsame öko-nomische, soziale, kulturelle Bedürfnisse und Ansprüche zu verwirklichen, was über einim gemeinsamen Besitz befindliches, demokratisch kontrolliertes Unternehmen erreichtwird [Int15]. EG sind spezielle Genossenschaften, die sich hauptsächlich auf die Produk-tion von Strom und Wärme (Photovoltaik, Wind, Kraft-Wärme-Kopplung, ...) konzentrie-ren [Fli11]. Bis zum Jahr 2013 wuchs ihre Anzahl auf über 700 EG an. Eine wesentlicheTriebfeder scheint hierbei der Wille engagierter Bürger vor Ort zu sein, die sich aktiv indie Transformation des deutschen Energiesystems von einem zentralen, Atom- / Koh-lestrom dominierten zu einem dezentral regenerativen einbringen wollen [Kay14]. Einweiterer Aspekt ist die finanzielle Teilhabe lokaler Wertschöpfungspartner. EG könnensich in unterschiedlichsten Funktionen, wie etwa in der Produktion oder im Verkauf vonEnergie in regionalen WN betätigen. Entsprechend sind unterschiedlichste Klassifizierun-gen von EG publiziert [CC04, Dul95, Mue06, The11]. Holstenkamp (2012) gibt einenguten Überblick über aktuelle Klassifikationen [Hol12], wobei die Mehrheit (95%) derGenossenschaften erneuerbare Energien, primär Solarstrom, produziert [DGR14].
2.2 Geschäftsmodelle in der EnergiewirtschaftMit der regulatorischen Trennung4 des Netzbetriebs von der Stromerzeugung und-versorgung in der Europäischen Union wurden die existierenden Monopole seit 1998 auf-gelöst [Dir06, LKHP11, Pol07] und der Energiemarkt für neue Teilnehmer und unter-schiedlichste GM geöffnet [KP11]. In diesem Zusammenhang stellen GM ein Werkzeugzur Implementierung von Geschäftsideen, mit dem Ziel eines vermarktbaren Ergebnisses(Produkt, Dienstleistung), dar [HB10]. Lange (2012) und andere Autoren vertreten denStandpunkt, dass für die Energiewende neue GM unabdingbar sind [Lan12]. Leider lässtdie Mehrheit der Autoren eine detaillierte Beschreibung der Modelle vermissen.
Osterwalder und Pigneur (2010) verstehen ein GM als Beschreibung des Grundprinzipsdarüber, wie eine Organisation einen Mehrwert erzeugt, liefert und sichert [OP10]. Siedefinieren neun relevante Bausteine eines GM und arrangieren diese als Teil ihres soge-nannten „Business Model Canvas“ (BMC). Dieser ist mittlerweile weitgehend anerkanntund wird regelmäßig in der wissenschaftlichen Community referenziert (z.B. [MGV13,Fie11, WWB+11]). Nichtsdestotrotz fehlt es bis heute noch an einem gemeinsamen Ver-ständnis über GM, deren Nutzen und Ziele, Architektur und Struktur [Sch14, MGV13].Schallmo (2013) liefert einen Überblick und eine Klassifikation über verschiedene Ge-schäftsmodelldefinitionen und Konzepte [Sch14].
4 Vgl. Gesetz zur Neuregelung des Energiewirtschaftsrechts i.d.F. vom 29.04.1998
18 Philipp Küller et al.
Johnson et al. (2008) stellen im Rahmen ihren Geschäftsmodellansatzes heraus, dass so-wohl Schlüsselprozesse als auch Schlüsselressourcen notwendig sind, um den Wertbeitragprofitabel, wiederholbar und skalierbar zu erbringen [JCK08]. Dabei sehen die AutorenInformationen und Technologien als Schlüsselressourcen an. Auch Henderson und Ven-katraman (1993) zeigen mit ihrem „Strategic Alignment Model“ [HV93], dass die Ge-schäftsbereiche mit adäquaten Informationssystemen unterstützt oder ermöglicht werdenmüssen. Entsprechend sind die neuen GM der Energiewende von besonderer Bedeutungfür die Wirtschaftsinformatik und ihrer Teilgebiete wie der Energieinformatik oder derService Science [WBC13, BLM14]. Allerdings wurde die Perspektive der Wirtschaftsin-formatik bisher eher vernachlässigt; der Fokus der Forschung lag mehr auf technologi-schen Herausforderungen rund um das Smart Grid [AMS12, WBC13]. Dabei stellen Ap-pelrath et al. (2012) heraus, dass die Veränderung des Energiesystems zwangsläufig auchein Überdenken der vorhandenen der IKT-Schicht erforderlich macht [ATW12]. Dabei istein Top-Down-Ansatz entlang der Unternehmensarchitektur (vgl. Abb. 2) von den GMüber Geschäftsprozesse hin zu den Informationstechnologien sinnvoll [SK15, HGG13].Entsprechend markieren die GM in diesem Beitrag den Ausgangspunkt für weitere For-schungsaktivitäten.
Im Kontext der EW befassten sich einige Autoren mit GM für spezielle regionale Kontexteoder dedizierte technologische Lösungen. Beispielsweise Richter (2013) diskutiert die Un-terschiede zwischen GM auf Seiten der Stadtwerke und deren Kunden [Ric13]. Watson etal. (2011) wandelten die vorgestellte BMC ab und entwickelten daraus ihren sogenannte„Energy Informatics Business Model Canvas“. Dieser spezielle Canvas wurde durch einenLayer ergänzt, um Entscheider in Unternehmen dabei zu unterstützen, Potentiale für Ener-gieeinsparungen zu erkennen [WWB+11]. Heindl et al. (2010) verwendeten den BMC umein GM für IT-Infrastruktur und Service Provider in einem Energie Ökosystem zu be-schreiben [HSW+10]. Marko et al. (2014) entwickelten fünf neue GM für Stadtwerke ineiner dezentralen Stromerzeugung. Dabei folgten sie einem ähnlichen Ansatz wie der vor-liegende Beitrag und setzen qualitative Methoden und einen morphologischen Ansatz zurGeschäftsmodellentwicklung ein [MGV13]. Die vorgestellten Ansätze und Veröffentli-chungen vereint, dass sie nur isolierte GM - quasi aus der Sicht des Unternehmers - füreinen Akteur und dessen interner Wertschöpfungskette betrachten.
Heutige GM können jedoch selten isoliert betrachtet werden. Sie setzen sich meist alsUnternehmensnetzwerk in einem Ökosystem zusammen [Krc11]. Dieser Trend kann auchin der EW beobachtet werden. Viele GM werden heute als sog. Wertschöpfungsnetzwerke(WN) kooperierender Partner etabliert und somit ist es notwendig zu klären, wie die be-teiligten Akteure ihre eigene Wertschöpfungskette mit der von anderen integrieren [CR95,BSRE14]. Ein solches Wertschöpfungsnetz könnte sich beispielsweise aus (a) einem re-gionalen Stadtwerk, welches das Energiesystem koordiniert, (b) einem Landwirt, der Bi-ogas produziert, (c) einer Schule, die mit dem Biogas ein Blockheizkraftwerk (BHKW)betreibt und (d) einer Bank, die Finanzierung über einen Energiesparbrief sicherstellt, zu-sammensetzen. Die Betrachtung eines isolierten Geschäftsmodells ist somit nicht ausrei-chend und entsprechend scheint der Ökosystemansatz deutlich passender, um diese Zu-sammenhänge zu verstehen. Moore (1996) definiert das unternehmerische Ökosystem
Energiegenossenschaften - Geschäftsmodelle und Wertschöpfungsnetzwerke 19
(Business Ecosystem) als „economic community supported by a foundation of interactingorganizations and individuals – the organisms of the business world“[Moo96]. Costa undda Cuhna (2008) geben dabei zu bedenken, dass GM interagierender Organisationen kom-plexer als einzelne GM sind [CdC08]. Die Akteure betreiben dabei oftmals auch mehrereGM zeitgleich [BM02]. Kartseva et al. analysierten GM in einer verteilten Energieerzeu-gung in Spanien und dokumentierten ihre Ergebnisse als konzeptuelles Modell basierendauf der e3value Methode [KGT04]. In Deutschland entwickelte das Projekt RegModHarzein GM mit mehreren Akteuren, die im Rahmen eines virtuellen Kraftwerks kooperieren[FRN+12].
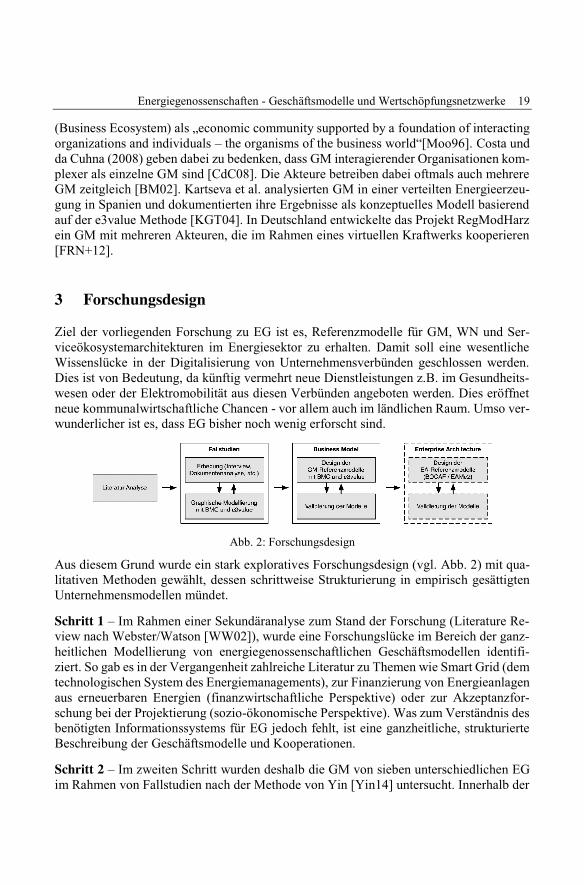
3 ForschungsdesignZiel der vorliegenden Forschung zu EG ist es, Referenzmodelle für GM, WN und Ser-viceökosystemarchitekturen im Energiesektor zu erhalten. Damit soll eine wesentlicheWissenslücke in der Digitalisierung von Unternehmensverbünden geschlossen werden.Dies ist von Bedeutung, da künftig vermehrt neue Dienstleistungen z.B. im Gesundheits-wesen oder der Elektromobilität aus diesen Verbünden angeboten werden. Dies eröffnetneue kommunalwirtschaftliche Chancen - vor allem auch im ländlichen Raum. Umso ver-wunderlicher ist es, dass EG bisher noch wenig erforscht sind.
Abb. 2: Forschungsdesign
Aus diesem Grund wurde ein stark exploratives Forschungsdesign (vgl. Abb. 2) mit qua-litativen Methoden gewählt, dessen schrittweise Strukturierung in empirisch gesättigtenUnternehmensmodellen mündet.
Schritt 1 – Im Rahmen einer Sekundäranalyse zum Stand der Forschung (Literature Re-view nach Webster/Watson [WW02]), wurde eine Forschungslücke im Bereich der ganz-heitlichen Modellierung von energiegenossenschaftlichen Geschäftsmodellen identifi-ziert. So gab es in der Vergangenheit zahlreiche Literatur zu Themen wie Smart Grid (demtechnologischen System des Energiemanagements), zur Finanzierung von Energieanlagenaus erneuerbaren Energien (finanzwirtschaftliche Perspektive) oder zur Akzeptanzfor-schung bei der Projektierung (sozio-ökonomische Perspektive). Was zum Verständnis desbenötigten Informationssystems für EG jedoch fehlt, ist eine ganzheitliche, strukturierteBeschreibung der Geschäftsmodelle und Kooperationen.
Schritt 2 – Im zweiten Schritt wurden deshalb die GM von sieben unterschiedlichen EGim Rahmen von Fallstudien nach der Methode von Yin [Yin14] untersucht. Innerhalb der
20 Philipp Küller et al.
Fallstudie wurden Interviews und Dokumente inhaltsanalytisch (Interviews, Dokumente)ausgewertet [May00] und in GM und WN der jeweiligen Fälle überführt. Bei der Ge-schäftsmodellierung wurde der holistische Ansatz des BMC von Osterwalder/Pigneur[OP10] gewählt. Um die Motivation der Einzelunternehmer und -unternehmen an der Teil-habe in einer Energiegenossenschaft zu verstehen, wurde zusätzlich mit der e3Value-Me-thode nach Jaap Gordijn [Gor02] das Wertschöpfungsnetzwerk des digitalen Unterneh-mensverbunds im Fall modelliert.
Schritt 3 – Um aus den Modellen (BMC, e3value-Network) der Einzelfälle gemeinsameStrukturen für semiformale Referenzmodelle zu gewinnen, wurde im dritten Schritt diemorphologische Methode von Zwicky [Rit11] verwendet. Sie fördert die Identifikationgemeinsamer Klassen und wurde bereits erfolgreich angewandt [VCB+14, MGV13].
Schritt 4 – Eine Validierung der gefundenen Referenzmodelle durch Experten steht zur-zeit noch aus (Research in Progress). Sollten sich die Modelle als valide erweisen, so istim nächsten Schritt die Modellierung der für EG passenden Informationssysteme und IT-Serviceportfolios im Rahmen einer ganzheitlichen Unternehmensarchitektur geplant.
4 Geschäftsmodelle von EnergiegenossenschaftenDer BMC bildet die theoretische Basis für die Modellierung der GM der EG in Baden-Württemberg aus der unternehmerischen Perspektive. Dabei befasst sich die BMC primärmit der internen Wertschöpfungskette und ist als „Blaupause fur eine Strategie zu sehen,die durch organisatorische Strukturen, Prozess und Systeme umgesetzt werden soll.“[Bir12]. Die Auswertung der jeweiligen grafischen Modelle der EG offenbarte, dass sichdie GM in einigen Punkten stark ähnelten, in anderen Aspekten aber auch sehr stark un-terschieden. Die Erstellung eines allgemeingültigen branchenspezifischen Referenzmo-dells als sog. „Common Practice“ [Sch99] macht aus diesem Grund nur bedingt Sinn.Vielmehr wurde nun der BMC mit der Idee des morphologischen Kastens (Zwicky Box)kombiniert; d.h. alle möglichen Ausprägungen werden dargestellt. Verbindet man beideKonzepte, so bilden die oben vorgestellten Bereiche des Canvas die Zeilen des morpholo-gischen Kastens und die Ausprägungen füllen die jeweiligen Spalten. Die eigentliche Dar-stellung kann dabei als Canvas oder klassisch als morphologischer Kasten erfolgen. De-tails zum erarbeiteten morphologischen GM wurden bereits veröffentlicht und können bei[KDK15] gefunden werden. Daher wird im Folgenden Abschnitt nur eine kurze Zusam-menfassung präsentiert.
Energiegenossenschaften stehen wie kaum eine andere Organisationsform für die dezent-rale, regionale und bürgernahe Energiewende in Deutschland. Neben den finanziellen As-pekten einer sicheren und rentablen Geldanlage im Rahmen der Genossenschaft, stehenfür Mitglieder und Kunden vor allem ökologische und regional-politische Werte im Vor-dergrund. Dieses Werteversprechen erreichen die EG primär durch Investitionen in Anla-gen zur regenerativen Erzeugung von Strom - seltener auch Wärme. Das Investment undder Betrieb der Anlagen werden meist in enger Kooperation mit regionalen Partnern
Energiegenossenschaften - Geschäftsmodelle und Wertschöpfungsnetzwerke 21
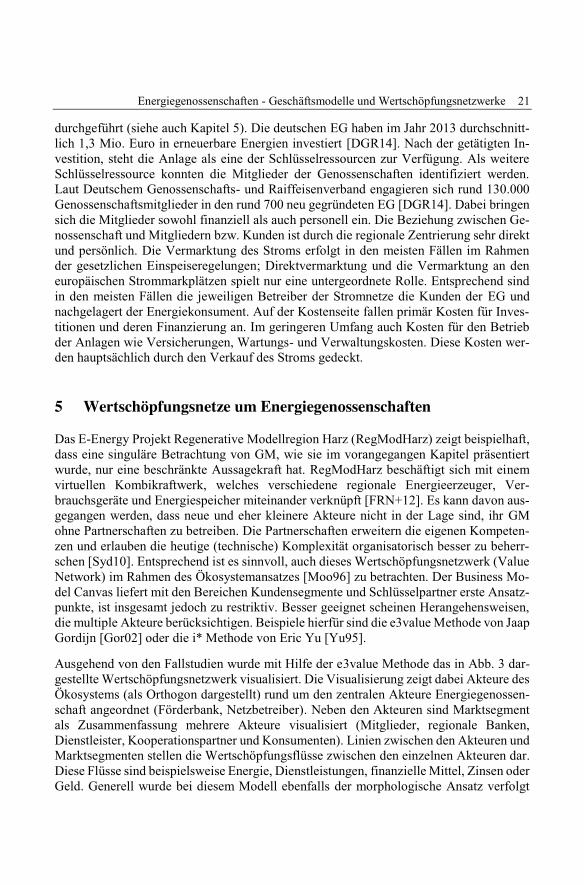
durchgeführt (siehe auch Kapitel 5). Die deutschen EG haben im Jahr 2013 durchschnitt-lich 1,3 Mio. Euro in erneuerbare Energien investiert [DGR14]. Nach der getätigten In-vestition, steht die Anlage als eine der Schlüsselressourcen zur Verfügung. Als weitereSchlüsselressource konnten die Mitglieder der Genossenschaften identifiziert werden.Laut Deutschem Genossenschafts- und Raiffeisenverband engagieren sich rund 130.000Genossenschaftsmitglieder in den rund 700 neu gegründeten EG [DGR14]. Dabei bringensich die Mitglieder sowohl finanziell als auch personell ein. Die Beziehung zwischen Ge-nossenschaft und Mitgliedern bzw. Kunden ist durch die regionale Zentrierung sehr direktund persönlich. Die Vermarktung des Stroms erfolgt in den meisten Fällen im Rahmender gesetzlichen Einspeiseregelungen; Direktvermarktung und die Vermarktung an deneuropäischen Strommarkplätzen spielt nur eine untergeordnete Rolle. Entsprechend sindin den meisten Fällen die jeweiligen Betreiber der Stromnetze die Kunden der EG undnachgelagert der Energiekonsument. Auf der Kostenseite fallen primär Kosten für Inves-titionen und deren Finanzierung an. Im geringeren Umfang auch Kosten für den Betriebder Anlagen wie Versicherungen, Wartungs- und Verwaltungskosten. Diese Kosten wer-den hauptsächlich durch den Verkauf des Stroms gedeckt.
5 Wertschöpfungsnetze um EnergiegenossenschaftenDas E-Energy Projekt Regenerative Modellregion Harz (RegModHarz) zeigt beispielhaft,dass eine singuläre Betrachtung von GM, wie sie im vorangegangen Kapitel präsentiertwurde, nur eine beschränkte Aussagekraft hat. RegModHarz beschäftigt sich mit einemvirtuellen Kombikraftwerk, welches verschiedene regionale Energieerzeuger, Ver-brauchsgeräte und Energiespeicher miteinander verknüpft [FRN+12]. Es kann davon aus-gegangen werden, dass neue und eher kleinere Akteure nicht in der Lage sind, ihr GMohne Partnerschaften zu betreiben. Die Partnerschaften erweitern die eigenen Kompeten-zen und erlauben die heutige (technische) Komplexität organisatorisch besser zu beherr-schen [Syd10]. Entsprechend ist es sinnvoll, auch dieses Wertschöpfungsnetzwerk (ValueNetwork) im Rahmen des Ökosystemansatzes [Moo96] zu betrachten. Der Business Mo-del Canvas liefert mit den Bereichen Kundensegmente und Schlüsselpartner erste Ansatz-punkte, ist insgesamt jedoch zu restriktiv. Besser geeignet scheinen Herangehensweisen,die multiple Akteure berücksichtigen. Beispiele hierfür sind die e3value Methode von JaapGordijn [Gor02] oder die i* Methode von Eric Yu [Yu95].
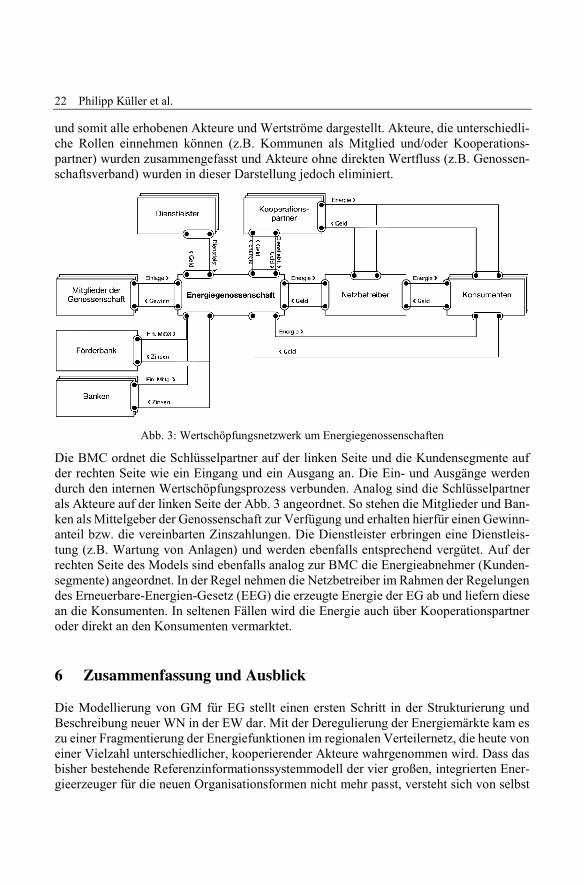
Ausgehend von den Fallstudien wurde mit Hilfe der e3value Methode das in Abb. 3 dar-gestellte Wertschöpfungsnetzwerk visualisiert. Die Visualisierung zeigt dabei Akteure desÖkosystems (als Orthogon dargestellt) rund um den zentralen Akteure Energiegenossen-schaft angeordnet (Förderbank, Netzbetreiber). Neben den Akteuren sind Marktsegmentals Zusammenfassung mehrere Akteure visualisiert (Mitglieder, regionale Banken,Dienstleister, Kooperationspartner und Konsumenten). Linien zwischen den Akteuren undMarktsegmenten stellen die Wertschöpfungsflüsse zwischen den einzelnen Akteuren dar.Diese Flüsse sind beispielsweise Energie, Dienstleistungen, finanzielle Mittel, Zinsen oderGeld. Generell wurde bei diesem Modell ebenfalls der morphologische Ansatz verfolgt
22 Philipp Küller et al.
und somit alle erhobenen Akteure und Wertströme dargestellt. Akteure, die unterschiedli-che Rollen einnehmen können (z.B. Kommunen als Mitglied und/oder Kooperations-partner) wurden zusammengefasst und Akteure ohne direkten Wertfluss (z.B. Genossen-schaftsverband) wurden in dieser Darstellung jedoch eliminiert.
Abb. 3: Wertschöpfungsnetzwerk um Energiegenossenschaften
Die BMC ordnet die Schlüsselpartner auf der linken Seite und die Kundensegmente aufder rechten Seite wie ein Eingang und ein Ausgang an. Die Ein- und Ausgänge werdendurch den internen Wertschöpfungsprozess verbunden. Analog sind die Schlüsselpartnerals Akteure auf der linken Seite der Abb. 3 angeordnet. So stehen die Mitglieder und Ban-ken als Mittelgeber der Genossenschaft zur Verfügung und erhalten hierfür einen Gewinn-anteil bzw. die vereinbarten Zinszahlungen. Die Dienstleister erbringen eine Dienstleis-tung (z.B. Wartung von Anlagen) und werden ebenfalls entsprechend vergütet. Auf derrechten Seite des Models sind ebenfalls analog zur BMC die Energieabnehmer (Kunden-segmente) angeordnet. In der Regel nehmen die Netzbetreiber im Rahmen der Regelungendes Erneuerbare-Energien-Gesetz (EEG) die erzeugte Energie der EG ab und liefern diesean die Konsumenten. In seltenen Fällen wird die Energie auch über Kooperationspartneroder direkt an den Konsumenten vermarktet.
6 Zusammenfassung und AusblickDie Modellierung von GM für EG stellt einen ersten Schritt in der Strukturierung undBeschreibung neuer WN in der EW dar. Mit der Deregulierung der Energiemärkte kam eszu einer Fragmentierung der Energiefunktionen im regionalen Verteilernetz, die heute voneiner Vielzahl unterschiedlicher, kooperierender Akteure wahrgenommen wird. Dass dasbisher bestehende Referenzinformationssystemmodell der vier großen, integrierten Ener-gieerzeuger für die neuen Organisationsformen nicht mehr passt, versteht sich von selbst
Energiegenossenschaften - Geschäftsmodelle und Wertschöpfungsnetzwerke 23
- genauso wie die Tatsache, dass neue Informationssystemarchitekturen an neuen Busi-ness-Architekturen ausgerichtet werden müssen. Hier wagt die oben beschriebene For-schung einen ersten Schritt zur Ergründung, Beschreibung und Strukturierung der neu ent-standenen WN.
Aus den beschriebenen Bausteinen der Business Model Canvas und den Relationen derWertschöpfungsnetze heraus, wird es künftig möglich sein, die passenden IT-Service-Portfolios, die notwendigen Service Level Agreements (SLA), aber auch Datenmodellenebst Zugriffskonventionen zu beschreiben. Dies wird nicht mit einer Informatik zu be-wältigen sein, die sich ausschließlich auf die Integration cyber-physischer Systeme imSmart-Grid konzentriert - wenngleich diese eine zentrale technische Komponente dar-stellt. Denkt man die „Digital Enterprise“ im Energiesektor noch einen Schritt weiter inRichtung daten-getriebener Mehrwertdienstleistungen (Hausautomatisierung, gesundheit-szentrierte Dienstleistungen, Elektromobilität), so werden diese mit einer Vielzahl neuerAkteure im Wertschöpfungsnetzwerk einhergehen. Die dann exponentiell zunehmendeKomplexität der Business- und IT-Architekturen wird dann - ohne eine gute Fundierungder neuen Organisationsformen in der regionalen EW - nur sehr schwer beherrschbar sein- eine Herausforderung an die Wirtschaftsinformatik.
7 DanksagungDie Autoren danken Christian Blaich, Norman Dorsch und Agnes Korsakas für ihren Bei-trag und den untersuchten Energiegenossenschaften für ihre Unterstützung.
Literaturverzeichnis[AMS12] Appelrath, H.; Mayer, C.; Steffens, U.: Energieinformatik. Informatik-Spektrum,
36(1):1–2, Dezember 2012.
[ATW12] Appelrath, H.; Terzidis, O.; Weinhardt C.: Internet of Energy. Business and InformationSystems Engineering, 4(1):1–2, Januar 2012.
[BB10] Bundesnetzagentur und Bundeskartellamt. Gemeinsamer Leitfaden zur Vergabe vonStrom- und Gaskonzessionen und zum Wechsel des Konzessionsnehmers. Bonn, 2010.
[Bir12] Birnhaeupl, L.: Business Model Canvas - smart von der Idee zum Cash. Energiewirt-schaftliche Tagesfragen, 62(7):66–69, 2012.
[BLM14] Böhmann, T.; Leimeister, J.; Möslein, K.: Service Systems Engineering. Business andInformation Systems Engineering, 6(2):73–79, Februar 2014.
[BM02] Brandtweiner, R.; Mahrer, H.: Business Models for Virtual Communities: An Explora-tive Analysis. In AMCIS 2002. AIS Electronic Library, 2002.

24 Philipp Küller et al.
[BSRE14] Bocken, N. et al.: A literature and practice review to develop sustainable business modelarchetypes. J. of Cleaner Production, 65:42–56, 2014.
[CC04] Chaddad, F.; Cook, M.. Understanding new cooperative models: An ownership-controlrights typology. Review of Agricultural Economics, 26(3):348–360, 2004.
[CdC08] Costa, C.; da Cuhna, P.: Reducing Uncertainty in Business Model Design: A Method toCraft the Value Proposal and its Supporting Information System. In ECIS, 2008.
[CR95] Christensen, C.; Rosenbloom, R.: Explaining the attacker’s advantage: Technologicalparadigms, organizational dynamics, and the value network, 1995.
[CR02] Chesbrough, H.; Rosenbloom, R.: The role of the business model in capturing valuefrom innovation. Industrial and Corporate Change, 11(3):529–555, Juni 2002.
[DGR14] DGRV. Energiegenossenschaften: Ergebnisse der Umfrage des DGRV und seiner Mit-gliedsverbände. Deutscher Genossenschafts- und Raiffeisenverband, Berlin, 2014.
[Dir06] Directorate-General for Research Sustainable Energy Systems. European TechnologyPlatform: Smart Grids. Luxembourg, 2006.
[dpa13] dpa Deutsche Presse-Agentur. Mit Datenmengen im Rücken: IT-Riesen ziehen auf denEnergiemarkt. Handelsblatt Online, 2013.
[Dul95] Dulfer. E.: Betriebswirtschaftslehre der Genossenschaften und vergleichbarer Koopera-tive. Vandenhoeck und Ruprecht, Göttingen, 2.. Auflage, 1995.
[Ede12] Edelmann, H.: Stadtwerke: Gestalter der Energiewende. Bericht, Ernst and Young, Düs-seldorf, 2012.
[Fie11] Fielt, E.:. Business Service Management - Volume 3 - Understanding business models.Bericht March, Smart Services CRC, Eveleigh NSW, 2011.
[Fli11] Flieger, B.: Energiegenossenschaften. Eine klimaverantwortliche, bürgernahe Energie-wirtschaft ist möglich. In Elsen, S. et al.: Ökosoziale Transformation. 2011.
[FRN+12] Filzek, D. et al.: Geschäftsmodelle fur RegModHarz. Bericht, 2012.
[Gor02] Gordijn, J.: Value-based requirements Engineering: Exploring innovative ecommerceideas. Dissertation, Vrije Universiteit Amsterdam, 2002.
[HB10] Horn, B.; Bone, G.: Developing a business model for product environmental stewardshipwithin IBM. In Int. Symp. on Sustainable Systems & Technology, IEEE, 2010.
[Her08] Herter, M.: Gut für die Entwicklung vor Ort. spw – Zeitschrift für sozialistische Politikund Wirtschaft, (166):34–37, 2008.
[HGG13] Hanschke, I.; Giesinger, G.; Goetze, D.: Business-Analyse - einfach und effektiv. CarlHanser Verlag GmbH & Co. KG, München, 2013.
[HM13] Holstenkamp, L.; Muller, J.: Zum Stand von Energiegenossenschaften in Deutschland -Ein statistischer Überblick zum 31.12.2012. 2013.

Energiegenossenschaften - Geschäftsmodelle und Wertschöpfungsnetzwerke 25
[Hol12] Holstenkamp, L.: Ansätze einer Systematisierung von Energiegenossenschaften. 2012.
[HSW+10] Heindl, M. et al.: Towards New Business Models in the Energy Sector based on Soft-ware-as-a- Service- Utilities and Value-added Services. eChallenges, 2010.
[Hue14] Huener, U.: Geschäftsmodelle für den offenen Energiemarkt. In Smart Energy – EineRoadmap für die Energiewende, München, 2014. Münchner Kreis.
[HV93] Henderson, J.; Venkatraman, N.: Strategic alignment: Leveraging information techno-logy for transforming organizations. IBM Sys. J., 32(1):472–484, 1993.
[Int15] International Co-operative Alliance. Co-operative identity, values and principles, 2015.
[JCK08] Johnson, M.; Christensen, C.; Kagermann, H.: Reinventing Your Business Model. Har-vard Business Review, 86(December), 2008.
[Kay14] Kayser, L.: Energiegenossenschaften. Eine klimaverantwortliche, bürgernahe Energie-wirtschaft ist möglich. 2014.
[KDK15] Kuller, P.; Dorsch, N.; Korsakas, A.: Energy Co-operatives Business Models: Interme-diate Result from eight Case Studies in southern Germany. In 5th International YouthConference on Energy 2015, Pisa, Italien, 2015.
[KGT04] Kartseva, V.; Gordijn, J.; Tan, Y.: Value Based Business Modelling for Network Orga-nizations: Lessons Learned from the Electricity Sector. In ECIS 2004, 2004.
[KH13] Kuller, P.; Hertweck, D.: Bedeutung von Services in einer dezentralen Energieversor-gung. HMD - Praxis der Wirtschaftsinformatik, 50(291):60–70, 2013.
[KP11] Kerssenbrock, N.; Ploss, M.: Geschäftsmodelle in der Energiewirtschaft. Energiewirt-schaftliche Tagesfragen, 62. Jg(Heft 11):72ff, 2011.
[Krc11] Krcmar, H.: Business Model Research - State of the Art and Research Agenda. Bericht,TU München, München, 2011.
[Lan12] Lange, T.: Entscheidungsunterstützung für Smart Energy. HMD - Praxis der Wirt-schaftsinformatik, 50(291):71–79, 2012.
[LKHP11] Lassila, J. et al.: Concept of strategic planning in electricity distribution business. Inter-national Journal of Energy Sector Management, 5(4):447–470, 2011.
[LST13] Loock, C.; Staake, T.; Thiesse, F.: Motivating Energy- Efficient Behavior with GreenIS. MIS Quarterly, 37(4):1313–1332, 2013.
[LUB12] LUBW: Bürger machen Energie - Rechtsformen und Tipps für Bürgerenergieanlagen.Ministerium für Umwelt, Klima und Energiewirtschaft BW, Stuttgart, 2012.
[May00] Mayring, P.: Qualitative Inhaltsanalyse: Grundlagen und Techniken. Deutscher StudienVerlag, Weinheim, 2000.
[MGV13] Marko, W.; Granda, J.; Vorbach, S.: Energiewende – Utilities New Business Models forDistributed Renewable Energy Generation. In Corporate Responsibility Research Con-ference 2013, Graz, 2013.
26 Philipp Küller et al.
[Moo96] Moore, J.: The Death of Competition: Leadership and Strategy in the Age of BusinessEcosystems. HarperCollins, New York, 1996.
[Mue06] Muenkner, H.: Europäische Genossenschaft (SCE) und europäische Genossen-schaftstradition. 2006.
[OP10] Osterwalder, A.; Pigneur, Y.: Business Model Generation - A Handbook for Visionaries,Game Changers, and Challangers. John Wiley and Sons, Hoboken, 2010.
[Pol07] Pollitt, M.: Vertical unbundling in the EU electricity sector. Intereconomics, 42(Decem-ber):292–310, 2007.
[Ric13] Richter, M.: Business model innovation for sustainable energy: German utilities and re-newable energy. Energy Policy, 62:1226–1237, 2013.
[Rit11] Ritchey, T.: Wicked Problems - Social Messes. Springer, Berlin, Heidelberg, 2011.
[RMVM12] Rauter, R. et al.: Business Model Innovation and Knowledge Transfer. In EURAMEuropean Academy of Management 2012, S. 1–35, Rotterdam, 2012.
[Sch99] Scheer, A.: ARIS - House of Business Engineering. In Becker et al. Referenzmodellie-rung. S. 1–21. Physica Verlag, Heidelberg, 1999.
[Sch14] Schallmo, D.: Theoretische Grundlagen der Geschäftsmodell-Innovation. In Schallmo,D., Kompendium Geschäftsmodell-Innovation. Springer Gabler, Wiesbaden, 2014.
[SK15] Schacht, S.; Küller, P.: Enterprise Architecture Management und Big Data. In Dorschel,J., Praxishandbuch Big Data. Springer Verlag, Wiesbaden, 2015.
[Syd10] Sydow, J.: Management von Netzwerkorganisationen. Gabler, Wiesbaden, 2010.
[The11] Theurl, T.: Genossenschaftliche Kooperationen. Trends und Zukunftsfelder. In Theurl,T., Genossenschaften auf dem Weg in die Zukunft. Aachen, 2011.
[VCB+14] Veit, D. et al.: Business Models. Business and Information Systems Engineering,6(1):45–53, Januar 2014.
[WBC13] Watson, R.; Boudreau, M.; Chen, A.: Information Systems and Environmentally Sus-tainable Development. MIS Quarterly, 34(1):23–38, 2013.
[WW02] Webster, J.; Watson, R.: Analyzing the Past to Prepare for the Future: Writing a Litera-ture Review. MIS Quarterly, 26(2):13–23, 2002.
[WWB+11] Watson, R. et al.: Energy Informatics and Business Model Generation Energy Infor-matics and Business Model Generation. Sprouts, (434), 2011.
[Yin14] Yin, R.: Case Study Research: Design and Methods. Sage, Thousand Oaks, 2014.
[Yu95] Yu, E.: Modelling strategic relationships for process reengineering. Toronto, 1995.
Alfred Zimmermann, Alexander Rossmann (Hrsg.): Digital Enterprise Computing 2015,Lecture Notes in Informatics (LNI), Gesellschaft für Informatik, Bonn 2015 27
Customer Services in the Digital Transformation:Social Media versus Hotline Channel Performance
Alexander Rossmann1 and Gerald Stei2
Abstract: Due to the digital transformation online service strategies have gained prominence inpractice as well as in the theory of service management. This study examines the efficacy of differenttypes of service channels in customer complaint handling. The theoretical framework, developedusing complaint handling and social media literature, is tested against data collected from two dif-ferent channels (hotline and social media) of a German telecommunication service provider. Wecontribute to the understanding of firm’s multichannel distribution strategy in two ways: a) by con-ceptualizing and evaluating complaint handling quality across traditional and social media channels,and b) by testing the impact of complaint handling quality on key performance outcomes like cus-tomer loyalty, positive word-of-mouth, and cross-purchase intentions.
Keywords: Multichannel, social media, word-of-mouth, customer satisfaction, customer loyalty,complaint handling.
1 IntroductionCustomer complaints are recurrent, and complaint handling is an important indicator offirm’s customer centricity and overall service quality ([HF05]). While poor complaint han-dling amplifies the negative evaluation of the overall service ([BBT90]), an excellent onecan convert complainers into fans ([SB98]). Therefore, service managers are complement-ing traditional channels with online channels and corporate social media sites for purposesof providing effective customer complaint handling services.
Due to the digital transformation firms are undertaking alterations to their channel struc-ture and are adopting multichannel structures ([YM13]). Online channels provide cost-efficiencies in distribution and superior customization and market coverage ([MM90]).Moreover, research evidence suggests that companies which complement their traditionalchannels with modern online channels are more successful ([GG00]; [Po01]). However,considerable costs are involved in the implementation of multiple channel systems([HVH14]), and channel expansion and alteration decision has a long-term impact onfirm’s performance ([CCV07]).
1 Reutlingen University, School of Informatics, Alteburgstr. 150, 72762 Reutlingen, [email protected]
2 Reutlingen University, School of Informatics, Alteburgstr. 150, 72762 Reutlingen,[email protected]
28 Alexander Rossmann and Gerald Stei
In sum, whether firms are better off using multiple channels or not remains an open ques-tion; and, even if multiple channels do lead to objective improvement in the service, theymay not necessarily result in a commensurate improvement in the customer’s perceptionof service quality ([GR11]; [HF05]). Therefore, this study examines the concept of per-ceived complaint handling quality (PCHQ), conceptualized as the complainer’s subjectiveassessment and perception of the complaint handling service ([SBW99]), and evaluates itsinfluence across different types of channels, specifically addressing the following threeresearch questions: a) how should PCHQ be conceptualized across different channels? b)how strong are the effects of different facets of PCHQ on customer satisfaction and otherkey performance outcomes? and c) how effective is customer complaint handling in socialmedia channels as compared to traditional channels?
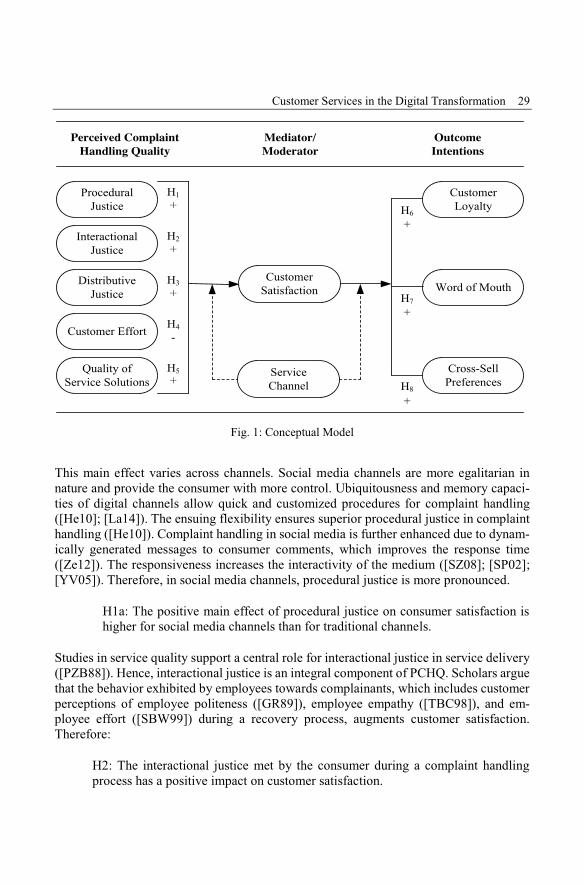
2 Conceptual ModelFigure 1 shows the five subdimensions of PCHQ derived from prior literature and anexploratory research process as (a) procedural justice, (b) interactional justice, (c) distrib-utive justice, (d) customer effort, and (e) quality of service solutions. We integrate thesefacets of PCHQ and anchor them in expectation-disconfirmation theory and equity theoryto model customer satisfaction as a mediator of the impact of PCHQ on three key perfor-mance outcomes (customer loyalty, word-of-mouth, and cross-purchase preferences).Additionally, the main effects are tested for a possible moderating role for the type ofservice channel (social media versus hotline).
Due to multimedia features such as colors, pictures, sound, animations, graphics, andinteractive components, social media channels are highly vivid. Vividness, on one hand,causes increased perceived accessibility of information ([St92]) through different sensoryelements and therefore trigger perception of superior quality and, on the other hand, itresults in formation of (higher) expectation, which, in turn, influences satisfaction andother corporate outcomes ([DGL12]; [He10]).
Procedural justice refers to the degree to which an organizational procedure for register-ing and processing customer complaints exists and is consistent with complainants’ needs([HF05]). It has been examined in terms of timing and speed and found to impact cus-tomer satisfaction ([HF05]; [SBW99]; [TBC98]). Therefore,
H1: Procedural justice in terms of timeliness and a process to solve a currentproblem positively impacts customer satisfaction.
Customer Services in the Digital Transformation 29
ProceduralJustice
InteractionalJustice
DistributiveJustice
Quality ofService Solutions
CustomerSatisfaction
Customer Effort
H1
Perceived ComplaintHandling Quality
Mediator/Moderator
OutcomeIntentions
CustomerLoyalty
Cross-SellPreferences
Word of Mouth
H2
H3
H4
H5
H6
H7
H8
ServiceChannel
+
+
+
-
+
+
+
+
Fig. 1: Conceptual Model
This main effect varies across channels. Social media channels are more egalitarian innature and provide the consumer with more control. Ubiquitousness and memory capaci-ties of digital channels allow quick and customized procedures for complaint handling([He10]; [La14]). The ensuing flexibility ensures superior procedural justice in complainthandling ([He10]). Complaint handling in social media is further enhanced due to dynam-ically generated messages to consumer comments, which improves the response time([Ze12]). The responsiveness increases the interactivity of the medium ([SZ08]; [SP02];[YV05]). Therefore, in social media channels, procedural justice is more pronounced.
H1a: The positive main effect of procedural justice on consumer satisfaction ishigher for social media channels than for traditional channels.
Studies in service quality support a central role for interactional justice in service delivery([PZB88]). Hence, interactional justice is an integral component of PCHQ. Scholars arguethat the behavior exhibited by employees towards complainants, which includes customerperceptions of employee politeness ([GR89]), employee empathy ([TBC98]), and em-ployee effort ([SBW99]) during a recovery process, augments customer satisfaction.Therefore:
H2: The interactional justice met by the consumer during a complaint handlingprocess has a positive impact on customer satisfaction.
30 Alexander Rossmann and Gerald Stei
Social media allows ease of partnering and engagement between firm and consumer([Pe13]). The company’s actions, including the service delivery effort, are more transpar-ent and visible ([He10]). According to parasocial interaction (PSI) theory ([La14]), socialmedia offer an illusionary experience of engagement and reciprocal relationship with me-diating person. PSI causes positive effects such as creating connections as real life friendsand affirm relationship with the mediated source ([GGB91]; [HW56]). Thus, on one hand,the influence of PSI in social media communication makes the customers feel better aboutthe way they are treated; on the other, due to the vividness property of social media, inter-actional justice is rendered more accessible. In complaint handling using social media ser-vice, although it is true that responses typically originate from prewritten scripts and fromdifferent service employees, due to the perceived interactivity and openness of the socialmedia, PSI effects are triggered so that consumers attribute the service responses to a sin-gle source, i.e., the brand as a source of interaction quality. Therefore, we hypothesize astronger effect of interactional justice on customer satisfaction in social media comparedto the same effect in traditional channels.
H2a: The positive effect of interactional justice on customer satisfaction is higherin social media channels than in traditional channels.
Distributive justice refers to whether or not the ratio of an individual’s output (benefits) toinput (financial and nonfinancial efforts) is balanced with that of relevant others. The con-struct is rooted in equity theory ([Ad65]). If the differences between input and output arein the individual’s favor, the result may be a feeling of guilt or regret, and if they aredetrimental to the individual, this may result in a feeling of disappointment or anger. Eq-uity theory predicts that in either situation individuals try to arrive at a state of equilibrium.Customers who perceive the organizational response to a complaint as fair are more satis-fied than those who perceive the response as unfair ([GR11]; [PCE06]; [SBW99]).
H3: Distributive justice with respect to organizational responses to complaintshas a positive impact on customer satisfaction.
Social media allows cost effective and personalized procedures for customers and can nowchange the intensity and meaning of messages in multiple ways ([DGL12]). They are in-formative and educational because of the multitude of socialization agents ([TLS11]), notto mention the role played by peer consumers, who also enable resolution of doubts andqueries. The higher interactivity increases the possibility of affective and convenient so-cialization ([Mu08]). Therefore, even when the firm puts in the same level of effort, socialmedia brings greater interactional benefits to the consumer. Therefore, we hypothesizecross-channel a stronger effect of distributive justice on satisfaction for complaint han-dling via social media.
H3a: The positive effect of distributive justice on customer satisfaction is higherin social media channels than in traditional channels.
Customer Services in the Digital Transformation 31
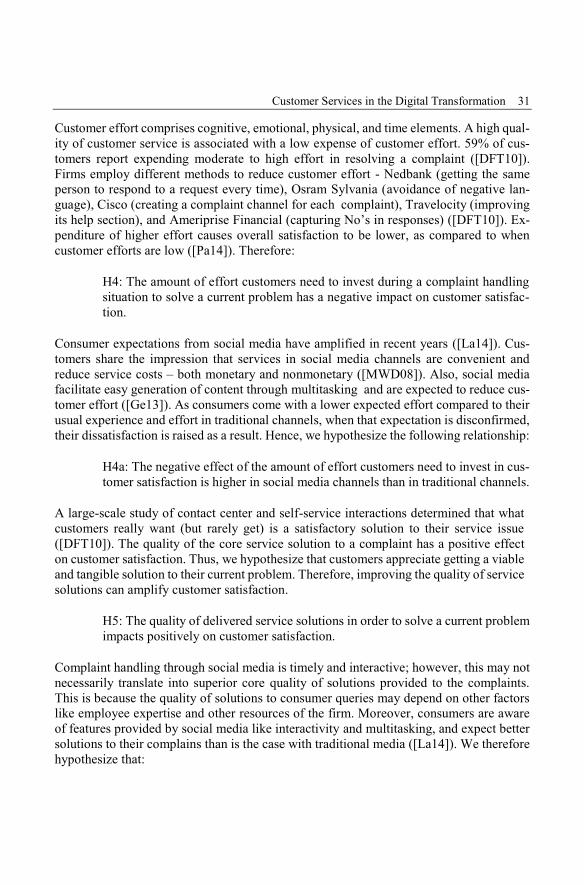
Customer effort comprises cognitive, emotional, physical, and time elements. A high qual-ity of customer service is associated with a low expense of customer effort. 59% of cus-tomers report expending moderate to high effort in resolving a complaint ([DFT10]).Firms employ different methods to reduce customer effort - Nedbank (getting the sameperson to respond to a request every time), Osram Sylvania (avoidance of negative lan-guage), Cisco (creating a complaint channel for each complaint), Travelocity (improvingits help section), and Ameriprise Financial (capturing No’s in responses) ([DFT10]). Ex-penditure of higher effort causes overall satisfaction to be lower, as compared to whencustomer efforts are low ([Pa14]). Therefore:
H4: The amount of effort customers need to invest during a complaint handlingsituation to solve a current problem has a negative impact on customer satisfac-tion.
Consumer expectations from social media have amplified in recent years ([La14]). Cus-tomers share the impression that services in social media channels are convenient andreduce service costs – both monetary and nonmonetary ([MWD08]). Also, social mediafacilitate easy generation of content through multitasking and are expected to reduce cus-tomer effort ([Ge13]). As consumers come with a lower expected effort compared to theirusual experience and effort in traditional channels, when that expectation is disconfirmed,their dissatisfaction is raised as a result. Hence, we hypothesize the following relationship:
H4a: The negative effect of the amount of effort customers need to invest in cus-tomer satisfaction is higher in social media channels than in traditional channels.
A large-scale study of contact center and self-service interactions determined that whatcustomers really want (but rarely get) is a satisfactory solution to their service issue([DFT10]). The quality of the core service solution to a complaint has a positive effecton customer satisfaction. Thus, we hypothesize that customers appreciate getting a viableand tangible solution to their current problem. Therefore, improving the quality of servicesolutions can amplify customer satisfaction.
H5: The quality of delivered service solutions in order to solve a current problemimpacts positively on customer satisfaction.
Complaint handling through social media is timely and interactive; however, this may notnecessarily translate into superior core quality of solutions provided to the complaints.This is because the quality of solutions to consumer queries may depend on other factorslike employee expertise and other resources of the firm. Moreover, consumers are awareof features provided by social media like interactivity and multitasking, and expect bettersolutions to their complains than is the case with traditional media ([La14]). We thereforehypothesize that:
32 Alexander Rossmann and Gerald Stei
H5a: The positive effect of the perceived quality of delivered service solutionson customer satisfaction is lower in social media channels than in traditionalchannels.
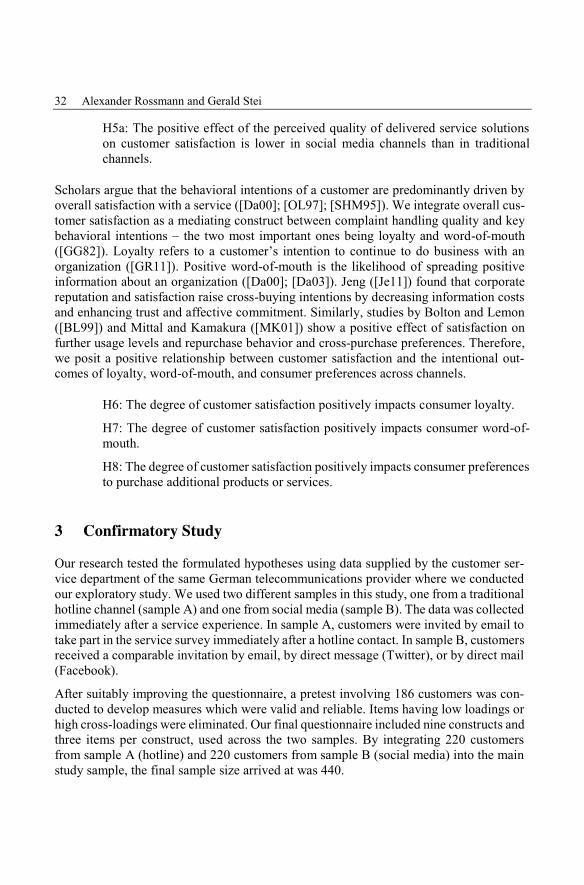
Scholars argue that the behavioral intentions of a customer are predominantly driven byoverall satisfaction with a service ([Da00]; [OL97]; [SHM95]). We integrate overall cus-tomer satisfaction as a mediating construct between complaint handling quality and keybehavioral intentions – the two most important ones being loyalty and word-of-mouth([GG82]). Loyalty refers to a customer’s intention to continue to do business with anorganization ([GR11]). Positive word-of-mouth is the likelihood of spreading positiveinformation about an organization ([Da00]; [Da03]). Jeng ([Je11]) found that corporatereputation and satisfaction raise cross-buying intentions by decreasing information costsand enhancing trust and affective commitment. Similarly, studies by Bolton and Lemon([BL99]) and Mittal and Kamakura ([MK01]) show a positive effect of satisfaction onfurther usage levels and repurchase behavior and cross-purchase preferences. Therefore,we posit a positive relationship between customer satisfaction and the intentional out-comes of loyalty, word-of-mouth, and consumer preferences across channels.
H6: The degree of customer satisfaction positively impacts consumer loyalty.
H7: The degree of customer satisfaction positively impacts consumer word-of-mouth.
H8: The degree of customer satisfaction positively impacts consumer preferencesto purchase additional products or services.
3 Confirmatory StudyOur research tested the formulated hypotheses using data supplied by the customer ser-vice department of the same German telecommunications provider where we conductedour exploratory study. We used two different samples in this study, one from a traditionalhotline channel (sample A) and one from social media (sample B). The data was collectedimmediately after a service experience. In sample A, customers were invited by email totake part in the service survey immediately after a hotline contact. In sample B, customersreceived a comparable invitation by email, by direct message (Twitter), or by direct mail(Facebook).
After suitably improving the questionnaire, a pretest involving 186 customers was con-ducted to develop measures which were valid and reliable. Items having low loadings orhigh cross-loadings were eliminated. Our final questionnaire included nine constructs andthree items per construct, used across the two samples. By integrating 220 customersfrom sample A (hotline) and 220 customers from sample B (social media) into the mainstudy sample, the final sample size arrived at was 440.
Customer Services in the Digital Transformation 33
The conceptual model was tested in a two-stage research process – (a) structural equationmodeling (SEM) was deemed suitable for testing the measurement model and estimatingthe main effects, (b) a multisample analysis to compare the hypothesized effects acrossthe two channels ([Co93]).
After the measurement models were deemed acceptable, we devised a structural pathmodel to test the hypotheses depicted in Figure 1. The fit indexes for the cross-channelsample (n= 440) (χ2(300) = 512.09, CFI= .991; NFI= .981; NNFI=.990; RMSEA = .040)suggest that the model acceptably fits the data ([By13]). A chi-square difference test re-veals that a model with direct effects (direct paths from the antecedent variables to thethree target variables) does not have significantly better fit indexes than our full mediationmodel, suggesting that our model provides a parsimonious explanation of the data([BY88]).
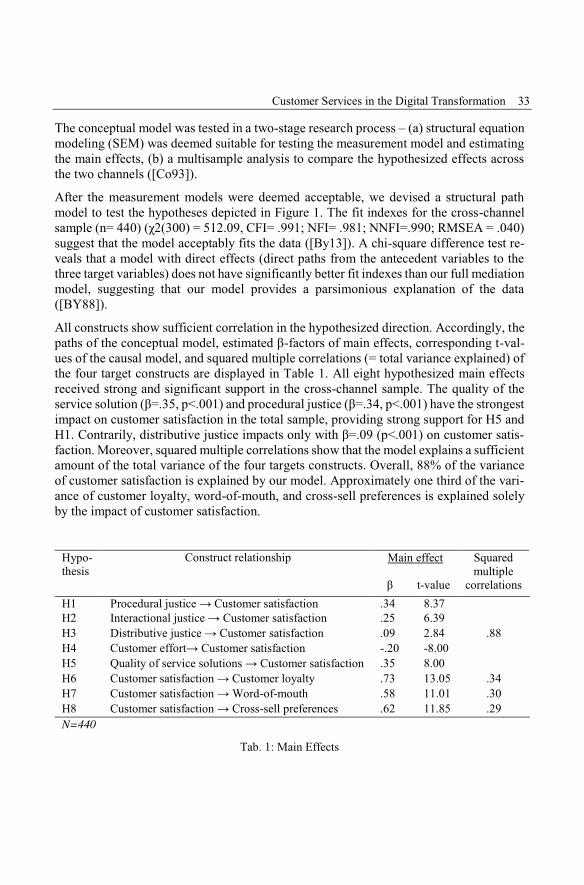
All constructs show sufficient correlation in the hypothesized direction. Accordingly, thepaths of the conceptual model, estimated β-factors of main effects, corresponding t-val-ues of the causal model, and squared multiple correlations (= total variance explained) ofthe four target constructs are displayed in Table 1. All eight hypothesized main effectsreceived strong and significant support in the cross-channel sample. The quality of theservice solution (β=.35, p<.001) and procedural justice (β=.34, p<.001) have the strongestimpact on customer satisfaction in the total sample, providing strong support for H5 andH1. Contrarily, distributive justice impacts only with β=.09 (p<.001) on customer satis-faction. Moreover, squared multiple correlations show that the model explains a sufficientamount of the total variance of the four targets constructs. Overall, 88% of the varianceof customer satisfaction is explained by our model. Approximately one third of the vari-ance of customer loyalty, word-of-mouth, and cross-sell preferences is explained solelyby the impact of customer satisfaction.
Hypo-thesis
Construct relationship Main effect
β t-value
Squaredmultiple
correlationsH1 Procedural justice → Customer satisfaction .34 8.37H2 Interactional justice → Customer satisfaction .25 6.39H3 Distributive justice → Customer satisfaction .09 2.84 .88H4 Customer effort→ Customer satisfaction -.20 -8.00H5 Quality of service solutions → Customer satisfaction .35 8.00H6 Customer satisfaction → Customer loyalty .73 13.05 .34H7 Customer satisfaction → Word-of-mouth .58 11.01 .30H8 Customer satisfaction → Cross-sell preferences .62 11.85 .29N=440
Tab. 1: Main Effects
34 Alexander Rossmann and Gerald Stei
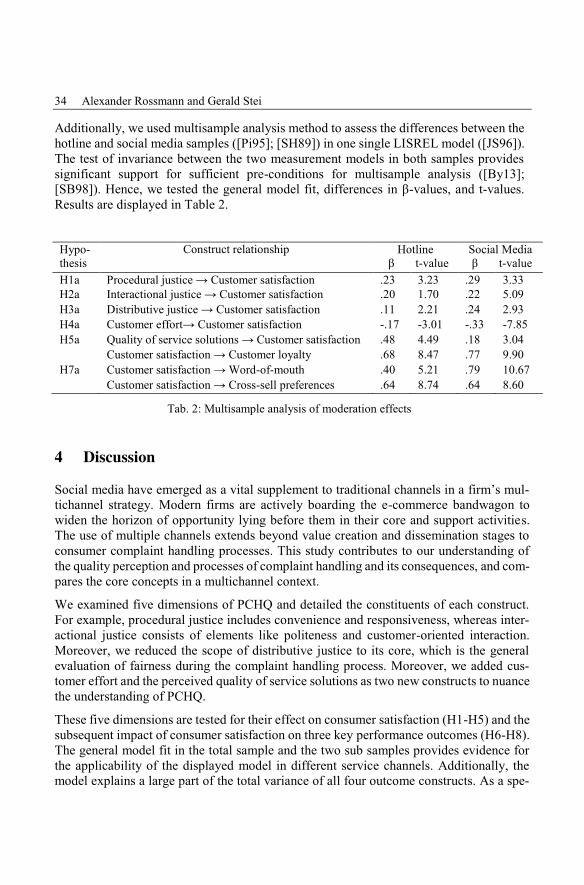
Additionally, we used multisample analysis method to assess the differences between thehotline and social media samples ([Pi95]; [SH89]) in one single LISREL model ([JS96]).The test of invariance between the two measurement models in both samples providessignificant support for sufficient pre-conditions for multisample analysis ([By13];[SB98]). Hence, we tested the general model fit, differences in β-values, and t-values.Results are displayed in Table 2.
Hypo-thesis
Construct relationship Hotlineβ t-value
Social Mediaβ t-value
H1a Procedural justice → Customer satisfaction .23 3.23 .29 3.33H2a Interactional justice → Customer satisfaction .20 1.70 .22 5.09H3a Distributive justice → Customer satisfaction .11 2.21 .24 2.93H4a Customer effort→ Customer satisfaction -.17 -3.01 -.33 -7.85H5a Quality of service solutions → Customer satisfaction .48 4.49 .18 3.04
Customer satisfaction → Customer loyalty .68 8.47 .77 9.90H7a Customer satisfaction → Word-of-mouth .40 5.21 .79 10.67
Customer satisfaction → Cross-sell preferences .64 8.74 .64 8.60
Tab. 2: Multisample analysis of moderation effects
4 DiscussionSocial media have emerged as a vital supplement to traditional channels in a firm’s mul-tichannel strategy. Modern firms are actively boarding the e-commerce bandwagon towiden the horizon of opportunity lying before them in their core and support activities.The use of multiple channels extends beyond value creation and dissemination stages toconsumer complaint handling processes. This study contributes to our understanding ofthe quality perception and processes of complaint handling and its consequences, and com-pares the core concepts in a multichannel context.
We examined five dimensions of PCHQ and detailed the constituents of each construct.For example, procedural justice includes convenience and responsiveness, whereas inter-actional justice consists of elements like politeness and customer-oriented interaction.Moreover, we reduced the scope of distributive justice to its core, which is the generalevaluation of fairness during the complaint handling process. Moreover, we added cus-tomer effort and the perceived quality of service solutions as two new constructs to nuancethe understanding of PCHQ.
These five dimensions are tested for their effect on consumer satisfaction (H1-H5) and thesubsequent impact of consumer satisfaction on three key performance outcomes (H6-H8).The general model fit in the total sample and the two sub samples provides evidence forthe applicability of the displayed model in different service channels. Additionally, themodel explains a large part of the total variance of all four outcome constructs. As a spe-
Customer Services in the Digital Transformation 35
cific theoretical contribution, an improved understanding of PCHQ would give fresh im-petus to research around these constructs. Particularly, the results of this research foster amore differentiated view about PCHQ and demonstrate the insights executives might de-rive for a multichannel strategy.
A multigroup SEM using samples from a traditional hotline channel and a social mediachannel indicates the comparative efficacy of the two types of channels. This leads to someimportant differences in effect size and carries implications for specific channel strategies.Social media makes the role of distributive justice (βSOCIAL=.25) and consumer effort(βSOCIAL=-.33) more salient, indicating that firms need to manage these two factorsclosely in pursuit of a social media channel strategy. On the other hand, the role of coreservice quality is of umpteen importance in the traditional channel strategy (βHOT=.48).The results also indicate that a satisfied customer in a social media channel is a su-perior asset for a firm than a customer served through traditional channels, because theformer is more inclined to generate word-of-mouth communication (βSOCIAL=.79).
While scholarly research is divided on the importance of social media as an alternativechannel of distribution, corporate executives believe that social media channels are supe-rior in performance in complaint handling and resort to implementing multiple channels.Our findings indicate that any increase in customer effort in respect of complaint handlingin social media might substantially reduce satisfaction as compared to traditional media.Additionally, our results show precisely the points of benefits where online channels canbe used in tandem with traditional channels and in what situations firm should not opt forfeature-rich channels like social media. For example, the impact of all perceived justicedimensions on satisfaction is higher in social media than in hotline; however, consumersavailing services from traditional channels value the core service quality more than any-thing else – this is so because, while social media do not affect the core service, they raisethe customer’s expectation from the channel, place the channel at risk of higher negativedisconfirmation of consumer expectation. Therefore, social media act also as vehicles ofcommunication media, while the traditional hotline is more of a solution channel.
Many firms are using multiple channels, including social media, to provide complainthandling services. The findings of our research are relevant to such practices, offeringuseful diagnostic insight into plausible replacement and channel migration decisions. Weillustrate that it is not always in the firm’s best interest to use feature-rich channels likesocial media. Though use of social media channels is expected to improve the quality ofsolutions and reduce consumer effort, the marginal impact of these on satisfaction andsubsequently on behavioral intentions is lower as compared to traditional media. Manag-ing service expectation should be an important component in channel design and change.However, social media have many features that lead to a reduction of customer effort,whereas consumer awareness of these features will result in high expectations. Whensuch expectations are tactfully managed, social media can be a cost effective replacementfor traditional channels.
36 Alexander Rossmann and Gerald Stei
References[Ad65] Adams, J. S.: Inequity in social exchange. Advances in Experimental Social Psychology,
2, pp. 267-299, 1965.
[BY88] Bagozzi, R. P.; Yi, Y.: On the Evaluation of Structural Equation Models. Journal of theAcademy of Marketing Science, 16(1), pp. 74–94, 1988.
[BBT90] Bitner, M. J.; Booms, B. H.; Tetreault, M. S.: The Service Encounter: Diagnosing Fa-vorable and Unfavorable Incidents. The Journal of Marketing, pp. 71–84, 1990.
[BL99] Bolton, R. N.; Lemon, K. N.: A Dynamic Model of Customers’ Usage of Services: Us-age as an Antecedent and Consequence of Satisfaction. Journal of Marketing Research,36(2), pp. 171-186, 1999.
[By13] Byrne, B. M.: Structural Equation Modeling with LISREL, PRELIS, and SIMPLIS:Basic Concepts, Applications, and Programming. Psychology Press, 2013.
[CCV07] Chu, J.; Chintagunta, P. K.; Vilcassim, N. J.: Assessing the Eonomic Value of Distribu-tion Channels: An Application to the Personal Computer Industry. Journal of MarketingResearch, 44(1), pp. 29–41, 2007.
[Co93] Cole, D. A.; Maxwell, S. E.; Arvey, R.; Salas, E.: Multivariate Group Comparisons ofVariable Systems: MANOVA and Structural Equation Modeling. Psychological Bulle-tin, 114(1), pp. 174-184, 1993.
[Da00] Davidow, M.: The Bottom Line Impact of Organizational Responses to Customer Com-plaints. Journal of Hospitality & Tourism Research, 24(4), pp. 473–490, 2000.
[DGL12] De Vries, L.; Gensler, S.; Leeflang, P. S. H.: Popularity of Brand Posts on Brand FanPages: An Investigation of the Effects of Social Media Marketing. Journal of InteractiveMarketing, 26(2), pp. 83–91, 2012.
[DFT10] Dixon, M.; Freeman, K.; Toman, N.: STOP Trying to Delight Your Customers. HarvardBusiness Review, 88(7/8), pp. 116–122, 2010.
[Ge13] Gensler, S.; Völckner, F.; Liu-Thompkins, Y.; Wiertz, C.: Managing Brands in the So-cial Media Environment. Journal of Interactive Marketing, 27(4), pp. 242–256, 2013.
[GG82] Gilly, M. C.; Gelb, B. D.: Post-Purchase Consumer Processes and the Complaining Con-sumer. Journal of Consumer Research, 9(3), pp. 323–328, 1982.
[GR89] Goodwin, C.; Ross, I.: Salient Dimensions of Perceived Fairness in Resolution of Ser-vice Complaints. Journal of Consumer Satisfaction, Dissatisfaction and ComplainingBehavior, 2(14), pp. 87–92, 1989.
[GGB91] Grant, A. E.; Guthrie, K. K.; Ball-Rokeach, S. J.: Television Shopping A Media SystemDependency Perspective. Communication Research, 18(6), pp. 773–798, 1991.
[GG00] Gulati, R.; Garino, J.: Get the Right Mix of Bricks and Clicks. Harvard Business Review,78(3), pp. 107–117, 2000.
[He10] Hennig-Thurau, T.; Malthouse, E. C.; Friege, C.; Gensler, S.; Lobschat, L.;Rangaswamy, A.; Skiera, B.: The Impact of New Media on Customer Relationships.Journal of Service Research, 13(3), pp. 311–330, 2010.
Customer Services in the Digital Transformation 37
[HF05] Homburg, C.; Fürst, A.: How Organizational Complaint Handling Drives CustomerLoyalty: An Analysis of the Mechanistic and the Organic Approach. Journal of Market-ing, 69(3), pp. 95–114, 2005.
[HVH14] Homburg, C.; Vollmayr, J.; Hahn, A.: Firm Value Creation Through Major ChannelExpansions: Evidence from an Event Study in the United States, Germany, and China.Journal of Marketing, 78(3), pp. 38–61, 2014.
[HW56] Horton, D.; Wohl, R. R.: Mass Communication and Para-Social Interaction: Observa-tions on Intimacy at a Distance. Psychiatry, 19(3), pp. 215–229, 1956.
[Je11] Jeng, S.-P.: The Effect of Corporate Reputations on Customer Perceptions and Cross-Buying Intentions. The Service Industries Journal, 31(6), pp. 851–862, 2011.
[KPL13] Kumar, V.; Petersen, J. A.; Leone, R. P.: Defining, Measuring, and Managing BusinessReference Value. Journal of Marketing, 77(1), pp. 68–86, 2013.
[MWD08] Mathwick, C.; Wiertz, C.; De Ruyter, K.: Social Capital Production in a Virtual P3 Com-munity. Journal of Consumer Research, 34(6), pp. 832–849, 2008.
[MK01] Mittal, V.; Kamakura, W. A.: Satisfaction, Repurchase Intent, and Repurchase Behavior:Investigating the Moderating Effect of Customer Characteristics. Journal of MarketingResearch, 38(1), pp. 131–142, 2001.
[MM90] Moriarty, R. T.; Moran, U.: Managing Hybrid Marketing Systems. Harvard BusinessReview, 68(6), pp. 146–155, 1990.
[Mu08] Muratore, I.: Teenagers, Blogs and Socialization: A Case Study of Young French Blog-gers. Young Consumers: Insight and Ideas for Responsible Marketers, 9(2), pp. 131–142, 2008.
[OL97] Oliver, R. L.: Satisfaction: A Behavioral Perspective on the Customer. New York, 1997.
[Pa14] Pappas, I. O.; Pateli, A. G.; Giannakos, M. N.; Chrissikopoulos, V.: Moderating Effectsof Online Shopping Experience on Customer Satisfaction and Repurchase Intentions.International Journal of Retail & Distribution Management, 42(3), pp. 187–204, 2014.
[PZB88] Parasuraman, A.; Zeithaml, V. A.; Berry, L. L.: SERVQUAL: A Multiple-Item Scalefor Measuring Consumer Perceptions of Service Quality. Journal of Retailing, 64(1), pp.12-40, 1988.
[PCE06] Patterson, P. G.; Cowley, E.; Prasongsukarn, K.; Service Failure Recovery: The Moder-ating Impact of Individual-Level Cultural Value Orientation on Perceptions of Justice.International Journal of Research in Marketing, 23(3), pp. 263–277, 2006.
[Pe13] Peters, K.; Chen, Y.; Kaplan, A. M.; Ognibeni, B.; Pauwels, K.: Social Media Metrics -A Framework and Guidelines for Managing Social Media. Journal of Interactive Mar-keting, 27(4), pp. 281–298, 2013.
[Pi95] Ping Jr., R. A.: A Parsimonious Estimating Technique for Interaction and Quadratic La-tent Variables. Journal of Marketing Research, 32(3), pp. 336–347, 1995.
[Po01] Porter, M. E.: Strategy and the Internet. Harvard Business Review, 79(3), pp. 62–79,2001.
38 Alexander Rossmann and Gerald Stei
[SB98] Smith, A. K.; Bolton, R. N.: An Experimental Investigation of Customer Reactions toService Failure and Recovery Encounters: Paradox or Peril? Journal of Service Re-search, 1(1), pp. 65–81, 1998.
[SBW99] Smith, A. K.; Bolton, R. N.; Wagner, J.: A Model of Customer Satisfaction With ServiceEncounters Involving Failure and Recovery. Journal of Marketing Research, 36(3), pp.356–372, 1999.
[SZ08] Song, J. H.; Zinkhan, G. M.: Determinants of Perceived Web Site Interactivity. Journalof Marketing, 72(2), pp. 99–113, 2008.
[SHM95] Spreng, R. A.; Harrell, G. D.; Mackoy, R. D.: Service Recovery: Impact on Satisfactionand Intentions. The Journal of Services Marketing, 9(1), pp. 15–23, 1995.
[St92] Steuer, J.: Defining Virtual Reality: Dimensions Determining Telepresence. Journal ofCommunication, 42(4), pp. 73–93, 1992.
[SP02] Stewart, D. W.; Pavlou, P. A.: From Consumer Response to Active Consumer: Measur-ing the Effectiveness of Interactive Media. Journal of the Academy of Marketing Sci-ence, 30(4), pp. 376–396, 2002.
[TBC98] Tax, S. S.; Brown, S. W.; Chandrashekaran, M.: Customer Evaluations of Service Com-plaint Experiences: Implications for Relationship Marketing. Journal of Marketing,62(2), pp. 60–76, 1998.
[TLS11] Taylor, D. G.; Lewin, J. E.; Strutton, D.: Friends, Fans, and Followers: Do Ads Workon Social Networks? Journal of Advertising Research, 51(1), pp. 258–275, 2011.
[YV05] Yadav, M. S.; Varadarajan, R.: Interactivity in the Electronic Marketplace: An Exposi-tion of the Concept and Implications for Research. Journal of the Academy of MarketingScience, 33(4), pp. 585–603, 2005.
[YM13] Young, J. A.; Merritt, N. J.: Marketing Channels: A Content Analysis of Recent Re-search, 2010–2012. Journal of Marketing Channels, 20(3-4), pp. 224–238, 2013.
[Ze12] Zebida, H.: TweetAdder: Simply the Fastest Way to Manage Twitter Account,http://www.famousbloggers.net/tweetadder-review.html, Retrieved July 25, 2014.
Alfred Zimmermann, Alexander Rossmann (Hrsg.): Digital Enterprise Computing 2015,Lecture Notes in Informatics (LNI), Gesellschaft für Informatik, Bonn 2015 39
Appflation – A Phenomenon to be considered for FutureDigital Services
Shéhérazade Benzerga1, Michael Pretz2, Dr. Andreas Riegg3, Wilfried Reimann4 andAhmed Bounfour5
Abstract: In recent years, the society has experienced a remarkable change that induced shifts inbehavior of people and companies. This effect is reinforced by the evolution of current and theemergence of new technologies such as Smartphones. In this paper it is aimed to contribute to theestablishment of a research area for both academic and industrial researchers on what will be de-scribed in the following as appflation. First a brief evaluation of the effects of mobile devices andapplication services on the ongoing digital transformation and the customer/company relationship isprovided. Second a definition of appflation is given and the origin and impact of this phenomenonis analyzed by considering the customer and the company side. This analysis is supported by a sur-vey amongst Smartphone users, generally confirming that amongst a vast number of installed appsonly a very small number actually is used. Additionally, this survey was used to briefly analyze theusage behavior of the participants in relation to the so called primary IT trends. Finally, in order toencourage researchers to advance the field future areas of interest are identified and drivers that willaffect the appflation phenomenon in the future are outlined.
Keywords: Hier stehen Stichworten, die das Thema des Beitrags am besten beschreiben. Die For-matierung ist äquivalent zu der des Abstracts, nur ist vor dem Absatz ein Abstand von 6pt statt 30pt.
1 Review of literature
1.1 The Digital transformation through the use of mobile devices
What defines mobile devices? It is the smartphone, the tablet, the wearables and all thedevices that in the last years are influencing our daily life. In fact they are omnipresent inevery aspect of life and if we consider the definition of the digital business transformationthat the IMD gives: “An organizational change through the use of digital technologies tomaterially improve performance” [MW14] it can be surely considered that mobile devicesare enabling this transformation. From the recent analysis of ABI Research (cf. fig. 1) itcan be observed that mobile devices like Smartphones are of an increasing importance inthe market. How can a small object influence the society so much? Briefly, this is enabled
1 Daimler AG / University Paris Sud, ITM/CE / RITM & European chair on intellectual capital, Epplestrasse225, 70546 Stuttgart, [email protected] [email protected]
2 Daimler AG, ITM/CE, Epplestrasse 225, 70546 Stuttgart, [email protected] Daimler AG, ITM/CE, Epplestrasse 225, 70546 Stuttgart, [email protected] Daimler AG, ITM/CE, Epplestrasse 225, 70546 Stuttgart, [email protected] University Paris Sud, RITM, , 54 Bd Desgranges, 92330 Sceaux, [email protected]
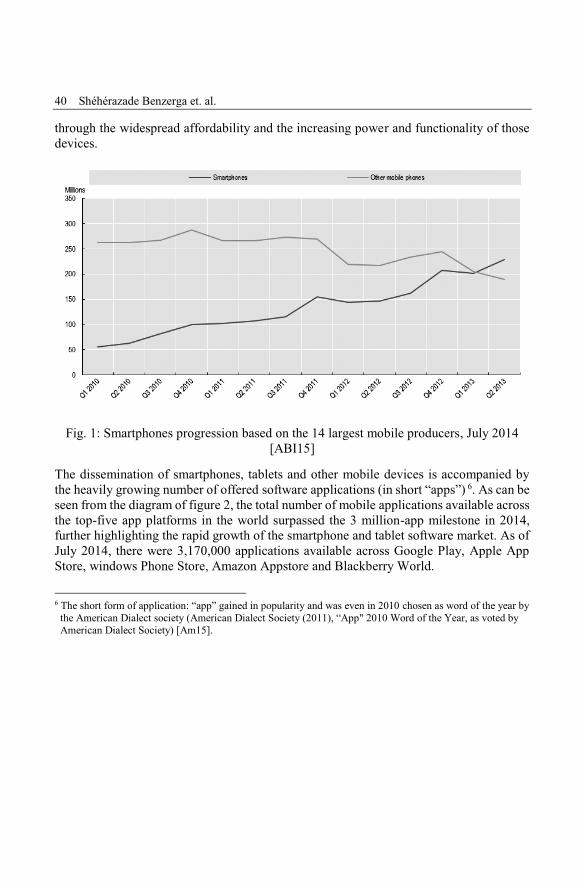
40 Shéhérazade Benzerga et. al.
through the widespread affordability and the increasing power and functionality of thosedevices.
Fig. 1: Smartphones progression based on the 14 largest mobile producers, July 2014[ABI15]
The dissemination of smartphones, tablets and other mobile devices is accompanied bythe heavily growing number of offered software applications (in short “apps”) 6. As can beseen from the diagram of figure 2, the total number of mobile applications available acrossthe top-five app platforms in the world surpassed the 3 million-app milestone in 2014,further highlighting the rapid growth of the smartphone and tablet software market. As ofJuly 2014, there were 3,170,000 applications available across Google Play, Apple AppStore, windows Phone Store, Amazon Appstore and Blackberry World.
6 The short form of application: “app” gained in popularity and was even in 2010 chosen as word of the year bythe American Dialect society (American Dialect Society (2011), “App" 2010 Word of the Year, as voted byAmerican Dialect Society) [Am15].
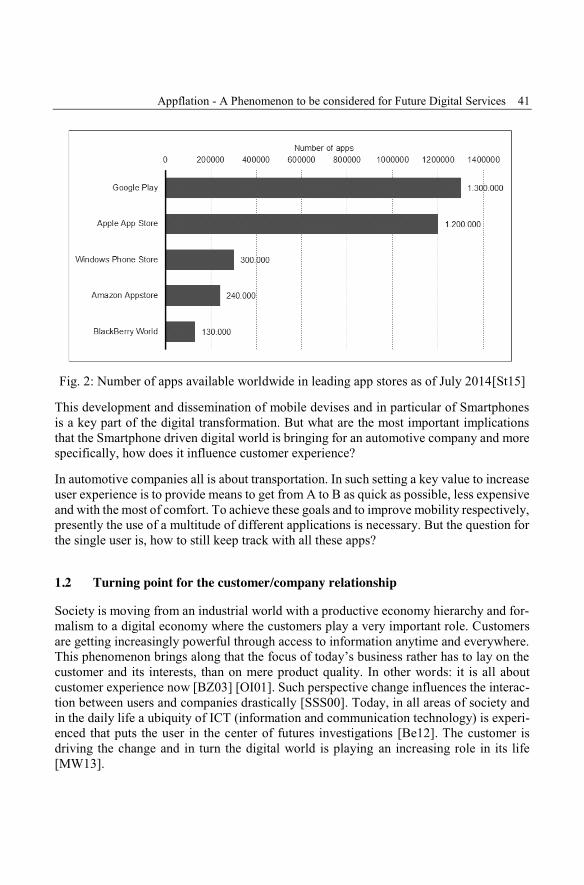
Appflation - A Phenomenon to be considered for Future Digital Services 41
Fig. 2: Number of apps available worldwide in leading app stores as of July 2014[St15]
This development and dissemination of mobile devises and in particular of Smartphonesis a key part of the digital transformation. But what are the most important implicationsthat the Smartphone driven digital world is bringing for an automotive company and morespecifically, how does it influence customer experience?
In automotive companies all is about transportation. In such setting a key value to increaseuser experience is to provide means to get from A to B as quick as possible, less expensiveand with the most of comfort. To achieve these goals and to improve mobility respectively,presently the use of a multitude of different applications is necessary. But the question forthe single user is, how to still keep track with all these apps?
1.2 Turning point for the customer/company relationshipSociety is moving from an industrial world with a productive economy hierarchy and for-malism to a digital economy where the customers play a very important role. Customersare getting increasingly powerful through access to information anytime and everywhere.This phenomenon brings along that the focus of today’s business rather has to lay on thecustomer and its interests, than on mere product quality. In other words: it is all aboutcustomer experience now [BZ03] [OI01]. Such perspective change influences the interac-tion between users and companies drastically [SSS00]. Today, in all areas of society andin the daily life a ubiquity of ICT (information and communication technology) is experi-enced that puts the user in the center of futures investigations [Be12]. The customer isdriving the change and in turn the digital world is playing an increasing role in its life[MW13].
42 Shéhérazade Benzerga et. al.
A multiplier for this effect was the introduction of the Apple App Store in 2008, the firstsuccessful platform-based service market place, which brought along a new era of mobileservice delivery. This allowed for an autonomous searching, comparing and purchasing ofmobile services and so for a rapid increase of functionality of the user devices [Cr10][JB13].
2 Appflation
2.1 Definition
Namjae Cho defined that “the new smart phone is an offspring of digital convergence ofnetwork, media, and electronic equipment. Smart phone, being an enabler of telecommu-nications network and open internet network access, help business people use diversemodes of date, information, images, and video on a unified mobile application platform”[Na13].
As observed by Aarts and Dijksterhuis, the decision, which specific apps to download andinstall on such device is driven by the social environment [AD00] of the respective cus-tomer then. People tend to download broadly successful apps or such apps which specifi-cally are popular in their immediate environment. But is the single customer aware of allthe installed apps at all times and does he/she really use them in consequence?
Where in non-digital times the customer easily lost overview e.g. due to a multitude ofloyalty cards and systems, today in the digital era, a similar phenomenon is experiencedwith apps. As the famous slogan of Apple “there is an app for that” [Ap15] shows, mobileapplications exist for everything. And the number of those apps is steadily increasing. Ifthe inflation of apps continues this way, how can an effective usage of the services pro-vided by these apps being safeguarded? Or in other words: How to manage this inflation?Might app technology even be considered as a burden for the customer experience?
The analysis of such inflation of mobile applications will be in the center of this research,with the overall phenomenon being named Appflation (App + inflation #Appflation).Let’s analyze this phenomenon from the two relevant perspectives first – from the cus-tomer perspective on the one hand, and the company’s perspective on the other:
2.2 The customer sideOn the customer side – as shown in a Gartner statistic – it can be observed that the appsector is experiencing a real boom. Already in the last year the 100 Billion apps downloadmark was reached and Gartner assumes that this phenomenon is just at its beginning, withpossibly 200 Billion apps downloaded in 2016 then:
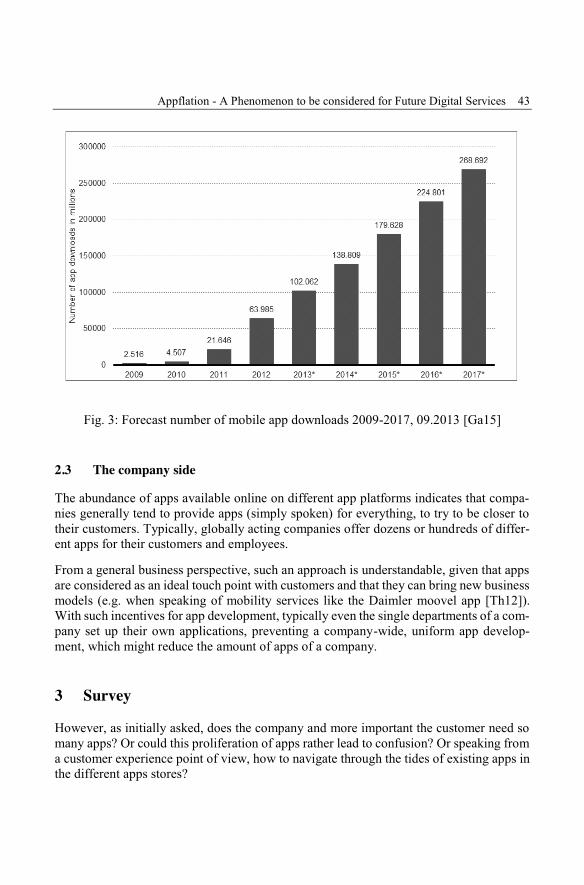
Appflation - A Phenomenon to be considered for Future Digital Services 43
Fig. 3: Forecast number of mobile app downloads 2009-2017, 09.2013 [Ga15]
2.3 The company sideThe abundance of apps available online on different app platforms indicates that compa-nies generally tend to provide apps (simply spoken) for everything, to try to be closer totheir customers. Typically, globally acting companies offer dozens or hundreds of differ-ent apps for their customers and employees.
From a general business perspective, such an approach is understandable, given that appsare considered as an ideal touch point with customers and that they can bring new businessmodels (e.g. when speaking of mobility services like the Daimler moovel app [Th12]).With such incentives for app development, typically even the single departments of a com-pany set up their own applications, preventing a company-wide, uniform app develop-ment, which might reduce the amount of apps of a company.
3 SurveyHowever, as initially asked, does the company and more important the customer need somany apps? Or could this proliferation of apps rather lead to confusion? Or speaking froma customer experience point of view, how to navigate through the tides of existing apps inthe different apps stores?
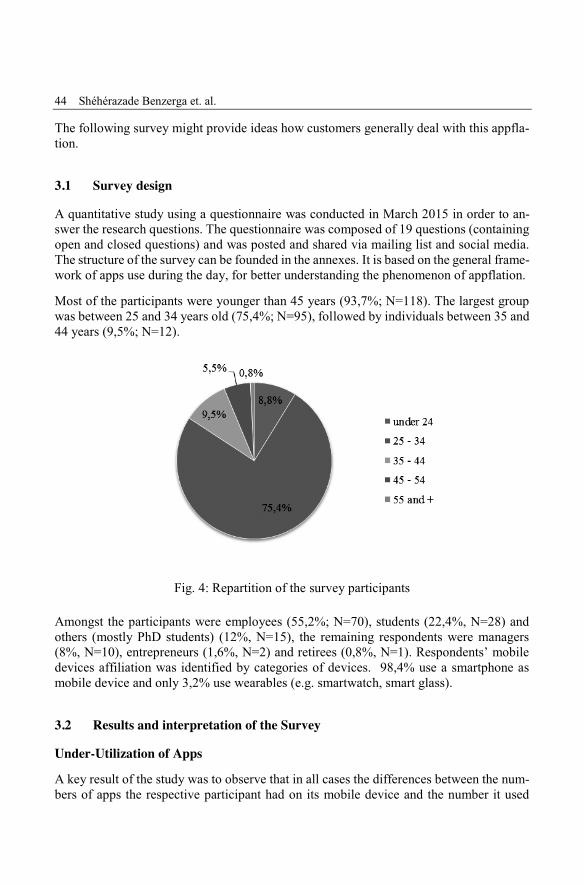
44 Shéhérazade Benzerga et. al.
The following survey might provide ideas how customers generally deal with this appfla-tion.
3.1 Survey design
A quantitative study using a questionnaire was conducted in March 2015 in order to an-swer the research questions. The questionnaire was composed of 19 questions (containingopen and closed questions) and was posted and shared via mailing list and social media.The structure of the survey can be founded in the annexes. It is based on the general frame-work of apps use during the day, for better understanding the phenomenon of appflation.
Most of the participants were younger than 45 years (93,7%; N=118). The largest groupwas between 25 and 34 years old (75,4%; N=95), followed by individuals between 35 and44 years (9,5%; N=12).
Fig. 4: Repartition of the survey participants
Amongst the participants were employees (55,2%; N=70), students (22,4%, N=28) andothers (mostly PhD students) (12%, N=15), the remaining respondents were managers(8%, N=10), entrepreneurs (1,6%, N=2) and retirees (0,8%, N=1). Respondents’ mobiledevices affiliation was identified by categories of devices. 98,4% use a smartphone asmobile device and only 3,2% use wearables (e.g. smartwatch, smart glass).
3.2 Results and interpretation of the Survey
Under-Utilization of AppsA key result of the study was to observe that in all cases the differences between the num-bers of apps the respective participant had on its mobile device and the number it used
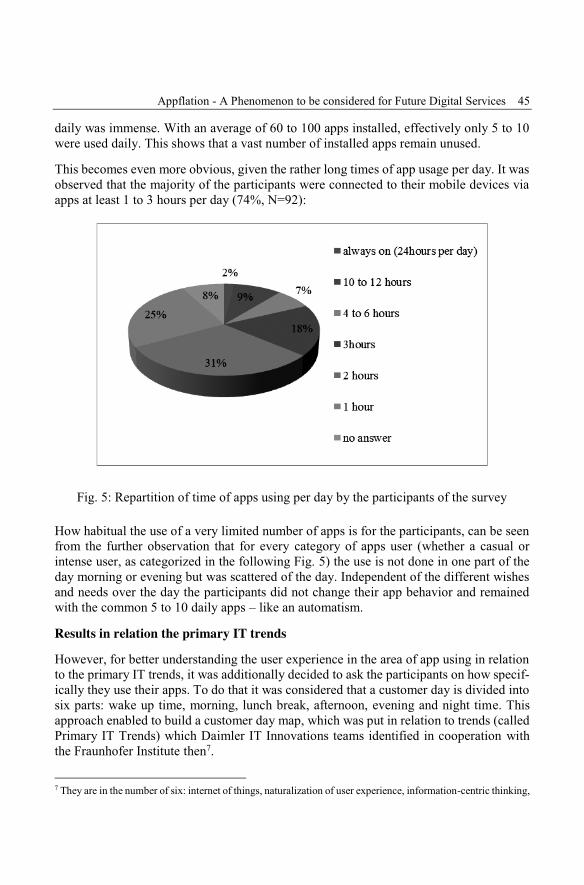
Appflation - A Phenomenon to be considered for Future Digital Services 45
daily was immense. With an average of 60 to 100 apps installed, effectively only 5 to 10were used daily. This shows that a vast number of installed apps remain unused.
This becomes even more obvious, given the rather long times of app usage per day. It wasobserved that the majority of the participants were connected to their mobile devices viaapps at least 1 to 3 hours per day (74%, N=92):
Fig. 5: Repartition of time of apps using per day by the participants of the survey
How habitual the use of a very limited number of apps is for the participants, can be seenfrom the further observation that for every category of apps user (whether a casual orintense user, as categorized in the following Fig. 5) the use is not done in one part of theday morning or evening but was scattered of the day. Independent of the different wishesand needs over the day the participants did not change their app behavior and remainedwith the common 5 to 10 daily apps – like an automatism.
Results in relation the primary IT trendsHowever, for better understanding the user experience in the area of app using in relationto the primary IT trends, it was additionally decided to ask the participants on how specif-ically they use their apps. To do that it was considered that a customer day is divided intosix parts: wake up time, morning, lunch break, afternoon, evening and night time. Thisapproach enabled to build a customer day map, which was put in relation to trends (calledPrimary IT Trends) which Daimler IT Innovations teams identified in cooperation withthe Fraunhofer Institute then7.
7 They are in the number of six: internet of things, naturalization of user experience, information-centric thinking,
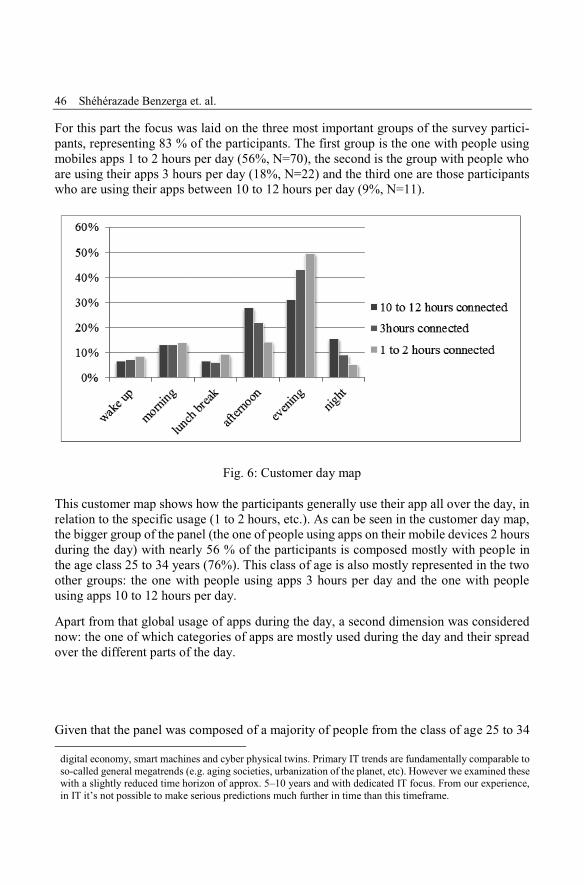
46 Shéhérazade Benzerga et. al.
For this part the focus was laid on the three most important groups of the survey partici-pants, representing 83 % of the participants. The first group is the one with people usingmobiles apps 1 to 2 hours per day (56%, N=70), the second is the group with people whoare using their apps 3 hours per day (18%, N=22) and the third one are those participantswho are using their apps between 10 to 12 hours per day (9%, N=11).
Fig. 6: Customer day map
This customer map shows how the participants generally use their app all over the day, inrelation to the specific usage (1 to 2 hours, etc.). As can be seen in the customer day map,the bigger group of the panel (the one of people using apps on their mobile devices 2 hoursduring the day) with nearly 56 % of the participants is composed mostly with people inthe age class 25 to 34 years (76%). This class of age is also mostly represented in the twoother groups: the one with people using apps 3 hours per day and the one with peopleusing apps 10 to 12 hours per day.
Apart from that global usage of apps during the day, a second dimension was considerednow: the one of which categories of apps are mostly used during the day and their spreadover the different parts of the day.
Given that the panel was composed of a majority of people from the class of age 25 to 34
digital economy, smart machines and cyber physical twins. Primary IT trends are fundamentally comparable toso-called general megatrends (e.g. aging societies, urbanization of the planet, etc). However we examined thesewith a slightly reduced time horizon of approx. 5–10 years and with dedicated IT focus. From our experience,in IT it’s not possible to make serious predictions much further in time than this timeframe.
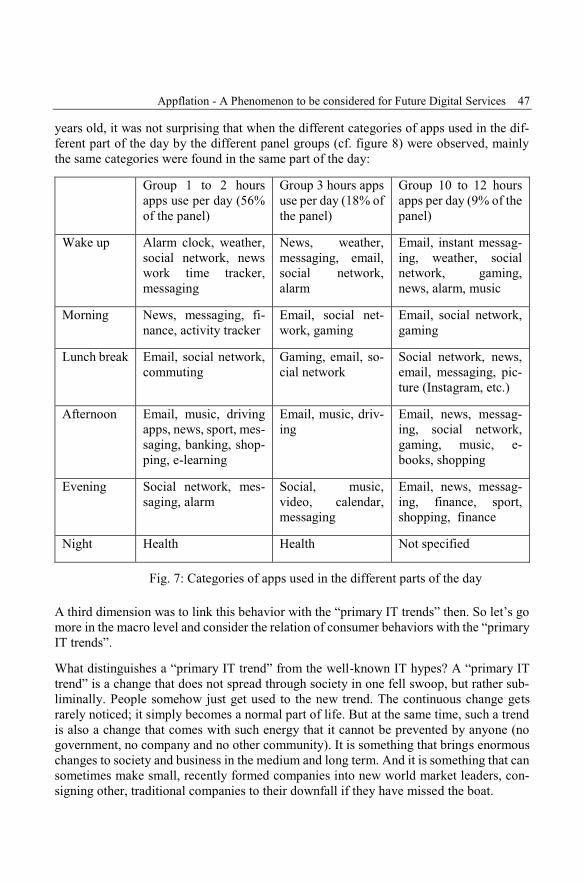
Appflation - A Phenomenon to be considered for Future Digital Services 47
years old, it was not surprising that when the different categories of apps used in the dif-ferent part of the day by the different panel groups (cf. figure 8) were observed, mainlythe same categories were found in the same part of the day:
Group 1 to 2 hoursapps use per day (56%of the panel)
Group 3 hours appsuse per day (18% ofthe panel)
Group 10 to 12 hoursapps per day (9% of thepanel)
Wake up Alarm clock, weather,social network, newswork time tracker,messaging
News, weather,messaging, email,social network,alarm
Email, instant messag-ing, weather, socialnetwork, gaming,news, alarm, music
Morning News, messaging, fi-nance, activity tracker
Email, social net-work, gaming
Email, social network,gaming
Lunch break Email, social network,commuting
Gaming, email, so-cial network
Social network, news,email, messaging, pic-ture (Instagram, etc.)
Afternoon Email, music, drivingapps, news, sport, mes-saging, banking, shop-ping, e-learning
Email, music, driv-ing
Email, news, messag-ing, social network,gaming, music, e-books, shopping
Evening Social network, mes-saging, alarm
Social, music,video, calendar,messaging
Email, news, messag-ing, finance, sport,shopping, finance
Night Health Health Not specified
Fig. 7: Categories of apps used in the different parts of the day
A third dimension was to link this behavior with the “primary IT trends” then. So let’s gomore in the macro level and consider the relation of consumer behaviors with the “primaryIT trends”.
What distinguishes a “primary IT trend” from the well-known IT hypes? A “primary ITtrend” is a change that does not spread through society in one fell swoop, but rather sub-liminally. People somehow just get used to the new trend. The continuous change getsrarely noticed; it simply becomes a normal part of life. But at the same time, such a trendis also a change that comes with such energy that it cannot be prevented by anyone (nogovernment, no company and no other community). It is something that brings enormouschanges to society and business in the medium and long term. And it is something that cansometimes make small, recently formed companies into new world market leaders, con-signing other, traditional companies to their downfall if they have missed the boat.
48 Shéhérazade Benzerga et. al.
So let’s have a closer look to these trends. They are in the number of six: internet of things,naturalization of user experience, information-centric thinking, digital economy, smartmachines and cyber physical twins. But which ones have an impact on the appflation phe-nomenon?
Considering the customer day map and the categories of apps used in the different part ofthe day, we can observe that three trends are very important here: the digital economy thecyber physical twins and the naturalization of user experience.
Digital economy has to do with business going digital. This is not new; we already hadthe first wave in the form of the e-business hype in the early 2000s. However, since theapparition of smartphone and apps we see an acceleration of this trend. The boom of appssector brings new business possibilities and contributes always more to the economy. Forexample if we consider the study from the European Commission [Eu14] we can observethat in 2013 the European app economy brings a revenue of 17, 5 billion Euro and it isrising to 63 billion euros by 2018 if referring to the results of this study to pure digitalservice products that are implemented as a pure digital value chain and services mashupswithout any physical assets involved at all.
Additionally to this, apps are a part of the changing world that is more known as the acro-nym cyber world. In this virtual world more and more entities (persons, legal bodies, lo-cations, things, etc.) which exist in the real physical world, also have some kind of digitalcounterpart in something which is called cyber space nowadays. Sometimes even morethan one cyber counterpart exists. The most important aspect is that both representationsare so closely connected together that any state change in one representation is somehowsynchronized to the other representation. Any external action to one representation willinduce some kind of reflection on the other side. Hence the resulting notion of “twins”.Accepting the cyber world representation as an inseparable part of entities has a big impacton the rules that have to be applied to this cyber representation (e.g. data ownership andinformation protection). This is totally linked with the trend cyber physical twins andmatch completely with the apps phenomenon.
Finally, the primary IT trend “naturalization of user experience” plays an important sup-porting role in this area. It does this two-fold: First, the most popular apps are those thatcome with an attractive user interface, can be used without a long lasting learning curveand offer also additional interaction modes like e.g. speech control, advanced swiping fea-tures and simple use of the built-in Smartphone cameras. Second, the instant, seamlessand context-aware user experience pattern of those apps helps a lot to foster frequent usageof them all over the day in modern life. It’s like business models being instantly exposedto the customer’s finger tips and in the future even to their eyes, ears and body movements.But again, care must be taken with the sheer number of even such attractive interactionmodes.
Appflation - A Phenomenon to be considered for Future Digital Services 49
3.3 LimitationsDue to the exploratory nature of our research, this study has some limitations. For exam-ple, while in this paper it is referred to the inflation of apps, it must be recognized that theconsiderations are limited to the consumer view. It might be valuable to make a compara-ble survey from a company oriented view to validate the company side. It could be con-sidered in future studies related to the topic.
Also, the survey is not representative for all app users, as it includes a large group ofpeople under 34 years old. In addition, only very general information on the demographiccharacteristics of the participants was at hand, which limits the ability to relate app users’information seeking behavior to demographic characteristics.
4 Conclusion and PerspectiveThe study shows that approaching from both sides – companies and consumers – the phe-nomenon of appflation can be observed, with a potential loss of usability and a negativeimpact on the consumer experience going along therewith. Appflation is not only makingthe experience more complex for the user community. Companies also have to deal withthe phenomenon to more effectively approach bigger numbers of customers, making moreconcerted digital app strategies necessary. What remains open is what role Enterprise Ar-chitecture could play in this organizational change. Some of well-known EAM (EnterpriseArchitecture Management) artifact cloud helpful, par ex. Life-cycle model, the service anddomain model, the process-apps-technology-cloud model as well a repository.
References[ABI15] ABI Research, www.fiercewireless.com/europe/offer/gc_handset_q213?source-
form=Organic-GC-Handset_q213-FierceWirelessEurope, date: 24.04.2015
[Am15] American Dialect Society, www.americandialect.org/American-Dialect-Society-2010-Word-of-the-Year-PRESS-RELEASE.pdf, date: 14.04.2015
[AD00] Aarts, H.; Dijksterhuis A.P.: The Automatic activation of goal directed behavior. Thecase of travel habit, Journal of environmental psychology, 2000.
[Ap15] Apple: www.apple.com/legal/intellectual-property/trademark/appletmlist.html, Stand:18.04.2015
[Be12] Benioff, M.: The Social Revolution – Wie Sie aus Ihrer Firma ein aktiv vernetztes Un-ternehmen und aus Ihren Kunden Freunde fürs Leben machen, Frankfurter AllgemeineBuch, 2012.
[BZ03] Benbasat, I.; Zmud, R.W.: The Identity Crisis within the IS Discipline: Defining andCommunicating the Discipline’s Core Properties, MIS Quarterly, 2003.
50 Shéhérazade Benzerga et. al.
[Cr10] Cramer H.; Rost M., Belloni N.; Bentley, F.; Chincholle D.: Research in the large: Usingapp stores, markets, and other wide distribution channels in Ubicomp research,UbiComp’10 Copenhagen: September 26–29, 2010.
[Eu14] European Commission, Sizing the EU app economy, February 2014.
[Ga15] Gartner, www.statista.com/statistics/266488/forecast-of-mobile-app-downloads/, date:25.04.2015
[JB13] Jansen, S., Bloemendal, E., Defining App Stores: The Role of Curated Marketplaces inSoftware Ecosystems, Software Business - Physical Products to Software Services andSolutions Volume 150 (pp 195-206), Springer, 2013.
[MW14] Marchand, D.A.; Wade, M.: IMD Discovery Event, May 14, 2014.
[MW13] Meeker M.; Wu, L.: Internet trends. In Conference. Rancho Palos Verdes, 2013.
[Na13] Namjae, C.: The use of smart mobile equipment for the innovation in organizational,Springer Briefs in Digital Spaces, 2013.
[OI01] Orlikowski, W.J.; Iacono, C.S.: Research commentary: Desperately Seeking the “IT” –A call to theorizing the IT Artifact, Information Systems Research, INFORMS, June2001.
[SSS00] Sheth, J.N.; Sisodia, R.S.; Sharma, A.: The antecedents and consequences of customercentric marketing, Journal of the academy of marketing Science, 2000.
[St15] Statista, www.statista.com/statistics/276623/number-of-apps-available-in-leading-app-stores/, Stand: 23.03.2015
[Th12] The new mobility platform Moovel, Mercedes Benz Next, November 2012
Alfred Zimmermann, Alexander Rossmann (Hrsg.): Digital Enterprise Computing 2015,Lecture Notes in Informatics (LNI), Gesellschaft für Informatik, Bonn 2015 51
User Engagement in Corporate Facebook Communities
Alexander Rossmann1 and Gerald Stei2
Abstract: The stimulation of user engagement has received significant attention in extant research.However, the theory of antecedents for user engagement with an initial electronic word-of-mouth(eWoM) communication is relatively less developed. In an investigation of 576 unique user postingsacross independent Facebook (FB) communities for two German firms, we contribute to the extantknowledge on user engagement in two different ways. First, we explicate senders’ prior usage ex-perience and the extent of their acquaintance with other community members as the two key driversof user engagement across a product and a service community. Second, we reveal that these maineffects differ according to the type of community. In service communities, experience has a strongerimpact on user engagement; whereas, in product communities, acquaintance is more important.
Keywords: Social media; User engagement; Acquaintance; Experience; Word-of-Mouth; Commu-nity type; Regression analysis
1 IntroductionWord-of-mouth (WoM) communication, long recognized as a highly influential source ofinformation, has gained renewed prominence with the proliferation of social media andelectronic WoM (eWoM) ([TLF14]). Both WoM and eWoM are customer-generated, use-ful sources of information and they are considered more credible, empathetic, and relevantthan a communication imposed upon consumers by marketers ([BS01]). As firms continueto engage in customer co-creation, multi-channel strategies, and integrated communica-tion, WoM and eWoM are gaining importance more than ever. The rise of the internet hascreated online forums, social media, and communities, which have, in turn, increased thescope and implications of eWoM for customers and firms ([Ma13]). Researchers haveexamined a diverse set of consequences of eWoM, for example, brand purchase probabil-ity ([EHL08]), a tendency to recommend ([Li06]), involvement ([MO01]), product adop-tion ([TS08]), and feedback on products and services ([He04]).
1 Reutlingen University, School of Informatics, Alteburgstr. 150, 72762 Reutlingen, [email protected]
2 Reutlingen University, School of Informatics, Alteburgstr. 150, 72762 Reutlingen,[email protected]
52 Alexander Rossmann and Gerald Stei
Similarly, several studies have examined the antecedents of eWoM, for example, affectivecharacteristics of the message ([BM12]), relational factors ([CK11]), and individual traits([MPZ07]). While the generation of eWoM has received ample attention, the concept ofuser engagement after an initial eWoM communication is relatively less developed([He04]; [HWW03]; [HGB14]; [Ya12]). User engagement is the connectedness with theeWoM message by a receiver, and is conceptualized as behavioral manifestations such aslikes and comments on a content on an electronic portal ([CMS09]; [Do10]). Firms needa better understanding about the specific preconditions for user engagement with eWoM,as they are investing heavily in digital marketing campaigns on social media. Such cam-paigns are particularly successful, if the group of receivers of an initial message spread theword, like and share the content, or contribute by way of user generated content([HGB14]). Therefore, firms need to develop a better understanding about the generationof eWoM and its adoption within an online community. This research conceptualizes userengagement, and illumines two of its important drivers, namely, the sender’s prior expe-rience with the product or service and her network acquaintances, in generating efficaciouseWoM about the product or service. We conceptual model is tested in the customer-to-customer (C2C) context of two different online communities of two German firms: (1) aservice community of a telecom provider and (2) a product community of a car manufac-turer. We posit that acquaintance and experience impact differently across product andservice communities.
2 Conceptual FrameworkAs a first step towards a deeper understanding about the generation of eWoM and itsadoption, within an online community, we develop a clear conceptualization of user en-gagement. Bijmolt et al. ([Bi10]) and Doorn et al. ([Do10]) define customer engagementas the behavioral manifestation of a customer toward a brand or a firm that may affectthe brand or firm and its constituents in other ways than purchases, e.g. WoM, recom-mendations, helping other customers, blogging, writing reviews, and participation inbrand communities. Our conceptualization is similar, albeit more connected to our con-text, and captures specific interactions between consumers, brands, companies, and/orother members of an online community ([BR11]; [Br13]). Posting content on social me-dia platforms elicits several types of user interaction behavior, for example, likes, com-ments, shares, and offline conversations ([HGB14]; [LHN14]). However, opportunitiesto share or the possibility of engaging in an offline communication are improbable, andwere not captured by either of the companies that furnished the data for this study. There-fore, in this study, and motivated by similar conceptualization of brand post-popularityby de Vries, Gensler and Leeflang ([DGL12]), the modes of likes and comments wereconsidered the primary and most relevant way of user engagement.
User Engagement in Corporate Facebook Communities 53
Likes denote a positive affect about e-contents and posts. Comments are independent textmessages, addenda or responses to another post. However, comments are more broad-based than likes because they allow the sender to express a diverse set of utilitarian, ra-tional, and emotional content ([Ma13, p. 276]). The variation in the composition of likesand comments as constituents of user engagement may be viewed as a close proxy forchanges in the affect and utility dimensions of user engagement ([CMS09 p. 322]). There-fore, we come up with an interactive and traceable conceptualization of user engagementbased on the likes and comments on an initial eWoM communication.
Due to strict space limitations in this version of the paper, we are unfortunately unable tothoroughly elaborate the theoretical foundation of our antecedent constructs, acquaintanceand experience. However, it can be argued that these constructs and relationships are to acertain extent self-explaining and that most of them are understandable for an informedreader. Further information about construct definitions, operationalization, and item scaleare provided in Table 1.
Beside the clarity about antecedents of user engagement, this research also hypothesizes amoderating effect of community context on the main effects. While several typologies ofonline communities are used in extant research ([Ko99]), the differentiation between prod-uct and service communities is a fundamental distinction. Our use of community type im-plies a unique focus with regard to its current conceptualization in extant research. Theattitude of the members of service and product communities has been investigated byKozinets ([Ko99]) due to the difference between information versus relationship orienta-tion. We extend this approach by illustrating the trends and patterns for information andrelationship orientation in both community types. Social media communities develop inaccordance with the specific and varied communication interests of community members.Consumers might see a corporate community as an appropriate place to discuss their ques-tions, problems, and complaints. In the service community, customer service is the focalpoint of interest, and the communication processes between corporation and users, as wellas between users with a service focus, lead to the development of a service community.Such communities focus on functional issues. Information sharing is the primary motiveand interactions are built around instrumental aspects, efficacy, and expectancy-relatedincentives arising from participation ([WF04]). Therefore, prior experience is a powerfuldriver for user engagement within a service community. On the other hand, product com-munities are also built around communication about products. The main objectives in join-ing a product community are networking with other product users, as well as showing andpromoting affective emotions toward the product ([DGL12]). In such cases, online userstend to report their experiences with specific products. Corporations stimulate these com-munication preferences via specific product information, pictures, videos, or test reports.Acquaintance plays a major role in such product- and brand-driven dialogues, as commu-nity members try to pursue an interaction with established contacts ([Ph04]). Linkingvalue, which is an added source of value within these communities, is created over andabove the value embedded in the product ([Co97]).
Therefore, we summarize the following hypotheses. Figure 1 represents an overview ofour conceptual model:
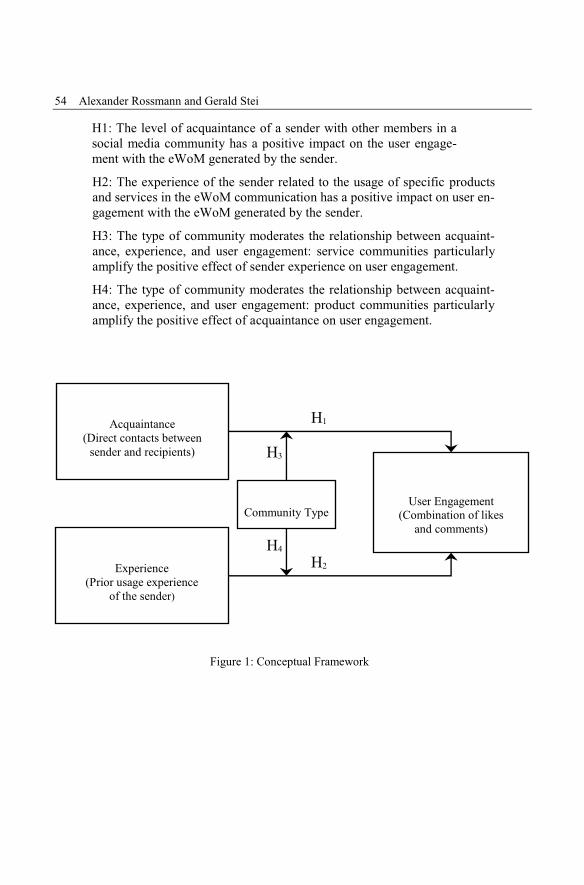
54 Alexander Rossmann and Gerald Stei
H1: The level of acquaintance of a sender with other members in asocial media community has a positive impact on the user engage-ment with the eWoM generated by the sender.
H2: The experience of the sender related to the usage of specific productsand services in the eWoM communication has a positive impact on user en-gagement with the eWoM generated by the sender.
H3: The type of community moderates the relationship between acquaint-ance, experience, and user engagement: service communities particularlyamplify the positive effect of sender experience on user engagement.
H4: The type of community moderates the relationship between acquaint-ance, experience, and user engagement: product communities particularlyamplify the positive effect of acquaintance on user engagement.
Figure 1: Conceptual Framework
Acquaintance(Direct contacts between
sender and recipients)
Experience(Prior usage experience
of the sender)
Community TypeUser Engagement
(Combination of likesand comments)
H1
H2
H3
H4
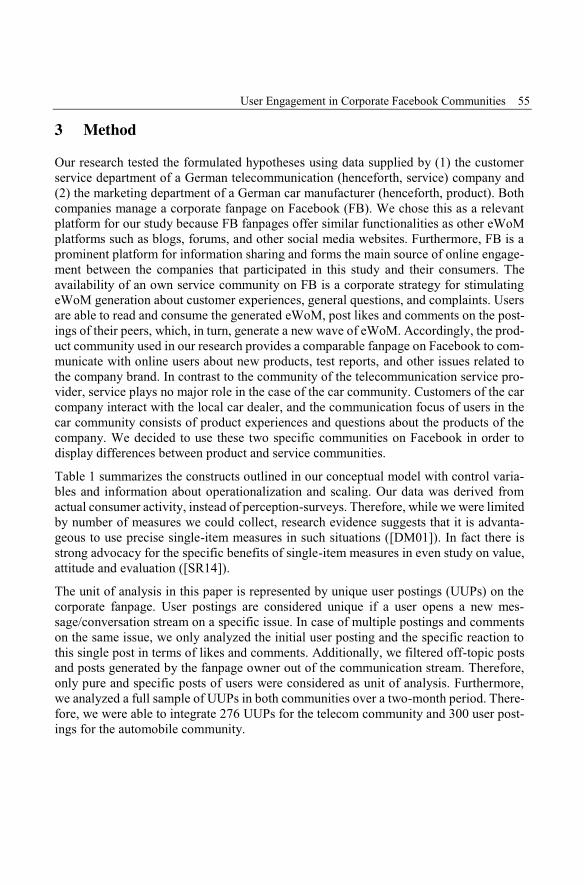
User Engagement in Corporate Facebook Communities 55
3 MethodOur research tested the formulated hypotheses using data supplied by (1) the customerservice department of a German telecommunication (henceforth, service) company and(2) the marketing department of a German car manufacturer (henceforth, product). Bothcompanies manage a corporate fanpage on Facebook (FB). We chose this as a relevantplatform for our study because FB fanpages offer similar functionalities as other eWoMplatforms such as blogs, forums, and other social media websites. Furthermore, FB is aprominent platform for information sharing and forms the main source of online engage-ment between the companies that participated in this study and their consumers. Theavailability of an own service community on FB is a corporate strategy for stimulatingeWoM generation about customer experiences, general questions, and complaints. Usersare able to read and consume the generated eWoM, post likes and comments on the post-ings of their peers, which, in turn, generate a new wave of eWoM. Accordingly, the prod-uct community used in our research provides a comparable fanpage on Facebook to com-municate with online users about new products, test reports, and other issues related tothe company brand. In contrast to the community of the telecommunication service pro-vider, service plays no major role in the case of the car community. Customers of the carcompany interact with the local car dealer, and the communication focus of users in thecar community consists of product experiences and questions about the products of thecompany. We decided to use these two specific communities on Facebook in order todisplay differences between product and service communities.
Table 1 summarizes the constructs outlined in our conceptual model with control varia-bles and information about operationalization and scaling. Our data was derived fromactual consumer activity, instead of perception-surveys. Therefore, while we were limitedby number of measures we could collect, research evidence suggests that it is advanta-geous to use precise single-item measures in such situations ([DM01]). In fact there isstrong advocacy for the specific benefits of single-item measures in even study on value,attitude and evaluation ([SR14]).
The unit of analysis in this paper is represented by unique user postings (UUPs) on thecorporate fanpage. User postings are considered unique if a user opens a new mes-sage/conversation stream on a specific issue. In case of multiple postings and commentson the same issue, we only analyzed the initial user posting and the specific reaction tothis single post in terms of likes and comments. Additionally, we filtered off-topic postsand posts generated by the fanpage owner out of the communication stream. Therefore,only pure and specific posts of users were considered as unit of analysis. Furthermore,we analyzed a full sample of UUPs in both communities over a two-month period. There-fore, we were able to integrate 276 UUPs for the telecom community and 300 user post-ings for the automobile community.
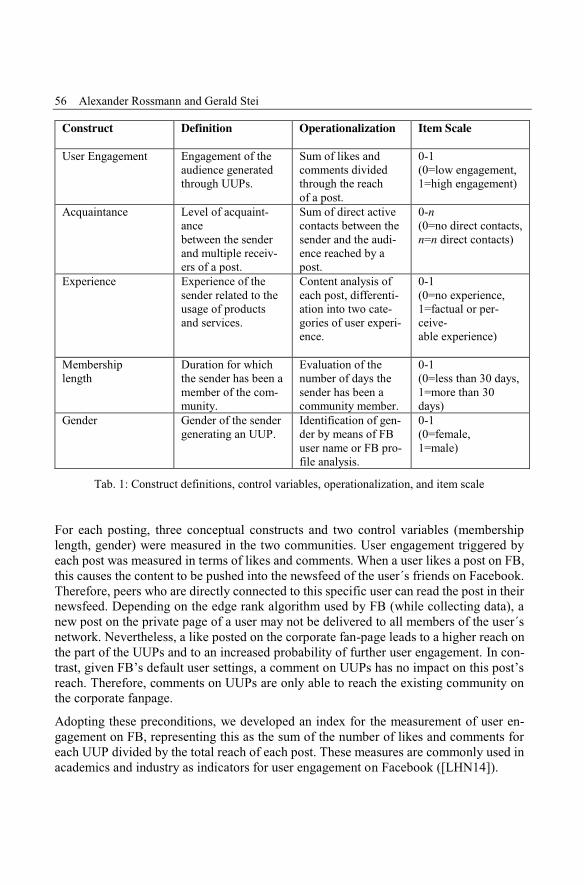
56 Alexander Rossmann and Gerald Stei
Construct Definition Operationalization Item Scale
User Engagement Engagement of theaudience generatedthrough UUPs.
Sum of likes andcomments dividedthrough the reachof a post.
0-1(0=low engagement,1=high engagement)
Acquaintance Level of acquaint-ancebetween the senderand multiple receiv-ers of a post.
Sum of direct activecontacts between thesender and the audi-ence reached by apost.
0-n(0=no direct contacts,n=n direct contacts)
Experience Experience of thesender related to theusage of productsand services.
Content analysis ofeach post, differenti-ation into two cate-gories of user experi-ence.
0-1(0=no experience,1=factual or per-ceive-able experience)
Membershiplength
Duration for whichthe sender has been amember of the com-munity.
Evaluation of thenumber of days thesender has been acommunity member.
0-1(0=less than 30 days,1=more than 30days)
Gender Gender of the sendergenerating an UUP.
Identification of gen-der by means of FBuser name or FB pro-file analysis.
0-1(0=female,1=male)
Tab. 1: Construct definitions, control variables, operationalization, and item scale
For each posting, three conceptual constructs and two control variables (membershiplength, gender) were measured in the two communities. User engagement triggered byeach post was measured in terms of likes and comments. When a user likes a post on FB,this causes the content to be pushed into the newsfeed of the user´s friends on Facebook.Therefore, peers who are directly connected to this specific user can read the post in theirnewsfeed. Depending on the edge rank algorithm used by FB (while collecting data), anew post on the private page of a user may not be delivered to all members of the user´snetwork. Nevertheless, a like posted on the corporate fan-page leads to a higher reach onthe part of the UUPs and to an increased probability of further user engagement. In con-trast, given FB’s default user settings, a comment on UUPs has no impact on this post’sreach. Therefore, comments on UUPs are only able to reach the existing community onthe corporate fanpage.
Adopting these preconditions, we developed an index for the measurement of user en-gagement on FB, representing this as the sum of the number of likes and comments foreach UUP divided by the total reach of each post. These measures are commonly used inacademics and industry as indicators for user engagement on Facebook ([LHN14]).
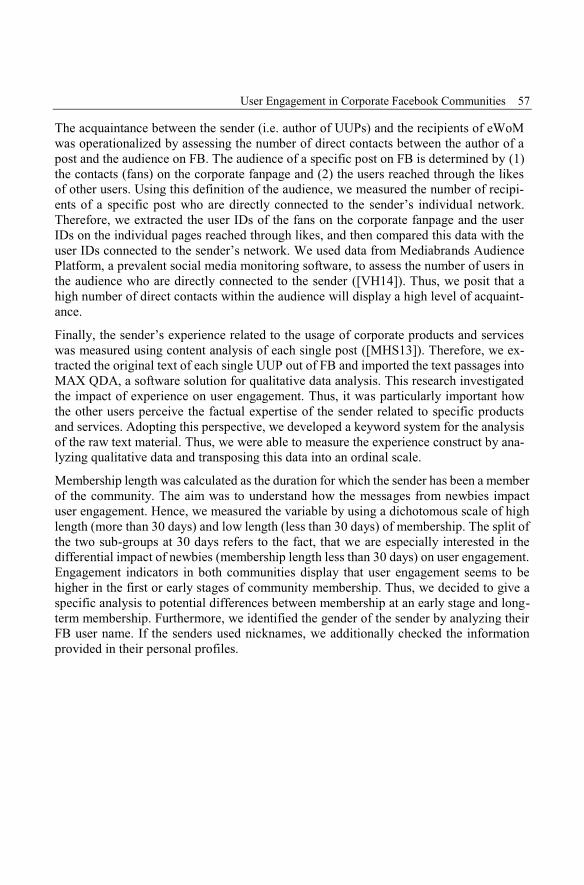
User Engagement in Corporate Facebook Communities 57
The acquaintance between the sender (i.e. author of UUPs) and the recipients of eWoMwas operationalized by assessing the number of direct contacts between the author of apost and the audience on FB. The audience of a specific post on FB is determined by (1)the contacts (fans) on the corporate fanpage and (2) the users reached through the likesof other users. Using this definition of the audience, we measured the number of recipi-ents of a specific post who are directly connected to the sender’s individual network.Therefore, we extracted the user IDs of the fans on the corporate fanpage and the userIDs on the individual pages reached through likes, and then compared this data with theuser IDs connected to the sender’s network. We used data from Mediabrands AudiencePlatform, a prevalent social media monitoring software, to assess the number of users inthe audience who are directly connected to the sender ([VH14]). Thus, we posit that ahigh number of direct contacts within the audience will display a high level of acquaint-ance.
Finally, the sender’s experience related to the usage of corporate products and serviceswas measured using content analysis of each single post ([MHS13]). Therefore, we ex-tracted the original text of each single UUP out of FB and imported the text passages intoMAX QDA, a software solution for qualitative data analysis. This research investigatedthe impact of experience on user engagement. Thus, it was particularly important howthe other users perceive the factual expertise of the sender related to specific productsand services. Adopting this perspective, we developed a keyword system for the analysisof the raw text material. Thus, we were able to measure the experience construct by ana-lyzing qualitative data and transposing this data into an ordinal scale.
Membership length was calculated as the duration for which the sender has been a memberof the community. The aim was to understand how the messages from newbies impactuser engagement. Hence, we measured the variable by using a dichotomous scale of highlength (more than 30 days) and low length (less than 30 days) of membership. The split ofthe two sub-groups at 30 days refers to the fact, that we are especially interested in thedifferential impact of newbies (membership length less than 30 days) on user engagement.Engagement indicators in both communities display that user engagement seems to behigher in the first or early stages of community membership. Thus, we decided to give aspecific analysis to potential differences between membership at an early stage and long-term membership. Furthermore, we identified the gender of the sender by analyzing theirFB user name. If the senders used nicknames, we additionally checked the informationprovided in their personal profiles.
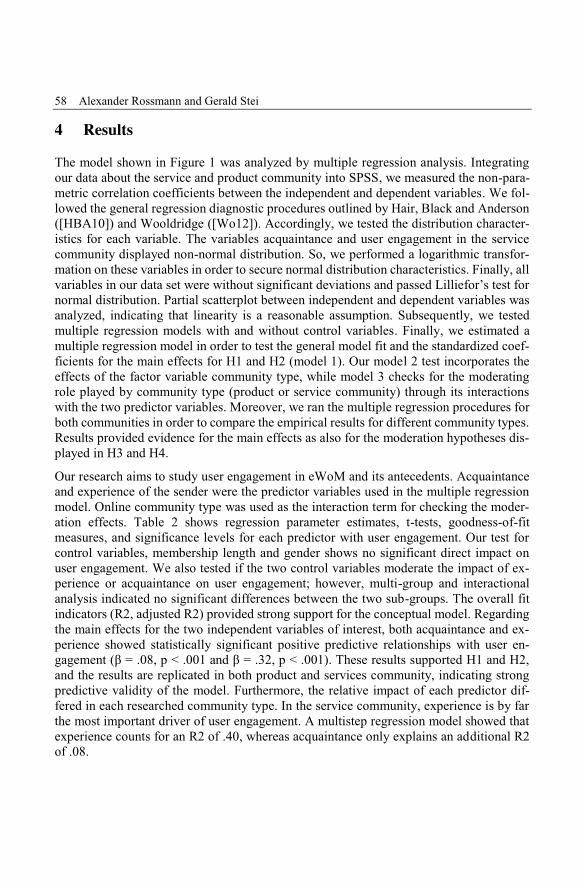
58 Alexander Rossmann and Gerald Stei
4 ResultsThe model shown in Figure 1 was analyzed by multiple regression analysis. Integratingour data about the service and product community into SPSS, we measured the non-para-metric correlation coefficients between the independent and dependent variables. We fol-lowed the general regression diagnostic procedures outlined by Hair, Black and Anderson([HBA10]) and Wooldridge ([Wo12]). Accordingly, we tested the distribution character-istics for each variable. The variables acquaintance and user engagement in the servicecommunity displayed non-normal distribution. So, we performed a logarithmic transfor-mation on these variables in order to secure normal distribution characteristics. Finally, allvariables in our data set were without significant deviations and passed Lilliefor’s test fornormal distribution. Partial scatterplot between independent and dependent variables wasanalyzed, indicating that linearity is a reasonable assumption. Subsequently, we testedmultiple regression models with and without control variables. Finally, we estimated amultiple regression model in order to test the general model fit and the standardized coef-ficients for the main effects for H1 and H2 (model 1). Our model 2 test incorporates theeffects of the factor variable community type, while model 3 checks for the moderatingrole played by community type (product or service community) through its interactionswith the two predictor variables. Moreover, we ran the multiple regression procedures forboth communities in order to compare the empirical results for different community types.Results provided evidence for the main effects as also for the moderation hypotheses dis-played in H3 and H4.
Our research aims to study user engagement in eWoM and its antecedents. Acquaintanceand experience of the sender were the predictor variables used in the multiple regressionmodel. Online community type was used as the interaction term for checking the moder-ation effects. Table 2 shows regression parameter estimates, t-tests, goodness-of-fitmeasures, and significance levels for each predictor with user engagement. Our test forcontrol variables, membership length and gender shows no significant direct impact onuser engagement. We also tested if the two control variables moderate the impact of ex-perience or acquaintance on user engagement; however, multi-group and interactionalanalysis indicated no significant differences between the two sub-groups. The overall fitindicators (R2, adjusted R2) provided strong support for the conceptual model. Regardingthe main effects for the two independent variables of interest, both acquaintance and ex-perience showed statistically significant positive predictive relationships with user en-gagement (β = .08, p < .001 and β = .32, p < .001). These results supported H1 and H2,and the results are replicated in both product and services community, indicating strongpredictive validity of the model. Furthermore, the relative impact of each predictor dif-fered in each researched community type. In the service community, experience is by farthe most important driver of user engagement. A multistep regression model showed thatexperience counts for an R2 of .40, whereas acquaintance only explains an additional R2of .08.
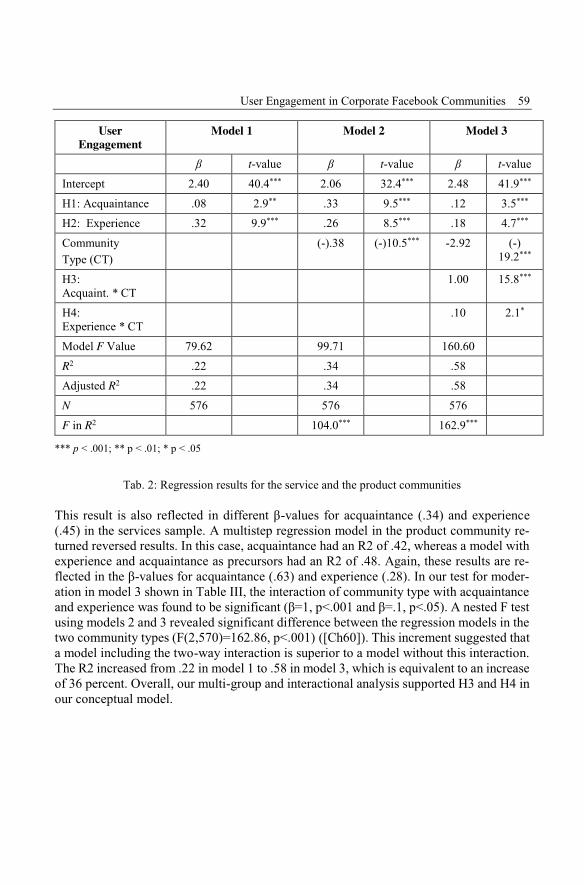
User Engagement in Corporate Facebook Communities 59
UserEngagement
Model 1 Model 2 Model 3
β t-value β t-value β t-value
Intercept 2.40 40.4*** 2.06 32.4*** 2.48 41.9***
H1: Acquaintance .08 2.9** .33 9.5*** .12 3.5***
H2: Experience .32 9.9*** .26 8.5*** .18 4.7***
CommunityType (CT)
(-).38 (-)10.5*** -2.92 (-)19.2***
H3:Acquaint. * CT
1.00 15.8***
H4:Experience * CT
.10 2.1*
Model F Value 79.62 99.71 160.60
R2 .22 .34 .58Adjusted R2 .22 .34 .58
N 576 576 576
F in R2 104.0*** 162.9***
*** p < .001; ** p < .01; * p < .05
Tab. 2: Regression results for the service and the product communities
This result is also reflected in different β-values for acquaintance (.34) and experience(.45) in the services sample. A multistep regression model in the product community re-turned reversed results. In this case, acquaintance had an R2 of .42, whereas a model withexperience and acquaintance as precursors had an R2 of .48. Again, these results are re-flected in the β-values for acquaintance (.63) and experience (.28). In our test for moder-ation in model 3 shown in Table III, the interaction of community type with acquaintanceand experience was found to be significant (β=1, p<.001 and β=.1, p<.05). A nested F testusing models 2 and 3 revealed significant difference between the regression models in thetwo community types (F(2,570)=162.86, p<.001) ([Ch60]). This increment suggested thata model including the two-way interaction is superior to a model without this interaction.The R2 increased from .22 in model 1 to .58 in model 3, which is equivalent to an increaseof 36 percent. Overall, our multi-group and interactional analysis supported H3 and H4 inour conceptual model.
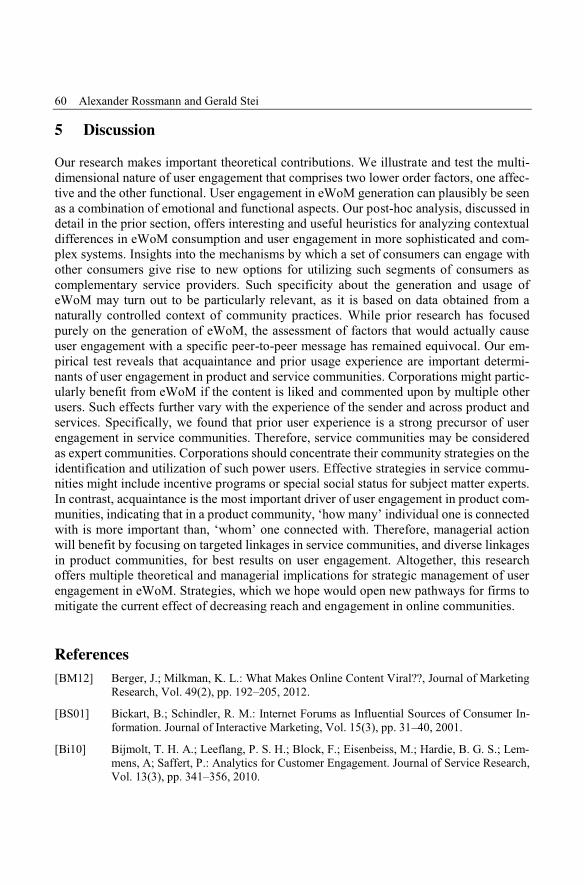
60 Alexander Rossmann and Gerald Stei
5 DiscussionOur research makes important theoretical contributions. We illustrate and test the multi-dimensional nature of user engagement that comprises two lower order factors, one affec-tive and the other functional. User engagement in eWoM generation can plausibly be seenas a combination of emotional and functional aspects. Our post-hoc analysis, discussed indetail in the prior section, offers interesting and useful heuristics for analyzing contextualdifferences in eWoM consumption and user engagement in more sophisticated and com-plex systems. Insights into the mechanisms by which a set of consumers can engage withother consumers give rise to new options for utilizing such segments of consumers ascomplementary service providers. Such specificity about the generation and usage ofeWoM may turn out to be particularly relevant, as it is based on data obtained from anaturally controlled context of community practices. While prior research has focusedpurely on the generation of eWoM, the assessment of factors that would actually causeuser engagement with a specific peer-to-peer message has remained equivocal. Our em-pirical test reveals that acquaintance and prior usage experience are important determi-nants of user engagement in product and service communities. Corporations might partic-ularly benefit from eWoM if the content is liked and commented upon by multiple otherusers. Such effects further vary with the experience of the sender and across product andservices. Specifically, we found that prior user experience is a strong precursor of userengagement in service communities. Therefore, service communities may be consideredas expert communities. Corporations should concentrate their community strategies on theidentification and utilization of such power users. Effective strategies in service commu-nities might include incentive programs or special social status for subject matter experts.In contrast, acquaintance is the most important driver of user engagement in product com-munities, indicating that in a product community, ‘how many’ individual one is connectedwith is more important than, ‘whom’ one connected with. Therefore, managerial actionwill benefit by focusing on targeted linkages in service communities, and diverse linkagesin product communities, for best results on user engagement. Altogether, this researchoffers multiple theoretical and managerial implications for strategic management of userengagement in eWoM. Strategies, which we hope would open new pathways for firms tomitigate the current effect of decreasing reach and engagement in online communities.
References[BM12] Berger, J.; Milkman, K. L.: What Makes Online Content Viral??, Journal of Marketing
Research, Vol. 49(2), pp. 192–205, 2012.
[BS01] Bickart, B.; Schindler, R. M.: Internet Forums as Influential Sources of Consumer In-formation. Journal of Interactive Marketing, Vol. 15(3), pp. 31–40, 2001.
[Bi10] Bijmolt, T. H. A.; Leeflang, P. S. H.; Block, F.; Eisenbeiss, M.; Hardie, B. G. S.; Lem-mens, A; Saffert, P.: Analytics for Customer Engagement. Journal of Service Research,Vol. 13(3), pp. 341–356, 2010.
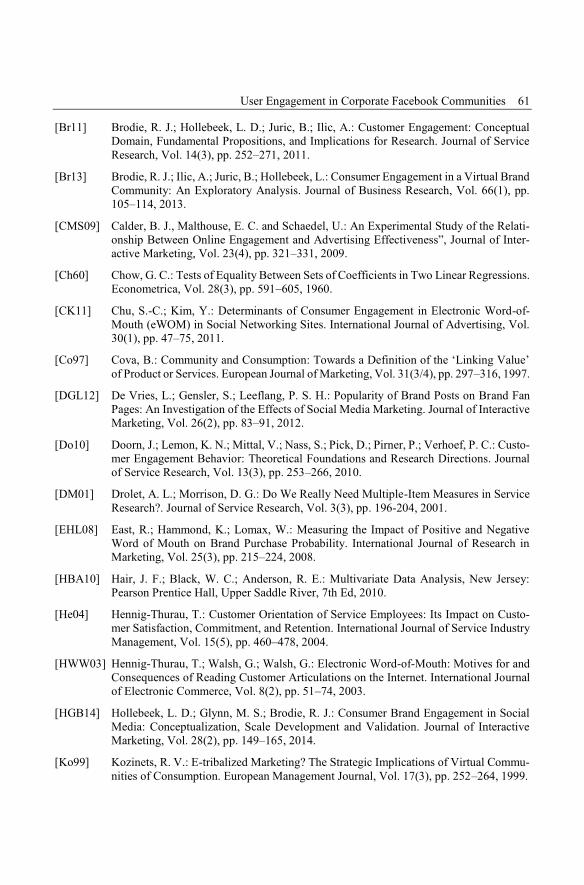
User Engagement in Corporate Facebook Communities 61
[Br11] Brodie, R. J.; Hollebeek, L. D.; Juric, B.; Ilic, A.: Customer Engagement: ConceptualDomain, Fundamental Propositions, and Implications for Research. Journal of ServiceResearch, Vol. 14(3), pp. 252–271, 2011.
[Br13] Brodie, R. J.; Ilic, A.; Juric, B.; Hollebeek, L.: Consumer Engagement in a Virtual BrandCommunity: An Exploratory Analysis. Journal of Business Research, Vol. 66(1), pp.105–114, 2013.
[CMS09] Calder, B. J., Malthouse, E. C. and Schaedel, U.: An Experimental Study of the Relati-onship Between Online Engagement and Advertising Effectiveness”, Journal of Inter-active Marketing, Vol. 23(4), pp. 321–331, 2009.
[Ch60] Chow, G. C.: Tests of Equality Between Sets of Coefficients in Two Linear Regressions.Econometrica, Vol. 28(3), pp. 591–605, 1960.
[CK11] Chu, S.-C.; Kim, Y.: Determinants of Consumer Engagement in Electronic Word-of-Mouth (eWOM) in Social Networking Sites. International Journal of Advertising, Vol.30(1), pp. 47–75, 2011.
[Co97] Cova, B.: Community and Consumption: Towards a Definition of the ‘Linking Value’of Product or Services. European Journal of Marketing, Vol. 31(3/4), pp. 297–316, 1997.
[DGL12] De Vries, L.; Gensler, S.; Leeflang, P. S. H.: Popularity of Brand Posts on Brand FanPages: An Investigation of the Effects of Social Media Marketing. Journal of InteractiveMarketing, Vol. 26(2), pp. 83–91, 2012.
[Do10] Doorn, J.; Lemon, K. N.; Mittal, V.; Nass, S.; Pick, D.; Pirner, P.; Verhoef, P. C.: Custo-mer Engagement Behavior: Theoretical Foundations and Research Directions. Journalof Service Research, Vol. 13(3), pp. 253–266, 2010.
[DM01] Drolet, A. L.; Morrison, D. G.: Do We Really Need Multiple-Item Measures in ServiceResearch?. Journal of Service Research, Vol. 3(3), pp. 196-204, 2001.
[EHL08] East, R.; Hammond, K.; Lomax, W.: Measuring the Impact of Positive and NegativeWord of Mouth on Brand Purchase Probability. International Journal of Research inMarketing, Vol. 25(3), pp. 215–224, 2008.
[HBA10] Hair, J. F.; Black, W. C.; Anderson, R. E.: Multivariate Data Analysis, New Jersey:Pearson Prentice Hall, Upper Saddle River, 7th Ed, 2010.
[He04] Hennig-Thurau, T.: Customer Orientation of Service Employees: Its Impact on Custo-mer Satisfaction, Commitment, and Retention. International Journal of Service IndustryManagement, Vol. 15(5), pp. 460–478, 2004.
[HWW03] Hennig-Thurau, T.; Walsh, G.; Walsh, G.: Electronic Word-of-Mouth: Motives for andConsequences of Reading Customer Articulations on the Internet. International Journalof Electronic Commerce, Vol. 8(2), pp. 51–74, 2003.
[HGB14] Hollebeek, L. D.; Glynn, M. S.; Brodie, R. J.: Consumer Brand Engagement in SocialMedia: Conceptualization, Scale Development and Validation. Journal of InteractiveMarketing, Vol. 28(2), pp. 149–165, 2014.
[Ko99] Kozinets, R. V.: E-tribalized Marketing? The Strategic Implications of Virtual Commu-nities of Consumption. European Management Journal, Vol. 17(3), pp. 252–264, 1999.
62 Alexander Rossmann and Gerald Stei
[LHN14] Lee, D.; Hosanagar, K.; Nair, H. S.: The Effect of Advertising Content on ConsumerEngagement: Evidence from Facebook. Working Paper Available at SSRN:http://ssrn.com/abstract=2290802, Accessed 18 April 2014.
[Li06] Liu, Y.: Word of Mouth for Movies: Its Dynamics and Impact on Box Office Revenue.Journal of Marketing, Vol. 70(3), pp. 74–89, 2006.
[Ma13] Malthouse, E. C.; Haenlein, M.; Skiera, B.; Wege, E.; Zhang, M.: Managing CustomerRelationships in the Social Media Era: Introducing the Social CRM House. Journal ofInteractive Marketing, Vol. 27(4), pp. 270–280, 2013.
[MHS13] Miles, M. B.; Huberman, A. M.; Saldaña, J.: Qualitative Data Analysis: A MethodsSourcebook, SAGE Publications, Incorporated, 2013.
[MPZ07] Mowen, J. C.; Park, S.; Zablah, A.: Toward A Theory of Motivation and PersonalityWith Application to Word-of-Mouth Communications. Journal of Business Research,Vol. 60(6), pp. 590–596, 2007.
[MO01] Muniz Jr., A. M.; O’Guinn, T. C.: Brand Community. Journal of Consumer Research,Vol. 27(4), pp. 412–432, 2001.
[Ph04] Phelps, J. E.; Lewis, R.; Mobilio, L.; Perry, D.; Raman, N.: Viral Marketing or Electro-nic Word-of-Mouth Advertising: Examining Consumer Responses and Motivations toPass Along Email. Journal of Advertising Research, Vol. 44(4), pp. 333–348, 2004.
[SR14] Stein, A.; Ramaseshan, B.: Customer Referral Behavior: Do Switchers and Stayers Dif-fer?. Journal of Service Research, 2014.
[TLF14] Thompson, S. A.; Loveland, J. M.; Fombelle, P. W.: Thematic Discrepancy Analysis: AMethod to Gain Insights into Lurkers and Test for Non-Response Bias. Journal of Inter-active Marketing, Vol. 28(1), pp. 55–67, 2014.
[TS08] Thompson, S. A.; Sinha, R. K.: Brand Communities and New Product Adoption: TheInfluence and Limits of Oppositional Loyalty. Journal of Marketing, Vol. 72(6], pp. 65–80, 2008.
[VH14] Veeck, A.; Hoger, B.: Tools for Monitoring Social Media: A Marketing Research Pro-ject. Marketing Education Review, Vol. 24(1), pp. 37–72, 2014.
[WF04] Wang, Y.; Fesenmaier, D. R.: Modeling Participation in an Online Travel Community.Journal of Travel Research, Vol. 42(3), pp. 261–270, 2004.
[Wo12] Wooldridge, J. M.: Introductory Econometrics: A Modern Approach. Cengage Learn-ing, Mason, 2012.
[Ya12] Yang, S.; Hu, M.; Winer, R. S.; Assael, H.; Chen, X.: An Empirical Study of Word-of-Mouth Generation and Consumption. Marketing Science, Vol. 31(6), pp. 952–963,2012.
Alfred Zimmermann, Alexander Rossmann (Hrsg.): Digital Enterprise Computing 2015,Lecture Notes in Informatics (LNI), Gesellschaft für Informatik, Bonn 2015 63
i*Gov a Feeling - Ein Studienportal für das interaktiveHeute
Manuel Breu1, Klaus Berndl2 und Thomas Heimann3
Abstract: In Deutschland ist der Weg vom Studieninteressenten zum Studenten geprägt von redun-danten Datenerfassungen, vielfältigen Anlaufstationen und komplexen Prozessen. Dieses Beispielist symptomatisch für viele weitere digitale Leistungsangebote der öffentlichen Hand. Eine niedrigeAkzeptanzrate des eGovernments in der Bevölkerung ist damit kaum verwunderlich. Das Rahmen-werk i*Gov liefert Konstruktionsprinzipien um digitale Leistungsangebote so zu gestalten, wie sieder Bürger erwartet. Dieses Positionspapier skizziert ein interaktives, nutzerorientiertes Studienpor-tal, das sich an diesen Konstruktionsprinzipien orientiert.
Keywords: eGovernment, i*Gov, Studienportal
1 Der Weg vom Studieninteressenten zum StudentenWürde ich heute beim Frühstück beschließen, nochmal zu studieren, hätte ich viel zu tun.Meine Schritte wären aber fast dieselben wie vor zehn Jahren. Nach meinem Müsli macheich mich auf den Weg zum Laptop. Auf verschiedenen Plattformen versorge ich mich mitInformationen zu Hochschulen und Studiengängen. „Meine offenen Fragen kann mir dieStudienberatung beantworten“, uberlege ich. Ich greife zum Hörer. Nach langer Warte-schleife und kurzem Beratungsgespräch kann ich meine Auswahl auf wenige Studien-gänge beschränken. Ich startete die Bewerbungen. Für jeden Studiengang gebe ich meinePersonendaten neu in die jeweiligen Hochschulseiten ein. Mittags habe ich die ausge-druckten Bewerbungsformulare vor mir. Auf zur Post! Dort angekommen reihe ich michin die Warteschlange am Schalter ein. Zwanzig Minuten später sind die Bewerbungen aufdem Weg zu den Hochschulen. Vier Wochen später erhalte ich die Zusage meiner Traum-Uni mit beigefügtem Immatrikulationsformular. Ich trage meine Personendaten ein, undmache mich auf den Weg zur Post. Wieder zuhause ankommen, duftet es nach Nudeln.Bis das Essen fertig ist sehe ich mich nach Fachbüchern um. Dank intelligenter Produkt-vorschläge und 1-Click-Orderings landen diese auf meinem Tablet, noch bevor die Nudelnauf dem Tisch stehen. So geht das, so muss das sein. Der Parcours durch die Institutionenist jedoch nicht mehr zeitgemäß.
Dieses Beispiel ist symptomatisch für andere Kundenprozesse der öffentlichen Hand inDeutschland: Redundante Datenerfassungen, Medienbrüche, und aus Bürgersicht kom-plexe Prozesse mit vielen Anlaufstellen sind allgegenwärtig. Vergleicht man dies mit den
1 Capgemini Deutschland GmbH, Potsdamer Platz 5, 10785 Berlin, [email protected] Capgemini Deutschland GmbH, Potsdamer Platz 5, 10785 Berlin, [email protected] Capgemini Deutschland GmbH, Potsdamer Platz 5, 10785 Berlin, [email protected]
64 Manuel Breu et al.
digitalen Angeboten der Wirtschaft, scheint es, als habe der Staat unser digitales, kunden-orientiertes Zeitalter verschlafen. Doch stellen wir uns die Frage: Ist das wirklich so?
2 Capgeminis i*Gov weist den Weg vom elektronischen hin zum in-teraktiven Government
Wie das eGovernment-Gesetz zeigt, beschäftigt sich die öffentliche Hand durchaus mitDigitalisierung. Hintergrund dieses Gesetzes sind Budgetsanierungen aufgrund von Haus-haltskonsolidierung und Schuldenabbau, die mit der Alterung der Gesellschaft kollidieren.Darüber hinaus liegt in Deutschland der Anteil der über 50 jährigen im öffentlichen Dienstim Durchschnitt bei ca. 25% [Ro2009].Viele Arbeitskräfte gehen also in näherer Zukunftin Ruhestand. Sie werden auf Grund von Haushaltsbeschränkungen nicht durch Neuein-stellungen ersetzt. Dadurch wird die IT der öffentlichen Verwaltung geradezu gezwungen,stark zu automatisieren [Re2014]. Die britische Verwaltung verfolgt hier eine „Digital byDefault“-Strategie: Jegliche Interaktion geschieht elektronisch und nur in Ausnahmefällendurch persönlichen Kontakt [Of2012]. Dies ist in Deutschland nicht gewollt. Nach Ein-schätzung der Politik birgt ein solches Vorgehen die Gefahr einer Verschlechterung aufder Leistungsseite, v.a. dort wo eine persönliche Kommunikation sinnvoll ist [Br2013].In Deutschland sollen digitale Leistungsangebote geschaffen werden, die der Bürger frei-willig nutzt [Re2014]. Für den Erfolg dieser Pull-Strategie sind die Akzeptanzraten derdigitalen Angebote jedoch zu gering [Ro2013]. Ein Grund hierfür ist das übergeordneteZiel der Kosteneinsparung. Wie Leistungsangebote digitalisiert werden, folgt v.a. aus denAbläufen der Verwaltungen, nicht aber aus Sicht der Kundenprozesse. Sie entsprechendadurch oft nur bedingt den Erwartungen der Bürger [Re2013]. Dies führt zu einer nied-rigen Akzeptanz und kollidiert mit der Push-Strategie Deutschlands. Noch expliziter alsAnsätze wie etwa Stein-Hardenberg 2.0 [Su2011] und Verwaltung 4.0 [Kr2013] fordertCapgeminis Rahmenwerk i*Gov [Ro2013] deshalb den Weg vom e-Government zum i-Government, d.h. von der behördlichen Elektronifizierung hin zur Interaktion. i*Gov siehtvor, zunächst eine integrierte Verwaltungsfabrik zu schaffen, die Verwaltungsaufgabeneffizient erfüllt. Die hierdurch freigesetzten Geldmittel können dann für die Realisierungeines intuitiven, individualisierten und schließlich interaktiven Governments genutzt wer-den (vgl. Abb. 1).
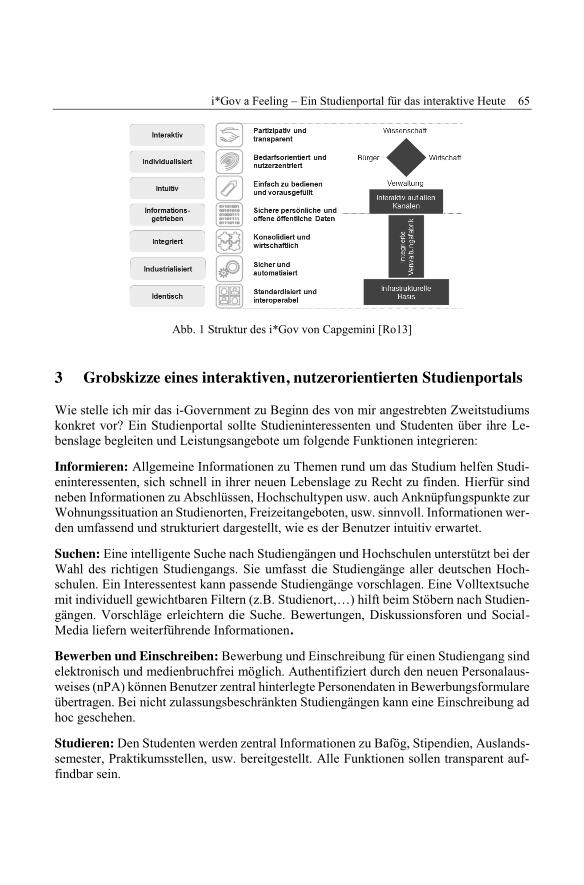
i*Gov a Feeling – Ein Studienportal für das interaktive Heute 65
Abb. 1 Struktur des i*Gov von Capgemini [Ro13]
3 Grobskizze eines interaktiven, nutzerorientierten StudienportalsWie stelle ich mir das i-Government zu Beginn des von mir angestrebten Zweitstudiumskonkret vor? Ein Studienportal sollte Studieninteressenten und Studenten über ihre Le-benslage begleiten und Leistungsangebote um folgende Funktionen integrieren:
Informieren: Allgemeine Informationen zu Themen rund um das Studium helfen Studi-eninteressenten, sich schnell in ihrer neuen Lebenslage zu Recht zu finden. Hierfür sindneben Informationen zu Abschlüssen, Hochschultypen usw. auch Anknüpfungspunkte zurWohnungssituation an Studienorten, Freizeitangeboten, usw. sinnvoll. Informationen wer-den umfassend und strukturiert dargestellt, wie es der Benutzer intuitiv erwartet.
Suchen: Eine intelligente Suche nach Studiengängen und Hochschulen unterstützt bei derWahl des richtigen Studiengangs. Sie umfasst die Studiengänge aller deutschen Hoch-schulen. Ein Interessentest kann passende Studiengänge vorschlagen. Eine Volltextsuchemit individuell gewichtbaren Filtern (z.B. Studienort,…) hilft beim Stöbern nach Studien-gängen. Vorschläge erleichtern die Suche. Bewertungen, Diskussionsforen und Social-Media liefern weiterführende Informationen.Bewerben und Einschreiben: Bewerbung und Einschreibung für einen Studiengang sindelektronisch und medienbruchfrei möglich. Authentifiziert durch den neuen Personalaus-weises (nPA) können Benutzer zentral hinterlegte Personendaten in Bewerbungsformulareübertragen. Bei nicht zulassungsbeschränkten Studiengängen kann eine Einschreibung adhoc geschehen.
Studieren: Den Studenten werden zentral Informationen zu Bafög, Stipendien, Auslands-semester, Praktikumsstellen, usw. bereitgestellt. Alle Funktionen sollen transparent auf-findbar sein.
66 Manuel Breu et al.
4 Zusammenfassung und AusblickWie das eingängige Beispiel zeigt, reichen die bestehenden Ansätze nicht aus, um einefreiwillige Nutzung des digitalen Kanals zu erreichen. Das vorgeschlagene Studienportalist nur ein Muster, das mit dem Rahmenwerk i*Gov auf andere Prozesse der öffentlichenVerwaltung übertragen werden kann. Es wäre sehr wünschenswert, wenn solche Projektein naher Zukunft realisiert werden. Sie können als Leuchtturm dienen. Eine stärkere Fo-kussierung der Nutzer fördert die Motivation der Bürger, digitale Leistungsangebote stär-ker zu nutzen und stellt einen Erfolg der deutschen e-Government-Strategie sicher. Diessichert nicht zuletzt den Industriestandort Deutschland.
Literaturverzeichnis[Br2013] Breu, M.; Santesson, L.: EAM öffnet Sozialversicherungen den Weg in die digitale Zu-
kunft. Berliner Behördenspiegel 01/2013, 2013.
[Kr2011] Krimmer, K..: Politische Rahmenbedingungen für die Verwaltungsmodernisierung mitIT. In (Gora, W.; Bauer, H. Hrsg.): Virtuelle Organisationen im Zeitalter von E-Businessund E-Government – Einblicke und Ausblicke, 2001, Springer, Berlin Heidelberg NewYork, S.332
[Kr2013] Kruse, W. Hogrebe, F.: Verwaltung 4.0- Erste empirische Befunde,http://subs.emis.de/LNI/Proceedings/Proceedings229/29.pdf, 2015, Zugriff am09.05.2015.
[Of2012] Office UK Cabinet: Government Digital Strategy. https://www.gov.uk/government/up-loads/system/uploads/attachment_data/file/296336/Government_Digital_Stratetegy_-_November_2012.pdf, 2012, Zugriff am 17.03.2015, S. 2-4.
[Re2014] Reinhardt, M.: European Executive Panel - Drivers for Digital Change. http://mc.capge-mini.de/wfb2014/Plenary_Drivers_of_change_MarcReinhardt.pdf, 2014, Zugriff am17.03.2015, S.2-6.
[Re2013] Reinhardt, M. Nachgefragt: Sind E-Government-Services noch zu wenig nutzerorien-tiert Innovative Verwaltung 09/2013, Gabler-Verlag, 2013.
[Ro2013] Roth, S.L.:Workshop ZUKUNFTSKONGRESS – Mit sieben i zum bürgerorientiertenE-Government. http://www.de.capgemini.com/zukunftskongress, 2013, Zugriff am17.03.2015.
[Ro2009] Robert Bosch Stiftung: Demographieorientierte Personalpolitik in der öffentlichen Ver-waltung, http://www.bosch-stiftung.de/content/language2/downloads/Demographieori-entierte_Personalpolitik_fuer_Internet.pdf, 2009, Zugriff am 11.05.2015.
[Su2011] Schuppan, T.: „Stein-Hardenberg 2.0“? – Staatsmodernisierung, Territorialität und ver-waltungswissenschaftliche Transformationsforschung, 2011, http://www.budrich-jour-nals.de/index.php/dms/article/view/5687/4815, Zugriff am 08.06.2015
Alfred Zimmermann, Alexander Rossmann (Hrsg.): Digital Enterprise Computing 2015,Lecture Notes in Informatics (LNI), Gesellschaft für Informatik, Bonn 2015 67
Sales 2.0 in Business-to-Business (B2B) Networks:Conceptualization and Impact of Social Mediain B2B Sales Relationships
Alexander Rossmann1 and Gerald Stei2
Abstract: In recent years, the rise of the digital transformation received significant importance inBusiness-to-Business (B2B) research. Social media applications provide executives with a raft ofnew options. Consequently, interfaces to social media platforms have also been integrated into B2Bsalesforce applications, although very little is as yet known about their usage and general impact onB2B sales performance. This paper evaluates 1) the conceptualization of social media usage in adyadic B2B relationship; 2) the effects of a more differentiated usage construct on customer satis-faction; 3) antecedents of social media usage on multiple levels; and 4) the effectiveness of socialmedia usage for different types of customers. The framework presented here is tested cross-industryagainst data collected from dyadic buyer-seller relationships in the IT service industry. The resultselucidate the preconditions and the impact of social media usage strategies in B2B sales relations.
Keywords: Social Media, Salesforce Applications, Business-to-Business, Customer Satisfaction
1 IntroductionIn recent years, the rise of the digital transformation has attracted much attention in variousresearch disciplines ([We13]). This is especially valid for social media and the develop-ment of the so called Web 2.0. Global usage of popular social media sites like Facebook,YouTube, and Twitter has grown to the point where it can only be described as ubiquitous([HN12, p. 69]). Social Media enable open and broad communication and cooperation([LB09]). They facilitate business decision processes ([BM11]) and help to improve or-ganizational productivity throughout the whole value chain ([Ch12]). Clearly, social me-dia applications now provide corporate IT and management executives with a raft of newoptions – targeting the impact of direct user interaction, say, or the online integration ofusers in corporate value creation processes ([DGL12]).
1 Reutlingen University, School of Informatics, Alteburgstr. 150, 72762 Reutlingen,[email protected]
2 Reutlingen University, School of Informatics, Alteburgstr. 150, 72762 Reutlingen,[email protected]
68 Alexander Rossmann and Gerald Stei
Thus, interfaces to social media platforms have recently also been integrated intosalesforce applications ([BC12]; [GS11]; [Me10]), although very little is known about us-age and general impact on B2B sales performance.
For all the valuable contributions made by social media research, a lot of important ques-tions still remain unexplored ([HN12]). This is particularly true for the use of social mediain B2B sales relationships. While two-third of US B2B sales executives reported viewingsocial media as an important channel to interact with customers, only seven percent of thesurvey group felt that their organization was adequately leveraging social media ([Ac11]).In the digital era, customers have access to a wide array of information and so no longerrely on salespeople as sole source of information about products, services, and innovation([BC12]). Instead, customers can gather information quickly and easily, use multiplesources of information, and interact how and when they want in the (digital) marketplace.
However, extant research offers only scant insight into the use of social media in B2Bsales relationships. Therefore, we need to achieve a better strategic understanding of howto use social media in sales processes ([SP12]). Resultant strategies need to be conceptu-alized and evaluated with respect to their effect on important B2B sales objectives likecustomer satisfaction, loyalty, and sales performance. To date, research has confined itselfto a quite holistic conceptualization of social media usage as a focal research construct,resulting in weak insights into the antecedents of social media usage in B2B sales rela-tionships and only limited data about the impact of social media usage on B2B corporateobjectives ([SSG12]). In particular, research needs to achieve a better understanding aboutthe interplay of social media strategies with different types of customers.
Responding to these gaps in current social media research, this paper addresses the fol-lowing four questions: 1) How should social media usage in B2B sales relationships beconceptualized on multiple levels? 2) Which B2B social media strategies are important inenhancing customer satisfaction? 3) Which antecedents drive the usage of social media onmultiple levels? 4) How effective is social media usage in B2B sales relationships fordifferent types of customers?
These questions have led us to formulate a conceptual model with a strong theoreticalfoundation in relationship theory. The model has been tested cross-industry against datacollected from dyadic buyer-seller relationships in the IT service industry. Results eluci-date the preconditions and the impact of social media usage strategies in B2B sales rela-tions.
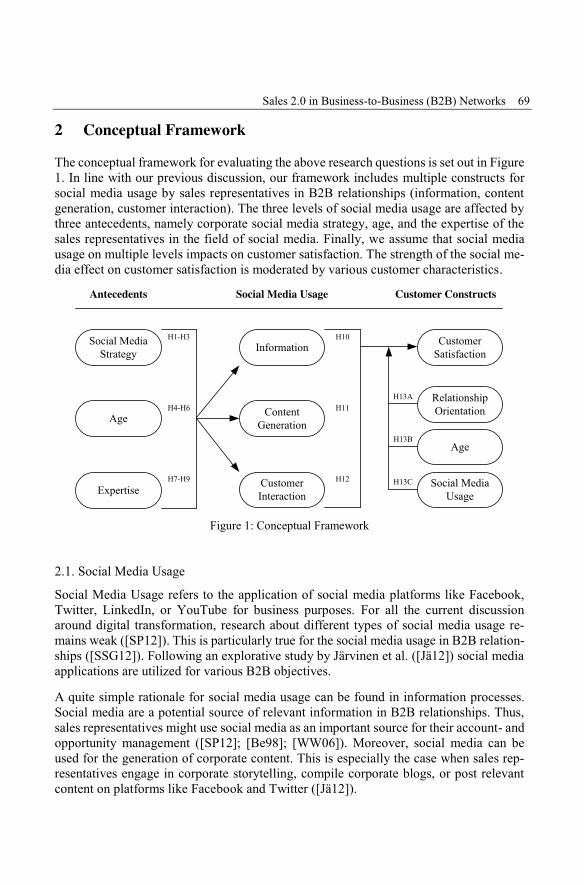
Sales 2.0 in Business-to-Business (B2B) Networks 69
2 Conceptual FrameworkThe conceptual framework for evaluating the above research questions is set out in Figure1. In line with our previous discussion, our framework includes multiple constructs forsocial media usage by sales representatives in B2B relationships (information, contentgeneration, customer interaction). The three levels of social media usage are affected bythree antecedents, namely corporate social media strategy, age, and the expertise of thesales representatives in the field of social media. Finally, we assume that social mediausage on multiple levels impacts on customer satisfaction. The strength of the social me-dia effect on customer satisfaction is moderated by various customer characteristics.
Social MediaStrategy
Age
Expertise
H1-H3
Antecedents Social Media Usage Customer Constructs
CustomerSatisfactionInformation
ContentGeneration
CustomerInteraction
H4-H6
H7-H9
H10
H11
H12
RelationshipOrientation
H13A
Age
Social MediaUsage
H13B
H13C
Figure 1: Conceptual Framework
2.1. Social Media Usage
Social Media Usage refers to the application of social media platforms like Facebook,Twitter, LinkedIn, or YouTube for business purposes. For all the current discussionaround digital transformation, research about different types of social media usage re-mains weak ([SP12]). This is particularly true for the social media usage in B2B relation-ships ([SSG12]). Following an explorative study by Järvinen et al. ([Jä12]) social mediaapplications are utilized for various B2B objectives.
A quite simple rationale for social media usage can be found in information processes.Social media are a potential source of relevant information in B2B relationships. Thus,sales representatives might use social media as an important source for their account- andopportunity management ([SP12]; [Be98]; [WW06]). Moreover, social media can beused for the generation of corporate content. This is especially the case when sales rep-resentatives engage in corporate storytelling, compile corporate blogs, or post relevantcontent on platforms like Facebook and Twitter ([Jä12]).
70 Alexander Rossmann and Gerald Stei
Finally, the bulk of existing research on social media usage concerns direct interactionbetween sales representatives and customers ([SP12]; [BC12]). The relationship to exist-ing customers can be supported, for example, by facilitating the transaction process([BGL02]).
Accordingly, social media usage by sales representatives may be resolved in terms ofthree independent constructs: (1) passive consumption of information via social media;(2) active generation of relevant content; and (3) direct interaction with current and po-tential customers.
2.2. Antecedents: Social Media Strategy, Age, and Expertise
The three focal constructs for social media usage are driven by three different anteced-ents. Social media strategy refers to the existence and quality of a corporate social mediastrategy. This leads to the question: What happens if the firm of a sales representativeruns a corporate social media strategy and encourages the sales staff to participate in theimplementation of this strategy? ([HWK09]). Prior research suggests that salespeople aremore likely to implement specific actions if sales managers, other executives, or evencustomers have the ability to reward desired and punish non-desired behavior ([Ve03]).The extent to which salespeople are integrated in a corporate strategy has a strong andpositive influence on their decision to adopt and use technology ([AP05]). As more sales-people within the company come to use social media, it will be easier for a single B2Bsalesperson to follow suit; moreover, it will encourage more rapid adoption, as they willface the social pressure from their sales peers ([PS97]). Therefore, we hypothesize:
H1-H3: The quality of the corporate social media strategy has a pos-itive impact on social media usage in terms of the consumption ofinformation, content generation, and active interaction with custom-ers.
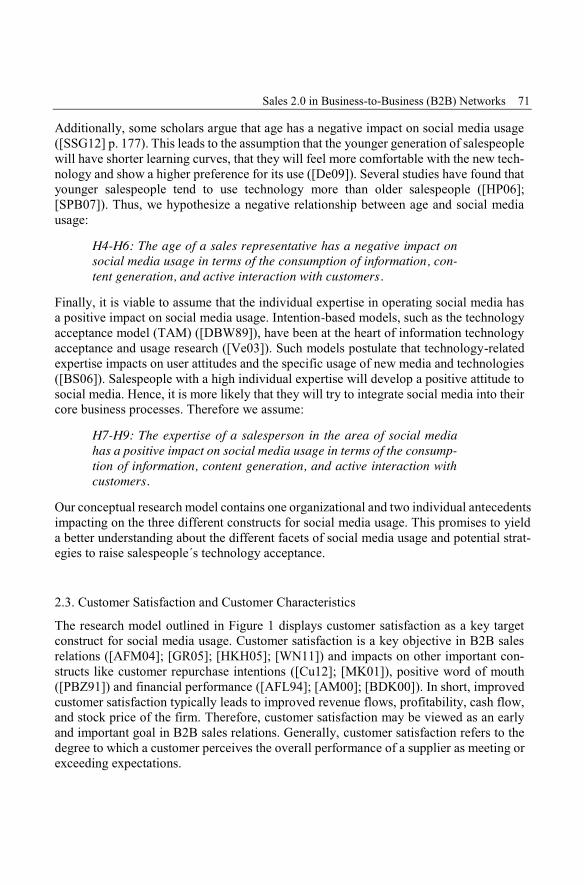
Sales 2.0 in Business-to-Business (B2B) Networks 71
Additionally, some scholars argue that age has a negative impact on social media usage([SSG12] p. 177). This leads to the assumption that the younger generation of salespeoplewill have shorter learning curves, that they will feel more comfortable with the new tech-nology and show a higher preference for its use ([De09]). Several studies have found thatyounger salespeople tend to use technology more than older salespeople ([HP06];[SPB07]). Thus, we hypothesize a negative relationship between age and social mediausage:
H4-H6: The age of a sales representative has a negative impact onsocial media usage in terms of the consumption of information, con-tent generation, and active interaction with customers.
Finally, it is viable to assume that the individual expertise in operating social media hasa positive impact on social media usage. Intention-based models, such as the technologyacceptance model (TAM) ([DBW89]), have been at the heart of information technologyacceptance and usage research ([Ve03]). Such models postulate that technology-relatedexpertise impacts on user attitudes and the specific usage of new media and technologies([BS06]). Salespeople with a high individual expertise will develop a positive attitude tosocial media. Hence, it is more likely that they will try to integrate social media into theircore business processes. Therefore we assume:
H7-H9: The expertise of a salesperson in the area of social mediahas a positive impact on social media usage in terms of the consump-tion of information, content generation, and active interaction withcustomers.
Our conceptual research model contains one organizational and two individual antecedentsimpacting on the three different constructs for social media usage. This promises to yielda better understanding about the different facets of social media usage and potential strat-egies to raise salespeople´s technology acceptance.
2.3. Customer Satisfaction and Customer Characteristics
The research model outlined in Figure 1 displays customer satisfaction as a key targetconstruct for social media usage. Customer satisfaction is a key objective in B2B salesrelations ([AFM04]; [GR05]; [HKH05]; [WN11]) and impacts on other important con-structs like customer repurchase intentions ([Cu12]; [MK01]), positive word of mouth([PBZ91]) and financial performance ([AFL94]; [AM00]; [BDK00]). In short, improvedcustomer satisfaction typically leads to improved revenue flows, profitability, cash flow,and stock price of the firm. Therefore, customer satisfaction may be viewed as an earlyand important goal in B2B sales relations. Generally, customer satisfaction refers to thedegree to which a customer perceives the overall performance of a supplier as meeting orexceeding expectations.
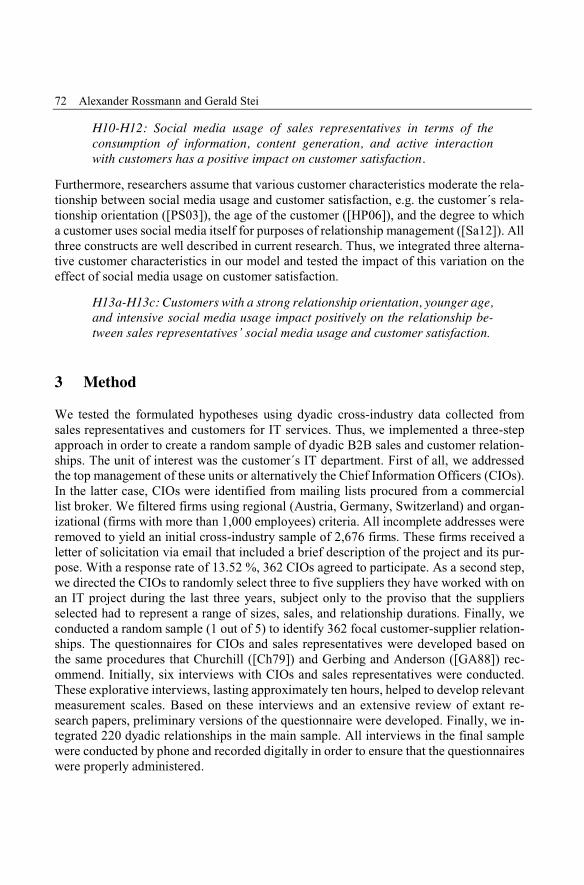
72 Alexander Rossmann and Gerald Stei
H10-H12: Social media usage of sales representatives in terms of theconsumption of information, content generation, and active interactionwith customers has a positive impact on customer satisfaction.
Furthermore, researchers assume that various customer characteristics moderate the rela-tionship between social media usage and customer satisfaction, e.g. the customer´s rela-tionship orientation ([PS03]), the age of the customer ([HP06]), and the degree to whicha customer uses social media itself for purposes of relationship management ([Sa12]). Allthree constructs are well described in current research. Thus, we integrated three alterna-tive customer characteristics in our model and tested the impact of this variation on theeffect of social media usage on customer satisfaction.
H13a-H13c: Customers with a strong relationship orientation, younger age,and intensive social media usage impact positively on the relationship be-tween sales representatives’ social media usage and customer satisfaction.
3 MethodWe tested the formulated hypotheses using dyadic cross-industry data collected fromsales representatives and customers for IT services. Thus, we implemented a three-stepapproach in order to create a random sample of dyadic B2B sales and customer relation-ships. The unit of interest was the customer´s IT department. First of all, we addressedthe top management of these units or alternatively the Chief Information Officers (CIOs).In the latter case, CIOs were identified from mailing lists procured from a commerciallist broker. We filtered firms using regional (Austria, Germany, Switzerland) and organ-izational (firms with more than 1,000 employees) criteria. All incomplete addresses wereremoved to yield an initial cross-industry sample of 2,676 firms. These firms received aletter of solicitation via email that included a brief description of the project and its pur-pose. With a response rate of 13.52 %, 362 CIOs agreed to participate. As a second step,we directed the CIOs to randomly select three to five suppliers they have worked with onan IT project during the last three years, subject only to the proviso that the suppliersselected had to represent a range of sizes, sales, and relationship durations. Finally, weconducted a random sample (1 out of 5) to identify 362 focal customer-supplier relation-ships. The questionnaires for CIOs and sales representatives were developed based onthe same procedures that Churchill ([Ch79]) and Gerbing and Anderson ([GA88]) rec-ommend. Initially, six interviews with CIOs and sales representatives were conducted.These explorative interviews, lasting approximately ten hours, helped to develop relevantmeasurement scales. Based on these interviews and an extensive review of extant re-search papers, preliminary versions of the questionnaire were developed. Finally, we in-tegrated 220 dyadic relationships in the main sample. All interviews in the final samplewere conducted by phone and recorded digitally in order to ensure that the questionnaireswere properly administered.
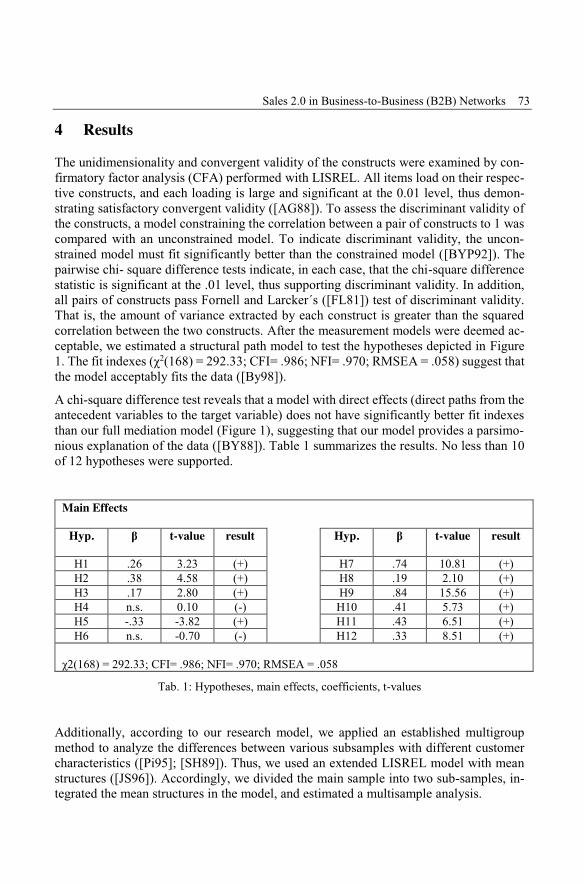
Sales 2.0 in Business-to-Business (B2B) Networks 73
4 ResultsThe unidimensionality and convergent validity of the constructs were examined by con-firmatory factor analysis (CFA) performed with LISREL. All items load on their respec-tive constructs, and each loading is large and significant at the 0.01 level, thus demon-strating satisfactory convergent validity ([AG88]). To assess the discriminant validity ofthe constructs, a model constraining the correlation between a pair of constructs to 1 wascompared with an unconstrained model. To indicate discriminant validity, the uncon-strained model must fit significantly better than the constrained model ([BYP92]). Thepairwise chi- square difference tests indicate, in each case, that the chi-square differencestatistic is significant at the .01 level, thus supporting discriminant validity. In addition,all pairs of constructs pass Fornell and Larcker´s ([FL81]) test of discriminant validity.That is, the amount of variance extracted by each construct is greater than the squaredcorrelation between the two constructs. After the measurement models were deemed ac-ceptable, we estimated a structural path model to test the hypotheses depicted in Figure1. The fit indexes (χ2(168) = 292.33; CFI= .986; NFI= .970; RMSEA = .058) suggest thatthe model acceptably fits the data ([By98]).
A chi-square difference test reveals that a model with direct effects (direct paths from theantecedent variables to the target variable) does not have significantly better fit indexesthan our full mediation model (Figure 1), suggesting that our model provides a parsimo-nious explanation of the data ([BY88]). Table 1 summarizes the results. No less than 10of 12 hypotheses were supported.
Main Effects
Hyp. β t-value result Hyp. β t-value result
H1 .26 3.23 (+) H7 .74 10.81 (+)H2 .38 4.58 (+) H8 .19 2.10 (+)H3 .17 2.80 (+) H9 .84 15.56 (+)H4 n.s. 0.10 (-) H10 .41 5.73 (+)H5 -.33 -3.82 (+) H11 .43 6.51 (+)H6 n.s. -0.70 (-) H12 .33 8.51 (+)
χ2(168) = 292.33; CFI= .986; NFI= .970; RMSEA = .058
Tab. 1: Hypotheses, main effects, coefficients, t-values
Additionally, according to our research model, we applied an established multigroupmethod to analyze the differences between various subsamples with different customercharacteristics ([Pi95]; [SH89]). Thus, we used an extended LISREL model with meanstructures ([JS96]). Accordingly, we divided the main sample into two sub-samples, in-tegrated the mean structures in the model, and estimated a multisample analysis.
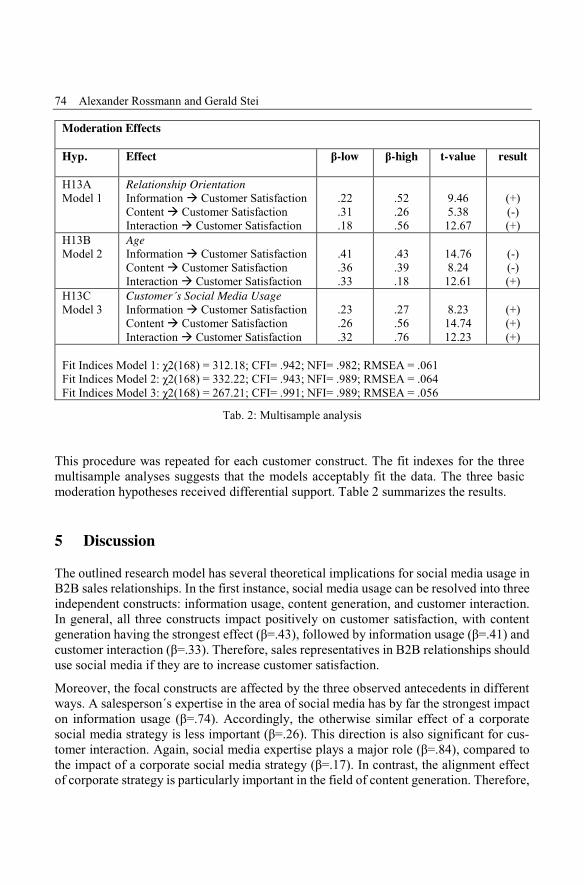
74 Alexander Rossmann and Gerald Stei
Moderation Effects
Hyp. Effect β-low β-high t-value result
H13AModel 1
Relationship OrientationInformation # Customer SatisfactionContent # Customer SatisfactionInteraction # Customer Satisfaction
.22
.31
.18
.52
.26
.56
9.465.38
12.67
(+)(-)(+)
H13BModel 2
AgeInformation # Customer SatisfactionContent # Customer SatisfactionInteraction # Customer Satisfaction
.41
.36
.33
.43
.39
.18
14.768.24
12.61
(-)(-)(+)
H13CModel 3
Customer´s Social Media UsageInformation # Customer SatisfactionContent # Customer SatisfactionInteraction # Customer Satisfaction
.23
.26
.32
.27
.56
.76
8.2314.7412.23
(+)(+)(+)
Fit Indices Model 1: χ2(168) = 312.18; CFI= .942; NFI= .982; RMSEA = .061Fit Indices Model 2: χ2(168) = 332.22; CFI= .943; NFI= .989; RMSEA = .064Fit Indices Model 3: χ2(168) = 267.21; CFI= .991; NFI= .989; RMSEA = .056
Tab. 2: Multisample analysis
This procedure was repeated for each customer construct. The fit indexes for the threemultisample analyses suggests that the models acceptably fit the data. The three basicmoderation hypotheses received differential support. Table 2 summarizes the results.
5 DiscussionThe outlined research model has several theoretical implications for social media usage inB2B sales relationships. In the first instance, social media usage can be resolved into threeindependent constructs: information usage, content generation, and customer interaction.In general, all three constructs impact positively on customer satisfaction, with contentgeneration having the strongest effect (β=.43), followed by information usage (β=.41) andcustomer interaction (β=.33). Therefore, sales representatives in B2B relationships shoulduse social media if they are to increase customer satisfaction.
Moreover, the focal constructs are affected by the three observed antecedents in differentways. A salesperson´s expertise in the area of social media has by far the strongest impacton information usage (β=.74). Accordingly, the otherwise similar effect of a corporatesocial media strategy is less important (β=.26). This direction is also significant for cus-tomer interaction. Again, social media expertise plays a major role (β=.84), compared tothe impact of a corporate social media strategy (β=.17). In contrast, the alignment effectof corporate strategy is particularly important in the field of content generation. Therefore,
Sales 2.0 in Business-to-Business (B2B) Networks 75
the quality of the corporate social media strategy impacts more strongly on content gener-ation (β=.38), compared to the similar effect of expertise (β=.19). Clearly, organizationalfactors are particularly important if corporations intend to increase the social media con-tent created by sales representatives. This could be explained by the resource situation ofsales representatives (time for content generation, pre-defined organizational content) orelse by security and compliance considerations (approval for content generation). The so-cial media expertise of sales representatives is more important when corporations focuson information usage and customer interaction. These theoretical interactions and, in par-ticular, the dynamic interplay between organization/individual factors and different vari-ations for social media usage are not covered by current research.
Surprisingly, the key assumptions for the impact of age on social media usage were notfully supported by our research. The age of sales representatives has no general negativeimpact on social media usage. Clearly, salespeople in a higher age bracket also use theinformation offered by social media. They are also motivated and able to interact withcustomers using social media platforms. Nevertheless, a negative effect of age on contentgeneration was supported by our research (β=-.33). Thus, older salespeople seem to usesocial media in passive ways (information) or if it is important for interacting with thecustomer, but they are less motivated to create their own content.
Additionally, the outlined research holds further relevant implications, due to the impactof social media usage with different customer characteristics. Generally, the impact ofsocial media usage is more relevant in all three variations when the customers themselvesuse social media. Again, age is particularly important in the area of interaction. Hence, itis more important to use social media for interaction with younger customers (β=.33),compared to the same situation with older customers (β=.18). Accordingly, our researchfound no support for further moderation effects driven by the age of the customer. Finally,the customer’s relationship orientation (transactional versus relational) impacts on thestrength of the outlined main effects. The usage of information provided by social mediaand direct interaction is significantly more important for relational customers, whereas thiseffect is not supported for content generation.
Even more promising for executives are the managerial implications outlined by this re-search. Marketing and sales executives should foster the expertise of their sales repre-sentatives in the area of social media. This will lead to a stronger usage of informationdelivered though these new media formats for purposes of B2B account- and opportunitymanagement. Moreover, the expertise of sales representatives drives direct interactionwith B2B customers. Such strategies are particularly important for corporations handlingcustomer relationships or dealing with customers who use social media intensively fortheir own business. A strong corporate social media strategy and viable formats for train-ing and personal development will both contribute significantly to customer satisfaction.In sum, social media will continue to play an important role for sales performance in B2Brelationships.
76 Alexander Rossmann and Gerald Stei
References[Ac11] Accenture: Embracing Social Media in a B2B Context, Accenture Dublin, 2011.
[AFL94] Anderson, E. W.; Fornell, C.; Lehmann, D. R.: “Customer Satisfaction, Market Shareand Profitability: Findings from Sweden. Journal of Marketing, 58(July), 53-66, 1994.
[AFM04] Anderson, E. W.; Fornell, C.; Mazvancheryl, S.: Customer Satisfaction and ShareholderValue. Journal of Marketing, 68(4), 172-185, 2004.
[AG88] Anderson, J.; Gerbing, D. W.: Structural Equation Modeling in Practice: A Review andRecommended Two-Step Approach. Psychological Bulletin, Vol. 103(3), 411-425,1988.
[AM00] Anderson, E. W.; Mittal, V.: Strengthening the Satisfaction-Profit Chain. Journal of Ser-vice Research, Vol. 3(2), 107-120, 2000.
[AP05] Avlonitis, G. J.; Panagopoulos, N. G.: Antecedents and Consequences of CRM Tech-nology Acceptance in the Sales Forces. Industrial Marketing Management, Vol. 34(4),355-368, 2005.
[BY88] Bagozzi, R. P.; Yi, Y.: On the Evaluation of Structural Equation Models. Journal of theAcademy of Marketing Science, Vol. 16(1), 74-94, 1988.
[BYP92] Bagozzi, R. P.; Yi, Y.; Philips, L. W.: Assessing Construct Validity in OrganizationalResearch. Administrative Science Quarterly, Vol. 36 (September), 421-458, 1992.
[BGL02] Bauer, H. H.; Grether, M.; Leach, M.: Building Customer Relations over the Internet.Industrial Marketing Management, Vol. 31(1), 155-163, 2002.
[BDK00] Bernhardt, K. L.; Donthu, N.; Kennett, P. A.: A Longitudinal Analysis of Satisfactionand Profitability. Journal of Business Research, Vol. 47, 161-171, 2000.
[Be98] Berthon, P.; Lane, N.; Pitt, L.; Watson, R. T.: The World Wide Web as an IndustrialMarketing Communication Tool: Models for the Identification and Assessment of Op-portunities. Journal of Marketing Management, Vol. 14, 691-704, 1998.
[BS06] Bhattacherjee, A.; Sanford, C.: Influence Strategies for Information Technology Usage:An Elaboration-Likelihood Model. MIS Quarterly, 30, 805-825, 2006.
[BC12] Bodnar, K.; Cohen, J. L.: The B2B Social Media Book, Wiley, Hoboken, NJ, 2012.
[BM11] Bradley, A. J.; McDonald, M. P.: The Social Organization: How to Use Social Media toTap the Collective Genius of your Customers and Employees, Boston MA: HarvardBusiness Review Press, 2011.
[By98] Byrne, B.: Structural Equation Modeling with LISREL, PRELIS and SIMPLIS: BasisConcepts, Applications, and Programming, Mahwah, NJ, 1998.
[Ch12] Chui, M.; Manyika, J.; Bughin, J.; Dobbs, R.; Roxburgh, C.; Sarrazin, H.; Sands, G.;Westergren, M.: The Social Economy: Unlocking Value and Productivity Through So-cial Technologies, McKinsey Global Institute, 2012.
[Ch79] Churchill, G. A. Jr.: A Paradigm for Developing Better Measures of Marketing Con-structs. Journal of Marketing, 16 (February), 64-73, 1979.
Sales 2.0 in Business-to-Business (B2B) Networks 77
[Cu12] Curtis, T.; Abratt, R.; Dion, P.; Rhoades, D.: Customer Satisfaction, Loyalty and Repur-chase: Some Evidence from Apparel Customers. Review of Business, 32(1), 47-57,2012.
[DBW89] Davis, F. D.; Bagozzi, R. P.; Warshaw, P. R.: User Acceptance of Computer Technol-ogy: A Comparison of Two Theoretical Models. Management Science, 35, 982-1003,1989.
[DGL12] De Vries, L.; Gensler, S.; Leeflang, P. S. H.: Popularity of Brand Posts on Brand FanPages: An Investigation of the Effects of Social Media Marketing. Journal of InteractiveMarketing, Vol. 26 (2), 83-91, 2012.
[De09] DelVecchio, S.; Baby Boomers and Generation X Industrial Salespeople: GenerationalDivide or Convergence. The Journal of Applied Business Research, Vol. 25(5), 69-84,2009.
[FL81] Fornell, C.; Larcker, D. F.: Evaluating Structural Equation Models with UnobservableVariables and Measurement Error. Journal of Marketing Research, Vol.28 (February),39-50, 1981.
[GA88] Gerbing, D. W.; Anderson, J.: An Updated Paradigm for Scale Development Incorpo-rating Unidimensionality and Its Assessment. Journal of Marketing Research, 25(May),186-192, 1988.
[GS11] Gillin, P.; Schwartzman, E.: Social Marketing to the Business Customer, Wiley, Hobo-ken, NJ, 2011.
[GR05] Gruca, T. S.; Rego, L. L.: Customer Satisfaction, Cash Flow, and Shareholder Value.Journal of Marketing, 693, 115-130, 2005.
[HN12] Hoffman, D. L.; Novak, T. P.: Towards a Deeper Understanding of Social Media. Jour-nal of Interactive Marketing, Vol. 26, 69-70, 2012.
[HKH05] Homburg, C.; Koschate, N.; Hoyer, W. D.: Do Satisfied Customers Really Pay More?A Study of the Relationship between Customer Satisfaction and Willingness to Pay.Journal of Marketing, 69 (April), 84-96, 2005.
[HWK09] Homburg, C.; Wieseke, J.; Kuehnl, C.: Social Influence on Salespeople´s Adoption ofSales Technology. Journal of the Academy of Marketing Science, Vol. 38(2), 159-168,2009.
[HP06] Hunter, G. K.; Perreault, W. D.: Sales Technology Orientation, Information Effective-ness and Sales Performance. Journal of Personal Selling & Sales Management, Vol.26(2), 95-113, 2006.
[Jä12] Järvinen, J.; Tollinen, A.; Karjaluoto, H.; Jayawardhema, C.: Digital and Social MediaMarketing Usage in B2B Industrial Section. Marketing Management Journal, Vol.22(2), pp.102-117, 2012.
[JS96] Jöreskog, K.; Sörbom, D.: LISREL 8: User´s Reference Guide, Lincolnwood: ScientificSoftware International, 1996.
[LB09] Li, C.; Bernoff, J.: Marketing in the Groundswell, Cambridge MA: Harvard BusinessPress, 2009.
78 Alexander Rossmann and Gerald Stei
[Me10] Meyerson, M.: Success Secrets of the Social Media Marketing Superstars, EntrepeneurPress, Irvine, CA, 2010.
[MK01] Mittal, V.; Kamakura, W.: Satisfaction, Repurchase Intent, and Repurchase Behavior:Investigating the Moderating Effect of Customer Characteristics. Journal of MarketingResearch, Vol. 38(Feb.), 131-142, 2001.
[PBZ91] Parasuraman, A.; Berry, L. L.; Zeithaml, V. A.: Perceived Service Quality as a Cus-tomer-Based Performance Measure: An Empirical Examination of Organizational Bar-riers Using an Extended Service Quality Model. Human Resource Management, Vol.30(Fall), 335-364, 1991.
[PS97] Parthasarathy, M.; Sohi, R. S.: Salesforce Automation and the Adoption of Technologi-cal Innovations by Salespeople: Theory and Implications. Journal of Business and In-dustrial Marketing, Vol. 12(3/4), 196-208, 1997.
[PS03] Pillai, K. G.; Sharma, A.: Mature Relationships: Why Does Relational Orientation Turninto Transaction Orientation? Industrial Marketing Management, 32(8), 643-651, 2003.
[Pi95] Ping, R. A.: A Parsimonious Estimating Technique for Interaction and Quadratic LatentVariables. Journal of Marketing Research, Vol. 32 (August), 336-347, 1995.
[Sa12] Sashi, C. M.: Customer Engagement, Buyer-Seller Relationships, and Social Media.Management Decision, Vol. 50(2), 253-272, 2012.
[SPB07] Senecal, S.; Pullins, E. B.; Bueher, R. E.: The Extent of Technology Use and Salespeo-ple: An Exploratory Investigation. Journal of Business & Industrial Marketing,Vol.22(1), 52-61, 2007.
[SP12] Sood, S. C.; Pattinson, H. M.: 21st Century Applicability of the Interaction Model: DoesPervasiveness of Social Media in B2B Marketing Increase Business Dependency on theInteraction Model? Journal of Customer Behaviour, Vol. 11(2), 117-128, 2012.
[SSG12] Schultz, R. J.; Schwepker, C. H.; Good, D. J.: Social Media Usage: An Investigation ofB2B Salespeople. American Journal of Business, Vol. 27(2), 174-194, 2012.
[SH89] Stone, E. F.; Hollenbeck, J. R.: Clarifying Some Controversial Issues Surrounding Sta-tistical Procedures for Detecting Moderator Variables: Empirical Evidence and RelatedMatters. Journal of Applied Psychology, Vol. 74(1), 3-10. 1989.
[Ve03] Venkatesh, V.; Morris, M. G.; Davis, G. B.; Davis, F. D.: User Acceptance of Infor-mation Technology. MIS Quarterly, Vol. 27(3), 425-476, 2003.
[We13] Weinberg, B. D.; de Ruyter, K.; Dellarocas, C.; Buck, M.; Keeling, D. I.: DestinationSocial Business: Exploring an Organization´s Journey with Social Media, CollaborativeCommunity and Expressive Individuality. Journal of Interactive Marketing, Vol. 27,299-310, 2013.
[WW06] Welling, R.; White, L.: Web Site Performance Measurement: Promise and Reality. Man-aging Service Quality, Vol. 16(6), 654-670, 2006.
[WN11] Williams, P.; Naumann, E.: Customer Satisfaction and Business Performance: A Firm-level Analysis. Journal of Services Marketing, 25(1), 20-32, 2011.
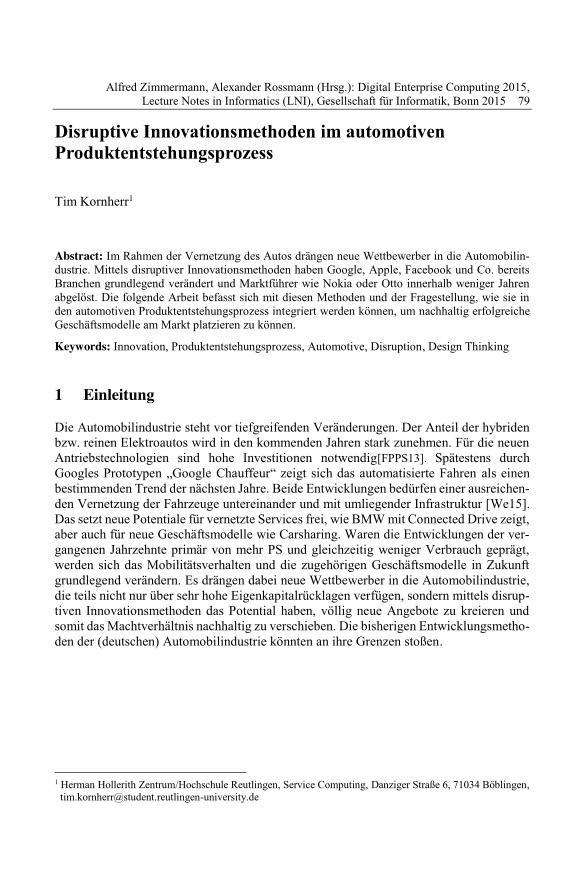
Alfred Zimmermann, Alexander Rossmann (Hrsg.): Digital Enterprise Computing 2015,Lecture Notes in Informatics (LNI), Gesellschaft für Informatik, Bonn 2015 79
Disruptive Innovationsmethoden im automotivenProduktentstehungsprozess
Tim Kornherr1
Abstract: Im Rahmen der Vernetzung des Autos drängen neue Wettbewerber in die Automobilin-dustrie. Mittels disruptiver Innovationsmethoden haben Google, Apple, Facebook und Co. bereitsBranchen grundlegend verändert und Marktführer wie Nokia oder Otto innerhalb weniger Jahrenabgelöst. Die folgende Arbeit befasst sich mit diesen Methoden und der Fragestellung, wie sie inden automotiven Produktentstehungsprozess integriert werden können, um nachhaltig erfolgreicheGeschäftsmodelle am Markt platzieren zu können.
Keywords: Innovation, Produktentstehungsprozess, Automotive, Disruption, Design Thinking
1 EinleitungDie Automobilindustrie steht vor tiefgreifenden Veränderungen. Der Anteil der hybridenbzw. reinen Elektroautos wird in den kommenden Jahren stark zunehmen. Für die neuenAntriebstechnologien sind hohe Investitionen notwendig[FPPS13]. Spätestens durchGoogles Prototypen „Google Chauffeur“ zeigt sich das automatisierte Fahren als einenbestimmenden Trend der nächsten Jahre. Beide Entwicklungen bedürfen einer ausreichen-den Vernetzung der Fahrzeuge untereinander und mit umliegender Infrastruktur [We15].Das setzt neue Potentiale für vernetzte Services frei, wie BMW mit Connected Drive zeigt,aber auch für neue Geschäftsmodelle wie Carsharing. Waren die Entwicklungen der ver-gangenen Jahrzehnte primär von mehr PS und gleichzeitig weniger Verbrauch geprägt,werden sich das Mobilitätsverhalten und die zugehörigen Geschäftsmodelle in Zukunftgrundlegend verändern. Es drängen dabei neue Wettbewerber in die Automobilindustrie,die teils nicht nur über sehr hohe Eigenkapitalrücklagen verfügen, sondern mittels disrup-tiven Innovationsmethoden das Potential haben, völlig neue Angebote zu kreieren undsomit das Machtverhältnis nachhaltig zu verschieben. Die bisherigen Entwicklungsmetho-den der (deutschen) Automobilindustrie könnten an ihre Grenzen stoßen.
1 Herman Hollerith Zentrum/Hochschule Reutlingen, Service Computing, Danziger Straße 6, 71034 Böblingen,[email protected]
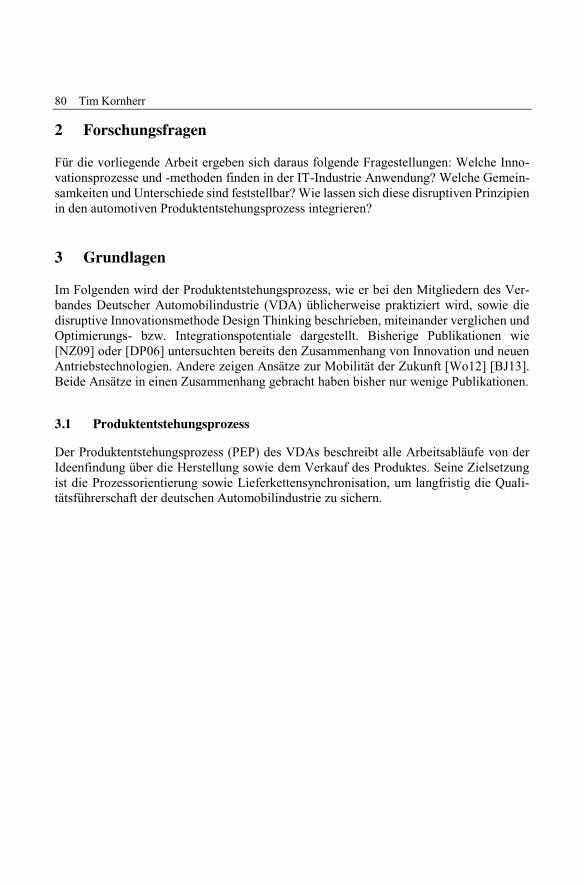
80 Tim Kornherr
2 ForschungsfragenFür die vorliegende Arbeit ergeben sich daraus folgende Fragestellungen: Welche Inno-vationsprozesse und -methoden finden in der IT-Industrie Anwendung? Welche Gemein-samkeiten und Unterschiede sind feststellbar? Wie lassen sich diese disruptiven Prinzipienin den automotiven Produktentstehungsprozess integrieren?
3 GrundlagenIm Folgenden wird der Produktentstehungsprozess, wie er bei den Mitgliedern des Ver-bandes Deutscher Automobilindustrie (VDA) üblicherweise praktiziert wird, sowie diedisruptive Innovationsmethode Design Thinking beschrieben, miteinander verglichen undOptimierungs- bzw. Integrationspotentiale dargestellt. Bisherige Publikationen wie[NZ09] oder [DP06] untersuchten bereits den Zusammenhang von Innovation und neuenAntriebstechnologien. Andere zeigen Ansätze zur Mobilität der Zukunft [Wo12] [BJ13].Beide Ansätze in einen Zusammenhang gebracht haben bisher nur wenige Publikationen.
3.1 ProduktentstehungsprozessDer Produktentstehungsprozess (PEP) des VDAs beschreibt alle Arbeitsabläufe von derIdeenfindung über die Herstellung sowie dem Verkauf des Produktes. Seine Zielsetzungist die Prozessorientierung sowie Lieferkettensynchronisation, um langfristig die Quali-tätsführerschaft der deutschen Automobilindustrie zu sichern.
Disruptive Innovationsmethoden im automotiven Produktentstehungsprozess 81
Abbildung 1: Produktionsentstehungsprozess nach VDA Norm 4.3 [SE05]
Der Produktentstehungsprozess ist in der VDA-Norm 4.3 beschrieben und liefert Richtli-nien zur Definition von Entwicklungsprojekten. Insgesamt sind sieben Schritte zu durch-laufen, in denen verschiedene Aufgabenfelder wie Konzeption, Entwicklung, Produktionund Produktabnahme abgearbeitet werden. Durch die Abnahme eines jeden Schrittes an-hand vordefinierter Checklisten und Richtlinien soll damit die Qualität vor dem Produkti-onsstart (Start Of Production – SOP) sichergestellt werden [SE05].
3.2 Disruptive Innovationen
Disruptive Innovationen adressiert einen Markt oder einen Sektor, der zuvor nicht bear-beitet werden konnte oder verändert bestehende Strukturen durch die Einführung einereinfacheren, günstigeren oder komfortableren Lösung. Meist wächst eine Disruption auseiner Niche heraus in komplizierten Märkten bzw. solchen mit hohen Kosten. Unterneh-men mit disruptiven Innovationensmethoden kommen unerwartet, verändern Märkte undProduktgattungen nachhaltig und schaffen es dadurch, etablierte Anbieter zu verdrängen[CH12]. Das wohl bekannteste Beispiel ist Apple mit dem Launch des iPhones, welchesbinnen kurzer Zeit den Handymarkt extrem veränderte und den Marktführer Nokia ver-drängt hat. Wie auch andere Unternehmen aus dem Silicon Valley setzt Apple dabei aufdie Design Thinking Methode. Design Thinking wurde Mitte der 80er Jahre von DavidKelley von der Design-Agentur IDEO entwickelt. Ziel war eine Innovationsmethode zuschaffen, die die Bedürfnisse der Nutzer in den Fokus stellt. Eine Innovation ist in Ein-klang mit der Wirtschaftlichkeit, der Machbarkeit sowie der Wünschbarkeit der Nutzer
82 Tim Kornherr
und wird optimaler Weise in interdisziplinären Teams in einem kreativen Umfeld entwi-ckelt [GÜ13].
Abbildung 2: Prozessschritte von Design Thinking [CR15]
Ein empathisches Verständnis über die Probleme und Bedürfnisse der Nutzer ist der ersteProzessschritt. Verstärkt wird dies durch das wiederholte Beobachten und Befragen derUser. Erst dann können Erkenntnisse (Insights) abgeleitet werden. Basierend darauf wer-den Ideen entwickelt und zu Prototypen entwickelt, um sie schließlich vom Endkundentesten lassen zu können. Das gewonnene Feedback stößt einen iterativen Folgeprozess zurkontinuierlichen Verbesserung an. Die Besonderheiten der Methode liegen darüber hinausin der visuellen Darstellung und Dokumentation, dem narrativen Beschreiben (Storytel-ling) sowie der interdisziplinären Zusammenarbeit in kleinen Teams. [BR08]
4 VergleichWie sich zeigt, stellt der Produktentstehungsprozess den Qualitätsanspruch und die Pro-duktion in den Vordergrund, wohingegen Design Thinking auf das Kundenerleben abzielt.Beide Ansätze arbeiten nach einem fest definierten Prozess. Der PEP sieht im Idealfallkeine Iteration vor, er ist sequenziell aufgebaut. Alles zielt auf das Erreichen der nächstenQualitätsmeilensteine ab. Die Kundenperspektive trägt lediglich zu Beginn einen geringenAnteil. Die Folge ist eine hohe Technologieorientierung. Durch die fehlenden Kunden-rückmeldungen und abgeleiteten Iterationsschritten ist die Wahrscheinlichkeit für einenFlop nach Markteintritt beim Produktentstehungsprozess höher. Design Thinking und die„Trail&Error“ Kultur kann durch das Beobachten des Kundenerlebnisses eine höhereKundenorientierung und –akzeptanz gewährleisten.
Nachfrage und Mobilitätsgewohnheiten werden diese langfristig nicht genügen, disruptiveAnsätze sind gefragt. Um die hohen Qualitätsanforderungen halten zu können und trotz-dem gleichzeitig kundenorientierte Lösungen zu entwickeln, ist die Verzahnung beiderModelle von Nöten. Der Produktentstehungsprozess sollte sich im Sinne disruptiver Inno-vation frühzeitig für mehr Nutzerfeedback und mehr Interaktionen öffnen. Gerade in derKreativphase zu Beginn - bei Konzeptionierung sowie Produktentstehung und –verifizie-rung - bieten sich Möglichkeiten, den Prozess flexibler zu gestalten und die Qualitäts- zu
Disruptive Innovationsmethoden im automotiven Produktentstehungsprozess 83
einer Kundenorientierung umzugestalten. Ein abgegrenztes Testfeld unter realen Bedin-gungen kann helfen, die Kundenanforderungen tiefgreifend zu erforschen. Auch die dabeiverwendeten Prototypen, welche von Nutzern in dem Testfeld verwendet werden, könnenwichtige Erkenntnisse entwickeln und als Input für eine kontinuierliche Verbesserung die-nen.
5 Fazit und AusblickDisruptive Innovationen sind für kommende Mobilitätskonzepte notwendig. Die Quali-tätskonzentration der deutschen Automobilindustrie war in der Vergangenheit der Erfolgs-faktor. Um die Innovationsfähigkeit künftig weiter zu sichern, muss sich der Prozess fürmehr Kundenorientierung öffnen und den User früher und aktiver involvieren. Dies erhöhtdie Wahrscheinlichkeit, dass Flops frühzeitiger identifiziert werden können, somit das In-novationsbudget effektiver eingesetzt und durch die prozessorientierte VorgehensweiseEffektivität gewährleistet ist. Weiterhin ist Raum fur eine „Trial&Error“-Fehlerkultur not-wendig, die iterative Prozesse zulässt.
Bei der Integration von externem Knowhow in den Innovationsprozess, sind weitere For-schungen in Bezug auf Open Innovation Ansätze zu untersuchen. Wie kann der Innovati-onsprozess flexibler gestaltet werden? Wie kann Geschwindigkeit und Effektivität erhöhtwerden? 3D Printer Konzepte zur Erstellung von Prototypen oder gar Industrie 4.0 zurFlexibilisierung der Produktion stellen themennahe Forschungsfelder dar. Welche aktuel-len Trends bzw. Technologien können positiven Einfluss auf den Innovationsprozess ha-ben? Wie lassen sich diese integrieren?
Literaturverzeichnis[BJ13] Jaekel, M.; Bronnert, K.: Die digitale Evolution moderner Großstädte. Smart City-Initi-
ativen in Action – Vernetzte urbane Mobilität, Wiesbaden, 2013.
[BR08] Brown, T.: Design Thinking. Harvard Business Review, Boston, 2008.
[CH12] Christensen, C.: Disruptive Innovation, http://www.claytonchristensen.com/key-con-cepts/, letzter Aufruf 22.03.2015.
[CR15] Creaffective: Design Thinking Prozess, http://www.creaffective.de/de/creaffective/ar-beitsweise/innovationsprozesse/design-thinking/, letzter Zugriff 22.03.2015.
[DP06] Dyerson, R.; Pilkington, A.: Innovation in disruptive regulatory environments: A patentstudy of electric vehicle technology development, 2006.
[FPPS13] Fojcik, M.; Proff, H.; Proff, H. V.; Sandau, J.: Aufbruch in die Elektromobilität. Märkte– Geschäftsmodelle – Qualifi kationen – Bewertung, Kienbaum Global Practice GroupAutomotive & Lehrstuhl für ABWL & Internationales Automobilmanagement, Univer-sität Duisburg-Essen, 2013.

84 Tim Kornherr
[GÜ13] Gürtler, J.: Design Thinking - Woher kommen eigentlich die wirklich guten Ideen? Ob-jektForum Karlsruhe. Karlsruhe, 2000.
[NZ09] Nieuwenhuisa, B.; Zapataa, C.: Exploring innovation in the automotive industry: newtechnologies for cleaner cars, 2009.
[We15] Wee, D.: Autonomous Driving – 10 ways in which autonomous vehicles could reshapeour lives, McKinsey, 2015.
[Wo12] Wolter, S.: Zukünftige Entwicklungen in der Mobilität. Smart Mobility- IntelligenteVernetzung der Verkehrsangebote in Großstädten, Springer Verlag, Wiesbaden 2009.
[SE05] Seidel, M.: Methodische Produktplanung. Grundlagen, Systematik und Anwendung imProduktentstehungsprozess, Universitätsverlag Karlsruhe, Karlsruhe, 2005.
Alfred Zimmermann, Alexander Rossmann (Hrsg.): Digital Enterprise Computing 2015,Lecture Notes in Informatics (LNI), Gesellschaft für Informatik, Bonn 2015 85
Herausforderungen der Projektfertigung – eine Fallstudiezur Informationsbedarfsanalyse
Steffen Brümmel1, Martin Schößler2 und Birger Lantow3
Abstract: Insbesondere bei Standardlösungen für ERP-Systeme gestaltet sich die Abbildung derfachlichen bzw. technologischen Zusammenhänge der Projektfertigung im ERP-System schwierig.Mit wechselnden Anforderungen in einer Vielzahl von Projekten stoßen die Systeme an die Grenzenihrer Flexibilität. Ein Großteil der wesentlichen Informationen zu Fertigungsprojekten liegt außer-halb des ERP-Systems. Mit dem Fernziel einer Assistenzfunktion zur Planungsunterstützung in derProjektfertigung, stellt diese Arbeit exemplarisch die Durchführung einer Analyse zur Informations-bedarfsermittlung nach Lundqvist et al. dar. Ergebnisse sind der Nachweis der grundsätzlichen An-wendbarkeit dieser Methode für dieses Ziel, Erfahrungen bei der Anwendung und Analyseergeb-nisse sowohl für den konkreten Fall als auch in verallgemeinerter Form.
Keywords: Informationsbedarfsanalyse, Unternehmensmodellierung, Informationsbedarfsmuster,Projektfertigung, ERP-System
1 EinleitungIm aktuellen wirtschaftlichen Umfeld stehen viele Unternehmen vor der Herausforderung,mit wenigen, teilweise unscharfen Anforderungen Produkte anzubieten bzw. projektartigzu planen und auszuführen. Diese Unschärfe erschwert es, auf viele bereits im ERP-Sys-tem vorhandene Informationen und auf in der Vergangenheit durchgeführte Projekte zu-rückzugreifen. Derartige Informationen stellen einen Wissensvorrat des Unternehmensdar, der nur durch die Mitarbeiter in den richtigen bzw. für das neue Projekt sinnvollenund unterstützenden Zusammenhang gebracht werden kann. Eine Unterstützung der Mit-arbeiter durch das ERP-System an dieser Stelle eröffnet die Möglichkeit, den umfangrei-chen Daten- und Erfahrungsvorrat aus der Vergangenheit in der Gegenwart wesentlicheffektiver zu nutzen. Die vorliegende Studie stellt einen Baustein auf dem Weg zu diesemZiel dar. Sie ist durch eine Kooperation im „BeProductive!“-Firmennetzwerk (www.be-productive.org) entstanden. Durch die Vernetzung von produzierenden Unternehmen,Software- und Hardwareherstellern, Dienstleistern aus dem EPR-, MES- und BDE Umfeldsowie Forschungseinrichtungen aus den Bereichen IT, Visual Computing und Arbeitsphy-siologie sollen Lösungen zur besseren Unterstützung des Wissensträger Mensch in derProduktion erarbeitet werden.
1 Universität Rostock, Lehrstuhl für Wirtschaftsinformatik, [email protected] Universität Rostock, Lehrstuhl für Wirtschaftsinformatik, [email protected] Universität Rostock, Lehrstuhl für Wirtschaftsinformatik, [email protected]
86 Steffen Brümmel et al.
Eine besondere Bedeutung der IT in Bezug auf unternehmensberichtete Maßnahmen istim Bereich der Systeme des Enterprise Resource Planning (ERP-Systeme) anzusehen,welche die umfassendsten und komplexesten Vertreter der in Unternehmen eingesetztenInformationssysteme (IS) darstellen [MS12, S. 25]. ERP-Systembietet dem Nutzer dieMöglichkeit, die funktionale Koordination und die Ablaufkontrolle der Geschäftsprozessezu unterstützen [MS12, S. 25-27]. Die Betrachtungen sind hauptsächlich auf unterneh-mensinterne Prozesse bezogen [MS12, S.25]. Insbesondere bei Standardlösungen fürERP-Systeme gestaltet sich die Abbildung der fachlichen bzw. technologischen Zusam-menhänge im ERP-System schwierig. Mit wechselnden Anforderungen in einer Vielzahlvon Projekten stoßen die Systeme an die Grenzen ihrer Flexibilität. Ein Großteil der we-sentlichen Informationen zu Fertigungsprojekten liegt außerhalb des ERP-Systems. Diesresultiert in einer mangelnden Unterstützung insbesondere bei der Planung und Kalkula-tion.
Mit dem Ziel einer werkzeugunterstützten Zusammenführung von Informationen ausERP-Systemen und anderen projektbezogenen Informationsquellen sollen Planungs- undKalkulationsaufgaben zukünftig unterstützt werden. Dazu muss zunächst der Informati-onsbedarf für diese Aufgaben bestimmt werden. Abschnitt 2 der Arbeit greift diese Prob-lematik auf und stellt Ansätze zur Informationsbedarfsanalyse dar. Mit dem Ziel der Ver-allgemeinerung des Informationsbedarfs vor dem Hintergrund einer breiten Anwendbar-keit der Lösung, werden der Ansatz der Informationsbedarfsmuster nach Sandkuhl [Sa12]und ein komplementärer Ansatz zur Informationsbedarfsanalyse [LS+12] tiefer betrachtet.Im folgenden dritten Abschnitt werden die Anwendung der Methode und die Musterent-wicklung in einem konkreten Anwendungsfall diskutiert. Der letzte Abschnitt diskutiertdie gewonnenen Erfahrungen und gibt einen Ausblick auf folgende Schritte.
2 Informationsbedarfsanalyse„Unter Informationsbedarfsanalyse subsumieren wir jene Verfahren, die geeignet sind,diejenigen Informationen zu ermitteln, die für die Lösung konkreter betriebswirtschaftli-cher Aufgaben im Rahmen eines Unternehmens erforderlich sind.“[Ko76, S. 65]. Entspre-chend der Unterscheidung zwischen objektivem und subjektivem Informationsbedarf wer-den auch bei der Analyse eine subjektive und objektive Sichtweise unterschieden. Bei dersubjektiven Betrachtung steht der Nutzer im Mittelpunkt, wobei sein Bedarfsprofil ermit-telt wird. Oftmals entspricht dieses seiner Informationsnachfrage. Die objektive Betrach-tungsweise ist hingegen losgelöst vom Benutzer. Stattdessen erfolgt die Bedarfsermittlungauf Basis von Aufgabe und Problem [Ko76, S. 65 f.]. Aus Sicht der strategischen Unter-nehmensplanung, die Ziele und Strategien der nächsten fünf oder mehr Jahre festlegt[Eh07, S. 21], ist außerdem eine Unterscheidung in zwei Teilbedarfe, den Informations-grundbedarf und den situativen Informationsbedarf, vorzunehmen. Während der Grund-bedarf durch branchen- und unternehmenstypische Bedarfe charakterisiert wird und somitweniger veränderlich ist, ist der situative Bedarf kaum vorhersehbar, da er aktuelle Ent-
Herausforderungen der Projektfertigung – eine Fallstudie zur Informationsbedarfsanalyse 87
wicklungen ausdrückt [Be95, S. 29 f.]. In der Projektfertigung sehen wir uns im Span-nungsfeld zwischen dem Grundbedarf und dem situativen Bedarf. Ziel ist es, auf der Basisfachlicher und technologischer Zusammenhänge Unterstützung bei der Befriedigung dessituativen Bedarfs zu bieten. Dazu müssen mögliche Informationsquellen identifiziertwerden und eine geeignete Charakterisierung des situativen Bedarfs erarbeitet werden.
Neben der Beschreibung des Informationsbedarfs an sich, hat auch die gewählte Analyse-methode einen großen Einfluss auf das erzielte Ergebnis. Hinsichtlich der Partizipationam Analyseprozess kann unterschieden werden zwischen: (1) Selbstermittlung (2) Frem-dermittlung (3) Partizipative Ermittlung (externe und interne Experten) (4) Kollektive Er-mittlung (interne Experten). Eine weitere Kategorisierung sieht eine Unterscheidung hin-sichtlich des Unternehmens (induktive oder deduktive Methode) und der Quelle (Primär-oder Sekundäranalyse) vor. Während induktive Methoden den Informationsbedarf aus denwirklichen Verhältnissen des Unternehmens ableiten, erfolgt dies bei deduktiven Metho-den mit Hilfe der Aufgaben und Ziele des Unternehmens. Die Einteilung nach Primär- undSekundäranalyse unterscheidet hingegen, ob die Quelle für die Bedarfserhebung der Nut-zer der Information ist (Primäranalyse) oder stattdessen mittels Dokumenten oder Model-len der Bedarf hergeleitet wurde (Sekundäranalyse). Damit der Bedarf bestmöglich ermit-telt werden kann, ist der Einsatz von Verfahren aus unterschiedlichen Kategorien sinnvoll[TN00, S. 236]. Eine weitere Einteilung unterscheidet nach der Art des resultierenden In-formationsbedarfs. So werden bei subjektiven Verfahren die betreffende Person oder ihrUmfeld befragt, während bei den objektiven Methoden der Bedarf aus Aufgaben oderZielsetzungen hervorgeht. Gemischte Verfahren wiederum zeichnen sich durch theoreti-sche Vorgaben aus, die subjektiv interpretiert werden, um den Bedarf zu ermitteln [Sc90,S. 237].
Mit dem im Kontext dieser Arbeit angestrebten Übertragbarkeit und Verallgemeinerbar-keit der Analyseergebnisse stellt sich die Frage einer vereinheitlichten Darstellung vonInformationsbedarfen. Einen Ansatz hierfür bieten Informationsbedarfsmuster, welche imFolgenden näher betrachtet werden.
2.1 InformationsbedarfsmusterDie Grundlage für die Entwicklung von Informationsbedarfsmustern bilden Ansätze ausdem Bereich des Enterprise Knowledge Modelling (EKM). Enterprise KnowledgeModelling befasst sich mit der Wiederverwendbarkeit von Organisationswissen durchdie Anwendung von Techniken des Enterprise Modelling zur systematischen Analyse undModellierung von Prozessen, Organisations- und Produktstrukturen, IT-Systemen und an-deren Betrachtungsobjekten [Sa12]. Ein Informationsbedarfsmuster ist eine Weiterfüh-rung des Konzepts des Musters für die Anwendung im Bereich des Informationsbedarfszur Feststellung von relevanten Informationen und der Wiederverwendung probater Lö-sungen in Bezug auf diese Informationen [Sa12].
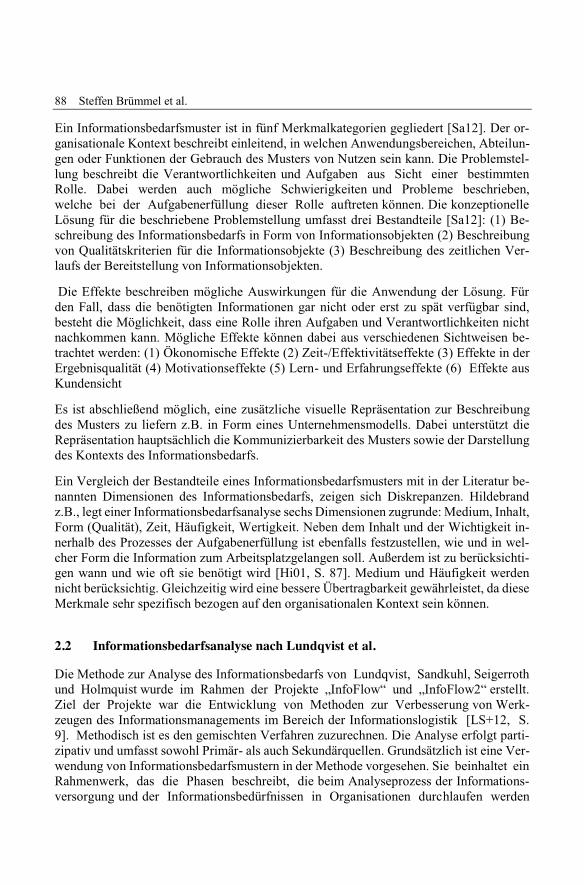
88 Steffen Brümmel et al.
Ein Informationsbedarfsmuster ist in fünf Merkmalkategorien gegliedert [Sa12]. Der or-ganisationale Kontext beschreibt einleitend, in welchen Anwendungsbereichen, Abteilun-gen oder Funktionen der Gebrauch des Musters von Nutzen sein kann. Die Problemstel-lung beschreibt die Verantwortlichkeiten und Aufgaben aus Sicht einer bestimmtenRolle. Dabei werden auch mögliche Schwierigkeiten und Probleme beschrieben,welche bei der Aufgabenerfüllung dieser Rolle auftreten können. Die konzeptionelleLösung für die beschriebene Problemstellung umfasst drei Bestandteile [Sa12]: (1) Be-schreibung des Informationsbedarfs in Form von Informationsobjekten (2) Beschreibungvon Qualitätskriterien für die Informationsobjekte (3) Beschreibung des zeitlichen Ver-laufs der Bereitstellung von Informationsobjekten.
Die Effekte beschreiben mögliche Auswirkungen für die Anwendung der Lösung. Fürden Fall, dass die benötigten Informationen gar nicht oder erst zu spät verfügbar sind,besteht die Möglichkeit, dass eine Rolle ihren Aufgaben und Verantwortlichkeiten nichtnachkommen kann. Mögliche Effekte können dabei aus verschiedenen Sichtweisen be-trachtet werden: (1) Ökonomische Effekte (2) Zeit-/Effektivitätseffekte (3) Effekte in derErgebnisqualität (4) Motivationseffekte (5) Lern- und Erfahrungseffekte (6) Effekte ausKundensicht
Es ist abschließend möglich, eine zusätzliche visuelle Repräsentation zur Beschreibungdes Musters zu liefern z.B. in Form eines Unternehmensmodells. Dabei unterstützt dieRepräsentation hauptsächlich die Kommunizierbarkeit des Musters sowie der Darstellungdes Kontexts des Informationsbedarfs.
Ein Vergleich der Bestandteile eines Informationsbedarfsmusters mit in der Literatur be-nannten Dimensionen des Informationsbedarfs, zeigen sich Diskrepanzen. Hildebrandz.B., legt einer Informationsbedarfsanalyse sechs Dimensionen zugrunde: Medium, Inhalt,Form (Qualität), Zeit, Häufigkeit, Wertigkeit. Neben dem Inhalt und der Wichtigkeit in-nerhalb des Prozesses der Aufgabenerfüllung ist ebenfalls festzustellen, wie und in wel-cher Form die Information zum Arbeitsplatzgelangen soll. Außerdem ist zu berücksichti-gen wann und wie oft sie benötigt wird [Hi01, S. 87]. Medium und Häufigkeit werdennicht berücksichtig. Gleichzeitig wird eine bessere Übertragbarkeit gewährleistet, da dieseMerkmale sehr spezifisch bezogen auf den organisationalen Kontext sein können.
2.2 Informationsbedarfsanalyse nach Lundqvist et al.
Die Methode zur Analyse des Informationsbedarfs von Lundqvist, Sandkuhl, Seigerrothund Holmquist wurde im Rahmen der Projekte „InfoFlow“ und „InfoFlow2“ erstellt.Ziel der Projekte war die Entwicklung von Methoden zur Verbesserung von Werk-zeugen des Informationsmanagements im Bereich der Informationslogistik [LS+12, S.9]. Methodisch ist es den gemischten Verfahren zuzurechnen. Die Analyse erfolgt parti-zipativ und umfasst sowohl Primär- als auch Sekundärquellen. Grundsätzlich ist eine Ver-wendung von Informationsbedarfsmustern in der Methode vorgesehen. Sie beinhaltet einRahmenwerk, das die Phasen beschreibt, die beim Analyseprozess der Informations-versorgung und der Informationsbedürfnissen in Organisationen durchlaufen werden
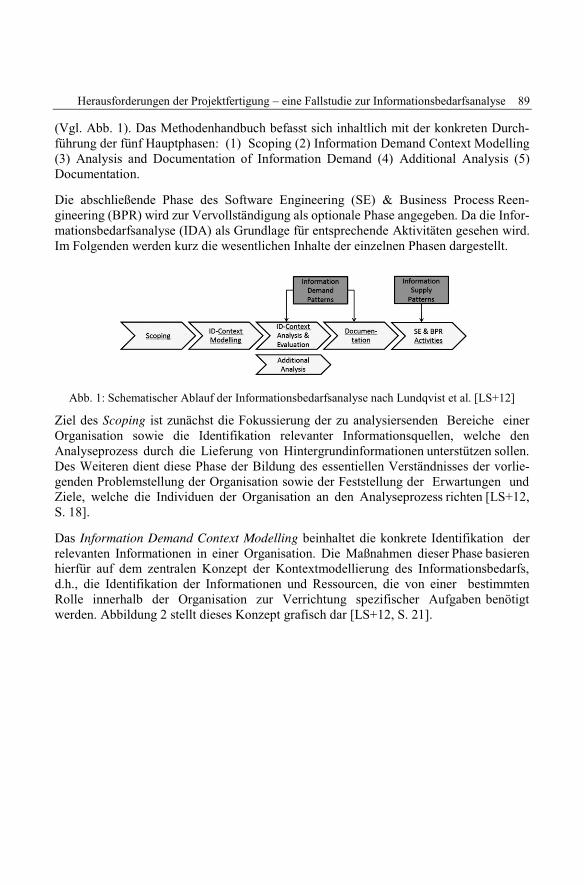
Herausforderungen der Projektfertigung – eine Fallstudie zur Informationsbedarfsanalyse 89
(Vgl. Abb. 1). Das Methodenhandbuch befasst sich inhaltlich mit der konkreten Durch-führung der fünf Hauptphasen: (1) Scoping (2) Information Demand Context Modelling(3) Analysis and Documentation of Information Demand (4) Additional Analysis (5)Documentation.
Die abschließende Phase des Software Engineering (SE) & Business Process Reen-gineering (BPR) wird zur Vervollständigung als optionale Phase angegeben. Da die Infor-mationsbedarfsanalyse (IDA) als Grundlage für entsprechende Aktivitäten gesehen wird.Im Folgenden werden kurz die wesentlichen Inhalte der einzelnen Phasen dargestellt.
Abb. 1: Schematischer Ablauf der Informationsbedarfsanalyse nach Lundqvist et al. [LS+12]
Ziel des Scoping ist zunächst die Fokussierung der zu analysiersenden Bereiche einerOrganisation sowie die Identifikation relevanter Informationsquellen, welche denAnalyseprozess durch die Lieferung von Hintergrundinformationen unterstützen sollen.Des Weiteren dient diese Phase der Bildung des essentiellen Verständnisses der vorlie-genden Problemstellung der Organisation sowie der Feststellung der Erwartungen undZiele, welche die Individuen der Organisation an den Analyseprozess richten [LS+12,S. 18].
Das Information Demand Context Modelling beinhaltet die konkrete Identifikation derrelevanten Informationen in einer Organisation. Die Maßnahmen dieser Phase basierenhierfür auf dem zentralen Konzept der Kontextmodellierung des Informationsbedarfs,d.h., die Identifikation der Informationen und Ressourcen, die von einer bestimmtenRolle innerhalb der Organisation zur Verrichtung spezifischer Aufgaben benötigtwerden. Abbildung 2 stellt dieses Konzept grafisch dar [LS+12, S. 21].
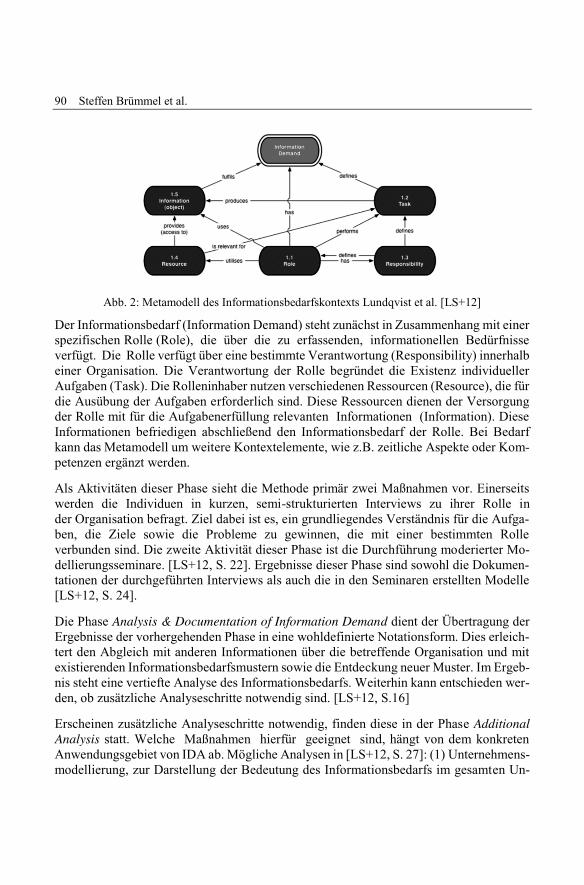
90 Steffen Brümmel et al.
Abb. 2: Metamodell des Informationsbedarfskontexts Lundqvist et al. [LS+12]
Der Informationsbedarf (Information Demand) steht zunächst in Zusammenhang mit einerspezifischen Rolle (Role), die über die zu erfassenden, informationellen Bedürfnisseverfügt. Die Rolle verfügt über eine bestimmte Verantwortung (Responsibility) innerhalbeiner Organisation. Die Verantwortung der Rolle begründet die Existenz individuellerAufgaben (Task). Die Rolleninhaber nutzen verschiedenen Ressourcen (Resource), die fürdie Ausübung der Aufgaben erforderlich sind. Diese Ressourcen dienen der Versorgungder Rolle mit für die Aufgabenerfüllung relevanten Informationen (Information). DieseInformationen befriedigen abschließend den Informationsbedarf der Rolle. Bei Bedarfkann das Metamodell um weitere Kontextelemente, wie z.B. zeitliche Aspekte oder Kom-petenzen ergänzt werden.
Als Aktivitäten dieser Phase sieht die Methode primär zwei Maßnahmen vor. Einerseitswerden die Individuen in kurzen, semi-strukturierten Interviews zu ihrer Rolle inder Organisation befragt. Ziel dabei ist es, ein grundliegendes Verständnis für die Aufga-ben, die Ziele sowie die Probleme zu gewinnen, die mit einer bestimmten Rolleverbunden sind. Die zweite Aktivität dieser Phase ist die Durchführung moderierter Mo-dellierungsseminare. [LS+12, S. 22]. Ergebnisse dieser Phase sind sowohl die Dokumen-tationen der durchgeführten Interviews als auch die in den Seminaren erstellten Modelle[LS+12, S. 24].
Die Phase Analysis & Documentation of Information Demand dient der Übertragung derErgebnisse der vorhergehenden Phase in eine wohldefinierte Notationsform. Dies erleich-tert den Abgleich mit anderen Informationen über die betreffende Organisation und mitexistierenden Informationsbedarfsmustern sowie die Entdeckung neuer Muster. Im Ergeb-nis steht eine vertiefte Analyse des Informationsbedarfs. Weiterhin kann entschieden wer-den, ob zusätzliche Analyseschritte notwendig sind. [LS+12, S.16]
Erscheinen zusätzliche Analyseschritte notwendig, finden diese in der Phase AdditionalAnalysis statt. Welche Maßnahmen hierfür geeignet sind, hängt von dem konkretenAnwendungsgebiet von IDA ab. Mögliche Analysen in [LS+12, S. 27]: (1) Unternehmens-modellierung, zur Darstellung der Bedeutung des Informationsbedarfs im gesamten Un-
Herausforderungen der Projektfertigung – eine Fallstudie zur Informationsbedarfsanalyse 91
ternehmenskontext (2) Analyse sozialer Netzwerke, zur Darstellung informeller Infor-mationsflüsse (3) Kompetenzmodellierung, zur Berücksichtigung individueller Kompe-tenzen bei der Informationsversorgung.
In der abschließenden Phase Documentation ist eine vereinheitlichte Dokumentation derAnalyseergebnisse möglich. Diese ist dann Grundlage für Folgemaßnahmen [LS+12, S.16].
3 Fallstudie zur InformationsbedarfsanalyseVor dem Hintergrund der informationstechnischen Unterstützung der Planungsprozessein der Projektfertigung wurde eine Informationsbedarfsanalyse für die Durchlaufplanungeines metallverarbeitenden Unternehmens durchgeführt. Aufbauend auf dieser Analyse istdann ein erster Entwurf eines Informationsbedarfsmusters für die Durchlaufplanung ent-standen. Aus Platzgründen werden nur Auszüge der Analyseergebnisse gargestellt.
3.1 Informationsbedarfsentwicklung
Im Rahmen des Scopings wurden zunächst relevante Rollen identifiziert. Dies waren dieBereichsleiter von insgesamt 5 Geschäftsbereichen. Die Methode sieht für das InformationContext Modelling verschiedene Bausteine vor. Es sind sowohl Einzelbefragungen alsauch moderierte Modellierungssitzungen vorgesehen. Es wurde entschieden, dass dieInformationserhebung lediglich durch Befragungen vorgenommen werden sollen. DieseEntscheidung beruht auf der Sichtweise, dass die Informationserhebung für die unter-schiedlichen Rollen des Unternehmens getrennt vorgenommen werden sollte. Es wurdedavon ausgegangen, dass jeder Produktionsbereich seinen eigenen, spezifischen In-formationsbedarf besitzt. Auf Grund der Tatsache, dass die personelle Struktur der Pla-nungsaufgaben innerhalb der Produktionsbereiche sehr flach ist und die Leitung der Pro-duktionsbereiche nur durch eine Person pro Produktionsbereich erfolgt, erschien dieDurchführung von Modellierungssitzungen für jeden Produktionsbereich als impraktika-bel.
Als Grundlage der Befragungen wurde ein Fragebogen entwickelt, der geeigneterschien, alle relevanten Informationen für die Gestaltung der Planungsprozesse zu ermit-teln. Die Gestaltung des Fragebogens richtet sich dabei inhaltlich nach den Empfehlungender IDA-Methode, vgl. [LS+12, S. 23]. Die Fragen des Fragebogens weichen allerdingsleicht von den dortigen Empfehlungen ab. Es erschien sinnvoll, die Frage nach Tätigkeits-dauer des Befragten in seinem Bereich zu einzubinden. Darüber sollten Rückschlüsse überdie Betrachtungstiefe und die Fachkompetenz des Befragten ermöglicht und gegebenen-falls berücksichtigt werden. Ebenso wurde die Frage nach den derzeitigen Problemender Informationssituation in mehrere Fragen aufgeteilt. Dadurch sollte erreicht wer-den, dass sowohl die Schwächen der aktuellen Situation als auch die aktuellen Prob-leme erfasst werden. Probleme in der Aufgabenerfüllung müssen ihre Ursache nicht in der
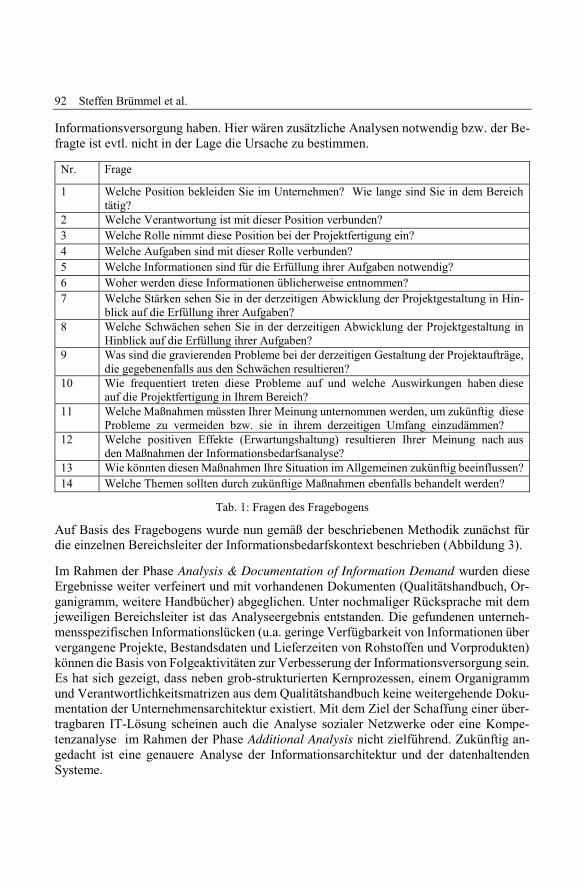
92 Steffen Brümmel et al.
Informationsversorgung haben. Hier wären zusätzliche Analysen notwendig bzw. der Be-fragte ist evtl. nicht in der Lage die Ursache zu bestimmen.
Nr. Frage
1 Welche Position bekleiden Sie im Unternehmen? Wie lange sind Sie in dem Bereichtätig?
2 Welche Verantwortung ist mit dieser Position verbunden?3 Welche Rolle nimmt diese Position bei der Projektfertigung ein?4 Welche Aufgaben sind mit dieser Rolle verbunden?5 Welche Informationen sind für die Erfüllung ihrer Aufgaben notwendig?6 Woher werden diese Informationen üblicherweise entnommen?7 Welche Stärken sehen Sie in der derzeitigen Abwicklung der Projektgestaltung in Hin-
blick auf die Erfüllung ihrer Aufgaben?8 Welche Schwächen sehen Sie in der derzeitigen Abwicklung der Projektgestaltung in
Hinblick auf die Erfüllung ihrer Aufgaben?9 Was sind die gravierenden Probleme bei der derzeitigen Gestaltung der Projektaufträge,
die gegebenenfalls aus den Schwächen resultieren?10 Wie frequentiert treten diese Probleme auf und welche Auswirkungen haben diese
auf die Projektfertigung in Ihrem Bereich?11 Welche Maßnahmen müssten Ihrer Meinung unternommen werden, um zukünftig diese
Probleme zu vermeiden bzw. sie in ihrem derzeitigen Umfang einzudämmen?12 Welche positiven Effekte (Erwartungshaltung) resultieren Ihrer Meinung nach aus
den Maßnahmen der Informationsbedarfsanalyse?13 Wie könnten diesen Maßnahmen Ihre Situation im Allgemeinen zukünftig beeinflussen?14 Welche Themen sollten durch zukünftige Maßnahmen ebenfalls behandelt werden?
Tab. 1: Fragen des Fragebogens
Auf Basis des Fragebogens wurde nun gemäß der beschriebenen Methodik zunächst fürdie einzelnen Bereichsleiter der Informationsbedarfskontext beschrieben (Abbildung 3).
Im Rahmen der Phase Analysis & Documentation of Information Demand wurden dieseErgebnisse weiter verfeinert und mit vorhandenen Dokumenten (Qualitätshandbuch, Or-ganigramm, weitere Handbücher) abgeglichen. Unter nochmaliger Rücksprache mit demjeweiligen Bereichsleiter ist das Analyseergebnis entstanden. Die gefundenen unterneh-mensspezifischen Informationslücken (u.a. geringe Verfügbarkeit von Informationen übervergangene Projekte, Bestandsdaten und Lieferzeiten von Rohstoffen und Vorprodukten)können die Basis von Folgeaktivitäten zur Verbesserung der Informationsversorgung sein.Es hat sich gezeigt, dass neben grob-strukturierten Kernprozessen, einem Organigrammund Verantwortlichkeitsmatrizen aus dem Qualitätshandbuch keine weitergehende Doku-mentation der Unternehmensarchitektur existiert. Mit dem Ziel der Schaffung einer über-tragbaren IT-Lösung scheinen auch die Analyse sozialer Netzwerke oder eine Kompe-tenzanalyse im Rahmen der Phase Additional Analysis nicht zielführend. Zukünftig an-gedacht ist eine genauere Analyse der Informationsarchitektur und der datenhaltendenSysteme.
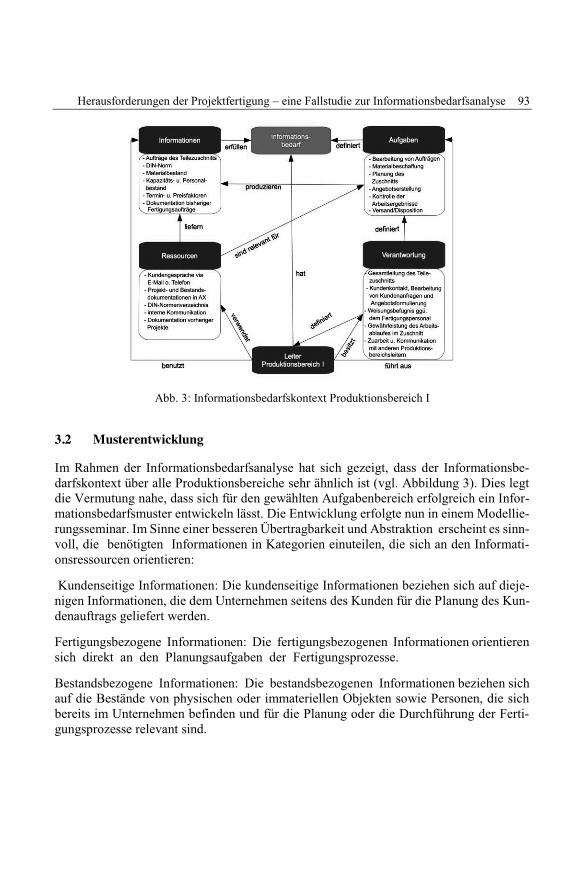
Herausforderungen der Projektfertigung – eine Fallstudie zur Informationsbedarfsanalyse 93
Abb. 3: Informationsbedarfskontext Produktionsbereich I
3.2 Musterentwicklung
Im Rahmen der Informationsbedarfsanalyse hat sich gezeigt, dass der Informationsbe-darfskontext über alle Produktionsbereiche sehr ähnlich ist (vgl. Abbildung 3). Dies legtdie Vermutung nahe, dass sich für den gewählten Aufgabenbereich erfolgreich ein Infor-mationsbedarfsmuster entwickeln lässt. Die Entwicklung erfolgte nun in einem Modellie-rungsseminar. Im Sinne einer besseren Übertragbarkeit und Abstraktion erscheint es sinn-voll, die benötigten Informationen in Kategorien einuteilen, die sich an den Informati-onsressourcen orientieren:
Kundenseitige Informationen: Die kundenseitige Informationen beziehen sich auf dieje-nigen Informationen, die dem Unternehmen seitens des Kunden für die Planung des Kun-denauftrags geliefert werden.
Fertigungsbezogene Informationen: Die fertigungsbezogenen Informationen orientierensich direkt an den Planungsaufgaben der Fertigungsprozesse.
Bestandsbezogene Informationen: Die bestandsbezogenen Informationen beziehen sichauf die Bestände von physischen oder immateriellen Objekten sowie Personen, die sichbereits im Unternehmen befinden und für die Planung oder die Durchführung der Ferti-gungsprozesse relevant sind.
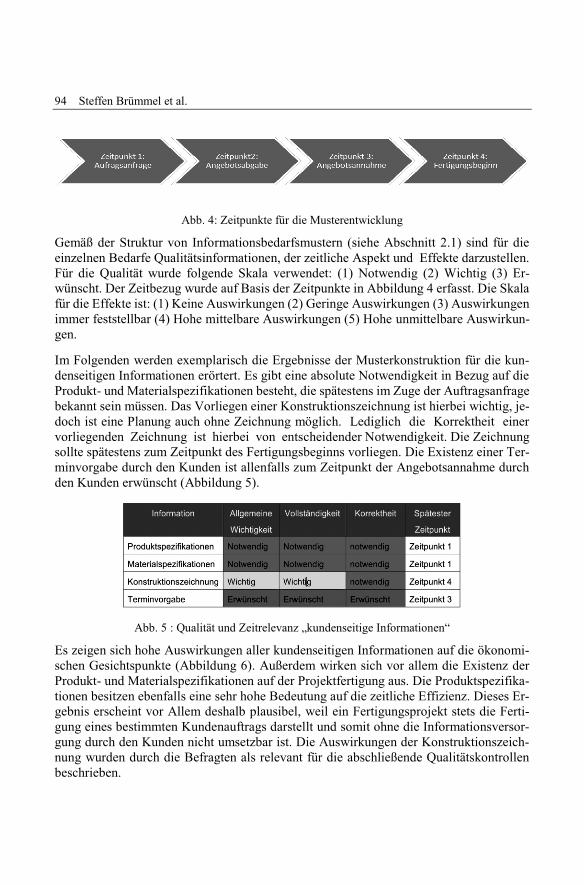
94 Steffen Brümmel et al.
Abb. 4: Zeitpunkte für die Musterentwicklung
Gemäß der Struktur von Informationsbedarfsmustern (siehe Abschnitt 2.1) sind für dieeinzelnen Bedarfe Qualitätsinformationen, der zeitliche Aspekt und Effekte darzustellen.Für die Qualität wurde folgende Skala verwendet: (1) Notwendig (2) Wichtig (3) Er-wünscht. Der Zeitbezug wurde auf Basis der Zeitpunkte in Abbildung 4 erfasst. Die Skalafür die Effekte ist: (1) Keine Auswirkungen (2) Geringe Auswirkungen (3) Auswirkungenimmer feststellbar (4) Hohe mittelbare Auswirkungen (5) Hohe unmittelbare Auswirkun-gen.
Im Folgenden werden exemplarisch die Ergebnisse der Musterkonstruktion für die kun-denseitigen Informationen erörtert. Es gibt eine absolute Notwendigkeit in Bezug auf dieProdukt- und Materialspezifikationen besteht, die spätestens im Zuge der Auftragsanfragebekannt sein müssen. Das Vorliegen einer Konstruktionszeichnung ist hierbei wichtig, je-doch ist eine Planung auch ohne Zeichnung möglich. Lediglich die Korrektheit einervorliegenden Zeichnung ist hierbei von entscheidender Notwendigkeit. Die Zeichnungsollte spätestens zum Zeitpunkt des Fertigungsbeginns vorliegen. Die Existenz einer Ter-minvorgabe durch den Kunden ist allenfalls zum Zeitpunkt der Angebotsannahme durchden Kunden erwünscht (Abbildung 5).
Abb. 5 : Qualität und Zeitrelevanz „kundenseitige Informationen“
Es zeigen sich hohe Auswirkungen aller kundenseitigen Informationen auf die ökonomi-schen Gesichtspunkte (Abbildung 6). Außerdem wirken sich vor allem die Existenz derProdukt- und Materialspezifikationen auf der Projektfertigung aus. Die Produktspezifika-tionen besitzen ebenfalls eine sehr hohe Bedeutung auf die zeitliche Effizienz. Dieses Er-gebnis erscheint vor Allem deshalb plausibel, weil ein Fertigungsprojekt stets die Ferti-gung eines bestimmten Kundenauftrags darstellt und somit ohne die Informationsversor-gung durch den Kunden nicht umsetzbar ist. Die Auswirkungen der Konstruktionszeich-nung wurden durch die Befragten als relevant für die abschließende Qualitätskontrollenbeschrieben.
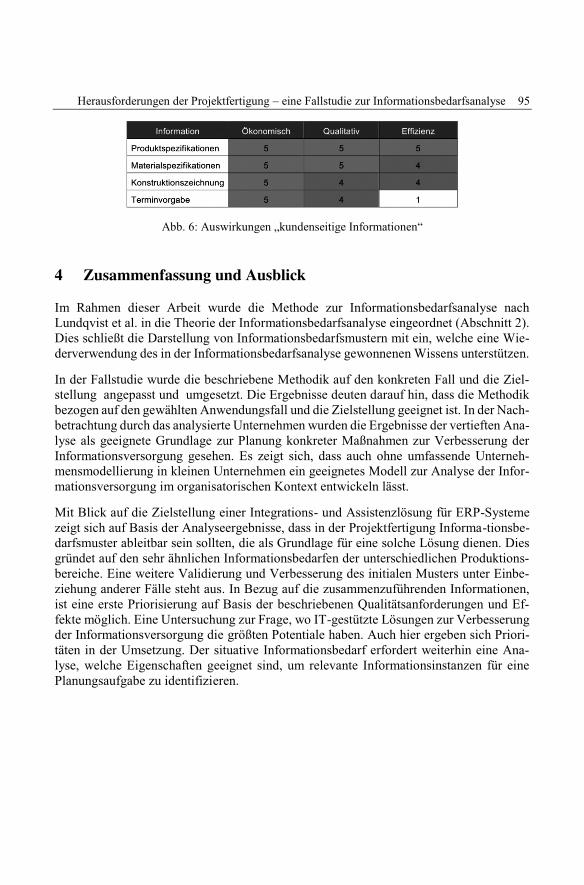
Herausforderungen der Projektfertigung – eine Fallstudie zur Informationsbedarfsanalyse 95
Abb. 6: Auswirkungen „kundenseitige Informationen“
4 Zusammenfassung und AusblickIm Rahmen dieser Arbeit wurde die Methode zur Informationsbedarfsanalyse nachLundqvist et al. in die Theorie der Informationsbedarfsanalyse eingeordnet (Abschnitt 2).Dies schließt die Darstellung von Informationsbedarfsmustern mit ein, welche eine Wie-derverwendung des in der Informationsbedarfsanalyse gewonnenen Wissens unterstützen.
In der Fallstudie wurde die beschriebene Methodik auf den konkreten Fall und die Ziel-stellung angepasst und umgesetzt. Die Ergebnisse deuten darauf hin, dass die Methodikbezogen auf den gewählten Anwendungsfall und die Zielstellung geeignet ist. In der Nach-betrachtung durch das analysierte Unternehmen wurden die Ergebnisse der vertieften Ana-lyse als geeignete Grundlage zur Planung konkreter Maßnahmen zur Verbesserung derInformationsversorgung gesehen. Es zeigt sich, dass auch ohne umfassende Unterneh-mensmodellierung in kleinen Unternehmen ein geeignetes Modell zur Analyse der Infor-mationsversorgung im organisatorischen Kontext entwickeln lässt.
Mit Blick auf die Zielstellung einer Integrations- und Assistenzlösung für ERP-Systemezeigt sich auf Basis der Analyseergebnisse, dass in der Projektfertigung Informa-tionsbe-darfsmuster ableitbar sein sollten, die als Grundlage für eine solche Lösung dienen. Diesgründet auf den sehr ähnlichen Informationsbedarfen der unterschiedlichen Produktions-bereiche. Eine weitere Validierung und Verbesserung des initialen Musters unter Einbe-ziehung anderer Fälle steht aus. In Bezug auf die zusammenzuführenden Informationen,ist eine erste Priorisierung auf Basis der beschriebenen Qualitätsanforderungen und Ef-fekte möglich. Eine Untersuchung zur Frage, wo IT-gestützte Lösungen zur Verbesserungder Informationsversorgung die größten Potentiale haben. Auch hier ergeben sich Priori-täten in der Umsetzung. Der situative Informationsbedarf erfordert weiterhin eine Ana-lyse, welche Eigenschaften geeignet sind, um relevante Informationsinstanzen für einePlanungsaufgabe zu identifizieren.

96 Steffen Brümmel et al.
Literaturverzeichnis[AB00] [Be95] Beiersdorf, Holger. Informationsbedarf und Informationsbedarfsermittlung im
Problemlösungsprozess ’Strategische Unternehmungsplanung’. Hampp, Munchen [u.a.],1995.
[Eh07] Ehrmann, Harald. Unternehmensplanung. 5. überarbeitete und aktualisierte Auflage,Kiehl, Ludwigshafen (Rhein), 2007.
[Hi01] Hildebrand, Knut. Informationsmanagement: Wettbewerbsorientierte Informationsverar-beitung mit Standard-Software und Internet. 2. erweiterte Auflage, Oldenbourg Verlag,München, 2001.
[Ko76] Kereimann, Dieter S. Methoden der Informationsbedarfsanalyse. De Gruyter, Berlin [u.a.],1976.
[LS+12] Lundqvist, Magnus; Sandkuhl, Kurt; Seigerroth, Ulf; Holmquist, Eva. InfoFlow. IDA UserGuide. Handbook for Information Demand Analysis, Version 2.0. Universität Jönköping,2012.
[MS12] Margal, Simha; Word, Jeffrey. Integrated Business Processes with ERP-Systems. JohnWiley & SonsInc., 2012.
[Sa12] Sandkuhl, Kurt. „Information Demand Pattern.“ Patterns 2011: The Third InternationalConferences on Pervasive Patterns and Applications (IARIA ), 2011.
[Sc90] Schneider, Ursula. Kulturbewußtes Informationsmanagement. Ein organisationstheoreti-scher Gestaltungsrahmen für die Infrastruktur betrieblicher Informationsprozesse. Olden-bourg Verlag, München [u.a.], 1990.
[TN00] Tropp, Gerhard; Nusselein, Mark. Methodik einer Informationsbedarfsanalyse als Grund-lage der Konzeption von Entscheidungsunterstützungssystemen am Beispiel des ProjektsCEUS. In: Beiträge zur Hochschulforschung, München, 2000, S. 233-243.
Alfred Zimmermann, Alexander Rossmann (Hrsg.): Digital Enterprise Computing 2015,Lecture Notes in Informatics (LNI), Gesellschaft für Informatik, Bonn 2015 97
Feasibility of Bluetooth iBeacons for Indoor Localization
Marcel Estel1 and Laura Fischer2
Abstract: Location-based Services in buildings represent a great advantage for people to searchplaces, products or people. In our paper we examine the feasibility of Bluetooth iBeacons for indoorlocalization. In the first part we define and evaluate the iBeacon technology through different ex-periments. In the second part our solution application is described. Our system is able to estimatethe position of the user’s smartphone based on RSSI measurements. Therefore we used the built-insmartphone sensor and a building map with required sender information. Trilateration is used aspositioning technique in contrast to fingerprinting to minimize beforehand effort. Results are prom-ising but cannot reach the same accuracy level as sensor-fusion or fingerprinting approaches.
Keywords: Location Based Services (LBS), Indoor Localization, Bluetooth iBeacon, Trilateration,RSSI (Received Signal Strength Indicator)
1 IntroductionThe field of Location-based Services (LBS) is a rapidly growing market. Nowadays thereare already a lot of mobile applications where Location-based services are integrated. Themain impulses for this growth in the LBS sector are the fast growth in the smartphonemarket as well as in the telecommunication area (EDGE, UMTS and LTE). There are alot of definitions for LBS, but in general it means that the current position of the user isused to provide context-related data. The classic and most known example for a Location-based Service application is a navigation system. The application uses the current userposition in order to make position related information available like POIs, traffic jams,and more. A common example is the search for a Point of Interest (POI) like a restaurant.The navigation system then makes use of the user position, searches for restaurant in theimmediate vicinity and then routes the user to the selected restaurant. But there are also alot of other use cases like advertising, sport activity tracking, car sharing, etc.
Up to now most of those Location-based Services are designed for the usage in the outdoorarea. Consequently, as Outdoor Location-based Services are a great success, the next log-ical step would be to realize Indoor Location-based Services (ILBS) as well, to providethose additional, position related information also in a building. However, the realizationof Indoor Location-based Services is facing completely new challenges.
1 Hochschule Reutlingen, Herman Hollerith Zentrum, Danziger Straße 6, 71034 Böblingen , [email protected]
2 Hochschule Reutlingen, Herman Hollerith Zentrum, Danziger Straße 6, 71034 Böblingen, [email protected]
98 Marcel Estel and Laura Fischer
ILBS provide new opportunities to increase the user experience within buildings and bearsthe potential for new business areas [LLG13]. Possible areas of application are for instanceairports, stations, shopping centers, museums, office buildings and a lot more. Use Casesin these areas could be indoor navigation, search for POIs, get vouchers and offers in theshopping center, guiding tour through the museum, etc. Despite the facing challenges,Indoor Location-based Services becomes more important. There are several indicatorswhich confirm that companies like Google and Apple are researching in this area. GoogleMaps started at the end of 2011 to offer the opportunity to integrate building maps into themap data in order to enable indoor navigation. Furthermore Apple developed an own tech-nology based on Bluetooth Low Energy, called iBeacon
As already mentioned before, ILBS leads to some challenges. Basically, the greatest chal-lenge is to obtain a correct and accurate localization of mobile devices within buildings.The inaccuracy can be attributed to the presently used localization techniques. At the out-door area the localization mostly occurs based on GPS- / GSM techniques. The localiza-tion highly depends on the reception of the GPS signals. The reception of the signals isstrongly affected in buildings. Due to that indoor localization is really imprecise. IndoorLocation-based Services require a good accuracy in a range of a meter or even centimeters.For instance in an office building there are several rooms close together and an accuracyof 5 meters is not sufficient to navigate to a specific room. For that reason other technol-ogies like Infrared, Wifi and Bluetooth are used to build up an Indoor Location-basedService. We will deal in our paper with an examination whether Apple iBeacon Bluetoothtechnology is suitable for indoor localization.
1.1 Problem descriptionLocalization refers to the problem to calculate or estimate a user’s position within a spe-cific map area. Indoor Localization aims to solve this problem within a specific buildingor federation of buildings. As described earlier, GPS or other widely-available signals likecellular networks are not feasible for this task, because they require line-of-sight and arehighly affected by obstacles. Therefore the current approach is to use a specific infrastruc-ture of senders within a building. The task of indoor localization is to calculate the positionof the receiver based on received signals from known senders within the map area. Thereare various research questions which should be considered in our study. These researchquestions are the following:
" Are Bluetooth iBeacons a good choice for using in indoor positioning systems?
" How accurate and precise is a Bluetooth iBeacon based indoor positioning?
" For which use cases does an indoor positioning application based on Bluetoothmakes sense?
" What are advantages and disadvantages of Bluetooth?
Feasibility of Bluetooth iBeacons for Indoor Localization 99
2 Related WorkMost approaches in literature and commercial systems use radio-frequency reference sig-nals (WiFi and Bluetooth) in combination with other sensors (inertial, barometer, com-pass, vision, etc). The best combination of these sensors depends on the available sensorsof the devices and already installed infrastructure at the building. In our paper we restrictto only one information source, the Bluetooth signal, nevertheless we present some otherapproaches.
Sensor-Fusion approaches reported by Zampella et. al [ZJS13] use foot mounted inertialmeasurements in combination with any available radio frequency measurement. The po-sition is calculated using a particle filter, which is updated when a step from the inertialmeasurement system is detected. The result is 2 meter accuracy in 90 % of the estimates.Other sensor-fusion approaches are described in [He14] and [KS13]. Real world installa-tions in use are implemented for example from the company Infsoft. Infsoft is a germancompany providing indoor localization to Frankfurt Airport. They also use any kind ofsensor as well as GSM and WiFi signals to estimate the user position, reporting up to 1meter precision [In15].
Another approach is to avoid the use of signals to increase scalability, avoiding installationcosts and maintenance. Woodman and Harle [WH08] use also a foot mounted inertial unitand a detailed building map model to provide absolute positioning. They could also handlestairs and multiple floors within their system. WiFi signals are used to initialize the userposition.
RF signal only approaches typically use Bluetooth, WiFi or ZigBee. Adalja and Khilarireport up to 2 meter accuracy using fingerprinting and Bluetooth [AK13]. Saxena et alachieve 1.1 meter accuracy with 90 % probability using WiFi and fingerprinting [SGJ08].On the other side trilateration positioning technique and Bluetooth could only reach < 5 mprecision with 85 % probability as reported by Dahlgreen and Mahmood [DM14].
3 MethodologyOur basic approach is to use the Apple API and use the Received Signal Strength Indicator(RSSI) of our Bluetooth senders to locate the user’s position. Our goal is then to reach <2 m precision, which is a sufficient value to build an Indoor Localization App that we willdescribe in Section 7.
Therefore we will model a map with senders S and their position P(x,y,z) in cartesiancoordinate system. The RSSI is then used to calculate the distance to the sender and locatethe user by trilateration algorithm. Our Experiments are done with kontakt.io BluetoothBeacons and an iPhone 5 running iOS 8. Finally, we tested the feasibility of indoor local-ization by the help of our developed App within the university building.
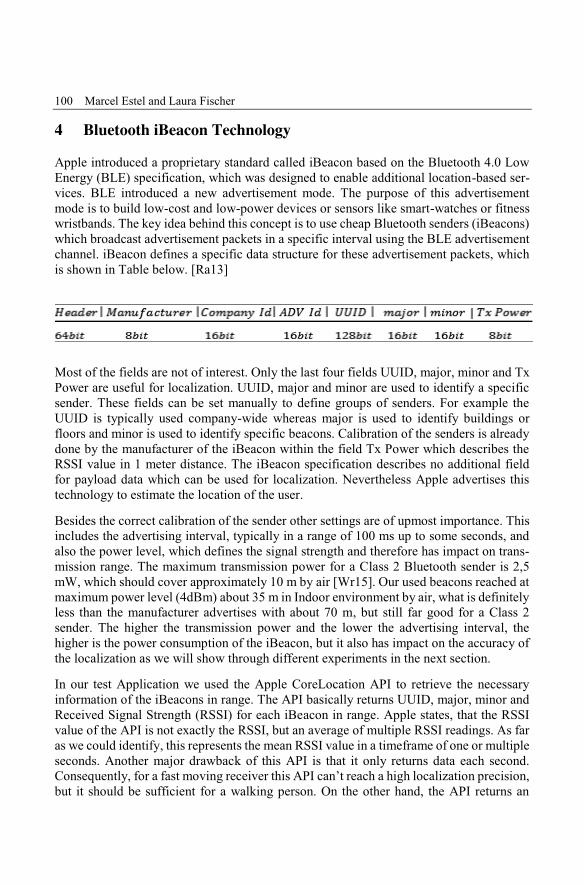
100 Marcel Estel and Laura Fischer
4 Bluetooth iBeacon TechnologyApple introduced a proprietary standard called iBeacon based on the Bluetooth 4.0 LowEnergy (BLE) specification, which was designed to enable additional location-based ser-vices. BLE introduced a new advertisement mode. The purpose of this advertisementmode is to build low-cost and low-power devices or sensors like smart-watches or fitnesswristbands. The key idea behind this concept is to use cheap Bluetooth senders (iBeacons)which broadcast advertisement packets in a specific interval using the BLE advertisementchannel. iBeacon defines a specific data structure for these advertisement packets, whichis shown in Table below. [Ra13]
Most of the fields are not of interest. Only the last four fields UUID, major, minor and TxPower are useful for localization. UUID, major and minor are used to identify a specificsender. These fields can be set manually to define groups of senders. For example theUUID is typically used company-wide whereas major is used to identify buildings orfloors and minor is used to identify specific beacons. Calibration of the senders is alreadydone by the manufacturer of the iBeacon within the field Tx Power which describes theRSSI value in 1 meter distance. The iBeacon specification describes no additional fieldfor payload data which can be used for localization. Nevertheless Apple advertises thistechnology to estimate the location of the user.
Besides the correct calibration of the sender other settings are of upmost importance. Thisincludes the advertising interval, typically in a range of 100 ms up to some seconds, andalso the power level, which defines the signal strength and therefore has impact on trans-mission range. The maximum transmission power for a Class 2 Bluetooth sender is 2,5mW, which should cover approximately 10 m by air [Wr15]. Our used beacons reached atmaximum power level (4dBm) about 35 m in Indoor environment by air, what is definitelyless than the manufacturer advertises with about 70 m, but still far good for a Class 2sender. The higher the transmission power and the lower the advertising interval, thehigher is the power consumption of the iBeacon, but it also has impact on the accuracy ofthe localization as we will show through different experiments in the next section.
In our test Application we used the Apple CoreLocation API to retrieve the necessaryinformation of the iBeacons in range. The API basically returns UUID, major, minor andReceived Signal Strength (RSSI) for each iBeacon in range. Apple states, that the RSSIvalue of the API is not exactly the RSSI, but an average of multiple RSSI readings. As faras we could identify, this represents the mean RSSI value in a timeframe of one or multipleseconds. Another major drawback of this API is that it only returns data each second.Consequently, for a fast moving receiver this API can’t reach a high localization precision,but it should be sufficient for a walking person. On the other hand, the API returns an
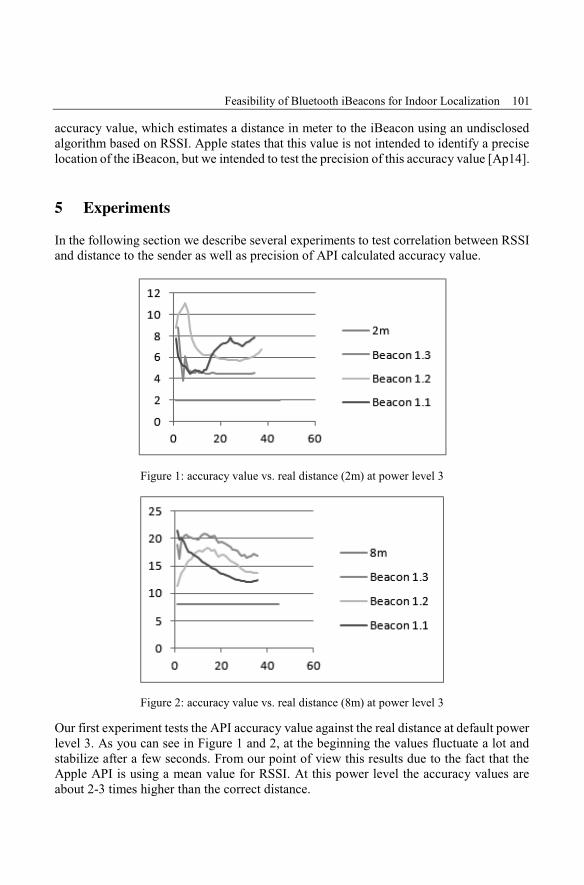
Feasibility of Bluetooth iBeacons for Indoor Localization 101
accuracy value, which estimates a distance in meter to the iBeacon using an undisclosedalgorithm based on RSSI. Apple states that this value is not intended to identify a preciselocation of the iBeacon, but we intended to test the precision of this accuracy value [Ap14].
5 ExperimentsIn the following section we describe several experiments to test correlation between RSSIand distance to the sender as well as precision of API calculated accuracy value.
Figure 1: accuracy value vs. real distance (2m) at power level 3
Figure 2: accuracy value vs. real distance (8m) at power level 3
Our first experiment tests the API accuracy value against the real distance at default powerlevel 3. As you can see in Figure 1 and 2, at the beginning the values fluctuate a lot andstabilize after a few seconds. From our point of view this results due to the fact that theApple API is using a mean value for RSSI. At this power level the accuracy values areabout 2-3 times higher than the correct distance.
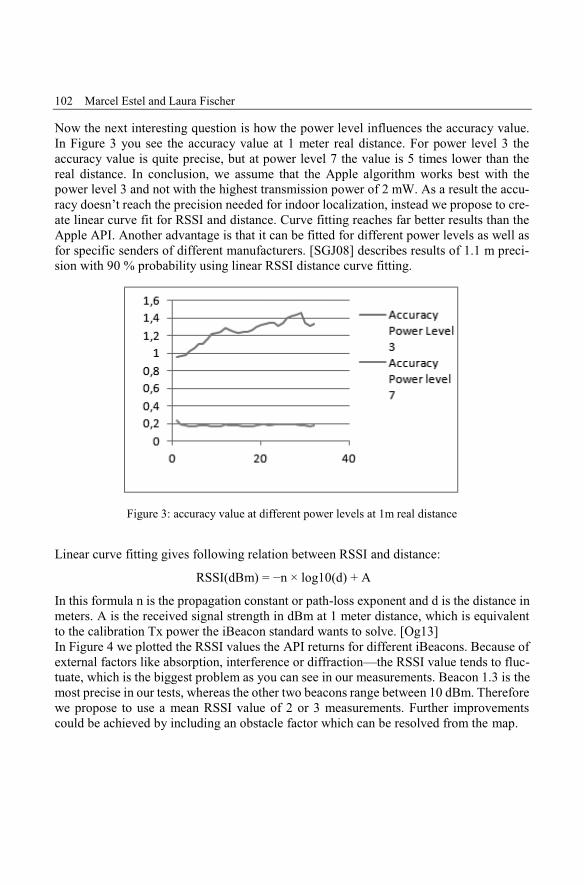
102 Marcel Estel and Laura Fischer
Now the next interesting question is how the power level influences the accuracy value.In Figure 3 you see the accuracy value at 1 meter real distance. For power level 3 theaccuracy value is quite precise, but at power level 7 the value is 5 times lower than thereal distance. In conclusion, we assume that the Apple algorithm works best with thepower level 3 and not with the highest transmission power of 2 mW. As a result the accu-racy doesn’t reach the precision needed for indoor localization, instead we propose to cre-ate linear curve fit for RSSI and distance. Curve fitting reaches far better results than theApple API. Another advantage is that it can be fitted for different power levels as well asfor specific senders of different manufacturers. [SGJ08] describes results of 1.1 m preci-sion with 90 % probability using linear RSSI distance curve fitting.
Figure 3: accuracy value at different power levels at 1m real distance
Linear curve fitting gives following relation between RSSI and distance:
RSSI(dBm) = −n × log10(d) + A
In this formula n is the propagation constant or path-loss exponent and d is the distance inmeters. A is the received signal strength in dBm at 1 meter distance, which is equivalentto the calibration Tx power the iBeacon standard wants to solve. [Og13]In Figure 4 we plotted the RSSI values the API returns for different iBeacons. Because ofexternal factors like absorption, interference or diffraction—the RSSI value tends to fluc-tuate, which is the biggest problem as you can see in our measurements. Beacon 1.3 is themost precise in our tests, whereas the other two beacons range between 10 dBm. Thereforewe propose to use a mean RSSI value of 2 or 3 measurements. Further improvementscould be achieved by including an obstacle factor which can be resolved from the map.
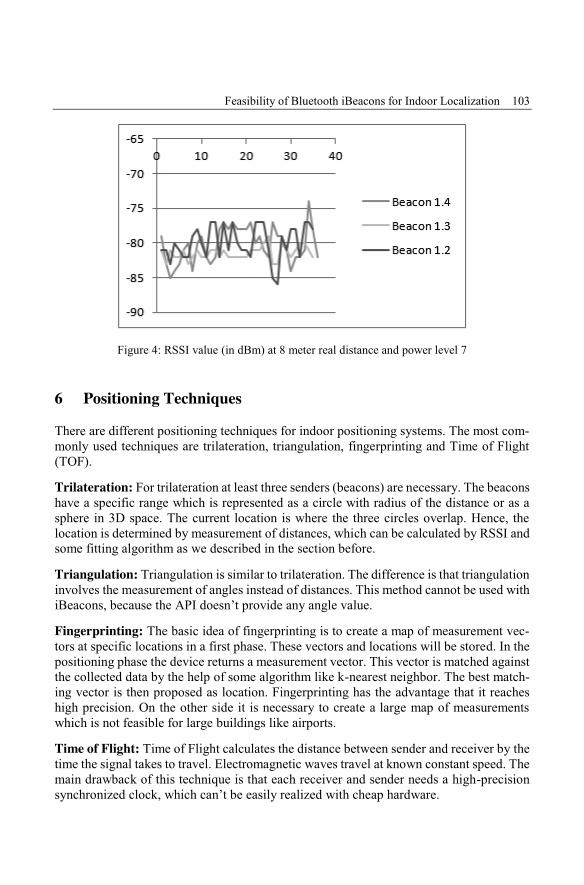
Feasibility of Bluetooth iBeacons for Indoor Localization 103
Figure 4: RSSI value (in dBm) at 8 meter real distance and power level 7
6 Positioning TechniquesThere are different positioning techniques for indoor positioning systems. The most com-monly used techniques are trilateration, triangulation, fingerprinting and Time of Flight(TOF).
Trilateration: For trilateration at least three senders (beacons) are necessary. The beaconshave a specific range which is represented as a circle with radius of the distance or as asphere in 3D space. The current location is where the three circles overlap. Hence, thelocation is determined by measurement of distances, which can be calculated by RSSI andsome fitting algorithm as we described in the section before.
Triangulation: Triangulation is similar to trilateration. The difference is that triangulationinvolves the measurement of angles instead of distances. This method cannot be used withiBeacons, because the API doesn’t provide any angle value.
Fingerprinting: The basic idea of fingerprinting is to create a map of measurement vec-tors at specific locations in a first phase. These vectors and locations will be stored. In thepositioning phase the device returns a measurement vector. This vector is matched againstthe collected data by the help of some algorithm like k-nearest neighbor. The best match-ing vector is then proposed as location. Fingerprinting has the advantage that it reacheshigh precision. On the other side it is necessary to create a large map of measurementswhich is not feasible for large buildings like airports.
Time of Flight: Time of Flight calculates the distance between sender and receiver by thetime the signal takes to travel. Electromagnetic waves travel at known constant speed. Themain drawback of this technique is that each receiver and sender needs a high-precisionsynchronized clock, which can’t be easily realized with cheap hardware.
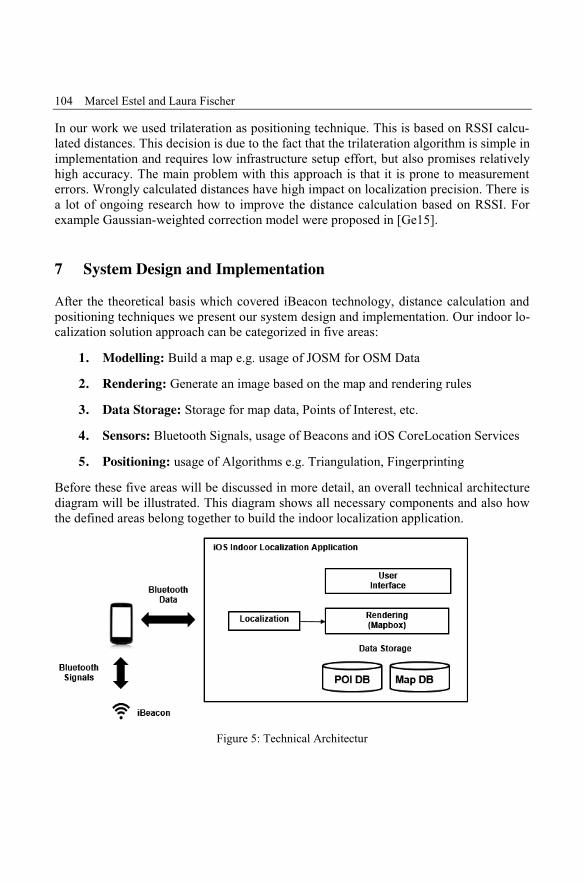
104 Marcel Estel and Laura Fischer
In our work we used trilateration as positioning technique. This is based on RSSI calcu-lated distances. This decision is due to the fact that the trilateration algorithm is simple inimplementation and requires low infrastructure setup effort, but also promises relativelyhigh accuracy. The main problem with this approach is that it is prone to measurementerrors. Wrongly calculated distances have high impact on localization precision. There isa lot of ongoing research how to improve the distance calculation based on RSSI. Forexample Gaussian-weighted correction model were proposed in [Ge15].
7 System Design and ImplementationAfter the theoretical basis which covered iBeacon technology, distance calculation andpositioning techniques we present our system design and implementation. Our indoor lo-calization solution approach can be categorized in five areas:
1. Modelling: Build a map e.g. usage of JOSM for OSM Data
2. Rendering: Generate an image based on the map and rendering rules
3. Data Storage: Storage for map data, Points of Interest, etc.
4. Sensors: Bluetooth Signals, usage of Beacons and iOS CoreLocation Services
5. Positioning: usage of Algorithms e.g. Triangulation, Fingerprinting
Before these five areas will be discussed in more detail, an overall technical architecturediagram will be illustrated. This diagram shows all necessary components and also howthe defined areas belong together to build the indoor localization application.
Figure 5: Technical Architectur
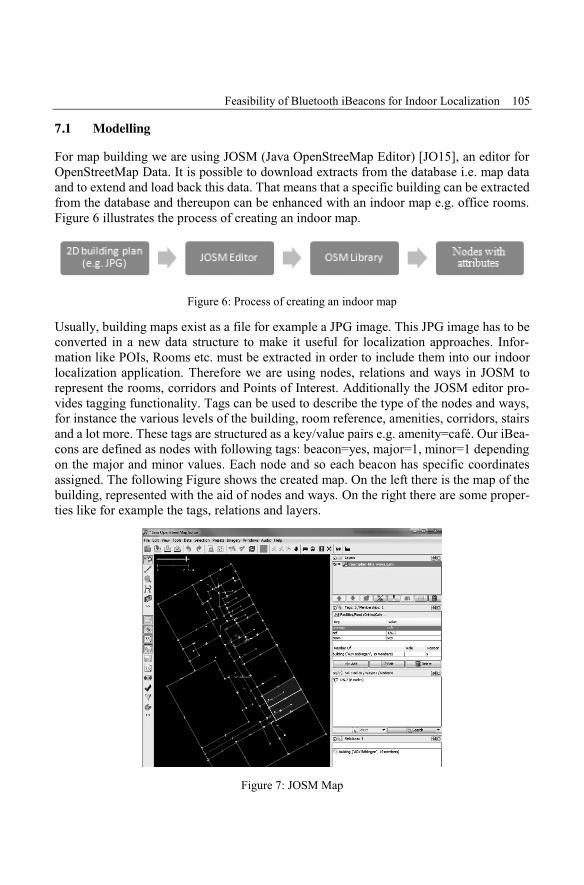
Feasibility of Bluetooth iBeacons for Indoor Localization 105
7.1 ModellingFor map building we are using JOSM (Java OpenStreeMap Editor) [JO15], an editor forOpenStreetMap Data. It is possible to download extracts from the database i.e. map dataand to extend and load back this data. That means that a specific building can be extractedfrom the database and thereupon can be enhanced with an indoor map e.g. office rooms.Figure 6 illustrates the process of creating an indoor map.
Figure 6: Process of creating an indoor map
Usually, building maps exist as a file for example a JPG image. This JPG image has to beconverted in a new data structure to make it useful for localization approaches. Infor-mation like POIs, Rooms etc. must be extracted in order to include them into our indoorlocalization application. Therefore we are using nodes, relations and ways in JOSM torepresent the rooms, corridors and Points of Interest. Additionally the JOSM editor pro-vides tagging functionality. Tags can be used to describe the type of the nodes and ways,for instance the various levels of the building, room reference, amenities, corridors, stairsand a lot more. These tags are structured as a key/value pairs e.g. amenity=café. Our iBea-cons are defined as nodes with following tags: beacon=yes, major=1, minor=1 dependingon the major and minor values. Each node and so each beacon has specific coordinatesassigned. The following Figure shows the created map. On the left there is the map of thebuilding, represented with the aid of nodes and ways. On the right there are some proper-ties like for example the tags, relations and layers.
Figure 7: JOSM Map
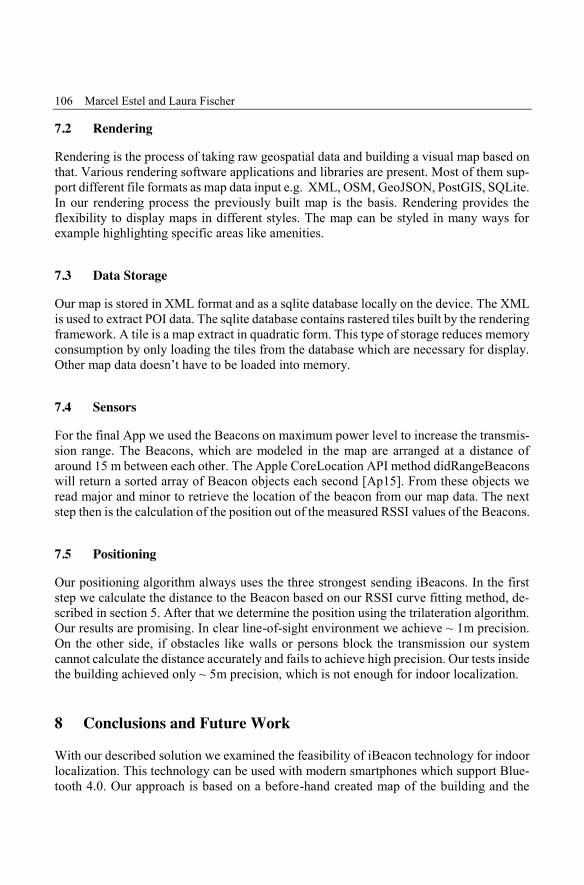
106 Marcel Estel and Laura Fischer
7.2 RenderingRendering is the process of taking raw geospatial data and building a visual map based onthat. Various rendering software applications and libraries are present. Most of them sup-port different file formats as map data input e.g. XML, OSM, GeoJSON, PostGIS, SQLite.In our rendering process the previously built map is the basis. Rendering provides theflexibility to display maps in different styles. The map can be styled in many ways forexample highlighting specific areas like amenities.
7.3 Data StorageOur map is stored in XML format and as a sqlite database locally on the device. The XMLis used to extract POI data. The sqlite database contains rastered tiles built by the renderingframework. A tile is a map extract in quadratic form. This type of storage reduces memoryconsumption by only loading the tiles from the database which are necessary for display.Other map data doesn’t have to be loaded into memory.
7.4 SensorsFor the final App we used the Beacons on maximum power level to increase the transmis-sion range. The Beacons, which are modeled in the map are arranged at a distance ofaround 15 m between each other. The Apple CoreLocation API method didRangeBeaconswill return a sorted array of Beacon objects each second [Ap15]. From these objects weread major and minor to retrieve the location of the beacon from our map data. The nextstep then is the calculation of the position out of the measured RSSI values of the Beacons.
7.5 PositioningOur positioning algorithm always uses the three strongest sending iBeacons. In the firststep we calculate the distance to the Beacon based on our RSSI curve fitting method, de-scribed in section 5. After that we determine the position using the trilateration algorithm.Our results are promising. In clear line-of-sight environment we achieve ~ 1m precision.On the other side, if obstacles like walls or persons block the transmission our systemcannot calculate the distance accurately and fails to achieve high precision. Our tests insidethe building achieved only ~ 5m precision, which is not enough for indoor localization.
8 Conclusions and Future WorkWith our described solution we examined the feasibility of iBeacon technology for indoorlocalization. This technology can be used with modern smartphones which support Blue-tooth 4.0. Our approach is based on a before-hand created map of the building and the
Feasibility of Bluetooth iBeacons for Indoor Localization 107
positions of our iBeacon senders. In the second step we calculated the distance betweendevice and sender using RSSI linear curve fitting. Finally with the help of trilaterationalgorithm our solution estimated the position of the user.
The results are promising. In clear line-of-sight we achieve ~ 1m precision, but if obstaclesblock the transmission, precision of our solution drops heavily to only ~ 5m. These resultsare not feasible for indoor localization and have to be improved through further applica-tions. Therefore we propose hybrid approaches like [He14] stated. Furthermore an obsta-cle factor for distance calculation could improve precision. Other Positioning algorithmslike Fingerprinting promise better precision, but require more fore-hand effort. A morefine-grained distribution of iBeacons would also have a major impact on the precision. Onthe other side large scale iBeacon distribution induces Infrastructure management.
The current state of our solution is applicable for large buildings like airports where highprecision (~ 1m) is not necessary. On the contrary most indoor localization use cases re-quire high precision to create added-value for users. Location-based Services in buildingsoffer a great advantage for customers to search places or products. The iBeacon technol-ogy developed by Apple Inc. enables retailers to send specific notifications tosmartphones, if the user is near to specific Beacons. There are not only use cases for loca-tion-based advertising like notification sending, but it is also possible to guide or trackcustomers within shops. Such use cases require high precision, which our current solutioncannot provide, but one can imagine the variety of possible applications.
References[AK13] Adalja, D.; Khilari, G.: Fingerprinting Based Indoor Positioning System using RSSI
Bluetooth, In International Journal for Scientific Research & Development Vol. 1, Issue4, 2013.
[Ap14] Apple: CLBeacon Class Reference, 2014, [Online] Available: https://devel-oper.apple.com/library/ios/documentation/CoreLocation/Reference/CLBea-con_class/index.html
[Ap15] Apple Inc., Region Monitoring and iBeacon, 2015, [Online] Available: https://devel-oper.apple.com/library/ios/documentation/UserExperience/Conceptual/LocationA-warenessPG/RegionMonitoring/RegionMonitoring.html
[DM14] Dahlgren, E.; Mahmood, H.: Evaluation of indoor positioning based on Bluetooth Smarttechnology, 2014, Master Thesis
[Ge15] Ge, B.; Wang, K.; Hanand, J.; Zhao, B.: Improved RSSI Positioning Algorithm for CoalMine Underground Locomotive, In Journal of Electrical and Computer Engineering,Volume 2015.
108 Marcel Estel and Laura Fischer
[He14] Aguilar Herrera, J. C.; Plöger, P. G.; Hinkenjann, A.; Maiero, J.; Flores, M.; Ramos, A.:Pedestrian Indoor Positioning Using Smartphone Multi-sensing, Radio Beacons, UserPositions Probability Map and IndoorOSM Floor Plan Representation. In 2014 Interna-tional Conference of Indoor Positioning and Indoor Navigation (IPIN), 27th – 30th Oc-tober 2014
[In15] InfSoft., Indoor Navigation, 2015 [Online] Available:http://www.infsoft.com/Products/Indoor-Navigation
[JO15] JOSM, Extensible editor, 2015, [Online] Available: https://josm.openstreetmap.de/
[KS13] Khan, M. I.; Syrjarinne, J.: Investigating effective methods for integration of building’smap with low cost inertial sensors and wifi-based positioning, October 2013
[LLG13] Liu, K.; Liu, X.; Guoguo, X. L.: enabling Fine-grained indoor localization viasmartphone. In Proceeding of the 11th annual international conference on Mobile sys-tems, applications, and services, MobiSys ’13, pages 235–248, New York, NY, USA,2013.
[Og13] Oguejiofor, O.S.; Okorogu, V.N.; Adewale, A.; Osuesu, B.O.: Outdoor LocalizationSystem Using RSSI Measurement of Wireless Sensor Network, In International Journalof Innovative Technology and Exploring Engineering (IJITEE), Volume-2, Issue-2, Jan-uary 2013
[Ra13] Radius Networks: Reverse Engineering the iBeacon Profile, 2013, [Online] Available:http://developer.radiusnetworks.com/2013/10/01/reverse-engineering-the-ibeacon-pro-file.html
[SGJ08] Saxena, M.; Gupta, P.; Jain, B. N.: Experimental Analysis of RSSI-based Location Es-timation in Wireless Sensor Networks, In Communication Systems Software and Mid-dleware and Workshops, 2008, pp. 503 - 510
[WH08] Woodman, O.; Harle, R.: Pedestrian localisation for indoor environments, In Proceed-ings of the 10th international conference on Ubiquitous computing. ACM, 2008, pp.114–123.
[Wr15] Wright, J.: Dispelling Common Bluetooth Misconceptions, 2015, [Online] Available:http://www.sans.edu/research/security-laboratory/article/bluetooth
[ZJS13] Zampella, F.; Jimenez, A. R.; Seco, F.: Robust indoor positioning fusing pdr and rftechnologies: The rfid and uwb case, October 2013.

Digital Enterprise Architecture

Alfred Zimmermann, Alexander Rossmann (Hrsg.): Digital Enterprise Computing 2015,Lecture Notes in Informatics (LNI), Gesellschaft für Informatik, Bonn 2015 111
Identitäts- und Zugangsmanagement für Kundenportale –Eine Bestandsaufnahme
Peter Weierich1, David Weich2 und Sebastian Abeck3
Abstract: Das Identitäts- und Zugangsmanagement (engl. Identity and Access Management, IAM)entwickelt sich zu einer Schlüsseltechnologie zur Umsetzung von digitalen Transformationen undder damit einhergehenden Personalisierung. An der Interaktionsschnittstelle zum Kunden ist einegute Benutzerfreundlichkeit gefragt, damit die Kundenakzeptanz gewährleistet werden kann. Diehier vorgestellte Studie evaluiert die Benutzerfreundlichkeit des IAM von 112 Unternehmenspor-talen der Branchen Banken, Versicherungen, Automobilindustrie und E-Commerce. Lösungeninnerhalb einer Branche sind sich häufig ähnlich, profitieren jedoch nicht von den Erfahrungenanderer Branchen. Jedes der betrachteten Portale hat kleinere und größere Schwachstellen hin-sichtlich der Benutzerfreundlichkeit.
Keywords: IAM, Consumer IAM, Kundenportale, Benutzerfreundlichkeit
1 EinleitungDie digitale Transformation ist für viele Unternehmen derzeit hochpriorisiert, um dieKundenbindung zu erhöhen und neue Geschäftsmodelle zu entwickeln. Kunden begrü-ßen dies und nutzen digital verbundene Produkte und Services, um ihre Bedürfnisse zuerfüllen. Es wurde vielfach festgestellt, dass das traditionelle IAM nicht geeignet ist, umden dynamischen Anforderungen von Kunden gerecht zu werden. Dieses dient meist derErfüllung von Compliance-Vorgaben und setzt den Fokus auf die Sicherheit. Bediener-freundlichkeit ist in vielen Fällen nicht relevant, da die IAM-Systeme vor allem in starkregulierten Branchen – z.B. bei Banken – vor allem als lästige „Pflichtübung“ betrachtetwerden. Im kundenorientierten IAM (Consumer IAM) dagegen ist die Benutzerfreund-lichkeit der IAM-Prozesse ein kritischer Faktor für erfolgreiche Kundenportale. Sicher-heitssysteme müssen so gestaltet sein, dass sie gleichzeitig sicher und benutzbar sind.Beispielsweise muss die Registrierung eines Interessenten so einfach und effizient sein,dass die Einstiegsbarriere so niedrig wie möglich liegt. Auch Anmeldeprozesse überPassworteingabe, soziale Medien oder andere Authentisierungswege müssen möglichsteinfach und unempfindlich gegen das Vergessen von Zugangsdaten sein. Trotzdem ver-langt der Kunde, dass sowohl Datenschutz und Sicherheit seiner Daten gewährleistet alsauch sensible Geschäftsprozesse ausreichend gegen Missbrauch abgesichert sind.
1 iC Consult GmbH, Keltenring 14, 82041 Oberhaching, [email protected] Karlsruhe Institut für Technologie (KIT), Forschungsgruppe Cooperation & Management (C&M), Zirkel 2,
76131 Karlsruhe, [email protected] Karlsruhe Institut für Technologie (KIT), Forschungsgruppe Cooperation & Management (C&M), Zirkel 2,
76131 Karlsruhe, [email protected]
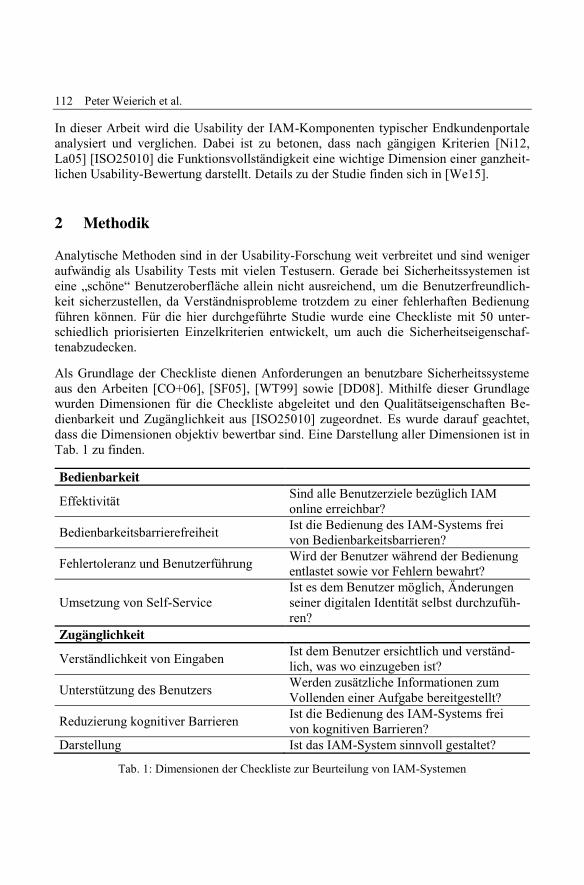
112 Peter Weierich et al.
In dieser Arbeit wird die Usability der IAM-Komponenten typischer Endkundenportaleanalysiert und verglichen. Dabei ist zu betonen, dass nach gängigen Kriterien [Ni12,La05] [ISO25010] die Funktionsvollständigkeit eine wichtige Dimension einer ganzheit-lichen Usability-Bewertung darstellt. Details zu der Studie finden sich in [We15].
2 MethodikAnalytische Methoden sind in der Usability-Forschung weit verbreitet und sind wenigeraufwändig als Usability Tests mit vielen Testusern. Gerade bei Sicherheitssystemen isteine „schöne“ Benutzeroberfläche allein nicht ausreichend, um die Benutzerfreundlich-keit sicherzustellen, da Verständnisprobleme trotzdem zu einer fehlerhaften Bedienungführen können. Für die hier durchgeführte Studie wurde eine Checkliste mit 50 unter-schiedlich priorisierten Einzelkriterien entwickelt, um auch die Sicherheitseigenschaf-tenabzudecken.
Als Grundlage der Checkliste dienen Anforderungen an benutzbare Sicherheitssystemeaus den Arbeiten [CO+06], [SF05], [WT99] sowie [DD08]. Mithilfe dieser Grundlagewurden Dimensionen für die Checkliste abgeleitet und den Qualitätseigenschaften Be-dienbarkeit und Zugänglichkeit aus [ISO25010] zugeordnet. Es wurde darauf geachtet,dass die Dimensionen objektiv bewertbar sind. Eine Darstellung aller Dimensionen ist inTab. 1 zu finden.
BedienbarkeitEffektivität Sind alle Benutzerziele bezüglich IAM
online erreichbar?
Bedienbarkeitsbarrierefreiheit Ist die Bedienung des IAM-Systems freivon Bedienbarkeitsbarrieren?
Fehlertoleranz und Benutzerführung Wird der Benutzer während der Bedienungentlastet sowie vor Fehlern bewahrt?
Umsetzung von Self-ServiceIst es dem Benutzer möglich, Änderungenseiner digitalen Identität selbst durchzufüh-ren?
ZugänglichkeitVerständlichkeit von Eingaben Ist dem Benutzer ersichtlich und verständ-
lich, was wo einzugeben ist?
Unterstützung des Benutzers Werden zusätzliche Informationen zumVollenden einer Aufgabe bereitgestellt?
Reduzierung kognitiver Barrieren Ist die Bedienung des IAM-Systems freivon kognitiven Barrieren?
Darstellung Ist das IAM-System sinnvoll gestaltet?
Tab. 1: Dimensionen der Checkliste zur Beurteilung von IAM-Systemen
Identitäts- und Zugangsmanagement für Kundenportale – Eine Bestandsaufnahme 113
3 ErgebnisseDurch die Analysen hat sich herausgestellt, dass die Branchen in unterschiedlichen Qua-litätsdimensionen Schwächen und Stärken besitzen. So bieten die IAM-Systeme vonBanken und Versicherungen regelmäßig zu wenige Funktionen im Self Service. Auto-motive und E-Commerce dagegen haben ihre Schwächen eher in der Zugänglichkeit.
Effektivität (6 Einzelkriterien): Kunden haben den Anspruch, auf allen Kanälen ihreZiele erreichen zu können. Das bedeutet, dass Kunden sowohl über das Internet, Telefonoder durch Präsenz die gleichen Möglichkeiten geboten werden. Mängel existieren häu-fig im Bereich der Registrierung und Löschung von Kundenzugängen. Auch die Rück-setzung des Kennwortes ist häufig nicht ohne weiteres möglich.
Bedienbarkeitsbarrierefreiheit (5 Einzelkriterien): Um eine bessere Konversionsquote zuerreichen, sollten die Einstiegshürden und Barrieren so niedrig wie möglich sein. Der E-Commerce setzt dies am besten um. Häufige Mängel in anderen Branchen: Die Regist-rierung ist häufig nur Bestandskunden vorbehalten, Interessenten wird kein Zuganggewährt. Aber selbst den Bestandskunden werden Captchas, langsame Reaktionszeitenund mehrstufige Registrierungsprozesse zugemutet.
Fehlertoleranz/Benutzerführung (9 Einzelkriterien): Das häufigste Problem ist, dassEingaben nicht validiert werden. So ist es regelmäßig möglich, ungültige Zeichen inFelder einzutragen oder nicht existente Adressen zu hinterlegen. Auch bei komplexerenEingaben wie bei Kontoeröffnungen oder Angebotsberechnungen von Versicherungen,fehlen Plausibilitätsprüfungen. So kann der Kunde kurz nach seinem Geburtsdatumschon in seinen Beruf eingetreten sein, obwohl das in der Realität nicht möglich ist.
Self-Service (4 Einzelkriterien): Der Self-Service ist meist nur teilweise umgesetzt. BeiBanken und Versicherungen ist es häufig nicht möglich, das Kennwort über das Systemzurückzusetzen. Dies muss über einen anderen Kanal geschehen. Die Löschung desKundenzuganges ist nur bei den Automobilherstellern möglich. Auch Stammdatenände-rungen sind oft nicht möglich.
Verständlichkeit von Eingaben (7 Einzelkriterien): Branchenübergreifend ist die Ver-ständlichkeit der Systeme gut. Trotzdem gibt es auch hier Probleme: So werden teilweisePasswortrichtlinien nicht angezeigt, erst nach Bestätigung der Registrierung Fehlergemeldet. Weiterhin werden häufig viele Daten abgefragt, deren Zweck unklar ist.
Unterstützung des Benutzers (6 Einzelkriterien): Die kognitive Unterstützung ist meistunzureichend umgesetzt. Fehlermeldungen geben häufig nur an, dass ein Fehler vorliegt.Außerdem bekommt der Benutzer meist erst eine Rückmeldung zu seinen Eingaben,wenn er den aktuellen Schritt abschließen möchte.
Reduzierung kognitiver Barrieren (9 Einzelkriterien): Diese Dimension wurde von kei-ner Branche ausreichend erfüllt. Es werden häufig Passwortrichtlinien verwendet, diekeine Sicherheitsvorteile bringen oder den Benutzer zu stark einschränken. Außerdem
114 Peter Weierich et al.
bieten nicht einmal 10 % der betrachteten Portale die Möglichkeit des "bring-your-own-identity", z.B. über die Nutzung eines Social Media Login wie Facebook und Google.
Darstellung (4 Einzelkriterien): Die Darstellung der IAM-bezogenen Formulare undInformationseinblendungen sind häufig nicht im Design der restlichen Seite gestaltet.Viele Anbieter nutzen Overlays und Popups, um Informationen darzustellen oder abzu-fragen statt das IAM-System in das Portaldesign zu integrieren.
4 FazitKeines der betrachteten Portale ist frei von Makeln, das heißt die Unternehmen nutzenbei weitem noch nicht die Möglichkeiten aus um in Kundenportalen Geschäftsbeziehun-gen zu vertiefen bzw. Neugeschäft zu generieren. So sehen wir insbesondere das "SocialLogin", als wertvollen Lösungsbaustein. Zukünftig bietet sich ebenfalls der Einsatz vonBiometrie an, da diese durch moderne Betriebssysteme unterstützt wird. Am bestenstehen aktuell E-Commerce Portale da. An Stelle zwei und drei stehen die BereicheAutomotive und Banken. An hinterster Stelle folgen Versicherungen, hauptsächlich weilnur 45 % der betrachteten Versicherungsportale überhaupt ein IAM-System aufweisen.
Literaturverzeichnis[DD08] Dhamlia, R.; Fusseault, L.: The Seven Flaws of Identity Management – Usability and
Security Challenges, IEEE Security & Privacy, 2008.
[CO+06] Chiasson S.; Oorschot, P.C; Biddle R.: A Usability Study and Critique of Two Pass-word Managers, Proceedings of the 15th USENIX Security Symposium, 2006.
[ISO25010] ISO/IEC25010: Systems and software engineering – Systems and software QualityRequirements and Evaluation (SQuaRE) – System and software quality models.
[La05] Lauesen, S.: User interface design – a software engineering perspective; Addison-Wesley, 2005.
[Ni12] Nielson J.: Usability 101: Introduction to Usability, http://www.nngroup.com/articles/usability-101-introduction-to-usability/, (Abgerufen am 23.03.2015).
[SF05] Sasse, A.; Flechais, I.: Usable Security - Why Do We Need It? How Do We Get It?,Security and Usability, O'Reilly Verlag, 2005.
[We15] Weich, D.: Untersuchung der Identitäts- und Zugriffsmanagementsysteme von End-kundenportalen in ausgesuchten Branchen. Masterarbeit, KIT, Cooperation und Man-agement, 2015.
[WT99] Whitten, A.; Tygar, J. D.: Why Johnny Can't Encrypt – A Usability Evaluation of PGP5.0, Proceedings of the 8th USENIX Security Symposium, 1999.
Alfred Zimmermann, Alexander Rossmann (Hrsg.): Digital Enterprise Computing 2015,Lecture Notes in Informatics (LNI), Gesellschaft für Informatik, Bonn 2015 115
IT Operation Management -A Systematic Literature Review of ICIS, EDOC and BISEMark Hansen, Tim Piontek and Matthias Wißotzki1
Abstract: IT Operation Management (ITOM) observes IT Services and the IT Infrastructure. Thefield of IT Operation Management is a well explored research area and also well applied by practi-tioners. We provide a systematic literature review in the field of IT Operation Management. Weconcentrated on the two conferences ICIS and EDOC and on the BISE journal between the years2005 and 2012. The paper will show who is active in this research area, what topics are investigat-ed, what research approaches are used, and what kind of IT Operation Management approachescan be distinguished.
1 IntroductionThe aim of IT Operation Management is to ensure the feasibility of all processes andtasks that depend on IT Services and IT Infrastructure [IT15]. IT Services are essentialfor all processes in a company. Systems and services are supervised by the IT ServiceManagement that cares for “any component that needs to be managed in order to deliveran IT service” [Re07] what in turn includes the “IT Infrastructure”. The conferenceBusiness Information Systems (BIS) concentrates on the challenge for enterprises tokeep up with the pace of changing business demands. ITOM is one way for handling thechanges of IT Services and the IT Infrastructure. We want to motivate for this researcharea by providing a systematic literature review (SLR) in the field of IT Operation Man-agement. We identify existing research activities by answering five research questionsthat will be presented in section two. In section three we outline the selection process ofgathering relevant papers. The data collection and data analysis is reported in sectionfour. Furthermore, we provide explanations on the data found. Section five includes aconclusion to our work and presents further research possibilities
2 Research ApproachThis systematic literature review (SLR) is performed according to the guidelines definedby Kitchenham et al. [Kit04]. A SLR is a review process of research results with a struc-tured and comprehensible procedure. The aim of an SLR is to accumulate all “existingevidence concerning a treatment or technology”, “identify gaps in current research”, andprovide “background in order to appropriately position new research activities” [Kit04].
1 Universität Rostock, Lehrstuhl für Wirtschaftsinformatik, Albert-Einstein-Str. 22,18059 Rostock, {mark.hansen,tim.piontek,matthias.wissotzki}@uni-rostock.de
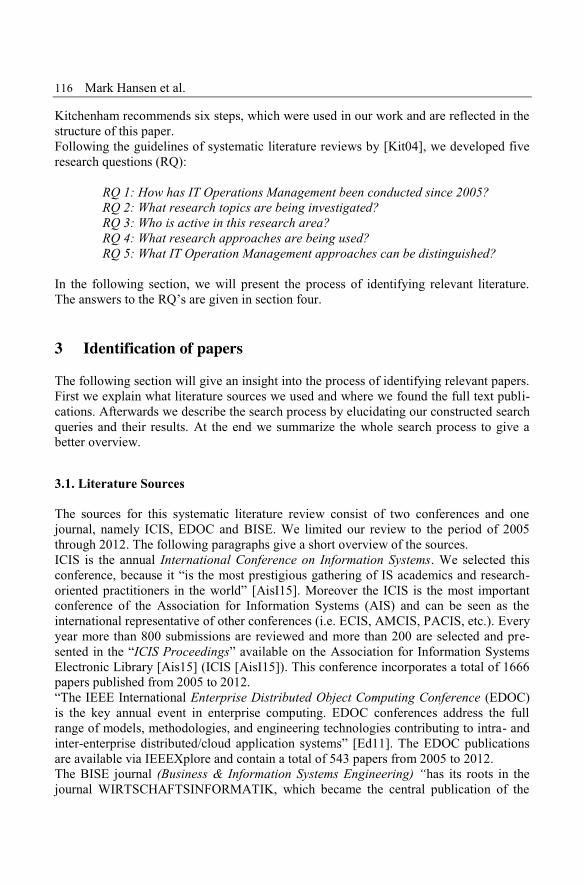
116 Mark Hansen et al.
Kitchenham recommends six steps, which were used in our work and are reflected in thestructure of this paper.Following the guidelines of systematic literature reviews by [Kit04], we developed fiveresearch questions (RQ):
RQ 1: How has IT Operations Management been conducted since 2005?RQ 2: What research topics are being investigated?RQ 3: Who is active in this research area?RQ 4: What research approaches are being used?RQ 5: What IT Operation Management approaches can be distinguished?
In the following section, we will present the process of identifying relevant literature.The answers to the RQ’s are given in section four.
3 Identification of papersThe following section will give an insight into the process of identifying relevant papers.First we explain what literature sources we used and where we found the full text publi-cations. Afterwards we describe the search process by elucidating our constructed searchqueries and their results. At the end we summarize the whole search process to give abetter overview.
3.1. Literature Sources
The sources for this systematic literature review consist of two conferences and onejournal, namely ICIS, EDOC and BISE. We limited our review to the period of 2005through 2012. The following paragraphs give a short overview of the sources.ICIS is the annual International Conference on Information Systems. We selected thisconference, because it “is the most prestigious gathering of IS academics and research-oriented practitioners in the world” [AisI15]. Moreover the ICIS is the most importantconference of the Association for Information Systems (AIS) and can be seen as theinternational representative of other conferences (i.e. ECIS, AMCIS, PACIS, etc.). Everyyear more than 800 submissions are reviewed and more than 200 are selected and pre-sented in the “ICIS Proceedings” available on the Association for Information SystemsElectronic Library [Ais15] (ICIS [AisI15]). This conference incorporates a total of 1666papers published from 2005 to 2012.“The IEEE International Enterprise Distributed Object Computing Conference (EDOC)is the key annual event in enterprise computing. EDOC conferences address the fullrange of models, methodologies, and engineering technologies contributing to intra- andinter-enterprise distributed/cloud application systems” [Ed11]. The EDOC publicationsare available via IEEEXplore and contain a total of 543 papers from 2005 to 2012.The BISE journal (Business & Information Systems Engineering) “has its roots in thejournal WIRTSCHAFTSINFORMATIK, which became the central publication of the
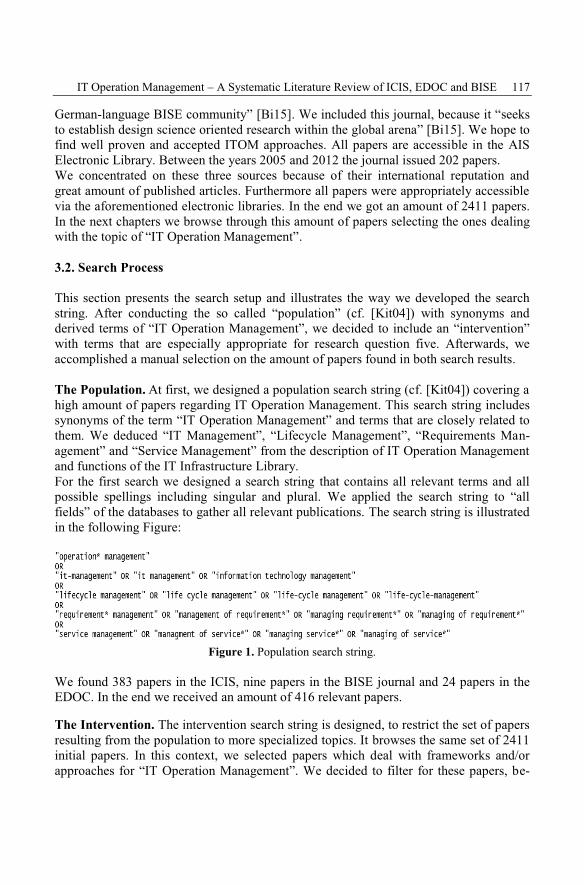
IT Operation Management – A Systematic Literature Review of ICIS, EDOC and BISE 117
German-language BISE community” [Bi15]. We included this journal, because it “seeksto establish design science oriented research within the global arena” [Bi15]. We hope tofind well proven and accepted ITOM approaches. All papers are accessible in the AISElectronic Library. Between the years 2005 and 2012 the journal issued 202 papers.We concentrated on these three sources because of their international reputation andgreat amount of published articles. Furthermore all papers were appropriately accessiblevia the aforementioned electronic libraries. In the end we got an amount of 2411 papers.In the next chapters we browse through this amount of papers selecting the ones dealingwith the topic of “IT Operation Management”.
3.2. Search Process
This section presents the search setup and illustrates the way we developed the searchstring. After conducting the so called “population” (cf. [Kit04]) with synonyms andderived terms of “IT Operation Management”, we decided to include an “intervention”with terms that are especially appropriate for research question five. Afterwards, weaccomplished a manual selection on the amount of papers found in both search results.
The Population. At first, we designed a population search string (cf. [Kit04]) covering ahigh amount of papers regarding IT Operation Management. This search string includessynonyms of the term “IT Operation Management” and terms that are closely related tothem. We deduced “IT Management”, “Lifecycle Management”, “Requirements Man-agement” and “Service Management” from the description of IT Operation Managementand functions of the IT Infrastructure Library.For the first search we designed a search string that contains all relevant terms and allpossible spellings including singular and plural. We applied the search string to “allfields” of the databases to gather all relevant publications. The search string is illustratedin the following Figure:
Figure 1. Population search string.
We found 383 papers in the ICIS, nine papers in the BISE journal and 24 papers in theEDOC. In the end we received an amount of 416 relevant papers.
The Intervention. The intervention search string is designed, to restrict the set of papersresulting from the population to more specialized topics. It browses the same set of 2411initial papers. In this context, we selected papers which deal with frameworks and/orapproaches for “IT Operation Management”. We decided to filter for these papers, be-
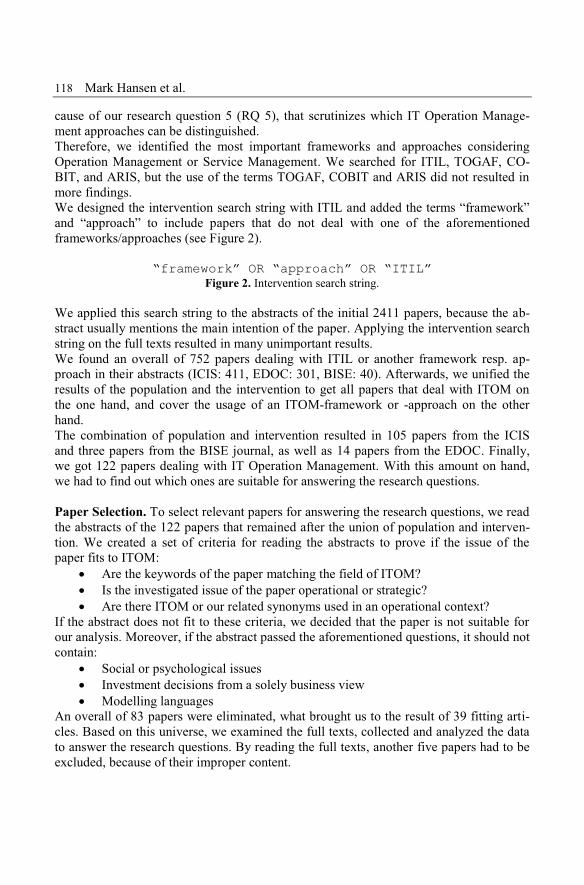
118 Mark Hansen et al.
cause of our research question 5 (RQ 5), that scrutinizes which IT Operation Manage-ment approaches can be distinguished.Therefore, we identified the most important frameworks and approaches consideringOperation Management or Service Management. We searched for ITIL, TOGAF, CO-BIT, and ARIS, but the use of the terms TOGAF, COBIT and ARIS did not resulted inmore findings.We designed the intervention search string with ITIL and added the terms “framework”and “approach” to include papers that do not deal with one of the aforementionedframeworks/approaches (see Figure 2).
“framework” OR “approach” OR “ITIL”Figure 2. Intervention search string.
We applied this search string to the abstracts of the initial 2411 papers, because the ab-stract usually mentions the main intention of the paper. Applying the intervention searchstring on the full texts resulted in many unimportant results.We found an overall of 752 papers dealing with ITIL or another framework resp. ap-proach in their abstracts (ICIS: 411, EDOC: 301, BISE: 40). Afterwards, we unified theresults of the population and the intervention to get all papers that deal with ITOM onthe one hand, and cover the usage of an ITOM-framework or -approach on the otherhand.The combination of population and intervention resulted in 105 papers from the ICISand three papers from the BISE journal, as well as 14 papers from the EDOC. Finally,we got 122 papers dealing with IT Operation Management. With this amount on hand,we had to find out which ones are suitable for answering the research questions.
Paper Selection. To select relevant papers for answering the research questions, we readthe abstracts of the 122 papers that remained after the union of population and interven-tion. We created a set of criteria for reading the abstracts to prove if the issue of thepaper fits to ITOM:
" Are the keywords of the paper matching the field of ITOM?" Is the investigated issue of the paper operational or strategic?" Are there ITOM or our related synonyms used in an operational context?
If the abstract does not fit to these criteria, we decided that the paper is not suitable forour analysis. Moreover, if the abstract passed the aforementioned questions, it should notcontain:
" Social or psychological issues" Investment decisions from a solely business view" Modelling languages
An overall of 83 papers were eliminated, what brought us to the result of 39 fitting arti-cles. Based on this universe, we examined the full texts, collected and analyzed the datato answer the research questions. By reading the full texts, another five papers had to beexcluded, because of their improper content.
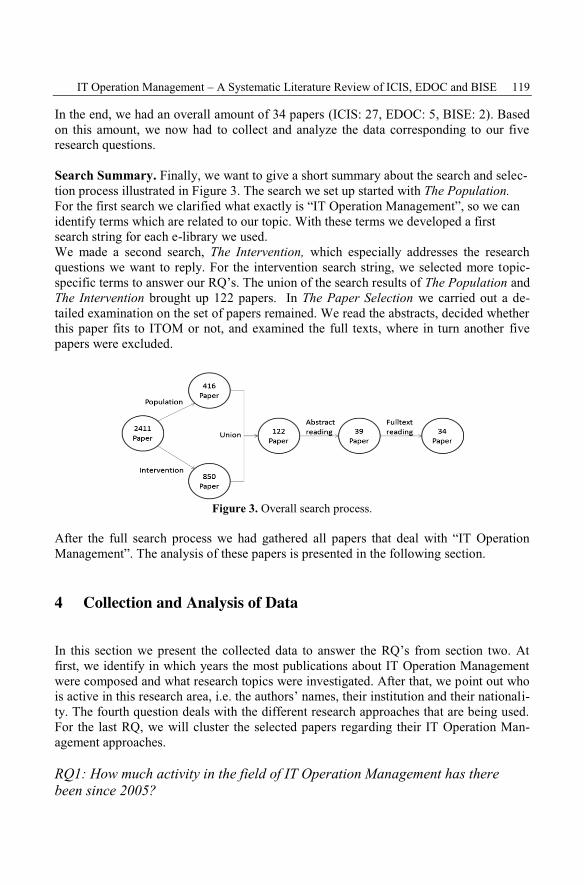
IT Operation Management – A Systematic Literature Review of ICIS, EDOC and BISE 119
In the end, we had an overall amount of 34 papers (ICIS: 27, EDOC: 5, BISE: 2). Basedon this amount, we now had to collect and analyze the data corresponding to our fiveresearch questions.
Search Summary. Finally, we want to give a short summary about the search and selec-tion process illustrated in Figure 3. The search we set up started with The Population.For the first search we clarified what exactly is “IT Operation Management”, so we canidentify terms which are related to our topic. With these terms we developed a firstsearch string for each e-library we used.We made a second search, The Intervention, which especially addresses the researchquestions we want to reply. For the intervention search string, we selected more topic-specific terms to answer our RQ’s. The union of the search results of The Population andThe Intervention brought up 122 papers. In The Paper Selection we carried out a de-tailed examination on the set of papers remained. We read the abstracts, decided whetherthis paper fits to ITOM or not, and examined the full texts, where in turn another fivepapers were excluded.
Figure 3. Overall search process.
After the full search process we had gathered all papers that deal with “IT OperationManagement”. The analysis of these papers is presented in the following section.
4 Collection and Analysis of Data
In this section we present the collected data to answer the RQ’s from section two. Atfirst, we identify in which years the most publications about IT Operation Managementwere composed and what research topics were investigated. After that, we point out whois active in this research area, i.e. the authors’ names, their institution and their nationali-ty. The fourth question deals with the different research approaches that are being used.For the last RQ, we will cluster the selected papers regarding their IT Operation Man-agement approaches.
RQ1: How much activity in the field of IT Operation Management has therebeen since 2005?
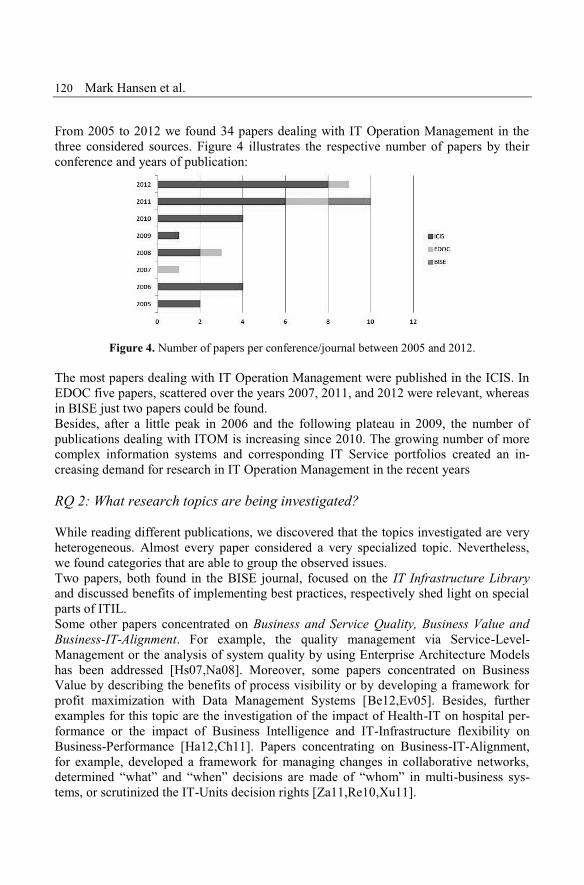
120 Mark Hansen et al.
From 2005 to 2012 we found 34 papers dealing with IT Operation Management in thethree considered sources. Figure 4 illustrates the respective number of papers by theirconference and years of publication:
Figure 4. Number of papers per conference/journal between 2005 and 2012.
The most papers dealing with IT Operation Management were published in the ICIS. InEDOC five papers, scattered over the years 2007, 2011, and 2012 were relevant, whereasin BISE just two papers could be found.Besides, after a little peak in 2006 and the following plateau in 2009, the number ofpublications dealing with ITOM is increasing since 2010. The growing number of morecomplex information systems and corresponding IT Service portfolios created an in-creasing demand for research in IT Operation Management in the recent years
RQ 2: What research topics are being investigated?
While reading different publications, we discovered that the topics investigated are veryheterogeneous. Almost every paper considered a very specialized topic. Nevertheless,we found categories that are able to group the observed issues.Two papers, both found in the BISE journal, focused on the IT Infrastructure Libraryand discussed benefits of implementing best practices, respectively shed light on specialparts of ITIL.Some other papers concentrated on Business and Service Quality, Business Value andBusiness-IT-Alignment. For example, the quality management via Service-Level-Management or the analysis of system quality by using Enterprise Architecture Modelshas been addressed [Hs07,Na08]. Moreover, some papers concentrated on BusinessValue by describing the benefits of process visibility or by developing a framework forprofit maximization with Data Management Systems [Be12,Ev05]. Besides, furtherexamples for this topic are the investigation of the impact of Health-IT on hospital per-formance or the impact of Business Intelligence and IT-Infrastructure flexibility onBusiness-Performance [Ha12,Ch11]. Papers concentrating on Business-IT-Alignment,for example, developed a framework for managing changes in collaborative networks,determined “what” and “when” decisions are made of “whom” in multi-business sys-tems, or scrutinized the IT-Units decision rights [Za11,Re10,Xu11].
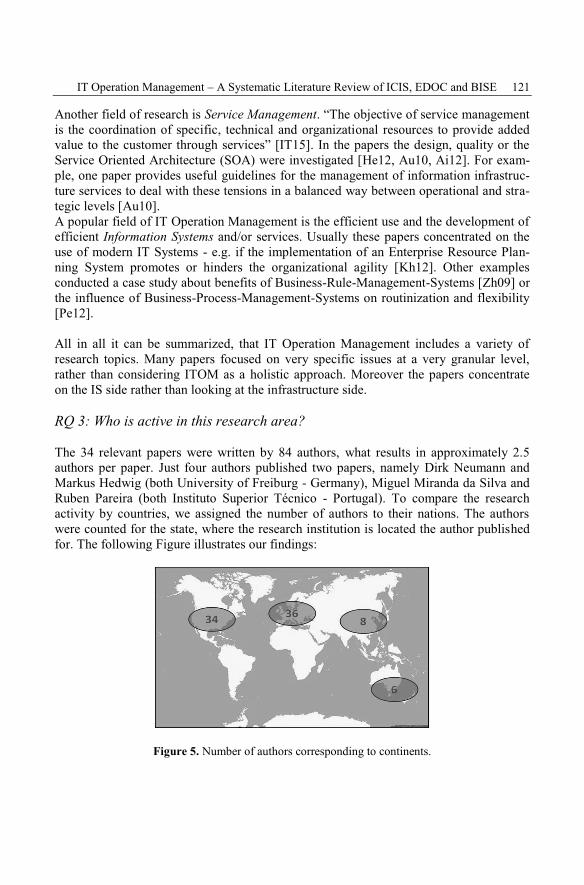
IT Operation Management – A Systematic Literature Review of ICIS, EDOC and BISE 121
Another field of research is Service Management. “The objective of service managementis the coordination of specific, technical and organizational resources to provide addedvalue to the customer through services” [IT15]. In the papers the design, quality or theService Oriented Architecture (SOA) were investigated [He12, Au10, Ai12]. For exam-ple, one paper provides useful guidelines for the management of information infrastruc-ture services to deal with these tensions in a balanced way between operational and stra-tegic levels [Au10].A popular field of IT Operation Management is the efficient use and the development ofefficient Information Systems and/or services. Usually these papers concentrated on theuse of modern IT Systems - e.g. if the implementation of an Enterprise Resource Plan-ning System promotes or hinders the organizational agility [Kh12]. Other examplesconducted a case study about benefits of Business-Rule-Management-Systems [Zh09] orthe influence of Business-Process-Management-Systems on routinization and flexibility[Pe12].
All in all it can be summarized, that IT Operation Management includes a variety ofresearch topics. Many papers focused on very specific issues at a very granular level,rather than considering ITOM as a holistic approach. Moreover the papers concentrateon the IS side rather than looking at the infrastructure side.
RQ 3: Who is active in this research area?
The 34 relevant papers were written by 84 authors, what results in approximately 2.5authors per paper. Just four authors published two papers, namely Dirk Neumann andMarkus Hedwig (both University of Freiburg - Germany), Miguel Miranda da Silva andRuben Pareira (both Instituto Superior Técnico - Portugal). To compare the researchactivity by countries, we assigned the number of authors to their nations. The authorswere counted for the state, where the research institution is located the author publishedfor. The following Figure illustrates our findings:
Figure 5. Number of authors corresponding to continents.
122 Mark Hansen et al.
The map indicates that most research is done in the USA and Europe. Just a little workwas made in Asia (Singapore, China and Shanghai) and Australia (+ one paper fromNew Zealand).After that, we figured out which research institutions are most active. To do this, wecounted the papers published per institution. Three institutions, namely the Royal Insti-tute of Technology (Sweden), the University of Mannheim (Germany), and the Universi-ty of Memphis (USA) tie for the most active institution with four authors each. It has tobe mentioned that we did not differentiate between various campuses belonging to anuniversity in the US (e.g. authors from the University of North Carolina at Greensboro,as well as authors from the University of North Carolina at Charlotte were both countedfor the University of North Carolina).Based on this data, it could be interpreted that most research activity is done in USA andEurope because of their high technologized economy (great tertiary sector), leading tomore complex information systems, what in turn could lead to a greater need of researchin this area. The fact, that six of the eight authors from China published their papers inthe near past (2010, 2011, and 2012) gives some evidence to this reasoning because ofgrowing technologies in this region especially in recent years.Because of the fact, that we found many different authors and just four of them pub-lished two papers, we could furthermore interpret that there are no researchers or institu-tions specialized on ITOM. Nevertheless, the universe of 34 papers is too small to devel-op convincing interpretations on this.
RQ 4: What research approaches are being used?
By analyzing the different research approaches used in the papers, we first had to defineappropriate research methods to classify the papers. Many papers used different designa-tions for almost the same approaches. We found 19 different research approaches,whereas just five of them were mentioned in more than three papers. After comparingthem, we developed the following five research approach categories to classify them.
" 5 literature Reviews: containing literature reviews and literature analyses" 19 empirical Studies: containing empirical studies, empirical testings, case stud-
ies, surveys, case settings, field studies and empirical applications" 11 frameworks: containing theoretical frameworks, adaptation frameworks and
architectural approaches" 9 practical Experiences: containing practical experiences, practical applications,
experiments and evaluations in test infrastructures" 3 theoretical works: containing theoretical work, systematical approaches, hy-
potheses
We got an overall amount of 47 research approaches used in our 34 relevant papers.Obviously, some of them used multiple approaches, e.g. developed a framework andevaluated it with an empirical study. Most papers used empirical studies (ca. 40%) anddeveloped frameworks (ca. 23%) (for more on this see RQ 5).With these results on hand, we could interpret that ITOM is a relative new research area,so that more research focus on developing practical frameworks or approaches tested
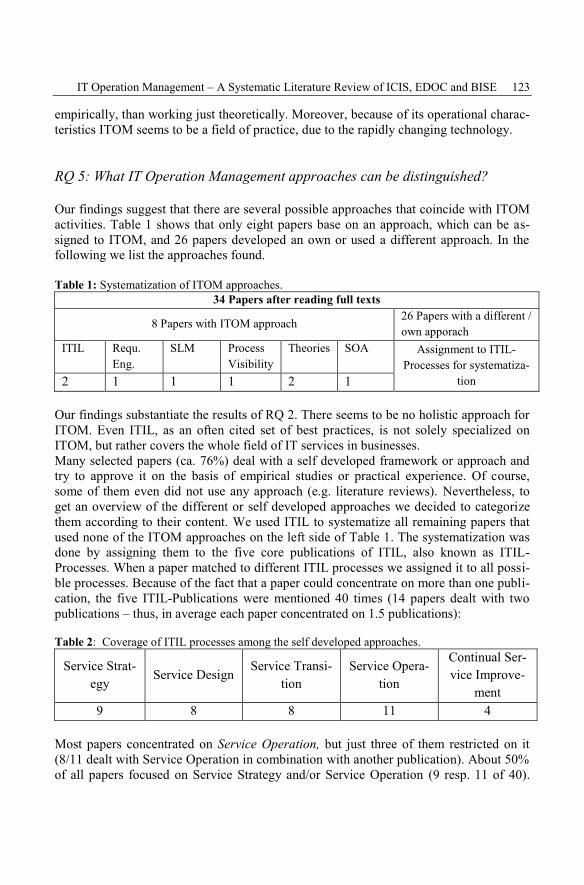
IT Operation Management – A Systematic Literature Review of ICIS, EDOC and BISE 123
empirically, than working just theoretically. Moreover, because of its operational charac-teristics ITOM seems to be a field of practice, due to the rapidly changing technology.
RQ 5: What IT Operation Management approaches can be distinguished?
Our findings suggest that there are several possible approaches that coincide with ITOMactivities. Table 1 shows that only eight papers base on an approach, which can be as-signed to ITOM, and 26 papers developed an own or used a different approach. In thefollowing we list the approaches found.
Table 1: Systematization of ITOM approaches.34 Papers after reading full texts
8 Papers with ITOM approach 26 Papers with a different /own apporach
ITIL Requ.Eng.
SLM ProcessVisibility
Theories SOA Assignment to ITIL-Processes for systematiza-
tion2 1 1 1 2 1
Our findings substantiate the results of RQ 2. There seems to be no holistic approach forITOM. Even ITIL, as an often cited set of best practices, is not solely specialized onITOM, but rather covers the whole field of IT services in businesses.Many selected papers (ca. 76%) deal with a self developed framework or approach andtry to approve it on the basis of empirical studies or practical experience. Of course,some of them even did not use any approach (e.g. literature reviews). Nevertheless, toget an overview of the different or self developed approaches we decided to categorizethem according to their content. We used ITIL to systematize all remaining papers thatused none of the ITOM approaches on the left side of Table 1. The systematization wasdone by assigning them to the five core publications of ITIL, also known as ITIL-Processes. When a paper matched to different ITIL processes we assigned it to all possi-ble processes. Because of the fact that a paper could concentrate on more than one publi-cation, the five ITIL-Publications were mentioned 40 times (14 papers dealt with twopublications – thus, in average each paper concentrated on 1.5 publications):
Table 2: Coverage of ITIL processes among the self developed approaches.
Service Strat-egy
Service Design Service Transi-tion
Service Opera-tion
Continual Ser-vice Improve-
ment9 8 8 11 4
Most papers concentrated on Service Operation, but just three of them restricted on it(8/11 dealt with Service Operation in combination with another publication). About 50%of all papers focused on Service Strategy and/or Service Operation (9 resp. 11 of 40).
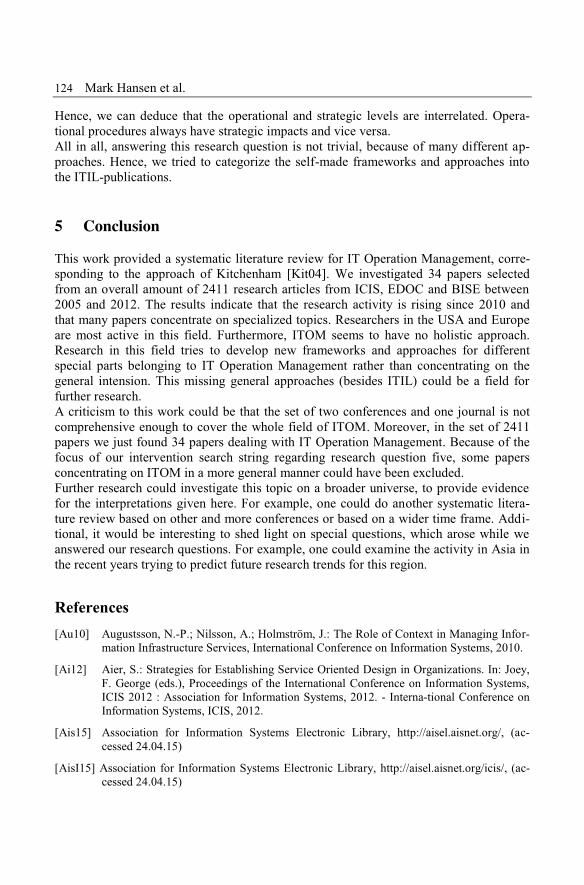
124 Mark Hansen et al.
Hence, we can deduce that the operational and strategic levels are interrelated. Opera-tional procedures always have strategic impacts and vice versa.All in all, answering this research question is not trivial, because of many different ap-proaches. Hence, we tried to categorize the self-made frameworks and approaches intothe ITIL-publications.
5 ConclusionThis work provided a systematic literature review for IT Operation Management, corre-sponding to the approach of Kitchenham [Kit04]. We investigated 34 papers selectedfrom an overall amount of 2411 research articles from ICIS, EDOC and BISE between2005 and 2012. The results indicate that the research activity is rising since 2010 andthat many papers concentrate on specialized topics. Researchers in the USA and Europeare most active in this field. Furthermore, ITOM seems to have no holistic approach.Research in this field tries to develop new frameworks and approaches for differentspecial parts belonging to IT Operation Management rather than concentrating on thegeneral intension. This missing general approaches (besides ITIL) could be a field forfurther research.A criticism to this work could be that the set of two conferences and one journal is notcomprehensive enough to cover the whole field of ITOM. Moreover, in the set of 2411papers we just found 34 papers dealing with IT Operation Management. Because of thefocus of our intervention search string regarding research question five, some papersconcentrating on ITOM in a more general manner could have been excluded.Further research could investigate this topic on a broader universe, to provide evidencefor the interpretations given here. For example, one could do another systematic litera-ture review based on other and more conferences or based on a wider time frame. Addi-tional, it would be interesting to shed light on special questions, which arose while weanswered our research questions. For example, one could examine the activity in Asia inthe recent years trying to predict future research trends for this region.
References[Au10] Augustsson, N.-P.; Nilsson, A.; Holmström, J.: The Role of Context in Managing Infor-
mation Infrastructure Services, International Conference on Information Systems, 2010.
[Ai12] Aier, S.: Strategies for Establishing Service Oriented Design in Organizations. In: Joey,F. George (eds.), Proceedings of the International Conference on Information Systems,ICIS 2012 : Association for Information Systems, 2012. - Interna-tional Conference onInformation Systems, ICIS, 2012.
[Ais15] Association for Information Systems Electronic Library, http://aisel.aisnet.org/, (ac-cessed 24.04.15)
[AisI15] Association for Information Systems Electronic Library, http://aisel.aisnet.org/icis/, (ac-cessed 24.04.15)
IT Operation Management – A Systematic Literature Review of ICIS, EDOC and BISE 125
[Be12] Berner, M.; Graupner, E.; Maedche, A.; Mueller, B.: Process Visibility – Towards aConceptualization and Research Themes, Thirty Third International Conference on In-formation Systems, Orlando, 2012.
[Bi15] Business & Information System Engineering, http://www.bise-journal.org/index.php;sid=j9f00p7pat8selblpabqbr2gj6, (accessed 24.04.15)
[Ch11] Chen, X., Siau, K.: Impact of Business Intelligence and IT Infrastructure flexibility onCompetitive Performance: An Organizational Agility Perspective, In: Proceedings of theInternational Conference on Information Systems, ICIS 2011.
[Ed11] EDOC 2011 Conference, http://www.cs.helsinki.fi/en/edoc2011/edoc2012, (ac-cessed24.04.15)
[ED06] 10th IEEE International Enterprise Distributed Object Computing Conference, TitlePage, http://ieeexplore.ieee.org/stamp/stamp.jsp?tp=&arnumber=4031179, (accessed24.04.15)
[Ev05] Even, A.; Shankaranarayanan, G.; Berger, P.D.: Profit Maximization with Data Man-agement Systems, In: Proceedings of the International Conference on Information Sys-tems, ICIS 2005, December 11-14, 2005.
[Ha12] Hah, H.; Bharadwaj, A.: A Mulit-Level Analysis of the Impact of Health InformationTechnology on Hospital Performance, Thirty Third International Conference on Infor-mation Systems, Orlando, 2012.
[He12] Hedwig, M.; Malkowski, S.; Neumann, D.: Efficient and Flexible Management of Enter-prise Information Systems. Thirty Third International Conference on Information Sys-tems, Orlando, 2012.
[Hs07] Hsueh, M.-C.: Adaptive Service Level Management, 2012 IEEE 16th InternationalEnterprise Distributed Object Computing Conference, IEEE Computer Society, 2007.
[IT15] Information Technology Infrastructure Library, ITIL.org, (accessed 24.04.15)
[Kh12] Kharabe, A.; Lyytinen, K.: Is Implementing ERP Like Pouring Concrete Into a Compa-ny? Impact of Enterprise Systems on Organizational Agility, Thirty Third InternationalConference on Information Systems, Orlando, 2012.
[Kit04] Kitchenham, B.A.: Procedures for Undertaking Systematic Reviews, Joint TechnicalReport, Computer Science Department, Keele University (TR/SE-0401) and NationalICT Australia Ltd., 2004.
[Na08] Narman, P.; Schonherr, M.; Johnson, P.; Ekstedt, M.; Chenine, M.: Using EnterpriseArchitecture Models for System Quality Analysis, Enterprise Distributed Object Compu-ting Conference, 2008. EDOC '08. 12th International IEEE , vol., no., pp.14-23, 2008.
[Pe12] Pentland, B.T.; Singh, H.; Yakura, E.K.: Routinizing change: Does business processmanagement technology have unintended firm-level consequences? Thirty Third Interna-tional Conference on Information Systems, Orlando, 2012.
[Re07] Reboucas, R.; Sauve, J.; Moura, A.; Bartolini, C.; Trastour, D.: A decision support toolto optimize scheduling of IT changes, Integrated Network Management. IM '07. 10thIFIP/IEEE International Symposium on , pp. 343-352, May 21 2007.

126 Mark Hansen et al.
[Re10] Reynolds, P.; Thorogood, A.; Yetton, P.: Allocation of IT Decision Rights in Multi-business Organizations: What Decisions, Who Makes Them, and When Are They Tak-en?, International Conference on Information Systems, 2010.
[Xu11] Xue, L.; Zhang, C.; Ling, H.; Zhao, X.: Impact of IT Unit’s Decision Right on Organiza-tional Risk Taking in IT, International Conference on Information Systems, 2011
[Za11] Zarvic, N.; Fellmann, M.; Thomas, O.: Managing Changes in Collaborative Net-works:A Conceptual Approach, Thirty Second International Conference on Information Sys-tems, Shanghai, 2011.
[Zh09] Zhang, C.; Meservy, T.O.; Lee, E.T.; Dhaliwal, J.S.: An Exploratory Case Study of theBenefits of Business Rules Management Systems, In: Proceedings of the Inter-nationalConference on Information Systems, ICIS, 2009.
Alfred Zimmermann, Alexander Rossmann (Hrsg.): Digital Enterprise Computing 2015,Lecture Notes in Informatics (LNI), Gesellschaft für Informatik, Bonn 2015 127
Rollenkonzepte im Enterprise Architecture Management
Matthias Wißotzki, Christina Köpp und Paul Stelzer1
Zusammenfassung: Um die Flexibilität und somit schnelle Anpassung an Veränderungen zuermöglichen, motiviert durch innere und/oder äußere Einflüsse, haben sich seit Jahren Methodenund Werkzeuge des Enterprise Architecture Managements (EAM) bewährt. Des Weiteren opti-miert es die Abstimmung von Geschäftszielen und dessen Strategie mit anderen Architekturebe-nen. Dies gelingt nur, wenn die damit verbundenen Aufgaben und benötigten Kompetenzen be-kannt sind. Obgleich die Fachliteratur auf die Bedeutung von Rollen nachdrücklich hinweist,wurden diese bislang nur spärlich diskutiert. Diese Arbeit analysiert eine Auswahl an Beiträgen inHinblick auf darin enthaltene Rollenkonzepte. Ziel der Arbeit ist die Erstellung einer Gruppierungvon Rollen im EAM, mitsamt den dazugehörigen Aufgaben und benötigten Kompetenzen.
1 EinführungUnternehmensarchitekturen gewähren einen ganzheitlichen Blick auf das Unternehmenhinsichtlich seiner Elemente und Abhängigkeiten, dessen Kenntnisse zur Leistungser-stellung notwendig sind. Die Verwaltung dieser Unternehmensarchitekturen, das Unter-nehmensarchitekturmanagement (Enterprise Architecture Management) ist bestrebt, imEinklang mit den Unternehmenszielen und –strategien, die Flexibilität und Transparenzin Unternehmensarchitekturen durch die Nutzung von Planungs-, Veränderungs- undKontrollkonzepten, aufrechtzuerhalten sowie neue Fähigkeiten und Kostensenkungspo-tenziale zu identifizieren [Ah12], [Wi15]. Des Weiteren wird das EAM genutzt, „[...] umdie Komplexität der IT-Landschaft zu beherrschen und die IT-Landschaft strategisch undBusiness-orientiert weiterzuentwickeln“ [Ha12].
Um zu verstehen, wie das EAM in seiner Struktur aufgebaut ist, muss folgende Fragebeantwortet werden: Welche Aufgaben sind zu bewältigen und welche Kenntnisse („Ski-lls“ [Th11]) werden dafür benötigt? Dieses Wissen schafft nicht nur strukturelle Trans-parenz, es ist wesentlich für den Erfolg des EAMs, denn: Nur wenn die richtigen Mitar-beiter mit den erforderlichen Kompetenzen in den dafür vorgesehenen Rollen die anste-henden Aufgaben korrekt erledigen, kann sich der volle Nutzen des EAMs entfalten(nach [Ah12]). Es ist folglich wichtig, die Rollen und die damit verbundenen Verant-wortlichkeiten und Aufgaben zu kennen, denn die ausführenden Personen sind in ihrerRolle verantwortlich für die Entwicklung, Realisierung und Optimierung dieses Ma-nagementansatzes und somit entscheidend für dessen Erfolg oder Misserfolg.
1 Universität Rostock, Lehrstuhl für Wirtschaftsinformatik, Albert-Einstein-Str. 22,18059 Rostock, {matthias.wissotzki, christina.koepp, paul.stelzer}@uni-rostock.de
128 Matthias Wißotzki at al.
Mittlerweile sind zahlreiche Abhandlungen zum Thema EAM erschienen. Es gibt weitmehr als 50 Rahmenwerke [Ma11], eine Menge an wissenschaftlichen Beiträgen unddiverse Fachliteratur zu diesem Thema [WS12]. Auf die zur Umsetzung der EAM Kon-zepte benötigten Rollen wird jedoch nur selten eingegangen. Auch Rahmenwerke derUnternehmensarchitektur (Enterprise Architecture), welche das Thema wesentlich ge-nauer „[...] durch verschiedene Sichten und Aspekte [...]“ [Ha12] beschreiben, betrach-ten, bis auf wenige Ausnahmen, die ausführenden Rollen nicht genauer.
Aus diesem Grund sollen in dieser Arbeit die Ergebnisse einer Analyse bestehenderRollenkonzepte und die gefundenen Ansätze zusammengefasst dargestellt werden. Dazuwurden mittels einer Literaturanalyse verschiedene wissenschaftliche Beiträge auf dasVorhandensein von Rollenkonzepten geprüft. Durch die aggregierte Rollenübersichtentsteht Kenntnis darüber, welche „Standardrollen“ im EAM sich aus der Literatur ablei-ten lassen. Dieses Wissen ist sowohl für Unternehmen interessant, welche EAM einfüh-ren, um sich am Rollenset zu orientieren, als auch für Unternehmen mit vorhandenemEAM, um zu überprüfen, ob die gefundenen Aufgabenaspekte in ihren bereits etabliertenRollen berücksichtigt wurden.
2 ForschungsansatzDer Forschungsprozess begann mit der Aufstellung der Forschungsfragen. Die Arbeitsoll einen generalisierten Überblick über verwendete Rollenkonzepte im EAM geben.Dazu muss im ersten Schritt der Begriff der Rolle definiert werden. Des Weiteren mussfür die Analyse der in den unterschiedlichen Ressourcen gefundenen Rollen ein Ord-nungsrahmen entwickelt werden. Nur so können die Rollen aus der untersuchten Litera-tur vereinheitlicht und zusammengefasst werden. Daraus ergibt sich die Forschungsfra-ge:
RQ: Welche allgemeinen Rollen können innerhalb eines EAM Teams unterschiedenwerden?Im zweiten Schritt erfolgte die Literaturrecherche. Hierbei finden in der Regel zweiVerfahren Anwendung: Die „systematische Methode“ [Ki04] und die Methode der kon-zentrischen Kreise [Sa13] wobei für diese Arbeit das zweite Verfahren als Grundlage fürdie Literaturrecherche genutzt wurde.
Um sowohl die Basisliteratur als auch die daraus abgeleitete passende EAM Literatur zuidentifizieren wurden folgende Schlagwortgruppen gebiltet: (1) „Enterprise ArchitectureManagement“, (2) „Enterprise Architecture Management & Rollen“, (3) „EnterpriseArchitecture Management & Roles“, (4) „Enterprise Architecture“ & „Framework“, (5)„Unternehmensarchitekturmanagement“, (6) „Unternehmensarchitektur“, (7) „Unter-nehmensarchitekturmanagement & Rollen“. Die Suche erfolgte in von Voss [Vo11]zusammengefassten Suchdiensten: Bibliothekskatalog, Literaturdatenbanken und Elekt-ronische Volltextausgaben; die Operatoren innerhalb der Suchterme wurden an die An-forderungen des jeweiligen Suchdienstes angepasst. Für diese Arbeit wurde insbesondere
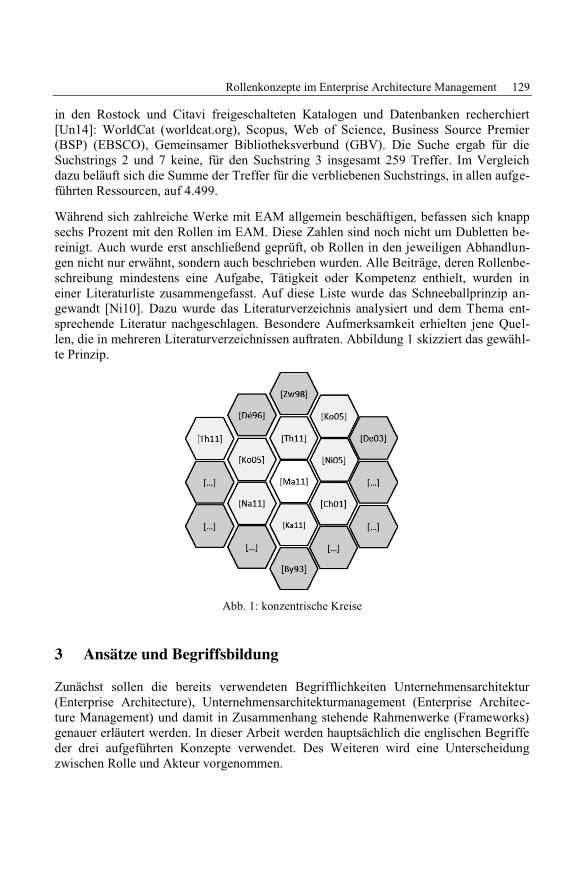
Rollenkonzepte im Enterprise Architecture Management 129
in den Rostock und Citavi freigeschalteten Katalogen und Datenbanken recherchiert[Un14]: WorldCat (worldcat.org), Scopus, Web of Science, Business Source Premier(BSP) (EBSCO), Gemeinsamer Bibliotheksverbund (GBV). Die Suche ergab für dieSuchstrings 2 und 7 keine, für den Suchstring 3 insgesamt 259 Treffer. Im Vergleichdazu beläuft sich die Summe der Treffer für die verbliebenen Suchstrings, in allen aufge-führten Ressourcen, auf 4.499.
Während sich zahlreiche Werke mit EAM allgemein beschäftigen, befassen sich knappsechs Prozent mit den Rollen im EAM. Diese Zahlen sind noch nicht um Dubletten be-reinigt. Auch wurde erst anschließend geprüft, ob Rollen in den jeweiligen Abhandlun-gen nicht nur erwähnt, sondern auch beschrieben wurden. Alle Beiträge, deren Rollenbe-schreibung mindestens eine Aufgabe, Tätigkeit oder Kompetenz enthielt, wurden ineiner Literaturliste zusammengefasst. Auf diese Liste wurde das Schneeballprinzip an-gewandt [Ni10]. Dazu wurde das Literaturverzeichnis analysiert und dem Thema ent-sprechende Literatur nachgeschlagen. Besondere Aufmerksamkeit erhielten jene Quel-len, die in mehreren Literaturverzeichnissen auftraten. Abbildung 1 skizziert das gewähl-te Prinzip.
Abb. 1: konzentrische Kreise
3 Ansätze und BegriffsbildungZunächst sollen die bereits verwendeten Begrifflichkeiten Unternehmensarchitektur(Enterprise Architecture), Unternehmensarchitekturmanagement (Enterprise Architec-ture Management) und damit in Zusammenhang stehende Rahmenwerke (Frameworks)genauer erläutert werden. In dieser Arbeit werden hauptsächlich die englischen Begriffeder drei aufgeführten Konzepte verwendet. Des Weiteren wird eine Unterscheidungzwischen Rolle und Akteur vorgenommen.
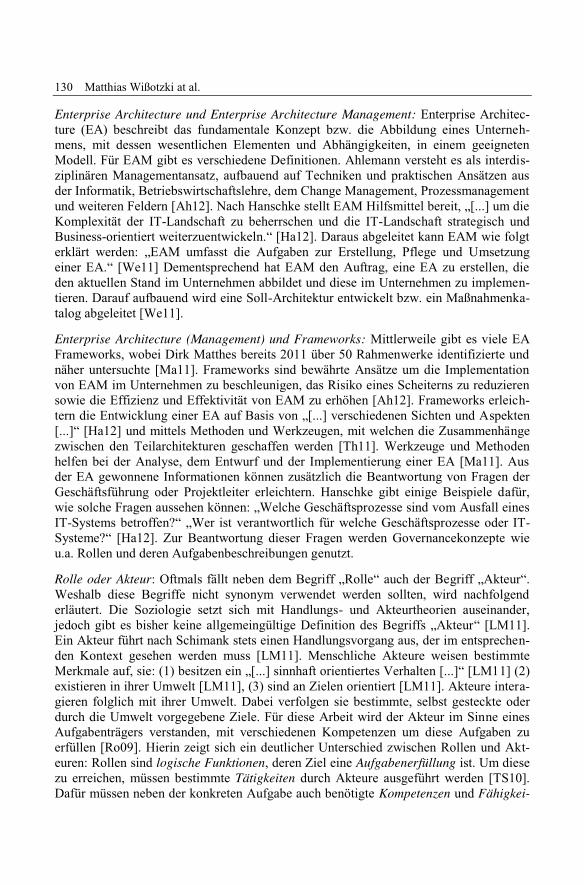
130 Matthias Wißotzki at al.
Enterprise Architecture und Enterprise Architecture Management: Enterprise Architec-ture (EA) beschreibt das fundamentale Konzept bzw. die Abbildung eines Unterneh-mens, mit dessen wesentlichen Elementen und Abhängigkeiten, in einem geeignetenModell. Für EAM gibt es verschiedene Definitionen. Ahlemann versteht es als interdis-ziplinären Managementansatz, aufbauend auf Techniken und praktischen Ansätzen ausder Informatik, Betriebswirtschaftslehre, dem Change Management, Prozessmanagementund weiteren Feldern [Ah12]. Nach Hanschke stellt EAM Hilfsmittel bereit, „[...] um dieKomplexität der IT-Landschaft zu beherrschen und die IT-Landschaft strategisch undBusiness-orientiert weiterzuentwickeln.“ [Ha12]. Daraus abgeleitet kann EAM wie folgterklärt werden: „EAM umfasst die Aufgaben zur Erstellung, Pflege und Umsetzungeiner EA.“ [We11] Dementsprechend hat EAM den Auftrag, eine EA zu erstellen, dieden aktuellen Stand im Unternehmen abbildet und diese im Unternehmen zu implemen-tieren. Darauf aufbauend wird eine Soll-Architektur entwickelt bzw. ein Maßnahmenka-talog abgeleitet [We11].
Enterprise Architecture (Management) und Frameworks: Mittlerweile gibt es viele EAFrameworks, wobei Dirk Matthes bereits 2011 über 50 Rahmenwerke identifizierte undnäher untersuchte [Ma11]. Frameworks sind bewährte Ansätze um die Implementationvon EAM im Unternehmen zu beschleunigen, das Risiko eines Scheiterns zu reduzierensowie die Effizienz und Effektivität von EAM zu erhöhen [Ah12]. Frameworks erleich-tern die Entwicklung einer EA auf Basis von „[...] verschiedenen Sichten und Aspekten[...]“ [Ha12] und mittels Methoden und Werkzeugen, mit welchen die Zusammenhängezwischen den Teilarchitekturen geschaffen werden [Th11]. Werkzeuge und Methodenhelfen bei der Analyse, dem Entwurf und der Implementierung einer EA [Ma11]. Ausder EA gewonnene Informationen können zusätzlich die Beantwortung von Fragen derGeschäftsführung oder Projektleiter erleichtern. Hanschke gibt einige Beispiele dafür,wie solche Fragen aussehen können: „Welche Geschäftsprozesse sind vom Ausfall einesIT-Systems betroffen?“ „Wer ist verantwortlich für welche Geschäftsprozesse oder IT-Systeme?“ [Ha12]. Zur Beantwortung dieser Fragen werden Governancekonzepte wieu.a. Rollen und deren Aufgabenbeschreibungen genutzt.
Rolle oder Akteur: Oftmals fällt neben dem Begriff „Rolle“ auch der Begriff „Akteur“.Weshalb diese Begriffe nicht synonym verwendet werden sollten, wird nachfolgenderläutert. Die Soziologie setzt sich mit Handlungs- und Akteurtheorien auseinander,jedoch gibt es bisher keine allgemeingültige Definition des Begriffs „Akteur“ [LM11].Ein Akteur führt nach Schimank stets einen Handlungsvorgang aus, der im entsprechen-den Kontext gesehen werden muss [LM11]. Menschliche Akteure weisen bestimmteMerkmale auf, sie: (1) besitzen ein „[...] sinnhaft orientiertes Verhalten [...]“ [LM11] (2)existieren in ihrer Umwelt [LM11], (3) sind an Zielen orientiert [LM11]. Akteure intera-gieren folglich mit ihrer Umwelt. Dabei verfolgen sie bestimmte, selbst gesteckte oderdurch die Umwelt vorgegebene Ziele. Für diese Arbeit wird der Akteur im Sinne einesAufgabenträgers verstanden, mit verschiedenen Kompetenzen um diese Aufgaben zuerfüllen [Ro09]. Hierin zeigt sich ein deutlicher Unterschied zwischen Rollen und Akt-euren: Rollen sind logische Funktionen, deren Ziel eine Aufgabenerfüllung ist. Um diesezu erreichen, müssen bestimmte Tätigkeiten durch Akteure ausgeführt werden [TS10].Dafür müssen neben der konkreten Aufgabe auch benötigte Kompetenzen und Fähigkei-

Rollenkonzepte im Enterprise Architecture Management 131
ten beschrieben sein, welche ein Akteur, also eine handelnde, menschliche Person oderorganisatorische Einheit, besitzen sollte [As12]. Ein Akteur kann mehrere Rollen ausü-ben, wenn er die dafür notwendigen Kompetenzen und Fähigkeiten besitzt [TS10]. Zu-dem interagieren Akteure mit anderen Akteuren, wobei die Ziele, die sie haben, sich anden Rollenbeschreibungen orientieren und um eigene Ziele ergänzt werden können.
4 RollenidentifikationDie Rollen in diesem Artikel wurden auf Grundlage von Beiträgen in Rahmenwerkenund Fachliteratur identifiziert und analysiert. Grundlage für die Identifikation war, dassRollen explizit in den Quellen genannt und beschrieben wurden. Die Beschreibungmusste mindestens eine Aufgabe, Tätigkeit oder Kompetenz beinhalten.
Enterprise Architecture Frameworks Analyse: Ausgangsbasis für die Suche nach Rollenbildete das „Enterprise Architecture Framework Kompendium“ [Ma11]. Verbreitertwurde diese Basis um in [Ma11] nicht erfasste Frameworks, wie z.B. das 2012 veröffent-lichte General Enterprise Framework (GEF) [MSB12]. In Anlehnung an [Ma11] ver-wendeten wir für unsere Untersuchungen die drei vorgeschlagenen Kategorien (1) Ma-nagement, (2) Regierung und (3) Militär, die anhand von Merkmalen in Gruppen unter-teilt wurden [Ma11]. Die weitere Analyse folgte immer dem gleichen Schema: Zunächstwurde die Verfügbarkeit des jeweiligen Frameworks geprüft. War es nicht frei zugäng-lich, wurde es von der weiteren Betrachtung ausgeschlossen. Die verbliebenen Rahmen-werke wurden auf das Vorhandensein von Rollen sowie deren Beschreibung geprüft.
(1) Management: In dieser Kategorie konnten nur bei vier Rahmenwerken Rollen inkl.Beschreibungen identifiziert werden: toolbox for Enterprise Architecture Management(t-eam), das The Open Group Architecture Framework (TOGAF) [Th11], Virtual Enter-prise Reference Architecture and Methodology (VERAM) [Ka11] und Zachman EAFramework [Za87].
(2) Militär: In diesem Bereich war der Zugriff auf mehr als die Hälfte der Rahmenwerkenicht möglich. Insgesamt wurden neun ermittelt, bei vier wurden Rollen identifiziert.Ausgeschlossen wurden jene, deren Downloads nicht öffentlich freigegeben bzw. dieweder in deutscher noch englischer Sprache verfügbar waren, wie z.B. das „Atelier deGestion de l’Architecture“ [Dé05] (nur in Französisch verfügbar). Auch das NATOArchitecture Framework konnte in der neuesten Version nicht analysiert werden, da esbisher nicht fertiggestellt ist [NA14b]. Allerdings soll es auf dem UK Ministry of De-fence Architectural Framework (MoDAF) und TOGAF basieren [NA14a], welche be-rücksichtigt wurden.
(3) öffentliche Verwaltung. Zu dieser Kategorie fanden wir sieben Frameworks, welcheunter anderem aus den Bereichen des Verkehrs- oder Gesundheitswesen stammen[Ma11]. Dennoch konnten nur zwei Frameworks identifiziert werden, da zum Beispielbei Werken die Originalquellen nicht zur Verfügung standen, wie z.B. beim TreasuryEnterprise Architecture Framework (TEAF) [Ch01]. Oder es wurde auf Personen nur
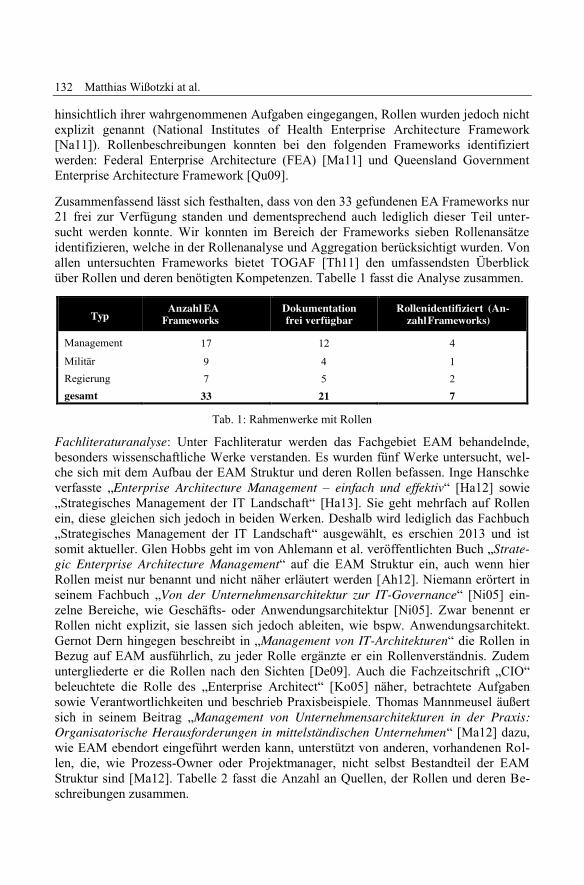
132 Matthias Wißotzki at al.
hinsichtlich ihrer wahrgenommenen Aufgaben eingegangen, Rollen wurden jedoch nichtexplizit genannt (National Institutes of Health Enterprise Architecture Framework[Na11]). Rollenbeschreibungen konnten bei den folgenden Frameworks identifiziertwerden: Federal Enterprise Architecture (FEA) [Ma11] und Queensland GovernmentEnterprise Architecture Framework [Qu09].
Zusammenfassend lässt sich festhalten, dass von den 33 gefundenen EA Frameworks nur21 frei zur Verfügung standen und dementsprechend auch lediglich dieser Teil unter-sucht werden konnte. Wir konnten im Bereich der Frameworks sieben Rollenansätzeidentifizieren, welche in der Rollenanalyse und Aggregation berücksichtigt wurden. Vonallen untersuchten Frameworks bietet TOGAF [Th11] den umfassendsten Überblicküber Rollen und deren benötigten Kompetenzen. Tabelle 1 fasst die Analyse zusammen.
Typ Anzahl EAFrameworks
Dokumentationfrei verfügbar
Rollenidentifiziert (An-zahlFrameworks)
Management 17 12 4
Militär 9 4 1Regierung 7 5 2gesamt 33 21 7
Tab. 1: Rahmenwerke mit Rollen
Fachliteraturanalyse: Unter Fachliteratur werden das Fachgebiet EAM behandelnde,besonders wissenschaftliche Werke verstanden. Es wurden fünf Werke untersucht, wel-che sich mit dem Aufbau der EAM Struktur und deren Rollen befassen. Inge Hanschkeverfasste „Enterprise Architecture Management – einfach und effektiv“ [Ha12] sowie„Strategisches Management der IT Landschaft“ [Ha13]. Sie geht mehrfach auf Rollenein, diese gleichen sich jedoch in beiden Werken. Deshalb wird lediglich das Fachbuch„Strategisches Management der IT Landschaft“ ausgewählt, es erschien 2013 und istsomit aktueller. Glen Hobbs geht im von Ahlemann et al. veröffentlichten Buch „Strate-gic Enterprise Architecture Management“ auf die EAM Struktur ein, auch wenn hierRollen meist nur benannt und nicht näher erläutert werden [Ah12]. Niemann erörtert inseinem Fachbuch „Von der Unternehmensarchitektur zur IT-Governance“ [Ni05] ein-zelne Bereiche, wie Geschäfts- oder Anwendungsarchitektur [Ni05]. Zwar benennt erRollen nicht explizit, sie lassen sich jedoch ableiten, wie bspw. Anwendungsarchitekt.Gernot Dern hingegen beschreibt in „Management von IT-Architekturen“ die Rollen inBezug auf EAM ausführlich, zu jeder Rolle ergänzte er ein Rollenverständnis. Zudemuntergliederte er die Rollen nach den Sichten [De09]. Auch die Fachzeitschrift „CIO“beleuchtete die Rolle des „Enterprise Architect“ [Ko05] näher, betrachtete Aufgabensowie Verantwortlichkeiten und beschrieb Praxisbeispiele. Thomas Mannmeusel äußertsich in seinem Beitrag „Management von Unternehmensarchitekturen in der Praxis:Organisatorische Herausforderungen in mittelständischen Unternehmen“ [Ma12] dazu,wie EAM ebendort eingeführt werden kann, unterstützt von anderen, vorhandenen Rol-len, die, wie Prozess-Owner oder Projektmanager, nicht selbst Bestandteil der EAMStruktur sind [Ma12]. Tabelle 2 fasst die Anzahl an Quellen, der Rollen und deren Be-schreibungen zusammen.
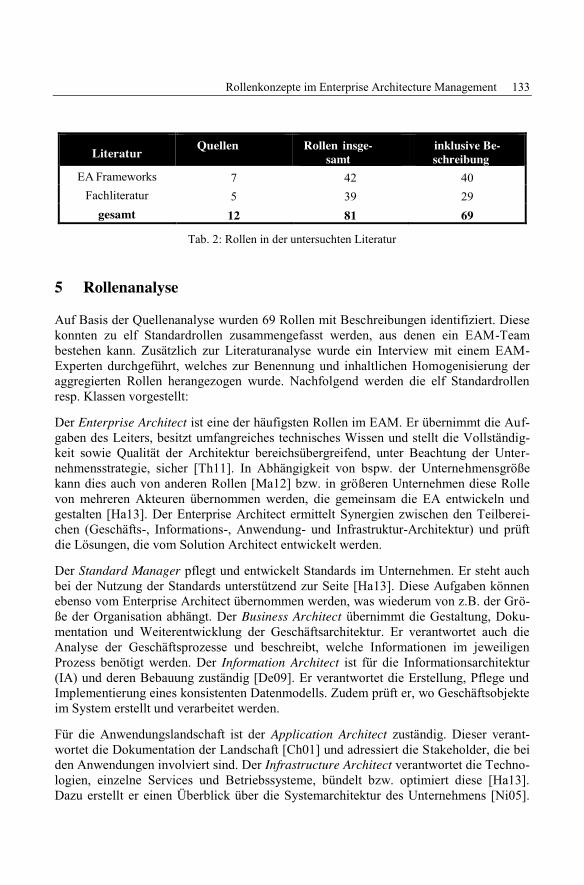
Rollenkonzepte im Enterprise Architecture Management 133
Literatur Quellen Rollen insge-samt
inklusive Be-schreibung
EA Frameworks 7 42 40Fachliteratur 5 39 29
gesamt 12 81 69Tab. 2: Rollen in der untersuchten Literatur
5 RollenanalyseAuf Basis der Quellenanalyse wurden 69 Rollen mit Beschreibungen identifiziert. Diesekonnten zu elf Standardrollen zusammengefasst werden, aus denen ein EAM-Teambestehen kann. Zusätzlich zur Literaturanalyse wurde ein Interview mit einem EAM-Experten durchgeführt, welches zur Benennung und inhaltlichen Homogenisierung deraggregierten Rollen herangezogen wurde. Nachfolgend werden die elf Standardrollenresp. Klassen vorgestellt:
Der Enterprise Architect ist eine der häufigsten Rollen im EAM. Er übernimmt die Auf-gaben des Leiters, besitzt umfangreiches technisches Wissen und stellt die Vollständig-keit sowie Qualität der Architektur bereichsübergreifend, unter Beachtung der Unter-nehmensstrategie, sicher [Th11]. In Abhängigkeit von bspw. der Unternehmensgrößekann dies auch von anderen Rollen [Ma12] bzw. in größeren Unternehmen diese Rollevon mehreren Akteuren übernommen werden, die gemeinsam die EA entwickeln undgestalten [Ha13]. Der Enterprise Architect ermittelt Synergien zwischen den Teilberei-chen (Geschäfts-, Informations-, Anwendung- und Infrastruktur-Architektur) und prüftdie Lösungen, die vom Solution Architect entwickelt werden.
Der Standard Manager pflegt und entwickelt Standards im Unternehmen. Er steht auchbei der Nutzung der Standards unterstützend zur Seite [Ha13]. Diese Aufgaben könnenebenso vom Enterprise Architect übernommen werden, was wiederum von z.B. der Grö-ße der Organisation abhängt. Der Business Architect übernimmt die Gestaltung, Doku-mentation und Weiterentwicklung der Geschäftsarchitektur. Er verantwortet auch dieAnalyse der Geschäftsprozesse und beschreibt, welche Informationen im jeweiligenProzess benötigt werden. Der Information Architect ist für die Informationsarchitektur(IA) und deren Bebauung zuständig [De09]. Er verantwortet die Erstellung, Pflege undImplementierung eines konsistenten Datenmodells. Zudem prüft er, wo Geschäftsobjekteim System erstellt und verarbeitet werden.
Für die Anwendungslandschaft ist der Application Architect zuständig. Dieser verant-wortet die Dokumentation der Landschaft [Ch01] und adressiert die Stakeholder, die beiden Anwendungen involviert sind. Der Infrastructure Architect verantwortet die Techno-logien, einzelne Services und Betriebssysteme, bündelt bzw. optimiert diese [Ha13].Dazu erstellt er einen Überblick über die Systemarchitektur des Unternehmens [Ni05].
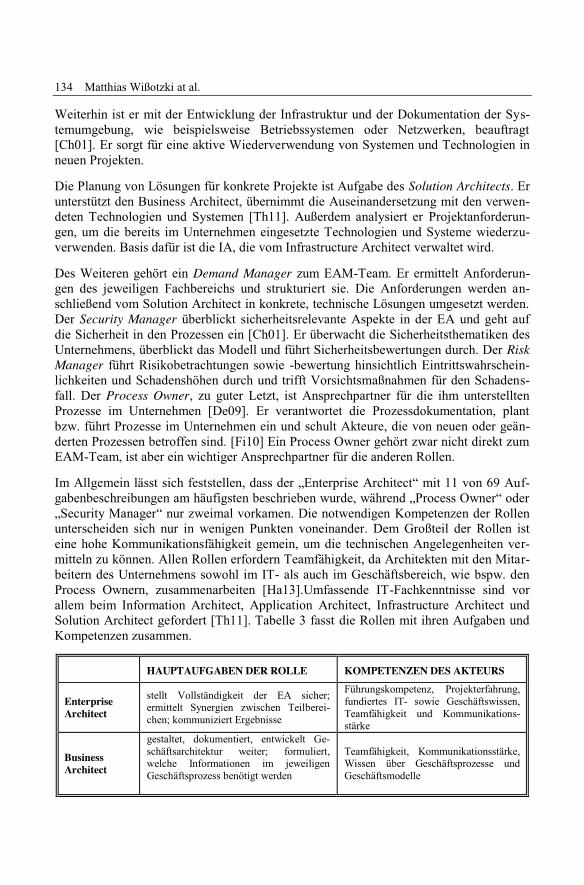
134 Matthias Wißotzki at al.
Weiterhin ist er mit der Entwicklung der Infrastruktur und der Dokumentation der Sys-temumgebung, wie beispielsweise Betriebssystemen oder Netzwerken, beauftragt[Ch01]. Er sorgt für eine aktive Wiederverwendung von Systemen und Technologien inneuen Projekten.
Die Planung von Lösungen für konkrete Projekte ist Aufgabe des Solution Architects. Erunterstützt den Business Architect, übernimmt die Auseinandersetzung mit den verwen-deten Technologien und Systemen [Th11]. Außerdem analysiert er Projektanforderun-gen, um die bereits im Unternehmen eingesetzte Technologien und Systeme wiederzu-verwenden. Basis dafür ist die IA, die vom Infrastructure Architect verwaltet wird.
Des Weiteren gehört ein Demand Manager zum EAM-Team. Er ermittelt Anforderun-gen des jeweiligen Fachbereichs und strukturiert sie. Die Anforderungen werden an-schließend vom Solution Architect in konkrete, technische Lösungen umgesetzt werden.Der Security Manager überblickt sicherheitsrelevante Aspekte in der EA und geht aufdie Sicherheit in den Prozessen ein [Ch01]. Er überwacht die Sicherheitsthematiken desUnternehmens, überblickt das Modell und führt Sicherheitsbewertungen durch. Der RiskManager führt Risikobetrachtungen sowie -bewertung hinsichtlich Eintrittswahrschein-lichkeiten und Schadenshöhen durch und trifft Vorsichtsmaßnahmen für den Schadens-fall. Der Process Owner, zu guter Letzt, ist Ansprechpartner für die ihm unterstelltenProzesse im Unternehmen [De09]. Er verantwortet die Prozessdokumentation, plantbzw. führt Prozesse im Unternehmen ein und schult Akteure, die von neuen oder geän-derten Prozessen betroffen sind. [Fi10] Ein Process Owner gehört zwar nicht direkt zumEAM-Team, ist aber ein wichtiger Ansprechpartner für die anderen Rollen.
Im Allgemein lässt sich feststellen, dass der „Enterprise Architect“ mit 11 von 69 Auf-gabenbeschreibungen am häufigsten beschrieben wurde, während „Process Owner“ oder„Security Manager“ nur zweimal vorkamen. Die notwendigen Kompetenzen der Rollenunterscheiden sich nur in wenigen Punkten voneinander. Dem Großteil der Rollen isteine hohe Kommunikationsfähigkeit gemein, um die technischen Angelegenheiten ver-mitteln zu können. Allen Rollen erfordern Teamfähigkeit, da Architekten mit den Mitar-beitern des Unternehmens sowohl im IT- als auch im Geschäftsbereich, wie bspw. denProcess Ownern, zusammenarbeiten [Ha13].Umfassende IT-Fachkenntnisse sind vorallem beim Information Architect, Application Architect, Infrastructure Architect undSolution Architect gefordert [Th11]. Tabelle 3 fasst die Rollen mit ihren Aufgaben undKompetenzen zusammen.
HAUPTAUFGABEN DER ROLLE KOMPETENZEN DES AKTEURS
EnterpriseArchitect
stellt Vollständigkeit der EA sicher;ermittelt Synergien zwischen Teilberei-chen; kommuniziert Ergebnisse
Führungskompetenz, Projekterfahrung,fundiertes IT- sowie Geschäftswissen,Teamfähigkeit und Kommunikations-stärke
BusinessArchitect
gestaltet, dokumentiert, entwickelt Ge-schäftsarchitektur weiter; formuliert,welche Informationen im jeweiligenGeschäftsprozess benötigt werden
Teamfähigkeit, Kommunikationsstärke,Wissen über Geschäftsprozesse undGeschäftsmodelle
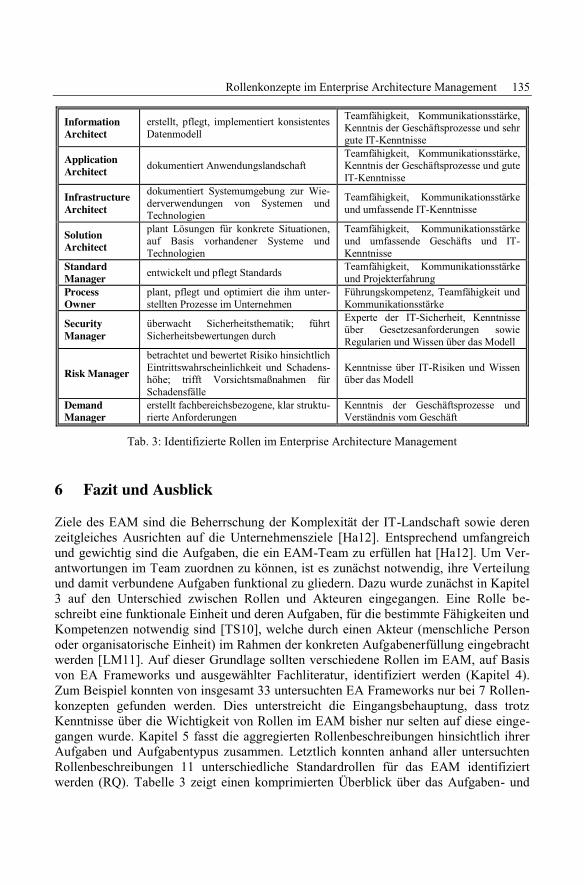
Rollenkonzepte im Enterprise Architecture Management 135
InformationArchitect
erstellt, pflegt, implementiert konsistentesDatenmodell
Teamfähigkeit, Kommunikationsstärke,Kenntnis der Geschäftsprozesse und sehrgute IT-Kenntnisse
ApplicationArchitect dokumentiert Anwendungslandschaft
Teamfähigkeit, Kommunikationsstärke,Kenntnis der Geschäftsprozesse und guteIT-Kenntnisse
InfrastructureArchitect
dokumentiert Systemumgebung zur Wie-derverwendungen von Systemen undTechnologien
Teamfähigkeit, Kommunikationsstärkeund umfassende IT-Kenntnisse
SolutionArchitect
plant Lösungen für konkrete Situationen,auf Basis vorhandener Systeme undTechnologien
Teamfähigkeit, Kommunikationsstärkeund umfassende Geschäfts und IT-Kenntnisse
StandardManager entwickelt und pflegt Standards Teamfähigkeit, Kommunikationsstärke
und ProjekterfahrungProcessOwner
plant, pflegt und optimiert die ihm unter-stellten Prozesse im Unternehmen
Führungskompetenz, Teamfähigkeit undKommunikationsstärke
SecurityManager
überwacht Sicherheitsthematik; führtSicherheitsbewertungen durch
Experte der IT-Sicherheit, Kenntnisseüber Gesetzesanforderungen sowieRegularien und Wissen über das Modell
Risk Managerbetrachtet und bewertet Risiko hinsichtlichEintrittswahrscheinlichkeit und Schadens-höhe; trifft Vorsichtsmaßnahmen fürSchadensfälle
Kenntnisse über IT-Risiken und Wissenüber das Modell
DemandManager
erstellt fachbereichsbezogene, klar struktu-rierte Anforderungen
Kenntnis der Geschäftsprozesse undVerständnis vom Geschäft
Tab. 3: Identifizierte Rollen im Enterprise Architecture Management
6 Fazit und AusblickZiele des EAM sind die Beherrschung der Komplexität der IT-Landschaft sowie derenzeitgleiches Ausrichten auf die Unternehmensziele [Ha12]. Entsprechend umfangreichund gewichtig sind die Aufgaben, die ein EAM-Team zu erfüllen hat [Ha12]. Um Ver-antwortungen im Team zuordnen zu können, ist es zunächst notwendig, ihre Verteilungund damit verbundene Aufgaben funktional zu gliedern. Dazu wurde zunächst in Kapitel3 auf den Unterschied zwischen Rollen und Akteuren eingegangen. Eine Rolle be-schreibt eine funktionale Einheit und deren Aufgaben, für die bestimmte Fähigkeiten undKompetenzen notwendig sind [TS10], welche durch einen Akteur (menschliche Personoder organisatorische Einheit) im Rahmen der konkreten Aufgabenerfüllung eingebrachtwerden [LM11]. Auf dieser Grundlage sollten verschiedene Rollen im EAM, auf Basisvon EA Frameworks und ausgewählter Fachliteratur, identifiziert werden (Kapitel 4).Zum Beispiel konnten von insgesamt 33 untersuchten EA Frameworks nur bei 7 Rollen-konzepten gefunden werden. Dies unterstreicht die Eingangsbehauptung, dass trotzKenntnisse über die Wichtigkeit von Rollen im EAM bisher nur selten auf diese einge-gangen wurde. Kapitel 5 fasst die aggregierten Rollenbeschreibungen hinsichtlich ihrerAufgaben und Aufgabentypus zusammen. Letztlich konnten anhand aller untersuchtenRollenbeschreibungen 11 unterschiedliche Standardrollen für das EAM identifiziertwerden (RQ). Tabelle 3 zeigt einen komprimierten Überblick über das Aufgaben- und
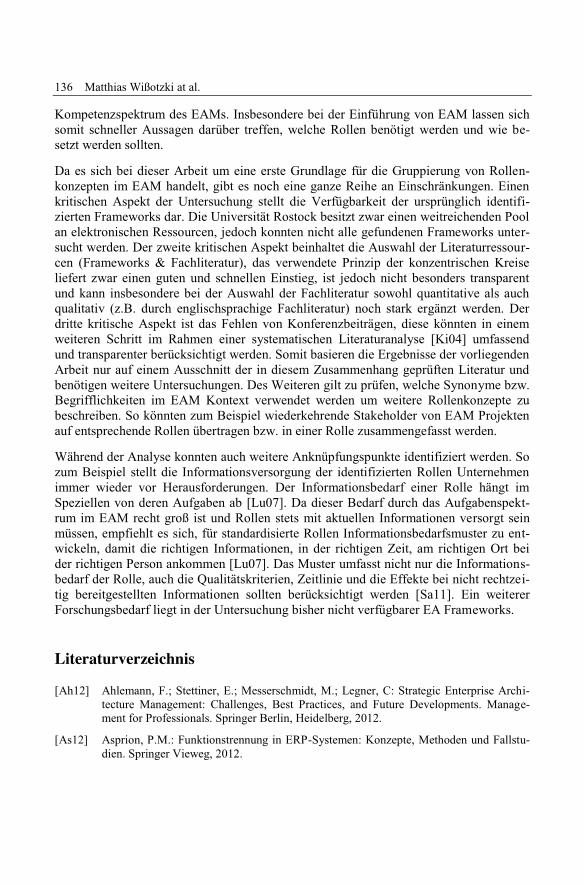
136 Matthias Wißotzki at al.
Kompetenzspektrum des EAMs. Insbesondere bei der Einführung von EAM lassen sichsomit schneller Aussagen darüber treffen, welche Rollen benötigt werden und wie be-setzt werden sollten.
Da es sich bei dieser Arbeit um eine erste Grundlage für die Gruppierung von Rollen-konzepten im EAM handelt, gibt es noch eine ganze Reihe an Einschränkungen. Einenkritischen Aspekt der Untersuchung stellt die Verfügbarkeit der ursprünglich identifi-zierten Frameworks dar. Die Universität Rostock besitzt zwar einen weitreichenden Poolan elektronischen Ressourcen, jedoch konnten nicht alle gefundenen Frameworks unter-sucht werden. Der zweite kritischen Aspekt beinhaltet die Auswahl der Literaturressour-cen (Frameworks & Fachliteratur), das verwendete Prinzip der konzentrischen Kreiseliefert zwar einen guten und schnellen Einstieg, ist jedoch nicht besonders transparentund kann insbesondere bei der Auswahl der Fachliteratur sowohl quantitative als auchqualitativ (z.B. durch englischsprachige Fachliteratur) noch stark ergänzt werden. Derdritte kritische Aspekt ist das Fehlen von Konferenzbeiträgen, diese könnten in einemweiteren Schritt im Rahmen einer systematischen Literaturanalyse [Ki04] umfassendund transparenter berücksichtigt werden. Somit basieren die Ergebnisse der vorliegendenArbeit nur auf einem Ausschnitt der in diesem Zusammenhang geprüften Literatur undbenötigen weitere Untersuchungen. Des Weiteren gilt zu prüfen, welche Synonyme bzw.Begrifflichkeiten im EAM Kontext verwendet werden um weitere Rollenkonzepte zubeschreiben. So könnten zum Beispiel wiederkehrende Stakeholder von EAM Projektenauf entsprechende Rollen übertragen bzw. in einer Rolle zusammengefasst werden.
Während der Analyse konnten auch weitere Anknüpfungspunkte identifiziert werden. Sozum Beispiel stellt die Informationsversorgung der identifizierten Rollen Unternehmenimmer wieder vor Herausforderungen. Der Informationsbedarf einer Rolle hängt imSpeziellen von deren Aufgaben ab [Lu07]. Da dieser Bedarf durch das Aufgabenspekt-rum im EAM recht groß ist und Rollen stets mit aktuellen Informationen versorgt seinmüssen, empfiehlt es sich, für standardisierte Rollen Informationsbedarfsmuster zu ent-wickeln, damit die richtigen Informationen, in der richtigen Zeit, am richtigen Ort beider richtigen Person ankommen [Lu07]. Das Muster umfasst nicht nur die Informations-bedarf der Rolle, auch die Qualitätskriterien, Zeitlinie und die Effekte bei nicht rechtzei-tig bereitgestellten Informationen sollten berücksichtigt werden [Sa11]. Ein weitererForschungsbedarf liegt in der Untersuchung bisher nicht verfügbarer EA Frameworks.
Literaturverzeichnis[Ah12] Ahlemann, F.; Stettiner, E.; Messerschmidt, M.; Legner, C: Strategic Enterprise Archi-
tecture Management: Challenges, Best Practices, and Future Developments. Manage-ment for Professionals. Springer Berlin, Heidelberg, 2012.
[As12] Asprion, P.M.: Funktionstrennung in ERP-Systemen: Konzepte, Methoden und Fallstu-dien. Springer Vieweg, 2012.
Rollenkonzepte im Enterprise Architecture Management 137
[Br07] Braun, C.: Modellierung der Unternehmensarchitektur: Weiterentwicklung einer beste-henden Methode und deren Abbildung in einem Meta-Modellierungswerkzeug. Disserta-tion, Universität St. Gallen, Hochschule für Wirtschafts-, Rechts- und Sozialwissen-schaften, St. Gallen, 2007, Zugriff: 3.8.2014 - 20:45.
[Ch01] Chief Information Officer Council: A Practical Guide to Federal Enterprise Architecture,2001. www.enterprise-architecture.info/Images/Documents/Federal%20Enterprise%20Architecture%20Guide%20v1a.pdf, Zugriff: 20.8.2014 - 13:52.
[Dé05] Délégation Générale pour l’Armement: Manuel de référence AGATE V3, 2005.www.achats.defense.gouv.fr/IMG/zip/Guide_S-CAT_n10002_Ed_01_sans-.NET.zip,Zugriff: 16.8.2014 - 10:10.
[De09] Dern, G.: Management von IT-Architekturen. Springer Fachmedien, Wiesbaden, 2009.
[Fi10] Fischermanns, G.: Praxishandbuch Prozessmanagement, Band 9 der Reihe ibo-Schriftenreihe. G. Schmidt, Gießen, 9. Auflage, 2010.
[Ha12] Hanschke, I.: Enterprise Architecture Management - einfach und effektiv: Ein prakti-scher Leitfaden für die Einführung von EAM. Hanser, München, 2012.
[Ha13] Hanschke, I.: Strategisches Management der IT-Landschaft: Ein praktischer Leitfadenfür das Enterprise Architecture Management. Hanser, München, 3. Auflage, 2013.
[Ka11] Kazi, Abdul, Matti Hannus, Jarmo Laitinen und Olli Nummelin: Distributed Engineeringin Construction: Findings from the IMS GLOBEMEN PROJECT, 2011.www.itcon.org/2001/10/paper.pdf, Zugriff: 8.8.2014 - 12:34.
[Ki04] Kitchenham, B.: Procedures for performing systematic reviews. Keele, UK, Keele Uni-versity 33, 2004.
[Ko05] Koch, C.: A new blueprint for the enterprise. CIO, Ausgabe 1. März 2005, Band 18 Nr.10, Seiten 39–50, 2005.
[LM11] Lüdtke, N.; Matsuzaki, H.: Akteur - Individuum - Subjekt: Fragen zu ‚Personalität‘ und‚Sozialität‘. VS Verlag für Sozialwissenschaften / Springer Fachmedien, Wiesbaden,2011.
[Lu07] Lundqvist, M.: Information Demand and Use: Improving Information Flow withinSmall-scale Business Contexts, Linköping University, Sweden, 2007. liu.diva-portal.org/smash/get/ diva2:24074/FULLTEXT01.pdf, Zugriff: 12.8.2014 - 12:50.
[Ma12] Mannmeusel, T.: Management von Unternehmensarchitekturen in der Praxis: Organisa-torische Herausforderungen in mittelständischen Unternehmen. In: Suchan, Christianund Jochen Frank (Herausgeber): Analyse und Gestaltung leistungsfähiger IS-Architekturen, Seiten 35–57. Springer Berlin Heidelberg, 2012.
[Ma11] Matthes, D.: Enterprise Architecture Frameworks Kompendium: Über 50 Rahmenwerkefür das IT-Management. Xpert.press. Springer-Verlag Berlin Heidelberg, 2011.
[MSB12] Mottal, G.; Sacco, D.; Barroero, T.: General Enterprise Framework (GEF). IEEE Inter-national Conference on Service Operations and Logistics, and Informatics (SOLI), 2012,Seiten 54–59. IEEE, Piscataway, NJ, 2012.
[Na11] National Institutes of Health: Guide to NIH Enterprise Architecture, 2011.https://enterprisearchitecture.nih.gov/Pages/guide.aspx, Zugriff: 20.8.2014 - 14:24.
138 Matthias Wißotzki at al.
[NA14a] NATO: Methodology | NATO Architecture Framework v4.0 Documentation (draft),2014. nafdocs.org/methodology/, Zugriff: 25.8.2014 - 13:40.
[NA14b] NATO: NATO Architecture Framework v4.0 Documentation (draft), 2014. nafdocs.org/,Zugriff: 16.8.2014 - 21:13.
[Ni05] Niemann, K. D.: Von der Unternehmensarchitektur zur IT-Governance: Bausteine fürein wirksames IT-Management. Edition CIO. Vieweg + Teubner (GWV), 2005.
[Ni10] Niedermair, K.: Recherchieren und Dokumentieren: Der richtige Umgang mit Literaturim Studium, Band 3356 UVK-Verl.-Ges, Konstanz, 2010.
[Qu09] Queensland Government Chief Information Office (2009): DRAFT QueenslandGovernment Enterprise Architecture Framework 2.0 The State of Queensland (Depart-ment of Public Works).
[TBS00] Thomas, R.; Beamer, R.; Sowell, P.: Civilian Application of the DOD C4ISR Architec-ture Framework: A Treasury Department Case Study, dodccrp.org) 2000, Zugriff:20.8.2014 - 17:14.
[Ro09] Rohloff, M.: Integrierte Gestaltung von Unternehmensorganisation und IT. Gito, 2009.
[Sa11] Sandkuhl, K. (Herausgeber): Information Demand Patterns: Capturing OrganizationalKnowledge about Information Flow. Patterns 2011: The Third International Conferenceon Pervasive Patterns and Applications, 2011.
[Sa13] Sandberg, B.: Wissenschaftlich Arbeiten von Abbildung bis Zitat: Lehr- und Übungs-buch für Bachelor, Master und Promotion. Oldenbourg, München, 2 Auflage, 2013.
[So14] Software AG: ARIS-Methode: Methodenhandbuch Version 9.6, 2014. Zugriff:14.7.2014 - 16:03.
[Th11] The Open Group: TOGAF Version 9.1. Van Haren Publ, Zaltbommel, 2011.
[TS10] Tsolkas, A.; Schmidt, K.: Rollen und Berechtigungskonzepte: Ansätze für das Identity-und Access Management im Unternehmen. Vieweg+Teubner (GWV), 2010.
[Un14] Uni Rostock: Literaturverwaltung mit Citavi, 2014, www.ub.uni-rostock.de/ub/xServices/citavi_xde.shtml, Zugriff: 4.8.2014 - 7:24.
[Vo11] Voss, R.: Wissenschaftliches Arbeiten... leicht verständlich: Mit 86 Abbildungen undÜbersichten, Band 844,7 UVK-Verl.-Ges, Konstanz, 2 Auflage, 2011.
[We11] Weber, M.: Enterprise Architecture Management - neue Disziplin für die ganzheitlicheUnternehmensentwicklung, 2011, www.bitkom.org/files/documents/EAM_ Enterpri-se_Architecture_Management_-_BITKOM_Leitfaden.pdf, Zugriff: 29.8.2014 - 19:16.
[WS12] Wißotzki, M.; Sonnenberger, A.: Enterprise Architecture Management - State of Rese-arch Analysis & A Comparison of Selected Approaches. PoeM, 2012.
[Wi15] Wißotzki, M.: The Capability Management Process - Finding Your Way into CapabilityEngineering. In Simon, D.; Schmidt, C. (Eds.): Business Architecture Management -Architecting the Business for Consistency and Alignment; To be published by Springerin the series "Management Professionals", 2015.
[Za87] Zachman, John: A framework for information systems architecture. IBM Systems Jour-nal VOL 26, No 3 S. 276-292.
Alfred Zimmermann, Alexander Rossmann (Hrsg.): Digital Enterprise Computing 2015,Lecture Notes in Informatics (LNI), Gesellschaft für Informatik, Bonn 2015 139
Enterprise Architecture Management for theInternet of Things
Alfred Zimmermann1, Rainer Schmidt2, Kurt Sandkuhl3,Dierk Jugel1,3, Michael Möhring4 and Matthias Wißotzki3
Abstract: The Internet of Things (IoT) fundamentally influences today’s digital strategies withdisruptive business operating models and fast changing markets. New business information sys-tems are integrating emerging Internet of Things infrastructures and components. With the hugediversity of Internet of Things technologies and products organizations have to leverage and ex-tend previous enterprise architecture efforts to enable business value by integrating the Internet ofThings into their evolving Enterprise Architecture Management environments. Both architectureengineering and management of current enterprise architectures is complex and has to integratebeside the Internet of Things synergistic disciplines like EAM - Enterprise Architecture and Man-agement with disciplines like: services & cloud computing, semantic-based decision supportthrough ontologies and knowledge-based systems, big data management, as well as mobility andcollaboration networks. To provide adequate decision support for complex business/IT environ-ments, it is necessary to identify affected changes of Internet of Things environments and theirrelated fast adapting architecture. We have to make transparent the impact of these changes overthe integral landscape of affected EAM-capabilities, like directly and transitively impacted IoT-objects, business categories, processes, applications, services, platforms and infrastructures. Thepaper describes a new metamodel-based approach for integrating partial Internet of Things objects,which are semi-automatically federated into a holistic Enterprise Architecture Management envi-ronment.
Keywords: Internet of Things, Enterprise Reference Architecture, Architecture Integration Meth-od, Architecture Metamodel and Ontology
1 IntroductionOne of the most challenging objects for our current discussion about the digital trans-formation of our society is the Internet of Things (IoT) [Wa14] and [Pa15]. The Internetof Things enables a large number of physical devices to connect each other to performwireless data communication and interaction using the Internet as a global communica-tion environment. Information and data are central components of our everyday activi-ties. Social networks, smart portable devices, and intelligent cars, represent a few in-stances of a pervasive, information-driven vision of current enterprise systems with IoTand service-oriented enterprise architectures. Social graph analysis and management, big
1 Reutlingen University, {alfred.zimmermann, dierk.jugel}@reutlingen-university.de}2 Munich University, {[email protected]}3 University of Rostock, {[email protected]}4 Aalen University, {[email protected]}
140 Alfred Zimmermann et al.
data, and cloud data management, ontological modeling, smart devices, personal infor-mation systems, hard non-functional requirements, such as location-independent re-sponse times and privacy, are challenging aspects of the above software architecture[BCK13].
Service-oriented systems close the business - IT gap by delivering appropriate businessfunctionality efficiently and integrating new service types coming from the Internet ofThings [Gu13], [Sp09] and from cloud services environments [Be11], [OG11] and[CSA09]. As the architecture of Internet of Things systems becomes more complex, andwe are going rapidly into cloud computing settings, we need a new and improved set ofmethodological well-supported instruments of Enterprise Architecture Management,which are associated with tools for managing, decision support, diagnostics and for op-timization of impacted business models and information systems.
The current state of art research for the Internet of Things architecture [Pa15] lacks anintegral understanding of Enterprise Architecture and Management [Ia15], [Jo14],[To11] and [Ar12] and shows an abundant set of physical-related standards, methods andtools, and a fast growing magnitude of heterogeneous IoT devices. The aim of our re-search is to close this gap and enhance analytical instruments for cyclic evaluations ofbusiness and system architectures of integrated Internet of Things environments. Noveltechnologies demand an increased permeability between “inside” and “outside” of theborders of the classic enterprise system with traditional Enterprise Architecture Man-agement. In this paper we are concentrating on following concrete research questions:
RQ1: What are new architectural elements and constraints for the Internet of Things?
RQ2: What is the blueprint for an extended Enterprise Reference Architecture, which isable to host even new and small type of architectural description for the Internet ofThings?
RQ3: How looks am mapping scheme for the Internet of Things Reference Architectureinto a holistic and adaptable Enterprise Reference Architecture?
In this paper we make the following contributions and extend our service-oriented enter-prise architecture reference model in the context of a new tailored architecture metamod-el integration approach and ontology as fundamental solution elements for an integralEnterprise Architecture of the Internet of Things. We are revisiting and evolving our firstversion of ESARC–Enterprise Services Architecture Reference Cube [Zi11], [Zi13b].Our research aims to investigate a metamodel-based model extraction and integrationapproach for enterprise architecture viewpoints, models, standards, frameworks and toolsfor the high fragmented Internet of Things. The integration of many dynamically grow-ing distributed Internet of Things objects into an effective and consistent EnterpriseArchitecture Management is challenging. Currently we are working on the idea of inte-grating small EA descriptions for each relevant IoT object. These EA-IoT-Mini-Descriptions consists of partial EA IoT data and partial EA IoT models and metamodels.Our goal is to be able to support an integral architecture development, assessments, ar-
Enterprise Architecture Management for the Internet of Things 141
chitecture diagnostics, monitoring with decision support, and optimization of the busi-ness, information systems, and technologies. We report about our work in progress re-search to provide a unified ontology-based methodology for adaptable digital enterprisearchitecture models from relevant information resources, especially for the Internet ofThings.
The following Section 2 describes our research platform with fundamental concepts ofthe Internet of Things. The following Section 3 presents our holistic reference architec-ture for Enterprise Architecture Management. Section 4 revisits and extends previousresearch about architectural integration and federation methods. Finally Section 5 con-cludes our main results and provides an outlook for our work in progress.
2 The Internet of ThingsThe Internet of Things (IoT) fundamentally revolutionizes today’s digital strategies withdisruptive business operating models [WR04], and holistic governance models for busi-ness and IT [Ro06], in context of current fast changing markets [Wa14]. With the hugediversity of Internet of Things technologies and products organizations have to leverageand extend previous enterprise architecture efforts to enable business value by integrat-ing the Internet of Things into their classic business and computational environments.Reasons for strategic changes by the Internet of Things [Wa14] are:
" Information of everything – enables information about what customers really de-mand,
" Shift from the thing to the composition – the power of the IoT results form theunique composition of things in an always-on always-connected environment,
" Convergence – integrates people, things, places, and information,
" Next-level business – the Internet of Things is changing existing business capabili-ties by providing a way to interact, measure, operate, and analyze business.
The Internet of Things is the result of a convergence of visions [At10] like, a Things-oriented vision, an Internet-oriented vision, and a Semantic-oriented vision. The Internetof Things supports many connected physical devices over the Internet as a global com-munication platform. A cloud centric vision for architectural thinking of a ubiquitoussensing environment is provided by [Gu13]. The typical configuration of the Internet ofThings includes besides many communicating devices a cloud-based server architecture,which is required to interact and perform remote data management and calculations.
Sensors, actuators, devices as well as humans and software agents interact and com-municate data to implement specific tasks or more sophisticated business or technicalprocesses. The Internet of Things maps and integrates real world objects into the virtualworld, and extends the interaction with mobility systems, collaboration support systems,and systems and services for big data and cloud environments. Furthermore, the Internet
142 Alfred Zimmermann et al.
of Things is a very important influence factor of the potential use of Industry 4.0[Sc15b]. Therefore, smart products as well as their production is supported by the Inter-net of Things and can help enterprises to create more customer-oriented products.
A main question of current and further research is, how the Internet of Things architec-ture fits in a context of a services-based enterprise-computing environment? A service-oriented integration approach for the Internet of Things was elaborated in [Sp09]. Thecore idea for millions of cooperating devices is, how they can be flexibly connected toform useful advanced collaborations within the business processes of an enterprise. Theresearch in [Sp09] proposes the SOCRADES architecture for an effective integration ofInternet of Things in enterprise services. The architecture from [Sp09] abstracts the het-erogeneity of embedded systems, their hardware devices, software, data formats andcommunication protocols. A layered architecture structures following bottom-up func-tionalities and prepares these layers for integration within an Internet of Things focusedenterprise architecture: Devices Layer, Platform Abstraction Layer, Security Layer,Device Management Layer with Monitoring and Inventory Services, and Service Lifecy-cle Management, Service Management Layer, and the Application Interface Layer.
Today, the Internet of Things includes a multitude of technologies and specific applica-tion scenarios of ubiquitous computing [At10], like wireless and Bluetooth sensors,Internet-connected wearable systems, low power embedded systems, RFID tracking,smartphones, which are connected with real world interaction devices, smart homes andcars, and other SmartLife scenarios. To integrate all aspects and requirements of theInternet of Things is difficult, because no single architecture can support today the dy-namics of adding and extracting these capabilities. A first Reference Architecture (RA)for the Internet of Things is proposed by [WS15] and can be mapped to a set of opensource products. This Reference Architecture covers aspects like: cloud server-side ar-chitecture, monitoring and management of Internet of Things devices and services, aspecific lightweight RESTful communication system, and agent and code on often-smalllow power devices, having probably only intermittent connections.
The Internet of Thing architecture has to support a set of generic as well as some specificrequirements [WS15], and [Pa15]. Generic requirements result from the inherent connec-tion of a magnitude of devices via the Internet, often having to cross firewalls and otherobstacles. Having to consider so many and a dynamic growing number of devices weneed an architecture for scalability. Because these devices should be active in a 24x7timeframe we need a high-availability approach [Ga12], with deployment and auto-switching across cooperating datacenters in case of disasters and high scalable pro-cessing demands. Additionally an Internet of Thing architecture has to support automaticmanaged updates and remotely managed devices. Often connected devices collect andanalyze personal or security relevant data. Therefore it is mandatory to support identitymanagement, access control and security management on different levels: from the con-nected devices through the holistic controlled environment.
Specific architectural requirements [WS15] and [At10] result from key categories, suchas connectivity and communications, device management, data collection and analysis,
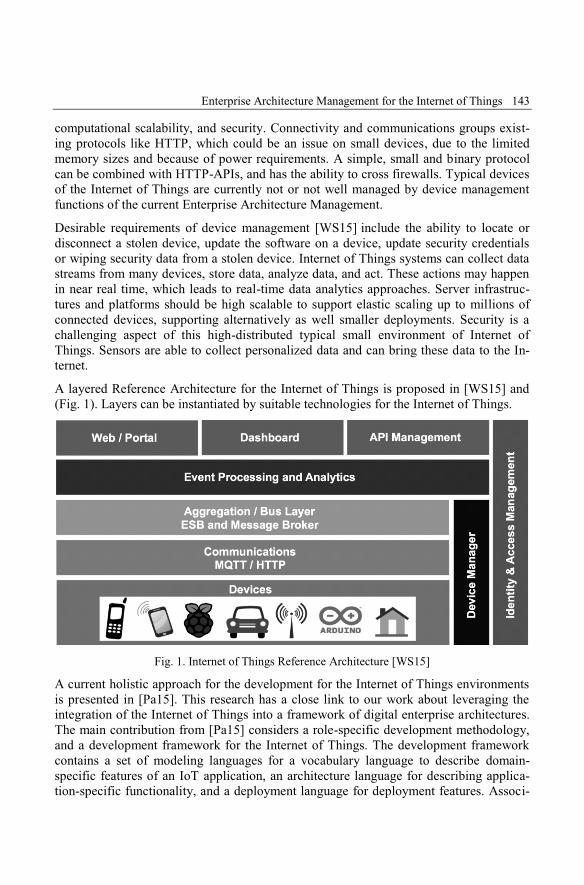
Enterprise Architecture Management for the Internet of Things 143
computational scalability, and security. Connectivity and communications groups exist-ing protocols like HTTP, which could be an issue on small devices, due to the limitedmemory sizes and because of power requirements. A simple, small and binary protocolcan be combined with HTTP-APIs, and has the ability to cross firewalls. Typical devicesof the Internet of Things are currently not or not well managed by device managementfunctions of the current Enterprise Architecture Management.
Desirable requirements of device management [WS15] include the ability to locate ordisconnect a stolen device, update the software on a device, update security credentialsor wiping security data from a stolen device. Internet of Things systems can collect datastreams from many devices, store data, analyze data, and act. These actions may happenin near real time, which leads to real-time data analytics approaches. Server infrastruc-tures and platforms should be high scalable to support elastic scaling up to millions ofconnected devices, supporting alternatively as well smaller deployments. Security is achallenging aspect of this high-distributed typical small environment of Internet ofThings. Sensors are able to collect personalized data and can bring these data to the In-ternet.
A layered Reference Architecture for the Internet of Things is proposed in [WS15] and(Fig. 1). Layers can be instantiated by suitable technologies for the Internet of Things.
Fig. 1. Internet of Things Reference Architecture [WS15]
A current holistic approach for the development for the Internet of Things environmentsis presented in [Pa15]. This research has a close link to our work about leveraging theintegration of the Internet of Things into a framework of digital enterprise architectures.The main contribution from [Pa15] considers a role-specific development methodology,and a development framework for the Internet of Things. The development frameworkcontains a set of modeling languages for a vocabulary language to describe domain-specific features of an IoT application, an architecture language for describing applica-tion-specific functionality, and a deployment language for deployment features. Associ-
144 Alfred Zimmermann et al.
ated with this language set are suitable automation techniques for code generation, andlinking to reduce the effort for developing and operating device-specific code. The met-amodel for Internet of Things applications from [Pa15] defines elements of an Internet ofThings architectural reference model like, IoT resources of type: sensor, actuator, stor-age, and user interface. Internet of Thing resources and their associated physical devicesare differentiated in the context of locations and regions. A device provides the capabil-ity to interact with users or with other devices. The base functionality of Internet ofThings resources is provided by software components, which are handled in a service-oriented way by using computational services.
3 Enterprise Reference ArchitectureOur principal contribution is an extended approach about the systematic composition andintegration of architectural metamodels, ontologies, views and viewpoints within adapt-able service-oriented enterprise architecture frameworks for services and cloud compu-ting architectures, by means of different integrated service types and architecture capa-bilities. ESARC - Enterprise Services Architecture Reference Cube, [Zi11], [Zi13b] and[Zi14] is an integral service-oriented enterprise architecture categorization framework,which sets a classification scheme for main enterprise architecture models, as a guidinginstrument for concrete decisions in architectural engineering viewpoints. We are cur-rently integrating metamodels for EAM and the Internet of Things.
The ESARC – Enterprise Services Architecture Reference Cube [Zi11] and [Zi13b] (seeFig. 1) completes existing architectural standards and frameworks in the context of EAM– Enterprise Architecture Management [To11], [Be12] and [La13], [Ar12] and extendsthese architecture standards for services and cloud computing in a more specific practicalway. ESARC is an original architecture reference model, which provides a holistic clas-sification model with eight integral architectural domains. ESARC abstracts from a con-crete business scenario or technologies, but is applicable for concrete architectural in-stantiations.
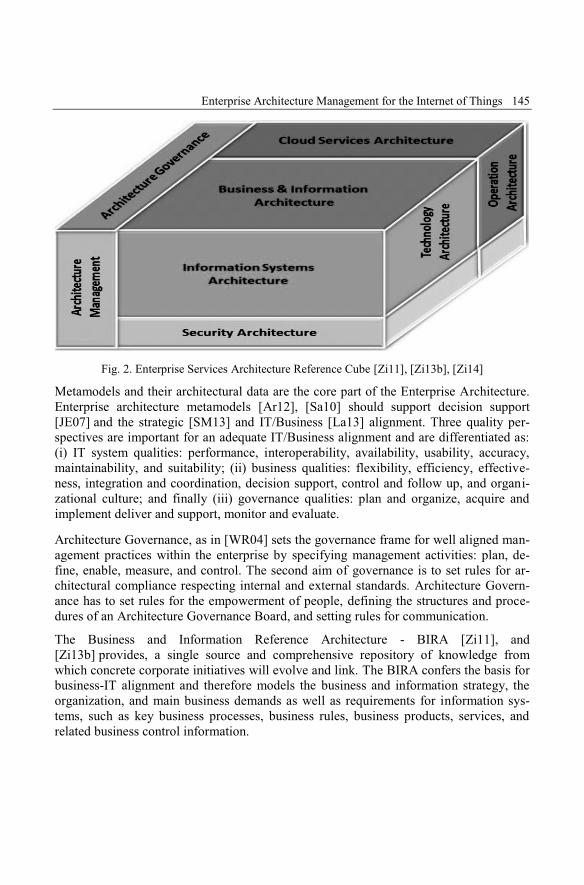
Enterprise Architecture Management for the Internet of Things 145
Fig. 2. Enterprise Services Architecture Reference Cube [Zi11], [Zi13b], [Zi14]
Metamodels and their architectural data are the core part of the Enterprise Architecture.Enterprise architecture metamodels [Ar12], [Sa10] should support decision support[JE07] and the strategic [SM13] and IT/Business [La13] alignment. Three quality per-spectives are important for an adequate IT/Business alignment and are differentiated as:(i) IT system qualities: performance, interoperability, availability, usability, accuracy,maintainability, and suitability; (ii) business qualities: flexibility, efficiency, effective-ness, integration and coordination, decision support, control and follow up, and organi-zational culture; and finally (iii) governance qualities: plan and organize, acquire andimplement deliver and support, monitor and evaluate.
Architecture Governance, as in [WR04] sets the governance frame for well aligned man-agement practices within the enterprise by specifying management activities: plan, de-fine, enable, measure, and control. The second aim of governance is to set rules for ar-chitectural compliance respecting internal and external standards. Architecture Govern-ance has to set rules for the empowerment of people, defining the structures and proce-dures of an Architecture Governance Board, and setting rules for communication.
The Business and Information Reference Architecture - BIRA [Zi11], and[Zi13b] provides, a single source and comprehensive repository of knowledge fromwhich concrete corporate initiatives will evolve and link. The BIRA confers the basis forbusiness-IT alignment and therefore models the business and information strategy, theorganization, and main business demands as well as requirements for information sys-tems, such as key business processes, business rules, business products, services, andrelated business control information.
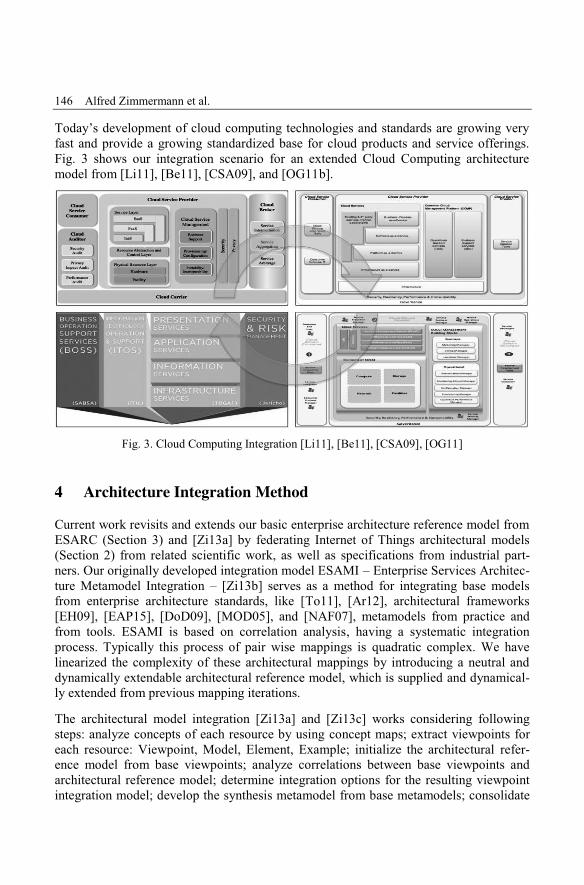
146 Alfred Zimmermann et al.
Today’s development of cloud computing technologies and standards are growing veryfast and provide a growing standardized base for cloud products and service offerings.Fig. 3 shows our integration scenario for an extended Cloud Computing architecturemodel from [Li11], [Be11], [CSA09], and [OG11b].
Fig. 3. Cloud Computing Integration [Li11], [Be11], [CSA09], [OG11]
4 Architecture Integration MethodCurrent work revisits and extends our basic enterprise architecture reference model fromESARC (Section 3) and [Zi13a] by federating Internet of Things architectural models(Section 2) from related scientific work, as well as specifications from industrial part-ners. Our originally developed integration model ESAMI – Enterprise Services Architec-ture Metamodel Integration – [Zi13b] serves as a method for integrating base modelsfrom enterprise architecture standards, like [To11], [Ar12], architectural frameworks[EH09], [EAP15], [DoD09], [MOD05], and [NAF07], metamodels from practice andfrom tools. ESAMI is based on correlation analysis, having a systematic integrationprocess. Typically this process of pair wise mappings is quadratic complex. We havelinearized the complexity of these architectural mappings by introducing a neutral anddynamically extendable architectural reference model, which is supplied and dynamical-ly extended from previous mapping iterations.
The architectural model integration [Zi13a] and [Zi13c] works considering followingsteps: analyze concepts of each resource by using concept maps; extract viewpoints foreach resource: Viewpoint, Model, Element, Example; initialize the architectural refer-ence model from base viewpoints; analyze correlations between base viewpoints andarchitectural reference model; determine integration options for the resulting viewpointintegration model; develop the synthesis metamodel from base metamodels; consolidate
Enterprise Architecture Management for the Internet of Things 147
the architectural reference model according the synthesis metamodel, and finally readjustcorrelations and integration options; develop the ontology of the architectural referencemodel; develop correspondence rules between model elements; and develop patterns forarchitecture diagnostics and optimization.
First we have to analyze and transform given architecture resources with concept mapsand extract their coarse-grained aspects in a standard way [Zi13a], [Zi13c] by delimitingarchitecture viewpoints, architecture models, their elements, and illustrating these mod-els by a typical example. Architecture viewpoints are representing and grouping concep-tual business and technology functions regardless of their implementation resources likepeople, processes, information, systems, or technologies. They extend these informationby additional aspects like quality criteria, service levels, KPI, costs, risks, compliancecriteria a. o. We are using modeling concepts from ISI/IEC 42010 [EH09] like Architec-ture Description, Viewpoint, View, and Model. Architecture models are composed oftheir elements and relationships, and are represented using architectural diagrams.
The integration of a huge amount of dynamically growing Internet of Things objects is aconsiderable challenge for the extension and dynamically evolution of EA models. Cur-rently we are working on the idea of integrating small EA descriptions for each relevantIoT object. These EA-IoT-Mini-Descriptions consists of partial EA-IoT-Data, partialEA-IoT-Models, and partial EA-IoT-Metamodels associated with main IoT objects likeIoT-Resource, IoT-Device, and IoT-Software-Component [Pa15], and [WS14]. Ourresearch in progress main question asks, how we can federate these EA-IoT-Mini-Descriptions to a global EA model and information base by promoting a mixed automat-ic and collaborative decision process [Ju15]. For the automatic part we currently extendmodel federation and transformation approaches [Br10], [Tr15] by introducing sematic-supported architectural representations, e.g. by using partial and federated ontologies[Kh11] and associated mapping rules - as universal enterprise architectural knowledgerepresentation, which are combined with special inference mechanisms.
5 Conclusion and Future WorkWe have developed a metamodel-based model extraction and integration approach forenterprise architecture viewpoints, models, standards, frameworks and tools for EAMtowards integrated Internet of Things. Our goal is to support a holistic Enterprise Archi-tecture Management with architecture development, assessments, architecture diagnos-tics, monitoring with decision support, and optimization of the business, informationsystems, and technologies. We intend to provide a unified and consistent ontology-basedEAM-methodology for the architecture management models of relevant Internet ofThings resources, especially integrating service-oriented and cloud computing systemsfor digital transforming enterprises as well.
148 Alfred Zimmermann et al.
Referring to our research questions, we looked at:
RQ1: What are new architectural elements and constraints for the Internet of Things?First we have delimited main architectural elements for the Internet of Things and adopt-ed and included an IoT reference model from the state of art. We defined in that way ourconceptual architectural elements of our “outside” world, which have to be consideredfor integration with the “inside” model for an integrated Enterprise Architecture.
RQ2: What is the blueprint for an extended Enterprise Reference Architecture, which isable to host even new and small type of architectural description for the Internet ofThings? We have defined with the Enterprise Reference Architecture our holistic andadaptable framework of architectural domains, viewpoints, and views.
RQ3: How looks am mapping scheme for the Internet of Things Reference Architectureinto a holistic and adaptable Enterprise Reference Architecture? With the correlation-based integration method we have defined a flexible methodology for the integration ofarchitectural elements by using an extendable architecture reference model. Our ap-proach introduces the new concept of EA-IoT-Mini-Descriptions. Many of the typicalhigh-level model-based integration decisions could not be done during run time at thedeployment-level. Given the high number of IoT elements in dynamically complex envi-ronment such strong EAM claim would require strong evidence of the feasibility.
From our research in progress work on integrating Internet of Things architectures intoEnterprise Architecture Management results some interesting theoretical and practicalimplications. By considering the context of service-oriented enterprise architecture, wehave set the foundation for integrating metamodels and related ontologies for orthogonalarchitecture domains within our Enterprise Architecture Management approach for theInternet of Things. Architectural decisions for Internet of Things objects, like IoT-Resource, Device, and Software Component are closely linked with the code implemen-tation. Therefore, researchers can use our approach for integrating and evaluating Inter-net of Things in the field of enterprise architecture management. Our results can helppractical users to understand the integration of EAM and Internet of Things as well ascan support architectural decision making in this area. Limitations can be found e.g. inthe field of practical multi-level evaluation of our approach as well as domain-specificadoptions.
Future work will include conceptual work to federate EA-IoT-Mini-Descriptions to aglobal EA model and enterprise architecture repository by promoting a semi-automaticand collaborative [Sc15] decision process [JS14], [Sc14] and [JSZ15]. We are currentlyextending our model federation and transformation approaches with elements from relat-ed work, like [Br10], [Tr15]. We are researching about semantic-supported architecturalrepresentations, as enterprise architectural knowledge representations, which are com-bined with special inference and visualization mechanisms.

Enterprise Architecture Management for the Internet of Things 149
References[Ar12] The Open Group: Archimate 2.0 Specification. Van Haren Publishing, 2012[At10] Atzori, L. et al.: The Internet of Things: A survey. In Journal of Computer Networks 54,
2010, pp. 2787-2805[BCK13] Bass, C., Clements, P., Kazman, R.: Software Architecture in Practice. Addison Wesley,
2013.[Be11] Behrendt, M., Glaser, B., Kopp, P., Diekmann, R., Breiter, G., Pappe, S., Kreger, H., and
Arsanjani, A.: Introduction and Architecture Overview – IBM Cloud Computing Refer-ence Architecture 2.0. IBM, 2011.
[Be12] Bente, S. et al.: Collaborative Enterprise Architecture. Morgan Kaufmann, 2012.[Br10] Breu, R. et al.: Living Models – Ten Principles for Change-Driven Software Engineer-
ing. In Int. Journal of Software Informatics, Vol. 5, No. 1-2, 2010, pp. 267-290[CSA09] CSA Cloud Security Alliance: Security Guidance for Critical Areas of Focus In Cloud
Computing V2.1”, 2009.[DoD09] DoDAF 2009. DoDAF Architecture Framework. Version 2.0, Volume 1, Department of
Defense USA, 28 May 2009.[EH09] Emery, D., Hilliard, R.: Every Architecture Description needs a Framework: Expressing
Architecture Frameworks Using ISO/IEC 42010. IEEE/IFIP WICSA/ECSA, 2009, pp.31-39
[Fa12] Farwick, M. et al.: A Meta-Model for Automated Enterprise Architecture Model Mainte-nance. EDOC 2012, pp. 1-10
[Ga12] Ganz, F. et al.: A Resource Mobility Scheme for Service-Continuity in the Internet ofThings. GreenCom 2012, pp. 261-264
[Gu13] Gubbi, J. et al.: Internet of Things (IoT): A vision, architectural elements, and futuredirections. Future Generation Comp. Syst. 29(7), 2013, pp. 1645-1660
[Ia15] Iacob, M.-E. et al.: Delivering Business Outcome with TOGAF® and ArchiMate®.eBook BiZZdesign, 2015
[Iso11] ISO/IEC/IEEE 42010: Systems and Software Engineering – Architecture Description.Technical Standard, 2011.
[JE07] Johnson, P., Ekstedt, M.: Enterprise Architecture – Models and Analyses for InformationSystems Decision Making, Studentliteratur, 2007
[Jo14] Johnson, P. et al.: IT Management with Enterprise Architecture. KTH, Stockholm, 2014.[JS14] Jugel, D., Schweda, C.M.: Interactive functions of a Cockpit for Enterprise Architecture
Planning. In: International Enterprise Distributed Object Computing Conference Work-shops and Demonstrations (EDOCW), Ulm, Germany, 2014, pp. 33-40
[JSZ15] Jugel, D., Schweda, C.M., Zimmermann, A.: Modeling Decisions for CollaborativeEnterprise Architecture Engineering. In: 10th Workshop Trends in Enterprise Architec-ture Research (TEAR), held on CAISE 2015, Stockholm, Sweden, 2015.
[Kh11] Khan, N. A.: Transformation of Enterprise Model to Enterprise Ontology. Master Thesis,Linköping University, Sweden, 2011.
[La13] Lankhorst, M. et al.: Enterprise Architecture at Work: Modelling, Communication andAnalysis. Springer, 2013.
[Li11] Liu, F. et al.: NIST Cloud Computing Reference Architecture. NIST special publication,2011.
[MD05] MODAF 2005. MOD Architectural Framework, Executive Summary, Version 1.0, 31August, Ministry of Defense UK, 2005.
[NAF07] NAF 2007. NATO Architecture Framework. Version 3, 2007.
150 Alfred Zimmermann et al.
[OG11] Open Group 2011. Service-Oriented Cloud Computing Infrastructure (SOCCI) Frame-work. The Open Group, 2011.
[Pa15] Patel, P., Cassou, D.: Enabling High-level Application Development for the Internet ofThings. In CoRR abs/1501.05080, submitted to Journal of Systems and Software, 2015.
[Ro06] Ross, J. W. et al.: Enterprise Architecture as Strategy – Creating a Foundation for Busi-ness Execution. Harvard Business School Press, 2006.
[Sa10] Saat, J. et al.: Enterprise Architecture Meta Models for IT/Business Alignment Situa-tions. IEEE-EDOC Conference 2010, Vitoria, Brazil, 2010.
[Sc14] Schmidt, R. et al.: Towards a Framework for Enterprise Architecture Analytics. In Pro-ceedings of the 18th IEEE International Enterprise Distributed Object Computing Con-ference Workshops (EDOCW), Ulm / Germany, 2014, pp. 266-275
[Sc15] Schmidt, R. et al.: Social-Software-based Support for Enterprise Architecture Manage-ment Processes. International BPM 2014 Conference Workshops, Eindhoven, 2014,LNBIP, Springer 2015.
[Sc15b] Schmidt, R. et al.: Industry 4.0 - Potentials for Creating Smart Products: EmpiricalResearch Results. 18th Conference on Business Information Systems, Poznan 2015, Lec-ture Notes in Business Information Processing, Springer, 2015 , forthcoming.
[SM13] Schmidt, R., Möhring, M.: Strategic alignment of Cloud-based Architectures for BigData. Proceedings of the 17th IEEE International Enterprise Distributed Object Compu-ting Conference Workshops EDOCW Vancouver, Canada, 2013, pp. 136–143
[Sp09] Spiess, P. et al.: SOA-Based Integration of the Internet of Things in Enterprise Ser-vices. ICWS 2009, pp. 968-975
[To11] The Open Group: TOGAF Version 9.1. Van Haren Publishing, 2011.[Tr15] Trojer, T. et. al.: Living Modeling of IT Architectures: Challenges and Solutions. Soft-
ware, Services, and Systems 2015, pp. 458-474[Wa14] Walker, M. J.: Leveraging Enterprise Architecture to Enable Business Value With IoT
Innovations Today. In Gartner Research http://www.gartner.com/analyst/49943, 2014.[WR04] Weill, P., Ross, J. W.: It Governance: How Top Performers Manage It Decision Rights
for Superior Results. Harvard Business School Press, 2004.[WS15] WSO2 White Paper: A Reference Architecture for the Internet of Things. Version 0.8.0
http://wso2.com, 2015.[Zi11] Zimmermann, A. et al.: Capability Diagnostics of Enterprise Service Architectures using
a dedicated Software Architecture Reference Model. In IEEE International Conferenceon Services Computing (SCC), Washington DC, USA, 2011; pp. 592–599
[Zi13a] Zimmermann, A. et al.: Towards an Integrated Service-Oriented Reference EnterpriseArchitecture. ESEC / WEA 2013 on Software Ecosystem Architectures, St. Petersburg,Russia, 2013, pp. 26-30
[Zi13b] Zimmermann, A. et al.: Towards Service-oriented Enterprise Architectures for Big DataApplications in the Cloud. EDOC 2013 with SoEA4EE, 9-13 September 2013, Vancou-ver, BC, Canada, 2013, pp. 130-135
[Zi13c] Zimmermann, A. et al.: Metamodell-basierte Integration von Service-orientierten EA-Referenzarchitekturen. Informatik 2013, September 16-20, Koblenz, Germany, LectureNotes in Informatics, 2013.
[Zi14] Zimmermann, A. et al.: Adaptable Enterprise Architectures for Software Evolution ofSmartLife Ecosystems. In: Proceedings of the 18th IEEE International Enterprise Dis-tributed Object Computing Conference Workshops (EDOCW), Ulm / Germany, 2014,pp. 316-323
Alfred Zimmermann, Alexander Rossmann (Hrsg.): Digital Enterprise Computing 2015,Lecture Notes in Informatics (LNI), Gesellschaft für Informatik, Bonn 2015 151
Providing EA Decision Support for Stakeholders byAutomated Analyses
Dierk Jugel1,2, Stefan Kehrer1, Christian M. Schweda1 and Alfred Zimmermann1
Abstract: Enterprise architecture management (EAM) is a holistic approach to tackle the complexBusiness and IT architecture. The transformation of an organization’s EA towards a strategy-oriented system is a continuous task. Many stakeholders have to elaborate on various parts of theEA to reach the best decisions to shape the EA towards an optimized support of the organizations’capabilities. Since the real world is too complex, analyzing techniques are needed to detect optimi-zation potentials and to get all information needed about an issue. In practice visualizations arecommonly used to analyze EAs. However these visualizations are mostly static and do not provideanalyses. In this article we combine analyzing techniques from literature and interactive visualiza-tions to support stakeholders in EA decision-making.
Keywords: Enterprise Architecture, decision support, visual analytics, automated analyses
1 IntroductionEnterprise Architecture Management (EAM) is a commonly accepted method to supportenterprises in their continuous transformation processes. These processes are necessary,as enterprises need to continue growing in order to be sustainable in a competitive envi-ronment. Enterprises are large and complex systems consisting of business processes,organizational units, applications and other elements. EAM provides a systematic ap-proach to enhance transparency, to support business and IT-alignment and to enable thestrategy-driven development of the Enterprise Architecture (EA) as a whole [Ha12]. Keyto EAM is the systematic evolution of the EA over time. Modifications of business pro-cesses, but also applications have to take place, and affect plenty of other elementsthroughout the EA. Frameworks like The Open Group Architecture Framework (TO-GAF) [TOG09] assist organizations with a holistic approach for EAM. The TOGAFArchitecture Development Method (ADM) [TOG09] details EAM tasks stating thatanalyses of the EA have to be undertaken prior to decision-making. EA analysis is usedto derive and extract information relevant for decision-making from the available infor-mation about Enterprise Architecture [Ra14]. In this vein, as Johnson et al. describe in[Jo07], EA analysis is the “application of property assessment criteria on enterprise ar-chitecture models”. The complexity of these models and the impacts of a change overdifferent layers of the EA require the involvement of different stakeholders. In particular,exchange between these stakeholders is necessary to agree on EA planning, as Lucke et
1 Reutlingen University, Herman Hollerith Zentrum, {dierk.jugel, christian.schweda, alf-red.zimmermann}@reutlingen-university.de, [email protected]
2 Rostock University, [email protected]
152 Dierk Jugel et al.
al. identify in [LKL10] the stakeholder’s communication is a critical issue in the field ofEAM. Summarizing, one can say that EA analysis and planning processes are skill-intensive and dependent on the competence and the decision-making ability of the en-gaged and often diverse team of stakeholders.
In general EA analysis uses visualizations of relevant information to support stakehold-ers in their individual tasks [Ma08]. EA tools provide different visualization techniques,which are usually static and do not target an interactive style of collaboratively workingon a decision. Therefore, stakeholders seeking to make a decision regarding the evolu-tion of the EA need assistance of “EA analysts” to develop an EA-based argumentationrepresenting their concerns contributing to an architectural effort. Florez et al. [FSV14]propose to automate analysis methods in order to facilitate decision-making. By auto-mating and standardizing analysis processes, EA activities get more reliable and repeata-ble without manual errors.
In this article we extend the ideas of Florez et al. from [FSV14] towards a visual analyt-ics approach for EAM. In the sense of Keim et al. [Ke08], who define visual analytics asthe combination of automated analyses and interactive visualizations, we combine auto-mated analyses of the EA structure with an interactive visualization mechanism. Visualanalytics can be regarded a novelty for the field of EAM, as the survey of Roth et al.[RZM14] inquiring visualization capabilities of current EAM tools shows.
First we put the base from existing approaches for EA analysis in Section 2. In Section 3we describe how structural analyses of the EA can be automated by our novel approach.In Section 4 we link the analysis results to our approach to support interactive visualiza-tions. Final Section 5 concludes our results and gives an outlook.
2 Related WorkTOGAF [TOG09] is the de facto global standard for EAM and outlines a general methodfor project-like development and evolution of the EA. The Architecture DevelopmentMethod (ADM) is the core of TOGAF and describes a sequence of development phasesstarting with “A – Architecture Vision” and concluding with “H – Architecture ChangeManagement”. The three phases “B - Business Architecture“, “C – Information SystemsArchitecture“ und “D – Technology Architecture“ each encompass activities of EAanalysis building on the available information. This information is organized in differentEA models pragmatically. TOGAF [TOG09, p. 95] recommends to “gather and analyzeonly that information that allows informed decisions to be made relevant to the scope ofthis architecture effort”. As a general framework TOGAF does not make specific rec-ommendations on the analysis procedures and techniques. It contrariwise offers onlyhigh-level guidance and needs to be complemented with techniques for analysis[KW07]. In Section 2.1 we reflect best practice analyses described in literature. Section2.2 addresses related work in the field of automated EA analyses.
Providing EA Decision Support for Stakeholders by Automated Analyses 153
2.1 Best Practice Analyses in EAMJohnson et al. recommend in [JE07] a goal-driven approach for EAM. The authors espe-cially address how to derive decision-relevant information from EA models. Johnson etal. discuss that architecture-related goals have to be operationalized to provide a founda-tion for the decision-making processes. Therefore, the authors propose a mapping ofgoals and necessary viewpoints. They stress the specific creation of viewpoints to sup-port stakeholders in their decision-making tasks. Automated assessment and correspond-ing tools are only mentioned for the analysis of influence diagrams, respectively to theirgoal-oriented approach. The goal-driven approach provides a systematic framework forunderstanding and performing EA analysis, but only offers limited guidance for theidentification of architecture improvements.
Hanschke presents so-called analysis patterns in the appendix A of [Ha13]. These analy-sis patterns are described as practice-proven and generalized templates to find needs foraction and potential improvements concerning the EA. Hanschke identifies five differentcategories: 1) redundancy, 2) inconsistency, 3) organizational need for action, 4) imple-menting business requirements and 5) technical need for action and potential improve-ments. Each analysis pattern is structured using a canonical form including the followingcharacteristics: id, name, version, description, context, dependencies, result, and exam-ple. Each pattern provides a textual prescription on how to identify shortcomings andderive improvements in the architecture. This prescription gives guidance to an experi-enced enterprise architect, but is not translated to a formal, i.e. algorithmic, manner. Thecontext of the pattern states necessary requirements concerning the underlying EA mod-el, but does not provide an explicit model. If there are any dependencies to other patternsthey are described in the dependencies section.
Matthes et al. [Ma11] present quantitative, metrics-driven EA analyses resulting in a setof EA key performance indicators (KPIs). These KPIs provide necessary measurementcapabilities for EAM, needed to aid planning and controlling the EA. The EAM KPICatalog contributes in presenting ten common EA management goals and 52 KPIs in-cluding the underlying EA model. Each KPI is described by the following characteris-tics: description, underlying EA model, goals, calculation, code, sources, organization-specific instantiation and the affected layers of the EA. The EAM KPI Catalog also pro-vides a good basis for implementation purposes. Especially the calculation section de-scribes the algorithm for calculation of each KPI concisely. While KPIs, like the projectperformance index, can be used to detect need-for-action, optimization potentials in theEA itself are not identified. An experienced enterprise architect would be needed toidentify the elements of the EA causing the value of the KPI.
154 Dierk Jugel et al.
2.2 Automated EA AnalysesBuschle et al. present a tool, which supports the Predictive, Probabilistic ArchitectureModeling Framework (P2AMF) in order to perform analysis on EA models [BJS13]. Theauthors especially promote the capability of the tool 1) to analyze EA models withouthardcoded analyses and 2) the ability to handle model incompleteness. Basically theyuse two methods to address the aforementioned capabilities: 1) a model transformationusing extended Eclipse Modeling Framework (EMF) containing the so called ClassModeler and the Object Modeler, and 2) P2AMF derivations to reconstruct missing at-tributes using a model-based dependency structure. The assessment framework built inthe Class Modeler can be loaded into the Object Modeler to instantiate the predefinedclasses. Additionally, the evidence for missing attribute values can be supplied by sam-pling according to P2AMF [BJS13]. The underlying concept is further detailed in [Jo07].The automated approach of Buschle et al. provides a framework for quantitative analysisunder uncertain and incomplete information. This approach can be applied to differentquantitative best-practice analyses, e.g. the KPIs defined by Matthes et al. [Ma11]. Theresults of the analyses are presented in simple graph-like visualizations or in a tabularmanner, covering only a subset of the visualization types prevalent in EAM.
Florez et al. [FSV14] discuss the motivations and requirements for EA model analysisautomation and the requirements of analysis methods. Depicted advantages of automatedanalysis procedures are the possibility to work with larger models and the lesser chanceof manual errors. On the downside, Florez et al. identify the following three problemswith automated EA analysis: 1) Higher model requirements would lead to more compli-cated and hence more expensive modelling processes. 2) Analysis methods are selectedlate in projects whereas meta-models have been already designed and corresponding EAmodels constructed. 3) In general EAM tools do not support flexible meta-models. Suchflexibility would – according to the authors – be required to store analysis results alongthe analyzed elements of the EA. Florez et al. [FSV14] derive seven requirements forfuture EAM tools and present an approach called SAMBA to realize these requirements.A key point of their approach is the capability to change the meta-model by analyses.
Ramos et al. propose in [Ra14] a characterization of analysis functions including a speci-fication of the algorithms. The authors consider the explicit documentation of infor-mation requirements that every analysis method has as important. Therefore, the struc-ture for each analysis function contains the following information: name, description,dimension, type, layer, entities and relations, structural attributes and algorithm. Where-as the dimension reuses the classification concept by Lankhorst [La13], the type refer-ences one of the types, developed according to the different concerns. The layer depictsthe concerned ArchiMate layer and the entities, relations and structural attributes charac-terize the underlying EA model. Finally, the algorithm describes the information extrac-tion of the analysis function from the model. The analysis process itself is depicted as acyclic procedure of querying and enriching the EA model until the result is achieved.Thereby, the authors also use the aforementioned method of Florez et al. [FSV14] tostore results of analysis processes in the EA model. Additionally they mention the possi-
Providing EA Decision Support for Stakeholders by Automated Analyses 155
bility to use a set of newly generated data in a visualization without transforming the EAmodel. The authors of [Ra14] are currently working on a catalog of so called analysisfunctions and a conceptual framework on top of ArchiMate.
Naranjo et al. describe in [NSV14] a flexible and configurable graph-based approachthat makes automated EA analysis methods applicable in a pipeline. This holistic ap-proach is grounded on the Visual Analysis framework PRIMROSe. Contrary to Florez etal. [FSV14] and Ramos et al. [Ra14] the authors use the so called Conceptual Meta-model to store the initial EA model and the Analysis Meta-model, as extended versionenriched with facts generated by the EA analyses. The analysis is performed by a trans-formation process through applying a series of five pipelined stages: 1) Import: At firstthe EA model is transformed to an expanded graph GE to allow the insertion of newrelation properties. 2) Analyze: The transformation to an analysis graph GA containsadditional so called selectors pointing to existing vertices of GE. Selectors can be classi-fied as analysis functions, which updates the graph, or as decorator functions, which onlyadd additional attributes to existing vertices. 3) Map: After additional information hasbeen added, so-called visual rules are used to translate data into visual information.Therefore a visual rule is a pair of a visual attribute and a mapping function. Furthermorea visual decorator can be used to apply a set of visual rules to a vertices marked by aselector in order to create a visual graph GV, which is an isomorphism of GE enrichedwith visual properties. 4) Visualize: GV can be transformed into the desired graphicalformat to support View Operators, which do not alter the visualization, and Data Opera-tors, which are able to modify all internal pipelines of the stages applied before to alterthe visualization. 5) Communicate: Finally, filters can be applied sequentially to removevertices. Thereby, stakeholders can highlight relevant parts of the model in a resultingview. Naranjo et al. present a holistic and modular approach of combining the two im-portant EA functions analysis and visualization. For EA analysis purposes the pipelineconcept carries a major advantage: analysis methods can be applied sequentially to sup-port highly sophisticated analysis structures.
Antunes et al. present in [An13] an ontology-based approach to document knowledgeabout the EA and support EA analysis through model reasoning. Thereto, the authors usea core meta-model called domain-independent ontology (DIO) that can be extended bydomain-specific languages. The concepts presented in [An13] are at an early stage. Fur-ther explorations of the analysis possibilities considering reasoning and querying meth-ods are still open tasks.
3 EA Analysis TechniqueThe analysis patterns presented by Hanschke in the appendix A of [Ha13] (c.f. Section2.1) provide an operationalization of EA analysis and planning. Hanschke describes thepatterns in a generic way to enhance reusability and flexibility concerning the underlyingmeta-model. However the analysis patterns of Hanschke cannot be automated without
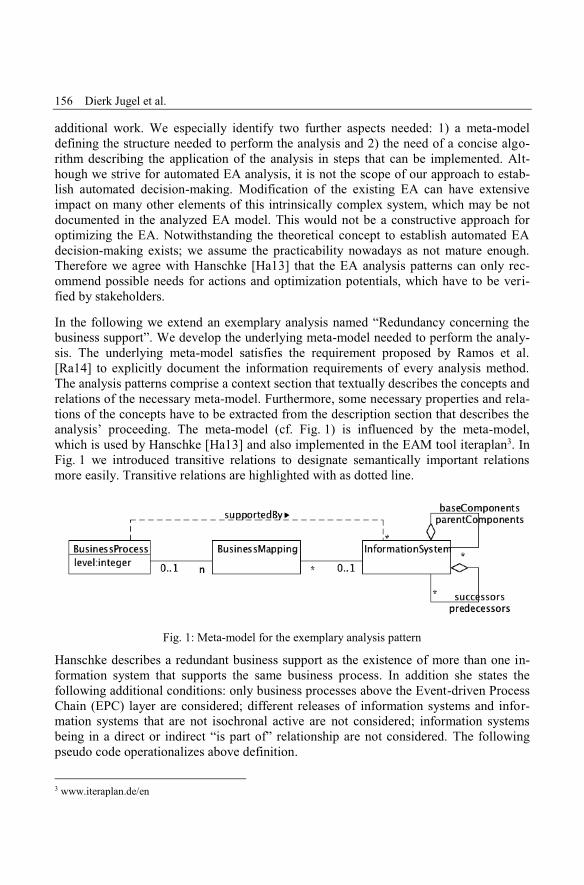
156 Dierk Jugel et al.
additional work. We especially identify two further aspects needed: 1) a meta-modeldefining the structure needed to perform the analysis and 2) the need of a concise algo-rithm describing the application of the analysis in steps that can be implemented. Alt-hough we strive for automated EA analysis, it is not the scope of our approach to estab-lish automated decision-making. Modification of the existing EA can have extensiveimpact on many other elements of this intrinsically complex system, which may be notdocumented in the analyzed EA model. This would not be a constructive approach foroptimizing the EA. Notwithstanding the theoretical concept to establish automated EAdecision-making exists; we assume the practicability nowadays as not mature enough.Therefore we agree with Hanschke [Ha13] that the EA analysis patterns can only rec-ommend possible needs for actions and optimization potentials, which have to be veri-fied by stakeholders.
In the following we extend an exemplary analysis named “Redundancy concerning thebusiness support”. We develop the underlying meta-model needed to perform the analy-sis. The underlying meta-model satisfies the requirement proposed by Ramos et al.[Ra14] to explicitly document the information requirements of every analysis method.The analysis patterns comprise a context section that textually describes the concepts andrelations of the necessary meta-model. Furthermore, some necessary properties and rela-tions of the concepts have to be extracted from the description section that describes theanalysis’ proceeding. The meta-model (cf. Fig. 1) is influenced by the meta-model,which is used by Hanschke [Ha13] and also implemented in the EAM tool iteraplan3. InFig. 1 we introduced transitive relations to designate semantically important relationsmore easily. Transitive relations are highlighted with as dotted line.
Fig. 1: Meta-model for the exemplary analysis pattern
Hanschke describes a redundant business support as the existence of more than one in-formation system that supports the same business process. In addition she states thefollowing additional conditions: only business processes above the Event-driven ProcessChain (EPC) layer are considered; different releases of information systems and infor-mation systems that are not isochronal active are not considered; information systemsbeing in a direct or indirect “is part of” relationship are not considered. The followingpseudo code operationalizes above definition.
3 www.iteraplan.de/en
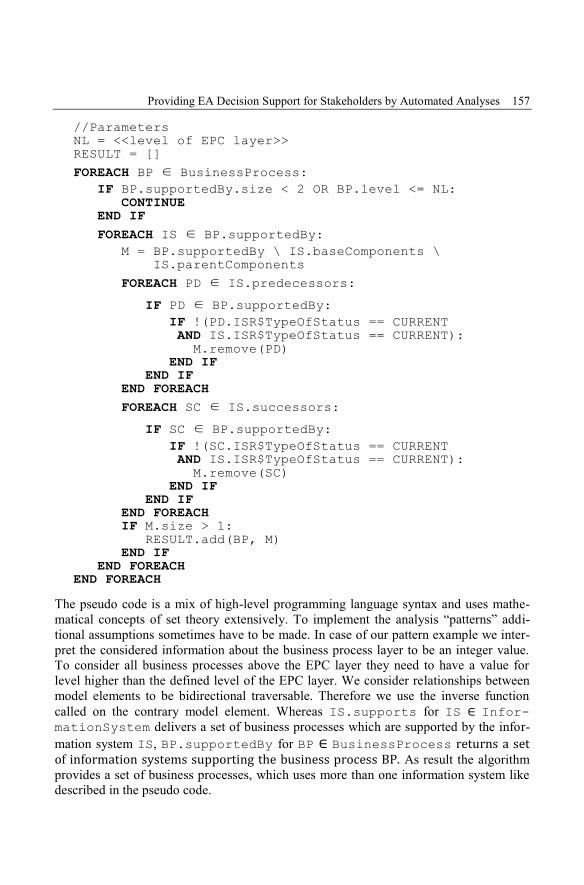
Providing EA Decision Support for Stakeholders by Automated Analyses 157
//ParametersNL = <<level of EPC layer>>RESULT = []FOREACH BP ∈ BusinessProcess:
IF BP.supportedBy.size < 2 OR BP.level <= NL:CONTINUE
END IFFOREACH IS ∈ BP.supportedBy:
M = BP.supportedBy \ IS.baseComponents \IS.parentComponents
FOREACH PD ∈ IS.predecessors:IF PD ∈ BP.supportedBy:
IF !(PD.ISR$TypeOfStatus == CURRENTAND IS.ISR$TypeOfStatus == CURRENT):
M.remove(PD)END IF
END IFEND FOREACHFOREACH SC ∈ IS.successors:
IF SC ∈ BP.supportedBy:IF !(SC.ISR$TypeOfStatus == CURRENTAND IS.ISR$TypeOfStatus == CURRENT):
M.remove(SC)END IF
END IFEND FOREACHIF M.size > 1:
RESULT.add(BP, M)END IF
END FOREACHEND FOREACH
The pseudo code is a mix of high-level programming language syntax and uses mathe-matical concepts of set theory extensively. To implement the analysis “patterns” addi-tional assumptions sometimes have to be made. In case of our pattern example we inter-pret the considered information about the business process layer to be an integer value.To consider all business processes above the EPC layer they need to have a value forlevel higher than the defined level of the EPC layer. We consider relationships betweenmodel elements to be bidirectional traversable. Therefore we use the inverse functioncalled on the contrary model element. Whereas IS.supports for IS ∈ Infor-mationSystem delivers a set of business processes which are supported by the infor-mation system IS, BP.supportedBy for BP ∈ BusinessProcess returns a setof information systems supporting the business process BP. As result the algorithmprovides a set of business processes, which uses more than one information system likedescribed in the pseudo code.
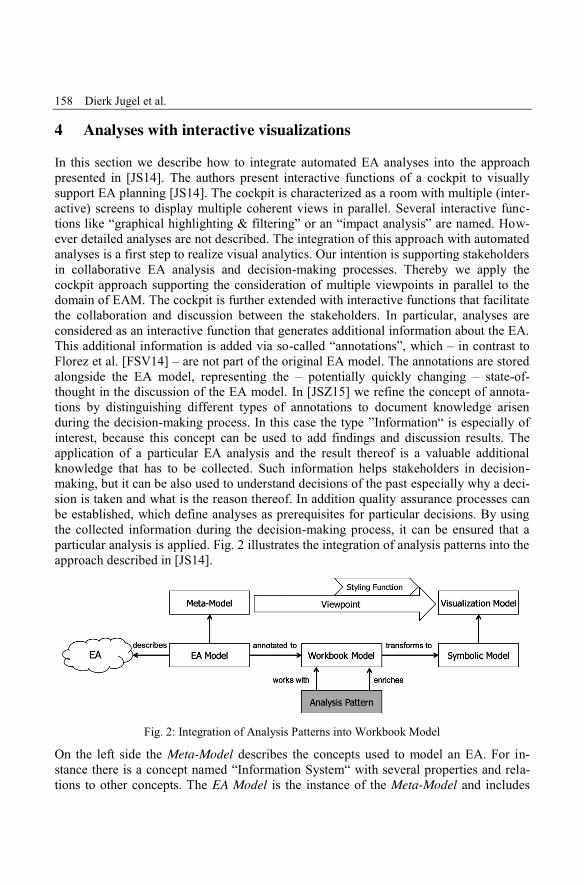
158 Dierk Jugel et al.
4 Analyses with interactive visualizationsIn this section we describe how to integrate automated EA analyses into the approachpresented in [JS14]. The authors present interactive functions of a cockpit to visuallysupport EA planning [JS14]. The cockpit is characterized as a room with multiple (inter-active) screens to display multiple coherent views in parallel. Several interactive func-tions like “graphical highlighting & filtering” or an “impact analysis” are named. How-ever detailed analyses are not described. The integration of this approach with automatedanalyses is a first step to realize visual analytics. Our intention is supporting stakeholdersin collaborative EA analysis and decision-making processes. Thereby we apply thecockpit approach supporting the consideration of multiple viewpoints in parallel to thedomain of EAM. The cockpit is further extended with interactive functions that facilitatethe collaboration and discussion between the stakeholders. In particular, analyses areconsidered as an interactive function that generates additional information about the EA.This additional information is added via so-called “annotations”, which – in contrast toFlorez et al. [FSV14] – are not part of the original EA model. The annotations are storedalongside the EA model, representing the – potentially quickly changing – state-of-thought in the discussion of the EA model. In [JSZ15] we refine the concept of annota-tions by distinguishing different types of annotations to document knowledge arisenduring the decision-making process. In this case the type ”Information“ is especially ofinterest, because this concept can be used to add findings and discussion results. Theapplication of a particular EA analysis and the result thereof is a valuable additionalknowledge that has to be collected. Such information helps stakeholders in decision-making, but it can be also used to understand decisions of the past especially why a deci-sion is taken and what is the reason thereof. In addition quality assurance processes canbe established, which define analyses as prerequisites for particular decisions. By usingthe collected information during the decision-making process, it can be ensured that aparticular analysis is applied. Fig. 2 illustrates the integration of analysis patterns into theapproach described in [JS14].
Fig. 2: Integration of Analysis Patterns into Workbook Model
On the left side the Meta-Model describes the concepts used to model an EA. For in-stance there is a concept named “Information System“ with several properties and rela-tions to other concepts. The EA Model is the instance of the Meta-Model and includes
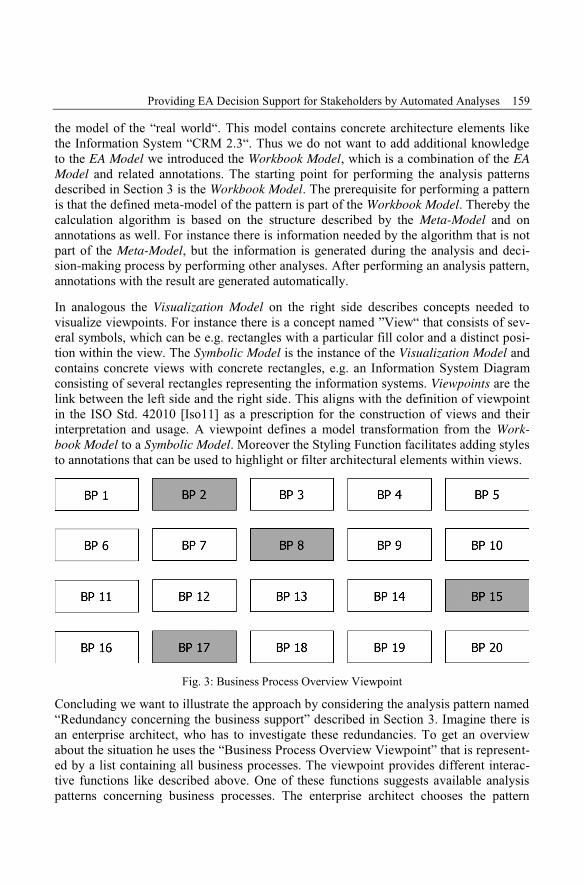
Providing EA Decision Support for Stakeholders by Automated Analyses 159
the model of the “real world“. This model contains concrete architecture elements likethe Information System “CRM 2.3“. Thus we do not want to add additional knowledgeto the EA Model we introduced the Workbook Model, which is a combination of the EAModel and related annotations. The starting point for performing the analysis patternsdescribed in Section 3 is the Workbook Model. The prerequisite for performing a patternis that the defined meta-model of the pattern is part of the Workbook Model. Thereby thecalculation algorithm is based on the structure described by the Meta-Model and onannotations as well. For instance there is information needed by the algorithm that is notpart of the Meta-Model, but the information is generated during the analysis and deci-sion-making process by performing other analyses. After performing an analysis pattern,annotations with the result are generated automatically.
In analogous the Visualization Model on the right side describes concepts needed tovisualize viewpoints. For instance there is a concept named ”View“ that consists of sev-eral symbols, which can be e.g. rectangles with a particular fill color and a distinct posi-tion within the view. The Symbolic Model is the instance of the Visualization Model andcontains concrete views with concrete rectangles, e.g. an Information System Diagramconsisting of several rectangles representing the information systems. Viewpoints are thelink between the left side and the right side. This aligns with the definition of viewpointin the ISO Std. 42010 [Iso11] as a prescription for the construction of views and theirinterpretation and usage. A viewpoint defines a model transformation from the Work-book Model to a Symbolic Model. Moreover the Styling Function facilitates adding stylesto annotations that can be used to highlight or filter architectural elements within views.
Fig. 3: Business Process Overview Viewpoint
Concluding we want to illustrate the approach by considering the analysis pattern named“Redundancy concerning the business support” described in Section 3. Imagine there isan enterprise architect, who has to investigate these redundancies. To get an overviewabout the situation he uses the “Business Process Overview Viewpoint” that is represent-ed by a list containing all business processes. The viewpoint provides different interac-tive functions like described above. One of these functions suggests available analysispatterns concerning business processes. The enterprise architect chooses the pattern
160 Dierk Jugel et al.
“Redundancy concerning the business support”. The pattern algorithm is performed inthe background to detect business processes that are using more than one informationsystem. An annotation of the type “Detailed Information” is created that relates thesebusiness processes. In addition a styling function is applied to assign the elements of theannotation with a particular fill color. Annotations represent additional knowledge. Tovisualize them the styling function mechanism is needed. The result is illustrated in Fig.3. Now the enterprise architect can decide what he wants to do next. For instance, hedecides to perform another analysis to get information about the information system thatis affected by one of these identified business processes.
5 ConclusionIn this article we have introduced a novel approach for integrating automated EA anal-yses with interactive visualizations as our contribution for an integral Visual EA analyt-ics. The analysis patterns of Hanschke [Ha13] are very useful to identify optimizationpotentials within EAs. We extended these EA patterns by developing a meta-model anda calculation algorithm to provide automatic support for these EA analysis patterns.Next, we have integrated the analyses in the approach described in [JS14]. The automat-ed analyses work with the Workbook Model that provides the EA model annotated withadditional knowledge. The annotation mechanism provides a generic vehicle to modelanalysis results during decision-making processes. In future work we want to investigatedifferent kinds of analyses in more detail, and extend these in a consistent and holisticway. Buckl et al. describe in [BMS09] three kinds of analysis techniques: expert-based,rule-based and indicator-based. The analysis patterns of Hanschke, which are rule-basedanalyses, are a first step to support stakeholders in decision-making. Now we investigatehow other kinds of analyses contribute and how these analyses can be integrated in theapproach. Furthermore we want to develop a type-safe language for performing anal-yses. At the moment the developed algorithms to perform the patterns are describedprocedurally. Another way to automate the analyses is to describe them declaratively byusing a query language. The calculations of KPIs described in [Ma11] use such a declar-ative mechanism.
References[An13] Antunes, G. et al.: Using Ontologies for Enterprise Architecture Analysis. In: 17th
IEEE International Enterprise Distributed Object Computing Conference Workshops,pp. 361-368, 2013.
[BMS09] Buckl, S.; Matthes, F.; Schweda, C.M.: Classifying Enterprise Architecture AnalysisApproaches. In: The 2nd IFIP WG5.8 Workshop on Enterprise Interoperability (I-WEI'2009), Valencia, Spain, pp. 66-79, 2009.
Providing EA Decision Support for Stakeholders by Automated Analyses 161
[BJS13] Buschle, M.; Johnson, P.; Shahzad, K.: The Enterprise Architecture Analysis Tool –Support for the Predictive, Probabilistic Architecture Modeling Framework. In: Pro-ceedings of the Nineteenth Americas Conference on Information Systems (AMCIS),Chicaco, Illinois, pp. 3350-3364, 2013.
[FSV14] Florez, H.; Sánchez, M.; Villalobos, J.: Extensible Model-based Approach for Support-ing Automatic Enterprise Analysis. In: 18th International Enterprise Distributed ObjectComputing Conference (EDOC), Ulm, Germany, pp. 32-41, 2014.
[Ha12] Hanschke, I.: Enterprise Architecture Management – einfach und effektiv: ein prakti-scher Leitfaden für die Einführung von EAM, Hanser Verlag, 2012.
[Ha13] Hanschke, I.: Strategisches Management der IT-Landschaft Ein praktischer Leitfadenfür das Enterprise Architecture Management (3rd edition), Hanser Verlag, 2013.
[Iso11] ISO/IEC/IEEE: Systems and software engineering – Architecture description. Techni-cal standard, 2011.
[JE07] Johnson, P.; Ekstedt, M.: Enterprise Architecture – Models and Analyses for Informa-tion Systems Decision Making, Studenttliteratur, 2007.
[Jo07] Johnson, P. et al.: A Tool for Enterprise Architecture Analysis. In: 11th InternationalEnterprise Distributed Object Computing Conference (EDOC), Annapolis, Maryland,pp. 142-153, 2007.
[JS14] Jugel, D.; Schweda, C.M.: Interactive functions of a Cockpit for Enterprise Architec-ture Planning. In: International Enterprise Distributed Object Computing ConferenceWorkshops and Demonstrations (EDOCW), Ulm, Germany, pp. 33-40, 2014.
[JSZ15] Jugel, D.; Schweda, C.M.; Zimmermann, A.: Modeling Decisions for CollaborativeEnterprise Architecture Engineering. In: 10th Workshop Trends in Enterprise Archi-tecture Research (TEAR), held on CAISE 2015, Stockholm, Sweden, 2015.
[Ke08] Keim, D.A. et al.: Visual Analytics: Definition, Process, and Challenges. In: Informa-tion Visualization, Lecture Notes in Computer Science, vol. 4950, Springer Verlag,Heidelberg, pp. 154- 175, 2008.
[KW07] Kurpjuweit, S.; Winter, R.: Viewpoint-based meta model engineering, EnterpriseModelling and Information Systems Architectures-Concepts and Applications. In: Pro-ceedings of the 2nd Int’l Workshop EMISA, pp. 143–161, 2013.
[La13] Lankhorst, M.: Enterprise architecture at work: Modelling, communication and analy-sis. Springer, 2013.
[LKL10] Lucke, C.; Krell, S.; Lechner, U.: Critical Issues in Enterprise Architecting - A Litera-ture Review. In: Proceedings of Sustainable IT Collaboration Around the Globe, 16thAmericas Conference on Information Systems (AMCIS), Lima, Peru, pp. 305-315,2010.
[Ma08] Matthes, F.; Buckl, S.; Leitel, J.; Schweda, C.M.: Enterprise Architecture ManagementTool Survey 2008. Technical Report, Chair for Informatics 19, Technical University ofMunich, 2008.
[Ma11] Matthes, F. et al.: EAM KPI Catalog v 1.0, Technical Report, 2011.

162 Dierk Jugel et al.
[NSV12] Naranjo, D.; Sanchez, M.; Villalobos, J.: Visual Analysis of Enterprise Models. In:16th International Enterprise Distributed Object Computing Conference Workshopsand Demonstrations (EDOCW), Bejing, China, pp. 19-28, 2012.
[NSV14] Naranjo, D.; Sanchez, M.; Villalobos, J.: Towards a Unified and Modular Approachfor Visual Analysis of Enterprise Models. In: International Enterprise Distributed Ob-ject Computing Conference Workshops and Demonstrations (EDOCW), Ulm, Germa-ny, pp. 77-86, 2014.
[Ra14] Ramos, A. et al.: Automated Enterprise-Level Analysis of ArchiMate Models. In:Proceedings of the 15th International Conference, BPMDS 2014, 19th InternationalConference, EMMSAD 2014, held at CAISE 2014, Thessaloniki, Greece, pp. 439-453,2014.
[RZM14] Roth, S.; Zec, M.; Matthes, F.: Enterprise Architecture Visualization Tool Survey2014. Technical Report, Chair for Informatics 19, Technical University of Munich,2014.
[TOG09] The Open Group: The Open Group Architecture Framework (TOGAF), Version 9,2009.
Alfred Zimmermann, Alexander Rossmann (Hrsg.): Digital Enterprise Computing 2015,Lecture Notes in Informatics (LNI), Gesellschaft für Informatik, Bonn 2015 163
Bottom-up EA Management Governance usingRecommender Systems
Konstantin Govedarski1, Claudius Hauptmann1 and Christian M. Schweda2
Abstract: Enterprise Architecture (EA) Management is an activity that seeks to foster the align-ment of business and IT, and pursues various goals further operationalizing this alignment. Key toeffective EA Management is a framework that defines the roles, activities, and viewpoints used forEA Management in accordance to the concerns that the stakeholders aim to address. Consensusholds that such frameworks are organization-specific and hence they are designed in governanceactivities for EA Management. As of today, top-down approaches for governance are used toderive organization-specific frameworks. These usually lack systematic mechanisms for improvingthe framework based on the feedback of the responsible stakeholders. We outline a bottom-upapproach for EA Management governance that systematically observes the behavior of the actorsto learn user concerns and recommend appropriate viewpoints. With this approach, we comple-ment traditional top-down governance activities.
Keywords: Enterprise Architecture, Enterprise Architecture Management, Viewpoints
1 MotivationThe management of the IT of an enterprise is a collaborative endeavor, involving a largenumber of different stakeholders taking distinct roles. These stakeholders have diverseconcerns that all pertain to the one architecture of the enterprise, the so-called EnterpriseArchitecture (EA). Crucial to the successful utilization of the EA is the establishment ofappropriate EA management (EAM) governance and EAM processes. Different ap-proaches, as for example [Ha13] and [Bu11], provide a methodology describing how thiscan be achieved. Both authors identify a number of steps required for the deploymentand evolution of an EAM framework within an organization (see Figure 1). For the ini-tial deployment, the organization's vision – its long-term objectives – as well as thestakeholders participating in this vision are identified. Once this is achieved, the goalsand concerns of each particular stakeholder can be formulated. These concerns thenserve as a foundation for the specification of the two artefacts building the EAM frame-work within the organization. The first of those is the definition of an appropriateknowledge base describing manifold aspects of the EA as a set of typed elements, theirproperties, and relationships to each other, as well as the viewpoints which address theconcerns identified. This artefact of the EAM governance process is denoted as an EAframework and is usually implemented through an EAM tool. The second constituentelement of the EAM framework is the specification of the EAM method – an abstract
1 Technische Universität München, Fakultät für Informatik, [email protected], [email protected] Reutlingen University, Herman Hollerith Zentrum, [email protected]
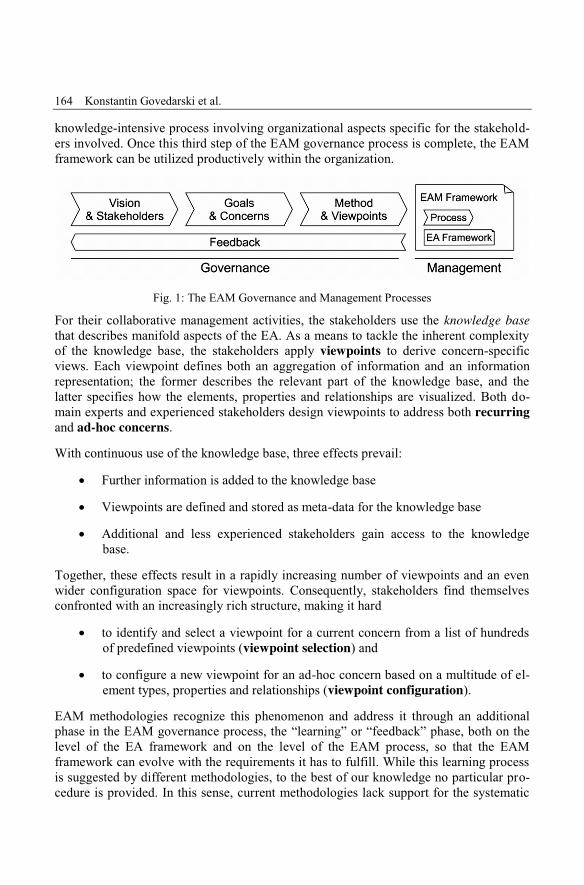
164 Konstantin Govedarski et al.
knowledge-intensive process involving organizational aspects specific for the stakehold-ers involved. Once this third step of the EAM governance process is complete, the EAMframework can be utilized productively within the organization.
Fig. 1: The EAM Governance and Management Processes
For their collaborative management activities, the stakeholders use the knowledge basethat describes manifold aspects of the EA. As a means to tackle the inherent complexityof the knowledge base, the stakeholders apply viewpoints to derive concern-specificviews. Each viewpoint defines both an aggregation of information and an informationrepresentation; the former describes the relevant part of the knowledge base, and thelatter specifies how the elements, properties and relationships are visualized. Both do-main experts and experienced stakeholders design viewpoints to address both recurringand ad-hoc concerns.
With continuous use of the knowledge base, three effects prevail:
" Further information is added to the knowledge base
" Viewpoints are defined and stored as meta-data for the knowledge base
" Additional and less experienced stakeholders gain access to the knowledgebase.
Together, these effects result in a rapidly increasing number of viewpoints and an evenwider configuration space for viewpoints. Consequently, stakeholders find themselvesconfronted with an increasingly rich structure, making it hard
" to identify and select a viewpoint for a current concern from a list of hundredsof predefined viewpoints (viewpoint selection) and
" to configure a new viewpoint for an ad-hoc concern based on a multitude of el-ement types, properties and relationships (viewpoint configuration).
EAM methodologies recognize this phenomenon and address it through an additionalphase in the EAM governance process, the “learning” or “feedback” phase, both on thelevel of the EA framework and on the level of the EAM process, so that the EAMframework can evolve with the requirements it has to fulfill. While this learning processis suggested by different methodologies, to the best of our knowledge no particular pro-cedure is provided. In this sense, current methodologies lack support for the systematic
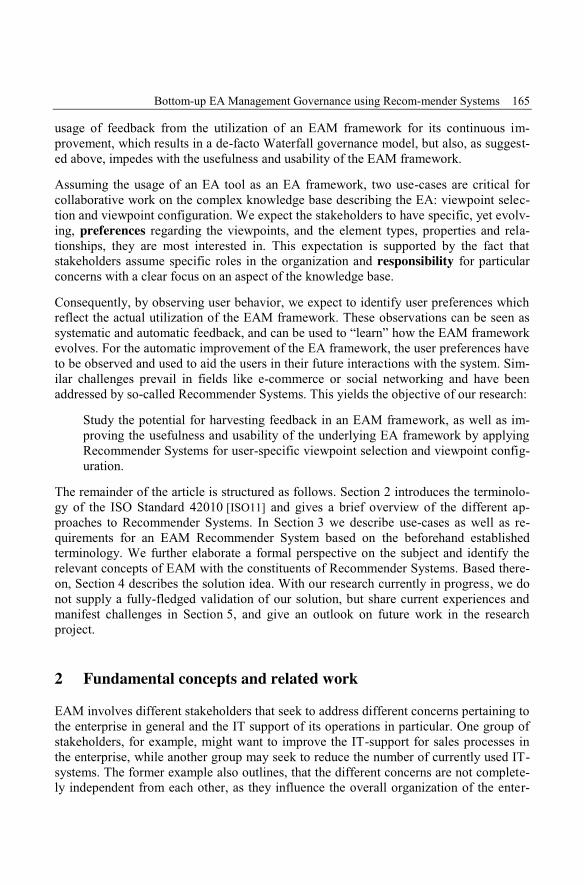
Bottom-up EA Management Governance using Recom-mender Systems 165
usage of feedback from the utilization of an EAM framework for its continuous im-provement, which results in a de-facto Waterfall governance model, but also, as suggest-ed above, impedes with the usefulness and usability of the EAM framework.
Assuming the usage of an EA tool as an EA framework, two use-cases are critical forcollaborative work on the complex knowledge base describing the EA: viewpoint selec-tion and viewpoint configuration. We expect the stakeholders to have specific, yet evolv-ing, preferences regarding the viewpoints, and the element types, properties and rela-tionships, they are most interested in. This expectation is supported by the fact thatstakeholders assume specific roles in the organization and responsibility for particularconcerns with a clear focus on an aspect of the knowledge base.
Consequently, by observing user behavior, we expect to identify user preferences whichreflect the actual utilization of the EAM framework. These observations can be seen assystematic and automatic feedback, and can be used to “learn” how the EAM frameworkevolves. For the automatic improvement of the EA framework, the user preferences haveto be observed and used to aid the users in their future interactions with the system. Sim-ilar challenges prevail in fields like e-commerce or social networking and have beenaddressed by so-called Recommender Systems. This yields the objective of our research:
Study the potential for harvesting feedback in an EAM framework, as well as im-proving the usefulness and usability of the underlying EA framework by applyingRecommender Systems for user-specific viewpoint selection and viewpoint config-uration.
The remainder of the article is structured as follows. Section 2 introduces the terminolo-gy of the ISO Standard 42010 [ISO11] and gives a brief overview of the different ap-proaches to Recommender Systems. In Section 3 we describe use-cases as well as re-quirements for an EAM Recommender System based on the beforehand establishedterminology. We further elaborate a formal perspective on the subject and identify therelevant concepts of EAM with the constituents of Recommender Systems. Based there-on, Section 4 describes the solution idea. With our research currently in progress, we donot supply a fully-fledged validation of our solution, but share current experiences andmanifest challenges in Section 5, and give an outlook on future work in the researchproject.
2 Fundamental concepts and related workEAM involves different stakeholders that seek to address different concerns pertaining tothe enterprise in general and the IT support of its operations in particular. One group ofstakeholders, for example, might want to improve the IT-support for sales processes inthe enterprise, while another group may seek to reduce the number of currently used IT-systems. The former example also outlines, that the different concerns are not complete-ly independent from each other, as they influence the overall organization of the enter-
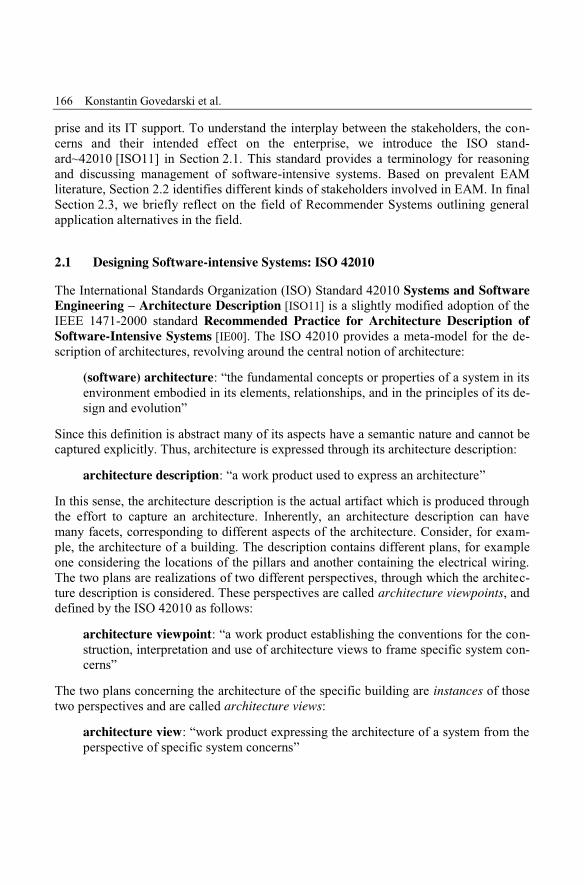
166 Konstantin Govedarski et al.
prise and its IT support. To understand the interplay between the stakeholders, the con-cerns and their intended effect on the enterprise, we introduce the ISO stand-ard~42010 [ISO11] in Section 2.1. This standard provides a terminology for reasoningand discussing management of software-intensive systems. Based on prevalent EAMliterature, Section 2.2 identifies different kinds of stakeholders involved in EAM. In finalSection 2.3, we briefly reflect on the field of Recommender Systems outlining generalapplication alternatives in the field.
2.1 Designing Software-intensive Systems: ISO 42010The International Standards Organization (ISO) Standard 42010 Systems and SoftwareEngineering – Architecture Description [ISO11] is a slightly modified adoption of theIEEE 1471-2000 standard Recommended Practice for Architecture Description ofSoftware-Intensive Systems [IE00]. The ISO 42010 provides a meta-model for the de-scription of architectures, revolving around the central notion of architecture:
(software) architecture: “the fundamental concepts or properties of a system in itsenvironment embodied in its elements, relationships, and in the principles of its de-sign and evolution”
Since this definition is abstract many of its aspects have a semantic nature and cannot becaptured explicitly. Thus, architecture is expressed through its architecture description:
architecture description: “a work product used to express an architecture”
In this sense, the architecture description is the actual artifact which is produced throughthe effort to capture an architecture. Inherently, an architecture description can havemany facets, corresponding to different aspects of the architecture. Consider, for exam-ple, the architecture of a building. The description contains different plans, for exampleone considering the locations of the pillars and another containing the electrical wiring.The two plans are realizations of two different perspectives, through which the architec-ture description is considered. These perspectives are called architecture viewpoints, anddefined by the ISO 42010 as follows:
architecture viewpoint: “a work product establishing the conventions for the con-struction, interpretation and use of architecture views to frame specific system con-cerns”
The two plans concerning the architecture of the specific building are instances of thosetwo perspectives and are called architecture views:
architecture view: “work product expressing the architecture of a system from theperspective of specific system concerns”
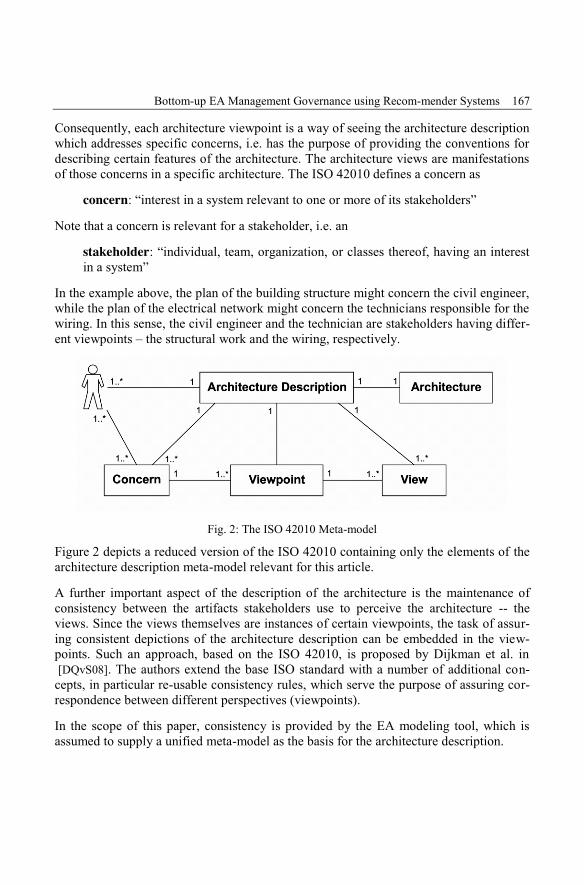
Bottom-up EA Management Governance using Recom-mender Systems 167
Consequently, each architecture viewpoint is a way of seeing the architecture descriptionwhich addresses specific concerns, i.e. has the purpose of providing the conventions fordescribing certain features of the architecture. The architecture views are manifestationsof those concerns in a specific architecture. The ISO 42010 defines a concern as
concern: “interest in a system relevant to one or more of its stakeholders”
Note that a concern is relevant for a stakeholder, i.e. an
stakeholder: “individual, team, organization, or classes thereof, having an interestin a system”
In the example above, the plan of the building structure might concern the civil engineer,while the plan of the electrical network might concern the technicians responsible for thewiring. In this sense, the civil engineer and the technician are stakeholders having differ-ent viewpoints – the structural work and the wiring, respectively.
Fig. 2: The ISO 42010 Meta-model
Figure 2 depicts a reduced version of the ISO 42010 containing only the elements of thearchitecture description meta-model relevant for this article.
A further important aspect of the description of the architecture is the maintenance ofconsistency between the artifacts stakeholders use to perceive the architecture -- theviews. Since the views themselves are instances of certain viewpoints, the task of assur-ing consistent depictions of the architecture description can be embedded in the view-points. Such an approach, based on the ISO 42010, is proposed by Dijkman et al. in[DQvS08]. The authors extend the base ISO standard with a number of additional con-
cepts, in particular re-usable consistency rules, which serve the purpose of assuring cor-respondence between different perspectives (viewpoints).
In the scope of this paper, consistency is provided by the EA modeling tool, which isassumed to supply a unified meta-model as the basis for the architecture description.
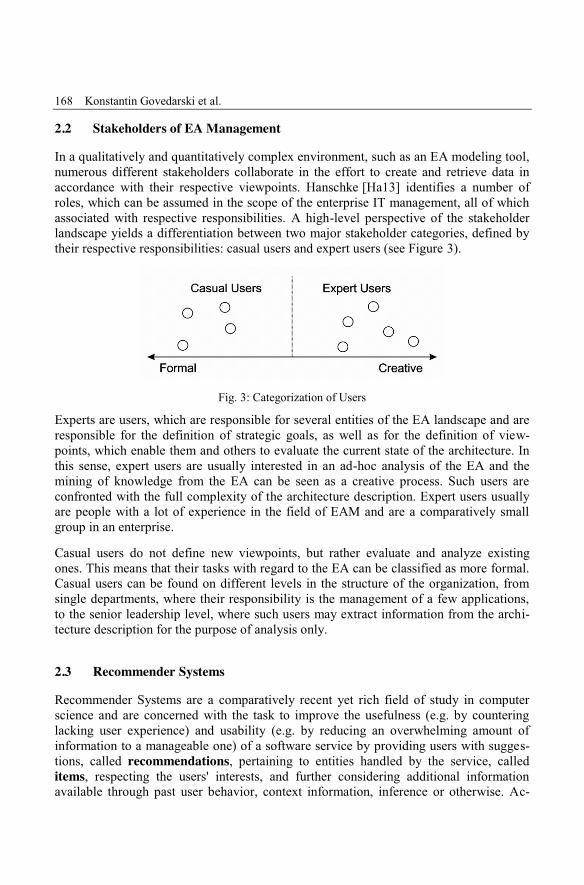
168 Konstantin Govedarski et al.
2.2 Stakeholders of EA ManagementIn a qualitatively and quantitatively complex environment, such as an EA modeling tool,numerous different stakeholders collaborate in the effort to create and retrieve data inaccordance with their respective viewpoints. Hanschke [Ha13] identifies a number ofroles, which can be assumed in the scope of the enterprise IT management, all of whichassociated with respective responsibilities. A high-level perspective of the stakeholderlandscape yields a differentiation between two major stakeholder categories, defined bytheir respective responsibilities: casual users and expert users (see Figure 3).
Fig. 3: Categorization of Users
Experts are users, which are responsible for several entities of the EA landscape and areresponsible for the definition of strategic goals, as well as for the definition of view-points, which enable them and others to evaluate the current state of the architecture. Inthis sense, expert users are usually interested in an ad-hoc analysis of the EA and themining of knowledge from the EA can be seen as a creative process. Such users areconfronted with the full complexity of the architecture description. Expert users usuallyare people with a lot of experience in the field of EAM and are a comparatively smallgroup in an enterprise.
Casual users do not define new viewpoints, but rather evaluate and analyze existingones. This means that their tasks with regard to the EA can be classified as more formal.Casual users can be found on different levels in the structure of the organization, fromsingle departments, where their responsibility is the management of a few applications,to the senior leadership level, where such users may extract information from the archi-tecture description for the purpose of analysis only.
2.3 Recommender SystemsRecommender Systems are a comparatively recent yet rich field of study in computerscience and are concerned with the task to improve the usefulness (e.g. by counteringlacking user experience) and usability (e.g. by reducing an overwhelming amount ofinformation to a manageable one) of a software service by providing users with sugges-tions, called recommendations, pertaining to entities handled by the service, calleditems, respecting the users' interests, and further considering additional informationavailable through past user behavior, context information, inference or otherwise. Ac-
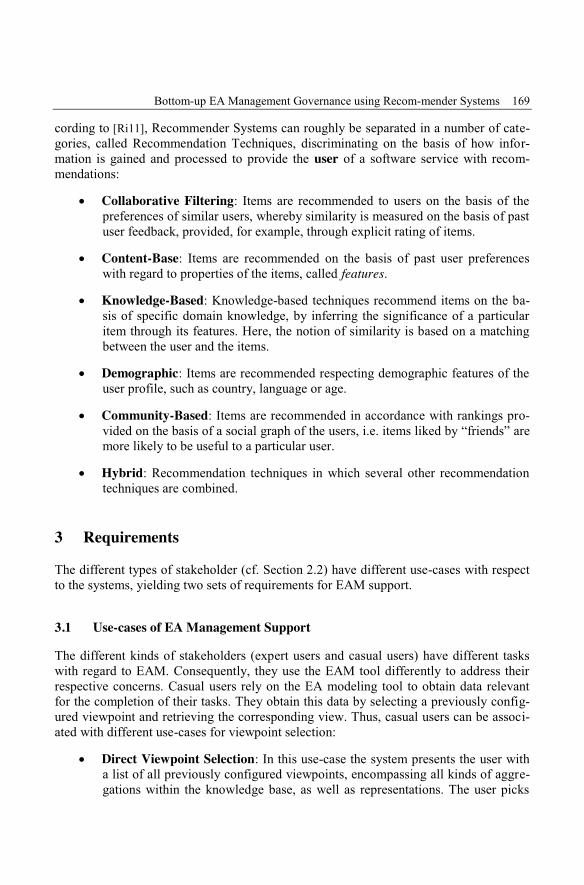
Bottom-up EA Management Governance using Recom-mender Systems 169
cording to [Ri11], Recommender Systems can roughly be separated in a number of cate-gories, called Recommendation Techniques, discriminating on the basis of how infor-mation is gained and processed to provide the user of a software service with recom-mendations:
" Collaborative Filtering: Items are recommended to users on the basis of thepreferences of similar users, whereby similarity is measured on the basis of pastuser feedback, provided, for example, through explicit rating of items.
" Content-Base: Items are recommended on the basis of past user preferenceswith regard to properties of the items, called features.
" Knowledge-Based: Knowledge-based techniques recommend items on the ba-sis of specific domain knowledge, by inferring the significance of a particularitem through its features. Here, the notion of similarity is based on a matchingbetween the user and the items.
" Demographic: Items are recommended respecting demographic features of theuser profile, such as country, language or age.
" Community-Based: Items are recommended in accordance with rankings pro-vided on the basis of a social graph of the users, i.e. items liked by “friends” aremore likely to be useful to a particular user.
" Hybrid: Recommendation techniques in which several other recommendationtechniques are combined.
3 RequirementsThe different types of stakeholder (cf. Section 2.2) have different use-cases with respectto the systems, yielding two sets of requirements for EAM support.
3.1 Use-cases of EA Management SupportThe different kinds of stakeholders (expert users and casual users) have different taskswith regard to EAM. Consequently, they use the EAM tool differently to address theirrespective concerns. Casual users rely on the EA modeling tool to obtain data relevantfor the completion of their tasks. They obtain this data by selecting a previously config-ured viewpoint and retrieving the corresponding view. Thus, casual users can be associ-ated with different use-cases for viewpoint selection:
" Direct Viewpoint Selection: In this use-case the system presents the user witha list of all previously configured viewpoints, encompassing all kinds of aggre-gations within the knowledge base, as well as representations. The user picks
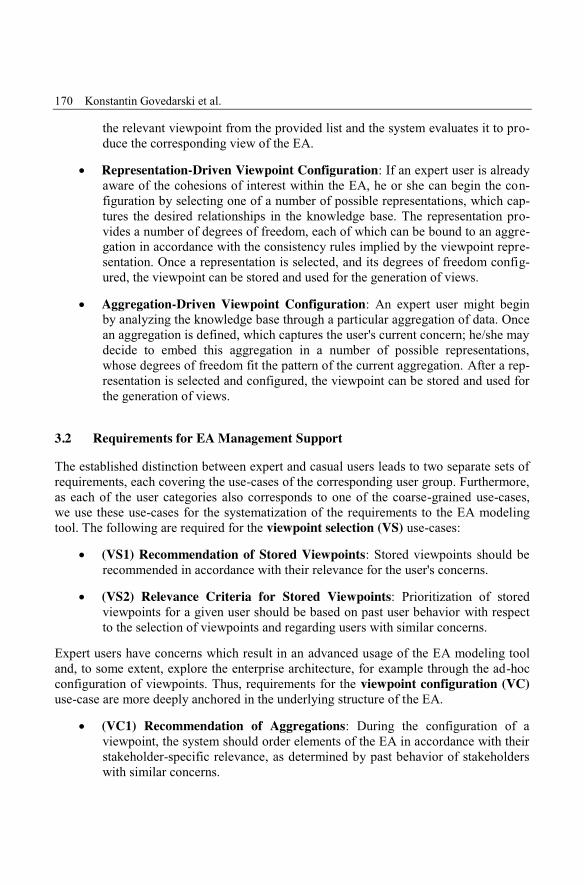
170 Konstantin Govedarski et al.
the relevant viewpoint from the provided list and the system evaluates it to pro-duce the corresponding view of the EA.
" Representation-Driven Viewpoint Configuration: If an expert user is alreadyaware of the cohesions of interest within the EA, he or she can begin the con-figuration by selecting one of a number of possible representations, which cap-tures the desired relationships in the knowledge base. The representation pro-vides a number of degrees of freedom, each of which can be bound to an aggre-gation in accordance with the consistency rules implied by the viewpoint repre-sentation. Once a representation is selected, and its degrees of freedom config-ured, the viewpoint can be stored and used for the generation of views.
" Aggregation-Driven Viewpoint Configuration: An expert user might beginby analyzing the knowledge base through a particular aggregation of data. Oncean aggregation is defined, which captures the user's current concern; he/she maydecide to embed this aggregation in a number of possible representations,whose degrees of freedom fit the pattern of the current aggregation. After a rep-resentation is selected and configured, the viewpoint can be stored and used forthe generation of views.
3.2 Requirements for EA Management SupportThe established distinction between expert and casual users leads to two separate sets ofrequirements, each covering the use-cases of the corresponding user group. Furthermore,as each of the user categories also corresponds to one of the coarse-grained use-cases,we use these use-cases for the systematization of the requirements to the EA modelingtool. The following are required for the viewpoint selection (VS) use-cases:
" (VS1) Recommendation of Stored Viewpoints: Stored viewpoints should berecommended in accordance with their relevance for the user's concerns.
" (VS2) Relevance Criteria for Stored Viewpoints: Prioritization of storedviewpoints for a given user should be based on past user behavior with respectto the selection of viewpoints and regarding users with similar concerns.
Expert users have concerns which result in an advanced usage of the EA modeling tooland, to some extent, explore the enterprise architecture, for example through the ad-hocconfiguration of viewpoints. Thus, requirements for the viewpoint configuration (VC)use-case are more deeply anchored in the underlying structure of the EA.
" (VC1) Recommendation of Aggregations: During the configuration of aviewpoint, the system should order elements of the EA in accordance with theirstakeholder-specific relevance, as determined by past behavior of stakeholderswith similar concerns.
Bottom-up EA Management Governance using Recom-mender Systems 171
" (VC2) Recommendation of Representations: During the configuration of aviewpoint, the system should offer representations and representation configu-rations in accordance with their stakeholder-specific relevance, as determinedby past behavior of stakeholders with similar concerns.
" (VC3) Exploration of Adjacent Configurations: During the configuration of aviewpoint, the system should offer likely aggregation or representation configu-rations based on correlations with past stakeholder behavior, not necessarilyconstrained to stakeholders with similar concerns.
4 Solution IdeaStakeholders utilize viewpoints to address their concerns and perform the managementtasks. The assignment of stakeholders and viewpoints and the entailing responsibilitiesconstitute a key determinant of the management's corresponding governance model.Traditionally, these governance models are defined top-down. The subsequently present-ed approach targets to develop and evolve the governance model bottom-up, i.e., byobserving and analyzing the behavior of the stakeholders.
Key to our approach is the assumption, that any distinct stakeholder has concerns thatcover related areas-of-interest in the overall EA. This means, that any stakeholder isinterested in only a small set of characteristics of the enterprise, while he/she considersthese characteristics in different combinations and different perspectives. This assump-tion is backed by the observations in [NKF94]. They describe, that concerned with amanagement task, stakeholders rely on viewpoints that relate to each other:
" Two viewpoints overlap with respect to the covered concerns, i.e., display oneor more shared characteristics.
" One viewpoint refines another one with respect to the covered concerns, i.e.,provides additional details when it comes to the relevant characteristics.
Our approach leverages aforementioned relationships to identify relevant viewpoints fora stakeholder, based on the viewpoints that the stakeholder already utilized. We furtherdo not assume that relationships between the viewpoints are explicitly stated. Such as-sumption sensibly applies to the field of EA management, where – as discussed in Sec-tion 3.2 – EAM frameworks are organization-specific. Many of these tailored frame-works lack explicit descriptions of the viewpoints, let alone descriptions of their rela-tionships. Consequently, we use mechanisms that observe user behavior to determinerelationships between viewpoints and to make recommendations on viewpoints.
In the terminology of Recommender Systems, the first relevant use-case (viewpointselection) can be addressed by treating predefined viewpoints as items for the Recom-mender System. The second use-case (viewpoint configuration) uses element types,
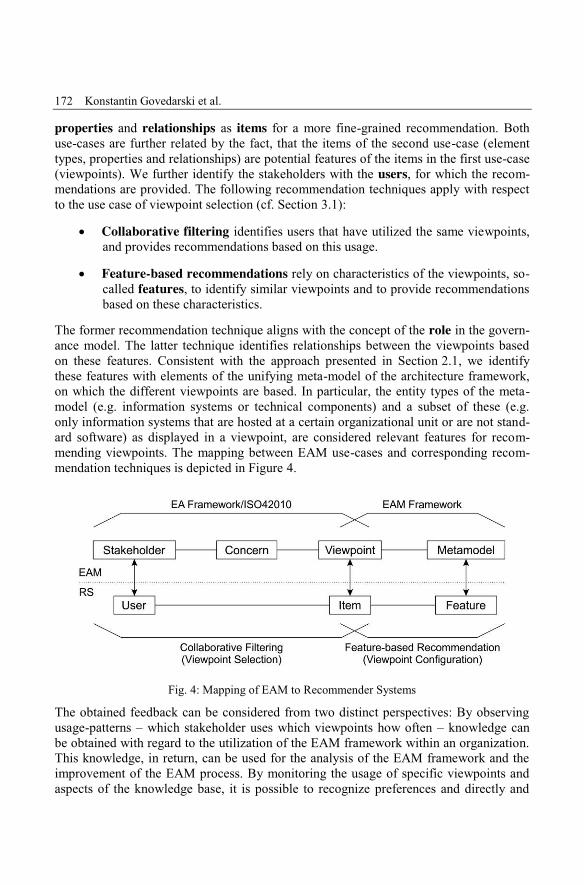
172 Konstantin Govedarski et al.
properties and relationships as items for a more fine-grained recommendation. Bothuse-cases are further related by the fact, that the items of the second use-case (elementtypes, properties and relationships) are potential features of the items in the first use-case(viewpoints). We further identify the stakeholders with the users, for which the recom-mendations are provided. The following recommendation techniques apply with respectto the use case of viewpoint selection (cf. Section 3.1):
" Collaborative filtering identifies users that have utilized the same viewpoints,and provides recommendations based on this usage.
" Feature-based recommendations rely on characteristics of the viewpoints, so-called features, to identify similar viewpoints and to provide recommendationsbased on these characteristics.
The former recommendation technique aligns with the concept of the role in the govern-ance model. The latter technique identifies relationships between the viewpoints basedon these features. Consistent with the approach presented in Section 2.1, we identifythese features with elements of the unifying meta-model of the architecture framework,on which the different viewpoints are based. In particular, the entity types of the meta-model (e.g. information systems or technical components) and a subset of these (e.g.only information systems that are hosted at a certain organizational unit or are not stand-ard software) as displayed in a viewpoint, are considered relevant features for recom-mending viewpoints. The mapping between EAM use-cases and corresponding recom-mendation techniques is depicted in Figure 4.
Fig. 4: Mapping of EAM to Recommender Systems
The obtained feedback can be considered from two distinct perspectives: By observingusage-patterns – which stakeholder uses which viewpoints how often – knowledge canbe obtained with regard to the utilization of the EAM framework within an organization.This knowledge, in return, can be used for the analysis of the EAM framework and theimprovement of the EAM process. By monitoring the usage of specific viewpoints andaspects of the knowledge base, it is possible to recognize preferences and directly and
Bottom-up EA Management Governance using Recom-mender Systems 173
systematically improve the EA framework itself. While analysis of both the EAM andthe EA frameworks is conceivable, direct improvement of the EAM process is not feasi-ble, since it is knowledge-intensive and not portrayed directly in the EAM tool.
5 Experiences, Challenges and OutlookAs a research-in-progress paper we cannot provide a full-fledged implementation nor anvalidation of the above described approach. Open issues and demands for current EAMtool support, however back the need for a bottom-up EAM governance using Recom-mender Systems. The definition of roles is a basic feature of current EA managementtools [Ma08] nevertheless the concept is typically considered from the aspect of authori-zation and access rights. As a tooling company that provides an EAM solution, we re-ceived numerous requests regarding the support of saving and sharing filters, i.e. featuresor meta-model excerpt definitions.
References[Bu11] Buckl, S. M: Developing organization-specific enterprise architecture management
functions using a method base. 2011.
[DQvS08] Dijkman, R. M; Quartel, D. AC; van Sinderen, M. J: Consistency in multi-viewpointdesign of enterprise information systems. Information and Software Technology,50(7):737–752, 2008.
[Ha13] Hanschke, I.: Strategisches Management der IT-Landschaft Ein praktischer Leitfadenfür das Enterprise Architecture Management (3rd edition), Hanser Verlag, 2013.
[IE00] IEEE: IEEE Standard 1471-2000: Recommended Practice for Architectural Descrip-tion of Software-Intensive Systems, 2000.
[ISO11] ISO/IEC/IEEE: Systems and software engineering – Architecture description. Tech-nical standard, 2011.
[Ma08] Matthes, F.; Buckl, S.; Leitel, J.; Schweda, C.M.: Enterprise Architecture ManagementTool Survey 2008. Technical Report, Chair for Informatics 19, Technical University ofMunich, 2008.
[NKF94] Nuseibeh, B.; Kramer, J.; Finkelstein, A.: A Framework for Expressing the Relation-ships Between Multiple Views in Requirements Specification. IEEE Trans. Softw.Eng., 20:760–773, 1994.
[Ri11] Ricci, F.; Rokach, L.; Shapira, B.; Kantor, P. B: Recommender systems handbook,Jgg. 1. Springer, 2011.

Alfred Zimmermann, Alexander Rossmann (Hrsg.): Digital Enterprise Computing 2015,Lecture Notes in Informatics (LNI), Gesellschaft für Informatik, Bonn 2015 175
Goal-oriented Decision Support in CollaborativeEnterprise Architecture
Thomas Hamm1 and Stefan Kehrer2
Abstract: Decision-making in the field of Enterprise Architecture (EA) is a complex task. Manyorganizations establish a set of complex processes and hierarchical structures to enable strategy-driven development of their EA. This leads to slow and inefficient decision-making entailing badtime-to-market and discontented stakeholders. Collaborative EA delineates a lightweight approachto enable EA decisions but often neglects strategic alignment. In this paper, we present an ap-proach to integrate the concept of Collaborative EA and goal-driven decision-making throughcollaborative modeling of goal-oriented information demands based on ArchiMate’s Motivationextension to reach a goal-oriented EA decision support in a collaborative EA environment.
Keywords: Collaborative Enterprise Architecture, ArchiMate Motivation extension, StrategicAlignment, EA Decision Support
1 IntroductionEnterprise Architecture Management (EAM) is a commonly accepted method to supportenterprises in their continuous transformation processes. EAM provides a systematicapproach to enhance transparency, to support business and IT-alignment and to enablethe strategy-driven development of the Enterprise Architecture (EA) as a whole [Ha12].Key to EAM is the systematic evolution of the EA over time. EAM commonly uses amodel-based approach to document the EA as a basis for decision-making. For EA themodeling language ArchiMate is a well-established standard [TOG12]. The complexityof the EA and the impacts of a change over different layers of the EA require the in-volvement of many stakeholders. To handle such a complex system, frameworks likeThe Open Group Architecture Framework (TOGAF) [TOG09] assist organizations witha holistic approach for EAM. The TOGAF Architecture Development Method (ADM)[TOG09] details processes to develop an organization’s EA. Albeit it is a complex andfrustrating task to establish a complex system of EA processes as described in TOGAFand other frameworks. To address this issue lightweight collaborative processes cansupport a manifold stakeholder team to enable well-founded decisions concerning theEA. Bente et al. outline an improvement approach for EA based on the following threeguidelines: (1) Establish a lean set of processes and rules instead of overloading stake-holders with bureaucratic processes and unsolicited artifacts; (2) adopt evolutionaryproblem solving instead of extensively blueprinting the future rigidly on a drawing
1 Reutlingen University, [email protected] Reutlingen University, [email protected]
176 Thomas Hamm and Stefan Kehrer
board; (3) foster and moderate open participation in decisions on the ground instead ofrelying on experts and top-down wisdom [BBL12]. We consider (3) to be a very im-portant capability for Collaborative EA that may conflict with the hierarchical structurefound in many organizations. To reach Collaborative EA with participation in decisionsmany different stakeholders that are locally distributed need to have the possibility tointeract and share information. Nevertheless, the stakeholders need to have a good un-derstanding of the causal effects of the decision alternatives on the organization’s goalsbefore making a decision [JE07]. Whereas Jugel et al. describe a method for document-ing decision-making processes [JSZ15]; we take a step back to focus on the collaborativedecision support of the ArchiMate Motivation extension that can be used to model themotivation of architectural efforts [TOG12]. We use this ArchiMate extension to modeland document relevant motivational knowledge especially needed in collaborative EAprocesses. This can be seen as a basis for EA decision-making in a collaborative EAenvironment.
In this paper, we utilize the approach of Bente et al. to integrate social software plat-forms and EA [BBL12] and add a concept based on the ArchiMate Motivation extension[TOG12] that covers information demands needed to support collaborative EA deci-sions. Thereto we analyze how to enhance the ArchiMate extension to reach a bettergoal-oriented decision support in a collaborative EA environment. We exemplify ourapproach with a collaborative decision-making scenario.
We describe existing approaches towards Collaborative EA, goal-oriented EA decision-making processes and the Motivation extension of the EA modeling language ArchiMatein Section 2. In Section 3 we analyze how to cover additional information demands ofCollaborative EA with the aforementioned ArchiMate extension and add further goingaspects to it. A collaborative decision-making scenario in Section 4 exemplifies the goal-oriented decision support of our enhanced ArchiMate Motivation extension. Section 5sums up our contribution and gives an outlook.
2 Related WorkBente et al. outline an approach for Collaborative EA by describing principles and a setof building blocks [BBL12]. The authors recommend Collaborative EA for improvingEA processes and state that a network of peers under suitable circumstances has a highercapability to shape complex systems than a hierarchical top-down organization. Theretothe authors apply lean and agile principles to the field of EA to enhance flexibility in EAprocesses and to realize their aforementioned guidelines of Collaborative EA. To supportparticipation in EA decisions the authors propose the use of social software platforms tointroduce a concept called IT opportunities bazaar (ITO bazaar). They use the ITO ba-zaar to find new opportunities and evaluate if these opportunities gain sufficient interestby the community. ITOs contain an effort estimation, which can be backed by the com-munity in form of offering a certain amount of work time. If the estimated effort can be
Goal-oriented Decision Support in Collaborative Enterprise Architecture 177
covered by the offered work time, the ITO will be checked by the project portfolio man-agement whether all participants can fulfill their shares. The authors propose the revisionof each ITO by a team of EA specialists before opening for participation as a possibleregulation of the ITO bazaar [BBL12]. We consider the realization of the ITO bazaarwithout any regulation as in conflict with the task of EAM to enable the strategy-drivendevelopment of the EA as a whole proposed by Hanschke [Ha12]. Reviewing ITOsconcerning their business value by a team of EA specialists is a fundamental quality gateto reach strategic alignment of EA shaping projects. This aligns with the integration ofEAM processes and strategic planning outlined by Ahlemann et al. [Ah12]. Bente et al.do not give detailed information about how to review and assess ITOs concerning theirstrategic alignment.
Making good decisions concerning the shape of the EA is very important to the field ofEAM. Johnson et al. recommend a goal-driven approach for EAM to avoid indiscrimi-nate modeling and especially address how to model decision-relevant information[JE07]. Johnson et al. state that architecture-related goals have to be operationalized toprovide a foundation for the decision-making processes. Therefore the authors propose aset of activities needed for decision-making: (1) The decision maker must settle on agoal or success criterion; (2) decision alternatives have to be identified; (3) effects of thedecisions on the goals must be elicited; (4) the decision-maker needs to decide on whatinformation to collect with respect to the different decision alternatives; (5) informationneeds to be collected; (6) collected information has to be consolidated into an aggregatedassessment. (7) Finally the decision needs to be made. These activities underline theneed of a clear understanding of goals and their breakdown to make good decisionsconcerning architectural efforts. Johnson et al. refer to a role called „decision maker“ toaddress the person responsible to decide; they do not focus on how the EAM organiza-tion is structured [JE07]. Whereas these activities can be aggravated by disruptive fac-tors such as unclear goal definitions, a lack of expert knowledge or uncertain informationin a hierarchical organization, these activities can be much more difficult in a collabora-tive EA environment. Collaborative EA is described by Bente et al. as an EA organiza-tion that utilizes a network of peers to shape the EA with lean and agile processes[BBL12]. In particular, these processes are dependent on the competence and the deci-sion-making ability of the engaged stakeholder team.
In general, EAM uses models and visualizations of relevant information to supportstakeholders in their collaborative tasks [Ma08]. Bente et al. mention the use of modelsin their collaborative data modeling approach called objectPedia [BBL12]. Models andvisualizations can be used to support Collaborative EA in describing, documenting andsharing relevant knowledge needed for a goal-oriented decision support in a collabora-tive EA environment. Many enterprise modeling approaches advocate collaborativemodeling concepts and their advantages. Sandkuhl et al. propose a workshop approachfor participatory modeling [Sa14]. The authors deem the involvement of stakeholderswith the best knowledge to be valuable to reach a particular workshop goal. Additionallystakeholders are able to contribute to an architectural effort, which increases the ac-ceptance of created models [Sa14]. We consider collaborative modeling sessions as an
178 Thomas Hamm and Stefan Kehrer
integral part of Collaborative EA. Besides moderation mentioned by Sandkuhl et al.[Sa14], applying collaborative modeling techniques to the field of EA decision-makingentails a focused and goal-oriented process. We propose to establish a lean and standard-ized decision-making process as defined in the aforementioned decision-making activi-ties outlined by Johnson et al. [JE07].
The ArchiMate Motivation extension extends the core language of ArchiMate through ametamodel of motivational concepts [TOG12]. ArchiMate offers the Motivation exten-sion to capture the motivation of architectural efforts and the EA design. The Motivationextension contains the elements Stakeholder, Driver, Assessment, Goal, Principle, Re-quirement and Constraint. A Stakeholder can be the role of an individual, a team or anorganization that has interests related to the EA and can be linked to an element of inter-est. Permitted Stakeholders define, change and emphasize Goals that they intend toachieve in a collaborative manner. A Goal is a desirable end state that a Stakeholderwants to achieve. This can be for example a „reduction of IT operational costs by 10%“.Factors that initiate the process of change within an architecture are called Drivers.Drivers can either be internal or external. Internal Drivers also named as concerns areusually associated with a Stakeholder. This enables transparency especially if it is usedin a collaborative EA environment. Before Goals can be derived from Drivers, the Driv-ers can be analyzed to generate a set of Assessments. Assessments may uncover strength,weaknesses, opportunities and threats of analyzed Drivers. Positive findings can directlybe translated into Goals. Negative findings however have to be translated into Goals thatnegate their effects. Principles and Requirements represent desired properties concerningthe realization of connected Goals. Principles define intended properties that are broaderin scope and more abstract, whereas a Requirement is defined as a concrete statement ofneed that must be realized to achieve a Goal. In contrast to a Requirement, a Constraintis a restriction that has to be respected during the realization [TOG12].
3 Modeling goal-oriented information demandsWe have already seen that modeling of decision-relevant EA aspects can be utilized withthe ArchiMate Motivation extension [TOG12] to support a manifold stakeholder team intheir decision-making tasks. In the following, we investigate which additional modelingdemands are important to document EA specific information that is especially needed incollaborative EA processes. We focus on an exemplary integration of additional ele-ments that are not covered by the ArchiMate extension. Johnson et al. present a goalviewpoint in [JE07] that contains Goals that can be broken down hierarchically; Prob-lems that hinder the achievement of Goals; Initiatives that fulfill a Goal and resolveProblems; and Prerequisites that delimit Initiatives. A Problem that hinders a Goal is anelement that is not mentioned in the ArchiMate extension. Whereas ArchiMate usesAssessments to model weaknesses and threats that can be considered as problems, theyneed to be addressed by Goals that “negate” these weaknesses and threats. There is nopossibility to model problems that hinder the achievement of a Goal itself. We consider
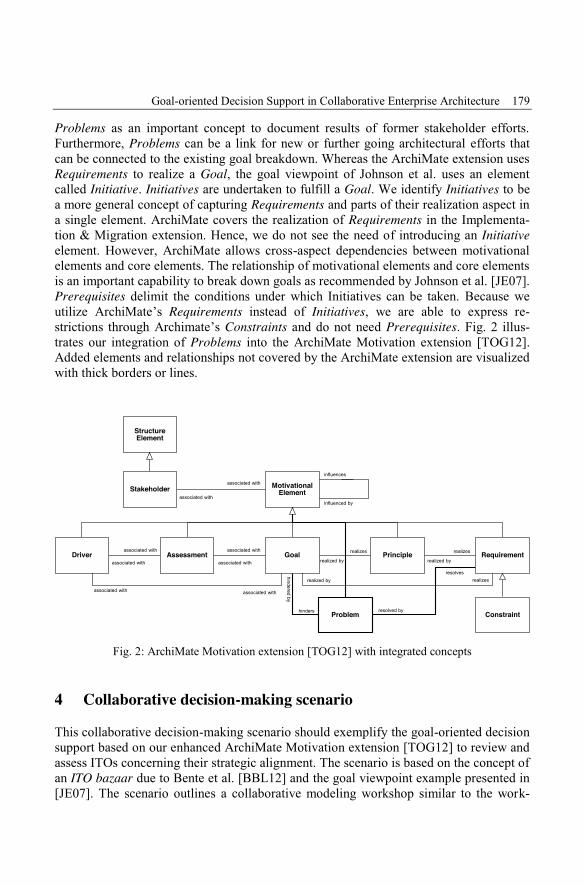
Goal-oriented Decision Support in Collaborative Enterprise Architecture 179
Problems as an important concept to document results of former stakeholder efforts.Furthermore, Problems can be a link for new or further going architectural efforts thatcan be connected to the existing goal breakdown. Whereas the ArchiMate extension usesRequirements to realize a Goal, the goal viewpoint of Johnson et al. uses an elementcalled Initiative. Initiatives are undertaken to fulfill a Goal. We identify Initiatives to bea more general concept of capturing Requirements and parts of their realization aspect ina single element. ArchiMate covers the realization of Requirements in the Implementa-tion & Migration extension. Hence, we do not see the need of introducing an Initiativeelement. However, ArchiMate allows cross-aspect dependencies between motivationalelements and core elements. The relationship of motivational elements and core elementsis an important capability to break down goals as recommended by Johnson et al. [JE07].Prerequisites delimit the conditions under which Initiatives can be taken. Because weutilize ArchiMate’s Requirements instead of Initiatives, we are able to express re-strictions through Archimate’s Constraints and do not need Prerequisites. Fig. 2 illus-trates our integration of Problems into the ArchiMate Motivation extension [TOG12].Added elements and relationships not covered by the ArchiMate extension are visualizedwith thick borders or lines.
MotivationalElement
StructureElement
Problem Constraint
associated with
associated with
associated with associated with
associated with
associated with realized by
realizes
realized by
realizes
realized by realizes
associated with
associated with
influences
influenced by
resolveshinderedby
hinders resolved by
Goal PrincipleAssessmentDriver
Stakeholder
Requirement
Fig. 2: ArchiMate Motivation extension [TOG12] with integrated concepts
4 Collaborative decision-making scenarioThis collaborative decision-making scenario should exemplify the goal-oriented decisionsupport based on our enhanced ArchiMate Motivation extension [TOG12] to review andassess ITOs concerning their strategic alignment. The scenario is based on the concept ofan ITO bazaar due to Bente et al. [BBL12] and the goal viewpoint example presented in[JE07]. The scenario outlines a collaborative modeling workshop similar to the work-
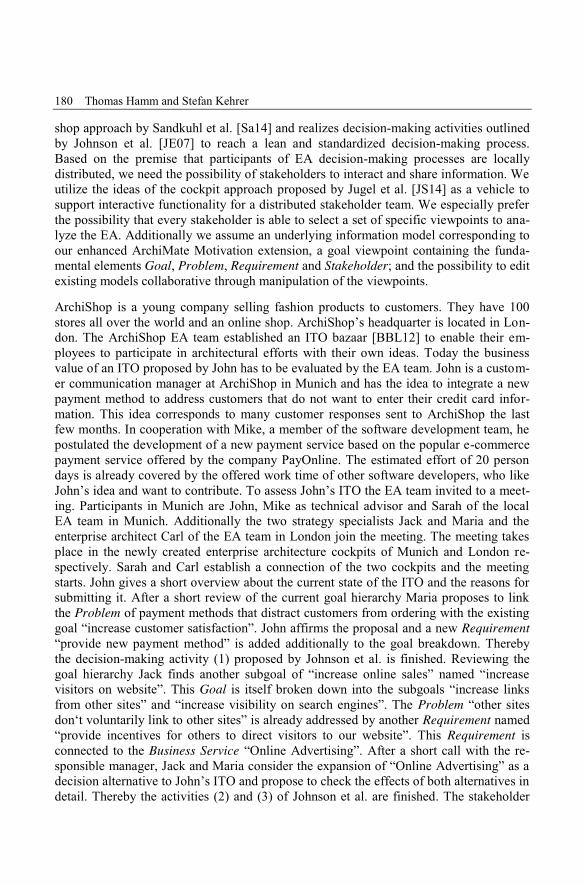
180 Thomas Hamm and Stefan Kehrer
shop approach by Sandkuhl et al. [Sa14] and realizes decision-making activities outlinedby Johnson et al. [JE07] to reach a lean and standardized decision-making process.Based on the premise that participants of EA decision-making processes are locallydistributed, we need the possibility of stakeholders to interact and share information. Weutilize the ideas of the cockpit approach proposed by Jugel et al. [JS14] as a vehicle tosupport interactive functionality for a distributed stakeholder team. We especially preferthe possibility that every stakeholder is able to select a set of specific viewpoints to ana-lyze the EA. Additionally we assume an underlying information model corresponding toour enhanced ArchiMate Motivation extension, a goal viewpoint containing the funda-mental elements Goal, Problem, Requirement and Stakeholder; and the possibility to editexisting models collaborative through manipulation of the viewpoints.
ArchiShop is a young company selling fashion products to customers. They have 100stores all over the world and an online shop. ArchiShop’s headquarter is located in Lon-don. The ArchiShop EA team established an ITO bazaar [BBL12] to enable their em-ployees to participate in architectural efforts with their own ideas. Today the businessvalue of an ITO proposed by John has to be evaluated by the EA team. John is a custom-er communication manager at ArchiShop in Munich and has the idea to integrate a newpayment method to address customers that do not want to enter their credit card infor-mation. This idea corresponds to many customer responses sent to ArchiShop the lastfew months. In cooperation with Mike, a member of the software development team, hepostulated the development of a new payment service based on the popular e-commercepayment service offered by the company PayOnline. The estimated effort of 20 persondays is already covered by the offered work time of other software developers, who likeJohn’s idea and want to contribute. To assess John’s ITO the EA team invited to a meet-ing. Participants in Munich are John, Mike as technical advisor and Sarah of the localEA team in Munich. Additionally the two strategy specialists Jack and Maria and theenterprise architect Carl of the EA team in London join the meeting. The meeting takesplace in the newly created enterprise architecture cockpits of Munich and London re-spectively. Sarah and Carl establish a connection of the two cockpits and the meetingstarts. John gives a short overview about the current state of the ITO and the reasons forsubmitting it. After a short review of the current goal hierarchy Maria proposes to linkthe Problem of payment methods that distract customers from ordering with the existinggoal “increase customer satisfaction”. John affirms the proposal and a new Requirement“provide new payment method” is added additionally to the goal breakdown. Therebythe decision-making activity (1) proposed by Johnson et al. is finished. Reviewing thegoal hierarchy Jack finds another subgoal of “increase online sales” named “increasevisitors on website”. This Goal is itself broken down into the subgoals “increase linksfrom other sites” and “increase visibility on search engines”. The Problem “other sitesdon‘t voluntarily link to other sites” is already addressed by another Requirement named“provide incentives for others to direct visitors to our website”. This Requirement isconnected to the Business Service “Online Advertising”. After a short call with the re-sponsible manager, Jack and Maria consider the expansion of “Online Advertising” as adecision alternative to John’s ITO and propose to check the effects of both alternatives indetail. Thereby the activities (2) and (3) of Johnson et al. are finished. The stakeholder
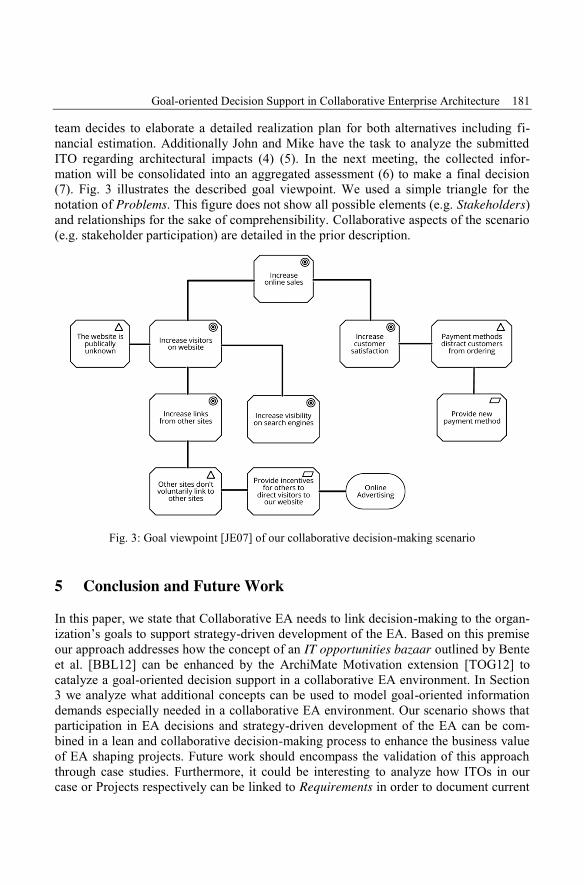
Goal-oriented Decision Support in Collaborative Enterprise Architecture 181
team decides to elaborate a detailed realization plan for both alternatives including fi-nancial estimation. Additionally John and Mike have the task to analyze the submittedITO regarding architectural impacts (4) (5). In the next meeting, the collected infor-mation will be consolidated into an aggregated assessment (6) to make a final decision(7). Fig. 3 illustrates the described goal viewpoint. We used a simple triangle for thenotation of Problems. This figure does not show all possible elements (e.g. Stakeholders)and relationships for the sake of comprehensibility. Collaborative aspects of the scenario(e.g. stakeholder participation) are detailed in the prior description.
Fig. 3: Goal viewpoint [JE07] of our collaborative decision-making scenario
5 Conclusion and Future WorkIn this paper, we state that Collaborative EA needs to link decision-making to the organ-ization’s goals to support strategy-driven development of the EA. Based on this premiseour approach addresses how the concept of an IT opportunities bazaar outlined by Benteet al. [BBL12] can be enhanced by the ArchiMate Motivation extension [TOG12] tocatalyze a goal-oriented decision support in a collaborative EA environment. In Section3 we analyze what additional concepts can be used to model goal-oriented informationdemands especially needed in a collaborative EA environment. Our scenario shows thatparticipation in EA decisions and strategy-driven development of the EA can be com-bined in a lean and collaborative decision-making process to enhance the business valueof EA shaping projects. Future work should encompass the validation of this approachthrough case studies. Furthermore, it could be interesting to analyze how ITOs in ourcase or Projects respectively can be linked to Requirements in order to document current
182 Thomas Hamm and Stefan Kehrer
actions realizing a Requirement. We consider the ArchiMate Implementation and Migra-tion extension [TOG12] to be a good starting point.
However, Collaborative EA as outlined by Bente et al. [BBL12] delineates a new ap-proach of establishing EA processes and is still a young subject in EAM. Research inthis field may be relevant for many organizations in the future because Collaborative EAcan unleash the capability of a collaborative stakeholder team to enable well-founded EAdecisions without entailing slow decision-making through complex processes.
References[Ah12] Ahlemann, F.; Messerschmid, M.; Stettiner, E.; Legner, C.: Strategic Enterprise Archi-
tecture Management - Challenges, Best Practices, and Future Developments. SpringerBerlin Heidelberg, 2012.
[BBL12] Bente, S.; Bombosch, U.; Langade, S.: Collaborative Enterprise Architecture, MorganKaufmann Elsevier, 2012.
[Ha12] Hanschke, I.: Enterprise Architecture Management – einfach und effektiv: Ein prakti-scher Leitfaden für die Einführung von EAM, Hanser Verlag, 2012.
[JE07] Johnson, P.; Ekstedt, M.: Enterprise Architecture – Models and Analyses for Infor-mation Systems Decision Making, Studentlitteratur, 2007.
[JS14] Jugel, D.; Schweda, C.M.: Interactive functions of a Cockpit for Enterprise Architec-ture Planning. In: International Enterprise Distributed Object Computing ConferenceWorkshops and Demonstrations (EDOCW), Ulm, Germany, 2014.
[JSZ15] Jugel, D.; Schweda, C.M.; Zimmermann, A.: Modeling Decisions for CollaborativeEnterprise Architecture Engineering. In: 10th Workshop Trends in Enterprise Archi-tecture Research (TEAR), held on CAISE 2015, Stockholm, Sweden, 2015.
[Ma08] Matthes, F.; Buckl, S.; Leitel, J.; Schweda, C.M.: Enterprise Architecture ManagementTool Survey 2008, Technical Report, 2008.
[Sa14] Sandkuhl, K.; Stirna, J.; Persson, A.; Wißotzki, M.: Enterprise Modeling TacklingBusiness Challenges with the 4EM Method, Springer Berlin Heidelberg, 2014.
[TOG09] The Open Group: The Open Group Architecture Framework (TOGAF), Version 9,2009.
[TOG12] The Open Group: ArchiMate 2.0 Specification, 2012.
Alfred Zimmermann, Alexander Rossmann (Hrsg.): Digital Enterprise Computing 2015,Lecture Notes in Informatics (LNI), Gesellschaft für Informatik, Bonn 2015 183
Evolving Enterprise Architectures for DigitalTransformations
Alfred Zimmermann1, Rainer Schmidt2, Dierk Jugel1,3 and Michael Möhring4
Abstract: The digital transformation of our society changes the way we live, work, learn, com-municate, and collaborate. This disruptive change interacts with all information processes andsystems that are important business enablers for the digital transformation since years. The Internetof Things, Social Collaboration Systems for Adaptive Case Management, Mobility Systems andServices for Big Data in Cloud Services environments are emerging to support intelligent user-centered and social community systems. They will shape future trends of business innovation andthe next wave of information and communication technology. Biological metaphors of living andadaptable ecosystems provide the logical foundation for self-optimizing and resilient run-timeenvironments for intelligent business services and related distributed information systems withservice-oriented enterprise architectures. The present research investigates mechanisms for flexibleadaptation and evolution of Digital Enterprise Architectures in the context of integrated synergisticdisciplines like distributed service-oriented Architectures and Information Systems, EAM - Enter-prise Architecture and Management, Metamodeling, Semantic Technologies, Web Services, CloudComputing and Big Data technology. Our aim is to support flexibility and agile transformationsfor both business domains and related enterprise systems through adaptation and evolution ofdigital enterprise architectures. The present research paper investigates digital transformations ofbusiness and IT and integrates fundamental mappings between adaptable digital enterprise archi-tectures and service-oriented information systems.
Keywords: Digital Transformation, Digital Enterprise Architecture, Service-oriented InformationSystems, Metamodel Integration Method, Adaptable Services and Systems
1 IntroductionInformation, data and knowledge are fundamental concepts of our everyday activities.Social networks, smart portable devices, and intelligent cars, represent only a few in-stances of a pervasive, information-driven vision [PF91] for the next wave of the digitaleconomy and better-aligned information systems. Currently some major trends for digi-tal enterprise transformation are investigated by [Le14]:
1. Digitization of products and services: products and services are enriched with value-added services or are completely digitized,
1 Reutlingen University, {alfred.zimmermann, dierk.jugel}@reutlingen-university.de}2 Munich University, {[email protected]}3 University of Rostock, {[email protected]}4 Aalen University, {[email protected]}
184 Alfred Zimmermann et al.
2. Context-sensitive value creation: though popularity of mobile devices location con-texts are used more frequently and enable on demand customized solutions,
3. Consumerization of IT: One of the challenges is the safe integration of mobile de-vices into a managed enterprise architecture for both business and IT,
4. Digitization of work: Today it is much easier to work together over large distances,which allows often an uncomplicated outsourcing of business tasks,
5. Digitization of business models: Businesses need to adapt and have to rethink theirbusiness models to develop innovative business models according to employees’current skills and competencies.
Enterprise Architecture Management [Zi11] and Services Computing is the approach ofchoice to organize, build and utilize distributed capabilities for Digital Transformation[Ai11]. They provide flexibility and agility in business and IT systems. The developmentof such applications integrates Web and REST Services, Cloud Computing and Big Datamanagement, among other frameworks and methods for architectural semantic support.Today’s information systems span a broad range of domains including: intelligent mobil-ity systems and services, intelligent energy support systems, smart personal health-caresystems and services, intelligent transportation and logistics services, smart environmen-tal systems and services, intelligent systems and software engineering, intelligent engi-neering and manufacturing.
Platform Ecosystems [Ti13] like Amazon, Google, Apple, and Facebook are integratedwith enterprise systems and have to support flexible transformation patterns for adapta-ble Digital Enterprise Architecture. In our understanding of the vision - adaptable andevolutionary information systems and Enterprise Architectures are self-optimizing sys-tems, which have self-healing properties of distributed service-oriented environmentswith evolutionary service-oriented Enterprise Architectures. The technological and busi-ness architectural impact of Digital Transformation has multiple aspects, which directlyaffect adaptable Digital Enterprise Architectures and their supported systems. Smartcompanies are extending their capabilities continuously to manage their changing Busi-ness Operating Model [Ro06] by developing and managing Enterprise Architectures asthe architectural part of a changing IT Governance [WR04].
In our current research we are extending our first version of the Enterprise Services Ar-chitecture Reference Cube (ESARC) [Zi11], [Zi13b], and [SM13] by mechanisms forarchitectural integration and evolution to support adaptable information systems andarchitectural transformations for transformable business models. ESARC is an integralService-oriented Enterprise Architecture classification framework, which sets a concep-tual baseline for analyzed Enterprise Architecture models. ESARC makes it possible toverify, define and track the improvement path of different business and IT changes con-sidering alternative business operating models, business functions and business process-es, enterprise services and systems, their architectures and related cloud-enabled tech-nologies, like infrastructures and platforms as a service. We are interested in a discussion
Evolving Enterprise Architectures for Digital Transformations 185
about our approach of evolving Enterprise Architecture to support Digital Transfor-mations. The novelty in our current research about digital enterprise Architectures com-prises new aspects for architectural evolution and integration methods as an instrumentto guide digital transformation endeavors.
The following Section 2 describes our research platform for Digital Enterprise Architec-ture, which is a starting point of our mapping approach and scope for agile and adaptableinformation systems. Section 3 extends our previous Architecture Metamodel IntegrationMethod and covers the seeding research for agile adaptable and transformable enterprisearchitectures and systems. Finally, we summarize in Section 4 our research findings, ourongoing validations in academic and practical environments and our future researchplans.
2 Digital Enterprise ArchitectureThe discipline of Enterprise Architecture Management (EAM) [Jo14], [La13], [Be12]defines today with frameworks, standards [To11] and [Ar12], tools and practical exper-tise a quite large set of different views and perspectives. These abundance of ingredientsfor EAM leads in practice often to a “heavy EA” approach, which is not always feasibleenough to support practical initiatives of software development and maintenance withina living and changing business and system environment. We argue in this paper that anew refocused service-oriented EA approach should be both holistic [Zi11] and [Zi13b]and easily adaptable [Zi14] for practical support of software evolution and transfor-mation of information systems in growing business and IT environments, which arebased on new technologies like social software, big data, services & cloud computing,mobility platforms and systems, security systems, and semantics support.
We have developed our integration approach in [Zi13a] to unify and integrate most valu-able parts of existing EA frameworks and metamodels from theory and practice. Ourapproach, which is based on correlation matrixes, is economically focused and sparinglydriven by preventing us to integrate every existing or unusable feature. According to[Bu11] we are building the conceptualization of EA in 4 steps – from stakeholders’needs, to the concerns of stakeholders, then the extraction of concepts, and last but notleast the definition of relationships for new tailored EA models. In our current researchwe are using the BEAMS Modeling Method [Sc11] and [Sc11] to model systematicallythe conceptual base for new tailored functions of our reference enterprise architecture forplatform and application ecosystems.
The BEAMS methodology contains an activity method framework [Sc11] with buildingblocks for supporting continuous and self maintaining management functions for EA byprocesses like: develop & describe, communicate & enact, analyze and evaluate, as wellas configure and adapt. Additionally to the mentioned Method Building Blocks BEAMSprovides through [Sc11] important Language Building Blocks to describe the metamodelof EA information. The Information Building Blocks from [Sc11] give support for the
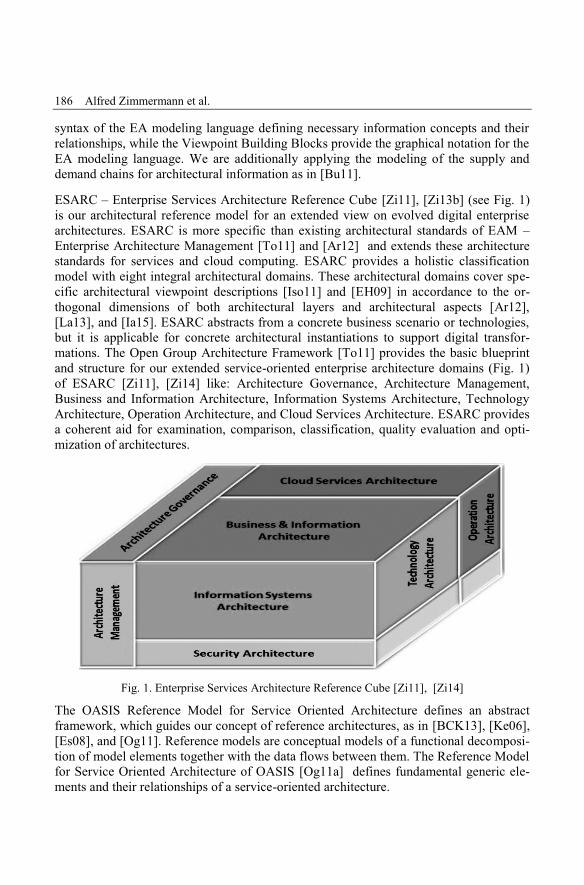
186 Alfred Zimmermann et al.
syntax of the EA modeling language defining necessary information concepts and theirrelationships, while the Viewpoint Building Blocks provide the graphical notation for theEA modeling language. We are additionally applying the modeling of the supply anddemand chains for architectural information as in [Bu11].
ESARC – Enterprise Services Architecture Reference Cube [Zi11], [Zi13b] (see Fig. 1)is our architectural reference model for an extended view on evolved digital enterprisearchitectures. ESARC is more specific than existing architectural standards of EAM –Enterprise Architecture Management [To11] and [Ar12] and extends these architecturestandards for services and cloud computing. ESARC provides a holistic classificationmodel with eight integral architectural domains. These architectural domains cover spe-cific architectural viewpoint descriptions [Iso11] and [EH09] in accordance to the or-thogonal dimensions of both architectural layers and architectural aspects [Ar12],[La13], and [Ia15]. ESARC abstracts from a concrete business scenario or technologies,but it is applicable for concrete architectural instantiations to support digital transfor-mations. The Open Group Architecture Framework [To11] provides the basic blueprintand structure for our extended service-oriented enterprise architecture domains (Fig. 1)of ESARC [Zi11], [Zi14] like: Architecture Governance, Architecture Management,Business and Information Architecture, Information Systems Architecture, TechnologyArchitecture, Operation Architecture, and Cloud Services Architecture. ESARC providesa coherent aid for examination, comparison, classification, quality evaluation and opti-mization of architectures.
Fig. 1. Enterprise Services Architecture Reference Cube [Zi11], [Zi14]
The OASIS Reference Model for Service Oriented Architecture defines an abstractframework, which guides our concept of reference architectures, as in [BCK13], [Ke06],[Es08], and [Og11]. Reference models are conceptual models of a functional decomposi-tion of model elements together with the data flows between them. The Reference Modelfor Service Oriented Architecture of OASIS [Og11a] defines fundamental generic ele-ments and their relationships of a service-oriented architecture.
Evolving Enterprise Architectures for Digital Transformations 187
Architecture Governance, as in [WR04] and [Ro06] defines and maintains the Architec-ture Governance Cycle. It sets the abstract governance frame for concrete architectureactivities within the enterprise or a product line or ecosystem development and specifiesthe following management activities: plan, define, enable, measure, and control. Thesecond aim of Architecture Governance is to foster the business-IT alignment and definerules for architecture compliance related to internal and external standards. The integra-tion of business-IT alignment is very important to support the business goals. Therefore,the standing of the IT department can be improved. In the past, IT departments weredefined as a collection of risks as well as a cost driver. Enterprise and software architectsare acting on a sophisticated connection path emanating from business and IT strategy tothe architecture landscape realization for interrelated business domains, applications andtechnologies.
The Business and Information Reference Architecture - BIRA [Zi11] [Zi14] provides,for instance, a single source and comprehensive repository of knowledge from whichconcrete corporate initiatives will evolve and link. This knowledge is model-based anddefines an integrated enterprise business model, which includes organization models andbusiness processes. The BIRA opens a connection to IT infrastructures, IT systems, andsoftware as well as security architectures. The BIRA confers the basis for business-ITalignment and therefore models the business and information strategy, the organization,and main business demands as well as requirements for information systems, such as keybusiness processes, business rules, business products, services, and related businesscontrol information.
The Information Systems Reference Architecture – ISRA [Zi11] [Zi14] is the applicationreference architecture and contains main application-specific service types, defining theirrelationship by a layer model of building services. The core functionality of domainservices is linked with application interaction services and with the business processes ofthe customer organization. In our research we are considering the standard referencemodels [Ke06] and reference architectures [Es08] and [Og11a] for services computing.We have differentiated a consistent set of layered service types (Fig. 2).
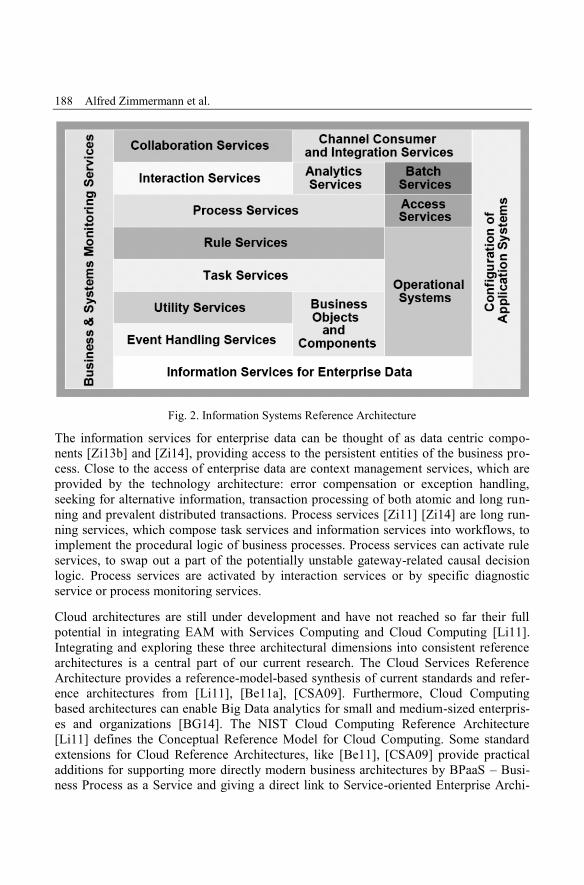
188 Alfred Zimmermann et al.
Fig. 2. Information Systems Reference Architecture
The information services for enterprise data can be thought of as data centric compo-nents [Zi13b] and [Zi14], providing access to the persistent entities of the business pro-cess. Close to the access of enterprise data are context management services, which areprovided by the technology architecture: error compensation or exception handling,seeking for alternative information, transaction processing of both atomic and long run-ning and prevalent distributed transactions. Process services [Zi11] [Zi14] are long run-ning services, which compose task services and information services into workflows, toimplement the procedural logic of business processes. Process services can activate ruleservices, to swap out a part of the potentially unstable gateway-related causal decisionlogic. Process services are activated by interaction services or by specific diagnosticservice or process monitoring services.
Cloud architectures are still under development and have not reached so far their fullpotential in integrating EAM with Services Computing and Cloud Computing [Li11].Integrating and exploring these three architectural dimensions into consistent referencearchitectures is a central part of our current research. The Cloud Services ReferenceArchitecture provides a reference-model-based synthesis of current standards and refer-ence architectures from [Li11], [Be11a], [CSA09]. Furthermore, Cloud Computingbased architectures can enable Big Data analytics for small and medium-sized enterpris-es and organizations [BG14]. The NIST Cloud Computing Reference Architecture[Li11] defines the Conceptual Reference Model for Cloud Computing. Some standardextensions for Cloud Reference Architectures, like [Be11], [CSA09] provide practicaladditions for supporting more directly modern business architectures by BPaaS – Busi-ness Process as a Service and giving a direct link to Service-oriented Enterprise Archi-
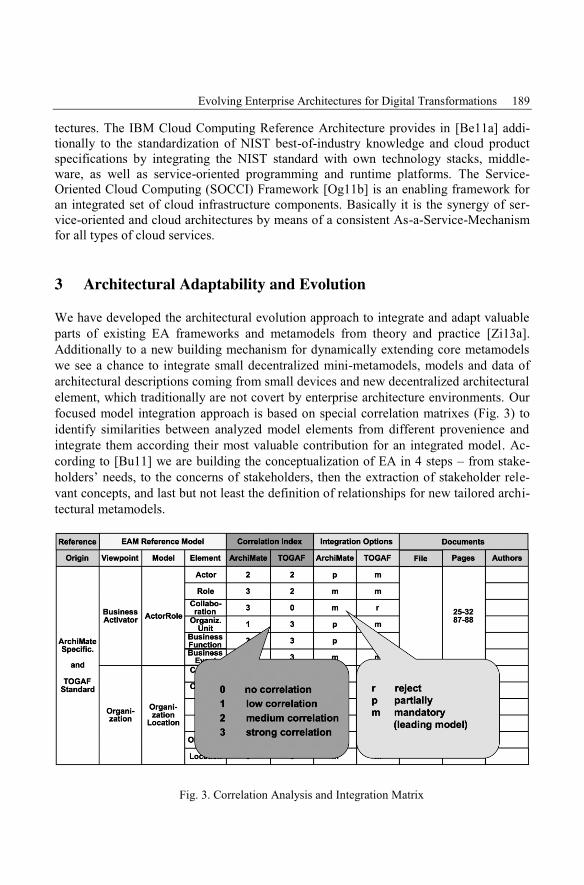
Evolving Enterprise Architectures for Digital Transformations 189
tectures. The IBM Cloud Computing Reference Architecture provides in [Be11a] addi-tionally to the standardization of NIST best-of-industry knowledge and cloud productspecifications by integrating the NIST standard with own technology stacks, middle-ware, as well as service-oriented programming and runtime platforms. The Service-Oriented Cloud Computing (SOCCI) Framework [Og11b] is an enabling framework foran integrated set of cloud infrastructure components. Basically it is the synergy of ser-vice-oriented and cloud architectures by means of a consistent As-a-Service-Mechanismfor all types of cloud services.
3 Architectural Adaptability and EvolutionWe have developed the architectural evolution approach to integrate and adapt valuableparts of existing EA frameworks and metamodels from theory and practice [Zi13a].Additionally to a new building mechanism for dynamically extending core metamodelswe see a chance to integrate small decentralized mini-metamodels, models and data ofarchitectural descriptions coming from small devices and new decentralized architecturalelement, which traditionally are not covert by enterprise architecture environments. Ourfocused model integration approach is based on special correlation matrixes (Fig. 3) toidentify similarities between analyzed model elements from different provenience andintegrate them according their most valuable contribution for an integrated model. Ac-cording to [Bu11] we are building the conceptualization of EA in 4 steps – from stake-holders’ needs, to the concerns of stakeholders, then the extraction of stakeholder rele-vant concepts, and last but not least the definition of relationships for new tailored archi-tectural metamodels.
Fig. 3. Correlation Analysis and Integration Matrix
190 Alfred Zimmermann et al.
First we analyze and transform given architecture resources with concept maps and ex-tract their coarse-grained aspects in a standard way [Zi13a] by delimiting architectureviewpoints [La13], [Iso11], architecture models [Ia15], their elements, and illustratingthese models by a typical example. Architecture viewpoints are representing and group-ing conceptual business and technology functions regardless of their implementationresources like people, processes, information, systems, or technologies. They extendthese information by additional aspects like quality criteria, service levels, KPI, costs,risks, compliance criteria a. o. We have adopted modeling concepts from ISO/IEC 42010[Iso11], [EH09] like Architecture Description, Viewpoint, View, and Model. Architec-tural metamodels are composed of their elements and relationships, and are representedby architecture diagrams.
We are extending architecture metamodels as an abstraction for architectural elementsand relate them to architectural ontologies [Zi13a], [An13]. Ontologies are a base forsemantic modeling of digital enterprise architectures in a most flexible way. As men-tioned in this section, integration of enterprise architectural elements is a complex task,which is today mainly supported by human effort and integration methodologies, andonly additionally by some challenging federated approaches [Fa12], [Tr15] for automat-ed Enterprise Architecture model maintenance. We believe that a part of this manualintegration could be automated or supported by architectural cockpits, if we better un-derstand the analysis approaches [BMS09] and collaborative architectural decisionmechanisms [Be12], [JE07], [JS14], and [JSZ15] for easy adaptable digital enterprisearchitectures as a base for the digital business transformation.
We have adopted an agile manageable spectrum of multi-attribute analysis metamodelsand related architectural viewpoints from [Jo14] to support adaptable enterprise architec-tures: application modifiability, data accuracy, application usage, service availability,interoperability, cost, and utility. We have extracted the idea of digital ecosystems from[Ti13] and linked this with main strategic drivers for system development and their evo-lution. Core concepts of ecosystem’s enterprise architectures are based in our approachon specific microarchitectures, which are placed in the context of Internet systems. Thepreferred mechanisms for modularization rely on decoupling and on interface standardi-zation. Architecture governance models show the way to achieve adaptable ecosystemsand to orchestrate the platform evolution.
The potential value of EA for SMEs [BG14] involves benefits like: agility to adjustecosystems to changing environments, strategy planning and decision making, continu-ous business/IT alignment, management of complexity, integration of business process-es, unify and integrate data and link with external partners, and achieve more value forIT. The focus of the ADaPPT [Sh11] EA approach is on primarily aligning four strategicEA domain elements: people, processes, data, and technologies.
We are currently integrating the perspectives of agile software models [He06], [Sa10]for an adaptable enterprise architecture management, and extend the agility perspectivefor EA in SMEs with aspects of Data Consistency and Big Data [Be13] for EAM. Addi-
Evolving Enterprise Architectures for Digital Transformations 191
tionally to the state of science we are currently analyzing and integrating EAM capabil-ity models from both industrial partners and from EA tools.
From the point of view of modeling adaptive EA metamodels we got inspirations fromthe Adaptive Object-Model Architectural Style, promoted by [Yo02] to enable flexibilityand run-time system configuration. Business rules are explicitly represented and storedoutside of the program code. The power of this approach is that business architects canflexibly and easily configure the adaptive object model at runtime. Patterns of Object-Oriented Meta-Architectures from [Fe10] enables reflective architectures, which are ableto inspect and dynamically adapt their structure and behavior at run time. Three corepatterns can be located in most object-oriented meta-architectures: Everything is aThing, Closing the Roof, and Bootstrapping.
Adaptation drives the survival [Ti13], [He04], [Be11b] of enterprise architectures[Ha10], platforms and application ecosystems. Adapting rapidly to new technology andmarket contexts improves the fitness of adaptive ecosystems. Volatile technologies andmarkets typically drive the evolution of ecosystems. Also we have to consider internalfactors. Most important for supporting the evolution of ecosystems is the systematicarchitecture-governance alignment. Both are critical factors, which affect the ecosys-tem-wide motivation and the ability to innovate ecosystem structures and change pro-cesses. The alignment of Architecture-Governance shapes resiliency, scalability andcomposability of components and services for distributed information systems.
4 Conclusion and Future WorkIn this paper, we have introduced a new perspective for adaptable enterprise architec-tures, which is model-based and relies on main EA standards, technologies and agilebusiness models. Decision support for EA should be based on fundamental EA analyticsand profound EA models and accurate EA data, showing main dependencies and impactsfor practical interventions on business and IT. EA knowledge at the level of differentstakeholders is still quite poor and should be part of our attention and support by know-ledge-based systems and special knowledge dissemination and certification programs.
We have developed a metamodel-based EA model extraction and integration approachfor enterprise architecture viewpoints, models, standards, frameworks and tools for EAMtowards consistent semantic-supported service-oriented reference enterprise architecturesin cloud environments. The presented architectural classification and integration ap-proach supports new architectural integration aspects for the Internet of Things and othersmall or mobile environments as well. Our goal is to be able to better support architec-ture development, assessments, architecture diagnostics, monitoring with decision sup-port, and optimization of the business, information systems, and technologies. We intendto provide a unified and consistent ontology-based EAM-methodology for the architec-ture management models of relevant information resources, especially for service-oriented and cloud computing systems. Today we additionally observe companies adopt-
192 Alfred Zimmermann et al.
ing a three level architecture: On the basic level the classic systems of records, on afurther level the systems of differentiation, and at the third level new IT opportunities forthe systems of innovation. Expanding the classical EAM agenda thru ontology supportwith business rules and metamodel updating we see the chance for future work and re-search.
We contribute to the current IS literature by introducing this new perspective for adapta-ble digital enterprise architectures. EA managers can benefit from new knowledge aboutadaptable enterprise architectures and can use it for decision support and can reduceoperational risks. Some limitations (e.g. use and adoption in different sectors) must beconsidered. Future research can adopt and evaluate our results for EAM and can take alook at the use in different industry sectors.
References[Ai11] Aier, S. et al.: Towards a More Integrated EA Planning: Linking Transformation Plan-
ning with Evolutionary Change. In: Proceedings of EMISA 2011, Hamburg, Germany,2011; pp. 23-36
[An13] Antunes, G. et al.: Using Ontologies for Enterprise Architecture Analysis. In: 17th IEEE-International Enterprise Distributed Object Computing Conference Workshops, 2013;pp. 361-368
[Ar12] The Open Group: Archimate 2.0 Specification. Van Haren Publishing, 2012.[BCK13] Bass, C., Clements, P., Kazman, R.: Software Architecture in Practice. Addison Wesley,
2013.[Be11a] Behrendt, M., Glaser, B., Kopp, P., Diekmann, R., Breiter, G., Pappe, S., Kreger, H., and
Arsanjani, A.: Introduction and Architecture Overview – IBM Cloud Computing Refer-ence Architecture 2.0. IBM, 2011.
[Be11b] Bertossi, L.: Database Repairing and Consistent Query Answering. Morgan & ClaypoolPublishers, 2011.
[Be12] Bente, S. et al.: Collaborative Enterprise Architecture. Morgan Kaufmann, 2012.[Be13] Berman, J.J.: Principles of Big Data. Morgan Kaufmann, 2013.[BG14] Van Belle, J-P. and Giqwa, L., The Potential of Enterprise Architectureal Thinking for
Small Enterprises: An Exploratory South African Study. International Journal of Ad-vanced Research in Business, Vol. 1, No. 3, 2014; pp. 22-29
[BMS09]Buckl, S., Matthes, F., Schweda, C.M.: Classifying Enterprise Architecture AnalysisApproaches. In: The 2nd IFIP WG5.8 Workshop on Enterprise Interoperability(IWEI'2009), Valencia, Spain, 2009; pp. 66-79
[Bu11] Buckl, S. et al.: Modeling the supply and demand of architectural information on enter-prise level. 15th IEEE International EDOC Conference 2011, Helsinki, Finland, 2011;pp. 44-51
[CSA09] CSA Cloud Security Alliance: Security Guidance for Critical Areas of Focus In CloudComputing V2.1”, 2009.
[EH09] Emery, D., Hilliard, R.: Every Architecture Description needs a Framework: ExpressingArchitecture Frameworks Using ISO/IEC 42010. IEEE/IFIP WICSA/ECSA, 2009; pp.31-39
[Es08] Estefan, J. A., et al.: OASIS Reference Architecture for Service Oriented Architecture.Version 1.0, OASIS Public Review Draft 1, April 23, 2008.
Evolving Enterprise Architectures for Digital Transformations 193
[Fa12] Farwick, M. et al.: A Meta-Model for Automated Enterprise Architecture Model Mainte-nance. EDOC 2012; pp. 1-10
[Fe10] Ferreira, H.S., Correia, F.F., Yoder, J., Aguiar, A.: Core Patterns of Object-OrientedMeta-Architecture. ACM-PLoP Conference October 16-18, 2010, Reno/Tahoe, Nevada,USA, 2010.
[He04] Heistacher, T. et al.: Pervasive service architecture for a digital business ecosystem.arXiv preprint cs/0408047, 2004.
[He06] Hendrickx, W., Gorissen, D., Dhaene, T.: GRID Enabled Sequential Design and Adap-tive Metamodeling. IEEE Proceedings of the 2006 Winter Simulation Conference, 2006,pp. 872-881
[Ia15] Iacob, M.-E. et al.: Delivering Business Outcome with TOGAF® and ArchiMate®.eBook BiZZdesign, 2015.
[Iso11] ISO/IEC/IEEE: Systems and Software Engineering – Architecture Description. Tech-nical Standard, 2011.
[JE07] Johnson, P., Ekstedt, M.: Enterprise Architecture – Models and Analyses for InformationSystems Decision Making, Studentliteratur, 2007.
[Jo14] Johnson, P. et al.: IT Management with Enterprise Architecture. KTH, Stockholm, 2014.[JS14] Jugel, D., Schweda, C.M.: Interactive functions of a Cockpit for Enterprise Architecture
Planning. In: International Enterprise Distributed Object Computing Conference Work-shops and Demonstrations (EDOCW), Ulm, Germany, 2014; pp. 33-40
[JSZ15] Jugel, D., Schweda, C.M., Zimmermann, A.:Modeling Decisions for Collaborative En-terprise Architecture Engineering. In: 10th Workshop Trends in Enterprise ArchitectureResearch (TEAR), held on CAISE 2015, Stockholm, Sweden, 2015.
[Ke06] MacKenzie, et al.: OASIS Reference Model for Service Oriented Architecture 1.0. OA-SIS Standard, 2006.
[La13] Lankhorst, M. et al.: Enterprise Architecture at Work: Modelling, Communication andAnalysis. Springer, 2013.
[Le14] Leimeister, J. M. et al.: Research Program “Digital Business Transformation HSG”. In:Working Paper Services of University of St. Gallen’s Institute of Information Manage-ment, No. 1, St. Gallen, Switzerland, 2014.
[Li11] Liu, F. et al.: NIST Cloud Computing Reference Architecture. NIST special publication,2011.
[Og11a] Open Group: SOA Reference Architecture. The Open Group, 2011.[Og11b] Open Group 2011. Service-Oriented Cloud Computing Infrastructure (SOCCI) Frame-
work. The Open Group, 2011.[PF91] Piateski, G., Frawley, W.: Knowledge discovery in databases. MIT Press, 1991[Ro06] Ross, J. W. et al.: Enterprise Architecture as Strategy – Creating a Foundation for Busi-
ness Execution. Harvard Business School Press, Harvard Business School Press, 2006.[Sa10] Saat, J., Franke, U., Lagerström, R., Ekstedt, M.: Enterprise Architecture Meta Models
for IT/Business Alignment Situations. IEEE-EDOC Conference 2010, Vitoria, Brazil,2010.
[SM13] Schmidt, R., Möhring, M.: Strategic alignment of Cloud-based Architectures for BigData. Proceedings of the 17th IEEE International Enterprise Distributed Object Compu-ting Conference Workshops EDOCW Vancouver, Canada, 2013; pp. 136–143
[Sc11] Schweda, C. M.: Development of organization-specific enterprise architecture modelinglanguages using building blocks, TUM Munich, Germany, PhD-Thesis, 2011.
[Sc14] Schmidt, R. et al.: Towards a Framework for Enterprise Architecture Analytics. In Pro-ceedings of the 18th IEEE International Enterprise Distributed Object Computing Con-ference Workshops (EDOCW), Ulm / Germany, 2014; pp. 266-275

194 Alfred Zimmermann et al.
[Sc15] Schmidt, R. et al.: Social-Software-based Support for Enterprise Architecture Manage-ment Processes. International BPM 2014 Conference Workshops, Eindhoven, 2014,LNBIP, Springer 2015.
[Sh11] Shah, H. and Godler, P.: ADaPPT: Enterprise Architecture Thinking for InformationSystems Development. IJCSI International Journal of Computer Science Issues, Vol. 8,Issue 1, January, 2011.
[Ti13] Tiwana, A.: Platform Ecosystems: Aligning Architecture, Governance, and Strategy.Morgan Kaufmann, 2013.
[To11] The Open Group: TOGAF Version 9.1. Van Haren Publishing, 2011.[Tr15] Trojer, T. et. Al.: Living Modeling of IT Architectures: Challenges and Solutions. Soft-
ware, Services, and Systems 2015; pp. 458-474[WR04] Weill, P., Ross, J. W.: It Governance: How Top Performers Manage It Decision Rights
for Superior Results. Harvard Business School Press, 2004.[Yo02] Yoder, J. W., Johnson, R.: The Adaptive Object-Model Architectural Style. IFIP-
WICSA Conference 2002, Kluwer B.V., 2002, pp. 3-27[Zi11] Zimmermann, A. et al.: Capability Diagnostics of Enterprise Service Architectures using
a dedicated Software Architecture Reference Model. In IEEE International Conferenceon Services Computing (SCC), Washington DC, USA, 2011; pp. 592–599
[Zi13a] Zimmermann, A. et al.: Towards an Integrated Service-Oriented Reference EnterpriseArchitecture. ESEC / WEA 2013 on Software Ecosystem Architectures, St. Petersburg,Russia, 2013; pp. 26-30
[Zi13b] Zimmermann, A. et al.: Towards Service-oriented Enterprise Architectures for Big DataApplications in the Cloud. EDOC 2013 with SoEA4EE, 9-13 September 2013, Vancou-ver, BC, Canada, 2013; pp. 130-135
[Zi14] Zimmermann, A. et al.: Adaptable Enterprise Architectures for Software Evolution ofSmartLife Ecosystems. In: Proceedings of the 18th IEEE International Enterprise Dis-tributed Object Computing Conference Workshops (EDOCW), Ulm / Germany, 2014;pp. 316-323
Alfred Zimmermann, Alexander Rossmann (Hrsg.): Digital Enterprise Computing 2015,Lecture Notes in Informatics (LNI), Gesellschaft für Informatik, Bonn 2015 195
Konzeption und prototypische Umsetzung einesArchitekturcockpits
Sebastian Breitbach1, Baris Cubukcuoglu1, Tobias Gorhan1, Daniel Hammer1, DierkJugel2 und Christoph Wenzel1
Abstract: EAM ist ein holistischer Ansatz, um komplexe IT- und Unternehmensstrukturen darzu-stellen. Dabei ist es von zentraler Bedeutung diese Strukturen möglichst komplett und übersicht-lich zu visualisieren. Ein Ansatz dies zu erreichen ist eine multiperspektivische Darstellung vonmehreren Views in einem Architekturcockpit. Dabei können mehrere Views simultan betrachtetund Analysiert werden. Dadurch ist es möglich die Auswirkungen einer Analyse des Views einesStakeholders simultan aus den Views anderer Stakeholder betrachten zu können um eventuelleWechselwirkungen zu erkennen und einen allgemeinen Überblick über die Unternehmensarchitek-tur zu behalten. In dieser Arbeit zeigen wir, von der Konzeption über die Umsetzung bis zu einemAnwendungsbeispiel, wie ein solches Architekturcockpit realisiert werden kann.
Keywords: EAM, Enterprise Architecture Management, Unternehmensarchitektur, Visualisie-rung, Visuelle Analyse
1 EinleitungUnternehmen sind komplexe und integrierte Systeme, bestehend aus u.a. Geschäftspro-zessen, Geschäftseinheiten, Ressourcen und Technologien. Die Unternehmensarchitektureines Unternehmens beschreibt diese Elemente und die vielfältigen Beziehungen zwi-schen diesen. In der heutigen Zeit, die von sehr dynamischen Märkten geprägt ist, stehenUnternehmen vor der Herausforderung schnell und agil auf verschiedene Markteinflüssereagieren zu müssen. Dies betrifft insbesondere das Geschäftsmodell. Aufgrund dervielfältigen Beziehungen zwischen den Elementen einer Unternehmensarchitektur habenÄnderungen des Geschäftsmodells zahlreiche Auswirkungen auf andere Elemente undSchichten der Unternehmens-architektur. Das Enterprise Architecture Management(EAM) beschäftigt sich mit der Beherrschung und Weiterentwicklung der Unterneh-mensarchitektur [Ha13]. Hierbei liegt ein besonderes Augenmerk auf der Schaffung vonTransparenz über die sehr komplexen Strukturen. Neben der organisatorischen Einbet-tung von EAM werden zur Unterstützung EAM-Werkzeuge genutzt, um die Unterneh-mensarchitektur zu dokumentieren und weiterzuentwickeln. Zur Aufdeckung von Opti-mierungspotentialen werden Analysetechniken eingesetzt [Ha13].
1 Hochschule Reutlingen, {sebastian.breitbach, baris.cubukcuoglu, tobias.gorhan, daniel.hammer, chris-toph.wenzel }@student.reutlingen-university.de
2 Hochschule Reutlingen, Herman Hollerith Zentrum, [email protected]
196 Sebastian Breitbach et al.
Das Analysieren von Unternehmensarchitekturen ist eine zeitaufwändige und auf vielenInformationen basierende Aufgabe. In der Praxis werden hierzu gewöhnlich Visualisie-rungen eingesetzt [Ha13]. Die EAM Werkzeugstudie von Matthes et al. [Ma08], sowiedie EAM Visualisierungsstudie von Roth et al. [RZM14] zeigen, dass die von EAMWerkzeugen zur Verfügung gestellten Visualisierungen weitgehend statisch sind. ZurVerbesserung der Analysefähigkeit von Visualisierungen im EAM Umfeld haben Jugelet al. [JS14] den Ansatz eines interaktiven Architekturcockpits vorgestellt. Dieser Ansatzbasiert auf Viewpoints, wie in [ISO11] beschrieben. Ein Viewpoint beschreibt nach[ISO11] die Konstruktion, Interpretation und Nutzung von Views. Views entsprechendabei einer Visualisierung. Ein Beispiel dafür ist ein Clusterdiagramm. Die Besonderheitdes Architekturcockpits ist die Möglichkeit eine Unternehmensarchitektur unter paralle-ler Nutzung zusammenhängender interaktiver Views analysieren zu können.
Wie lässt sich das in [JS14] beschriebene Konzept eines interaktiven Architekturcockpitsin der Praxis umsetzen? Dazu stellen wir in diesem Artikel die Konzeption eines Proto-typs vor der diese Frage beantworten könnte. Ein erster Schritt in Richtung eines Proto-typs wurde in [Ki14] behandelt.
Durch ein Architekturcockpit ergeben sich vielseitige Möglichkeiten der interaktivengrafischen Analyse einer Unternehmensarchitektur. Dabei werden die verschiedenenBlickwinkel der an einem Entscheidungsprozess beteiligten Stakeholder berücksichtigt.Das Konzept eines Stakeholders ist ebenfalls im ISO Standard 42010 [ISO11] beschrie-ben. Ein Stakeholder entspricht nach dieser Definition einer Person oder Personengrup-pe, die einen oder mehrere sogenannter Concerns an der Unternehmensarchitektur hat.Ein Concern ist dabei ein Interesse, beispielsweise aufgrund einer Verantwortlichkeitoder besonderem Wissen über einen Ausschnitt der Unternehmensarchitektur. Die Visu-alisierung der Unternehmensarchitektur ermöglicht es komplexe IT-Unternehmensstrukturen verständlich und anschaulich abzubilden.
In [JS14] weisen Jugel und Schweda auf die Problematik der fokussierten beziehungs-weise isolierten Sichtweise von Stakeholdern auf die Unternehmens-architektur hin.Weiter heißt es, dass jeder Stakeholder Experte für seine Sichtweise ist und daher andereAnforderungen an die Betrachtung und Analyse einer Unternehmensarchitektur hat.Oftmals werden fachfremde Bereiche nicht berücksichtigt oder bedacht.
Wie eingangs erwähnt, können Änderungen innerhalb der Unternehmensarchitekturaufgrund der vielfältigen Beziehungen zwischen den Elementen weitreichende Auswir-kungen auf andere Elemente haben. Aufgrund der hohen Komplexität einer Unterneh-mensarchitektur, sind diese Auswirkungen nicht ohne weiteres erkennbar, da sie nicht indirektem Kontext des betrachteten Architekturelements stehen. Dieser Umstand er-schwert die Analyse von Unternehmensarchitekturen. Daher reicht das bloße Darstellenvon Elemente nicht aus. Stattdessen müssen Beziehungen untereinander und möglicheAuswirkungen sichtbar gemacht werden. Entscheidungsrelevante Informationen sowieEinflüsse auf die Architektur müssen innerhalb der Visualisierung eindeutig zu identifi-zieren sein [JS14]. Wie in [Ju15b] aufgezeigt, fehlen in gängigen EAM Werkzeugen
Konzeption und prototypische Umsetzung eines Architekturcockpits 197
Interaktionsmöglichkeiten bei Visualisierungen. Mithilfe eines interaktiven Cockpits solldieses Problem gelöst und eine Interaktion mit der Unternehmensarchitektur ermöglichtwerden. Dies soll ein tieferes Verständnis und eine bessere Entscheidungsfindung beiÄnderungen der Architektur ermöglichen [Ju15a]. Die Kombination aus interaktivenVisualisierungen und automatisierten Analysen im Hintergrund wird als Visual Analy-tics bezeichnet [Ka08]. Dieser Ansatz findet bereits in vielen AnwendungsbereichenAnwendung. In der Domäne EAM fand dieser Ansatz bisher jedoch keine Anwendung.Unsere Arbeit konzentriert sich in dieser Iteration primär auf die interaktive Visualisie-rung der Unternehmens- und IT-Architektur, welche als Grundlage für weitere Arbeitendient.
In Kapitel 2 beschreiben wir relevante Arbeiten zum Thema Visualisierung und Analysevon Unternehmensarchitekturen. Anschließend beschreiben wir in Kapitel 3 die Konzep-tion und in Kapitel 4 die Umsetzung des Prototyps. In Kapitel 5 soll Mithilfe eines Sze-narios der Nutzen dargestellt werden.
2 Verwandte AnsätzeIn diesem Kapitel werden verwandte Arbeiten mit Bezug zur Visualisierung von Unter-nehmensarchitekturen und zu visuellen Analysen vorgestellt.
Roth, Zec und Matthes [RZM14] betrachten in ihrer Visualisierungsstudie verschiedeneWerkzeuge zur Visualisierung von Unternehmensarchitekturen, unter der Berücksichti-gung unterschiedlicher Eigenschaften und Nutzungsmuster. Als Ergebnis der Studiekann zusammengefasst werden, dass Design, Konfigurationsmöglichkeiten sowie An-passung des Informationsmodells wichtige Kriterien sind. Des Weiteren stellt sich her-aus, dass die meist benötigten Visualisierungstypen Cluster Map, Matrix, Graph, Timeli-ne und Flow-Diagramm sind. Weiter beschreibt die Studie das aktuelle Nutzerverhalten,zukünftige Anforderungen und bestehende Schwachstellen. Das Paper zeigt die wich-tigsten Funktionen für EAM Werkzeuge mit Bezug zur Visualisierung auf. Diese Er-kenntnisse bieten eine solide Grundlage innerhalb der Konzeption unseres Prototyps.Diese Arbeit lässt jedoch Anforderungen an die Visuelle Analyse von Unternehmensar-chitekturen außer Acht. Das Prinzip von Visual Analytics wird in dieser Studie nichterwähnt.
Schaub, Matthes und Roth [SMR12] stellen ein konzeptionelles Framework zur Ent-wicklung von interaktiven Visualisierungen vor. Hierbei steht die Manipulation derUnternehmensarchitekturdaten im Fokus. Aus diesem Grund werden u.a. Transaktions-und Konsistenzmechanismen benötigt. Da das Konzept des Architekturcockpits keineManipulation des eigentlichen Modells der Unternehmensarchitektur vorsieht, sind sol-che Mechanismen nicht notwendig.
Naranjo, Sánchez und Villalobos [NSV13] beschreiben in ihrer Arbeit eine alternativeHerangehensweise. Ihrer Ansicht nach sind einzelne Views ungeeignet um die gesamte
198 Sebastian Breitbach et al.
Unternehmensarchitektur zu beschreiben, da Views immer nur einen kleinen Teil dergesamten Architektur darstellen können. Ziel ist es einen Startpunkt zu finden um dieUnternehmensarchitektur im Gesamtüberblick zu analysieren um mehr spezifische Ana-lysetechniken zu entwickeln. Aufbauend auf [NSV13] beschreibt die Autoren in[NSV14] das PRIMROSe-Framework, einen konfigurierbaren und flexiblen Ansatz zurAnalyse und Visualisierung von Unternehmensarchitekturen. Die Visualisierung undAnalyse mit PRIMROSe besteht aus fünf Schritten: Import, Analyse, Map, Visualisie-rung und Kommunikation. Dabei ist jeder Schritt gleich aufgebaut: Input, Transformati-on und Output. Die Transformation wird dabei als Pipeline dargestellt. Mit Hilfe dieserSchritte und einem angepassten Metamodell, wird die Unternehmensarchitektur analy-siert und visualisiert. In jeder Pipeline können entsprechende Analysemethoden formu-liert werden, die unabhängig von benutzen Modellierungs-Tools, sequentiell ausgeführtwerden können. Die Analyse beschränkt sich nicht auf die bereits existierenden Viewssondern kann auf das gesamte Unternehmensmodell angewandt werden und präsentiertin den erstellten Views die Ergebnisse. Im Vergleich zu einem Architekturcockpit bietetdieser Ansatz jedoch nicht die Möglichkeit mehrere Views multiperspektivisch zu be-trachten.
3 KonzeptionUnsere konzeptionellen Anforderungen basieren auf der Arbeit [JS14], in der bereitsFunktionen für ein interaktives Cockpit beschrieben wurden. Eine wichtige Disziplininnerhalb der Planungsphase des Architekturcockpits ist die Erarbeitung einer adäquatenArchitektur der Applikation. Ein Cockpit, auch „War Room“ oder „Situation Room“genannt, war ursprünglich eine rein militärische Bezeichnung. Dort liefen alle relevantenInformationen zusammen um Staat und Streitkräfte effektiv, ohne Störungen von außen,führen zu können. Dieses Konzept wird heute auch in der Wirtschaft angewandt [Da06].In unserem Fall sollen dabei alle relevanten Informationen über die Unternehmens- undIT-Architektur visualisiert und analysiert werden können. Die Darstellung der Informati-onen kann dabei auf mehreren Monitoren parallel erfolgen. Das Architekturcockpit ist ineine Frontend- und eine Backend-Applikation unterteilt. Das Frontend dient zur Visuali-sierung der Daten auf den Monitoren. Zwischen Backend und Frontend existiert einKommunikationskanal. Mithilfe dessen Hilfe werden JSON-Nachrichten ausgetauscht.Das nachfolgende Schaubild stellt die beschriebene Gesamtarchitektur dar:
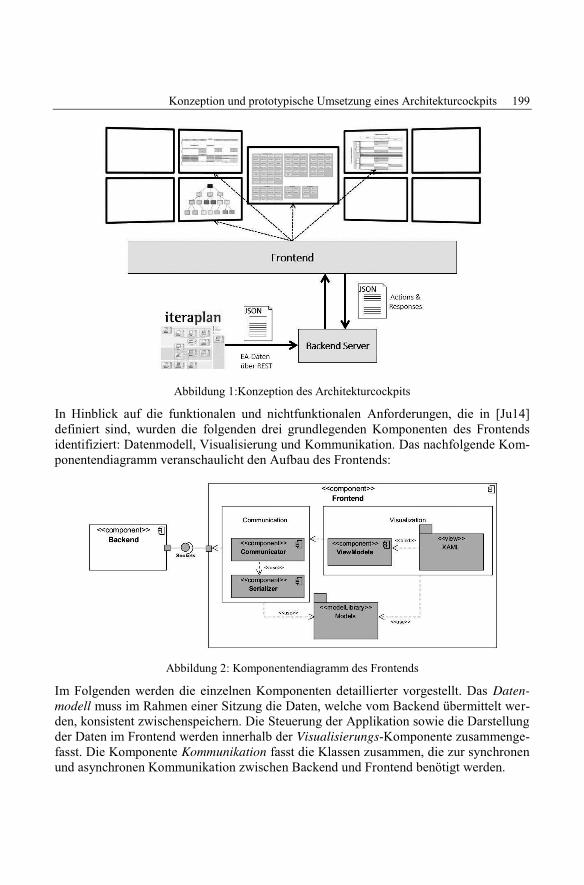
Konzeption und prototypische Umsetzung eines Architekturcockpits 199
Abbildung 1:Konzeption des Architekturcockpits
In Hinblick auf die funktionalen und nichtfunktionalen Anforderungen, die in [Ju14]definiert sind, wurden die folgenden drei grundlegenden Komponenten des Frontendsidentifiziert: Datenmodell, Visualisierung und Kommunikation. Das nachfolgende Kom-ponentendiagramm veranschaulicht den Aufbau des Frontends:
Abbildung 2: Komponentendiagramm des Frontends
Im Folgenden werden die einzelnen Komponenten detaillierter vorgestellt. Das Daten-modell muss im Rahmen einer Sitzung die Daten, welche vom Backend übermittelt wer-den, konsistent zwischenspeichern. Die Steuerung der Applikation sowie die Darstellungder Daten im Frontend werden innerhalb der Visualisierungs-Komponente zusammenge-fasst. Die Komponente Kommunikation fasst die Klassen zusammen, die zur synchronenund asynchronen Kommunikation zwischen Backend und Frontend benötigt werden.
200 Sebastian Breitbach et al.
Im Zuge der Erstellung eines ganzheitlichen Prototyps des Architekturcockpits wurdeeine beispielhafte Unternehmensarchitektur im EAM Werkzeug iteraplan3 abgebildet.iteraplan ist ein Werkzeug zur Verwaltung einer Unternehmensarchitektur, welches vonder Firma iteratec GmbH entwickelt wurde. Das dort modellierte Modell einer Unter-nehmensarchitektur wird über eine vom Werkzeug bereitgestellte REST-Schnittstelle insBackend geladen. Das Frontend greift auf diese Daten, die im Backend gespeichert wer-den, zu. Das Backend ist für die Aufbereitung des EA Modells und für die Erstellungvon Views, die vom Frontend abgefordert werden, zuständig.
Das grundlegende Datenmodell zur Darstellung einer Unternehmensarchitektur bildetdas sogenannte Atlas-Modell. Der Begriff des Atlas ist an den Atlas aus der Kartogra-phie angelehnt. Dabei ist ein Atlas eine Sammlung verschiedener Blickwinkel auf dieErde. Jeder einzelne Blickwinkel ist dabei eine Visualisierung. Des Weiteren sind dieVisualisierungen farblich codiert. Beispielsweise sind Wälder grün und Wasser blau.Ähnlich verhält es sich mit den Visualisierungen einer Unternehmensarchitektur. MitHilfe des in [JS14] beschriebenen Annotationsmechanismus können Architektur-elemente annotiert und Annotationen visuelle Eigenschaften zugeordnet werden. EinAtlas im Atlas-Modell bildet eine Unternehmensarchitektur ab, welche in iteraplan do-kumentiert wurde. Eine Karte im Atlas-Modell, welches in [ISO11] als Viewpoint be-zeichnet wird, erlaubt es die Architektur eines Unternehmens aus unterschiedlichenBlickwinkeln zu betrachten. Die Interessen der Stakeholder können durch variable Sich-ten adressiert werden. Diese Sichten werden als Views bezeichnet und sind bezüglichihrer Granularität flexibel. Zur Visualisierung der Architektur werden unterschiedlicheStrukturen verwendet. So können Hierarchien, Landscape- und Cluster-Diagramme zurDarstellung herangezogen werden. Innerhalb eines Views können eine Vielzahl vonEbenen, auch Layer genannt, angelegt werden. Die Layer werden benötigt, um das Prob-lem von sich überlagernden visuellen Eigenschaften für ein bestimmtes Architekturele-ment zu lösen. Architekturelemente können ausgeblendet und farblich hervorgehobenwerden. Ein Layer hat einen Namen, eine Beschreibung und ein oder mehrere Partitio-nen. Mit Hilfe der Partitionen können Architekturelemente innerhalb eines Layers grup-piert werden. Beispielsweise kann eine Partition erstellt werden, um Elemente einerbestimmten Annotation farblich hervorzuheben. In diesem Fall gibt es zwei Partitionen.Eine Partition für die Elemente der Annotation und eine für die restlichen Elemente.Beiden Partitionen können individuelle visuelle Eigenschaften zugeordnet werden. Dar-über hinaus können Layer lokal auf einen View beschränkt werden oder global für alleViews im Architekturcockpit angewendet werden. So sind Beziehungen von Architektu-relementen über verschiedene Views hinweg nachvollziehbar.
Das Frontend fordert verschiedene Views durch eine Benutzerinteraktion an. Die Viewswerden anschließend vom Backend erstellt und an das Frontend geliefert. Eine dauerhaf-te Speicherung dieser Daten im Frontend ist aufgrund der dadurch entstehenden Inkon-sistenz nicht vorgesehen. Zur asynchronen und synchronen Kommunikation zwischenBack- und Frontend wird das sogenannte Action/Response-Prinzip eingesetzt. Dabei
3 www.iteraplan.de
Konzeption und prototypische Umsetzung eines Architekturcockpits 201
instanziiert eine Benutzerinteraktion eine Action. Der Inhalt einer Action ist der Nameder initiierten Aktion, eine fortlaufende Nummer und Nutzdaten, welche für die Ausfüh-rung im Backend nötig sind. Die Action wird an das Backend gesendet. Anschließenderzeugt das Backend eine Response, durch den der aktualisierte Zustand des Atlas-Modells an das Frontend übermittelt wird. Dies kann entweder das vollständige Modelloder nur eine Teilmenge davon sein.
Für eine visuelle Planung der Unternehmensarchitektur, unter Einbeziehung unterschied-licher Stakeholder, ist eine kollaborative Komponente unerlässlich. Dies setzt eineMehrbenutzerfähigkeit und eine asynchrone Ereignissteuerung voraus. Für die Applika-tion wird das Publisher/Subscriber-Prinzip angewendet. Das Backend erfasst die einge-loggten Teilnehmer, die am gleichen Atlas arbeiten. Hierbei spielt es keine Rolle, ob sichein Benutzer im Cockpit anmeldet oder an einem normalen Computer. Der einzige Un-terschied ist die Anzahl der Monitore. Bei einer Änderung, beispielsweise beim Hinzu-fügen eines Layers innerhalb eines Views, werden die Anzeigen der anderen Teilnehmerasynchron aktualisiert. Jeder Stakeholder arbeitet damit kontinuierlich auf dem aktuellenZustand eines Atlas.
Zur Vorbereitung oder zur nachträglichen Änderung eines Atlas, hat das Frontend nebender Visualisierung auch eine Konfigurationsfunktion. Mit dieser lassen sich Views anle-gen oder ändern. Wie die Darstellung der Unternehmensarchitektur, ist die Konfigurati-on ebenfalls geräteunabhängig und nach einer Speicherung sofort verfügbar.
4 UmsetzungAls Grundlage für das Architekturcockpit wird das existierende Management Cockpitder Hochschule Reutlingen verwendet [Ki14]. Dieses besteht aus einem zentralenTouchscreen als Hauptbildschirm. Links und rechts von diesem befinden sich jeweilsvier weitere Bildschirme.
Der Prototyp eines Frontends für das Architekturcockpit wurde mit C# und dem Frame-work WPF4 entwickelt. Hierfür ist das .NET Framework5 erforderlich. Die grafischeOberfläche basiert auf dem Pattern MVVM6 und ermöglicht es das User Interface(View) unabhängig von der Programmlogik zu entwickeln. Die Daten, welche in derView angezeigt werden, werden mittels Data Binding in dieser platziert und so auf derBenutzeroberfläche dargestellt.
Die Applikation kann auf einem System mit einer beliebigen Anzahl an Monitoren aus-geführt werden. Die Steuerung dieser Applikation ist nur über den zentralen Hauptbild-schirm möglich (siehe Abbildung 1). Eine Funktion verhindert, dass die Maus außerhalb
4 Windows Presentation Foundation, Bibliotheken für GUI, https://msdn.microsoft.com/de-de/library/ms754130%28v=vs.110%29.aspx
5 Laufzeitumgebung von Microsoft, stellt Klassenbibliotheken bereit, http://www.microsoft.com/net6 Model View ViewModel, https://msdn.microsoft.com/en-us/library/gg405484%28v=pandp.40%29.aspx
202 Sebastian Breitbach et al.
dieses zentralen Hauptbildschirms geschoben werden kann. Beim Starten der Applikati-on wird ermittelt wie viele Monitore dem Betriebssystem bekannt sind. Für jeden ange-schlossenen Monitor wird ein Anwendungsfenster erzeugt und dieses auf dem Monitorplatziert. Nach den Bildschirmkoordinaten werden die Anwendungsfenster sortiert undmit Indices in der Applikation bereitgestellt. Wird ein Atlas vom Benutzer geladen,werden die entsprechenden Views in den Anwendungsfenstern platziert. Die Bild-schirmsteuerung wird in einem Overlay angezeigt und ermöglicht es, Views auf denseitlichen Bildschirmen zu verschieben, Views ohne Monitorzuordnung auf einen Moni-tor zu legen und Views auf den Hauptbildschirm in der Mitte zu übernehmen. Die Ap-plikation kann über den berührungsempfindlichen Hauptbildschirm oder herkömmlichmit Tastatur und Maus gesteuert werden. Beim Einsatz einer Maus ist die Bedienungerleichtert, wenn diese nicht über viele Monitore geschoben werden muss und die zentra-le Steuerung immer im Mittelpunkt stattfindet.
In der Kommunikationskomponente wird die Verbindung zum Backend über einen So-cket aufgebaut. Dieser ermöglicht es, dass das Backend proaktiv Nachrichten an dieverbundenen Clients senden kann. Im Frontend hört ein Listener, in einem separatenThread, auf Push-Nachrichten des Backends bzw. auf Responses zu den gesendetenActions. Dafür wurde bewusst ein separater Thread verwendet, so dass die GUI unab-hängig vom Senden oder Empfangen ist. Das Backend sendet die Responses per Push-Nachricht an alle verbundenen Geräte für diesen Atlas.
Das Konzept der Actions und Responses basiert auf dem Pattern Request/Response. DasArchitekturcockpit unterstützt 36 Actions. Beispiele für Actions sind das Einblenden vonZusatzinformationen zu einzelnen Elementen, das Annotieren von Elementen oder aucheine Impact Analyse auf ein einzelnes Element. Ein Klick auf ein Steuerelement löst eineAction aus, welche zum Backend gesendet wird. Hat das Backend eine Action verarbei-tet, wird eine entsprechende Response mit aktualisierten Daten gesendet, welche imFrontend deserialisiert wird. Jede Klasse für eine Response beinhaltet eine Methode„Perform“, welche in der Kommunikationskomponente nach dem Eintreffen dieserResponse ausgeführt wird und die Daten im Frontend aktualisiert. Die Views werdendurch das Data-Binding beim Ändern der Daten aktualisiert.
5 Beispiel-SzenarioIn diesem Kapitel wird ein fiktives Szenario beschrieben, um die Funktionen des Archi-tekturcockpits exemplarisch darzustellen. Hierfür wird eine Sitzung im Architekturcock-pit des fiktiven Unternehmens Swabian Automotive AG beschrieben. Diese ist ein deut-scher Automobilhersteller für Luxusautos. An der Sitzung nehmen der CIO, der Unter-nehmensarchitekt, sowie der EA-Analyst teil. Der CIO stellte aufgrund eines ihm vorlie-genden Berichts fest, dass die Kosten der IT sehr hoch sind und möchte Einsparungspo-tentiale identifizieren. Der Analyst beschreibt die aktuelle Situation der IT-Strukturendes Unternehmens und weist auf Einsparungspotentiale bei den Betriebssystemen hin.
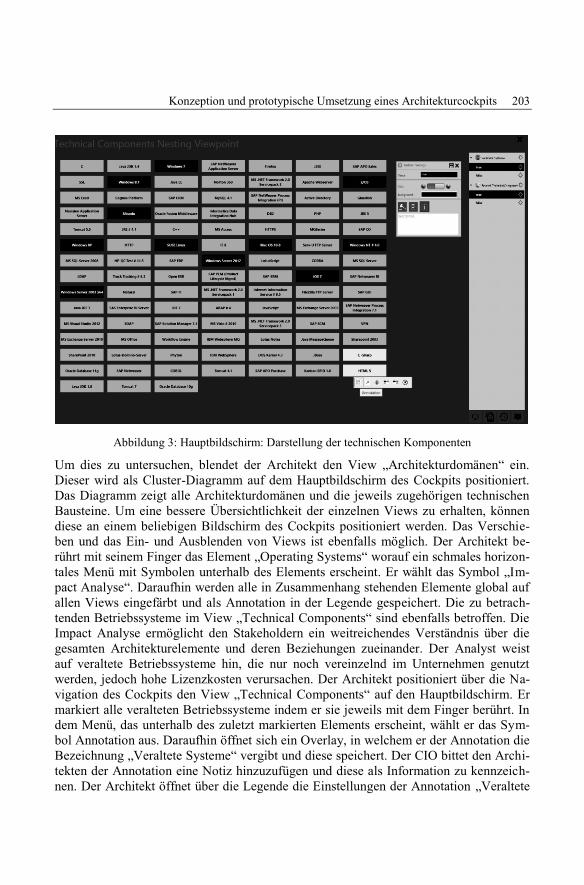
Konzeption und prototypische Umsetzung eines Architekturcockpits 203
Abbildung 3: Hauptbildschirm: Darstellung der technischen Komponenten
Um dies zu untersuchen, blendet der Architekt den View „Architekturdomänen“ ein.Dieser wird als Cluster-Diagramm auf dem Hauptbildschirm des Cockpits positioniert.Das Diagramm zeigt alle Architekturdomänen und die jeweils zugehörigen technischenBausteine. Um eine bessere Übersichtlichkeit der einzelnen Views zu erhalten, könnendiese an einem beliebigen Bildschirm des Cockpits positioniert werden. Das Verschie-ben und das Ein- und Ausblenden von Views ist ebenfalls möglich. Der Architekt be-rührt mit seinem Finger das Element „Operating Systems“ worauf ein schmales horizon-tales Menü mit Symbolen unterhalb des Elements erscheint. Er wählt das Symbol „Im-pact Analyse“. Daraufhin werden alle in Zusammenhang stehenden Elemente global aufallen Views eingefärbt und als Annotation in der Legende gespeichert. Die zu betrach-tenden Betriebssysteme im View „Technical Components“ sind ebenfalls betroffen. DieImpact Analyse ermöglicht den Stakeholdern ein weitreichendes Verständnis über diegesamten Architekturelemente und deren Beziehungen zueinander. Der Analyst weistauf veraltete Betriebssysteme hin, die nur noch vereinzelnd im Unternehmen genutztwerden, jedoch hohe Lizenzkosten verursachen. Der Architekt positioniert über die Na-vigation des Cockpits den View „Technical Components“ auf den Hauptbildschirm. Ermarkiert alle veralteten Betriebssysteme indem er sie jeweils mit dem Finger berührt. Indem Menü, das unterhalb des zuletzt markierten Elements erscheint, wählt er das Sym-bol Annotation aus. Daraufhin öffnet sich ein Overlay, in welchem er der Annotation dieBezeichnung „Veraltete Systeme“ vergibt und diese speichert. Der CIO bittet den Archi-tekten der Annotation eine Notiz hinzuzufügen und diese als Information zu kennzeich-nen. Der Architekt öffnet über die Legende die Einstellungen der Annotation „Veraltete
204 Sebastian Breitbach et al.
Systeme“. Hier gibt er die Notiz „Nutzer der veralteten Betriebssysteme über bevorste-hende Abschaltung informieren“ ein und wählt das Symbol „Information“ an. DiesesSymbol wird daraufhin mit einer dunkleren Farbe hinterlegt, wodurch die Auswahl dar-gestellt wird. Der Architekt speichert die Änderungen, wodurch die Einstellungen auto-matisch ausgeblendet werden. Der CIO teilt dem Analysten die Aufgabe zu, die be-troffenen Personen zu kontaktieren und beendet damit die Sitzung.
6 FazitMit der Erstellung des Prototyps wurden Konzepte für die Darstellung und Interaktionmit einer Unternehmensarchitektur in einem Architekturcockpit erarbeitet und realisiert.Unter anderem können parallele Views auf mehreren Monitoren multiperspektivischdargestellt werden. Das Cockpit kann sowohl per Maus als auch durch Berührungen desHauptbildschirms gesteuert werden. Des Weiteren können Atlanten und Viewpointsdurch die Nutzung eines Tablets oder direkt im Cockpit konfiguriert werden. Unter-schiedliche Anwendungsszenarien, ähnlich dem beschriebenen aus Kapitel 5, haben denPrototyp evaluiert. Die Ergebnisse der Evaluierung zeigen, dass der Nutzen des Archi-tekturcockpits die Erwartungen erfüllt und somit die Grundlage für weitere Projekte indiesem Bereich geschaffen wurde. Der Fokus dieser Arbeit lag auf der Visualisierungvon Unternehmensarchitekturen mittels Views. Ein erster Schritt in Richtung VisualAnalytics erfolgte durch die Implementierung der "Impact Analyse", die eine interaktiveVisualisierung mit automatisierten Berechnungen im Hintergrund kombiniert.
Um den Prototyp zu erweitern, könnten in Folgearbeiten weitere Viewpoints implemen-tiert werden. In Bezug auf die Interaktion mit den Visualisierungen und dem Cockpitselbst, sind weitere Funktionen denkbar. Beispielsweise könnte eine Show/Hide-Funktion eingebaut werden, mit der Elemente, zugunsten der Übersichtlichkeit, kurzfris-tig ausgeblendet werden könnten. Ebenso geplant ist eine Report-Funktion, welche eineCockpit-Sitzung eigenständig dokumentiert. Diese könnte um weitere Funktionalitätenergänzt werden. Durch die technischen Möglichkeiten, die das Cockpit bietet, ist eineGesten- oder Sprachsteuerung ebenfalls vorstellbar. Außerdem sollte die Erweiterungund Absicherung der kollaborativen Nutzung des Cockpits in Betracht gezogen werden.Dafür wäre ein Rollenkonzept mit Berechtigungen von großem Nutzen. Weiter wäreeine Usability Study mit Stakeholdern aus realen Unternehmen wünschenswert um even-tuelle Erfahrungswerte, der einzelnen Personengruppen, für die Verbesserung des Archi-tekturcockpits nutzen zu können und die derzeitige Forschung an weiteren Analysemög-lichkeiten an der Hochschule Reutlingen zu unterstützen.
Konzeption und prototypische Umsetzung eines Architekturcockpits 205
7 Literaturverzeichnis[Da06] Daum, J.: Management Cockpit War Room: Objectives, Concept and Function, and
Future Prospects of a (Still) Unusual, But Highly Effective Management Tool. In: Con-trolling – Zeitschrift für die erfolgsorientierte Unternehmensführung, vol. 18, C.H. BeckVerlag, München, Deutschland, 2006; Seiten 311-318
[Ha13] Hanschke, I.: Strategisches Management der IT-Landschaft : Ein praktischer Leitfadenfür das Enterprise Architecture Management. Hanser, München, Deutschland, 2013.
[ISO11] ISO/IEC/IEEE 42010:2011 - Systems and software engineering - Architecture descrip-tion; International Organization Of Standardization, 2011.
[JS14] Jugel, D., Schweda, C.M.: Interactive functions of a Cockpit for Enterprise ArchitecturePlanning. In: International Enterprise Distributed Object Computing Conference Work-shops and Demonstrations (EDOCW), Ulm, Deutschland, 2014; Seiten 33-40
[Ju15a] Jugel, D., Kehrer, S., Schweda, C., Zimmermann, A.: Towards Visual EAM Analytics –Automating Analyses in EAM. In: Digital Enterprise Computing 2015, 2015.
[Ju15b] Jugel, D., Schweda, C., Zimmermann, A., Läufer, S.: Tool Capability in Visual EAMAnalytics. In: Complex Systems Informatics and Modeling Quarterly (CSIMQ), 2015;Seiten 46-55
[Ka08] Keim, D.A. et al.: Visual Analytics: Definition, Process, and Challenges. In: InformationVisualization, Lecture Notes in Computer Science, vol. 4950, Springer Verlag, Heidel-berg, Deutschland, 2008; Seiten 154- 175
[Ki14] Kirchner, A., Scheurer, S., Weber, C., Wiechmann, A., Jugel, D.: Architektur einesCockpits zur interaktiven Analyse von Enterprise Architectures auf Basis vonViewpoints. In: Hochschule Reutlingen Lecture Notes in Informatics, Gesellschaft fürInformatik (GI), Volume S-13, Seiten 139 – 143, 2014.
[Ma08] Matthes, F., Buckl, S., Leitel, J., Schweda, C.M.: Enterprise Architecture ManagementTool Survey 2008, Technischer Bericht, 2008.
[NSV13] Naranjo, D., Sanchez, M., Villalobos, J.: Connecting the Dots: Examining VisualizationTechniques for Enterprise Architecture Model Analysis. In: International Enterprise Dis-tributed Object Computing Conference Workshops and Demonstrations (EDOCW),Ulm, Deutschland, 2013; Seiten 29-38
[NSV14] Naranjo, D., Sanchez, M., Villalobos, J.: Towards a Unified and Modular Approach forVisual Analysis of Enterprise Models. In: International Enterprise Distributed ObjectComputing Conference Workshops and Demonstrations (EDOCW), Ulm, Deutschland,2014; Seiten 77-86
[RZM14]Roth, S., Zec, M., Matthes, F.: Enterprise Architecture Visualization Tool Survey 2014.Technischer Bericht, Lehrstuhl für Informatik 19, Technische Universität München,2014.
[SMR12] Schaub, M.; Matthes, F.; Roth, S.: Towards a Conceptual Framework for InteractiveEnterprise Architecture Management Visualizations. In: Modellierung, Bamberg,Deutschland, 2012.


Adaptive Business Processes

Alfred Zimmermann, Alexander Rossmann (Hrsg.): Digital Enterprise Computing 2015,Lecture Notes in Informatics (LNI), Gesellschaft für Informatik, Bonn 2015 209
Improving the Understanding of Business Processes
Felix Schiele1, Fritz Laux2 and Thomas M Connolly3
Abstract: Business processes are important knowledge resources of a company. The knowledgecontained in business processes impart procedures used to create products and services. However,modelling and application of business processes are affected by problems connected to knowledgetransfer. This paper presents and implements a layered model to improve the knowledge transfer.Thus modelling and understanding of business process models is supported. An evaluation of theapproach is presented and results and other areas of application are discussed.
Keywords: business process modelling, Event-driven Process Chains (EPC), knowledge transfer.
1 IntroductionKnowledge is an important resource and a critical factor for organisations to sustain andextend competitive advantages ([Te03]; [Da11]; [CDK11]). The important knowledge ofa company, describing the procedures for the production of products and services, isincorporated in business processes. A business process is a sequence of activitiesperformed in order to create a specified product or service [SS13] taking a holistic viewon the value creation [SN00]. Thus, the business processes of an organisation need to becaptured and represented as a business process model in order to guarantee an efficientproduction and repeatable quality. A model is an abstract representation focused on theattributes relevant to the modelling goal [St73].
1.1 Challenges in Business Process Modelling
The knowledge about the processes is often decentralised and tacit. Furthermore, thedocumentation of the business processes is hampered by communication problems[Ve04]. Reijers and Mendling [RM11] investigated in the understanding of businessprocess models and the influence of modelling and personal factors. Their researchrevealed that personal factors such as education, and knowledge of theory and practicemight have a larger impact on the understanding of business process models thanmodelling factors might have. However, modelling factors such as size of the model andnumber and type of connectors also influence the understanding [MRC07].
1 Reutlingen University, Fakultät Informatik, Alteburgstraße 150, D-72762 Reutlingen,[email protected]
2 Reutlingen University, Fakultät Informatik, Alteburgstraße 150, D-72762 Reutlingen,[email protected]
3 University of the West of Scotland, School of Engineering and Computing, PA1 2BE, Paisley,[email protected]
210 Felix Schiele et al.
Personal factors are of particular importance as modelling of business processesnormally requires bidirectional communication. Modelling is usually done by expertswho are unaware of the processes in the organisation and the employees who know theprocesses are not familiar with the modelling language. Therefore an approach shouldtake into account the knowledge of both involved parties and support theircommunication. This is where our prototype tool comes into play.
1.2 Related WorkAn approach that represents the knowledge required to perform an activity and enablesthe evaluation of the transfer is presented by Bahrs et al. [BBG11]. It implements theKnowledge Modeling and Description Language (KMDL), which is focused onknowledge intensive business processes and comprises three modelling views, namelyprocess view, activity view and communication-based-view. The process view containsthe sequence of activities and the associated roles. The activity view concentrates on theknowledge conversions required to perform an activity and include the four knowledgeconversions of the SECI Model [NT95]. The communication-based-view describes thesequence of communication and involved roles. The model was evaluated by anexperiment with 89 students. Thereby the experiment investigated in different factorsand their influence on knowledge transfer. The authors [BBG11] identified a need for: 1)“A more precise method for description of knowledge transfer with a model reflectinginfluential attributes of the sender and receiver based influences and success factors ofknowledge transfers.” 2) “An empirical foundation for the evaluation and design ofknowledge transfer success”.The layered model for knowledge transfer developed by Schiele et al. [SLC13] shortlyrecapped in Section Fehler! Verweisquelle konnte nicht gefunden werden. describesthe process of knowledge transfer and points out problems that occur during theknowledge transfer based on differences in the knowledge of sender and receiver. Theapplication of this model to the area of business process modelling aims to solve theknowledge transfer problem. The application of the layered model for knowledgetransfer in business process modelling is described in detail in [SLC14]. However, animplementation in software or an empirical evaluation has not yet been conducted.
1.3 ContributionTo demonstrate that the model of Schiele et al. [SLC14] really helps to support theknowledge transfer in the area of business process modelling a prototype wasimplemented and an empirical study was conducted. The prototype implements amodelling environment with the basic EPC symbols and a knowledge repository tofacilitate the reuse of elements. The prototype aims to support the modelling and theunderstanding of business process models.
Improving the Understanding of Business Processes 211
1.4 OutlineThis paper is structured as follows: Chapter 2 will present a brief description of businessprocess modelling, the modelling language applied in the prototype and the applicationof the layered model for knowledge transfer in business process modelling. Chapter 3will present the prototype and its relevant features. The evaluation of the prototype willbe presented in chapter 4. In Chapter 5 we discuss the results and future directions.
2 Business Process ModellingThe layered model for knowledge transfer [SLC14] is implemented in a modelling toolthat uses the Event-driven Process Chain (EPC) diagram for the representation ofbusiness processes. The first section will provide a brief description of the modellinglanguage EPC and their benefits and disadvantages. The second section brieflyrecapitulates a knowledge transfer model of Schiele et al. [SLC13] and its application inbusiness process modelling.
2.1 Event-driven Process ChainsThe EPC diagram invented by Scheer [Sc00] consists of events and functionsinterconnected by a control flow. Functions are rectangular symbols that represent anactivity. Events are hexangular symbols that represent a situation that triggers a function.The control flow can be split and merged by the use of a logical connector such as AND,OR, and XOR [KNS92]. Another basic symbol used in EPC diagrams is the role. Therole is connected to a function and shows who is involved in the execution of thefunction. If further symbols, standard or company-specific, are added to the EPC itbecomes an enhanced Event-driven Process Chain (eEPC). Commonly used symbols areresources such as system, data base, and document which can be connected to functionsby an information flow indicating the input or output of a function. EPC is a semi-formalmodelling language especially for the functional representation of business processes.EPCs are widespread, at least in Germany and supported by various tools [SS13]. Due tothe simple graphical representation EPC is easy to understand and therefore suitable fordiscussions with department specialists. However, the limited amount of symbolsrestricts the accuracy of the representation. Details of functions and events are expressedby comments or, if supported by the tool, by additional attributes with an undefinedsemantic.
The modelling of business processes entails conceptual problems as good standards aremissing [AHW03]. Guidelines for modelling [MRA10] and standardised process modelssuch as Business Process Model and Notation (BPMN) have contributed to animprovement. However, BPMN is more complex therefore harder to learn than the EPCnotation. Reijers and Mendling [RM11] investigated the factors that influence theunderstanding of business processes. The following cognitive dimensions are considered
212 Felix Schiele et al.
relevant for the understanding and reading of business process models. 1) Theabstraction gradient that describes the potential of the modelling language to groupactions to reduce complexity. 2) The hard mental operation that describes thedisproportionate increase of reading difficulty with an increase in elements. 3) Thehidden dependences that describe dependences which are not obvious in the first place.4) The secondary notation which includes regulations that are not part of the primarynotation such as rules for denomination of elements and process layout.
2.2 Application of the Layered Model for Knowledge TransferThe layered model for knowledge transfer [SLC13] contributes to a better understandingin order to support knowledge transfer. The transfer of knowledge from the sender to thereceiver requires a transformation as knowledge cannot be transferred directly. Thesender needs to encode the knowledge to transfer it as a message and the receiver needsto decode the data received from the message to obtain knowledge. The knowledgetransfer from sender to receiver is influenced on four layers. At the lowest level is thecode layer that consists of symbols or signs. They represent the smallest units, whichform the basis of the higher layers. In the case of written language, which is the focushere, the smallest elements are the characters, σ, taken from an alphabet Σ. The syntacticlayer is constituted by the syntax that contains rules for the combination of signs orsymbols. In written language, L, the characters σ are combined to form words ω by theuse of production rules P. The semantic layer contains the semantics that establish therelation between words ω and meaning m. This relation, called semantics s(ω, m),connects the word to its meaning, which can be a real world entity or an abstract thing.The top layer is the pragmatic layer. Pragmatics p(s, c) connects the semantic term swith a concept c. The concept contains the course of action and the aims and moralconcepts that are represented in the human brain. They influence the thinking and actingof sender and receiver. The interpretation of the message depends on the elements thatare used and whether they are part of the knowledge base of the receiver and equivalentto the elements of the sender’s knowledge base.
When we consider the modelling language EPC with respect to the layered model forknowledge transfer we can derive the following statements. The code layer contains thesymbols used in the EPC diagram as well as the language in which the process ismodelled. The syntactic layer contains the rules for the EPC diagram and the rules of thenatural language. The semantic layer contains the connection between the words orsymbols and its meaning. Because of the simple EPC representation the precise meaningdepends mainly on the wording. More precise descriptions are almost impossible as theannotation of the used words is not possible. The pragmatics of a process is nearlyimpossible to model by the EPC, with the exception of start and end event of a businessprocess, which represents the goals that are to be achieved when the process isperformed. However, the pragmatic is affected by the natural language used to describethe process and the knowledge base of the person modelling the process and the personwho reads it. The simple notation of EPC leads to a lack of precision in the semantic and
Improving the Understanding of Business Processes 213
pragmatic layer of the knowledge transfer. To achieve the goal of a better and ideallylossless communication in the area of business processes the descriptions concerning thesemantic and pragmatic layer need to be enhanced. To achieve a better representation onthe semantic and pragmatic layers the authors have decided to use frames. Everyfunction and event in the business process will be represented as a frame.
According to Sowa [So00], the frames specified by Minsky [Mi74] are a more preciseand implementable representation of the schemata. The schemata were first mentionedby Aristotle to categorise the elements of his logical arguments. Minsky defined a frameas a data structure to represent a consistent situation [So00]. The frame can becomplemented with attributes to describe the application of the frame, the followingaction, or alternative actions. Minsky [Mi74] characterises the frame “as a network ofnodes and relations”. Minsky pointed out, that a frame has several layers and the toplevels represent the true characteristics of the frame. Lower levels contain terminals thatstore specific data about the instance. Those instances often constitute sub- frames. Withthe frames Minsky intends to create an approach that imitates the human thinking in theaspect of creating pattern and applying them to new situations. He points out that a newframe often is an imperfect representation, which is gradually refined. This is facilitatedby a loose coupling that enables replacement of assignments to slots. The application offrames intends to enhance a function with a precise description. Frames allow describinga situation and changes to this situation. When used for functions the frame enables aprecise description of the performance and thereby a representation of the pragmaticlayer. Frames provide the opportunity to create nested structures, which allows anefficient representation of complex situations. The inputs and outputs of functions andevents, represented as frames, are described in a formal way. This aims to verifyinterfaces and make suggestions for modelling based on the interface verification. Inaddition, the semantic description should help to clarify the properties of the input andoutput objects. The objects describing the application of a function and the objects thatrepresent the inputs and outputs of the function can be represented as frames too.According to Minsky they are called terminals and constitute slots where the data aresaved. Based on the usage of the word terminal in computer science for an entity thatcannot be further broken down, the authors will refer to the terminals of the frame asslots. Each slot can contain an object describing the characteristics of the function or anobject representing an input or output of a function. Each of these objects needs to befurther broken down until the costs for the break down is higher than the gained benefit.
3 The PrototypeThe layered model for knowledge transfer is applied to the area of business processmodelling in a modelling environment based on the EPC language. The prototypeincludes the basic EPC symbols and a repository to facilitate the reuse of elements.Furthermore, it contains a repository for description objects, which can be used torepresent an input or output of an activity. Based on the description objects the prototype
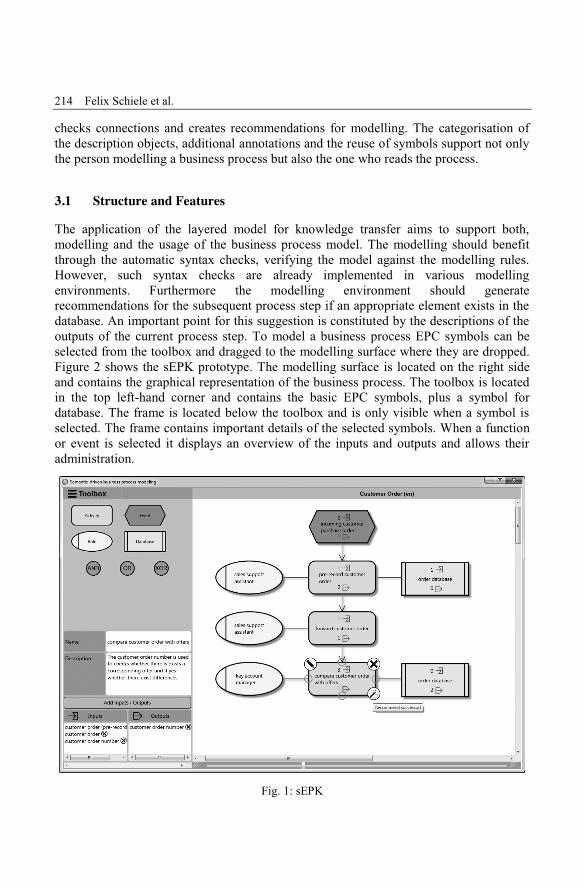
214 Felix Schiele et al.
checks connections and creates recommendations for modelling. The categorisation ofthe description objects, additional annotations and the reuse of symbols support not onlythe person modelling a business process but also the one who reads the process.
3.1 Structure and FeaturesThe application of the layered model for knowledge transfer aims to support both,modelling and the usage of the business process model. The modelling should benefitthrough the automatic syntax checks, verifying the model against the modelling rules.However, such syntax checks are already implemented in various modellingenvironments. Furthermore the modelling environment should generaterecommendations for the subsequent process step if an appropriate element exists in thedatabase. An important point for this suggestion is constituted by the descriptions of theoutputs of the current process step. To model a business process EPC symbols can beselected from the toolbox and dragged to the modelling surface where they are dropped.Figure 2 shows the sEPK prototype. The modelling surface is located on the right sideand contains the graphical representation of the business process. The toolbox is locatedin the top left-hand corner and contains the basic EPC symbols, plus a symbol fordatabase. The frame is located below the toolbox and is only visible when a symbol isselected. The frame contains important details of the selected symbols. When a functionor event is selected it displays an overview of the inputs and outputs and allows theiradministration.
Fig. 1: sEPK
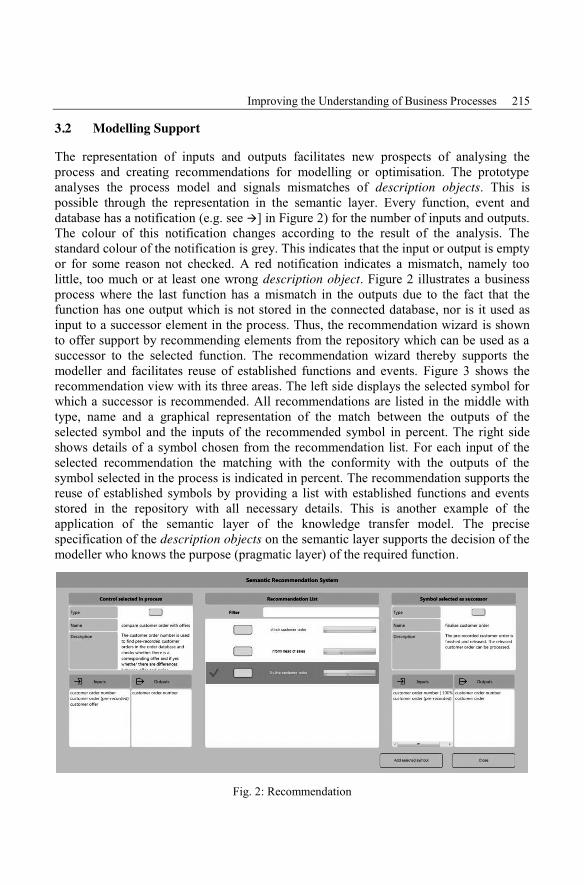
Improving the Understanding of Business Processes 215
3.2 Modelling Support
The representation of inputs and outputs facilitates new prospects of analysing theprocess and creating recommendations for modelling or optimisation. The prototypeanalyses the process model and signals mismatches of description objects. This ispossible through the representation in the semantic layer. Every function, event anddatabase has a notification (e.g. see #] in Figure 2) for the number of inputs and outputs.The colour of this notification changes according to the result of the analysis. Thestandard colour of the notification is grey. This indicates that the input or output is emptyor for some reason not checked. A red notification indicates a mismatch, namely toolittle, too much or at least one wrong description object. Figure 2 illustrates a businessprocess where the last function has a mismatch in the outputs due to the fact that thefunction has one output which is not stored in the connected database, nor is it used asinput to a successor element in the process. Thus, the recommendation wizard is shownto offer support by recommending elements from the repository which can be used as asuccessor to the selected function. The recommendation wizard thereby supports themodeller and facilitates reuse of established functions and events. Figure 3 shows therecommendation view with its three areas. The left side displays the selected symbol forwhich a successor is recommended. All recommendations are listed in the middle withtype, name and a graphical representation of the match between the outputs of theselected symbol and the inputs of the recommended symbol in percent. The right sideshows details of a symbol chosen from the recommendation list. For each input of theselected recommendation the matching with the conformity with the outputs of thesymbol selected in the process is indicated in percent. The recommendation supports thereuse of established symbols by providing a list with established functions and eventsstored in the repository with all necessary details. This is another example of theapplication of the semantic layer of the knowledge transfer model. The precisespecification of the description objects on the semantic layer supports the decision of themodeller who knows the purpose (pragmatic layer) of the required function.
Fig. 2: Recommendation
216 Felix Schiele et al.
The chosen symbol can be adopted as it is or it can be used as template that can beadjusted as required. The selected symbol of the recommendation list can be added assuccessor by clicking on add selected symbol. Consequently the symbol is automaticallyplaced in the process and connected with its predecessor. In addition sEKP offers arecommendation wizard for missing inputs. The algorithm searches all databasesexisting in the process for the input missing. In case a database contains the requiredinput, the recommendation system lists this database and facilitates an automatedintegration in the process. Furthermore, the modelling of the inputs and outputs with thedescription objects leads to a more detailed process. The more detailed representationrequires a deeper understanding of the process and an accurate modelling. However,with respect to the recommendation system and the reuse of established functions, eventsand description objects the additional expense is limited. It has to be considered thatprocess models pursue different targets. For process models used as work instruction thesemantic annotation and enhanced descriptions can constitute a benefit. For theoptimisation the description of inputs, outputs and application are of great importance.Based on this various optimisation approaches could be undertaken.
4 Empirical EvaluationAn empirical evaluation of the implementation of the layered model for knowledgetransfer in the prototype was conducted as an experiment with a pre-test / post-testdesign. The experiment aimed to investigate whether a modelling tool that implements alayered model for knowledge transfer would lead to better results than other solutions.The experiment was conducted with students of the Business Informatics studyprogramme at Reutlingen University. All participants were enrolled in the fourth, fifth orsixth semester, so it was ensured that all participants have already gained someexperience in business process modelling as part of their studies. 43 participantscompleted the pre-test and the post-test of the experiment.
4.1 Experimental Architecture and Design
The experiment included the task of modelling a business process based on a textualdescription. The participants had to internalise the textual description of the businessprocess and subsequently create a business process model by externalising this process.To measure the accuracy of the transfer two main key figures were used. First,representation reflects the semantics of the business process model, namely thecompleteness of the transformation from the textual description. To determine the keyfigure representation all symbols of the process were rated on an ordinal scale (good,acceptable and bad), in accordance with the modelled characteristics. Second, designreflects the syntactic elements of the business process model, namely the compliancewith the business process modelling rules. To assess the key figure design the rules forEPC were rated on an ordinal scale (very good, good, acceptable, bad and very bad).
Improving the Understanding of Business Processes 217
To measure the differences between the implementation of the layered model andstandard approaches the individual modelling capabilities of each participant weremeasured in the pre-test. In the pre-test all participants used only pen and paper to createthe model based on the description of task 1, describing the process customer offer. Thepost-test aimed to investigate the difference between the applied approaches, thus threedifferent approaches were used. The experimental group 1 used the sEPK prototype thatimplements the layered model for knowledge transfer to determine whether this wouldsupport modelling. The experimental group 2 used ARIS Express to analyse the supportfor modelling given by a standard modelling tool. The control group used again pen andpaper to determine whether the results of the pre-test and the post-test could becompared. To perform a randomised assignment that creates three groups with equalcognitive performance all participants were ordered based on their results of task 1 andassigned to the groups alternately. Pre-test and post-test were performed to measuredifferences in the process model based on the applied approach. Therefore tasks 1 (pre-test) and task 2 (post-test) were designed to have the same complexity and structure.
4.2 ResultsAn initial analysis of the results was performed by a graphic analysis of the differencesin the results of pre-test and post-test for the three groups. Figure 4 shows the deviationof the results of the post-test compared to the pre-test. Based on the used scale a negativenumber represents an improvement in the post-test compared to the pre-test. Participantswhose result in representation has improved are shown in the lower area of the chart.Those who improved in terms of design are shown on the left side of the chart.
Figure 4 shows that the participants who used sEPC could achieve the biggestimprovement in terms of representation. In terms of design both experimental groupsshow slightly better results than the control group. For the analysis of the results non-parametric tests were used because a Shapiro-Wilk test indicated that the key figuresrepresentation (D (43) = 0.91, p = 0.002) and design (D (43) = 0.88, p < 0.001) were notnormally distributed. A Kruskal-Wallis test was used to investigate the differencesbetween the three groups based on the key figures calculated for representation anddesign for the pre-test and the post-test. The Kruskal-Wallis test indicated a significantdifference in terms of representation (K = 17.074, p < 0.001) and design (K = 12.183, p= 0.002) between the two experimental groups and the control group. Mann-Whitney Utests were used for further investigations and a direct comparison of two groups at atime. Experimental group 1 performed significantly better in terms of representation incomparison with experimental group 2 (Z = 3.057, p = 0.002) and the control group(Z = 3.859, p < 0.001). Only in terms of design there was no significant differencebetween the both experimental groups (Z = 1.879, p = 0.068) but experimental group 1performed significantly better in relation to design than the control group(Z = 3.290, p = 0.001). A Mann-Whitney U tests indicated that there was no significantdifferences between experimental group 2 and the control group in terms ofrepresentation (Z = -1.206, p = 0.240) or in terms of design (Z = -1.930, p = 0.058).
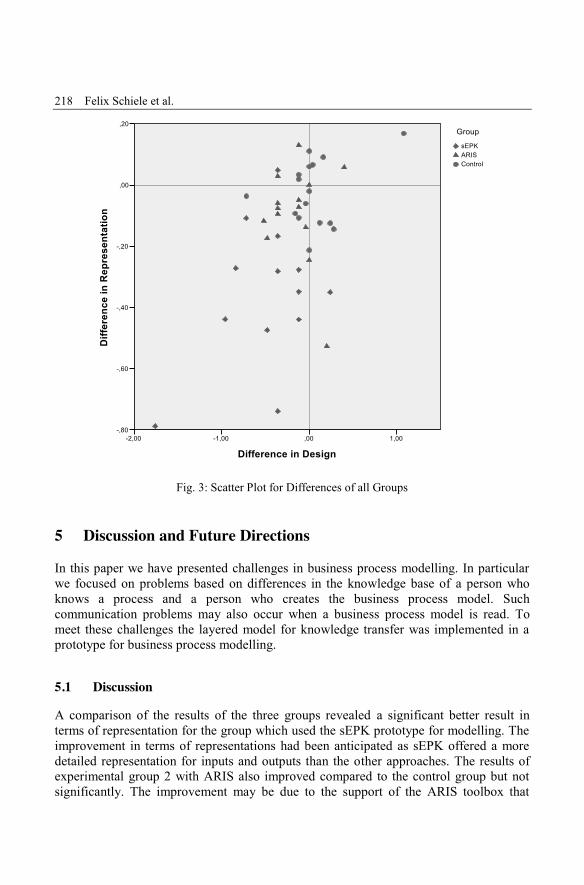
218 Felix Schiele et al.
Fig. 3: Scatter Plot for Differences of all Groups
5 Discussion and Future DirectionsIn this paper we have presented challenges in business process modelling. In particularwe focused on problems based on differences in the knowledge base of a person whoknows a process and a person who creates the business process model. Suchcommunication problems may also occur when a business process model is read. Tomeet these challenges the layered model for knowledge transfer was implemented in aprototype for business process modelling.
5.1 DiscussionA comparison of the results of the three groups revealed a significant better result interms of representation for the group which used the sEPK prototype for modelling. Theimprovement in terms of representations had been anticipated as sEPK offered a moredetailed representation for inputs and outputs than the other approaches. The results ofexperimental group 2 with ARIS also improved compared to the control group but notsignificantly. The improvement may be due to the support of the ARIS toolbox that
Improving the Understanding of Business Processes 219
offers all EPC symbols. However, the possibilities of describing the execution of afunction, the occurrence of an event or required inputs or outputs are limited to textattributes. In contrast, the sEPK prototype offers predefined categorised descriptionobjects, which can be enhanced if necessary. Based on the fact that sEPK and ARISprovided a toolbox with all required symbols for the creation of an EPC process it wasexpected that both experimental groups could improve in terms of design. Whileexperimental group 1 improved significantly in terms of design experimental group 2could not improve significantly. Some of the participants using sEPK or ARIS haddifficulties with the process alignment and thus their results in terms of design declined.The problems may be explained by the fact that the participants had only little or noexperience with modelling tools, so that the alignment of the process was more difficultfor them than without a tool. The control group using pen and paper for the modellingdid neither improve nor deteriorate. The experiment showed that a modelling tool likesEPC could help to improve the precision of a business process model. The support forthe modeller in matters of reusability and recommendation offered this possibilitywithout losing too much time for the more precise representation. However, theapproach demands a profound engagement with the business process as the creation of adetailed process model requires detailed knowledge about the business process thatneeds to be modelled. A limitation of this research may be that the experiment has onlyinvolved 43 students, thus the generalisation could be limited.
5.2 Future DirectionsThe implementation of the layered model in the area of business process showed firstresults. More effort in the representation of the description objects can be a worthwhilegoal. An ontology-based implementation might provide new options in combination withan inference engine. The detailed representation of the functions and events and thedetailed description of their inputs and outputs provide a basis for process analysis andoptimisation. This was confirmed by experts from industry and research who testedsEPK. Early detection of errors in business processes could be a further field ofapplication. From an economic view an error must be detected as soon as possiblebecause the costs of fixing the error rise disproportionately with the passed time.
References[AHW03] Aalst, W. M. van der; Hofstede, A. H. ter; Weske, M.: Business Process Management:
A Survey. In (Aalst, W. M. van der; Weske, M. Eds.): Business Process Management.Springer Berlin Heidelberg, 2003; pp. 1–12.
[BBG11] Bahrs, J.; Brockmann, C.; Gronau, N.: A Concept for Model Driven Design andEvaluation of Knowledge Transfer. In (IEEE Computer Society Ed.): Proceedings ofthe 2011 44th Hawaii International Conference on System Sciences. IEEE - TheInstitute of Electrical and Electronics Engineers, Washington, DC, USA, 2011.
220 Felix Schiele et al.
[CDK11] Ciabuschi, F.; Dellestrand, H.; Kappen, P.: Exploring the Effects of Vertical andLateral Mechanisms in International Knowledge Transfer Projects. In ManagementInternational Review, 2011, 51; pp. 129-155.
[Da11] Dalkir, K.: Knowledge Management in Theory and Practice. MIT Press, 2011.
[KNS92] Keller, G.; Nüttgens, M.; Scheer, A. W.: Semantische Prozeßmodellierung auf derGrundlage Ereignisgesteuerter Prozeßketten (EPK), Saarbrücken, Germany, 1992.
[Mi74] Minsky, M. L.: A framework for representing knowledge. Massachusetts Institute ofTechnology A.I. Laboratory, Cambridge, 1974.
[MRA10] Mendling, J.; Reijers, H. A.; Aalst, W. M. van der: Seven process modeling guidelines(7PMG). In Information and Software Technology, 2010, 52; pp. 127–136.
[MRC07] Mendling, J.; Reijers, H.; Cardoso, J.: What Makes Process Models Understandable?In (Alonso, G.; Dadam, P.; Rosemann, M. Eds.): Business Process Management.Springer Berlin Heidelberg, 2007; pp. 48–63.
[NT95] Nonaka, I.; Takeuchi, H.: The knowledge-creating company. Oxford University Press,Oxford, 1995.
[RM11] Reijers, H. A.; Mendling, J.: A Study Into the Factors That Influence theUnderstandability of Business Process Models. In Systems, Man and Cybernetics, PartA: Systems and Humans, IEEE Transactions on, 2011, 41; pp. 449–462.
[Sc00] Scheer, A.-W.: ARIS--business process modeling. Springer, Berlin, New York, 2000.
[SLC13] Schiele, F.; Laux, F.; Connolly, T. M.: A Layered Model for Knowledge Transfer:SEMAPRO 2013, The Seventh International Conference on Advances in SemanticProcessing, 2013; pp. 26–31.
[SLC14] Schiele, F.; Laux, F.; Connolly, T. M.: Applying a Layered Model for KnowledgeTransfer to Business Process Modelling (BPM). In International Journal on Advancesin Intelligent Systems, 2014, vol 7; pp. 156–166.
[SN00] Scheer, A.-W.; Nüttgens, M.: ARIS Architecture and Reference Models for BusinessProcess Management. In (Aalst, W. M. van der; Desel, J.; Oberweis, A. Eds.):Business process management. Models, techniques, and empirical studies. Springer,Berlin, New York, 2000; pp. 366–379.
[So00] Sowa, J. F.: Knowledge representation. Logical, philosophical, and computationalfoundations. Brooks/Cole, Pacific Grove, Calif. [u.a.], 2000.
[SS13] Schmelzer, H. J.; Sesselmann, W.: Geschäftsprozessmanagement in der Praxis.Kunden zufrieden stellen - Produktivität steigern - Wert erhöhen. Hanser, München,2013.
[St73] Stachowiak, H.: Allgemeine Modelltheorie. Springer, Wien, 1973.
[Te03] Teece, D. J.: Knowledge and Competence as Strategic Assets. In (Holsapple, C. W.Ed.): Handbook on Knowledge Management 1. Knowledge Matters. Springer, Berlin[u.a.], 2003; pp. 129–152.
[Ve04] Verner, L.: BPM: The Promise and the Challenge. In Queue, 2004, 2; pp. 82–91.
Alfred Zimmermann, Alexander Rossmann (Hrsg.): Digital Enterprise Computing 2015,Lecture Notes in Informatics (LNI), Gesellschaft für Informatik, Bonn 2015 221
Application of Process Mining for Improving Adaptivity inCase Management Systems
Eberhard Heber1, Holger Hagen2 and Martin Schmollinger3
Abstract: The character of knowledge-intense processes is that participants decide the nextprocess activities on base of the present information and their expert knowledge. The decisions ofthese knowledge workers are in general non-deterministic. It is not possible to model theseprocesses in advance and to automate them using a process engine of a BPM system. Hence, inthis context a process instance is called a case, because there is no predefined model that could beinstantiated. Domain-specific or general case management systems are used to support theknowledge workers. These systems provide all case information and enable users to define thenext activities, but they have no or only limited activity recommendation capabilities. In thefollowing paper, we present a general concept for a self-learning system based on process miningthat suggests the next best activity on quantitative and qualitative data for a given case. As a proofof concept, it was applied to the area of insurance claims settlement.
Keywords: Adaptive Case Management, Process Mining, Business Process Management.
1 IntroductionIn the past decade, Business Process Management (BPM) [VHW03] [We07] [DLMR13]gained more and more importance for companies due to a rising need for quicklyadapting a company’s processes to new business models and its requirements. Thedevelopment of modeling notations like Business Process Model and Notation (BPMN)[OMG11] that can be used for business modeling as well as for execution on processengines of BPM systems [Ka95] [Ch06] [DLMR13] improves the ability of ITdepartments to reduce the time for automating new processes.
The implementation of processes using a BPM system is the best approach for processesfor which it is possible to design a standardized model that is completely deterministicand can be reused for each process instance [SF07]. The model contains all possibleactivities and events and all their possible orders of execution. Process participants haveto deal with the same activities in each process instance.
Experiences from BPM projects in the last years showed that this approach is not
1 Novatec Consulting GmbH, Dieselstr. 18/1, 70771 Leinfelden-Echterdingen, [email protected], Germany
2 Novatec Consulting GmbH, Dieselstr. 18/1, 70771 Leinfelden-Echterdingen, [email protected], Germany
3 Reutlingen University, Herman Hollerith Zentrum, Alteburgstr. 150, 72762 Reutlingen, [email protected], Germany
222 Eberhard Heber et al.
applicable for all processes in all domains. Especially processes in knowledge-intenseworking domains, like e.g. incident management or handling of service requests, cannotbe modeled and automated in this way. The reason for this is that the required activitiesand their sequence of execution for handling a certain process instance depends on itsspecific situation. Depending on this, an individual plan has to be developed involvingan individual set of participants and activities. This plan is not static and can be adaptedto new situations during the handling of the instance. The plan is created and adapted bya knowledge worker and after completion of the process instance stored for potentialreuse on new instances [Sw10]. A knowledge worker “… is someone who knows moreabout his or her job than anyone else in the organization” [Dr59] and is therefore theonly one who is able to develop an individual plan for solving the current processinstance.
In this context the term process instance from BPM does not fit, because there is nopredefined model that could be instantiated. Instead of this, the term case is preferablebecause of the data-centric and goal-driven nature of the work. According to [Da05] thepercentage of knowledge workers in companies is between 25% and 50% of the generalworkforce. [Sw10] states that knowledge workers are possibly spending 95% of theworkday performing knowledge work. That means, that a huge part of a company’sbusiness processes is knowledge-intense and stresses the importance of a successful casemanagement and the need for an optimal IT support.
The BPMN standard defines ad-hoc processes that could help in such situations with therestriction that the potential number of activities in future for handling the casesuccessfully is known at the time of modeling. Unfortunately, the implementation of ad-hoc processes in BPM systems is very seldom. Currently, this statement is also valid forCMMN [OMG14], OMG’s new modeling standard for case management. This notationstandardizes the graphical modeling of case management processes. Nevertheless, alsothis approach only helps in situations, where all possible future activities are wellknown. Independent of this restriction, there are currently nearly no relevant systems onthe market that implement the notation. These are rather new developments which willimprove in future, but do not help for the moment due to the existing restrictionsconcerning support for knowledge-intense processes.
Traditionally, systems that support knowledge workers got well-known as casemanagement systems. In the last years, these systems improved their capabilitiesconcerning the adaptivity of the case handling leading to the term Adaptive CaseManagement (ACM) [Fi15] [LM11] [Pu10]. Vendors quickly adapted this term, but eachof them had a different understanding of the term adaptive in this context.
According to [LM11] a case is data-centric and the corresponding case folder includesall the documents, data, collaboration artifacts, activities, workflows, policies, rules,analytics and other information needed to handle the case. The handling itself is drivenby outside events and requires incremental and progressive responses from theknowledge workers of the respective business domain with a certain goal in mind.
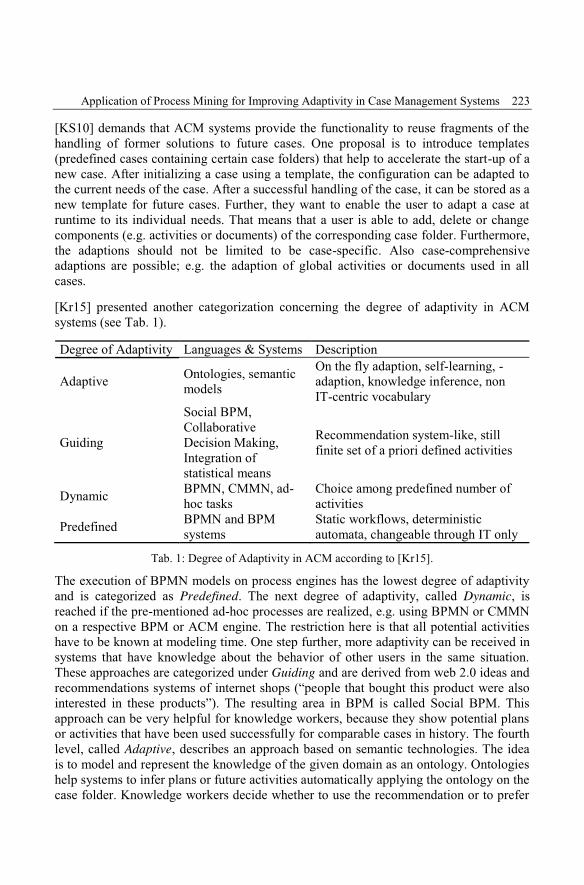
Application of Process Mining for Improving Adaptivity in Case Management Systems 223
[KS10] demands that ACM systems provide the functionality to reuse fragments of thehandling of former solutions to future cases. One proposal is to introduce templates(predefined cases containing certain case folders) that help to accelerate the start-up of anew case. After initializing a case using a template, the configuration can be adapted tothe current needs of the case. After a successful handling of the case, it can be stored as anew template for future cases. Further, they want to enable the user to adapt a case atruntime to its individual needs. That means that a user is able to add, delete or changecomponents (e.g. activities or documents) of the corresponding case folder. Furthermore,the adaptions should not be limited to be case-specific. Also case-comprehensiveadaptions are possible; e.g. the adaption of global activities or documents used in allcases.
[Kr15] presented another categorization concerning the degree of adaptivity in ACMsystems (see Tab. 1).
Degree of Adaptivity Languages & Systems Description
Adaptive Ontologies, semanticmodels
On the fly adaption, self-learning, -adaption, knowledge inference, nonIT-centric vocabulary
Guiding
Social BPM,CollaborativeDecision Making,Integration ofstatistical means
Recommendation system-like, stillfinite set of a priori defined activities
Dynamic BPMN, CMMN, ad-hoc tasks
Choice among predefined number ofactivities
Predefined BPMN and BPMsystems
Static workflows, deterministicautomata, changeable through IT only
Tab. 1: Degree of Adaptivity in ACM according to [Kr15].
The execution of BPMN models on process engines has the lowest degree of adaptivityand is categorized as Predefined. The next degree of adaptivity, called Dynamic, isreached if the pre-mentioned ad-hoc processes are realized, e.g. using BPMN or CMMNon a respective BPM or ACM engine. The restriction here is that all potential activitieshave to be known at modeling time. One step further, more adaptivity can be received insystems that have knowledge about the behavior of other users in the same situation.These approaches are categorized under Guiding and are derived from web 2.0 ideas andrecommendations systems of internet shops (“people that bought this product were alsointerested in these products”). The resulting area in BPM is called Social BPM. Thisapproach can be very helpful for knowledge workers, because they show potential plansor activities that have been used successfully for comparable cases in history. The fourthlevel, called Adaptive, describes an approach based on semantic technologies. The ideais to model and represent the knowledge of the given domain as an ontology. Ontologieshelp systems to infer plans or future activities automatically applying the ontology on thecase folder. Knowledge workers decide whether to use the recommendation or to prefer
224 Eberhard Heber et al.
an own plan or activity. Dependent on the decisions of the knowledge workers theunderlying ontologies must be adapted in order to improve future recommendations.Since the ontology represents knowledge, the knowledge worker (and not the ITdepartment) should be able to extend it in cases where unpredicted situations arise.
The last two approaches are similar in their attempt to learn from the decisions of theknowledge workers. While the first one (Guiding) derives the recommendation from datathat was collected during the handling of former cases, the latter approach (Adaptive)manages an explicit model that contains information about entities and their relations inthe respective domain.
In this paper, we present a concrete concept for realizing adaptivity in case managementsystems based on historic case handling data. The concept can be ranked in-between theadaptivity degrees (Tab. 1) Guiding and Adaptive, because it has properties of bothcategories. The concept can be characterized as follows:
" No explicit rule management: In general, the development of rule-based systems isvery work-intensive, because you have to work out how the business is reallydone. Besides political issues, you are also dependent of employees explainingtheir daily business from their personal point of view and you have to gather thisinformation together and to extract a set of rules. Further, a management of theserules has to be installed, i.e. a process for adding, deleting or updating rules. In ourapproach, we don’t use explicit business rules. Instead, we use the collected dataof previous handled cases that implicitly contains business rules.
" Process mining Technology: The existing domain-specific case managementsystems store each step of handling a case in their log files. Using process miningtechnology helps to discover the real process model out of the provided log files.This model is the base for the system’s recommendations. Although knowledgeworkers should be able to decide the next steps just on base of the current casefolder, the information about decisions and their consequences in similar formercases is valuable. Even if it is not possible in the respective knowledge-intenseprocess to adopt the recommendations of the system directly, the knowledgeworker should be able to revise them successfully for his current case.
" Self-learning: Each handled case leaves its footsteps in the log files of the casemanagement systems. By continuously updating the data store for process miningwith new handled cases the system learns with each of them.
" Quantitative and qualitative data: Besides data that just describes the quantitativeappearance of certain sequence of activities, we also want to include qualitativedata like the amount of damage and the duration of settlement in order to giveusers a domain-specific orientation for their decision.
" Add-on or plugin character: The concept can be realized as an add-on module toexisting domain-specific case management systems. In real world scenarios, theexisting software is very complex, closed and monolithic. Usually, only data
Application of Process Mining for Improving Adaptivity in Case Management Systems 225
integration approaches are acceptable concerning costs. This minimalistic kind ofintegration is sufficient for our concept.
Although the approach is very generic, we applied it to the area of insurance claimmanagement, where we could work on (in part anonymized) real world data as a base forour prototypic implementation. Before we go into details of the concept, we sketch theapplication domain and motivation.
2 Practical MotivationIn the field of insurances, claim settlements are handled as cases. The handling of thesecases can only be standardized in very rare situations, e.g. breakage of car glass. In themost cases, we are confronted with knowledge-intense processes. The clerk of theinsurance acts as a knowledge worker and must handle the cases in an interactive andevent-driven way, because new situations may arise every time like e.g. a letter from thelawyer of a client or the unforeseen behavior of an opposing insurance. In practice, thatmeans e.g. that the number and kind of activities necessary for settling a claim from ascratch in a car’s varnish is totally different from those needed for handling a write-offcar accident.
In this paper, we assume that claim settlements of the insurance is implemented by adomain-specific respectively an insurance case management system. The system storescases and case-specific activities that can be evaluated afterwards. On top of this, wewant to provide a recommendation system to support the clerks while they are handlingtheir cases one after each other. On base of former cases, the system suggests the nextbest activity (NBA) for a certain case. Depending on the current case state (given by thelast activity or event) the system calculates the NBA by taking into account the numberof occurrences of a certain activity in former cases in the same state, the resultingamount of damage and the time needed to finally settle the claim for taking this activity.Ideally, we don’t recommend only one opportunity but a list of opportunities prioritizedby the just mentioned figures.
For our experiments, we use a data pool from an insurance company containing about25.000 cases in 257.000 data sets.
3 A Concept for a Recommendation System based on ProcessMining
Process mining technology [VdA11] plays a key role in our concept. Process mining canproduce process models using activity data captured in event logs of information systemsreflecting the real process flow. [Br15] suggests four use cases for process mining inACM systems.
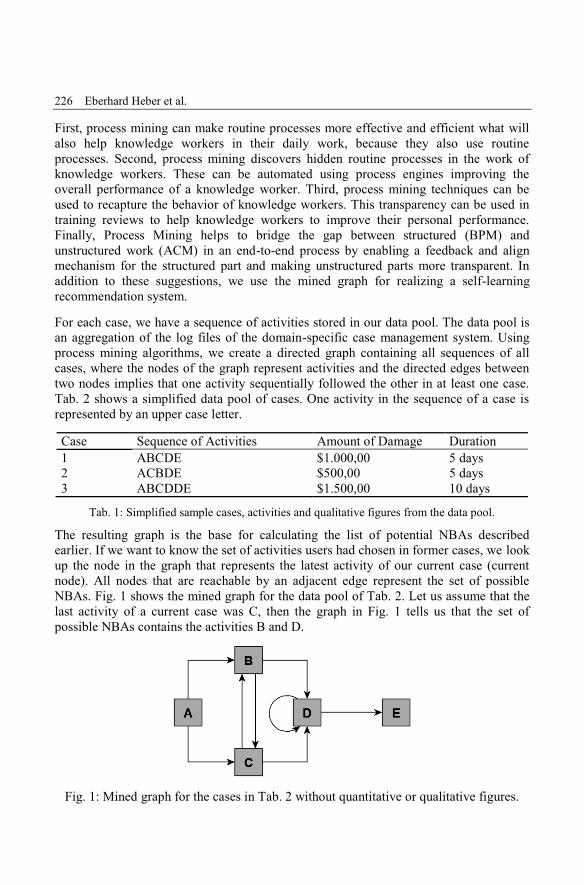
226 Eberhard Heber et al.
First, process mining can make routine processes more effective and efficient what willalso help knowledge workers in their daily work, because they also use routineprocesses. Second, process mining discovers hidden routine processes in the work ofknowledge workers. These can be automated using process engines improving theoverall performance of a knowledge worker. Third, process mining techniques can beused to recapture the behavior of knowledge workers. This transparency can be used intraining reviews to help knowledge workers to improve their personal performance.Finally, Process Mining helps to bridge the gap between structured (BPM) andunstructured work (ACM) in an end-to-end process by enabling a feedback and alignmechanism for the structured part and making unstructured parts more transparent. Inaddition to these suggestions, we use the mined graph for realizing a self-learningrecommendation system.
For each case, we have a sequence of activities stored in our data pool. The data pool isan aggregation of the log files of the domain-specific case management system. Usingprocess mining algorithms, we create a directed graph containing all sequences of allcases, where the nodes of the graph represent activities and the directed edges betweentwo nodes implies that one activity sequentially followed the other in at least one case.Tab. 2 shows a simplified data pool of cases. One activity in the sequence of a case isrepresented by an upper case letter.
Case Sequence of Activities Amount of Damage Duration1 ABCDE $1.000,00 5 days2 ACBDE $500,00 5 days3 ABCDDE $1.500,00 10 days
Tab. 1: Simplified sample cases, activities and qualitative figures from the data pool.
The resulting graph is the base for calculating the list of potential NBAs describedearlier. If we want to know the set of activities users had chosen in former cases, we lookup the node in the graph that represents the latest activity of our current case (currentnode). All nodes that are reachable by an adjacent edge represent the set of possibleNBAs. Fig. 1 shows the mined graph for the data pool of Tab. 2. Let us assume that thelast activity of a current case was C, then the graph in Fig. 1 tells us that the set ofpossible NBAs contains the activities B and D.
Fig. 1: Mined graph for the cases in Tab. 2 without quantitative or qualitative figures.
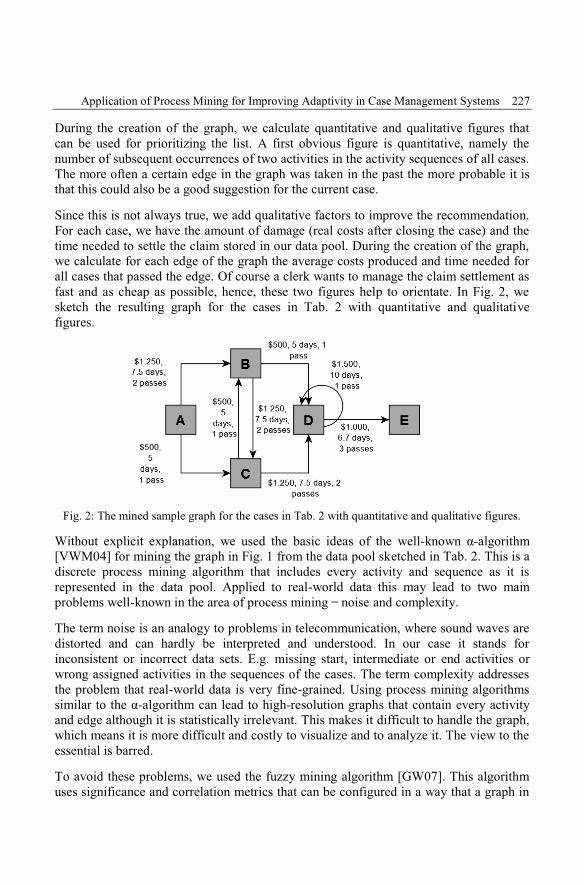
Application of Process Mining for Improving Adaptivity in Case Management Systems 227
During the creation of the graph, we calculate quantitative and qualitative figures thatcan be used for prioritizing the list. A first obvious figure is quantitative, namely thenumber of subsequent occurrences of two activities in the activity sequences of all cases.The more often a certain edge in the graph was taken in the past the more probable it isthat this could also be a good suggestion for the current case.
Since this is not always true, we add qualitative factors to improve the recommendation.For each case, we have the amount of damage (real costs after closing the case) and thetime needed to settle the claim stored in our data pool. During the creation of the graph,we calculate for each edge of the graph the average costs produced and time needed forall cases that passed the edge. Of course a clerk wants to manage the claim settlement asfast and as cheap as possible, hence, these two figures help to orientate. In Fig. 2, wesketch the resulting graph for the cases in Tab. 2 with quantitative and qualitativefigures.
Fig. 2: The mined sample graph for the cases in Tab. 2 with quantitative and qualitative figures.
Without explicit explanation, we used the basic ideas of the well-known α-algorithm[VWM04] for mining the graph in Fig. 1 from the data pool sketched in Tab. 2. This is adiscrete process mining algorithm that includes every activity and sequence as it isrepresented in the data pool. Applied to real-world data this may lead to two mainproblems well-known in the area of process mining noise and complexity.
The term noise is an analogy to problems in telecommunication, where sound waves aredistorted and can hardly be interpreted and understood. In our case it stands forinconsistent or incorrect data sets. E.g. missing start, intermediate or end activities orwrong assigned activities in the sequences of the cases. The term complexity addressesthe problem that real-world data is very fine-grained. Using process mining algorithmssimilar to the α-algorithm can lead to high-resolution graphs that contain every activityand edge although it is statistically irrelevant. This makes it difficult to handle the graph,which means it is more difficult and costly to visualize and to analyze it. The view to theessential is barred.
To avoid these problems, we used the fuzzy mining algorithm [GW07]. This algorithmuses significance and correlation metrics that can be configured in a way that a graph in
228 Eberhard Heber et al.
the desired granularity is mined. The idea of the algorithm can be compared to the zoomlevel in online maps. The lower the zoom level the less information is contained in theresulting map. The fuzzy algorithm provides the quantitative figures as described aboveout of the box. In order to include the qualitative figures, we equipped the algorithm withadditional information about minimal, maximal and average amount of damage, averageduration, as well as the number of passes. All these information is stored at the edgesduring the mining of the graph. By that it is possible to evaluate each adjacent edge fromthe point of view of a certain node and to generate the desired prioritized list ofactivities.
The prioritization function maps the input values to a scale from 0 to 10, where 10 is thehighest priority. As already explained, the function calculates a value for each edgeusing the stored information at the edge, namely costs, duration and number of passes.Since in first order, insurances want to work cost efficient the costs incur with a doubleweight in the calculation.
Applying this function to each edge leads to a sorting criteria for the list of possible nextactivities; the activities are sorted in descending order with respect to calculated priority.The sorted list containing all possible next activities and their quantitative and qualitativefigures can be presented for inspection to the clerk within the application. The NBA isthe activity in the list that has the highest priority (of course, sometimes there may bemore than one activity with the highest priority). The clerk in the role of a knowledgeworker is free to choose one alternative from the list or to decide to do something totallydifferent. Independent of this decision, the clerk executes the next activity using hiscasual insurance case management system. This decision is incorporated in futurerecommendations by updating the data pool of our NBA system.
4 Prototypic Implementation and Performance IssuesWe realized a web application prototype using the Java EE platform [DS13]. Theprocess mining part was realized using the Java-based generic open source frameworkProM published under the GPL license (v2). ProM is a platform for process mining,analysis and conversion that can be extended by plugins. Particularly, it provides severalplugins for process mining algorithms. We integrated the fuzzy mining algorithm in ourprototype by using and adapting the source code of the respective ProM plugin4.
Further, the prototype realizes the access to our real-world data pool, a user interface thatallows selecting subsets of the cases for claim classes (e.g. comprehensive cover or thirdparty liability) stored in the data pool and the mining of the decision graph. Forsimulation reasons, the creation of new cases, the calculation of the prioritized NBA listas describe in the last section, the creation of new activities instead of just selecting them
4 Both documentation and software (including the source code) can be downloadedfrom www.processmining.org
Application of Process Mining for Improving Adaptivity in Case Management Systems 229
from the suggested list and the inclusion of new handled, finalized cases in the decisiongraph is realized, too. The latter data is just stored in main memory and hence volatile.With these features it is possible to simulate the handling of cases by using therecommendation system.
During our simulations, we recognized serious performance problems. Experiments on acasual developer computer showed that the prototype is only able to extract and analyzeabout 50 cases out of 25.000 in an acceptable time. Although in a productiveenvironment the processing would be done on a more performant server, this seems to bea bottle neck for the whole approach. Particularly, if the software is used in a multi-userenvironment, we would have to generate multiple graphs at a time on the server and allof them have to be held in memory for a certain time (scope). One technical approach isto replace the persistence layer of the application. The prototype uses Java’s standardO/R mapper JPA. Though the usage of standard technologies has often big advantages,in this case it was not an adequate choice and provides room for improvement. Theperformance issue needs further investigations with respect to technology, algorithmsand data structures.
5 ConclusionsIn the last sections, we explained the characteristics of knowledge-intense processes andthe need for IT systems that support knowledge workers without limiting their freedomof decision. In this context, we presented an approach to increase the degree ofadaptivity in domain-specific case management systems. The core of the presentedconcept is the usage of process mining algorithms for a self- learning recommendationsystem that can be realized as an add-on to the given case management system. Therecommendation system suggests the next best activity on quantitative and qualitativedata for a given case. As a proof of concept, it was applied to the area of insuranceclaims settlement. The resulting prototype was used for simulations on real-world datafrom an insurance. During the simulations, serious performance problems wererecognized that need further investigation. Beside of this issue, the simulations werepromising, but have not yet been verified by a professional insurance clerk. This is thesecond open question. Are the recommendations generated by the system really helpful?In order to answer this question, the prototype has to be improved in functionality andperformance, the data pool has to be updated. Afterwards, a promising idea is that testclerks from an insurance use the prototype in parallel to their normal softwareenvironment in daily business. Ideally, for each case they decide on base of their normalenvironment what to do next. Before they commit their decision in the insurance’ssystem, they also ask our prototype what to do next and create a protocol about thedegree of conformity of both decisions. Afterwards the protocols and interviews with thetest clerks will hopefully give new insights for improving the quality of this approach.
230 Eberhard Heber et al.
References[Br15] Brantley, W. A.: Ontology-based ACM – The Need for Truly Adaptive Systems. In:
Fischer, Layna et al.: Thriving on Adaptability - Best Practices for KnowledgeWorkers. Future Strategies, 2015.
[Ch06] Chang, J. F.: Business Process Management Systems. Auerbach Publications, 2006
[Da05] Davenport, T. H.: Thinking for a Living – How to Get Better Performances andResults from Knowledge Workers. Boston: Harvard Business School Publishing, 2005.
[DLMR13] Dumas, M.; La Rosa, M.; Mendling, J.; Reijers, H.: Fundamentals of Business ProcessManagement. Springer, 2013.
[DS13] DeMichiel, L.; Shannon, B.; Java Community Process: JSR 342: JavaTM Platform,Enterprise Edition 7 (Java EE 7) Specification, URLhttps://jcp.org/en/jsr/detail?id=342, 2013.
[Dr59] Drucker, P. F.: Landmarks of Tomorrow, 1959.
[GW07] Günther, C. W.; van der Aalst, W.: Fuzzy Mining – Adaptive Process SimplificationBased on Multi-perspective Metric. In: Proceedings of the 5th InternationalConference Business Process Management (BPM), LNCS Volume 4714, pp 328-34,Springer, 2007.
[Ka95] Karagiannis, D.: BPMS: Business Process Management Systems. In: ACM SIGOISBulletin 16, pp 10-13, 1995.
[Kr15] Kress, J.; Utschig-Utschig, C.; Normann, H.; Winterberg, T.: Ontology-based ACM –The Need for Truly Adaptive Systems. In: Fischer, Layna et al.: Thriving onAdaptability - Best Practices for Knowledge Workers. Future Strategies, 2015.
[KS10] Khoyi, D.; Swenson, K. D.: Templates, Not Programs. In: Mastering the Unpredictable– How Adaptive Case Management will Revolutionize the Way that KnowledgeWorkers get Things done. Meghan-Kiffer Press, 2010.
[LM11] Le Clair; Miers: The Forrester Wave: Dynamic Case Management Q1 2011 / ForresterResearch. 2011.
[OMG11] Object Management Group: Business Process Model And Notation (BPMN) Version2.0 / Object Management Group. URL http://www.omg.org/spec/BPMN/2.0/PDF,2011.
[OMG14] Object Management Group: Case Management Model And Notation (CMMN) Version1.0 / Object Management Group. URL http://www.omg.org/spec/CMMN/1.0/, 2014.
[Pu10] Pucher, M. J.: The Elements of Adaptive Case Management. In: Mastering theUnpredictable – How Adaptive Case Management will Revolutionize the Way thatKnowledge Workers get Things done. Meghan-Kiffer Press, 2010.
[SF07] Smith, H. ; Fingar, Peter: Business Process Management - The Third Wave. Meghan-Kiffer Press, 2007.
Application of Process Mining for Improving Adaptivity in Case Management Systems 231
[Sw10] Swenson, K. D.: The Nature of Knowledge Work. In: Mastering the Unpredictable –How Adaptive Case Management will Revolutionize the Way that KnowledgeWorkers get Things done. Meghan-Kiffer Press, 2010.
[VdA11] Van der Aalst, W.: Process Mining: Discovery, Conformance and Enhancement ofBusiness Processes. Springer, 2011.
[VHW03] Van der Aalst, W.; ter Hofstede, A.; Weske, M.: Business Process Management: ASurvey. In: Lecture notes in computer science Bd. 2678/2003. Springer Verlag, p 1019,2003.
[VWM04] Van der Aalst, W.; Weijters, T; Maruster, L: Workflow Mining: Discovering processmodels from event logs. In: IEEE Transactions on Knowledge and Data EngineeringVol. 16 (9), pp 1128-42, 2004.
[We07] Weske, M.: Business Process Management. Springer Verlag, p 7, 2007.

Alfred Zimmermann, Alexander Rossmann (Hrsg.): Digital Enterprise Computing 2015,Lecture Notes in Informatics (LNI), Gesellschaft für Informatik, Bonn 2015 233
Experiencing Adaptive Case Management Capabilities withCognoscenti
Danielle Collenbusch, Anja Sauter, Ipek Tastekil and Denise Uslu8
Abstract: In a world with rapidly changing customer requirements and the increased role oftechnology, companies need more flexible systems to adapt their processes and react dynamicallyto changes. Adaptive Case Management (ACM) comes into consideration by providing a conceptto adapt to changing business conditions. Within our research project we did a first foundationalevaluation of the potential of ACM in supporting unpredictable sales processes. Based on a set ofcriteria we tested the concept of ACM with the open source tool Cognoscenti. The evaluation gaveus the possibility to experience the concept of ACM. Hence we were able to provide a statementabout the potential of ACM within the context of an unpredictable sales process, setting the path tofurther research and discussion of ACM in the area of sales processes.
Keywords: Adaptive Case Management, ACM, Business Process Management, BPM,Cognoscenti, Sales process, unpredictable process, Knowledge Worker
1 IntroductionIn today’s working environment it is essential to adapt to changing circumstances inorder to compete and raise customer satisfaction. Imagine a sales process within an ITcompany that is selling hardware (HW) and software (SW) with an additional serviceportfolio. Some customers can be served with out of the box solutions (HW, SW andpre-packed services), therefore a standardized process flow would be sufficient. But inother cases customers have very specific requirements, so there is no standardizedprocess flow to fulfill them. That is where we questioned capabilities of BusinessProcess Management (BPM) and started to research whether there is another way tosupport such an unpredictable sales processes – with no predefined path, many rolesinvolved, high level of communication, changing scope, etc. [Sw11]. An initial researchon how unpredictable processes could be supported led us to Adaptive CaseManagement (ACM) [Sw11] [Wo14]. Based on an abstract model of an unpredictablesales process, we evaluated the capabilities of an Adaptive Case Management System(ACMS) to support knowledge workers involved in a certain sales case. Using the opensource tool Cognoscenti [Sw15b] provided by Keith Swenson, we did a first evaluationof the concept of ACM. Within our evaluation we defined criteria covering the usabilityof the tool and the ACM capabilities of Cognoscenti.In this paper we want to share our experience and while doing this we aim to contribute
8 University of Reutlingen, Faculty of Informatics, M. Sc. Services Computing, Danziger Str. 6 | 71034Böblingen, [email protected]
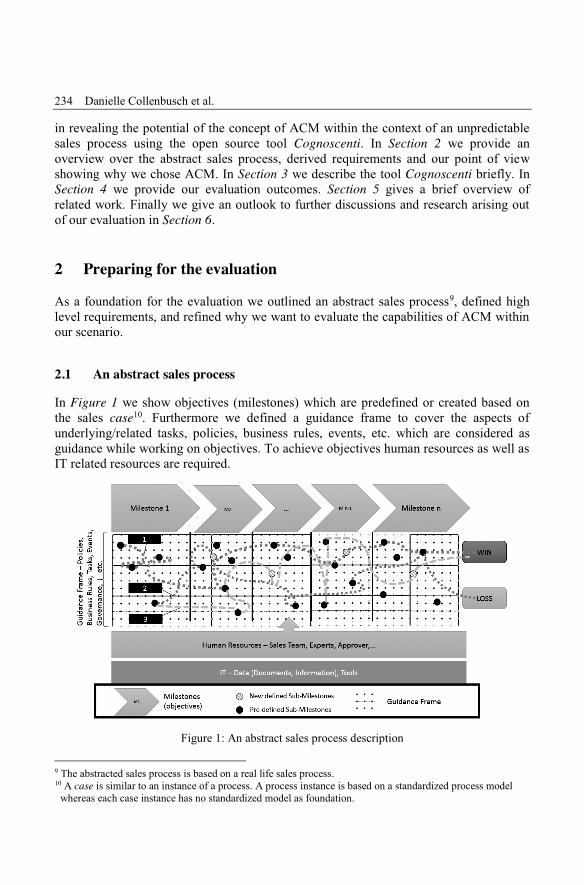
234 Danielle Collenbusch et al.
in revealing the potential of the concept of ACM within the context of an unpredictablesales process using the open source tool Cognoscenti. In Section 2 we provide anoverview over the abstract sales process, derived requirements and our point of viewshowing why we chose ACM. In Section 3 we describe the tool Cognoscenti briefly. InSection 4 we provide our evaluation outcomes. Section 5 gives a brief overview ofrelated work. Finally we give an outlook to further discussions and research arising outof our evaluation in Section 6.
2 Preparing for the evaluationAs a foundation for the evaluation we outlined an abstract sales process9, defined highlevel requirements, and refined why we want to evaluate the capabilities of ACM withinour scenario.
2.1 An abstract sales processIn Figure 1 we show objectives (milestones) which are predefined or created based onthe sales case10. Furthermore we defined a guidance frame to cover the aspects ofunderlying/related tasks, policies, business rules, events, etc. which are considered asguidance while working on objectives. To achieve objectives human resources as well asIT related resources are required.
Figure 1: An abstract sales process description
9 The abstracted sales process is based on a real life sales process.10 A case is similar to an instance of a process. A process instance is based on a standardized process model
whereas each case instance has no standardized model as foundation.
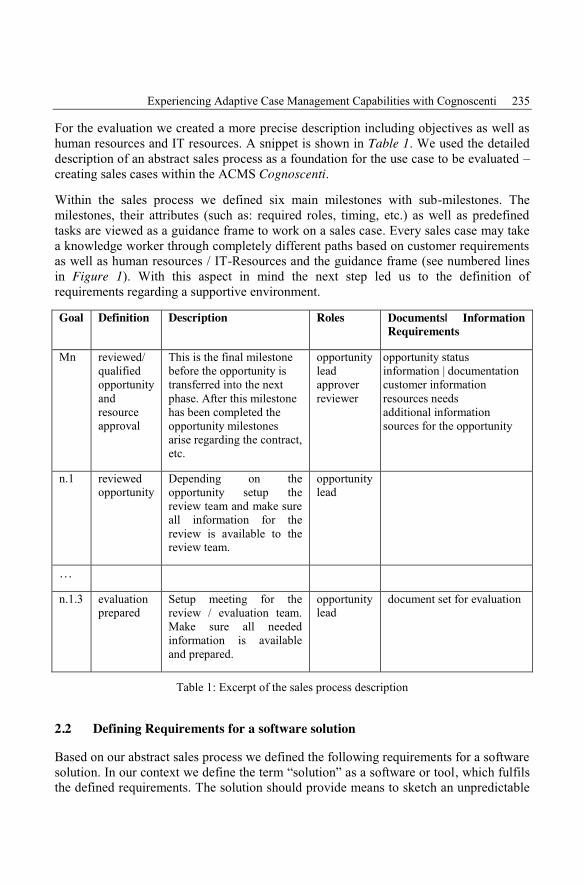
Experiencing Adaptive Case Management Capabilities with Cognoscenti 235
For the evaluation we created a more precise description including objectives as well ashuman resources and IT resources. A snippet is shown in Table 1. We used the detaileddescription of an abstract sales process as a foundation for the use case to be evaluated –creating sales cases within the ACMS Cognoscenti.Within the sales process we defined six main milestones with sub-milestones. Themilestones, their attributes (such as: required roles, timing, etc.) as well as predefinedtasks are viewed as a guidance frame to work on a sales case. Every sales case may takea knowledge worker through completely different paths based on customer requirementsas well as human resources / IT-Resources and the guidance frame (see numbered linesin Figure 1). With this aspect in mind the next step led us to the definition ofrequirements regarding a supportive environment.
Goal Definition Description Roles Documents| InformationRequirements
Mn reviewed/qualifiedopportunityandresourceapproval
This is the final milestonebefore the opportunity istransferred into the nextphase. After this milestonehas been completed theopportunity milestonesarise regarding the contract,etc.
opportunityleadapproverreviewer
opportunity statusinformation | documentationcustomer informationresources needsadditional informationsources for the opportunity
n.1 reviewedopportunity
Depending on theopportunity setup thereview team and make sureall information for thereview is available to thereview team.
opportunitylead
…
n.1.3 evaluationprepared
Setup meeting for thereview / evaluation team.Make sure all neededinformation is availableand prepared.
opportunitylead
document set for evaluation
Table 1: Excerpt of the sales process description
2.2 Defining Requirements for a software solution
Based on our abstract sales process we defined the following requirements for a softwaresolution. In our context we define the term “solution” as a software or tool, which fulfilsthe defined requirements. The solution should provide means to sketch an unpredictable
236 Danielle Collenbusch et al.
sales process. Even though milestones, goals, etc. are elements from projectmanagement, we wanted to be able to sketch the sales process with all sub goals in theselected tool. To reflect the adaptive nature of ACM, these goals should be changeable.The solution should also provide means to link documents. As documents are (besidesthe process flow) the most important fragments of a business case that can be tracked,the tool should provide means to link documents to certain process steps. This could bedone either by upload, or by including a connection to SharePoint or other documentstores. Furthermore, the solution should provide roles to which users can be assigned.The solution should also provide a mechanism for prediction of potential next steps. Asthe ultimate goal is to predict which steps in the process could lead to success or failure,a solution which is capable of doing so would be provide the highest level of support.However, this is highly improbable, so a solid base of data and possibilities to implementthis prediction mechanism would be sufficient. Most importantly, the solution must befree of charge. In the best case the solution is open source, which is not only free, butprovides the possibility of extensions and corrections.
2.3 Adaptive Case Management – handling unpredictable processesBPM is a discipline involving modeling, automation, control, and optimization ofbusiness activity flows, within and beyond the enterprise boundaries [Pa15]. StandardBPM is about automating routine processes that have a standard flow every time. Butautomation is impossible for knowledge related work, because the work itself simplydoesn’t repeat in routine patterns [Sw13].
After questioning the BPM approach, it was clear that normative defined and fixedprocesses are only useful for the execution of predefined and standardized flows. But inour case, “predefined” was the challenge. If it is not known, what tasks and in whichorder will be performed, how can they be predefined? Besides, in some cases there is ahuge number of alternatives to offer and it is not possible to choose one right path tomeet customer demands.
What we needed was a flexible BPM that supports real-time decisions and is adaptablewith learning effects. These essential requirements for enabling to support unpredictableand dynamic processes led us to ACM for further research. According to ACM everysingle case has to be considered as an individual process. To achieve specific goals ofcases, knowledge workers decide (with their own know-how, information systems etc.)which potential process steps to follow. ACM is thus flexible, data-driven, and dynamic.It also offers on-the-fly process models and allows customers and participants to actdynamically. Therefore a solution based on ACM was chosen.
ACM and BPM are not opposite approaches, instead they complement each other. Inmany projects both methods are needed and each should be used where it is appropriate.If there are a lot of potential process steps, if it is essential to use the know-how of aknowledge worker or if there is an unpredictable dynamic process; then ACM comesinto consideration.
Experiencing Adaptive Case Management Capabilities with Cognoscenti 237
3 ACM Environment – CognoscentiAn ACM approach provides a framework for knowledge-based and less predictableprocesses, which are unstructured and dynamic. Therefore an ACMS must provide ahigh level of flexibility and support knowledge workers to achieve their goals related toa case.
Cognoscenti11 has been developed by Keith Swenson who has made manycontributions12 in the ACM area. Today Cognoscenti is available to everyone as an opensource experimental platform which presents features and characteristics of an ACMapproach.
To support complex and unpredictable processes, one should experience many differentprocesses and approaches first. Regarding this purpose Cognoscenti offers a set ofcapabilities to track documents, goals, roles, notes, etc. By providing such structuralsupport with the ability to adapt as needed, it supports knowledge workers to adapt theirspecific cases, make real time and data-driven decisions, and achieve their goals.
Cognoscenti stores all information in XML files. Since adapting databases to specificneeds is highly complex in a comparison to XML files, Cognoscenti makes theinstallation a lot easier by removing the need of a database. XML files offer a flexibleschema that can be evolved efficiently and also allow users to access and edit filesdirectly.
The conceptual object model which consists of “Site,” “Project” and “UserProfile”objects, forms the root of Cognoscenti. The “Site” object stands for a space which has agroup of owners who all are allowed to create projects on this site. The “Project” objectis a collection of documents, notes, roles, goals, history etc. The “UserProfile” object haspersonal information about users like their addresses and personal settings, but it is notrelated to the “Site” and “Project” objects. Therefore a user is allowed to have multipleroles and responsibilities in variable projects.
Since Cognoscenti is first and foremost a collaborative case management system to workwith sensitive information, security features, that control how particular users accessparticular artefacts, are seen as a primary consideration by the developers ofCognoscenti. Security must be easy and clear enough to understand and only the rightpeople should have access to specific artefacts. Therefore, the security and access controlsettings must be clear for non-technical users, too. If a particular user is assigned to anactive goal in Cognoscenti, this user will automatically get access to all the documents of
11 The adventure of Cognoscenti has begun as a research prototype within Fujitsu North America. It has beendeveloped by Keith Swenson. Today with some strategic internal company changes Cognoscenti is availableto everyone as an open source experimental platform.
12 Keith Swenson is a pioneer in case management area and keynote speaker at many conferences. He is alsothe writer of the book „Mastering the Unpredictable: How Adaptive Case Management Will Revolutionize theWay That Knowledge Workers Get Things Done” which has a high importance in the Case ManagementArea.
238 Danielle Collenbusch et al.
this goal. If this user delegates an assignment to another person, this person will also getaccess to the documents immediately. With these features users of Cognoscenti don’tneed to spend additional time on management of the access rights. [Sw14]
3.1 Installing CognoscentiAiming to share the whole picture of our experience within this paper, we also want tocover the installation process of the ACM tool Cognoscenti as follows:
Cognoscenti is built to be installed in five easy steps. First, the user has to drop thedownloaded WAR-file into TomCat's webapps directory and second edit the mainconfiguration. The next steps are to edit some configuration files, for which examplesare given. As a last step the user has to create an account and edit the main config to setthis account as administration account.
Installing Cognoscenti is straightforward. However, there are a few details, that aren'tmentioned and caused our installation to fail multiple times. As most of them are alreadyfixed in a newer version of Cognoscenti, we only wanted to mention the following one:Only one Cognoscenti instance per machine is allowed and trying to install multipleinstances leads to breaking all instances. This should be mentioned more visible to avoidconfusion. But in the best case, installing Cognoscenti is actually really easy andrequires almost no deeper technical knowledge. All needed configuration details aregiven and work out of the box.
3.2 Cognoscenti reflecting sales casesAfter the technical setup of Cognoscenti we created sales cases based on our abstractsales process to do the evaluation. Using the vocabulary of Cognoscenti we set up theenvironment as follows:
Project: The sales case is reflected as a project within Cognoscenti. All of the followingsetups are within the context of a specific project.Project goals: We used project goals to reflect the milestones as well as some sub-levelsof milestones. Here we used the possibility to describe the milestones in more detail –like timing, required roles, description, etc. This enables new knowledge workers tolearn about the case – current status, next steps/objectives, etc.
Project notes: Project notes were used for communication within the case environment.It provides the capability to share information as well as gathering feedback from theteam. Additionally there is the possibility to restrict the access to project notes to focuson a certain group of case worker. This is important regarding sensitive data within asales case.
Project documents: While handling a sales case, a wide range of data is needed,
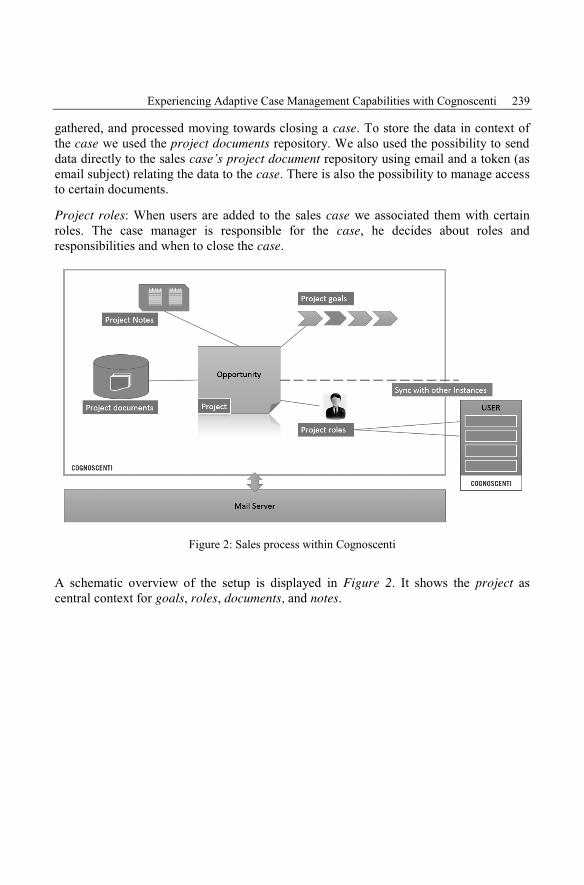
Experiencing Adaptive Case Management Capabilities with Cognoscenti 239
gathered, and processed moving towards closing a case. To store the data in context ofthe case we used the project documents repository. We also used the possibility to senddata directly to the sales case’s project document repository using email and a token (asemail subject) relating the data to the case. There is also the possibility to manage accessto certain documents.
Project roles: When users are added to the sales case we associated them with certainroles. The case manager is responsible for the case, he decides about roles andresponsibilities and when to close the case.
Figure 2: Sales process within Cognoscenti
A schematic overview of the setup is displayed in Figure 2. It shows the project ascentral context for goals, roles, documents, and notes.
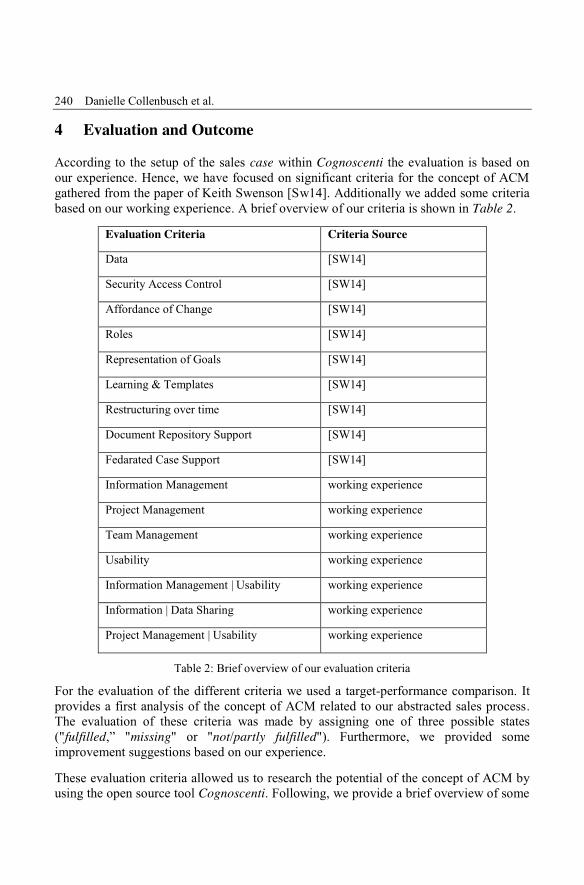
240 Danielle Collenbusch et al.
4 Evaluation and OutcomeAccording to the setup of the sales case within Cognoscenti the evaluation is based onour experience. Hence, we have focused on significant criteria for the concept of ACMgathered from the paper of Keith Swenson [Sw14]. Additionally we added some criteriabased on our working experience. A brief overview of our criteria is shown in Table 2.
Evaluation Criteria Criteria SourceData [SW14]
Security Access Control [SW14]
Affordance of Change [SW14]
Roles [SW14]
Representation of Goals [SW14]
Learning & Templates [SW14]
Restructuring over time [SW14]
Document Repository Support [SW14]
Fedarated Case Support [SW14]
Information Management working experience
Project Management working experience
Team Management working experience
Usability working experience
Information Management | Usability working experience
Information | Data Sharing working experience
Project Management | Usability working experience
Table 2: Brief overview of our evaluation criteria
For the evaluation of the different criteria we used a target-performance comparison. Itprovides a first analysis of the concept of ACM related to our abstracted sales process.The evaluation of these criteria was made by assigning one of three possible states("fulfilled,” "missing" or "not/partly fulfilled"). Furthermore, we provided someimprovement suggestions based on our experience.
These evaluation criteria allowed us to research the potential of the concept of ACM byusing the open source tool Cognoscenti. Following, we provide a brief overview of some
Experiencing Adaptive Case Management Capabilities with Cognoscenti 241
of our outcome:
Cognoscenti stores Data in an XML-format which simplifies the data exchange and alsothe extension of the Data-schema. The idea for improvement of the criterion Data is tocollect use historic case-data and make it useful for further projects/cases (e.g.recommend a next best step). A pattern structure could give guidance on how to fulfillcustomer requirements successfully based on historic data (logs). Thus the weakness of aprocess can be emphasized and determined with enhancement for a better customerservice.
The criterion Affordance of Change administers the members for access, project, andgoals. Worth considering is that a role will not be distributed by the super admin.Different roles should have the possibility to manage an access to provide moreflexibility.
The Federate Case Management criterion is responsible for the connection with otherCase Management Systems and could not be evaluated, since we only have implementedone ACMS. The Federated Case Management is beneficial for synchronizing data in-between heterogeneous ACMSs [Sw14]. The Document Repository Support enables thesynchronization of project documents and connection to several repositories. Thisenables a better handling of project related content even though it is distributed over avariety of repositories.
The Learning & Templates capability allows reusing cases that are marked as template.A central repository for all project templates would provide a dynamic exchange and theusers could learn from each other. However, improvement suggestions for capabilitiesrelated to the criterion Usability might be considered. The navigation in Cognoscenti isnot always explicit. The possibility for users to personalize the menu would reducecomplexity.
For the project management Cognoscenti has beneficial features. We were able to mapevery single process step. The structure of hierarchy gave notice about the goals and thesub-goals (Representation of Goals). For a general overview it would be nice to have aone pager inside of a project which can be used to get more detailed information. Toachieve goals the support of Information | Data Sharing is essential. Folders can begenerated and information can be shared in order to work towards goals and makedecisions. However, a communication outside of the notes was not enabled within theimplementation of Cognoscenti. Additional functionality enabling collaboration couldprovide a further improvement (e.g.: Instant Messaging, Micro Feed, etc.).
The concept of Cognoscenti is promising. Therefore, this first evaluation wasfundamental to emphasize the potential of the concept of ACM for our scenario. For anultimate assumption our evaluation is not sufficient. For sophisticated statements thereneeds to be ongoing research and further evaluation with a deeper focus on certain partsof the concept of ACM.
242 Danielle Collenbusch et al.
5 Related WorkWithin our project we looked on the potential of ACM for an unpredictable salesprocess. There are other scientific works analyzing the aspects of ACM. Especially thepaper from Hauder, Pigat et al. [HPM14] gives an overview over the research areas ofACM. The books published by the WfMC are providing also good insight on the conceptof ACM. Beside of theoretical aspects there are also real life cases explaining how ACMis already used [Sw11] [Sw12] [Sw15a]. In [Sw15a] for example, use cases describescenarios where ACM is used for a NASA project or within the government of Norway.
Looking at tools beside the open source tool Cognoscenti we found Oracle [Or15] andTIBCO [Ti15] providing ACM capabilities within their products. Another tool which isone of the first hour is Isis Papyrus [Is15].
Within our evaluation we found the functionality of advanced collaboration withinCognoscenti was not sufficient. In other researches in the area of ACM, the collaborationaspect seems to be an important topic. This includes topics like: finding experts tohandle a case [HWG14], collaborative case management supported by IT-tools[HLB14], flexible case management in a social network environment [Mo12] andcollaborative knowledge work [MKR13].
Looking on all those references and related works we could not identify use cases for thecontext of unpredictable sales processes. Mainly we found examples for health care orinsurance claims. Nevertheless the related work show that there is a broad range ofresearch within the area of ACM which can also be leveraged into further research in thecontext of unpredictable sales processes.
6 Conclusion and OutlookThe ultimate goal of all companies hasn’t changed: “to meet customer demands.” But ina world with rapidly changing customer requirements and the increased role oftechnology, companies need more flexible technology solutions to adapt their processesand react dynamically to the changing conditions. ACM comes into consideration byproviding such flexibility and capability to adapt to changing business conditions. ACMputs knowledge in the center and serves for sustainable further development andoptimization.
Within our paper we provided a first foundational evaluation of the potential of ACM insupporting unpredictable sales processes. The evaluation with Cognoscenti showed usthat the concept of ACM has a high potential. Further research could evaluate thepotential of linkages to Customer Relationship Management, the analysis of collectedcase data as well as management support with new measurement systems to manageunpredictable processes. A further evaluation may also involve user and include criteriaweighting, taking additional tools into consideration.
Experiencing Adaptive Case Management Capabilities with Cognoscenti 243
References[HLB14] Huber, S.; Lederer, M.; Bodendorf, F.: IT-enabled collaborative case management –
Principles and tools; pp. 259–266, 2014.
[HPM14] Hauder, M.; Pigat, S.; Matthes, F.: Research Challenges in Adaptive CaseManagement: A Literature Review; pp. 98-107, 2014.
[Is15] Isis Papyrus: ISIS Papyrus Communications and Process Platform. Under:http://www.isis-papyrus.com/e15/pages/software/software.html#sthash.oa8Cgbe4.5Eacz4TT.dpbs.2015. (Call date: 28.03.2015).
[MKR13] Mundbrod, N.; Kolb, J.; Reichert, M.: Towards a System Support of CollaborativeKnowledge Work, 132; pp. 31–42, 2013
[Mo12] Motahari-Nezhad, H. R. et al.: Adaptive Case Management in the Social Enterprise,7636; pp. 550–557, 2012.
[Or14] Oracle – Adaptive Case Management: Under:http://docs.oracle.com/cd/E28280_01/doc.1111/e15176/case_mgmt_bpmpd.htm#BPMPD87407. (Call date: 03.04.2015).
[Pa15] Palmer, Nathaniel: “What is BPM?” Business Process Management, Inc. Under:http://bpm.com/what-is-bpm. (Call date: 15.03.2015).
[Sw11] Swenson, Keith D. et al.: Taming the Unpredictable, Lighthouse Point Florida, p. 84.201.
[Sw12] Swenson, K. D.: How knowledge workers get things done. Future Strategies, London,2012.
[Sw13] Swenson, Keith D.:”White Paper: State of the Art in Case Management”. FujitsuAmerica, Inc. March, p. 5-6, 2013.
[Sw14] Swenson, Keith D.: “Demo: Cognoscenti Open Source Software for Experimentation onAdaptive Case Management Approaches”, in Proceedings of the 18th InternationalEnterprise Distributed Object Computing Conference, IEEE EDOC, Ulm/Germany,September 1-5 2014.
[Sw15a] Swenson, K. D.: Thriving on adaptability. Best practices for knowledge workers.Lighthouse Point, FL 33064 USA, 2015.
[Sw15b] Swenson, Keith D.: The installation code and instructions for Open Source AdaptiveCase Management System: Cognoscenti. Under:https://code.google.com/p/cognoscenti/. (Call date: 03.03.2015).
[Ti15] TIBCO: TIBCO – Application/Integration/Automation Product: TIBCO ActiveMatrixBusinessWorksTM 6.0. Under: http://www.tibco.com/products/automation/application-integration/activematrix-businessworks. (Call date: 28.03.2015).
[Wo14] WfMC – Workflow Management Coalition. Under:http://adaptivecasemanagement.org/AboutACM.html. (Call date: 09.03.2015).


Big Data

Alfred Zimmermann, Alexander Rossmann (Hrsg.): Digital Enterprise Computing 2015,Lecture Notes in Informatics (LNI), Gesellschaft für Informatik, Bonn 2015 247
On Practical Implications of Trading ACID for CAP in theBig Data Transformation of Enterprise Applications
Andreas Tönne1
Abstract: Transactional enterprise applications today depend on the ACID property of theunderlying database. ACID is a valuable model to reason about concurrency and consistencyconstraints in the application requirements. The new class of NoSQL databases that is used at thefoundation of many big data architectures drops the ACID properties and especially gives upstrong consistency for eventual consistency. The common justification for this change is the CAP-theorem, although general scalability concerns are also noted. In this paper we summarize thearguments for dropping ACID in favour of a weaker consistency model for big data architectures.We then show the implications of the weaker consistency for the business customer and hisrequirements when a transactional Java EE application is transformed to a big data architecture.
Keywords: big data, acid, cap theorem, consistency, requirements, nosql
1 IntroductionThe ACID property of relational databases has proven to be a valuable guarantee forspecifying enterprise application requirements. Business customers are enabled toexpress their business needs as if they are sequentially executed. The complicated detailsof concurrency control of transactions and maintaining consistency are delegated to thedatabase. ACID has become a synonym for a promise of effective and safe concurrencyof business services. And business customers have learned to assume this as given and asa reasonable requirement.
The broad scale introduction of NoSQL[Ev09][Fo12] databases to enterprises forsolving big data business needs introduces a new class of promises to the businesscustomer. Strong consistency as promised by ACID is replaced by the rather weakeventual consistency[Vo09]. The CAP-theorem[Br00] is the excuse of the NoSQLdevelopers and generally of the big data architects to weaken consistency in favour ofavailability, although modern NoSQL database also offer higher levels of consistency.
In this paper, we discuss the consequences of the transformation of enterpriseapplications to a big data architecture. Our focus lies on the practical implications ofloosening consistency for the business customers and their requirements. We considerthe severity of the implications, the difficulty to balance these with the customerexpectations and strategies for remedies.
1 NovaTec Consulting GmbH, Dieselstrasse 18/1, 70771 Leinfelden-Echterdingen, [email protected]
248 Andreas Tönne
1.1 Transformation ScopeThe class of enterprise applications, which we consider are the OLTP (online transactionprocessing) applications. As the name implies, these applications critically depend ontransactional properties and for this upholding ACID is seen mandatory. Our generalinterest lies in the question to what degree (and at what cost) can business needs thattoday require OLTP applications can be transformed to the big data paradigm.
1.2 Big Data ChallengesOLTP applications are under a strong big data pressure. The three main characteristicsvolume, variety and velocity of big data also apply to many today's enterpriseapplications. The volume of data to handle increases through new relevant sources likefor example the Internet of Things or the German governments Industrie 4.0 initiative[Bm15]. Also globalization in general increases the amount of data to handle. Thevariety of data increases greatly because structured data source are increasinglyaccompanied or replaced by unstructured sources like the Web or Enterprise 2.0initiatives. Acceleration of business processes and the success of big data analytics (datascience) of competitors increase the demands for a higher velocity, especially combinedwith the required higher data volumes.
We think it is fair to state that many OLTP applications already operate under big dataconditions. However they show a strong inertia to complete the transformation. Theirarchitecture hinders the integration of unstructured data source. Their choice of forexample Java EE with a relational database means a hard limitation of scalability. Andas will be shown in this paper, the practical consequences and compromises for big datascale processing are threatening to the business customer.
1.3 ContributionWe experienced these transformation challenges in the migration of a customer'smiddleware solution to a big data architecture. The first transformation milestone,establishing demonstration capabilities of the solution, was an eleven man year effort.The architecture changed from a layered monolith based on Java EE and a relationaldatabase to a cloud ready microservices topology. We were using the Titan graphdatabase [Th15], Cassandra [Ap15][LM10] as the NoSQL storage backend andElasticsearch [El15] for indexing. The transformation was critical to our customer for thesimple reason that the existing implementation was falling short of the scalingrequirements by three orders of magnitudes.
The solutions main purpose is to provide ETL (extract, transform, load) services toenterprise applications in a flexible way. Structured and unstructured data is extractedfrom a large range of sources (using agents) and lossless converted to a common datamodel. This data is persisted in the style of a data lake [Fo15] but structured and
On Practical Implications of Trading ACID for CAP in the Big Data Transformation 249
enriched with metadata. The metadata describes semantic and formal relations betweenthe data records similar to an ontology. The combined data structure is persisted in adistributed graph database.
The heart of the solution are the analysis algorithms and their quality requirements.Running such analysis concurrently while preserving consistency is a criticalrequirement. If for example two data records are analyzed for their relationshipsconcurrently, duplicate relations like "my user matches your author" and "my authormatches your user" would lead to wrong overall relation weights between the tworecords. Such concurrency conflict is actually a common case: if sets of related recordsare modified in an application, these would be imported for analysis concurrently and theconsistency of relations is threatened across many concurrent nodes. Consistency ruleslike requiring uniqueness of commutative relations ("we have something in common")were enforced in the business requirements through uniqueness constraints on thedatabase. It should be needless to point out that this was a scalability killer by design.
1.4 Structure of this PaperIn the following section 2 we introduce the reader to the CAP theorem and eventualconsistency and discuss their relevance for scalability.
Section 3 is the main result of this paper, showing the implications of switching toeventual consistency for scalability reasons to our business project.
Some remaining challenges are described in section 4.
2 The CAP Theorem, Eventual Consistency and ScalabilityIn this section, we provide an overview of the influences of the CAP theorem andeventual consistency to scalability concerns of distributed transactional applications. Wemotivate the decision to loosen consistency up to the point of eventual consistency. Andwe briefly show possibilities to achieve higher levels of consistency and their price interms of scalability and effort.
2.1 Scalability is the New Top Priority
The transformation of application architectures from transactional monoliths todistributed cloud service topologies, from traditional to web and big data, usually comeswith a shift of priorities. An influential statement for this shift was given by WernerVogels, Amazon CTO:
"Each node in a system should be able to make decisions purely based on local state. Ifyou need to do something under high load with failures occurring and you need to reach
250 Andreas Tönne
agreement, you’re lost. If you’re concerned about scalability, any algorithm that forcesyou to run agreement will eventually become your bottleneck. Take that as a given."[Vo07][In07]
The shift was from consistency as the main promise for application properties toavailability of services, which is treated second-class by ACID systems. And the rulingregime, as pointed out by Vogels, is the (horizontal) scalability. These new architecturesare characterized by being extremely distributed, both in terms of number of computingand data nodes and distance measured in communication latency and network partitionprobability. Data replication is used to achieve better proximity of data and client andbetter availability in the presence of network partitions. Also for big data, replication isoften the only sensible backup strategy.
2.2 BASE Semantics and Eventual Consistency
The conflict between ACIDs consistency focus and the availability demands of webbased scalable large distributed systems lead to the alternative BASE datasemantics[Fo97] (basically available, soft state, eventual consistency) which uses theweak eventual consistency model. This basically means that after a write there is anunspecified period of time of inconsistency while the change is replicated through thedistributed topology of data nodes. Which version of the data is presented at a node inthis time window is pure luck. Eventually after a period of no changes, the network ofdata nodes stabilizes and agrees on the last written version.
We do not want to embark on a discussion of other stronger consistency models that arealso offered by some NoSQL databases like Cassandra using quorums or paxosprotocols. When discussing this consistency issue with business customers in the light oftheir requirements, the interesting question is "how on earth did they get away with sucha lousy consistency model?".
2.3 CAP TheoremThe answer lies in the CAP theorem [Br00] and its proof [GL02], which was (ab-)usedby the developers of NoSQL databases to ignore the matter of stronger consistency toachieve better scalability and availability, and justify eventual consistency as a law ofnature. Any distributed system may have the following three important properties andBrewer's conjecture was that you can only have two of these at any time2:
1. Consistency, which means single-copy consistency (ACID consistency withoutthe data invariants): all nodes have the same version of a value.
2 Actually the proof by Gilbert and Lynch makes use of an asynchronous model and thus introduces theassumption that there is no common notion of time in the distributed system. This seems to be consistent withthe intention of Brewer but limits the scope of CAP in practical systems.
On Practical Implications of Trading ACID for CAP in the Big Data Transformation 251
2. Availability, which can be characterized as the promise: as long as a node is up,it always returns answers (after an unbounded duration of time).
3. Partition Tolerance, which means it is ok to lose arbitrarily many messagesbetween nodes.
This theorem and its adoption as a justification for eventual consistency sparked lastingdiscussions about its relevance and which choice of CA, CP or AP is the best. Brewerhimself summarizes his view of the state of affairs of CAP [Br12] highlighting the veryimportant interpretation of CAP that "First, because partitions are rare, there is littlereason to forfeit C or A when the system is not partitioned. Second, the choice betweenC and A can occur many times within the same system at very fine granularity..." and"Because partitions are rare, CAP should allow perfect C and A most of the time, butwhen partitions are present or perceived, a strategy that detects partitions and explicitlyaccounts for them is in order." CAP is all about managing the exceptional case of anetwork partition, which is a split-brain situation. The decision to take is called thepartition decision by Brewer [Br12]:
" Cancel an operation after a timeout and decrease availability or
" Proceed with the operation and risk inconsistency
The matter of healing network partitions is handled by NoSQL implementations usingfor example brute-force strategies like last-write-wins. A more graceful solution wouldbe to use vector clocks to identify and handle merge conflicts of partitioned data change.
2.4 NoSQL With Higher Levels Of ConsistencyThe NoSQL community initially has settled for AP with eventual consistency, inspiredby Amazon's Dynamo database [De07]. But we are seeing more and more additions toNoSQL databases that allow stronger consistency models like for example Cassandra[Da15] allowing a quorum consistency level. Thus the choice of AP or CP is no longerfixed by our architecture and in Cassandra for instance it is possible at the level ofindividual reads and writes.
There is however a price attached to higher levels of consistencies and that is the degreeof scalability we can achieve. As Vogels pointed out in the above quote, any need foragreement opposes scalability. Achieving strong consistency with a quorum or evennaively requiring all data nodes in a system to acknowledge a write will likely reducescalability of a big data scale system drastically.
252 Andreas Tönne
In our example application, lowering the consistency level to single node writes resultedin orders of magnitude speedups (throughput) while exposing architectural issues that wewill describe in the following section3.
The good news is that eventual consistency is not as bad as it sounds. Recent analysis[BG13] shows that eventual consistent databases can achieve consistency on a frequentbasis within tens or hundreds of milliseconds. What this does not tell us is what damagesare done during this period and how to deal with them.
3 Business ImplicationsThis section is the main result of the transformation of our OLTP application to a bigdata stack with a NoSQL database. We discuss the tension in the project between thebusiness customer, requiring ACID properties that he was used to and the requirement toachieve a substantial increase in scalability and throughput. The reduction in consistencyleads to some difficult questions about the business requirements. We also give sometechnical details of how we dealt with the errors introduced by the reduced consistencylevel.
3.1 ACID RequirementsJudging the business implications of turning towards a big data database with loosenedconsistency requires us to respect the business customer needs and expectations. In anideal world, a business service is specified under the assumption of perfect singularity ofthe executing system. No side effects, no concurrency, no temporal considerations, noother users, no failures. Consistency is defined in terms of business rules about dataintegrity.
In the last decades, transactional systems upholding the ACID properties wereunderstood and accepted by business customers as the nearest approximation of thissimplified ideal that could be delivered by their IT people.
The ACID properties of a transaction guarantees the following beneficial guarantees forits execution:
Atomicity - The guarantee that the transaction is executed in one atomic step (from anoutside view) or aborted as a whole.
Consistency - The guarantee that the transaction transforms the database from aconsistent state to another consistent state. The notion of consistency can vary largely,depending on the capabilities of the underlying database. Usually this includes structural
3 Performance figures are unfortunately not available and meaningful since the system went through a rapidsequences of changes.
On Practical Implications of Trading ACID for CAP in the Big Data Transformation 253
consistency rules about uniqueness and referential integrity as well as data consistencyrules.
Isolation - The guarantee that concurrent transactions are isolated against theirrespective database changed to a configurable degree.
Durability - The guarantee that once a transaction was committed (success), its changesare permanent, even in the presence of system failures.
ACID has proven to be a simple enough model to talk about requirements in thepresence of such nasty things as concurrency and failures. At times, the architect wouldcome back with "Would it be allowed that..." questions, asking for exceptions to thesimplified world and complicating things a bit. The I (Isolation) in ACID is the adjustingscrew for such optimizations of SQL systems possibly affecting their consistency.Locking and database constraints on uniqueness are commonly used in requirements tohedge against consistency errors and to control concurrency.
3.2 Dropping ACID to Achieve Higher Scalability
It is common wisdom that big data is a disruptive concept that requires thetransformation of the businesses core for adoption. Business requirements for achievingbusiness goals need to be redefined to reflect the paradigms of big data architectures.That means: What promises for consistency, availability and scalability can your ITpeople deliver on a big data scale? Taking a technology approach by replacing relationaldatabases by NoSQL and call it good is no option. Unfortunately as we experienced inthe mentioned project this is an all too alluring idea to waive it easily. The businesscustomer must be educated in the consequences of asking to "solve the problem with bigdata". And this means to find the sweet spot in the triangle of loosening consistency,achievable scalability and implementation effort.
In our example, we opted for loosening consistency as much as possible because thatwas the quick route4 to deliver a system with the necessary performance. Going foreventual consistency means to drop ACID in favour of a BASE semantics oftransactions. That in turn exposed all the unknown invariants of the analysis algorithms.Dropping ACID also created an enormous technical dept to handle the consistencyerrors.
3.3 Consequences of Lowering ConsistencyWe mentioned the uniqueness constraint on commutative relations between records. Theanalysis requirements disallowed dual relations of the kind "My user is your author" and"My author is your user" since they are considered commutative and duplicating them
4 We had to deliver the demo ready version within six months.
254 Andreas Tönne
puts a too strong emphasis on the relationship of the two records. Trading ACID for anunconstrained database created questions for this example:
" How often does this constraint violation take place in practice?
" How severe is the error introduced?
- Follow-up question: Has anyone a measure for meta annotation errors?
" Do other algorithms using the meta annotation break on the duplication itself oron the annotation weight error?
- Follow-up question: Who depends on this annotation anyway?External clients or also internal algorithms?
" Can we ignore the error for some time or is there a build-up effect over time?
" Do we need to filter the duplicate annotations at read time or can we repair theconsistency at intervals?
- Follow-up question: What would be a reasonable interval?
These questions led to rather uncomfortable and time-consuming meetings with thebusiness customer. The customer did not have a need to think about these issues before;he was shielded from them by a single requirement of uniqueness of commutativerelations.
As Brewer [Br12] noted: "Another aspect of CAP confusion is the hidden cost offorfeiting consistency, which is the need to know the system’s invariants. The subtlebeauty of a consistent system is that the invariants tend to hold even when the designerdoes not know what they are. Consequently, a wide range of reasonable invariants willwork just fine."
We observed a few distinct types of issues with weakening consistency and droppingconstraints that have distinct reasons and justifications. The following sections show afew common cases.
3.4 Internal Phantom ReadsIn our example, this was the type of effect with the most quality damages. This is thepremier effect of eventual consistency. An internal phantom read happens when oneconcurrent service execution runs in isolation (due to the eventual consistency timewindow) to another execution and sees old versions of data modified by the secondexecution. Example: two related records are analyzed in parallel and due to bad luck ofreplication one analysis does not see the other's updated record. This is severe since itmeans that the analysis results become random for records imported in a tight timewindow. Also consider that there is a higher probability for a meaningful relation
On Practical Implications of Trading ACID for CAP in the Big Data Transformation 255
between two records received at the same time. We might lose valuable analysis results.
In a transactional system, this scenario calls for a serialization of execution with locking.A solution was to keep a journal of analysis order and determine those imports thatmight need a re-analysis to stabilize the annotation consistency.
3.5 Where is my Data?Eventual consistency does not only affect concurrent execution but sometimes also serialexecution. This depends on the implementation of the replication strategy of the databasebut also on the architecture of the system itself. Some databases do not give a guaranteethat data written can be immediately read back, even at the same node, because thereplication preparation takes some time. We experienced such problems when chaininganalysis algorithms. A similar error (but not consistency caused) can take place with theElasticsearch refresh interval. Here we did not find our own analysis results in the indexfor a short time until Elasticsearch had prepared and executed the index refresh.
We only found a brute-force solution to assure that chains of algorithms can work ontheir own results, apart from passing the results between the algorithm steps. We neededto use delays, either explicitly between each step or as retries with an exponentialbackoff.
3.6 Zombie DataCombining updates and deletes in a concurrent system gives you the usual zombieproblem if updates and deletes of the same record overrun each other. We employedmeasures like timestamps to ensure a monotonic order of analysis executions for arecord. And we wrote tombstones for deleted records to distinguish true data fromzombies.
Tombstoning became an issue because we could not use locking for record updates.Acquiring locks in a distributed database like Cassandra is a very expensive operationthat requires a consensus between all accessible nodes. Since updates were a veryfrequent operation, this was not acceptable. So there is a very small chance that atombstone is overwritten, creating a zombie record. As usual with big data, smallchances become significant given enough data updates. This problem awaits a solutionstill.
3.7 Who is Unique?
Assuring uniqueness has the same costs as a distributed lock for record updates. The keystrategy to avoid this cost was to detach the creation of unique data from the remaininganalysis algorithms. Some of the unique records were pre-created in a startup phase from
256 Andreas Tönne
sample data to reduce frequent locks. This was particularly successful for sets of uniquedata with an upper bound. For example words of a particular language.
3.8 Probabilistic Truth
This is an issue that originates from the distributed nature of the database itself and fromthe big data scale. Keeping a correct tally of data can be too expensive at real-time andone has to use approximation techniques. Consider for example the number of distinctwords in the whole database. Keeping such tally does require some sort ofsynchronization between the concurrent updates. We experimented with Cassandracounter columns[Da14] and with elastic caching approaches using Hazelcast[Ha15] butfinally decided to use a probabilistic approach with a defined error rate, based on aGoogle implementation[HNH13] of HyperLogLog[Fl07].
4 OutlookOur experience with the transformation of our OLTP Java EE / Relational application toa native big data stack shows the importance of a hybrid persistency approach. Asadvocates of ACID for NoSQL[Pi15] highlight, there is a need for the option to choosestronger consistency at high performance. In a hybrid approach, we could separate dataneeding linearizability consistency and weaker consistency. For example, dumping themass of data in HBase and keeping the strongly consistent references to that dataelsewhere. Google Spanner [Cr13] shows that by having an accurate and coherentdistributed clock, one can achieve strong consistency at a reasonable cost.
Another idea we want to pursue is to avoid certain types of consistency errors usingCRDT (commutative replicated data types)[Sh11] to propagate conflict free distributedchanges in the case of network partitions. The case of internal phantom reads can beconsidered to be effected by a short time network partition. We would be happy toresolve this partition conflict-free. The distributed database riak [Ba15] shows how tocombine NoSQL concepts with CRDT [Ba15a] to achieve conflict-free data types.
5 ConclusionsTransforming existing business requirements that are implemented by OLTPapplications to a big data solution using today's best practice big data technology meansto give up many benefits of ACID transactions and especially strong consistency ingeneral.
We showed our practical experiences with a sizable (and from the customers perspectivevery successful) transformation of an existing OLTP application to a big data stack. Thisexample shows that although the weakening of consistency to the level of eventual
On Practical Implications of Trading ACID for CAP in the Big Data Transformation 257
consistency does not prohibit this transformation, it still creates a significant dept. Wegave some examples of the errors introduced by the lower consistency and how we dealtwith them technically.
The cost of compensating for consistency defects and the achievable scalability had to becompared and judged together with the business customer. The effort for thetransformation of the business requirements and thus the effort put on the businesscustomer and architect turned out to be significant and it needed to be carefullyaccompanied by consulting and mentoring.
Invariants of business requirements that are usually hidden by the ACID properties anddatabase locks and constraints become important when high scalability needs to beachieved with a NoSQL database.
References[Ap15] Apache: Welcome to Apache Cassandra, http://cassandra.apache.org, April 9, 2015.
[Ba15] basho: riak product site, http://basho.com/riak/, April 9 2015.
[Ba15a] basho: How to Build a Client Library for Riak 2.0, http://basho.com/tag/crdt/, April 92015.
[BG13] Bailis, P.; Ghodsi, Al.: Eventual Consistency Today: Limitations, Extensions, andBeyond. acm queue volume 11, issue 3, April 9, 2013.
[Bm15] Bundesministerium für Bildung und Forschung: Zukunftsprojekt Industrie 4.0,http://www.bmbf.de/de/9072.php, April 9, 2015.
[Br00] Brewer, E.: Towards Robust Distributed Systems. In: Proceedings of the 19th AnnualACM Symposium on Principles of Distributed Computing (PODC '00), pages 7-10,2000.
[Br12] Brewer, E.: CAP Twelve Years Later: How the 'Rules' Have Changed. Computer,pages 23-29, 2012.
[Cr13] Corbett, J. et al.: Spanner: Google's Globally-Distributed Database. In: ACMTransactions on Computer Systems (TOCS), volume 31, issue 3, 2013.
[Da14] DataStax: What's New in Cassdra 2.1: Better Implementation of Counters.http://www.datastax.com/dev/blog/whats-new-in-cassandra-2-1-a-better-implementation-of-counters, May 20, 2014.
[Da15] DataStax: Configuring Data Consistency.http://docs.datastax.com/en/cassandra/2.0/cassandra/dml/dml_config_consistency_c.html, April 9, 2015.
[De07] DeCandia, G. et al.: Dynamo: Amazon's Highly Available Key-Value Store. In: SOSP'07 Proceedings of twenty-first ACM SIGOPS symposium on Operating systemsprinciples, pages 205-220, 2007.
258 Andreas Tönne
[El15] Elasticsearch BV: Elasticsearch | Search & Analyze Data in Real Time,https://www.elastic.co/products/elasticsearch, April 9, 2015.
[Ev09] Evans, E.: Eric Evan's Weblog, http://blog.sym-link.com/2009/05/12/nosql_2009.html,April 9, 2015.
[Fl07] Flajolet, P. et al.: HyperLogLog: the analysis of a near-optimal cardinality estimationalgorithm. In: AOFA '07: Proceedings of the 2007 International Conference on theAnalysis of Algorithms, 2007.
[Fo97] Fox, A.; Gribble, S.; Chawate, Y.; Brewer, E.; Gauthier, P.: Cluster-Based ScalableNetwork Services. In: Proceedings of the Sixteenth ACM Symposium on OperatingSystems Principles (SOSP-16), 1997.
[Fo12] Fowler, M.: NosqlDefinition, http://martinfowler.com/bliki/NosqlDefinition.html,April 9, 2015.
[Fo15] Fowler, M.: DataLake, http://martinfowler.com/bliki/DataLake.html, April 9, 2015.
[GL02] Gilbert, S.; Lynch, N.: Brewer's Conjecture and the Feasibility of Consistent,Available, Partition-Tolerant Web Services. In: ACM SIGACT News 33, pages 51-59,2002.
[Ha15] Hazelcast: Company site, http://hazelcast.com, April 9 2015.
[HNH13] Heule, S.; Nunkesser, M.; Hall, A.: HyperLogLog in Practice: AlgorithmicEngineering of a State of The Art Cardinality Estimation Algorithm. In: EDBT '13Proceedings of the 16th International Conference on Extending Database Technology,2013.
[In07] InfoQ: Presentation: Amazon CTO Werner Vogels on Availability and Consistency ,http://www.infoq.com/news/2007/08/werner-vogels-pres, April 9, 2015.
[LM10] Lakshman, A.; Malik P.: Cassandra: a decentralized structured storage system. In:ACM SIGOPS Operating Systems Review Volume 44 Issue 2, pages 35-40, 2010.
[Pi15] Pimentel, S.: The Return of ACID in the Design of NoSQL Databases,http://www.methodsandtools.com/archive/acidnosqldatabase.php, April 9 2015.
[Sh11] Shapiro, M. et al.: A comprehensive study of convergent and commutative replicateddata types. INRIA Technical Report RR-7506, 2011.
[Th15] Thinkaurelius: Titan Distributed Graph Database, http://thinkaurelius.github.io/titan/,April 9, 2015.
[Vo07] Vogels, W.: Availability & Consistency. QCon 2007.
[Vo09] Vogels, W.: Eventually Consistent. Communications of the ACM 52, 2009.
Alfred Zimmermann, Alexander Rossmann (Hrsg.): Digital Enterprise Computing 2015,Lecture Notes in Informatics (LNI), Gesellschaft für Informatik, Bonn 2015 259
Using Feature Construction for dimensionality reduction inBig Data scenarios to allow real time classification ofsequence data
Michael Schaidnagel1, Fritz Laux2 and Thomas Connolly3
Abstract: A sequence of transactions represents a complex and multi-dimensional type of data.Feature construction can be used to reduce the data´s dimensionality to find behavioural patternswithin such sequences. The patterns can be expressed using the blue prints of the constructedrelevant features. These blue prints can then be used for real time classification on othersequences.
Keywords: Feature construction, real time classification, big data
1 IntroductionA rapid advance in database technology nowadays allows storing massive amounts ofdata. The term ‘Big Data’ has become one of the biggest buzzwords in the last two years.This is also reflected by the massive interest of the research community in the topic.However, little of that data is actually analysed and used effectively. Reasons for that arethe increasing complexity of the stored data (i.e. data sequences) and a more structuralproblem: In order to handle the data flood, companies tend to separate their operationalsystems from the analytical information systems. Operational systems are applicationsthat operate the customer service, e.g., the booking system of an airline, the check-outapplication in an online store etc. Analytical information systems are databases that storelarge amounts of data such as the DWH or backup servers. This way, companies such asonline retailers, airlines or computer game companies can ensure that their customers areserved in a timely manner by rather lightweight application systems. These systemsbackup their data into the DWH on a regular basis. The data is aggregated according tothe cubes that have been defined to fit the business needs. This structural necessityhowever, is contrary to new requirements and types of analysis that data miners arechallenged with. Business needs include nowadays that data mining analysis is done on acustomer (i.e., individual) level in real/near time, rather than on the aggregated form ofcubes. The aggregation is necessary since not every detail can be stored for a longer timespan. Unfortunately, a lot of valuable information contained in data sequences aboutindividual customers is lost during this process. This work will show how feature
1 University of the West of Scotland, School of Computing, PA1 2BE, Scotland,[email protected]
2 FH Reutlingen, Fakultät Informatik, Alteburgstr 150, 72762 Reutlingen, [email protected] University of the West of Scotland, School of Computing, PA1 2BE, Scotland, [email protected]
260 Michael Schaidnagel et al.
construction can be used to simplify complex data sequences and therefore allow realtime classification in big data scenarios. The rest of the paper is structured as follows:Section 2 will give a brief introduction into the related work. Section 3 will describe thestructure of sequence data. Section 4 will give a short introduction into the field offeature construction. Section 5 will presents the underlying feature construction modelsand describes a framework that shows how feature construction can be used for real timeclassification. The concluding Section 6 will highlight the contributions of this paper.
2 Related WorkRecent contributions to the field of feature construction have been made by Shafti[SP09], who presents a technique named MFE3/GA. It searches through the initial spaceof attribute subsets to find subsets of interaction attributes as well as a function over eachof the found subsets. The suitable functions are then added as new features to theoriginal data set. A standard C4.5 decision tree learner is then applied for the datamining process. Only nominal attributes are being processed, so that class labels andcontinuous attributes need to be normalized. A feature is a bit-string of length N, whereeach bit shows the presence or absence of one the N original attributes. Anotherapproach to feature construction is described by Morik and Köpcke [MK04]. They createfeatures based on term frequency (TF) and inverse document frequency (IDF) features.The timestamped data is thereby transformed into frequency features as they are used inbag-of-words representations of text. A heuristic is used in order to estimate if atransformation of given raw data into frequency features will be beneficial or not. Sincetimestamped data often describes a status change of the same object, TF/IDF features usea Boolean representation to denote status changes of certain attributes. However, thecurrent feature construction techniques have been designed for tupel based data, leavingthe sequence dimension aside.
The dimensionality reduction described in this work has similarities with the PrincipalComponent Analysis, which is a widely known statistical method to transform a set ofobservations into a smaller number of ‘principal components’.
3 Sequence dataThis research work is focusing on data sets that consist of transactions. Thesetransactions represent complex vectors that can include both data types (categorical andordinal) and another dimension of information: the time of the transaction. Primeexample for transaction sequences are sessions in an online shop. Customers can viewproducts and put them into their shopping basket. Every action can be represented in adatabase as a tuple that is associated with a timestamp. Following that, sequential datathat is used in this work must include the following: a sequence identifier attribute
, at least two attributes of arbitrary data type , a
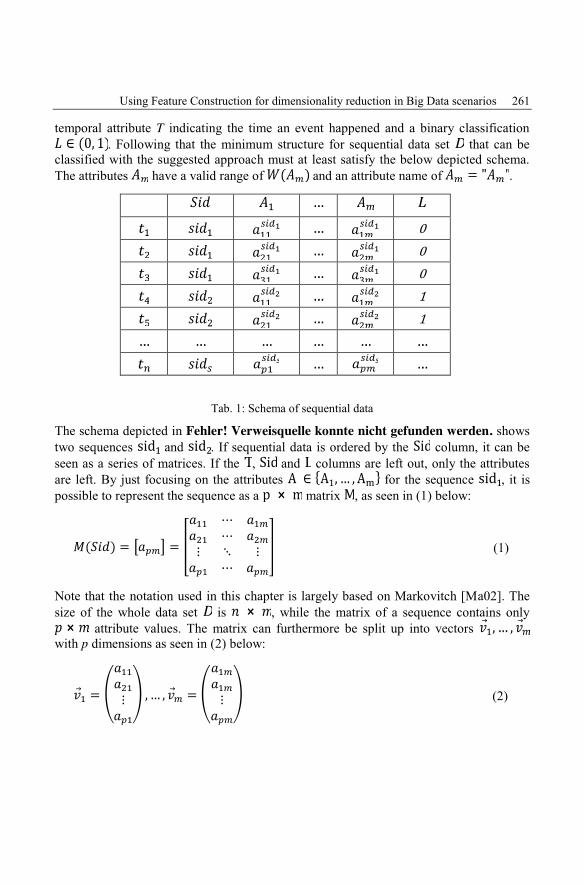
Using Feature Construction for dimensionality reduction in Big Data scenarios 261
temporal attribute T indicating the time an event happened and a binary classification. Following that the minimum structure for sequential data set that can be
classified with the suggested approach must at least satisfy the below depicted schema.The attributes have a valid range of and an attribute name of .
00011Tab. 1: Schema of sequential data
The schema depicted in Fehler! Verweisquelle konnte nicht gefunden werden. showstwo sequences and . If sequential data is ordered by the column, it can beseen as a series of matrices. If the , and columns are left out, only the attributesare left. By just focusing on the attributes for the sequence , it ispossible to represent the sequence as a matrix , as seen in (1) below:
(1)
Note that the notation used in this chapter is largely based on Markovitch [Ma02]. Thesize of the whole data set is , while the matrix of a sequence contains only
attribute values. The matrix can furthermore be split up into vectorswith p dimensions as seen in (2) below:
(2)
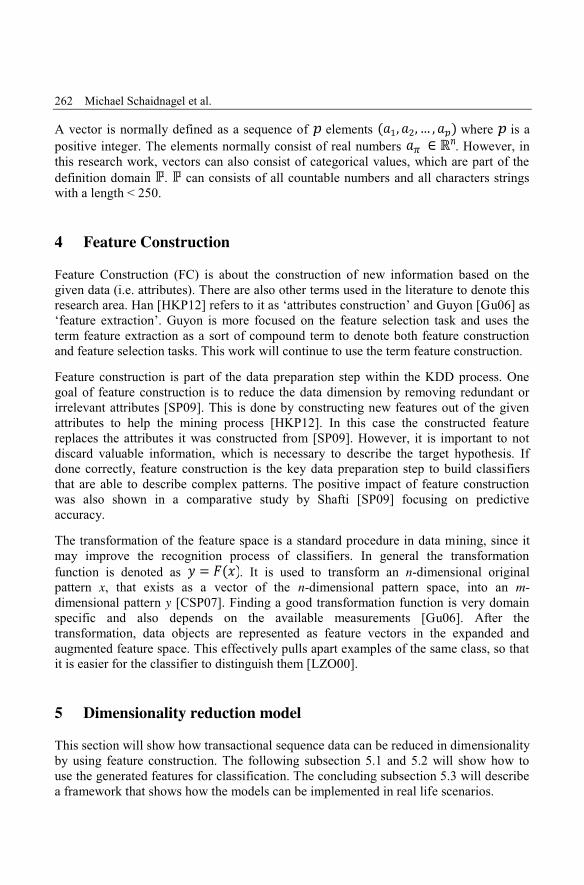
262 Michael Schaidnagel et al.
A vector is normally defined as a sequence of elements where is apositive integer. The elements normally consist of real numbers . However, inthis research work, vectors can also consist of categorical values, which are part of thedefinition domain . can consists of all countable numbers and all characters stringswith a length < 250.
4 Feature ConstructionFeature Construction (FC) is about the construction of new information based on thegiven data (i.e. attributes). There are also other terms used in the literature to denote thisresearch area. Han [HKP12] refers to it as ‘attributes construction’ and Guyon [Gu06] as‘feature extraction’. Guyon is more focused on the feature selection task and uses theterm feature extraction as a sort of compound term to denote both feature constructionand feature selection tasks. This work will continue to use the term feature construction.
Feature construction is part of the data preparation step within the KDD process. Onegoal of feature construction is to reduce the data dimension by removing redundant orirrelevant attributes [SP09]. This is done by constructing new features out of the givenattributes to help the mining process [HKP12]. In this case the constructed featurereplaces the attributes it was constructed from [SP09]. However, it is important to notdiscard valuable information, which is necessary to describe the target hypothesis. Ifdone correctly, feature construction is the key data preparation step to build classifiersthat are able to describe complex patterns. The positive impact of feature constructionwas also shown in a comparative study by Shafti [SP09] focusing on predictiveaccuracy.
The transformation of the feature space is a standard procedure in data mining, since itmay improve the recognition process of classifiers. In general the transformationfunction is denoted as . It is used to transform an n-dimensional originalpattern x, that exists as a vector of the n-dimensional pattern space, into an m-dimensional pattern y [CSP07]. Finding a good transformation function is very domainspecific and also depends on the available measurements [Gu06]. After thetransformation, data objects are represented as feature vectors in the expanded andaugmented feature space. This effectively pulls apart examples of the same class, so thatit is easier for the classifier to distinguish them [LZO00].
5 Dimensionality reduction modelThis section will show how transactional sequence data can be reduced in dimensionalityby using feature construction. The following subsection 5.1 and 5.2 will show how touse the generated features for classification. The concluding subsection 5.3 will describea framework that shows how the models can be implemented in real life scenarios.
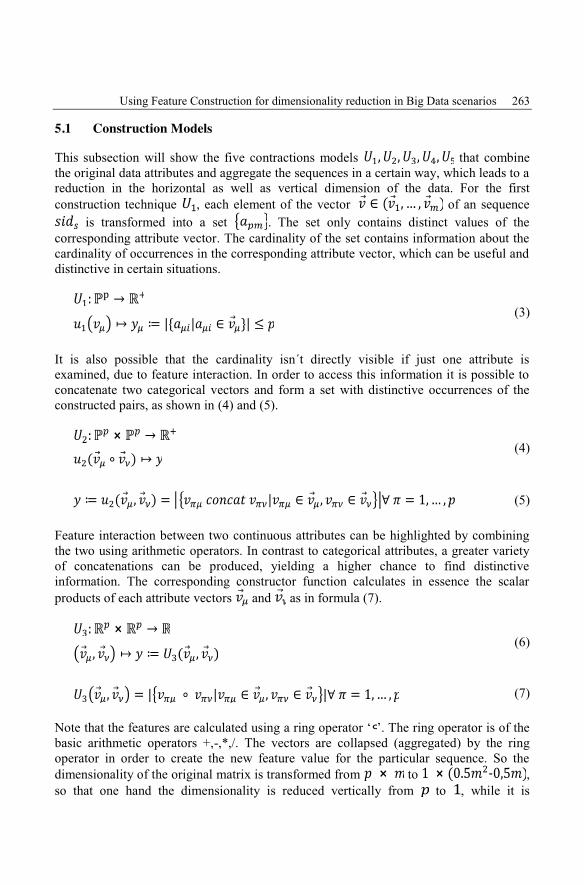
Using Feature Construction for dimensionality reduction in Big Data scenarios 263
5.1 Construction Models
This subsection will show the five contractions models that combinethe original data attributes and aggregate the sequences in a certain way, which leads to areduction in the horizontal as well as vertical dimension of the data. For the firstconstruction technique , each element of the vector of an sequence
is transformed into a set . The set only contains distinct values of thecorresponding attribute vector. The cardinality of the set contains information about thecardinality of occurrences in the corresponding attribute vector, which can be useful anddistinctive in certain situations.
(3)
It is also possible that the cardinality isn´t directly visible if just one attribute isexamined, due to feature interaction. In order to access this information it is possible toconcatenate two categorical vectors and form a set with distinctive occurrences of theconstructed pairs, as shown in (4) and (5).
(4)
(5)
Feature interaction between two continuous attributes can be highlighted by combiningthe two using arithmetic operators. In contrast to categorical attributes, a greater varietyof concatenations can be produced, yielding a higher chance to find distinctiveinformation. The corresponding constructor function calculates in essence the scalarproducts of each attribute vectors and as in formula (7).
(6)
(7)
Note that the features are calculated using a ring operator ‘ ’. The ring operator is of thebasic arithmetic operators +,-,*,/. The vectors are collapsed (aggregated) by the ringoperator in order to create the new feature value for the particular sequence. So thedimensionality of the original matrix is transformed from to ,so that one hand the dimensionality is reduced vertically from to , while it is
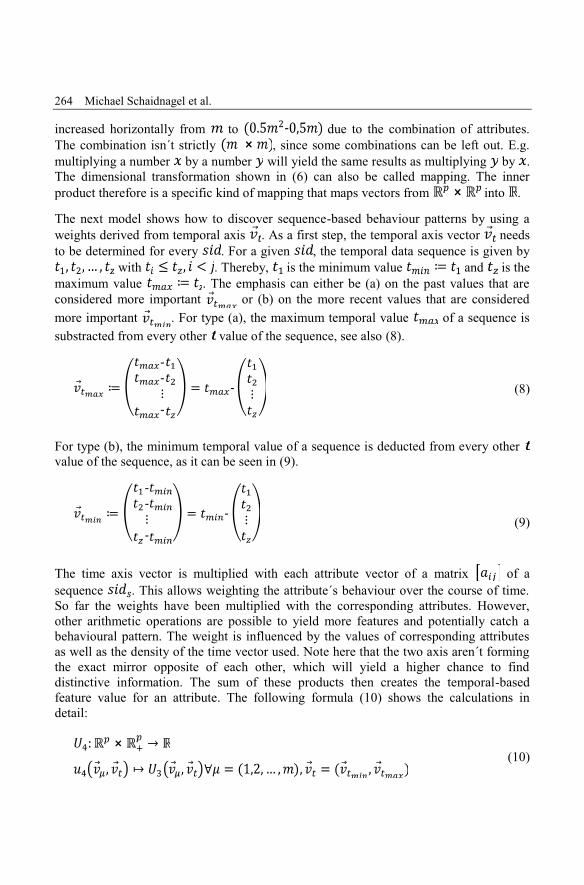
264 Michael Schaidnagel et al.
increased horizontally from to due to the combination of attributes.The combination isn´t strictly , since some combinations can be left out. E.g.multiplying a number by a number will yield the same results as multiplying by .The dimensional transformation shown in (6) can also be called mapping. The innerproduct therefore is a specific kind of mapping that maps vectors from into .
The next model shows how to discover sequence-based behaviour patterns by using aweights derived from temporal axis . As a first step, the temporal axis vector needsto be determined for every . For a given , the temporal data sequence is given by
with . Thereby, is the minimum value and is themaximum value . The emphasis can either be (a) on the past values that areconsidered more important or (b) on the more recent values that are consideredmore important . For type (a), the maximum temporal value of a sequence issubstracted from every other value of the sequence, see also (8).
(8)
For type (b), the minimum temporal value of a sequence is deducted from every othervalue of the sequence, as it can be seen in (9).
(9)
The time axis vector is multiplied with each attribute vector of a matrix of asequence . This allows weighting the attribute´s behaviour over the course of time.So far the weights have been multiplied with the corresponding attributes. However,other arithmetic operations are possible to yield more features and potentially catch abehavioural pattern. The weight is influenced by the values of corresponding attributesas well as the density of the time vector used. Note here that the two axis aren´t formingthe exact mirror opposite of each other, which will yield a higher chance to finddistinctive information. The sum of these products then creates the temporal-basedfeature value for an attribute. The following formula (10) shows the calculations indetail:
(10)
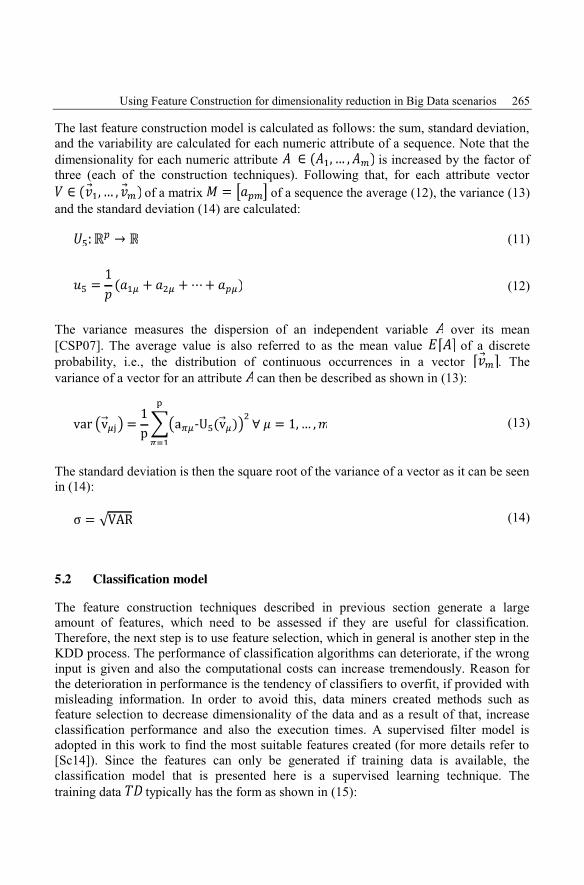
Using Feature Construction for dimensionality reduction in Big Data scenarios 265
The last feature construction model is calculated as follows: the sum, standard deviation,and the variability are calculated for each numeric attribute of a sequence. Note that thedimensionality for each numeric attribute is increased by the factor ofthree (each of the construction techniques). Following that, for each attribute vector
of a matrix of a sequence the average (12), the variance (13)and the standard deviation (14) are calculated:
(11)
(12)
The variance measures the dispersion of an independent variable over its mean[CSP07]. The average value is also referred to as the mean value of a discreteprobability, i.e., the distribution of continuous occurrences in a vector . Thevariance of a vector for an attribute can then be described as shown in (13):
(13)
The standard deviation is then the square root of the variance of a vector as it can be seenin (14):
(14)
5.2 Classification model
The feature construction techniques described in previous section generate a largeamount of features, which need to be assessed if they are useful for classification.Therefore, the next step is to use feature selection, which in general is another step in theKDD process. The performance of classification algorithms can deteriorate, if the wronginput is given and also the computational costs can increase tremendously. Reason forthe deterioration in performance is the tendency of classifiers to overfit, if provided withmisleading information. In order to avoid this, data miners created methods such asfeature selection to decrease dimensionality of the data and as a result of that, increaseclassification performance and also the execution times. A supervised filter model isadopted in this work to find the most suitable features created (for more details refer to[Sc14]). Since the features can only be generated if training data is available, theclassification model that is presented here is a supervised learning technique. Thetraining data typically has the form as shown in (15):
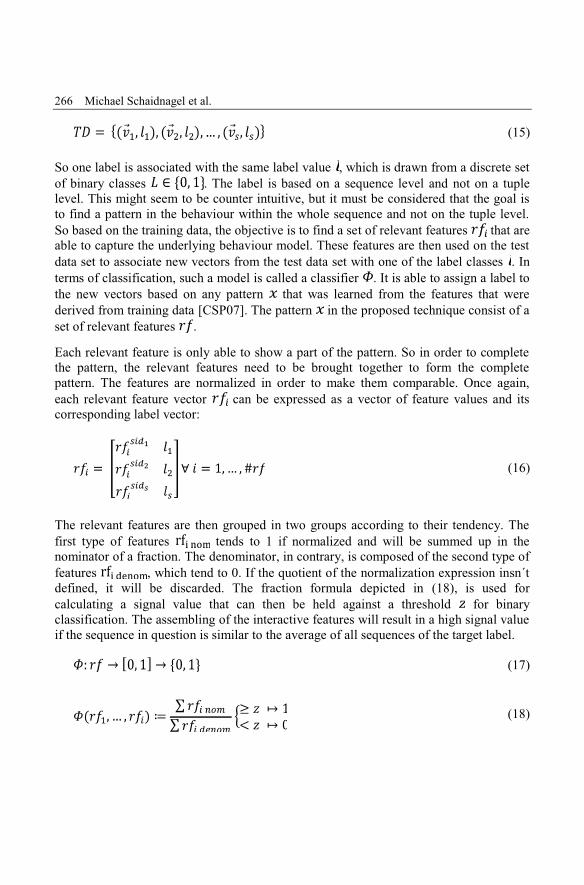
266 Michael Schaidnagel et al.
(15)
So one label is associated with the same label value , which is drawn from a discrete setof binary classes . The label is based on a sequence level and not on a tuplelevel. This might seem to be counter intuitive, but it must be considered that the goal isto find a pattern in the behaviour within the whole sequence and not on the tuple level.So based on the training data, the objective is to find a set of relevant features that areable to capture the underlying behaviour model. These features are then used on the testdata set to associate new vectors from the test data set with one of the label classes . Interms of classification, such a model is called a classifier . It is able to assign a label tothe new vectors based on any pattern that was learned from the features that werederived from training data [CSP07]. The pattern in the proposed technique consist of aset of relevant features .
Each relevant feature is only able to show a part of the pattern. So in order to completethe pattern, the relevant features need to be brought together to form the completepattern. The features are normalized in order to make them comparable. Once again,each relevant feature vector can be expressed as a vector of feature values and itscorresponding label vector:
(16)
The relevant features are then grouped in two groups according to their tendency. Thefirst type of features tends to 1 if normalized and will be summed up in thenominator of a fraction. The denominator, in contrary, is composed of the second type offeatures , which tend to 0. If the quotient of the normalization expression insn´tdefined, it will be discarded. The fraction formula depicted in (18), is used forcalculating a signal value that can then be held against a threshold for binaryclassification. The assembling of the interactive features will result in a high signal valueif the sequence in question is similar to the average of all sequences of the target label.
(17)
(18)
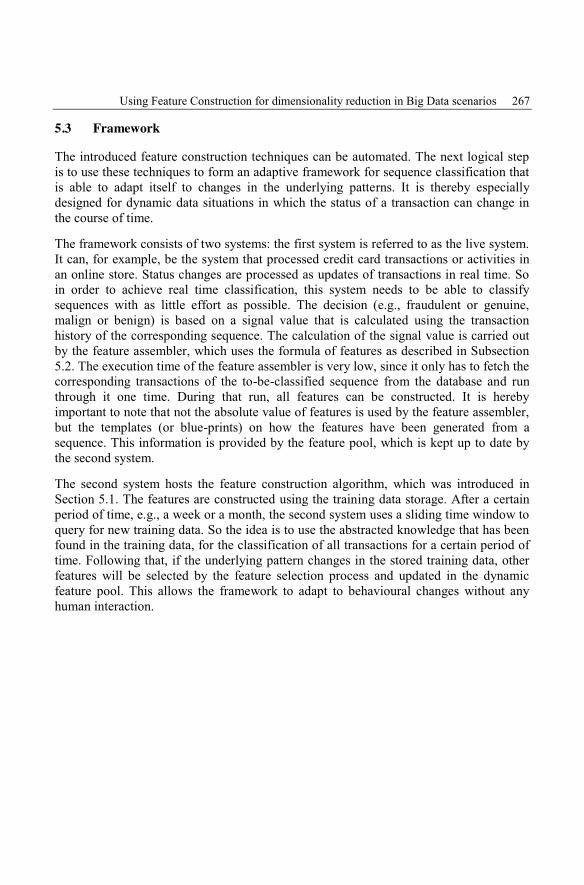
Using Feature Construction for dimensionality reduction in Big Data scenarios 267
5.3 Framework
The introduced feature construction techniques can be automated. The next logical stepis to use these techniques to form an adaptive framework for sequence classification thatis able to adapt itself to changes in the underlying patterns. It is thereby especiallydesigned for dynamic data situations in which the status of a transaction can change inthe course of time.
The framework consists of two systems: the first system is referred to as the live system.It can, for example, be the system that processed credit card transactions or activities inan online store. Status changes are processed as updates of transactions in real time. Soin order to achieve real time classification, this system needs to be able to classifysequences with as little effort as possible. The decision (e.g., fraudulent or genuine,malign or benign) is based on a signal value that is calculated using the transactionhistory of the corresponding sequence. The calculation of the signal value is carried outby the feature assembler, which uses the formula of features as described in Subsection5.2. The execution time of the feature assembler is very low, since it only has to fetch thecorresponding transactions of the to-be-classified sequence from the database and runthrough it one time. During that run, all features can be constructed. It is herebyimportant to note that not the absolute value of features is used by the feature assembler,but the templates (or blue-prints) on how the features have been generated from asequence. This information is provided by the feature pool, which is kept up to date bythe second system.
The second system hosts the feature construction algorithm, which was introduced inSection 5.1. The features are constructed using the training data storage. After a certainperiod of time, e.g., a week or a month, the second system uses a sliding time window toquery for new training data. So the idea is to use the abstracted knowledge that has beenfound in the training data, for the classification of all transactions for a certain period oftime. Following that, if the underlying pattern changes in the stored training data, otherfeatures will be selected by the feature selection process and updated in the dynamicfeature pool. This allows the framework to adapt to behavioural changes without anyhuman interaction.
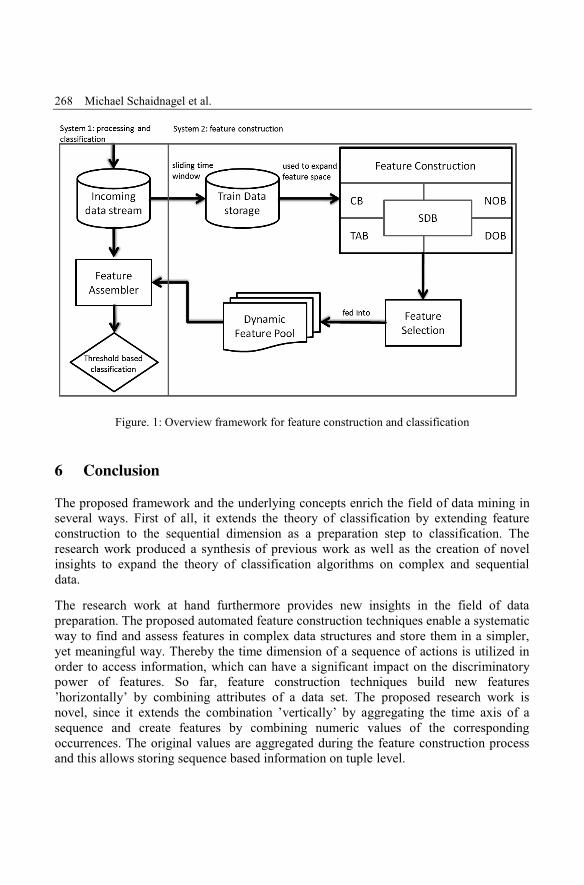
268 Michael Schaidnagel et al.
Figure. 1: Overview framework for feature construction and classification
6 ConclusionThe proposed framework and the underlying concepts enrich the field of data mining inseveral ways. First of all, it extends the theory of classification by extending featureconstruction to the sequential dimension as a preparation step to classification. Theresearch work produced a synthesis of previous work as well as the creation of novelinsights to expand the theory of classification algorithms on complex and sequentialdata.
The research work at hand furthermore provides new insights in the field of datapreparation. The proposed automated feature construction techniques enable a systematicway to find and assess features in complex data structures and store them in a simpler,yet meaningful way. Thereby the time dimension of a sequence of actions is utilized inorder to access information, which can have a significant impact on the discriminatorypower of features. So far, feature construction techniques build new features’horizontally’ by combining attributes of a data set. The proposed research work isnovel, since it extends the combination ’vertically’ by aggregating the time axis of asequence and create features by combining numeric values of the correspondingoccurrences. The original values are aggregated during the feature construction processand this allows storing sequence based information on tuple level.
Using Feature Construction for dimensionality reduction in Big Data scenarios 269
So far, the approach can be applied on scenarios with binary labels. In order to apply theapproach to multi-label situations, a one-vs.-rest classification approach needs to beimplemented. An example for a one-vs.-rest classification is the following: assume that adata set consists of samples that are associated to either class a, b, c, or d. In order toapply a binary classification algorithm on the problem, an iterative approach needs to betaken. First, all samples of class a are relabeled as e.g. 1, while all other classes arerelabelled as 0. Then the algorithm is trained on the data set, yielding features that areable to distinguish class a from all other classes. In the next iteration, all samples of classb are relabelled as 1 and class a, c, and d are relabelled as 0. Then the training startsagain to yield features that are able to distinguish b from all other classes and so forth.Another approach for multiclass scenarios could be to take a closer look at the signalvalues of the various classes. It is possible that classes have certain signal value intervalswhich could then be used for interval based classification. An example for that could bethat a signal value between 0 and 0.3 is associated with label a, while the interval 0.3 to0.6 is associated with the label b etc.
References[CSP07] Cios, K.; J. Swiniarski, R. W; Pedrycz, W.; Kurgan, L. A.: The Knowledge Discovery
Process: A Knowledge Discovery Approach. US: Springer US, 2007[Gu06] Guyon, I.: Feature extraction: Foundations and applications. Berlin [u.a]: Springer, 2006
(Studies in Fuzziness and Soft Computing 207)[HKP12] Han, J.; Kamber, M.; Pei, J.: Data mining: Concepts and techniques, third edition. 3.
Aufl. Waltham, Mass: Morgan Kaufmann Publishers, 2012 (The Morgan Kaufmannseries in data management systems)
[LZO00] Lesh, N.; Zaki, M.; Oglhara, M.: Scalable feature mining for sequential data. In: IEEEIntelligent Systems 15 (2000), Nr. 2, S. 48–56. URLhttp://ieeexplore.ieee.org/xpl/articleDetails.jsp?arnumber=850827 – Last accessed 2013-12-13
[Ma02] Markovitch, S.; Rosenstein, D.: Feature Generation Using General ConstructorFunctions. In: Machine Learning 49 (2002), Nr. 1, S. 59–98. URLhttp://dx.doi.org/10.1023/A:1014046307775 – Last accessed 2014-03-18
[MK04] Morik, K.; Köpcke, H.: Local Pattern Detection: Features for Learning Local Patterns inTime-Stamped Data. Heidelberg: Springer Berlin, 2004 (Lecture Notes in ArtificialIntelligence 3539)
[Sc14] Schaidnagel, M.; Laux, F.: Feature Construction for Time Ordered Data Sequences. In:Proceedings of the Sixth International Conference on Advances in Databases,Knowledge, and Data Applications.
[SP09] Shafti, L. S.; Pérez, E.: Feature Construction and Feature Selection in Presence ofAttribute Interactions, Bd. 5572. In: 4th International Conference, HAIS 2009,Salamanca, Spain, June 10-12, 2009. Proceedings, S. 589–596

Alfred Zimmermann, Alexander Rossmann (Hrsg.): Digital Enterprise Computing 2015,Lecture Notes in Informatics (LNI), Gesellschaft für Informatik, Bonn 2015 271
Automatisiertes Data Discovery innerhalb einesProvisionierungstools
Heiko Bonhorst1, Patrick Kopf2 und Fekkry Meawad3
Abstract: Das Provisioning Tool automaIT wurde prototypisch um die Möglichkeit eines DataDiscovery erweitert, mit dem Ziel nicht durch automaIT verwaltete Systeme anbinden und steuernzu können. Daten aus dem Data Discovery werden mittels dem Tool Facter gesammelt und könnendynamisch in ausführbare Modelle von automaIT integriert und ausgewertet werden. Dadurchkann der Verlauf weiterer Provisionierungsschritte gesteuert werden, ohne dass es eines manuellenEingriffs bedarf.
Keywords: Provisioning, Data Discovery, automaIT, Facter, Ruby, Linux
1 EinleitungDer Begriff Provisioning wird häufig mit unterschiedlichen Bedeutungen in der IT,jeweils abhängig vom Kontext, verwendet. Grundsätzlich bedeutet dies dieBereitstellung von Daten, Applikationen oder Berechtigungen für den Endanwender[JD06]. Im Rahmen dieses Papers bedeutet Provisioning das automatisierte Deploymenteines Software Stacks auf einem bereits vorkonfigurierten Betriebssystem. NachAbschluss des Vorganges steht dem Benutzer der angeforderte Service (Softwares Stack)vollumfänglich produktiv zur Verfügung.
Die Software automaIT der NovaTec GmbH wird hier als Provisioning Tool eingesetzt.Von automaIT verwaltete Server werden über einen vorher ausgerollten Agentenangesteuert. Die im automaIT Server enthaltenen Modelle wiederrum werden über denAgenten auf dem Zielsystem ausgeführt. Alle Ereignisse werden dabei in einerDatenbank protokolliert, womit zu jedem Zeitpunkt der aktuelle Zustand einerverwalteten Systemlandschaft zur Verfügung steht. Die Modellentwicklung wird durcheine speziell entwickelte XML-Struktur realisiert. Eine Modellausführung kannzusätzlich noch individuell parametrisiert werden, was es ermöglicht, ein Modell inunterschiedlichen Ausprägungen zu provisionieren [NT15]. So können etwa mehrereDatenbankinstanzen mit unterschiedlichen Ports und Instanznamen erstellt werden. Fürdas Data Discovery wurde auf die Entwicklung eines eigenen Algorithmus verzichtet, dasich hierfür das Tool Facter anbietet.
1 Hermann Hollerith Zentrum Böblingen, [email protected] Hermann Hollerith Zentrum Böblingen, [email protected] Hermann Hollerith Zentrum Böblingen, [email protected]
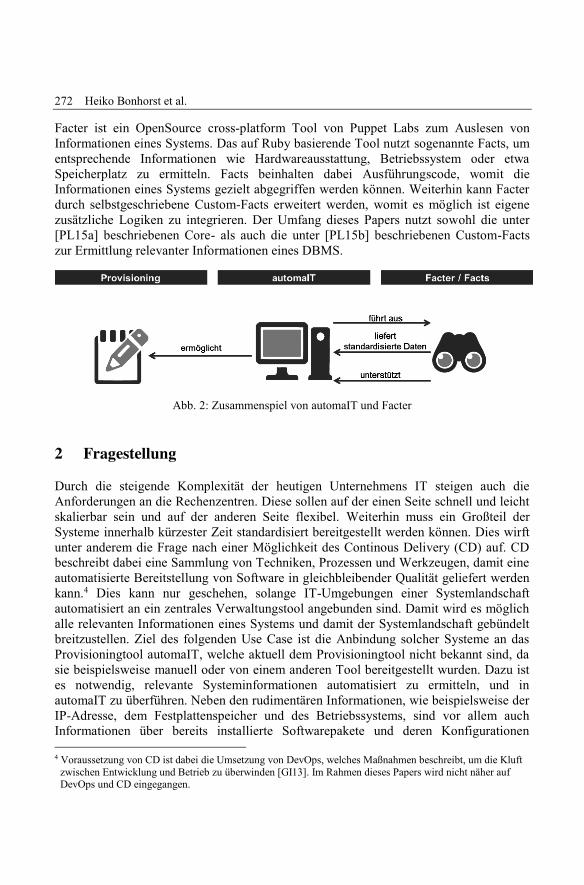
272 Heiko Bonhorst et al.
Facter ist ein OpenSource cross-platform Tool von Puppet Labs zum Auslesen vonInformationen eines Systems. Das auf Ruby basierende Tool nutzt sogenannte Facts, umentsprechende Informationen wie Hardwareausstattung, Betriebssystem oder etwaSpeicherplatz zu ermitteln. Facts beinhalten dabei Ausführungscode, womit dieInformationen eines Systems gezielt abgegriffen werden können. Weiterhin kann Facterdurch selbstgeschriebene Custom-Facts erweitert werden, womit es möglich ist eigenezusätzliche Logiken zu integrieren. Der Umfang dieses Papers nutzt sowohl die unter[PL15a] beschriebenen Core- als auch die unter [PL15b] beschriebenen Custom-Factszur Ermittlung relevanter Informationen eines DBMS.
Abb. 2: Zusammenspiel von automaIT und Facter
2 FragestellungDurch die steigende Komplexität der heutigen Unternehmens IT steigen auch dieAnforderungen an die Rechenzentren. Diese sollen auf der einen Seite schnell und leichtskalierbar sein und auf der anderen Seite flexibel. Weiterhin muss ein Großteil derSysteme innerhalb kürzester Zeit standardisiert bereitgestellt werden können. Dies wirftunter anderem die Frage nach einer Möglichkeit des Continous Delivery (CD) auf. CDbeschreibt dabei eine Sammlung von Techniken, Prozessen und Werkzeugen, damit eineautomatisierte Bereitstellung von Software in gleichbleibender Qualität geliefert werdenkann.4 Dies kann nur geschehen, solange IT-Umgebungen einer Systemlandschaftautomatisiert an ein zentrales Verwaltungstool angebunden sind. Damit wird es möglichalle relevanten Informationen eines Systems und damit der Systemlandschaft gebündeltbreitzustellen. Ziel des folgenden Use Case ist die Anbindung solcher Systeme an dasProvisioningtool automaIT, welche aktuell dem Provisioningtool nicht bekannt sind, dasie beispielsweise manuell oder von einem anderen Tool bereitgestellt wurden. Dazu istes notwendig, relevante Systeminformationen automatisiert zu ermitteln, und inautomaIT zu überführen. Neben den rudimentären Informationen, wie beispielsweise derIP-Adresse, dem Festplattenspeicher und des Betriebssystems, sind vor allem auchInformationen über bereits installierte Softwarepakete und deren Konfigurationen
4 Voraussetzung von CD ist dabei die Umsetzung von DevOps, welches Maßnahmen beschreibt, um die Kluftzwischen Entwicklung und Betrieb zu überwinden [GI13]. Im Rahmen dieses Papers wird nicht näher aufDevOps und CD eingegangen.
Automatisiertes Data Discovery innerhalb eines Provisionierungstools 273
relevant. Dies soll mittels einer integrierten Data Discovery Funktion ermöglicht werden,um genau solche Systeme in einer IT-Landschaft zu integrieren und in den CD-Prozessmit aufnehmen zu können.
2.1 Use CaseDamit die Realisierbarkeit eines automatisierten Data Discovery bewertet werden kann,wird ein Proof of Concept anhand des im Folgenden beschriebenen Use Casedurchgeführt.
Mittels automaIT sollen das PostgreSQL DBMS sowie die dazugehörigen Instanzen aufeiner bis dahin für automaIT fremden IT-Umgebung automatisiert aufgesetzt werden.Damit Serverressourcen möglichst effizient eingesetzt werden, sollen mehrereDatenbankinstanzen auf einer Serverinstanz gestartet werden. Ob auf einem Systemgenügend Ressourcen vorhanden sind, muss automaIT mittels Data Discovery eineReihe von Informationen ermitteln.
Innerhalb den automaIT Modellen kann dazu ein entsprechender Workflow zurÜberprüfung aufgebaut werden. Ziel ist, automaIT die Grunddaten von fremdenMaschinen einer IT-Landschaft in einer standardisierten Form über das Data Discoveryzur Verfügung zu stellen. Zu den Grunddaten zählen unter anderem die IP-Adresse,Rechnerarchitektur, Betriebssystem und Version, installierte Software Pakete und einerVielzahl Use Case abhängiger Parameter:
"" Installiertes PostgreSQL Paket
"" Lokation des Datenverzeichnisses (Datadir)
"" Belegter Port einer vorhanden PostgreSQL Instanz
"" Nächster freier Port
"" Freier Speicherplatz
"" Verfügbarer Arbeitsspeicher
Diese Daten sollen automaIT so zur Verfügung gestellt werden, damit sogenannteautomaIT Komponenten, diese als Standardvariablen nutzen können. Komponentenbeinhalten dabei die Ausführungslogik der einzelnen Provisionierungsschritte.Zusammengehörige Komponenten werden zu einem Plugin zusammengefasst.
2.2 NutzenDer übergeordnete Nutzen dieser Funktionalität ist einerseits die Beschleunigunginitialer Provisionierungsprozesse und anderseits die Identifikation fremder Maschineninnerhalb der vorhandener IT-Systemlandschaften. Zu den für automaIT fremdenSystemen in einem Unternehmensnetzwerk zählen insbesondere bereits manuell
274 Heiko Bonhorst et al.
aufgesetzte Umgebungen. Diese Umgebungen sollen durch das Data Discoverymöglichst automatisiert nach bereits vorhandener Software untersucht werden und diedabei ermittelten Ergebnisse in einem automaIT Modell abgebildet werden. Nach derautomatisierten Abbildung im Modell soll es möglich sein, die Umgebungen, inklusiveder dort bereits vorhanden Software, über automaIT zu managen ohne dafür manuelleAktionen auf der bis dahin fremden Umgebung ausgeführt zu haben.
In der aufgeführten Umsetzung könnte es beispielsweise vorkommen, dass bereits einePSQL DBMS auf der Umgebung ist, zu der aber noch keine Instanzen erstellt wurden.Nach einem automatisierten Data Discovery soll es dann möglich sein, Instanzen für dasbereits verfügbare DBMS über automaIT zu erstellen und zu starten.
2.3 Optionen zur UmsetzungZur Umsetzung wurden verschiedene Optionen in Betracht gezogen. Zum einen wurdedie Möglichkeit untersucht, eigene Skripte bzw. optionale Anwendungen für das DataDiscovery zu programmieren. Zum anderen wurde verifiziert, ob bereits bestehendeTools und Werkzeuge auf dem Markt existieren, die den definierten Vorgabenentsprechen. Aufgrund vorgegebener Einschränkungen wird die Funktionalität des DataDiscovery jedoch nicht Teil einer Integration in das Produkt sein. Aus diesem Grund istdie Wahl auf ein bereits existierendes Tool zum Data Discovery gefallen. Das ToolFacter der Firma Puppet Labs ist unter der Opensource Lizenz veröffentlicht undplattformunabhängig. Neben der sehr großen Community, die zur Weiterentwicklungbeiträgt, werden bereits entsprechende Skripte, sogenannte Core Facts zum Ausleseneiniger Standardparameter wie der IP-Adresse, Betriebssystemversion sowie verfügbarerArbeitsspeicher mitgeliefert [PL15a]. Durch das offene System lässt sich Facter flexibelerweitern und erlaubt es eigene Custom Facts, wie unter [Kr13] beschrieben, zudefinieren. Diese Facts können in automaIT eingebunden werden, womit eineErweiterung durch beliebige Facts und damit Use Case spezifische Informationenmöglich ist. Im folgenden Teil dieser Arbeit wird die Frage beantwortet, wie deruntersuchte Use Case in der Praxis umgesetzt werden kann.
3 ErgebnisZiel der Arbeit ist automaIT mit einer Komponente zum automatisierten Data Discoveryzu erweitern. Damit dies erreicht werden kann, wurde im ersten Schritt die im Folgendenbeschriebene Lösungsarchitektur entwickelt. Die umgesetzte Architektur basiert imWesentlichen auf zwei in automaIT abgebildeten Plugins.
Automatisiertes Data Discovery innerhalb eines Provisionierungstools 275
3.1 Linux System Service PluginDas Linux System Service Plugin wird direkt nach der initialen Verknüpfung vonautomaIT und dem zu verwaltenden Server ausgeführt.5 Dazu wurde ein sogenannterData Discovery Setup Service (kurz DDSS)6 erstellt. Gestartet wird dieser über dasautomaIT Web Front-End. Nach dem Start führt dieser die im Plugin abgebildeten undbeschriebenen Prozessschritte auf der Ziel-Umgebung aus:
1. Da Puppet, und somit auch Facter, eine in Ruby geschriebene Library ist, wird dieVerfügbarkeit von Ruby geprüft und bei Bedarf auf der Umgebung eineInstallation ausgeführt.
2. Zur Ausführung der in Ruby geschriebenen Facts ist Facter Voraussetzung. Dazuwird bei Nichtverfügbarkeit Facter installiert.
3. Damit die für den Use Case definierten Custom-Facts ausgeführt werden könnenist es im ersten Schritt notwendig, diese auf die Umgebung zu übertragen. Imzweiten Schritt wird zusätzlich der Pfad zur Facter Library definiert undgesourced, damit bei der Ausführung der Facts nicht der absolute Pfad angebenwerden muss. Somit reicht die Ausführung von facter <Name des Facts>, um einFact auszuführen und das Ergebnis zu erhalten.
4. Veranschaulichung des globalen Data Discovery: Im Gegensatz zu der im zweitenPlugin beschriebenen Umsetzung des PostgreSQL Use Case, bei dem Facts erstzum Zeitpunkt des Bedarfs ausgeführt werden, wird hier die alternativeMöglichkeit eines globalen Data Discovery dargestellt. Dazu werden alle auf derUmgebung verfügbaren Facts (d.h. sowohl Core [PL15a] als auch Custom[PL15b]) zu Beginn ausgeführt und in einer temporären Datei (discovery.log)abgespeichert. Aus dieser Datei können die ermittelten Werte zu einem beliebigenspäteren Zeitpunkt ausgelesen werden, ohne die Ergebnisse über eine erneuteAusführung der Facts zu ermitteln.
3.2 PostgreSQL Plugin
Während das erste Plugin vorbereitende Aufgaben sowie das prototypische, globale DataDiscovery übernimmt, ist das zweite Plugin für das PostgreSQL spezifische DataDiscovery zuständig. Zur Abbildung des erwähnten PostgreSQL Use Case beinhaltet dasPlugin drei Komponenten:
"" Server: Prüfung ob und wenn ja, in welcher Version bereits ein PostgreSQL Servervorhanden ist. Basierend auf diesem Ergebnis wird der weitere Ablauf dynamischangepasst. Das bedeutet: Sollte bereits ein Server in passender Konfiguration
5 Voraussetzung hierfür ist, dass ein automaIT Agent bereits auf der Umgebung installiert wurde. Die dazunotwendige Logik ist bereits Teil der automaIT Software und für die weitere Beschreibung nicht relevant,weshalb hierauf nicht weiter eingegangen wird.
6 DDSS: Besteht aus einem System Service, der Hostinitialisierung sowie dem globalen Discovery.
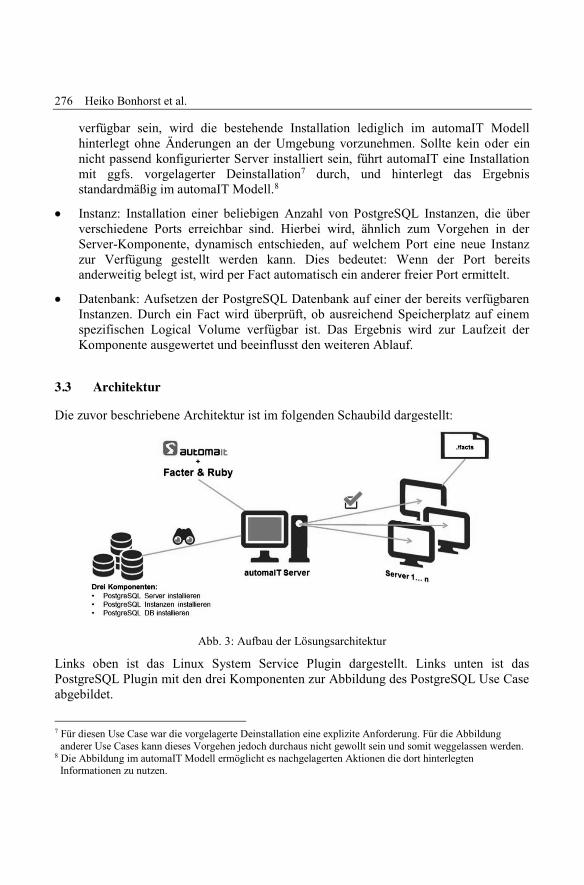
276 Heiko Bonhorst et al.
verfügbar sein, wird die bestehende Installation lediglich im automaIT Modellhinterlegt ohne Änderungen an der Umgebung vorzunehmen. Sollte kein oder einnicht passend konfigurierter Server installiert sein, führt automaIT eine Installationmit ggfs. vorgelagerter Deinstallation7 durch, und hinterlegt das Ergebnisstandardmäßig im automaIT Modell.8
"" Instanz: Installation einer beliebigen Anzahl von PostgreSQL Instanzen, die überverschiedene Ports erreichbar sind. Hierbei wird, ähnlich zum Vorgehen in derServer-Komponente, dynamisch entschieden, auf welchem Port eine neue Instanzzur Verfügung gestellt werden kann. Dies bedeutet: Wenn der Port bereitsanderweitig belegt ist, wird per Fact automatisch ein anderer freier Port ermittelt.
"" Datenbank: Aufsetzen der PostgreSQL Datenbank auf einer der bereits verfügbarenInstanzen. Durch ein Fact wird überprüft, ob ausreichend Speicherplatz auf einemspezifischen Logical Volume verfügbar ist. Das Ergebnis wird zur Laufzeit derKomponente ausgewertet und beeinflusst den weiteren Ablauf.
3.3 ArchitekturDie zuvor beschriebene Architektur ist im folgenden Schaubild dargestellt:
Abb. 3: Aufbau der Lösungsarchitektur
Links oben ist das Linux System Service Plugin dargestellt. Links unten ist dasPostgreSQL Plugin mit den drei Komponenten zur Abbildung des PostgreSQL Use Caseabgebildet.
7 Für diesen Use Case war die vorgelagerte Deinstallation eine explizite Anforderung. Für die Abbildunganderer Use Cases kann dieses Vorgehen jedoch durchaus nicht gewollt sein und somit weggelassen werden.
8 Die Abbildung im automaIT Modell ermöglicht es nachgelagerten Aktionen die dort hinterlegtenInformationen zu nutzen.
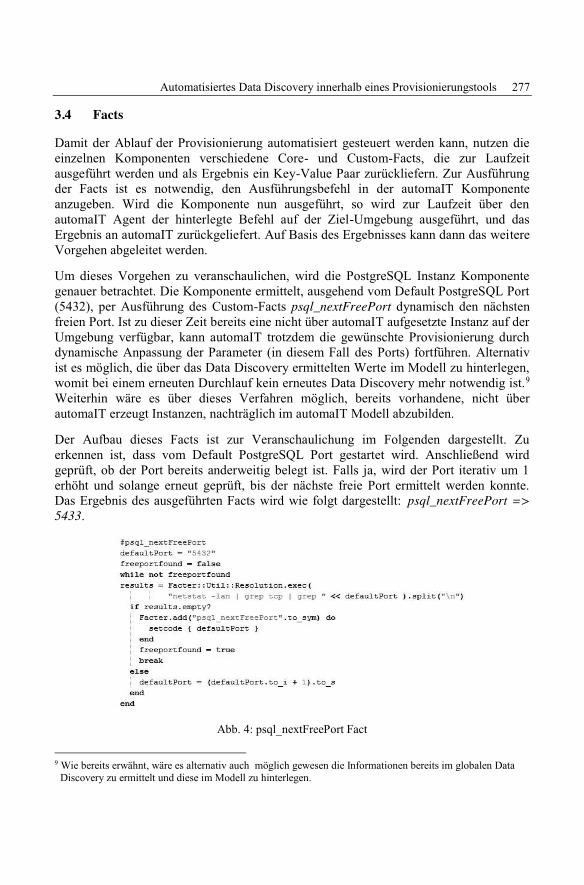
Automatisiertes Data Discovery innerhalb eines Provisionierungstools 277
3.4 FactsDamit der Ablauf der Provisionierung automatisiert gesteuert werden kann, nutzen dieeinzelnen Komponenten verschiedene Core- und Custom-Facts, die zur Laufzeitausgeführt werden und als Ergebnis ein Key-Value Paar zurückliefern. Zur Ausführungder Facts ist es notwendig, den Ausführungsbefehl in der automaIT Komponenteanzugeben. Wird die Komponente nun ausgeführt, so wird zur Laufzeit über denautomaIT Agent der hinterlegte Befehl auf der Ziel-Umgebung ausgeführt, und dasErgebnis an automaIT zurückgeliefert. Auf Basis des Ergebnisses kann dann das weitereVorgehen abgeleitet werden.
Um dieses Vorgehen zu veranschaulichen, wird die PostgreSQL Instanz Komponentegenauer betrachtet. Die Komponente ermittelt, ausgehend vom Default PostgreSQL Port(5432), per Ausführung des Custom-Facts psql_nextFreePort dynamisch den nächstenfreien Port. Ist zu dieser Zeit bereits eine nicht über automaIT aufgesetzte Instanz auf derUmgebung verfügbar, kann automaIT trotzdem die gewünschte Provisionierung durchdynamische Anpassung der Parameter (in diesem Fall des Ports) fortführen. Alternativist es möglich, die über das Data Discovery ermittelten Werte im Modell zu hinterlegen,womit bei einem erneuten Durchlauf kein erneutes Data Discovery mehr notwendig ist.9
Weiterhin wäre es über dieses Verfahren möglich, bereits vorhandene, nicht überautomaIT erzeugt Instanzen, nachträglich im automaIT Modell abzubilden.
Der Aufbau dieses Facts ist zur Veranschaulichung im Folgenden dargestellt. Zuerkennen ist, dass vom Default PostgreSQL Port gestartet wird. Anschließend wirdgeprüft, ob der Port bereits anderweitig belegt ist. Falls ja, wird der Port iterativ um 1erhöht und solange erneut geprüft, bis der nächste freie Port ermittelt werden konnte.Das Ergebnis des ausgeführten Facts wird wie folgt dargestellt: psql_nextFreePort =>5433.
Abb. 4: psql_nextFreePort Fact
9 Wie bereits erwähnt, wäre es alternativ auch möglich gewesen die Informationen bereits im globalen DataDiscovery zu ermittelt und diese im Modell zu hinterlegen.
278 Heiko Bonhorst et al.
Ausgeführt wird das Fact über den Befehl facter psql_nextFreePort.10
Auf PostgreSQL-Seite wurden zu dem oben erläuterten Fact psql_nextFreePort weitereFacts definiert und in den Komponenten eingesetzt:
"" psql_version: zur Ermittlung der Version bzw. Rückmeldung, dass kein PostgreSQLinstalliert ist.
"" psql_instances: Zur Ermittlung der Ports aller aktuell verfügbaren Instanzen.
"" psql_datadir: Zur Ermittlung des Pfades des PostgreSQL Data Directory.
Weitere für den Use Case relevante Custom Facts sind:
"" lvs_#{entry}_size: um die absolute Größe der Logical Volumes auszulesen.
"" lvs_#{entry}_free: um den aktuell verfügbaren Platz zu ermitteln.
Der Teil #{entry} wird dabei jeweils dynamisch durch die Namen der verfügbarenLogical Volumes ersetzt.
Als einziges Core Fact wurde operatingsystem eingesetzt, womit systemspezifischeAktionen in den Komponenten ausgeführt werden können.
4 Fazit und AusblickDurch die prototypische Implementierung eines Data Discovery konnte gezeigt werden,dass für automaIT unbekannte Maschinen einer IT Infrastruktur optimal eingebundenund ein hoher Grad an Automatisierung geschaffen werden konnte. Dadurch ist esmöglich, das Provisioning Tool automaIT auch in nicht gemanagte Infrastruktureneffizient und optimal einzuführen. Die Erweiterung durch Facter unterstützt dabei inhohem Maße die Flexibilität mit dem Ziel die Mächtigkeit des Data Discovery weiterauszubauen. Weiterhin ist nach dem Data Discovery ein Abbild der vorliegenden IT-Topologie im automaIT Modell hinterlegt, welches unter Umständen vorher nichtbekannt war.
Bevor dies jedoch erreicht werden kann, bedarf es eines erhöhtenEntwicklungsaufwandes, um weitere vollumfänglichere Custom-Facts zu erzeugen, alsauch bestehende automaIT Komponenten zu erweitern.
Damit eine bessere Integration des Data Discovery Mechanismus erreicht werden kann,wäre eine Integration in die automaIT interne Substitutionssprache zu empfehlen.Hierdurch könnten Facts innerhalb des XML-Code der Komponenten durch den Einsatzvon Systemvariablen (z.B. :[sys.fact:getUserId]) genutzt und ad-hoc verwendet werden.
10 Wird lediglich facter ausgeführt, so liefert Facter alle auf der Umgebung verfügbaren Key-Value Paare(sowohl Core- als auch Custom-Facts).
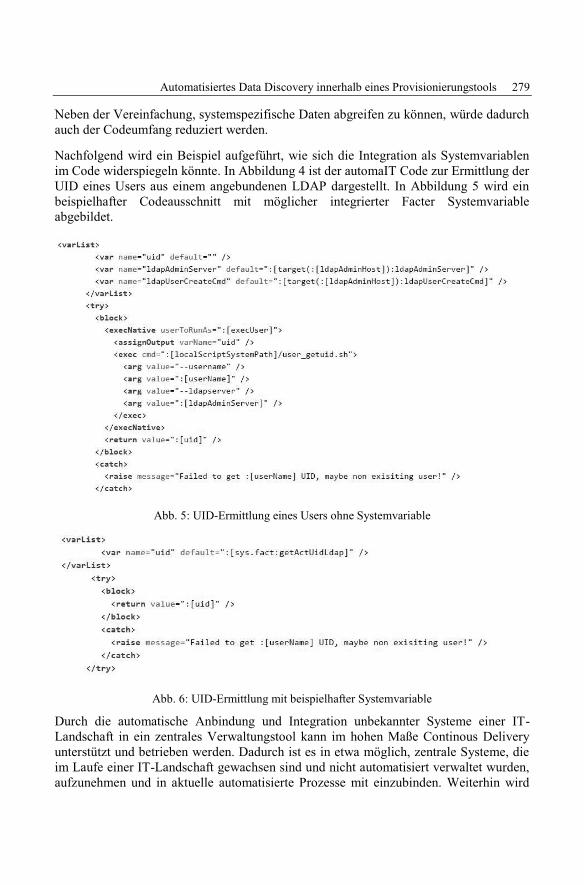
Automatisiertes Data Discovery innerhalb eines Provisionierungstools 279
Neben der Vereinfachung, systemspezifische Daten abgreifen zu können, würde dadurchauch der Codeumfang reduziert werden.
Nachfolgend wird ein Beispiel aufgeführt, wie sich die Integration als Systemvariablenim Code widerspiegeln könnte. In Abbildung 4 ist der automaIT Code zur Ermittlung derUID eines Users aus einem angebundenen LDAP dargestellt. In Abbildung 5 wird einbeispielhafter Codeausschnitt mit möglicher integrierter Facter Systemvariableabgebildet.
Abb. 5: UID-Ermittlung eines Users ohne Systemvariable
Abb. 6: UID-Ermittlung mit beispielhafter Systemvariable
Durch die automatische Anbindung und Integration unbekannter Systeme einer IT-Landschaft in ein zentrales Verwaltungstool kann im hohen Maße Continous Deliveryunterstützt und betrieben werden. Dadurch ist es in etwa möglich, zentrale Systeme, dieim Laufe einer IT-Landschaft gewachsen sind und nicht automatisiert verwaltet wurden,aufzunehmen und in aktuelle automatisierte Prozesse mit einzubinden. Weiterhin wird

280 Heiko Bonhorst et al.
dadurch ein hoher Grad der Standardisierung für IT-Systeme erreicht, was zur Folge hat,dass diese in gleichbleibender Qualität erzeugt und genutzt werden können. Historischgewachsene IT-Landschaften lassen sich durch das Data Discovery kosten- undzeiteffizient einbinden. Zusätzlich kann dadurch die aktuelle IT-Topologie aufgezeichnetwerden.
Literaturverzeichnis[NT15] NovaTec GmbH, automaIT, http://automait.de, Stand: 20.03.2015.
[JD06] Jones, D.; Desai, A.: The Reference Guide To Data Center Automation.Realtimepublishers.com, 2006.
[PL15a] Puppet Labs, Core Facts, docs.puppetlabs.com/facter/latest/core_facts.html, Stand:08.04.2015.
[PL15b] Puppet Labs, Fact Overview, docs.puppetlabs.com/facter/latest/fact_overview.html,Stand: 08.04.2015.
[Kr13] Krum, S.; Van Hevelingen, W.; Kero, B.; Turnbull, J.; McCune, J. Pro Puppet. 2.Auflage, Springer, Berlin, 2013.
[GI13] Gartner Inc. 2013, Gartner IT Glossary - DevOps,www.gartner.com/it-glossary/devops, Stand: 16.05.2015.
P-1 Gregor Engels, Andreas Oberweis, Albert Zündorf (Hrsg.): Modellierung 2001.
P-2 Mikhail Godlevsky, Heinrich C. Mayr (Hrsg.): Information Systems Technology and its Applications, ISTA’2001.
P-3 Ana M. Moreno, Reind P. van de Riet (Hrsg.): Applications of Natural Lan-guage to Information Systems, NLDB’2001.
P-4 H. Wörn, J. Mühling, C. Vahl, H.-P. Meinzer (Hrsg.): Rechner- und sensor-gestützte Chirurgie; Workshop des SFB 414.
P-5 Andy Schürr (Hg.): OMER – Object-Oriented Modeling of Embedded Real-Time Systems.
P-6 Hans-Jürgen Appelrath, Rolf Beyer, Uwe Marquardt, Heinrich C. Mayr, Claudia Steinberger (Hrsg.): Unternehmen Hoch-schule, UH’2001.
P-7 Andy Evans, Robert France, Ana Moreira, Bernhard Rumpe (Hrsg.): Practical UML-Based Rigorous Development Methods – Countering or Integrating the extremists, pUML’2001.
P-8 Reinhard Keil-Slawik, Johannes Magen-heim (Hrsg.): Informatikunterricht und Medienbildung, INFOS’2001.
P-9 Jan von Knop, Wilhelm Haverkamp (Hrsg.): Innovative Anwendungen in Kommunikationsnetzen, 15. DFN Arbeits-tagung.
P-10 Mirjam Minor, Steffen Staab (Hrsg.): 1st German Workshop on Experience Man-agement: Sharing Experiences about the Sharing Experience.
P-11 Michael Weber, Frank Kargl (Hrsg.): Mobile Ad-Hoc Netzwerke, WMAN 2002.
P-12 Martin Glinz, Günther Müller-Luschnat (Hrsg.): Modellierung 2002.
P-13 Jan von Knop, Peter Schirmbacher and Viljan Mahni_ (Hrsg.): The Changing Universities – The Role of Technology.
P-14 Robert Tolksdorf, Rainer Eckstein (Hrsg.): XML-Technologien für das Se-mantic Web – XSW 2002.
P-15 Hans-Bernd Bludau, Andreas Koop (Hrsg.): Mobile Computing in Medicine.
P-16 J. Felix Hampe, Gerhard Schwabe (Hrsg.): Mobile and Collaborative Busi-ness 2002.
P-17 Jan von Knop, Wilhelm Haverkamp (Hrsg.): Zukunft der Netze –Die Verletz-barkeit meistern, 16. DFN Arbeitstagung.
P-18 Elmar J. Sinz, Markus Plaha (Hrsg.): Modellierung betrieblicher Informations-systeme – MobIS 2002.
P-19 Sigrid Schubert, Bernd Reusch, Norbert Jesse (Hrsg.): Informatik bewegt – Infor-matik 2002 – 32. Jahrestagung der Gesell-schaft für Informatik e.V. (GI) 30.Sept.-3.Okt. 2002 in Dortmund.
P-20 Sigrid Schubert, Bernd Reusch, Norbert Jesse (Hrsg.): Informatik bewegt – Infor-matik 2002 – 32. Jahrestagung der Gesell-schaft für Informatik e.V. (GI) 30.Sept.-3.Okt. 2002 in Dortmund (Ergänzungs-band).
P-21 Jörg Desel, Mathias Weske (Hrsg.): Promise 2002: Prozessorientierte Metho-den und Werkzeuge für die Entwicklung von Informationssystemen.
P-22 Sigrid Schubert, Johannes Magenheim, Peter Hubwieser, Torsten Brinda (Hrsg.): Forschungsbeiträge zur “Didaktik der Informatik” – Theorie, Praxis, Evaluation.
P-23 Thorsten Spitta, Jens Borchers, Harry M. Sneed (Hrsg.): Software Management 2002 – Fortschritt durch Beständigkeit
P-24 Rainer Eckstein, Robert Tolksdorf (Hrsg.): XMIDX 2003 – XML-Technologien für Middleware – Middle-ware für XML-Anwendungen
P-25 Key Pousttchi, Klaus Turowski (Hrsg.): Mobile Commerce – Anwendungen und Perspektiven – 3. Workshop Mobile Commerce, Universität Augsburg, 04.02.2003
P-26 Gerhard Weikum, Harald Schöning, Erhard Rahm (Hrsg.): BTW 2003: Daten-banksysteme für Business, Technologie und Web
P-27 Michael Kroll, Hans-Gerd Lipinski, Kay Melzer (Hrsg.): Mobiles Computing in der Medizin
P-28 Ulrich Reimer, Andreas Abecker, Steffen Staab, Gerd Stumme (Hrsg.): WM 2003: Professionelles Wissensmanagement – Er-fahrungen und Visionen
P-29 Antje Düsterhöft, Bernhard Thalheim (Eds.): NLDB’2003: Natural Language Processing and Information Systems
P-30 Mikhail Godlevsky, Stephen Liddle, Heinrich C. Mayr (Eds.): Information Systems Technology and its Applications
P-31 Arslan Brömme, Christoph Busch (Eds.): BIOSIG 2003: Biometrics and Electronic Signatures
GI-Edition Lecture Notes in Informatics
3025594_GI_P_244_Bände.indd 149 28.05.15 08:45

P-32 Peter Hubwieser (Hrsg.): Informatische Fachkonzepte im Unterricht – INFOS 2003
P-33 Andreas Geyer-Schulz, Alfred Taudes (Hrsg.): Informationswirtschaft: Ein Sektor mit Zukunft
P-34 Klaus Dittrich, Wolfgang König, Andreas Oberweis, Kai Rannenberg, Wolfgang Wahlster (Hrsg.): Informatik 2003 – Innovative Informatikanwendungen (Band 1)
P-35 Klaus Dittrich, Wolfgang König, Andreas Oberweis, Kai Rannenberg, Wolfgang Wahlster (Hrsg.): Informatik 2003 – Innovative Informatikanwendungen (Band 2)
P-36 Rüdiger Grimm, Hubert B. Keller, Kai Rannenberg (Hrsg.): Informatik 2003 – Mit Sicherheit Informatik
P-37 Arndt Bode, Jörg Desel, Sabine Rath-mayer, Martin Wessner (Hrsg.): DeLFI 2003: e-Learning Fachtagung Informatik
P-38 E.J. Sinz, M. Plaha, P. Neckel (Hrsg.): Modellierung betrieblicher Informations-systeme – MobIS 2003
P-39 Jens Nedon, Sandra Frings, Oliver Göbel (Hrsg.): IT-Incident Management & IT-Forensics – IMF 2003
P-40 Michael Rebstock (Hrsg.): Modellierung betrieblicher Informationssysteme – Mo-bIS 2004
P-41 Uwe Brinkschulte, Jürgen Becker, Diet-mar Fey, Karl-Erwin Großpietsch, Chris-tian Hochberger, Erik Maehle, Thomas Runkler (Edts.): ARCS 2004 – Organic and Pervasive Computing
P-42 Key Pousttchi, Klaus Turowski (Hrsg.): Mobile Economy – Transaktionen und Prozesse, Anwendungen und Dienste
P-43 Birgitta König-Ries, Michael Klein, Philipp Obreiter (Hrsg.): Persistance, Scalability, Transactions – Database Me-chanisms for Mobile Applications
P-44 Jan von Knop, Wilhelm Haverkamp, Eike Jessen (Hrsg.): Security, E-Learning. E-Services
P-45 Bernhard Rumpe, Wofgang Hesse (Hrsg.): Modellierung 2004
P-46 Ulrich Flegel, Michael Meier (Hrsg.): Detection of Intrusions of Malware & Vulnerability Assessment
P-47 Alexander Prosser, Robert Krimmer (Hrsg.): Electronic Voting in Europe – Technology, Law, Politics and Society
P-48 Anatoly Doroshenko, Terry Halpin, Stephen W. Liddle, Heinrich C. Mayr (Hrsg.): Information Systems Technology and its Applications
P-49 G. Schiefer, P. Wagner, M. Morgenstern, U. Rickert (Hrsg.): Integration und Daten-sicherheit – Anforderungen, Konflikte und Perspektiven
P-50 Peter Dadam, Manfred Reichert (Hrsg.): INFORMATIK 2004 – Informatik ver-bindet (Band 1) Beiträge der 34. Jahresta-gung der Gesellschaft für Informatik e.V. (GI), 20.-24. September 2004 in Ulm
P-51 Peter Dadam, Manfred Reichert (Hrsg.): INFORMATIK 2004 – Informatik ver-bindet (Band 2) Beiträge der 34. Jahresta-gung der Gesellschaft für Informatik e.V. (GI), 20.-24. September 2004 in Ulm
P-52 Gregor Engels, Silke Seehusen (Hrsg.): DELFI 2004 – Tagungsband der 2. e-Learning Fachtagung Informatik
P-53 Robert Giegerich, Jens Stoye (Hrsg.): German Conference on Bioinformatics – GCB 2004
P-54 Jens Borchers, Ralf Kneuper (Hrsg.): Softwaremanagement 2004 – Outsourcing und Integration
P-55 Jan von Knop, Wilhelm Haverkamp, Eike Jessen (Hrsg.): E-Science und Grid Ad-hoc-Netze Medienintegration
P-56 Fernand Feltz, Andreas Oberweis, Benoit Otjacques (Hrsg.): EMISA 2004 – Infor-mationssysteme im E-Business und E-Government
P-57 Klaus Turowski (Hrsg.): Architekturen, Komponenten, Anwendungen
P-58 Sami Beydeda, Volker Gruhn, Johannes Mayer, Ralf Reussner, Franz Schweiggert (Hrsg.): Testing of Component-Based Systems and Software Quality
P-59 J. Felix Hampe, Franz Lehner, Key Pousttchi, Kai Ranneberg, Klaus Turowski (Hrsg.): Mobile Business – Processes, Platforms, Payments
P-60 Steffen Friedrich (Hrsg.): Unterrichtskon-zepte für inforrmatische Bildung
P-61 Paul Müller, Reinhard Gotzhein, Jens B. Schmitt (Hrsg.): Kommunikation in ver-teilten Systemen
P-62 Federrath, Hannes (Hrsg.): „Sicherheit 2005“ – Sicherheit – Schutz und Zuver-lässigkeit
P-63 Roland Kaschek, Heinrich C. Mayr, Stephen Liddle (Hrsg.): Information Sys-tems – Technology and ist Applications
3025594_GI_P_244_Bände.indd 150 28.05.15 08:45

P-64 Peter Liggesmeyer, Klaus Pohl, Michael Goedicke (Hrsg.): Software Engineering 2005
P-65 Gottfried Vossen, Frank Leymann, Peter Lockemann, Wolffried Stucky (Hrsg.): Datenbanksysteme in Business, Techno-logie und Web
P-66 Jörg M. Haake, Ulrike Lucke, Djamshid Tavangarian (Hrsg.): DeLFI 2005: 3. deutsche e-Learning Fachtagung Infor-matik
P-67 Armin B. Cremers, Rainer Manthey, Peter Martini, Volker Steinhage (Hrsg.): INFORMATIK 2005 – Informatik LIVE (Band 1)
P-68 Armin B. Cremers, Rainer Manthey, Peter Martini, Volker Steinhage (Hrsg.): INFORMATIK 2005 – Informatik LIVE (Band 2)
P-69 Robert Hirschfeld, Ryszard Kowalcyk, Andreas Polze, Matthias Weske (Hrsg.): NODe 2005, GSEM 2005
P-70 Klaus Turowski, Johannes-Maria Zaha (Hrsg.): Component-oriented Enterprise Application (COAE 2005)
P-71 Andrew Torda, Stefan Kurz, Matthias Rarey (Hrsg.): German Conference on Bioinformatics 2005
P-72 Klaus P. Jantke, Klaus-Peter Fähnrich, Wolfgang S. Wittig (Hrsg.): Marktplatz Internet: Von e-Learning bis e-Payment
P-73 Jan von Knop, Wilhelm Haverkamp, Eike Jessen (Hrsg.): “Heute schon das Morgen sehen“
P-74 Christopher Wolf, Stefan Lucks, Po-Wah Yau (Hrsg.): WEWoRC 2005 – Western European Workshop on Research in Cryptology
P-75 Jörg Desel, Ulrich Frank (Hrsg.): Enter-prise Modelling and Information Systems Architecture
P-76 Thomas Kirste, Birgitta König-Riess, Key Pousttchi, Klaus Turowski (Hrsg.): Mo-bile Informationssysteme – Potentiale, Hindernisse, Einsatz
P-77 Jana Dittmann (Hrsg.): SICHERHEIT 2006
P-78 K.-O. Wenkel, P. Wagner, M. Morgens-tern, K. Luzi, P. Eisermann (Hrsg.): Land- und Ernährungswirtschaft im Wandel
P-79 Bettina Biel, Matthias Book, Volker Gruhn (Hrsg.): Softwareengineering 2006
P-80 Mareike Schoop, Christian Huemer, Michael Rebstock, Martin Bichler (Hrsg.): Service-Oriented Electronic Commerce
P-81 Wolfgang Karl, Jürgen Becker, Karl-Erwin Großpietsch, Christian Hochberger, Erik Maehle (Hrsg.): ARCS´06
P-82 Heinrich C. Mayr, Ruth Breu (Hrsg.): Modellierung 2006
P-83 Daniel Huson, Oliver Kohlbacher, Andrei Lupas, Kay Nieselt and Andreas Zell (eds.): German Conference on Bioinfor-matics
P-84 Dimitris Karagiannis, Heinrich C. Mayr, (Hrsg.): Information Systems Technology and its Applications
P-85 Witold Abramowicz, Heinrich C. Mayr, (Hrsg.): Business Information Systems
P-86 Robert Krimmer (Ed.): Electronic Voting 2006
P-87 Max Mühlhäuser, Guido Rößling, Ralf Steinmetz (Hrsg.): DELFI 2006: 4. e-Learning Fachtagung Informatik
P-88 Robert Hirschfeld, Andreas Polze, Ryszard Kowalczyk (Hrsg.): NODe 2006, GSEM 2006
P-90 Joachim Schelp, Robert Winter, Ulrich Frank, Bodo Rieger, Klaus Turowski (Hrsg.): Integration, Informationslogistik und Architektur
P-91 Henrik Stormer, Andreas Meier, Michael Schumacher (Eds.): European Conference on eHealth 2006
P-92 Fernand Feltz, Benoît Otjacques, Andreas Oberweis, Nicolas Poussing (Eds.): AIM 2006
P-93 Christian Hochberger, Rüdiger Liskowsky (Eds.): INFORMATIK 2006 – Informatik für Menschen, Band 1
P-94 Christian Hochberger, Rüdiger Liskowsky (Eds.): INFORMATIK 2006 – Informatik für Menschen, Band 2
P-95 Matthias Weske, Markus Nüttgens (Eds.): EMISA 2005: Methoden, Konzepte und Technologien für die Entwicklung von dienstbasierten Informationssystemen
P-96 Saartje Brockmans, Jürgen Jung, York Sure (Eds.): Meta-Modelling and Ontolo-gies
P-97 Oliver Göbel, Dirk Schadt, Sandra Frings, Hardo Hase, Detlef Günther, Jens Nedon (Eds.): IT-Incident Mangament & IT-Forensics – IMF 2006
3025594_GI_P_244_Bände.indd 151 28.05.15 08:45

P-98 Hans Brandt-Pook, Werner Simonsmeier und Thorsten Spitta (Hrsg.): Beratung in der Softwareentwicklung – Modelle, Methoden, Best Practices
P-99 Andreas Schwill, Carsten Schulte, Marco Thomas (Hrsg.): Didaktik der Informatik
P-100 Peter Forbrig, Günter Siegel, Markus Schneider (Hrsg.): HDI 2006: Hochschul-didaktik der Informatik
P-101 Stefan Böttinger, Ludwig Theuvsen, Susanne Rank, Marlies Morgenstern (Hrsg.): Agrarinformatik im Spannungsfeld zwischen Regionalisierung und globalen Wertschöpfungsketten
P-102 Otto Spaniol (Eds.): Mobile Services and Personalized Environments
P-103 Alfons Kemper, Harald Schöning, Thomas Rose, Matthias Jarke, Thomas Seidl, Christoph Quix, Christoph Brochhaus (Hrsg.): Datenbanksysteme in Business, Technologie und Web (BTW 2007)
P-104 Birgitta König-Ries, Franz Lehner, Rainer Malaka, Can Türker (Hrsg.) MMS 2007: Mobilität und mobile Informationssysteme
P-105 Wolf-Gideon Bleek, Jörg Raasch, Heinz Züllighoven (Hrsg.) Software Engineering 2007
P-106 Wolf-Gideon Bleek, Henning Schwentner, Heinz Züllighoven (Hrsg.) Software Engineering 2007 – Beiträge zu den Workshops
P-107 Heinrich C. Mayr, Dimitris Karagiannis (eds.) Information Systems Technology and its Applications
P-108 Arslan Brömme, Christoph Busch, Detlef Hühnlein (eds.) BIOSIG 2007: Biometrics and Electronic Signatures
P-109 Rainer Koschke, Otthein Herzog, Karl-Heinz Rödiger, Marc Ronthaler (Hrsg.) INFORMATIK 2007 Informatik trifft Logistik Band 1
P-110 Rainer Koschke, Otthein Herzog, Karl-Heinz Rödiger, Marc Ronthaler (Hrsg.) INFORMATIK 2007 Informatik trifft Logistik Band 2
P-111 Christian Eibl, Johannes Magenheim, Sigrid Schubert, Martin Wessner (Hrsg.) DeLFI 2007: 5. e-Learning Fachtagung Informatik
P-112 Sigrid Schubert (Hrsg.) Didaktik der Informatik in Theorie und Praxis
P-113 Sören Auer, Christian Bizer, Claudia Müller, Anna V. Zhdanova (Eds.) The Social Semantic Web 2007 Proceedings of the 1st Conference on Social Semantic Web (CSSW)
P-114 Sandra Frings, Oliver Göbel, Detlef Günther, Hardo G. Hase, Jens Nedon, Dirk Schadt, Arslan Brömme (Eds.) IMF2007 IT-incident management & IT-forensics Proceedings of the 3rd International Conference on IT-Incident Management & IT-Forensics
P-115 Claudia Falter, Alexander Schliep, Joachim Selbig, Martin Vingron and Dirk Walther (Eds.) German conference on bioinformatics GCB 2007
P-116 Witold Abramowicz, Leszek Maciszek (Eds.) Business Process and Services Computing 1st International Working Conference on Business Process and Services Computing BPSC 2007
P-117 Ryszard Kowalczyk (Ed.) Grid service engineering and manegement The 4th International Conference on Grid Service Engineering and Management GSEM 2007
P-118 Andreas Hein, Wilfried Thoben, Hans-Jürgen Appelrath, Peter Jensch (Eds.) European Conference on ehealth 2007
P-119 Manfred Reichert, Stefan Strecker, Klaus Turowski (Eds.) Enterprise Modelling and Information Systems Architectures Concepts and Applications
P-120 Adam Pawlak, Kurt Sandkuhl, Wojciech Cholewa, Leandro Soares Indrusiak (Eds.) Coordination of Collaborative Engineering - State of the Art and Future Challenges
P-121 Korbinian Herrmann, Bernd Bruegge (Hrsg.) Software Engineering 2008 Fachtagung des GI-Fachbereichs Softwaretechnik
P-122 Walid Maalej, Bernd Bruegge (Hrsg.) Software Engineering 2008 - Workshopband Fachtagung des GI-Fachbereichs Softwaretechnik
3025594_GI_P_244_Bände.indd 152 28.05.15 08:45

P-123 Michael H. Breitner, Martin Breunig, Elgar Fleisch, Ley Pousttchi, Klaus Turowski (Hrsg.) Mobile und Ubiquitäre Informationssysteme – Technologien, Prozesse, Marktfähigkeit Proceedings zur 3. Konferenz Mobile und Ubiquitäre Informationssysteme (MMS 2008)
P-124 Wolfgang E. Nagel, Rolf Hoffmann, Andreas Koch (Eds.) 9th Workshop on Parallel Systems and Algorithms (PASA) Workshop of the GI/ITG Speciel Interest Groups PARS and PARVA
P-125 Rolf A.E. Müller, Hans-H. Sundermeier, Ludwig Theuvsen, Stephanie Schütze, Marlies Morgenstern (Hrsg.) Unternehmens-IT: Führungsinstrument oder Verwaltungsbürde Referate der 28. GIL Jahrestagung
P-126 Rainer Gimnich, Uwe Kaiser, Jochen Quante, Andreas Winter (Hrsg.) 10th Workshop Software Reengineering (WSR 2008)
P-127 Thomas Kühne, Wolfgang Reisig, Friedrich Steimann (Hrsg.) Modellierung 2008
P-128 Ammar Alkassar, Jörg Siekmann (Hrsg.) Sicherheit 2008 Sicherheit, Schutz und Zuverlässigkeit Beiträge der 4. Jahrestagung des Fachbereichs Sicherheit der Gesellschaft für Informatik e.V. (GI) 2.-4. April 2008 Saarbrücken, Germany
P-129 Wolfgang Hesse, Andreas Oberweis (Eds.) Sigsand-Europe 2008 Proceedings of the Third AIS SIGSAND European Symposium on Analysis, Design, Use and Societal Impact of Information Systems
P-130 Paul Müller, Bernhard Neumair, Gabi Dreo Rodosek (Hrsg.) 1. DFN-Forum Kommunikations-technologien Beiträge der Fachtagung
P-131 Robert Krimmer, Rüdiger Grimm (Eds.) 3rd International Conference on Electronic Voting 2008 Co-organized by Council of Europe, Gesellschaft für Informatik and E-Voting.CC
P-132 Silke Seehusen, Ulrike Lucke, Stefan Fischer (Hrsg.) DeLFI 2008: Die 6. e-Learning Fachtagung Informatik
P-133 Heinz-Gerd Hegering, Axel Lehmann, Hans Jürgen Ohlbach, Christian Scheideler (Hrsg.) INFORMATIK 2008 Beherrschbare Systeme – dank Informatik Band 1
P-134 Heinz-Gerd Hegering, Axel Lehmann, Hans Jürgen Ohlbach, Christian Scheideler (Hrsg.) INFORMATIK 2008 Beherrschbare Systeme – dank Informatik Band 2
P-135 Torsten Brinda, Michael Fothe, Peter Hubwieser, Kirsten Schlüter (Hrsg.) Didaktik der Informatik – Aktuelle Forschungsergebnisse
P-136 Andreas Beyer, Michael Schroeder (Eds.) German Conference on Bioinformatics GCB 2008
P-137 Arslan Brömme, Christoph Busch, Detlef Hühnlein (Eds.) BIOSIG 2008: Biometrics and Electronic Signatures
P-138 Barbara Dinter, Robert Winter, Peter Chamoni, Norbert Gronau, Klaus Turowski (Hrsg.) Synergien durch Integration und Informationslogistik Proceedings zur DW2008
P-139 Georg Herzwurm, Martin Mikusz (Hrsg.) Industrialisierung des Software-Managements Fachtagung des GI-Fachausschusses Management der Anwendungs entwick-lung und -wartung im Fachbereich Wirtschaftsinformatik
P-140 Oliver Göbel, Sandra Frings, Detlef Günther, Jens Nedon, Dirk Schadt (Eds.) IMF 2008 - IT Incident Management & IT Forensics
P-141 Peter Loos, Markus Nüttgens, Klaus Turowski, Dirk Werth (Hrsg.) Modellierung betrieblicher Informations-systeme (MobIS 2008) Modellierung zwischen SOA und Compliance Management
P-142 R. Bill, P. Korduan, L. Theuvsen, M. Morgenstern (Hrsg.) Anforderungen an die Agrarinformatik durch Globalisierung und Klimaveränderung
P-143 Peter Liggesmeyer, Gregor Engels, Jürgen Münch, Jörg Dörr, Norman Riegel (Hrsg.) Software Engineering 2009 Fachtagung des GI-Fachbereichs Softwaretechnik
3025594_GI_P_244_Bände.indd 153 28.05.15 08:45

P-144 Johann-Christoph Freytag, Thomas Ruf, Wolfgang Lehner, Gottfried Vossen (Hrsg.) Datenbanksysteme in Business, Technologie und Web (BTW)
P-145 Knut Hinkelmann, Holger Wache (Eds.) WM2009: 5th Conference on Professional Knowledge Management
P-146 Markus Bick, Martin Breunig, Hagen Höpfner (Hrsg.) Mobile und Ubiquitäre Informationssysteme – Entwicklung, Implementierung und Anwendung 4. Konferenz Mobile und Ubiquitäre Informationssysteme (MMS 2009)
P-147 Witold Abramowicz, Leszek Maciaszek, Ryszard Kowalczyk, Andreas Speck (Eds.) Business Process, Services Computing and Intelligent Service Management BPSC 2009 · ISM 2009 · YRW-MBP 2009
P-148 Christian Erfurth, Gerald Eichler, Volkmar Schau (Eds.) 9th International Conference on Innovative Internet Community Systems I2CS 2009
P-149 Paul Müller, Bernhard Neumair, Gabi Dreo Rodosek (Hrsg.) 2. DFN-Forum Kommunikationstechnologien Beiträge der Fachtagung
P-150 Jürgen Münch, Peter Liggesmeyer (Hrsg.) Software Engineering 2009 - Workshopband
P-151 Armin Heinzl, Peter Dadam, Stefan Kirn, Peter Lockemann (Eds.) PRIMIUM Process Innovation for Enterprise Software
P-152 Jan Mendling, Stefanie Rinderle-Ma, Werner Esswein (Eds.) Enterprise Modelling and Information
Systems Architectures Proceedings of the 3rd Int‘l Workshop
EMISA 2009
P-153 Andreas Schwill, Nicolas Apostolopoulos (Hrsg.) Lernen im Digitalen Zeitalter DeLFI 2009 – Die 7. E-Learning Fachtagung Informatik
P-154 Stefan Fischer, Erik Maehle Rüdiger Reischuk (Hrsg.) INFORMATIK 2009 Im Focus das Leben
P-155 Arslan Brömme, Christoph Busch, Detlef Hühnlein (Eds.) BIOSIG 2009: Biometrics and Electronic Signatures Proceedings of the Special Interest Group on Biometrics and Electronic Signatures
P-156 Bernhard Koerber (Hrsg.) Zukunft braucht Herkunft 25 Jahre »INFOS – Informatik und Schule«
P-157 Ivo Grosse, Steffen Neumann, Stefan Posch, Falk Schreiber, Peter Stadler (Eds.) German Conference on Bioinformatics 2009
P-158 W. Claupein, L. Theuvsen, A. Kämpf, M. Morgenstern (Hrsg.) Precision Agriculture Reloaded – Informationsgestützte Landwirtschaft
P-159 Gregor Engels, Markus Luckey, Wilhelm Schäfer (Hrsg.) Software Engineering 2010
P-160 Gregor Engels, Markus Luckey, Alexander Pretschner, Ralf Reussner (Hrsg.) Software Engineering 2010 – Workshopband (inkl. Doktorandensymposium)
P-161 Gregor Engels, Dimitris Karagiannis Heinrich C. Mayr (Hrsg.) Modellierung 2010
P-162 Maria A. Wimmer, Uwe Brinkhoff, Siegfried Kaiser, Dagmar Lück-Schneider, Erich Schweighofer, Andreas Wiebe (Hrsg.) Vernetzte IT für einen effektiven Staat Gemeinsame Fachtagung Verwaltungsinformatik (FTVI) und Fachtagung Rechtsinformatik (FTRI) 2010
P-163 Markus Bick, Stefan Eulgem, Elgar Fleisch, J. Felix Hampe, Birgitta König-Ries, Franz Lehner, Key Pousttchi, Kai Rannenberg (Hrsg.) Mobile und Ubiquitäre Informationssysteme Technologien, Anwendungen und Dienste zur Unterstützung von mobiler Kollaboration
P-164 Arslan Brömme, Christoph Busch (Eds.) BIOSIG 2010: Biometrics and Electronic Signatures Proceedings of the Special Interest Group on Biometrics and Electronic Signatures
3025594_GI_P_244_Bände.indd 154 28.05.15 08:45

P-165 Gerald Eichler, Peter Kropf, Ulrike Lechner, Phayung Meesad, Herwig Unger (Eds.) 10th International Conference on Innovative Internet Community Systems (I2CS) – Jubilee Edition 2010 –
P-166 Paul Müller, Bernhard Neumair, Gabi Dreo Rodosek (Hrsg.) 3. DFN-Forum Kommunikationstechnologien Beiträge der Fachtagung
P-167 Robert Krimmer, Rüdiger Grimm (Eds.) 4th International Conference on Electronic Voting 2010 co-organized by the Council of Europe, Gesellschaft für Informatik and E-Voting.CC
P-168 Ira Diethelm, Christina Dörge, Claudia Hildebrandt, Carsten Schulte (Hrsg.) Didaktik der Informatik Möglichkeiten empirischer Forschungsmethoden und Perspektiven der Fachdidaktik
P-169 Michael Kerres, Nadine Ojstersek Ulrik Schroeder, Ulrich Hoppe (Hrsg.) DeLFI 2010 - 8. Tagung der Fachgruppe E-Learning der Gesellschaft für Informatik e.V.
P-170 Felix C. Freiling (Hrsg.) Sicherheit 2010 Sicherheit, Schutz und Zuverlässigkeit
P-171 Werner Esswein, Klaus Turowski, Martin Juhrisch (Hrsg.) Modellierung betrieblicher Informationssysteme (MobIS 2010) Modellgestütztes Management
P-172 Stefan Klink, Agnes Koschmider Marco Mevius, Andreas Oberweis (Hrsg.) EMISA 2010 Einflussfaktoren auf die Entwicklung flexibler, integrierter Informationssysteme Beiträge des Workshops der GI-Fachgruppe EMISA (Entwicklungsmethoden für Infor- mationssysteme und deren Anwendung)
P-173 Dietmar Schomburg, Andreas Grote (Eds.) German Conference on Bioinformatics 2010
P-174 Arslan Brömme, Torsten Eymann, Detlef Hühnlein, Heiko Roßnagel, Paul Schmücker (Hrsg.) perspeGKtive 2010 Workshop „Innovative und sichere Informationstechnologie für das Gesundheitswesen von morgen“
P-175 Klaus-Peter Fähnrich, Bogdan Franczyk (Hrsg.) INFORMATIK 2010 Service Science – Neue Perspektiven für die Informatik Band 1
P-176 Klaus-Peter Fähnrich, Bogdan Franczyk (Hrsg.) INFORMATIK 2010 Service Science – Neue Perspektiven für die Informatik Band 2
P-177 Witold Abramowicz, Rainer Alt, Klaus-Peter Fähnrich, Bogdan Franczyk, Leszek A. Maciaszek (Eds.) INFORMATIK 2010 Business Process and Service Science – Proceedings of ISSS and BPSC
P-178 Wolfram Pietsch, Benedikt Krams (Hrsg.) Vom Projekt zum Produkt Fachtagung des GI-
Fachausschusses Management der Anwendungsentwicklung und -wartung im Fachbereich Wirtschafts-informatik (WI-MAW), Aachen, 2010
P-179 Stefan Gruner, Bernhard Rumpe (Eds.) FM+AM`2010 Second International Workshop on Formal Methods and Agile Methods
P-180 Theo Härder, Wolfgang Lehner, Bernhard Mitschang, Harald Schöning, Holger Schwarz (Hrsg.) Datenbanksysteme für Business, Technologie und Web (BTW) 14. Fachtagung des GI-Fachbereichs „Datenbanken und Informationssysteme“ (DBIS)
P-181 Michael Clasen, Otto Schätzel, Brigitte Theuvsen (Hrsg.) Qualität und Effizienz durch informationsgestützte Landwirtschaft, Fokus: Moderne Weinwirtschaft
P-182 Ronald Maier (Hrsg.) 6th Conference on Professional Knowledge Management From Knowledge to Action
P-183 Ralf Reussner, Matthias Grund, Andreas Oberweis, Walter Tichy (Hrsg.) Software Engineering 2011 Fachtagung des GI-Fachbereichs Softwaretechnik
P-184 Ralf Reussner, Alexander Pretschner, Stefan Jähnichen (Hrsg.) Software Engineering 2011 Workshopband (inkl. Doktorandensymposium)
3025594_GI_P_244_Bände.indd 155 28.05.15 08:45

P-185 Hagen Höpfner, Günther Specht, Thomas Ritz, Christian Bunse (Hrsg.) MMS 2011: Mobile und ubiquitäre Informationssysteme Proceedings zur 6. Konferenz Mobile und Ubiquitäre Informationssysteme (MMS 2011)
P-186 Gerald Eichler, Axel Küpper, Volkmar Schau, Hacène Fouchal, Herwig Unger (Eds.) 11th International Conference on Innovative Internet Community Systems (I2CS)
P-187 Paul Müller, Bernhard Neumair, Gabi Dreo Rodosek (Hrsg.) 4. DFN-Forum Kommunikations- technologien, Beiträge der Fachtagung 20. Juni bis 21. Juni 2011 Bonn
P-188 Holger Rohland, Andrea Kienle, Steffen Friedrich (Hrsg.) DeLFI 2011 – Die 9. e-Learning Fachtagung Informatik der Gesellschaft für Informatik e.V. 5.–8. September 2011, Dresden
P-189 Thomas, Marco (Hrsg.) Informatik in Bildung und Beruf INFOS 2011 14. GI-Fachtagung Informatik und Schule
P-190 Markus Nüttgens, Oliver Thomas, Barbara Weber (Eds.) Enterprise Modelling and Information Systems Architectures (EMISA 2011)
P-191 Arslan Brömme, Christoph Busch (Eds.) BIOSIG 2011 International Conference of the Biometrics Special Interest Group
P-192 Hans-Ulrich Heiß, Peter Pepper, Holger Schlingloff, Jörg Schneider (Hrsg.) INFORMATIK 2011 Informatik schafft Communities
P-193 Wolfgang Lehner, Gunther Piller (Hrsg.) IMDM 2011
P-194 M. Clasen, G. Fröhlich, H. Bernhardt, K. Hildebrand, B. Theuvsen (Hrsg.) Informationstechnologie für eine nachhaltige Landbewirtschaftung Fokus Forstwirtschaft
P-195 Neeraj Suri, Michael Waidner (Hrsg.) Sicherheit 2012 Sicherheit, Schutz und Zuverlässigkeit Beiträge der 6. Jahrestagung des Fachbereichs Sicherheit der Gesellschaft für Informatik e.V. (GI)
P-196 Arslan Brömme, Christoph Busch (Eds.)BIOSIG 2012 Proceedings of the 11th International Conference of the Biometrics Special Interest Group
P-197 Jörn von Lucke, Christian P. Geiger, Siegfried Kaiser, Erich Schweighofer, Maria A. Wimmer (Hrsg.) Auf dem Weg zu einer offenen, smarten und vernetzten Verwaltungskultur Gemeinsame Fachtagung Verwaltungsinformatik (FTVI) und Fachtagung Rechtsinformatik (FTRI) 2012
P-198 Stefan Jähnichen, Axel Küpper, Sahin Albayrak (Hrsg.) Software Engineering 2012 Fachtagung des GI-Fachbereichs Softwaretechnik
P-199 Stefan Jähnichen, Bernhard Rumpe, Holger Schlingloff (Hrsg.) Software Engineering 2012 Workshopband
P-200 Gero Mühl, Jan Richling, Andreas Herkersdorf (Hrsg.) ARCS 2012 Workshops
P-201 Elmar J. Sinz Andy Schürr (Hrsg.) Modellierung 2012
P-202 Andrea Back, Markus Bick, Martin Breunig, Key Pousttchi, Frédéric Thiesse (Hrsg.) MMS 2012:Mobile und Ubiquitäre Informationssysteme
P-203 Paul Müller, Bernhard Neumair, Helmut Reiser, Gabi Dreo Rodosek (Hrsg.) 5. DFN-Forum Kommunikations-technologien Beiträge der Fachtagung
P-204 Gerald Eichler, Leendert W. M. Wienhofen, Anders Kofod-Petersen, Herwig Unger (Eds.) 12th International Conference on Innovative Internet Community Systems (I2CS 2012)
P-205 Manuel J. Kripp, Melanie Volkamer, Rüdiger Grimm (Eds.) 5th International Conference on Electronic Voting 2012 (EVOTE2012) Co-organized by the Council of Europe, Gesellschaft für Informatik and E-Voting.CC
P-206 Stefanie Rinderle-Ma, Mathias Weske (Hrsg.) EMISA 2012 Der Mensch im Zentrum der Modellierung
P-207 Jörg Desel, Jörg M. Haake, Christian Spannagel (Hrsg.) DeLFI 2012: Die 10. e-Learning Fachtagung Informatik der Gesellschaft für Informatik e.V. 24.–26. September 2012
3025594_GI_P_244_Bände.indd 156 28.05.15 08:45

P-208 Ursula Goltz, Marcus Magnor, Hans-Jürgen Appelrath, Herbert Matthies, Wolf-Tilo Balke, Lars Wolf (Hrsg.) INFORMATIK 2012
P-209 Hans Brandt-Pook, André Fleer, Thorsten Spitta, Malte Wattenberg (Hrsg.) Nachhaltiges Software Management
P-210 Erhard Plödereder, Peter Dencker, Herbert Klenk, Hubert B. Keller, Silke Spitzer (Hrsg.) Automotive – Safety & Security 2012 Sicherheit und Zuverlässigkeit für automobile Informationstechnik
P-211 M. Clasen, K. C. Kersebaum, A. Meyer-Aurich, B. Theuvsen (Hrsg.)Massendatenmanagement in der Agrar- und Ernährungswirtschaft Erhebung - Verarbeitung - Nutzung Referate der 33. GIL-Jahrestagung 20. – 21. Februar 2013, Potsdam
P-212 Arslan Brömme, Christoph Busch (Eds.) BIOSIG 2013 Proceedings of the 12th International Conference of the Biometrics Special Interest Group 04.–06. September 2013 Darmstadt, Germany
P-213 Stefan Kowalewski, Bernhard Rumpe (Hrsg.) Software Engineering 2013 Fachtagung des GI-Fachbereichs Softwaretechnik
P-214 Volker Markl, Gunter Saake, Kai-Uwe Sattler, Gregor Hackenbroich, Bernhard Mit schang, Theo Härder, Veit Köppen (Hrsg.) Datenbanksysteme für Business, Technologie und Web (BTW) 2013 13. – 15. März 2013, Magdeburg
P-215 Stefan Wagner, Horst Lichter (Hrsg.)Software Engineering 2013 Workshopband (inkl. Doktorandensymposium) 26. Februar – 1. März 2013, Aachen
P-216 Gunter Saake, Andreas Henrich, Wolfgang Lehner, Thomas Neumann, Veit Köppen (Hrsg.) Datenbanksysteme für Business, Technologie und Web (BTW) 2013 –Workshopband 11. – 12. März 2013, Magdeburg
P-217 Paul Müller, Bernhard Neumair, Helmut Reiser, Gabi Dreo Rodosek (Hrsg.) 6. DFN-Forum Kommunikations- technologien Beiträge der Fachtagung 03.–04. Juni 2013, Erlangen
P-218 Andreas Breiter, Christoph Rensing (Hrsg.) DeLFI 2013: Die 11 e-Learning Fachtagung Informatik der Gesellschaft für Informatik e.V. (GI) 8. – 11. September 2013, Bremen
P-219 Norbert Breier, Peer Stechert, Thomas Wilke (Hrsg.) Informatik erweitert Horizonte INFOS 2013 15. GI-Fachtagung Informatik und Schule 26. – 28. September 2013
P-220 Matthias Horbach (Hrsg.) INFORMATIK 2013 Informatik angepasst an Mensch, Organisation und Umwelt 16. – 20. September 2013, Koblenz
P-221 Maria A. Wimmer, Marijn Janssen, Ann Macintosh, Hans Jochen Scholl, Efthimios Tambouris (Eds.) Electronic Government and Electronic Participation Joint Proceedings of Ongoing Research of IFIP EGOV and IFIP ePart 2013 16. – 19. September 2013, Koblenz
P-222 Reinhard Jung, Manfred Reichert (Eds.) Enterprise Modelling
and Information Systems Architectures (EMISA 2013)
St. Gallen, Switzerland September 5. – 6. 2013
P-223 Detlef Hühnlein, Heiko Roßnagel (Hrsg.) Open Identity Summit 2013 10. – 11. September 2013 Kloster Banz, Germany
P-224 Eckhart Hanser, Martin Mikusz, Masud Fazal-Baqaie (Hrsg.) Vorgehensmodelle 2013 Vorgehensmodelle – Anspruch und Wirklichkeit 20. Tagung der Fachgruppe Vorgehensmodelle im Fachgebiet Wirtschaftsinformatik (WI-VM) der Gesellschaft für Informatik e.V. Lörrach, 2013
P-225 Hans-Georg Fill, Dimitris Karagiannis, Ulrich Reimer (Hrsg.) Modellierung 2014 19. – 21. März 2014, Wien
P-226 M. Clasen, M. Hamer, S. Lehnert, B. Petersen, B. Theuvsen (Hrsg.) IT-Standards in der Agrar- und Ernährungswirtschaft Fokus: Risiko- und Krisenmanagement Referate der 34. GIL-Jahrestagung 24. – 25. Februar 2014, Bonn
3025594_GI_P_244_Bände.indd 157 28.05.15 08:45

P-227 Wilhelm Hasselbring, Nils Christian Ehmke (Hrsg.) Software Engineering 2014 Fachtagung des GI-Fachbereichs Softwaretechnik 25. – 28. Februar 2014 Kiel, Deutschland
P-228 Stefan Katzenbeisser, Volkmar Lotz, Edgar Weippl (Hrsg.) Sicherheit 2014 Sicherheit, Schutz und Zuverlässigkeit Beiträge der 7. Jahrestagung des Fachbereichs Sicherheit der Gesellschaft für Informatik e.V. (GI) 19. – 21. März 2014, Wien
P-230 Arslan Brömme, Christoph Busch (Eds.) BIOSIG 2014 Proceedings of the 13th International
Conference of the Biometrics Special Interest Group
10. – 12. September 2014 in Darmstadt, Germany
P-231 Paul Müller, Bernhard Neumair, Helmut Reiser, Gabi Dreo Rodosek (Hrsg.) 7. DFN-Forum Kommunikationstechnologien 16. – 17. Juni 2014 Fulda
P-232 E. Plödereder, L. Grunske, E. Schneider, D. Ull (Hrsg.)
INFORMATIK 2014 Big Data – Komplexität meistern 22. – 26. September 2014 Stuttgart
P-233 Stephan Trahasch, Rolf Plötzner, Gerhard Schneider, Claudia Gayer, Daniel Sassiat, Nicole Wöhrle (Hrsg.)
DeLFI 2014 – Die 12. e-Learning Fachtagung Informatik der Gesellschaft für Informatik e.V. 15. – 17. September 2014 Freiburg
P-234 Fernand Feltz, Bela Mutschler, Benoît Otjacques (Eds.)
Enterprise Modelling and Information Systems Architectures
(EMISA 2014) Luxembourg, September 25-26, 2014
P-235 Robert Giegerich, Ralf Hofestädt,
Tim W. Nattkemper (Eds.) German Conference on Bioinformatics 2014 September 28 – October 1 Bielefeld, Germany
P-236 Martin Engstler, Eckhart Hanser, Martin Mikusz, Georg Herzwurm (Hrsg.)
Projektmanagement und Vorgehensmodelle 2014
Soziale Aspekte und Standardisierung Gemeinsame Tagung der Fachgruppen
Projektmanagement (WI-PM) und Vorgehensmodelle (WI-VM) im Fachgebiet Wirtschaftsinformatik der Gesellschaft für Informatik e.V., Stuttgart 2014
P-237 Detlef Hühnlein, Heiko Roßnagel (Hrsg.) Open Identity Summit 2014 4.–6. November 2014 Stuttgart, Germany
P-238 Arno Ruckelshausen, Hans-Peter Schwarz, Brigitte Theuvsen (Hrsg.) Informatik in der Land-, Forst- und Ernährungswirtschaft Referate der 35. GIL-Jahrestagung 23. – 24. Februar 2015, Geisenheim
P-239 Uwe Aßmann, Birgit Demuth, Thorsten Spitta, Georg Püschel, Ronny Kaiser (Hrsg.) Software Engineering & Management 2015 17.-20. März 2015, Dresden
P-240 Herbert Klenk, Hubert B. Keller, Erhard Plödereder, Peter Dencker (Hrsg.) Automotive – Safety & Security 2015 Sicherheit und Zuverlässigkeit für automobile Informationstechnik 21.–22. April 2015, Stuttgart
P-241 Thomas Seidl, Norbert Ritter, Harald Schöning, Kai-Uwe Sattler, Theo Härder, Steffen Friedrich, Wolfram Wingerath (Hrsg.) Datenbanksysteme für Business, Technologie und Web (BTW 2015) 04. – 06. März 2015, Hamburg
P-242 Norbert Ritter, Andreas Henrich, Wolfgang Lehner, Andreas Thor, Steffen Friedrich, Wolfram Wingerath (Hrsg.) Datenbanksysteme für Business, Technologie und Web (BTW 2015) – Workshopband 02. – 03. März 2015, Hamburg
P-243 Paul Müller, Bernhard Neumair, Helmut Reiser, Gabi Dreo Rodosek (Hrsg.)
8. DFN-Forum Kommunikationstechnologien 06.–09. Juni 2015, Lübeck
3025594_GI_P_244_Bände.indd 158 28.05.15 08:45

P-244 Alfred Zimmermann, Alexander Rossmann (Eds.) Digital Enterprise Computing (DEC 2015) Böblingen, Germany June 25-26, 2015
The titles can be purchased at:
Köllen Druck + Verlag GmbHErnst-Robert-Curtius-Str. 14 · D-53117 BonnFax: +49 (0)228/9898222E-Mail: [email protected]
3025594_GI_P_244_Bände.indd 159 28.05.15 08:45

3025594_GI_P_244_Bände.indd 160 28.05.15 08:45


![[Acronym] Proceedings - UFG](https://static.fdokumen.com/doc/165x107/631430486ebca169bd0abf4b/acronym-proceedings-ufg.jpg)