GI-Edition Proceedings - EMIS
409
GI-Edition Lecture Notes in Informatics Jürgen Münch, Peter Liggesmeyer (Hrsg.) Software Engineering 2009 - Workshopband 02.–06. März 2009 Kaiserslautern Jürgen Münch, Peter Liggesmeyer (Hrsg.): Software Engineering 2009 Proceedings Gesellschaft für Informatik (GI) publishes this series in order to make available to a broad public recent findings in informatics (i.e. computer science and informa- tion systems), to document conferences that are organized in co- operation with GI and to publish the annual GI Award dissertation. Broken down into the fields of • Seminar • Proceedings • Dissertations • Thematics current topics are dealt with from the fields of research and development, teaching and further training in theory and practice. The Editorial Committee uses an intensive review process in order to ensure the high level of the contributions. The volumes are published in German or English. Information:http://www.gi-ev.de/service/publikationen/lni/ This volume contains papers from the workshops of the Software Engineering 2009 conference held in Kaiserslautern from 2 to 6 March 2009.The topics covered in the papers range from requirements engineering, software architecture, model driven development, human computer interaction and visualization to reports dis- cussing distributed development and enterprise architecture management tech- nologies. 150 ISSN 1617-5468 ISBN 978-3-88579-244-4
-
Upload
khangminh22 -
Category
Documents
-
view
0 -
download
0
Transcript of GI-Edition Proceedings - EMIS

GI-EditionLecture Notesin Informatics
Jürgen Münch,Peter Liggesmeyer (Hrsg.)
Software Engineering2009 - Workshopband
02.–06. März 2009KaiserslauternJü
rgen
Mü
nch
,Pet
erLi
gges
mey
er(H
rsg.
):So
ftw
are
Engi
nee
rin
g20
09
Proceedings
Gesellschaft für Informatik (GI)
publishes this series in order to make available to a broad publicrecent findings in informatics (i.e. computer science and informa-tion systems), to document conferences that are organized in co-operation with GI and to publish the annual GI Award dissertation.
Broken down into the fields of• Seminar• Proceedings• Dissertations• Thematicscurrent topics are dealt with from the fields of research anddevelopment, teaching and further training in theory and practice.The Editorial Committee uses an intensive review process in orderto ensure the high level of the contributions.
The volumes are published in German or English.
Information: http://www.gi-ev.de/service/publikationen/lni/
This volume contains papers from the workshops of the Software Engineering2009 conference held in Kaiserslautern from 2 to 6 March 2009.The topics coveredin the papers range from requirements engineering,software architecture,modeldriven development,human computer interaction and visualization to reports dis-cussing distributed development and enterprise architecture management tech-nologies.
150
ISSN 1617-5468ISBN 978-3-88579-244-4


Jürgen Münch, Peter Liggesmeyer(Hrsg.)
Software Engineering 2009−
Workshopband
Fachtagung des GI-Fachbereichs Softwaretechnik
02.-06.03.2009in Kaiserslautern
Gesellschaft für Informatik e.V. (GI)
Lecture Notes in Informatics (LNI) - ProceedingsSeries of the Gesellschaft für Informatik (GI)
Volume P-150
ISBN 978-3-88579-244-4ISSN 1617-5468
Volume EditorsDr. Jürgen MünchFraunhofer-Institut für Experimentelles Software EngineeringFraunhofer-Platz 167663 Kaiserslautern, GermanyEmail: [email protected]
Prof. Dr.-Ing. Peter LiggesmeyerTU Kaiserslautern undFraunhofer-Institut für Experimentelles Software EngineeringFraunhofer-Platz 167663 Kaiserslautern, GermanyEmail: [email protected]
Series Editorial BoardHeinrich C. Mayr, Universität Klagenfurt, Austria (Chairman, [email protected])Hinrich Bonin, Leuphana-Universität Lüneburg, GermanyDieter Fellner, Technische Universität Darmstadt, GermanyUlrich Flegel, SAP Research, GermanyUlrich Frank, Universität Duisburg-Essen, GermanyJohann-Christoph Freytag, Humboldt-Universität Berlin, GermanyUlrich Furbach, Universität Koblenz, GermanyMichael Goedicke, Universität Duisburg-EssenRalf Hofestädt, Universität BielefeldMichael Koch, Universität der Bundeswehr, München, GermanyAxel Lehmann, Universität der Bundeswehr München, GermanyErnst W. Mayr, Technische Universität München, GermanySigrid Schubert, Universität Siegen, GermanyMartin Warnke, Leuphana-Universität Lüneburg, Germany
DissertationsDorothea Wagner, Universität Karlsruhe, GermanySeminarsReinhard Wilhelm, Universität des Saarlandes, GermanyThematicsAndreas Oberweis, Universität Karlsruhe (TH)
Gesellschaft für Informatik, Bonn 2009printed by Köllen Druck+Verlag GmbH, Bonn
Vorwort
Die Tagung „Software Engineering 2009“ (SE 2009) wurde vom 2. bis 6. März 2009 alsfünfte Veranstaltung einer inzwischen etablierten Reihe von Fachtagungen durchgeführt,deren Ziel die Zusammenführung und Stärkung der deutschsprachigen Softwaretechnikist. Die SE 2009 bot ein Forum zum intensiven Austausch über praktische Erfahrungen,wissenschaftliche Erkenntnisse sowie zukünftige Herausforderungen bei der Entwick-lung von Softwareprodukten bzw. software-intensiven Systemen. Sie richtete sich glei-chermaßen an Teilnehmer aus Industrie und Wissenschaft.
Die Software-Engineering-Tagungsreihe wird vom Fachbereich Softwaretechnik derGesellschaft für Informatik e.V. getragen. Die SE 2009 wurde vom Lehrstuhl SoftwareEngineering: Dependability der Technischen Universität Kaiserslautern und dem Fraun-hofer-Institut für Experimentelles Software Engineering (IESE) veranstaltet.
Ein wichtiger Bestandteil der SE 2009 waren acht Workshops zu innovativen und praxis-relevanten Themen im Software Engineering, die auf großes Interesse gestoßen sind. DieWorkshops deckten thematisch den Software-Lebenszyklus vom Requirements Enginee-ring und der Softwarearchitektur bis hin zu modernen modellgetriebenen Entwicklungs-ansätzen umfassend ab. Hinzu kamen Workshops zu innovativen Themen in den Berei-chen Qualitätsmanagement, Human-Computer Interaction und Visualisierung, sozialeSoftware, verteilte Entwicklung und Enterprise Architecture Management.
Der vorliegende Workshopband wurde im Anschluss an die Tagung erstellt, sodass Au-toren die Möglichkeit hatten, Anregungen aus Diskussionen aus den Workshops aufzu-nehmen. Er umfasst alle Workshops mit Ausnahme des Workshops SQMB, der separateProceedings vorlegt. Die Proceedings der Workshops SofTEAM und SENSE werden indiesem Workshopband unter dem Titel „Social Aspects in Software Engineering“ zu-sammengeführt, da beide Workshops zusammen durchgeführt wurden.
Unser Dank geht an die Organisatoren der einzelnen Workshops für ihr besonderes En-gagement sowie an Henning Barthel, der die Zusammenstellung der Beiträge für diesenBand übernommen hat. Darüber hinaus danken wir dem Organisationsteam für die Un-terstützung bei der Planung und Durchführung der Workshops.
Wir wünschen Ihnen viele neue Einsichten und Erkenntnisse bei der Lektüre des vorlie-genden Workshopbandes!
Jürgen Münch, Leitung Workshops und Tutorials
Peter Liggesmeyer, Tagungsleitung
Kaiserslautern, im April 2009

TagungsleitungPeter Liggesmeyer, TU Kaiserslautern, Fraunhofer IESE
Leitung IndustrietagGregor Engels, Universität Paderborn
Leitung Workshops und TutorialsJürgen Münch, Fraunhofer IESE
TagungsorganisationJörg Dörr, Fraunhofer IESENorman Riegel, Fraunhofer IESESimone Rockenmeyer, Fraunhofer IESE
ProgrammkomiteeKlaus Beetz, Siemens AGManfred Broy, Technische Universität MünchenBernd Brügge, Technische Universität MünchenJürgen Ebert, Universität Koblenz-LandauGregor Engels, Universität PaderbornMichael Goedicke, Universität Duisburg-EssenKlaus Grimm, Daimler AGVolker Gruhn, Universität LeipzigWilhelm Hasselbring, Christian-Albrechts-Universität zu KielLutz Heuser, SAP AGStefan Jähnichen, Technische Universität BerlinMatthias Jarke, RWTH AachenUdo Kelter, Universität SiegenClaus Lewerentz, Brandenburgische Technische Universität CottbusHorst Lichter, RWTH AachenOliver Mäckel, Siemens AGFlorian Matthes, Technische Universität MünchenManfred Nagl, RWTH AachenBarbara Paech, Universität HeidelbergKlaus Pohl, Universität Duisburg-EssenRalf Reussner, Universität Karlsruhe (TH)Eric Sax, MBtech GroupWilhelm Schäfer, Universität PaderbornAndy Schürr, Technische Universität DarmstadtWalter Tichy, Universität Karlsruhe (TH)Markus Voß, Capgemini sd&m AGMario Winter, Fachhochschule KölnAndreas Zeller, Universität des SaarlandesHeinz Züllighoven, Universität HamburgAlbert Zündorf, Universität Kassel

Offizieller VeranstalterFachbereich Softwaretechnik der Gesellschaft für Informatik (GI)
MitveranstalterFraunhofer-Institut für Experimentelles Software EngineeringTechnische Universität Kaiserslautern
Unterstützt wird die Tagung zudem von:Schweizer Informatik Gesellschaft (SI)Österreichische Computer Gesellschaft (OCG)


Inhaltsverzeichnis
Patterns in Enterprise Architecture Management (PEAM)
Patterns in Enterprise Architecture Management (PEAM 2009)Florian Matthes, Alexander Ernst ................................................................................ 17
Some Process Patterns for Enterprise Architecture ManagementChristoph Moser, Stefan Junginger, Matthias Brückmann,Klaus-Manfred Schöne ................................................................................................ 19
Enterprise Architecture Patterns for Multichannel ManagementMarc M. Lankhorst, Paul H.W.M. Oude Luttighuis...................................................... 31
An Enterprise Architecture Management Pattern for Software Change Project Cost AnalysisRobert Lagerström, Pontus Johnson, David Höök ...................................................... 43
Patterns for Enterprise-wide SOABorjan Cace.................................................................................................................. 55
EA Management Patterns for Consolidations after MergersSabine Buckl, Alexander Ernst, Harald Kopper, Rolf Marliani,Florian Matthes, Peter Petschownik, Christian M. Schweda ...................................... 67
EA Management Patterns for Smart NetworksArmin Lau, Thomas Fischer, Michael Weiß, Sabine Buckl,Alexander Ernst, Florian Matthes, Christian M. Schweda .......................................... 79
Produkt-Variabilität im gesamten Lebenszyklus (PVLZ)
Produkt-Variabilität im gesamten Lebenszyklus (PVLZ2009)Klaus Marquardt, Dietmar Schütz, Markus Völter ...................................................... 93
Ansatz für ein durchgängiges Variantenmanagement in der automobilenSteuergeräteentwicklungChristian Bimmermann ................................................................................................ 97
Feature Dependencies have to be Managed Throughout the Whole Product Life-cycleGoetz Botterweck, Kwanwoo Lee ................................................................................ 101
Eine Infrastruktur für modellgetriebene hierarchische ProduktlinienChristoph Elsner, Daniel Lohmann, Christa Schwanninger ........................................ 107
Modellgetriebenes Softwareengineering – Der Beginn industrieller Softwareproduktion?Wolfgang Goerigk, Thomas Stahl ................................................................................ 115
Variabilität als eine eigenständige Sicht auf ProduktlinienKim Lauenroth, Klaus Pohl .......................................................................................... 119
Ein Klassifikationsansatz zur Variabilitätsmodellierung in E/E-EntwicklungsprozessenCem Mengi, Ibrahim Armaç ........................................................................................ 125
Architekturgetriebenes Pairwise-Testing für Software ProduktlinienSebastian Oster, Andy Schürr ...................................................................................... 131
Konsistente Evolution von lebenszyklusübergreifenden VariabilitätsmodellenKlaus Schmid................................................................................................................ 135
Human-Computer Interaction und Visualisierung – Bedeutung und Anwendung im Software Engineering (HCIV)
Human-Computer Interaction and Visualization (HCIV2009)Achim Ebert, Peter Dannenmann ................................................................................ 143
Novel Visual Representations for Software Metrics Using 3D and AnimationAndreas Kerren, Ilir Jusufi .......................................................................................... 147
The Role of Visualization in the Naturalization of Remote Software ImmigrantsAzam Khan, Justin Matejka, Steve Easterbrook .......................................................... 155
Visual Debugger for Single-Point-Contact Haptic RenderingChristoph Fünfzig, Kerstin Müller, Gudrun Albrecht .................................................. 161
Applications of Visualization Technology in Robotics Software DevelopmentMax Reichardt, Lisa Wilhelm, Martin Proetzsch, Karsten Berns ................................ 167
Network Situational Awareness: A Representative StudyThomas Eskridge, David Lecoutre, Matt Johnson, Jeffrey M. Bradshaw .................... 175
User Centered Design Patterns for VisualizationGerrit van der Veer, Elbert-Jan Hennipman, Evert-Jan Oppelaar .............................. 183
Requirements Engineering und Business Process Management – Konvergenz, Synonym oder doch so wie gehabt? (REBPM)
Workshop Requirements Engineering und Business Process Management – REBPM 2009Daniel Lübke, Sebastian Adam, Sebastian Stein, Jörg Dörr, Kurt Schneider .............. 193
Einfluss dienstebasierter Architekturen auf das Requirements Engineering – Anforderungen und AnwendungsfallBeate van Kempen, Frank Hogrebe, Wilfried Kruse .................................................... 195
Requirements Engineering und Geschäftsprozessmodellierung – zwei Seiten der gleichen MedailleHeinz Ehrsam, Ralf Fahney, Kurt McKeown................................................................ 205
Bridging Requirements Engineering and Business Process ManagementKen Decreus, M. El Kharbili, Geert Poels, Elke Pulvermueller .................................. 215
Qualität von Geschäftsprozessen und Unternehmenssoftware – Eine ThesensammlungBarbara Paech, Andreas Oberweis, Ralf Reussner ...................................................... 223
Verzahnung von Requirements Engineering und GeschäftsprozessdesignMatthias Weidlich, Alexander Grosskopf, Daniel Lübke, Kurt Schneider,Eric Knauss, Leif Singer .............................................................................................. 229
Social Aspects in Software Engineering (SENSE, SofTEAM)
Social Aspects in Software EngineeringAnna Hannemann, Hans-Jörg Happel, Matthias Jarke, Ralf Klamma,Steffen Lohmann, Walid Maalej, Volker Wulf ................................................................ 239
Supporting Software Development Teams with a Semantic Process- and Artifact-oriented Collaboration EnvironmentSebastian Weber, Andreas Emrich, Jörg Broschart, Eric Ras, Özgür Ünalan.............. 243
Enabling Social Network Analysis in Distributed Collaborative Software DevelopmentTommi Kramer, Tobias Hildenbrand, Thomas Acker .................................................... 255
Playful Cleverness revisited: open-source game development as a method for teaching software engineeringKaido Kikkas, Mart Laanpere ...................................................................................... 267
Web 2.0 artifacts in SME-networks – A qualitative approach towards an integrative conceptualization considering organizational and technical perspectivesNadine Blinn, Nadine Lindermann, Katrin Fäcks, Markus Nüttgens .......................... 273
Investigating the Suitability of Web X.Y Features for Software Engineering – Towards an Empirical SurveyEric Ras, Jörg Rech, Sebastian Weber.......................................................................... 285
A method for identifying unobvious requirements in globally distributed software projectsSmita Ghaisas .............................................................................................................. 297
A Web Platform for Social Requirements EngineeringSteffen Lohmann, Sebastian Dietzold, Philipp Heim, Norman Heino.......................... 309
Community Driven Elicitation of Requirements with Entertaining Social SoftwareAnna Hannemann, Christian Hocken, Ralf Klamma .................................................. 317
Communication is the key – Support Durable Knowledge Sharing in SoftwareEngineering by MicrobloggingWolfgang Reinhardt ...................................................................................................... 329
Improving Knowledge Sharing in Distributed Teams by Capturing and Recommending Informal KnowledgeHans-Jörg Happel, Walid Maalej ................................................................................ 341
Annals of Knowledge Sharing in Distributed Software Development Environments: Experience from Open Source Software ProjectsSulayman K. Sowe, Rishab Ghosh, and Luc Soete ...................................................... 347
Modellgetriebene Softwarearchitektur – Evolution,Integration und Migration (MSEIM)
Workshop Modellgetriebene Softwarearchitektur – Evolution, Integration und Migration (MSEIM2009)Michael Goedicke, Maritta Heisel, Sascha Hunold, Stefan Kühne,Matthias Riebisch, Niels Streekmann .......................................................................... 363
Anwendung von grafischen Validierungsregeln bei der Entwicklung von IT-IntegrationsprozessenJens Drawehn, Sven Feja.............................................................................................. 367
Berechnung von Modelldifferenzen als Basis für die Evolution von ProzessmodellenStanley Hillner, Heiko Kern, Stefan Kühne .................................................................. 375
Deriving Software Architectures from Problem DescriptionsDenis Hatebur, Maritta Heisel .................................................................................... 383
Softwaremodernisierung durch werkzeugunterstütztes Verschieben von CodeblöckenMarvin Ferber, Sascha Hunold, Thomas Rauber, Björn Krellner,Thomas Reichel, Gudula Rünger.................................................................................. 393
Patterns in Enterprise ArchitectureManagement
(PEAM)
Inhaltsverzeichnis
Patterns in Enterprise Architecture Management (PEAM 2009)Florian Matthes, Alexander Ernst ................................................................................ 17
Some Process Patterns for Enterprise Architecture ManagementChristoph Moser, Stefan Junginger, Matthias Brückmann,Klaus-Manfred Schöne ................................................................................................ 19
Enterprise Architecture Patterns for Multichannel ManagementMarc M. Lankhorst, Paul H.W.M. Oude Luttighuis...................................................... 31
An Enterprise Architecture Management Pattern for Software Change Project Cost AnalysisRobert Lagerström, Pontus Johnson, David Höök ...................................................... 43
Patterns for Enterprise-wide SOABorjan Cace.................................................................................................................. 55
EA Management Patterns for Consolidations after MergersSabine Buckl, Alexander Ernst, Harald Kopper, Rolf Marliani,Florian Matthes, Peter Petschownik, Christian M. Schweda ...................................... 67
EA Management Patterns for Smart NetworksArmin Lau, Thomas Fischer, Michael Weiß, Sabine Buckl,Alexander Ernst, Florian Matthes, Christian M. Schweda .......................................... 79
Patterns in Enterprise Architecture Management(PEAM 2009)
Florian Matthes, Alexander Ernst
Technische Universität München{matthes,ernst}@in.tum.de
There is a growing interest in academia and industry to identify, collect, document andexchange best practices in the management of very large software application landscapesin a structured manner. This workshop addresses European researchers and practitionerswith experience in enterprise architecture management topics. The goal of the workshopis to improve this knowledge exchange by using an integrating pattern-based approach.An enterprise architecture management pattern (EAM pattern) is a general, reusablesolution to a common problem in a given context which identifies driving forces, knownusages and consequences. It can be specified on different levels of abstraction and detail,e.g. as a framework for enterprise architectures, as a method for enterprise modeling, oras a reference model. EAM patterns address social, technical and economic issues in abalanced manner.
17

Some Process Patterns for Enterprise ArchitectureManagement
Christoph Moser1, Stefan Junginger1, Matthias Brückmann2, Klaus-Manfred Schöne2
1BOC AGWipplingerstraße 1
A-1010 Vienna{christoph.moser,stefan.junginger}@boc-group.com
2ZIVITWilhelm-Fay-Straße 11
D-65936 Frankfurt{matthias.brueckmann,klaus-manfred.schoene}@zivit.de
Abstract: The purpose of EAM patterns can be seen to supplement existing EAMframeworks, which often only provide generic approaches in implementing,maintaining, and analysing an Enterprise Architecture. This is done by providingadditional concepts, tailorable to the EAM problems at hand. This paper extendsthe existing EAM patterns approach of the Technical University of Munich bydefining a concept for EAM process patterns. Some EAM process patterns arepresented in detail.
1. Introduction
Numerous frameworks for EAM are discussed in literature (for an overview see forexample [Sc06]). Some of them are extremely complex regarding the number ofconcepts they consider. On the other hand, practitioners stress that only pragmatic andnot too complex EAM approaches lead to a successful implementation within anorganisation [Ke07]. This conforms to the experiences of the authors of this paper – twoof us are with BOC, a company providing EAM solutions (ADOit, ADOben) and EAMconsulting and two of us are enterprise architects at ZIVIT, one of the largest IT ServiceProviders in Germany's public administration.
We see EAM patterns as a powerful tool for implementing EAM within an organisation,especially for enhancing efficiency with the purpose of saving money and time. In thefollowing we use the concepts presented in the EAM pattern catalogue of the TechnicalUniversity of Munich, Germany [Bu08]. An important feature of the tool (ADOit) weuse is its metamodelling capability [BO08]. Most ADOit users define their own EAMmetamodel. These metamodels are derived from their EAM objectives and usuallyconsist of only a few concepts (in contrast to complex metamodels described in manyEAM frameworks).
19
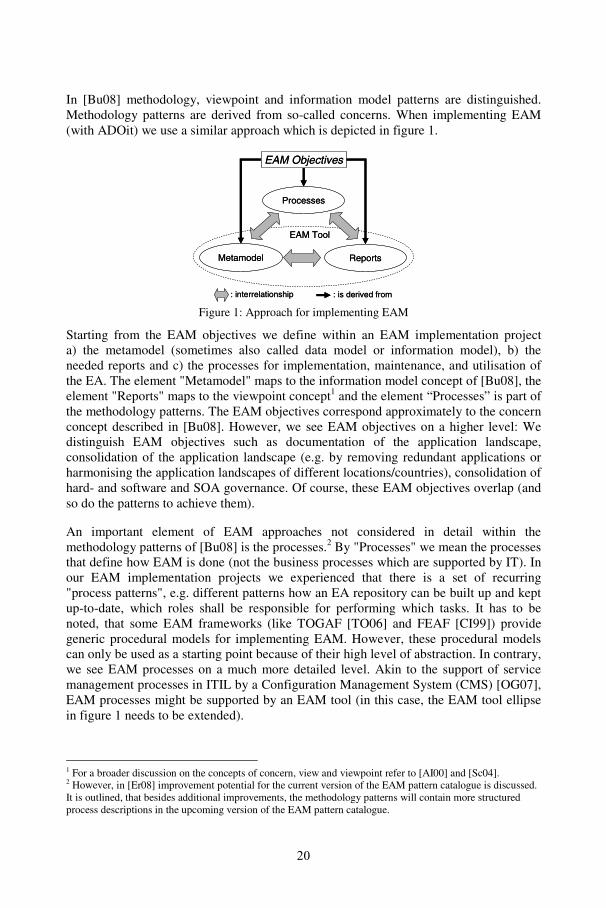
In [Bu08] methodology, viewpoint and information model patterns are distinguished.Methodology patterns are derived from so-called concerns. When implementing EAM(with ADOit) we use a similar approach which is depicted in figure 1.
Processes
EAM Tool
EAM Objectives
Metamodel Reports
: interrelationship : is derived from
Processes
EAM Tool
EAM Objectives
Metamodel Reports
: interrelationship : is derived from
Figure 1: Approach for implementing EAM
Starting from the EAM objectives we define within an EAM implementation projecta) the metamodel (sometimes also called data model or information model), b) theneeded reports and c) the processes for implementation, maintenance, and utilisation ofthe EA. The element "Metamodel" maps to the information model concept of [Bu08], theelement "Reports" maps to the viewpoint concept1 and the element “Processes” is part ofthe methodology patterns. The EAM objectives correspond approximately to the concernconcept described in [Bu08]. However, we see EAM objectives on a higher level: Wedistinguish EAM objectives such as documentation of the application landscape,consolidation of the application landscape (e.g. by removing redundant applications orharmonising the application landscapes of different locations/countries), consolidation ofhard- and software and SOA governance. Of course, these EAM objectives overlap (andso do the patterns to achieve them).
An important element of EAM approaches not considered in detail within themethodology patterns of [Bu08] is the processes.2 By "Processes" we mean the processesthat define how EAM is done (not the business processes which are supported by IT). Inour EAM implementation projects we experienced that there is a set of recurring"process patterns", e.g. different patterns how an EA repository can be built up and keptup-to-date, which roles shall be responsible for performing which tasks. It has to benoted, that some EAM frameworks (like TOGAF [TO06] and FEAF [CI99]) providegeneric procedural models for implementing EAM. However, these procedural modelscan only be used as a starting point because of their high level of abstraction. In contrary,we see EAM processes on a much more detailed level. Akin to the support of servicemanagement processes in ITIL by a Configuration Management System (CMS) [OG07],EAM processes might be supported by an EAM tool (in this case, the EAM tool ellipsein figure 1 needs to be extended).
1 For a broader discussion on the concepts of concern, view and viewpoint refer to [AI00] and [Sc04].2 However, in [Er08] improvement potential for the current version of the EAM pattern catalogue is discussed.It is outlined, that besides additional improvements, the methodology patterns will contain more structuredprocess descriptions in the upcoming version of the EAM pattern catalogue.
20
The remainder of the paper is organised as follows. In chapter 2 EAM processes arediscussed, a definition of EAM process patterns is given and the pattern language we useto describe EAM process patterns is presented. Chapter 3 presents concrete EAMprocess patterns. The interplay and usage of these patterns is discussed, by integratingthese with EA metamodels and EA reporting patterns. Finally, chapter 4 gives anoutlook on future research fields. To illustrate the concepts presented in this paper werefer to the EAM implementation at ZIVIT. Details about this implementation can befound in [Ju08].
2. A Pattern Form for EAM Process Patterns
There is not much literature about EAM processes (in comparison to publications aboutEAM modelling frameworks). Of course, the EAM processes needed depend on theEAM objectives. If, for example, the EAM objective is to standardise soft- and hardwarea process is needed on how this standardisation should take place. Additionally, it has tobe decided which processes are seen as part of EAM as it possesses – and of course hasto possess – a tight integration with disciplines such as business process management,strategy management, (IT) service management, demand management, (project)portfolio management, requirements management, software development, risk andcompliance management. Hence, some organisations see demand and portfoliomanagement as part of EAM and others do not.
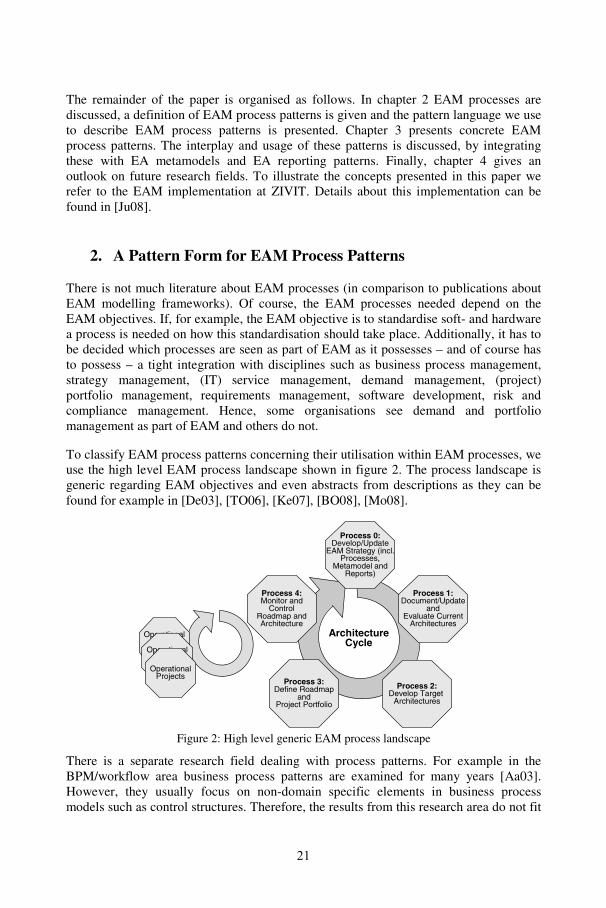
To classify EAM process patterns concerning their utilisation within EAM processes, weuse the high level EAM process landscape shown in figure 2. The process landscape isgeneric regarding EAM objectives and even abstracts from descriptions as they can befound for example in [De03], [TO06], [Ke07], [BO08], [Mo08].
ArchitectureCycle
Process 4:Monitor and
ControlRoadmap andArchitecture
Process 0:Develop/Update
EAM Strategy (incl.Processes,
Metamodel andReports)
Process 1:Document/Update
andEvaluate Current
Architectures
Process 2:Develop Target
Architectures
Process 3:Define Roadmap
andProject Portfolio
OperationalEAM /
ProjectsOperationalEAM /
ProjectsOperationalProjects
Figure 2: High level generic EAM process landscape
There is a separate research field dealing with process patterns. For example in theBPM/workflow area business process patterns are examined for many years [Aa03].However, they usually focus on non-domain specific elements in business processmodels such as control structures. Therefore, the results from this research area do not fit
21
to our intention of EAM process patterns. In the software engineering community thereare many publications about process patterns for the software development process[Co95]. Furthermore, concepts described in CMMI and ITIL can be seen as processpatterns, too – although not described this way [OG07], [CM06]. ITIL states forexample, that the main purpose of its CMS is the provision of up-to-date and secureinformation via the configuration items used to support all service managementdisciplines [OG07]. Hence, there is a major overlap with process patterns for keeping anEA repository up-to-date ("Process 1" in figure 2). The concepts developed in thesefields fit better to our objectives – just the application area is different (EAM vs.software development/IT service management). We define an EAM process pattern as a"reusable element of an EAM process (model)". Usually, an EAM process pattern isparameterised in the sense that exact activities and roles executing the activities aredefined when applying the pattern.
We describe EAM process patterns using the following "pattern form":
• Name: Concise, strong name for the pattern.
• Summary: Short description of the process pattern.
• EAM process: Description in which EAM process this pattern can be used. Forthis purpose we classify the patterns according to the process landscape shownin figure 2.
• Problem: Indication of the situation to which the pattern applies, and ifapplicable the entry conditions to perform it.
• Solution: Description of the process pattern including the steps/activities to beperformed. We use BPMN to illustrate the patterns.
• Resulting Context: Description of the situation/context which will result fromperforming the process pattern solution.
• Related Patterns: Indication of patterns that this pattern is composed of, is apart of, or is associated to. To describe the associations to metamodel(information model) and reports (viewpoints), we refer exemplarily to EAMpatterns described in [Bu08].
• Known Uses/Examples: Description where/how the process pattern has beenapplied.
3. EAM Process Patterns: Some Examples
This chapter identifies an extensible set of reoccurring patterns in EA processes andshows the best use practices for them. The patterns are derived from the practicalexperience of the authors in EAM and literature.
22
3.1 Pattern: Centralised Manual Data Acquisition/Maintenance
Summary: Architecture artefacts of a certain type (class) are maintained in the EArepository by a central role, usually the enterprise architects.
EAM Process: Process 1.
Problem: This process pattern can be applied if the EA repository shall be filled orupdated.
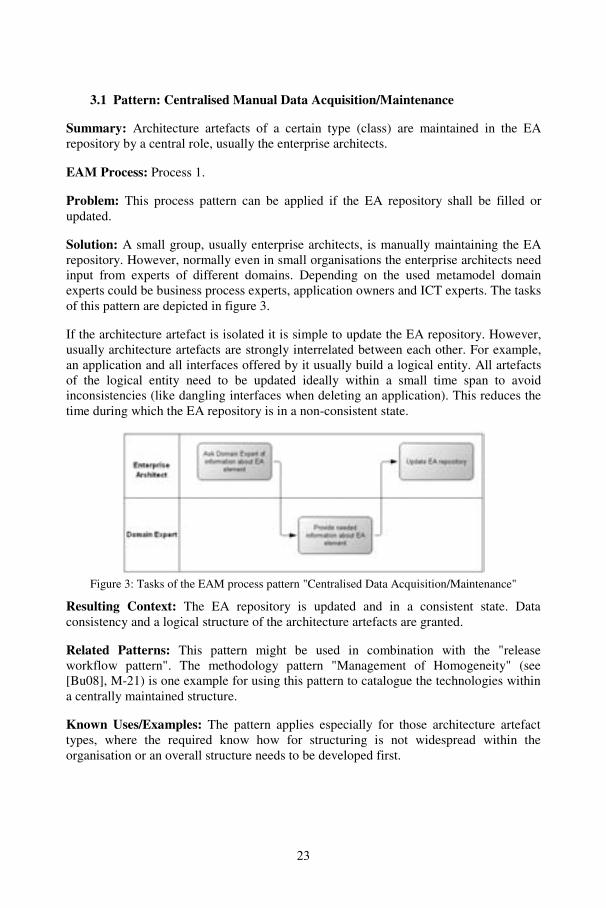
Solution: A small group, usually enterprise architects, is manually maintaining the EArepository. However, normally even in small organisations the enterprise architects needinput from experts of different domains. Depending on the used metamodel domainexperts could be business process experts, application owners and ICT experts. The tasksof this pattern are depicted in figure 3.
If the architecture artefact is isolated it is simple to update the EA repository. However,usually architecture artefacts are strongly interrelated between each other. For example,an application and all interfaces offered by it usually build a logical entity. All artefactsof the logical entity need to be updated ideally within a small time span to avoidinconsistencies (like dangling interfaces when deleting an application). This reduces thetime during which the EA repository is in a non-consistent state.
Figure 3: Tasks of the EAM process pattern "Centralised Data Acquisition/Maintenance"
Resulting Context: The EA repository is updated and in a consistent state. Dataconsistency and a logical structure of the architecture artefacts are granted.
Related Patterns: This pattern might be used in combination with the "releaseworkflow pattern". The methodology pattern "Management of Homogeneity" (see[Bu08], M-21) is one example for using this pattern to catalogue the technologies withina centrally maintained structure.
Known Uses/Examples: The pattern applies especially for those architecture artefacttypes, where the required know how for structuring is not widespread within theorganisation or an overall structure needs to be developed first.
23
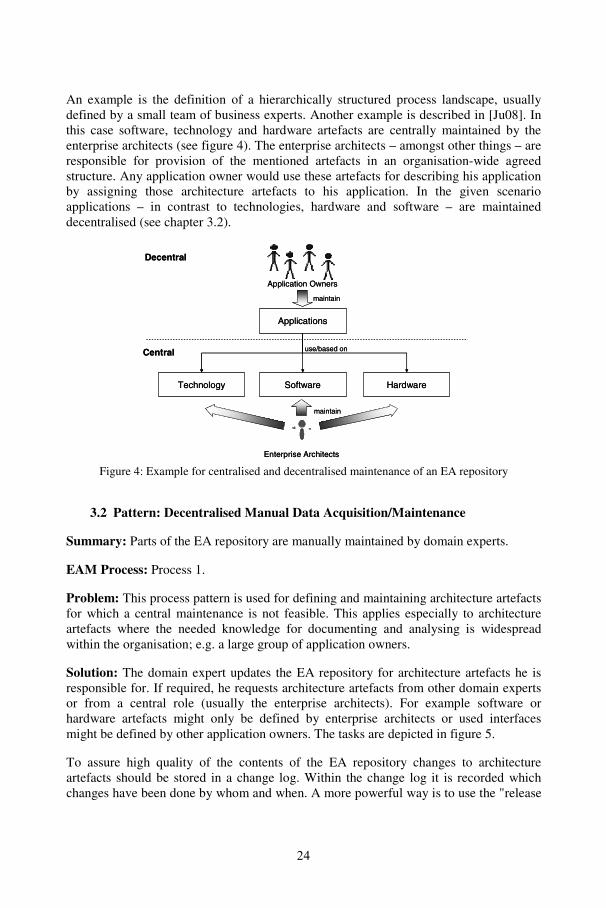
An example is the definition of a hierarchically structured process landscape, usuallydefined by a small team of business experts. Another example is described in [Ju08]. Inthis case software, technology and hardware artefacts are centrally maintained by theenterprise architects (see figure 4). The enterprise architects – amongst other things – areresponsible for provision of the mentioned artefacts in an organisation-wide agreedstructure. Any application owner would use these artefacts for describing his applicationby assigning those architecture artefacts to his application. In the given scenarioapplications – in contrast to technologies, hardware and software – are maintaineddecentralised (see chapter 3.2).
Applications
SoftwareTechnology Hardware
use/based on
Decentral
Central
Application Owners
maintain
Enterprise Architects
maintain
Applications
SoftwareTechnology Hardware
use/based on
Decentral
Central
Application Owners
maintain
Enterprise Architects
maintain
Figure 4: Example for centralised and decentralised maintenance of an EA repository
3.2 Pattern: Decentralised Manual Data Acquisition/Maintenance
Summary: Parts of the EA repository are manually maintained by domain experts.
EAM Process: Process 1.
Problem: This process pattern is used for defining and maintaining architecture artefactsfor which a central maintenance is not feasible. This applies especially to architectureartefacts where the needed knowledge for documenting and analysing is widespreadwithin the organisation; e.g. a large group of application owners.
Solution: The domain expert updates the EA repository for architecture artefacts he isresponsible for. If required, he requests architecture artefacts from other domain expertsor from a central role (usually the enterprise architects). For example software orhardware artefacts might only be defined by enterprise architects or used interfacesmight be defined by other application owners. The tasks are depicted in figure 5.
To assure high quality of the contents of the EA repository changes to architectureartefacts should be stored in a change log. Within the change log it is recorded whichchanges have been done by whom and when. A more powerful way is to use the "release
24
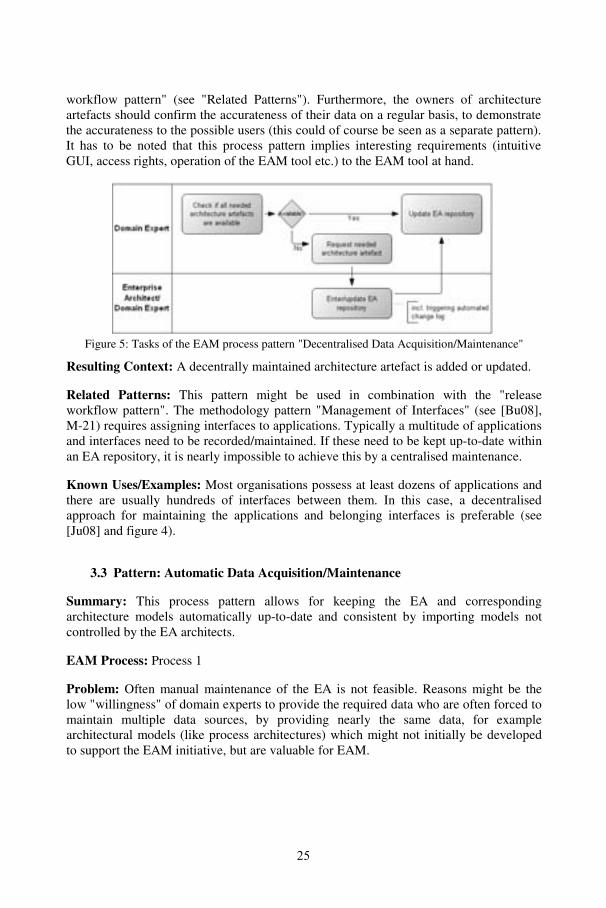
workflow pattern" (see "Related Patterns"). Furthermore, the owners of architectureartefacts should confirm the accurateness of their data on a regular basis, to demonstratethe accurateness to the possible users (this could of course be seen as a separate pattern).It has to be noted that this process pattern implies interesting requirements (intuitiveGUI, access rights, operation of the EAM tool etc.) to the EAM tool at hand.
Figure 5: Tasks of the EAM process pattern "Decentralised Data Acquisition/Maintenance"
Resulting Context: A decentrally maintained architecture artefact is added or updated.
Related Patterns: This pattern might be used in combination with the "releaseworkflow pattern". The methodology pattern "Management of Interfaces" (see [Bu08],M-21) requires assigning interfaces to applications. Typically a multitude of applicationsand interfaces need to be recorded/maintained. If these need to be kept up-to-date withinan EA repository, it is nearly impossible to achieve this by a centralised maintenance.
Known Uses/Examples: Most organisations possess at least dozens of applications andthere are usually hundreds of interfaces between them. In this case, a decentralisedapproach for maintaining the applications and belonging interfaces is preferable (see[Ju08] and figure 4).
3.3 Pattern: Automatic Data Acquisition/Maintenance
Summary: This process pattern allows for keeping the EA and correspondingarchitecture models automatically up-to-date and consistent by importing models notcontrolled by the EA architects.
EAM Process: Process 1
Problem: Often manual maintenance of the EA is not feasible. Reasons might be thelow "willingness" of domain experts to provide the required data who are often forced tomaintain multiple data sources, by providing nearly the same data, for examplearchitectural models (like process architectures) which might not initially be developedto support the EAM initiative, but are valuable for EAM.
25
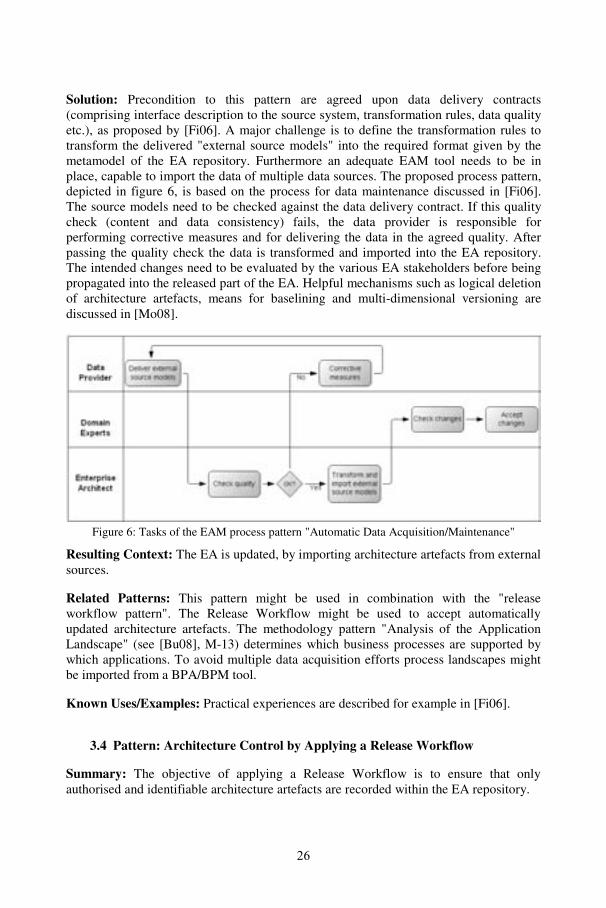
Solution: Precondition to this pattern are agreed upon data delivery contracts(comprising interface description to the source system, transformation rules, data qualityetc.), as proposed by [Fi06]. A major challenge is to define the transformation rules totransform the delivered "external source models" into the required format given by themetamodel of the EA repository. Furthermore an adequate EAM tool needs to be inplace, capable to import the data of multiple data sources. The proposed process pattern,depicted in figure 6, is based on the process for data maintenance discussed in [Fi06].The source models need to be checked against the data delivery contract. If this qualitycheck (content and data consistency) fails, the data provider is responsible forperforming corrective measures and for delivering the data in the agreed quality. Afterpassing the quality check the data is transformed and imported into the EA repository.The intended changes need to be evaluated by the various EA stakeholders before beingpropagated into the released part of the EA. Helpful mechanisms such as logical deletionof architecture artefacts, means for baselining and multi-dimensional versioning arediscussed in [Mo08].
Figure 6: Tasks of the EAM process pattern "Automatic Data Acquisition/Maintenance"
Resulting Context: The EA is updated, by importing architecture artefacts from externalsources.
Related Patterns: This pattern might be used in combination with the "releaseworkflow pattern". The Release Workflow might be used to accept automaticallyupdated architecture artefacts. The methodology pattern "Analysis of the ApplicationLandscape" (see [Bu08], M-13) determines which business processes are supported bywhich applications. To avoid multiple data acquisition efforts process landscapes mightbe imported from a BPA/BPM tool.
Known Uses/Examples: Practical experiences are described for example in [Fi06].
3.4 Pattern: Architecture Control by Applying a Release Workflow
Summary: The objective of applying a Release Workflow is to ensure that onlyauthorised and identifiable architecture artefacts are recorded within the EA repository.
26
EAM Process: Process 1, Process 2, Process 3, Process 4.
Problem: Especially if the "Decentralised Manual Data Acquisition/Maintenance" isapplied there is the danger that the data in the EA repository is not accurate. This processpattern tries to overcome this by allowing only authorised changes of architectureartefacts.
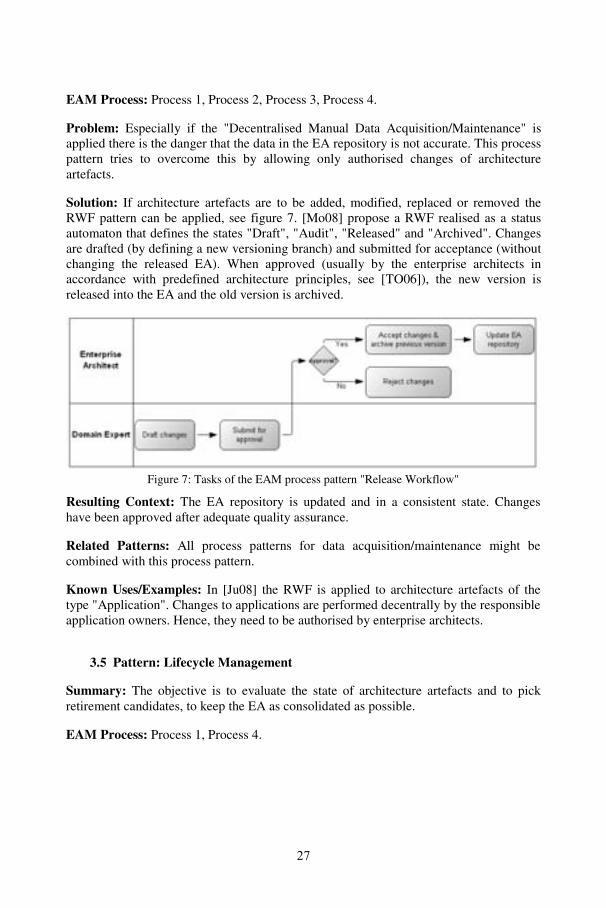
Solution: If architecture artefacts are to be added, modified, replaced or removed theRWF pattern can be applied, see figure 7. [Mo08] propose a RWF realised as a statusautomaton that defines the states "Draft", "Audit", "Released" and "Archived". Changesare drafted (by defining a new versioning branch) and submitted for acceptance (withoutchanging the released EA). When approved (usually by the enterprise architects inaccordance with predefined architecture principles, see [TO06]), the new version isreleased into the EA and the old version is archived.
Figure 7: Tasks of the EAM process pattern "Release Workflow"
Resulting Context: The EA repository is updated and in a consistent state. Changeshave been approved after adequate quality assurance.
Related Patterns: All process patterns for data acquisition/maintenance might becombined with this process pattern.
Known Uses/Examples: In [Ju08] the RWF is applied to architecture artefacts of thetype "Application". Changes to applications are performed decentrally by the responsibleapplication owners. Hence, they need to be authorised by enterprise architects.
3.5 Pattern: Lifecycle Management
Summary: The objective is to evaluate the state of architecture artefacts and to pickretirement candidates, to keep the EA as consolidated as possible.
EAM Process: Process 1, Process 4.
27
Problem: To control architecture artefacts efficiently during their entire lifespan, it isnecessary to assign lifecycle states to architecture artefacts. By assigning lifecycle statesto architecture artefacts stakeholders are guided in their architectural work. Planningactivities are supported and development of the EA in accordance with the technologyroadmap – comprising the agreed set of software, hardware and technologies to be used– of the organisation is possible.
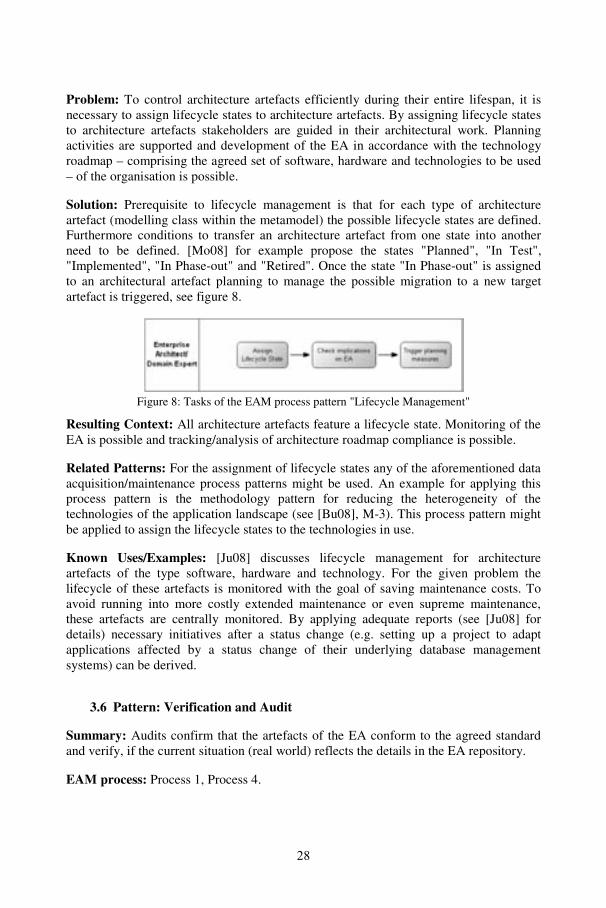
Solution: Prerequisite to lifecycle management is that for each type of architectureartefact (modelling class within the metamodel) the possible lifecycle states are defined.Furthermore conditions to transfer an architecture artefact from one state into anotherneed to be defined. [Mo08] for example propose the states "Planned", "In Test","Implemented", "In Phase-out" and "Retired". Once the state "In Phase-out" is assignedto an architectural artefact planning to manage the possible migration to a new targetartefact is triggered, see figure 8.
Figure 8: Tasks of the EAM process pattern "Lifecycle Management"
Resulting Context: All architecture artefacts feature a lifecycle state. Monitoring of theEA is possible and tracking/analysis of architecture roadmap compliance is possible.
Related Patterns: For the assignment of lifecycle states any of the aforementioned dataacquisition/maintenance process patterns might be used. An example for applying thisprocess pattern is the methodology pattern for reducing the heterogeneity of thetechnologies of the application landscape (see [Bu08], M-3). This process pattern mightbe applied to assign the lifecycle states to the technologies in use.
Known Uses/Examples: [Ju08] discusses lifecycle management for architectureartefacts of the type software, hardware and technology. For the given problem thelifecycle of these artefacts is monitored with the goal of saving maintenance costs. Toavoid running into more costly extended maintenance or even supreme maintenance,these artefacts are centrally monitored. By applying adequate reports (see [Ju08] fordetails) necessary initiatives after a status change (e.g. setting up a project to adaptapplications affected by a status change of their underlying database managementsystems) can be derived.
3.6 Pattern: Verification and Audit
Summary: Audits confirm that the artefacts of the EA conform to the agreed standardand verify, if the current situation (real world) reflects the details in the EA repository.
EAM process: Process 1, Process 4.
28
Problem: This pattern can be applied to ensure consistency and actuality of the EA. It isof major importance to assure that the EA repository, providing the basis for anyarchitectural work is up-to-date because otherwise planning deficiencies, caused byutilisation of inconsistent and outdated data might appear.
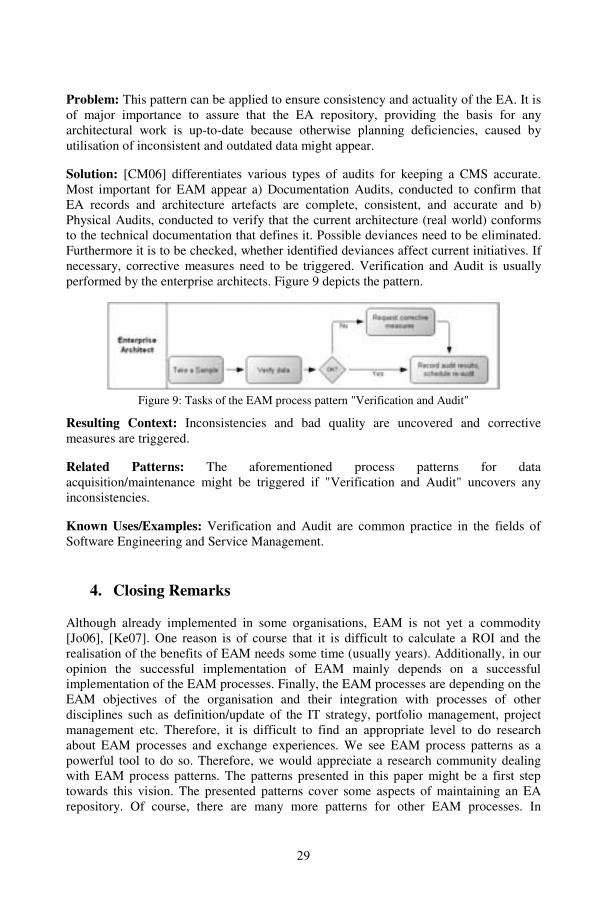
Solution: [CM06] differentiates various types of audits for keeping a CMS accurate.Most important for EAM appear a) Documentation Audits, conducted to confirm thatEA records and architecture artefacts are complete, consistent, and accurate and b)Physical Audits, conducted to verify that the current architecture (real world) conformsto the technical documentation that defines it. Possible deviances need to be eliminated.Furthermore it is to be checked, whether identified deviances affect current initiatives. Ifnecessary, corrective measures need to be triggered. Verification and Audit is usuallyperformed by the enterprise architects. Figure 9 depicts the pattern.
Figure 9: Tasks of the EAM process pattern "Verification and Audit"
Resulting Context: Inconsistencies and bad quality are uncovered and correctivemeasures are triggered.
Related Patterns: The aforementioned process patterns for dataacquisition/maintenance might be triggered if "Verification and Audit" uncovers anyinconsistencies.
Known Uses/Examples: Verification and Audit are common practice in the fields ofSoftware Engineering and Service Management.
4. Closing Remarks
Although already implemented in some organisations, EAM is not yet a commodity[Jo06], [Ke07]. One reason is of course that it is difficult to calculate a ROI and therealisation of the benefits of EAM needs some time (usually years). Additionally, in ouropinion the successful implementation of EAM mainly depends on a successfulimplementation of the EAM processes. Finally, the EAM processes are depending on theEAM objectives of the organisation and their integration with processes of otherdisciplines such as definition/update of the IT strategy, portfolio management, projectmanagement etc. Therefore, it is difficult to find an appropriate level to do researchabout EAM processes and exchange experiences. We see EAM process patterns as apowerful tool to do so. Therefore, we would appreciate a research community dealingwith EAM process patterns. The patterns presented in this paper might be a first steptowards this vision. The presented patterns cover some aspects of maintaining an EArepository. Of course, there are many more patterns for other EAM processes. In
29
addition to the patterns themselves the used pattern forms need to be reviewed andprobably refined.
5. References
[Aa03] van der Aalst, W.M.P. et al.: Workflow Patterns. In: Distributed and Parallel Databases,14(1), 2003, pp. 5-51.
[AI00] ANSI/IEEE Std 1471-2000; Recommended Practice for Architectural Description ofSoftware-Intensive Systems.
[BO08] BOC AG: Enterprise Architecture Management with ADOit. Wien, 2008.[Bu08] Buckl, S. et. al.: Enterprise Architecture Management Pattern Catalog. Release 1.0,
Garching b. München, Germany 2008, http://srvmatthes8.informatik.tu-muenchen.de:8083/file/EAMPatternCatalogV1.0.pdf (access: 2008-10-15).
[CI99] CIO Council: Federal Enterprise Architecture Framework. Version 1.1,http://www.cio.gov/Documents/fedarch1.pdf (access: 2008-10-15).
[CM06] CMMI Product Team: CMMI® for Development. Version 1.2 (CMMI-SE/SW/IPPD/SS,V1.1): Staged Representation, Carnegie Mellon Software Engineering Institute,http://www.sei.cmu.edu/cmmi/models/index.html (access: 2007-08-15).
[Co95] Coplien, J.O.: A Generative Development-Process Pattern Language. In: Coplien, J. O.;Schmidt, D. C. (Eds.): Pattern Languages of Program Design. Addison Wesley. 1995,pp. 183-237.
[De03] Dern, G.: Management von IT-Architekturen. Vieweg, Wiesbaden, 2003.[Er08] Ernst, A.: Enterprise Architecture Management Patterns. http://www.hillside.net
/plop/2008/ACM/ConferenceProceedings/papers/PLoP2008_18_Ernst.pdf (access: 2009-03-01).
[Fi06] Fischer, R. et. al.: A Federated Approach to Enterprise Architecture Model Maintenance.In: Reichert, M. et al. (Eds.): Enterprise Modelling and Information SystemsArchitectures, LNI P-119, GI, Bonn, 2007, pp. 9-22.
[Jo06] Jonkers, H. et al.: Enterprise Architecture: Management tool and blueprint for the or-ganisation. In: Information Systems Frontier (2006) 8, pp. 63-66.
[Ju08] Junginger, S. et. al.: Anwendungsportfoliomanagement mit ADOit im ZIVIT. In:Riempp, G.; Stahringer, S.: HDM-Praxis der Wirtschaftsinformatik: Unternehmens-architekturen. dpunkt-verlag GmbH, 262, 2008, pp. 29-38.
[Ke07] Keller, W.: IT-Unternehmensarchitektur. Von der Geschäftsstrategie zur optimalen IT-Unterstützung. dpunkt.verlag, Heidelberg, 2007.
[Mo08] Moser, C. et. al.: Business Objectives Compliance Framework. Mechanisms forControlling Enterprise Artefacts. In: Kühne, T.; Reisig, W.; Steimann, F. (Eds.):Modellierung 2008. Proceedings, March 2008, Lecture Notes in Informatics, Volume P-127, pp. 74-88.
[OG07] Office of Government Commerce: ITIL – Service Transition. Appeared in the bookseries ITIL - IT Infrastructure Library, The Stationery Office, London, 2007.
[Sc04] Schekkerman, J.: Another View on Extended Enterprise Architecture Viewpoints.http://www.enterprise-architecture.info/Images/Extended%20Enterprise/E2A-Viewpoints_IFEAD.PDF (access: 2008-10-15).
[Sc06] Schekkerman, J.: How to Survive in the Jungle of Enterprise Architecture Frameworks:Creating or Choosing an EA Framework. Trafford Publishing, 2006.
[TO06] TOGAF: The Open Group Architecture Framework, Enterprise Edition. Version 9,http://www.opengroup.org/architecture/togaf9-doc/arch/ (access: 2009-02-15).
[Za87] Zachman, J.: A framework for information systems architecture. In: IBM SystemsJournal, 26(3), 1987, pp. 277-293.
30
Enterprise Architecture Patternsfor Multichannel Management
Marc M. Lankhorst, Paul H.W.M. Oude Luttighuis
Telematica InstituutPO Box 589
7500 AN EnschedeThe Netherlands
{marc.lankhorst, paul.oudeluttighuis}@telin.nl
Abstract: This paper describes a catalogue of patterns for multichannel manage-ment: functional structures for designing organizational and technical solutionsthat help organizations to manage and align the various information channels theyuse in communicating with their customers. The paper outlines the structure of thecatalogue and the identification of the patterns, and describes an example pattern inmore detail to give the reader an impression of the catalogue’s content.
1 Introduction
Since the early nineties, organizations have been using a variety of customer servicechannels. Next to the traditional channels, such as mail, fax, reception desk or telephone,customers have access to digital channels like websites and e-mail. These service chan-nels have different characteristics and are used for communication, interaction, transac-tion and distribution of products and/or services. Channel usage statistics suggest cus-tomers still prefer more expensive personal channels (desk and telephone) over newercost-effective digital channels.
Many organizations, especially in government, struggle with the integration and man-agement of these service channels. In particular, channel synchronization needs to beaddressed. Channel synchronization and coordination is required as customers expectinformation and services to be consistent across channels. Channel synchronization isnot only a technical but also an organizational problem, since information needs to beshared, processes must be aligned, and the customer should be addressed in a similarfashion across various parts of the organization. Solutions to these problems are usuallydeveloped on an ad hoc basis, without a solid methodological foundation. In order todeploy customer service channels effectively and efficiently, architects of multichannelmanagement solutions need to be supported in a better way. So far, there are very fewsources of proven enterprise architecture knowledge about multi-channel management.
In software engineering and architecture, patterns have become a popular way of captur-ing architectural knowledge [Al77, Fo02]. The notions of design patterns and architec-
31
ture patterns, however, are hardly applied to enterprise architecture, of which we con-sider multi-channel architecture to be a constituent. Still, the architectural complexity ofmulti-channel management, outlined in this article, provides sufficient basis for the hy-pothesis that patterns might help to manage this complexity. This paper reports our ef-forts of developing a catalogue of architecture patterns for multichannel management.
To clarify what we mean by multichannel management, we first address the aspects thatare relevant in any organization using multiple channels for its communication withcustomers. Based on these, we then define a framework of design issues for which archi-tecture patterns may be useful. We explain one of these patterns in more detail to illus-trate our approach and report on the practical application of these patterns.
2 Characteristics of Multichannel Management
In multichannel management, and hence in multichannel architecture, we observe fourcore elements that need to be addressed: clients, services, providers, and channels. Thesefour key dimensions extend the three basic concepts of service architectures (service,client and provider) with the central concept in multichannel management (channel).
In multichannel situations, different client groups may have different needs, demandsand preferences with respect to e.g. service content, channel usage, and parties involved.Also, different service characteristics may influence channel usage: Group information services: these offer generic information to groups of (usually
anonymous) customers. Think of e.g. marketing campaigns via radio or TV, genericmail to customers, providing information via the Web, et cetera.
Individual information services: these provide specific (personalized) informationthat is targeted to an individual, identifiable customer. Think of e.g. the progress ofthe client’s application for a residence permit, events taking place in his neighbour-hood, et cetera.
Transaction services: these provide a specific product or service to an individual,identifiable customer and require some kind of contractual relation between serviceprovider and customer. Think of e.g. buying a book from a Web shop, applying forchild benefits, et cetera.
Each service is offered by one or more service providers. Often several parties are in-volved. We therefore distinguish between three responsibilities in the service deliveryprocess: accountability, coordination, and execution. Especially in complex service de-livery networks such as those in government, these responsibilities may be distributedacross different organizations. Take for instance a typical re-integration scenario, de-signed to aid the unemployed in finding their way back to the labour market. In this case,the Ministry of Labour may be accountable, a social security agency may coordinate,and a private re-integration agency may provide the actual service of coaching peopleback to a job. All these parties must comply with legal restrictions and other regulations,for example on privacy protection, archiving laws, or bookkeeping standards.
Finally, each service is provided through one or more channels, such as mail, telephone,website, e-mail, sms, chat, front desk, mass media, intermediaries, and more. Of course,
32
these channels differ in many respects, such as opportunities for personalization, imme-diate feedback or not, social influence, geographical and social reach, amount of infor-mation that can be delivered, cost per contact, and synchronicity of communication (seealso [Te07]). Choosing the ‘right’ channel(s) for a specific service and target group,however, is beyond the scope of this paper.
These four dimensions of client, service, provider, and channel span the multi-channelarchitecture problem space. As explained in [Fi08], a large part of the complexity ofmultichannel management is in the multiplicity of these relations, i.e., situations inwhich multiple clients, services, providers, and/or channels are involved (the latter being‘multichannel management’ in the strict sense). Take again our reintegration example, inwhich several government institutions, both local and national, together with privatecompanies like temping agencies and job banks, communicate with the customer throughtelephone, mail, e-mail and website. All these parties and channels involved must besynchronized to provide the client with a seamless experience.
A number of important forces are at work in this problem space. First, there are the cli-ents’ needs for unified service provision across multiple channels and organizations. Thisis counteracted by the organizational subdivision of government and other organizationsalong different lines, often related to legal tasks and responsibilities or to areas of exper-tise, and not to the clients’ needs. Another important force is that of the dissimilar chan-nel and service characteristics. For example, whether a channel is synchronous or asyn-chronous influences the way in which applications that support these channels deal withprocess coordination and data storage. Finally, there is the force (or deadweight…) oflegacy systems, which often requires sub-optimal solutions from an idealistic point ofview. The patterns we have identified aim to balance these forces.
3 Framework for Identifying Multichannel Management Patterns
To identify potentially useful patterns for multichannel management, we did not want togo about in an ad-hoc manner. We have therefore defined a framework that positions thevarious aspects of multichannel architectures for which patterns could be relevant. Thefirst dimension of this framework is given by the four aspects distinguished in Section 2,refined further by using a number of interrogatives, analogous to e.g. the ZachmanFramework [Za87]: Who is the client and what do we know about him/her? What service(s) does the client consume? Where are these services provided, i.e., through which channels? Whose services are these, i.e., who provides them? With whom are these services provided or consumed, i.e., who provides assistance? How are these services delivered and realized?
A second important dimension is that of the elements of the service delivery process.During this process, the (prospective) client first searches and selects the right service,channel and/or provider. This might happen for example via a website offering theseservices, via an intermediary assisting a client, or via an interactive voice response sys-
33
tem. Next, the chosen service is delivered to the client via the chosen channel of theservice provider. To this end, the provider must perform all kinds of internal processesand functions, using various automated systems in the ‘back-end’, to actually realize thisservice. This service delivery process is not a perfect funnel: during service delivery, forexample, responsibility may pass from one provider to another, and in every step differ-ent channels may be used.
Based on these aspects of multichannel management on the one hand and the servicedelivery process on the other hand, we have created a framework for identifying mul-tichannel management patterns. Each of the cells in the table represents a relevant areaof design, and hence a possibility for discovering one or more architecture patterns.Later in this paper, we will show how this framework is filled in with relevant patterns.
4 Structure of Multichannel Solutions
Architecture patterns abstract from specific technological solutions, but focus on func-tionality needed to solve a given architectural problem. In order to organize the structureof multichannel management solutions, and hence of the architecture patterns we haveidentified, we have employed a layered framework, in which specific functional aspectsof multichannel service provisioning are positioned: The (objective) situation of the client. What are his needs, personal situation, pro-
file, circumstances? But also: what communication channels can he use? The preferences of the client. What demands and desires does he have with respect
to service content, manner of delivery, channels used, et cetera? The dialogue with the client. Starting from the client’s situation and preferences, his
actual needs and the applicable (combination of) service(s) must be established. The channel(s) used to provide information and services. This includes the medium
used (e.g. paper, telephone, Web, face-to-face), but also differences within thesecategories, like using large fonts for communicating with visually impaired clients, alanguage switch on a website used by non native speakers, et cetera.
The content of the information and services. Often this consists of textual descrip-tions like brochures, forms, web pages and call centre scripts, if necessary targetedto specific client groups.
The business logic of the information and services. This comprises knowledge mod-els, concepts, procedures, computations and other business logic that determines therights and obligations of clients, the form in which a service or product is delivered,the steps needed in service provisioning, checks to be made, deadlines to be met, etcetera.
The data that is used, comprising client data, case data, product data, et cetera. The communication within and between the organizations involved.
As said, these layers describe functional aspects, i.e., the functions that must be carriedout to provide a service. Hence, the service itself is not a separate layer in this frame-work, but rather an abstraction of these functions (or vice versa, these functions jointlyrealize the service). The layered model serves as a structural template and check list for
34
the multichannel architecture patterns. Next to these functional aspects, we have alsoidentified aspects that address management, control, and realization of multichannelsolutions. However, these aspects are deemed out of scope for this paper. For more de-tails, the reader is referred to [La08]. The layers in this framework help us in describingthe content of the multichannel patterns and position them relative to each other. Somepatterns are more ‘technical’ or ‘internal’ in nature, covering the lower layers of theframework, others are more ‘customer-oriented’, focussing on the upper layers.
The patterns we have identified are at a somewhat more detailed level of abstraction thanfor example IBM’s e-business patterns [Ko01], which contain high-level structures suchas ‘self-service’ or ‘extended enterprise’ and some more detailed patterns within these.There are similarities between the two approaches, in particular in IBM’s ‘access inte-gration’ pattern, but its subordinate patterns are strictly application-oriented, and theirwork does not focus on general multichannel solutions.
5 Catalogue of Multichannel Management Patterns
In the previous sections, we have outlined relevant characteristics of multichannel archi-tectures and the resulting design issues and aspects for which architecture patterns maybe of use. In this section, we describe the contents of our pattern catalogue.
5.1 Description of Patterns
The description of the multichannel patterns in the catalogue contains the followingelements, inspired of course by [Ga95], [Bu99] and many other pattern catalogues:
Name: A short descriptive name of the pattern. Context: In which circumstances is this pattern useful? Problem: Which problem does this pattern solve? Solution: What solution does this pattern offer? Forces: Which forces have to be balanced? Structure: What is the architectural structure of the pattern? Consequences: How does the pattern resolve the forces? Known uses: How is this pattern used in practice? Related patterns: How is this pattern linked to other patterns?
The pattern’s structural description typically includes business roles, business processes,services, application functions, data collections and other functional elements. The pat-tern’s structure is also mapped onto the layers of Sect. 4.
5.2 Pattern Identification
To identify relevant architecture patterns for multichannel management, we started fromthe framework of relevant multichannel architecture issues described in Sect. 3. To findpatterns that fit these issues, we have looked at applicable literature (e.g. [Bu99], [Fo02],
35
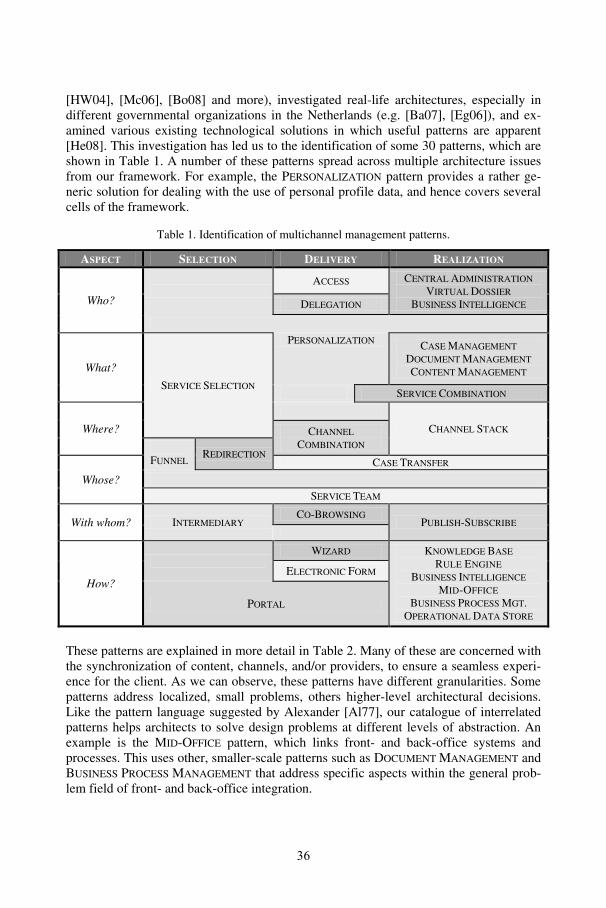
[HW04], [Mc06], [Bo08] and more), investigated real-life architectures, especially indifferent governmental organizations in the Netherlands (e.g. [Ba07], [Eg06]), and ex-amined various existing technological solutions in which useful patterns are apparent[He08]. This investigation has led us to the identification of some 30 patterns, which areshown in Table 1. A number of these patterns spread across multiple architecture issuesfrom our framework. For example, the PERSONALIZATION pattern provides a rather ge-neric solution for dealing with the use of personal profile data, and hence covers severalcells of the framework.
Table 1. Identification of multichannel management patterns.
ASPECT SELECTION DELIVERY REALIZATION
Who?
ACCESS CENTRAL ADMINISTRATIONVIRTUAL DOSSIER
BUSINESS INTELLIGENCEDELEGATION
What?
SERVICE SELECTION
PERSONALIZATION CASE MANAGEMENTDOCUMENT MANAGEMENTCONTENT MANAGEMENT
SERVICE COMBINATION
Where? CHANNEL STACKCHANNELCOMBINATION
FUNNELREDIRECTION
Whose?
CASE TRANSFER
SERVICE TEAM
With whom? INTERMEDIARYCO-BROWSING
PUBLISH-SUBSCRIBE
How?
WIZARD KNOWLEDGE BASERULE ENGINE
BUSINESS INTELLIGENCEMID-OFFICE
BUSINESS PROCESS MGT.OPERATIONAL DATA STORE
ELECTRONIC FORM
PORTAL
These patterns are explained in more detail in Table 2. Many of these are concerned withthe synchronization of content, channels, and/or providers, to ensure a seamless experi-ence for the client. As we can observe, these patterns have different granularities. Somepatterns address localized, small problems, others higher-level architectural decisions.Like the pattern language suggested by Alexander [Al77], our catalogue of interrelatedpatterns helps architects to solve design problems at different levels of abstraction. Anexample is the MID-OFFICE pattern, which links front- and back-office systems andprocesses. This uses other, smaller-scale patterns such as DOCUMENT MANAGEMENT andBUSINESS PROCESS MANAGEMENT that address specific aspects within the general prob-lem field of front- and back-office integration.
36
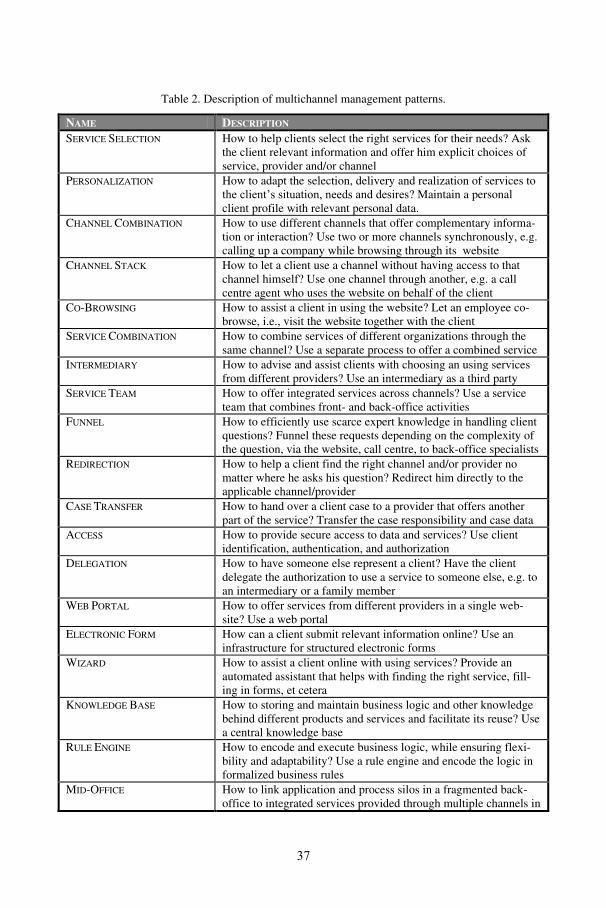
Table 2. Description of multichannel management patterns.
NAME DESCRIPTION
SERVICE SELECTION How to help clients select the right services for their needs? Askthe client relevant information and offer him explicit choices ofservice, provider and/or channel
PERSONALIZATION How to adapt the selection, delivery and realization of services tothe client’s situation, needs and desires? Maintain a personalclient profile with relevant personal data.
CHANNEL COMBINATION How to use different channels that offer complementary informa-tion or interaction? Use two or more channels synchronously, e.g.calling up a company while browsing through its website
CHANNEL STACK How to let a client use a channel without having access to thatchannel himself? Use one channel through another, e.g. a callcentre agent who uses the website on behalf of the client
CO-BROWSING How to assist a client in using the website? Let an employee co-browse, i.e., visit the website together with the client
SERVICE COMBINATION How to combine services of different organizations through thesame channel? Use a separate process to offer a combined service
INTERMEDIARY How to advise and assist clients with choosing an using servicesfrom different providers? Use an intermediary as a third party
SERVICE TEAM How to offer integrated services across channels? Use a serviceteam that combines front- and back-office activities
FUNNEL How to efficiently use scarce expert knowledge in handling clientquestions? Funnel these requests depending on the complexity ofthe question, via the website, call centre, to back-office specialists
REDIRECTION How to help a client find the right channel and/or provider nomatter where he asks his question? Redirect him directly to theapplicable channel/provider
CASE TRANSFER How to hand over a client case to a provider that offers anotherpart of the service? Transfer the case responsibility and case data
ACCESS How to provide secure access to data and services? Use clientidentification, authentication, and authorization
DELEGATION How to have someone else represent a client? Have the clientdelegate the authorization to use a service to someone else, e.g. toan intermediary or a family member
WEB PORTAL How to offer services from different providers in a single web-site? Use a web portal
ELECTRONIC FORM How can a client submit relevant information online? Use aninfrastructure for structured electronic forms
WIZARD How to assist a client online with using services? Provide anautomated assistant that helps with finding the right service, fill-ing in forms, et cetera
KNOWLEDGE BASE How to storing and maintain business logic and other knowledgebehind different products and services and facilitate its reuse? Usea central knowledge base
RULE ENGINE How to encode and execute business logic, while ensuring flexi-bility and adaptability? Use a rule engine and encode the logic informalized business rules
MID-OFFICE How to link application and process silos in a fragmented back-office to integrated services provided through multiple channels in
37
a unified front office? Use a mid-office layer for process and dataintegration
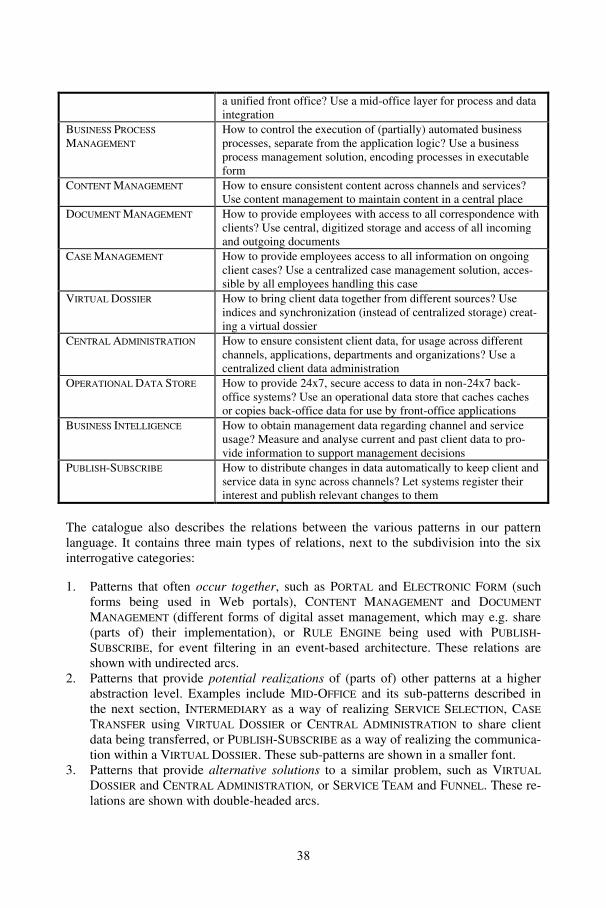
BUSINESS PROCESS
MANAGEMENT
How to control the execution of (partially) automated businessprocesses, separate from the application logic? Use a businessprocess management solution, encoding processes in executableform
CONTENT MANAGEMENT How to ensure consistent content across channels and services?Use content management to maintain content in a central place
DOCUMENT MANAGEMENT How to provide employees with access to all correspondence withclients? Use central, digitized storage and access of all incomingand outgoing documents
CASE MANAGEMENT How to provide employees access to all information on ongoingclient cases? Use a centralized case management solution, acces-sible by all employees handling this case
VIRTUAL DOSSIER How to bring client data together from different sources? Useindices and synchronization (instead of centralized storage) creat-ing a virtual dossier
CENTRAL ADMINISTRATION How to ensure consistent client data, for usage across differentchannels, applications, departments and organizations? Use acentralized client data administration
OPERATIONAL DATA STORE How to provide 24x7, secure access to data in non-24x7 back-office systems? Use an operational data store that caches cachesor copies back-office data for use by front-office applications
BUSINESS INTELLIGENCE How to obtain management data regarding channel and serviceusage? Measure and analyse current and past client data to pro-vide information to support management decisions
PUBLISH-SUBSCRIBE How to distribute changes in data automatically to keep client andservice data in sync across channels? Let systems register theirinterest and publish relevant changes to them
The catalogue also describes the relations between the various patterns in our patternlanguage. It contains three main types of relations, next to the subdivision into the sixinterrogative categories:
1. Patterns that often occur together, such as PORTAL and ELECTRONIC FORM (suchforms being used in Web portals), CONTENT MANAGEMENT and DOCUMENT
MANAGEMENT (different forms of digital asset management, which may e.g. share(parts of) their implementation), or RULE ENGINE being used with PUBLISH-SUBSCRIBE, for event filtering in an event-based architecture. These relations areshown with undirected arcs.
2. Patterns that provide potential realizations of (parts of) other patterns at a higherabstraction level. Examples include MID-OFFICE and its sub-patterns described inthe next section, INTERMEDIARY as a way of realizing SERVICE SELECTION, CASE
TRANSFER using VIRTUAL DOSSIER or CENTRAL ADMINISTRATION to share clientdata being transferred, or PUBLISH-SUBSCRIBE as a way of realizing the communica-tion within a VIRTUAL DOSSIER. These sub-patterns are shown in a smaller font.
3. Patterns that provide alternative solutions to a similar problem, such as VIRTUAL
DOSSIER and CENTRAL ADMINISTRATION, or SERVICE TEAM and FUNNEL. These re-lations are shown with double-headed arcs.
38
6 Example: MID-OFFICE and its Sub-Patterns
In this section, we give a (somewhat abbreviated) description of the MID-OFFICE pattern,according to the pattern template outlined in Section 5.1.
Context: In many organizations, the back office is organized along the lines of the ap-plicable expertise, both in an organizational sense and in terms of the application land-scape. This does not fit the needs of clients, since these needs may span multiple exper-tise areas, systems and organizational units. To address these client needs in an integralway, a unified front office is often created, comprising e.g. the call centre, website, frontdesk et cetera. This must then be linked to the existing, fragmented back office.
Problem: How do you link application and process silos in a fragmented back-office tointegrated services provided through multiple channels in a unified front office?
Solution: Use a MID-OFFICE, an intermediate layer of functionality that handles bothprocess and data integration between the front office and the back office.
Forces: The two main forces at play in this pattern are the client’s need for unified ser-vice provision versus the organizational (and consequently the application landscape’s)subdivision along lines of expertise. An integrated view of the client situation is neededto provide adequate products and services. Treating a client request, however, may re-quire many different areas of expertise, each often using dedicated systems.
A second important force is the need for integrating legacy applications from the backoffice. Although a fully service-oriented architecture might be the ‘ideal’ solution in thelong term, until then a short-term solution for the integration of these systems must befound. Point-to-point links between multiple channels and multiple systems are toocostly to maintain and do not scale well to more systems and/or channels. Hence, a mid-office architecture is often used as a temporary phase in the migration from monolithicsystems to a SOA.
Other relevant forces opposing the need for legacy integration are availability, securityand performance: back-office systems are often not available around the clock, are notmeant to be accessed directly by clients for security reasons, and are not designed tohandle the load of large numbers of clients. Directly linking these systems to e.g. thewebsite is therefore not an option.
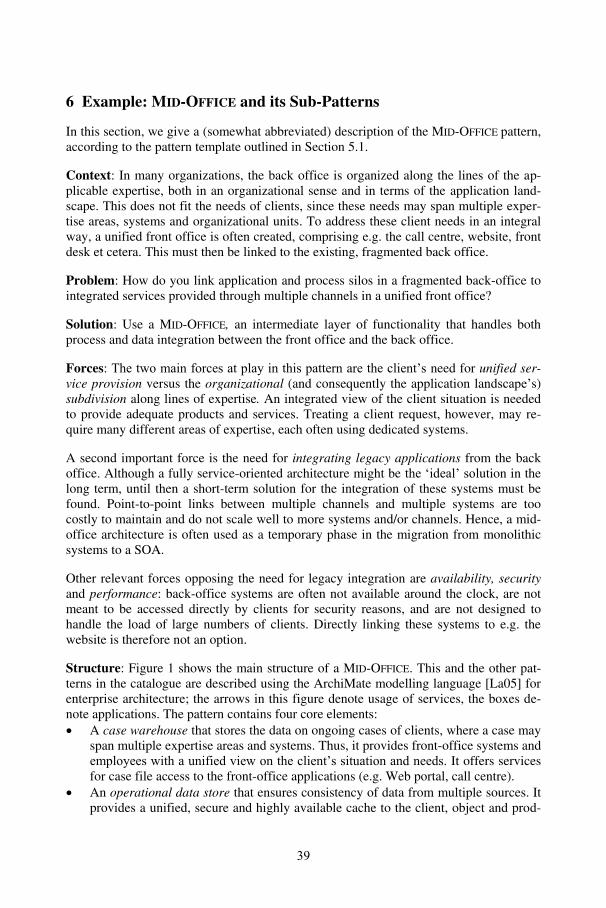
Structure: Figure 1 shows the main structure of a MID-OFFICE. This and the other pat-terns in the catalogue are described using the ArchiMate modelling language [La05] forenterprise architecture; the arrows in this figure denote usage of services, the boxes de-note applications. The pattern contains four core elements: A case warehouse that stores the data on ongoing cases of clients, where a case may
span multiple expertise areas and systems. Thus, it provides front-office systems andemployees with a unified view on the client’s situation and needs. It offers servicesfor case file access to the front-office applications (e.g. Web portal, call centre).
An operational data store that ensures consistency of data from multiple sources. Itprovides a unified, secure and highly available cache to the client, object and prod-
39
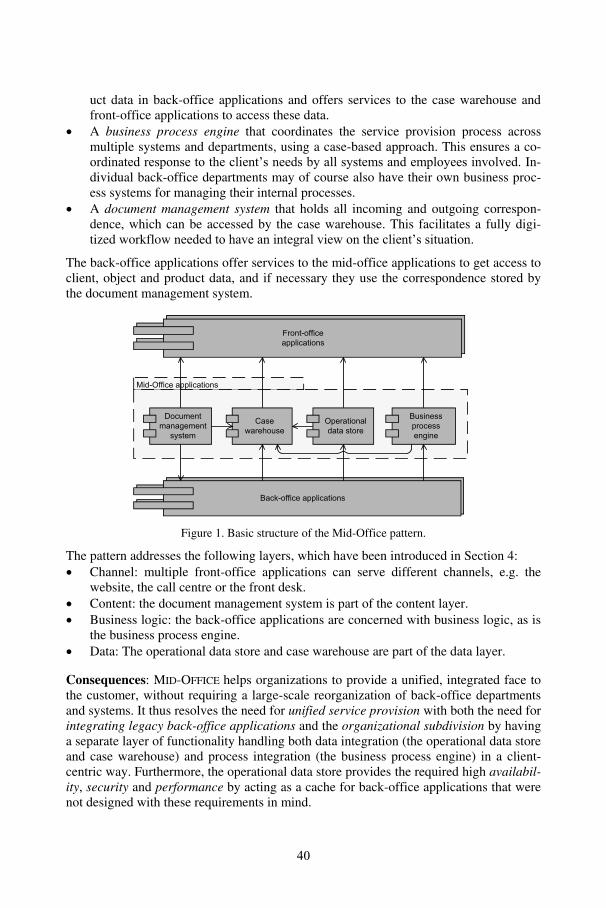
uct data in back-office applications and offers services to the case warehouse andfront-office applications to access these data.
A business process engine that coordinates the service provision process acrossmultiple systems and departments, using a case-based approach. This ensures a co-ordinated response to the client’s needs by all systems and employees involved. In-dividual back-office departments may of course also have their own business proc-ess systems for managing their internal processes.
A document management system that holds all incoming and outgoing correspon-dence, which can be accessed by the case warehouse. This facilitates a fully digi-tized workflow needed to have an integral view on the client’s situation.
The back-office applications offer services to the mid-office applications to get access toclient, object and product data, and if necessary they use the correspondence stored bythe document management system.
Frontoffice-applicaties
Casewarehouse
Businessprocessengine
Documentmanagementsystem
Operationaldata store
Front-officeapplications
Back-office applications
Mid-Office applications
Figure 1. Basic structure of the Mid-Office pattern.
The pattern addresses the following layers, which have been introduced in Section 4: Channel: multiple front-office applications can serve different channels, e.g. the
website, the call centre or the front desk. Content: the document management system is part of the content layer. Business logic: the back-office applications are concerned with business logic, as is
the business process engine. Data: The operational data store and case warehouse are part of the data layer.
Consequences: MID-OFFICE helps organizations to provide a unified, integrated face tothe customer, without requiring a large-scale reorganization of back-office departmentsand systems. It thus resolves the need for unified service provision with both the need forintegrating legacy back-office applications and the organizational subdivision by havinga separate layer of functionality handling both data integration (the operational data storeand case warehouse) and process integration (the business process engine) in a client-centric way. Furthermore, the operational data store provides the required high availabil-ity, security and performance by acting as a cache for back-office applications that werenot designed with these requirements in mind.
40
The main liability of this pattern is that it could serve as an excuse to prolong the life ofan outdated back-office application landscape, preventing an organization to reap thebenefits of a cleaner, more manageable service architecture that removes duplications offunctionality and data. Another risk is that some vendors offer integrated suites of appli-cations as their ‘mid-office solutions’, whereas the elements of the pattern could be im-plemented rather independently and phased out step by step when moving to a SOA.
Known uses: This pattern and its variants are widely used by large financial institutionssuch as banks and insurers, who have often grown through mergers and acquisitions,resulting in a scattered and fragmented back-office application landscape. It can also beobserved within Dutch municipalities [Eg06, BL08]; concrete examples include themunicipalities participating in the Dimpact (www.dimpact.nl) and GovUnited(www.govunited.nl) groups.
Related patterns: MID-OFFICE contains four core elements, each of which is addressedby a pattern in its own right:
BUSINESS PROCESS MANAGEMENT: to control business processes (workflows)across the borders of applications and departments;
CASE MANAGEMENT: to register the progress of a client case (service usage)across applications and departments;
DOCUMENT MANAGEMENT: to provide a centralized database of all in- and out-going client communication;
OPERATIONAL DATA STORE: to provide a safe, reliable and 24x7 accessible datawarehouse for back-office data.
Each of these patterns is worked out in more detail in our pattern catalogue.
7 Conclusions
The pattern catalogue described in this paper can provide an important asset for enter-prise and business architects concerned with the design of multichannel architectures. Itis not just a loosely connected set of patterns, but an integrated whole with extensivecoverage of the various aspects that need to be addressed in multichannel management.Especially the comprehensive way in which the patterns were identified and mappedonto a framework of relevant design aspects may serve as an example for other patterncatalogues. Thus, the structure of the catalogue might be viewed as a pattern itself.
First reactions from practitioners have been positive. The catalogue is published online[La08] under a Creative Commons licence, to stimulate architects to reuse, improve, andextend them. We will actively monitor the development and use of the catalogue and aimto contribute its content to other existing pattern repositories.
41
Acknowledgments
This paper results from the ‘Kanalen in Balans’ project (‘Channels in Balance’www.kanaleninbalans.nl) of the Telematica Instituut, a research initiative with partnersfrom government and academia, comprising the Dutch Ministry of the Interior, theDutch Ministry of Economic Affairs, SVB, UWV, IB-Groep, IND, VDP, the Universityof Twente, and Delft University of Technology. Furthermore, we want to thank theanonymous reviewers, our paper shepherd Wolfgang Keller, and all participants of thePEAM 2009 workshop for their valuable feedback on previous versions of this paper.
References
[Al77] Alexander, C., et al., A Pattern Language. New York: Oxford University Press, 1977.[Ba07] Bayens, G.I.H.M., et al., Nederlandse Overheid Referentie Architectuur (NORA) v. 2.0.
Stichting ICTU, The Hague, The Netherlands, 2007.[BL08] Bayens, G.I.H.M., Lankhorst, M.M., De midoffice ontrafeld. Via Nova Architectura,
June 28, 2008.[Bo08] Booch, G., Patterns (Handbook of Software Architecture),
http://www.booch.com/architecture/patterns.jsp?view=kind_name%20catalog. VisitedJuly 1, 2008.
[Bu99] Buschmann, F., Meunier, R., Rohnert, H., Sommerlad, P., & Stal, M., Pattern-OrientedSoftware Architecture: A System of Patterns, John Wiley & Sons, 1999.
[Eg06] EGEM werkgroep Midoffice, Architectuur Model Gemeentelijke E-Dienstverlening:Project Referentiemodel Midoffice ten behoeve van Gemeenten. Stichting ICTU, TheHague, The Netherlands, 2006.
[Fi08] Fielt, E., Lankhorst, M.M., Oude Luttighuis, P.H.W.M., De multichannel-dienst-verleningscontext. TI/RS/2008/020, Telematica Instituut, Enschede, The Netherlands,2008.
[Fo02] Fowler, M., Patterns of Enterprise Application Architecture. Addison Wesley SignatureSeries, 2002.
[Ga95] Gamma, E., Helm, R., Johnson, R., Vlissides, J., Design Patterns: Elements of ReusableObject-Oriented Software. Addison-Wesley, 1995.
[HW04] Hohpe, G,. Woolf, B., Enterprise Integration Patterns, Addison-Wesley, 2004.[Ko01] Koushik, S. Vasudeva, G., Galambos, G., Adams, J. Patterns for e-business. Mc Press,
2001.[La05] Lankhorst, M.M., et al., Enterprise Architecture at Work –Modelling, Communication,
and Analysis. Springer-Verlag, 2005.[La08] Lankhorst, M.M., Klievink, A.J., Oude Luttighuis, P.H.W.M., Fielt, E., Heerink, L. &
Van Leeuwen, D., Kanaalpatronen – Functionele structuren voor multichan-nel-management. TI/RS/2008/021, Telematica Instituut, Enschede, The Netherlands,2008. http://www.telin.nl/Project/Kanalen/Kanaalpatronen.htm.
[LB08] Lankhorst, M.M. & Bayens, G.I.H.M., A Service-Oriented Reference Architecture for E-Government. Chapter II in P. Saha (Ed.), Advances in Government Enterprise Architec-ture, IGI Global, 2008.
[Mc06] McGovern, J., Sims, O., Jain, A., & Little, M., Enterprise Service Oriented Architec-tures: Concepts, Challenges, Recommendations. Springer, 2006.
[Te07] Teerling, M., et al., Multichannel Management – de stand van zaken, TI/RS/2007/040,Telematica Instituut, Enschede, The Netherlands, 2007.
[Za87] Zachman, J.A., A Framework for Information Systems Architecture, IBM Systems Jour-nal, 26(3):276–292, 1987.
42
An Enterprise Architecture Management Pattern forSoftware Change Project Cost Analysis
Robert Lagerström, Pontus Johnson, David Höök
Industrial Information and Control Systemsthe Royal Institute of Technology
Osquldas väg 1210044 Stockholm
{robertl, pj101, davidh}@ics.kth.se
Abstract: Business environments today progress and change rapidly. Mostbusiness processes are supported by information systems and since the businessprocesses change the information systems need to be changed as well. An essentialissue with today’s software systems is that many of them are interconnected, thus achange to one system may cause a ripple effect among other systems. Also,numerous systems have been developed and modified during many years and tomake further changes to them requires a lot of effort from the organization. Thispaper suggests enterprise architecture as an approach to model software systemsand their environment. An enterprise architecture management pattern in the formof a metamodel for change project costs modeling and analysis is presented. ITdecision makers can use this metamodel in order to make cost predictions and dorisk analysis for their change projects. The employment of the model is illustratedwith ten projects.
1 Introduction
Enterprise architecture is an approach to enterprise information systems managementthat relies on models of the information systems and their environment. Instead ofmodifying the enterprise information system using trial and error, a set of models isproposed to predict the behavior and effects of changes to the system. The enterprisearchitecture models allow reasoning about the consequences of various scenarios andthereby support decision making. What constitutes a “good” enterprise architecturemodel is contingent on the purpose the model is intended to fill, that is what type ofanalysis it will be subjected to. For instance in the case of analyzing softwaremaintainability, here defined as the cost of change, it is necessary that the modelscontain information on maintainability, e.g. component source code understandability,documentation quality, change management process maturity etc. [Jo07]
43
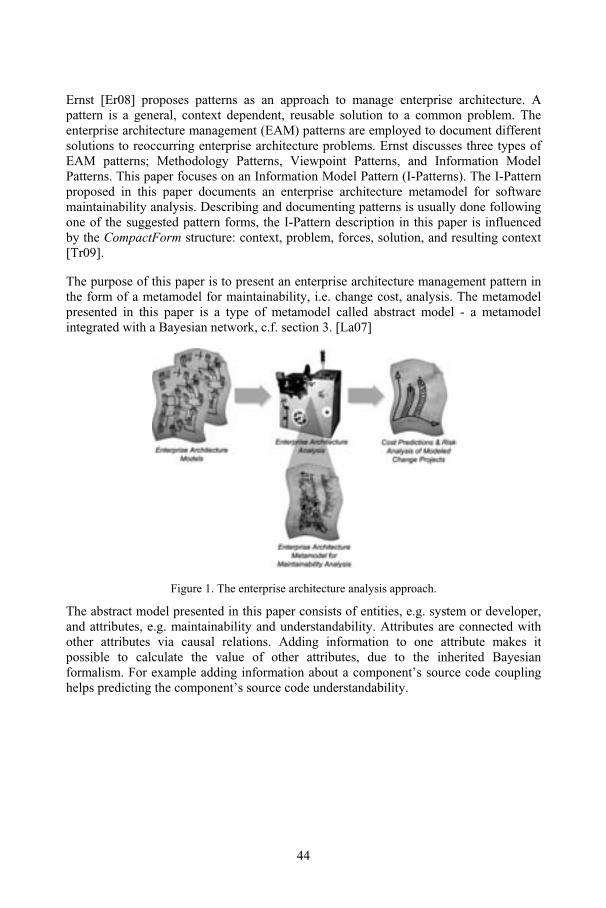
Ernst [Er08] proposes patterns as an approach to manage enterprise architecture. Apattern is a general, context dependent, reusable solution to a common problem. Theenterprise architecture management (EAM) patterns are employed to document differentsolutions to reoccurring enterprise architecture problems. Ernst discusses three types ofEAM patterns; Methodology Patterns, Viewpoint Patterns, and Information ModelPatterns. This paper focuses on an Information Model Pattern (I-Patterns). The I-Patternproposed in this paper documents an enterprise architecture metamodel for softwaremaintainability analysis. Describing and documenting patterns is usually done followingone of the suggested pattern forms, the I-Pattern description in this paper is influencedby the CompactForm structure: context, problem, forces, solution, and resulting context[Tr09].
The purpose of this paper is to present an enterprise architecture management pattern inthe form of a metamodel for maintainability, i.e. change cost, analysis. The metamodelpresented in this paper is a type of metamodel called abstract model - a metamodelintegrated with a Bayesian network, c.f. section 3. [La07]
Figure 1. The enterprise architecture analysis approach.
The abstract model presented in this paper consists of entities, e.g. system or developer,and attributes, e.g. maintainability and understandability. Attributes are connected withother attributes via causal relations. Adding information to one attribute makes itpossible to calculate the value of other attributes, due to the inherited Bayesianformalism. For example adding information about a component’s source code couplinghelps predicting the component’s source code understandability.
44
2 Related Work
A number of enterprise architecture initiatives have been proposed, for example TheOpen Group Architecture Framework (TOGAF) [Op05], the Zachman Framework[Za87], Enterprise Architecture Planning (EAP) [SH92], and the General EnterpriseReference Architecture and Methodology (GERAM) [If99]. There are also numerousmetamodels proposed for enterprise architecture modeling, e.g. the ones presented byCummins [Cu02], O’Rourke [OFS03], Lankhorst [La05], and Niemann [Ni06].Considering the suitability of the frameworks and metamodels for the purpose ofmaintainability analysis, it is found that a number of the proposed metamodels are notdetailed enough to provide the information required for our analysis purpose. Whenanalyzing maintainability it is necessary that the metamodel is capable to model systems,components, documentation, tools, processes, developers etc. and information such ascomponent coupling and size, developer expertise, change management process maturityetc. Few metamodels hold any of this information, none have it all.
Several methods for analyzing maintainability and change costs have been suggested, forexample the COnstructive COst MOdel (COCOMO) for software maintenance costestimation [Bo81], the Definition and Taxonomy for Software Maintainability [Om92],the maintainability part of the Quality Model proposed by ISO/IEC [Is01], themaintainability software metrics suggested by Fenton and Pfleeger [FP97], and theSoftware Architecture Analysis Method (SAAM) concerning modifiability [BCK98].Existing enterprise architecture frameworks and metamodels don’t contain the properinformation for maintainability analysis and that previously proposed maintainabilitymeasures haven’t been incorporated in any enterprise architecture metamodel, wepropose such a metamodel in this paper.
3 Introduction to Enterprise Architecture Analysis
An abstract model is an enterprise architecture metamodel containing entities and entityrelations, augmented with attributes and attribute relations. Entities represent the objectsof interest when modeling, e.g. systems, components, persons, or processes. Entityrelations connect two entities, e.g. “documentation describes system” or “person is aresource of process”. Entity relations also state the multiplicity of the relationshipbetween the entities, c.f. Figure 2.
45
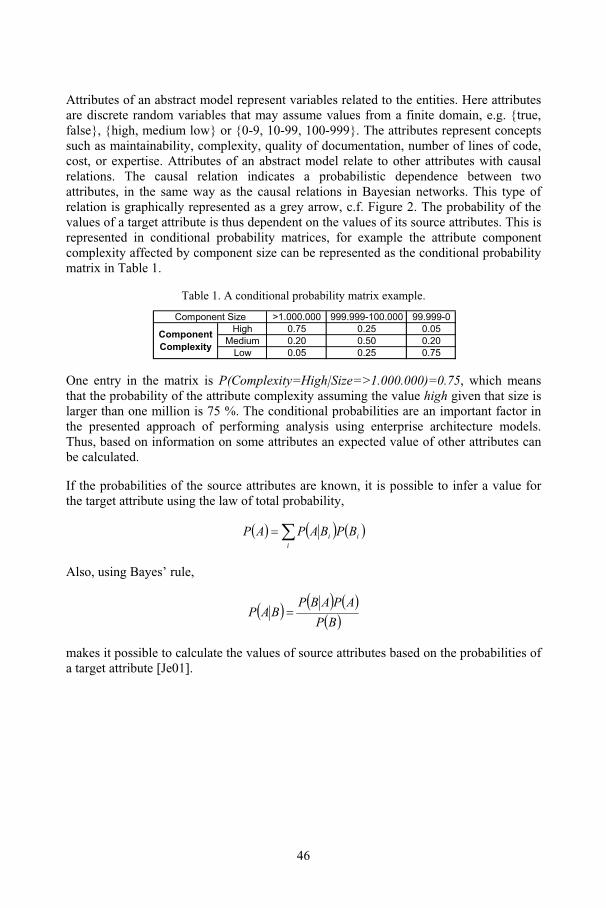
Attributes of an abstract model represent variables related to the entities. Here attributesare discrete random variables that may assume values from a finite domain, e.g. {true,false}, {high, medium low} or {0-9, 10-99, 100-999}. The attributes represent conceptssuch as maintainability, complexity, quality of documentation, number of lines of code,cost, or expertise. Attributes of an abstract model relate to other attributes with causalrelations. The causal relation indicates a probabilistic dependence between twoattributes, in the same way as the causal relations in Bayesian networks. This type ofrelation is graphically represented as a grey arrow, c.f. Figure 2. The probability of thevalues of a target attribute is thus dependent on the values of its source attributes. This isrepresented in conditional probability matrices, for example the attribute componentcomplexity affected by component size can be represented as the conditional probabilitymatrix in Table 1.
Table 1. A conditional probability matrix example.
One entry in the matrix is P(Complexity=High|Size=>1.000.000)=0.75, which meansthat the probability of the attribute complexity assuming the value high given that size islarger than one million is 75 %. The conditional probabilities are an important factor inthe presented approach of performing analysis using enterprise architecture models.Thus, based on information on some attributes an expected value of other attributes canbe calculated.
If the probabilities of the source attributes are known, it is possible to infer a value forthe target attribute using the law of total probability,
( ) ( ) ( )∑=i
ii BPBAPAP
Also, using Bayes’ rule,
( ) ( ) ( )( )BP
APABPBAP =
makes it possible to calculate the values of source attributes based on the probabilities ofa target attribute [Je01].
>1.000.000 999.999-100.000 99.999-0High 0.75 0.25 0.05
Medium 0.20 0.50 0.20Low 0.05 0.25 0.75
ComponentComplexity
Component Size
46
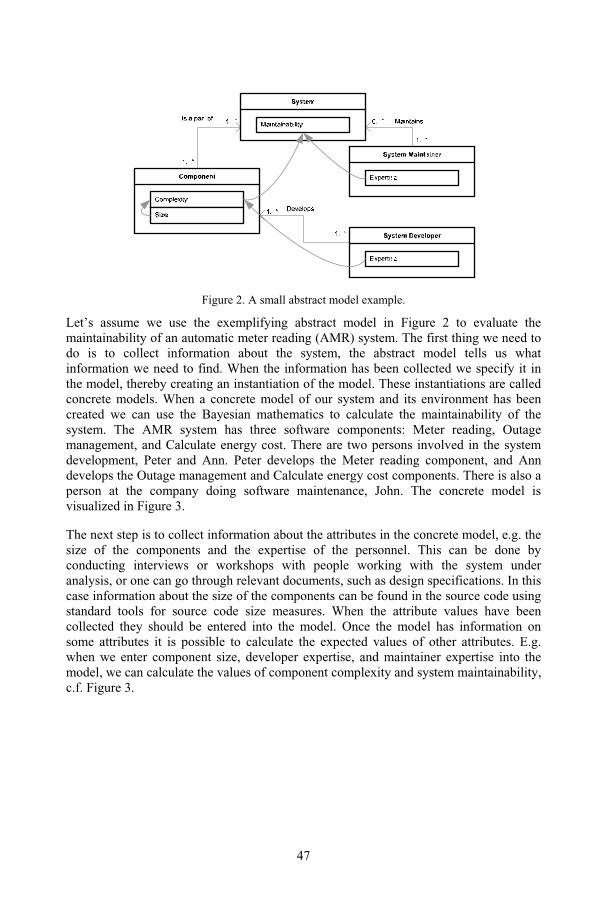
Figure 2. A small abstract model example.
Let’s assume we use the exemplifying abstract model in Figure 2 to evaluate themaintainability of an automatic meter reading (AMR) system. The first thing we need todo is to collect information about the system, the abstract model tells us whatinformation we need to find. When the information has been collected we specify it inthe model, thereby creating an instantiation of the model. These instantiations are calledconcrete models. When a concrete model of our system and its environment has beencreated we can use the Bayesian mathematics to calculate the maintainability of thesystem. The AMR system has three software components: Meter reading, Outagemanagement, and Calculate energy cost. There are two persons involved in the systemdevelopment, Peter and Ann. Peter develops the Meter reading component, and Anndevelops the Outage management and Calculate energy cost components. There is also aperson at the company doing software maintenance, John. The concrete model isvisualized in Figure 3.
The next step is to collect information about the attributes in the concrete model, e.g. thesize of the components and the expertise of the personnel. This can be done byconducting interviews or workshops with people working with the system underanalysis, or one can go through relevant documents, such as design specifications. In thiscase information about the size of the components can be found in the source code usingstandard tools for source code size measures. When the attribute values have beencollected they should be entered into the model. Once the model has information onsome attributes it is possible to calculate the expected values of other attributes. E.g.when we enter component size, developer expertise, and maintainer expertise into themodel, we can calculate the values of component complexity and system maintainability,c.f. Figure 3.
47
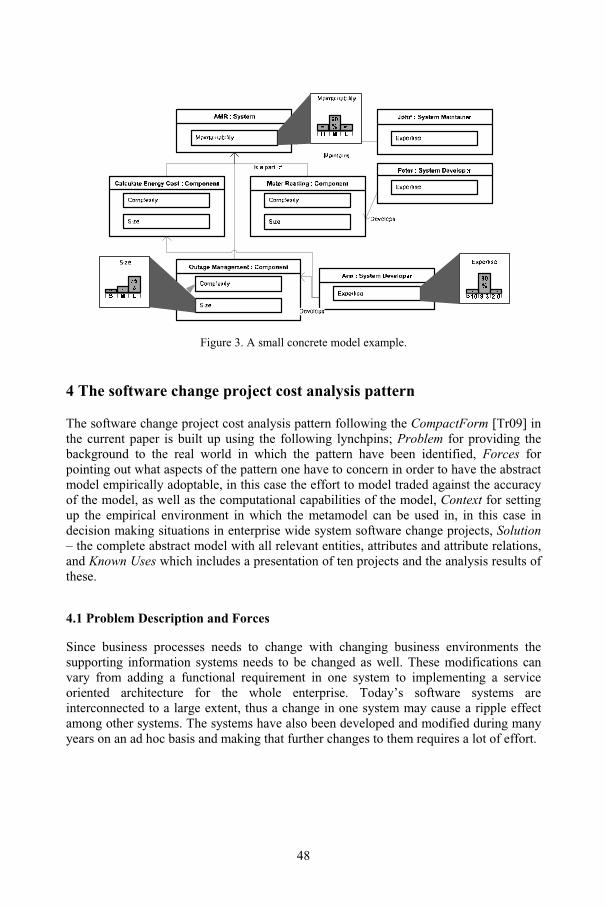
Figure 3. A small concrete model example.
4 The software change project cost analysis pattern
The software change project cost analysis pattern following the CompactForm [Tr09] inthe current paper is built up using the following lynchpins; Problem for providing thebackground to the real world in which the pattern have been identified, Forces forpointing out what aspects of the pattern one have to concern in order to have the abstractmodel empirically adoptable, in this case the effort to model traded against the accuracyof the model, as well as the computational capabilities of the model, Context for settingup the empirical environment in which the metamodel can be used in, in this case indecision making situations in enterprise wide system software change projects, Solution– the complete abstract model with all relevant entities, attributes and attribute relations,and Known Uses which includes a presentation of ten projects and the analysis results ofthese.
4.1 Problem Description and Forces
Since business processes needs to change with changing business environments thesupporting information systems needs to be changed as well. These modifications canvary from adding a functional requirement in one system to implementing a serviceoriented architecture for the whole enterprise. Today’s software systems areinterconnected to a large extent, thus a change in one system may cause a ripple effectamong other systems. The systems have also been developed and modified during manyyears on an ad hoc basis and making that further changes to them requires a lot of effort.
48
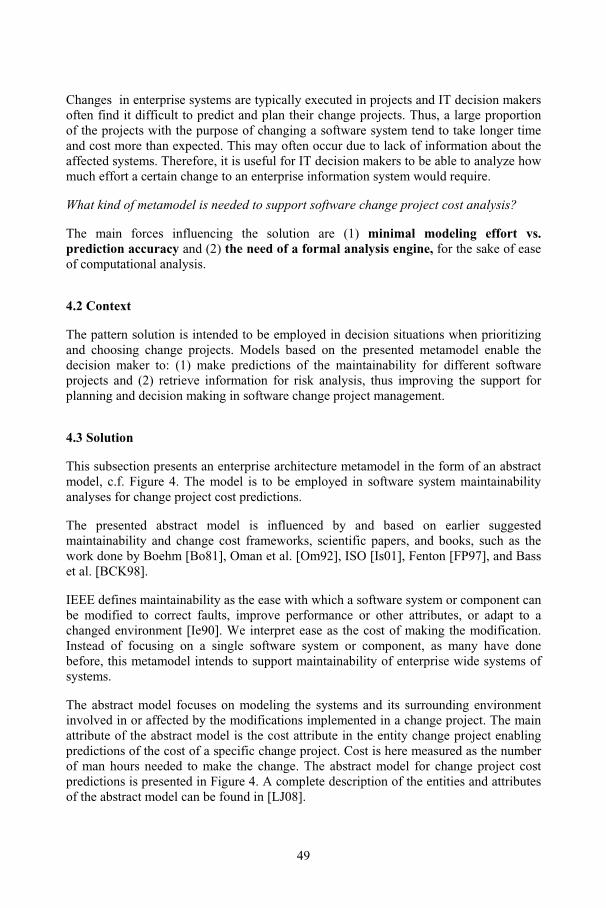
Changes in enterprise systems are typically executed in projects and IT decision makersoften find it difficult to predict and plan their change projects. Thus, a large proportionof the projects with the purpose of changing a software system tend to take longer timeand cost more than expected. This may often occur due to lack of information about theaffected systems. Therefore, it is useful for IT decision makers to be able to analyze howmuch effort a certain change to an enterprise information system would require.
What kind of metamodel is needed to support software change project cost analysis?
The main forces influencing the solution are (1) minimal modeling effort vs.prediction accuracy and (2) the need of a formal analysis engine, for the sake of easeof computational analysis.
4.2 Context
The pattern solution is intended to be employed in decision situations when prioritizingand choosing change projects. Models based on the presented metamodel enable thedecision maker to: (1) make predictions of the maintainability for different softwareprojects and (2) retrieve information for risk analysis, thus improving the support forplanning and decision making in software change project management.
4.3 Solution
This subsection presents an enterprise architecture metamodel in the form of an abstractmodel, c.f. Figure 4. The model is to be employed in software system maintainabilityanalyses for change project cost predictions.
The presented abstract model is influenced by and based on earlier suggestedmaintainability and change cost frameworks, scientific papers, and books, such as thework done by Boehm [Bo81], Oman et al. [Om92], ISO [Is01], Fenton [FP97], and Basset al. [BCK98].
IEEE defines maintainability as the ease with which a software system or component canbe modified to correct faults, improve performance or other attributes, or adapt to achanged environment [Ie90]. We interpret ease as the cost of making the modification.Instead of focusing on a single software system or component, as many have donebefore, this metamodel intends to support maintainability of enterprise wide systems ofsystems.
The abstract model focuses on modeling the systems and its surrounding environmentinvolved in or affected by the modifications implemented in a change project. The mainattribute of the abstract model is the cost attribute in the entity change project enablingpredictions of the cost of a specific change project. Cost is here measured as the numberof man hours needed to make the change. The abstract model for change project costpredictions is presented in Figure 4. A complete description of the entities and attributesof the abstract model can be found in [LJ08].
49
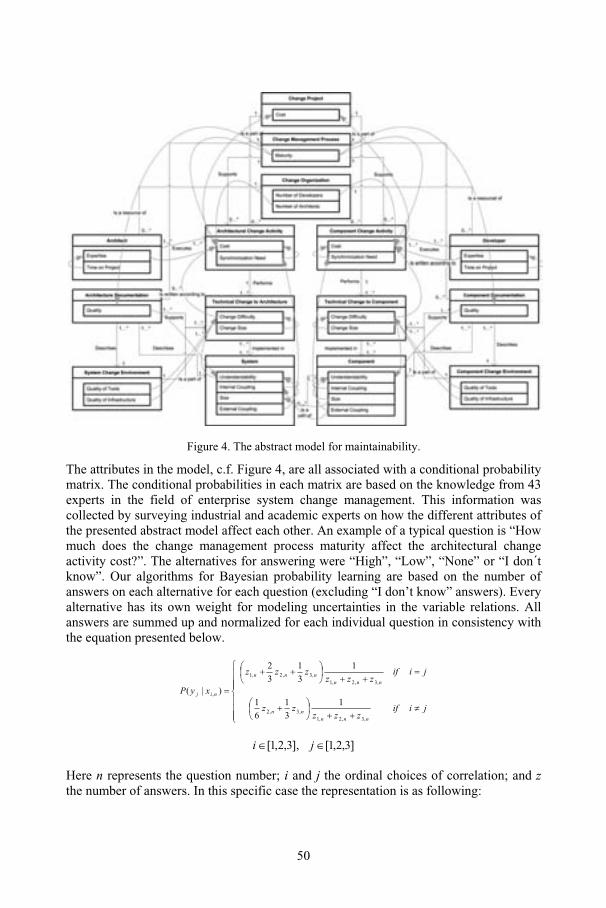
Figure 4. The abstract model for maintainability.
The attributes in the model, c.f. Figure 4, are all associated with a conditional probabilitymatrix. The conditional probabilities in each matrix are based on the knowledge from 43experts in the field of enterprise system change management. This information wascollected by surveying industrial and academic experts on how the different attributes ofthe presented abstract model affect each other. An example of a typical question is “Howmuch does the change management process maturity affect the architectural changeactivity cost?”. The alternatives for answering were “High”, “Low”, “None” or “I don´tknow”. Our algorithms for Bayesian probability learning are based on the number ofanswers on each alternative for each question (excluding “I don’t know” answers). Everyalternative has its own weight for modeling uncertainties in the variable relations. Allanswers are summed up and normalized for each individual question in consistency withthe equation presented below.
⎪⎪⎪
⎩
⎪⎪⎪
⎨
⎧
≠++
⎟⎠⎞
⎜⎝⎛ +
=++
⎟⎠⎞
⎜⎝⎛ ++
=
jiifzzz
zz
jiifzzz
zzz
xyP
nnnnn
nnnnnn
nij
,3,2,1,3,2
,3,2,1,3,2,1
,
1
3
1
6
1
1
3
1
3
2
)|(
]3,2,1[],3,2,1[ ∈∈ ji
Here n represents the question number; i and j the ordinal choices of correlation; and zthe number of answers. In this specific case the representation is as following:
50
z1,n = number of High effectanswers on question n
z2,n = number of Low effectanswers on question n
z3,n = number of No effectanswers on question n
When there is more than one variable affecting the outcome then there will be a jointprobability relation. A representation of the joint probability between questions 1 ! m isrepresented as P(Y|X1,…,Xm). For each answer alternative i with relating outputcorrelation j the joint probability is calculated as
∑=
=m
n
nijmiij m
xyPxxyP
1
,,1,
)|(),...,|(
The outcome of the presented expert elicitation method is complete conditionalprobability matrices for all attributes in the abstract model. [La09]
4.4 Known Uses
In section 3 a short example was provided in order to show how abstract models can beused and how abstract models turn into concrete models. This section illustrates thepresented maintainability abstract model´s capability of predicting the cost order ofchange projects using two different case studies. In the first case eight projects, C-J,within a large Nordic manufacturing company was studied. The second case consideredtwo projects, A-B, conducted within a Nordic consultancy firm. In the subsequentsubsections we first present Project F in more detail to show how the abstract model canbe employed and secondly the actual predictions of the cost order for the ten projects arelisted, and compared to the actual cost order of the projects, as can be seen in Table 2.
Project F was initiated since the company predicted increased sales and thus an increasedamount of employed products. To still be able to manage the sold products a newfunction in the Product Management Portal was needed. In addition to this, a moresecure, redundant and scalable server environment was needed to be set up along thedevelopment of the new software application. The project had several objectivesconcerning improvement of the product management business, namely; to reduce theamount of hours spent on administration related to product management, to improve thesupport for the distributors of the products, to improve the quality of current services, toobtain a scalable, redundant and secure communication infrastructure and to future proofthe communication and server environment in terms of the functionality they will be ableto incorporate.
51
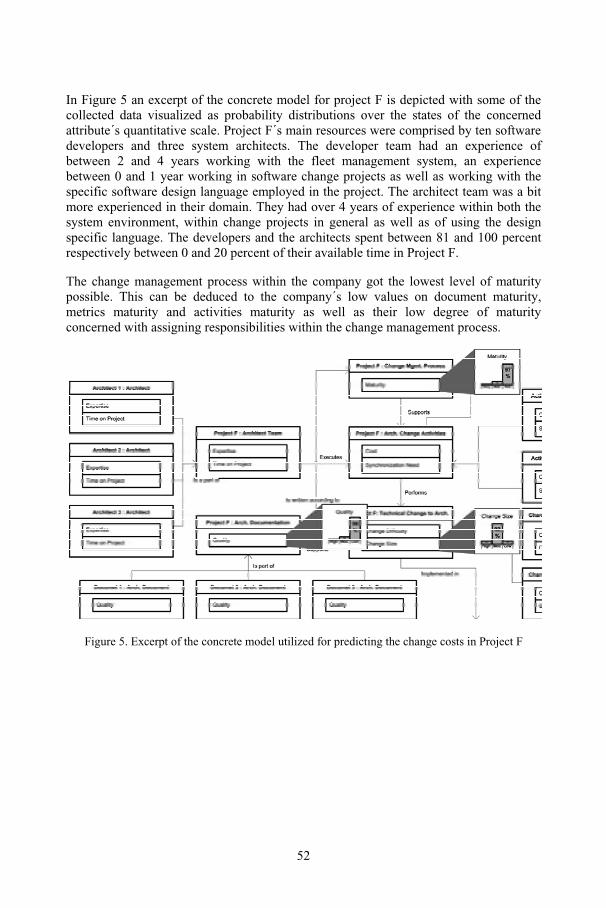
In Figure 5 an excerpt of the concrete model for project F is depicted with some of thecollected data visualized as probability distributions over the states of the concernedattribute´s quantitative scale. Project F´s main resources were comprised by ten softwaredevelopers and three system architects. The developer team had an experience ofbetween 2 and 4 years working with the fleet management system, an experiencebetween 0 and 1 year working in software change projects as well as working with thespecific software design language employed in the project. The architect team was a bitmore experienced in their domain. They had over 4 years of experience within both thesystem environment, within change projects in general as well as of using the designspecific language. The developers and the architects spent between 81 and 100 percentrespectively between 0 and 20 percent of their available time in Project F.
The change management process within the company got the lowest level of maturitypossible. This can be deduced to the company´s low values on document maturity,metrics maturity and activities maturity as well as their low degree of maturityconcerned with assigning responsibilities within the change management process.
Figure 5. Excerpt of the concrete model utilized for predicting the change costs in Project F
52
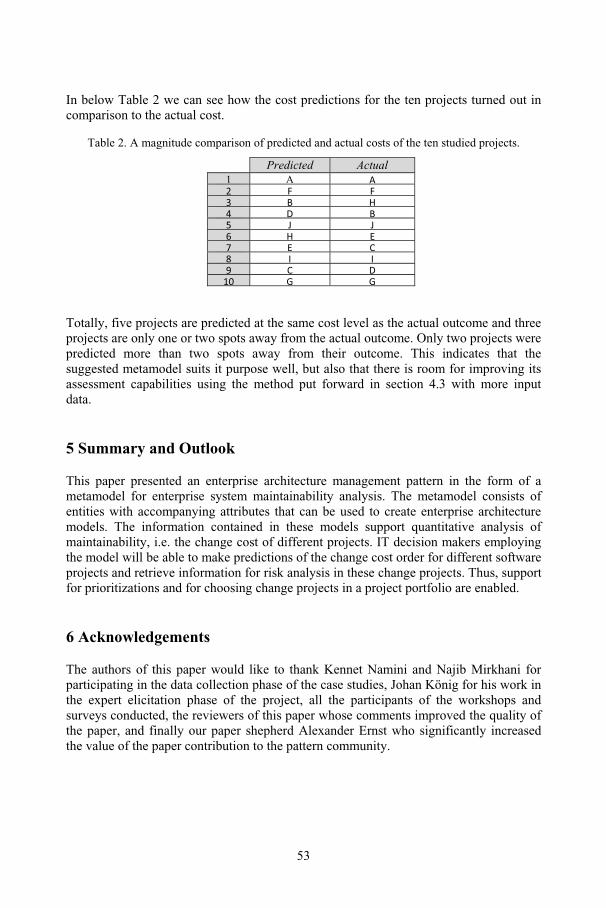
In below Table 2 we can see how the cost predictions for the ten projects turned out incomparison to the actual cost.
Table 2. A magnitude comparison of predicted and actual costs of the ten studied projects.
Predicted Actual1 A A2 F F3 B H4 D B5 J J6 H E7 E C8 I I9 C D10 G G
Totally, five projects are predicted at the same cost level as the actual outcome and threeprojects are only one or two spots away from the actual outcome. Only two projects werepredicted more than two spots away from their outcome. This indicates that thesuggested metamodel suits it purpose well, but also that there is room for improving itsassessment capabilities using the method put forward in section 4.3 with more inputdata.
5 Summary and Outlook
This paper presented an enterprise architecture management pattern in the form of ametamodel for enterprise system maintainability analysis. The metamodel consists ofentities with accompanying attributes that can be used to create enterprise architecturemodels. The information contained in these models support quantitative analysis ofmaintainability, i.e. the change cost of different projects. IT decision makers employingthe model will be able to make predictions of the change cost order for different softwareprojects and retrieve information for risk analysis in these change projects. Thus, supportfor prioritizations and for choosing change projects in a project portfolio are enabled.
6 Acknowledgements
The authors of this paper would like to thank Kennet Namini and Najib Mirkhani forparticipating in the data collection phase of the case studies, Johan König for his work inthe expert elicitation phase of the project, all the participants of the workshops andsurveys conducted, the reviewers of this paper whose comments improved the quality ofthe paper, and finally our paper shepherd Alexander Ernst who significantly increasedthe value of the paper contribution to the pattern community.
53
References
[BCK98] L. Bass, P. Clements and R. Kazman, Software Architecture in Practise, the SEI Series inSoftware Engineering, Addison Wesley Longman, 1998.
[Bo81] B. Boehm, Software Engineering Economics, Prentice Hall, 1981.[Cu02] F. Cummins, Enterprise Integration – An Architecture for Enterprise Application and
Systems Integration, John Wiley & Sons, 2002.[Er08] A. Ernst, Enterprise Architecture Management Patterns, Pattern Languages of Programs
Conference 2008 (PLoP08), Nashville, 2008.[FP97] N. Fenton and S. Pfleeger, Software Metrics – A Rigorous & Practical Approach,
Second Edition, PWS Publishing Company, 1997.[Ie90] IEEE Standard Glossary of Software Engineering Terminology, IEEE Std 610.12-1990,
ISBN 1-55937-067-X, 1990.[If99] IFAC-IFIP, “Task Force on Architectures for Enterprise Integration Geram - Generalized
enterprise reference architecture and methodology”, Version 1.6, 1999.[Is01] ISO/IEC 9126-1, Software Engineering – Product Quality, 2001.[Je01] F. Jensen, Bayesian Networks and Decision Graphs, Springer-Verlag, 2001.[Jo07] P. Johnson, R. Lagerström, P. Närman, and M. Simonsson, Enterprise Architecture
Analysis with Extended Influence Diagrams, Information Systems Frontiers, Vol. 9, No2, May 2007.
[La05] M. Lankhorst et al., Enterprise Architecture at Work – Modelling, Communication, andAnalysis, Springer-Verlag, 2005.
[La07] R. Lagerström, Analyzing System Maintainability using Enterprise Architecture Models,Journal of Enterprise Architecture, November 2007.
[La09] R. Lagerström, P. Johnson, D. Höök, and J. König, Software Change Project CostEstimation – A Bayesian Network and a Method for Expert Elicitation, Accepted to theSoftware Quality and Maintainability (SQM) workshop, 2009.
[LJ08] R. Lagerström and P. Johnson, Using Architectural Models to Predict the Maintainabilityof Enterprise Systems, In Proceedings of the 12th European Conference on SoftwareMaintenance and Reengineering, April 2008.
[Ni06] K. Niemann, From Enterprise Architecture to IT Governance – Elements of Effective ITManagement, Friedr. Vieweg & Sohn Verlag, 2006.
[OFS03] C. O’Rourke, N. Fishman, and W. Selkow, Enterprise Architecture – Using the ZachmanFramework, Thomson Learning, 2003.
[Om92] P. Oman, J. Hagemeister and D. Ash, “A Definition and Taxonomy for SoftwareMaintainability”, SETL Report #91-08 TR, University of Idaho, Moscow, ID 83843,1992.
[Op05] The Open Group, “The Open Group Architecture Framework”, Version 8, 2005.[SH92] S.H. Spewak and S.C. Hill, Enterprise Architecture Planning - Developing a Blueprint
for Data, Applications and Technology, John Wiley and Sons, 1992.[Tr09] Ben Tremblay, CompactForm, http://c2.com/cgi/wiki?CompactForm, 24 Feb. 2009.[Za87] J. Zachman, “A framework for information systems architecture”, IBM Systems Journal,
26(3), 1987.
54
Patterns for Enterprise-wide SOA
Borjan Cace
CaceConsultJan de Beijerhof 14
1191ep Ouderkerk aan de AmstelThe Netherlands
Abstract: Service Oriented Architecture has entered the mainstream of businessapplications and articles about SOA continue to proliferate. However, texts thatshare people‟s real-life experiences with SOA are scarce. Partly this can beattributed to difficulties in sharing architectural knowledge in a structured way.This article calls for more effort to be put into sharing knowledge througharchitectural patterns. That is done by describing concrete patterns that haveemerged in the SOA practice of information-intensive enterprises. Fellowarchitects are invited to join the effort of „Via Nova Architectura‟ (www.via-nova-architectura.org) and share their experiences through patterns.
1 Introduction
There are thousands of articles offering advice on SOA; there are “do‟s and don‟ts” allover the Internet. Consultants, integrators, product vendors … all those people want totell the rest of the world how to aim the new silver bullet in the right direction. Howcome so many people know what others should do with SOA? How do we know whatcan be trusted?
I do not feel that there is much to be gained by analyzing all that is being written fromthe perspective of the parties selling products or services. It would be much moreeffective to look at SOA from the perspective of the enterprise and ask „what solutionshave worked and what have failed? What real-life problems have been successfullytackled by service orientation?‟One way to do this is to describe the recurring problems and the associated, well-provenarchitectural solutions that involve service orientation. In other words, let‟s look for theviable architectural patterns that are based on SOA. For that purpose, in this article Iwill describe two patterns common to information-intensive enterprises such as insurers,banks and government agencies.
The problem domain addressed by these patterns is associated with the delivery ofbusiness services to customers/citizens. The services we are concerned with aredelivered by information systems. For example, local authorities issue a variety ofpermits; tax offices make decisions on tax returns; government agencies process requestsfor welfare support and decide on eligibility; insurance companies process insuranceapplications and claims and so on. All these services are information-intensive and theservice fulfillment has been automated to a large extent. What architecture helps those
55
information-intensive organizations to really deserve the label e-Business or e-Government?
Please note:
a) The solutions I am describing in this article are not my invention - mycontribution is to describe those solutions as patterns.
b) The patterns are strongly related to service orientation but we should not labelthem as „SOA patterns‟. Service orientation is one essential aspect of thesesolutions but not the only one.
c) By saying „Architecture Patterns for the Enterprise‟, the broad scope of thesepatterns is emphasized, namely, the entire enterprise. This does not imply that Iam writing about „Enterprise Architecture‟ as a theme.
There are several standard ways to write patterns - one of these has been agreed upon forthe „Via Nova Architectura‟ site. However, for the time being and for practical reasons, Iam pursuing another way and use the original „Alexandrian‟ form [Al77]; patternswritten in that way (more narrative than structured) can be embedded more easily in anarticle.
In the following section, I have summarized the essence of SOA as an architectural style.That paragraph can then be used as the reference point for the claim that SOA alsocontributes to solving real-life problems, being more than just hype. Subsequently, twopatterns are described. Some other pattern sources are referred to, this in order toproperly re-use the work done elsewhere and put the patterns described here into context.
2 What Makes a Solution Service Oriented?
If we want to attribute any solution to Service Oriented Architecture, we need to agreewhat that architecture is, and what makes it different. I have elaborated on this in anotherVia Nova article: „SOA Terminology and the SOA Reference Model of OASIS‟ [Ca08],so I will quote from there and start with the definition of OASIS [OA06]:
“Service Oriented Architecture is a paradigm for organizing and utilizing distributedcapabilities that may be under the control of different ownership domains. It provides auniform means to offer, discover, interact with and use capabilities to produce desiredeffects consistent with measurable preconditions and expectations.”We can use this definition as an anchor point to emphasize the three main characteristicsof service orientation:
1. „Distributed capabilities‟ means that SOA is concerned with software components1.Those components have independent life-cycles and interact in a certain way whichwe call „service-oriented‟: some components offer services (sets of individualfunctions called operations) and others (service consumers or clients) consume those
1 The term software components used here is by no means related to “Component Based Development” (CBD).The term is used in a general sense to designate a piece of software, a programmatic entity; an application isconsidered a „component‟ too. Also it needs to be stressed here that this definition excludes interactions thatare not programmatic, i.e. those that do not take place between programmatic entities. This is not in line withthe definition of the Reference Model of OASIS [OASIS, 2006] which extends SOA to services that areaccessed not only programmatically, but also through human interactions. I consider that wrong. There is nopoint in extending a relatively new concept (SOA) over concepts that have existed for hundreds of years.
56
services. SOA is an architectural style that focuses on leveraging those service-oriented interactions.
2. The interacting software components “may be under the control of differentownership domains”. This means that the components have independent life-cyclesand the level of coupling should be minimized, i.e. the components in SOA must be„loosely coupled‟. The fundamental aspect of „loose coupling‟ in SOA is that theservice interfaces are defined as separate entities and that the usage of theseinterfaces is further formalized in contracts.
3. SOA is a solution in the context of „business applications‟, i.e. the software that ispart of information systems in businesses. In that context, the central issue beingaddressed is the ability to expose specific business functionality as a set of softwarefunctions and to have that business functionality consumed by other softwarecomponents.
To summarize, SOA makes interactions between software components with independentlife-cycles viable, something which could make the IT architecture truly adaptive on theenterprise scale (please note here that significant numbers of integration solutions wereservice oriented much before the term „Service Oriented Architecture‟ has beenintroduced) The promise of this new architectural style is that the software componentscan behave like business units and by collaborating can grow together into a „system-of-systems‟.
3 Choice of Architecture Patterns
There is no doubt that patterns cannot exist in isolation. If we believe that patterns are ameans to describe knowledge, we also have to recognize that those chunks of knowledgeare interdependent. A pattern supports some larger patterns and is supported by patternson a lower conceptual level. That is what makes it difficult to start writing patterns:where to start from and where to end? How can we connect to the existing body ofknowledge?
The choice of patterns described in this text is pragmatic and focuses on the mostcommon SOA solutions for „multi-channeling‟, a business approach to deliver servicesto customers or citizens by using multiple interaction channels. Multi-channeling iscommon in information-intensive organizations like government agencies, insurancecompanies and banks. Two patterns often used to tackle the multi-channeling issues areelaborated. The patterns deal with the application architecture.
Figure 1 depicts this relationship between patterns (arrows are directing from 'larger'patterns to 'smaller' ones). The diagram is intended to be more indicative than exhaustiveand definite. However, it shows how we could build a cohesive pattern language toprovide the optimal solution for multi-channeling.
Only two of the patterns shown in the Figure 1 are described in this article; others can befound in the wiki of the online magazine „Via Nova Architectura‟ [SK09].
57
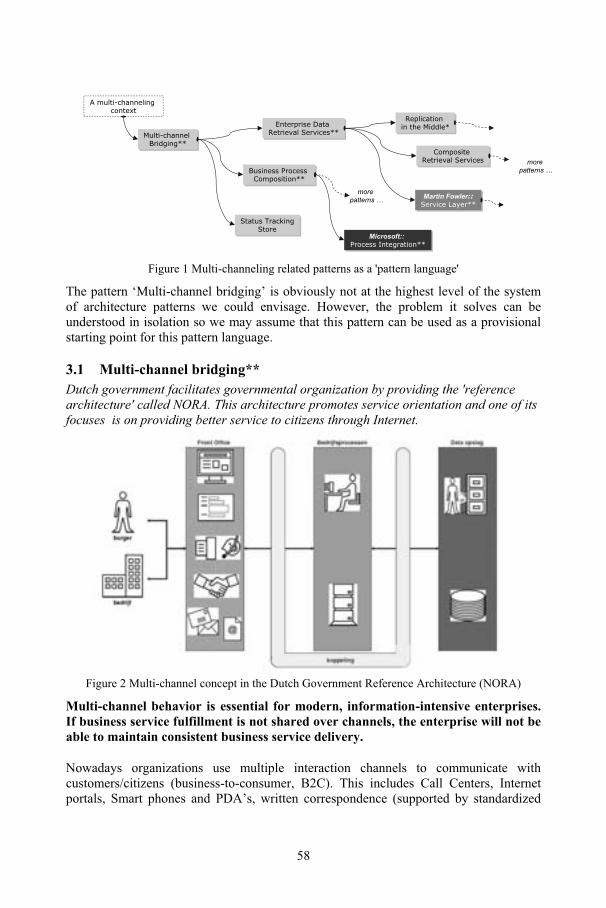
58
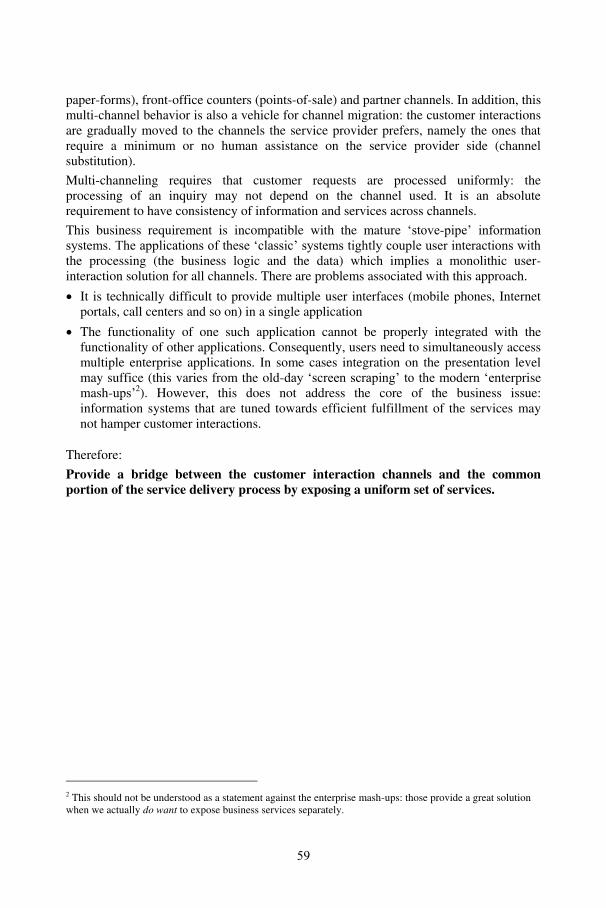
paper-forms), front-office counters (points-of-sale) and partner channels. In addition, thismulti-channel behavior is also a vehicle for channel migration: the customer interactionsare gradually moved to the channels the service provider prefers, namely the ones thatrequire a minimum or no human assistance on the service provider side (channelsubstitution).
Multi-channeling requires that customer requests are processed uniformly: theprocessing of an inquiry may not depend on the channel used. It is an absoluterequirement to have consistency of information and services across channels.
This business requirement is incompatible with the mature „stove-pipe‟ informationsystems. The applications of these „classic‟ systems tightly couple user interactions withthe processing (the business logic and the data) which implies a monolithic user-interaction solution for all channels. There are problems associated with this approach.
It is technically difficult to provide multiple user interfaces (mobile phones, Internetportals, call centers and so on) in a single application
The functionality of one such application cannot be properly integrated with thefunctionality of other applications. Consequently, users need to simultaneously accessmultiple enterprise applications. In some cases integration on the presentation levelmay suffice (this varies from the old-day „screen scraping‟ to the modern „enterprisemash-ups‟2). However, this does not address the core of the business issue:information systems that are tuned towards efficient fulfillment of the services maynot hamper customer interactions.
Therefore:
Provide a bridge between the customer interaction channels and the commonportion of the service delivery process by exposing a uniform set of services.
2 This should not be understood as a statement against the enterprise mash-ups: those provide a great solutionwhen we actually do want to expose business services separately.
59
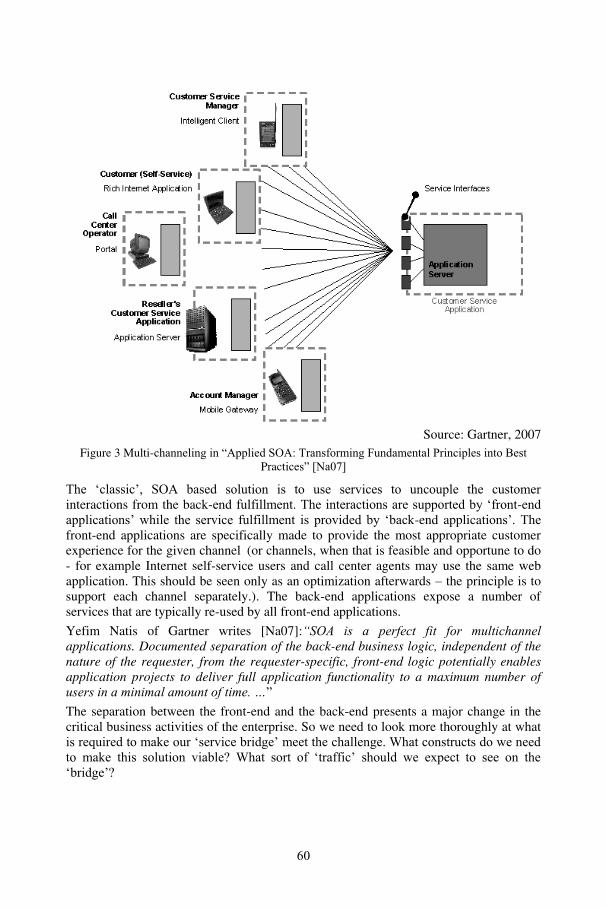
Source: Gartner, 2007Figure 3 Multi-channeling in “Applied SOA: Transforming Fundamental Principles into Best
Practices” [Na07]
The „classic‟, SOA based solution is to use services to uncouple the customerinteractions from the back-end fulfillment. The interactions are supported by „front-endapplications‟ while the service fulfillment is provided by „back-end applications‟. Thefront-end applications are specifically made to provide the most appropriate customerexperience for the given channel (or channels, when that is feasible and opportune to do- for example Internet self-service users and call center agents may use the same webapplication. This should be seen only as an optimization afterwards – the principle is tosupport each channel separately.). The back-end applications expose a number ofservices that are typically re-used by all front-end applications.
Yefim Natis of Gartner writes [Na07]:“SOA is a perfect fit for multichannelapplications. Documented separation of the back-end business logic, independent of thenature of the requester, from the requester-specific, front-end logic potentially enablesapplication projects to deliver full application functionality to a maximum number ofusers in a minimal amount of time. …”The separation between the front-end and the back-end presents a major change in thecritical business activities of the enterprise. So we need to look more thoroughly at whatis required to make our „service bridge‟ meet the challenge. What constructs do we needto make this solution viable? What sort of „traffic‟ should we expect to see on the„bridge‟?
60
In order to understand the implications of this pattern, let us look at the functionality ofthe back-end services. That functionality can be logically clustered into three groups:
We need services that provide business functions that correspond to customerinquiries.
Also, there will be services that expose some business logic that is common tomultiple channel applications, to augment the first group of services. This includesaccess to diverse supporting functions like business rules, server-side datavalidations, inventory checks and the like.
Finally, there will be services providing access to all other enterprise content thatare not directly associated with any individual customer.
The first group can be further subdivided into services that:
a) Process requests for a business service delivery;b) Retrieve customers‟ personal data such as address, contract information,
previous purchases and so on;c) Update customers‟ personal data such as e-mail address and telephone number;d) Provide access to the status of a process initiated earlier.
These services correspond strongly to the use cases that capture the most commoncustomer interaction with the enterprise. That is to be expected, as enterprisesintentionally push the implementation of business functionality into the back-end asmuch as possible.
These use cases, narrowed down to the context of a local authority self-service portal areshown in the following figure. The portal enables citizens to acquire permits from theirlocal authority.
Requestpermit
Inquirestatus of therequestprocessing
Set contactinformation(Email,phone,..)
Retrieveinformation
Citizen
Figure 4: Example use cases for an e-Government self-service: requesting a localauthority permit
61
The functionality associated with these use cases can only be implemented in the back-end systems, which means that we effectively propagate the user‟s requests into thosesystems.
That imposes some challenges regarding the synchronicity of the services. In SOA, wetypically prefer all services to be asynchronous – this to allow for better utilization ofresources and to keep implementation costs low. However, asynchronous interactions areinappropriate in the case of services that are exposed to channels; the functionality of theservices is part of the interaction with the end-user. To match the customer expectations,those services must be synchronous, available 24/7 and high-performing. This appliesnot only to information retrievals; even some transactions need to be functionallysynchronous, like updating a telephone number, an email address or a bank-accountnumber.
On the other hand, service fulfillment is almost always asynchronous by nature (andcustomers do not expect anything else). The process may involve human interaction or itmay be dependent on some external system which imposes unavoidable delays. In otherwords, the service fulfillment mostly commonly requires a long-lived process.
Based on this analysis we can group all operations as follows:
1. Non intrusive operations (information retrievals), all synchronous (retrieval ofcustomer data, retrieval of other enterprise content and diverse supportingfunctions such as data validations)
2. Transactions that require functionally straight-through processing - allsynchronous (simple updates)
3. Long-lived transactions – asynchronous (the most business service fulfillments)
This grouping of operations imposes constraints that need to be considered whenconstructing solutions based on this pattern. How to ensure 24/7 availability? How toachieve the best response times? These have to be addressed by smaller patterns, someof which are suggested later in this paragraph.
To summarize, disregarding these considerations, we can conclude that there should beno substantial obstacles to realize this pattern.
Ensure that synchronous services are performing well - use the patterns available fromyour technology vendor (Java or .NET, for example).
The asynchronous, long-lived transactions should be modeled as automated processes -consider the BUSINESS PROCESS COMPOSITION pattern.
Use ENTERPRISE DATA RETRIEVAL SERVICES [SK09]. If combined views overmultiple data sources are required in multiple channels, consider COMPOSITERETRIEVAL SERVICES [SK09]. Performance issues can be addressed byREPLICATION IN THE MIDDLE [SK09].
Examine the implications for security and transactional integrity arising from the use ofservices. Select patterns that are best matching your technology choices (J2EE, .NETetc).
62
4 Some Other Patterns and Pattern Sources
Patterns should be more valuable as part of a larger collection of patterns, disregardingthe distinction between a „mere catalogue‟ and a real „pattern language‟. A collection ofpatterns provides a framework that guides the user into a certain way of thinking whenanalyzing the problem domain. For that reason, an isolated pattern or a small collectionsuch as the one presented in this article may be harder to use.
In my search for a catalogue (or language) that would be suitable to „host‟ the patternsdescribed here I have only identified one publicly accessible pattern source that appearedcoherent and well thought out, namely the collection of IBM‟s Patterns for e-business[Ad01], [IBM08].
4.1 IBM Patterns for e-businessThis collection constitutes a system of patterns that aims to help enterprises „to develope-business solutions. IBM also defines the process that has to be followed in using thepatterns: development starts by identifying business patterns from the requirements,continues via two layers of „smaller‟ patterns and ends with product mappings.In the IBM process, the step after selecting a business pattern is to select the appropriateApplication pattern3. Those patterns present the user with choices about how to partitionthe application logic between the logical tiers and to select the styles of interactionbetween the logic tiers. Subsequently, a Run Time pattern which would provide you witha grouping of functional requirements into nodes has to be selected.
Perhaps it‟s needless to say that the product mappings of the IBM literature lead you toIBM products. However, this does not disqualify their system; other, non-IBM productscan also be used (There is at least one implementation based on Microsoft technology).
Of the four business patterns defined by IBM, two can be directly related to the patternsdescribed here:
EXTENDEDENTERPRISE
“The Extended Enterprise business pattern (aka Business-to-Business or B2B) addresses the interactions and collaborationsbetween business processes in separate enterprises. This patterncan be observed in solutions that implement programmaticinterfaces to connect inter-enterprise applications.” [IBM08]
SELF-SERVICE “Also known as the User-to-Business pattern, Self-Serviceaddresses the general case of internal and external usersinteracting with enterprise transactions and data.” [IBM08]
What place would the patterns described in this article have? MULTI-CHANNELBRIDGING would definitely belong to the layer of application patterns [IBM08],despite the fact that the IBM system does not list multi-channeling as a business pattern.The issues of multi-channeling have been recognized as such and discussed in theprocess of selecting an application pattern suitable for SELF-SERVICE; therefore
3 This is simplified by ignoring the Integration and Composite patterns. For better explanations, please refer toIBM‟s sources or to the original book.
63
MULTI-CHANNEL BRIDGING can be placed in the context of IBM‟s businesspatterns.
The other four patterns would also belong to the IBM category of application patterns.The pattern BUSINESS PROCESS COMPOSITION is essentially the same pattern asIBM‟s „EXPOSED SERIAL PROCESS APPLICATION PATTERN‟ [IBM08]. Otherpatterns would complement the IBM collection, but, as the IBM pattern catalogue isdescribed in multiple sources (and appears mainly written for IBM professionals) it isdifficult for an outsider to extend that catalogue. Moreover, the waste multitude ofdocumentation is a problem for anyone intending to use IBM‟s patterns.Please also note here that, unlike in the architecture that deals with cities and buildings,in our field it is not always clear which pattern comes first, which pattern is „larger‟ andwhich is „smaller‟. For example, EXTENDED ENTERPRISE [IBM08] is a pattern to beused in opening an SOA-based partner channel. From the data centric point of view, it isa lower pattern than ENTERPRISE DATA RETRIEVAL SERVICES [SK09]. Contraryto that, thinking from the service delivery point of view, it is an even higher pattern thanMULTI-CHANNEL BRIDGING. However, further discussion would go beyond thescope of this article.
4.2 Other sourcesThe popular, established pattern sources are typically concerned with softwarearchitecture and software design. The best starting point for looking into softwarearchitecture and design patterns is probably the Hillside group site (www.hillside.net).
I also have to mention popular and often-quoted books such as „Pattern-orientedsoftware architecture‟ [Bu96], „Patterns of Enterprise Application Architecture‟ [Fo02],„Enterprise Integration Patterns‟ [Ho03], and, of course, the book of the gang-of-four(Erich Gamma, Richard Helm, Ralph Johnson, and John Vlissides), „Design Patterns:Elements of Reusable Object-Oriented Software‟ [Ga94]. However, there is a substantialproblem with patterns published in a book: those patterns cannot be actively maintained.As Rebecca Wirfs-Brock said in her blog [Wi06]: “… I don‟t expect patterns to be fixedand unchangeable. They should wiggle around a bit. But I like thoughtful discussionsand reasonable examples … Currently, most patterns are copyrighted by authors andare locked up in relatively static media - books or conference proceedings or magazinearticles - or static online versions of the same. There‟s no central source, no commonrepository for a growing body of pattern wisdom gained from experience. So whenpattern interpretations shift, as they invariably do, it is in a quirky ad hoc manner …”Microsoft‟s „Enterprise Architecture, Patterns and Practices‟ site is a large andimpressive source of information regarding software architecture (of course, restricted toMicrosoft technology). A catalogue of patterns for building Enterprise Applications in.NET technology has been also published in book form [MS03].
Some sources list SOA-specific patterns. One of these is A. Arsanjani‟s article „Towarda pattern language for Service-Oriented Architecture and Integration, Part 1: Build aservice eco-system‟ [Ar05]. A source that may be of interest is Thomas Erl‟s „SOAPatterns‟ site (www.soapatterns.org). It is actually the companion site to a new book, notyet available at the moment of writing.
64
5 Final Thoughts and Conclusions
“…We hope, of course, that many of the people who read, and use this language, will tryto improve these patterns—will put their energy to work, in this task of finding more
true, more profound invariants—and we hope that gradually these more true patterns,which are slowly discovered, as time goes on, will enter a common language, which all
of us can share.”Christopher Alexander in „A Pattern language‟, 1977 [Al77]
In this article I have elaborated on SOA‟s role in resolving the issues associated withmulti-channeling. My goal has been twofold:
to describe some proven SOA solutions for concrete problems;
to describe the solutions as patterns.
Regarding the first goal:
There is no need to prove that Service Oriented Architecture significantly contributestowards resolving issues associated with e-business and e-government - there is broadconsensus on that. However, browsing through publicly available sources I have beensurprised how little has been written by way of concrete examples. This is in starkcontrast to the numerous articles elaborating on things of secondary importance. Butthen, one could attribute this situation to the viewpoint taken by most writers; mostpublicly available SOA articles are not written from the perspective of an enterprise.
One should not view SOA as something that comes first, as a kind of precondition.Instead, SOA should be well understood but used only when its use is appropriate. Thepatterns described in this article depend on SOA, but not because I am pushing SOAsolutions. Rather, I have selected the problem domain (multi-channeling) for which Iknew beforehand that it could best be solved by introducing service interactions.
Regarding the second goal, writing patterns;
I have followed the advice of Martin Fowler [Fo06] and used the pattern form which Ibelieved to be the most suitable for me. Writing narrative text appeared easier at the timethan structuring the information in a more detailed pattern template. However,describing patterns in an article can only be the first step. Like all other instructions,patterns must be unambiguous, clear and perfectly up-to-date with technologicaladvances. To achieve that, one must continually update pattern descriptions as necessary.The form of an article is definitely unsuitable for that, while wiki‟s, for example, aremeant just for that purpose. Moreover, a wiki collection of patterns can grow andpatterns published can easily be connected with other pattern sources.
Nowadays few architecture practitioners would question that explicitly describedpatterns are useful in capturing chunks of architectural knowledge. However, one shouldalso be aware of the difference between architecture that deals with information systemsand IT components and that which deals with cities, streets, promenades, houses and soon. Urban planning and the architecture of buildings, which constitute the domain ofAlexander‟s patterns, have existed for thousands of years. Our field is very different - weare in the middle of an overheated, run-away technological evolution. The patterns ofenterprise-wide IT solutions have all emerged in recent years and some will probablydisappear in less than a decade. However, perhaps that in itself makes the case for the
65
patterns in our field even stronger. We deal with knowledge that needs to be used now,and patterns open the possibility to communicate that knowledge in a structured way, yetwithout unnecessary layers of abstractions. In other words: the patterns for enterprise wecan recognize now are perhaps already destined to retire, but can still be extremelyvaluable at this moment.
Last but not least how to improve the patterns described in this article? These patternsare already available in the wiki of the online magazine „Via Nova Architectura‟ [SK09],an open repository of patterns and anti-patterns. The colleague practitioners are invitedto join the community and contribute to the free exchange of architecture knowledge.
References[Ad01] J. Adams et al: “Patterns for E-Business: A Strategy for Reuse”, IBM Press, Oct. 31,
2001, ISBN-1931182027 (the most of the contents also available in [IBM08] and theso called “Red Books” of IBM)
[Al77] C. Alexander et al, “A Pattern Language”, Oxford University Press, 1977[Ar05] A. Arsanjani, “Toward a pattern language for Service-Oriented Architecture and
Integration, Part 1: Build a service eco-system”, IBM,http://www.ibm.com/developerworks/webservices/library/ws-soa-soi/
[Bu96] F. Buschmann, R. Meunier, H. Rohnert, P.Sommerlad, M. Stal, “Pattern-orientedsoftware architecture, Volume 1” Wiley, 1996, ISBN-0471958697.
[Ca08] B. Cace, “SOA Terminology and the „SOA Reference Model‟ of OASIS”, Via NovaArchitectura, http://www.via-nova-architectura.org/magazine/reviewed/soa-terminology-and-the-soa-reference-model-of-oasis.html
[Fo02] M. Fowler, “Patterns of Enterprise Application Architecture”, Addison-Wesley, 2002,ISBN-0321127420
[Fo06] M. Fowler, “Writing Software Patterns”,http://www.martinfowler.com/articles/writingPatterns.html
[Ga94] E. Gamma et al, “Design Patterns: Elements of Reusable Object-Oriented Software”,Addison-Wesley, 1994, ISBN-0201633612
[Ho03] G. Hohpe and B. Woolf, “Enterprise Integration Patterns”, Addison-Wesley, 2003,ISBN-0321200683
[IBM08] IBM‟s developerWorks site, IBM Patterns for e-business, http://www-128.ibm.com/developerworks/patterns/index.html and http://www-128.ibm.com/developerworks/patterns/library/index.html
[MS03] “Enterprise Solution Patterns Using Microsoft .Net: Version 2.0 : Patterns &Practices”, Microsoft, ISBN-0735618399 (also available fordownload:http://www.microsoft.com/downloads/details.aspx?familyid=3C81C38E-ABFC-484F-A076-CF99B3485754&displaylang=en)
[Na07] Y. Natis, “Applied SOA: Transforming Fundamental Principles Into Best Practices”,Gartner Research Note Id G00147098, 4 April 2007, http://www.gartner.com
[OA06] “Reference Model for Service Oriented Architecture V1.0” OASIS, CommitteeSpecification 1, 2 August 2006, http://www.oasis-open.org/committees/download.php/19679/soa-rm-cs.pdf
[SK09] “Sharing Knowledge of Enterprise Architecture through Patterns” site (link to „ViaNova Architectura‟ wiki: http://www.skeap.nl/Browser/Patterns/P4/Multi-channel.htm)
[Wi06] R.Wirfs-Brock, “Rebecca‟s blog: Pattern Drift”, http://www.wirfs-brock.com/2006/01/pattern-drift.html
66
EA Management Patterns for Consolidations after Mergers
Sabine Buckl1, Alexander Ernst1, Harald Kopper2, Rolf Marliani2, Florian Matthes1,Peter Petschownik2, Christian M. Schweda1
1Lehrstuhl fur Informatik 19 (sebis)Technische Universitat Munchen
Boltzmannstr. 385748 Garching
{buckls,ernst,matthes,schweda}@in.tum.de
2Nokia Siemens NetworksTolzer Straße 3581379 Munchen
{harald.kopper,rolf.marliani,peter.petschownik}@nsn.com
Abstract: Mergers between enterprises or carved-out parts thereof are a common phe-nomenon in todays economic environment. They nevertheless form a major challengefor enterprise architects, who have to consolidate, i.e. to harmonize and integrate thebusiness capabilities in the newly formed enterprise, reducing redundancy as far aspossible. This article presents a best practice approach to this consolidation endeavor,detailing a methodology to do so together with a supporting viewpoint on the enterprisearchitecture (EA). An information model, which outlines the information demands formethodology execution, is presented to complement the approach.
1 Motivation
Mergers and the post-merger endeavors to integrate and harmonize the enterprises’ busi-ness capabilities are issues often occurring in todays economic environment [ORH01]. Asalmost half of all mergers have been unsuccessful [MH04], making the merger integrationprocess an interesting topic for practitioners and academia.
According to [Pen99] reasons for the high number of mergers in the banking sector aree.g. the reduction of annual cost between 10 and 20 percent, or increased revenues dueto an improved appearance in the market. Two kinds of mergers have to be differentiated.The first and most common one is merger by incorporation and results in the absorptionof the target company. The second one is merger by equals and results in a totally newenterprise built from the previously independent enterprises [GPPS97].
This article documents proven practices for addressing the issues arising in a merger sit-uation in the format of Enterprise Architecture (EA) Management Patterns [BELM08].Three types of EAM patterns are thereby used. Methodology Patterns (M-Pattern) define
67
steps to be taken in order to address a given problem. Viewpoint Patterns (V-Pattern) pro-vide a language used by one or more M-Patterns and thus proposes a way to present datastored according to one or more I-Patterns. Information Model Patterns (I-Pattern) supplyan underlying model for the data visualized in one or more V-Patterns.
These proven practices for a merger situation consider the various questions, which ariseduring the integration and harmonization process – e.g. how to determine the business do-mains of the post-merger enterprise. Consolidating Architectures after Mergers documentsa methodology to addressing these questions, followed by Business Domain-based Capa-bility Roadmap presenting a viewpoint used in the approach and Business Domain-drivenCapability Planning showing, which information is required during the integration.
This article and the herein included EA management patterns are intended for people con-cerned with managing post-merger capability integration and harmonization endeavors.Stakeholders are enterprise architects, application owners, and domain architects.
2 Consolidating Architectures after Mergers
The M-Pattern Consolidating Architectures after Mergers describes a business domain-driven approach to develop a future state of the EA after a merger between previouslyindependent enterprises or parts thereof. The main focus lies on ensuring the businesscontinuity during the transformation process.
2.1 Example
After the merger between a business unit of Nokia and a part of the telecommunicationbranch of Siemens, an integrated future architecture of the newly formed enterprise NokiaSiemens Networks has to be developed. Thereby, decisions on business capabilities neededin the future enterprise have to be taken, leading to questions whether an existing capabilityof one of the previous independent business units is suitable to provide this support or ifthere is a need to provide a new one. A major challenge is to ensure business continuityduring the transformation process. Prior to such advisements, the future business structureof the enterprise should be explicated in order to provide a foundation for the definition offuture business capabilities needed.
2.2 Context
Two or more previously independent enterprises or parts thereof with dedicated businesscapabilities have been merged. The resulting enterprise shares responsibilities and IT en-vironments, which are mostly offered by the mother enterprises1. Thus, the new enterprisehas limited ability to decide on design and deployment of the used business capabilities.
2.3 Problem
You are experiencing problems in overlooking the current state of your EA, as you haveto integrate two or more separately developed architectures? You are missing a clear
1The term mother enterprise in this context refers to the enterprises, which the new enterprise originates from.In the example presented above Nokia and Siemens are the mother enterprises of Nokia Siemens Networks.
68
overview about the current situation and are in trouble of explicating future planningstates? You feel the risk of an unmanaged evolution of the EA due to limited controlover some systems the mother enterprises are in charge of? You want to define a plannedstate for a consolidated EA and intermediate planning steps to achieve this goal? Youare unsure about the impact the transformation might have on the support for your busi-ness? How do you develop a future EA, which provides ideal business capabilities foryour new enterprise, and the intermediate planning steps to achieve this goal whileensuring business continuity during the transformation process?
The following forces influence the solution:
- Business capability integration versus stakeholder resistance: Integrating busi-ness capabilities requires removal of overlap to reduce costs, which may yield resis-tance from the stakeholders involved.
- Costs versus insight: Combining business capabilities requires insight in their re-spective qualities, resulting in higher costs.
- Costs versus contracts: How do you cope with the numerous existing contracts andassociated costs concerning the business capabilities of the preceding enterprises?
- Homogeneity versus heterogeneity: What is a good balance between homogene-ity and heterogeneity concerning business capabilities, which may rely on differenttechnologies, and how can it be achieved?
- Corporate cultures versus balance of power: How do you cope with corporatecultures and account for the balance of power between the parties?
2.4 Solution
The M-Pattern Consolidating Architectures after Mergers addresses the problems describedabove by guiding and documenting the transformation process of two historically grownisolated enterprises to an integrated, standardized one. Thereby, it provides an overviewabout the high-level process to achieve this goal. The single steps mentioned below sum-marize the major tasks, which need to be accomplished. For each of these steps onespecialized M-Pattern details on a methodology how to perform this step. The M-PatternConsolidating Architectures after Mergers can therefore be regarded as an umbrella pat-tern, which is detailed in multiple (Sub-)M-Patterns.
The high-level process starts with the identification of the business domains for the post-merger enterprise, which are used as a business domain framework for the future planningof business capabilities. Thus, the business domains can be used to allocate capabilities,assign responsibilities, etc. Prior to the development of prospective states, the current situ-ation of the enterprise has to be documented according to the business domain framework.Based on these domains, a future post-merger state has to be developed and the transfor-mation process from the current to the post-merger state has to be planned, derived from agap analysis. In the development of a roadmap from current to post-merger state, securingbusiness continuity during the transformation is a major goal of the approach presented.The different planning states of the EA, which have to be considered, are:
- The current state representing the status quo of the EA today,- the planned state representing a to be state of the EA at a specific time in the near
future, and
69
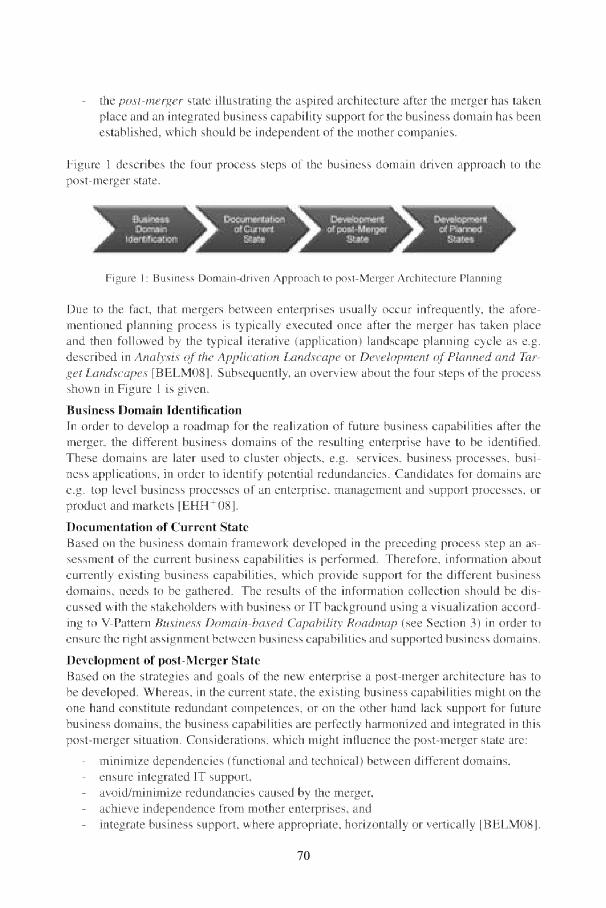
70
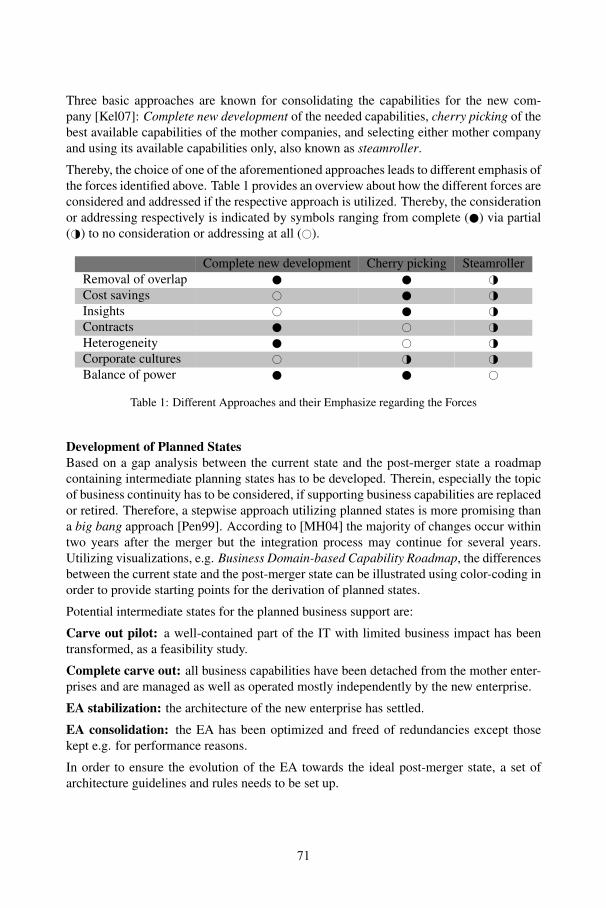
Three basic approaches are known for consolidating the capabilities for the new com-pany [Kel07]: Complete new development of the needed capabilities, cherry picking of thebest available capabilities of the mother companies, and selecting either mother companyand using its available capabilities only, also known as steamroller.
Thereby, the choice of one of the aforementioned approaches leads to different emphasis ofthe forces identified above. Table 1 provides an overview about how the different forces areconsidered and addressed if the respective approach is utilized. Thereby, the considerationor addressing respectively is indicated by symbols ranging from complete (!) via partial("#) to no consideration or addressing at all (#).
Complete new development Cherry picking SteamrollerRemoval of overlap ! ! "#Cost savings # ! "#Insights # ! "#Contracts ! # "#Heterogeneity ! # "#Corporate cultures # "# "#Balance of power ! ! #
Table 1: Different Approaches and their Emphasize regarding the Forces
Development of Planned StatesBased on a gap analysis between the current state and the post-merger state a roadmapcontaining intermediate planning states has to be developed. Therein, especially the topicof business continuity has to be considered, if supporting business capabilities are replacedor retired. Therefore, a stepwise approach utilizing planned states is more promising thana big bang approach [Pen99]. According to [MH04] the majority of changes occur withintwo years after the merger but the integration process may continue for several years.Utilizing visualizations, e.g. Business Domain-based Capability Roadmap, the differencesbetween the current state and the post-merger state can be illustrated using color-coding inorder to provide starting points for the derivation of planned states.
Potential intermediate states for the planned business support are:
Carve out pilot: a well-contained part of the IT with limited business impact has beentransformed, as a feasibility study.
Complete carve out: all business capabilities have been detached from the mother enter-prises and are managed as well as operated mostly independently by the new enterprise.
EA stabilization: the architecture of the new enterprise has settled.
EA consolidation: the EA has been optimized and freed of redundancies except thosekept e.g. for performance reasons.
In order to ensure the evolution of the EA towards the ideal post-merger state, a set ofarchitecture guidelines and rules needs to be set up.
71
2.5 Implementation
This M-Pattern can be useful for the handling of the complexity arising in the context ofa merger between enterprises. Nevertheless, different challenges arising from the involve-ment of different enterprises (mother enterprises and the new resulting one) have to beaddressed and demand for special attention. For example, decisions on the retirement of abusiness capability might have additional social impact due to dissolving responsibilities.Therefore, a steering committee should be set up, in which stakeholders from the formerlyindependent enterprises are equally represented. This committee should be involved in thedifferent process steps described before and acts as final decision board.
2.6 Known Uses
The approach documented in M-Pattern Consolidating Architectures after Mergers is usedat AXA Winterthur, Nokia Siemens Networks, and Uni Credit Group.
2.7 Consequences
Business capability integration versus stakeholder resistance: The emotionality of dis-cussion and the fear of the affected employees about the future [WL04] can be faced bymaking the decision process and the reasons for decisions taken transparent to the stake-holders involved. Another way to cope with stakeholder resistance is the pattern EarlyDecision [Kel01], which tries to avoid too many workshops often used for political dis-cussion instead of reasonable discussions about the future development.
Costs versus insight: In order reduce overlaps in business capabilities you need insightknowledge. The effort needed to gain this knowledge has to be balanced to the benefit ofthis knowledge. This is important in the documentation of the current state.
Costs versus contracts: Merger endeavors lead to a high amount of different contracts,that need to be maintained and produce costs in the future. Therefore, you have to considerthe existing and new contracts in the phase development of post-merger state, as these havea high influence on costs.
Corporate cultures versus balance of power: In the new enterprise both formerly inde-pendent enterprises have equal rights, which more often than not lead to emotional tit-for-tat decisions. These decisions try to balance retirements of business capabilities from bothmother enterprises, leading to a situation, where high effort has to be spent in integratingbusiness capabilities developed independently. Another important aspect for the success-ful execution of the merger is to define the new positions and responsibilities of the newIT department as soon as possible [WL04] to be able to focus on the upcoming decisionsand not on discussion about people and their roles.
Homogeneity versus heterogeneity: Different corporate cultures and the balance of powerbetween the parties may also be detrimental to homogenization endeavors. You have tofind a balance between homogenization and heterogeneity to fit your needs.
2.8 See Also
In order to support the implementation of M-Pattern Consolidating Architectures afterMergers the V-Pattern Business Domain-based Capability Roadmap should be considered.
72
3 Business Domain-based Capability Roadmap
This V-Pattern provides a way to visualize information about business domains of one ormore enterprises in relation to the available and required business capabilities. Thereby,also planning aspects as e.g. the introduction or the removal of capabilities are considered.
3.1 Example
A business unit of Nokia has merged with a part of the telecommunication sector ofSiemens. This resulted in the need to define the new business domains and merge thepreviously independent business capabilities of both enterprises. In order to appropriatelysupport this task, views have to be created showing the business domains of the new enter-prise together with the available and required business capabilities supporting the businessdomains. Subsequently, the reduction of existing redundancies and the creation of missingcapabilities have to be planned using the visualization.
3.2 Context
In a merger situation of multiple formerly independent enterprises an overview about thebusiness domains and the available and required business capabilities is required.
3.3 Problem
You want to get an overview about the business domains and the available business ca-pabilities in order to identify redundancies or to harmonize the existing capabilities. Ifneeded capabilities are missing, you want to introduce new business capabilities to fill thisgap. How do you visualize the capabilities supporting your business domains whenintegrating two or more enterprises?
The following forces influence the solution:
- Completeness versus readability: How can you include enough information in thevisualization to support analysis of the situation without overstraining the user withtoo much details?
- Static versus dynamic: How can you visualize the transition from the current stateto a planned or an envisioned state of your business domains and capabilities?
- Belonging versus planning: Do you want to show the belonging of a businesscapability to one of the previously independent companies or do you focus on theresult after the merger?
- Redundancies versus gaps: How do you visualize redundant business support forbusiness domains but also consider missing capabilities (gaps)?
3.4 Solution
Business Domain-based Capability Roadmap uses grouping to show which business ca-pabilities are available for which business domain and from which enterprise the businesscapabilities originate. This is exemplarily shown in Figure 2. Thereby the belonging ofa business capability to one of the previously independent enterprises or to the mergedenterprise is shown via color coding and the border types indicate, whether a capabilityis planned to be unchanged, introduced, or retired. However, If your company is part ofan industry for which a standardized reference model is available, like eTOM [For09] for
73
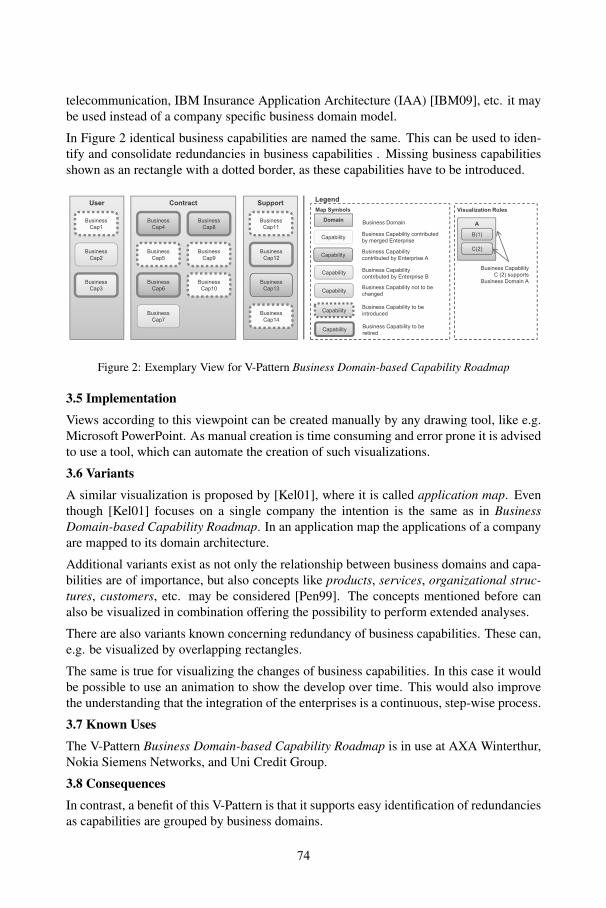
74
Getting an overview about the original contributor of a capability is another benefit of thisV-Pattern, as well as an easy to use tool to plan the future support of business domains.
Completeness versus readability: When visualizing not only the business domains andthe corresponding capabilities but also the relationships to other concepts like the onesintroduced in the variants section, you have to keep in mind that the resulting views aregetting more difficult to understand.
Static versus dynamic: The variants section of this pattern mentioned the possibility toshow the transition of the current state to a future state using animation. At first this mightbe an appealing approach, but you should consider that this may require using specialtools, which support animations a functionality typically not supported by EA managementtools. Another drawback would be that the usability of an animation is limited, e.g. if youconsider a text based document.
Belonging versus planning: You should think about you focus when using this pattern.If your focus is on showing to which of the ”old” companies a business capability belongsto or if your focus is on the future plan. If you try to included both aspects this hasnegative effects on the readability of the resulting visualization. A way to get around thisproblem would be to use the layers to differentiate between those aspects but still includethe complete information.
Redundancies versus gaps: If your focus is on identifying gaps. You should to developthe domain map first, add the required capabilities and then try to match the requiredcapabilities with the available ones by the ”old” companies. If redundancies are in yourfocus you can skip the step to add the required capabilities and instead directly add theavailable ones to the domain map. Now you can start to consolidate and look for missingbusiness support afterwards.
3.9 See Also
This V-Pattern may be useful when using M-Pattern Consolidating Architectures afterMergers (see Section 2). The visualized information is based on I-Pattern Business Domain-driven Capability Planning (see Section 4). A detailed description of the application mappattern can be found in [Kel01].
4 Business Domain-driven Capability Planning
This I-Pattern provides a way to store information about the existing and future businesscapabilities providing support for the a new enterprise after a merger has taken place.
4.1 Example
During the merger between a part of the telecommunication sector of Siemens and a busi-ness unit of Nokia an information model specifying which information is needed to harmo-nize and integrate the business capabilities in the post-merger enterprise had to be defined.Thereby, aspects of redundancies and gaps concerning business capabilities as well as theorigins of the capabilities were of interest.
75
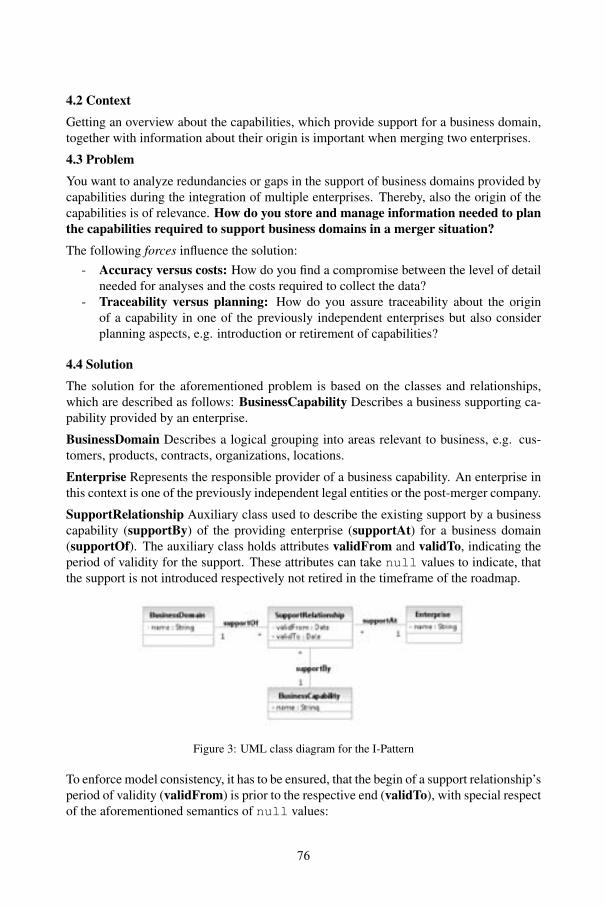
76
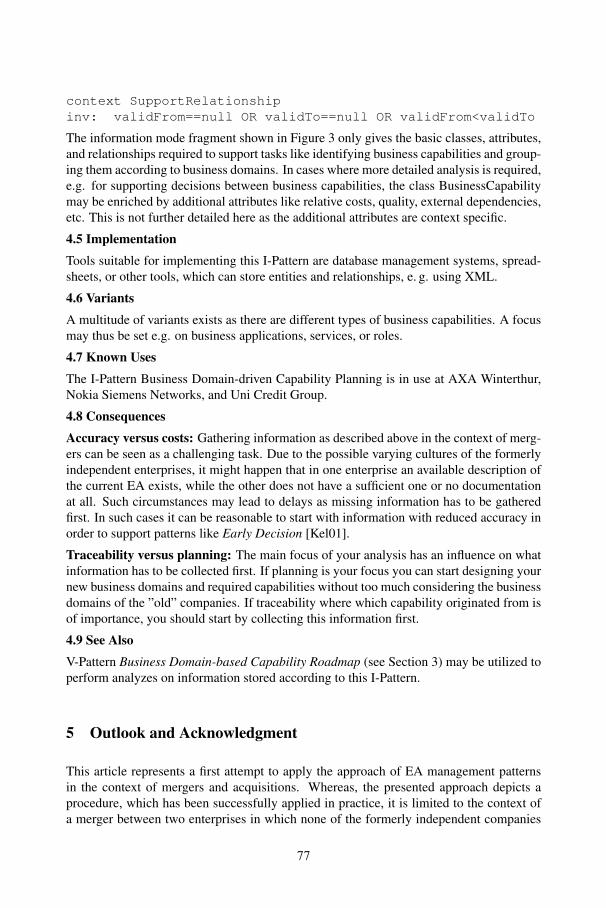
context SupportRelationshipinv: validFrom==null OR validTo==null OR validFrom<validTo
The information mode fragment shown in Figure 3 only gives the basic classes, attributes,and relationships required to support tasks like identifying business capabilities and group-ing them according to business domains. In cases where more detailed analysis is required,e.g. for supporting decisions between business capabilities, the class BusinessCapabilitymay be enriched by additional attributes like relative costs, quality, external dependencies,etc. This is not further detailed here as the additional attributes are context specific.
4.5 Implementation
Tools suitable for implementing this I-Pattern are database management systems, spread-sheets, or other tools, which can store entities and relationships, e. g. using XML.
4.6 Variants
A multitude of variants exists as there are different types of business capabilities. A focusmay thus be set e.g. on business applications, services, or roles.
4.7 Known Uses
The I-Pattern Business Domain-driven Capability Planning is in use at AXA Winterthur,Nokia Siemens Networks, and Uni Credit Group.
4.8 Consequences
Accuracy versus costs: Gathering information as described above in the context of merg-ers can be seen as a challenging task. Due to the possible varying cultures of the formerlyindependent enterprises, it might happen that in one enterprise an available description ofthe current EA exists, while the other does not have a sufficient one or no documentationat all. Such circumstances may lead to delays as missing information has to be gatheredfirst. In such cases it can be reasonable to start with information with reduced accuracy inorder to support patterns like Early Decision [Kel01].
Traceability versus planning: The main focus of your analysis has an influence on whatinformation has to be collected first. If planning is your focus you can start designing yournew business domains and required capabilities without too much considering the businessdomains of the ”old” companies. If traceability where which capability originated from isof importance, you should start by collecting this information first.
4.9 See Also
V-Pattern Business Domain-based Capability Roadmap (see Section 3) may be utilized toperform analyzes on information stored according to this I-Pattern.
5 Outlook and Acknowledgment
This article represents a first attempt to apply the approach of EA management patternsin the context of mergers and acquisitions. Whereas, the presented approach depicts aprocedure, which has been successfully applied in practice, it is limited to the context ofa merger between two enterprises in which none of the formerly independent companies
77
has a dominant role. In the case of an acquisition or an absorptive merger [MH04], oneof the participating enterprises may have the power to enforce decisions, which leads to adifferent situation. While yet no methodology, or M-Pattern respectively, for such casesexists, the aforementioned patterns can be used as a starting point for the development ofsuch patterns. In addition, further enhancements of the presented approach are possible,e.g. regarding the identification of relevant business domains, etc.
We want to thank all participants of the writers’ workshop of the Patterns in EnterpriseArchitecture Management (PEAM) 2009 workshop, we want to express our gratitude toMarc Lankhorst a reviewer and Wolfgang Keller the shepherd of this paper, for the timespent on reading, commenting, and discussing the article.
References
[BELM08] Sabine Buckl, Alexander M. Ernst, Josef Lankes, and Florian Matthes. Enterprise Ar-chitecture Management Pattern Catalog (Version 1.0, February 2008). Technical report,Chair for Informatics 19 (sebis), Technische Universitat Munchen, Munich, 2008.
[EHH+08] Gregor Engels, Andreas Hess, Bernhard Humm, Ooliver Juwig, Marc Lohmann, andJan-Peter Richter. Quasar Enterprise – Anwendungslandschaften serviceorientiertgestalten. dpunkt.verlag, Heidelberg, 2008.
[For09] TeleManagement Forum. Business Process Framework (eTOM) Release7.5. http://www.tmforum.org/BusinessProcessFramework/GB921TheBusiness/36137/article.html (cited 2009-02-18), 2009.
[GPPS97] F. Giacomazzi, C. Panella, B. Pernici, and M. Sansoni. Information systems integra-tion in mergers and acquisitions: A normative model. Information&Management, Vol.32:289–302, 1997.
[IBM09] IBM. IBM Insurance Application Architecture. http://www-01.ibm.com/software/sw-library/en_US/detail/V307468L22469F96.html(cited 2009-02-21), 2009.
[Kel01] Wolfgang Keller. A Few Patterns for Managing Large Application Portfolios. In Euro-PLoP 2001, Universitatsverlag Konstanz, 2001.
[Kel07] Wolfgang Keller. IT-Unternehmensarchitektur. dpunkt.verlag, Heidelberg, 2007.
[MH04] Manjari Mehta and Rudy Hirschheim. A Framework for Assessing IT IntegrationDecision-Making in Mergers and Acquisitions. Hawaii International Conference onSystem Sciences, 8:80264c, 2004.
[ORH01] P. Oliveira, A. Roth, and M. Heitor. Mergers and Acquisitions: A Tool for Knowl-edge/Technology Transfer. Hawaii International Conference on System Sciences,8:8030, 2001.
[Pen99] H.G. Penzel. Post Merger Management in Banken – und die Konsequenzen fur dasIT-Management. Wirtschaftsinformatik, Vol. 41(2):105–115, 1999.
[WL04] Patrick Wirz and Markus Lusti. Information technology strategies in mergers and ac-quisitions: an empirical survey. In WISICT ’04: Proceedings of the winter internationalsymposium on Information and communication technologies, pages 1–6. Trinity CollegeDublin, 2004.
78
EA Management Patterns for Smart Networks
Armin Lau1, Thomas Fischer1, Michael Weiß1, Sabine Buckl2,Alexander Ernst2, Florian Matthes2, Christian M. Schweda2
1Deutsche Institute fur Textil- und Faserforschung (DITF) DenkendorfZentrum fur Management Research
Korschtalstraße 26, 73770 Denkendorf{armin.lau,thomas.fischer,michael.weiss}@ditf-denkendorf.de
2Lehrstuhl fur Informatik 19 (sebis)Technische Universitat MunchenBoltzmannstr. 3, 85748 Garching
{buckls,ernst,matthes,schweda}@in.tum.de
Abstract: With the growing complexity of products and processes in a globalizedmarket, companies are required to strive for a new quality of partnership. In SmartNetworks, networking of partners goes beyond mere organizational networking, butinvolves also networking on the levels of knowledge and information/communicationtechnology (ICT). The setup of ICT networking in newly formed Smart Networks re-quires not only information about already existing ICT infrastructure, but also a clearunderstanding of the organizational interconnections and knowledge interdependen-cies. This paper presents how the respective knowledge can be identified, visualized,and structured through information models in order to obtain decision support for theintroduction of additional ICT support for the collaboration within a Smart Network.
1 Introduction
This article gives a short introduction on the management topic of Smart Networks andshows, how enterprise architecture (EA) management methods and patterns can be appliedto this kind of networks – especially to its ICT parts. A Smart Network in this contextis an organizational structure spanning different enterprises (manufacturers and serviceproviders), which has been formed to pursue a business opportunity. A conjoint goalcould e.g. be the collaborative manufacturing of products or collaborative innovation.Smart Networks are in their understanding of collaboration strongly oriented towards threeconstituting features as characterized by Filos [Fil06]:
Organizational networking refers to the strong interconnection of organizations in het-erarchical structures and business processes, which are designed and optimized together.Knowledge networking lays the base for organizational networking, by establishing ef-fective exchange of knowledge. Each partner will have access to relevant knowledge forthe different collaborative tasks to be performed at any time.
79

ICT networking supports virtual organizational structures and knowledge networking byproviding the technical basis for transferring information objects, which form an explicitknowledge representation.
In comparison to strategic networks as described by Sydow [Syd92], Smart Networks arecharacterized by their high flexibility. They are able to adapt dynamically to changingbusiness situations. According to the needs of the network from an organizational, knowl-edge, or ICT point of view, new partners can be easily integrated, key roles in the networkmay alter, or existing partners may be dismissed in order to reach the business opportu-nity driving the network. Actors in Smart Networks work together with high intensity andexchange relevant knowledge continuously. In this context, we speak about collaboration.Partners pursue not only conjoint goals but are performing actions together [SF07].
Research topic of DITF-MR are Smart Networks of small and medium-sized enterprises,which collaborate across industry sectors. For further examination, we assume, that part-ners are equal, meaning that none has a dominant role. Neither has any partner enoughresources available to be the only driver for networking. Due to the lack of a leading role,such a network may be in need of a mediator or coordinator to facilitate collaboration.
Intended AudienceThe idea of EA management patterns, as presented below, is to determine possible ICTsupport for knowledge-driven networks of equal organizations by introduction of addi-tional software solutions, e.g. a collaboration platform. The focus of the patterns is onSmart Networks, and thus will be of special interest for mediators and coordinators ofsuch networks. However, similar problems can be identified in any network with hetero-geneous ICT solutions, and thus might be of interest for any coordinator of networkedorganizations. Through the explicit consideration of the intangible resource knowledge,the pattern will be especially suited for any knowledge-related ICT infrastructure.
2 ICT Network Managment for Smart Networks
This Methodology Pattern describes a business capability-driven methodology to plan theICT infrastructure for knowledge exchange in a Smart Network.
2.1 ExampleThe European project AVALON is an integrated project, which focuses from a materialpoint of view on new product and process developments using so-called shape memoryalloys within textile structures. Several Smart Networks have evolved, which are targetingat different end-user applications of such materials. The final applications will be foundin different industry branches – from medical devices to industry filters – while the pro-duction processes for intermediate products are textile processes. These cross-sectoralinnovation processes need to be supported methodically and technologically, for whichreason also collaborative innovation in Smart Networks is a major research topic in theproject from a management point of view.
The AVALON Smart Networks need additional ICT support to facilitate knowledge ex-change within the project. Knowledge exchange is required along the value-added chain
80
of each network, e.g. to communicate customer requirements or processing parameters.As well, it is necessary between Smart Networks to incorporate knowledge of the differentservice providers which may be applicable in several Smart Networks, e.g. to share insightin the relation between the chemical composition of the alloy and the resulting mechanicalbehaviour.
With respect to their existing ICT infrastructure, Smart Networks require both completelynew functionalities for knowledge exchange and extensions of applications originally de-signed for company-internal use only. Within AVALON, the project coordinator DITF-MRdecided to offer the Smart Networks a website and a wiki to share unstructured informationand to provide various applications supporting innovation processes on the collaborationplatform efikton R!1 to share structured information. Those applications comprise basicinnovation management features for all of the project’s Smart Networks and specificallydesigned applications to suffice the needs of selected networks, like risk management ap-plications suited for the use in the industry sector of medical devices.
2.2 ContextA Smart Network consisting of a number of small- and medium-sized enterprises exists,for which ICT networking shall be improved. The set-up phase for a Smart Network ishence not considered in this pattern. Concerning the knowledge exchange in networks,three different knowledge access layers are distinguished [Reh07]:
Public knowledge, which is available to everyone (in- and outside of the Smart Network)Community knowledge, which is available to the partners in the networkInternal knowledge, which is kept privately available to the respective owner or to veryclose collaborators only
In the context of establishing and improving the ICT networking, one has to be aware ofwhich knowledge from the internal access layer has to be lifted to the community accesslayer in order to facilitate collaboration.
2.3 ProblemIn order to facilitate collaboration within these Smart Networks, it has to be taken intoaccount that we are talking about partners, which are in general locally dispersed. Collab-oration on organizational and on knowledge level can therefore only be achieved througha high level of ICT networking.
The key question in this context is: Which parts of the knowledge network should besupported by newly developed additional (ICT-)applications, and which parts mightbe left to decentralized, perhaps non-automated, communication means? The follow-ing forces influence the solution:
Confidentiality Confidentiality and reliability concerns of the partners affect the com-plexity of the information exchange and may interfere with the demands of knowl-edge exchange.
Technology Different technologies and deviations from standards complicate the infor-mation exchange and thus influence implementation costs and time-to-operate.
1For more information see http://www.diasfalisis.com/efikton.
81
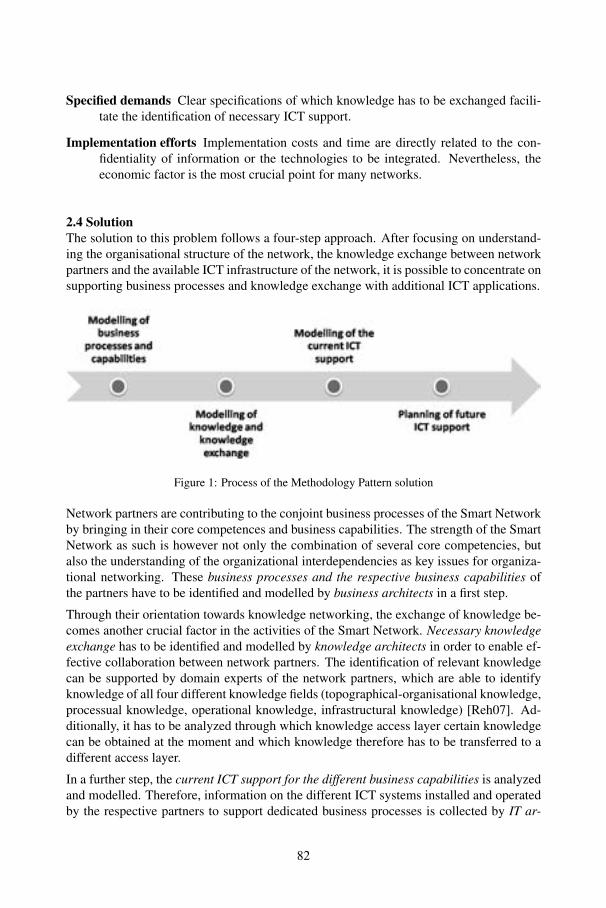
82
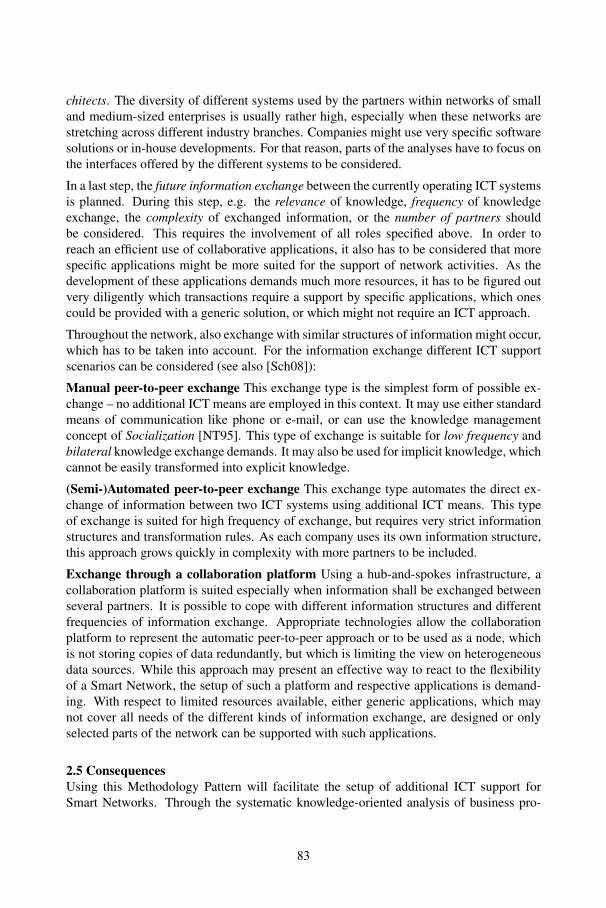
chitects. The diversity of different systems used by the partners within networks of smalland medium-sized enterprises is usually rather high, especially when these networks arestretching across different industry branches. Companies might use very specific softwaresolutions or in-house developments. For that reason, parts of the analyses have to focus onthe interfaces offered by the different systems to be considered.
In a last step, the future information exchange between the currently operating ICT systemsis planned. During this step, e.g. the relevance of knowledge, frequency of knowledgeexchange, the complexity of exchanged information, or the number of partners shouldbe considered. This requires the involvement of all roles specified above. In order toreach an efficient use of collaborative applications, it also has to be considered that morespecific applications might be more suited for the support of network activities. As thedevelopment of these applications demands much more resources, it has to be figured outvery diligently which transactions require a support by specific applications, which onescould be provided with a generic solution, or which might not require an ICT approach.
Throughout the network, also exchange with similar structures of information might occur,which has to be taken into account. For the information exchange different ICT supportscenarios can be considered (see also [Sch08]):
Manual peer-to-peer exchange This exchange type is the simplest form of possible ex-change – no additional ICT means are employed in this context. It may use either standardmeans of communication like phone or e-mail, or can use the knowledge managementconcept of Socialization [NT95]. This type of exchange is suitable for low frequency andbilateral knowledge exchange demands. It may also be used for implicit knowledge, whichcannot be easily transformed into explicit knowledge.
(Semi-)Automated peer-to-peer exchange This exchange type automates the direct ex-change of information between two ICT systems using additional ICT means. This typeof exchange is suited for high frequency of exchange, but requires very strict informationstructures and transformation rules. As each company uses its own information structure,this approach grows quickly in complexity with more partners to be included.
Exchange through a collaboration platform Using a hub-and-spokes infrastructure, acollaboration platform is suited especially when information shall be exchanged betweenseveral partners. It is possible to cope with different information structures and differentfrequencies of information exchange. Appropriate technologies allow the collaborationplatform to represent the automatic peer-to-peer approach or to be used as a node, whichis not storing copies of data redundantly, but which is limiting the view on heterogeneousdata sources. While this approach may present an effective way to react to the flexibilityof a Smart Network, the setup of such a platform and respective applications is demand-ing. With respect to limited resources available, either generic applications, which maynot cover all needs of the different kinds of information exchange, are designed or onlyselected parts of the network can be supported with such applications.
2.5 ConsequencesUsing this Methodology Pattern will facilitate the setup of additional ICT support forSmart Networks. Through the systematic knowledge-oriented analysis of business pro-
83
cesses, the pattern yields specifications of required support for knowledge exchange. Con-fidentiality concerns and technology issues are part of the analysis and thus can be consid-ered easily, so that the final implementation efforts can be significantly reduced. Applyingthis pattern helps also to choose the appropriate architecture to prepare knowledge for thedifferent knowledge access layers. However, the application of the pattern itself is quitecostly and thus has to be taken into account as well. One additional problem of this patternis that ICT support will be introduced very early after the creation of such a network. Inthis phase, available infrastructural knowledge about necessary content and structure ofpossible knowledge exchange will be very limited. Therefore, this pattern depends muchon the competencies of the knowledge domain experts and the accurateness of their esti-mations.
The pattern can be applied to any kind of Smart Network, independent of its size or thesize of the acting organizations. It has to be considered that the number of partners, andalso their competencies in the field of ICT applications and technologies, will affect theapplication of the pattern itself. The expected benefit may be less for smaller networks, butalso the effort is signifcantly reduced. Thus, life-time of the Smart Network is the crucialcriterion to figure out if the benefits justify the effort.
2.6 Known UsesThis pattern has been used by the team of DITF-MR in different integrated researchprojects concerned with Smart Networks, e.g. the aforementioned AVALON (see www.avalon-eu.org), Leapfrog (see www.leapfrog-eu.org) or contex-T (see www.contex-t.eu). The Smart Networks in these projects are all covering completely dif-ferent value-added chains in different industry sectors. This pattern is also basis for theSmart Network Modelling method developed by DITF-MR.
2.7 See AlsoThe implementation of this pattern ICT Network Managment for Smart Networks can besupported using the Viewpoint Pattern ICT Network Map presented in Section 3.
3 ICT Network Map
This Viewpoint Pattern provides a way to visualize information about business capabilities,knowledge exchange, and ICT support with a Smart Network.
3.1 ExampleThe Smart Network in the AVALON project has been discussed and set up in preparationof the collaborative realization of a business opportunity. Additionally, the ICT systems,which support the respective business capabilities have been documented by each partici-pating partner. Now the ICT support of the Smart Network shall be planned. In order tofacilitate this planning process, an overview on the current support should be given.
3.2 ContextThe pattern can visualize the ICT support for knowledge exchange in a Smart Network.
84
3.3 ProblemYou want to visualize the ICT systems currently in use to support the business capabilitiesof the different partners in a Smart Network and relate them to the demands of knowledgeexchange. The key question in this context is:
How do you visualize, which parts of the knowledge network should be supportedby newly developed additional ICT-applications, and which parts might be left todecentralized, perhaps non-automated, communication means?
The following forces influence the solution:
Clear visualization How can you visualize the information in a concise manner?
Stakeholder acceptance How can you promote acceptance of the visualization as an ex-plication of their demands and business capabilities by the partners?
3.4 SolutionA view (see Figure 2) according to the respective viewpoint is a two-dimensional map withan x-axis made up by the high-level business processes of the Smart Network. The y-axiscomplementingly enumerates the partners collaborating in the Smart Network. Addition-ally, mediators may be listed on the bottom end of the y-axis. The symbols on the axespartition the main area of the visualization in fields – these intersections are filled with asymbol representing a business capability, which expresses that the respective partner canprovide support for the respective business process. On the level of the business capabili-ties, the knowledge exchange demands from the knowledge network are denoted as arrowsconnecting the source and target capability.
The currently deployed ICT systems used to support the business capabilities at the differ-ent partners are represented by rectangular symbols nested into the symbols representingthe respective business capability. The ICT systems are connected with lines, if an infor-mation exchange takes place between these systems.
3.5 VariantsVariants of this Viewpoint Pattern exist, of which a prominent one omits the ICT networklevel details (business applications and information exchanges between them) and focuseson the knowledge network exclusively. The variant can easily be created using the layeringprinciple of software cartography as presented in [Mat08]. This variant is similar to theTopography Model found in [FR04]. Another variant could use different types of linesbetween the ICT systems to indicate the level of automation for the specific informationexchange.
3.6 Known UsesVisualizations according to a similar viewpoint have been used by DITF-MR researchersin the different aforementioned projects, e.g. the AVALON project.
85
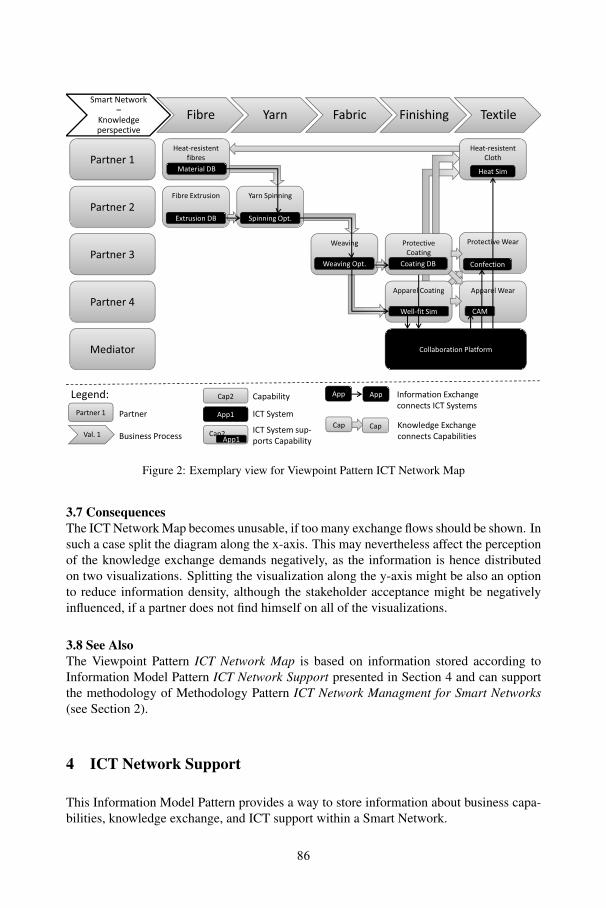
86
4.1 ExampleThe knowledge network of the Smart Network in the AVALON project has been docu-mented in a respective model. Additionally, the partners have supplied information on theICT systems, which are used to support their business capabilities. Now the ICT supportof the Smart Network shall be planned.
4.2 ContextAvailable knowledge within the Smart Network is described via business capabilities,which are contributed by the respective partner as support for specific business processes.Additionally, the documentation of these business capabilities should be extended withinformation on the knowledge exchange (and knowledge access layer), which has to takeplace between the collaborating partners. Complementing the knowledge level model ofthe Smart Network, the ICT support for the network has to be planned, especially takinginto account the knowledge exchange demands as incorporated in the knowledge network.
4.3 ProblemYou want to get an overview on the knowledge network constituing your Smart Network,in order to prepare decisions on the ICT network for supporting the knowledge exchange.The key question is: What is a good way to store and maintain information about busi-ness capabilities supplied by the Smart Network partners together with informationon the needed knowledge exchange?
4.4 SolutionThe needed information can be stored in an information model employing the classesdepicted in Figure 3. These classes and the relationships between them are detailed below:
BusinessCapability A business capability refers to the ability of certain partners to exe-cute a respective business process of the collaborative value chain.
BusinessCapability isSourceOf KnowledgeExchange respectively BusinessCapabilityisTargetOf KnowledgeExchange These relationships are used to describe, that aknowledge exchange takes place connecting certain business capabilities.
BusinessCapability relatesTo BusinessProcess A business capability supports the exe-cution of a respective business process.
BusinessProcess A business process describes a high-level process concept for collabo-rative activities. The business processes, which are considered in this pattern, forma linear order and are supported by one or more partners in the Smart Network.
CollaborationPlatform A collaboration platform is the contribution of a mediator to theSmart Network supporting hub-and-spoke information exchange complementing thedirect, i.e. peer-to-peer, exchange.
ICTSystem An ICT system represents a deployed instance of a software system facilitat-ing information processing and communication.
87
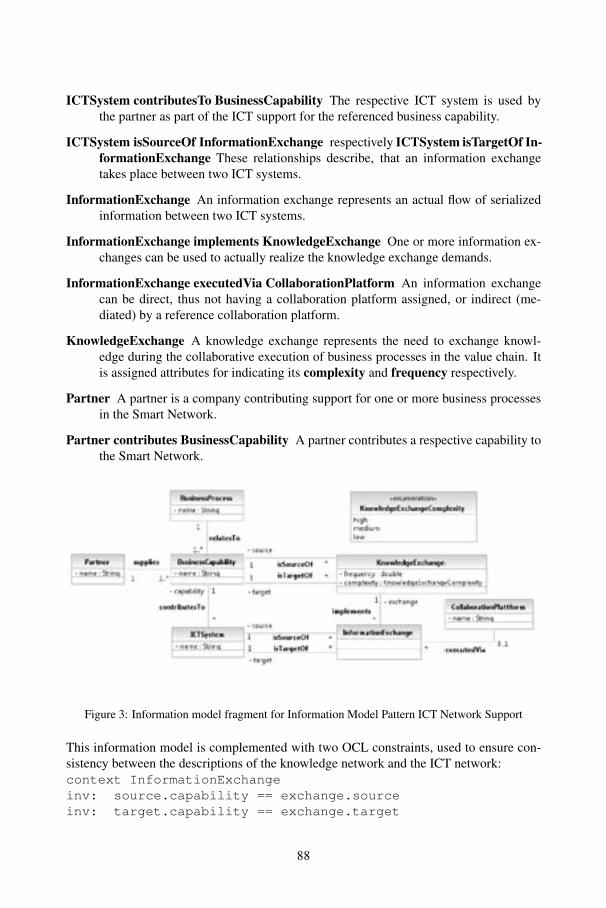
88
4.5 Known UsesAt the DITF-MR, similar information models have been created and are used as basis forthe Smart Network modelling method.
4.6 ConsequencesGathering the information as demanded in this Information Model Pattern is a crucial taskin this context. This is especially true, as information on the used ICT systems has to becollected from the different partners of the Smart Network. This might be not withoutproblems due to two reasons. On the one hand, the partners are perhaps not willing toshare information on their used ICT systems, especially with other partners providing abusiness capability supporting the same process. On the other hand, cross-organizationalinformation collection is likely to be impeded by the absence of a central governing struc-ture or organization. The second issue nevertheless can be resolved, if a mediating partneris liable for information collection.
A benefit of this Information Model Pattern might be the support for the evolution of theSmart Network, e.g. concerning the introduction of a new partner into the network. Usingthe information stored according to the Information Model Pattern makes it much easierfor late entrants to understand the knowledge and ICT network level currently operated.
4.7 See AlsoInformation stored according to this Information Model Pattern can be presented in a viewaccording to Viewpoint Pattern ICT Network Map, shown in Section 3.
5 Acknowledgement and Outlook
The creation of patterns for an EA management topic is no one-time task nor has it beenthe work of the authors only. Thus, we would like to thank all the people, who helped toimprove this article by their feedback and remarks. Concluding, we give a short outlookon next steps, which could be taken to evolve the patterns presented here and extend themtowards other application areas.
5.1 AcknowledgementsWe want to thank all participants of the Patterns in Enterprise Architecture Management(PEAM) workshop at the Software Engineering 2009 conference. Especially, we want toexpress our gratitude to Prof. Peter Sommerlad, the shepherd of this article, for the timespent on reading, commenting, and discussing the article. The work presented in this paperwas carried out partially in the context of the AVALON project co-funded by the EuropeanCommission under the 6th Framework Program. The authors acknowledge the commentsand contributions of the project partners.
5.2 OutlookThe Methodology Pattern, Viewpoint Pattern, and Information Model Pattern presentedin this article are an initial attempt to apply the EA management pattern approach in the
89
context of Smart Network management. Thus, the field of ICT networking was exem-plarily taken, omitting the organizationally more complex problem of initialization andset up of a Smart Network on the organizational and knowledge network level. Neverthe-less, while yet no methodology, i.e. no Methodology Pattern(s) for these tasks have beenpresented, especially Viewpoint Pattern ICT Network Map and the respective InformationModel Pattern ICT Network Support may prove useful tools in this context.
Planning the ICT network supporting knowledge exchange, which is supported by the pat-terns presented in this article, is a first step towards an ICT supported Smart Network,which is followed by a couple of also important steps. These steps, including implementa-tion and maintenance of the ICT network, also demand for appropriate management andcould thus be supported by EA management patterns. Therefore, further patterns shouldbe created in order to provide seamless management support for the entire lifecycle of acollaborative ICT network. These patterns could use the ones presented in this article asa starting point, but would have to take additional aspects, e. g. the dismissal of a partner,into consideration. In this context also time–related aspects, as discussed in [BEMS08],should be taken into account.
References
[BEMS08] Sabine Buckl, Alexander Ernst, Florian Matthes, and Christian M. Schweda. An In-formation Model for Landscape Management – Discussing Temporality Aspects. InP. Johnson, J. Schelp, and S. Aier, editors, Proceedings of the 3rd International Work-shop on Trends in Enterprise Architecture Research, Sydney, Australia, 2008.
[Fil06] E. Filos. Smart Organizations in the Digital Age. Integration of ICT in Smart Organiza-tions, pages 1–39. In I. Mezgar, editor, Integration of ICT in Smart Organizations, IGIPublishing, 2006.
[FR04] T. Fischer and S.-V. Rehm. A Cybernetic Approach Towards Knowledge-Based Coor-dination of Dynamically Networked Enterprises, pages 135–144. In L.M. Camarinha-Matos, editors, Virtual Enterprises and Collaborative Networks, Kluwer Academic Pub-lishers, 2004.
[Mat08] Florian Matthes. Softwarekartographie. Informatik Spektrum, 31(6), 2008.
[NT95] I. Nonaka and H. Takeuchi. The Knowledge-Creating Company. Oxford UniversityPress, 1995.
[Reh07] S.-V. Rehm. Architektur vernetzter Wertschopfungsgemeinschaften der Textilwirtschaft.(Architecture of Networked Value Added Communities of Textile Industries). Disser-tation, Universitat Stuttgart, Online http://elib.uni-stuttgart.de/opus/volltexte/2007/3197/, 2007.
[Sch08] Petra Schubert. Integrationsszenarien fur Business Collaboration. HMD Praxis derWirtschaftsinformatik, 261:32–42, 2008.
[SF07] V. Serrano and T. Fischer. Collaborative innovation in ubiquitous systems. Journal ofIntelligent Manufacturing, 18(5):599–615, 2007.
[Syd92] J. Sydow. Strategische Netzwerke. Evolution und Organisation. Gabler Verlag, 1992.
90
Produkt-Variabilität im gesamtenLebenszyklus
(PVLZ)
Inhaltsverzeichnis
Produkt-Variabilität im gesamten Lebenszyklus (PVLZ2009)Klaus Marquardt, Dietmar Schütz, Markus Völter ...................................................... 93
Ansatz für ein durchgängiges Variantenmanagement in der automobilenSteuergeräteentwicklungChristian Bimmermann ................................................................................................ 97
Feature Dependencies have to be Managed Throughout the Whole Product Life-cycleGoetz Botterweck, Kwanwoo Lee ................................................................................ 101
Eine Infrastruktur für modellgetriebene hierarchische ProduktlinienChristoph Elsner, Daniel Lohmann, Christa Schwanninger ........................................ 107
Modellgetriebenes Softwareengineering – Der Beginn industrieller Softwareproduktion?Wolfgang Goerigk, Thomas Stahl ................................................................................ 115
Variabilität als eine eigenständige Sicht auf ProduktlinienKim Lauenroth, Klaus Pohl .......................................................................................... 119
Ein Klassifikationsansatz zur Variabilitätsmodellierung in E/E-EntwicklungsprozessenCem Mengi, Ibrahim Armaç ........................................................................................ 125
Architekturgetriebenes Pairwise-Testing für Software ProduktlinienSebastian Oster, Andy Schürr ...................................................................................... 131
Konsistente Evolution von lebenszyklusübergreifenden VariabilitätsmodellenKlaus Schmid................................................................................................................ 135
Produkt-Variabilität im gesamten Lebenszyklus(PVLZ 2009)
Klaus Marquardt1, Dietmar Schütz2, Markus Völter3
1Dräger Medical AG &Co [email protected]
2 Siemens AG Corporate [email protected]
3 Völter Ingenieurbü[email protected]
Zielsetzung
Ansätze zu Produktlinien und Produktfamilien beschäftigen sich meist mit denAnforderungen und der Architektur, die Erweiterbarkeit und Variabilität ausdrückt undmodelliert. Bereits beim Testen, aber mehr noch bei der Installation und Migration wirddie Variabilität oft erheblich reduziert. Welche Maßnahmen müssen ergriffen werden,damit die Vorteile durch Variabilität tatsächlich bei dem Endkunden ankommen?
Ziel dieses Workshops war es, den gesamten Lebenszyklus zu betrachten undAnforderungen, Architektur, Implementierung, Testen, Installation und Wartungmiteinander in Beziehung zu bringen. Für jede Phase in der Software-Entwicklung gibtes eine Reihe von erprobten Techniken und Praktiken. Je nach verwendeter Architektursind diese Praktiken unterschiedlich sinnvoll – im schlechtesten Fall können Konzepte inspäteren Phasen manche Ziele aus früheren Phasen konterkarieren. Jenseits dertechnischen Lösung im Fokus der Architektur gibt es viel zu beachten:
• Wie werden Anforderungen erstellt und verwaltet, wie wird Variabilität modelliert?• Welcher Teil der Software hat welche Lebensdauer und Gültigkeit?• Was wird versioniert und freigegeben?• Welche Qualitätsmaßnahmen greifen für welche Art von variablen Architekturen?• Wie wird Kompatibilität sichergestellt – oder unterbunden?• Wie finden Updates und Migrationen statt?
Zwischen diesen unterschiedlichen Bereichen des Lebenszyklus gibt es zahlreicheBeziehungen. Verschiedene technische Mechanismen der Variabilität können dabeiunterschiedliche Praktiken erfordern. Insgesamt sollen zueinander passende Praktikenidentifiziert werden, die sich gegenseitig unterstützen und verstärken.
93
Verlauf
Der Schwerpunkt des Workshops lag auf der Interaktion der Teilnehmer und desgrößtmöglichen Erfahrungsaustausches. Die eingereichten Positionspapiere wurden vonden Autoren im Plenum vorgestellt. Die Präsentationen fanden jeweils am Flipchart statt,damit im Gespräch die Schwerpunkte und die Fragen dazu unmittelbar herausgearbeitetund geklärt werden konnten.
Nach dieser Einführung in die vorhandenen Kenntnisse und Ansichten wurden in zweiaufeinander folgenden Gruppenarbeiten eine Reihe von Themen bearbeitet, die dieTeilnehmer selbst erarbeitet hatten. Die Ergebnisse und Diskussionspunkte sind imPlenum vorgestellt worden und stellen einen Zwischenstand dar, der von denTeilnehmern weiter verfolgt und auf nachfolgenden Workshops vertieft werden wird.
• Modellgetriebenes Design und Produktlinien-Entwicklung• Zusammenspiel von Requirements und Variabilität• Traceability zwischen Modellen bei komplexen Software-Produktlinien• Wieviel Mensch und wieviel Maschine braucht eine Produklinien-Entwicklung?• Konfiguration versus Konstruktion / Programmierung• Identifikation und Konkretisierung von Variabilität, besonders in nur implizit
variabel gestalteten Systemen
Weitere Themen für zukünftige Workshops wurden identifiziert:
• Formale Spezifikation in modellgetriebener Softwareentwicklung• Umgang mit mehreren Domain Specific Languages (DSL) und Variabilität• Test und Qualitätssicherung im Software-Produktlinien Entwicklungszyklus• Umgang mit Fehlermeldungen, Fehlersuche• Wie relevant ist die Qualität von Sourcecode?• Patterns und Standardisierung von Ansätzen• Kriterien zum Release einer/aller Varianten
Material
Die eingereichten Positionspapiere stehen in diesem Tagungsband zur Verfügung.
• Christian Bimmermann: Ansatz für ein durchgängiges Variantenmanagement in derautomobilen Steuergeräteentwicklung
• Goetz Botterweck, Kwanwoo Lee: Feature Dependencies have to be ManagedThroughout the Whole Product Life-cycle
• Christoph Elsner, Daniel Lohmann, Christa Schwanninger: Eine Infrastruktur fürmodellgetriebene hierarchische Produktlinien
• Wolfgang Goerigk, Thomas Stahl: Modellgetriebenes Softwareengineering – DerBeginn industrieller Softwareproduktion ?
94

• Kim Lauenroth, Klaus Pohl: Variabilität als eine eigenständige Sicht aufProduktlinien
• Cem Mengi, Ibrahim Armac: Ein Klassifikationsansatz zurVariabilitätsmodellierung in E/E-Entwicklungsprozessen
• Sebastian Oster, Andy Schürr: Architekturgetriebenes Pairwise-Testing fürSoftware Produktlinien
• Klaus Schmid: Konsistente Evolution von lebenszyklusübergreifendenVariabilitätsmodellen
95

Ansatz fur ein durchgangiges Variantenmanagement in derautomobilen Steuergerateentwicklung
Christian Bimmermann
Abstract: Das Papier gibt einen Uberblick uber die Problematik der hohen Varianten-bildung in der automobilen Steuergerateentwicklung und skizziert erste Losungsideenfur die Schaffung eines durchgangigen, d.h. uber alle beteiligten Disziplinen hinwegeinheitlichen, Variantenmanagements.
1 Einleitung
Eine steigende Anzahl von Fahrzeugfunktionen, der zunehmende Vernetzungsgrad der sierealisierenden Steuergerate (ECU - Electronic Control Unit) und eine starke Marktdy-namik stellen die Automobilhersteller vor neue Herausforderungen. Auf der einen Seitemochten sie dem Kunden eine breite Palette an Variabilitat in der Fahrzeugfunktionalitatanbieten (Motortypen, Sonderausstattung etc.), oder es sind landerspezifische Richtlinienoder Gesetze zu erfullen. Auf der anderen Seite mochten sie in immer kurzer werdendenZyklen so kostengunstig wie moglich qualitativ hochwertige Systeme bauen. Dies fuhrtdazu, dass die zu entwickelnden ECUs so realisiert werden mussen, dass sie eine Vielzahldieser Varianten abdecken. So muss beispielsweise eine Motor-ECU in der Lage sein, ver-schiedene Zylinderanzahlen zu unterstutzen und die Zylinder korrekt anzusteuern. Eineandere ECU konnte ihre Daten von verschiedenen Arten von Sensoren empfangen, undihr Verhalten musste dementsprechend anpassbar sein.
Dabei ist zu beachten, dass nicht alle Varianten beliebig miteinander kombiniert werdendurfen. Entscheidet man sich z.B. fur die Unterstutzung der Onboard-Diagnose (OBD),dann muss eine zweite Lambda-Sonde im Motor eingebaut sein und beide von der Motor-ECU uberwacht werden. Somit sind in diesem Fall alle Variantenkombinationen ohnezweite Lambda-Sonde nicht zulassig.
Nachfolgend werden diese zulassigen Variantenkombinationen mit ,,Fahrzeugkonfigura-tionen” bezeichnet, da sie praktisch einem Fahrzeug zuzuordnen sind, wie es auch wirk-lich auf der Straße zum Einsatz kommt. Dies umfasst z.B. alle Ausstattungs- und Markva-rianten. Einige Fahrzeughersteller (OEM - Original Equipment Manufacturer) behauptenschon heute, dass jedes von ihnen neu produzierte Fahrzeug fur sich genommen ein Unikatdarstellt, da es auf spezifische Kunden- und Marktwunsche zugeschnitten ist.
97
2 Problembeschreibung
Die ECUs bilden zusammen mit ihren Sensoren und Aktuatoren mechatronische Systeme,bei deren Entwicklung zahlreiche Domanen (wie z.B. die Mechanik oder die Informations-technik) beteiligt sind, die jeweils ihre eigenen Entwicklungsprozesse mit einer individu-ellen Untergliederung in verschiedene Entwicklungsphasen besitzen. Da ein Großteil derFunktionalitat heute in modellbasiert entwickelter Software umgesetzt wird, steht nachfol-gend die Domane der automotiven Softwareentwicklung im Fokus. Das zu entwickelndedurchgangige Variantenkonzept soll jedoch auch uber Domanengrenzen hinweg anwend-bar sein. Der Softwareentwicklungsprozess eines Steuergerates orientiert sich oft am sogenannten V-Modell und ist untergliedert in verschiedene Entwicklungsphasen, wie z.B.die Software-Architektur- und Funktionsentwicklung oder die Testautomatisierung. Hin-ter den einzelnen Entwicklungsphasen stehen oft eigene Abteilungen, die unterschiedlicheWerkzeuge einsetzen, mit denen die spezifischen Artefakte bearbeitet werden. Die einge-setzten Werkzeuge bieten aktuell zu wenig Moglichkeiten der Variantenunterstutzung an,so dass das Single Source Prinzip nicht weit genug angewendet wird. Stattdessen werdenfur verschiedene Fahrzeugkonfigurationen mehrere, zum Großteil sehr ahnliche Entwick-lungsartefakte (Modelle, Code, Tests etc.) produziert. Dies fuhrt zu schlechter Wartbarkeit,und Anderungen werden gegebenenfalls nicht in allen Artefakten nachgezogen.
Da heute die Varianten nicht zentral modelliert werden, muss sich jede Entwicklungs-phase eigenstandig ihre Varianteninformationen z.B. aus der Spezifikation oder durchRucksprache besorgen. Sie bekommt dadurch erst zu einem spateren Zeitpunkt den voll-standigen Uberblick oder ubersieht moglicherweise Varianten. Auch bei der Kommuni-kation zwischen den Entwicklungsphasen und besonders zwischen OEMs und Zuliefe-rern, welche mit der Entwicklung von Teilsystemen oder der Umsetzung bestimmter Ent-wicklungsphasen beauftragt werden, treten Probleme auf: Es fehlen einheitliche Beschrei-bungsmittel, welche Varianten wie umzusetzen sind bzw. umgesetzt wurden. Heute wer-den hierzu oft textbasierte, proprietare Formate verwendet. Dies fuhrt dazu, dass (a) einerhohter Kommunikationsbedarf besteht; (b) Varianten bei der Entwicklung nicht umge-setzt werden; (c) in keiner Fahrzeugkonfiguration vorkommende Variantenkombinationenimplementiert und somit Ressourcen vergeudet werden; (d) variantenbehaftete Artefaktefur die ausgewahlte Variante falsch konfiguriert werden.
Bei der Integration der, aus Komplexitatsgrunden verteilt entwickelten, Systeme in ein Ge-samtsystem, kommt es oft zu Problemen, d.h. zu einem spaten und somit kostenintensivenZeitpunkt werden Fehler sichtbar, die im Zusammenspiel mit anderen Systemen auftre-ten. Jede einzelne ECU scheint im Bezug auf die Spezifikation korrekt umgesetzt wor-den zu sein, nur treten gerade in der Netzwerkkommunikation und im Timing-Verhaltenviele Fehler auf, die erst am Prufstand gefunden werden. Diese Problematik kann zwardurch das Auspragen einer umfassenden Gesamtfahrzeugsicht und der fruhen Simulation /Testdurchfuhrung angegangen werden, fur verlassliche Aussagen uber die Korrektheit ei-nes Systems benotigt man jedoch auch Informationen uber die Varianten. So mussen alleFahrzeugkonfigurationen bekannt sein, in denen ein System vorkommen kann, so dass ausihnen eine sinnvolle Teilmenge fur die Tests ausgewahlt werden kann. Genauso benotigenim Prinzip alle Entwicklungsphasen ahnliche Informationen: Was sind die relevanten, d.h.
98
direkt zu unterstutzenden Varianten und in welchen Fahrzeugkonfigurationen treten sieauf? Wie sehen die Zusammenhange zu den anderen Entwicklungsphasen aus? Welchezusatzlichen Varianten (wie z.B. Alternativentwicklungen, Kalibrierdaten oder Simulati-onsmodelle) gibt es, und wie ist ihr Zusammenhang zu den ubrigen Varianten und Ent-wicklungsphasen?
Einen weiteren wichtigen Aspekt stellen die so genannten ,,Bindezeitpunkte” dar, die denspatesten Zeitpunkt im Entwicklungsprozess beschreiben, zu dem man sich fur eine be-stimmte Variante entscheiden muss. Sie lassen sich in folgende zwei Bereiche unterteilen:Der erste Bereich umfasst die Zeit vor bzw. wahrend des Erstellens des Softwarestandes(Build), d.h. Architektur- und Funktionsmodellierung, Codegenerierung, Kompilierungund das Linken. Der zweite Bereich umfasst entsprechend die Zeit nach dem Erstellendes Softwarestandes (Post-Build), d.h. Flashen eines neuen Softwarestandes bzw. einzel-ner Konfigurationsparameter oder Umschaltung zur Laufzeit. Haufig kommt es vor, dassauf OEM-Seite der Build-Process nicht durchgefuhrt werden kann, da die Zulieferer dieSoftware nur als Binardaten ausliefern, oder ein Re-Build aus Aufwandsgrunden nicht inFrage kommt. In diesem Fall werden die Post-Build-Bindezeiten verwendet, die noch ei-ne sehr spate Konfigurierung erlauben. Hierdurch wird beispielsweise ermoglicht, erst amEnde der Produktionsstraße den individuellen Softwarestand des Fahrzeugs auf die ECUszu laden und uber entsprechende Parameter zu konfigurieren (,,End-of-Line-Flash”).
Ein weiteres Problem stellt die Sicherstellung der projektweiten Konsistenz bei Anderun-gen von Artefakten bzw. gerade auch von Varianten dar. Bei der verteilten Entwicklungder ECUs kommt es heute oft zu Anderungen in samtlichen Entwicklungsphasen. Hier istdafur zu sorgen, dass Anderungen an einem Artefakt an die anderen Entwicklungsphasenpropagiert werden und die Auswirkungen der Anderungen abschatzbar zu machen. Diesist zwar nicht alleinige Aufgabe eines Variantenmanagements, aber durch die Variantenerreicht dies eine zusatzliche Dimension: Welcher Entwicklungsaufwand wurde fur eineErweiterung um eine neue Variante anfallen und welche Artefakte waren betroffen? Aufwelche Varianten bzw. Fahrzeugkonfigurationen wurde sich eine Anderung an einem Ar-tefakt auswirken und welche Regressionstests waren durchzufuhren? Diese Fragen lassensich mit dem heutigen Entwicklungsprozessen haufig nicht ausreichend beantworten, weilZusammenhange zwischen den Artefakten und den Varianten bzw. zwischen den Artefak-ten untereinander nicht ausreichend festgehalten werden. So ist es keine Seltenheit, dassDesign-Dokumente und Code bzw. Soft- und Hardwarestand nicht mehr zusammen passenoder dass eine zu geringe Testtiefe erzielt wird.
3 Zielsetzung / Losungsansatz
Hauptziel der aktuellen Forschungsarbeit ist die Entwicklung eines Konzepts, durch wel-ches bestehende Steuergerateentwicklungsprozesse derart erweitert werden konnen, dassin all ihren Prozessphasen, auch uber Domanen- und Zulieferergrenzen hinweg, einheitlichmit den Varianten umgegangen werden kann. Dadurch soll das Wiederverwendungspoten-zial besser ausgeschopft, die Entwicklungskosten gesenkt und die Qualitat der erstelltenECUs verbessert werden. Die Arbeit wird in folgende Bereiche untergliedert:
99
Variantenprozess: Relevante Use Cases werden identifiziert und benotigten Prozessrollenund -schritte definiert. Bei der automobilen Steuergerateentwicklung spielen Software-Produktlinien (SPLs) eine immer großere Rolle. Gerade auf Zuliefererseite werden oftkomplette Systeme entwickelt, die an die Wunsche verschiedener OEMs angepasst unduber mehrere Produktversionen hinweg weiterentwickelt werden. Aktuell beschaftigt sichdas VEIA-Projekt mit der verteilten Entwicklung und Integration von Automotive-Produkt-linien [GEKM07]. Unsere Forschungsarbeit abstrahiert jedoch vom eigentlichen Entwick-lungsprozess und legt den Schwerpunkt auf das Management der Varianten.
Modellierung: Der Variantenprozess muss durch ein geeignetes Modell unterstutzt wer-den. Hier konnen bestehende Ansatze adaptiert und an die spezifischen Anforderungendes Automobilbereichs angepasst werden (z.B. die feature-modellbasierte Variabilitats-modellierung [BBM05, MP07]). Das zentrale Modell wird dabei sowohl die gesamte Va-riabilitatspyramide aus [PBvdL05] umfassen, als auch zusatzliche Informationen (wie dieArtefaktzusammenhange) abbilden, uber die z.B. Analysemethoden ermoglicht werden.
Werkzeugunterstutzung: Entwicklungswerkzeuge mussen sich in den Variantenprozessintegrieren und an das Variantenmodell anbinden lassen. Fur den Fall, dass sie keine di-rekte Variantenunterstutzung anbieten, wird aktuell ein generischer Mechanismus entwi-ckelt, durch den die Werkzeuge einheitlich uber Modelltransformationen erweitert werdenkonnen. Benotigte Variantierungsmoglichkeiten in den verschiedenen Entwicklungspha-sen bzw. Entwicklungswerkzeugen wurden bereits in verschiedenen Arbeiten untersucht,wie z.B. im Bereich der Funktionsentwicklung [BJK05, DLPW08].
Literatur
[BBM05] Kathrin Berg, Judith Bishop und Dirk Muthig. Tracing software product line variabi-lity: from problem to solution space. In SAICSIT ’05: Proceedings of the 2005 annualresearch conference of the South African institute of computer scientists and informa-tion technologists on IT research in developing countries, Seiten 182–191, Republic ofSouth Africa, 2005.
[BJK05] Stefan Bunzel, Udo Judaschke und Eva Kalix. Variant Mechanisms in Model-BasedDesign and Code Generation. Proc. of MathWorks International Automotive Confe-rence (IAC) 2005, Dearborn (MI), USA, Juni 2005.
[DLPW08] Christian Dziobek, Joachim Loew, Wojciech Przystas und Jens Weiland. FunctionalVariants Handling in Simulink Models. Proc. of MathWorks Automotive Conference(MAC) 2008, Stuttgart, Germany, Juni 2008.
[GEKM07] Martin Große-Rhode, Simon Euringer, Ekkart Kleinod und Stefan Mann. Grobentwurfdes VEIA-Referenzprozesses. ISST-Bericht 80/07, Fraunhofer-Institut fur Software-und Systemtechnik, Abt. Verlassliche Technische Systeme, Mollstraße 1, 10178 Berlin,Germany, January 2007.
[MP07] Andreas Metzger und Klaus Pohl. Variability Management in Software Product LineEngineering. In ICSE Companion, Seiten 186–187, 2007.
[PBvdL05] Klaus Pohl, Gunter Bockle und Frank J. van der Linden. Software Product Line Engi-neering: Foundations, Principles and Techniques. Springer, 2005.
100
Feature Dependencies have to be ManagedThroughout the Whole Product Life-cycle
Goetz Botterweck, Kwanwoo Lee
Lero – The Irish Software Engineering Research CentreUniversity of LimerickLimerick, Ireland
Hansung UniversitySeoul, South [email protected]
Abstract: In this position paper, we discuss feature dependencies as one majorchallenge in product line engineering. We suggest that (1) feature dependenciesshould be treated as first class entities and (2) dependencies in various artefactsacross the software life cycle should be mapped onto each other.
1 Introduction
Product line engineering [PBL05, ClNo02] is based on the assumption that under certainconditions it is more efficient to derive products from a product line than it would be todevelop these product from scratch.
However, the make that promise a reality the application engineering processes, whichderive the product (and account for the product-specific effort), have to be performed asefficiently as possible. For instance, in the schematic overview shown in Figure 1, wewould have to improve the processes Product Configuration and Product Derivation tomake the creation of a Product more efficient.
One potential approach would be to group all interactive decisions, which require humanintelligence and creativity, into the process of Product Configuration and try to automatethe mechanic assembly and generation of the product in Product Derivation as much aspossible. Then, after we configured a product we could just ``press a button'' and theproduct would be created by automated mechanisms.
101
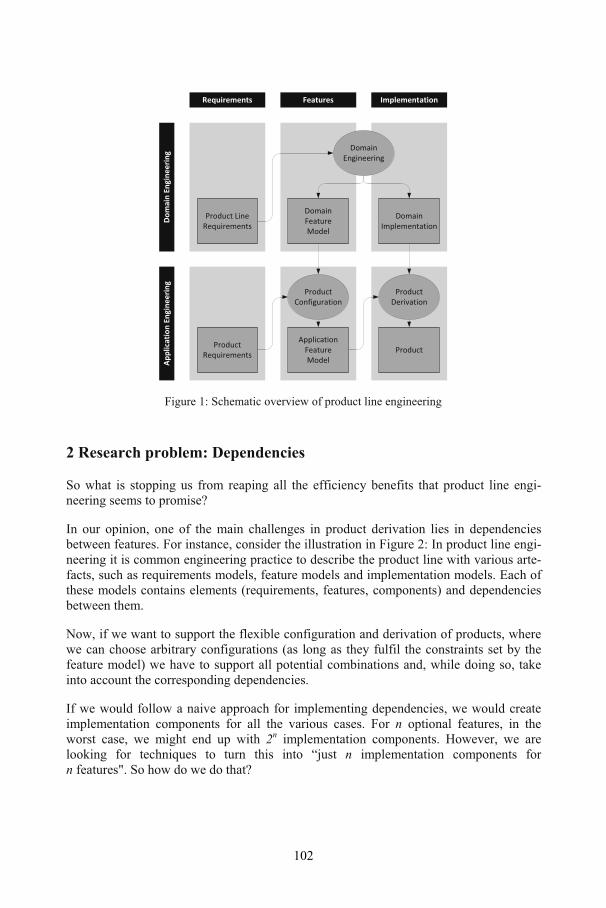
2 Research problem: Dependencies
So what is stopping us from reaping all the efficiency benefits that product line engi-neering seems to promise?
In our opinion, one of the main challenges in product derivation lies in dependenciesbetween features. For instance, consider the illustration in Figure 2: In product line engi-neering it is common engineering practice to describe the product line with various arte-facts, such as requirements models, feature models and implementation models. Each ofthese models contains elements (requirements, features, components) and dependenciesbetween them.
Now, if we want to support the flexible configuration and derivation of products, wherewe can choose arbitrary configurations (as long as they fulfil the constraints set by thefeature model) we have to support all potential combinations and, while doing so, takeinto account the corresponding dependencies.
If we would follow a naive approach for implementing dependencies, we would createimplementation components for all the various cases. For n optional features, in theworst case, we might end up with 2n implementation components. However, we arelooking for techniques to turn this into “just n implementation components forn features". So how do we do that?
Implementation
DomainFeatureModel
ApplicationFeatureModel
Features
ProductConfiguration
Dom
ainEn
gine
ering
App
licationEn
gine
ering
DomainImplementation
Product
ProductDerivation
DomainEngineering
Requirements
Product LineRequirements
ProductRequirements
Figure 1: Schematic overview of product line engineering
102
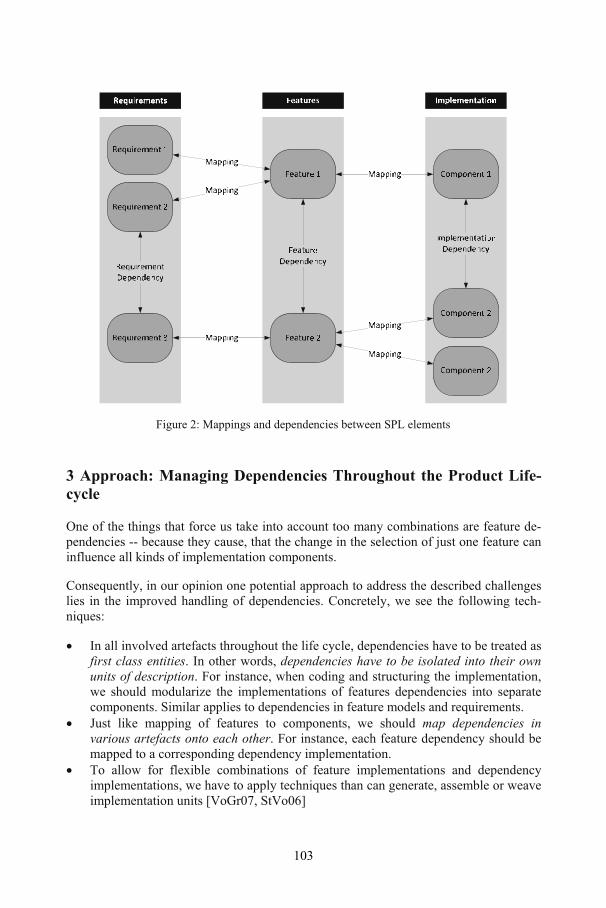
Figure 2: Mappings and dependencies between SPL elements
3 Approach: Managing Dependencies Throughout the Product Life-cycle
One of the things that force us take into account too many combinations are feature de-pendencies -- because they cause, that the change in the selection of just one feature caninfluence all kinds of implementation components.
Consequently, in our opinion one potential approach to address the described challengeslies in the improved handling of dependencies. Concretely, we see the following tech-niques:
• In all involved artefacts throughout the life cycle, dependencies have to be treated asfirst class entities. In other words, dependencies have to be isolated into their ownunits of description. For instance, when coding and structuring the implementation,we should modularize the implementations of features dependencies into separatecomponents. Similar applies to dependencies in feature models and requirements.
• Just like mapping of features to components, we should map dependencies invarious artefacts onto each other. For instance, each feature dependency should bemapped to a corresponding dependency implementation.
• To allow for flexible combinations of feature implementations and dependencyimplementations, we have to apply techniques than can generate, assemble or weaveimplementation units [VoGr07, StVo06]
103
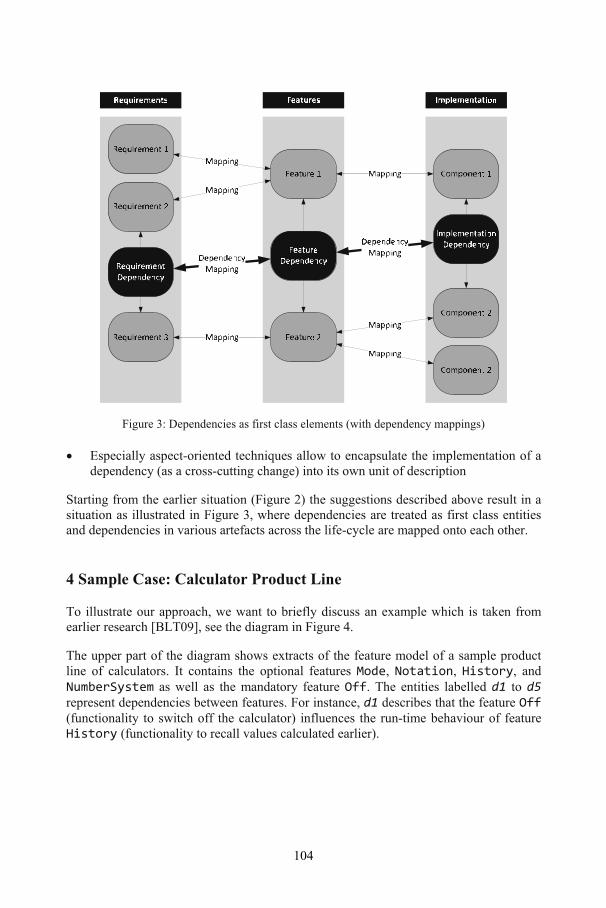
• Especially aspect-oriented techniques allow to encapsulate the implementation of adependency (as a cross-cutting change) into its own unit of description
Figure 3: Dependencies as first class elements (with dependency mappings)
Starting from the earlier situation (Figure 2) the suggestions described above result in asituation as illustrated in Figure 3, where dependencies are treated as first class entitiesand dependencies in various artefacts across the life-cycle are mapped onto each other.
4 Sample Case: Calculator Product Line
To illustrate our approach, we want to briefly discuss an example which is taken fromearlier research [BLT09], see the diagram in Figure 4.
The upper part of the diagram shows extracts of the feature model of a sample productline of calculators. It contains the optional features Mode, Notation, History, andNumberSystem as well as the mandatory feature Off. The entities labelled d1 to d5represent dependencies between features. For instance, d1 describes that the feature Off(functionality to switch off the calculator) influences the run-time behaviour of featureHistory (functionality to recall values calculated earlier).
104
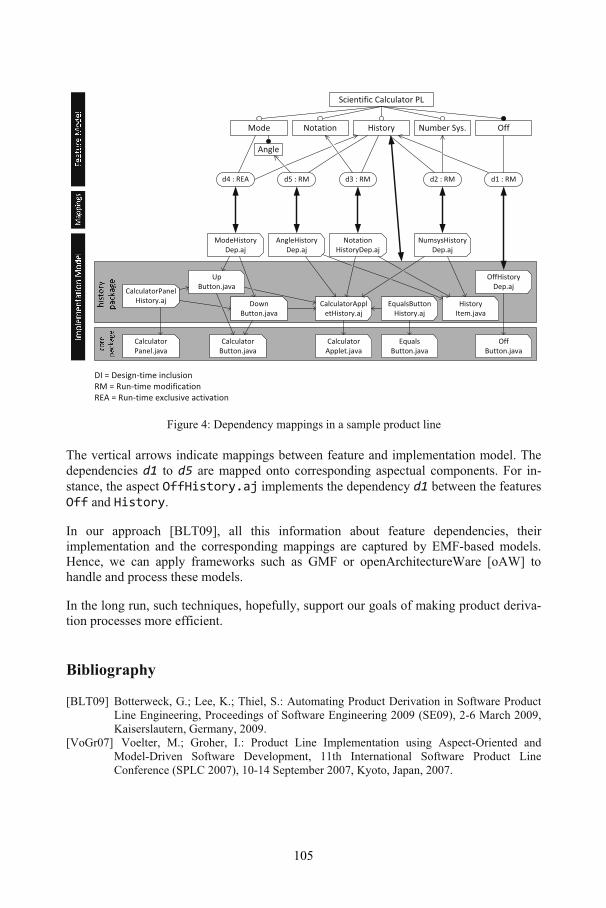
Scientific Calculator PL
The vertical arrows indicate mappings between feature and implementation model. Thedependencies d1 to d5 are mapped onto corresponding aspectual components. For in-stance, the aspect OffHistory.aj implements the dependency d1 between the featuresOff and History.
In our approach [BLT09], all this information about feature dependencies, theirimplementation and the corresponding mappings are captured by EMF-based models.Hence, we can apply frameworks such as GMF or openArchitectureWare [oAW] tohandle and process these models.
In the long run, such techniques, hopefully, support our goals of making product deriva-tion processes more efficient.
Bibliography
[BLT09] Botterweck, G.; Lee, K.; Thiel, S.: Automating Product Derivation in Software ProductLine Engineering, Proceedings of Software Engineering 2009 (SE09), 2-6 March 2009,Kaiserslautern, Germany, 2009.
[VoGr07] Voelter, M.; Groher, I.: Product Line Implementation using Aspect-Oriented andModel-Driven Software Development, 11th International Software Product LineConference (SPLC 2007), 10-14 September 2007, Kyoto, Japan, 2007.
Mode HistoryNotation OffNumber Sys.
d4 : REA d1 : RMd3 : RMd5 : RM d2 : RM
ModeHistoryDep.aj
OffHistoryDep.aj
AngleHistoryDep.aj
NumsysHistoryDep.aj
NotationHistoryDep.aj
DownButton.java
UpButton.javaCalculatorPanel
History.aj
CalculatorPanel.java
CalculatorButton.java
OffButton.java
CalculatorApplet.java
CalculatorAppletHistory.aj
EqualsButtonHistory.aj
EqualsButton.java
HistoryItem.java
Angle
DI = Design‐time inclusionRM = Run‐time modificationREA = Run‐time exclusive activation
Figure 4: Dependency mappings in a sample product line
105

[StVo06] Stahl, T.; Voelter, M.: Model-driven Software Development : Technology, Engineering,Management, ISBN 978-0470025703, Chichester, England; Hoboken, NJ, USA, JohnWiley, 2006.
[PBL05] Pohl, K.; Boeckle, G.; van der Linden, F.: Software Product Line Engineering :Foundations, Principles, and Techniques, ISBN 978-3540243724, New York, NY,Springer, 2005.
[ClNo02] Clements, P.; Northrop, L. M.: Software Product Lines: Practices and Patterns, The SEIseries in software engineering, ISBN 978-0201703320, Boston, MA, USA, Addison-Wesley, 2002.
[oAW] openarchitectureware.org - Official Open Architecture Ware Homepage, Web site.http://www.openarchitectureware.org/
106
Eine Infrastruktur für modellgetriebene hierarchischeProduktlinien
Christoph Elsner†, Daniel Lohmann†, Christa Schwanninger‡
†Friedrich-Alexander Universität Erlangen-Nürnberg{elsner,lohmann}@informatik.uni-erlangen.de
‡Siemens Corporate Technology, Software & Engineering [email protected]
Abstract: Die Entwicklung von Software durch den Produktlinienansatz hat zubeachtlichen Effizienzsteigerungen geführt. Die klassische Vorgehensweise stößtjedoch an Grenzen, wenn sehr breite Produktportfolios abgedeckt werden sollen. Ingroßen Unternehmen ergeben sich daher zunehmend so genannte hierarchischeProduktlinien, bei denen auf einer Basisplattform je nach zu entwickelnder Pro-duktgruppe weitere Produktlinienplattformen aufsetzen. Diese stellen sowohl inorganisatorischer als auch in technischer Hinsicht Herausforderungen im gesamtenSoftware-Lebenszyklus. Um die Variabilität in der Anforderungsspezifikation,der Architektur und der Implementierung einer solchen Produktlinie zu verknüp-fen, stellen wir in dieser Veröffentlichung unser Konzept der modellgetriebenenhierarchischen Produktlinie vor. Um deren einfache Entwicklung zu ermöglichen,beschreiben wir zudem unseren Ansatz einer generischen Infrastruktur, welche dieEntwicklung von modellgetriebenen hierarchischen Produktlinien unterstützt.
1 Einleitung
Softwareentwicklung mit dem Produktlinienansatz hat zu enormen Effizienzgewinnengeführt. Die bisher erzielten Erfolge des Produktlinienansatzes beschränken sich jedochhäufig auf Fälle, bei denen die Produktlinie einen relativ engen, klar begrenzten Gel-tungsbereich (scope) hat. Um die in Großunternehmen möglichen Synergien auch ange-messen nutzen zu können, müssen jedoch auch komplexere Szenarien berücksichtigtwerden.
Eine Möglichkeit, mit der steigenden Komplexität umzugehen, ist die Anwendung eineshierarchischen Produktlinieansatzes [Bo06]. Er setzt voraus, dass zum einen globaleGemeinsamkeiten bestehen und es zum anderen weitere Gemeinsamkeiten innerhalb vonsich nicht überschneidenden Produktgruppen des Portfolios gibt. Die Architektur einerhierarchischen Produktlinie besteht aus einer Basisproduktlinienplattform, auf die jenach Produktgruppe des zu entwickelnden Produkts weitere Produktlinienplattformenhierarchisch aufsetzen können.
107
Der hierarchische Produktlinienansatz hat mehrere Nachteile. Die Plattformen selbst sindmeist monolithisch und wenig flexibel aufgebaut. Die von ihnen angebotenen Konfigu-rationsmöglichkeiten erfordern daher umfangreiches Wissen über Interna der Plattfor-men (programmiersprachliche Konfigurationsschalter) und sind dadurch zeitaufwändigund fehlerträchtig.
Modellgetriebene Softwareentwicklung hingegen ermöglicht im Idealfall die Spezi-fikation der Anforderungen an ein konkretes Produkt durch ein domänenspezifischesModell im Problemraum. Dieses ist explizit darauf ausgelegt, von Domänenexpertenerstellt zu werden. Die Produktableitungslogik generiert auf Basis des Modells mit Hilfevon Modelltransformatoren und Code-Generatoren die variablen Anteile des Produkts.Detailwissen von den Implementierungsartefakten im Lösungsraum ist dann bei derProduktableitung nicht mehr von Nöten.
Nachfolgend stellen wir unserer Konzept der modellgetriebenen hierarchischen Produkt-linie und einer zugehörigen Infrastruktur vor. In Abschnitt 2 motivieren wir den Bedarfan besseren Konzepten zur Entwicklung von Software für umfangreiche Produktportfo-lios, die es ermöglichen, die Variabilitätsdarstellung während der Anforderungsanalysemit der während der Architektur und Implementierungsphase verwendeten zu verbinden.Anschließend stellen wir unser Konzept für hierarchische modellgetriebene Produktli-nien vor, dessen zentraler Bestandteil die so genannte Produktlinienkomponente (PLiC)darstellt, eine Art Subproduktlinie innerhalb der hierarchischen Produktlinie (Abschnitt3). In Abschnitt 4 beschreiben wir unseren Ansatz für eine generische Infrastruktur fürmodellgetriebene hierarchische Produktlinien. Abschließend berichten wir über unsereBemühungen zur Evaluierung des Gesamtkonzepts (Abschnitt 5).
2 Motivation
Im Folgenden möchten wir auf drei verschiedene Gesichtspunkte eingehen, um denEinsatz modellgetriebener Verfahren zur Variabilitätsmodellierung von hierarchischenProduktlinien in unterschiedlichen Phasen des Produktlinienlebenszyklus zu motivieren:Anforderungsanalyse, Produktlinienreferenzarchitektur und Produktableitungsinfra-struktur.
2.1 Anforderungsanalyse
Bereits bei der merkmalsorientierten Domänenanalyse nach Kang (FODA) [Ka90], wel-che der Spezifikation der Anforderungsvariabilität dient, ist die Aufspaltung der Merk-malsbäume nach Subdomänen vorgesehen. Sie eignet sich also bereits zur Modellierunghierarchischer Produktlinien, wenn man Subdomänen als optionale Zusätze zu einerBasisdomäne auffasst.
108
Tatsächlich gibt es bei der Modellierung der Variabilität der Anforderungen in Großpro-duktlinien zahlreiche mehr oder weniger formale Ansätze. Sie reichen von mengenorien-tierten [TH02, Pa08] und merkmalmodellbasierten Beschreibungen [Fr07] bis hin zurorthogonalen Variabilitätsmodellierung [BLP05]. Im Kontext von Großproduktlinien istes hingegen nicht üblich, diese Artefakte auch formal mit den Artefakten der Architekturund Implementierung in Beziehung zu setzen. Dies erschwert und verlangsamt sowohldie Domänen- und Anwendungsentwicklung und kann letztendlich dazu führen, dassAnforderungsspezifikation und die Implementierung der Produktlinie auseinander drif-ten.
Um diese Lücke zu schließen, ist unser Ziel, hierarchische Produktlinien mit explizitermodellgetriebener Unterstützung zu entwerfen. Dies möchten wir durch den Einsatzdomänenspezifischer Modelle, die einerseits stark an den Konzepten der Anforderungs-analyse angelehnt sind und deren Elemente andererseits explizit mit dem Lösungsraumverknüpft werden, erreichen.
2.2 Produktlinienreferenzarchitektur
Die Referenzarchitekturen komplexer Produktlinien befinden sich üblicherweise imZwischenbereich zweier Basisprinzipien: dem komponentenbasierten Entwurf und dembereits erwähnten hierarchischen, plattformbasierten Entwurf [Bo06]. Beim reinen platt-formbasierten Ansatz ist umfangreicher Integrationsaufwand während der Domänenent-wicklung (domain engineering) nötig. Zudem leidet bei ihm wie bereits erwähnt dieFlexibilität bei der Anwendungserstellung (application engineering). Beim komponen-tenbasiertem Ansatz hingegen entwickelt man zunächst alle Bestandteile der Produktli-nie während der Domänenentwicklung als weitgehend separate Komponenten. Er erfor-dert jedoch umfangreichen Kompositionsaufwand während der Anwendungserstellungfür jedes einzelne zu erstellende Produkt.
Einige Autoren wie Ommering und Bosch haben sich eine Zeit lang explizit für denkomponentenbasierten Entwurf ausgesprochen (z. B. in [OB02]). Um der Probleme deraufwändigen Komponentenintegration Herr zu werden, zeichnet sich in jüngster Zeithingegen wiederum eine Tendenz zur Vorintegration mehrerer Komponenten bereitswährend des Domänenentwurfs (pre-integrated components, auch architectural slicesgenannt) [PGB08] ab.
In dieser Veröffentlichung nähern wir uns dem Problem hingegen genau von der anderenSeite. Ausgehend von einer hierarchischen Produktlinie mit hohem manuellen Entwick-lungsanteil, möchten wir deren Flexibilität bei der Anwendungserstellung erhöhen, in-dem wir auf modellgetriebene Entwicklungsverfahren setzen. Die entsprechende mo-dellgetriebene Infrastruktur und Logik wird dabei in der Domänenentwicklungsphaseerstellt. Anwendungsingenieure können diese dann bei der Produktableitung verwendenund werden entlastet, ohne ihnen gleichzeitig die Flexibilität zu nehmen. Der von unsadressierte hierarchische Ansatz kommt hingegen nicht ohne Weiteres mit den bishererhältlichen modellgetriebenen Mitteln und Werkzeugen aus, was wir nachfolgend dar-legen werden.
109
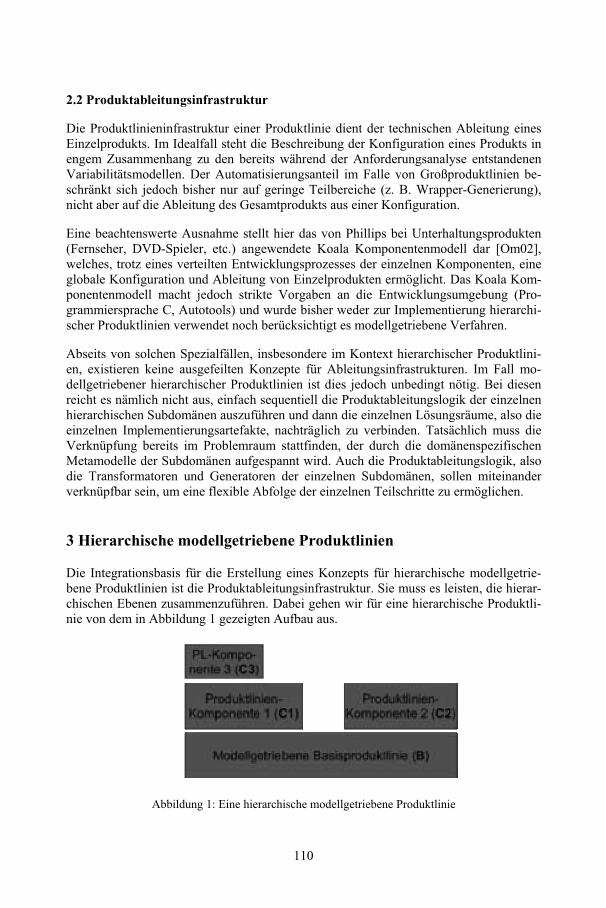
2.2 Produktableitungsinfrastruktur
Die Produktlinieninfrastruktur einer Produktlinie dient der technischen Ableitung einesEinzelprodukts. Im Idealfall steht die Beschreibung der Konfiguration eines Produkts inengem Zusammenhang zu den bereits während der Anforderungsanalyse entstandenenVariabilitätsmodellen. Der Automatisierungsanteil im Falle von Großproduktlinien be-schränkt sich jedoch bisher nur auf geringe Teilbereiche (z. B. Wrapper-Generierung),nicht aber auf die Ableitung des Gesamtprodukts aus einer Konfiguration.
Eine beachtenswerte Ausnahme stellt hier das von Phillips bei Unterhaltungsprodukten(Fernseher, DVD-Spieler, etc.) angewendete Koala Komponentenmodell dar [Om02],welches, trotz eines verteilten Entwicklungsprozesses der einzelnen Komponenten, eineglobale Konfiguration und Ableitung von Einzelprodukten ermöglicht. Das Koala Kom-ponentenmodell macht jedoch strikte Vorgaben an die Entwicklungsumgebung (Pro-grammiersprache C, Autotools) und wurde bisher weder zur Implementierung hierarchi-scher Produktlinien verwendet noch berücksichtigt es modellgetriebene Verfahren.
Abseits von solchen Spezialfällen, insbesondere im Kontext hierarchischer Produktlini-en, existieren keine ausgefeilten Konzepte für Ableitungsinfrastrukturen. Im Fall mo-dellgetriebener hierarchischer Produktlinien ist dies jedoch unbedingt nötig. Bei diesenreicht es nämlich nicht aus, einfach sequentiell die Produktableitungslogik der einzelnenhierarchischen Subdomänen auszuführen und dann die einzelnen Lösungsräume, also dieeinzelnen Implementierungsartefakte, nachträglich zu verbinden. Tatsächlich muss dieVerknüpfung bereits im Problemraum stattfinden, der durch die domänenspezifischenMetamodelle der Subdomänen aufgespannt wird. Auch die Produktableitungslogik, alsodie Transformatoren und Generatoren der einzelnen Subdomänen, sollen miteinanderverknüpfbar sein, um eine flexible Abfolge der einzelnen Teilschritte zu ermöglichen.
3 Hierarchische modellgetriebene Produktlinien
Die Integrationsbasis für die Erstellung eines Konzepts für hierarchische modellgetrie-bene Produktlinien ist die Produktableitungsinfrastruktur. Sie muss es leisten, die hierar-chischen Ebenen zusammenzuführen. Dabei gehen wir für eine hierarchische Produktli-nie von dem in Abbildung 1 gezeigten Aufbau aus.
Abbildung 1: Eine hierarchische modellgetriebene Produktlinie
110
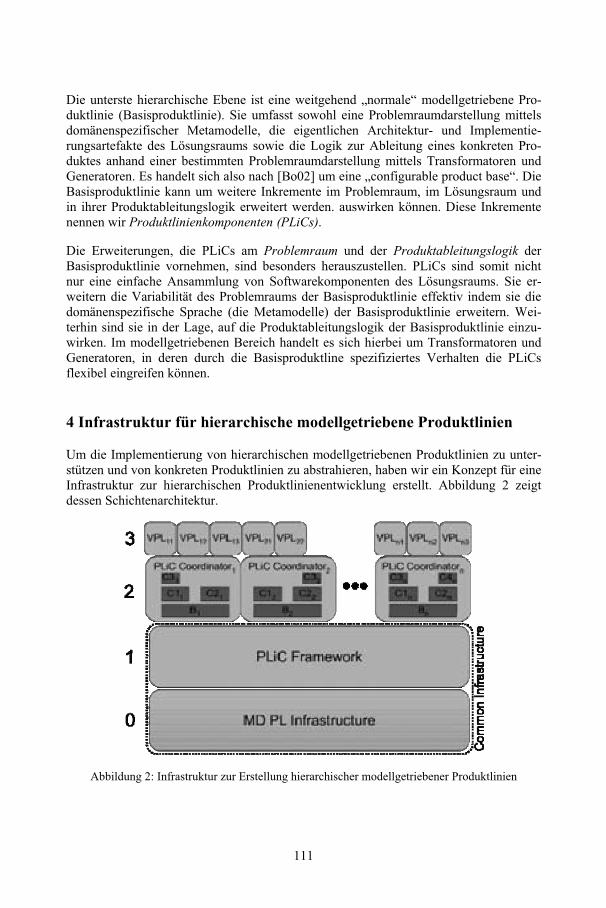
Die unterste hierarchische Ebene ist eine weitgehend „normale“ modellgetriebene Pro-duktlinie (Basisproduktlinie). Sie umfasst sowohl eine Problemraumdarstellung mittelsdomänenspezifischer Metamodelle, die eigentlichen Architektur- und Implementie-rungsartefakte des Lösungsraums sowie die Logik zur Ableitung eines konkreten Pro-duktes anhand einer bestimmten Problemraumdarstellung mittels Transformatoren undGeneratoren. Es handelt sich also nach [Bo02] um eine „configurable product base“. DieBasisproduktlinie kann um weitere Inkremente im Problemraum, im Lösungsraum undin ihrer Produktableitungslogik erweitert werden. auswirken können. Diese Inkrementenennen wir Produktlinienkomponenten (PLiCs).
Die Erweiterungen, die PLiCs am Problemraum und der Produktableitungslogik derBasisproduktlinie vornehmen, sind besonders herauszustellen. PLiCs sind somit nichtnur eine einfache Ansammlung von Softwarekomponenten des Lösungsraums. Sie er-weitern die Variabilität des Problemraums der Basisproduktlinie effektiv indem sie diedomänenspezifische Sprache (die Metamodelle) der Basisproduktlinie erweitern. Wei-terhin sind sie in der Lage, auf die Produktableitungslogik der Basisproduktlinie einzu-wirken. Im modellgetriebenen Bereich handelt es sich hierbei um Transformatoren undGeneratoren, in deren durch die Basisproduktline spezifiziertes Verhalten die PLiCsflexibel eingreifen können.
4 Infrastruktur für hierarchische modellgetriebene Produktlinien
Um die Implementierung von hierarchischen modellgetriebenen Produktlinien zu unter-stützen und von konkreten Produktlinien zu abstrahieren, haben wir ein Konzept für eineInfrastruktur zur hierarchischen Produktlinienentwicklung erstellt. Abbildung 2 zeigtdessen Schichtenarchitektur.
Abbildung 2: Infrastruktur zur Erstellung hierarchischer modellgetriebener Produktlinien
111
Schicht 0. Auf unterster Ebene befinden sich generische, auf dem Markt erhältlicheWerkzeuge zur Erstellung modellgetriebener Anwendungen und Produktlinien, bei-spielsweise openArchitectureWare [Op09].
Schicht 1. Das darauf aufsetzende PLiC Framework bietet Basisfunktionalitäten, dievon der darüber liegenden Schicht genutzt werden können um den Produktableitungs-prozess je hierarchische Produktlinie zu definieren und zu koordinieren. Es handelt sichhierbei um Funktionalitäten zur Definition von „Schnittstellen“ zwischen der Basispro-duktlinie und den PLiCs. Diese Schnittstelle spezifiziert also die durch PLiCs möglichenErweiterungen der Basisproduktlinie mit Problemraumelementen, Lösungsraumelemen-ten und Produktableitungslogik.
Schicht 2. Auf dieser Schicht befinden sich nun mehrere, auf der gemeinsamen Infra-struktur (common infrastructure) aufsetzende, modellgetriebene hierarchische Produktli-nien (vgl. Abbildung 1). Als Kapselungseinheit für eine solche, dient jeweils ein so ge-nannter PLiC Coordinator. Er definiert die konkreten Schnittstellen im Problem- undLösungsraum sowie in der Produktableitungslogik. Im modellgetriebenen Kontext gehtes bei den Schnittstellenelementen um Modelle, Metamodelle, Transformatoren, Genera-toren und Programmcode. Er dient somit als Mediator zwischen einer Basisproduktlinieund den PLiCs.
Schicht 3. Auf der obersten Schicht ist es nun möglich, virtuelle Produktlinien (VPLs)zu definieren. Eine VPL ist eine um bestimmte PLiCs erweiterte Basisproduktlinie. IhrProblemraum besteht aus der Vereinigung der Problemräume (also der domänenspezifi-schen Metamodelle, DSMMs) der Basisproduktlinie und der PLiCs. Die Spezifikationeines konkreten Produkts aus der VPL wird dann durch domänenspezifische Modelle(Instanzen der DSMMs) beschrieben, welche die Grundlage der Produktableitung bilden.Unter Beteiligung des PLiC Coordinators, der für das „Einweben“ der Transformations-und Generatorlogik der PLiCs in die Ableitungslogik der Basisproduktlinie sorgt, ent-steht schließlich das Endprodukt.
5 Ausblick
Wir arbeiten momentan an einer Implementierung des Konzepts auf Basis von openAr-chitectureWare (oAW) [Op09] und der Produktlinie Smart Home, welche im Kontextdes EU-Forschungsprojekts AMPLE (Aspect-Oriented Model-Driven Product Line En-gineering) [Am09] entstanden ist. Zur Erweiterung von Transformatoren und Generato-ren der Basisproduktlinie nutzen wir die von oAW angebotenen aspektorientierten Me-chanismen. Zur Spezifikation des PLiC Frameworks ist eine Erweiterung der oAWWorkflow Language [El08] angedacht, so dass die „Schnittstelle“ zwischen Basispro-duktlinie und PLiC durch einen solchen Worfklow spezifiziert werden kann.
112
Literaturverzeichnis
[Am09] AMPLE Project Homepage. Aspect-Oriented Model-Driven Product Line Engineering.Project Presentation, http://ample.holos.pt/.
[BLP05] Stan Bühne, Kim Lauenroth, and Klaus Pohl. Modelling Requirements Variability acrossProduct Lines. In RE ’05: Proceedings of the 13th IEEE International Conference on Re-quirements Engineering, pages 41–52, Washington, DC, USA, 2005. IEEE ComputerSociety.
[Bo02] Jan Bosch. Maturity and Evolution in Software Product Lines: Approaches, Artefactsand Organization. In 2nd Software Product Line Conf. (SPLC ’02), pages 257–271, Hei-delberg, BW, FRG, 2002. Springer.
[Bo06] Jan Bosch. Expanding the Scope of Software Product Families: Problems and Alterna-tive Approaches. In Christine Hofmeister, Ivica Crnkovic, and Ralf Reussner, editors,Quality of Software Architectures, volume 4214 of LNCS. Springer, 2006.
[El08] Christoph Elsner, Daniel Lohmann, and Wolfgang Schröder-Preikschat. Towards Sepa-ration of Concerns in Model Transformation Workflows. In Steffen Thiel and KlausPohl, editors, 12th Software Product Line Conf. (SPLC ’08), Second Volume. Lero In-ternational Science Centre, 2008.
[Fr07] Wolfgang Fries. Integration von konfigurierbaren Softwaremodulen in eingebetteteSysteme. Dissertation, Friedrich Alexander University Erlangen-Nuremberg, Chair inDistributed Systems and Operating Systems, August 2007.
[Ka90] K. Kang, S. Cohen, J. Hess, W. Novak, and S. Peterson. Feature-Oriented Domain Ana-lysis (FODA) feasibility study. Technical report, Carnegie Mellon University, SoftwareEngineering Institute, Pittsburgh, PA, November 1990.
[OB02] Rob Van Ommering and Jan Bosch. Widening the Scope of Software Product Lines -From Variation to Composition. In 2nd Software Product Line Conf. (SPLC ’02), pages328–347, Heidelberg, BW, FRG, 2002. Springer.
[Om02] Rob van Ommering. Building Product Populations with Software Components. In 24thInt. Conf. on Software Engineering (ICSE ’02), pages 255–265, New York, NY, USA,2002. ACM.
[Op09] OpenArchitectureWare Homepage. http://www.openarchitectureware.org.[Pa08] David Lorge Parnas. Multi-Dimensional Software Families: Document Defined Parti-
tions of a Set of Products. Keynote at the Software Product Line Conference (SPLC ‘08),2008.
[PGB08] Christian Prehofer, Jilles van Gurp, and Jan Bosch. Emerging Methods, Technologiesand Process Management in Software Engineering. Compositionality in Software Prod-uct Lines. Wiley-IEEE Computer Society Pr, 2008.
[TH03] Jeffrey M. Thompson and Mats P.E. Heimdahl. Structuring Product Family Require-ments for n-Dimensional and Hierarchical Product Lines. Requirements EngineeringJournal, 8(1):42– 54, February 2003.
113

Modellgetriebenes Softwareengineering – Der Beginn
industrieller Softwareproduktion?
Wolfgang Goerigk, Thomas Stahl
b+m engineeringb+m Informatik AG (www.bmiag.de)
Rotenhofer Weg 2024109 Melsdorf
[email protected]@ bmiag.de
Abstract: Modellgetriebenes Softwareengineering hat sich zu einem praxistaug-lichen und reifen Ansatz mit zunehmend breitem Anwendungsspektrum undausgereifter Werkzeugunterstützung entwickelt. Die mechanische Unterstützungder Konstruktionsprozesse steigert Qualität und Produktivität, und ein Vergleichmit industriellen Fertigungsstraßen ist erlaubt. Die Methoden lassen sich sinnvollauch mit dem Product Line Engineering verbinden, um Varianten oder allgemeinerVariabilität über weite Teile des Entwicklungsprozesses zu beherrschen. DerBeitrag enthält ein Position Paper zum Workshop „Produkt-Variabilität im gesam-ten Lebenszyklus“ auf der Softwareengineering 2009.
Einführung
In den zehn letzten Jahren hat sich das modellgetriebene Softwareengineering zu einemreifen und praxistauglichen Ansatz entwickelt. Neue Techniken, Methoden undStandards sorgen für ein zunehmend breites Anwendungsspektrum, weit über denengeren Bereich von Entwurf und Implementierung hinaus. Obwohl Softwaresystemezunehmend komplexer werden, sind die zugrundeliegenden Modelle oft klein, handlichund durch adäquate fachliche und technische Abstraktionen beherrschbar und einfachmodifizierbar. Hinzu kommen ausgereifte Werkzeuge, die den Konstruktionsprozessmechanisch unterstützen oder gar automatisieren, Know How verfügbar machen,Qualität und Produktivität steigern und die Angst vor Größe und Komplexität derentstehenden Softwaresysteme und auch der Konstruktionsschritte einzudämmen helfen.
115
Natürlich ist die industrielle Revolution, vor 100 Jahren von Henry Ford mit derEinführung des Fließbandes wesentlich vorangetrieben, auch der Softwarebrancheschon oft versprochen worden. Ein wesentlicher Durchbruch blieb dieser Branchebislang weitgehend verwehrt. Allerdings folgen Softwareartefakte und ihre Konstruk-tionsprozesse im Kontext von Objektorientierung und ausgereiften Frameworks zuneh-mend ähnlichen Mustern. Und tatsächlich gibt es Anzeichen, dass nun auch die Soft-warebranche reif für eine Industrialisierung ist. Moderne Fertigungsstraßen, wie sie imz.B. Automobilbau unabdingbar sind und die Produktion ähnlicher aber stets verschie-dener Produkte inzwischen ausgesprochen gut beherrschen, sind auch für die Software-branche in Sicht.
Produktlinien-Engineering (PLE), Generative Programmentwicklung (GP), DomainDriven Design (DDD) und viele andere Disziplinen modernen Softwareengineeringsspannen ein breites Spektrum von Methoden, Techniken und Werkzeugen auf, dieletztlich vieles gemeinsam haben: Sie sind modellgetrieben und domänenspezifisch, d.h.nicht universell, sondern spezialisiert und angepasst auf Familien ähnlicher Produkteoder Produktionstechniken. Sie zielen auf industrielle Fertigung mit der nötigenVariabilität. Und sie lassen sich im Kontext modellgetriebener Softwareentwicklung(MDSD), allgemeiner des modellgetriebenen Softwareengineerings (MDSE) verstehen.
Modellgetriebene Softwareentwicklung (MDSD)
Software-Artefakte, Modelle, Programme, Konfigurationen haben sich im Software-engineering seit geraumer Zeit kaum wesentlich verändert. Es sind vor allem diegedanklichen Prozesse und die Werkzeuge, die Fortschritt erkennen lassen und denVergleich mit moderner industrieller Fertigung rechtfertigen. Bis vor nicht allzu langerZeit entsprachen die Werkzeuge in der Softwareindustrie eher – um im Bild zu bleiben –den Stanzen, Fräsen und Drehbänken der Werkzeug – und Automobilindustrie. Dochmoderne Generatorframeworks können mehr als nur stanzen, fräsen, tiefziehen,extrahieren, kleben und schweißen. Sie können vor allem auch Stanzen, Fräsen,Drehbänke und Schweiß-Roboter programmieren und einsetzen, Fertigungssstraßenrealisieren und konfektionieren.
Eines der bekanntesten Generatorframeworks ist openArchitectureWare (oAW, opensource, www.openarchitectureware.org), in Eclipse (www.eclipse.org) integriert, ein-fach zu bedienen und genauso einfach zu adaptieren. Neben den zwei Transformations-arten – M2M (Model to Model) und M2T (Model to Text), die durch zwei Sprachen(Xtend und Xpand) bedient werden – steht auch ein Rahmen für die Ablaufsteuerung derProduktion zur Verfügung. Mit diesem Framework können ausgesprochen leistungs-fähige Transformatoren und Generatoren entwickelt werden. Dabei werden sogenannteTemplates gemäß der Referenzimplementierung ausgearbeitet und mit der nötigenSteuerungslogik versehen. Die einmal gefundene Lösung kann anschließend jederzeitreproduziert und angepasst werden.
116
Input für den Generator sind i.a. Modelle. Als Modellierungssprache werden seit gerau-mer Zeit meist die Unified Modeling Language (UML) bzw. UML-Profile verwendet,lange ohne nennenswerte Alternative. Die Entwicklung eines entsprechenden Modellie-rungswerkzeuges war ausgesprochen aufwendig und kostspielig. Inzwischen stehenWerkzeuge zur Verfügung, die die Entwicklung domänenspezifischer Modellierungs-sprachen (DSLs) und der entsprechenden Werkzeuge unterstützen und automatisieren[GW09], beispielsweise in der Architektur-Domäne die Entwicklungs-Plattform b+mgear Java, .NET für moderne Web-Anwendungen.
MDSE [SVEH07] macht für alle Unternehmen Sinn, die viel Software produzieren undsich die Möglichkeit der Wiederverwendung von Konstruktions-Know How, speziellvon Modellen und Generatoren zunutze machen wollen, um Kosten zu sparen undQualität zu steigern. Außerdem können durch den Einsatz maßgefertigter DSL-EditorenFach- und Entwicklungsabteilung enger zusammenarbeiten und Qualität und Produk-tivität im Softwareentwicklungsprozess steigern. Die Methoden des modellgetriebenenSoftwareengineering erlauben Variabilität von Produkten und Produktionsprozessen, undsie unterstützen zunehmend auch das Projekt- und Qualitätsmanagement.
Produktlinien und Variabilität
Die wesentlichen Techniken zum Umgang mit Features und Varianten stammen aus demProduktlinien-Engineering. Sie lassen sich auch im modellgetriebenen Vorgehens-modell nutzbringend einsetzen und mit domänenspezifischen Sprachen (DSLs)unterstützen. Die Variabilität der Einzelprodukte – mögliche Zusatzanforderungen oderverfügbare Features (Extras) – können systematisch und explizit erfasst und einerformalen Modellierung in einer problemorientierten Sprache zugeführt werden, anstattsie ausschließlich lösungsorientiert und konstruktiv oder gar implizit in Einzelproduktenzu etablieren. Feature-Modelle und entsprechende Werkzeuge unterstützen die expliziteModellierung und Handhabung von Variabilität. Die Techniken lassen sich auch imRequirements Engineering einsetzen, um sehr früh Variabilität bereits in Anforderungs-spezifikationen in entsprechenden DSLs zu modellieren und handhabbar zu machen –auch für Projekte außerhalb des Kontextes von Produktlinien [SW09].
Literaturverzeichnis
[GW09] Wolfgang Goerigk, Steffen Weik: Modellgetriebenes Softwareengineering – ModerneMethoden in der Praxis. Tutorial auf der Softwareengineering SE 2009, März 2009.
[SVEH07] Thomas Stahl, Markus Völter, Sven Efftinge, Arno Haase: ModellgetriebeneSoftwareentwicklung – Techniken, Engineering, Management (2. aktualisierte und erweiterteAuflage). Dpunkt Verlag, Heidelberg, Mai 2007.
[SW09] Thomas Stahl und Tim Weilkiens: SysML/DSL für Anforderungen mit Varianten .Requirements Engineering Tagung REConf 2009, München, 2009.
117
Die b+m Informatik AG
Die b+m Informatik AG (www.bmiag.de) ist Spezialist für Softwarelösungen derBranchen Finanzen, Gesundheit und internationaler Handel. Das Leistungsspektrum derb+m Gruppe reicht von IT-Beratung und Prozessanalyse über Softwareentwicklung und-integration bis hin zu Wartung und Betreuung. Über die Kernbranchen hinaus vertrauenmittelständische Unternehmen und Konzerne der Lösungskompetenz von b+m beikomplexen IT-Anforderungen in Hard- und Software. Durch „Top of the Art“ Software-engineering ist b+m ein führender Anbieter individuellerSoftware-Lösungen im deutsch-sprachigen Raum.
b+m engineering (www.bmiag.de/b-m-engineering.html) ist Pionier auf dem Gebiet derAutomatisierung von Softwareentwicklung (Model-Driven Software Development) undInitiator des führenden OpenSource-Projektes openArchitectureWare (oAW) in diesemBereich. Dieses Framework wurde 2003 Open-Source gestellt und wird von einer gro-ßen Community weltweit eingesetzt, getestet und weiterentwickelt. Die b+m InformatikAG ist die Firma mit dem größten Erfahrungsschatz im Einsatz dieses Konzepts imindustriellen Maßstab.
118
Variabilität als eine eigenständige Sicht auf Produktlinien
Kim Lauenroth, Klaus Pohl
Software Systems EngineeringUniversität Duisburg-Essen
Schützenbahn 7045117 Essen
[email protected]@sse.uni-due.de
1 Einleitung
Die explizite Analyse und Modellierung von Variabilität ist neben der Aufteilung inDomain und Application Engineering das wesentliche Unterscheidungsmerkmalzwischen Produktlinienentwicklung und Einzelsystementwicklung (vgl. [PBL05]). Indiesem Beitrag vertreten wir den Standpunkt, dass die Variabilität einer Produktlinieeine eigenständige Sicht darstellt und daher in einem eigenständigen Modelldokumentiert werden muss. Die eigenständige Dokumentation bietet für dieProduktlinienentwicklung zahlreiche Vorteile, die wir in diesem Beitrag skizzieren.
2 Argumente für eine eigenständige Sicht
In der Literatur werden zwei Arten der Dokumentation von Variabilität unterschieden:
• Die integrierte Dokumentation von Variabilität dokumentiert Variabilität innerhalbvon Entwicklungsartefakten. Zahlreiche Typen von Entwicklungsartefaktenunterstützen die Dokumentation von Variabilität mit Hilfe vonModellierungskonstrukten. Zum Beispiel bieten Use Cases hierzu optionale undalternative Abläufe an oder Klassendiagramme bieten hierzuVererbungsmechanismen an. Artefakttypen ohne Mechanismen für Variabilitätmüssen entsprechend erweitert werden.
• Die orthogonale Dokumentation von Variabilität dokumentiert die Variabilität ineinem eigenständigen Modell und damit unabhängig von konkretenEntwicklungsartefakten. Die Auswirkungen der Variabilität werden mit Hilfe vonBeziehungen zu den Artefaktmodellen dokumentiert.
Die integrierte Dokumentation von Variabilität ist aus verschiedenen Gründen vonNachteil. Unter anderem ist die Variabilitätsinformation über verschiedene Modelleverstreut und Abhängigkeiten zwischen verschiedenen Artefakten (z.B. zwischen derVariabilität in den Use Cases und den Klassenmodellen) können nur schwierigdokumentiert und geprüft werden. Ebenfalls kann die Variabilität nur mit Hilfe der
119
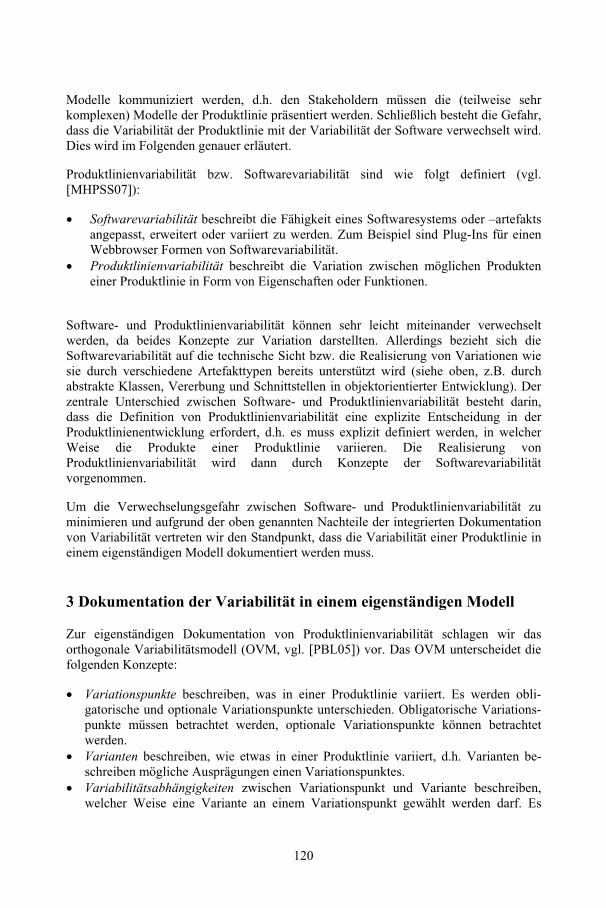
Modelle kommuniziert werden, d.h. den Stakeholdern müssen die (teilweise sehrkomplexen) Modelle der Produktlinie präsentiert werden. Schließlich besteht die Gefahr,dass die Variabilität der Produktlinie mit der Variabilität der Software verwechselt wird.Dies wird im Folgenden genauer erläutert.
Produktlinienvariabilität bzw. Softwarevariabilität sind wie folgt definiert (vgl.[MHPSS07]):
• Softwarevariabilität beschreibt die Fähigkeit eines Softwaresystems oder –artefaktsangepasst, erweitert oder variiert zu werden. Zum Beispiel sind Plug-Ins für einenWebbrowser Formen von Softwarevariabilität.
• Produktlinienvariabilität beschreibt die Variation zwischen möglichen Produkteneiner Produktlinie in Form von Eigenschaften oder Funktionen.
Software- und Produktlinienvariabilität können sehr leicht miteinander verwechseltwerden, da beides Konzepte zur Variation darstellten. Allerdings bezieht sich dieSoftwarevariabilität auf die technische Sicht bzw. die Realisierung von Variationen wiesie durch verschiedene Artefakttypen bereits unterstützt wird (siehe oben, z.B. durchabstrakte Klassen, Vererbung und Schnittstellen in objektorientierter Entwicklung). Derzentrale Unterschied zwischen Software- und Produktlinienvariabilität besteht darin,dass die Definition von Produktlinienvariabilität eine explizite Entscheidung in derProduktlinienentwicklung erfordert, d.h. es muss explizit definiert werden, in welcherWeise die Produkte einer Produktlinie variieren. Die Realisierung vonProduktlinienvariabilität wird dann durch Konzepte der Softwarevariabilitätvorgenommen.
Um die Verwechselungsgefahr zwischen Software- und Produktlinienvariabilität zuminimieren und aufgrund der oben genannten Nachteile der integrierten Dokumentationvon Variabilität vertreten wir den Standpunkt, dass die Variabilität einer Produktlinie ineinem eigenständigen Modell dokumentiert werden muss.
3 Dokumentation der Variabilität in einem eigenständigen Modell
Zur eigenständigen Dokumentation von Produktlinienvariabilität schlagen wir dasorthogonale Variabilitätsmodell (OVM, vgl. [PBL05]) vor. Das OVM unterscheidet diefolgenden Konzepte:
• Variationspunkte beschreiben, was in einer Produktlinie variiert. Es werden obli-gatorische und optionale Variationspunkte unterschieden. Obligatorische Variations-punkte müssen betrachtet werden, optionale Variationspunkte können betrachtetwerden.
• Varianten beschreiben, wie etwas in einer Produktlinie variiert, d.h. Varianten be-schreiben mögliche Ausprägungen einen Variationspunktes.
• Variabilitätsabhängigkeiten zwischen Variationspunkt und Variante beschreiben,welcher Weise eine Variante an einem Variationspunkt gewählt werden darf. Es
120
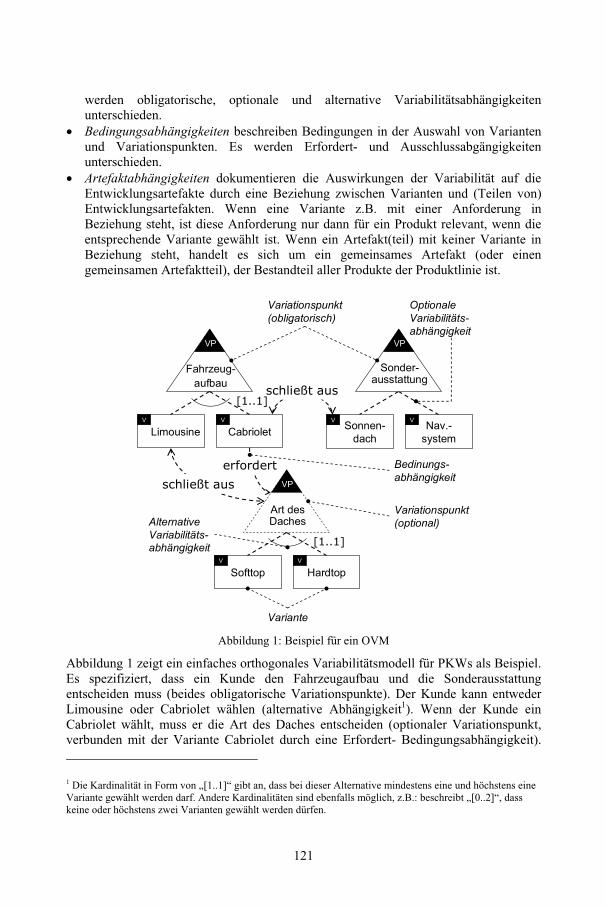
werden obligatorische, optionale und alternative Variabilitätsabhängigkeitenunterschieden.
• Bedingungsabhängigkeiten beschreiben Bedingungen in der Auswahl von Variantenund Variationspunkten. Es werden Erfordert- und Ausschlussabgängigkeitenunterschieden.
• Artefaktabhängigkeiten dokumentieren die Auswirkungen der Variabilität auf dieEntwicklungsartefakte durch eine Beziehung zwischen Varianten und (Teilen von)Entwicklungsartefakten. Wenn eine Variante z.B. mit einer Anforderung inBeziehung steht, ist diese Anforderung nur dann für ein Produkt relevant, wenn dieentsprechende Variante gewählt ist. Wenn ein Artefakt(teil) mit keiner Variante inBeziehung steht, handelt es sich um ein gemeinsames Artefakt (oder einengemeinsamen Artefaktteil), der Bestandteil aller Produkte der Produktlinie ist.
schließt aus
VP
Fahrzeug-aufbau
LimousineV
CabrioletV Sonnen-
dach
V Nav.-system
V
VP
Sonder-ausstattung
[1..1]
Art desDaches
SofttopV
HardtopV
[1..1]
erfordert
schließt aus
Variationspunkt(optional)
Variationspunkt(obligatorisch)
Variante
OptionaleVariabilitäts-abhängigkeit
AlternativeVariabilitäts-abhängigkeit
Bedinungs-abhängigkeit
VP
Abbildung 1: Beispiel für ein OVM
Abbildung 1 zeigt ein einfaches orthogonales Variabilitätsmodell für PKWs als Beispiel.Es spezifiziert, dass ein Kunde den Fahrzeugaufbau und die Sonderausstattungentscheiden muss (beides obligatorische Variationspunkte). Der Kunde kann entwederLimousine oder Cabriolet wählen (alternative Abhängigkeit1). Wenn der Kunde einCabriolet wählt, muss er die Art des Daches entscheiden (optionaler Variationspunkt,verbunden mit der Variante Cabriolet durch eine Erfordert- Bedingungsabhängigkeit).
1 Die Kardinalität in Form von „[1..1]“ gibt an, dass bei dieser Alternative mindestens eine und höchstens eineVariante gewählt werden darf. Andere Kardinalitäten sind ebenfalls möglich, z.B.: beschreibt „[0..2]“, dasskeine oder höchstens zwei Varianten gewählt werden dürfen.
121
Gleichzeitig darf er kein Sonnendach als Sonderausstattung wählen (Ausschluss-Bedingungsabhängigkeit). Wenn der Kunde die Variante Limousine wählt, darf er dieArt des Daches nicht entscheiden (Ausschluss- Bedingungsabhängigkeit).
Abbildung 2 zeigt ein Beispiel für Artefaktabhängigkeiten. Zum Beispiel ist die VarianteSonnendach über eine Artefaktabhängigkeit mit der Anforderung R-2. Damit ist dieseAnforderung nur dann für ein Produkt zu erfüllen, wenn die Variante Sonnendachgewählt ist. Die Anforderung R-3 steht mit keiner Variante in Beziehung, damit mussdiese Anforderung für alle Produkte der Produktlinie erfüllt werden (und damit hat jedesFahrzeug eine Klimaanlage als Sonderausstattung).
R-2: Das Fahrzeug verfügt überein Sonnendach …
Sonnen-dach
V Nav.-system
V
VP
Sonder-ausstattung
Artefakt-abhängigkeit
R-3: Das Fahrzeug verfügt übereine Klimaanlage …
R-1: Das Fahrzeug verfügt überein Navigationssystem …
Abbildung 2: Beispiel für Artefaktabhängigkeiten
4 Vorteile eines eigenständigen Variabilitätsmodells
Ein eigenständiges Variabilitätsmodell bietet unter anderem die folgenden Vorteile fürdie Produktlinienentwicklung (vgl. [PBL05]):
• Produktlinienvariabilität wird explizit dokumentiert: Durch ein eigenständigesModell wir die Variabilität der Produktlinie explizit dokumentiert und alseigenständiges Artefakt verfügbar gemacht. Eine Verwechslung mitSoftwarevariabilität wird damit ausgeschlossen.
• Dokumentation an einer zentralen Stelle: Durch die Dokumentation derProduktlinienvariabilität in einem eigenständigen Modell und durch dieBeziehungen des Variabilitätsmodells zu den Entwicklungsartefakten wird erreicht,dass die Variabilität der Produktlinie in einem einzigen Modell zentral dokumentiertwird. Hierdurch wird ein unmittelbarer Überblick über die Variabilität derProduktlinie ermöglicht.
122
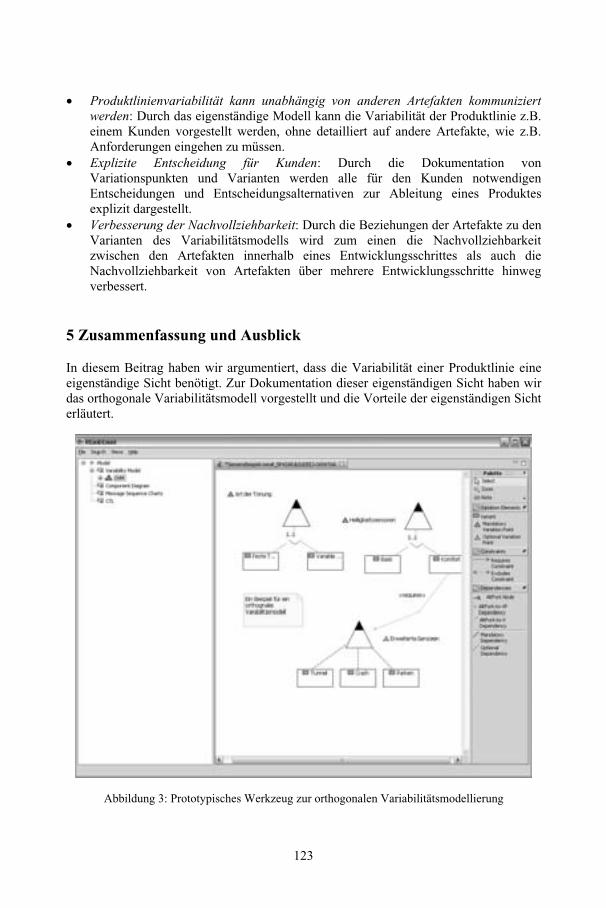
• Produktlinienvariabilität kann unabhängig von anderen Artefakten kommuniziertwerden: Durch das eigenständige Modell kann die Variabilität der Produktlinie z.B.einem Kunden vorgestellt werden, ohne detailliert auf andere Artefakte, wie z.B.Anforderungen eingehen zu müssen.
• Explizite Entscheidung für Kunden: Durch die Dokumentation vonVariationspunkten und Varianten werden alle für den Kunden notwendigenEntscheidungen und Entscheidungsalternativen zur Ableitung eines Produktesexplizit dargestellt.
• Verbesserung der Nachvollziehbarkeit: Durch die Beziehungen der Artefakte zu denVarianten des Variabilitätsmodells wird zum einen die Nachvollziehbarkeitzwischen den Artefakten innerhalb eines Entwicklungsschrittes als auch dieNachvollziehbarkeit von Artefakten über mehrere Entwicklungsschritte hinwegverbessert.
5 Zusammenfassung und Ausblick
In diesem Beitrag haben wir argumentiert, dass die Variabilität einer Produktlinie eineeigenständige Sicht benötigt. Zur Dokumentation dieser eigenständigen Sicht haben wirdas orthogonale Variabilitätsmodell vorgestellt und die Vorteile der eigenständigen Sichterläutert.
Abbildung 3: Prototypisches Werkzeug zur orthogonalen Variabilitätsmodellierung
123
Aktuell entwickeln wir eine prototypische Werkzeugumgebung, die sowohl das ortho-gonale Variabilitätsmodell unterstützt, als auch die Modellierung von Produktlinien-artefakten, insbesondere Anforderungen (z.B. Zielmodelle, Use Cases undDatenmodelle) oder Architekturbestandteile (z.B. Komponentenmodellen, Automaten-modellen oder Message Sequence Charts) und Testartefakte. Ein Screenshot desPrototyps ist in Abbildung 3 dargestellt.
Des Weiteren bearbeiten wir z.B. die frühe Qualitätssicherung der Produktlinienvaria-bilität in der Domänenentwicklung und untersuchen u.a. Ansätze zur Konsistenzprüfungvon Domänenanforderungen (vgl. hierzu z.B. [LP08]).
Literaturverzeichnis
[LP08] Lauenroth, K.; Pohl, K.: Dynamic Consistency Checking of DomainRequirements in Product Line Engineering. In Proceedings of the 16thInternational Requirements Engineering Conference, 2008.
[MHPSS07] Metzger, A.; Heymans, P.; Pohl, K.; Schobbens, P.-Y.; Saval, G.:Disambiguating the Documentation of Variability in Software ProductLines. In Proceedings of the 15th International Requirements EngineeringConference, 2007, S. 243-253.
[PBL05] Pohl, K.; Böckle, G.; van der Linden, F.: Software Product LineEngineering – Foundations, Principles, and Techniques. Springer,Heidelberg, 2005.
124
Ein Klassifikationsansatz zur Variabilitatsmodellierung inE/E-Entwicklungsprozessen
Cem Mengi und Ibrahim ArmacLehrstuhl fur Informatik 3 - SoftwaretechnikRWTH Aachen, Ahornstr. 55, 52074 Aachen
{mengi | armac}@i3.informatik.rwth-aachen.de
Abstract: Das Erfassen und Verwalten von Varianten in E/E-Entwicklungsprozessenist fur Automobilhersteller mit einem großen Aufwand verbunden. Hinzu kommt, dasssie derzeit ihre Prozesse auf den AUTOSAR Standard anpassen. Die Auswirkungen inBezug auf Variabilitat sind dabei sehr vielfaltig und konnen sehr komplex werden,wenn der Prozess nicht geeignet organisiert wird. In diesem Artikel wird daher einKlassifikationsansatz vorgestellt, der die Auswirkungen von AUTOSAR im Hinblickauf Variabilitat berucksichtigt. Dabei betrachten wir drei Ebenen: die Feature-Ebene,die Funktions-Ebene und die Architektur-Ebene. Durch die Klassifikation kann derProzess besser strukturiert und analysiert werden, so dass Varianten in den unterschied-lichen Ebenen genauer beleuchtet werden.
1 Einleitung
Die Automobilindustrie bietet derzeit ihren Kunden beim Kauf eines Fahrzeugs individu-elle Ausstattungsmoglichkeiten, wie beispielsweise Parkassistenten, Regensensoren undKomfort-Schließsysteme. Die Vielfalt an softwarebasierten Sonderausstattungen und ihreKombinationen ermoglichen eine große Anzahl an Fahrzeugvarianten zu konfigurieren.
Fur Fahrzeughersteller bedeutet dies, dass im Verlauf des E/E-Entwicklungsprozesses Va-rianten bzw. Variationspunkte, die unterschiedliche Varianten hervorrufen, in den Entwick-lungsartefakten geeignet und effizient erfasst werden mussen.
Die Existenz von Varianten erstreckt sich im gesamten E/E-Entwicklungsprozess. Varian-ten konnen in der Anforderungsspezifikation, in der Systemspezifikation, im Architektur-entwurf, im Code, aber auch in der Test- und Integrationsphase vorhanden sein. Daruberhinaus entstehen Varianten auch im Laufe der Produktion und in der Betriebs- und War-tungsphase, so dass im gesamten Produktlebenszyklus, der bei einem Fahrzeug ca. 20-25Jahre andauert, sehr viele und unterschiedliche Auspragungen von Varianten entstehenkonnen.
Offensichtlich ist das Erfassen und Verwalten von Variationspunkten mit einem erhebli-chen Aufwand verbunden. Eine einheitliche und nahtlose Methodik inklusive ihrer Werk-zeugunterstutzung, die den gesamten Produktlebenszyklus unterstutzt, ist derzeit nicht imEinsatz.
Hinzu kommt, dass die Automobilindustrie derzeit ihre Prozesse auf den AUTOSAR
125
Standard abstimmt [aut], um der enorm steigenden Komplexitat entgegen zu wirken[PBKS07, Bro06]. Eines der wichtigsten Entwicklungen im Standard ist, dass durchEinfuhrung einer Abstraktionsschicht die Software von der Hardware entkoppelt werdenkann. Die Auswirkungen auf den Entwicklungsprozess in Bezug auf Variabilitat sind sehrvielfaltig und konnen sehr komplex werden, wenn der Prozess nicht geeignet organisiertwird.
In diesem Artikel wird daher unter Berucksichtigung des AUTOSAR Standards und des-sen Einfluss auf den E/E-Entwicklungsprozess im Hinblick auf Variabilitat ein Klassi-fikationsansatz vorgestellt, so dass Varianten in den unterschiedlichen Ebenen genauerbeleuchtet und analysiert werden konnen. Dabei betrachten wir drei Ebenen: die Feature-Ebene, die Funktions-Ebene und die Architektur-Ebene. Insbesondere werden dabei dieAbhangigkeiten der Variationspunkte und der Konfigurationen zu spezifischen Variantenin den drei Ebenen genauer beschrieben. Weitere Phasen im Produktlebenszyklus, wiebeispielsweise Test und Integration, werden nicht betrachtet.
Der Artikel ist wie folgt strukturiert. In Abschnitt 2 wird zunachst die Auswirkung des AU-TOSAR Standards auf den E/E-Entwicklungsprozess im Hinblick auf die Handhabung derVariabilitat untersucht. Auf Basis dieser Untersuchung wird in Abschnitt 3 ein Klassifika-tionsansatz vorgeschlagen, der die wesentlichen Prozessschritte bis zur Architektur-Ebeneberucksichtigt. Schließlich wird in Abschnitt 4 der Artikel zusammengefasst.
2 Modellierung der Variabilitat in E/E-Entwicklungsprozessen
Es gibt viele Techniken zur Modellierung der Variabilitat. Sinnema und Deelstra habendiese in ihrem Artikel klassifiziert [SD07]. Im Wesentlichen unterscheiden sie drei Tech-niken: die Modellierung der Variabilitat mit Features, mit Use Cases und mit anderenTechniken.
Features beschreiben dabei Merkmale des Systems. Ein Beispiel ware die Zentralverrie-gelung im Auto. Durch eine Baumstruktur, die zusatzliche Sprachelemente zur Beschrei-bung der Variabilitat besitzt, konnen Features organisiert werden. Mit Use Cases konnenfunktionale Anforderungen des Systems und deren Beziehungen zu Aktoren in Anwen-dungsfallen beschrieben werden [uml]. Durch geeignete Erweiterungen der Modellie-rungselemente kann hier auch Variabilitat ausgedruckt werden [vdML]. Auf zusatzlicheTechniken wird hier nicht weiter eingegangen, sondern auf [SD07] verwiesen. In diesemArtikel beschranken wir uns auf die Modellierung der Variabilitat mit Features, da sieinsbesondere im Automobilbereich bereits Anwendung findet [TH02].
Bei der Betrachtung der Variabilitatsmodellierung im E/E-Entwicklungsprozess unter-scheiden wir zwei Ansatze: den klassischen hardware-getriebenen Ansatz und denfunktions-getriebenen Ansatz. In Abbildung 1 sind beide Ansatze beispielhaft dargestellt.
Untersuchen wir den hardware-getriebenen Ansatz (siehe Abbildung 1(a)), so werden dieMerkmale des Systems und dessen Varianten mit Feature-Modellen erfasst [KCH+90].Sie bieten die Moglichkeit vorgeschriebene, optionale, partielle und exklusive Features zumodellieren.
126
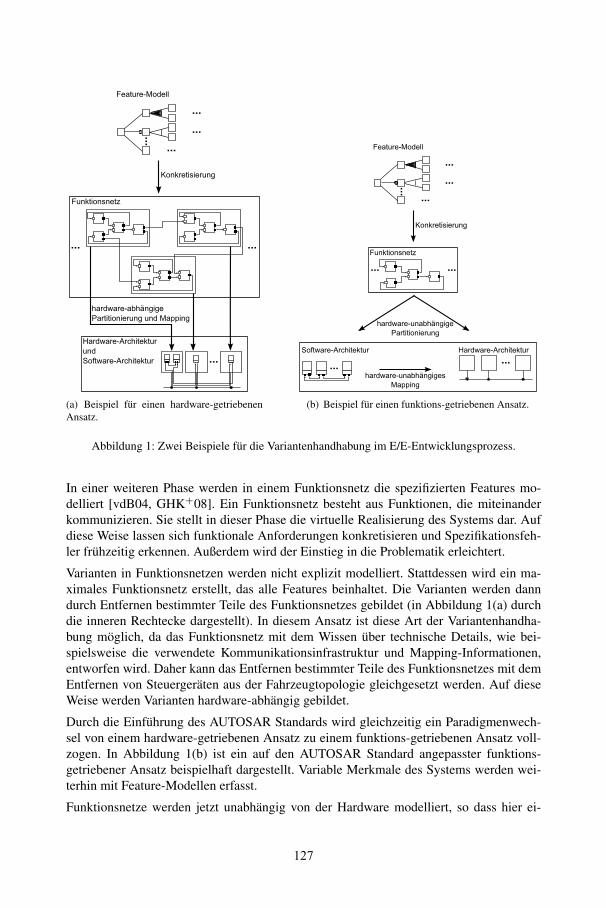
(a) Beispiel fur einen hardware-getriebenenAnsatz.
(b) Beispiel fur einen funktions-getriebenen Ansatz.
Abbildung 1: Zwei Beispiele fur die Variantenhandhabung im E/E-Entwicklungsprozess.
In einer weiteren Phase werden in einem Funktionsnetz die spezifizierten Features mo-delliert [vdB04, GHK+08]. Ein Funktionsnetz besteht aus Funktionen, die miteinanderkommunizieren. Sie stellt in dieser Phase die virtuelle Realisierung des Systems dar. Aufdiese Weise lassen sich funktionale Anforderungen konkretisieren und Spezifikationsfeh-ler fruhzeitig erkennen. Außerdem wird der Einstieg in die Problematik erleichtert.
Varianten in Funktionsnetzen werden nicht explizit modelliert. Stattdessen wird ein ma-ximales Funktionsnetz erstellt, das alle Features beinhaltet. Die Varianten werden danndurch Entfernen bestimmter Teile des Funktionsnetzes gebildet (in Abbildung 1(a) durchdie inneren Rechtecke dargestellt). In diesem Ansatz ist diese Art der Variantenhandha-bung moglich, da das Funktionsnetz mit dem Wissen uber technische Details, wie bei-spielsweise die verwendete Kommunikationsinfrastruktur und Mapping-Informationen,entworfen wird. Daher kann das Entfernen bestimmter Teile des Funktionsnetzes mit demEntfernen von Steuergeraten aus der Fahrzeugtopologie gleichgesetzt werden. Auf dieseWeise werden Varianten hardware-abhangig gebildet.
Durch die Einfuhrung des AUTOSAR Standards wird gleichzeitig ein Paradigmenwech-sel von einem hardware-getriebenen Ansatz zu einem funktions-getriebenen Ansatz voll-zogen. In Abbildung 1(b) ist ein auf den AUTOSAR Standard angepasster funktions-getriebener Ansatz beispielhaft dargestellt. Variable Merkmale des Systems werden wei-terhin mit Feature-Modellen erfasst.
Funktionsnetze werden jetzt unabhangig von der Hardware modelliert, so dass hier ei-
127
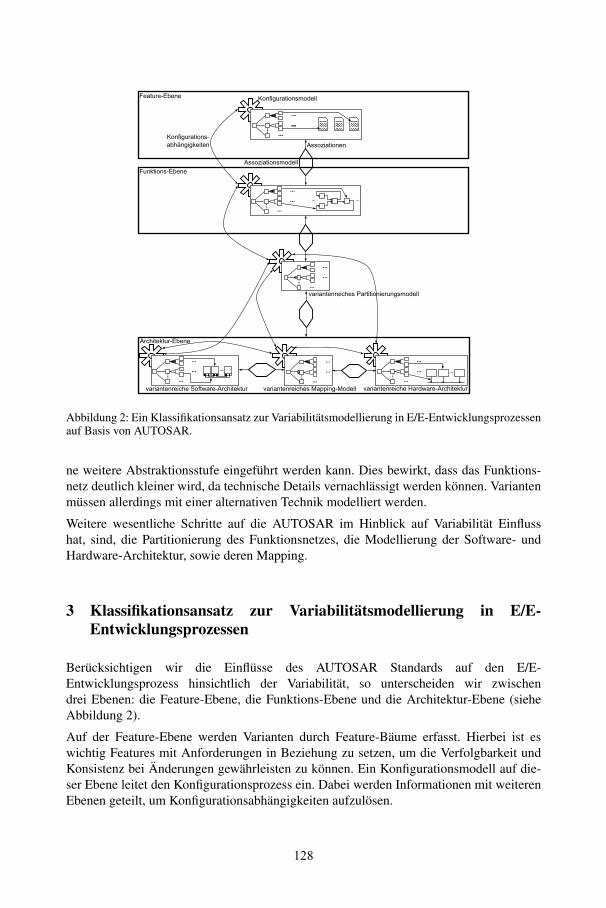
Abbildung 2: Ein Klassifikationsansatz zur Variabilitatsmodellierung in E/E-Entwicklungsprozessenauf Basis von AUTOSAR.
ne weitere Abstraktionsstufe eingefuhrt werden kann. Dies bewirkt, dass das Funktions-netz deutlich kleiner wird, da technische Details vernachlassigt werden konnen. Variantenmussen allerdings mit einer alternativen Technik modelliert werden.
Weitere wesentliche Schritte auf die AUTOSAR im Hinblick auf Variabilitat Einflusshat, sind, die Partitionierung des Funktionsnetzes, die Modellierung der Software- undHardware-Architektur, sowie deren Mapping.
3 Klassifikationsansatz zur Variabilitatsmodellierung in E/E-Entwicklungsprozessen
Berucksichtigen wir die Einflusse des AUTOSAR Standards auf den E/E-Entwicklungsprozess hinsichtlich der Variabilitat, so unterscheiden wir zwischendrei Ebenen: die Feature-Ebene, die Funktions-Ebene und die Architektur-Ebene (sieheAbbildung 2).
Auf der Feature-Ebene werden Varianten durch Feature-Baume erfasst. Hierbei ist eswichtig Features mit Anforderungen in Beziehung zu setzen, um die Verfolgbarkeit undKonsistenz bei Anderungen gewahrleisten zu konnen. Ein Konfigurationsmodell auf die-ser Ebene leitet den Konfigurationsprozess ein. Dabei werden Informationen mit weiterenEbenen geteilt, um Konfigurationsabhangigkeiten aufzulosen.
128
Auf der Funktions-Ebene werden die Funktionsnetze ohne technische Details entworfen.Dadurch kann abstrakter modelliert werden, was zu einer erheblichen Reduzierung hin-sichtlich der Große und der Anzahl an Varianten, die aufgrund technischer Details exis-tierten, fuhrt. Die fur diese Ebene typischen Varianten konnen beispielsweise separat durchFeature-Baume modelliert werden (angedeutet durch den Feature-Baum in Abbildung 2).Abhangigkeiten zwischen dem Variantenmodell und den Funktionsnetzen, sowie ein Kon-figurationsmodell sind wesentliche Bestandteile.
Die Entscheidung ob eine Funktion vollstandig als Software oder Hardware, bzw. als Soft-ware und Hardware realisiert wird erfolgt bei der Partitionierung. Insbesondere kann dieseVariabilitat einen enormen Kosteneinfluss haben. Eine gut gewahlte Partitionierungsvari-ante kann die Entwicklungskosten erheblich senken.
Die Applikations-Software kann nun nach dem AUTOSAR Ansatz unabhangig vonder Hardware entworfen werden. Variabilitat in der Software-Architektur als auch inder Hardware-Architektur werden weitestgehend unabhangig behandelt. Beispielsweisekonnen die Varianten Standard-Zentralverriegelung und Komfort-Zentralverriegelung inder Software-Architektur durch Feature-Baume erfasst werden. In der Konfigurationspha-se werden die entsprechenden Varianten so konfiguriert, dass die gewunschte Architekturmodelliert wird. Da das Mapping nicht festgelegt ist, existieren vielfaltige Moglichkeitendie Software auf die Hardware abzubilden. Wahrend im hardware-getriebenen Ansatzdie Standard- und Komfort-Zentralverriegelung durch zwei Steuergerate realisiert wer-den musste, um die Komplexitat so gering wie moglich zu halten, ist es jetzt moglich dieSoftware auf einem Steuergerat laufen zu lassen. Genau wie fur die Partitionierung, kannauch die Variabilitat beim Mapping einen enormen Kosteneinfluss haben.
Die separate Variantenerfassung wird zwar anfangs mit mehr Aufwand verbunden sein,doch auf langer Sicht werden die Vorteile dieses Ansatzes insbesondere in Bezug auf AU-TOSAR deutlich werden. Eine Klassifikation auf drei Ebenen scheint hier geeignet zu sein,da sie die wesentlichen Prozessschritte berucksichtigen.
4 Zusammenfassung
In diesem Artikel wurde ein Klassifikationsansatz vorgestellt, der unter Berucksichtigungdes AUTOSAR Standards Variabilitat im E/E-Entwicklungsprozess bis zur Architektur-Ebene beschreibt. Eine Einteilung in die Feature-, Funktions- und Architektur-Ebenescheint dabei geeignet zu sein, da sie die wesentlichen Prozessschritte beachtet. WelcheModellierungstechnik zur Erfassung der Variabilitat in den jeweiligen Ebenen passend ist,wurde dabei nicht untersucht. Es scheint allerdings, dass ein Ansatz basierend auf Feature-Modellen anwendbar ist. Die separate Modellierung stellt eine wichtige Voraussetzung dar,um die Komplexitat im eigentlichen Modell so gering wie moglich zu halten. Der Ansatzermoglicht eine genauere Analyse in den Ebenen, so dass Losungen entwickelt werdenkonnen, die auf die Problemdomane zugeschnitten sind. Beispielsweise sind neue Techni-ken zur Variabilitatsmodellierung und ihre Werkzeugunterstutzung in der Funktions-Ebenewichtige Bestandteile, um die Anwendung der Funktionsnetze zu fordern.
129
Literatur
[aut] AUTOSAR Website. http://www.autosar.org.
[Bro06] Manfred Broy. Challenges in automotive software engineering. In ICSE ’06: Procee-dings of the 28th international conference on Software engineering, Seiten 33–42, NewYork, NY, USA, 2006. ACM.
[GHK+08] Hans Gronniger, Jochen Hartmann, Holger Krahn, Stefan Kriebel, Lutz Rothhardt undBernhard Rumpe. Modelling Automotive Function Nets with Views for Features, Va-riants, and Modes. In 4th European Congress ERTS - Embedded Real Time Software,2008.
[KCH+90] K. C. Kang, S. G. Cohen, J. A. Hess, W. E. Novak und A. S. Peterson. Feature-OrientedDomain Analysis (FODA) Feasibility Study. Bericht, Carnegie-Mellon University Soft-ware Engineering Institute, November 1990.
[PBKS07] Alexander Pretschner, Manfred Broy, Ingolf H. Kruger und Thomas Stauner. Softwa-re Engineering for Automotive Systems: A Roadmap. In FOSE ’07: 2007 Future ofSoftware Engineering, Seiten 55–71, Washington, DC, USA, 2007. IEEE ComputerSociety.
[SD07] Marco Sinnema und Sybren Deelstra. Classifying variability modeling techniques. In-formation and Software Technology, 49(7):717–739, July 2007.
[TH02] Steffen Thiel und Andreas Hein. Modeling and Using Product Line Variability in Au-tomotive Systems. IEEE Softw., 19(4):66–72, 2002.
[uml] Unified Modeling Language Website. www.uml.org.
[vdB04] Michael von der Beeck. Function Net Modeling with UML-RT: Experiences from anAutomotive Project at BMW Group. In Nuno Jardim Nunes, Bran Selic, Alberto Rod-rigues da Silva und Jose Ambrosio Toval Alvarez, Hrsg., UML Satellite Activities, Jgg.3297 of Lecture Notes in Computer Science, Seiten 94–104. Springer, 2004.
[vdML] T. von der Maßen und H. Lichter. Modeling Variability by UML Use Case Diagrams.In IEEE Joint International Requirements Engineering Conference (RE02), Essen, Ger-many, Proc. of International Workshop on Requirements Engineering for Product Lines.
130
Architekturgetriebenes Pairwise-Testing fur SoftwareProduktlinien
Sebastian Oster, Andy Schurr
{oster, schuerr}@es.tu-darmstadt.de
Abstract: Software-Produktlinien-Entwicklung ermoglicht eine systematische Wie-derverwendung von Software. Aufgrund der Variabilitat innerhalb von Software-Pro-duktlinien (SPL) kann eine sehr hohe Anzahl von verschiedenen Produkten erzeugtwerden. Daher ist es unerlasslich Testverfahren zu entwickeln, die zum einen einemoglichst vollstandige Abdeckung von allen zu generierenden Produkten sicherstel-len und zum anderen weniger aufwendig sind als alle Produkte individuell zu testen.Dieser Beitrag beschreibt ein Konzept, mit dem Produktlinien-Variabilitat in Bezugauf Systemtests reprasentiert, gehandhabt und vereinfacht werden kann.
1 Einleitung
SPL-Entwicklung ist eine Methode zur Umsetzung systematischer Wiederverwendungvon Software. Dabei entsteht eine Gruppe von Software-Produkten, die sich gemeinsa-me Eigenschaften teilen und damit spezielle Anforderungen erfullen [PBvdL05]. In derPraxis werden SPLs haufig dadurch getestet, dass jedes generierte Produkt individuelluberpruft wird [TTK04]. Dies ist die sicherste und grundlichste Testmethode, jedoch istder Aufwand fur ein solches Testverfahren enorm und in der Regel nicht umsetzbar. ImAutomotive-Bereich kann das Motorsteuergerat als eins von bis zu 70 Steuergeraten in ei-nem PKW allein in mehr als 30.000 Varianten konfiguriert werden. Zum Zeitpunkt derProduktinstanziierung am Bandende ist es zeitlich nicht moglich alle Produkte indivi-duell zu testen. Ebenso kann nur ein Bruchteil der moglichen Kombinationen wahrendder Entwicklung uberpruft werden. Erstrebenswert ist deshalb die Bestimmung einer re-prasentativen Menge von Produkten der SPL. Das erfolgreiche Testen dieser Menge sollmit einer hohen Wahrscheinlichkeit garantieren, dass der Test aller weiteren Produkte derSPL ebenfalls erfolgreich ist. Diese reprasentative Menge soll wahrend der Entwicklungs-zeit getestet werden. Der hier vorgestellte Ansatz wird im Rahmen des BMBF-ProjektesfeasiPLe entwickelt [fC06].
2 Verwandte Arbeiten
Kombinatorisches Testen: Kombinatorisches Testen wird bislang meist dazu verwendet,beim Testen EINER Produktinstanz die Anzahl der zu testenden Wertekombinationen von
131
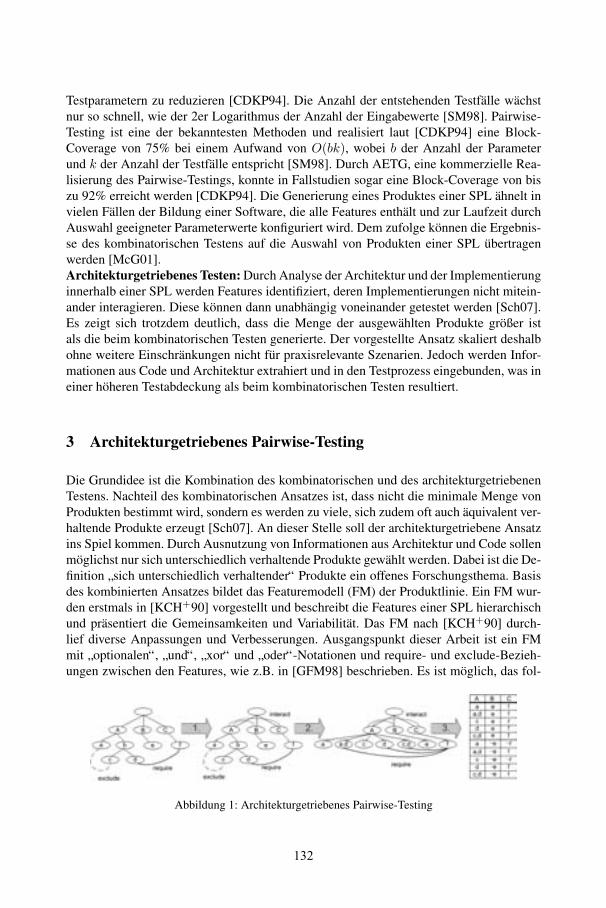
Testparametern zu reduzieren [CDKP94]. Die Anzahl der entstehenden Testfalle wachstnur so schnell, wie der 2er Logarithmus der Anzahl der Eingabewerte [SM98]. Pairwise-Testing ist eine der bekanntesten Methoden und realisiert laut [CDKP94] eine Block-Coverage von 75% bei einem Aufwand von O(bk), wobei b der Anzahl der Parameterund k der Anzahl der Testfalle entspricht [SM98]. Durch AETG, eine kommerzielle Rea-lisierung des Pairwise-Testings, konnte in Fallstudien sogar eine Block-Coverage von biszu 92% erreicht werden [CDKP94]. Die Generierung eines Produktes einer SPL ahnelt invielen Fallen der Bildung einer Software, die alle Features enthalt und zur Laufzeit durchAuswahl geeigneter Parameterwerte konfiguriert wird. Dem zufolge konnen die Ergebnis-se des kombinatorischen Testens auf die Auswahl von Produkten einer SPL ubertragenwerden [McG01].Architekturgetriebenes Testen: Durch Analyse der Architektur und der Implementierunginnerhalb einer SPL werden Features identifiziert, deren Implementierungen nicht mitein-ander interagieren. Diese konnen dann unabhangig voneinander getestet werden [Sch07].Es zeigt sich trotzdem deutlich, dass die Menge der ausgewahlten Produkte großer istals die beim kombinatorischen Testen generierte. Der vorgestellte Ansatz skaliert deshalbohne weitere Einschrankungen nicht fur praxisrelevante Szenarien. Jedoch werden Infor-mationen aus Code und Architektur extrahiert und in den Testprozess eingebunden, was ineiner hoheren Testabdeckung als beim kombinatorischen Testen resultiert.
3 Architekturgetriebenes Pairwise-Testing
Die Grundidee ist die Kombination des kombinatorischen und des architekturgetriebenenTestens. Nachteil des kombinatorischen Ansatzes ist, dass nicht die minimale Menge vonProdukten bestimmt wird, sondern es werden zu viele, sich zudem oft auch aquivalent ver-haltende Produkte erzeugt [Sch07]. An dieser Stelle soll der architekturgetriebene Ansatzins Spiel kommen. Durch Ausnutzung von Informationen aus Architektur und Code sollenmoglichst nur sich unterschiedlich verhaltende Produkte gewahlt werden. Dabei ist die De-finition ”sich unterschiedlich verhaltender“ Produkte ein offenes Forschungsthema. Basisdes kombinierten Ansatzes bildet das Featuremodell (FM) der Produktlinie. Ein FM wur-den erstmals in [KCH+90] vorgestellt und beschreibt die Features einer SPL hierarchischund prasentiert die Gemeinsamkeiten und Variabilitat. Das FM nach [KCH+90] durch-lief diverse Anpassungen und Verbesserungen. Ausgangspunkt dieser Arbeit ist ein FMmit ”optionalen“, ”und“, ”xor“ und ”oder“-Notationen und require- und exclude-Bezieh-ungen zwischen den Features, wie z.B. in [GFM98] beschrieben. Es ist moglich, das fol-
Abbildung 1: Architekturgetriebenes Pairwise-Testing
132
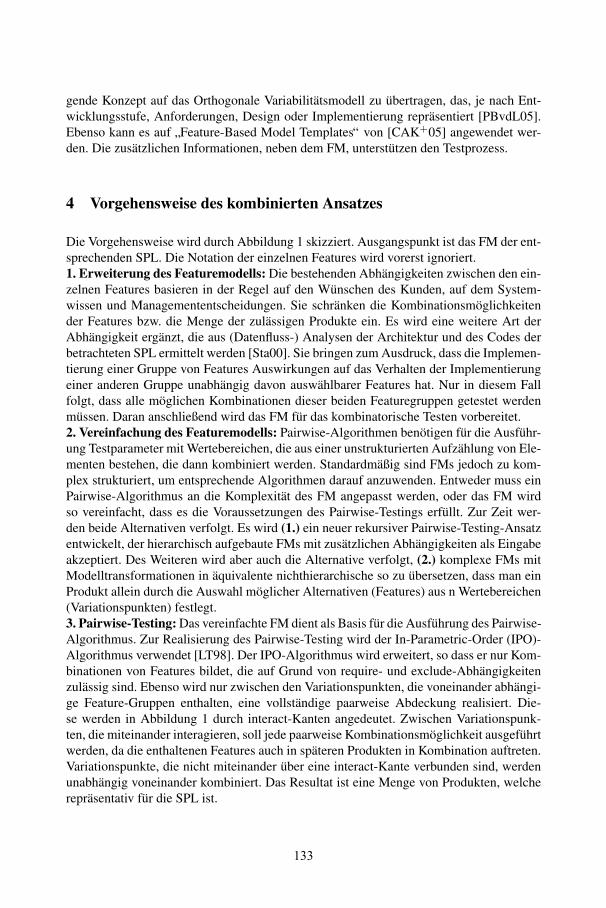
gende Konzept auf das Orthogonale Variabilitatsmodell zu ubertragen, das, je nach Ent-wicklungsstufe, Anforderungen, Design oder Implementierung reprasentiert [PBvdL05].Ebenso kann es auf ”Feature-Based Model Templates“ von [CAK+05] angewendet wer-den. Die zusatzlichen Informationen, neben dem FM, unterstutzen den Testprozess.
4 Vorgehensweise des kombinierten Ansatzes
Die Vorgehensweise wird durch Abbildung 1 skizziert. Ausgangspunkt ist das FM der ent-sprechenden SPL. Die Notation der einzelnen Features wird vorerst ignoriert.1. Erweiterung des Featuremodells: Die bestehenden Abhangigkeiten zwischen den ein-zelnen Features basieren in der Regel auf den Wunschen des Kunden, auf dem System-wissen und Managemententscheidungen. Sie schranken die Kombinationsmoglichkeitender Features bzw. die Menge der zulassigen Produkte ein. Es wird eine weitere Art derAbhangigkeit erganzt, die aus (Datenfluss-) Analysen der Architektur und des Codes derbetrachteten SPL ermittelt werden [Sta00]. Sie bringen zum Ausdruck, dass die Implemen-tierung einer Gruppe von Features Auswirkungen auf das Verhalten der Implementierungeiner anderen Gruppe unabhangig davon auswahlbarer Features hat. Nur in diesem Fallfolgt, dass alle moglichen Kombinationen dieser beiden Featuregruppen getestet werdenmussen. Daran anschließend wird das FM fur das kombinatorische Testen vorbereitet.2. Vereinfachung des Featuremodells: Pairwise-Algorithmen benotigen fur die Ausfuhr-ung Testparameter mit Wertebereichen, die aus einer unstrukturierten Aufzahlung von Ele-menten bestehen, die dann kombiniert werden. Standardmaßig sind FMs jedoch zu kom-plex strukturiert, um entsprechende Algorithmen darauf anzuwenden. Entweder muss einPairwise-Algorithmus an die Komplexitat des FM angepasst werden, oder das FM wirdso vereinfacht, dass es die Voraussetzungen des Pairwise-Testings erfullt. Zur Zeit wer-den beide Alternativen verfolgt. Es wird (1.) ein neuer rekursiver Pairwise-Testing-Ansatzentwickelt, der hierarchisch aufgebaute FMs mit zusatzlichen Abhangigkeiten als Eingabeakzeptiert. Des Weiteren wird aber auch die Alternative verfolgt, (2.) komplexe FMs mitModelltransformationen in aquivalente nichthierarchische so zu ubersetzen, dass man einProdukt allein durch die Auswahl moglicher Alternativen (Features) aus n Wertebereichen(Variationspunkten) festlegt.3. Pairwise-Testing: Das vereinfachte FM dient als Basis fur die Ausfuhrung des Pairwise-Algorithmus. Zur Realisierung des Pairwise-Testing wird der In-Parametric-Order (IPO)-Algorithmus verwendet [LT98]. Der IPO-Algorithmus wird erweitert, so dass er nur Kom-binationen von Features bildet, die auf Grund von require- und exclude-Abhangigkeitenzulassig sind. Ebenso wird nur zwischen den Variationspunkten, die voneinander abhangi-ge Feature-Gruppen enthalten, eine vollstandige paarweise Abdeckung realisiert. Die-se werden in Abbildung 1 durch interact-Kanten angedeutet. Zwischen Variationspunk-ten, die miteinander interagieren, soll jede paarweise Kombinationsmoglichkeit ausgefuhrtwerden, da die enthaltenen Features auch in spateren Produkten in Kombination auftreten.Variationspunkte, die nicht miteinander uber eine interact-Kante verbunden sind, werdenunabhangig voneinander kombiniert. Das Resultat ist eine Menge von Produkten, welchereprasentativ fur die SPL ist.
133
5 Zusammenfassung und Ausblick
Das vorgestellte Konzept kombiniert die Vorteile des kombinatorischen und des archi-tekturgetriebenen Testens. Erwartet wird eine kleinere Produktmenge mit einer hoherenTestabdeckung, als beide Ansatze einzeln fur sich erzielen. Das FM wurde fur die Ver-wendung des kombinatorischen Testens angepasst und der IPO-Algorithmus erweitert,so dass er Abhangigkeiten beachtet. In zukunftigen Veroffentlichungen wird in Fallstu-dien untersucht, ob der hier skizzierte Ansatz tatsachlich auch in der Praxis die erhofftenVorzuge besitzt. Evaluiert wird aktuell innerhalb des feasiPLe Projekts [fC06] und miteiner Lego-Auto-SPL in der Lehre. Daruber hinaus ist die Evaluierung an einer realenAutomotive-SW-SPL mit einem Industrie-Partner aus dem Rhein-Main-Gebiet geplant.
Literatur
[CAK+05] Krzysztof Czarnecki, Michal Antkiewicz, Chang Hwan Peter Kim, Sean Lau undKrzysztof Pietroszek. Model-driven software product lines. In OOPSLA ’05: Compa-nion to the 20th annual ACM SIGPLAN conference on Object-oriented programming,systems, languages, and applications, Seiten 126–127, New York USA, 2005. ACM.
[CDKP94] D. M. Cohen, S. R. Dalal, A. Kajla und G.C. Patton. The Automatic Efficient TestsGenerator. Fifth Int’l Symposium on Software Reliability Engineering, IEEE:303–309,1994.
[fC06] feasiPLe Consortium. www.feasiple.de. 2006.
[GFM98] Martin L. Griss, John Favaro und Case Methodologist. Integrating feature modelingwith the RSEB. In In Proceedings of the Fifth Int’l Conference on Software Reuse,Seiten 76–85, 1998.
[KCH+90] K. Kang, S. Cohen, J. Hess, W. Nowak und S. Peterson. Feature-Oriented DomainAnalysis (FODA) Feasibility Study. 1990.
[LT98] Yu Lei und K. C. Tai. In-Parameter-Order: A Test Generation Strategy for PairwiseTesting. High-Assurance Systems Engineering, IEEE Int’l Symposium, 1998.
[McG01] J. D. McGregor. Testing a Software Product Line. Technical Report CMU/SEI-2001-TR-022, Software Engineering Institute Carnegie Mellon University, 2001.
[PBvdL05] Klaus Pohl, Gunter Bockle und Frank J. van der Linden. Software Product Line Engi-neering : Foundations, Principles and Techniques. Springer, September 2005.
[Sch07] Kathrin Scheidemann. Verifying Families of System Configurations. Doctoral Thesis,TU Munich, 2007.
[SM98] Brett Stevens und Eric Mendelsohn. Efficient Software Testing Protocols. In CAS-CON ’98: Proceedings of the 1998 conference of the Centre for Advanced Studies onCollaborative research, Seite 22. IBM Press, 1998.
[Sta00] Judith A. Stafford. A Formal, Language-Independent, and Compositional Approach toInterprocedural Control Dependence Analysis, 2000.
[TTK04] A. Tevanlinna, J. Taina und R. Kauppinen. Product Family Testing: a Survey. ACMSIGSOFT Software Engineering Notes., 29, 2004.
134
Konsistente Evolution von lebenszyklusübergreifendenVariabilitätsmodellen
Klaus Schmid
Institute of Computer ScienceUniversity of Hildesheim
Marienburger Platz 2D-31141 Hildesheim, [email protected]
Abstract: Variabilitätsmanagement gilt als konzeptionelle Grundlage einersystematischen Entwicklung von Produktlinien. Dabei wird oft die Notwendigkeiteines lebenszyklusübergreifenden Ansatzes betont. Unter dem Aspekt derEvolution ergeben sich jedoch besondere Herausforderungen dabei. In diesemBeitrag geben wir eine kurze Übersicht einiger wesentlicher Herausforderungen.
1 Motivation
Produktlinienentwicklung hat sich in den letzten Jahren als ein effektiver Ansatz zurEntwicklung von Mengen ähnlicher Systeme in der Industrie etabliert. Dabei profitierenvon einer Produktlinienentwicklung sowohl die Kostenseite als auch die Qualität derentwickelten Systeme. Die Details der Durchführung einer Produktlinienentwicklungunterscheiden sich dabei von Unternehmen zu Unternehmen sehr stark [4].
Als eine der konzeptionellen Grundlagen einer Produktlinienentwicklung wird immerwieder das Variabilitätsmanagement genannt. Betrachtet man aber die unterschiedlichenAnsätze [3, 1, 7, 5], die für ein Variabilitätsmanagement vorgeschlagen werden, sounterscheiden sich diese deutlich. Die Unterschiede liegen dabei nicht nur in denzugrundeliegenden Paradigma, sondern auch in der Lebenszyklusüberdeckung. So sindviele Ansätze aus den frühen Phasen (Modellierung / Verständnis der Produktlinie)motiviert [3] oder sind sogar darauf beschränkt [2].
2 Konsistentes Variabililtätsmanagement
Der zentrale Unterschied zwischen einer Einzelsystementwicklung und einer Produkt-linienentwicklung liegt im Übergang von der Perspektive eines einzelnen Systems aufdie Betrachtung einer Menge von Systemen. Die Variabilitätsmodellierung dient dazudie Unterschiede zwischen den Systemen herauszustellen. Der vielleicht bekanntesteAnsatz dazu ist die Featuremodellierung [3]. Eine weitere Gruppe von Ansätzen ist dieEntscheidungsmodellierung [8, 7]. Das Variabilitätsmodell beschreibt die Variation vonSystemartefakten (z. B. Anforderungen, Architekturelemente, Implementierung, usw.).Dies geschieht bei der Featuremodellierung durch Bezugnahme auf Eigenschaften einesSystems, während dies bei der Entscheidungsmodellierung durch die Beschreibung dernotwendigen Entscheidungen beschrieben wird.
135
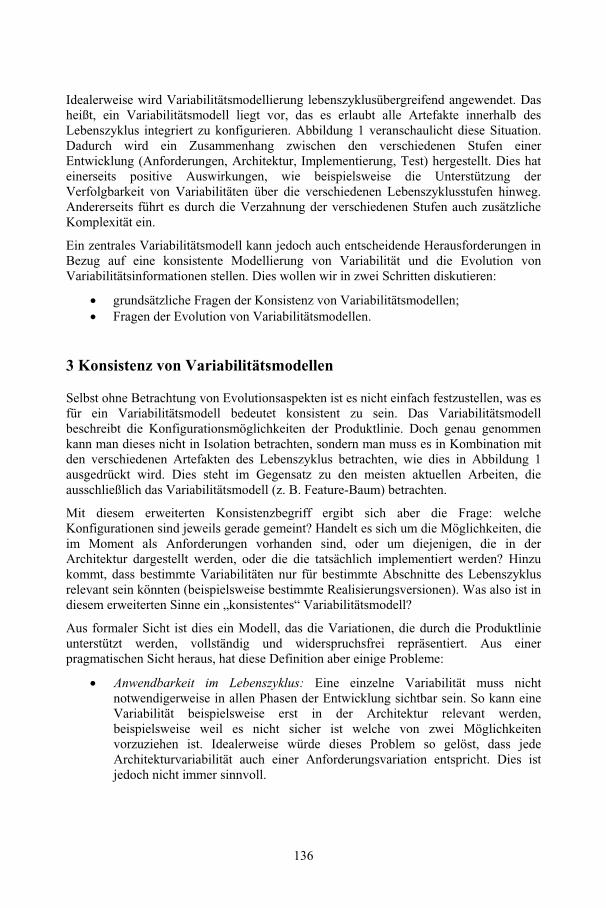
Idealerweise wird Variabilitätsmodellierung lebenszyklusübergreifend angewendet. Dasheißt, ein Variabilitätsmodell liegt vor, das es erlaubt alle Artefakte innerhalb desLebenszyklus integriert zu konfigurieren. Abbildung 1 veranschaulicht diese Situation.Dadurch wird ein Zusammenhang zwischen den verschiedenen Stufen einerEntwicklung (Anforderungen, Architektur, Implementierung, Test) hergestellt. Dies hateinerseits positive Auswirkungen, wie beispielsweise die Unterstützung derVerfolgbarkeit von Variabilitäten über die verschiedenen Lebenszyklusstufen hinweg.Andererseits führt es durch die Verzahnung der verschiedenen Stufen auch zusätzlicheKomplexität ein.
Ein zentrales Variabilitätsmodell kann jedoch auch entscheidende Herausforderungen inBezug auf eine konsistente Modellierung von Variabilität und die Evolution vonVariabilitätsinformationen stellen. Dies wollen wir in zwei Schritten diskutieren:
• grundsätzliche Fragen der Konsistenz von Variabilitätsmodellen;• Fragen der Evolution von Variabilitätsmodellen.
3 Konsistenz von Variabilitätsmodellen
Selbst ohne Betrachtung von Evolutionsaspekten ist es nicht einfach festzustellen, was esfür ein Variabilitätsmodell bedeutet konsistent zu sein. Das Variabilitätsmodellbeschreibt die Konfigurationsmöglichkeiten der Produktlinie. Doch genau genommenkann man dieses nicht in Isolation betrachten, sondern man muss es in Kombination mitden verschiedenen Artefakten des Lebenszyklus betrachten, wie dies in Abbildung 1ausgedrückt wird. Dies steht im Gegensatz zu den meisten aktuellen Arbeiten, dieausschließlich das Variabilitätsmodell (z. B. Feature-Baum) betrachten.
Mit diesem erweiterten Konsistenzbegriff ergibt sich aber die Frage: welcheKonfigurationen sind jeweils gerade gemeint? Handelt es sich um die Möglichkeiten, dieim Moment als Anforderungen vorhanden sind, oder um diejenigen, die in derArchitektur dargestellt werden, oder die die tatsächlich implementiert werden? Hinzukommt, dass bestimmte Variabilitäten nur für bestimmte Abschnitte des Lebenszyklusrelevant sein könnten (beispielsweise bestimmte Realisierungsversionen). Was also ist indiesem erweiterten Sinne ein „konsistentes“ Variabilitätsmodell?
Aus formaler Sicht ist dies ein Modell, das die Variationen, die durch die Produktlinieunterstützt werden, vollständig und widerspruchsfrei repräsentiert. Aus einerpragmatischen Sicht heraus, hat diese Definition aber einige Probleme:
• Anwendbarkeit im Lebenszyklus: Eine einzelne Variabilität muss nichtnotwendigerweise in allen Phasen der Entwicklung sichtbar sein. So kann eineVariabilität beispielsweise erst in der Architektur relevant werden,beispielsweise weil es nicht sicher ist welche von zwei Möglichkeitenvorzuziehen ist. Idealerweise würde dieses Problem so gelöst, dass jedeArchitekturvariabilität auch einer Anforderungsvariation entspricht. Dies istjedoch nicht immer sinnvoll.
136
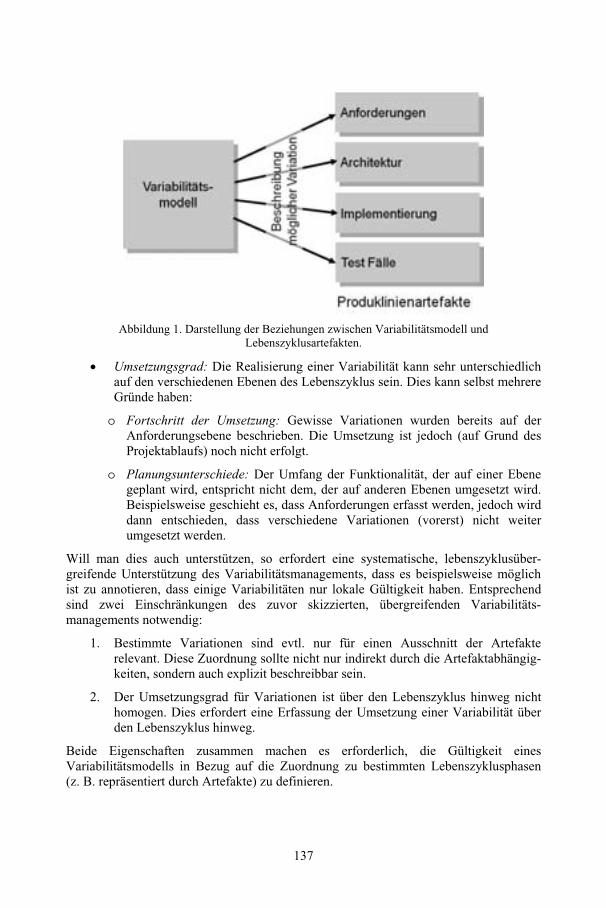
Abbildung 1. Darstellung der Beziehungen zwischen Variabilitätsmodell undLebenszyklusartefakten.
• Umsetzungsgrad: Die Realisierung einer Variabilität kann sehr unterschiedlichauf den verschiedenen Ebenen des Lebenszyklus sein. Dies kann selbst mehrereGründe haben:
o Fortschritt der Umsetzung: Gewisse Variationen wurden bereits auf derAnforderungsebene beschrieben. Die Umsetzung ist jedoch (auf Grund desProjektablaufs) noch nicht erfolgt.
o Planungsunterschiede: Der Umfang der Funktionalität, der auf einer Ebenegeplant wird, entspricht nicht dem, der auf anderen Ebenen umgesetzt wird.Beispielsweise geschieht es, dass Anforderungen erfasst werden, jedoch wirddann entschieden, dass verschiedene Variationen (vorerst) nicht weiterumgesetzt werden.
Will man dies auch unterstützen, so erfordert eine systematische, lebenszyklusüber-greifende Unterstützung des Variabilitätsmanagements, dass es beispielsweise möglichist zu annotieren, dass einige Variabilitäten nur lokale Gültigkeit haben. Entsprechendsind zwei Einschränkungen des zuvor skizzierten, übergreifenden Variabilitäts-managements notwendig:
1. Bestimmte Variationen sind evtl. nur für einen Ausschnitt der Artefakterelevant. Diese Zuordnung sollte nicht nur indirekt durch die Artefaktabhängig-keiten, sondern auch explizit beschreibbar sein.
2. Der Umsetzungsgrad für Variationen ist über den Lebenszyklus hinweg nichthomogen. Dies erfordert eine Erfassung der Umsetzung einer Variabilität überden Lebenszyklus hinweg.
Beide Eigenschaften zusammen machen es erforderlich, die Gültigkeit einesVariabilitätsmodells in Bezug auf die Zuordnung zu bestimmten Lebenszyklusphasen(z. B. repräsentiert durch Artefakte) zu definieren.
137

4 Evolution von Variabilitätsmodellen
Bereits in [6] haben wir das Thema der Evolution von Variabilitätsmodellen betrachtet.Dort leiteten wir (aus Sicht der Anforderungen) eine Taxonomie für Produktlinien-evolutionsschritte ab. Dabei unterschieden wir in die drei Ebenen: produktbezogeneÄnderungen, Änderungen im Hinblick auf Varianten, sowie Änderungen vonGemeinsamkeiten. Auf jeder dieser Ebenen kann es für sich betrachtet zu Evolutions-schritten kommen. Darüber hinaus sind auch Übergänge zwischen diesen Ebenenmöglich. Eine Übersicht gibt Abbildung 2.
Zusätzlich kann man Evolutionsschritte noch bezüglich ihres Umfangs kategorisieren.So gibt es Änderungen die ganze Produktlinien verändern (z. B. die Aufspaltung voneiner Produktlinie in zwei), solche die die Produkte einer Produktlinie verändern (z. B.Hinzufügen eines Produkts) und schließlich solche, die zur Änderung einzelnerAnforderungen führen.
Die Details der Taxonomie würden den Rahmen dieser Ausführungen sprengen, jedochkonnten 20 verschiedene Evolutionsoperationen identifiziert werden. DieseKombinationen ergaben sich insbesondere durch die getrennte Betrachtung desHinzufügens, Wegnehmens und Änderns von Elementen. Dabei wurde die Analysejedoch ausschließlich aus der Anforderungsperspektive durchgeführt. Die obenangeführten Überlegungen zu einer den Lebenszyklus umfassenden Perspektive wurdendabei noch nicht berücksichtigt.
Die Notwendigkeit der Unterstützung der verschiedenen Variabilitätsoperationen führtneben dem Bedarf zur direkten Unterstützung der verschiedenen Operationen auch zurNotwendigkeit die entsprechenden Informationen zu erfassen und zu verwalten. AufBasis der Analyse der Variabilitätsoperationen konnten wir die Notwendigkeit zurVerwaltung (und Manipulation) verschiedenster Abhängigkeiten identifizieren [6].
5 Zusammenfassung
In den beiden vorhergehenden Abschnitten, diskutierten wir einige Herausforderungenzur Produktlinienevolution. Dies waren einerseits Anforderungen, die sich aus der unter-schiedlichen Abdeckung der verschiedenen Lebenszyklusabschnitte ergaben, zumanderen solche, die sich aus der Evolution der Produktlinie als Ganzes ergeben.
Die Kombination beider Formen der Evolution, wie sie täglich in jeder realen Produkt-linie geschieht, erfordert wenn sie erfolgreich sein soll, eine umfangreiche Evolutions-unterstützung. Dabei muss sich beispielsweise auch der Projektfortschritt im Sinne einerunterschiedlichen Umsetzung von Produktlinienvariabilität im Variabilitätsmodellwiderspiegeln.
138
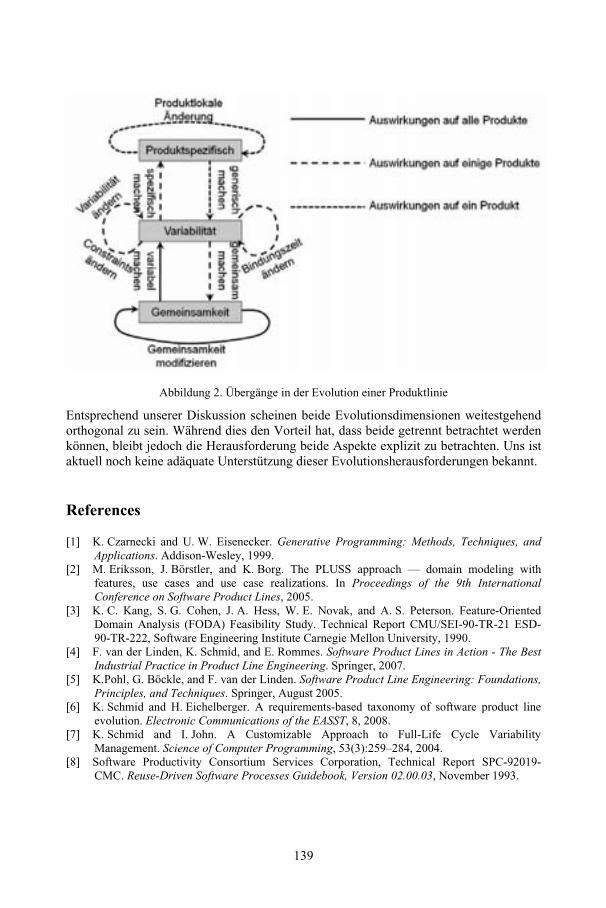
Abbildung 2. Übergänge in der Evolution einer Produktlinie
Entsprechend unserer Diskussion scheinen beide Evolutionsdimensionen weitestgehendorthogonal zu sein. Während dies den Vorteil hat, dass beide getrennt betrachtet werdenkönnen, bleibt jedoch die Herausforderung beide Aspekte explizit zu betrachten. Uns istaktuell noch keine adäquate Unterstützung dieser Evolutionsherausforderungen bekannt.
References
[1] K. Czarnecki and U. W. Eisenecker. Generative Programming: Methods, Techniques, andApplications. Addison-Wesley, 1999.
[2] M. Eriksson, J. Börstler, and K. Borg. The PLUSS approach — domain modeling withfeatures, use cases and use case realizations. In Proceedings of the 9th InternationalConference on Software Product Lines, 2005.
[3] K. C. Kang, S. G. Cohen, J. A. Hess, W. E. Novak, and A. S. Peterson. Feature-OrientedDomain Analysis (FODA) Feasibility Study. Technical Report CMU/SEI-90-TR-21 ESD-90-TR-222, Software Engineering Institute Carnegie Mellon University, 1990.
[4] F. van der Linden, K. Schmid, and E. Rommes. Software Product Lines in Action - The BestIndustrial Practice in Product Line Engineering. Springer, 2007.
[5] K.Pohl, G. Böckle, and F. van der Linden. Software Product Line Engineering: Foundations,Principles, and Techniques. Springer, August 2005.
[6] K. Schmid and H. Eichelberger. A requirements-based taxonomy of software product lineevolution. Electronic Communications of the EASST, 8, 2008.
[7] K. Schmid and I. John. A Customizable Approach to Full-Life Cycle VariabilityManagement. Science of Computer Programming, 53(3):259–284, 2004.
[8] Software Productivity Consortium Services Corporation, Technical Report SPC-92019-CMC. Reuse-Driven Software Processes Guidebook, Version 02.00.03, November 1993.
139

Human-Computer Interaction undVisualisierung – Bedeutung und Anwendung
im Software Engineering
(HCIV)
Inhaltsverzeichnis
Human-Computer Interaction and Visualization (HCIV2009)Achim Ebert, Peter Dannenmann ................................................................................ 143
Novel Visual Representations for Software Metrics Using 3D and AnimationAndreas Kerren, Ilir Jusufi .......................................................................................... 147
The Role of Visualization in the Naturalization of Remote Software ImmigrantsAzam Khan, Justin Matejka, Steve Easterbrook .......................................................... 155
Visual Debugger for Single-Point-Contact Haptic RenderingChristoph Fünfzig, Kerstin Müller, Gudrun Albrecht .................................................. 161
Applications of Visualization Technology in Robotics Software DevelopmentMax Reichardt, Lisa Wilhelm, Martin Proetzsch, Karsten Berns ................................ 167
Network Situational Awareness: A Representative StudyThomas Eskridge, David Lecoutre, Matt Johnson, Jeffrey M. Bradshaw .................... 175
User Centered Design Patterns for VisualizationGerrit van der Veer, Elbert-Jan Hennipman, Evert-Jan Oppelaar .............................. 183
Human-Computer Interaction and Visualization
(HCIV 2009)
Achim Ebert1,3, Peter Dannenmann2, 3
1Technische Universität Kaiserslautern2Fachhochschule Wiesbaden3DFKI GmbH [email protected]
HCIV 2009 war offizielles IFIP-Event (www.ifip.org) und stand unter dem Thema„Human-Computer Interaction and Visualization – Impact for and Applications inSoftware Engineering“. Der Workshop wurde vom Internationalen DFG-Graduiertenkolleg 1131 „Visualisierung großer und unstrukturierter Datenmengen“und vom Deutschen Forschungszentrum für Künstliche Intelligenz unterstützt.
Wichtige Ziele in den Forschungsgebieten Human-Computer Interaction (HCI) undVisualisierung sind die Erforschung, Entwicklung und Evaluierung von Werkzeugen undStrategien, um die Möglichkeiten der Interaktion mit großen Displays besser verstehenund unterstützen zu können. Bislang existieren aber nur wenige Anwendungen, die dieneuen Voraussetzungen großer Displays gewinnbringend und effektiv einsetzen können.Eine dieser Anwendungen könnte die Software Visualisierung darstellen, welche auf deräußerst erfolgreichen Software Engineering-Thematik „Software Measurement/SoftwareAnalysis aufbaut. Nach Price et. al. lässt sich das Gebiet der Software Visualisierung in„Algorithm Animation“ und „Program Visualization“ klassifizieren. Der erste Begriffbezieht sich dabei auf die dynamische Darstellung von High-Level-Beschreibungen vonSoftware (Algorithmen). Der zweite Begriff – im Zusammenhang mit dem Workshopder wichtigere – umschreibt die Verwendung dynamischer Visualisierungstechniken zurSteigerung des Verständnisses der Umsetzungen von Programmen oder Datenstrukturen.Program Visualization-Ansätze versuchen, die Features der Software zu extrahieren unddamit diese besser greifbar zu machen. Sie liefern damit einen wichtigen Zugang zumabstrakten Produkt „Software“.
Im Rahmen des Workshops beleuchteten Vorträge aus den Bereichen HCI und(Software) Visualisierung aktuelle Entwicklungen und den State-of-the-Art dieserGebiete in Bezug auf Software Engineering. Einen Überblick hierüber geben diefolgenden Abstracts:
Andreas Kerren, Ilir Jusufi: Novel Visual Representations for Software Metrics Using 3Dand Animation. The visualization of software metrics is an important step towards abetter understanding of the software product to be developed. Software metrics arequantitative measurements of a piece of software, e.g., a class, a package, or a
143
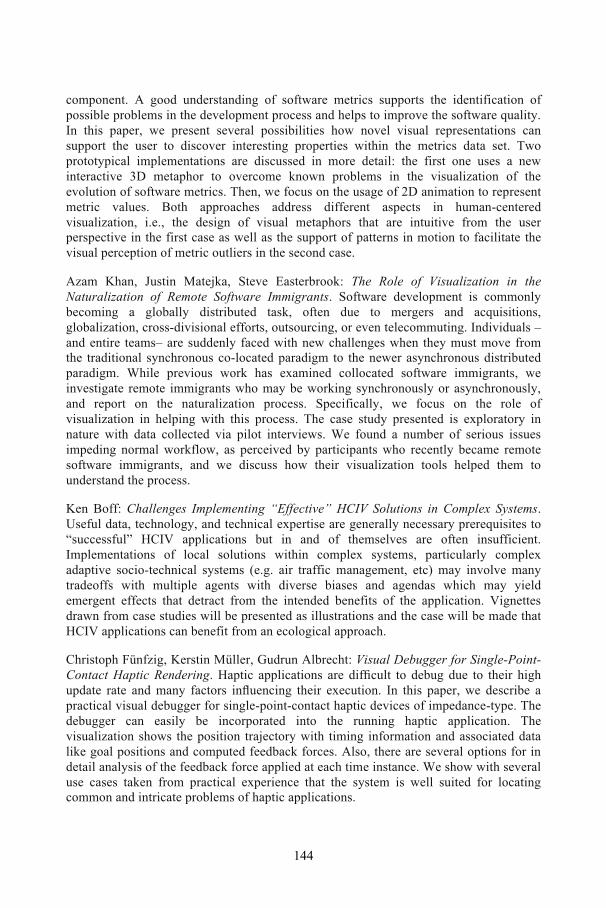
component. A good understanding of software metrics supports the identification ofpossible problems in the development process and helps to improve the software quality.In this paper, we present several possibilities how novel visual representations cansupport the user to discover interesting properties within the metrics data set. Twoprototypical implementations are discussed in more detail: the first one uses a newinteractive 3D metaphor to overcome known problems in the visualization of theevolution of software metrics. Then, we focus on the usage of 2D animation to representmetric values. Both approaches address different aspects in human-centeredvisualization, i.e., the design of visual metaphors that are intuitive from the userperspective in the first case as well as the support of patterns in motion to facilitate thevisual perception of metric outliers in the second case.
Azam Khan, Justin Matejka, Steve Easterbrook: The Role of Visualization in theNaturalization of Remote Software Immigrants. Software development is commonlybecoming a globally distributed task, often due to mergers and acquisitions,globalization, cross-divisional efforts, outsourcing, or even telecommuting. Individuals –and entire teams– are suddenly faced with new challenges when they must move fromthe traditional synchronous co-located paradigm to the newer asynchronous distributedparadigm. While previous work has examined collocated software immigrants, weinvestigate remote immigrants who may be working synchronously or asynchronously,and report on the naturalization process. Specifically, we focus on the role ofvisualization in helping with this process. The case study presented is exploratory innature with data collected via pilot interviews. We found a number of serious issuesimpeding normal workflow, as perceived by participants who recently became remotesoftware immigrants, and we discuss how their visualization tools helped them tounderstand the process.
Ken Boff: Challenges Implementing “Effective” HCIV Solutions in Complex Systems.Useful data, technology, and technical expertise are generally necessary prerequisites to“successful” HCIV applications but in and of themselves are often insufficient.Implementations of local solutions within complex systems, particularly complexadaptive socio-technical systems (e.g. air traffic management, etc) may involve manytradeoffs with multiple agents with diverse biases and agendas which may yieldemergent effects that detract from the intended benefits of the application. Vignettesdrawn from case studies will be presented as illustrations and the case will be made thatHCIV applications can benefit from an ecological approach.
Christoph Fünfzig, Kerstin Müller, Gudrun Albrecht: Visual Debugger for Single-Point-Contact Haptic Rendering. Haptic applications are difficult to debug due to their highupdate rate and many factors influencing their execution. In this paper, we describe apractical visual debugger for single-point-contact haptic devices of impedance-type. Thedebugger can easily be incorporated into the running haptic application. Thevisualization shows the position trajectory with timing information and associated datalike goal positions and computed feedback forces. Also, there are several options for indetail analysis of the feedback force applied at each time instance. We show with severaluse cases taken from practical experience that the system is well suited for locatingcommon and intricate problems of haptic applications.
144
Max Reichardt, Lisa Wilhelm, Martin Proetzsch, Karsten Berns: Applications ofVisualization Technology in Robotics Software Development. Control software forexperimental autonomous robots is typically complex and subject to frequent changes –posing numerous challenges for software engineers. When based on general-purposerobotics frameworks, significant parts of such systems are modular and data-flow-oriented – a natural fit for visualization in graph structures. In this paper, we presentapproaches to visualize different aspects of robotics software which proved helpful oreven essential in our development process. Furthermore, we briefly introduce centralabstractions in our software framework which greatly facilitate generic solutions.
Thomas Eskridge, David Lecoutre, Matt Johnson, Jeffrey M. Bradshaw: NetworkSituational Awareness: A Representative Survey. Recent developments in visualizationtechniques for network monitoring and analysis have advanced dramatically over thesimple graphs and color-coded representations found in early intrusion detectionsystems. These integrated visualization systems attempt to present a complete andcoherent view of the traffic on a network, and the possible security events that mayoccur. In this paper we describe several representative integrated network visualizationsystems and discuss the network status and security questions they answer. We addressthe strengths and weaknesses of each type of visualization system with particularemphasis on operator interaction and directability.
Gerrit van der Veer, Elbert-Jan Hennipman, Evert-Jan Oppelaar: User Centered DesignPatterns for Visualisation. The variation in screen sizes that people use is growing, andso is the variation in situations in which screens are used, and the activities for whichscreens are used. Engineers design the screens and most of the time engineers design theway the information will be displayed. Both design efforts require attention to theprospective users of the screen. This paper is about the way information could / shouldbe displayed. The meaning received from displayed information is dependent on: theuser (current needs, history of what displayed data could mean); the context; the user’sactivities when using the display. People perceive, ignore or interpret, accept or reject,the info from a screen, based on their current situation. To design for information toreach the goal it is intended to reach, the collective knowledge of HCI might help. Butmost designers are not experts in HCI. Design patterns are a way to provide provensolutions.
In einer gemeinsamen Abschlussdiskussion unter Leitung von Nahum Gershon wurdenmit den eigentlichen Nutzern der Konzepte, den Experten aus dem SoftwareEngineering, diese Inhalte anschließend erörtert und Visionen für zukünftigeForschungen entwickelt.
Die kompletten Workshopbeiträge sind auf den folgenden Seiten zusammengefasst. Siestellen die aktuellen Arbeiten der Teilnehmer dar, welche die Basis für die lebhaften undergiebigen Diskussionen des Workshops bildeten.
145

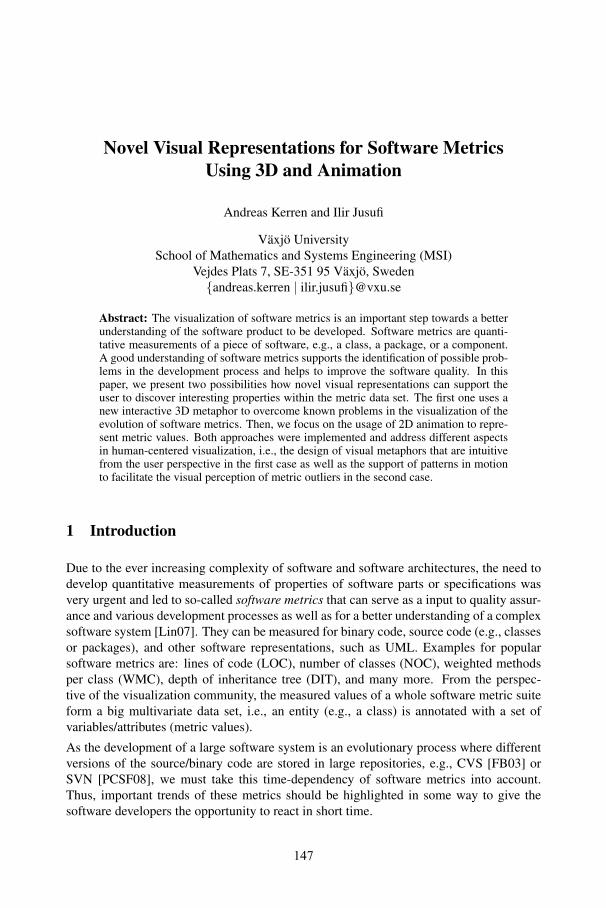
Novel Visual Representations for Software MetricsUsing 3D and Animation
Andreas Kerren and Ilir Jusufi
Vaxjo UniversitySchool of Mathematics and Systems Engineering (MSI)
Vejdes Plats 7, SE-351 95 Vaxjo, Sweden{andreas.kerren | ilir.jusufi}@vxu.se
Abstract: The visualization of software metrics is an important step towards a betterunderstanding of the software product to be developed. Software metrics are quanti-tative measurements of a piece of software, e.g., a class, a package, or a component.A good understanding of software metrics supports the identification of possible prob-lems in the development process and helps to improve the software quality. In thispaper, we present two possibilities how novel visual representations can support theuser to discover interesting properties within the metric data set. The first one uses anew interactive 3D metaphor to overcome known problems in the visualization of theevolution of software metrics. Then, we focus on the usage of 2D animation to repre-sent metric values. Both approaches were implemented and address different aspectsin human-centered visualization, i.e., the design of visual metaphors that are intuitivefrom the user perspective in the first case as well as the support of patterns in motionto facilitate the visual perception of metric outliers in the second case.
1 Introduction
Due to the ever increasing complexity of software and software architectures, the need todevelop quantitative measurements of properties of software parts or specifications wasvery urgent and led to so-called software metrics that can serve as a input to quality assur-ance and various development processes as well as for a better understanding of a complexsoftware system [Lin07]. They can be measured for binary code, source code (e.g., classesor packages), and other software representations, such as UML. Examples for popularsoftware metrics are: lines of code (LOC), number of classes (NOC), weighted methodsper class (WMC), depth of inheritance tree (DIT), and many more. From the perspec-tive of the visualization community, the measured values of a whole software metric suiteform a big multivariate data set, i.e., an entity (e.g., a class) is annotated with a set ofvariables/attributes (metric values).
As the development of a large software system is an evolutionary process where differentversions of the source/binary code are stored in large repositories, e.g., CVS [FB03] orSVN [PCSF08], we must take this time-dependency of software metrics into account.Thus, important trends of these metrics should be highlighted in some way to give thesoftware developers the opportunity to react in short time.
147
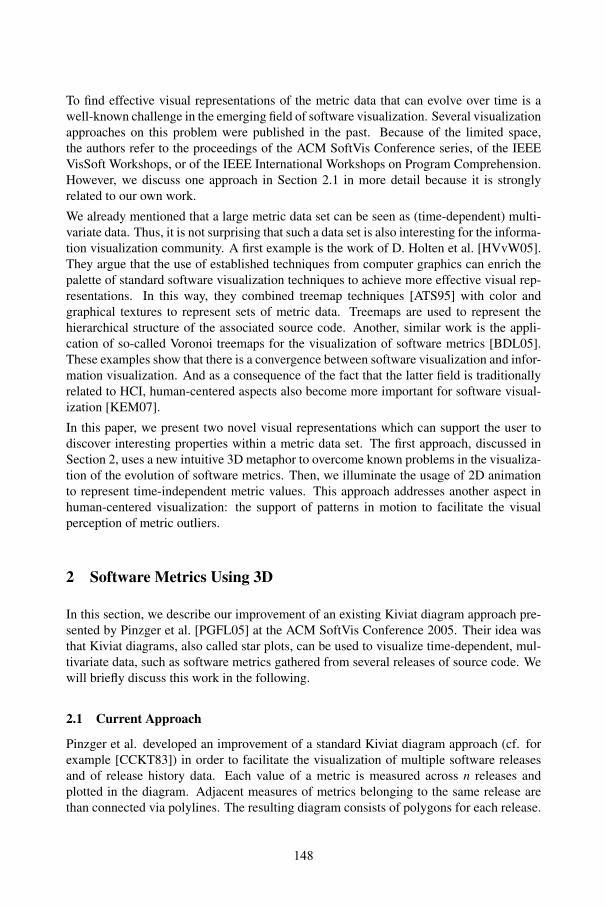
To find effective visual representations of the metric data that can evolve over time is awell-known challenge in the emerging field of software visualization. Several visualizationapproaches on this problem were published in the past. Because of the limited space,the authors refer to the proceedings of the ACM SoftVis Conference series, of the IEEEVisSoft Workshops, or of the IEEE International Workshops on Program Comprehension.However, we discuss one approach in Section 2.1 in more detail because it is stronglyrelated to our own work.
We already mentioned that a large metric data set can be seen as (time-dependent) multi-variate data. Thus, it is not surprising that such a data set is also interesting for the informa-tion visualization community. A first example is the work of D. Holten et al. [HVvW05].They argue that the use of established techniques from computer graphics can enrich thepalette of standard software visualization techniques to achieve more effective visual rep-resentations. In this way, they combined treemap techniques [ATS95] with color andgraphical textures to represent sets of metric data. Treemaps are used to represent thehierarchical structure of the associated source code. Another, similar work is the appli-cation of so-called Voronoi treemaps for the visualization of software metrics [BDL05].These examples show that there is a convergence between software visualization and infor-mation visualization. And as a consequence of the fact that the latter field is traditionallyrelated to HCI, human-centered aspects also become more important for software visual-ization [KEM07].
In this paper, we present two novel visual representations which can support the user todiscover interesting properties within a metric data set. The first approach, discussed inSection 2, uses a new intuitive 3D metaphor to overcome known problems in the visualiza-tion of the evolution of software metrics. Then, we illuminate the usage of 2D animationto represent time-independent metric values. This approach addresses another aspect inhuman-centered visualization: the support of patterns in motion to facilitate the visualperception of metric outliers.
2 Software Metrics Using 3D
In this section, we describe our improvement of an existing Kiviat diagram approach pre-sented by Pinzger et al. [PGFL05] at the ACM SoftVis Conference 2005. Their idea wasthat Kiviat diagrams, also called star plots, can be used to visualize time-dependent, mul-tivariate data, such as software metrics gathered from several releases of source code. Wewill briefly discuss this work in the following.
2.1 Current Approach
Pinzger et al. developed an improvement of a standard Kiviat diagram approach (cf. forexample [CCKT83]) in order to facilitate the visualization of multiple software releasesand of release history data. Each value of a metric is measured across n releases andplotted in the diagram. Adjacent measures of metrics belonging to the same release arethan connected via polylines. The resulting diagram consists of polygons for each release.
148
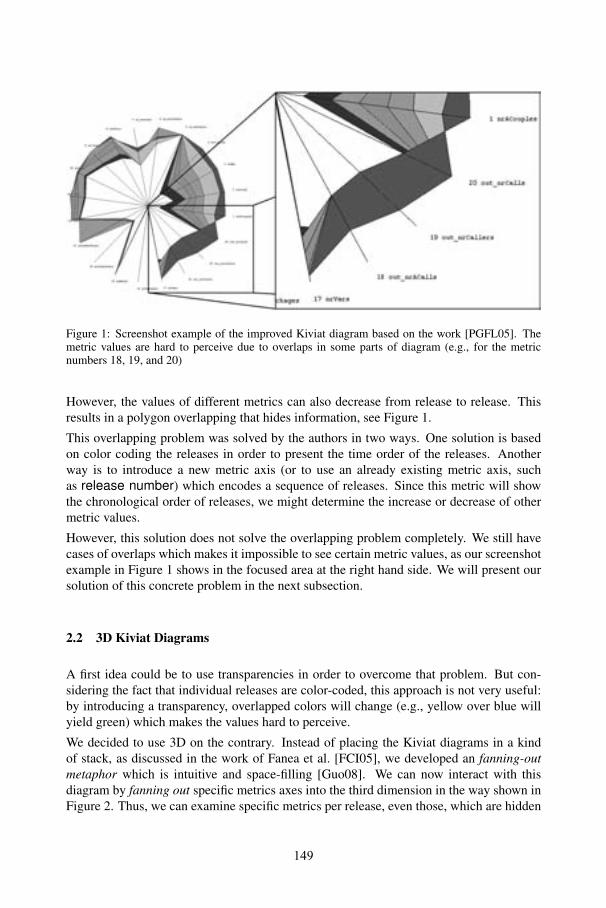
Figure 1: Screenshot example of the improved Kiviat diagram based on the work [PGFL05]. Themetric values are hard to perceive due to overlaps in some parts of diagram (e.g., for the metricnumbers 18, 19, and 20)
However, the values of different metrics can also decrease from release to release. Thisresults in a polygon overlapping that hides information, see Figure 1.
This overlapping problem was solved by the authors in two ways. One solution is basedon color coding the releases in order to present the time order of the releases. Anotherway is to introduce a new metric axis (or to use an already existing metric axis, suchas release number) which encodes a sequence of releases. Since this metric will showthe chronological order of releases, we might determine the increase or decrease of othermetric values.
However, this solution does not solve the overlapping problem completely. We still havecases of overlaps which makes it impossible to see certain metric values, as our screenshotexample in Figure 1 shows in the focused area at the right hand side. We will present oursolution of this concrete problem in the next subsection.
2.2 3D Kiviat Diagrams
A first idea could be to use transparencies in order to overcome that problem. But con-sidering the fact that individual releases are color-coded, this approach is not very useful:by introducing a transparency, overlapped colors will change (e.g., yellow over blue willyield green) which makes the values hard to perceive.
We decided to use 3D on the contrary. Instead of placing the Kiviat diagrams in a kindof stack, as discussed in the work of Fanea et al. [FCI05], we developed an fanning-outmetaphor which is intuitive and space-filling [Guo08]. We can now interact with thisdiagram by fanning out specific metrics axes into the third dimension in the way shown inFigure 2. Thus, we can examine specific metrics per release, even those, which are hidden
149
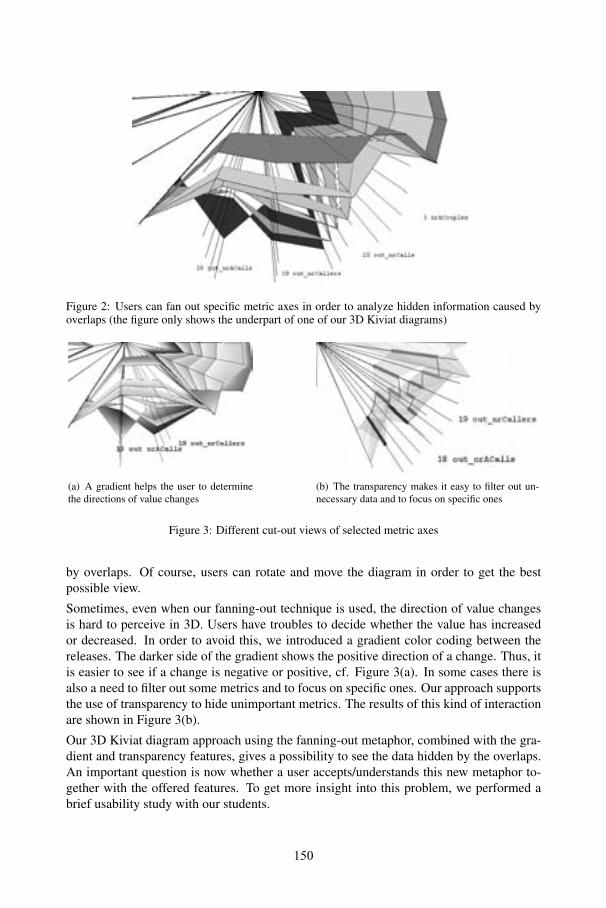
Figure 2: Users can fan out specific metric axes in order to analyze hidden information caused byoverlaps (the figure only shows the underpart of one of our 3D Kiviat diagrams)
(a) A gradient helps the user to determinethe directions of value changes
(b) The transparency makes it easy to filter out un-necessary data and to focus on specific ones
Figure 3: Different cut-out views of selected metric axes
by overlaps. Of course, users can rotate and move the diagram in order to get the bestpossible view.
Sometimes, even when our fanning-out technique is used, the direction of value changesis hard to perceive in 3D. Users have troubles to decide whether the value has increasedor decreased. In order to avoid this, we introduced a gradient color coding between thereleases. The darker side of the gradient shows the positive direction of a change. Thus, itis easier to see if a change is negative or positive, cf. Figure 3(a). In some cases there isalso a need to filter out some metrics and to focus on specific ones. Our approach supportsthe use of transparency to hide unimportant metrics. The results of this kind of interactionare shown in Figure 3(b).
Our 3D Kiviat diagram approach using the fanning-out metaphor, combined with the gra-dient and transparency features, gives a possibility to see the data hidden by the overlaps.An important question is now whether a user accepts/understands this new metaphor to-gether with the offered features. To get more insight into this problem, we performed abrief usability study with our students.
150
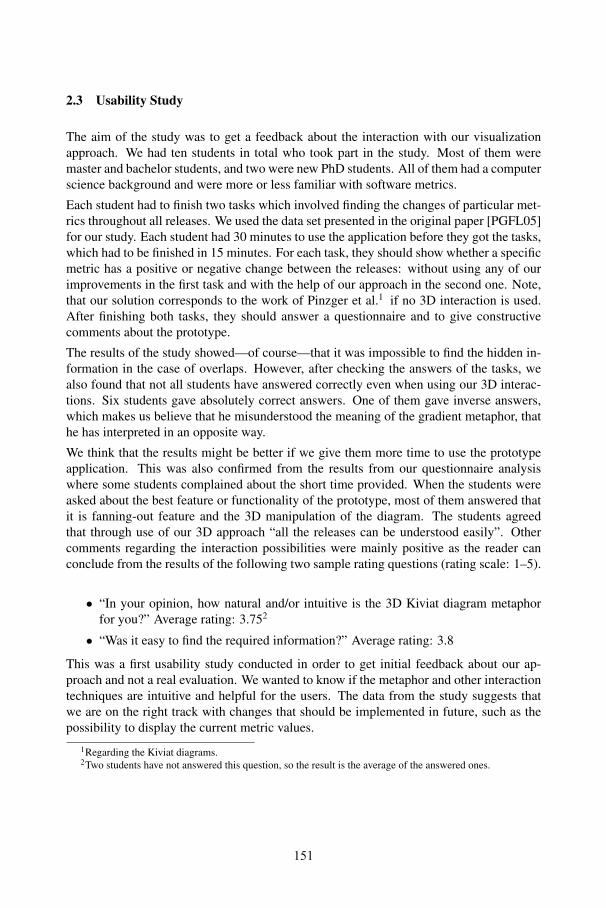
2.3 Usability Study
The aim of the study was to get a feedback about the interaction with our visualizationapproach. We had ten students in total who took part in the study. Most of them weremaster and bachelor students, and two were new PhD students. All of them had a computerscience background and were more or less familiar with software metrics.
Each student had to finish two tasks which involved finding the changes of particular met-rics throughout all releases. We used the data set presented in the original paper [PGFL05]for our study. Each student had 30 minutes to use the application before they got the tasks,which had to be finished in 15 minutes. For each task, they should show whether a specificmetric has a positive or negative change between the releases: without using any of ourimprovements in the first task and with the help of our approach in the second one. Note,that our solution corresponds to the work of Pinzger et al.1 if no 3D interaction is used.After finishing both tasks, they should answer a questionnaire and to give constructivecomments about the prototype.
The results of the study showed—of course—that it was impossible to find the hidden in-formation in the case of overlaps. However, after checking the answers of the tasks, wealso found that not all students have answered correctly even when using our 3D interac-tions. Six students gave absolutely correct answers. One of them gave inverse answers,which makes us believe that he misunderstood the meaning of the gradient metaphor, thathe has interpreted in an opposite way.
We think that the results might be better if we give them more time to use the prototypeapplication. This was also confirmed from the results from our questionnaire analysiswhere some students complained about the short time provided. When the students wereasked about the best feature or functionality of the prototype, most of them answered thatit is fanning-out feature and the 3D manipulation of the diagram. The students agreedthat through use of our 3D approach “all the releases can be understood easily”. Othercomments regarding the interaction possibilities were mainly positive as the reader canconclude from the results of the following two sample rating questions (rating scale: 1–5).
• “In your opinion, how natural and/or intuitive is the 3D Kiviat diagram metaphorfor you?” Average rating: 3.752
• “Was it easy to find the required information?” Average rating: 3.8
This was a first usability study conducted in order to get initial feedback about our ap-proach and not a real evaluation. We wanted to know if the metaphor and other interactiontechniques are intuitive and helpful for the users. The data from the study suggests thatwe are on the right track with changes that should be implemented in future, such as thepossibility to display the current metric values.
1Regarding the Kiviat diagrams.2Two students have not answered this question, so the result is the average of the answered ones.
151
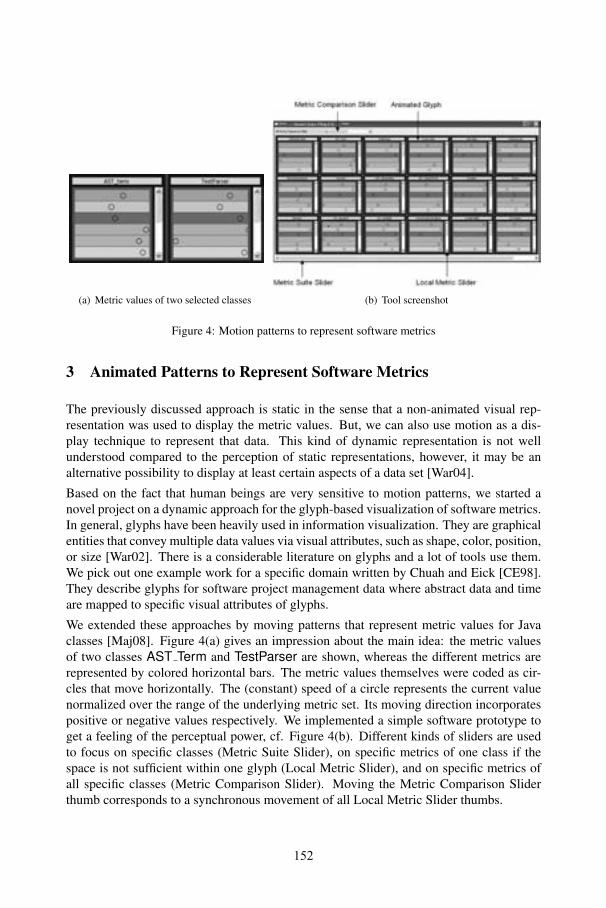
(a) Metric values of two selected classes (b) Tool screenshot
Figure 4: Motion patterns to represent software metrics
3 Animated Patterns to Represent Software Metrics
The previously discussed approach is static in the sense that a non-animated visual rep-resentation was used to display the metric values. But, we can also use motion as a dis-play technique to represent that data. This kind of dynamic representation is not wellunderstood compared to the perception of static representations, however, it may be analternative possibility to display at least certain aspects of a data set [War04].
Based on the fact that human beings are very sensitive to motion patterns, we started anovel project on a dynamic approach for the glyph-based visualization of software metrics.In general, glyphs have been heavily used in information visualization. They are graphicalentities that convey multiple data values via visual attributes, such as shape, color, position,or size [War02]. There is a considerable literature on glyphs and a lot of tools use them.We pick out one example work for a specific domain written by Chuah and Eick [CE98].They describe glyphs for software project management data where abstract data and timeare mapped to specific visual attributes of glyphs.
We extended these approaches by moving patterns that represent metric values for Javaclasses [Maj08]. Figure 4(a) gives an impression about the main idea: the metric valuesof two classes AST Term and TestParser are shown, whereas the different metrics arerepresented by colored horizontal bars. The metric values themselves were coded as cir-cles that move horizontally. The (constant) speed of a circle represents the current valuenormalized over the range of the underlying metric set. Its moving direction incorporatespositive or negative values respectively. We implemented a simple software prototype toget a feeling of the perceptual power, cf. Figure 4(b). Different kinds of sliders are usedto focus on specific classes (Metric Suite Slider), on specific metrics of one class if thespace is not sufficient within one glyph (Local Metric Slider), and on specific metrics ofall specific classes (Metric Comparison Slider). Moving the Metric Comparison Sliderthumb corresponds to a synchronous movement of all Local Metric Slider thumbs.
152
We will use this implementation as a basis for the development of more advanced dy-namic glyphs. The current ones are, for example, very space-consuming which shouldbe improved. A first small usability test has shown that the perception of such animatedglyphs seems to be better compared with a version using textures for the representation ofmetric values, but only if the number of animated objects per class is small (≈ five circles).Especially metric outliers are quickly discovered.
4 Conclusions and Future Work
In this paper, we presented two novel visual representations including their prototypicalimplementations, which can support the user to discover interesting properties within ametrics data set. The first one uses a new interactive 3D metaphor to overcome knownproblems in software metric visualization. The second one is on the usage of 2D animationto represent the metric values.
Both approaches are ongoing projects of our research group and need to be carefully eval-uated. Especially the dynamic approach is at the beginning of our investigations to bringmotion perception findings into software visualization. Our future work will be directedto analyze the possibilities that this approach will offer, to work on space-filling variants,and to extend it to alternative display technologies.
Acknowledgments: We would like to thank Guo Yuhua for implementing the 3D ap-proach to visualize software metric evolutions described in Section 2. Furthermore, we arethankful to Raja Majid for his prototypical implementation of animated patterns shortlydiscussed in Section 3.
References
[ATS95] T. Asahi, D. Turo, and B. Shneiderman. Visual Decision-Making: Using Treemaps forthe Analytic Hierarchy Process. In CHI 95 Conference Companion, pages 405–406,1995.
[BDL05] M. Balzer, O. Deussen, and C. Lewerentz. Voronoi Treemaps for the Visualization ofSoftware Metrics. In Proceedings of the 2005 ACM symposium on Software Visualiza-tion (SoftVis ’05), pages 165–172, New York, NY, USA, 2005. ACM.
[CCKT83] J.M. Chambers, W.S. Cleveland, B. Kleiner, and P.A. Tukey. Graphical Methods forData Analysis. Wadsworth, Belmont, CA, 1983.
[CE98] Mei C. Chuah and Stephen G. Eick. Information Rich Glyphs for Software ManagementData. IEEE Computer Graphics and Applications, 18(4):24–29, 1998.
[FB03] Karl Fogel and Moshe Bar. Open Source Development with CVS. Paraglyph Press, 3rdedition, 2003.
[FCI05] E. Fanea, S. Carpendale, and T. Isenberg. An Interactive 3D Integration of Parallel Co-ordinates and Star Glyphs. In Proceedings of the 2005 IEEE Symposium on InformationVisualization, pages 149–156, 2005.
153
[Guo08] Y. Guo. Implementation of 3D Kiviat Diagrams. Bachelor’s thesis, Vaxjo University,Sweden, 2008.
[HVvW05] D. Holten, R. Vliegen, and J.J. van Wijk. Visual Realism for the Visualization of Soft-ware Metrics. In Proceedings of Visualizing Software for Understanding and Analysis(VISSOFT 2005), pages 1–6, 2005.
[KEM07] Andreas Kerren, Achim Ebert, and Jorg Meyer, editors. Human-Centered VisualizationEnvironments. LNCS Tutorial 4417. Springer, Heidelberg, 2007.
[Lin07] R. Lincke. Validation of a Standard- and Metric-Based Software Quality Model. Li-centiate thesis, Vaxjo University, Sweden, 2007.
[Maj08] R. Majid. Dynamic and Static Approaches for Glyph-Based Visualization of SoftwareMetrics. Master’s thesis, Vaxjo University, Sweden, 2008.
[PCSF08] C.M. Pilato, B. Collins-Sussman, and B.W. Fitzpatrick. Version Control with Subver-sion. O’Reilly Media, Inc., 2nd edition, 2008.
[PGFL05] M. Pinzger, H. Gall, M. Fischer, and M. Lanza. Visualizing Multiple Evolution Metrics.In Proceedings of the 2005 ACM Symposium on Software Visualization (SoftVis ’05),pages 354–362, St. Louis, Missouri, 2005.
[War02] Matthew O. Ward. A Taxonomy of Glyph Placement Strategies for MultidimensionalData Visualization. Information Visualization, 1:194–210, 2002.
[War04] Colin Ware. Information Visualization: Perception for Design. Morgan Kaufmann, 2ndedition, 2004.
154
The Role of Visualization in the Naturalization of RemoteSoftware Immigrants
Azam Khan1,2, Justin Matejka1, Steve Easterbrook2
Autodesk Research1 & University of Toronto2
210 King Street EastToronto, OntarioM5A 1J7 Canada
[email protected]@autodesk.com
Abstract: Software development is commonly becoming a globally distributedtask, often due to mergers and acquisitions, globalization, cross-divisional efforts,outsourcing, or even telecommuting. Individuals -and entire teams- are suddenlyfaced with new challenges when they must move from the traditional synchronousco-located paradigm to the newer asynchronous distributed paradigm. Whileprevious work has examined collocated software immigrants, we investigateremote immigrants who may be working synchronously or asynchronously, andreport on the naturalization process. Specifically, we focus on the role ofvisualization in helping with this process. The case study presented is exploratoryin nature with data collected via pilot interviews. We found a number of issuesimpeding normal workflow, as perceived by participants who recently becameremote software immigrants, and we discuss how visualization tools weredeveloped to help them to understand the process.
1 Introduction
While Global Software Development (GSD) has recently been established as a new andcompelling research area, the transition from Local Software Development (LSD) toGSD has not been examined in detail. We believe this transition [CR06] is an importantpart of GSD and these early experiences may have a significant effect, lasting for severalyears, while teams move toward –and acclimatize to– viable GSD practices.
Inspired by the software immigrant metaphor introduced by Sim and Holt [SH98], weextend the exploration of this transition, from individuals joining new developmentteams in a collocated setting, to teams joining established larger remote teams in adistributed setting. In keeping with the immigrant metaphor, we also call this processnaturalization. Primarily, the team being integrated could be considered as going from aphysical team to a hybrid physical-virtual team.
155

Virtual team [GC03, LS97] and GSD research often further include dimensions of space,time, culture, and technology, often combined as a general concept of distance in anetworked world [GHP99]. Casey and Richardson [CR06] propose factors significantduring the establishment of virtual teams focussing on the management issues. However,our work more closely follows the work of Herbsleb and Grinter [HG99] who examineda GSD code integration project at a large corporation. We track a small team based inToronto working in a large software development corporation with 6451 employees andover 30 development centers around the world. The six member team was part of acompany with 400 people acquired by the corporation and this paper reports on theexperiences of the team for an 18 month period beginning from the acquisition.
Two integration projects were executed by the team during this period. The first projectbegins the naturalization process of the team into a larger distributed remote team withthe task of integrating a component created by the team into a single product. Based onmanagement’s perceived success of this effort, the second project carries the componentintegration task into many of the company’s products.
2 Orientation
The culture of the corporation was quite different from that of the team. Due to thehighly distributed nature of the corporation, meetings were primarily conducted byphone conference. Moreover, a notable number of employees worked from their homes.When initially phoning into meetings, the team members were fairly disoriented, notrecognizing the voices of the participants, nor understanding their roles on the project.Another difficulty was understanding the management structure for the project and howmembers of different divisions cross-reported. No physical meetings took place tofacilitate the integration project. Meeting participants typically used WindowsNetMeeting to share documents or to record meeting notes. The six members of the teamwould often be speaking with ten people on the phone, several of whom would dial intothe meeting individually. The team found the process to be quite challenging and statedthat, even after dozens of meetings over a period of four weeks, it was still difficult toidentify individual voices and roles. To address the team’s disorientation within thecompany and within the project, visualization was used
2.1 TeamViz
The company had an organization tree intranet tool that would graphically show amanager and the employees directly reporting to them, but navigating up or down thestructure would reload the page, eliminating context, and only a single level was shownat a time. To overcome this limitation, one of the developers on the team (on his owninitiative) created a visualization program called TeamViz to better understand the rolesand relationships of the phone meeting participants. The tool was built using theProcessing language built on top of Java (www.processing.org). As input, TeamViz tooka Microsoft Excel employee list spreadsheet and email lists extracted from MicrosoftOutlook, with a small custom-made plug-in.
156
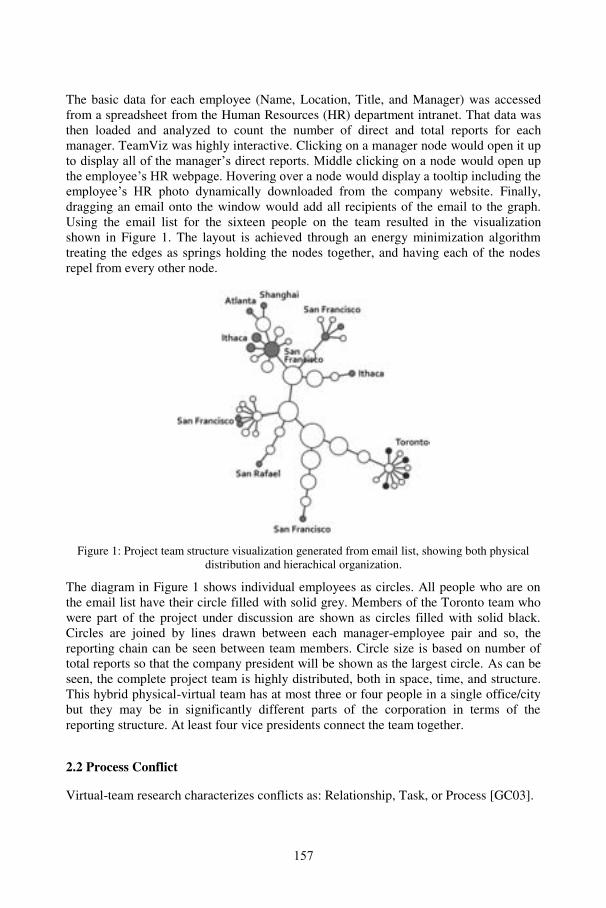
The basic data for each employee (Name, Location, Title, and Manager) was accessedfrom a spreadsheet from the Human Resources (HR) department intranet. That data wasthen loaded and analyzed to count the number of direct and total reports for eachmanager. TeamViz was highly interactive. Clicking on a manager node would open it upto display all of the manager’s direct reports. Middle clicking on a node would open upthe employee’s HR webpage. Hovering over a node would display a tooltip including theemployee’s HR photo dynamically downloaded from the company website. Finally,dragging an email onto the window would add all recipients of the email to the graph.Using the email list for the sixteen people on the team resulted in the visualizationshown in Figure 1. The layout is achieved through an energy minimization algorithmtreating the edges as springs holding the nodes together, and having each of the nodesrepel from every other node.
Figure 1: Project team structure visualization generated from email list, showing both physicaldistribution and hierachical organization.
The diagram in Figure 1 shows individual employees as circles. All people who are onthe email list have their circle filled with solid grey. Members of the Toronto team whowere part of the project under discussion are shown as circles filled with solid black.Circles are joined by lines drawn between each manager-employee pair and so, thereporting chain can be seen between team members. Circle size is based on number oftotal reports so that the company president will be shown as the largest circle. As can beseen, the complete project team is highly distributed, both in space, time, and structure.This hybrid physical-virtual team has at most three or four people in a single office/citybut they may be in significantly different parts of the corporation in terms of thereporting structure. At least four vice presidents connect the team together.
2.2 Process Conflict
Virtual-team research characterizes conflicts as: Relationship, Task, or Process [GC03].
157
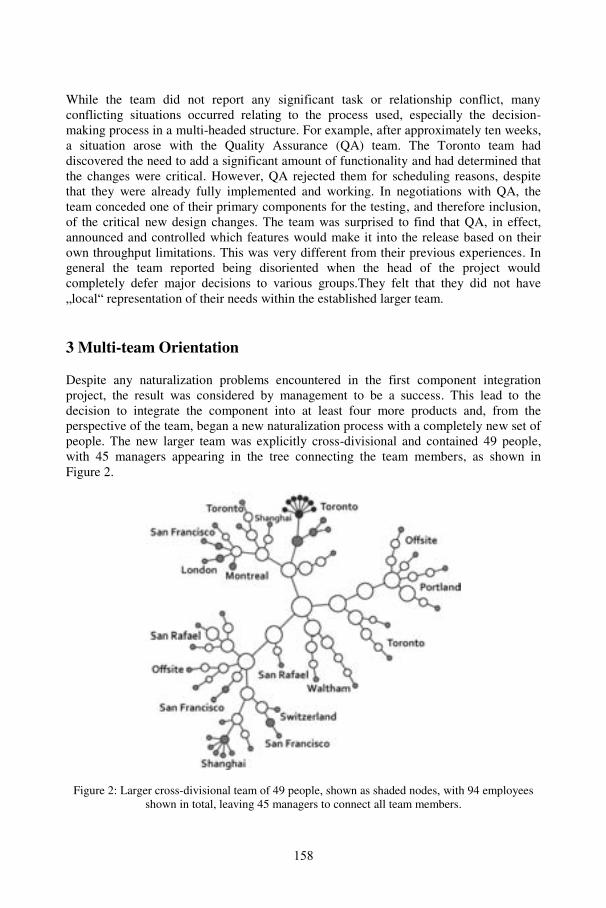
While the team did not report any significant task or relationship conflict, manyconflicting situations occurred relating to the process used, especially the decision-making process in a multi-headed structure. For example, after approximately ten weeks,a situation arose with the Quality Assurance (QA) team. The Toronto team haddiscovered the need to add a significant amount of functionality and had determined thatthe changes were critical. However, QA rejected them for scheduling reasons, despitethat they were already fully implemented and working. In negotiations with QA, theteam conceded one of their primary components for the testing, and therefore inclusion,of the critical new design changes. The team was surprised to find that QA, in effect,announced and controlled which features would make it into the release based on theirown throughput limitations. This was very different from their previous experiences. Ingeneral the team reported being disoriented when the head of the project wouldcompletely defer major decisions to various groups.They felt that they did not have„local“ representation of their needs within the established larger team.
3 Multi-team Orientation
Despite any naturalization problems encountered in the first component integrationproject, the result was considered by management to be a success. This lead to thedecision to integrate the component into at least four more products and, from theperspective of the team, began a new naturalization process with a completely new set ofpeople. The new larger team was explicitly cross-divisional and contained 49 people,with 45 managers appearing in the tree connecting the team members, as shown inFigure 2.
Figure 2: Larger cross-divisional team of 49 people, shown as shaded nodes, with 94 employeesshown in total, leaving 45 managers to connect all team members.
158
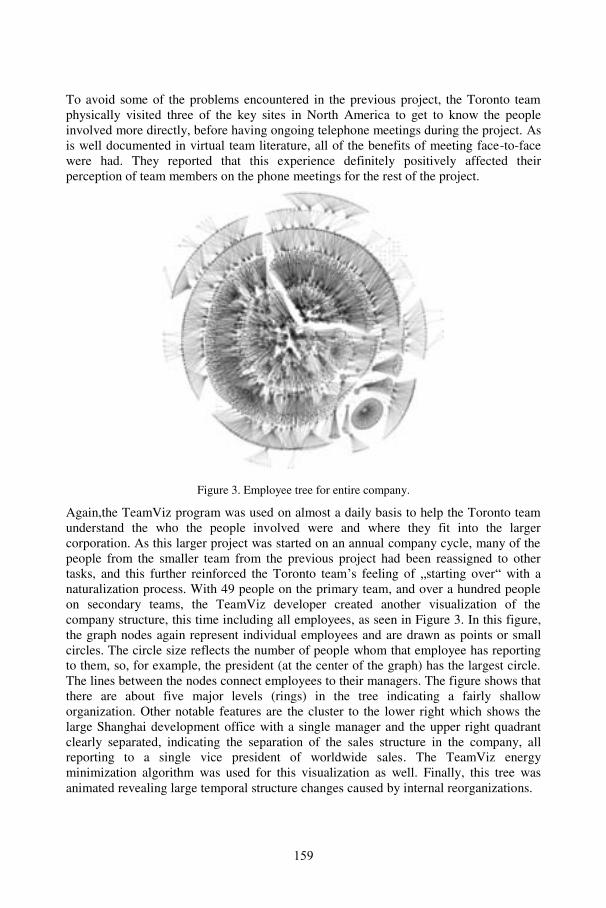
To avoid some of the problems encountered in the previous project, the Toronto teamphysically visited three of the key sites in North America to get to know the peopleinvolved more directly, before having ongoing telephone meetings during the project. Asis well documented in virtual team literature, all of the benefits of meeting face-to-facewere had. They reported that this experience definitely positively affected theirperception of team members on the phone meetings for the rest of the project.
Figure 3. Employee tree for entire company.
Again,the TeamViz program was used on almost a daily basis to help the Toronto teamunderstand the who the people involved were and where they fit into the largercorporation. As this larger project was started on an annual company cycle, many of thepeople from the smaller team from the previous project had been reassigned to othertasks, and this further reinforced the Toronto team’s feeling of „starting over“ with anaturalization process. With 49 people on the primary team, and over a hundred peopleon secondary teams, the TeamViz developer created another visualization of thecompany structure, this time including all employees, as seen in Figure 3. In this figure,the graph nodes again represent individual employees and are drawn as points or smallcircles. The circle size reflects the number of people whom that employee has reportingto them, so, for example, the president (at the center of the graph) has the largest circle.The lines between the nodes connect employees to their managers. The figure shows thatthere are about five major levels (rings) in the tree indicating a fairly shalloworganization. Other notable features are the cluster to the lower right which shows thelarge Shanghai development office with a single manager and the upper right quadrantclearly separated, indicating the separation of the sales structure in the company, allreporting to a single vice president of worldwide sales. The TeamViz energyminimization algorithm was used for this visualization as well. Finally, this tree wasanimated revealing large temporal structure changes caused by internal reorganizations.
159
While this visualization did help in the understanding of the overall corporate structure,it was not interactive as the minimization process took a significant amount of time toresolve all constraints. As such, its usage was not as common as TeamViz.
4 Conclusion
The naturalization process proved to be difficult for the team under review. Theestablished team they were working with seemed satisfied with a shared leadershipapproach but a hierarchical system was preferred [CDB03] by the software immigrants.Mismatched roles and a lack of face-to-face meetings seemed to contribute to conflictsand the resolution of problems was ad hoc. The distribution in space, time, and structureof the team also seemed to contribute to process conflict. The immigrant team developeda software tool to help visualize their company structure to better understand the rolesand relationships of the people they were working with. They reported using the toolregularly throughout the duration of both integration projects. While previous work hasdiscussed teams distributed in space and time, we have presented the distribution instructure as a compounding factor in the naturalization process.
References
[CR06] Casey, V. and Richardson, I. Uncovering the reality within virtual software teams. InProceedings of the 2006 international Workshop on Global Software Development Forthe Practitioner GSD '06. ACM Press, New York, pp. 66-72, 2006.
[CDB03] Creighton, O., Dutoit, A.H., and Bruegge, B. Supporting an Explicit OrganizationalModel in Global Software Engineering Projects. International Workshop on GlobalSoftware Development, ICSE Workshop (ICSE 2003). Portland, 2003.
[GC03] Gibson, C.B. and Cohen, S.G. eds. Virtual Teams that Work: Creating Conditions forVirtual Team Effectiveness. Jossey-Bass, San Francisco, 2003.
[GHP99] Grinter, R.E., Herbsleb, J.D., and Perry, D.E., The Geography of Coordination: Dealingwith Distance in R&D Work, In Proceedings of the International ACM SIGGROUPConference on Supporting Group Work, Phoenix, pp. 306-315, 1999.
[HG99] Herbsleb, J.D., Grinter, R.E., Splitting the Organization and Integrating the Code:Conway's Law Revisited, In Proceedings of the 21st International Conference onSoftware Engineering (ICSE ’99), Los Angeles, pp. 85-95, 1999.
[LS97] Lipnack, J. and Stamps, J. Virtual Teams: Reaching Across Space, Time, andOrganizations with Technology. Wiley & Sons, Inc., New York, 1997.
[SH98] Sim, S.E. and Holt, R.C. The Ramp-Up Problem in Software Projects: A Case Study ofhow Software Immigrants Naturalize. In Proceedings of the Twentieth Intern. Conf. onSoftware Engineering (ICSE-20) Kyoto, pp. 361-370, 1998.
160
Visual Debugger for Single-Point-Contact Haptic Rendering
Christoph Funfzig1, Kerstin Muller2, Gudrun Albrecht3
1 LE2I–MGSI, UMR CNRS 5158, Universite de Bourgogne, France2 Computer Graphics and Visualization, TU Kaiserslautern, Germany
3 LAMAV, FR CNRS 2956, Universite de Valenciennes et du Hainaut-Cambresis, [email protected]
[email protected]@univ-valenciennes.fr
Abstract: Haptic applications are difficult to debug due to their high update rate andmany factors influencing their execution.In this paper, we describe a practical visual debugger for single-point-of-contact hapticdevices of impedance-type. The debugger can easily be incorporated into the runninghaptic application. The visualization shows the position trajectory with timing infor-mation and associated data like goal positions and computed feedback forces. Also,there are several options for in detail analysis of the feedback force applied at eachtime instance. We show with several use cases taken from practical experience thatthe system is well suited for locating common and intricate problems of haptic appli-cations.
1 Introduction
Haptic applications have two characteristics. They are interactive with a human user inthe loop, and they have realtime requirements as they operate at a 1kHz rate. Both makethese applications difficult to debug and difficult to compare. Problems of a specific hapticrendering algorithm might occur only for certain input sequences and geometric configu-rations.
Concerning the device type, we work with an impedance-type haptic device and a sin-gle point of contact between the haptic probe and the rendered object. Impedance-typehaptic devices measure the endpoint motion (position or velocity) and output a force inresponse. Using the opposite causality, admittance-type devices measure the applied forceand output a motion according to the virtual environment being rendered [HM07]. Ex-amples of impedance-type are shown in Figure 1, the SensAble Phantom Omni and theNOVINT Falcon. In our experiments, we have used the NOVINT Falcon parallel device.It has a (4 inch)3 (approx. (10.16 cm)3) workspace with 2 lb-capable (approx. 8.9 N ) ac-tuators and 400 dpi (approx. 157.48 dpcm resolution) sensors. The standard procedure for
1The first author would like to thank the Conseil Regional de Bourgogne for support in a postdoc scholarshipof the year 2008/2009.
161
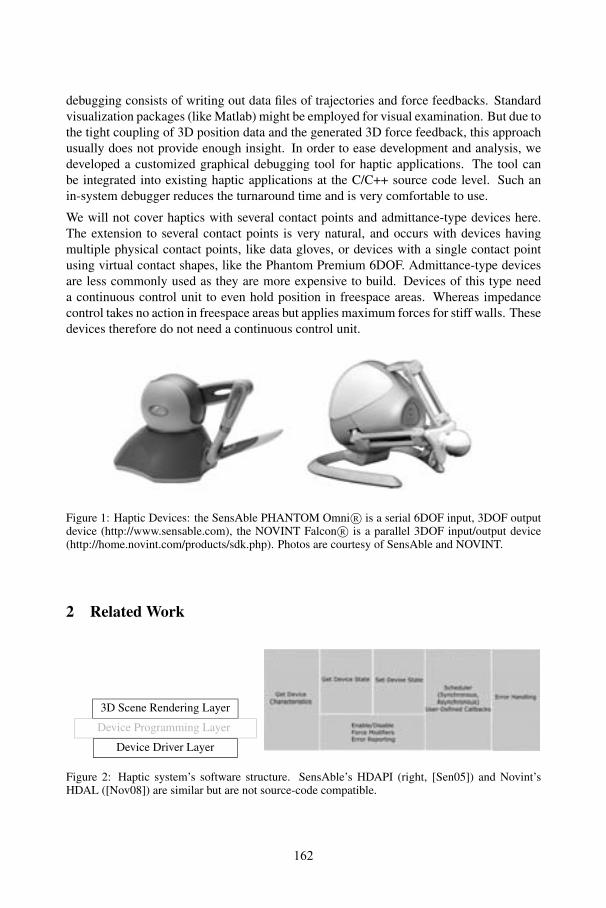
162
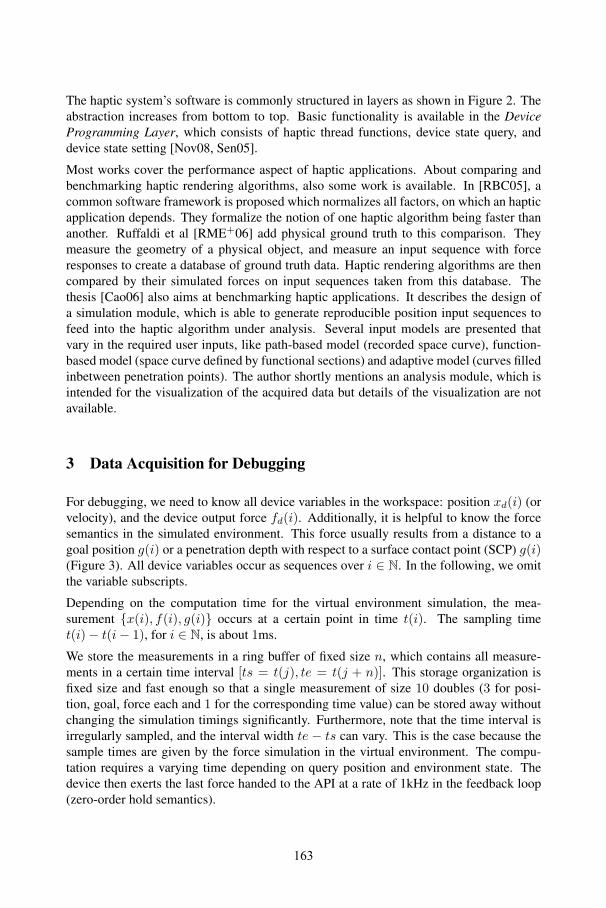
The haptic system’s software is commonly structured in layers as shown in Figure 2. Theabstraction increases from bottom to top. Basic functionality is available in the DeviceProgramming Layer, which consists of haptic thread functions, device state query, anddevice state setting [Nov08, Sen05].
Most works cover the performance aspect of haptic applications. About comparing andbenchmarking haptic rendering algorithms, also some work is available. In [RBC05], acommon software framework is proposed which normalizes all factors, on which an hapticapplication depends. They formalize the notion of one haptic algorithm being faster thananother. Ruffaldi et al [RME+06] add physical ground truth to this comparison. Theymeasure the geometry of a physical object, and measure an input sequence with forceresponses to create a database of ground truth data. Haptic rendering algorithms are thencompared by their simulated forces on input sequences taken from this database. Thethesis [Cao06] also aims at benchmarking haptic applications. It describes the design ofa simulation module, which is able to generate reproducible position input sequences tofeed into the haptic algorithm under analysis. Several input models are presented thatvary in the required user inputs, like path-based model (recorded space curve), function-based model (space curve defined by functional sections) and adaptive model (curves filledinbetween penetration points). The author shortly mentions an analysis module, which isintended for the visualization of the acquired data but details of the visualization are notavailable.
3 Data Acquisition for Debugging
For debugging, we need to know all device variables in the workspace: position xd(i) (orvelocity), and the device output force fd(i). Additionally, it is helpful to know the forcesemantics in the simulated environment. This force usually results from a distance to agoal position g(i) or a penetration depth with respect to a surface contact point (SCP) g(i)(Figure 3). All device variables occur as sequences over i ∈ N. In the following, we omitthe variable subscripts.
Depending on the computation time for the virtual environment simulation, the mea-surement {x(i), f(i), g(i)} occurs at a certain point in time t(i). The sampling timet(i) − t(i − 1), for i ∈ N, is about 1ms.
We store the measurements in a ring buffer of fixed size n, which contains all measure-ments in a certain time interval [ts = t(j), te = t(j + n)]. This storage organization isfixed size and fast enough so that a single measurement of size 10 doubles (3 for posi-tion, goal, force each and 1 for the corresponding time value) can be stored away withoutchanging the simulation timings significantly. Furthermore, note that the time interval isirregularly sampled, and the interval width te − ts can vary. This is the case because thesample times are given by the force simulation in the virtual environment. The compu-tation requires a varying time depending on query position and environment state. Thedevice then exerts the last force handed to the API at a rate of 1kHz in the feedback loop(zero-order hold semantics).
163
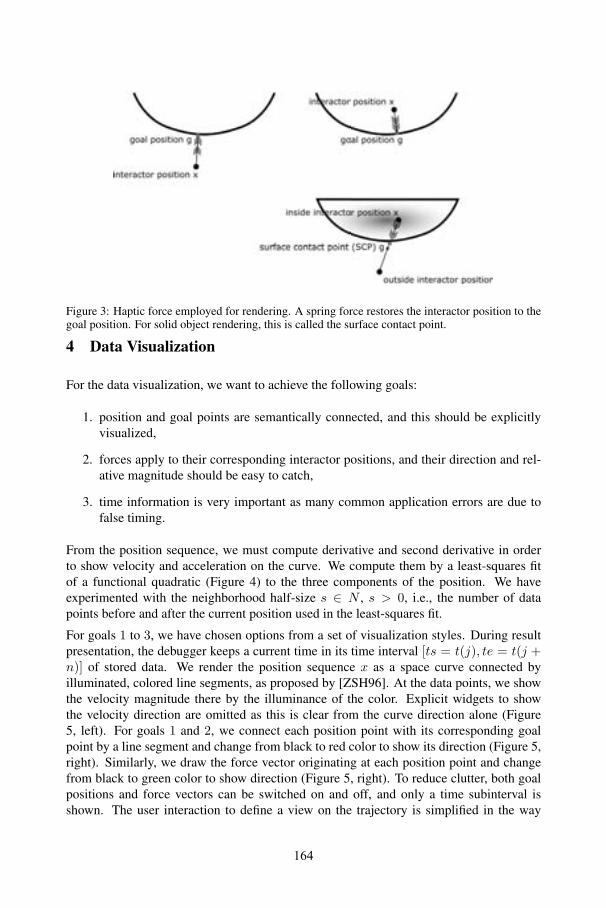
164
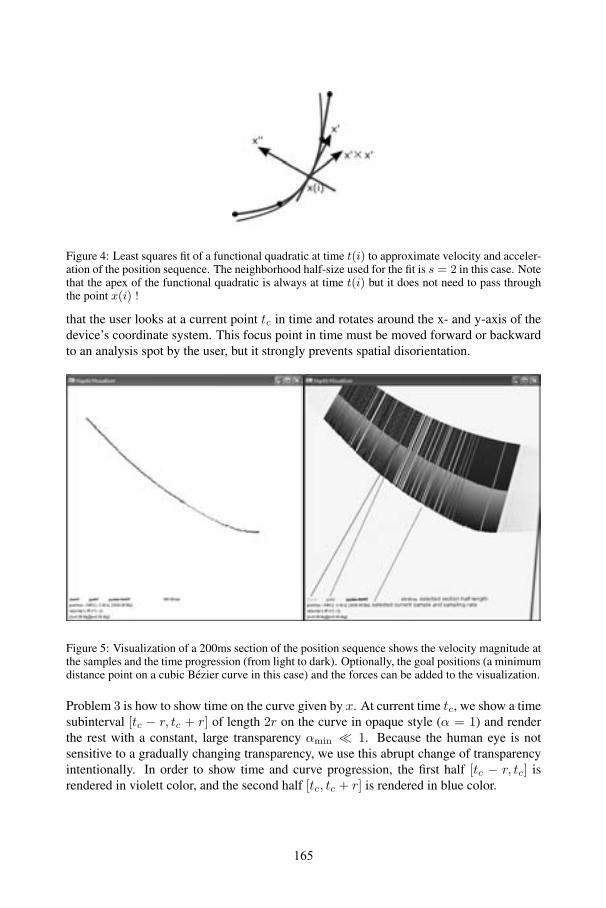
165
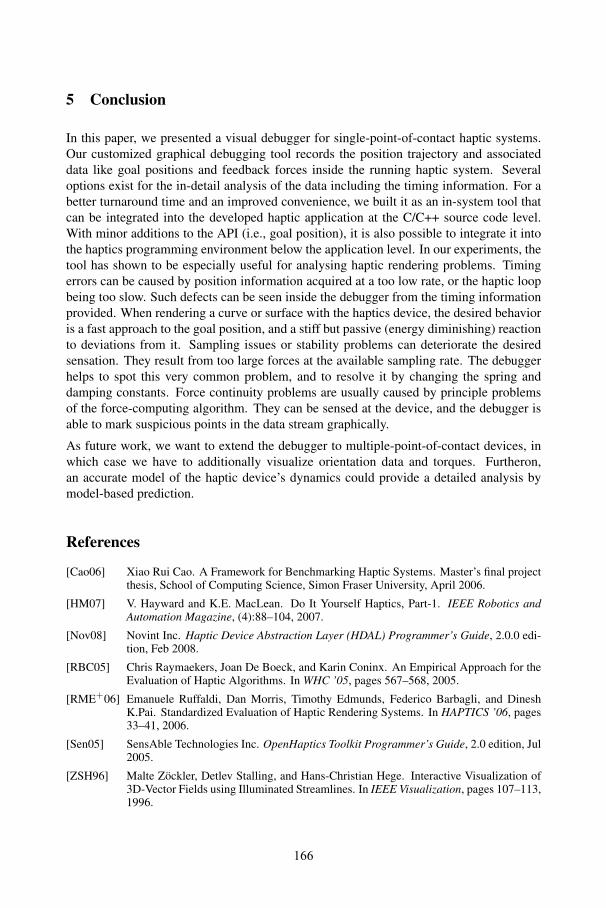
5 Conclusion
In this paper, we presented a visual debugger for single-point-of-contact haptic systems.Our customized graphical debugging tool records the position trajectory and associateddata like goal positions and feedback forces inside the running haptic system. Severaloptions exist for the in-detail analysis of the data including the timing information. For abetter turnaround time and an improved convenience, we built it as an in-system tool thatcan be integrated into the developed haptic application at the C/C++ source code level.With minor additions to the API (i.e., goal position), it is also possible to integrate it intothe haptics programming environment below the application level. In our experiments, thetool has shown to be especially useful for analysing haptic rendering problems. Timingerrors can be caused by position information acquired at a too low rate, or the haptic loopbeing too slow. Such defects can be seen inside the debugger from the timing informationprovided. When rendering a curve or surface with the haptics device, the desired behavioris a fast approach to the goal position, and a stiff but passive (energy diminishing) reactionto deviations from it. Sampling issues or stability problems can deteriorate the desiredsensation. They result from too large forces at the available sampling rate. The debuggerhelps to spot this very common problem, and to resolve it by changing the spring anddamping constants. Force continuity problems are usually caused by principle problemsof the force-computing algorithm. They can be sensed at the device, and the debugger isable to mark suspicious points in the data stream graphically.
As future work, we want to extend the debugger to multiple-point-of-contact devices, inwhich case we have to additionally visualize orientation data and torques. Furtheron,an accurate model of the haptic device’s dynamics could provide a detailed analysis bymodel-based prediction.
References
[Cao06] Xiao Rui Cao. A Framework for Benchmarking Haptic Systems. Master’s final projectthesis, School of Computing Science, Simon Fraser University, April 2006.
[HM07] V. Hayward and K.E. MacLean. Do It Yourself Haptics, Part-1. IEEE Robotics andAutomation Magazine, (4):88–104, 2007.
[Nov08] Novint Inc. Haptic Device Abstraction Layer (HDAL) Programmer’s Guide, 2.0.0 edi-tion, Feb 2008.
[RBC05] Chris Raymaekers, Joan De Boeck, and Karin Coninx. An Empirical Approach for theEvaluation of Haptic Algorithms. In WHC ’05, pages 567–568, 2005.
[RME+06] Emanuele Ruffaldi, Dan Morris, Timothy Edmunds, Federico Barbagli, and DineshK.Pai. Standardized Evaluation of Haptic Rendering Systems. In HAPTICS ’06, pages33–41, 2006.
[Sen05] SensAble Technologies Inc. OpenHaptics Toolkit Programmer’s Guide, 2.0 edition, Jul2005.
[ZSH96] Malte Zockler, Detlev Stalling, and Hans-Christian Hege. Interactive Visualization of3D-Vector Fields using Illuminated Streamlines. In IEEE Visualization, pages 107–113,1996.
166
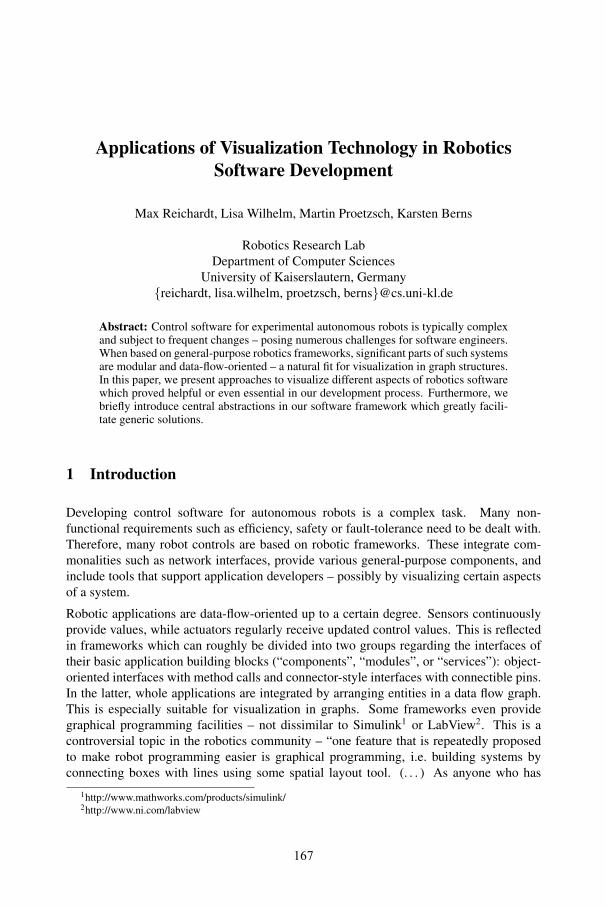
Applications of Visualization Technology in RoboticsSoftware Development
Max Reichardt, Lisa Wilhelm, Martin Proetzsch, Karsten Berns
Robotics Research LabDepartment of Computer Sciences
University of Kaiserslautern, Germany{reichardt, lisa.wilhelm, proetzsch, berns}@cs.uni-kl.de
Abstract: Control software for experimental autonomous robots is typically complexand subject to frequent changes – posing numerous challenges for software engineers.When based on general-purpose robotics frameworks, significant parts of such systemsare modular and data-flow-oriented – a natural fit for visualization in graph structures.In this paper, we present approaches to visualize different aspects of robotics softwarewhich proved helpful or even essential in our development process. Furthermore, webriefly introduce central abstractions in our software framework which greatly facili-tate generic solutions.
1 Introduction
Developing control software for autonomous robots is a complex task. Many non-functional requirements such as efficiency, safety or fault-tolerance need to be dealt with.Therefore, many robot controls are based on robotic frameworks. These integrate com-monalities such as network interfaces, provide various general-purpose components, andinclude tools that support application developers – possibly by visualizing certain aspectsof a system.
Robotic applications are data-flow-oriented up to a certain degree. Sensors continuouslyprovide values, while actuators regularly receive updated control values. This is reflectedin frameworks which can roughly be divided into two groups regarding the interfaces oftheir basic application building blocks (“components”, “modules”, or “services”): object-oriented interfaces with method calls and connector-style interfaces with connectible pins.In the latter, whole applications are integrated by arranging entities in a data flow graph.This is especially suitable for visualization in graphs. Some frameworks even providegraphical programming facilities – not dissimilar to Simulink1 or LabView2. This is acontroversial topic in the robotics community – “one feature that is repeatedly proposedto make robot programming easier is graphical programming, i.e. building systems byconnecting boxes with lines using some spatial layout tool. (. . . ) As anyone who has
1http://www.mathworks.com/products/simulink/2http://www.ni.com/labview
167
used Simulink knows, complex programs quickly lead to cluttered screens and so lots oftime is spent arranging objects spatially: an arrangement that has no meaning at all for thecode” [VG07].
The next chapter deals with software visualization in popular frameworks. Then, relevantabstractions in MCA, which we use for development, are introduced briefly – followed bya coverage of some of our recent projects which have proven helpful in developing andimproving our software. Graphically rich tools for simulation or sensor data visualizationare not covered, since they are not directly related to software engineering problems. Nev-ertheless, they are essential for the development process as well – particularly with respectto testing.
2 Visualization in Popular Robotic Frameworks
Numerous frameworks have been developed in the past. In fact, “It is only a small over-statement to say that almost every lab has brewed its own solution for robot control ar-chitecture, middleware and software integration concepts” [SP07]. This overview con-centrates a few well-known frameworks. While most frameworks provide facilities fordata visualization, robot operation, and simulators – visualization support directly target-ing software engineering problems is less common. There are, however, many worthwilepossibilities – some of which are discussed in the next chapters.
A major target of Microsoft’s Robotics Developer Studio was making development ofrobotic applications simpler. Part of this effort is the Microsoft Visual Programming Lan-guage (VPL). It allows creating robotic applications graphically by instantiating buildingblocks and connecting their inputs and outputs. Explicitly targeting “non-programmers”,however, this language is hardly used in professional robotic projects to our knowledge.
The Player Project [GVS+01] is arguably the most well-known open source roboticstoolkit. Minimalism and simplicity being major design goals, it provides interfaces to awide range of robotics hardware without making prescriptions for the robotic applicationsactually using them. Naturally, it cannot provide tools for visualizing these applications.
The open source robotics framework Orca [BKM+07] is an attempt to bring Component-Based Software Engineering to the robotics domain. It includes some tools for manage-ment of components, interaction with robots, and visualization of components’ internalstate. OrcaView2D is the most interesting regarding the latter – allowing any componentto render information to a two-dimensional map view using a generic interface.
FlowDesigner3 is a visual open source programming tool with similarities to Simulinkand LabView. The RobotFlow4 plugin is an attempt to utilize it for robotics software.It is closely related to the MARIE framework [CLR07] – a major attempt to integratecomponents from different frameworks. However, the latest release is from 2005.
3http://apps.sourceforge.net/mediawiki/flowdesigner/4http://robotflow.sourceforge.net/
168
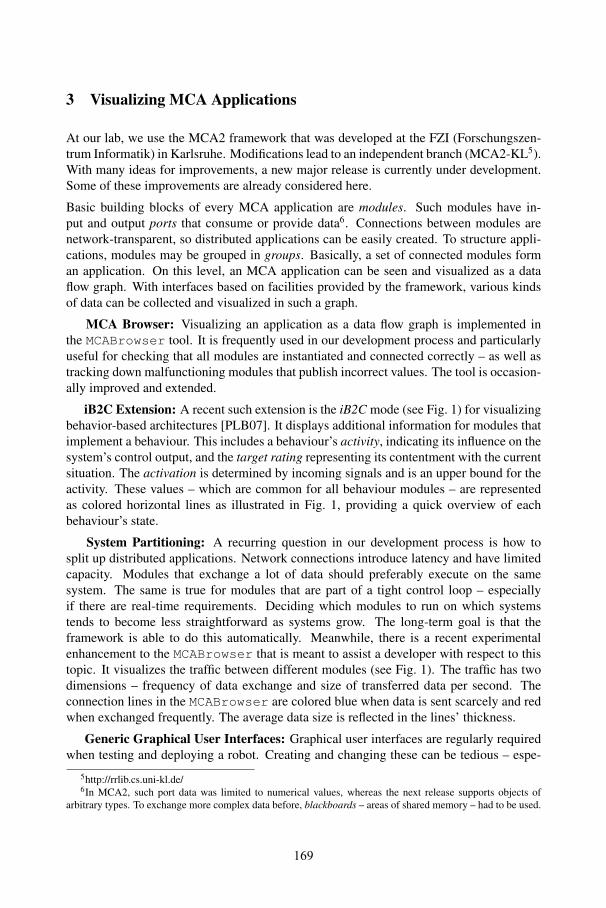
3 Visualizing MCA Applications
At our lab, we use the MCA2 framework that was developed at the FZI (Forschungszen-trum Informatik) in Karlsruhe. Modifications lead to an independent branch (MCA2-KL5).With many ideas for improvements, a new major release is currently under development.Some of these improvements are already considered here.
Basic building blocks of every MCA application are modules. Such modules have in-put and output ports that consume or provide data6. Connections between modules arenetwork-transparent, so distributed applications can be easily created. To structure appli-cations, modules may be grouped in groups. Basically, a set of connected modules forman application. On this level, an MCA application can be seen and visualized as a dataflow graph. With interfaces based on facilities provided by the framework, various kindsof data can be collected and visualized in such a graph.
MCA Browser: Visualizing an application as a data flow graph is implemented inthe MCABrowser tool. It is frequently used in our development process and particularlyuseful for checking that all modules are instantiated and connected correctly – as well astracking down malfunctioning modules that publish incorrect values. The tool is occasion-ally improved and extended.
iB2C Extension: A recent such extension is the iB2C mode (see Fig. 1) for visualizingbehavior-based architectures [PLB07]. It displays additional information for modules thatimplement a behaviour. This includes a behaviour’s activity, indicating its influence on thesystem’s control output, and the target rating representing its contentment with the currentsituation. The activation is determined by incoming signals and is an upper bound for theactivity. These values – which are common for all behaviour modules – are representedas colored horizontal lines as illustrated in Fig. 1, providing a quick overview of eachbehaviour’s state.
System Partitioning: A recurring question in our development process is how tosplit up distributed applications. Network connections introduce latency and have limitedcapacity. Modules that exchange a lot of data should preferably execute on the samesystem. The same is true for modules that are part of a tight control loop – especiallyif there are real-time requirements. Deciding which modules to run on which systemstends to become less straightforward as systems grow. The long-term goal is that theframework is able to do this automatically. Meanwhile, there is a recent experimentalenhancement to the MCABrowser that is meant to assist a developer with respect to thistopic. It visualizes the traffic between different modules (see Fig. 1). The traffic has twodimensions – frequency of data exchange and size of transferred data per second. Theconnection lines in the MCABrowser are colored blue when data is sent scarcely and redwhen exchanged frequently. The average data size is reflected in the lines’ thickness.
Generic Graphical User Interfaces: Graphical user interfaces are regularly requiredwhen testing and deploying a robot. Creating and changing these can be tedious – espe-
5http://rrlib.cs.uni-kl.de/6In MCA2, such port data was limited to numerical values, whereas the next release supports objects of
arbitrary types. To exchange more complex data before, blackboards – areas of shared memory – had to be used.
169
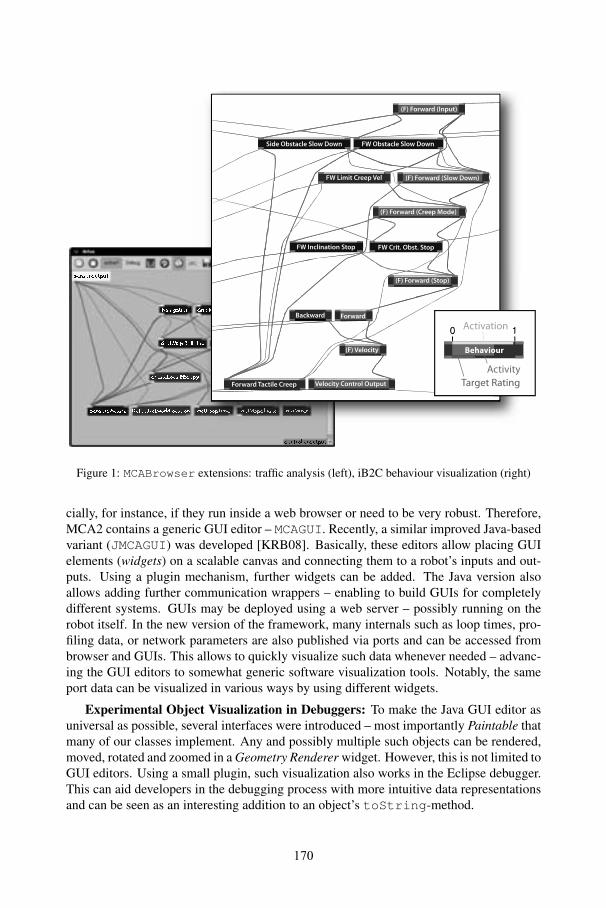
170
171
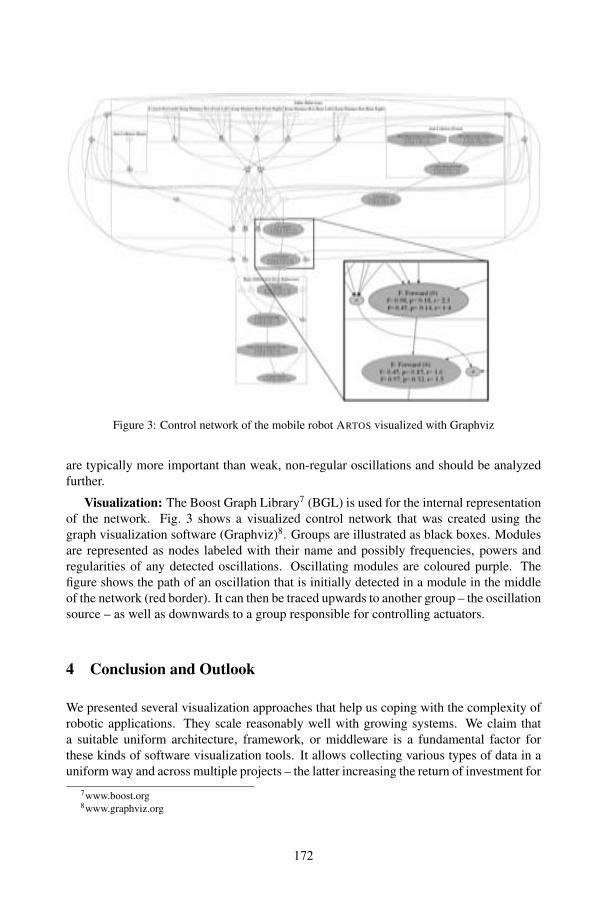
Figure 3: Control network of the mobile robot ARTOS visualized with Graphviz
are typically more important than weak, non-regular oscillations and should be analyzedfurther.
Visualization: The Boost Graph Library7 (BGL) is used for the internal representationof the network. Fig. 3 shows a visualized control network that was created using thegraph visualization software (Graphviz)8. Groups are illustrated as black boxes. Modulesare represented as nodes labeled with their name and possibly frequencies, powers andregularities of any detected oscillations. Oscillating modules are coloured purple. Thefigure shows the path of an oscillation that is initially detected in a module in the middleof the network (red border). It can then be traced upwards to another group – the oscillationsource – as well as downwards to a group responsible for controlling actuators.
4 Conclusion and Outlook
We presented several visualization approaches that help us coping with the complexity ofrobotic applications. They scale reasonably well with growing systems. We claim thata suitable uniform architecture, framework, or middleware is a fundamental factor forthese kinds of software visualization tools. It allows collecting various types of data in auniform way and across multiple projects – the latter increasing the return of investment for
7www.boost.org8www.graphviz.org
172
developing such tools. There are certainly many more interesting areas for visualizationsuch as, for instance, profiling – e.g. illustrating how much processing power modulesconsume and how much latency they introduce. In a current project, we plan improvingour tools in cooperation with our university’s computer graphics group. Early ideas includeovercoming group boundaries in the MCABrowser tool, as well as making it simpler toadd further visualization extensions.
References
[BKM+07] A. Brooks, T. Kaupp, A. Makarenko, S. Williams, and A. Oreback. Orca: A ComponentModel and Repository. In Brugali [Bru07].
[Bru07] D. Brugali, editor. Software Engineering for Experimental Robotics, volume 30 ofSpringer Tracts in Advanced Robotics. Springer - Verlag, Berlin / Heidelberg, April2007.
[CLR07] C. Cote, D. Letourneau, and C. Ra. Using MARIE for Mobile Robot Component De-velopment and Integration. In Brugali [Bru07].
[GVS+01] B. Gerkey, R. Vaughan, K. Sty, A. Howard, G. Sukhatme, and M. Mataric. Most valu-able player: A robot device server for distributed control. In Proc. of the IEEE/RSJInternatinal Conference on Intelligent Robots and Systems (IROS), pages 1226–1231,Wailea, Hawaii, October 2001.
[KCD+04] V. Kariwala, M. Choudhury, H. Douke, S. Shah, H. Takada, J. Forbes, and E. Meadows.Detection and Diagnosis of Plant-Wide Oscillations: An Application Study, 2004.
[Kna07] C. Knapwost. Forward und Reverse Engineering in der Robotik. Diploma thesis,Robotics Research Lab - University of Kaiserslautern, Mai 20 2007. unpublished.
[KRB08] J. Koch, M. Reichardt, and K. Berns. Universal Web Interfaces for Robot ControlFrameworks. In IEEE/RSJ International Conference on Intelligent Robots and Systems(IROS), Nice, France, September 22-26 2008.
[OT06] P.F. Odgaard and K. Trangbaek. Comparison of Methods for Oscillation Detection -Case Study on a Coal-Fired Power Plant. In Proceedings of IFAC Symposium on PowerPlants and Power Systems Control 2006, 2006.
[PLB07] M. Proetzsch, T. Luksch, and K. Berns. The Behaviour-Based Control ArchitectureiB2C for Complex Robotic Systems. In 30th Annual German Conference on ArtificialIntelligence (KI), pages 494–497, Osnabruck, Germany, September 10-13 2007.
[SP07] A. Shakhimardanov and E. Prassler. Comparative Evaluation of Robotic Software In-tegration Systems: A Case Study. In IEEE/RSJ International Conference on IntelligentRobots and Systems (IROS 2007), San Diego, CA, USA, October 29-November 2 2007.
[THZ03] N.F. Thornhill, B. Huang, and H. Zhang. Detection of Multiple Oscillations in ControlLoops. Journal of Process Control, 13:91–100, 2003.
[VG07] R. Vaughan and B. Gerkey. Reusable Robot Software and the Player/Stage Project. InBrugali [Bru07].
[Wil08] L. Wilhelm. Oscillation Detection in Behaviour-Based Robot Architectures. Diplomathesis, University of Kaiserslautern, November 2008. unpublished.
173

Network Situational Awareness: A Representative Study
Thomas Eskridge, David Lecoutre, Matt Johnson, Jeffrey M. Bradshaw
Florida Institute for Human and Machine Cognition (IHMC)
40 S. Alcaniz St., Pensacola, FL 32502
{teskridge,dlecoutre,mjohnson,jbradshaw}@ihmc.us
Abstract: Recent developments in visualization techniques for network
monitoring and analysis have advanced dramatically over the simple topological
graphs and color-coded textual representations found in early systems. These
developments are employed in network visualization systems that attempt to
present a complete and coherent view of the traffic on a network and the possible
security events that may occur. In this paper we describe several representative
integrated network visualization systems and discuss the network status and
security questions they answer. We then describe an organizational approach to
categorizing visualization systems and provide examples of each. We discuss the
strengths and weaknesses of each approach and conclude with a proposal for twodirections for next-generation systems.
1 Introduction
Threats against computer networks have never been greater, nor have they had a greater
impact on the use of computer and network resources [Ce09]. The sophistication of
network attacks has also been steadily increasing. First generation attacks propagated
uniquely-named executables that could be easily stopped once discovered. Newer attacks
use random names and execution patterns to throw off signature-based Intrusion
Detection Systems (IDS). Similarly, Denial of Service (DoS) attacks have increased in
sophistication from single computer attacks to distributed mobile attacks.
Foreseeing the prospect of even more clever variants on such attacks in the future,
computer network defense (CND) analysts require tools that permit the rogue processes
to be discovered, identified and remediated. The continual rapid evolution of attack
strategies means that IDSs will never be able to provide complete protection against
every form of attack, with the consequence that false alarms and multiple incident
reports will never completely go away and, in fact, are likely to increase. Even today, the
amount of data generated by IDSs is often overwhelming [Co06]. The goal of
visualization for CND is to provide an interactive interface which will allows the analyst
to acquire and maintain a high level of situational awareness to react more quickly and
efficiently to attacks.
Experienced CND analysts, and people in general, are adept at discovering patterns and
at noticing deviations from the norm. Because of the deep understanding of their own
network and network interfaces, analysts can infer that there is “something wrong” with
175
the network by observing key changes in measures of network properties. One such
property is the rate of bandwidth usage for a given time of day. For instance, while a
high bandwidth usage may be typical first thing in the morning when employees are
arriving at work, it might be suspicious at times when only a few users are at work. By
using experience as a guide, the analyst can rapidly diagnose anomalies and be better
able to analyze and interpret the results of IDS and other network monitoring tools to
identify and neutralize threats.
This paper presents a discussion of three main approaches to network situational
awareness and gives examples of implemented systems for each approach. The strengths
and weaknesses of each approach are identified.
2 Human-Centered Design
Computer network defense analysts continually strive to maintain a high level of
situational awareness. Graphic visualization of network status and intrusion events is one
way that CND analysts can stay ahead of threats. Visualization allows analysts to detect
new intrusions, identify anomalous events, and to begin to predict where new threats
may occur. By identifying the SA goals held by analysts and the tasks they perform to
acquire and maintain SA, a better understanding of the necessities and requirements for
CND visualization can be found.
Embracing a human-centered design agenda [Fla97; Hof00], Chen takes an information-
theoretic view of visual analytical problems such as NSA and CND and divides the
process into information foraging and sense-making [Che08]. Information foraging is a
predictive model of search behavior that assumes that the environment is composed of
connected islands of information, and that people strive to maximize the amount of
relevant information found by modifying their search strategies that traverse and
assimilate these islands. Sense-making involves developing numerical models or
graphical displays that express properties and relationships in the data. For CND
analysts, information foraging and sense-making form a continuous cycle of
investigating suspicious connections and interpreting their relationships to the internal
network.
D’Amico, et al. use cognitive task analysis to identify the mental processes and tasks
performed by analysts when identifying and remediating network intrusions [DAm06].
To complete their analysis, they studied more than forty network security analysts to
determine what they do, what information they need, and how they go about mediating
network threats. They identified several aspects of the mediation process the analysts
work through. These aspects include information foraging tasks, such as identifying and
quantifying the threat, and correlating indicators and other network data to form patterns
and trends. They also identified sense-making tasks such as attacker profiling, and
response formulation and execution.
The adoption of visualization tools has been hampered by the immense amount of data
to be processes, the short response times required, and the difficulty of making
176

visualization part of the standard operating procedures. D’Amico, et al. found that many
visualization tools were not useful to professional analysts because they did not fit the
workflow, could not handle the data volume, did not interface well with other systems,
or were too difficult to learn to use [DAm06].
3 Approaches to Network Visualization
The issues facing CND analysts are significant. There are large amounts of data whose
meaning can only be determined in the context of the specifics of the monitored
network. There are a large number of known patterns of intrusions, but there are also a
larger number of unknown or yet to be discovered patterns of intrusions that must be
made detectable. Finally, the intrusions themselves vary in criticality with respect to the
context in which the intrusion appears. The visualization systems discussed in this paper
each attempt to use visual presentation as a means of mitigating these issues.
While the visual display and user interaction techniques are different for each class of
visualization systems discussed, it is useful to understand how the methodological
approach of the class determines the context in which the system will be effective. While
no one approach has been shown to be superior to all others, lessons can be learned from
each methodological approach, allowing promising new areas of investigation to be
identified.
The Direct Approach. One methodology is to show what is happening as it is
happening in a direct one-to-one relationship between the physical networking
components and computers to the visualized elements. This approach yields systems that
are intuitive to use and understand and operate in real-time or near-real-time. They
generally take low-level data directly from packet or IDS logs and display it without
abstracting either visualized elements or input data.
VIAssist [DAi06] and VisFlowConnect [Yi04] are examples of the direct approach to
network visualization. The graph-based approach of VIAssist (Fig 1a) is a direct one-to-
one mapping from the physical network to the graphical network, and shows traffic with
connecting line color/thickness/style that clear and easily understandable.
VisFlowConnect uses a parallel coordinates construction to represent the netflow data.
Fig. 1b shows external senders on the left, internal hosts in the center, and external
receivers on the right. This technique facilitates easy recognition of intrusions such as
port scans and distributed denial of service attacks.
While the lack of abstraction makes direct approach interfaces easy to read (at least in
low-volume, small network situations), it also places a large burden on the operator to
notice the patterns indicative of intrusions. To this end, large or multiple screens can be
used very effectively for this class of systems. However, even with large or multiple
screens, as the volume of traffic increases the visual clutter also increases. Clutter from
overlapping connection lines can increase to the point where important information
needed by the analyst to recognize the patterns indicative of intrusions may be obscured.
177
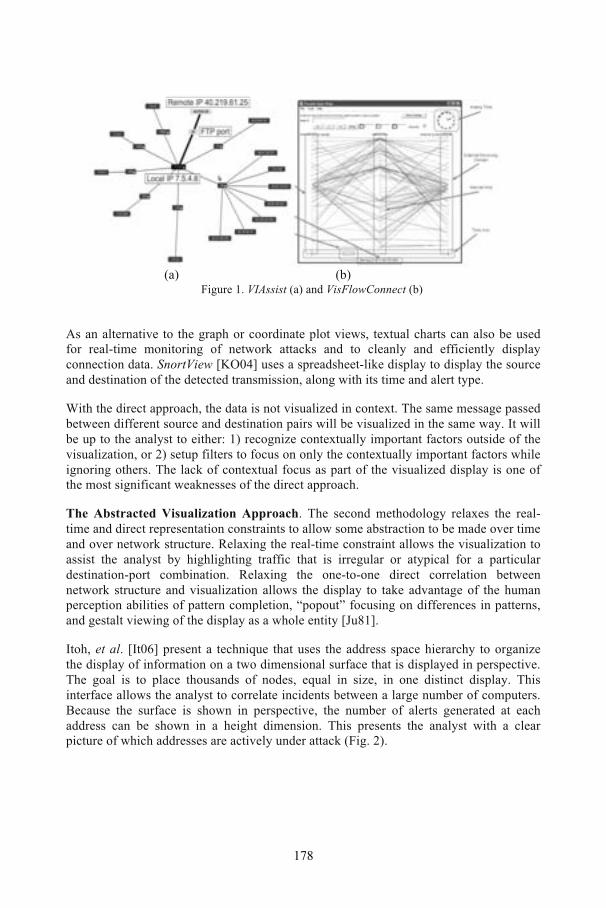
As an alternative to the graph or coordinate plot views, textual charts can also be used
for real-time monitoring of network attacks and to cleanly and efficiently display
connection data. SnortView [KO04] uses a spreadsheet-like display to display the source
and destination of the detected transmission, along with its time and alert type.
With the direct approach, the data is not visualized in context. The same message passed
between different source and destination pairs will be visualized in the same way. It will
be up to the analyst to either: 1) recognize contextually important factors outside of the
visualization, or 2) setup filters to focus on only the contextually important factors while
ignoring others. The lack of contextual focus as part of the visualized display is one of
the most significant weaknesses of the direct approach.
The Abstracted Visualization Approach. The second methodology relaxes the real-
time and direct representation constraints to allow some abstraction to be made over time
and over network structure. Relaxing the real-time constraint allows the visualization to
assist the analyst by highlighting traffic that is irregular or atypical for a particular
destination-port combination. Relaxing the one-to-one direct correlation between
network structure and visualization allows the display to take advantage of the human
perception abilities of pattern completion, “popout” focusing on differences in patterns,
and gestalt viewing of the display as a whole entity [Ju81].
Itoh, et al. [It06] present a technique that uses the address space hierarchy to organize
the display of information on a two dimensional surface that is displayed in perspective.
The goal is to place thousands of nodes, equal in size, in one distinct display. This
interface allows the analyst to correlate incidents between a large number of computers.
Because the surface is shown in perspective, the number of alerts generated at each
address can be shown in a height dimension. This presents the analyst with a clear
picture of which addresses are actively under attack (Fig. 2).
(a) (b)Figure 1. VIAssist (a) and VisFlowConnect (b)
178
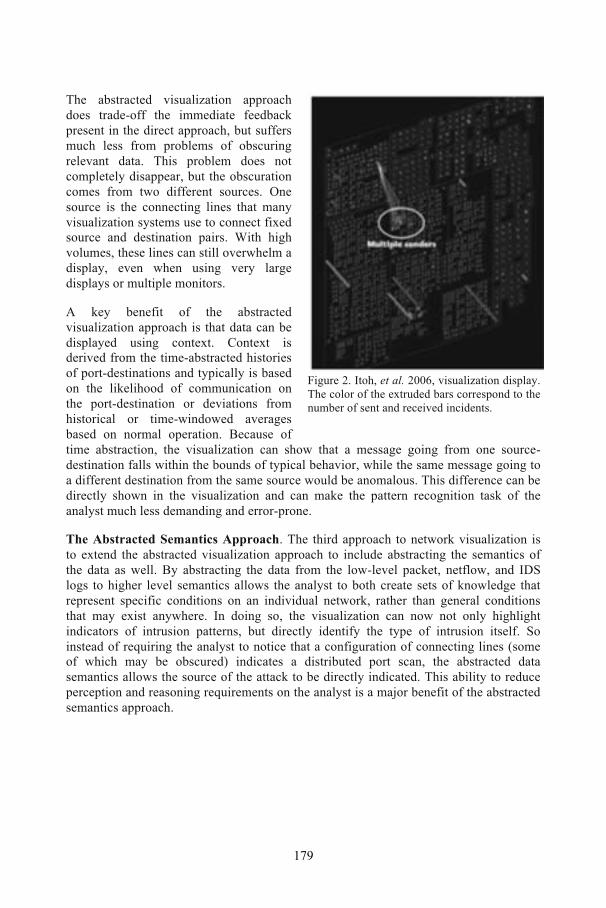
The abstracted visualization approach
does trade-off the immediate feedback
present in the direct approach, but suffers
much less from problems of obscuring
relevant data. This problem does not
completely disappear, but the obscuration
comes from two different sources. One
source is the connecting lines that many
visualization systems use to connect fixed
source and destination pairs. With high
volumes, these lines can still overwhelm a
display, even when using very large
displays or multiple monitors.
A key benefit of the abstracted
visualization approach is that data can be
displayed using context. Context is
derived from the time-abstracted histories
of port-destinations and typically is based
on the likelihood of communication on
the port-destination or deviations from
historical or time-windowed averages
based on normal operation. Because of
time abstraction, the visualization can show that a message going from one source-
destination falls within the bounds of typical behavior, while the same message going to
a different destination from the same source would be anomalous. This difference can be
directly shown in the visualization and can make the pattern recognition task of the
analyst much less demanding and error-prone.
The Abstracted Semantics Approach. The third approach to network visualization is
to extend the abstracted visualization approach to include abstracting the semantics of
the data as well. By abstracting the data from the low-level packet, netflow, and IDS
logs to higher level semantics allows the analyst to both create sets of knowledge that
represent specific conditions on an individual network, rather than general conditions
that may exist anywhere. In doing so, the visualization can now not only highlight
indicators of intrusion patterns, but directly identify the type of intrusion itself. So
instead of requiring the analyst to notice that a configuration of connecting lines (some
of which may be obscured) indicates a distributed port scan, the abstracted data
semantics allows the source of the attack to be directly indicated. This ability to reduce
perception and reasoning requirements on the analyst is a major benefit of the abstracted
semantics approach.
Figure 2. Itoh, et al. 2006, visualization display.
The color of the extruded bars correspond to the
number of sent and received incidents.
179
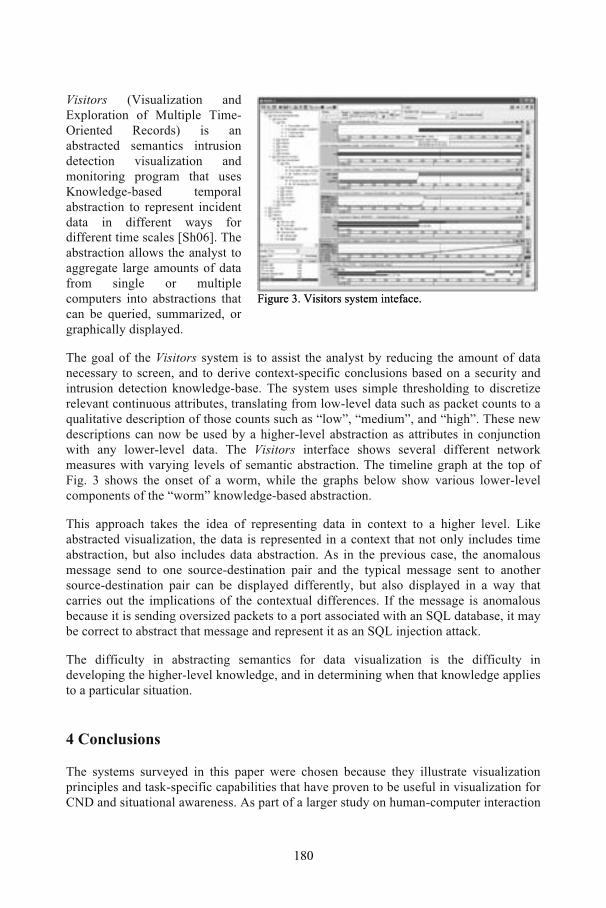
Visitors (Visualization and
Exploration of Multiple Time-
Oriented Records) is an
abstracted semantics intrusion
detection visualization and
monitoring program that uses
Knowledge-based temporal
abstraction to represent incident
data in different ways for
different time scales [Sh06]. The
abstraction allows the analyst to
aggregate large amounts of data
from single or multiple
computers into abstractions that
can be queried, summarized, or
graphically displayed.
The goal of the Visitors system is to assist the analyst by reducing the amount of data
necessary to screen, and to derive context-specific conclusions based on a security and
intrusion detection knowledge-base. The system uses simple thresholding to discretize
relevant continuous attributes, translating from low-level data such as packet counts to a
qualitative description of those counts such as “low”, “medium”, and “high”. These new
descriptions can now be used by a higher-level abstraction as attributes in conjunction
with any lower-level data. The Visitors interface shows several different network
measures with varying levels of semantic abstraction. The timeline graph at the top of
Fig. 3 shows the onset of a worm, while the graphs below show various lower-level
components of the “worm” knowledge-based abstraction.
This approach takes the idea of representing data in context to a higher level. Like
abstracted visualization, the data is represented in a context that not only includes time
abstraction, but also includes data abstraction. As in the previous case, the anomalous
message send to one source-destination pair and the typical message sent to another
source-destination pair can be displayed differently, but also displayed in a way that
carries out the implications of the contextual differences. If the message is anomalous
because it is sending oversized packets to a port associated with an SQL database, it may
be correct to abstract that message and represent it as an SQL injection attack.
The difficulty in abstracting semantics for data visualization is the difficulty in
developing the higher-level knowledge, and in determining when that knowledge applies
to a particular situation.
4 Conclusions
The systems surveyed in this paper were chosen because they illustrate visualization
principles and task-specific capabilities that have proven to be useful in visualization for
CND and situational awareness. As part of a larger study on human-computer interaction
Figure 3. Visitors system inteface.Figure 3. Visitors system inteface.
180
and network situational awareness, this lays the groundwork necessary to begin to
understand the current state-of-the-art in network visualization and the directions future
implementations may go.
Attempting to project beyond the trend established by the direct, abstracted visualization,
and abstracted semantics approaches yields several interesting possible next steps. One
approach is to improve the communicative qualities of the display itself. There are new
developments in using large displays that show a significant advantage over smaller,
conventional displays when the task is to discover hidden relations amongst data [Cz03;
Cz06]. Similarly, the style in which the data is presented can have a significant impact
on operator performance [Ju81; Be91; Th96; ST03].
Another approach is to leverage abstracted semantics to include reasoning and
delegation support for network visualization and management. Having identifiable
intrusions enables standard procedures to be carried out in response. Enabling delegation
of these standard procedures will enable the analyst to handle more intrusions more
efficiently. These procedures could include the delegation of the specification and
construction of visualizations to isolate intruder actions, or spawn process to collect data
related to the identity of the network threats. They could also perform interdictory
actions to prevent the intrusion from propagating further or wasting more network
resources.
Key questions to be answered by the delegation approach include: 1) how will the user
interact with the user interface and interaction elements to allow for the direction and
monitoring of delegated tasks? 2) How will the contextual conditions that trigger the
execution of an automatically-delegated task be specified and operated? and 3) Can the
conditions under which delegated tasks succeed or fail be used to learn new contextual
conditions for task application? Both directions for extending the current classes of
visualization systems show significant potential for increasing the efficiency and
effectiveness of network analysts. As there seems to be no slowdown in the releases of
new viruses, or in the rate of directed attacks against most organization’s networks,
progress in any or all of the approaches will be welcomed.
Ultimately, a successful future approach will need to go beyond the problem of
visualization itself. To be able to accommodate the preferences of individual analysts
and the idiosyncracies of differing contexts and situations, such displays must be highly
configurable through policy [Bra04a] and, where appropriate, should learn and adapt as
occasion requires [Jo05]. Moreover, future approaches will also benefit from advances in
agent technologies that can proactively assist analysts and remove some of the more
tedious aspects of their tasks [Bra04b].
Bibliography
[Be91] Bergen, J. R.: Theories of visual texture perception. Spatial Vision Vol 10: Vision and
Vision Dysfunction. D. Regan. Boca Raton, FL, CRC Press, 1991
181
[Bra04a] Bradshaw, J. M.; Beautement, P.; et al.: Making agents acceptable to people. In
Intelligent Technologies for Information Analysis: Advances in Agents, Data Mining,
and Statistical Learning, edited by N. Zhong and J. Liu, 361-400. Berlin: Springer
Verlag, 2004.
[Bra04b] Bradshaw, J. M.; Feltovich, P.; et al.: Dimensions of adjustable autonomy and mixed-
initiative interaction. In Agents and Computational Autonomy: Potential, Risks, and
Solutions. Lecture Notes in Computer Science, Vol. 2969, edited by Matthias Nickles,
Michael Rovatsos and Gerhard Weiss, 17-39. Berlin, Germany: Springer-Verlag, 2004.
[Ce09] CERT-CC: CERT Full Statistics. Retrieved Jan 26, 2009, from
http://www.cert.org/stats/full-stats.html#hist-year.
[Che08] Chen, C.: An Information-Theoretic View of Visual Analytics. IEEE Computer
Graphics and Applications 28(1), 2008: p. 18-23.
[Co06] Conti, G.; Abdullah, k.; et al.: Countering security information overload through alert
and packet visualization. Computer Graphics and Applications, IEEE 26(2), 2006,60-70.
[Cz06] Czerwinski, M.; Robertson, G.; et al: Large display research overview CHI '06 extended
abstracts on Human factors in computing systems. Montreal, Quebec, Canada ACM,
2006: p. 69-74.
[Cz03] Czerwinski, M.; Smith, G.; et al.: Toward Characterizing the Productivity Benefits of
Very Large Displays. Proceedings of IFIP INTERACT03: Human-Computer
Interaction, 2003: p. 9-16.
[DAm06]D'Amico, A. D.; Goodall, J.R.; et al.: Visual Discovery in Computer Network Defense.
Computer Graphics and Applications, IEEE 26(2), 2006: p. 20-27.
[Fla97] Flanagan, J. L.; Huang, T. S.; et al.: Final Report of the National Science Foundation
Workshop on Human-Centered Systems: Information, Interactively, and Intelligence
(HCS). Beckman Institute for Advanced Science and Technology, University of Illinois
at Urbana-Champaign, 1997.
[Hoff00] Hoffman, R. R.; Ford, K. M.; et al.: The Handbook of Human-Centered Computing.
Report, Institute for Human and Machine Cognition, University of West Florida,
Pensacola FL, 2000.
[It06] Itoh, T.; Takakura, H.; et al.: Hierarchical visualization of network intrusion detection
data. Computer Graphics and Applications, IEEE 26(2), 2006: p. 40-7.
[Jo05] Johnson, M.J.; Kulkarni, S.P.; et al.: AMI: An Adaptive Multi-Agent Framework for
Augmented Cognition. In the Proceedings of the 1st International Conference on
Augmented Cognition. Mahwah, NJ: Lawrence Erlbaum Associates, 2005.
[Ju81] Julesz, B.: Figure and ground perception in briefly presented isodipole textures.
Perceptual Organization. M. Kubovy and J. Pomerantz. Hillsdale, NJ, Erlbaum, 1981:
27-54.
[KO04] Koike, H.; Ohno, K.: SnortView: visualization system of snort logs. Proceedings of the
2004 ACM workshop on Visualization and data mining for computer security.
Washington DC, USA, ACM, 2004.
[Sh06] Shabtai, A.; et al.: An intelligent, interactive tool for exploration and visualization of
time-oriented security data. Proceedings of the 3rd international workshop on
Visualization for computer security. Alexandria, Virginia, USA, ACM, 2006.
[ST03] Still, D. L.; L. A. Temme: OZ: A human-centered computing cockpit display.
Interservice/Industry Training, Simulation & Education Conference (I/ITSEC). Orlando,
FL, 2003.
[Th96] Thibos, L. N.; D. L. Still; et al.: Characterization of spatial aliasing and contrast
sensitivity in peripheral vision. Vision Research 36, 1996: p.249-258.
[Yi04] Yin, X.; Yurcik, W.; et al.: VisFlowConnect: netflow visualizations of link relationships
for security situational awareness. Proceedings of the 2004 ACM workshop on
Visualization and data mining for computer security. Washington DC, USA, ACM,
2004.
182
User Centered Design Patterns for Visualization
Gerrit van der Veer, Elbert-Jan Hennipman, Evert-Jan Oppelaar
School of Computer ScienceOpen University Netherlands
Valkenburgerweg 1776419 AT Heerlen
{gvv,ehn,ejo}@ou.nl
Abstract: Displays are increasingly being provided for use by non-IT experts,based on requests from (non-expert) clients of design. Designers of screen contentand layout should be able to apply existing Visual Design knowledge. Mostengineers and designers, however, are no specialist in Human-ComputerInteraction. We aim at making this knowledge readily available for engineers whoare responsible for designing screens. We provide an overview of knowledgeavailable, and show our attempts to make this usable for engineers.
1 Screen Design is not Just About Pixels
Information Technology (IT) has been using displays for over 40 years. The variation inscreen sizes is still growing. Screens are designed for clients of design (industries as wellas buyers of products) who intend their products to be used by people. Screens are beingused by people to see, understand, and experience things. Today’s screen users are nolonger IT specialists. Consequently, screen design should be based on insight in howvisual presentations interact with human perception, understanding, decisions, andactions.
Engineers design (1) the screens, and most of the time engineers design (2) the waycontent data will be displayed. Both design efforts require attention to the prospectiveusers of the screen. However, engineers who have to design the graphical user interfaceoften lack sufficient education in Human-Computer Interaction (HCI) or Visual Design(VD) to optimally serve the user, especially in small and medium sized enterprises.
This paper is about knowledge of how information could / should be displayed. Thepaper shows our ongoing research in developing support for engineers. We aim atenabling them to make optimal use of design knowledge from HCI and VD. In fact thisknowledge is available, (1) in the format of user interface design patterns (e.g., [We09],[Ti08]); (2) in publications from the design community (e.g., [LH03]); and (3) in (web-based) accounts of ongoing research (e.g., [OR09]).
183
Especially the first two types of sources are mostly collecting, combining, andstructuring “second hand” knowledge, built from multiple instances of successfulpractice more than from theory, even if the sources we point to add theory basedexplanation “after the facts”. All three types of sources are in constant development andexpansion. The good news is that most of this knowledge is in fact available through theinternet.
In section 2 we will point to HCI design pattern collections and provide an overview ofthe most relevant patterns for VD. Section 3 shows an example of VD knowledge from astate of the art Design book. Section 4 illustrates what VD knowledge can be derivedfrom ongoing research that is public available. All three types of knowledge are in acontinuing state of expansion and development. Consequently, these reviews are nothingmore than a dated sample. Section 5 gives an account of a first attempt to provide thistype of knowledge to engineers and to assess our approach. Section 6 concludes with ourcurrent ideas to improve the way engineers can use this knowledge.
2 HCI Design Patterns for Visual Design
Design patterns, originally developed for Architecture by Alexander [Ax77], but soonadopted by Software Engineering [GH95], are a common source of proven solutions fordesigners’ problems, and, as such, are readily understandable and applicable. HCI designpatterns, on the other hand, are a relatively new type of knowledge source, developed byHCI experts (e.g., [WV00], [TI08]), and intended to be readily applicable by engineers.The main difference with Software Engineering patterns is the focus: HCI patterns aimat solving the users’ problems. Contrary to the goal of HCI design patterns, [SJ02] foundthat software developers “experience difficulty when attempting to understand, masterand apply a specific pattern in their context”. [SJ06]) indicated usability problems whenpattern collections were used by engineers as well. Our research project has the flavor ofdiscount usability, but the effect will be different from the approach of Nielsen [Ni94].Where his approach takes care of saving costs of different usability evaluation steps, ourapproach is to improve the early stage of the design process, by supporting the designdecisions of non-experts in usability design.
Our initial collection of VD knowledge (containing 29 patterns) is derived from two wellknown HCI design pattern collections [We09] and [Ti08]. Both collections base theknowledge they provide on design knowledge for which they could identify multipleindependent successful applications. We provide a sample of patterns from both sourcesthat we consider typical VD patterns, pointing to the source for details, examples ofactual use, and theoretical explanation:
• Center Stage [We09] User Problem: where to find the important things in relation to all thethings on the page; Solution: Create a large "center stage" that dominates on the page.
• Color Coded Section [We09] User Problem: need to recognize that they are in the rightplace; Solution: Color each major section with its own color.
184
• Grid-based Layout [We09] User Problem: need to be able to scan, read and understand apage quickly; Solution: Use grid system for placement and alignment of visual objects on thepage.
• Row Striping [Ti08] User Problem: need to read or scan a table in search of particularinformation Solution: Use alternating row colors for making the table more readable.
• Diagonal Balance [Ti08] User Problem: Users who read from left to right have a naturaleye movement from top left top bottom right; Solution: arrange page elements in anasymmetric fashion, balancing it by putting visual weight into both the upper left and thelower right corners.
• Action Panel [Ti08] User Problem: There are too many actions for making a button group,and a menu bar or pop-up menu is not obvious; Solution: Present a large group of relatedactions in a well organized UI panel that is always visible.
3 Visual Design Knowledge from Design Literature
Current literature on visual design (e.g., [LH03], [Tu97], [Sp06]) in many cases providesthe authors’ view on how to apply graphic techniques in order to make audience of thedesign understand, appreciate, experience, and act. The client of the design (the personor company who is paying the designer) in many cases has an explicit goal: to make theaudience receive the message, to change its mind, to buy the product, etc. In this respect,different from the patterns discussed before, this design knowledge seems to aim, at leastpartly, to solve the client’s problem. In the end, though, the client sometimes is theaudience as well (the “client” goes to a bookshop to find a book that allows him to “use”it for exiting reading). Most sources in this domain are in fact collections of successfuldesign, inspiring to expert readers, and structured along types of solutions, not userproblems. [LH03] stands out in what the subtitle says “100 Ways to Enhance Usability,Influence Perception, making Better Design Decisions, and Teach through Design”.This type of knowledge can be transformed into patterns in a relatively straightforwardway. We show examples of patterns developed from the clear-cut guidelines in [LH03]where examples from practice as well as theoretical background may be found.
• Affordance - User Problem: to know when and how to perform actions at a 2-D graphicalinterface; Solution: Represent a widget’s function analogous to relevant objects from theuser’s physical world: draw 3-D buttons, sliders, thrash cans, as well as their changing imageupon users’ actions towards these, and allow the user to use the display as input location.
• Chunking – User Problem: to keep an overview in case of large collections of elements;Solution: Group collections of related elements / objects into a single element, provided theuser will not need to scan the elements in the chunk – e.g., chunking will not work if the userhas to choose one of the states in the USA.
• Constraint – User Problem: to understand what actions make sense, or are possible in thecurrent state; Solution: Show action limits: sliders end-points; fading buttons when nomeaningful actions are possible; input constraints for dates: “dd/mm/yy”. If possible, considerto enforce relevant choices by providing pull-down menus for day, moth, year, country, etc.
185
• Iconic representation – User Problem: what does this icon mean; Solution: pictorialimages improve recognition and recall of signs and controls. Similar icons use images that arevisually analogous to actions, objects, or concepts; example icons exemplify these. Symbolicicons will work only as far as they resonate in the user’s cultural background. Arbitrary iconshave to be learned, so these will not work for incidental use.
4 Current research on visual design and perception of new media
Current available technologies like eye-tracking lead to a totally new way of analyzingthe people’s looking behavior while being confronted with, and interacting with, visualdisplays. We base our current examples on [OR09], where relevant results from welldesigned experiments are made available, that certainly are supportive for HCI experts,though for non experts a translation is needed. Here we only provide some attempts totransfer this type of knowledge into patterns that serve, mostly, the problems of theclients of design.
• Meaningful scanning – Client Problem: Make sure the user understands headline;Solution: Put message in first three words.
• Restrict number of options – Client Problem: How to make users consider all options;Solution: offer maximal 5 options at once.
• Picture faces – Client Problem: How to draw user’s attention away from normal readingpattern; Solution: For PC screen only: use medium size (210 * 230 pixels) picture of(preferably 2) faces.
5 Fitting Patterns to Engineering Practice
First of all, we selected 29 patterns relevant to Visual Design: we changed the names toindicate the user’s problem for which the pattern provided a possible solution. We editedthe pattern to optimally fit the design knowledge that was supposed to be available withEngineers without expertise in HCI or VD. We provided a small group (8) of ComputerScience students with this collection. All students were advanced Software Engineers,well aware of “traditional” patterns like [GH95]. As part of their curriculum they had todevelop a visual design for a website and related paper documents. Half of them used asimple tool that just listed the patterns grouped in the category set used by [We09]. Theother half were provided with a wizard that asked them questions in order to build scollection of most relevant patterns for their actual design case, see Figure 1. Bothgroups were able to identify and apply those patterns that were relevant for their designcase.
Somewhat surprising, the wizard group still browsed all patterns, including those notsuggested to them. We interpret this behavior as a strong need to be flexible, and playwith alternative solutions. A wizard seems too much an authority, dictating in the endwhich solutions would make sense and which not. Users are feeling they lack control of,and insight in, the functioning of the wizard.
186
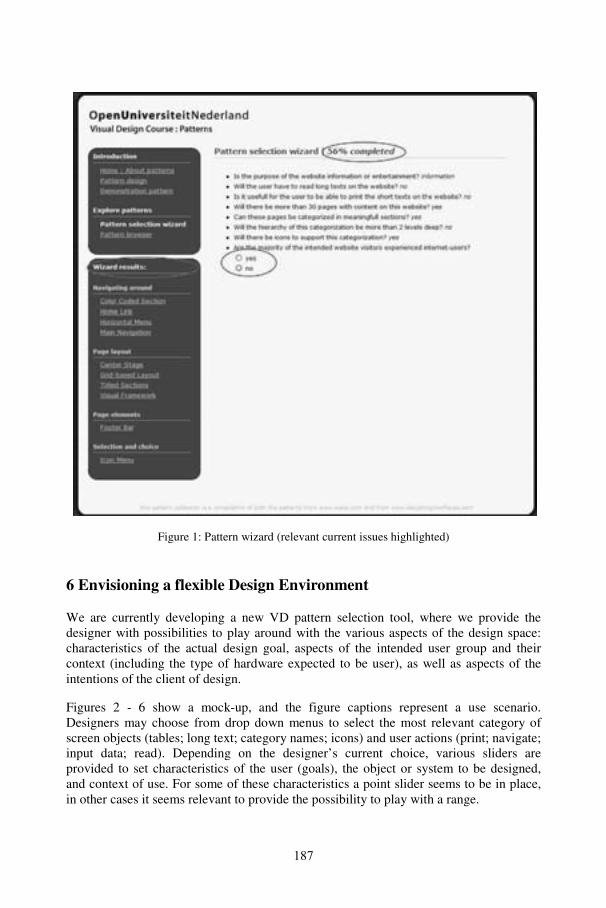
Figure 1: Pattern wizard (relevant current issues highlighted)
6 Envisioning a flexible Design Environment
We are currently developing a new VD pattern selection tool, where we provide thedesigner with possibilities to play around with the various aspects of the design space:characteristics of the actual design goal, aspects of the intended user group and theircontext (including the type of hardware expected to be user), as well as aspects of theintentions of the client of design.
Figures 2 - 6 show a mock-up, and the figure captions represent a use scenario.Designers may choose from drop down menus to select the most relevant category ofscreen objects (tables; long text; category names; icons) and user actions (print; navigate;input data; read). Depending on the designer’s current choice, various sliders areprovided to set characteristics of the user (goals), the object or system to be designed,and context of use. For some of these characteristics a point slider seems to be in place,in other cases it seems relevant to provide the possibility to play with a range.
187
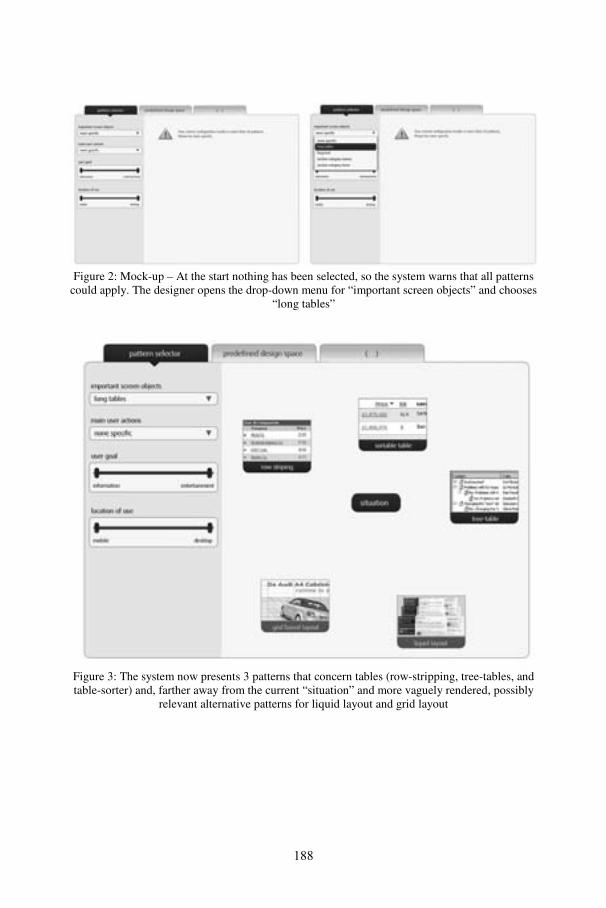
Figure 2: Mock-up – At the start nothing has been selected, so the system warns that all patternscould apply. The designer opens the drop-down menu for “important screen objects” and chooses
“long tables”
Figure 3: The system now presents 3 patterns that concern tables (row-stripping, tree-tables, andtable-sorter) and, farther away from the current “situation” and more vaguely rendered, possibly
relevant alternative patterns for liquid layout and grid layout
188
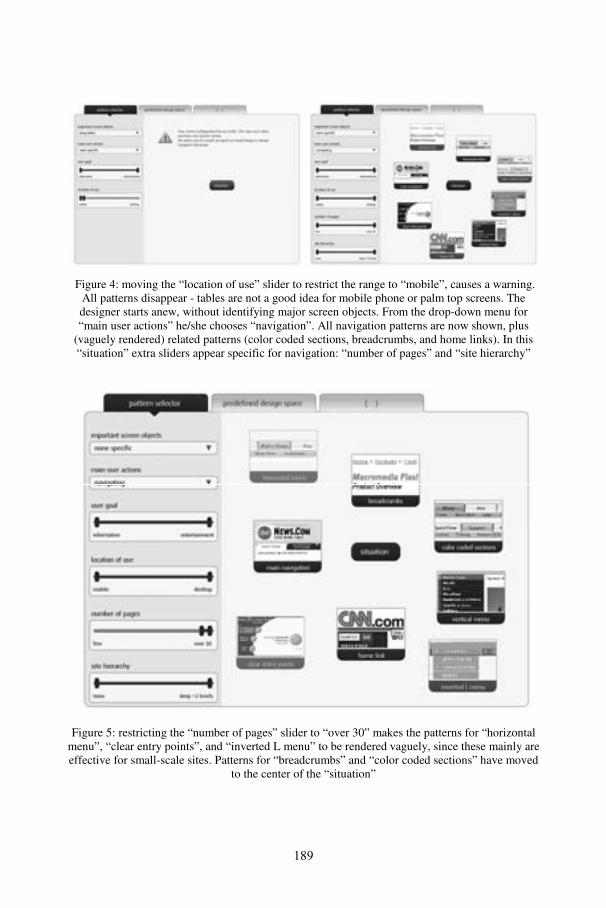
Figure 4: moving the “location of use” slider to restrict the range to “mobile”, causes a warning.All patterns disappear - tables are not a good idea for mobile phone or palm top screens. Thedesigner starts anew, without identifying major screen objects. From the drop-down menu for“main user actions” he/she chooses “navigation”. All navigation patterns are now shown, plus
(vaguely rendered) related patterns (color coded sections, breadcrumbs, and home links). In this“situation” extra sliders appear specific for navigation: “number of pages” and “site hierarchy”
Figure 5: restricting the “number of pages” slider to “over 30” makes the patterns for “horizontalmenu”, “clear entry points”, and “inverted L menu” to be rendered vaguely, since these mainly areeffective for small-scale sites. Patterns for “breadcrumbs” and “color coded sections” have moved
to the center of the “situation”
189
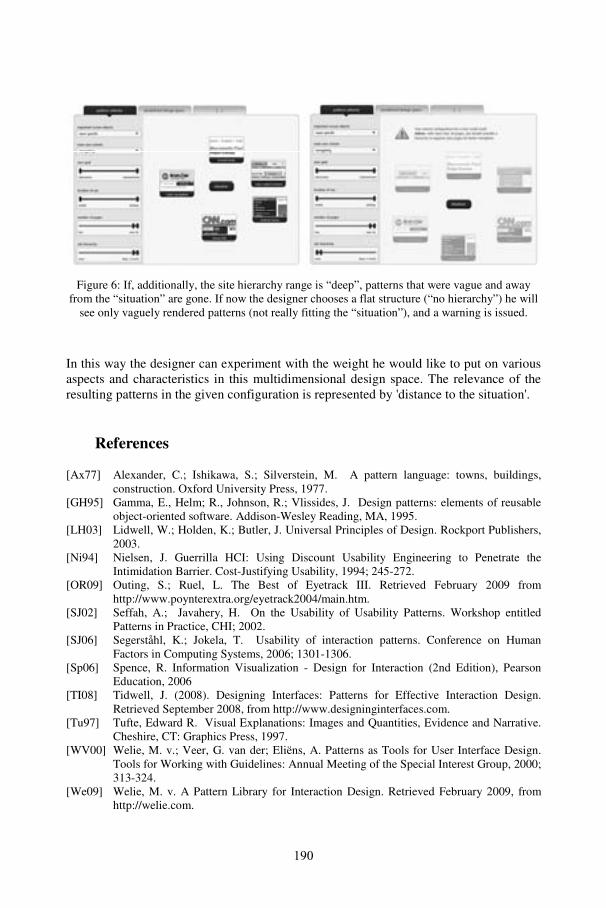
Figure 6: If, additionally, the site hierarchy range is “deep”, patterns that were vague and awayfrom the “situation” are gone. If now the designer chooses a flat structure (“no hierarchy”) he will
see only vaguely rendered patterns (not really fitting the “situation”), and a warning is issued.
In this way the designer can experiment with the weight he would like to put on variousaspects and characteristics in this multidimensional design space. The relevance of theresulting patterns in the given configuration is represented by 'distance to the situation'.
References
[Ax77] Alexander, C.; Ishikawa, S.; Silverstein, M. A pattern language: towns, buildings,construction. Oxford University Press, 1977.
[GH95] Gamma, E., Helm; R., Johnson, R.; Vlissides, J. Design patterns: elements of reusableobject-oriented software. Addison-Wesley Reading, MA, 1995.
[LH03] Lidwell, W.; Holden, K.; Butler, J. Universal Principles of Design. Rockport Publishers,2003.
[Ni94] Nielsen, J. Guerrilla HCI: Using Discount Usability Engineering to Penetrate theIntimidation Barrier. Cost-Justifying Usability, 1994; 245-272.
[OR09] Outing, S.; Ruel, L. The Best of Eyetrack III. Retrieved February 2009 fromhttp://www.poynterextra.org/eyetrack2004/main.htm.
[SJ02] Seffah, A.; Javahery, H. On the Usability of Usability Patterns. Workshop entitledPatterns in Practice, CHI; 2002.
[SJ06] Segerståhl, K.; Jokela, T. Usability of interaction patterns. Conference on HumanFactors in Computing Systems, 2006; 1301-1306.
[Sp06] Spence, R. Information Visualization - Design for Interaction (2nd Edition), PearsonEducation, 2006
[TI08] Tidwell, J. (2008). Designing Interfaces: Patterns for Effective Interaction Design.Retrieved September 2008, from http://www.designinginterfaces.com.
[Tu97] Tufte, Edward R. Visual Explanations: Images and Quantities, Evidence and Narrative.Cheshire, CT: Graphics Press, 1997.
[WV00] Welie, M. v.; Veer, G. van der; Eliëns, A. Patterns as Tools for User Interface Design.Tools for Working with Guidelines: Annual Meeting of the Special Interest Group, 2000;313-324.
[We09] Welie, M. v. A Pattern Library for Interaction Design. Retrieved February 2009, fromhttp://welie.com.
190
Requirements Engineering und BusinessProcess Management – Konvergenz, Synonym
oder doch so wie gehabt?
(REBPM)
Inhaltsverzeichnis
Workshop Requirements Engineering und Business Process Management –REBPM 2009Daniel Lübke, Sebastian Adam, Sebastian Stein, Jörg Dörr, Kurt Schneider .............. 193
Einfluss dienstebasierter Architekturen auf das Requirements Engineering –Anforderungen und AnwendungsfallBeate van Kempen, Frank Hogrebe, Wilfried Kruse .................................................... 195
Requirements Engineering und Geschäftsprozessmodellierung –zwei Seiten der gleichen MedailleHeinz Ehrsam, Ralf Fahney, Kurt McKeown................................................................ 205
Bridging Requirements Engineering and Business Process ManagementKen Decreus, M. El Kharbili, Geert Poels, Elke Pulvermueller .................................. 215
Qualität von Geschäftsprozessen und Unternehmenssoftware –Eine ThesensammlungBarbara Paech, Andreas Oberweis, Ralf Reussner ...................................................... 223
Verzahnung von Requirements Engineering und GeschäftsprozessdesignMatthias Weidlich, Alexander Grosskopf, Daniel Lübke, Kurt Schneider,Eric Knauss, Leif Singer .............................................................................................. 229
Workshop Requirements Engineering und Business ProcessManagement – REBPM 2009
Daniel Lübke1, Sebastian Adam2, Sebastian Stein3, Jörg Dörr2, Kurt Schneider11Leibniz Universität Hannover, Welfengarten 1, 30167 Hannover2Fraunhofer IESE, Fraunhofer-Platz 1, 66773 Kaiserslautern3IDS Scheer AG, Altenkesseler Str. 17, 66115 Saarbrücken
{daniel.luebke | kurt.schneider}@inf.uni-hannover.de | {sebastian.adam |joerg.doerr}@iese.fraunhofer.de | [email protected]
Abstract: SOA ist nicht auf die IT-Abteilung und die Softwareentwicklung be-schränkt, sondern wird Unternehmen in ihrer Gesamtheit betreffen. RequirementsEngineering als Schnittstellendisziplin zwischen „Kunde“ und „Entwickler“ musssich in diesem Kontext neu definieren, da klare Auftraggeber-Auftragnehmer-Situationen in den Hintergrund treten und die Unternehmen integriert von der Stra-tegie bis zur IT ganzheitlich gestaltet werden.
Dies beeinflusst die Anforderungserhebungsphase, die nun viel mehr auf die Um-setzung der Geschäftsziele unter Beachtung der Fähigkeiten der IT eingehen muss.So muss u.a. die Softwareentwicklung viel stärker mit den Geschäftsprozessen ab-gestimmt werden, um die Flexibilität von SOA nutzen zu können. Auf internatio-nalen Konferenzen wurden schon länger Diskussionen geführt, inwiefern in diesemZusammenhang Geschäftsprozessmanagement und Requirements Engineeringüberhaupt noch zu trennen sind bzw. wo der Unterschied und die Gemeinsamkei-ten liegen.
Der diesjährige REBPM-Workshop hatte zum Ziel, diese Diskussion in den Mit-telpunkt eines deutschsprachigen Workshops zu stellen. Dabei war es wichtig, dasssowohl Praktiker als auch Forscher gemeinsam, Zusammenhänge und Unterschie-de, sowie Erfahrungen und Ideen miteinander austauschen können.
Daraus entstand eine sehr positive und konstruktive Atmosphäre, die geholfen hat,Unterschiede in Sichtweisen und Terminologie der beiden Disziplinen zu erkennenund Gemeinsamkeiten herauszuarbeiten.
Insgesamt hat der Workshop damit sein Ziel erreicht, Leute aus beiden Disziplinenzusammenzubringen, die sich durch SOA der jeweils anderen Disziplin ausgesetztsehen, und gemeinsam Projekte zum Erfolg bringen müssen.
Aufgrund der positiven Rückmeldungen werden wir als Organisatoren versuchen,im nächsten Jahr ebenfalls einen REBPM-Workshop zu organisieren.
193

Einfluss dienstebasierte Architekturenauf das Requirements Engineering – Anforderungen und
Anwendungsfall
Beate van Kempen; Frank Hogrebe; Wilfried KruseLandeshauptstadt Düsseldorf
Organisations-, Personal-, IT- und WirtschaftsförderungsdezernatCompetence Center eGOV DüsseldorfBurgplatz 1, D-40213 Düsseldorf
beate.vankempen|frank.hogrebe|[email protected]
Abstract: Der konsequente Aufbau dienstebasierter Architekturen hat sich im öf-fentlichen Sektor bisher in der Fläche nicht durchgesetzt. Gründe hierfür liegen inoftmals unterschiedlichen Sichtweisen und korrespondierenden Bedarfslagen vonIT- und Prozessverantwortlichen einerseits und immer noch vorwiegend stellenbe-zogen und juristisch geprägten Verfahrens- und Entscheidungsverantwortlichenandererseits. Anbieter öffentlicher Dienstleistungen sind mit Blick auf die EU-Dienstleistungsrichtlinie gefordert, ihre Produkt- und Prozessorganisation bis Ende2009 neu auszurichten. Wesentliche Kernanforderungen sind die Einrichtung Ein-heitlicher Ansprechpartner für Unternehmen und die elektronische Verfahrensab-wicklung von Formalitäten und Verfahren zur Aufnahme und Ausübung einerDienstleistungstätigkeit. Dies hat unmittelbare Auswirkungen auf die Ausgestal-tung und Erhebung der benötigten Anforderungen zum Aufbau einer dienstebasier-ten Architektur und auf das Requirements Engineering. Der Beitrag beschreibt denEinfluss dienstebasierter Architekturen auf das Requirements Engineering am Bei-spiel des öffentlichen Sektors. Am Anwendungsfall der „Gewerbe-Anmeldung“wird ein Modellierungsansatz vorgestellt, der Fachanwendern, Organisatoren undSoftwareentwicklern gleichermaßen die Identifikation, Beschreibung und Integra-tion von SOA-Services im Rahmen der (Teil-)Automation von Verwaltungspro-zessen ermöglicht.
1 Einleitung
Dienstebasierte Informationssysteme sollen die Anpassung von IT-Systemlandschaftenan sich ändernde Anforderungen kostengünstig, zeitnah und flexibel, durch die wei-testgehende Entkopplung von betriebswirtschaftlichen und technischen Aspekten, er-möglichen. Für den öffentlichen Sektor stellt die EU-Dienstleistungsrichtlinie, kurz EU-DLR, eine solche geänderte Anforderung dar [EU06].
Die Anforderungen der EU-DLR haben in Verbindung mit dem erforderlichen Aufbaudienstebasierter Architekturen, über die notwendige Optimierung und elektronischerVerfügbarkeit der Verwaltungsprozesse hinaus, Einfluss auf das Requirements Enginee-ring. Der Beitrag beschreibt die Einflüsse dienstebasierter Architekturen auf das Requi-rements Engineering im öffentlichen Sektor und ist wie folgt aufgebaut: Im zweitenAbschnitt werden die wesentlichen Anforderungen der EU-Dienstleistungsrichtlinie zur
195
Verwaltungsvereinfachung beschrieben. Anschließend werden die Auswirkungen derDienstleistungsrichtlinie auf das Requirements Engineering dargestellt. In Abschnitt 4wird am Anwendungsfall der „Gewerbe-Anmeldung“ ein Modellierungsansatz vorge-stellt, der Fachanwendern, Organisatoren und Softwareentwicklern gleichermaßen dieIdentifikation und Beschreibung von SOA-Services zur (Teil-) Automation von Verwal-tungsprozessen und zur asynchronen Backendintegration mit Frontendlösungen ermög-licht und den Einfluss dienstebasierter Architekturen auf das Requirements Engineeringkonkretisiert. Die Arbeit schließt mit einer Zusammenfassung und einem Ausblick.
2 EU-Dienstleistungsrichtlinie
Durch die Richtlinie [EU06] soll der freie Dienstleistungsverkehr innerhalb der Gemein-schaft deutlich vereinfacht und erleichtert werden. Den Kern der Zielsetzungen bildet dieVerwaltungsvereinfachung zugunsten von Unternehmen (Kapitel 2 der Richtlinie). DieMitgliedsstaaten sind danach aufgefordert sicher zu stellen, dass alle Verfahren undFormalitäten problemlos auch aus der Ferne und elektronisch über den einheitlichenAnsprechpartner oder bei der zuständigen Behörde abgewickelt werden können (Art.8 -elektronische Verfahrensabwicklung).
Diese Anforderungen bringen Veränderungen in den Verwaltungsabläufen und Zustän-digkeiten des öffentlichen Sektors mit sich und fordern ein hohes Maß an Flexibilität aufallen Ebenen der IT-Umsetzungsszenarien. Zur Umsetzung der EU-DLR müssen Prozes-se von rund 200 Verwaltungsdienstleistungen mit Unternehmensbezug neu modelliertund für die elektronische Verfahrensabwicklung mit Schnittstellen in Front- und Backof-fices z.B. über SOA-Services mit einander verbunden werden. Diese Verbindung – ge-paart mit der Aufforderung, die Prozesse zu optimieren – erfordert eine Analyse und einRe-Design der sehr formulargetriebenen Verwaltungsprozesse und deren Modellierungs-techniken.
3 Einflüsse auf das Requirements Engineering
Requirements Engineering wird als Prozess beschrieben, der den Zweck einer Softwareergründet, in dem er die Bedürfnisse der Anwender ermittelt, diese dokumentiert, derAnalyse zugänglich macht, sie kommuniziert, diskutiert, um diese abschließend zu imp-lementieren [NE00]. Der Aufbau von dienstebasierten Architekturen beeinflusst dasRequirements Engineering in Bezug auf:1. die Dokumentation der Anforderungen, welche bei der Prozessmodellierung dieService-Identifizierung ermöglichen,
2. die Analyse der Bedürfnisse, die sich auf fehlende Dienste beschränkt und nichtkomplexe, monolithische Anwendungen zum Ziel haben und
3. die Implementierung von Lösungen, die durch die geforderte Interoperabilität undEntkopplung der Dienste eine verstärkte Überwachung der daraus folgenden asyn-chronen Prozesse erfordert.
196
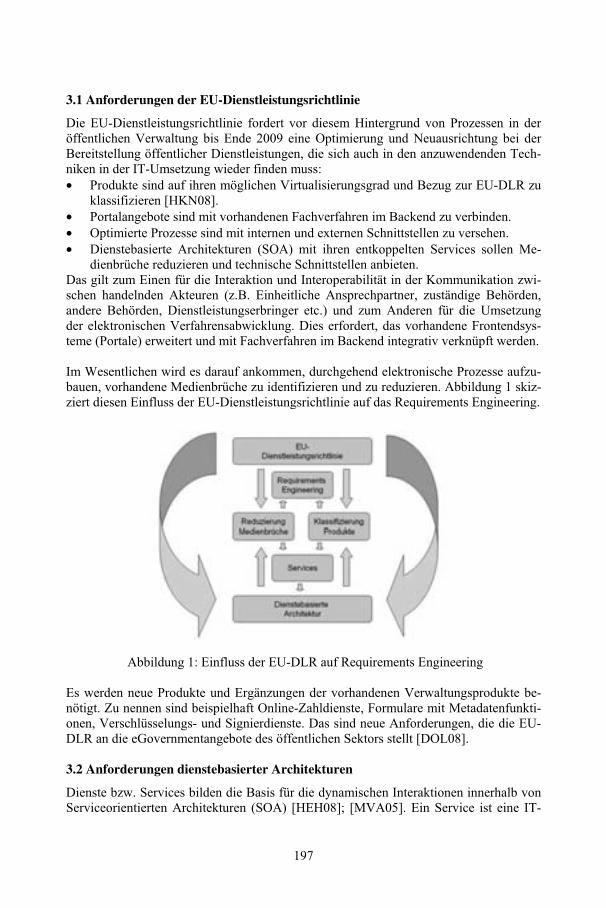
3.1 Anforderungen der EU-Dienstleistungsrichtlinie
Die EU-Dienstleistungsrichtlinie fordert vor diesem Hintergrund von Prozessen in deröffentlichen Verwaltung bis Ende 2009 eine Optimierung und Neuausrichtung bei derBereitstellung öffentlicher Dienstleistungen, die sich auch in den anzuwendenden Tech-niken in der IT-Umsetzung wieder finden muss:• Produkte sind auf ihren möglichen Virtualisierungsgrad und Bezug zur EU-DLR zuklassifizieren [HKN08].
• Portalangebote sind mit vorhandenen Fachverfahren im Backend zu verbinden.• Optimierte Prozesse sind mit internen und externen Schnittstellen zu versehen.• Dienstebasierte Architekturen (SOA) mit ihren entkoppelten Services sollen Me-dienbrüche reduzieren und technische Schnittstellen anbieten.
Das gilt zum Einen für die Interaktion und Interoperabilität in der Kommunikation zwi-schen handelnden Akteuren (z.B. Einheitliche Ansprechpartner, zuständige Behörden,andere Behörden, Dienstleistungserbringer etc.) und zum Anderen für die Umsetzungder elektronischen Verfahrensabwicklung. Dies erfordert, das vorhandene Frontendsys-teme (Portale) erweitert und mit Fachverfahren im Backend integrativ verknüpft werden.
Im Wesentlichen wird es darauf ankommen, durchgehend elektronische Prozesse aufzu-bauen, vorhandene Medienbrüche zu identifizieren und zu reduzieren. Abbildung 1 skiz-ziert diesen Einfluss der EU-Dienstleistungsrichtlinie auf das Requirements Engineering.
Abbildung 1: Einfluss der EU-DLR auf Requirements Engineering
Es werden neue Produkte und Ergänzungen der vorhandenen Verwaltungsprodukte be-nötigt. Zu nennen sind beispielhaft Online-Zahldienste, Formulare mit Metadatenfunkti-onen, Verschlüsselungs- und Signierdienste. Das sind neue Anforderungen, die die EU-DLR an die eGovernmentangebote des öffentlichen Sektors stellt [DOL08].
3.2 Anforderungen dienstebasierter Architekturen
Dienste bzw. Services bilden die Basis für die dynamischen Interaktionen innerhalb vonServiceorientierten Architekturen (SOA) [HEH08]; [MVA05]. Ein Service ist eine IT-
197
Repräsentation einer fachlichen Funktionalität [Jo08]. Hinter einem Dienst können dabeientweder ein komplexer Geschäftsprozess, ein kleiner Teilprozess oder ein Verarbei-tungsschritt stehen. SOA ist eine bausteinbasierte Architektur, wobei jeder einzelneDienst eine klar umrissene fachliche Aufgabe ausführt. Charakterisiert sind diensteba-sierte Anwendungen und Architekturen durch• eine produkt- und plattformunabhängige Architektur,• lose Kopplung der einzelnen Bausteine und• wieder Verwendbarkeit der technischen Dienste.Requirements Engineering unterliegt bei der Umsetzung von Teil-Prozessen in einerdienstebasierten Architektur anderen Bedingungen als bei monolithisch abgebildetenGesamtprozessen.
Leidet Requirements Engineering bei klassischer (monolithischer) Softwareentwicklungdaran, dass die Anwender häufig nicht in der Lage sind, komplexe fachliche Anforde-rungen an Software zu definieren, so ändert sich dies bei der Anforderungserhebung füreine SOA-Landschaft. Die Fachverfahren sind bereits vorhanden, die Datenbanken auf-gebaut und die Frontend-Komponenten sind produktiv. Da SOA vorhandene Heterogeni-tät (durch bestehende Softwarelandschaften) akzeptiert, müssen lediglich fehlende inte-grative Services identifiziert werden. Zukünftige Beschaffungen in Hard- und Softwaremüssen diesen neuen Anforderungen Rechnung tragen. Entsprechende Schnittstellen,Aufbau und Integration in eine SOA-Infrastruktur werden die IT-Landschaften des öf-fentlichen Sektors nachhaltig beeinflussen.
3.3 Medienbrüche als „Service-Kandidaten“
Als mögliche „Service-Kandidaten“ bieten sich - im Kontext der Anforderungen der EU-Dienstleistungsrichtlinie zur elektronischen Verfahrensabwicklung - insbesondere Me-dienbrüche im Prozessablauf an. Diese Medienbrüche sind für die Anwender einfach zubenennen, da sie in der praktischen Umsetzung im Prozess oftmals als störend empfun-den werden. Müssen z.B. im Prozess erforderliche Informationen in nicht elektronischverfügbaren Quellen (Gesetzessammlungen, Register etc.) nachgeschlagen werden, istein voll-elektronischer Prozess unterbrochen. Im Projekt-Bericht des Deutschland-Online-Projektes zur Umsetzung der EU-Dienstleistungsrichtlinie [DOL08] wird insbe-sondere der Abbau von Medienbrüchen für die elektronische Verfahrensabwicklung mitdurchgehenden Prozessen gefordert. Medienbrüche sind somit in diesem Kontext poten-tielle SOA-Service-Kandidaten, sofern sie wesentliche Kernanforderungen an Services,wie (1) Autonomie, (2) Modularität, (3) Bedarfs- und (4) Schnittstellenorientierung und(5) Interoperabilität erfüllen [Sc06].
4 SOA-Services am Anwendungsfall der „Gewerbe-Anmeldung“
Zwischen den Fachabteilungen und den IT-Entwicklern vorhandene Verständnislückenspiegeln sich in unterschiedlichen Werkzeugen sowie verschiedener Prozessmodellie-rungstypen und –Notationen wieder.
198
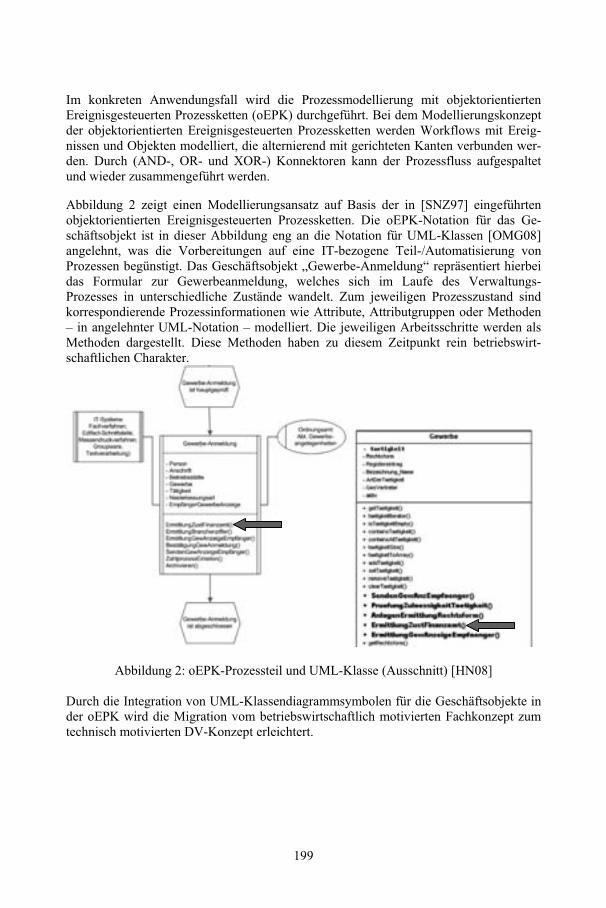
Im konkreten Anwendungsfall wird die Prozessmodellierung mit objektorientiertenEreignisgesteuerten Prozessketten (oEPK) durchgeführt. Bei dem Modellierungskonzeptder objektorientierten Ereignisgesteuerten Prozessketten werden Workflows mit Ereig-nissen und Objekten modelliert, die alternierend mit gerichteten Kanten verbunden wer-den. Durch (AND-, OR- und XOR-) Konnektoren kann der Prozessfluss aufgespaltetund wieder zusammengeführt werden.
Abbildung 2 zeigt einen Modellierungsansatz auf Basis der in [SNZ97] eingeführtenobjektorientierten Ereignisgesteuerten Prozessketten. Die oEPK-Notation für das Ge-schäftsobjekt ist in dieser Abbildung eng an die Notation für UML-Klassen [OMG08]angelehnt, was die Vorbereitungen auf eine IT-bezogene Teil-/Automatisierung vonProzessen begünstigt. Das Geschäftsobjekt „Gewerbe-Anmeldung“ repräsentiert hierbeidas Formular zur Gewerbeanmeldung, welches sich im Laufe des Verwaltungs-Prozesses in unterschiedliche Zustände wandelt. Zum jeweiligen Prozesszustand sindkorrespondierende Prozessinformationen wie Attribute, Attributgruppen oder Methoden– in angelehnter UML-Notation – modelliert. Die jeweiligen Arbeitsschritte werden alsMethoden dargestellt. Diese Methoden haben zu diesem Zeitpunkt rein betriebswirt-schaftlichen Charakter.
Abbildung 2: oEPK-Prozessteil und UML-Klasse (Ausschnitt) [HN08]
Durch die Integration von UML-Klassendiagrammsymbolen für die Geschäftsobjekte inder oEPK wird die Migration vom betriebswirtschaftlich motivierten Fachkonzept zumtechnisch motivierten DV-Konzept erleichtert.
199
Die fachlichen oEPK-Prozessmodelle sind die Grundlage für die weitere IT-technischenSpezifikation des Prozesses im UML-Klassendiagramm. Dort werden Medienbrüche beider Übertragung der betriebswirtschaftlichen Methoden aus der oEPK in die UML-Klassen sichtbar (in Abb. 2 hervorgehoben). Sobald einem Arbeitsschritt keine korres-pondierende Prozedur in einer der Klassen gegen übersteht, liegt ein Medienbruch vor.Diese Prozess-Unterbrechungen könnten mit geeigneten SOA-Services überbrückt wer-den. In dem hier dargestellten UML-Klassendiagramm werden diese betriebswirtschaft-lichen Methoden speziell markiert eingefügt. Sie hätten bei klassischer UML-Notationkeine Anwendung gefunden [Oe04].
Bei der endgültigen Bewertung, der „Service-Kandidaten“, ist insbesondere auf die wie-der Verwendbarkeit des Services auch für andere Prozesse zu achten [Wi06]. Im konkre-ten Anwendungsfall kann z.B. der Dienst „Ermittlung zuständiges Finanzamt“ identifi-ziert werden. Dieser stellt im Prozessablauf der Gewerbe-Anmeldung einen Medien-bruch dar. Die Anschrift der Betriebsstätte kann in größeren Städten dabei theoretischdrei möglichen Finanzämtern zugeordnet sein. Im Anwendungsfall wird bisher das zu-ständige Finanzamt durch manuelle Suche in Straßenverzeichnissen, Onlinedienstenoder anderen Quellen ermittelt. Die Ermittlung kann jedoch leicht automatisiert alsSOA-Dienst erfolgen und dann auch in anderen Verwaltungsprozessen eingesetzt wer-den. Dabei ist zu berücksichtigen, dass auch andere Fachabteilungen im Rahmen vonProzessdurchführungen mit jeweils unterschiedlich zuständigen Finanzämtern Informa-tionen austauschen und auch dort das richtige Finanzamt noch manuell ermittelt wird.
Darüber hinaus ermöglicht diese Art Modellierung sowohl der fachlichen als auch derinformationstechnischen Abläufe die Wiederverwendung von bereits vorhandenen Be-standteilen. Erste Projektergebnisse zeigen, dass sich bereits nach wenigen Prozessen dieZeit zur Modellierung deutlich reduziert, da auf bestehende Modellierungsteile zurück-gegriffen werden kann. Die gewählte Granularität der Prozessbeschreibung unter Ver-wendung der oEPK-Notation ermöglicht, dass grundlegende Java-Codes in Form voninitialisierten Methoden- und Attributdefinitionen bereitgestellt werden können. Siebilden die Basis der im Weiteren zu programmierenden Geschäftslogik des Prozesses.
5 Portalangebote mit Backendintegration über asynchrone Dienste
Durch die einer SOA-typischen losen Kopplung der Service-Provider ist es erforderlich,die elektronisch bereit gestellten Verwaltungsprozesse asynchron zu gestalten [Jos08].Prozessunterbrechungen sollen für den Nutzer nicht erkennbar sein und im besten Fallkeine Auswirkung auf die weiteren Portalaktivitäten haben. Die SOA-Infrastruktur mussdafür Sorge tragen, dass die „Prozessteile“ später wieder zueinander finden können.Dazu werden alternative System-Komponenten (hoch verfügbare Systeme) oder auchmanuelle Ausführungen berücksichtigt [KBS04]. Abbildung 3 zeigt die Architektureines asynchronen Verwaltungsprozesses zur Umsetzung der elektronischen Verfahrens-abwicklung im Rahmen der EU-Dienstleistungsrichtlinie:
200
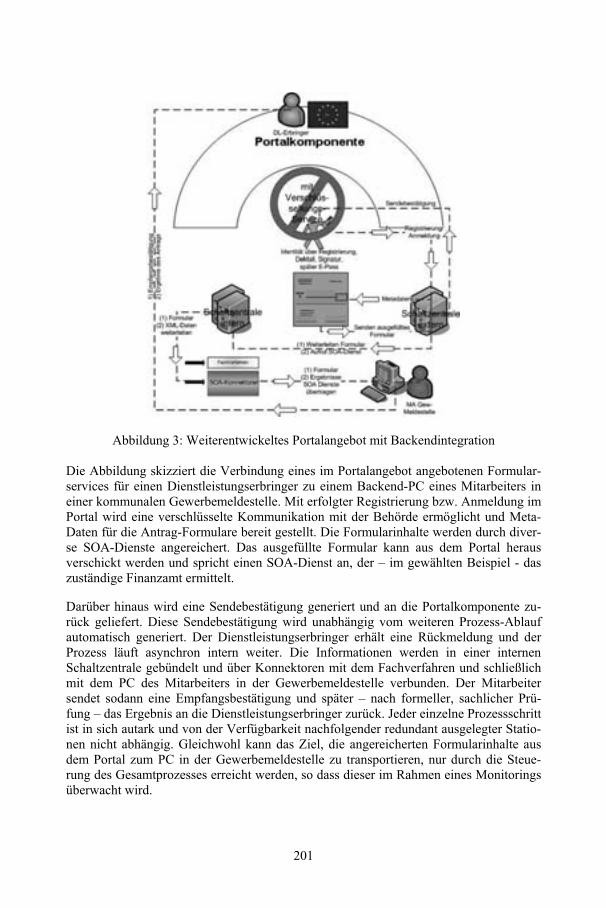
Abbildung 3: Weiterentwickeltes Portalangebot mit Backendintegration
Die Abbildung skizziert die Verbindung eines im Portalangebot angebotenen Formular-services für einen Dienstleistungserbringer zu einem Backend-PC eines Mitarbeiters ineiner kommunalen Gewerbemeldestelle. Mit erfolgter Registrierung bzw. Anmeldung imPortal wird eine verschlüsselte Kommunikation mit der Behörde ermöglicht und Meta-Daten für die Antrag-Formulare bereit gestellt. Die Formularinhalte werden durch diver-se SOA-Dienste angereichert. Das ausgefüllte Formular kann aus dem Portal herausverschickt werden und spricht einen SOA-Dienst an, der – im gewählten Beispiel - daszuständige Finanzamt ermittelt.
Darüber hinaus wird eine Sendebestätigung generiert und an die Portalkomponente zu-rück geliefert. Diese Sendebestätigung wird unabhängig vom weiteren Prozess-Ablaufautomatisch generiert. Der Dienstleistungserbringer erhält eine Rückmeldung und derProzess läuft asynchron intern weiter. Die Informationen werden in einer internenSchaltzentrale gebündelt und über Konnektoren mit dem Fachverfahren und schließlichmit dem PC des Mitarbeiters in der Gewerbemeldestelle verbunden. Der Mitarbeitersendet sodann eine Empfangsbestätigung und später – nach formeller, sachlicher Prü-fung – das Ergebnis an die Dienstleistungserbringer zurück. Jeder einzelne Prozessschrittist in sich autark und von der Verfügbarkeit nachfolgender redundant ausgelegter Statio-nen nicht abhängig. Gleichwohl kann das Ziel, die angereicherten Formularinhalte ausdem Portal zum PC in der Gewerbemeldestelle zu transportieren, nur durch die Steue-rung des Gesamtprozesses erreicht werden, so dass dieser im Rahmen eines Monitoringsüberwacht wird.
201
6 Zusammenfassung und Ausblick
Mit Blick auf die EU-Dienstleistungsrichtlinie sollen Unternehmen auch „aus der Ferne“die zur Dienstleistungsaufnahme und -ausübung notwendigen Formalitäten und Verfah-ren abwickeln können. Zur Umsetzung der EU-DLR werden daher Konzepte benötigt,durch welche die Ziele der Richtlinie erreicht werden können. Diese Konzepte beeinflus-sen das Requirements Engineering in Bezug auf die Dokumentation, Analyse undImplementation von Lösungen für den öffentlichen Sektor. Zukünftige Beschaffungen inHard- und Software müssen den neuen Anforderungen Rechnung tragen. EntsprechendeSchnittstellen, Aufbau und Integration in SOA-Infrastrukturen werden die IT-Landschaften des öffentlichen Sektors nachhaltig beeinflussen.
Der dargestellte integrative Ansatz von fachlicher und technischer Modellierung syste-matisiert die Identifizierung von SOA-Service-Kandidaten und zeigt eine Möglichkeitauf, die vorhandenen Verständnislücken zwischen Fachabteilungen und Softwareent-wicklern zu reduzieren. Die Implementierung asynchroner Verwaltungsprozesse hatEinfluss auf die Anforderungen an Systeme und Prozessmodelle. Sie benötigen ein höhe-res Maß an Prozess-Überwachung und die Bereitstellung hochverfügbarer und redundan-ter Systeme. Der gezeigte Ansatz wird derzeit im Rahmen eines Projektes zur Umset-zung der EU-Dienstleistungsrichtlinie für den Anwendungsfall einer deutschen Groß-stadt pilotiert umgesetzt.
Literaturverzeichnis
[DOL08] Deutschland-Online-Vorhaben: IT-Umsetzung der Europäischen Dienstleistungsricht-linie Projektbericht, S. 105, Stand: 24.09.2008.
[EU06] Richtlinie 2006/123/EG des Europäischen Rates über Dienstleistungen im Binnenmarkt.Amtsblatt der Europäischen Union L 376/36 vom 12.12.2006.
[HEH08] Hau, T.; Ebert, N.; Hochstein, A.; Brenner, W.: Where to Start with SOA Criteria forSelecting SOA Projects. 41st Hawaii International Conference on System Sciences,2008.
[HKN08]Hogrebe, F.; Kruse, W.; Nüttgens, M.: One-Stop-eGovernment für Unternehmen: EinBezugsrahmen zur Virtualisierung und Bündelung öffentlicher Dienstleistungen am Bei-spiel der Landeshauptstadt Düsseldorf, Multikonferenz Wirtschaftsinformatik 2008.
[HN08] Hogrebe, F.; Nüttgens, M.: Integrierte Produkt- und Prozessmodellierung: Rahmenkon-zept und Anwendungsfall zur EU-Dienstleistungsrichtlinie. In: Peter Loos, Markus Nütt-gens, Klaus Turowski , Dirk Werth (Hrsg.): Modellierung betrieblicher Informationssys-teme (MobIS 2008) Modellierung zwischen SOA und Compliance Management, S. 239-252. GI-Edition. Lecture Notes in Informatics (LNI). 7. GI-Workshop EPK 2008: Ge-schäftsprozeßmanagement mit Ereignisgesteuerten Prozessketten, Saarbrücken, 27-28.11.2008.
[Jo08] Josuttis, N. (2008): SOA in der Praxis. System-Design für verteilte Geschäftsprozesse.Heidelberg.
[KBS04] Krafzig Dirk, Banke Karl, Slama Dirk: Enterprise SOA, Service Oriented ArchitectureBest Practices; Prentice Hall International, 2004
[MVA05]Mayerl, Ch.; Vogel, T.; Abeck, S.: SOA-based Integration of IT Service ManagementApplications, IEEE International Conference on Web Services (ICWS), 2005.
202

[NE00] Nuseibeh, B.; Easterbrook, S.; Requirements Engineering: A roadmap. In Proceedings ofthe 22nd International Conference on Software Engineering (ICSE 2000) ADM Press:Limerick, Ireland, 2000, S. 35-46.
[Oe04] Oesterreich, Bernd: Objektorientierte Softwareentwicklung, Analyse und Design mit derUML 2.0 Oldenbourg, 2004, S. 253
[OMG08]Object Management Group (2008). Unified Modeling Language 2.0.http://www.uml.org/, zuletzt besucht am 06.12.2008.
[SNZ95] Scheer, A.-W.; Nüttgens, M.; Zimmermann, V.: Rahmenkonzept für ein integriertesGeschäftsprozessmanagement, in: Wirtschaftsinformatik, 37(1995)5, S. 426-434.
[Sc06] Schwemm, J.W.; Heutschi, R.; Vogel, T.; Wende, K.; Legner, C.: ServiceorientierteArchitekturen: Einordnung im Business Engineering. Working Paper of the HSG, Uni-versität St. Gallen, 2006.
[Wi06] Winkler, V: Identifikation und Gestaltung von Services, WIRTSCHAFTSINFORMATIK49 (2007) 4, S. 257–266
203

Requirements Engineering undGeschäftsprozessmodellierung –zwei Seiten der gleichen Medaille
Heinz Ehrsam1, Ralf Fahney2, Kurt McKeown1
1 Credit Suisse, CH-8070 Zürich{heinz.ehrsam | kurt.mckeown}@credit-suisse.com
2 Fahney Anforderungsingenieurwesen GmbH, Scheideggstrasse 73, CH-8038 Zü[email protected]
Abstract: Lassen sich Requirements Engineering und Geschäftsprozess-modellierung im Kontext service-orientierter Architektur überhaupt noch trennen?Die Autoren sind der Auffassung: Ja! Und es ist sinnvoll, die Disziplinenvoneinander zu trennen. Die Autoren begründen dies, beschreiben die bei CreditSuisse geplante Integration und zeigen die Implikationen auf für Projektarbeit. Diedargestellten Konzepte und Erfahrungen basieren auf einem Projekt, welches zumZiel hat, einen umfangreichen Teil historisch gewachsener IT-Systeme der CreditSuisse binnen der nächsten sechs bis sieben Jahre abzulösen durchNeuentwicklung in service-orientierter Architektur.
1 Das Projekt
Aus geschäftsstrategischen Überlegungen heraus, also getrieben vom Fachbereich, führtCredit Suisse ein Projekt durch, welches einen umfangreichen Teil ihrer historischgewachsenen Backoffice-Applikationen binnen der nächsten sechs bis sieben Jahredurch zukunftsorientierte Technologien ablösen soll. Daher erarbeitet und pilotiert dieBank derzeit die Grundlagen anhand eines in sich abgeschlossenen Teils der vom neuenSystem zu unterstützenden Geschäftsprozesse.
Im Fokus stehen sowohl die Lösungstechnologien
• Integration von Geschäftsprozess-, Use Case-, Daten- und Regelmodell auf derkonzeptionellen Ebene
• Automatisierte Transformation der modellierten Geschäftsprozesse in eineBusiness Process Engine
• Einsatz einer Business Rule Engine
• Serviceorientierte Architektur (SOA)
• Codegenerierung gemäßModel-Driven Architcture (MDA)
205
als auch die Prozesse zur Lösungsentwicklung
• Projektmanagement gemäss SCRUM
• Requirements Engineering (RE) und Geschäftsprozessmodellierung (BusinessProcess Modelling, BPM) als gleichberechtigte Verfahren zur Spezifikation
• Implementierung auf Basis der Geschäftsprozessmodelle
• Testdurchführung auf Basis der Requirements
• Automatisierte Regressionstests
Die Ergebnisse und Erfahrungen aus den pilotierten Prozessen werden wesentlich diezentralen Prozessvorgaben beeinflussen, auch im Hinblick auf die Zertifizierung gemässCMMI Maturity Level 3, welche Credit Suisse für 2010 plant.
Dieser Beitrag beschreibt die bisherigen Erfahrungen von Credit Suisse aus derPilotierung im Bereich Requirements Engineering und Geschäftsprozessmodellierung.
2 Die Herausforderung
Zu Beginn des erwähnten Projektes sprachen die Experten für BPM und SOA überBegriffe wie Business Process, Business Rule, Business Service, IT Service oderBusiness Object. In den von den Experten ausgearbeiteten Metamodellen gab es denBegriff „Anforderung“ nicht.
Gemäß der Planung dieser Experten sollten die Prozessbeschreibungen z.B.Ausführungen enthalten, was unter einem Business Process oder einer Business Rule zuverstehen sei, welche Arten von IT Services es gibt und wie Modelle des ComputationIndependent Model (CIM) zu transformieren sind in Modelle des Platform IndependentModel (PIM) und Platform Specific Model (PSM)1. Die Prozessbeschreibungen hättenjedoch keine Ausführungen enthalten darüber, wie Anforderungen an das zukünftigeSystem systematisch zu erheben, zu dokumentieren und zu verwalten, der Projektumfangzu definieren, zu verhandeln und zu vereinbaren, das Projekt auf Basis derAnforderungen zu planen oder die Anforderungen in Modelle zu transformieren sind.
Aus den Gesprächen mit dem Fachbereich erarbeiteten die Experten für BPM und SOAModelle für Geschäftsprozesse oder Geschäftsobjekte, dokumentierten jedoch nicht dieden Modellen zugrundeliegenden Anforderungen. Dies sahen die Experten für BPM undSOA als redundante Nacharbeit und mithin überflüssigen Aufwand an. Auf diese Weisewar z.B. die Entstehungsgeschichte und Begründung von Modellen im besten Fallunvollständig rekonstruierbar. Dies erschwerte u.a. Verhandlungen mit dem Fachbereichüber den geforderten Projektumfang.
1 Die Begriffe Computation Independent Model, Platform Independent Model und Platform Specific Modelsowie die Abkürzungen CIM, PIM und PSM entstammen [OMG03]. Dort sind auch die Bedeutungen derBegriffe eingehend erläutert.
206
Es entstand der Eindruck, dass den Experten für BPM und SOA der Einsatz bewährterVerfahren des RE unbekannt, zu aufwändig oder nicht sinnvoll erschien. Die Expertenfür BPM und SOA sahen nicht die Notwendigkeiten des Projektmanagements (z.B.Verhandlung von Anforderungen mit dem Fachbereich auf Basis geschätzter Kosten)und des Qualitätsmanagements (z.B. anforderungs-getriebener Test).
Die Herausforderung bestand darin, bei den Experten für BPM und SOA dasVerständnis zu wecken für den Sinn und die Notwendigkeit eines systematischen RE.Weiters war es erforderlich, ein Modell und ein Vorgehen zu finden, welches dieBedürfnisse von BPM/SOA auf der einen und RE auf der anderen Seite abdeckt.
3 Der Lösungsansatz
Dieser Beitrag versteht unter Requirements Engineering sämtliche Tätigkeiten, welcheerforderlich sind, um (Produkt- und Projekt-) Anforderungen zu erheben,zu analysieren,zu verstehen und zu dokumentieren. Dies betrifft Anforderungen an alle Arten vonErgebnissen, nicht nur Anforderungen an Geschäftsprozesse oder IT-Systeme.
Business Process Modelling ist diejenige Lösungsdisziplin, welche Anforderungen anGeschäftprozesse umsetzt in Modelle, welche auf konzeptioneller Ebene dieGeschäftsprozesse beschreiben, die eine Lösung für diese Anforderungen sind.
Die Integration der beiden Disziplinen RE und BPM besteht in der Zusammenführungder beiden Sichten auf Systementwicklung in ein dreidimensionales Modell und diePositionierung von RE als diejenige Disziplin, welche die Grundlagen dafür liefert, dassBPM die richtigen Geschäftsprozesse konzipiert.
3.1 Drei Dimensionen der Systementwicklung
Credit Suisse verwendet in dem erwähnten Projekt die dreidimensionale Sicht auf dieSystementwicklung, welche Forsberg und Mooz in [FM91] einführten unter dem NamenVee-Model und Vee-Chart. Die drei Dimensionen sind
• Abstraktionsebenen, in Abb. 1 dargestellt in der senkrechten Dimension. CreditSuisse verwendet die Ebenen Business Request, CIM, PIM, PSM undImplementierung2.
• Anforderungen, Rahmenbedingungen und Überprüfung deren Erfüllung, inAbb. 1 dargestellt in der waagrechten Dimension. Credit Suisse verwendet u.a.die Konzepte Request, Feature und Requirement, dokumentiert in Request- undAnforderungslisten. MS Excel kommt hierbei genauso zum Einsatz wieeinschlägige Werkzeuge für das RE.
2 Zur Erläuterung der Akronyme CIM, PIM und PSM verweisen wir auf [OMG03]
207
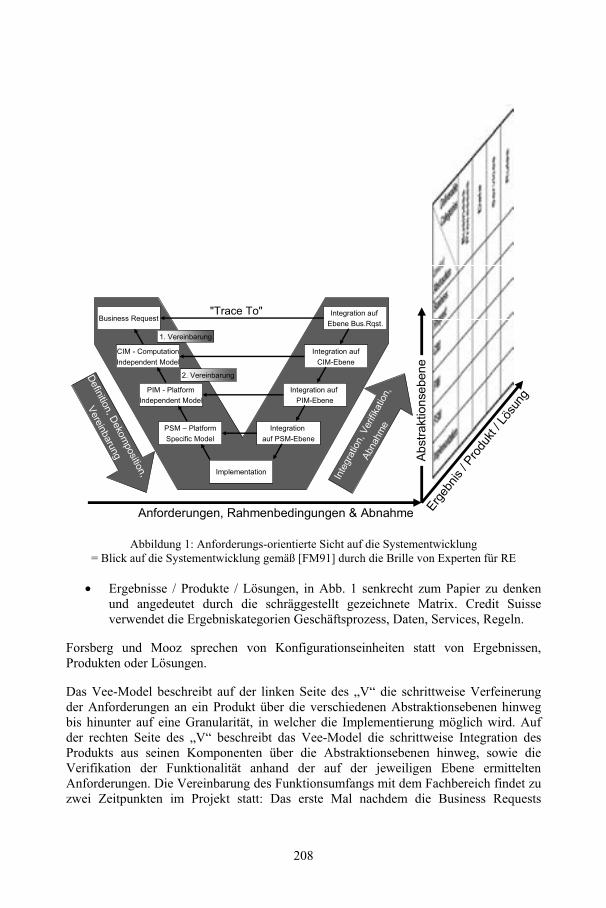
• Ergebnisse / Produkte / Lösungen, in Abb. 1 senkrecht zum Papier zu denkenund angedeutet durch die schräggestellt gezeichnete Matrix. Credit Suisseverwendet die Ergebniskategorien Geschäftsprozess, Daten, Services, Regeln.
Forsberg und Mooz sprechen von Konfigurationseinheiten statt von Ergebnissen,Produkten oder Lösungen.
Das Vee-Model beschreibt auf der linken Seite des „V“ die schrittweise Verfeinerungder Anforderungen an ein Produkt über die verschiedenen Abstraktionsebenen hinwegbis hinunter auf eine Granularität, in welcher die Implementierung möglich wird. Aufder rechten Seite des „V“ beschreibt das Vee-Model die schrittweise Integration desProdukts aus seinen Komponenten über die Abstraktionsebenen hinweg, sowie dieVerifikation der Funktionalität anhand der auf der jeweiligen Ebene ermitteltenAnforderungen. Die Vereinbarung des Funktionsumfangs mit dem Fachbereich findet zuzwei Zeitpunkten im Projekt statt: Das erste Mal nachdem die Business Requests
Anforderungen, Rahmenbedingungen & Abnahme
Abstraktionsebene
Ergebnis/ Produkt/ Lösung
Business Request
CIM - ComputationIndependent Model
PIM - PlatformIndependent Model
PSM – PlatformSpecific Model
Implementation
Integrationauf PSM-Ebene
Integration aufPIM-Ebene
Integration aufCIM-Ebene
Integration aufEbene Bus.Rqst.
Definition, Dekomposition,
Vereinbarung
"Trace To"
Integration,Verifikation,
Abnahme
1. Vereinbarung
2. Vereinbarung
Abbildung 1: Anforderungs-orientierte Sicht auf die Systementwicklung= Blick auf die Systementwicklung gemäß [FM91] durch die Brille von Experten für RE
208
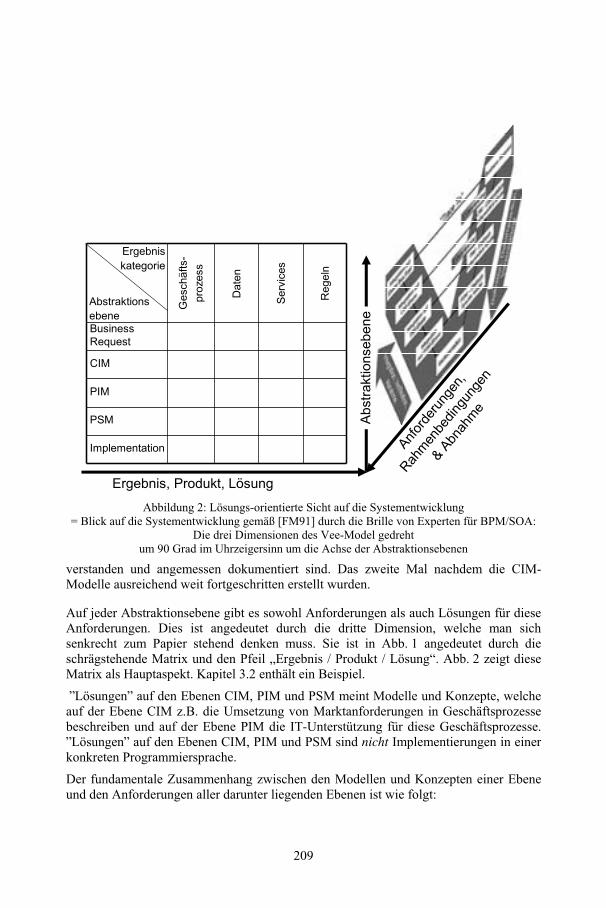
verstanden und angemessen dokumentiert sind. Das zweite Mal nachdem die CIM-Modelle ausreichend weit fortgeschritten erstellt wurden.
Auf jeder Abstraktionsebene gibt es sowohl Anforderungen als auch Lösungen für dieseAnforderungen. Dies ist angedeutet durch die dritte Dimension, welche man sichsenkrecht zum Papier stehend denken muss. Sie ist in Abb. 1 angedeutet durch dieschrägstehende Matrix und den Pfeil „Ergebnis / Produkt / Lösung“. Abb. 2 zeigt dieseMatrix als Hauptaspekt. Kapitel 3.2 enthält ein Beispiel.
"Lösungen" auf den Ebenen CIM, PIM und PSM meint Modelle und Konzepte, welcheauf der Ebene CIM z.B. die Umsetzung von Marktanforderungen in Geschäftsprozessebeschreiben und auf der Ebene PIM die IT-Unterstützung für diese Geschäftsprozesse."Lösungen" auf den Ebenen CIM, PIM und PSM sind nicht Implementierungen in einerkonkreten Programmiersprache.
Der fundamentale Zusammenhang zwischen den Modellen und Konzepten einer Ebeneund den Anforderungen aller darunter liegenden Ebenen ist wie folgt:
Anforderungen,
Rahmenbedingungen
&Abnahme
Abstraktionsebene
Ergebnis, Produkt, Lösung
Implementation
PSM
PIM
Geschäfts-
prozess
Daten
Services
Regeln
BusinessRequest
CIM
Abstraktionsebene
Ergebniskategorie
Abbildung 2: Lösungs-orientierte Sicht auf die Systementwicklung= Blick auf die Systementwicklung gemäß [FM91] durch die Brille von Experten für BPM/SOA:
Die drei Dimensionen des Vee-Model gedrehtum 90 Grad im Uhrzeigersinn um die Achse der Abstraktionsebenen
209
Die Einhaltung der Modelle und Konzepte der übergeordneten Ebenen ist implizit eineAnforderung an die Lösungen aller darunter liegenden Ebenen.
Die Abbildungen 1 und 2 zeigen und definieren anhand des Vee-Model aus [FM91] dieanforderungs- und die lösungsorientierte Sicht auf die Systementwicklung.
3.2 Ein Beispiel
Abstraktions-ebene
Anforderung Lösung
Business Request Der Fachbereich benötigtUnterstützung für die Abwick-lung von Geschäften mitphysischen Schweizer Namen-aktien
Entscheid des Fachbereichs, dieDurchführung von Lieferauf-trägen von Namenaktien als ei-genständigen Geschäftsprozesszu betrachten.
ComputationIndependentModel (CIM)
Der Geschäftsprozess ‘Liefer-auftrag Namenaktie durch-führen‘ muss umfassen, dienotwendigen Kundendokumentezu erzeugen
EPK des Geschäftsprozess‚Lieferauftrag Namenaktiedurchführen‘. Dieses EPK ent-hält die Funktion ‚Kundendo-kumente erzeugen‘.
PlatformIndependentModel (PIM)
Das System muss diejenigenKundendokumente erzeugen,deren Dokumenttypen dasSystem zuvor aus den Liefer-instruktionen des Kunden er-mittelt hat
EPK der Funktion ‚Kundendo-kumente erzeugen’. DiesesEPK enthält die Aufrufe der ITServices ‚Liste der Kundendo-kumenttypen berechnen’ und‚Kundendokumente drucken’
PlatformIndependentModel (PSM)
• System muss OraBPM alsProcess Engine verwenden
• Das Projekt muss XPDLverwenden um EPK in dieOraBPM-interne Prozess-darstellung zu transfor-mieren
• Das Projekt mussberücksichtigen, dass ARISund OraBPM den XPDLStandard unterschiedlichinterpretieren
XPDL-Datei für die FunktionKundendokumente erzeugen‘,exportiert aus ARIS undangepasst an die OraBPMImport-Funktionlität
210
Implementierung Die von der XPDL-Dateibeschriebende Funktionalität
Die nach dem Import der Dateiin die OraBPM von OraBPMerzeugte interne Repräsentation
3.3. Nutzen der gewählten Lösung
Mit dem beschriebenen Vorgehen wurde es möglich,
• zu erklären, dass Experten für RE und Experten für BPM/SOA ausunterschiedlichen Blickwinkeln auf das zu entwickelnde System schauen.
• den Experten für BPM und SOA zu erläutern, dass RE ein wesentlicherBestandteil ihrer Arbeit auch dann ist, wenn sie die Anforderungen nichtausdrücklich dokumentieren oder Anforderungsanalyse (noch) nicht alsBestandteil ihrer Tätigkeit sehen. [HFW07] zeigt ebenfalls diesen Aspekt auf
• zu erklären, weswegen die Metamodelle für BPM und SOA den Begriff„Anforderung“ nicht enthalten: Diese Metamodelle beziehen sich lediglich aufdie zweidimensionale Sicht der Experten für BPM/SOA, bestehend aus denDimensionen Abstraktionsebene und Ergebnis/Produkt/Lösung.
4 Erfahrungen aus der Anwendung der Konzepte
4.1 Anforderungs-orientierte Sicht als temporäre Sicht während der Projektarbeit,lösungs-orientierte Sicht als dauerhafte Sicht über den Lebenszyklus hinweg
Aus der Erfahrung von Credit Suisse hat es sich als wenig praktikabel erwiesen,Anforderungen in Anforderungslisten in vollem Detaillierungsgrad auszuformulierenund über den gesamten Lebenszyklus eines IT Systems hinweg zu pflegen und aktuell zuhalten: Je weiter die Spezifikationsarbeit voran schreitet, umso mehr liegt der Fokus aufder unmittelbaren Arbeit an Modellen. Die ursprünglich in Anforderungslistenaufgeschriebenen Texte müssten aufwändig und sogar redundant nachgepflegt werden.Die Motivation der Mitarbeiter für derartige Pflege ist eher wenig ausgeprägt. Inmanchen Situationen eignen sich Modelle schon für den Einstieg in die Analysearbeitbesser als textuelle Repräsentationen von Anforderungen.
Daher verwendet Credit Suisse Anforderungslisten lediglich als Mittel zurStrukturierung und Planung der Spezifikationstätigkeit innerhalb eines Projektes.Anforderungslisten verlieren ihre Bedeutung nach Projektabschluss. Bedeutung über denProjektabschluss hinaus hat die lösungsorientierte Sicht, also die Produktspezifikationen.
Nachteil dieses Vorgehens ist, dass die Begründungen und Quellen für eine bestimmteModellierung nicht vollständig nachvollziehbar sind. Die Granularität derHistorienführung bei den Modellen ist nicht geeignet, jedes Detail derAnforderungsklärung und jeden detaillierten Entscheid auch so detailliert zu
211
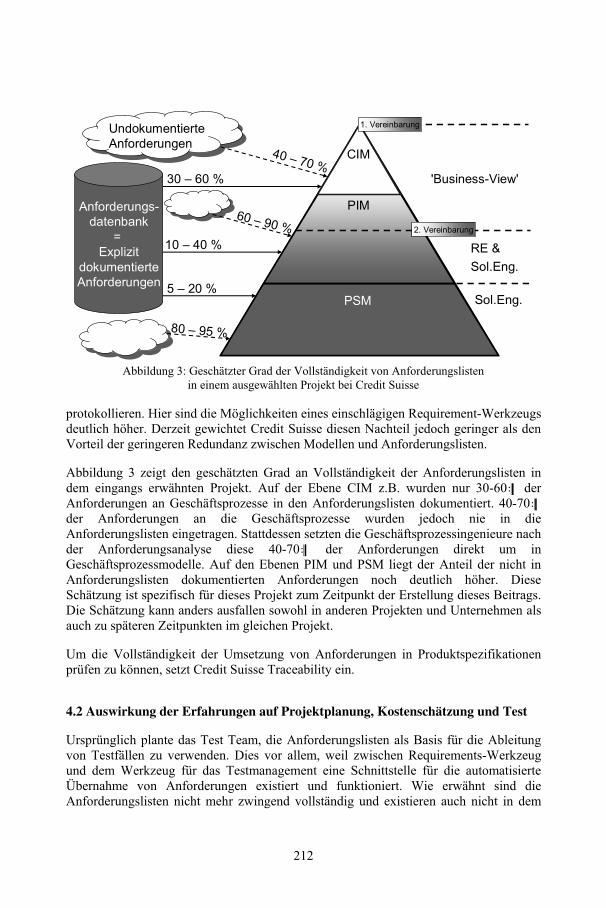
protokollieren. Hier sind die Möglichkeiten eines einschlägigen Requirement-Werkzeugsdeutlich höher. Derzeit gewichtet Credit Suisse diesen Nachteil jedoch geringer als denVorteil der geringeren Redundanz zwischen Modellen und Anforderungslisten.
Abbildung 3 zeigt den geschätzten Grad an Vollständigkeit der Anforderungslisten indem eingangs erwähnten Projekt. Auf der Ebene CIM z.B. wurden nur 30-60% derAnforderungen an Geschäftsprozesse in den Anforderungslisten dokumentiert. 40-70%der Anforderungen an die Geschäftsprozesse wurden jedoch nie in dieAnforderungslisten eingetragen. Stattdessen setzten die Geschäftsprozessingenieure nachder Anforderungsanalyse diese 40-70% der Anforderungen direkt um inGeschäftsprozessmodelle. Auf den Ebenen PIM und PSM liegt der Anteil der nicht inAnforderungslisten dokumentierten Anforderungen noch deutlich höher. DieseSchätzung ist spezifisch für dieses Projekt zum Zeitpunkt der Erstellung dieses Beitrags.Die Schätzung kann anders ausfallen sowohl in anderen Projekten und Unternehmen alsauch zu späteren Zeitpunkten im gleichen Projekt.
Um die Vollständigkeit der Umsetzung von Anforderungen in Produktspezifikationenprüfen zu können, setzt Credit Suisse Traceability ein.
4.2 Auswirkung der Erfahrungen auf Projektplanung, Kostenschätzung und Test
Ursprünglich plante das Test Team, die Anforderungslisten als Basis für die Ableitungvon Testfällen zu verwenden. Dies vor allem, weil zwischen Requirements-Werkzeugund dem Werkzeug für das Testmanagement eine Schnittstelle für die automatisierteÜbernahme von Anforderungen existiert und funktioniert. Wie erwähnt sind dieAnforderungslisten nicht mehr zwingend vollständig und existieren auch nicht in dem
40 – 70 %
60 – 90 %
80 – 95 %
CIM
PIM
PSM
'Business-View'
RE &Sol.Eng.
Sol.Eng.
30 – 60 %
10 – 40 %
5 – 20 %
2. Vereinbarung
1. VereinbarungUndokumentierteAnforderungenUndokumentierteAnforderungen
Anforderungs-datenbank
=Explizit
dokumentierteAnforderungen
Abbildung 3: Geschätzter Grad der Vollständigkeit von Anforderungslistenin einem ausgewählten Projekt bei Credit Suisse
212
Detailgrad, welcher für die Ableitung von Testfällen erforderlich wäre. Ein alternativesVorgehen ist deswegen erforderlich und wird derzeit ausgearbeitet. Es bietet sich an, dieTestfälle aus den Modellen abzuleiten. Eine Schnittstelle zur automatisierten Übernahmevon Modellen in das Werkzeug für das Testmanagement ist derzeit jedoch nicht bekannt.
Ähnliches gilt für die Kostenschätzung. Die Projektleitung wünscht für dieVerhandlungen mit dem Projektauftraggeber eine Kostenschätzung pro Anforderung.Derart geschätzte Kosten, über alle Anforderungen der Anforderungsliste summiert,würden jedoch nicht die Gesamtkosten beziffern. Eine Kostenschätzung auf Basis derProduktspezifikationen erscheint unumgänglich, könnte jedoch weniger leicht mit demFachbereich verhandelbar sein. Das am Ende geeignete Verfahren ist noch nichtfestgelegt.
Die Projektleitung hat für ein Vorgehen gemäss SCRUM entschieden. Dies nicht nur fürdie Programmierung, sondern auch dort, wo es um die Erstellung von Modellen undanderer Dokumentation geht. Ursprünglich war angedacht, die Inhalte jeder Iteration aufBasis von Anforderungen zu planen. Es zeigt sich, dass die Mitarbeiter eineIterationsplanung auf Basis von zu implementierenden Produktspezifikationenbevorzugen.
4.3 Wie passen Use Cases zu Geschäftsprozessmodellierung und SOA?
Zu Beginn des Projektes überwog die Ansicht, dass der Begriff „Use Case“ seineBedeutung verliert, wenn Geschäftsprozesse so weit ausmodelliert werden, dass sieautomatisch in eine Business Process Engine transformierbar sind und noch im Modellmit IT Services verknüpft werden können. Gestützt hat diese These Ivar Jacobsonanlässlich eines Referates bei Credit Suisse. Er vertrat die Ansicht, dass „BusinessProcess“ und „Business Use Case“ synonym verwendbare Begriffe sind. Denkt mandiese Analogie weiter, könnte man das aus [COCK05] bekannte Konzept "System UseCase" auch "System Process" nennen. Ungewöhnlich zwar, aber möglich. Credit Suissehat entschieden, von "Business Process" (gibt es auf Ebene CIM und PIM) und"(System) Use Case" (gibt es auf Ebene PIM) zu sprechen.
• Erfahrene Geschäftsprozessmodellierer bei Credit Suisse ziehen eine Analogiezwischen der Spezifikation eines System Use Case mittels EPK und dergrafischen Modellierung der in einer Java-Methode programmiertenFunktionalität z.B. mittels Sequenzdiagrammen: Einen System Use Case sollteman textuell beschreiben.
• Die Integration von Geschäftsprozessmodellen, anderen Modellen und ProcessEngines ist nicht nahtlos, die Umsetzung der Visionen von SOA daher nochnicht möglich. Also gibt es derzeit nicht die Notwendigkeit, im EPK auchdiejenigen Details einschliesslich der aufgerufenen IT Services zu modellieren,die Credit Suisse derzeit in Use Case Spezifikationen textuell beschreibt.
• In der Methodik der Credit Suisse ist der Begriff „Use Case“ tief verankert. Aufihn zu verzichten hätte einer umfänglichen Überzeugungsarbeit bedurft, welcheangesichts der bereits erwähnten Argumente, insbesondere der nicht nahtlos
213
miteinander integrierten Modelle und Process Engines, schwierig zu leistengewesen wäre.
5 Zusammenfassung
Die Erfahrungen von Credit Suisse deuten darauf hin, dass produkt-orientierteSpezifikation von Anforderungen den Erfordernissen der Lösungsentwicklung imUmfeld von BPM und SOA besser gerecht wird als eine detaillierte textuelleAusformulierung von Anforderungen in Form von Anforderungslisten. Trotzdem helfenAnforderungslisten, den Prozess der Anforderungsspezifikation zu planen und zustrukturieren. Insofern ergibt es weiterhin Sinn, eine anforderungs-orientierte und einelösungs-orientierte Sicht voneinander zu trennen und das Sammeln von Anforderungenals Aktivität in der Lösungsentwicklung nicht nur zuzulassen, sondern einzufordern.
Noch nicht vollständig abgeschlossen sind bei Credit Suisse die Überlegungen, welcheKonsequenzen sich aus dieser Erkenntnis für die Organisation von Tests, dieKostenschätzung, deren Verhandlung mit dem Auftraggeber, und die Projektplanungergeben. Entsprechende Erfahrungen wird Credit Suisse anlässlich des geplantenWorkshops jedoch berichten können.
Literaturverzeichnis
[COCK05] Alistair Cockburn, "Writing Effective Use Cases", Addison-Wesley, 2005[FM91] Kevin Forsberg, Harold Mooz, “The Relationship of System Engineering to the Project
Cycle”, presented at the joint conference sponsored by: National Council On SystemsEngineering (NCOSE) and American Society for Engineering Management (ASEM),Chattanooga, TN, 21–23 October 1991, abrufbarhttp://www.csm.com/repository/model/rep/o/pdf/Relationship% 20of% 20SE% 20to% 20Proj% 20Cycle.pdf
[HFW07] Andrea Herrmann, Ralf Fahney, Rüdiger Weißbach, “Wie viel RequirementsEngineering steckt im Software Engineering” im gleichnamigen Workshop, Hamburg,Deutschland, März 2007, abrufbar:http://www.repm.de/docspublic/SE2007workshop/Wieviel_RE_StecktIm_SE_onlineversion.pdf
[OMG03] Joaquin Miller, Jishnu Mukerji, "MDA Guide Version 1.0.1", 2003, abrufbar:http://www.omg.org/docs/omg/03-06-01.pdf
214
Bridging Requirements Engineering and Business ProcessManagement
Ken Decreus1♣, M. El Kharbili2♣, Geert Poels1, Elke Pulvermueller3
1 Faculty of Economics and Business Administration, Ghent University, Belgium.{ken.decreus | geert.poels}@ugent.be
2 ARIS Research, IDS Scheer AG, Altenkesseler Str. 17, D-66115 Saarbrücken,Germany. [email protected]
3 Institute of Computer Science, University of Osnabrück, Albrechtstr. 28, 49076,Germany. [email protected]
Abstract: Requirement elicitation is one of the earliest phases of a requirementengineering lifecycle. However, even though years of research have gone intoseeking machine support for requirements engineering, the methods used are stillhighly manual and the vision of automatic transfer of business analysisrequirements into IT systems supporting the business is still far from reach. On theother hand, incepting knowledge for creating AS-IS business processes inenterprise models has been recognized as a hard problem. In the context of aprocess centric organization, we propose an approach to create AS-IS businessprocess models by automatically transferring requirements to the business processlayer. Our aim is to enable carrying business requirements, goals and policies froman inception layer to the operational business process management layer. We placeour research in the context of a semantic business process management platform(SUPER) as the support to exploit the output of our research. This paper groundsthis research work and proposes a research design for requirement elicitation forproducing early-phase business process models that are nearer to the businessanalysis layer.
1 Introduction
Since the introduction of information systems in the 1960s, enterprises could benefitfrom automating business processes. Although the areas of business processmanagement (BPM) and information system development (ISD) are closely intertwined,the usage of conceptual modelling differs significantly in both fields [GI01]. BPMprefers to use conceptual models for communication and analysis purposes [AG04],whereas ISD employs business process models during the requirements engineering(RE) phase [MY98]. The first phase in BPM entails creating business process modelsusing a conceptual modelling grammar (e.g. BPMN [OMG08] or EPC [KE92]), whichwill serve as input for subsequent business process design and transformed intoexecutable models (e.g. BPEL [BPEL07]). Typically, a software engineering project
♣ Both authors are first authors
215
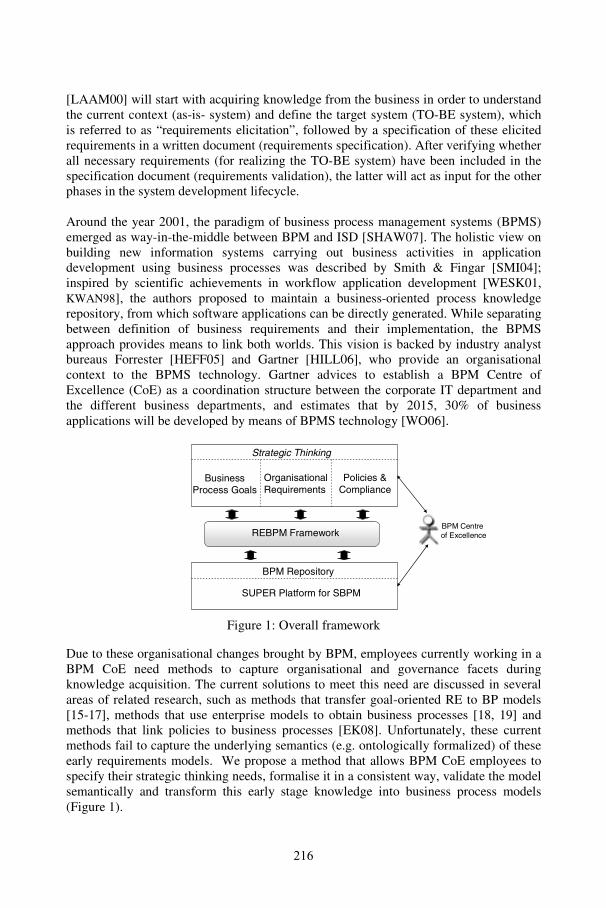
[LAAM00] will start with acquiring knowledge from the business in order to understandthe current context (as-is- system) and define the target system (TO-BE system), whichis referred to as “requirements elicitation”, followed by a specification of these elicitedrequirements in a written document (requirements specification). After verifying whetherall necessary requirements (for realizing the TO-BE system) have been included in thespecification document (requirements validation), the latter will act as input for the otherphases in the system development lifecycle.
Around the year 2001, the paradigm of business process management systems (BPMS)emerged as way-in-the-middle between BPM and ISD [SHAW07]. The holistic view onbuilding new information systems carrying out business activities in applicationdevelopment using business processes was described by Smith & Fingar [SMI04];inspired by scientific achievements in workflow application development [WESK01,KWAN98], the authors proposed to maintain a business-oriented process knowledgerepository, from which software applications can be directly generated. While separatingbetween definition of business requirements and their implementation, the BPMSapproach provides means to link both worlds. This vision is backed by industry analystbureaus Forrester [HEFF05] and Gartner [HILL06], who provide an organisationalcontext to the BPMS technology. Gartner advices to establish a BPM Centre ofExcellence (CoE) as a coordination structure between the corporate IT department andthe different business departments, and estimates that by 2015, 30% of businessapplications will be developed by means of BPMS technology [WO06].
SUPER Platform for SBPM
BPM Repository
Strategic Thinking
BusinessProcess Goals
OrganisationalRequirements
Policies &Compliance
REBPM FrameworkBPM Centreof Excellence
Figure 1: Overall framework
Due to these organisational changes brought by BPM, employees currently working in aBPM CoE need methods to capture organisational and governance facets duringknowledge acquisition. The current solutions to meet this need are discussed in severalareas of related research, such as methods that transfer goal-oriented RE to BP models[15-17], methods that use enterprise models to obtain business processes [18, 19] andmethods that link policies to business processes [EK08]. Unfortunately, these currentmethods fail to capture the underlying semantics (e.g. ontologically formalized) of theseearly requirements models. We propose a method that allows BPM CoE employees tospecify their strategic thinking needs, formalise it in a consistent way, validate the modelsemantically and transform this early stage knowledge into business process models(Figure 1).
216
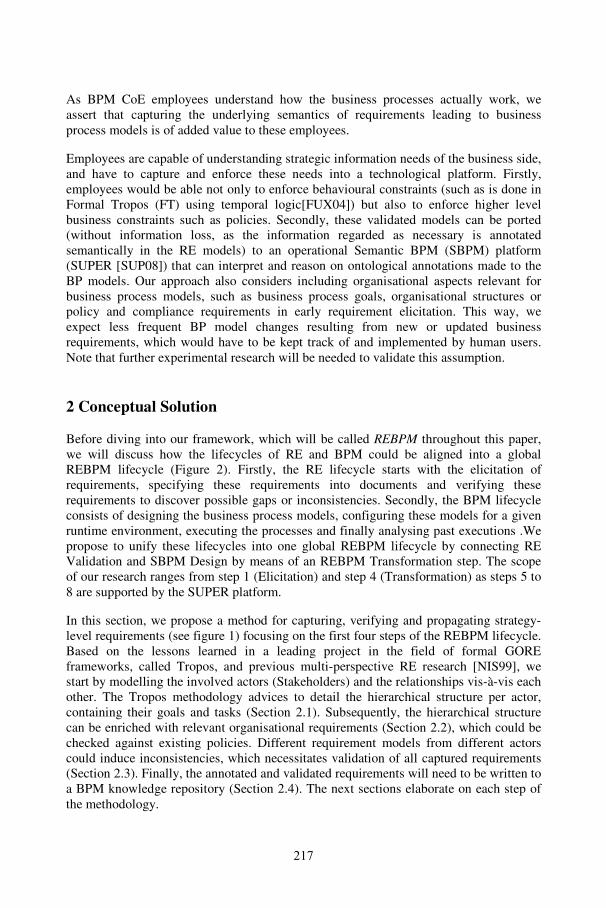
As BPM CoE employees understand how the business processes actually work, weassert that capturing the underlying semantics of requirements leading to businessprocess models is of added value to these employees.
Employees are capable of understanding strategic information needs of the business side,and have to capture and enforce these needs into a technological platform. Firstly,employees would be able not only to enforce behavioural constraints (such as is done inFormal Tropos (FT) using temporal logic[FUX04]) but also to enforce higher levelbusiness constraints such as policies. Secondly, these validated models can be ported(without information loss, as the information regarded as necessary is annotatedsemantically in the RE models) to an operational Semantic BPM (SBPM) platform(SUPER [SUP08]) that can interpret and reason on ontological annotations made to theBP models. Our approach also considers including organisational aspects relevant forbusiness process models, such as business process goals, organisational structures orpolicy and compliance requirements in early requirement elicitation. This way, weexpect less frequent BP model changes resulting from new or updated businessrequirements, which would have to be kept track of and implemented by human users.Note that further experimental research will be needed to validate this assumption.
2 Conceptual Solution
Before diving into our framework, which will be called REBPM throughout this paper,we will discuss how the lifecycles of RE and BPM could be aligned into a globalREBPM lifecycle (Figure 2). Firstly, the RE lifecycle starts with the elicitation ofrequirements, specifying these requirements into documents and verifying theserequirements to discover possible gaps or inconsistencies. Secondly, the BPM lifecycleconsists of designing the business process models, configuring these models for a givenruntime environment, executing the processes and finally analysing past executions .Wepropose to unify these lifecycles into one global REBPM lifecycle by connecting REValidation and SBPM Design by means of an REBPM Transformation step. The scopeof our research ranges from step 1 (Elicitation) and step 4 (Transformation) as steps 5 to8 are supported by the SUPER platform.
In this section, we propose a method for capturing, verifying and propagating strategy-level requirements (see figure 1) focusing on the first four steps of the REBPM lifecycle.Based on the lessons learned in a leading project in the field of formal GOREframeworks, called Tropos, and previous multi-perspective RE research [NIS99], westart by modelling the involved actors (Stakeholders) and the relationships vis-à-vis eachother. The Tropos methodology advices to detail the hierarchical structure per actor,containing their goals and tasks (Section 2.1). Subsequently, the hierarchical structurecan be enriched with relevant organisational requirements (Section 2.2), which could bechecked against existing policies. Different requirement models from different actorscould induce inconsistencies, which necessitates validation of all captured requirements(Section 2.3). Finally, the annotated and validated requirements will need to be written toa BPM knowledge repository (Section 2.4). The next sections elaborate on each step ofthe methodology.
217
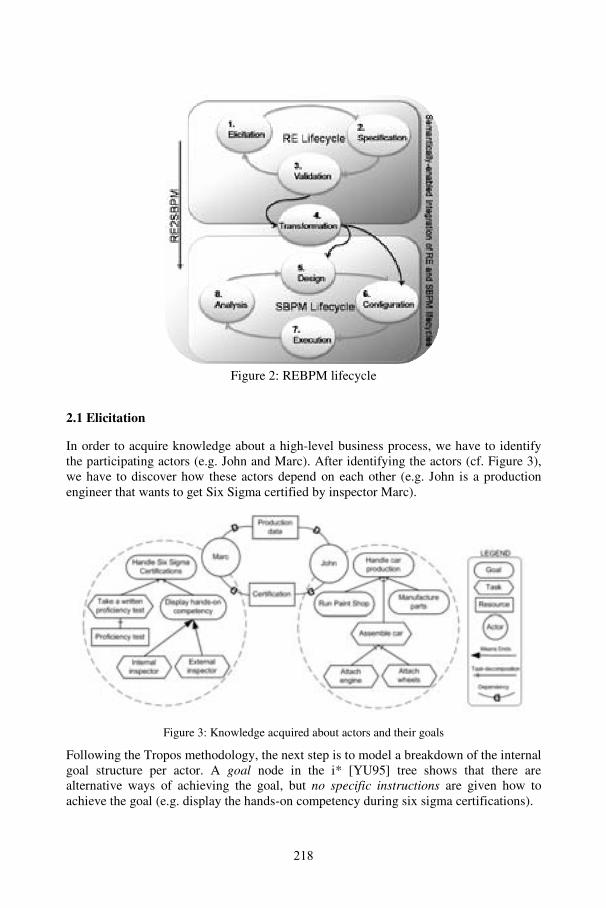
Figure 2: REBPM lifecycle
2.1 Elicitation
In order to acquire knowledge about a high-level business process, we have to identifythe participating actors (e.g. John and Marc). After identifying the actors (cf. Figure 3),we have to discover how these actors depend on each other (e.g. John is a productionengineer that wants to get Six Sigma certified by inspector Marc).
Figure 3: Knowledge acquired about actors and their goals
Following the Tropos methodology, the next step is to model a breakdown of the internalgoal structure per actor. A goal node in the i* [YU95] tree shows that there arealternative ways of achieving the goal, but no specific instructions are given how toachieve the goal (e.g. display the hands-on competency during six sigma certifications).
218
A task node shows that we specifically know what to do but there are constraints on howto do it (e.g. having an external inspector checking the hands-on competency). Aresource node shows that there is a need for a certain resource (e.g. finding theproficiency test). Furthermore, means-ends links point to alternative means to reach oneend (e.g. the hands-on competency can be checked by an internal or external inspector),and task-decomposition links allow to refine tasks in terms of other intentional elements(e.g. assemble car could be refined into attaching the engine and adding wheels onto thecar). Note that Figure 3 the environment of the system-to-be during this early RE phase,not the actual requirements of the system.
2.2 Specification
During the specification, a modeller uses a graphical modelling environment to createthe elicited i* model (as displayed in Figure 3). As we need powerful formal techniquesto translate goal models into business process models, the modelling environment willautomatically transform the graphical i* representation into Formal Tropos (FT)specifications [FUX04]. Assuming that the necessary organisational ontologies areloaded into the graphical modelling environment, the modeller should attach (bydragging-and-dropping) ontological annotations onto the graphical i* elements, whichagain will be automatically written in the underlying Formal Tropos specification.Taking the SUPER ontology stack as inspiration, we consider annotations BusinessRole, Business Function, Business Domain, Business Process Goal and Business Policy.The result of these steps are fully annotated FT specifications, containing references torelevant strategic thinking needs. Applied to our car manufacturer example, Table 1briefly illustrates these annotations.
i* Concept AnnotationActor ‘Marc’ Business Role ‘Six Sigma Certifier’Actor ‘Marc’ Business Function ‘Quality Control’Goal ‘Handle 6S Certifications’ Business Domain ‘6S Terminology’Goal ‘Display hands-on competency’ Business Process Goal
‘Display hands-on competency’Dependency ‘Certification’ Business Policy ‘Separation of Duty’
Table 1: Example annotations
2.3 Verification
Based on the experience of Nissen and Jarke [NIS99], all captured requirements shouldbe validated and inconsistencies should be tracked. The formalised validations have tosupport the creative process of gathering requirements by pointing out where possibleerrors are situated and by stimulating the Business Analyst with proper feedback. Forinstance, although we modelled the Business Policy ‘Separation of Duty’ between Marc(with Business Role ‘Six Sigma Certifier’) and John (with Business Role ‘ProductionEngineer’), no policies have yet been enforced. The rules defined by Business Policy‘Separation of Duty’ state that the person who runs the six sigma certification shoulddiffer from the one running the examined production factory.
219
The description of the need for and use to be made of such compliance checks is given in[EK08] in the context of BPM. Our work here is analogue to [EK08], but placed in thecontext of early requirements.
2.4 Transformation
After capturing the high-level requirements and refining them into detailed tasks peractor, annotating them with organisational and policy information while trackinginconsistencies, the acquired knowledge should be written to a BPM knowledgerepository. Distinguishing semantic repositories from non-semantic tools, the ones beingsemantic are both IT-oriented (accompanying the process engineer towards configuringand deploying BPs) while at the same time providing anchor points to domain andstrategy level models through ontologies (e.g. SUPER [SUP08]). This knowledge canalso be reused during analysis and optimization phases on a stronger business-orientedlevel. Non-semantic tools are either being strategy-crafted and cover a whole enterprisemodel but only offer limited integrated IT support (e.g. ARIS1 [SC00]), or areoverwhelmingly IT oriented and primarily seek to put BPs in production environments(e.g. ORACLE BPEL Manager2).
FT construct BPMO constructActor Actor &
Element from BusinessFunctionsOntologyGoal Process (Top Goal) / SubProcess (Children)Task GoalTask / WebServiceTask / ManualTaskSoftgoal Element from BusinessGoalOntologyResource Element from BusinessDomainOntologyEntity Element from BusinessDomainOntology
Table 2: FT2BPMO Concept Mappings
When applying the Formal Tropos specifications to the semantic BPM repository calledSUPER, we will employ the transformations proposed by Decreus & Poels [DE00]. Theauthors use the Business Process Modelling Ontology (BPMO) language [SUP08] as thecentral integration layer to connect Formal Tropos to, of which the mappings can besummarized in Table 2.
instance HandleSixSigmaCertifications memberOf ProcesshasName hasValue "Handle Six Sigma Certifications"hasActor hasValue MarchasWorkflow hasValue MyWorkflowhasBusinessFunction hasValue Ontology_BusinessFunction#ExaminationCentrehasBusinessRole hasValue Ontology_BusinessRole#SixSigmaInspectorhasBusinessProcessGoal hasValue Ontology_BusinessGoal#HonestyhasBusinessDomain hasValue Ontology_BusinessDomain#SixSigmaTerminology
Figure 4: example FT2BPMO output
1 www.aris.com2 http://www.oracle.com/technology/bpel/index.html. .
220
For instance, when we apply these FT2BPMO mappings to our running example, weobtain (partially) an output as displayed in Figure 4. The i* goal to handle six sigmacertifications could be annotated with information about the Business Function, BusinessRole, Business Process Goal and Business Domain. Future work should focus onextending the complete Formal Tropos grammar to include all mappings and conceptsshortly discussed in this paper.
6 Conclusion
This paper has presented a research design for coping with the lack of methodologicaland tool support for automated requirement propagation from strategy thinking layersinto business implementation layers as well as support for elicitation of AS-IS BPmodels. We showed that both scenarios were not yet tackled by current research in asatisfying manner. The setting regarded is that of a BP-oriented enterprise, where value-creating activities are modelled and executed based on BP models. This work claims thatusing goal-based requirement engineering methods for early-phase requirementelicitation makes it possible to create valid (with regard to business requirements) BPmodels, thus providing more control over the behaviour of the enterprise. The resultspresented here are of a conceptual nature and neither do we give a formal extension tothe RE methods yet, nor do we provide tool support for the proposed approach.Nevertheless, this work lays the ground to a software prototype based on the findingspresented for automated generation of enterprise models and semantic BP models out offormal strategy-level requirements. In particular, the implications of this work for early-phase modelling of goals, strategies, policies, and compliance guidelines will be key toshowcase the added value of our approach.
References
[GI01] G. M. Giaglis, "A Taxonomy of Business Process Modeling and Information SystemsModeling Techniques," International Journal of Flexible Manufacturing Systems, vol.13, pp. 209-228, 2001.
[AG04] R. S. Aguilar-Saven, "Business process modelling: Review and framework," InternationalJournal of Production Economics, vol. 90, pp. 129-149, 2004.
[MY98] J. Mylopoulos, "Information modeling in the time of the revolution," InformationSystems, vol. 23, pp. 127-155, 1998.
[OMG08] Object Management Group, "BPMN 1.1 specification," retrieved on 01.10.2008 from:http://www.bpmn.org/Documents/BPMN%201-1%20Specification.pdf, 2008.
[KE92] G. Keller, M. Nüttgens, and A. W. Scheer, "Semantische Prozessmodellierung auf derGrundlage Ereignisgesteuerter Prozessketten (EPK)," Universität des Saarlandes, 1992.
[BPEL07] OASIS, "Business Process Execution Language specification. Version 2.0,"Retrieved on 01.10.2008 from: http://docs.oasis-open.org/wsbpel/2.0/OS/wsbpel-v2.0-OS.html, 2007.
[LAAM00] A. van Lamsweerde, "Requirements engineering in the year 00: a researchperspective," in Proceedings of the 22nd ICSE Limerick, Ireland: ACM, 2000.
221
[SHAW07] D. R. Shaw, C. P. Holland, P. Kawalek, B. Snowdon, and B. Warboys,"Elements of a business process management system: theory and practice," BusinessProcess Management Journal, vol. 13, pp. 91-107, 2007.
[SMI04] H. Smith and P. Fingar, Business Process Management (BPM): The Third Wave, 2004.[WESK01] M. Weske, T. Goesmann, R. Holten, and R. Striemer, "Analysing, modelling and
improving workflow application development processes," Software Process:Improvement and Practice, vol. 6, pp. 35-46, 2001.
[KWAN98] M. M. Kwan and P. R. Balasubramanian, "Adding Workflow Analysis Techniques tothe IS Development Toolkit," in Proceedings of the Thirty-First Annual HawaiiInternational Conference on System Sciences-Volume 4 - Volume 4: IEEE ComputerSociety, 1998.
[HEFF05] R. Heffner, "Digital Business Architecture: IT Foundation For Business Flexibility,"Forrester Research, 2005.
[HILL06]J. Hill, J. Sinur, D. Flint, and M. Melenovsky, "Gartner's Position on Business ProcessManagement," Gartner Research, 2006.
[WO06] J. Woods and Y. Genovese, "Delivery of Commodity Business Applications in a BPMSDoes Not Mean You Should Customize the Applications," Gartner Research, vol.G00139084, 2006.
[KAZH04] R. Kazhamiakin, M. Pistore, and M. Roveri, "A Framework for IntegratingBusiness Processes and Business Requirements," in Proceedings of the EnterpriseDistributed Object Computing Conference, Eighth IEEE International: IEEE ComputerSociety, 2004.
[LAMP07] A. Lapouchnian, Y. Yu, and J. Mylopoulos, "Requirements-Driven Design andConfiguration Management of Business Processes," in Business Process Management,2007, pp. 246-261.
[KO06] G. Koliadis, A. Vranesevic, M. Bhuiyan, A. Krishna, and A. Ghose, "Combining i* andBPMN for Business Process Model Lifecycle Management," in Business ProcessManagement Workshops, 2006, pp. 416-427.
[DI06] J. Dietz, Enterprise Ontology: Theory and Methodology: Springer-Verlag New York,Inc., 2006.
[BU94] J. A. Bubenko and M. Kirikova, ""Worlds" in Requirements Acquisition and Modelling,"in 4th European Japanese Seminar on Information Modelling and Knowledge BasesStockholm, 1994.
[EK08] M. El Kharbili, S. Stein, I. Markovic, and E. Pulvermüller, "Towards a Framework forSemantic Business Process Compliance Management," In Shazia Sadiq, M. z. M. (ed.),Proceedings of the workshop on Governance, Risk and Compliance for InformationSystems (GRCIS 2008), CEUR Workshop Proceedings, Montepellier, France, pp. 1-15,2008.
[SUP08] SUPER, "All deliverables," http://www.ip-super.org/content/view/32/66/, 2008.[NIS99] H. W. Nissen and M. Jarke, "Repository support for multi-perspective requirements
engineering," Information Systems, vol. 24, pp. 131-158, 1999.[YU95] E. S.-K. Yu, "Modelling strategic relationships for process reengineering," University of
Toronto, 1995, p. 181.[FUX04] A. Fuxman, L. Liu, J. Mylopoulos, M. Pistore, M. Roveri, and P. Traverso, "Specifying
and analyzing early requirements in Tropos," Requirements Engineering, vol. 9, pp. 132-150, 2004.
[SC00] A.-W. Scheer, ARIS - Business Process Modeling: Springer-Verlag New York, Inc., 2000.[DE00] K. Decreus and G. Poels, "Mapping Semantically Enriched Formal Tropos to Business
Process Models," Proceedings of the ACM SAC 2009 (Hawaii) - Track RequirementsEngineering (To be published), 2009.
222
Qualität von Geschäftsprozessen undUnternehmenssoftware – Eine Thesensammlung
Barbara Paech1, Andreas Oberweis2, Ralf Reussner3
1Lehrstuhl für Software Systeme, Universität Heidelberg2Institut AIFB, Universität Karlsruhe (TH)
3Institut für Programmstrukturen und Datenorganisation, Universität Karlsruhe (TH)
[email protected] | [email protected]| [email protected]
Abstract: In diesem Positionspapier betrachten wir die Integration vonGeschäftsprozess- und Unternehmenssoftware-Gestaltung unter dem Aspekt derQualität. Wichtige Fragen sind dabei z.B. An welcher Stelle im Unternehmen undim Software-Entwicklungszyklus entstehen Qualitätsanforderungen? Wiebeeinflussen sich diese gegenseitig? Wie kann man sie am besten umsetzen? Wiekann man sie am besten überprüfen? Dieses Positionspapier beschreibt die ausSicht der AutorInnen wichtigsten Herausforderungen bei dieser Integration.
1 Einleitung
Unternehmenssoftware (im folgenden mit US abgekürzt) und Geschäftsprozesse sindeng miteinander verzahnt. Aufgabe der US ist die Unterstützung der Geschäftsprozesseeines Unternehmens. Insofern ergeben sich die Anforderungen an die US aus denGeschäftsprozessen. Auf der anderen Seite beeinflussen aber auch Innovationen auf US-Seite die Gestaltungsmöglichkeiten der Geschäftsprozesse (im folgenden mit GPabgekürzt).
Das traditionelle Wasserfallmodell für die Softwareentwicklung unterstützt dieseintegrierte Sichtweise nicht. Die Anforderungen an die US werden isoliert von denAnforderungen der GP ermittelt und umgesetzt. Auch die traditionelle GP-Gestaltung(Business Process Engineering, BPE) ist zu sehr orientiert an dem Ist-Zustand der USund vernachlässigt vielfach die durch US gegebenen Verbesserungsmöglichkeiten. Oftermöglichen neue Plattformen und Dienstkonzepte neuartige GP. So erhöhen z.B.verteilte Middleware-Plattformen wie Web-Services und externe Provider „server-seitiger“ Dienste nicht nur die Flexibilität bereits modellierter GP, sondern erlauben auchgänzlich neue. Weiterhin verringert die Wiederverwendung von US-Diensten die US-Kosten wesentlich. Deshalb ist es oft lohnend, diese wieder verwendbaren Dienste beider GP-Gestaltung zu berücksichtigen.
223
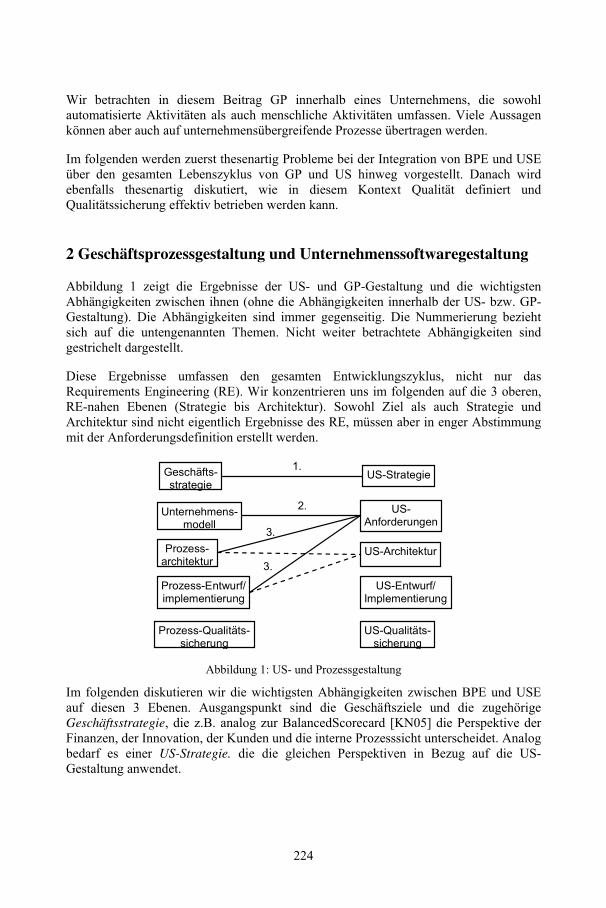
Wir betrachten in diesem Beitrag GP innerhalb eines Unternehmens, die sowohlautomatisierte Aktivitäten als auch menschliche Aktivitäten umfassen. Viele Aussagenkönnen aber auch auf unternehmensübergreifende Prozesse übertragen werden.
Im folgenden werden zuerst thesenartig Probleme bei der Integration von BPE und USEüber den gesamten Lebenszyklus von GP und US hinweg vorgestellt. Danach wirdebenfalls thesenartig diskutiert, wie in diesem Kontext Qualität definiert undQualitätssicherung effektiv betrieben werden kann.
2 Geschäftsprozessgestaltung und Unternehmenssoftwaregestaltung
Abbildung 1 zeigt die Ergebnisse der US- und GP-Gestaltung und die wichtigstenAbhängigkeiten zwischen ihnen (ohne die Abhängigkeiten innerhalb der US- bzw. GP-Gestaltung). Die Abhängigkeiten sind immer gegenseitig. Die Nummerierung beziehtsich auf die untengenannten Themen. Nicht weiter betrachtete Abhängigkeiten sindgestrichelt dargestellt.
Diese Ergebnisse umfassen den gesamten Entwicklungszyklus, nicht nur dasRequirements Engineering (RE). Wir konzentrieren uns im folgenden auf die 3 oberen,RE-nahen Ebenen (Strategie bis Architektur). Sowohl Ziel als auch Strategie undArchitektur sind nicht eigentlich Ergebnisse des RE, müssen aber in enger Abstimmungmit der Anforderungsdefinition erstellt werden.
Unternehmens-modell
Prozess-architektur
Prozess-Entwurf/implementierung
Prozess-Qualitäts-sicherung
US-Anforderungen
US-Architektur
US-Entwurf/Implementierung
US-Qualitäts-sicherung
Geschäfts-strategie
US-Strategie1.
2.
3.
3.
Abbildung 1: US- und Prozessgestaltung
Im folgenden diskutieren wir die wichtigsten Abhängigkeiten zwischen BPE und USEauf diesen 3 Ebenen. Ausgangspunkt sind die Geschäftsziele und die zugehörigeGeschäftsstrategie, die z.B. analog zur BalancedScorecard [KN05] die Perspektive derFinanzen, der Innovation, der Kunden und die interne Prozesssicht unterscheidet. Analogbedarf es einer US-Strategie. die die gleichen Perspektiven in Bezug auf die US-Gestaltung anwendet.
224
1.These: Es ist allgemein akzeptiert, dass die Geschäfts- und die US-Strategieaufeinander abgestimmt werden müssen. Es gibt aber nur wenige konkrete Ansätze, wiediese Abstimmung durchzuführen ist [PA08]. An dieser Stelle werden auchQualitätsziele und -maße definiert, einerseits für das Unternehmen, andererseits für dieUS. Es gibt keine methodisch fundierten Ansätze zu ihrer Abstimmung.
Basierend auf der Geschäftsstrategie wird das Unternehmensmodell, d.h. die Aufgaben,Verantwortlichkeiten, Leistungen und Verfahren eines Unternehmens, definiert.Basierend auf der US-Strategie werden funktionale und nicht-funktionale US-Anforderungen definiert
2. These: Das Unternehmensmodell ist der Ausgangspunkt für US- und die GP-Gestaltung. Es fehlen klare Methoden zur Definition eines Unternehmensmodells[LZ06]. Bisherige Ansätze zum USE (wie typische SWE-Vorgehensmodelle)berücksichtigen viel zu wenig dieses Modell. Die US-Anforderungen müssen sich an denkonkreten Aufgaben und Leistungsanforderungen des Unternehmens orientieren.
Die Prozessarchitektur (in [EHH+08] auch Geschäftsarchitektur genannt) definiert dieAkteure, Aktivitäten und Objekte zur Umsetzung der im Unternehmensmodelldefinierten Aufgaben, Leistungen und Verfahren. Die US-Architektur definiert diephysischen und logischen Komponenten und deren Vernetzung zur Umsetzung der US-Anforderungen.
3. These: Typischerweise wird in service-orientierten Ansätzen die ideale Abstimmungzwischen Prozessarchitektur/ -entwurf/ -implementierung und US-Architekturuntersucht. Die Abhängigkeiten zwischen US-Anforderungen und Prozessarchitektur / –entwurf und –implementierung werden allerdings vernachlässigt. Da sich viele US-Anforderungen direkt in US-Komponenten wiederfinden, ist diese Vernachlässigung vorallem bei übergreifenden Anforderungen wie Qualitätsanforderungen spürbar. Weiterhinfehlen konkrete Maße für die Güte der Abstimmung zwischen Prozess- und US-Architektur.
Insgesamt lässt sich feststellen, dass es einige Ansätze für die Integration von USE undBPE auf der Strategieebene und auf der Architekturebene gibt, aber nicht auf der Ebenevon Anforderungen, die das Bindeglied zwischen Strategie und Architektur darstellen.Wünschenswert wäre ein durchgängiges Concurrent Engineering von US und GP, beider USE an jeder Stelle so früh wie möglich mit dem BPE abgestimmt wird und damitfrühzeitig Feedback an das BPE geben kann. Concurrent Engineering unterstützt denLebenszyklus von GP und US in einem integrierten Ansatz, der alle Phasen von derStrategiedefinition über den Entwurf bis zum Einsatz methodisch unterstützt.
225
3 Integriertes Qualitätsmanagement
Die Qualität der Produkte und Dienste eines Unternehmens hängt sowohl von derQualität der GP als auch von der Qualität der US ab. Im folgenden wird näheruntersucht, wie und an welcher Stelle das Qualitätsmanagement für US und GP integriertwerden kann. Dazu verwenden wir das Beispiel der Qualitätsanforderung Performanz andie Unternehmensdienste.
Auf Ebene der Geschäftsstrategie wird festgelegt, welche Rolle die Performanz derProzesse spielt, inwieweit diese z.B. kritisch ist, um das Unternehmen von denMitbewerbern abzusetzen. Im Unternehmensmodell ist zu konkretisieren, welcheAufgaben und Leistungen für die Performanz eine Rolle spielen. Weiterhin sindkonkrete Vorgaben zu machen, wie die Performanz dabei zu messen ist und welcheWerte zu erreichen bzw. noch zu tolerieren sind (z.B. Antwortzeiten auf eineKundenanfrage zu einer Produktauslieferung).
Diese Vorgaben betreffen natürlich auch die US, d.h. es werden US-Anforderungen fürdie Performanz definiert. Die Performanz einer Aufgabe ist bestimmt durch diePerformanz der (in der Prozessarchitektur festgelegten) GP (und ihrer Ausführenden)und durch die Performanz der US-Systeme, die diese Aufgabe unterstützen. Es ist nichtsinnvoll, beides getrennt zu optimieren. So kann einerseits eine schlechteSystemantwortzeit (von z.B. mehreren Stunden für eine komplexe Transaktion übermehrere IT-Systeme) ggf. durch eine geschickte GP-Gestaltung, in der nachfolgendeSchritte soweit wie möglich nebenläufig durchgeführt werden, ausgeglichen werden.Andererseits können komplexe GP aufgrund von hervorragenden Systemantwortzeitennoch für die Kunden zufriedenstellend abgewickelt werden.
4. These: Es ist wichtig, Systemantwortzeiten und Prozessdurchlaufzeiten gleichzeitigzu betrachten und zu optimieren. Es fehlen dafür allerdings noch geeignete Ansätze.Wünschenswert wären z.B. Simulationen, um verschiedene Szenarien (unterschiedlicheProzesse mit unterschiedlicher US-Unterstützung) bewerten zu können, aber auchEntscheidungsunterstützende Systeme, die aufgrund von in aktuellen Prozessen undSystemen erhobenen Daten Defizite erkennen und Vorhersagen erlauben.
Die Performanz einzelner Prozessschritte ist nicht nur von Systemantwortzeitenabhängig, sondern z.B. auch von der Benutzbarkeit der Systeme.
5. These: Für die Optimierung von Prozessdurchlaufzeiten muss auch frühzeitig, z.B.durch Prototyping, die Benutzbarkeit der Systeme untersucht und optimiert werden. Esmuss den Benutzern entsprechend ihrer jeweiligen Rolle ermöglicht werden, ihreBenutzeraktionen effizient durchzuführen und die Systemaktionen effizient anzustoßen.Das Rollenmodell für den GP und das Rollenmodell für die US müssen entsprechendaufeinander abgestimmt werden.
Die Performanzanforderungen an die US werden auf die Performanz einzelner US-Komponenten (Teilsysteme) heruntergebrochen.
226
6. These: Typischerweise werden dazu Standardarchitekturen und existierende Systemebetrachtet. Es fehlen Ansätze, um zu Prozessarchitekturen und US-Performanzanforderungen systematisch US-Architekturoptionen abzuleiten. Auch hiersind Simulationen erforderlich, die es erlauben, bestimmte US-Architekturen zubewerten, und Entscheidungsunterstützende Systeme für die Sammlung und Analyse vonDaten zu existierenden US-Architekturen. Wichtig sind hier auch Daten zuArchitekturmustern. Für die Datensammlung ist weiterhin ein Monitoring des laufendenSystems in Bezug auf Performanzeigenschaften wichtig. Dieses Monitoring musskontinuierlich angepasst werden können. Bisher wird Monitoring sowohl aufProzessseite als auch auf Softwareseite getrennt eingesetzt, sinnvoll ist auch hier eineintegrierte Betrachtungsweise.
Aufgrund von Änderungen in der Geschäftsstrategie oder im Unternehmenskontext(z.B. gesetzliche Regelungen bzw. Mitbewerber) sind die PerformanzanforderungenÄnderungen unterworfen.
7. These: Es ist wünschenswert, die Prozess- und US-Architektur in Bezug aufPerformanzanforderungen zu parametrisieren, so dass auch im laufenden Betrieb Prozessund US-Architektur an geänderte Performanzanforderungen angepasst (konfiguriert)werden können. Auch hier fehlen geeignete Ansätze
Das beschriebene Vorgehen versucht, systematisch Qualitätsanforderungen ausgehendvon der Geschäftsstrategie zu verfeinern und zu bewerten. Eine Änderung an einer Stellebeeinflusst üblicherweise in irgendeiner Form die Gesamtqualität.
8. These: Durchgängige Qualität kann nur durch ein BPE und USE übergreifendesQualitätsmodell erreicht werden, das Qualitätsvorgaben an den verschiedenen Stellenmiteinander in Beziehung setzt und die Abhängigkeiten (wie sie auch in Abschnitt 2beschrieben wurden) explizit nachvollziehbar macht.
Während der Gestaltung wird immer wieder überprüft, ob die GP und die US gemeinsamdie Qualitätsvorgaben einhalten.
9. These: Auf Ebene der US-Komponenten gibt es viele Testverfahren zur Überprüfungvon Performanz (z.B. Lasttest). Es fehlen Ansätze, wie diese Ergebnisse und Verfahreneffizient im Integrationstest und Systemtest genutzt werden können. Weiterhin fehlenAnsätze für den Test von Prozessen unter Verwendung von Ergebnissen des US-Tests.
Insgesamt gibt es viele Ansätze für das Qualitätsmanagement von GP einerseits und vonUS andererseits. Die Integration dieser Ansätze ist notwendig für ein übergreifendesQualitätsmanagement.
227
4 Zusammenfassung
In Kapitel 2 haben wir Abhängigkeiten zwischen USE und BPE aufgezeigt, die bisher zuwenig untersucht worden sind und die in den BPE- bzw. USE-Vorgehen nicht genügendberücksichtigt werden. In Kapitel 3 haben wir an Hand eines Beispiels Defizite bei einerdurchgängigen Betrachtung von Qualität bei einem integrierten BPE und USEaufgezeigt. Die Thesen sollen die Vielfalt und die Komplexität der Fragestellungen beieiner Integration deutlich machen.
In einer Zusammenarbeit zwischen der Universität Heidelberg, der Universität Karlsruheund dem FZI Karlsruhe soll der hier angedachte Concurrent Engineering Ansatz für dieintegrierte Entwicklung von GP und US konkretisiert und durch entsprechendeMethoden und Werkzeuge unterstützt werden.
Literaturverzeichnis
[EHH+08] Engels G, Hess A, Humm B, Juwig O, Lohmann M, Richter JP, Voß M, Willkomm J.Quasar Enterprise – Anwendungslandschaften serviceorientiert gestalten, dpunktVerlag 2008.
[KN05] Kaplan RS, Norton D. The Balanced Scorecard: Measures That Drive Performance,Harvard Business Review, Reprint from 1992, July/August, pp.172-181, 2005
[LZ06] Leist S, Zellner G.Evaluation of current architecture frameworks, ACM Symposiumon Applied Computing, pp. 1546-1553, 2006
[PA08] Paech B, Aurum A. Boundary Objects for Value-based Requirements Engineering,SIGSAND Europe, LNI-P-129, pp. 11-24
228
Verzahnung von Requirements Engineering undGeschaftsprozessdesign
Matthias Weidlich, Alexander GrosskopfHasso-Plattner-Institut Potsdam
{matthias.weidlich,alexander.grosskopf}@hpi.uni-potsdam.de
Daniel Lubke, Kurt Schneider, Eric Knauss, Leif SingerLeibniz Universitat Hannover, FG Software Engineering
{daniel.luebke,kurt.schneider,eric.knauss,leif.singer}@inf.uni-hannover.de
Abstract: Geschaft und IT wachsen insbesondere in SOA-Projekten immer starkerzusammen. Hierbei wird deutlich: prozess- als auch anforderungsbezogene Rollenversuchen dasselbe Problem zu losen — namentlich die Erhebung von Anforderungenund die Neudefinition der Unternehmung. Dies geschieht jedoch auf verschiedenenEbenen und mit Hilfe unterschiedlicher Techniken. Da in Projekten bisher keine gegen-seitige Unterstutzung zwischen diesen beiden Rollen vorgesehen ist, sind redundantausgefuhrte Tatigkeiten und Inkonsistenzen in der Spezifikation haufig die Folge. DieAnforderungen fur SOA-Projekte konnten jedoch weitaus effizienter erhoben und ver-waltet werden: durch eine verbesserte Koordination zwischen den verschiedenen Rollen,die Definition von Abhangigkeiten zwischen ihnen sowie die Fixierung der gegenseitigzu erbringenden Resultate. Eben jene Verzahung verlangt daruberhinaus eine Reiheunterstutzender Techniken. Die schnellere Erhebung sowie die verbesserte Qualitat derAnforderungen erhohen die Agilitat der Projekte und starken so einen der Hauptvorteilevon SOA.
1 Einfuhrung und Motivation
Die Service-orientierte Architektur (SOA) teilt die Geschaftslogik der Anwendungen einerOrganisation auf sogenannte Services auf. So konnen alle Anwendungen gleichermaßenFunktionalitat nutzen, die mit Hilfe standardisierter Technologien plattformunabhangig zurVerfugung gestellt wird.
Da die Anwendungen der Organisation ihre Funktionalitat von den Services beziehen,lassen sich so neue Anforderungen an das Geschaft leichter, schneller und kostengunstigerumsetzen. Vorhandene Services konnen zentral angepasst werden; neue Anwendungenkonnen aus bestehender Funktionalitat orchestriert werden. Die IT kann so schnell auf dieErfordernisse des Geschaftes reagieren und notwendige Funktionalitat bereitstellen.
Die Fahigkeit zur schnellen Anpassung der Geschaftsprozesse ist entscheidend fur dieWettbewerbsfahigkeit eines Unternehmens, dessen Marktposition auf softwaregestutzteVerfahrensablaufe begrundet ist. Zwei Disziplinen der Softwaretechnik konzentrieren sichim Besonderen auf die Erfassung von Anforderungen fur softwaregestutzte Ablaufe.
229
Das Requirements Engineering (RE) ist die methodische Erhebung, Dokumentation, Ver-handlung, Verwaltung und Verfolgung von Anforderungen in einem Softwareentwicklungs-projekt. Die Rolle des Requirements Engineers fuhrt eine, einige oder alle dieser Tatigkeitenaus. [FHW07].
Das Geschaftsprozessmanagament hingegen umfasst Methoden und Techniken zur Erfas-sung, Analyse, Optimierung und Automatisierung von Geschaftsablaufen [Wes07]. DieBasis sind explizite Prozessreprasentationen zur Kommunikation und Prozessautomatisie-rung.
Projekte, die von beiden Disziplinen adressiert werden, zeichnen sich durch einen hohenGrad an fachlichem Prozesswissen aus. Wiederverwendung bestehender Funktionalitatbasierend auf Diensten einer SOA geht einher mit der Anpassung bestehender Software-produkte. Oft sind solche Projekte mit organisationeller Restrukturierung und Anderungender Arbeitsablaufe verbunden. Daraus ergibt sich ein Zeit- und Erfolgsdruck. Um schnelleDurchlaufzeiten zu ermoglichen und gute Ergebnisse zu erzielen, sollten Prozessdesignerund Requirements Engineers eng zusammenarbeiten.
In Abschnitt 2 dieses Papiers erlautern wir ein Szenario, bei der beide Disziplinen entkoppeltan einem Projekt arbeiten, und stellen die Problemtypen heraus. Folgend wird in Abschnitt3 eine Arbeitsweise der engen Verzahnung beschrieben. In Abschnitt 4 erlautern wir bereitsbestehende Techniken, die diese Arbeitsweise unterstutzen konnen. Wir fassen diese inAbschnitt 5 zusammen und diskutieren mogliche weitere Schritte zur engeren Verzahnung.
2 Identifikation moglicher Probleme
Die Entkopplung von Requirements Engineering und Prozessdesign kann zu einer Reihevon Problemen fuhren, welche wir im Folgenden exemplarisch verdeutlichen. Grundlageist ein fiktives Szenario eines Call-Centers, das auf Flugreisen spezialisiert ist. Aufgrundeiner Ausweitung der angebotenen Buchungsleistungen (Mietwagen, Hotels) wurde einProjekt zur Umstrukturierung aufgesetzt. Im Zuge der Umstrukturierung wurden bishernicht uber Services angeschlossene Hotelketten und Mietwagenverleiher integriert. Zudemsoll das Buchungssystem um die neuen Funktionen erweitert werden.
Die Umsetzung dieses Projekts besteht im Wesentlichen aus den folgenden Schritten. Ein ex-terner Prozessberater nimmt Ist-Prozesse auf und definiert Soll-Prozesse unter Rucksprachemit der IT-Abteilung des Flugbuchungsunternehmens, um eine Abdeckung der Prozessakti-vitaten durch Services sicherzustellen. Parallel dazu wird ein Requirements Engineer miteiner Anforderungsanalyse fur die Erweiterung des Buchungssystems beauftragt. Nach-dem sowohl die detailierten Soll-Prozesse, als auch die Anforderungsspezifikation vonder Geschaftsfuhrung des Unternehmens abgenommen sind, beginnt die Umsetzung. Sieerfolgt einerseits durch ein IT-Systemhaus, welches die Soll-Prozesse und Schnittstel-len durch Service-Orchestrierungen umsetzen soll. Andererseits wird der Hersteller derBuchungssoftware mit Erweiterungen auf Basis der Anforderungsspezifikation beauftragt.
Wahrend der Umsetzung des Projektes ergeben sich die folgenden Probleme: Die Flugsuche
230
des Buchungssystems sollte Allianzen von Fluglinien optional berucksichtigen konnen, al-lerdings wird diese Funktionalitat nicht von den implementierten Service-Orchestrierungenabgedeckt. Somit wird nachtraglich die Implementierung eines weiteren Services notwendig.Bei der Buchung von Hotels hingegen konnen im Buchungssystem nicht alle angebotenenRabattarten der Services genutzt werden. Dazu wird nachtraglich eine zusatzliche Erwei-terung des Buchungssystems spezifiziert. Letztlich stellt sich heraus, dass die Kategorienfur Mietwagen, welche vom Service zur Mietwagensuche geliefert wurden, nicht denim Buchungssystem hinterlegten entsprechen. Eine zusatzliche Datentransformation wirdnotwendig, um Services und das erweiterte Buchungssystems zu koppeln.
Diese Probleme sind exemplarisch fur negative Auswirkungen durch die Entkopplung vonAnforderungsanalyse und Prozessdesign. Die fehlende Abstimmung zwischen Require-ments Engineer und Prozessdesigner fuhrt zu einem Versatz zwischen der Prozessimple-mentierung und Softwareentwicklung. Die Probleme lassen sich wie folgt kategorisieren:
Fehlende Services fur die in Anforderungen spezifizierte FunktionalitatFunktionale oder nicht-funktionale Anforderungen sind nicht in den Soll-Prozessen adres-siert bzw. durch Services abgedeckt.
Fehlende Anbindung der in den Soll-Prozessen spezifizierten FunktionalitatFunktionalitat, welche in den Soll-Prozessen definiert und uber Services implementiert ist,wird nicht in Anwendungssysteme eingebunden, da sie nicht in der Anforderungsspezifika-tion berucksichtigt wurde.
Fehlende FunktionalitatNotwendige Funktionalitat wird weder vom Requirements Engineer, noch vom Prozessde-signer erfaßt. Grund hierfur ist die Annahme, dass die jeweils andere Rolle diese Aufgabewahrnimmt.
Duplizierte FunktionalitatAufgrund fehlender Abstimmung zwischen dem Requirements Engineer und dem Prozess-designer kommt es zu einer Neudefinition eines Services anstatt zu einer Orchestrierungvorhandener Services und somit zu Redundanzen innerhalb der Service Landschaft.
Inkonsistenzen zwischen spezifizierter und implementierter FunktionalitatGewisse Funktionalitat wird sowohl in den Anforderungen, als auch in den Soll-Prozessenerfaßt, allerdings gibt es Unterschiede in der Spezifikation. Somit ist eine Anbindung derAnwendungssysteme an die Services nicht ohne weiteres moglich. Grunde dafur sind oftunterschiedliche Begriffsdefinitionen und Datenmodelle.
Uberflussige InteraktionenEndnutzer werden mehrfach interviewt: im Rahmen der Ist-Prozess-Analyse, der Soll-Prozess-Definition und der Anforderungsanalyse.
3 Verzahnung von Requirements Engineering und Prozessdesign
Die im obigen Abschnitt beschriebenen Probleme zeigen, dass eine bessere Kopplung vonRequirements Engineering und Prozessdesign notwendig ist.
231
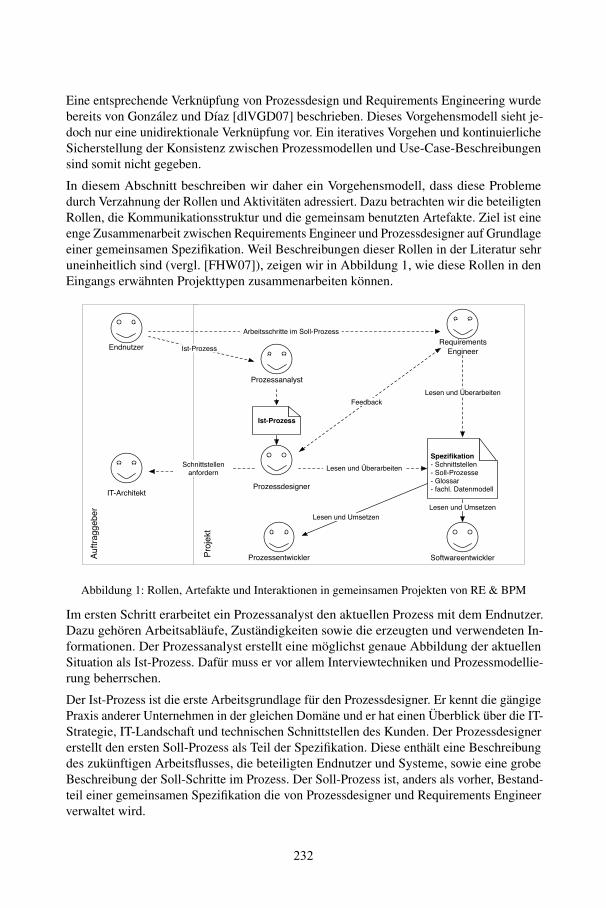
Eine entsprechende Verknupfung von Prozessdesign und Requirements Engineering wurdebereits von Gonzalez und Dıaz [dlVGD07] beschrieben. Dieses Vorgehensmodell sieht je-doch nur eine unidirektionale Verknupfung vor. Ein iteratives Vorgehen und kontinuierlicheSicherstellung der Konsistenz zwischen Prozessmodellen und Use-Case-Beschreibungensind somit nicht gegeben.
In diesem Abschnitt beschreiben wir daher ein Vorgehensmodell, dass diese Problemedurch Verzahnung der Rollen und Aktivitaten adressiert. Dazu betrachten wir die beteiligtenRollen, die Kommunikationsstruktur und die gemeinsam benutzten Artefakte. Ziel ist eineenge Zusammenarbeit zwischen Requirements Engineer und Prozessdesigner auf Grundlageeiner gemeinsamen Spezifikation. Weil Beschreibungen dieser Rollen in der Literatur sehruneinheitlich sind (vergl. [FHW07]), zeigen wir in Abbildung 1, wie diese Rollen in denEingangs erwahnten Projekttypen zusammenarbeiten konnen.
Auftraggeber
Projekt
Spezifikation- Schnittstellen- Soll-Prozesse- Glossar- fachl. Datenmodell
Endnutzer
Ist-Prozess
Ist-Prozess
Arbeitsschritte im Soll-Prozess
FeedbackLesen und Überarbeiten
Lesen und Überarbeiten
Lesen und UmsetzenLesen und Umsetzen
Schnittstellenanfordern
RequirementsEngineer
IT-Architekt
SoftwareentwicklerProzessentwickler
Prozessanalyst
Prozessdesigner
Abbildung 1: Rollen, Artefakte und Interaktionen in gemeinsamen Projekten von RE & BPM
Im ersten Schritt erarbeitet ein Prozessanalyst den aktuellen Prozess mit dem Endnutzer.Dazu gehoren Arbeitsablaufe, Zustandigkeiten sowie die erzeugten und verwendeten In-formationen. Der Prozessanalyst erstellt eine moglichst genaue Abbildung der aktuellenSituation als Ist-Prozess. Dafur muss er vor allem Interviewtechniken und Prozessmodellie-rung beherrschen.
Der Ist-Prozess ist die erste Arbeitsgrundlage fur den Prozessdesigner. Er kennt die gangigePraxis anderer Unternehmen in der gleichen Domane und er hat einen Uberblick uber die IT-Strategie, IT-Landschaft und technischen Schnittstellen des Kunden. Der Prozessdesignererstellt den ersten Soll-Prozess als Teil der Spezifikation. Diese enthalt eine Beschreibungdes zukunftigen Arbeitsflusses, die beteiligten Endnutzer und Systeme, sowie eine grobeBeschreibung der Soll-Schritte im Prozess. Der Soll-Prozess ist, anders als vorher, Bestand-teil einer gemeinsamen Spezifikation die von Prozessdesigner und Requirements Engineerverwaltet wird.
232
Der Soll-Prozess kapselt, welche Endnutzerrollen an den einzelnen Arbeitsschritten derProzesse beteiligt sein werden. Der Requirements Engineer fuhrt gezielt Interviews mitEndnutzern durch, um die Ausgestaltung einzelner Prozessschritte zu erarbeiten. Fur jedenProzessschritt werden Oberflachen, benotigte Funktionalitat und nicht-funktionale Eigen-schaften wie bspw. Antwortzeiten festgelegt. Die Interviews mit den Endnutzern fuhren zuAnpassungen der Spezifikation. Zum Beispiel werden vorher nicht betrachtete Daten essen-tiell fur den neuen Prozessablauf. Fur diese Informationen mussen Systemschnittstellenzur Verfugung stehen oder geschaffen werden. Der Requirements Engineer bestimmt dieAuswirkungen von Anforderungen auf die Spezifikation und passt sie entsprechend an.
Parallel kommuniziert der Prozessdesigner mit dem IT-Architekten beim Kunden, um dieSchnittstellen fur benotigte Funktionalitat zu finden oder auszuhandeln. Der IT-Architektuberwacht die System-Landschaft des Kunden. Er koordiniert verschiedene Projekte undsorgt fur einheitliche Standards, z.b. bei der Granularitat von Schnittstellen. Der Prozessde-signer kann durch die Abstimmung mit dem IT-Architekten genauer bestimmen, welcheSchnittstellen zur Verfugung stehen, modifiziert oder neu geschaffe n werden mussen. DieseInformationen werden genutzt, um den Soll-Prozess weiter zu verfeinern.
Der Prozessdesigner kann zu benutzende Schnittstellen fur einzelne Prozessschritte hinterle-gen, der Requirements Engineer kann die gebotene Funktionalitat gegen die Anforderungender Endnutzer prufen und ggf. Erweiterungen als Teil der Spezifikation definieren. Die Infor-mationen, die Prozessdesigner und Requirements Engineer in die gemeinsame Spezifikationeinpflegen, erfassen die Anforderungen entlang der Soll-Prozesse. Um eine reibungsloseAbstimmung zu gewahrleisten, arbeiten beide mit einem gemeinsamen Glossar, einemfachlichen Datenmodell und einer einheitlichen Schnittstellenbeschreibungen, die ebensowie die Soll-Prozesse Teil der Spezifikation sind.
Die Spezifikation reprasentiert das gemeinsam erarbeitete Wissen von Prozessdesigner undRequirements Engineer. Durch die Zusammenfuhrung der vormals getrennten Dokumentekann man den in Abschnitt 2 beschrieben Probleme begegnen. So konnen bspw. fehlendeServices fur Soll-Prozesse genauso wie duplizierte Funktionalitat durch Konsistenzprufungerkannt werden. Das geteilte Wissen kann auch das Problemverstandnis fordern und souberflussige Interaktionen mit dem Benutzer vermeiden helfen.
Die Spezifikation ist die Grundlage fur die Implementierung. Sowohl Prozessentwickler alsauch Softwareentwickler bekommen ein Dokument mit einheitlichem Vokabular und einemgemeinsamen Losungskonzept.
4 Unterstutzende Techniken
Um das Zusammenspiel zwischen Prozessdesigner und Requirements Engineer zu verbes-sern, sind unterstutzende Techniken wunschenswert, die die Kluft zwischen den beidenRollen uberbrucken. Im Rahmen verschiedener Forschungsprojekte wurden bereits einigeTechniken entwickelt, die sich hierfur nutzen lassen. Einige Moglichkeiten wollen wir indiesem Abschnitt kurz vorstellen.
233
4.1 Use-Case-VisualisierungEine Technik, die zwei vielgenutzte Modelle in der Geschaftsprozess- und der Anforde-rungswelt zusammenbringt, ist die Use-Case-Visualisierung. Hierbei werden von den Vor-und Nachbedingungen von Use-Cases Geschaftsprozesse abgeleitet und in einer gangigenNotation wie z.B. EPK [Lub06] oder BPMN [LSW08] dargestellt. Der generierte Pro-zess ist eine neue Sicht auf die Anforderung. Der Prozessdesigner kann feststellen ob dieSoftwareanforderungen dem vorgegebenen Prozess entsprechen oder wo Abweichungenvorhanden sind. Somit kann diese Visualisierungstechnik [KL08] genutzt werden um dieKommunikation zwischen Prozessdesignern und den Requirements Engineers zu verbessern.Umgekehrt konnen auch Use-Case Modelle aus Prozessmodellen generiert werden [DJ02].Dieses Verfahren erlaubt es Inkonsistenzen zwischen den manuell dokumentierten unddurch die Soll-Prozesse implizierten Anforderungen zu identifizieren.
4.2 Gemeinsames GlossarEines der herausragenden Ziele des Requirements Engineerings ist es, ein einheitlichesVerstandnis von Projektzielen und Projektumfang bei allen Projektbeteiligten zu erzeugen.Einheitlicher Sprachgebrauch ist eine wichtige Grundlage, um dieses Ziel zu erreichen.Dabei gibt es zwei grundsatzliche Schwierigkeiten:
1. Haben zwei Personen eine andere Definition eines Begriffs, kann es zu Missverstand-nissen kommen. Wenn es nicht an einem konkreten Beispiel zur Sprache kommt,wissen zwei Personen nicht, dass der Gesprachspartner eine andere Definition zuGrunde legt [Fis00].
2. Aus dem selben Grund kann selbst ein gutes Glossar unzulanglich sein: Bei derDokumentation von Anforderungen ist dem Requirements Engineer nicht unbedingtklar, dass ein von ihm verwendeter Begriff schon anders im Glossar definiert ist.
Im zweiten Fall kann mit recht einfachen Mitteln ein im Glossar definierter Begriff automa-tisch im Text hervorgehoben werden [KMS08]. Fur die erste Schwierigkeit, zu definierendeBegriffe uberhaupt erst zu finden, haben wir gute Erfahrungen mit automatisch erzeugtenVorschlagslisten gemacht [KMS08]. Diese Begriffe werden vor allem basierend auf ihrerHaufigkeit im Anforderungsdokument vorgeschlagen. Zusatzlich kommt eine erfahrungsba-sierte Komponente zum Einsatz, die Begriffe, die schon in anderen Projekten in das Glossaraufgenommen wurden, hoher priorisiert.
Im Gegensatz zu anderen Ansatzen (vgl. [Kof05]) ist der Fokus unseres Ansatzes dieAnregung zur Diskussion. Dazu ist direktes Feedback notig: Der Requirements Engineersoll auf eine moglicherweise anderslautende Definition eines verwendeten Begriff hinge-wiesen werden, sobald er ihn schreibt. Die Vorschlagliste soll regelmaßig zur Reflektionanregen, ob ein Begriff nicht doch missverstandlich sein konnte. Diese Unterstutzung kannRequirements Engineers und Prozessmodellierern die begriffliche Verzahnung erleichtern.
4.3 Rollenzentrierte GeschaftsprozessausschnitteUm Geschaftsprozesse mit Endnutzer abzustimmen, ist es sinnvoll, ihnen nur die fur sierelevanten Teile zu zeigen. Daher werden aus großen Geschaftsprozessmodellen die Teileausgeschnitten, die zu einer Rolle oder Organisationseinheit gehoren.
234
Einen Ansatz, um EPKs entsprechend zu partitionieren, wurde von Gottschalk et al. vor-gestellt [GRvdA05]: Dabei werden die EPK-Funktionen (d.h. modellierte Aktivitaten)aus einem Prozess selektiert, die Bezug zu einer Rolle haben. Die daraus resultierendenTeilprozesse werden mit Prozesswegweisern verbunden. Auf diese Art und Weise konnenTeilprozesse mit Benutzern besprochen und validiert werden, weil diese Technik eine furden jeweiligen Benutzer angepasste Sicht bereitstellt. Rollenzentrierte Prozesssichten schla-gen die Brucke zwischen den rollenubergreifenden Prozessen und der Sicht der Endnutzer.Sie erleichtern somit nicht ausschließlich die Kommunikation mit dem Endnutzer, sondernauch jene zwischen Prozessdesignern und Requirements Engineers, zum Beispiel wenn esum die Einordnung von Nutzeranforderungen in den Prozesskontext geht.
4.4 Modellubergreifendes TracingWenn Prozessdesigner und Requirements Engineers zusammenarbeiten, sollten nicht nurdie Softwareanforderungen nachverfolgbar sein. Interessant ist vielmehr, welche Softwa-reanforderungen mit welchen Geschaftsprozessen und Prozessteilen zusammenhangen.Daher ist das Tracing, welches im Requirements Engineering bereits vielfach eingesetztwird, auf die Geschaftsprozessmodellierung auszudehnen. Problematisch ist, dass das Tra-cing systemubergreifend arbeiten muss, weil verschiedenen Modelltypen in verschiedenenSystem gespeichert werden.
Daher muss das Tracing so gestaltet werden, dass sich Resourcen (Modelle, textuelle,Anforderungen, . . . ) frei referenzieren lassen. So wie sich mittels URLs Webseiten beliebiguntereinander verlinken lassen, kann man die Semantic-Web-Techniken dazu benutzen,verschiedene Resourcen computerlesbar miteinander zu verknupfen. Einen Ansatz furTracing mittels dem Resource Description Framework (RDF) wurde von Zhu entwickelt undprototypisch umgesetzt [QZ07]. Somit ist es technisch moglich, verschiedenartige Modellemiteinander zu verknupfen. Bei generierten Modellen (z.B. aus Use-Cases generierteGeschaftsprozesse) konnen diese Verknupfungen automatisch erzeugt werden. WelcheVerknupfungen sonst sinnvollerweise einzufugen und noch praktibabel handbar sind, mussweiter untersucht werden.
5 Zusammenfassung und Ausblick
Softwareprojekte mit dem Ziel Geschaftsprozesse zu unterstutzen mussen sowohl dieGeschaftsprozesse kennen, als auch softwarespezifische Anforderungen sammeln. Ge-schieht dies unabhangig voneinander, konnen durch Reibungsverluste viele Probleme, wieinkonsistente, nicht umsetzbare oder fehlende Anforderungen entstehen, die im weiterenProjektverlauf die Entwicklung verzogern und zusatzliche Kosten verursachen.
Wir schlagen daher vor, die beiden klassischen Bereiche Geschaftsprozessmodellierungund Requirements Engineering miteinander zu verzahnen und so Fehler bereits in derSpezifikationsphase zu verhindern. Durch klar definierte Rollen, integrierte Modelle undfestgesetzte Feedbackzyklen kann die Qualitat von Anforderungen gesteigert werden, sodass die nachfolgende Entwicklung schneller und effizienter durchgefuhrt werden kann.
Da beide Seiten ihre eigenen Methoden und Notationen haben, ist es notig, technische
235
Hilfsmittel anzubieten, die Sichten auf die Spezifikation erzeugen, welche von beiden Seitenverstanden wird. Einige Techniken, die Grundlage fur solche Werkzeuge sein konnten,haben wir hier vorgestellt. Diese Techniken mussen aber noch weiter verfeinert und aufdiesen neuen Einsatzbereich zugeschnitten werden.
Als nachste Schritte streben wir eine genauere Rollendefinition in den von uns skizziertenProjekten an, die die Grundlage eines Entwicklungsmodells sein soll. Diese Methodikmochten wir in Industrieprojekten einsetzen und mit passenden Sichten, die durch Toolsautomatisch generiert werden, unterstutzen.
Literatur
[DJ02] R.M. Dijkman und S.M.M. Joosten. An Algorithm to Derive Use Cases from BusinessProcesses. In Proceedings of the 6th IASTED International Conference on SoftwareEngineering and Applications (SEA), Seiten 679–684, Boston, MA, USA, 2002.
[dlVGD07] Jose Luis de la Vara Gonzalez und Juan Sachez Dıaz. Business process-driven requi-rements engineering: a goal-based approach. In Proceedings of the 8th Workshop onBusiness Process Modeling, Development, and Support (BPMDS), Trondheim, Norway,June 2007.
[FHW07] Ralf Fahney, Andrea Herrmann und Rudiger Weißbach. Bericht des AK RequirementsEngineering und Projektmanagement uber das Jahr 2007. Softwaretechnik-Trends, 28(1),2007.
[Fis00] Gerhard Fischer. Symmetry of ignorance, social creativity, and meta-design. KBSSpecial Issues C&C99, 13(78):527537, 2000.
[GRvdA05] Florian Gottschalk, Michael Rosemann und Wil M.P. van der Aalst. My own process:Providing dedicated views on EPCs. In Markus Nuttgens und Frank J. Rump, Hrsg.,EPK 2005 - Geschaftsprozessmanagement mit Ereignisgesteuerten Prozessketten, Seiten156–175, 2005.
[KL08] Eric Knauss und Daniel Lubke. Using the Friction between Business Processes and UseCases in SOA Requirements. In Proceedings of REFS’08, 2008.
[KMS08] Eric Knauss, Sebastian Meyer und Kurt Schneider. Recommending Terms for Glossaries:A Computer-Based Approach. In Proceedings of Workshop on Managing RequirementsKnowledge at 16th IEEE RE Conference, Barcelona, Spain, 2008.
[Kof05] Leonid Kof. Text Analysis for Requirements Engineering. Dissertation, TechnischeUniversitat Munchen, 2005.
[LSW08] Daniel Lubke, Kurt Schneider und Matthias Weidlich. Visualizing Use Case Sets asBPMN Processes. In Proceedings of REV Workshop, co-located at RE 2008, Barcelona,Spain, 2008.
[Lub06] Daniel Lubke. Transformation of Use Cases to EPC Models. In Proceedings of theEPK 2006 Workshop, Vienna, Austria, 2006.
[QZ07] Qiuyue Zhu. Tracing in SOA Projekten mit Semantic Web Technologien. Diplomarbeit,Gottfried Wilhelm Leibniz Universitat Hannover, 2007.
[Wes07] M. Weske. Business Process Management: Concepts, Languages, Architectures.Springer-Verlag Berlin Heidelberg, 2007.
236
Social Aspects in Software Engineering
(SENSE + SofTEAM)
Software Engineering within Social SoftwareEnvironments
(SENSE)
Collaboration and Knowledge Sharing inSoftware Development Teams
(SofTEAM)
Inhaltsverzeichnis
Social Aspects in Software EngineeringAnna Hannemann, Hans-Jörg Happel, Matthias Jarke, Ralf Klamma,Steffen Lohmann, Walid Maalej, Volker Wulf ................................................................ 239
Supporting Software Development Teams with a Semantic Process- and Artifact-oriented Collaboration EnvironmentSebastian Weber, Andreas Emrich, Jörg Broschart, Eric Ras, Özgür Ünalan.............. 243
Enabling Social Network Analysis in Distributed Collaborative Software DevelopmentTommi Kramer, Tobias Hildenbrand, Thomas Acker .................................................... 255
Playful Cleverness revisited: open-source game development as a method for teaching software engineeringKaido Kikkas, Mart Laanpere ...................................................................................... 267
Web 2.0 artifacts in SME-networks – A qualitative approach towards an integrative conceptualization considering organizational and technical perspectivesNadine Blinn, Nadine Lindermann, Katrin Fäcks, Markus Nüttgens .......................... 273
Investigating the Suitability of Web X.Y Features for Software Engineering – Towards an Empirical SurveyEric Ras, Jörg Rech, Sebastian Weber.......................................................................... 285
A method for identifying unobvious requirements in globally distributed software projectsSmita Ghaisas .............................................................................................................. 297
A Web Platform for Social Requirements EngineeringSteffen Lohmann, Sebastian Dietzold, Philipp Heim, Norman Heino.......................... 309
Community Driven Elicitation of Requirements with Entertaining Social SoftwareAnna Hannemann, Christian Hocken, Ralf Klamma .................................................. 317
Communication is the key – Support Durable Knowledge Sharing in SoftwareEngineering by MicrobloggingWolfgang Reinhardt ...................................................................................................... 329
Improving Knowledge Sharing in Distributed Teams by Capturing and Recommending Informal KnowledgeHans-Jörg Happel, Walid Maalej ................................................................................ 341
Annals of Knowledge Sharing in Distributed Software Development Environments: Experience from Open Source Software ProjectsSulayman K. Sowe, Rishab Ghosh, and Luc Soete ...................................................... 347
Social Aspects in Software Engineering
Anna Hannemann1, Hans-Jörg Happel2, Matthias Jarke1, Ralf Klamma1, SteffenLohmann3, Walid Maalej4, Volker Wulf5
1RWTH Aachen University
2FZI Research Center for Information Technology
3University of Duisburg-Essen
4Technische Universität München
5University of Siegen
Preface
Social Aspects in Software Engineering was a joint event of the workshops “SoftwareEngineering within Social Software Environments (SENSE)” and “Collaboration andKnowledge Sharing in Software Development Teams (SofTEAM)” that was held inconjunction with SE 2009 in Kaiserslautern on March 3rd. The full-day program coveredissues of collaboration and knowledge exchange in the development of software systems.In particular, it focused on social approaches of software engineering, engineering ofsocial software as well as new business models and community-oriented ways ofcollaborative software development in the Web 2.0 era.
The goal of the event was to bring together researchers and practitioners working ondifferent collaboration aspects, community interaction and knowledge exchange withrespect to software projects. The workshop covered both novel results and futurechallenges of collaboration in software engineering. The event consisted of four thematicsessions and additional round table discussions.
The first session entitled Collaboration in Software Engineering started with a talk bySebastian Weber et al. who presented a domain-independent meta-model for process-and artifact-oriented collaboration and its application in software engineering. Theapproach emphasizes lightweight support and hides complexity where not needed.Tommi Kramer, Tobias Hildenbrand and Thomas Acker presented a method and a toolthat are used within distributed project settings to facilitate social network analysis incollaborative software development environments. Finally, Mart Laanpere and KaidoKikkas proposed to combine Open Source and game development as an approach forteaching software engineering to students with different educational backgrounds andprogramming skills.
239
The second session on Web 2.0 and Software Engineering started with a talk byNadine Blinn et al. who offered a general methodology for the development of Web 2.0applications for SME networks based on interview analysis with representatives ofSMEs. Followed by a discussion on Web 2.0, 2.5 and 3.0 features and how they mightsupport software developers during the requirements engineering phase presented in atalk by Eric Ras, Jörg Rech and Sebastian Weber. Smita Ghaisas introduced a methodfor identifying unobvious requirements in globally distributed software projectscontinued by a brief discussion on tool support and experiences on applying the method.
In the third session on Community-Driven Requirements Elicitation two demos werepresented: Lohmann et al. introduced a Web platform that applies Social Softwareconcepts to requirements engineering in order to foster stakeholder engagement andsupport a community-oriented definition of requirements. The second demo by AnnaHannemann, Christian Hocken and Ralf Klamma presented a Bubble Annotation Tool(BAT) for enjoyable and intuitive requirements elicitation within communities-of-practice. It enables users to place annotations in the form of bubble speeches on softwareartifacts that are presented on a shared drawing board.
The fourth and last session consisted of three talks on Knowledge Sharing in SoftwareEngineering. Firstly, Wolfgang Reinhardt introduced the concept of integratingmicroblogging into software development. Then, Hans-Jörg Happel and Walid Maalejshowed means to capture and share informal knowledge in distributed developmentsituations. Finally, Sulayman K. Sowe, Rishab A. Ghosh and Luc Soete discussed howdevelopers and users share knowledge based on analyzing experience from Open Sourcesoftware projects.
Subsequently, four main issues of the workshop were identified and discussed in roundtables. One hot topic was expert finding and recommendation based on social networkand collaboration analysis. Though the workshop participants agreed that expert findingmechanisms are highly promising in assisting software development teams and projectmanagers, they also had several concerns regarding their applicability in real use cases.Particularly, privacy issues in collaboration tools and ways to better control the flow ofpersonal information were discussed.
Understanding and emphasizing the social experience of requirements engineering was athird issue that was heavily discussed in the round tables. Many interesting Web 2.0examples of integrating software users and communities in the development processwere mentioned. Related to this discussion, one further issue were bottom-up, informalapproaches of classification and organization of software artifacts as an alternative toclassical, top-down and formal ways.
We thank all workshop participants for their contributions and the program committeemembers for providing their expertise and giving elaborate feedback. Last but not least,we thank the organizers of SE 2009 for their support.
March 2009Anna Hannemann, Hans-Jörg Happel, Matthias Jarke, Ralf Klamma,Steffen Lohmann, Walid Maalej and Volker Wulf
240
Program Committee of SofTEAM’09
• Andreas Abecker, FZI Karlsruhe
• Lilith Al-Jadiri, T-Systems
• Bernd Brügge, TU München
• Björn Decker, Empolis
• Robert DeLine, Microsoft Research
• Paul Grünbacher, Johannes Kepler University
• Hans-Jörg Happel, FZI Karlsruhe
• Wolfgang Kaltz, Swiss Post
• Steffen Lohmann, University of Duisburg-Essen
• Walid Maalej, TU München
• Karsten Nebe, University of Paderborn
• Jasminko Novak, University of Zurich
• Barbara Paech, Heidelberg University
• Dirk Riehle, SAP Research
• Hans Schlichter, TU München
• Janice Singer, National Research Council
• Anil K. Thurimella, Harman Becker Automotive Systems
• Denny Vrandecic, Universität Karlsruhe
• Jürgen Ziegler, University of Duisburg-Essen
• Thomas Zimmermann, Microsoft Research
241
Program Committee of SENSE’09
• Andreas Oberweis, Universität Karlsruhe
• Asarnusch Rashid, FZI Karlsruhe
• Balasubramaniam Ramesh, Georgia State University
• Barbara Paech, Heidelberg University
• Bernhard Rumpe, TU Braunschweig
• Dirk Veiel, FernUniversität Hagen
• Dominik Schmitz, Fraunhofer FIT
• Imed Hammouda, Tampere University of Technology
• Gerti Kappel, Vienna University of Technology
• Jörg Haake, FernUniversität Hagen
• Kalle Lyytinen, Case Western Reserve University
• Matti Rossi, MetaCase
• Mehdi Jazayeri, University of Lugano
• Steffen Lohmann, University of Duisburg-Essen
• Stephan Lukosch, Delft University of Technology
• Tommi Mikkonen, Tampere University of Technology
• William Robinson, Georgia State University
242
Supporting Software Development Teams with a SemanticProcess- and Artifact-oriented Collaboration Environment
Sebastian Weber1, Andreas Emrich2, Jörg Broschart1, Eric Ras1, Özgür Ünalan1
1Fraunhofer Institute for Experimental Software Engineering (IESE)Fraunhofer-Platz 1
67663 Kaiserslautern, Germany{weber,broschart,ras,uenalan}@iese.fhg.de
2Institute for Information Systems (IWi) at theGerman Research Center for Artificial Intelligence (DFKI)
Stuhlsatzenhausweg 3, Campus D3.266123 Saarbrücken, [email protected]
Abstract: The focus of this paper is on how to support small software teams intailoring and following organization-specific process models by using alightweight and flexible approach to reduce the visible complexity of softwareprojects. We introduce the SPACE (Semantic Process- and Artifact-orientedCollaboration Environment) concept, which describes working processes and anassociated approach. These models are integrated semantically, thereby enablingvarious kinds of analytic techniques, and thus making it easier to cope with thecomplexity of processes. Pre-defined templates can be configured to actualworking processes and artifacts exchanged in such processes. In this paper, weadapt SPACE to the software engineering domain by using the domain-specificSoftware Organization Platform (SOP). In this context, the templates containprocess and artifact descriptions of software process models, such as V-Model,RUP, or agile development.
1 Introduction
Nowadays, numerous projects still fail despite enhancements in software engineering(SE) and project management techniques [CH07] [GL05]. One of the main reasons iscomplexity, which results, e.g., from having to coordinate tasks in a distributeddevelopment setting or from the increasing number of different project stakeholders. Asin any other process, the software development process consists of different activities.Feldman et al. distinguish two classes of roles in software development, namely,technical roles developing the software (e.g., requirements engineer or coder) andmanagement roles for planning and managing project executions (e.g., product manager,project planner, or project manager) [FE00]. The technical roles perform the coreactivities, i.e., the creation of the actual product, whereas the management roles performthe context activities, such as communication among the stakeholders, changemanagement, etc.
243
Especially in small and medium-sized enterprises (SME), the staff is not acquainted withsuch context activities. The lack of process- and technique-specific knowledge (e.g., howto conduct interviews for requirements elicitation) leads to longer development cycles.Such activities are often skipped, especially in time-critical situations [SP01].
As such, context activities are critical for the success of a software engineering process[WE08]. So the question is: How do we get SMEs to follow certain process models(especially if these models require process-specific knowledge)? And how can theyhandle the overall complexity that arises from software development?
Software engineering research has proposed various process models for softwaredevelopment (e.g., V-Model) over the years, which should help development teams toovercome such problems. Although these models are intended to reduce the risk ofproject failure, practice shows that SMEs often assume the effort for modeling ortailoring an organization-specific process model to be higher than the benefit in terms ofproject quality. In consequence, such organizations often follow their own “chaotic”development process (often not even documented), resulting in a negative impact on theproject’s execution and final outcome [DNW05].
In this paper, we introduce a domain-independent meta-model infrastructure calledSPACE (Semantic Process- and Artifact-oriented Collaboration Environment), whichsupports flexible process and artifact models in order to enable SMEs to create, manage,and apply meta models. In this context, artifacts are working resources of a process. E.g.,from a project point of view, an artifact is a project element that is used as input oroutput of project activities. These models describe overall processes from different detailperspectives. We apply this approach to the support of software development teams withour SE concept SOP (Software Organization Platform) [WE08], which aims atsupporting the collaboration of software developing teams and comprises the followingcornerstones:
Lifecycle artifact and process management deals with the creation of software artifacts.An SOP should support the definitions of software artifact models and process modelsthat define which sequence artifacts have to be created. These models are enriched withsemantic information and define attributes of artifacts used for to generating concreteend-user templates and provide traceability on the meta and instance levels.
Knowledge management aims at storing personal, project-specific, and organizationalexperience and knowledge. An SOP should leverage this information by supporting itsusers with pro-active recommendations, which should not only support the application ofartifact and process models (i.e., the creation of artifact and process instances), but alsotheir creation.
244

Stakeholder collaboration is geared towards supporting collaborative development ofartifacts by promoting and simplifying communication between stakeholders. This canbe reached indirectly by supporting the establishment of social networks between thestakeholders or directly through communication features (e.g., commenting or annotatingartifacts) within the platform. As with knowledge management, support should not onlyaim at the instance level (i.e., applying the models) but also on the meta model (i.e.,supporting the creation of the models).
We already started to implement such an SOP as a lightweight, semantically enabled,and user-driven wiki-based platform called SOP 2.0 (s. Figure 1). This rich internetapplication (RIA) facilitates the flexible and collaborative creation of processes andartifacts through its visualization capabilities, such as visual templates and editors.
Figure 1: Mockup of SOP 2.0 (work in progress)
The “2.0” in SOP 2.0 stands for the Web 2.0 spirit where people collaboratively work onthe production of software artifacts and thereby create a collective intelligence (i.e.,knowledge and experience). Figure 2 shows the connection between SPACE, SOP, andSOP 2.0. Throughout this paper, we describe the SPACE concept and illustrate it withappropriate use cases from SOP in the domain of SE.
245
Figure 2: Genealogy of SOP and SPACE
2 Related Work
In terms of supporting stakeholder collaboration and context work in softwaredevelopment projects, processes are crucial for successful software projects. Besides theeffort required for defining a custom-tailored model, the problem shared by many toolsis that they do not provide any functionality for applying and executing the model (i.e.,they do not pursue the “prosumer” idea).
Processes performed by human beings are in the focus of current research activities andindustrial developments. With BPEL4People [WS07], a standard has been establishedthat enables the integration of human tasks into BPEL workflow engines. Companieslike IBM, Oracle, Microsoft, and Intalio have integrated this standard into theirworkflow engines. However, these tasks are mostly only connected to the immediateresources of the workflow engine; i.e., the environment – the engine itself – defines therelationships to other aspects such as change management or knowledge management.
Processes are also considered by some semantic wikis such as Ontobrowse [HS08],which provides technical documentation for services or processes (in the SOA scope).Though it provides templates and semantic descriptions for processes, these do notenable role-specific views on the process or visual perspectives. Moreover, the model isnot as generic as SPACE, as it focuses on the documentation of SOA aspects.
ARIS (Architecture of Integrated Information Systems) [SC92] is a concept for modelinginformation systems with different views for data, resources, organization, control, andservices. These views show what kind of models could be considered within SPACE, asSPACE currently only addresses two views. SPACE can be the basis for a platform thatenables the modeling and execution of integrated models as specified through ARIS.
The problem with many tools is that they are based on many different, proprietaryprocess modeling approaches, which causes high coordination efforts with the specialknowledge and preferences of working staff or institutions. The OMG tries to tackle thecomplexity resulting from the diversity of modeling languages with the Software ProcessEngineering Metamodel (SPEM) which is defined as a UML Profile. The modelinglanguage of SOP 2.0 is based on SPEM and thus is extensible and easy to access byother software thanks to a standardized language.
246
As an example of the Software Engineering domain, the V-Modell® XT Projektassistent[VM08] deals only with one model, which is often inappropriate for SMEs. In addition,such a tool is too static for agile scenarios because the process is predefined and can onlybe tailored in terms of discarding activities. The generated templates are only isolateddocuments (i.e., Word documents) and not linked. As a result, small organizations areoften deterred and, therefore, avoid development process models or, instead, proceed inan ad-hoc and unstructured manner (s. Section 1).
Similar to SPACE, IRIS Process Author is a visual process management system thatenables collaborative authoring and tailoring of process assets (i.e., artifacts) [IR09].However, in contrast to SPACE, IRIS lacks semantic support, which is the basis forsophisticated traceability. Futher, IRIS only addresses SE processes, whereas SPACEimplementations are not limited to particular domains. Thus, IRIS is comparable withSOP 2.0, which is a system based on SPACE aiming at software process support.
The difference between many related SE tools to SPACE is that they mainly aim at theimplementation phase in the development cycle and not at the whole lifecycle. Forexample, the NetBeans collaboration project [NB08] is a collaboration frameworkwithin NetBeans that supports programmers regarding collaboration (e.g., distributedcode reviews) and communication (e.g., via chats). The Jazz [IBM08] [FR07] projectpursues a similar way of tool support within the Eclipse IDE. It goes far beyond theNetBeans approach, as it also integrates a wide range of existing tools (i.e., productsfrom the Rational product portfolio) addressing the complete software lifecycle (e.g.,requirements engineering or project management). However, this approach is closelyrelated to the Rational product family. Furthermore, there exist no (transparent) semanticconnections between artifacts between the tools.
Similar to SOP 2.0, a German research project called Teamserver [GFT08] aims atsupporting small organizations and small software projects. However, the main focus ison the integration of typical open-source tools, such as a bug tracking tool. The mainemphasis lies on code generation and testing.
3 Process Model
A software development process can be described by models such as the waterfallmodel, the V-Model, etc. Often, it is difficult to gain a thorough understanding of therespective model, which is required to apply it to the development practice in thecompany (s. Section 1). In this section, we describe the meta-concept SPACE and how itaddresses process modeling and execution. The SPACE process model can guide theway for an SE-specific SOP to support software engineering processes.
247
In order to tackle these problems, a software company should be supported by means ofpre-defined process models, which can be tailored to the specific needs of the respectivestakeholders. Moreover, it should have a flexible structure that does not force users tofollow every single step as intended by the model, but enables them to choose their owncourse of action. In SPACE, tailoring is also not a task that has to be performed beforeapplying the chosen process; rather it can also be changed, even throughout processexecution. Especially for SMEs, which often lack process- or method-specificknowledge, this approach makes it a lot easier to advance complex process models.
First, a concept for the process models themselves is needed. As SPACE is intended tobe a basis for both a modeling and an execution platform, it must incorporate bothprocess models and process instances (i.e., concrete model instantiations). The modeldefines a default sequence flow of activities. Certain information models are associatedwith these activities (s. Section 4 on the “Artifact Model”). As this approach seeks to beflexible at the instance level, the user is not forced to follow the process.
The platform proposes appropriate courses of action to the user according to the processmodel (soft processes). Consistency checks control the state of the artifacts that areassociated with a certain activity. Also, a recursive check over all previous processactivities and their respective artifacts is performed. This information is used to tell theuser whether the process he performs conforms to the modeled process or not. Forexample, a consistency check validates whether a requirements specification is completeor not. The concept of soft processes gives the users freedom of choice for theireveryday working tasks and thereby empowers them with new means of flexibility. Theycan decide spontaneously which path to follow and can delay tasks that require furtherinformation.
When following a modeled process within SPACE, the user has personalized views onthe specific process, i.e., he can zoom in or out at specific process segments. The level ofdetail can be pre-configured by the role a specific user has. An architect might have adifferent view on the process than a programmer, requirements engineer, etc. Views aremeant to be tailored to the respective needs of the stakeholder roles in order to reduceinformation overload. In fact, those views do not prevent access to detailed informationif desired, but emphasize the expected relevant information for the respective role. As anexample, a test engineer might not be interested in details of the requirementsengineering phase, such as interview documents, but he may require insights intorelevant information within use cases, such as the flow of events. Other informationcontained in the use case, such as actors, might not be relevant for him. As real-worldprocesses can become very complex due to various process variants [GS05], thisapproach ensures that the user has a minimal but sufficient view on the process.
There may also exist relationships between the different process models. In addition, itmay make sense to define certain sub-processes in separate process models to reducecomplexity in order to have more stability against changes, increase reusability, andimprove modularity. This enables easier management of the process models.
248
Semantic annotations can be used on both the model and instance levels. Wheneverpossible, the semantic annotations should be incorporated into the templates for certainprocess models. This takes away complexity from the user’s point of view and ensuresthat obvious relationships are modeled without extra effort. However, when semanticannotations only apply to specific instances, they have to be captured by the user. Theuser wants ease of use and thus not the complexity of modeling ontologies or similarsemantic descriptions. Thus, a platform based on SPACE supports the user in this taskwith appropriate decision support, which generates the semantic annotations in thebackground. Nevertheless, the process model must hold the information that describeshow to configure such decision support facilities. Further, semantic information is alsothe basis for the aforementioned consistency checks and the impact analysis (see below).
The semantic annotations allow for traceability of various kinds: Not only from artifactto artifact (as in the common understanding of traceability in software engineering), butalso from process to process, process to artifact, user to process, role to process, etc. Thisis the basis for various kinds of analytic techniques, e.g., an impact analysis. It couldshow which processes are concerned when a process segment changes, whichrequirements are affected when another requirement changes, etc. This traceabilitysupport provides valuable insights to the effects of certain changes. Especially foremployees who are not familiar with certain quality assurance techniques, this canfacilitate their working experience tremendously.
In the context of SE, a domain-specific platform following the SPACE approach is anSOP where the processes are SE processes, such as project management, requirementsengineering, or coding, and the stakeholders are project managers, requirementsengineers, programmers, etc.
4 Artifact Model
Besides focusing on the processes of a software project (s. Section 3), the project canalso be viewed from an output-oriented perspective. Here, the following questions arecentral: Which artifacts are created during the project? What relationships exist betweenthe different artifact types? What are the interrelationships with the process model?
The artifact model is associated with the process model, as it defines the different artifacttypes that are being transformed throughout process execution. In the scope of SOP,artifacts can be, e.g., requirements specifications that are associated with the processactivity “Requirements Analysis”.
As in the process models, personalized views should provide different role-focusedlevels of abstractions (i.e., blinding out irrelevant details for particular stakeholders toreduce information overload) regarding the presentation of the artifact structure. Theinterrelationships between all model and instance elements can be viewed throughdifferent perspectives. A perspective is an aspect-specific focus on a certain process. Incontrast to the aforementioned views, these perspectives express the complete structureof artifacts and processes.
249
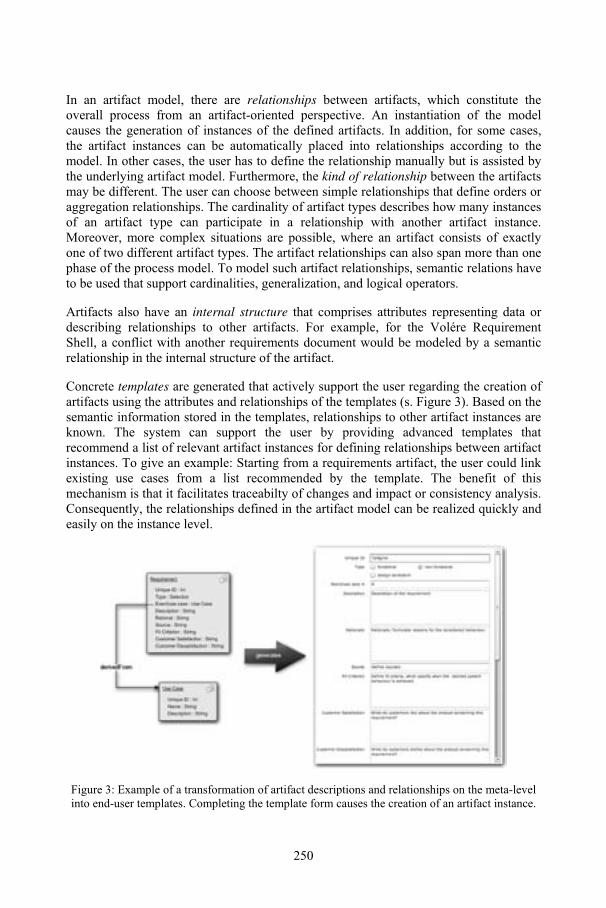
In an artifact model, there are relationships between artifacts, which constitute theoverall process from an artifact-oriented perspective. An instantiation of the modelcauses the generation of instances of the defined artifacts. In addition, for some cases,the artifact instances can be automatically placed into relationships according to themodel. In other cases, the user has to define the relationship manually but is assisted bythe underlying artifact model. Furthermore, the kind of relationship between the artifactsmay be different. The user can choose between simple relationships that define orders oraggregation relationships. The cardinality of artifact types describes how many instancesof an artifact type can participate in a relationship with another artifact instance.Moreover, more complex situations are possible, where an artifact consists of exactlyone of two different artifact types. The artifact relationships can also span more than onephase of the process model. To model such artifact relationships, semantic relations haveto be used that support cardinalities, generalization, and logical operators.
Artifacts also have an internal structure that comprises attributes representing data ordescribing relationships to other artifacts. For example, for the Volére RequirementShell, a conflict with another requirements document would be modeled by a semanticrelationship in the internal structure of the artifact.
Concrete templates are generated that actively support the user regarding the creation ofartifacts using the attributes and relationships of the templates (s. Figure 3). Based on thesemantic information stored in the templates, relationships to other artifact instances areknown. The system can support the user by providing advanced templates thatrecommend a list of relevant artifact instances for defining relationships between artifactinstances. To give an example: Starting from a requirements artifact, the user could linkexisting use cases from a list recommended by the template. The benefit of thismechanism is that it facilitates traceabilty of changes and impact or consistency analysis.Consequently, the relationships defined in the artifact model can be realized quickly andeasily on the instance level.
Figure 3: Example of a transformation of artifact descriptions and relationships on the meta-levelinto end-user templates. Completing the template form causes the creation of an artifact instance.
250
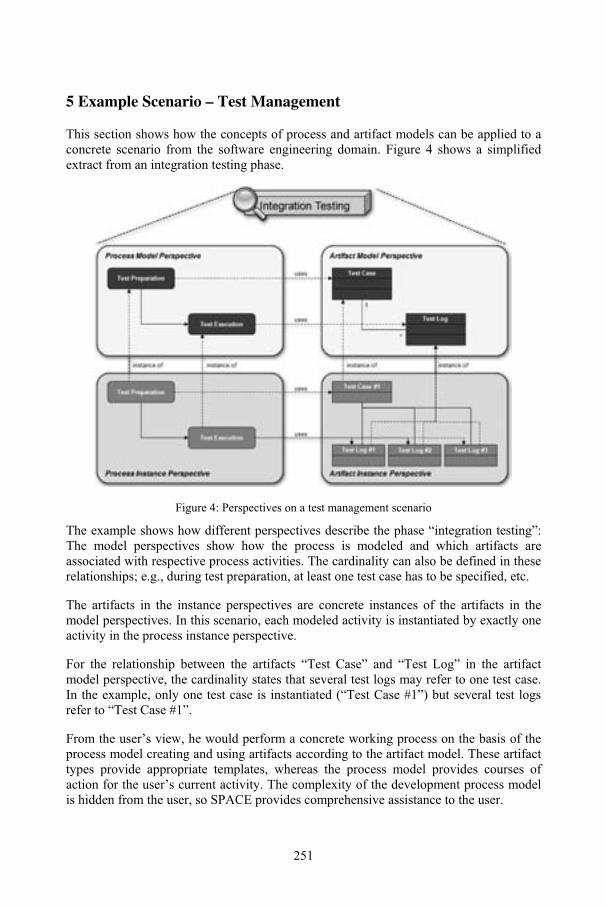
5 Example Scenario – Test Management
This section shows how the concepts of process and artifact models can be applied to aconcrete scenario from the software engineering domain. Figure 4 shows a simplifiedextract from an integration testing phase.
Figure 4: Perspectives on a test management scenario
The example shows how different perspectives describe the phase “integration testing”:The model perspectives show how the process is modeled and which artifacts areassociated with respective process activities. The cardinality can also be defined in theserelationships; e.g., during test preparation, at least one test case has to be specified, etc.
The artifacts in the instance perspectives are concrete instances of the artifacts in themodel perspectives. In this scenario, each modeled activity is instantiated by exactly oneactivity in the process instance perspective.
For the relationship between the artifacts “Test Case” and “Test Log” in the artifactmodel perspective, the cardinality states that several test logs may refer to one test case.In the example, only one test case is instantiated (“Test Case #1”) but several test logsrefer to “Test Case #1”.
From the user’s view, he would perform a concrete working process on the basis of theprocess model creating and using artifacts according to the artifact model. These artifacttypes provide appropriate templates, whereas the process model provides courses ofaction for the user’s current activity. The complexity of the development process modelis hidden from the user, so SPACE provides comprehensive assistance to the user.
251
6 Implementation of the Prototype (SOP 2.0)
The previous sections dealt with the underlying SPACE concept and how it is adapted tothe software engineering domain. This section briefly introduces the current work of theimplementation of SOP 2.0, which constitutes a prototype implementing the SOPconcept (s. Figure 1 of Section 1). Current work in progress is the development of theartifact model support.
SOP 2.0 is based on the wiki platform MediaWiki [MW08] [BA08], which is also thebase of the world’s largest wiki – Wikipedia. Semantic MediaWiki (SMW) [SMW08]forms the semantic foundation of SOP 2.0. Because MediaWiki is mainly usable fortext-based services, it is not perfectly suitable for visualizing complex issues. From theusability point of view, it lacks a lot of characteristics (e.g., drag & drop, desktop-likeuser guidance, etc.) that users expect from a Web-based application nowadays. Thus, wedecided to build a framework where SMW forms the foundation and a Flex layer on topenables arbitrary sophisticated extensions, especially for visualizing data sets.
With this framework, it is possible to extend SMW with advanced editors that constitutean abstraction from the underlying wiki pages by enabling the wiki user to createartifacts in a visual way guided by the process described by the process and artifactmodels. Semantic annotations through SMW attributes and typed links enable thecreation of meta-models (e.g., an artifact model or a process model). The user visuallyassembles models by dragging and dropping elements. These elements representconcrete artifacts that can be linked across different perspectives and abstraction layers.
As already addressed in Section 1, one of the strengths of our approach is the idea ofcollaboration. This means that process and artifact models are created by differentstakeholders in different roles concurrently. The models grow with the lifecycle (i.e., on-the-fly-tailoring) of a software project by adapting and refining. As an example, at thebeginning of a project, a project manager defines the initial coarse-grained project planwith a few central artifacts and processes. Then, different specialists refine differentaspects of the process or artifact models on different abstraction layers (perspectives,views). Consequently, this approach is flexible in such a way that SMEs are able todevelop their simple organization-specific models on a high level of abstraction, whereasother organizations might implement a complex process model, such as the V-Model.
7 Conclusion & Outlook
SPACE enables stakeholders to collaboratively develop artifacts in a visual and process-oriented manner. We distinguish meta-models, e.g., an artifact model for therequirements phase, from instances (e.g., concrete requirements created via generatedtemplates). In an initial phase, stakeholders collaboratively choose, customize, or createprocess and artifact models. With the help of perspectives dealing with different aspectsof the system and different levels of abstraction, process and artifact models can becreated and elements can be linked arbitrarily.
252
Based on the models, the platform generates semantically enriched templates andenables traceability between artifacts. These templates provide pre-configured sets ofprocesses and artifact models that can be easily reused or tailored to the specific needs ofthe stakeholders. The wiki-based approach enables customizing the models on-the-fly,i.e., a process can also be changed during its execution.
For future work, we plan to leverage this semantic information for further analytictechniques, such as impact analysis, cost estimations, etc. In addition, we are currentlyworking on a PID (Proactive Information Delivery) [HO06] feature, where intelligentassistance supports stakeholders by providing context-based and personalizedinformation.
In addition to the aforementioned default use case, where the platform can be used forcreating and connecting artifacts and process models, the platform can be utilized forseveral other scenarios. As an example, the platform can be used for improvingdocumentation in software projects. Nowadays, documenting is often neglected becauseof time pressure and inappropriate tools [GR02]. Existing tools are often generic, are notintegrated into the tool chain, and are not semantically enriched. Our tool can help tosupport documentation by generating templates from artifact models that also define therelationships between the artifacts (i.e., document tempates). The tool enables softwareteams to perform automatic consistency and completeness checks.
Although this paper focuses on supporting software engineers, the platform is notrestricted to this domain (s. Figure 1). The concept of process and artifact models isdomain-independent and can also be transferred to other scenarios. E-Learning processescould be modeled in a similar manner and could be enhanced by a proactive informationdelivery feature. SPACE could also be used as the basis for a business collaborationplatform, where different partners could negotiate common processes that describeinteractions in their partnerships. Extensions could monitor the execution of the processand could provide reporting mechanisms to make it possible to control the process. Thiscould be used for instance, to keep track of service level agreements.
By and large, SPACE can be the basis for a ubiquitous collaboration platform that can beapplied to many different domains. The pre-defined templates foster easier adoption ofcomplex processes or techniques and the traceability features help to handle thecomplexity arising from changes. Overall, SPACE uses the semantics to perform tediouscontext tasks in the background, and finally lets process owners focus on their mainpurpose: their working process. Along with the SOP concept and the SOP 2.0implementation, SPACE can provide comprehensive assistance for softwaredevelopment teams. It can take away complexity from the user and make it easier tokeep track of the complex relationships between the artifacts in a software developmentproject.
References
[Ba08] Barrett, V.D.: MediaWiki, O'Reilly Media, 2008.
253
[CH07] The Standish Group International: CHAOS Report 2007: The Laws of CHAOS, 2007.[DNW05]Durissini, M.; Nett, B.; Wulf, V.: Kompetenzentwicklung in kleinen Unternehmen der
Softwarebranche. Zur Praxisorientierung im Software Engineering. Mensch undComputer 2005. Kunst und Wissenschaften. Grenzüberschreitungen der interaktivenART. Munich, Germany, S. 91-100., 2005.
[Fe00] Feldmann, R. L. et al.: Applying Roles in Reuse Repositories, Chicago, USA, 2000.[Fr07] Frost, R.: Jazz and the Eclipse Way of Collaboration. IEEE Software vol. 24, 2007.[GFT08] Beneken, G.; Feindor, R.; Thurmayr, J.: IntegrierteWerkzeugunterstützung füur kleine
Projekte: Der Rosenheimer Team-Server. GI-Jahrestagung 2008, S. 317-319, 2008.[Gl05] Glass, R.: IT Failure Rates--70% or 10-15% ? IEEE Software vol. 22, 2005.[Gr02] Gruhn, V.: Process-Centered Software Engineering Environments, A Brief History and
Future Challenges. Kluwer Academic Publishers, vol. 14, S. 363-382, 2002.[GS05] Grief, J.; Seidlmeier, H.: Modellierung von Flexibilität mit Ereignisgesteuerten
Prozessketten (EPK). Geschäftsprozessmanagement mit EreignisgesteuertenProzessketten (WI-EPK), 4. Workshop der Gesellschaft für Informatik e.V. (GI) undTreffen ihres Arbeitskreises, 2005.
[Ho06] H. Holz et al.: Task-based process know-how reuse and proactive information delivery inTaskNavigator. Proceedings of the 15th ACM international conference on Informationand knowledge management, Arlington, Virginia, USA, S. 522-531, 2006.
[HS08] Happel, H.-J.; Seedorf, S.: Documenting Service-Oriented Architectures withOntobrowse Semantic Wiki. Munich, Germany, 2008.
[IBM08] IBM - Jazz overview. Accessed on December 19 2008: http://www-01.ibm.com/software/rational/jazz/
[IR09] IRIS Process Author. Accessed on February 12 2008: http://www.osellus.com/IRIS-PA[MW08] MediaWiki Project Website. Accessed on December 19 2008:
http://www.mediawiki.org/wiki/MediaWiki.[NB08] The NetBeans Collaboration Project. Accessed on December 19 2008:
http://collab.netbeans.org/.[Sc92] Scheer, A.-W.: Architektur integrierter Informationssysteme, Berlin, Heidelberg, New
York: Springer, 1992.[SMW08]Semantic MediaWiki Project Website. Accessed on December 19 2008:
http://www.semantic-mediawiki.org/wiki/Semantic_MediaWiki.[SP01] Sommerville, V.I.; Philippsborn, H.E.: Software Engineering. Addison-Wesley, 2001.[VM08] Das V-Modell XT Werkzeuge. Accessed on December 19 2008: http://v-
modell.iabg.de/index.php?option=com_content&task=view&id=27&Itemid=51.[We08] Weber, S. et al.: A Software Organization Platform (SOP). Learning Software
Organizations (LSO) 2008, Rom, Italy, 2008.[WS07] WS-BPEL Extension for People Specification (BPEL4People), Version 1.0, 2007.
Accessed on December 19 2008:http://www.ibm.com/developerworks/webservices/library/specification/ws-bpel4people/
254
Enabling Social Network Analysis in DistributedCollaborative Software Development
Tommi Kramer, Tobias Hildenbrand, Thomas Acker
{tkramer/thildenb/tacker}@rumms.uni-mannheim.de
Abstract: Social network analysis in software engineering attains an important role inproject support as more and more projects have to be conducted in globally-distributedsettings. Distributed project participants and software artifacts, such as requirementsspecifications, architectural models, and source code, can seriously impede efficientcollaboration. However, collaborative software development platforms bear the po-tential information for facilitating distributed projects through adequate informationsupply. Hence, we developed a method and tool implementation for applying socialnetwork analysis techniques in globally-distributed settings and thus provide superiorinformation on expertise location, co-worker activities, and personnel development.
1 Introduction
Social dependencies in globally distributed software development projects are critical, asmost projects nowadays involve distributed stakeholders and respective information re-sources; moreover, the software under construction becomes more and more complex interms of functional and technological requirements. Hence, collaborative developmentenvironments are utilized in order to provide one common information repository andglobal view on the project. Social dependencies evolve around shared artifacts and workprocesses and this information can be extracted and analyzed by different project stake-holders. Existing methods of social network analysis (SNA) allow for locating expertise,providing better co-worker awareness, and supporting personnel development in general,for instance.
In order to make the required information available even in distributed settings, we havedeveloped an approach to extracting relevant project data from collaborative developmentenvironments and providing flexible analysis functionality for different types of stake-holder roles and software projects. Therefore, we aim at presenting a solution for enablingSNA in distributed collaborative software projects and making use of this information tosupport more efficient development processes through better information supply. Hence,we extend existing collaboration platforms towards a social software for software engi-neering (SE).
For achieving this objective, we present a brief introduction to SNA in software develop-ment and related work in Section 2. Section 3 analyzes the most relevant use cases for ourSNA solution, whereas in Section 4 design and implementation of selected features are
255
described and Section 5 concludes with an evaluative discussion [HMPR04] of the currentuse case implementations and future work.
2 Foundations and Related Work
This section describes the definition of Social Network Analysis (SNA) in practice aswell as in software development projects in particular. It gives a basic understanding ofwhat social networks are and how they are created and used in Collaborative SoftwareDevelopment Platforms (CSDP).
2.1 Social Network Analysis
Having SNA on the one hand as a logical construct and on the other hand as the networkrepresentation substitutional for visual aid, this kind of information is of great help in man-aging projects, especially software engineering projects, in a better and more successfulway. Also the goals of SNA and the metrics for calculating that network are mentioned.
In order to communicate or to express themselves in daily private life, people create pro-files in which they provide information about their current activities. Furthermore, theyjoin groups of shared interests or equal abilities, e.g. people of the same university, fam-ily relations, or sports teams. This process of organizing and communicating via socialsoftware is often also called social networking. As an example, there are platforms for re-gional or scholar clustering called Facebook1 as well as for graduates and business peoplethe Linked-in2 website.
As one individual generally shares more than one interest or ability with others, manydifferent links are created. These altogether build a huge network among the participants,the so called social network. This network with its various characteristics e.g. numberof activities and relations allows/facilitates an evaluation and analysis of the strength ofparticipant ties [WF94].
The importance of social capital has been subject to various studies of social sciences[BRW04]. The forming and distribution of knowledge is seen as an integral part of it.It should however be distinguished between explicit knowledge, that is written down ex-plicitly and tacit knowledge, which can hardly be transfered or saved. Most social net-work approaches cover the management of explicit knowledge, whereas the focus on theidentification and better usage of implicit knowledge can only be found in more recentapproaches.
With the importance of social capital recognized, social networks and social networkinghave found their way into companies. One major motivation was to overcome the miss-ing competence transparency among employees within large enterprises. Relationships of
1www.facebook.com (as of Dec. 3, 2008)2www.linkedin.com (as of Dec. 3, 2008)
256
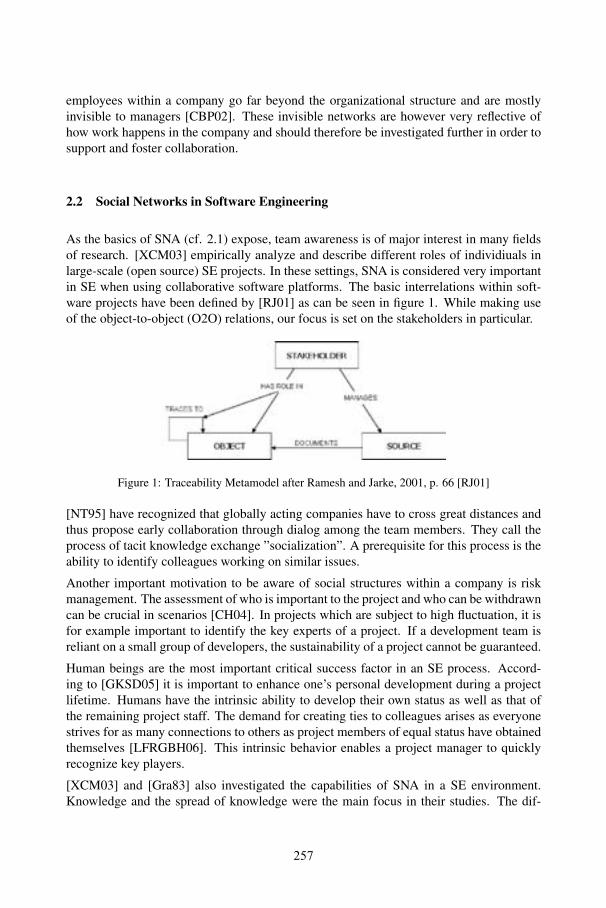
257
ference between strong and weak ties as well as the spread of new ideas and knowledgecan be explained by an SNA. That way the visual support of SNA provides a strong senseof common understanding and better awareness within the team. [Gab90] and [McG84]found out that a team is not understood as a composition of individuals and single work-ers any more. SNA helps create a better working atmosphere, better collaboration, and ahigher satisfaction of the staff.
To analyze a social network in detail, metrics are of fundamental importance. Therefore,[LFRGBH06] made some initial propositions for adequate metrics in SE, like Betweennessand Diameter or Distance. Besides adapting these and other metrics, another approach forthe identification of expertise of a colleague in an SE environment is to extract informationfrom the documents the individual users have developed. These documents can providea heap of information about authorship, topic, involvement and so on. This approach isfurther investigated in this paper.
3 Use Cases and Functional Requirements
As the importance of social networks was outlined both in daily life and in companies, thefollowing section focuses on the investigation of how this kind of awareness can improvecollaboration and coordination within software projects, in particular. Moreover, actualrequirements based on the user value for team members and management are deducted.
3.1 Use Case 1: Expertise Location [UC1]
The importance of expert location is confirmed in a field study by [KDV07]. In this study,awareness about artifacts and co-workers was identified to be the most frequent informa-tion need around developers. It was found that developers often had to defer tasks becausethe only source of knowledge were unavailable coworkers.In various other field studies, [dSHR07] found specific scenarios that identified majorproblems during the development of software. These especially illustrated the impact of alack of awareness. The situation could be solved by the identification of developers whoworked on the same or at least similar artifacts within a project. In order to find an expert,it is important to specify what is considered to be central in an organization. Communica-tion habits as well as working habits of individual teams need to be regarded in order toobtain the desired result.
3.2 Use Case 2: Co-worker Awareness [UC2]
As partly outlined in the previous section, co-worker awareness is generally of significantimportance. Not only the purposeful identification of an ascertained number of colleaguesbut also the awareness of ”what my professional environment is doing and how this relates
258
to me” is a prerequisite for efficient development planning.Especially in large distributed teams like open source development projects, the globalawareness of who is working on the same or related artifacts can save a lot of redundantwork. Moreover, as mentioned in section 2.2, this kind of awareness allows the projectmembers to identify colleagues working on related issues more efficiently or in the firstplace. Knowing these colleagues can thus provide a means to exchange tacit knowledgeand even to enhance the affiliation within the team.
3.3 Use Case 3: Personnel Development [UC3]
By means of SNA, it is possible to analyze a project worker’s development from the man-agement level. A new developer joining the team might only have a few ties to otherproject members. SNA providing special functions as part of this work enables the man-ager to track the development of the newcomer via SNA screenshots every once in a while.The progress (or even regress) in his development can be traced by that functionality. In apositive scenario the numbers of ties for example increase in every step.
3.4 Functional Requirements
Based on the use cases outlined above, functional requirements will be derived for ourSNA-enabled Trace Visualization (TraVis) solution [HGKA08] in order to provide an ef-fective means to meet the mostly unresolved issues identified in the literature (cp. Section2.2).First of all, the novel version of TraVis must provide functionality to extract existing tra-cability and rationale data from current data structures. With an adequate algorithm andby implementing some of the metrics discussed in section 2.1, this data needs to be trans-formed and prepared for visual output with users also grouped by their Edge Betweenness,a measure to calculate the importance of a user in a network.The tool shall be enhanced by role-based filtering in order to be able to distinguish be-tween developers, project managers, etc. The possibility of a view that highlights only theoutgoing relationships of the user might also be a valuable addition. If he already has anidea of whom to contact for expertise knowledge within the project, this view will supporthim by proposing the shortest path regarding the strength of the ties to others.To obtain a more specific view on the expertise that is searched for, a tracker item viewshall be implemented that displays only those relationships between users that were iden-tified within a specific tracker item. As the standard SNA-view visualizes relationships ofprojects based on their participation in all trackers, tracker items and artifacts, the socialnetwork becomes very abstract. This problem is enhanced in large-scale projects wheremany users participate. Where a holistic view on the social network is important to findout the overall relationships within a project, a more detailed view can be used for thelocation of expertise. The user shall therefore be able to choose a specific tracker item andthe social network of users related to that item will be displayed on the graph.
259
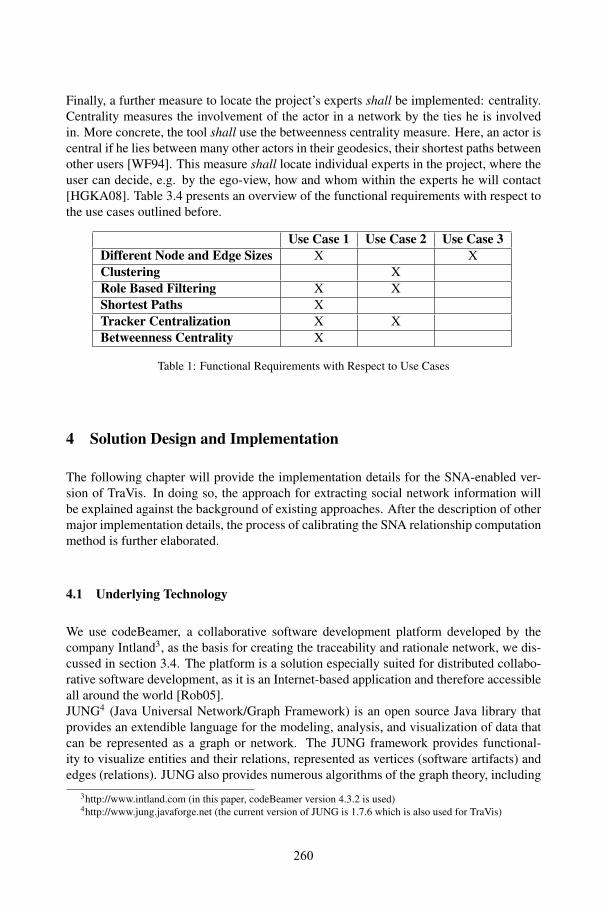
Finally, a further measure to locate the project’s experts shall be implemented: centrality.Centrality measures the involvement of the actor in a network by the ties he is involvedin. More concrete, the tool shall use the betweenness centrality measure. Here, an actor iscentral if he lies between many other actors in their geodesics, their shortest paths betweenother users [WF94]. This measure shall locate individual experts in the project, where theuser can decide, e.g. by the ego-view, how and whom within the experts he will contact[HGKA08]. Table 3.4 presents an overview of the functional requirements with respect tothe use cases outlined before.
Use Case 1 Use Case 2 Use Case 3Different Node and Edge Sizes X XClustering XRole Based Filtering X XShortest Paths XTracker Centralization X XBetweenness Centrality X
Table 1: Functional Requirements with Respect to Use Cases
4 Solution Design and Implementation
The following chapter will provide the implementation details for the SNA-enabled ver-sion of TraVis. In doing so, the approach for extracting social network information willbe explained against the background of existing approaches. After the description of othermajor implementation details, the process of calibrating the SNA relationship computationmethod is further elaborated.
4.1 Underlying Technology
We use codeBeamer, a collaborative software development platform developed by thecompany Intland3, as the basis for creating the traceability and rationale network, we dis-cussed in section 3.4. The platform is a solution especially suited for distributed collabo-rative software development, as it is an Internet-based application and therefore accessibleall around the world [Rob05].JUNG4 (Java Universal Network/Graph Framework) is an open source Java library thatprovides an extendible language for the modeling, analysis, and visualization of data thatcan be represented as a graph or network. The JUNG framework provides functional-ity to visualize entities and their relations, represented as vertices (software artifacts) andedges (relations). JUNG also provides numerous algorithms of the graph theory, including
3http://www.intland.com (in this paper, codeBeamer version 4.3.2 is used)4http://www.jung.javaforge.net (the current version of JUNG is 1.7.6 which is also used for TraVis)
260
centrality, betweeness, HITS, etc. This framework is the basis for the implementation ofTraVis.
4.2 Trace Visualization and Social Network Analysis Method
In [Hil08] a tool, called TraVis, was developed for visualizing tracability and rationaleinformation. Technical details are also described in [HGKA07]. Based on that we arecomplementing some classes and build new data structures to achieve social networkingfunctionality.
4.2.1 Algorithm
As mentioned before, there are two basic approaches for finding dependency informationin software development projects. Social dependencies can be obtained by collecting codedependency information. Authorship information of the source code is retrieved in order toassociate users with code dependencies [dSHR07]. On the other hand, TraVis is based onmore general artifact-related dependencies. Software development platforms supportingsoftware projects with document management functionality, repositories, etc. (cp. section4.1) contain valuable information on how individual teams collaborate that goes far beyondsource code. This information can be utilized in order to obtain authorship information andanalyze social dependencies throughout the project. By means of the JUNG framework,dependencies are displayed in a graph: vertices represent users and edges their relation toeach other.
In order to identify these relationships, TraVis implements the following algorithm: Forall users of the project, relationships to artifacts are identified where the user has somekind of active involvement (e.g. creator, modifier, etc.). For each of these artifacts in turn,associations are extracted from the lists and their respective users are put into relation withthe current user to be analyzed in the loop. The overall procedure is illustrated in figure 2.For every user (shown in the middle of the figure) an iteration is run. It should be notedthat within two iterations, relations to the depth of 3 can be obtained by the algorithm.These relationships however have a decreased weighting as the social relationship is ofless direct nature. By that algorithm a foundation for extracting social data is set whichdelivers the required information for the named use cases [UC1], [UC2] and [UC3].
These associations can include many types. As authorship information about users to de-fine the type of linkages between them and therefore decides about the strength of the tie,weightings need to be included. These weightings consist of the participation of the userregarding the individual artifact and the weighting of the artifact itself. In the algorithm,both values are multiplied and added to the SNA-value of the respective pair of users.For that, TraVis regards the roles: Creator, Modifier, Submitter, Approver, Owner, LastModifier, Assigned Person, Locking Person. Moreover, various weightings can be distin-guished:TRACKER, TRACKER ITEM ATTACHMENT, TRACKER ITEM COMMENT, FORUM,
261
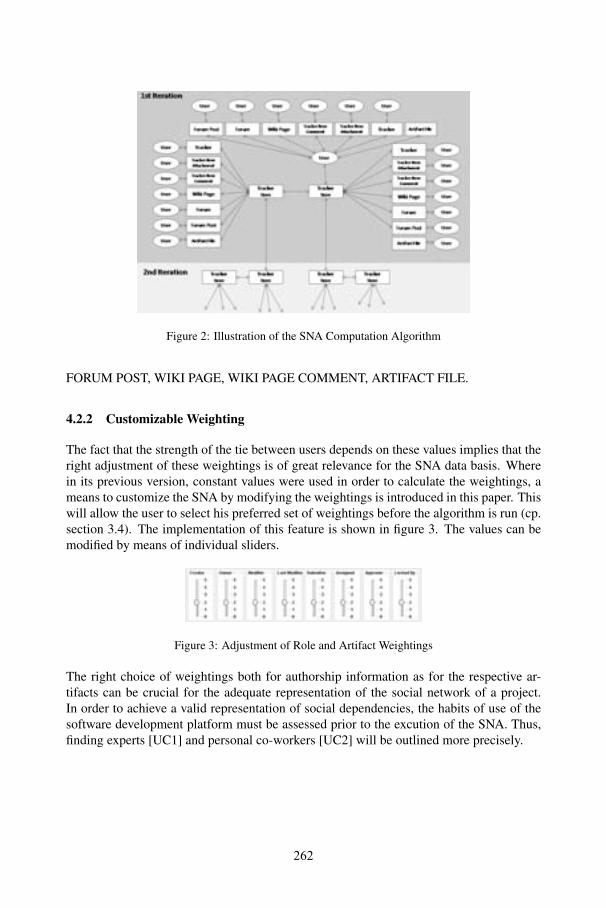
262
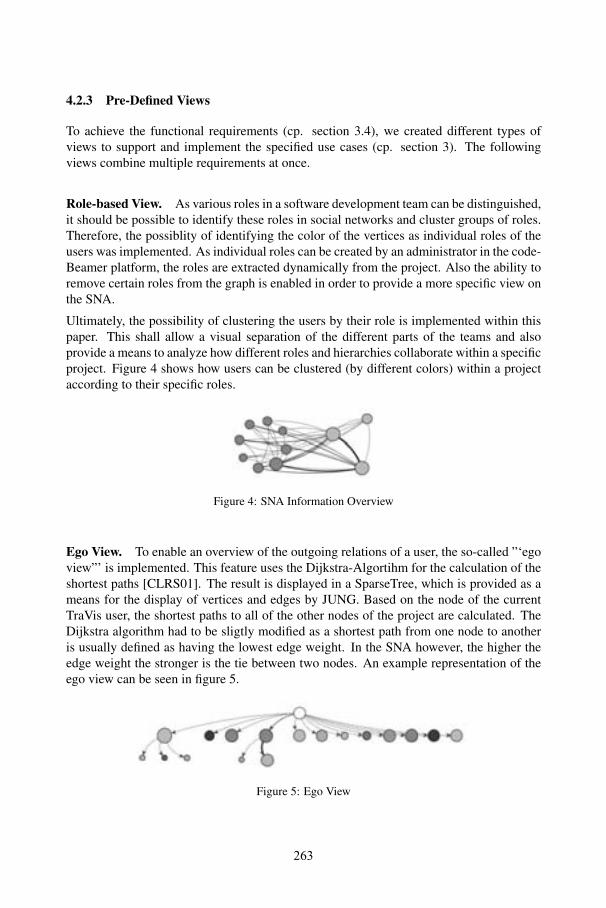
263
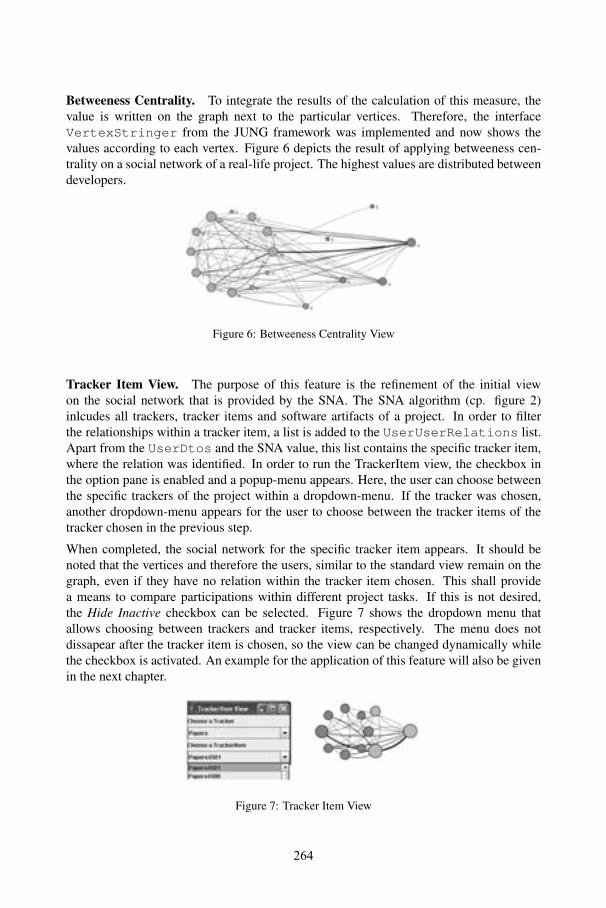
264
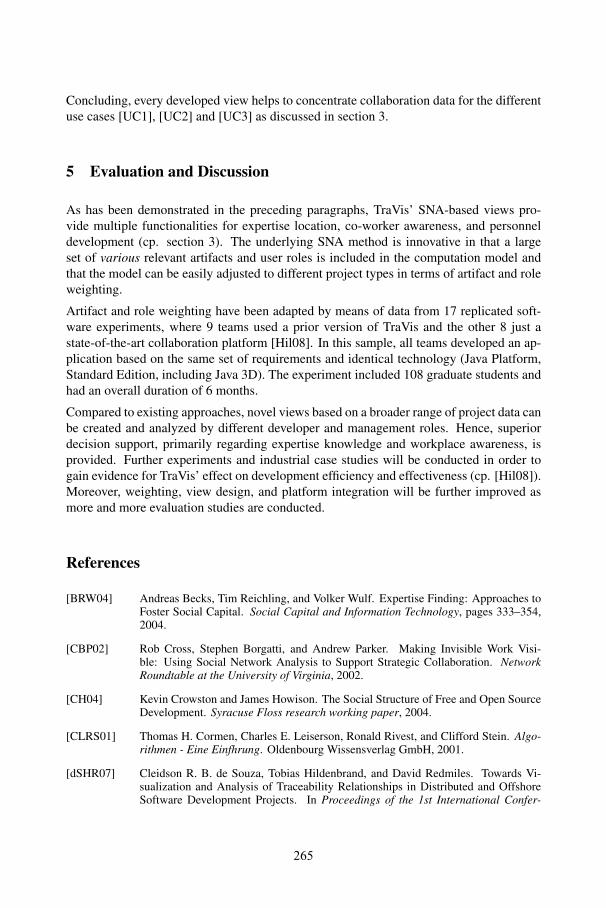
Concluding, every developed view helps to concentrate collaboration data for the differentuse cases [UC1], [UC2] and [UC3] as discussed in section 3.
5 Evaluation and Discussion
As has been demonstrated in the preceding paragraphs, TraVis’ SNA-based views pro-vide multiple functionalities for expertise location, co-worker awareness, and personneldevelopment (cp. section 3). The underlying SNA method is innovative in that a largeset of various relevant artifacts and user roles is included in the computation model andthat the model can be easily adjusted to different project types in terms of artifact and roleweighting.
Artifact and role weighting have been adapted by means of data from 17 replicated soft-ware experiments, where 9 teams used a prior version of TraVis and the other 8 just astate-of-the-art collaboration platform [Hil08]. In this sample, all teams developed an ap-plication based on the same set of requirements and identical technology (Java Platform,Standard Edition, including Java 3D). The experiment included 108 graduate students andhad an overall duration of 6 months.
Compared to existing approaches, novel views based on a broader range of project data canbe created and analyzed by different developer and management roles. Hence, superiordecision support, primarily regarding expertise knowledge and workplace awareness, isprovided. Further experiments and industrial case studies will be conducted in order togain evidence for TraVis’ effect on development efficiency and effectiveness (cp. [Hil08]).Moreover, weighting, view design, and platform integration will be further improved asmore and more evaluation studies are conducted.
References
[BRW04] Andreas Becks, Tim Reichling, and Volker Wulf. Expertise Finding: Approaches toFoster Social Capital. Social Capital and Information Technology, pages 333–354,2004.
[CBP02] Rob Cross, Stephen Borgatti, and Andrew Parker. Making Invisible Work Visi-ble: Using Social Network Analysis to Support Strategic Collaboration. NetworkRoundtable at the University of Virginia, 2002.
[CH04] Kevin Crowston and James Howison. The Social Structure of Free and Open SourceDevelopment. Syracuse Floss research working paper, 2004.
[CLRS01] Thomas H. Cormen, Charles E. Leiserson, Ronald Rivest, and Clifford Stein. Algo-rithmen - Eine Einfhrung. Oldenbourg Wissensverlag GmbH, 2001.
[dSHR07] Cleidson R. B. de Souza, Tobias Hildenbrand, and David Redmiles. Towards Vi-sualization and Analysis of Traceability Relationships in Distributed and OffshoreSoftware Development Projects. In Proceedings of the 1st International Confer-
265
ence on Software Engineering Approaches for Offshore and Outsourced Develop-ment (SEAFOOD’07). Springer, 2007.
[Gab90] J. Gabarro. The development of working relationships. Intellectual Teamwork: So-cial and Technological Foundations of Cooperative Work, 1:79–110, 1990.
[GKSD05] T. Girba, A. Kuhn, M. Seeberger, and S. Ducasse. How developers drive softwareevolution. Proceedings of the International Conference on Software Maintenance,1:113–122, 2005.
[Gra83] M. Granovetter. The strength of weak ties. American Journal of Sociology, -:1360–1380, 1983.
[HGKA07] Tobias Hildenbrand, Michael Geisser, Lars Klimpke, and Thomas Acker. Designingand Implementing a Tool for Distributed Collaborative Traceability and RationaleManagement. Working Paper des Lehrstuhls fr ABWL und Wirtschaftsinformatik derUniversitt Mannheim, 2007.
[HGKA08] Tobias Hildenbrand, Michael Geisser, Lars Klimpke, and Thomas Acker. Design-ing and Implementing a Tool for Distributed Collaborative Traceability and Ra-tionale Management. In Proceedings of the Multikonferenz Wirtschaftsinformatik(MKWI’08), Munich, Germany, 2008. accepted for publication.
[Hil08] Tobias Hildenbrand. Improving Traceability in Distributed Collaborative SoaftwareDevelopment - A Design Science Approach. Dissertation, University of Mannheim,Germany, Mannheim, Germany, 2008.
[HMPR04] Alan R. Hevner, Salvatore T. March, Jinsoo Park, and Sudha Ram. Design Sciencein Information Systems Research. MIS Quarterly, 28(1):75–105, 2004.
[KDV07] Andrew Ko, Robert DeLine, and Gina Venolia. Information Needs in CollocatedSoftware Development Teams. In 29th International Conference on Software Engi-neering (ICSE ’07), 2007.
[LFRGBH06] Luis Lopez-Fernandez, Gregorio Robles, Jesus M. Gonzalez-Barahona, and IsraelHerraiz. Applying Social Network Analysis Techniques to Community-Driven LibreSoftware Projects. Int. J. of Information Technology and Web Engineering, Univer-sidad Rey Juan Carlos, Spain, 2006-09:22, 2006.
[McG84] J. McGrath. Groups, interaction and performance. Prince-Hall, 1:–, 1984.
[NT95] I. Nonaka and H. Takeuchi. Knowledge Creating Company, volume 77. HarvardBusiness Review, 1995.
[RJ01] Balasubramaniam Ramesh and Matthias Jarke. Towards Reference Models for Re-quirements Traceability. IEEE Transactions on Software Engineering, 27(1):58–93,2001.
[Rob05] Jason Robbins. Adopting Open Source Software Engineering (OSSE) Practices byAdopting OSSE Tools. In Joseph Feller, Brian Fitzgerald, Scott A. Hissam, andKarim R. Lakhani, editors, Free/Open Source Processes and Tools, pages 245–264.MIT Press, Cambridge, USA, 2005.
[WF94] Stanley Wasserman and Katherine Faust. Social Network Analysis: Methods andApplications. Cambridge University Press, Cambridge, UK, 1994.
[XCM03] Jin Xu, Scott Christley, and Gregory Madey. Application of Social Network Analysisto the Study of Open Source Software. 2003.
266
Playful Cleverness revisited: open-source gamedevelopment as a method for teaching software engineering
Kaido Kikkas, Mart Laanpere
Tallinn UniversityNarva Road 25, 10120 Tallinn, Estonia
[email protected], [email protected]
Abstract: This paper discussing using methods from the historical Internet hackerculture in teaching XXI century students. A case study was carried out in TallinnUniversity in the form of action research exercise. The playful learning approachwas selected to involve students of two different courses in the full cycle ofdeveloping game scenarios for an open source strategy game The Battle forWesnoth.
1 Introduction
In his well-known book „Hackers: The Heroes of the Computer Revolution“, StevenLevy quotes one of the original hackers back around 1975, a Homebrew Computer Clubfounding member Tom Pittman on his feelings after completing a program: „In thatinstant, I as a Christian thought I could feel something of the satisfaction that God musthave felt when He created the world“ [Le01].
In January 2008, a Master student of the Open Source Management course at TallinnUniversity wrote in her blog about successfully building a Battle for Wesnoth campaign:„IT WORKS!!! :) Our campaign really works! Well, it´s not an extremely huge piece ofcoding-art, but at least it´s playable. Feels funny to play it :) I was quite sure it wouldnever reach this point.. If there was more time it would be nice to develop it further.“(http://sonjacky.blogspot.com/2007/12/osm-battle-for- wesnoth-viii.html)
Over the gap of more than 30 years, the experience has remained the same.
2 The hacker culture
This techno-culture of sharing, independent thinking and playful originality formed atthe Massachusetts Institute of Technology back in the 1950s. In 1959 there were the firstcourses on computer science and the TX-0 computer was obtained which is consideredto be the first hacker machine. In 1961 the MIT obtained PDP-1 which became thecentral device for the forming hacker culture, later formalised into the Project MAC andthe famous MIT Artificial Intelligence Laboratory [Le01].
267
For a long time, the culture was almost completely free of business thought – due to itsspecific field which was too small to create a market, and also the ties of many projectsto the military. Thanks to skilful management, the bureaucracy was kept separate andthe creative minds were given ample space to work. All this created an atmosphere ofcreative and original intelligence that Richard Stallman has called 'playful cleverness'.
While the 'hacker paradise' at MIT came to an end in early 80s when most of its staff leftto form commercial enterprises, the spirit lived on in Stallman's GNU project and inacademic circles. In 1991, inspired by a small Unix variant called Minix, LinusTorvalds started a new operating system later labelled as Linux. The system started todevelop as a collaborative effort empowered by the rapidly spreading Internet. Thehacker spirit came out of the academic enclaves where it had temporarily been forced toretreat by the proprietary model. The following years saw the gradual return of hackers –besides Linux and its many distributions, also on projects like Apache, MySQL, PHP,GNOME, KDE and others. The new millennium brought along many interestingdevelopments – not only in software (OpenOffice.org, Ubuntu Linux) but even more theextension of the hacker model into other fields (content production, e-learning etc).
3. Doing it the hacker way
The power of hacker model probably lies in the combination of two factors:
• open source development – the whole process is public, allowing everyone to studythe project in detail; participation is unhindered; there is also no externalencumbrance in the form of licenses, patents, trademarks etc.
• playful, informal approach – the project is managed in a way that allows creativity,unorthodox ideas and 'not-so-serious' mentality while keeping the level ofstructure/hierarchy as low as possible.
Achievement of the former is mostly a technical aspect (choosing the right platform,tools and distribution channels), while the latter is addressed by management.
4 Case study: Open Source Game Development at Tallinn University
In 2007, Tallinn University launched its new IMKE (Interactive Media and KnowledgeEnvironments) Master programme which had open source approach as one of its centralideas (coupled with the pedagogical concepts of constructivism and knowledgebuilding). From that base stemmed the idea to test out the historical hacker model in anacademic setting – adding a third, teaching/learning factor to the two mentioned above.
An exploratory case study was carried out during a pilot course at Tallinn University.We used the Action Research methodology for the following research questions:
268
1) How to compose an effective online environment that supports collaborativeknowledge building among students, as well as self-directed learning?
2) Can we reach curriculum goals through game scenario development?
3) How well does the playful learning strategy support groups of learners with differentcoherence factor (homogenous vs heterogenous)?
4.1 Context: The Two Courses
The Open Source Management (OSM) Master course in autumn term and the Methodsand Practices of Free Software (MPFS) in spring term were chosen as testing vehicles.The main goal of both courses is to familiarise the students with different aspects ofFree/Open-Source Software (licensing, business models, development methods, history,motivation etc), including a small practical project.
The OSM is offered during the first term of the studies. At its initial launch in autumn2007, 6 students took the course (as attendance to IMKE as a startup programme is quitelow yet), all of whom also finished it.
As the OSM course was successful, the same methods were also used at the Methods ofPractices of Free Software course in the following spring term of 2008. The MPFS is aBachelor-level elective course usually taken by the third-year students of computerscience. In 2008, it started with 23 students, all except one finished the course.
Comparing the two courses, the differences were
• study level – Master level in OSM, Bachelor level in MPFS
• number of attendance
• background of participants – in OSM, the students had their background ineducation and media, and while most of them did have adequate power-user levelcomputer skills, they had almost no practical experience in computer programming– the fact that limited the use of possible tools for practical tasks quite seriously(given that most open-source projects involve programming in one way or another).On the contrary, the MPFS students were essentially on their way to graduating withB.Sc in information technology (and most of them did the following summer) andhad working knowledge in programming, with many working in the field already.
• orientation – the approach in MPFS was somewhat more practical and technical,given the better and more coherent IT background of students.. Yet the practicaltasks involving teamwork was quite the same as in OSM.
However, in both cases, most of the the students lacked previous knowledge of thecooperative tools (Trac, Subversion) and only some of them had some superficialexperience with The Battle for Wesnoth.
269
The participants formed teams of 3-5 people – in OSM there were Red and Blue teamswith 3 students each, while the MPFS had Red, Yellow, Green, Blue and Grey with 3-5students each (most teams had 4-5 people, one fell to 3 due to a member quitting). Inboth cases, each team had to build a mini-campaign of 3 scenarios for The Battle forWesnoth, using the collaborative tools to coordinate the effort and share the code.
4.2 The tools
The Battle for Wesnoth (BfW) is a turn-based, multiplayer, fantasy strategy game, whichis free, open-source (under GNU GPL) and cross-platform (including MS Windows,Linux and MacOS X). The project started in 2003 and has since developed a remarkablefollowing - the game engine development credits contain more than 400 names, thenumber of game data (campaigns and scenarios) developers is much larger. Being ofsimilar quality with proprietary games, it is a major open-source success story..
The BfW is played on a hexagonal grid (map) in turns either as a multiplayer match orsingle-player, multi-scenario campaigns. The game rules are simple but hard to master.The game has a large number of units with varying abilities, the gameplay is alsoaffected by the day-twilight-night cycle (lawful vs chaotic units) and different terrain.As campaigns consist of multiple scenarios, surviving units can be carried over.
Besides the main engine, a crucial component of the BfW is the game data which isentirely contributed by the community. There is a number of 'official campaigns'(thoroughly tested and chosen by the core team) and a much larger choice of user-madeones. All campaigns are downloadable in-game from a central application server.
Most of the game data is written in Wesnoth Markup Language (WML) – a human-readable, structured markup language resembling XML (according to the BfW website,it is used to code almost everything, including scenarios, units, savefiles, and the userinterface layout). WML allows a wide variety of entities – variables, events etc.
Besides BfW, the other crucial tool was Trac – a Web-based software projectmanagement environment with a bug-tracker, a ticket-based workflow managementsystem and an integrated Subversion code repository. It allowed the students to learnversion management and workflow management, plus provided a wiki for interaction.
4.4. Learning tasks on the courses
The considerations for choosing a game-related task over more conventional, 'moreserious' programming tasks for the initial OSM course can be summarised as follows:
• it matched better the diverse background of the participants
• it allowed for a wider range of different sub-tasks
• it sparked the hacker-ish innovative creativity
270
In comparison, the MPFS students, while being more apt in technical matters, were in anequally new situation regarding the community building (as well as the playful mindset).
Developing a scenario for the BfW requires elements from three different areas:artistic/visual (choosing/creating the units, building the maps, creating the introductoryscreens etc), narrative/verbal (building up a story) and technical/logical (the small-scalesoftware project in WML), due to different roles involved. It will also be beneficial tothe development of overall creativity – in his essay „How To Become A Hacker“, Eric S.Raymond lists web skills as mandatory for a hacker, largely for the same reason [Ra01].
The students had to go through the following steps:
• creating the storyline, planning the major events and outlining scenarios
• Choosing and building units for main characters
• Each scenario involved
• Design (objectives, events)
• Map design (considering terrain and starting points)'
• Choosing units and recruitment scheme
• Coding the scenario
• Coding the campaign summary after individual scenarios were finished
• Testing and balancing
4.5. Results
In both cases, students were very excited and well-motivated (which also reflects in thevery low dropout rate). As a reflection of the creative, non-standard spirit, one of theMPFS diverted greatly from the original Wesnoth fantasy world, building rather adystopian, “Mad Max”-style alternative reality which was considerably different fromthe original setting. (yet using the same game environment and tools)
Regarding the research questions:
1) Trac proved to be an adequate means for building a creative community – thewiki discussion was quite lively, as well as using the ticket system for bughunting. However, it must be considered that the participants were able to meetoffline as well – in a fully distant setting and a greater number of participants, itwould be beneficial to add other Web 2.0 channels as well (development blogs,Skype, Ekiga or other voice chat etc).
271
2) The playful approach in choosing BfW as the practical exercise served the thepurpose of the course well. The student were able to learn about differentaspects of free/open-source software development as well as experience thesame excitement that was characteristic to early hackers (see the introduction).
3) Despite the different compositions of the two courses and varying degrees ofcoherence, the playful approach worked out well. While the students of MPFSwere able to make use of their better training in software engineering inbuilding more feature-rich scenarios, the largely non-technical students of OSMwere able to obtain enough technical skills to have the same general experience.
We found BfW to be useful for teaching a number of diverse subjects includingstorytelling/narrative, graphic design, animation, markup languages and event-drivenprogramming. These can be mixed and balanced according to the audience, allowing agood range of accommodation. The playful, game-based approach is also easier to 'sell'to non-technical students, many of which would often feel shy of taking computerprogramming courses.
5 Conclusions
On the basis of successful experiment with the courses, we propose that methods ofplayful learning can be further adopted in teaching and learning computer science, as:
- involving students in game development can (in case of good orchestrationfrom the teacher’s side) enhance collaborative knowledge building, especiallyin case of incoherent student groups with limited technical preparation.
- open, community-based software development models are going to thrive in thefuture, so universites should introduce these skills to future software developers- and the best way to do it is “learning by doing”.
Acknowledgements
This study was funded by Estonian MER targeted research grant 0130159s08.
References
[Hi01] Himanen, P.: The Hacker Ethic and the Spirit of the Information Age. Random HouseInc. New York, 2001.
[Le01] Levy, S.: Hackers, Heroes of the Computer Revolution. New York, NY: BantamDoubleday Dell Publishing Group, 2001.
[Ra01] Raymond, E.S.: How to become a Hacker. Available on the WWW athttp://www.catb.org/~esr/faqs/hacker-howto.html
272
Web 2.0 artifacts in SME-networks – A qualitativeapproach towards an integrative conceptualization
considering organizational and technicalperspectives
Nadine Blinn1, Nadine Lindermann2, Katrin Fäcks1, Markus Nüttgens1
1University of HamburgSchool of Business, Economics and Social Sciences
Institute for Information SystemsVon-Melle-Park 9, D-20146 [email protected]@wiso.uni-hamburg.de
2University of Koblenz-LandauComputer Science FacultyInstitute for Management
Universitaetsstrasse 1, D-56070 [email protected]
Abstract: Small and medium sized enterprises (SMEs) face new challenges in acomplex and dynamic competitive environment. According to this, SMEs need tocooperate due to their restricted resources and limited capacities. At this,Enterprise 2.0 is seen as a supporting approach. As there is a lack of academicpublications concerning recommendations for the application of Web 2.0 artifactsin SME-networks, we aim at bridging this gap with the following paper by su-ggesting a conceptual base following the design science approach. Based on tech-nical and organizational requirements resulting from interviews with represen-tatives of SMEs participating in a regional SME-network, we transfer technical andorganizational requirements in a prototypic concept. This developed conceptprovides a basis for a field test to evaluate the concept and for further research.
1 Introduction
Since small- and medium sized enterprises (SMEs) represent 99 % of all EuropeanEnterprises, they are of high social and economic importance within Europe [EC03].With respect to their restricted resources and limited capacity for innovation, SMEs needto cooperate to compete with new challenges in a complex and dynamic competitiveenvironment. Thereby cooperation enables SMEs to access and operate on an extendedresource base [HP96; SC07].
273
From the technical point of view, Web 2.0 tools as software-oriented Web 2.0 artifacts1are seen as adequate tools for SMEs to increase productivity as well as proximity to themarket [Wy08]. The advantages of Web 2.0 tools in internal use of enterprises arebeyond dispute. However, the implementation of Web 2.0 artifacts in SMEs is consi-dered useful and necessary [Al09; Fa06] but expandable, as the implementation of Web2.0 artifacts remains exceptional [CB07]. From an organizational point of view, SMEsare often aligned in a patriarchic way. Thus, entrepreneurial initiatives are often drivenby one or two individuals [Sc97]. Consequently, generally not all employees canparticipate in the development of new ideas [TH96].
At present, results considering a concept to support the challenges of SME-networks byusing the Web 2.0 approach considering technical and organizational perspectives, arenot published in the information system research landscape. This paper aims at bridgingthis gap by presenting actual results of a qualitative research approach. Following thedesign science approach [He04] our work aims at depicting Web 2.0 tools that have to beimplemented within a network of SMEs by means of an incremental qualitative approachconsidering organizational and technical perspectives. The paper is structured as follo-wed: Chapter 2 outlines general characteristics of SMEs and Web 2.0 as well as howSMEs are using Web 2.0 in practice. Thereby we emphasize the need for an integrativeconsideration of organizational and technical aspects in the software developmentprocess of Web 2.0. Chapter 3 presents results of expert interviews conducted withSME-managers of the “WirtschaftsForum Neuwied e.V.”, a SME-network in consi-deration. Thereby we gathered organizational and technical requirements for thedevelopment of the Web 2.0 platform. Based on these results, recommendations for anincremental software development process considering organizational and technicalrequirements towards an integrative Web 2.0 conceptualization are given. Chapter 4concludes with further research questions and next steps within the project.
2 Background: Web 2.0 in the Context of SMEs
Web 2.0 is a term which has a high popularity and is widely disputed within theliterature. It provides new possibilities for companies to organize their business in aninnovative way. This chapter aims to introduce Web 2.0 in an organizational context.Therefore it outlines results of actual studies that analyze how enterprises, especiallySMEs are using Web 2.0 in practice and which challenges they are facing by using it. Onthe basis of these findings we derive an incremental research approach to develop a Web2.0 platform within a specific SME-network.
1 In the following the term “Web 2.0 artifact” comprises Web 2.0 applications (e.g. blogs) alsonamed Web 2.0 tools as well as Web 2.0 concepts (e.g. tagging).
274
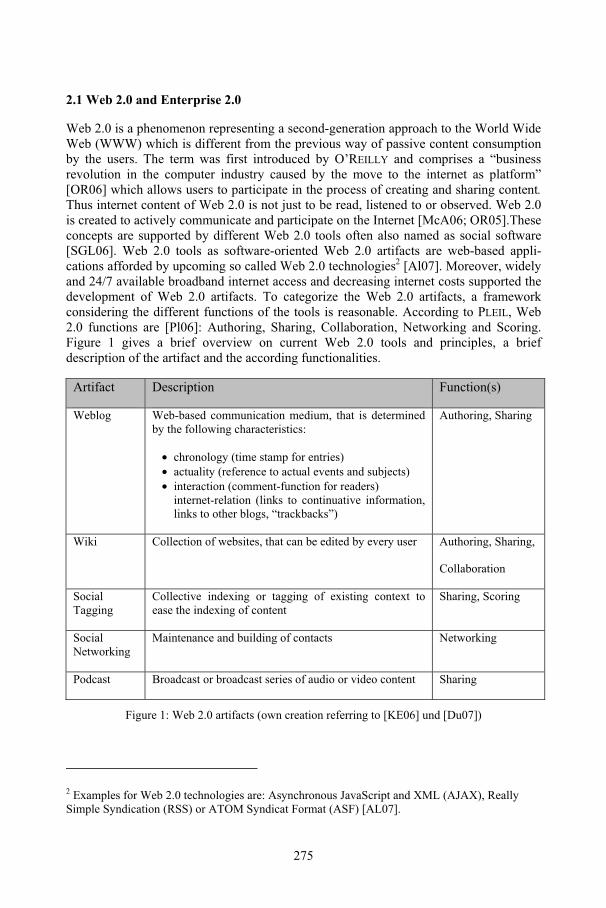
2.1 Web 2.0 and Enterprise 2.0
Web 2.0 is a phenomenon representing a second-generation approach to the World WideWeb (WWW) which is different from the previous way of passive content consumptionby the users. The term was first introduced by O’REILLY and comprises a “businessrevolution in the computer industry caused by the move to the internet as platform”[OR06] which allows users to participate in the process of creating and sharing content.Thus internet content of Web 2.0 is not just to be read, listened to or observed. Web 2.0is created to actively communicate and participate on the Internet [McA06; OR05].Theseconcepts are supported by different Web 2.0 tools often also named as social software[SGL06]. Web 2.0 tools as software-oriented Web 2.0 artifacts are web-based appli-cations afforded by upcoming so called Web 2.0 technologies2 [Al07]. Moreover, widelyand 24/7 available broadband internet access and decreasing internet costs supported thedevelopment of Web 2.0 artifacts. To categorize the Web 2.0 artifacts, a frameworkconsidering the different functions of the tools is reasonable. According to PLEIL, Web2.0 functions are [Pl06]: Authoring, Sharing, Collaboration, Networking and Scoring.Figure 1 gives a brief overview on current Web 2.0 tools and principles, a briefdescription of the artifact and the according functionalities.
Artifact Description Function(s)
Weblog Web-based communication medium, that is determinedby the following characteristics:
• chronology (time stamp for entries)• actuality (reference to actual events and subjects)• interaction (comment-function for readers)internet-relation (links to continuative information,links to other blogs, “trackbacks”)
Authoring, Sharing
Wiki Collection of websites, that can be edited by every user Authoring, Sharing,
Collaboration
SocialTagging
Collective indexing or tagging of existing context toease the indexing of content
Sharing, Scoring
SocialNetworking
Maintenance and building of contacts Networking
Podcast Broadcast or broadcast series of audio or video content Sharing
Figure 1: Web 2.0 artifacts (own creation referring to [KE06] und [Du07])
2 Examples for Web 2.0 technologies are: Asynchronous JavaScript and XML (AJAX), ReallySimple Syndication (RSS) or ATOM Syndicat Format (ASF) [AL07].
275
Applying Web 2.0 technology in an organizational context is referred to the term ofEnterprise 2.0. The term was coined by MCAFEE to focus on those Web 2.0 platformsthat are used “within companies, or between companies and their partners andcustomers” [McA06]. While Web 2.0 is stated to be a business revolution and amilestone in the WWW it is also criticized just to be hype or a “dotcom bubble”. Thus,the section below sketches major results of actual studies analyzing the question of howcompanies are using Web 2.0 technologies in practice.
2.2 Enterprise 2.0 in Practice: State of the Art
This section summarizes main results of actual studies which are considering the state ofthe art of Enterprise 2.0 in practice [CB07; McK08; TEI07]: In a nutshell there is a trendthat Web 2.0 is becoming familiar within the companies and that all companies plan tospend more on it. Primarily large companies and enterprises that are deriving businessvalue from Web 2.0 are extensively using it. Thereby Web 2.0 tools are integrated intobusiness activities both outside the company to improve customer services and relationsand inside the company to optimize internal information and knowledge management.However, not all companies are using Web 2.0. While some companies are dissatisfiedwith existing Web 2.0 tools and abandon the use of them, for some companies the termWeb 2.0 is not known and its benefits are not clear: Web 2.0 comprises a multitude oftechnologies, applications and services that provide different functionalities and servicesthat are hardly to differentiate. As no common definition of Web 2.0 exists, just a fewpeople really know what it means. Managers do not understand the economical benefitthat Web 2.0 can bring to their company and do not encourage the use of it within theenterprise. Besides, some companies suspect a lack of security by using Web 2.0. WhileSMEs are companies with less than 250 employees [EC03] the section below statesfurther challenges of applying Web 2.0 in SMEs’ practice.
2.3 The Challenge of Applying Web 2.0 in SMEs
Even though companies perceive an increasing benefit by using Web 2.0, its adoption isaffiliated with primarily non-technical barriers and challenges. Applying Web 2.0 inSMEs thus requires considering the specific characteristics of SMEs to gain anunderstanding of how Web 2.0 is actually used in SMEs-practice. In general, the SMEsector is very dynamic. While many new enterprises start up every year only fortypercent of them survive for ten years [LP05]. This is caused by the specific managementstructure of these companies: SMEs are considerably influenced by the personality of thecompany’s owners and their attitude to do business [BG06; LP05]: A real small firm hastwo arms, two legs and a giant ego” [Bu01]. The strategic horizon tends to be short withfocus on a survival strategy and a reactive decision style due to limited resources [LP05].
276
Thus, planning and implementing Information Technology (IT) tends to take a short-term perspective. IT is used to manage day-to-day operations rather than to supportmanagement activities. As SMEs mostly have no IT department or expertise, the SME’sowner is the only person with authority and (limited) knowledge to identify IT-opportunities and to adopt them. Implementing IT often occurs in an ad hoc fashion andhighly depends on the owner’s personality, experience and skills [LP05; SC07].
Given this context, the adoption of Web 2.0 in SMEs practice differs in some pointsfrom the study results outlined previously. While an intensive SMEs’ usage of theInternet can be observed, the utilization of Web 2.0 remains exception. Internet is mainlyused for e-mail communication with customers and suppliers as well as collectinginformation. However there is an increasing use of complex online applications forcustomer service and purchase. In the next two years rising internet activities forcustomer communication are expected. Contrary to this Web 2.0 has no businessrelevance for some SMEs. Although they perceive improvements in customer relationsor an optimization in gathering information, SMEs consider the potential of success ofWeb 2.0 with skepticism. A SMEs’ minority believe that Web 2.0 will impact theirbusiness since they are not able to evaluate its potential. Additionally a SMEs’ majorityperceives risks by using Web 2.0 within their company (e.g. legal risks, risks of abuse)[DS08a; DS08b; ECH08; SCN08].
3 A Concept for Cooperation Support of SMEs by Web 2.0 artifacts
Within the project KMU 2.03 (SME 2.0) we could observe that SMEs perceive potentialsby using Web 2.0 technology in a cross-organizational context. Thereby Web 2.0provides possibilities to meet the needs for efficient collaboration as well as to gaineconomical benefit from it. In this regard, we introduce the term SME 2.0 to focus onWeb 2.0 applications that are targeted at the necessities of SME-networks [vK08].Thereby SME 2.0 “can’t just to be about a wiki here, a blog there forever” [Ho07] itrather has to be embedded in the specific context of the particular SME-network [KR07].
3.1 Use Case and Research Design
The research project KMU 2.0 explores new management strategies for collaboration inSME-networks enabled by Web 2.0 applications and referring to innovative andcooperative solutions for daily work life problems (e.g. worker’s health protection orwork-life balance issues). This comprises an analysis of concepts and models of self-organization and information technology (IT) in the context of Web 2.0, assuming
• An employee’s confidence in using Web 2.0 applications in private life and thus amotivation to participate on a Web 2.0 platform in work life.
• A high potential for creativity and innovation offered by heterogeneous groups.
3KMU 2.0 is funded by the German Federal Ministry of Education and Research (BMBF). For furtherinformation see www.kmu20.net.
277
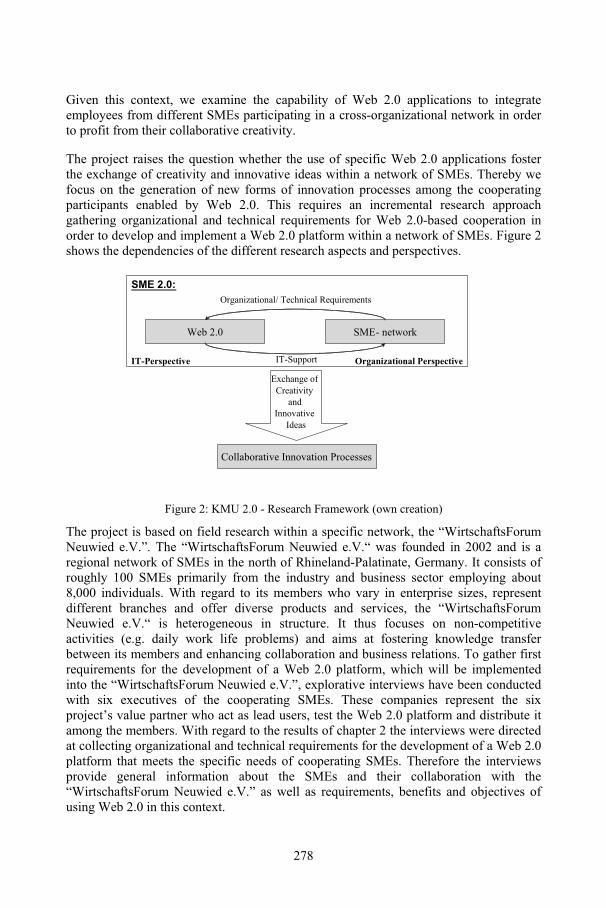
Given this context, we examine the capability of Web 2.0 applications to integrateemployees from different SMEs participating in a cross-organizational network in orderto profit from their collaborative creativity.
The project raises the question whether the use of specific Web 2.0 applications fosterthe exchange of creativity and innovative ideas within a network of SMEs. Thereby wefocus on the generation of new forms of innovation processes among the cooperatingparticipants enabled by Web 2.0. This requires an incremental research approachgathering organizational and technical requirements for Web 2.0-based cooperation inorder to develop and implement a Web 2.0 platform within a network of SMEs. Figure 2shows the dependencies of the different research aspects and perspectives.
Figure 2: KMU 2.0 - Research Framework (own creation)
The project is based on field research within a specific network, the “WirtschaftsForumNeuwied e.V.”. The “WirtschaftsForum Neuwied e.V.“ was founded in 2002 and is aregional network of SMEs in the north of Rhineland-Palatinate, Germany. It consists ofroughly 100 SMEs primarily from the industry and business sector employing about8,000 individuals. With regard to its members who vary in enterprise sizes, representdifferent branches and offer diverse products and services, the “WirtschaftsForumNeuwied e.V.“ is heterogeneous in structure. It thus focuses on non-competitiveactivities (e.g. daily work life problems) and aims at fostering knowledge transferbetween its members and enhancing collaboration and business relations. To gather firstrequirements for the development of a Web 2.0 platform, which will be implementedinto the “WirtschaftsForum Neuwied e.V.”, explorative interviews have been conductedwith six executives of the cooperating SMEs. These companies represent the sixproject’s value partner who act as lead users, test the Web 2.0 platform and distribute itamong the members. With regard to the results of chapter 2 the interviews were directedat collecting organizational and technical requirements for the development of a Web 2.0platform that meets the specific needs of cooperating SMEs. Therefore the interviewsprovide general information about the SMEs and their collaboration with the“WirtschaftsForum Neuwied e.V.” as well as requirements, benefits and objectives ofusing Web 2.0 in this context.
SME 2.0:Organizational/ Technical Requirements
Web 2.0 SME- network
IT-Support
Collaborative Innovation Processes
Exchange ofCreativityand
InnovativeIdeas
IT-Perspective Organizational Perspective
278
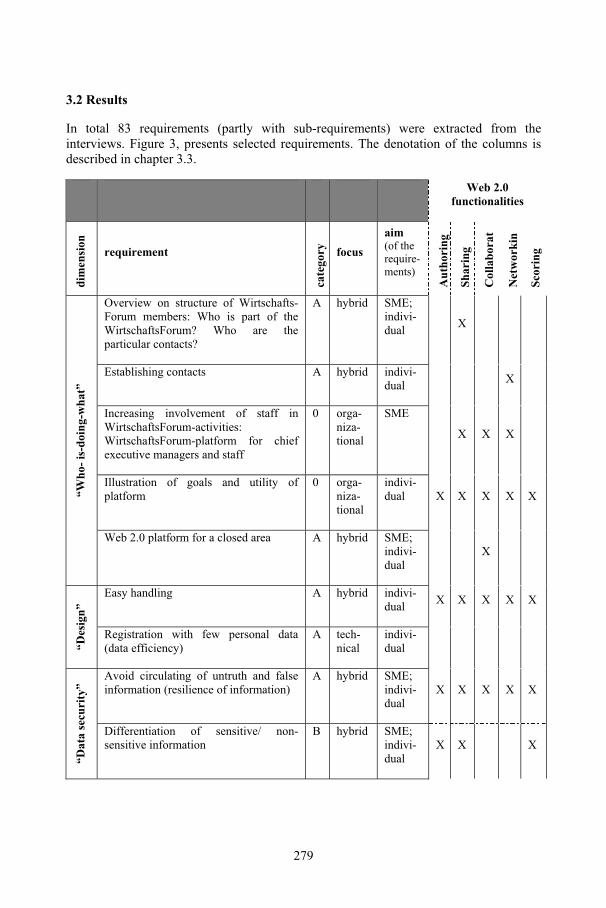
3.2 Results
In total 83 requirements (partly with sub-requirements) were extracted from theinterviews. Figure 3, presents selected requirements. The denotation of the columns isdescribed in chapter 3.3.
Web 2.0functionalities
dimension
requirement
category focus
aim(of therequire-ments)
Authoring
Sharing
Collaborat
Networkin
Scoring
“Who-is-doing-what”
Overview on structure of Wirtschafts-Forum members: Who is part of theWirtschaftsForum? Who are theparticular contacts?
A hybrid SME;indivi-dual X
Establishing contacts A hybrid indivi-dual X
Increasing involvement of staff inWirtschaftsForum-activities:WirtschaftsForum-platform for chiefexecutive managers and staff
0 orga-niza-tional
SME
X X X
Illustration of goals and utility ofplatform
0 orga-niza-tional
indivi-dual X X X X X
Web 2.0 platform for a closed area A hybrid SME;indivi-dual
X
“Design”
Easy handling A hybrid indivi-dual X X X X X
Registration with few personal data(data efficiency)
A tech-nical
indivi-dual
“Datasecurity”
Avoid circulating of untruth and falseinformation (resilience of information)
A hybrid SME;indivi-dual
X X X X X
Differentiation of sensitive/ non-sensitive information
B hybrid SME;indivi-dual
X X X
279
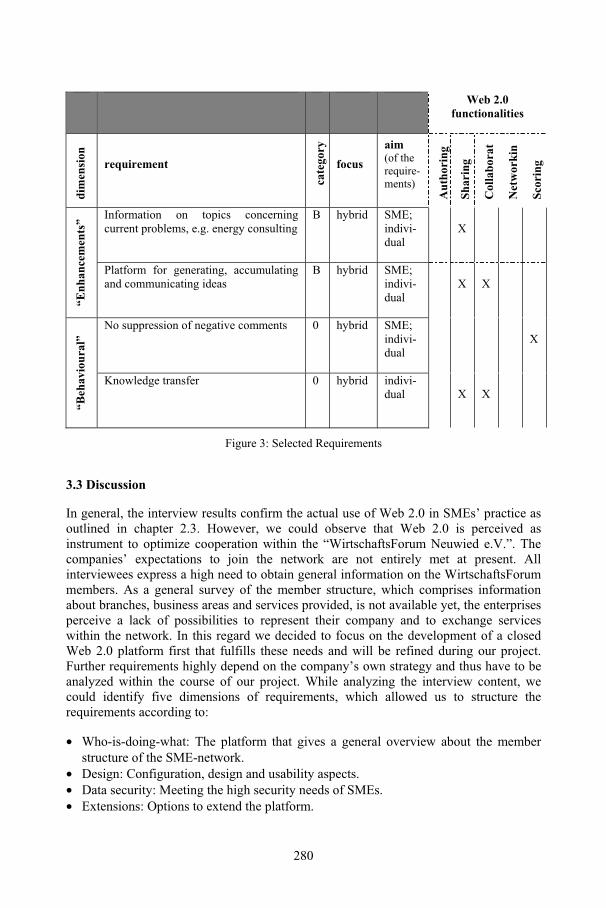
Web 2.0functionalities
dimension
requirement
category
focusaim(of therequire-ments)
Authoring
Sharing
Collaborat
Networkin
Scoring
“Enhancements” Information on topics concerning
current problems, e.g. energy consultingB hybrid SME;
indivi-dual
X
Platform for generating, accumulatingand communicating ideas
B hybrid SME;indivi-dual
X X
“Behavioural”
No suppression of negative comments 0 hybrid SME;indivi-dual
X
Knowledge transfer 0 hybrid indivi-dual X X
Figure 3: Selected Requirements
3.3 Discussion
In general, the interview results confirm the actual use of Web 2.0 in SMEs’ practice asoutlined in chapter 2.3. However, we could observe that Web 2.0 is perceived asinstrument to optimize cooperation within the “WirtschaftsForum Neuwied e.V.”. Thecompanies’ expectations to join the network are not entirely met at present. Allinterviewees express a high need to obtain general information on the WirtschaftsForummembers. As a general survey of the member structure, which comprises informationabout branches, business areas and services provided, is not available yet, the enterprisesperceive a lack of possibilities to represent their company and to exchange serviceswithin the network. In this regard we decided to focus on the development of a closedWeb 2.0 platform first that fulfills these needs and will be refined during our project.Further requirements highly depend on the company’s own strategy and thus have to beanalyzed within the course of our project. While analyzing the interview content, wecould identify five dimensions of requirements, which allowed us to structure therequirements according to:
• Who-is-doing-what: The platform that gives a general overview about the memberstructure of the SME-network.
• Design: Configuration, design and usability aspects.• Data security: Meeting the high security needs of SMEs.• Extensions: Options to extend the platform.
280
• Behavioral: Aspects comprising rules and ethical code that constitute the overallbehaviour of the platform participants.
These requirements aim partly on technical aspects of the prototype (e.g. ease of use),partly on organizational aspects (e.g. gaining economical benefit) and partly on hybridaspects. We identified hybrid aspects as organizational requirements, which can besupported by technology (e.g. initiation of contacts). By assigning the Web 2.0functionalities (Authoring, Sharing, Collaboration, Networking, Scoring) to theparticular requirements and dimensions, we could schematically identify the Web 2.0tool that fulfils these requirements.
The requirements can be categorized according to the aim of their use. Either they aim atsupporting individual use, the SMEs’ use or both. Furthermore we categorized therequirements according to importance A (must have within the first prototype) and B(further implementation). As a result we could identify the relevant requirements foreach iterative phase of our incremental development process. Requirements that cannotbe realized by technical means are categorized by “0”. These requirements are thusimportant for the organizational management of the SME-network. Analyzing thedimensions, we summarized that a social network tool is the Web 2.0 tool fulfilling mostof the A-requirements and providing the most technical possibilities to expand theplatform (according to www.wer-kennt-wen.de). Thereby we follow the principle ofspare use of applications implying that the use of different applications with same orsimilar functions is avoided.
3.4. Recommendations
As most of the members of the “WirtschaftsForum Neuwied e.V.” are not familiar withWeb 2.0 concepts or Web 2.0 tools, the academic project partners decided toconceptualize a prototypic Web 2.0 platform in an early stage of the project. Thisdecision was made, so that the Forum members have a “playgroud” to try out and tolearn the Web 2.0 concepts by using them. The information and requirements weobtained from the interviews showed that a prototype fulfilling all requirements at onceis neither realizable nor reasonable. As most of the interviewed persons are not commonwith Web 2.0 concepts or Web 2.0 tools, they probably change their requirements duringtesting the prototype and identify more requirements during the testing phase.
By analyzing the interview recordings we could identify three groups of requirements:technical requirements, organizational requirements and hybrid requirements concerninginseparable technical and organizational perspectives. Hence, to transfer theserequirements into an integrated conceptualization considering all groups of requirements,an iterative proceeding is necessary. In such a manner, Web 2.0 artifacts can beimplemented in sustainable way into the SME-network. Towards an integratedconceptualization, we recommend the following steps:
1. Requirements survey: information gathering by structured interviews to obtain firstuser requirements, extracting the requirements of the interviews by analyzing thequintessence
281

2. Classification of the requirements: To structure the requirements, we recommendseveral dimensions (cp. Figure 3), to classify the requirements. The recommendeddimensions are: A) Main content requirements (in the given case “Who-is-doing-what”) B) Design C) Data security D) Extensions E) Behavioral. After havingallocated a requirement, we recommend to identify the associated Web 2.0functionalities as well as the requirement group (technical, organizational, hybrid).The web 2.0 functionalities provide a basis for prioritizing the technicalrequirements:
3. Prioritization of the (technical) requirements to obtain a first set of requirements forthe first prototype (A: first prototype, B: further implementation).
4. Implementation of A-requirements in a first prototype according to the identifiedWeb 2.0 tool.
5. Train the users for basic functionalities. Thereby present the economical benefits thecompanies have by participating on the platform
6. Testing the prototype in a two-tier procedure: First, the lead users (in our case: aheterogeneous group of 6 so called-value partners) test the prototype. Then, theentire Forum will test the prototype. Accompanying, the lead users act as opinionformers
7. Requirements survey: In a second round, further requirements are surveyed, thatresult from the testing stage.
8. Implementation of B-requirements and after-testing requirements
9. Testing the extended prototype and monitoring of the user behaviour (e.g. clickingpaths).
With this set of recommendations we aim at suggesting a sustainable concept toimplement Web 2.0 in a SME-network. The concept is going to be evaluated incooperation with “WirtschaftsForum Neuwied e.V.”.
4 Summary and Outlook
Small and medium sized enterprises (SMEs) face new challenges in a complex anddynamic competitive environment. To compete with these challenges, SMEs need tocooperate due to their restricted resources and limited capacities. Enterprise 2.0 is seenas an approach to solve the current problems that SMEs have to solve. As there is a lackof academic publications concerning recommendations for the application of Web 2.0artifacts in SME-networks, we presented a conceptual base following the design scienceapproach.
282
The approach bases on technical and organizational requirements resulting frominterviews with representatives of SMEs participating in a regional SME-network. Withthe aid of several analyzing dimensions, we identified technical, organizational as wellas hybrid requirements and transferred them in a prototypic iterative concept. We willapply this concept and evaluate it in cooperation with the “WirtschaftsForum Neuwiede.V.”.
This leads us to further research questions: can Web 2.0 newbies in the SMEs handle theprototype? Is sustain “learning” of Web 2.0 artifacts possible? How do individualsaccept or decline the Web 2.0 artifacts? Do the users apply the prototypic Web 2.0platform to solve their work life problems? Is this concept unchanged portable to otherSME-networks? After having implemented the first prototype, the next step is to trainthe users and evaluate the acceptance of the prototype. Furthermore, according to therecommended concept, further requirements are going to be surveyed.
Literature
[AL07] Alby, T.: Web 2.0 – Konzepte, Anwendungen, Technologien. Hanser, München, 2007.[Al09] Albrecht, S.: Web 2.0 – Eine Chance für den Mittelstand. http://www.firmenwissen.de/-
redaktion/fachartikel/chance_fuer_den_mittelstand.html, 2009. Last access: 2nd ofJanuary 2009.
[BG06] Bellmann, K.; Gerster, B.: Netzwerkmanagement kleiner und mittlerer Unternehmen:Eine theoretische und empirische Untersuchung. In: Bellmann, K. and Becker, T. (eds.):Wertschöpfungsnetzwerke, Erich Schmidt Verlag, Berlin, 2006, p. 53-68.
[Bu01] Burns, P.: Entrepreneurship and Small Business. Palgrave, Hampshire, 2001, UK.[CB07] CoreMedia; Berlecon Research: Enterprise 2.0 in Deutschland – Verbreitung, Chancen
und Herausforderungen. A Study on behalf of CoreMedia conducted by BerleconResearch, November 2007.
[DS08a] De Saulles, M.: SMEs and the Web – Executive Summary. University of Brighton,2008.
[DS08b] De Saulles, M.: Never too small to join the party. In: Information World Review, third ofSeptember 2008. http://www.iwr.co.uk/information-world-review/features/2225252/never-small-join-party, last access: 31th of December 2008.
[Du07] Duschinski, H.: Web 2.0 – Chancen und Risiken für die Unternehmenskommunikation.Diplomica, Hamburg, 2007.
[EC03] European Commission: The new SME Definition – User guide and model declaration.Enterprise and Industry Publication, 2003.
[ECH08] E-Commerce Center Handel: Elektronischer Geschäftsverkehr in Mittelstand undHandwerk – Ihre Erfahrungen und Wünsche 2008. Ergebnisse einer Untersuchung imAuftrag des Bundesministeriums für Wirtschaft und Technologie. Berichtsband derNEG-Untersuchung. E-Commerce Center am Institut für Handelsforschung, Köln 2008.
[Fa06] Farrell, J.: Wikis, Blogs and other community tool in the enterprise – solve enterpriseapplication problems with social collaboration technology. http://www.ibm.com/developerworks/library/wa-wikiapps.html, 2006. Last access: 2nd of January 2009.
[He04] Hevner, A. R.; March, S. T.; Jinsoo, P.; Ram, S.: Design Science in InformationSystems. In: MIS Quarterly, Jg. 28, H. 1, p. 75–105, 2004.
[Ho07] Hoover, M. J.: Most Business Tech Pros Wary About Web 2.0 Tools in Business. In:Information Week, 26th of February issue, 2007.
283
[HP96] Human, S. E.; Provan K. G.: External Resource Exchange and Perceptions ofCompetitiveness within Organizational Networks: An Organizational LearningPerspective. Frontiers of Entrepreneurship Research, 1996.
[KE06] Kolo, C.; Eichner, D.: Web 2.0 und der neue Internet-Boom – Was ist es, was treibt esund was bedeutet es für Unternehmen?http://www.robertundhorst.de/v2/img/downloads/Web_2.0.pdf?PHPSESSID=3b45d404f7fec55a20ce077e2b7c6ab2, 2006. Last access: 2nd of January 2009.
[KR07] Koch, M.; Richter, A.: Enterprise 2.0 – Planung, Einführung und erfolgreicher Einsatzvon Social Software in Unternehmen. Oldenbourg, München, 2007.
[LP05] Levy, M.; Powell, P.: Strategies for Growth in SMEs – The Role of Information andInformation Systems. In: Information Systems Series (ISS). Elsevier, Oxford 2005.
[McA06] McAfee, A.P.: Enterprise 2.0: The Drawn of Emergent Collaboration. In: SloanManagement Review, Vol. 47, No. 3, p. 21-28, 2006.
[McK08] McKinsey and Company: Building the Web 2.0 Enterprise: Mc Kinsey Global SurveyResults. The McKinsey Quarterly, July 2008.
[OR05] O’Reilly, T.: What Is Web 2.0 – Design Patterns and Business Models for the NextGeneration of Software. http://www.oreillynet.com/pub/a/oreilly/tim/news/2005/09/30/what-is-web-20.html, 2005. Last access: 31th of December 2008.
[OR06] O’Reilly, T.: Web 2.0 Compact Definition: Trying Again. http://radar.oreilly.com/archives/2006/12/web-20-compact.html, 2006. Last access: 31th of December 2008.
[Pl06] Pleil, T.: Social Software im Redaktionsmarketing http://thomaspleil.files.wordpress.com/2006/09/pleil-medien-2-0.pdf, 2006. Last access: 2nd of January 2009.
[Sc97] Scherer, E.: Hilfe zur Selbsthilfe – Reorganisationsstrategien für KMU. In:Unkonventionelle unternehmerische Konzepte, Reorganisation und Innovation in Klein-und Mittelbetrieben – erfolgreiche Beispiele, Zürich 1997. p. 11-16.
[SC07] Street, C. T.; Cameron A. F. : External Relationships and the Small Business: A Reviewof Small Business Alliance and Network Research. In: Journal of Small BusinessManagement, Vol. 45, No. 2, p. 239-266, 2007.
[SCN08] Social Computing News Desk: “Web 2.0 is All About Using the Power of the WebBusiness Advantages”, Says Expert. In Social Computing Magazine, 25 May 2007.http://www.socialcomputingmagazine.com/viewcolumn.cfm?colid=249#bio, 2008. Lastaccess: 31th of December 2008.
[SGL06] Szugat, M.; Gewehr, J. E.; Lochmann, C.: Social Software – Blogs, Wikis & Co.entwickler.press, Frankfurt am Main, 2006.
[TEI07] The Economist Intelligence Unit: Serious Business – Web 2.0 Goes Corporate. Reportfrom the Economist Intelligence Unit Sponsored by FAST, 2007.
[TH96] Thielemann F.: Die Gestaltung von Kooperationen kleiner und mittlerer Unternehmen,In: Innovation: Forschung und Management. No. 7, IAI Institut für angewandteInnovationsforschung, Bochum.
[vK08] Von Kortzfleisch, H. F. O.; Mergel, I.; Manouchehri, S.; Schaarschmidt, M.: CorporateWeb 2.0 Applications: Motives, Organizational Embeddedness, and Creativity. In: Hass,B.; Walsh, G. and Kilian, T. (eds.): Web 2.0: Neue Perspektiven für Marketing undHandel [trans. New Perspectives in Marketing and Business], Springer, Berlin, 2008,p. 73-89.
[Wy08] Wyllie, D.: Blogs, Wikis, Social Networks – Warum der Mittelstand Web 2.0 braucht,http://www.computerwoche.de/knowledge_center/mittelstands_it/1866746/, 2008. Lastaccess: 2nd of January 2009.
284
Investigating the Suitability of Web X.Y Features for Soft-ware Engineering – Towards an Empirical Survey
Eric Ras, Jörg Rech, Sebastian Weber
Fraunhofer IESEFraunhofer-Platz 167663 Kaiserslautern
[email protected]@iese.fraunhofer.de
Abstract: Today, software engineers strongly rely on information while they per-form development activities in the different software engineering (SE) phases. Theresults of a previous survey showed that most information is required during thephases of requirements engineering (RE), design, programming, and project man-agement. Web X.Y features (i.e., concepts and technologies) facilitate collabora-tion and communication with distributed individuals and help to cope with theimmense amount of information by simplifying the organization, integration, andreuse of information scattered across diverse content sources. After presenting thefeatures of the different Web X.Y generations (i.e., Web 2.0, Web 2.5, and Web3.0), we propose a weighted mapping for the relevancy of these Web X.Y featuresregarding their support for the four SE phases with the highest need for informa-tion. Based on this subjective mapping, a set of research questions and hypothesesis derived that form the basis of an empirical survey. The goal of this survey is toinvestigate the potential of Web X.Y features for SE.
0B1 Introduction
The work environment in software engineering (SE) is changing rapidly, as new meth-ods, techniques, and tools keep popping up to cope with the rising demands of customersasking for high-quality software. Nowadays, software engineers face an immenseamount of information that is necessary to perform daily engineering tasks. Require-ments and technologies are always in flux, legacy software needs to be understood andchanged, the architecture and design need to be adapted, and test results or changes needto be communicated within the team. Web X.Y features (i.e., concepts and technologies)provide new possibilities for low-threshold, lightweight mechanisms for supporting thesearch, access, and usage of information during the different SE phases.
In this paper, we present a mapping between Web X.Y features and SE phases with highinformation needs, because here, a high potential of Web X.Y concepts and technologies
285
can be expected (Section 2). While concepts such as collaboration, technology-basedknowledge sharing, and ubiquitous access to information are essential in all developmentprocesses, we focus on the traditional SE lifecycle, although global, model-driven, oropen-source software development could benefit from Web X.Y concepts and technolo-gies as well. One of the main contributions of this paper is to propose a weighted map-ping of the relevancy of Web 2.0, Web 2.5, and Web 3.0 features (see Section 3 for theirdescriptions) regarding their support for a selection of SE phases based on judgmentsmade by researchers. This mapping is explained exemplarily for the phase of require-ments engineering (RE) in Section 4. A second contribution is a set of research questionsand hypotheses, which serves as a basis for developing an empirical survey. The aim ofthis survey will be to investigate the information need, information usage, collaborationbehavior, and knowledge exchange in specific development phases as well as the generalpotential of Web X.Y features in SE. Finally, Section 5 summarizes the paper and de-scribes the next steps.
1 B2 Information Needs in Software Engineering
SE in a software organization have special needs for information in their daily work thatare not supported by most current search methodologies and technologies. During mostof their working time, software engineers go through an incremental process of acquir-ing, evaluating, organizing, analyzing, presenting, and securing information [Do09].Achievements used in Web X.Y systems offer new opportunities for connecting andsupporting these software engineers by exploiting network effects as well as the informa-tion available in a software organization.
In a first step, we conducted a survey on intelligent assistance in SE to find out wheremost information is needed and which kind of information resources are used in softwareorganizations [RRD07]. We discovered that software engineers are often confrontedwith new application areas and technologies requiring them to search for suitable infor-mation. We further investigated the respondents’ retrieval rationales and present the re-sults in Figure 1. It shows that the main learning rationales are to solve concrete prob-lems at hand and close knowledge gaps, and personal motivation.
Furthermore, Figure 2 depicts phases in SE where the participants frequently need in-formation or support by colleagues in order to make decisions, solve problems, or en-hance their competencies. The data shows that the early development phases such asproject management, RE, software design, and programming are the phases with thehighest need for additional information.
In addition, we investigated which information sources are used at the workplace. Notsurprisingly, most software engineers are using Internet search and personal contacts astheir sources of information. In addition, company-specific knowledge bases and helpsystems in the applications used are utilized to satisfy their information needs. Regardingour three differentiation groups (experience, position, and company size), we could notfind any significant differences in the use of information sources.
286
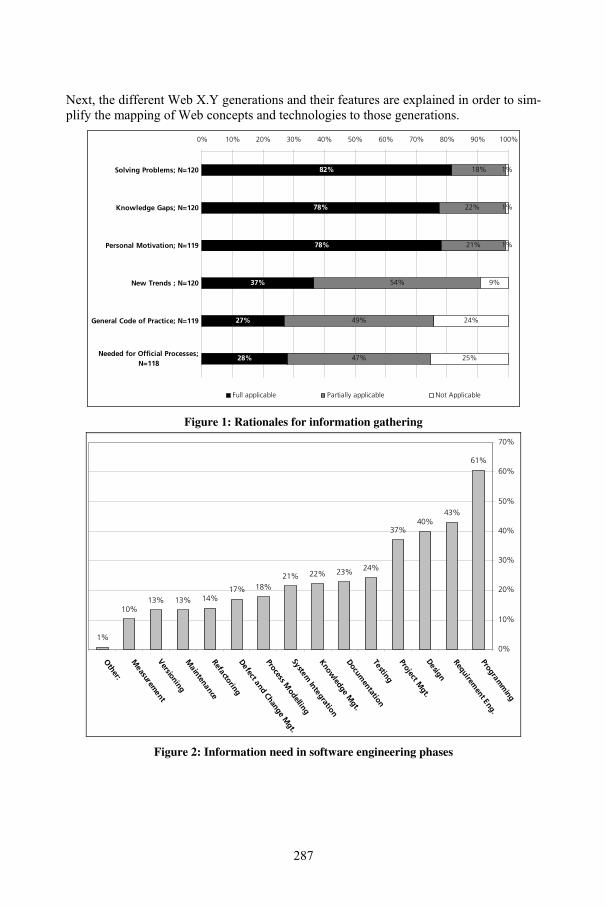
Next, the different Web X.Y generations and their features are explained in order to sim-plify the mapping of Web concepts and technologies to those generations.
82%
78%
78%
37%
27%
28%
18%
22%
21%
54%
49%
47%
1%
1%
1%
9%
24%
25%
0% 10% 20% 30% 40% 50% 60% 70% 80% 90% 100%
Solving Problems; N=120
Knowledge Gaps; N=120
Personal Motivation; N=119
New Trends ; N=120
General Code of Practice; N=119
Needed for Official Processes;N=118
Full applicable Partially applicable Not Applicable
Figure 1: Rationales for information gathering
61%
43%40%
37%
24%23%22%21%18%17%
14%13%13%10%
1%
0%
10%
20%
30%
40%
50%
60%
70%
Programming
Requirement Eng.
Design
Project Mgt.
Testing
Documentation
Knowledge
Mgt.
SystemIntegration
Process Modelling
Defect andChange
Mgt.
Refactoring
Maintenance
Versioning
Measurem
ent
Other:
Figure 2: Information need in software engineering phases
287
2B3 Web X.Y Generations
The World Wide Web (WWW) has been through many changes since its beginnings andhas become the largest information platform worldwide. In the following, we describethe evolutionary steps of the Web, i.e., Web X.Y generations and their features (con-cepts, such as folksonomies, and technologies, such as blogs) – the main aspects thatcharacterize the particular Web era. While new generations of the Web supersede olderones, concepts and technologies from new stages do not completely replace older onesbut co-exist with them (e.g., email, FTP, blogs, etc.). However, in newer stages, conceptsor technologies might be replaced by advanced solutions (e.g., feeds in the Web 2.0stage might be replaced by intelligent assistants in the Web 3.0 stage). While the term“Web 2.0” goes back to its identification by O’Reilly [Or09], Weber and Rech proposeddefinitions and classifications of the terms Web 2.0, 2.5, and 3.0 based on a systematicliterature survey as briefly described throughout the next sub sections (see also [WR09]).During the initial Web step (Web 1.x), Tim Berners-Lee developed the fundamental ar-chitecture of the Web. All the inventions and concepts of this phase (e.g., HTTP, linkingdocuments, or referencing Web resources by a unique URI) are still integral parts of theWeb.
6 B3.1 WEB 2.0 Features
In Tim O’Reilly’s [Or09] famous essay, he described Web 2.0 as a new stage in the evo-lution of the Web. In the spirit of Web 2.0, Web-based applications make the most of theintrinsic advantages of the Internet as a platform. They get better as more people usethem by capturing network effects; they enable collaborative work; they deliver rich userexperiences via desktop-like interfaces; and they combine data from multiple sourcesinto new services.
Social Networking software (e.g., LinkedIn) is a special kind of social software that sup-ports human communication and collaboration [St05]. Social networking services offerall or some of the following exemplary functionalities: network of friends, person brows-ing, private messaging, commenting, etc. The main benefits are that users can interact,exchange information, and keep updated with their networks.
Annotating refers to activities where users create content or comment on existing con-tent. This is a common communication concept for collaboratively creating content andimproving the quality. Rating is a special kind of annotation. Users can assess content inorder to communicate whether it was relevant or not to them for the current context.
Web applications featuring recommendations suggest information originating from so-cial communities (e.g., Amazon customers) to their users in order to increase the benefit.
Mashups refer to an ad-hoc composition of content and services coming from differentsources (e.g., Websites, RSS feeds, or databases) to create entirely new services thatwere not originally provided by any integrated source.
In syndication, the content’s essentials are, in effect, lifted from the traditional website
288
context and published without styling information but with enhanced metadata (title,date, links, etc.), which makes it possible for end-user tools to mashup the content withmaterial from other sources [Ay06]. A widespread syndication technology is RSS.
Folksonomy is the practice of HcollaborativelyH creating and managing HtagsH to annotate andHcategorizeH HcontentH [Vo07]. The basic principle is that end users do subject indexing in-stead of experts only, and the assigned tags are shown immediately on the Web. Thismechanism can help to find content and to collaboratively create a common vocabulary.
Collaboration refers to Web applications that enable the users cooperatively create orannotate content. Examples are enterprise wikis where project experience is documented.
The blog phenomenon impressively reveals that Web 2.0 has brought a shift in the waypeople use the Web. Expressing one’s own interests instead of “blind” consuming andstaring is the motto. Blogs are simple “Web diaries” that can be created by anyonethanks to simple tools. Track-back links and comments make this concept interactive.
Life streaming refers to an online record of a person's daily activities, either via directvideo feed or via aggregating the person's online content such as blog posts or socialnetwork updates [Ws09].
7B3.2 WEB 2.5 Features
Web 2.5, the Pervasive Web, will focus on users who are “always-on”, carrying alongtheir mobile devices connected to the Internet. There is a shift away from “desktops” asunique Internet access towards increased usage of mobile devices – off-site reading (e.g.,with RSS feeds and Web desktops) and publishing (e.g., Twitter as a microblogging ser-vice or Diigo as a social annotation service) will be integral parts of Web 2.5 technolo-gies, which constitutes the transition between Web 2.0 and Web 3.0.
Seamless Experience refers to the fact that multimedia, games, or normal content can beseamlessly viewed or played on multiple devices without remembering positions, replay-ing levels, or changing formats for the specific device. The devices change to an ambientsystem that can be accessed anywhere and anytime (e.g., at home, in the car, or at work).
Device Sensitivity means that services and content are becoming sensitive to the devicethey are viewed on. Interfaces and functionalities adapt to the input or output capabili-ties.
User Sensitivity means that services and content are sensitive to the user (profile) thatoperates or views it, such that they are presented in understandable languages or in dif-ferent colors if the user is color-blind.
Location Sensitivity means that services and content are sensitive to the location they areviewed at, e.g., when micro-blogging tools are disabled in cinemas or ads are presentedin the context of stores located in the vicinity.
Content Sensitivity means that services are sensitive to the content they present, such asjob postings being offered if a CV is designed.
289
Time-Sensitivity means that services and content are sensitive to the time or season theyare viewed at, such as navigational devices being darkened or the hint about a speciallunch offer on mobile devices only appears at lunchtime.
Dynamic Mashups refer to a dynamical adaption of the data, functions, users, or presen-tation components available, such as the most relevant blogs being computed dynami-cally based on the current user profile and integrated into one personalized news stream.
Rule-based Services are simple intelligent features that automatically support the userwith information or services. These may range from simple exclusion rules (e.g., paren-tal guides or filters for explicit content) to software agents with different strategies foracquiring products from online auctioning systems.
End-user programming: Since most stakeholders do not have the time or inclination tolearn the tools and skills of a professional programmer, they can profit from end-userfriendly tools (e.g., visual programming) that enable them to easily assemble context-specific and short-dated “micro applications (service mashups)”.
Semantic Social Networks are the next logical step beyond the current social networkingtechnology as more (semantic) information is available about individuals, which can beused to support more intelligent assistance and pro-active information delivery (PID).
8B3.3 WEB 3.0 Features
Web 3.0 is often associated with the Semantic Web [LH07], [Ay06], [He08]. Marketanalyst Davis expects that semantic technologies will embrace all semantic techniquesand standards that can be applied on top of Web 2.0 (e.g., basic reasoning or model-based inferencing) [Da09]. According to Murugesan [Mu07], Web 3.0 will make use ofalready matured Web 2.0 features but also of technologies evolving in Web 2.5. NovaSpivack (2006) defines key emerging technology trends for Web 3.0, such as ubiquitousconnectivity, open technologies (e.g., open APIs, protocols, or data), open identity, andthe intelligent Web (e.g., Semantic Web technologies, or machine learning) [Sp09]. Inthe following, we present the Web 3.0 features that emerged from our literature survey[WR09].
Semantic Data refers to the increasing enrichment of content and profiles with additionalmetadata, which is machine-readable and usable for better differentiation and reasoning.
Semantic Services will build upon semantic data (e.g., using microformats) and offerintelligent assistance to the users. Services exploiting semantic data will provide moreintelligent services such as more exact searches or sensitive presentation of data.
Natural-Language Search refers to the ability of search engines to answer full questionssuch as “Which US Presidents were assassinated?“
Experience-based Services refer to services that learn from the specific behavior of theuser and optimize their services in this regard.
The 3D Web has the potential to change collaboration in distributed software projects.Although face-to-face meetings can never be replaced by any technology-based tech-
290
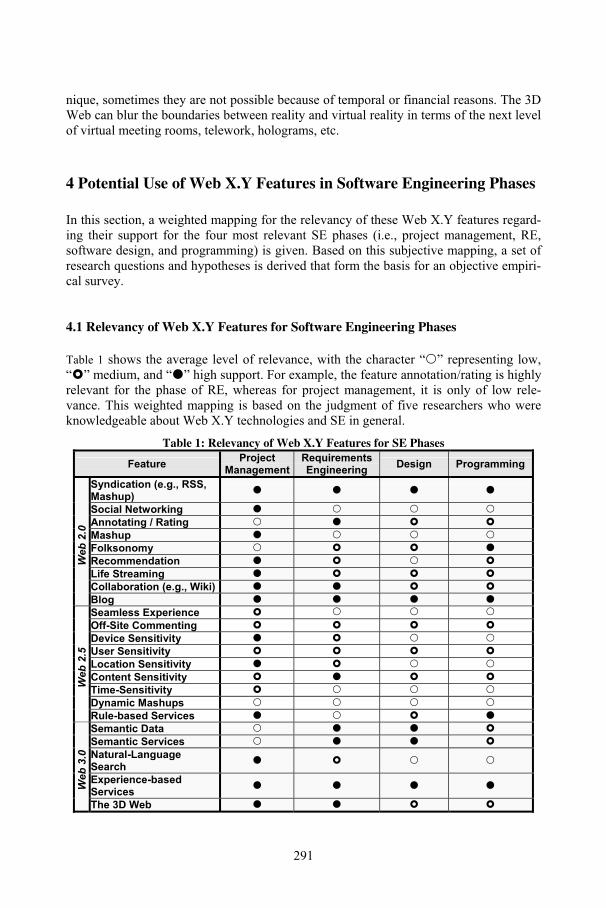
nique, sometimes they are not possible because of temporal or financial reasons. The 3DWeb can blur the boundaries between reality and virtual reality in terms of the next levelof virtual meeting rooms, telework, holograms, etc.
3B4 Potential Use of Web X.Y Features in Software Engineering Phases
In this section, a weighted mapping for the relevancy of these Web X.Y features regard-ing their support for the four most relevant SE phases (i.e., project management, RE,software design, and programming) is given. Based on this subjective mapping, a set ofresearch questions and hypotheses is derived that form the basis for an objective empiri-cal survey.
9 B4.1 Relevancy of Web X.Y Features for Software Engineering Phases
XTable 1X shows the average level of relevance, with the character “"” representing low,“!” medium, and “#” high support. For example, the feature annotation/rating is highlyrelevant for the phase of RE, whereas for project management, it is only of low rele-vance. This weighted mapping is based on the judgment of five researchers who wereknowledgeable about Web X.Y technologies and SE in general.
Table 1: Relevancy of Web X.Y Features for SE Phases
Feature ProjectManagement
RequirementsEngineering Design Programming
Syndication (e.g., RSS,Mashup) # # # #
Social Networking # " " "Annotating / Rating " # ! !Mashup # " " "Folksonomy " ! ! #Recommendation # ! " !Life Streaming # ! ! !Collaboration (e.g., Wiki) # # ! !
Web2.0
Blog # # # #Seamless Experience ! " " "Off-Site Commenting ! ! ! !Device Sensitivity # ! " "User Sensitivity ! ! ! !Location Sensitivity # ! " "Content Sensitivity ! # ! !Time-Sensitivity ! " " "Dynamic Mashups " " " "
Web2.5
Rule-based Services # " ! #Semantic Data " # # !Semantic Services " # # !Natural-LanguageSearch # ! " "
Experience-basedServices # # # #W
eb3.0
The 3D Web # # ! !
291
Due to the limited space in this paper, a detailed description of each entry in the tablecannot be provided - this would be part of the survey report. Thus, in the following, wewill go only into some examples by focusing on the requirements engineering phase andWeb 2.0 features because most evidence of the relevancy rating can be provided heredue to past studies with Web 2.0 technologies in the RE field (see, for example, [De07]).
10B4.2 Example: Web 2.0 Features Supporting Requirements Engineering
The RE process can be seen as a creative process that is executed by a requirements en-gineer. Figure 3 depicts the RE activities graphically. It can be seen that the require-ments documentation activity is a core activity located between discovering, analyzing,and negotiating requirements and the validating/verifying requirements. The activityproduces the requirements specification that is agreed upon by the different stakeholders.Different types of information are needed to produce the document: stakeholder needsand constraints, organizational standards, regulations, domain information, markettrends, and existing system information. Hence, RE is a highly collaborative activityrequiring many different types of information from different sources and stakeholderswith different preferences, needs, and knowledge. While different approaches to RE ex-ist, which sometimes require formal specifications, many of them can be integrated intoWeb X.Y tools. For example, Decker et al used textual and graphical UML diagrams,such as use cases, within wikis [De06] .
Requirements elicitation: This activity may require interviewing stakeholders or observ-ing real-world processes. Syndication can first improve the access to information fromdifferent sources (e.g., interview questionnaires for developing new interview question-naires, accessing protocols/recordings/observations from conducted interviews, etc.) byhiding style information, which makes mashing of information possible. Second, syndi-cation can provide more homogenous access to existing systems, work instructions, in-ternal process instructions, and, for example, past change requests. Annotation is a sup-porting feature for analyzing interview protocols collaboratively. Technologies such as aWiki can support the collaboration between the different stakeholders, e.g., by support-ing brainstorming activities [Ue08]. As stated previously, a lot of information is ac-cessed and analyzed to derive requirements. Folksonomies help to annotate and structurethis information and hence enable tools to structure and search in this pool of informa-tion.
Requirements analysis: Analyzing means that gaps in the preliminary requirementsdocumentation or conflicting requirements (e.g., contradictions to regulations or stan-dards) are identified or that incompatibilities with constraints such as budget or applica-tion environment are discovered. Syndication can enhance access to these regulations orstandards and to domain- and customer-specific constraints (e.g., costs, budget, safetyconstraints). Annotations help to add and semantically connect information, e.g., aboutpotential conflicts with the requirements that have to be discussed with the team. Theserelationships (i.e., connections) can then be used to perform consistency checks withregard to completeness and correctness (e.g., checking whether each use case descriptionis related to an actor description) [Ue08]. Collaborative commenting supports simultane-ous reviewing of requirements between the different stakeholders.
292
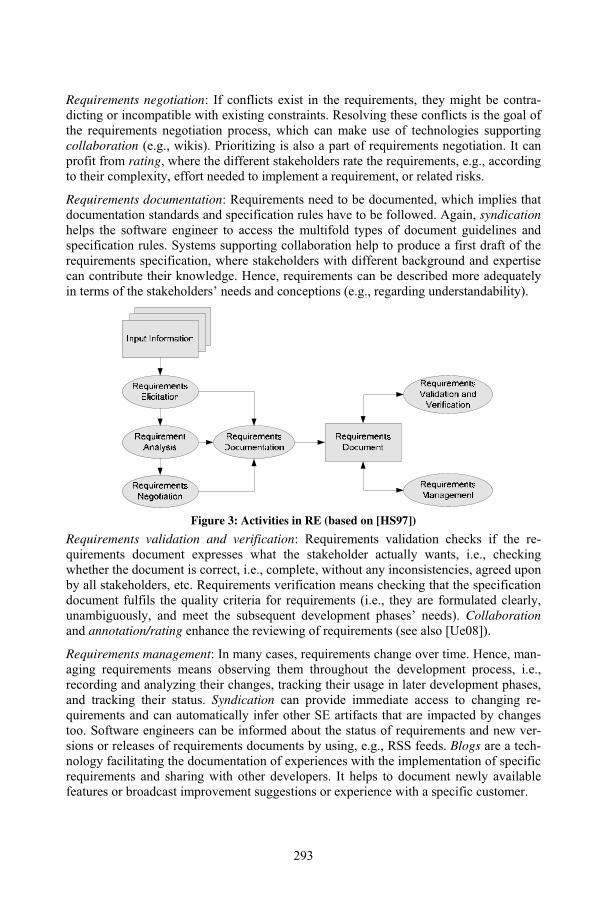
Requirements negotiation: If conflicts exist in the requirements, they might be contra-dicting or incompatible with existing constraints. Resolving these conflicts is the goal ofthe requirements negotiation process, which can make use of technologies supportingcollaboration (e.g., wikis). Prioritizing is also a part of requirements negotiation. It canprofit from rating, where the different stakeholders rate the requirements, e.g., accordingto their complexity, effort needed to implement a requirement, or related risks.
Requirements documentation: Requirements need to be documented, which implies thatdocumentation standards and specification rules have to be followed. Again, syndicationhelps the software engineer to access the multifold types of document guidelines andspecification rules. Systems supporting collaboration help to produce a first draft of therequirements specification, where stakeholders with different background and expertisecan contribute their knowledge. Hence, requirements can be described more adequatelyin terms of the stakeholders’ needs and conceptions (e.g., regarding understandability).
Figure 3: Activities in RE (based on [HS97])
Requirements validation and verification: Requirements validation checks if the re-quirements document expresses what the stakeholder actually wants, i.e., checkingwhether the document is correct, i.e., complete, without any inconsistencies, agreed uponby all stakeholders, etc. Requirements verification means checking that the specificationdocument fulfils the quality criteria for requirements (i.e., they are formulated clearly,unambiguously, and meet the subsequent development phases’ needs). Collaborationand annotation/rating enhance the reviewing of requirements (see also [Ue08]).
Requirements management: In many cases, requirements change over time. Hence, man-aging requirements means observing them throughout the development process, i.e.,recording and analyzing their changes, tracking their usage in later development phases,and tracking their status. Syndication can provide immediate access to changing re-quirements and can automatically infer other SE artifacts that are impacted by changestoo. Software engineers can be informed about the status of requirements and new ver-sions or releases of requirements documents by using, e.g., RSS feeds. Blogs are a tech-nology facilitating the documentation of experiences with the implementation of specificrequirements and sharing with other developers. It helps to document newly availablefeatures or broadcast improvement suggestions or experience with a specific customer.
293
11B4.3 Deriving a First Set of Research Questions and Hypotheses for the Survey
As the rating in Table 1 is based on few expert judgments, its reliability and validity arerather low and should therefore not be used as a reference. Thus, our main focus is onderiving a set of research questions and hypotheses to serve as a basis for developing anobjective empirical survey. The aim of this survey will be to investigate the informationneed, information usage, collaboration behavior, and knowledge exchange in specificdevelopment phases as well as the general potential of Web X.Y features in SE.
The target group of the survey are primarily SE professionals. This makes it more chal-lenging, because we cannot expect them to also be familiar with the terminology forWeb X.Y features as introduced previously in Section 3. Therefore, we need to find amore understandable wording for the questionnaire. Another issue is not to focus on aspecific lifecycle model, since this would reduce the sample size dramatically. It is moreeffective to ask people which lifecycle their organization follows – this would also allowus to investigate differences between various development contexts.
Our previous survey on intelligent assistance revealed that the rationale behind the needfor information are users’ personal motivation, solving problems at hand, and closingexisting knowledge gaps. In order to investigate the rationale behind the use of Web X.Yfeatures in SE, other dimensions must be added (see also [HMV08] and [MWY06]).Recent studies about experience with Web X.Y technologies in SE could help to im-prove the questionnaire (RE [Da08], [De07], architecture documentation [BM06], pro-gramming [WCM07], project management [Xu07], and processes management [Kr09]).
Besides determining the information need, information usage, collaboration behavior,and knowledge exchange in specific development phases, we are interested in the fol-lowing general research questions:
• What are the rationales for using specific Web X.Y features in SE?
• How relevant are Web-based collaboration, social networking, and content productionas well as consumption for daily SE work in general?
• How relevant are annotations and recommendation of information in SE?
• How relevant is a technical means for mashing up information from different sources(e.g., building an SE dashboard)?
• How relevant are services that are able to deliver information according to the currentcontext (i.e., device-, user-, location-, content-, time-sensitivity)?
• How relevant are intelligent and pro-active services based on Web X.Y features (e.g.,inference based on available semantic data, machine learning systems, natural lan-guage processing, etc.)?
Based on the mapping between Web X.Y features and a selection of SE activities fromSection 4.1, we formulate the following hypotheses, which will be verified or falsifiedafter conducting the survey:
• The average relevancy for blogs and syndication is significantly higher than neutral,independent of the SE phase (neutral refers to the middle value of a (Likert) scale with
294
a normal distribution).
• The average relevancy of collaboration support is significant higher for RE and projectmanagement than for other SE phases.
• The average relevancy of context-aware services (independent of a particular SEphase) is lower than the average relevancy of non-context-aware services.
• The average relevancy of semantic data and semantic services is higher for RE anddesign than for other SE phases.
• The average relevancy for adaptive and learning systems is higher than neutral.
4B5 Conclusions and Outlook
Web X.Y features can facilitate communication with distributed individuals and can helpto cope with the immense amount of information by simplifying the organization, inte-gration, and reuse of information scattered across diverse content sources. In this paper,a first mapping regarding the relevancy of Web X.Y features for a selection of SE phaseswas presented. This mapping will serve as a baseline for the development of a survey inthe field. A preliminary set of research questions and hypotheses is available to start dis-cussion on which aspects are most interesting to be investigated by such a survey.
The results of this survey will shed light on which Web X.Y features are preferred andshould be part of intelligent information platforms for SE in the future. In addition, itwill help us to extract, structure, and annotate SE information in such a way that WebX.Y features can use them to provide new information services to engineers.
5 BReferences
[Ay06] Ayers, D.: The Shortest Path to the Future Web, IEEE Internet Computing, vol. 10, no.6, pp. 76-79, 2006.
[BM06] Bachman, F.; Merson, P.: Experience Using the Web-Based Tool Wiki for Architec-ture Documentation, Carnegie Mellon University, Pittsburg, PA, USA, 2006.
[Da08] Da, Y.; Di, W.; Koolmanojwong, S.; Brown, A. W.; Boehm, W. B.: WikiWinWin: AWiki Based System for Collaborative Requirements Negotiation. In 41st Annual Ha-waii International Conference on System Sciences (HICSS 2008). Waikoloa, Hawaii,USA, 2008; pp. 1-10.
[Da09] Davis, M.: Industry Roadmap to Web 3.0 and Multibillion Dollar Market Opportuni-ties (Executive Summary). http://www.project10x.com/, last accessed on February 16,2009.
[De06] Decker, B. et. al.: Using Wikis to Manage Use Cases: Experience and Outlook, InInternational Workshop on Learning Software Organizations and Requirements Engi-neering (LSO+RE 2006), Hannover, Germany, 2006.
[De07] Decker, B.; Ras, E.; Rech, J.; Jaubert, P.; Rieth, M.: Wiki-Based Stakeholder Participa-tion in Requirements Engineering, IEEE Software, vol. 24, no. 2, pp. 28-35, 2007.
295
[Do09] Dorsey, P. A.: Personal Knowledge Management: Educational Framework for GlobalBusiness. http://www.millikin.edu/pkm/pkm_istanbul.html, last accessed on February16, 2009.
[He08] Hendler, J.: Web 3.0: Chicken Farms on the Semantic Web, IEEE Computing, vol. 41,no. 1, pp. 106-108, 2008.
[HMV08] Henriksson, J.; Mikkonen, T.; Vadén, T.: Experiences of Wiki use in Finnish compa-nies. In Proceedings of the 12th International Conference on Entertainment and Mediain the Ubiquitous Era. Tampere, Finland, 2008.
[HS97] Kotonya, G.; Sommerville, I.: Requirements Engineering: Processes and TechniquesJohn Wiley & Sons, Chichester, 1997.
[Kr09] Krogstie, B. R.: Using Project Wiki History to Reflect on the Project Process. In 42ndHawaii International Conference on System Sciences (HICSS 2009). Waikoloa, Ha-waii, USA IEEE; 2009 pp. 1-10.
[LH07] Lassila, O.; Hendler, J.: Embracing "Web 3.0", IEEE Internet Computing, vol. 11, no.3, pp. 90-93, 2007.
[Mu07] Murugesan, S.: Get Ready to Embrace Web 3.0, Cutter Consortium, vol 7 (8), 2007.[MWY06] Majchrzak, A.; Wagner, C.; Yates, D.: Corporate Wiki Users: Results of a Survey. In
International Symposium on Wikis 2006 (WikiSym 2006). Odense, Denmark: ACM(2006)
[Or09] O'Reilly, T.: What is Web 2.0.http://www.oreillynet.com/pub/a/oreilly/tim/news/2005/09/30/what-is-web-20.html,last accessed on February 16, 2009.
[RRD07] Rech, J.; Ras, E.; Decker, B.: Intelligent Assistance in German Software Development:A Survey, IEEE Software, vol. 24, no. 4, pp. 72-79, 2007.
[Sp09] Spivack, N.: The Third-Generation Web is Coming.http://www.kurzweilai.net/meme/frame.html?main=/articles/art0689.html, last ac-cessed on February 16, 2009.
[St05] Staab, S. et. al.: Social Networks Applied, IEEE Intelligent Systems, vol. 20, no. 1, pp.80-93, 2005.
[Ue08] Uenalan, O.; Riegel, N.; Weber, S.; Doerr, J.: Using Enhanced Wiki-based Solutionsfor Managing Requirements. In First International Workshop on Managing Require-ments Knowledge MaRK'08 (in conjunction with 16th IEEE International Require-ments Engineering Conference). Barcelona, Spain, 2008.
[Vo07] Voß, J.: Tagging, Folksonomy & Co Renaissance of Manual Indexing? In ISI 200710th international Symposium for Information Science. Cologne, Germany, 2007.
[WCM07] WenPeng, X.; ChangYan, C.; Min, Y.: On-line collaborative software development viawiki. In International Symposium on Wikis 2007 (WikiSym 2007). Montreal, Quebec,Canada, 2007.
[WR09] Weber, S.; Rech, J.: An Overview and Differentiation of the Evolutionary Steps of theWeb X.Y Movement: The Web Before and Beyond 2.0, In (S. Murugesan (eds.)): AnOverview and Differentiation of the Evolutionary Steps of the Web X.Y Movement:The Web Before and Beyond 2.0. IGI Global, USA, 2009.
[Ws09] Word Spy: Lifestreaming. http://www.wordspy.com/words/lifestreaming.asp, last ac-cessed on February 16, 2009.
[Xu07] Xu, L.: Project the wiki way: using wiki for computer science course project manage-ment, Journal of Computing Sciences in Colleges, vol. 22, no. 6, pp. 109-116, 2007.
296
Amethod for identifying unobvious requirements inglobally distributed software projects
Smita Ghaisas
Tata Research, Design and Development CenterTata Consultancy Services
54 B Hadapsar Industrial EstatePune 411013, [email protected]
Abstract: We present a method and an assisting toolset to identify unobviousrequirements in globally distributed projects. We demonstrate use of socialsoftware principles and technologies in distributed and collaborative requirementselicitation with a purpose to detect unobvious requirements. In our experience,stakeholders are rarely clear on their requirements. During requirements elicitationworkshops (that involve face-to-face communications), they are not able tovisualize all the pertinent scenarios. They can typically articulate ‘first-order’scenarios resulting out of direct interactions (among stakeholders and betweenstakeholders and proposed systems), but they find ‘second-order’ scenarios thatresult out of multiple stimuli hard to detect a-priori. We refer to such ‘hard todetect’ requirements as the ‘unobvious’ ones. In globally distributed situations,this challenge becomes even more pronounced due to lack of frequent and informalcommunications that allow iterative refinements of stakeholder inputs. Wedescribe an approach that addresses this problem. Our approach includesidentification of representative roles and construction of method chunks thatinclude a step-by-step guidance for roles to practice the method chunks relevant tothem. Towards this purpose, we have developed a web 2.0 based toolset thatpresents the method chunks to appropriate roles, synchronizes activities performedby the roles by providing relevant notifications and automates some of theactivities recommended in the method. Web2.0 has been chosen as a platform todeliver our method in the light of architecture of participation that it offers. Theidentification of unobvious requirements has been demonstrated through the resultsof a case study in Insurance domain.
1 Introduction
Requirements elicitation is a difficult activity even when executed in a co-located mode.Organizations providing IT services invariably need to involve globally dispersed teams.Such teams attempting to elicit requirements lack opportunities for informal and frequentface-to-face communication. This results in unobvious requirements staying assumed inthe minds of customers and unstated for developers. It can further lead to dissatisfaction
297
of the customer and loss of goodwill. Missing requirements’ has been known to be oneof the top five causes for poor estimation [D1]. In spite of an extensive research [e.g.SFG2-MR7] in this field, recent studies indicate [SFG2] that requirements continue to bea problem. Industry veterans attribute more than half of rework to missing ormisunderstood requirements and stress the importance of making use of the high energy(of involved stakeholders) in the elicitation phase [M8,M9]. The reason for missingrequirements is lack of “bridging the dialects” or in other words, communication gaps asa result of different interests (hence different foci), competence, and expertise ofmultiple stakeholders [M8]. In the global context, lack of common understanding ofrequirements and reduced opportunity to share work artifacts are found be significantfactors that challenge the effective collaboration of remote stakeholders [DZ10]. In arecent review, Herbsleb highlights requirements elicitation and communication as one ofthe four critical research challenges in the context of global software engineering [H11].
We have observed oftentimes that stakeholders have little clarity on their requirements.Even in situations when they are clear about their requirements, they are not in a positionto anticipate all the pertinent scenarios. Typically, they are able to visualize the ‘firstorder’ scenarios (such as “Reserve book for claimant”) that are results of directinteractions among stakeholders, but ‘second order ‘scenarios (such as “uponcancellation of a claim, make book either available to library if there are no claimants orreserve for one of the other claimants based on certain priority criterion if there are morethan one claimant”) that result out of multiple stimuli are difficult to detect a-priori. Thelack of frequent and informal communication typical of globally distributed projectsfurther complicates this problem and calls for suitable methods and collaborative toolsthat specifically address the needs of geographically separated multiple stakeholders.
In this paper, we present our work to address this need. Specifically, we have
1. Identified representative roles participating in requirements elicitation inglobally distributed projects and constructed method chunks that include astep-by-step guidance to help detect unobvious requirements
2. Developed a web2.0 based toolset that assists the approach by presenting themethod chunks to appropriate roles, synchronizing their activities by providingrelevant notifications and automating some of the activities recommended in themethod
We have used guidelines from design science research [HMPR12-MS14] in our work
2 Related Work
Requirements elicitation in the global context has been studied extensively [e.g.BGM15-CA22 ]. Bhat et al [BG15] have studied the requirements engineering challenges fromthe people-process-technology angle and proposed a framework. Other authors[DZ10,D16-DZ18] note that aspects such as a lack of a common understanding ofrequirements, together with reduced awareness of working local context, trust level and
298
ability to share work artifacts significantly challenge the effective collaboration ofremote stakeholders. Hanisch and Corbitt [HC19] have discussed reasons forimpediments to requirements engineering in the global software development andattributed them to differences in shared meaning and contexts. Hsieh [H20] also stresseson culture and shared understanding in distributed requirements engineering. Aranda etal examine technology selection to improve global collaboration. They propose use ofcognitive psychology to define strategy to select technology. Herbsleb [H11] identifiesenvironment and tools as another important critical challenge in the context of softwareengineering. Sinha et al [SSC21] have developed a tool for collaborative requirementsmanagement. Globalisation has indeed been noted as a major research challenge inrequirements engineering [H11, CA22].
While research in this filed has addressed and analyzed multiple issues, there are nospecific approaches designed to identify unobvious requirements especially in the globalcontext. With reference to globally distributed requirements elicitation, we emphasizeidentification of unobvious requirements as the principal focus of our work. Ourapproach is different from the ones described above in the following aspects:
1. We identify representative roles involved in globally distributed requirementselicitation and provide each role with a view of the method chunk relevant tohim/her. We assist identification of unobvious requirements in multiple wayssuch as manual validations, automated analysis that uses UML models alongwith formal semantics and domain specific guidance in the form of seedspecifications.
2. We orchestrate identification of unobvious requirements by providing a web 2.0based solution that assists in effective collaboration among stakeholders.
In our method, we explicitly correlate inputs from stakeholder categories and use thesecorrelations to identify inconsistencies and gaps in requirements specifications. In theprocess of establishing such correlations, we are able to reveal important details such asmissing business rules, and (typically second-order) scenarios that are otherwiseundetected during requirements elicitation. We additonally use tool-generated scenariosand counter examples as a medium of communication.
3 Research approach
Kolos-Mazuryk et al [KWE23] examine several existing approaches in design scienceresearch [e.g. HMPR12-MS14] and combine the insights offered therein. We broadlyfollow their route of awareness, suggestion, and circumscriptive development, evaluationand conclusion.
The problem awareness stage in our case included (1) inspection of existing methodsand tools in the market with a view to understand solutions proposed by otherresearchers and (2) Interactions with various stakeholders in our organizations with aview to understand their difficulties in terms of identifying unobvious requirements and
299
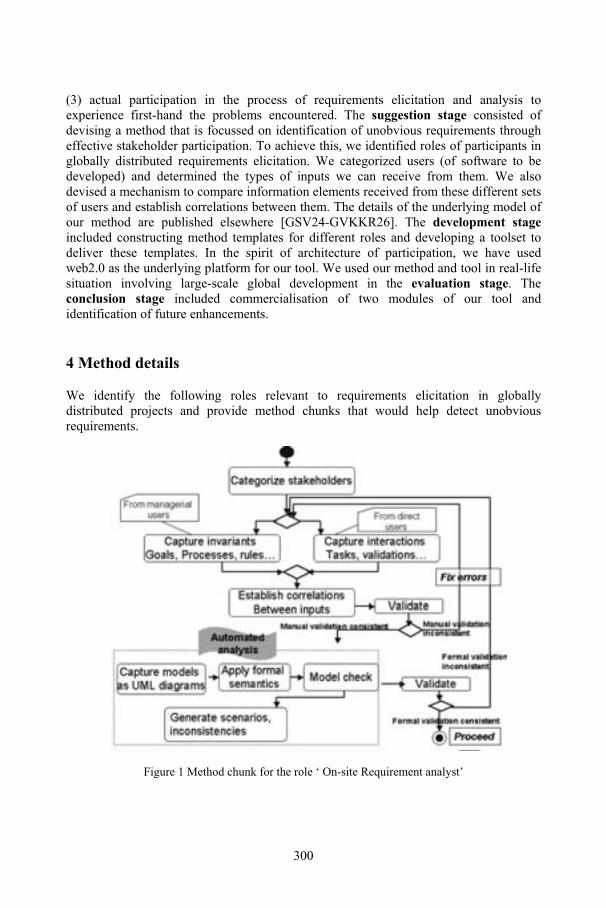
(3) actual participation in the process of requirements elicitation and analysis toexperience first-hand the problems encountered. The suggestion stage consisted ofdevising a method that is focussed on identification of unobvious requirements througheffective stakeholder participation. To achieve this, we identified roles of participants inglobally distributed requirements elicitation. We categorized users (of software to bedeveloped) and determined the types of inputs we can receive from them. We alsodevised a mechanism to compare information elements received from these different setsof users and establish correlations between them. The details of the underlying model ofour method are published elsewhere [GSV24-GVKKR26]. The development stageincluded constructing method templates for different roles and developing a toolset todeliver these templates. In the spirit of architecture of participation, we have usedweb2.0 as the underlying platform for our tool. We used our method and tool in real-lifesituation involving large-scale global development in the evaluation stage. Theconclusion stage included commercialisation of two modules of our tool andidentification of future enhancements.
4 Method details
We identify the following roles relevant to requirements elicitation in globallydistributed projects and provide method chunks that would help detect unobviousrequirements.
Figure 1 Method chunk for the role ‘ On-site Requirement analyst’
300
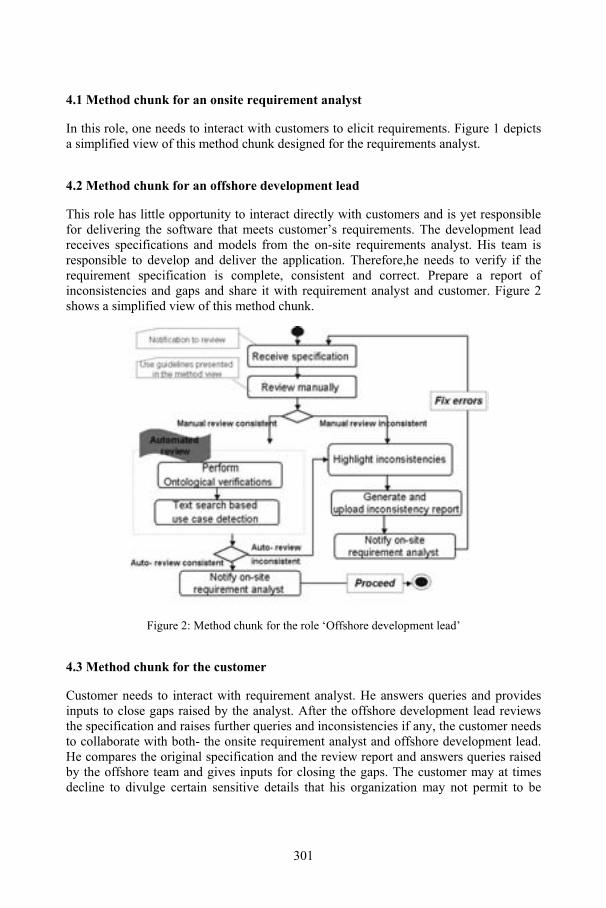
4.1 Method chunk for an onsite requirement analyst
In this role, one needs to interact with customers to elicit requirements. Figure 1 depictsa simplified view of this method chunk designed for the requirements analyst.
4.2 Method chunk for an offshore development lead
This role has little opportunity to interact directly with customers and is yet responsiblefor delivering the software that meets customer’s requirements. The development leadreceives specifications and models from the on-site requirements analyst. His team isresponsible to develop and deliver the application. Therefore,he needs to verify if therequirement specification is complete, consistent and correct. Prepare a report ofinconsistencies and gaps and share it with requirement analyst and customer. Figure 2shows a simplified view of this method chunk.
Figure 2: Method chunk for the role ‘Offshore development lead’
4.3 Method chunk for the customer
Customer needs to interact with requirement analyst. He answers queries and providesinputs to close gaps raised by the analyst. After the offshore development lead reviewsthe specification and raises further queries and inconsistencies if any, the customer needsto collaborate with both- the onsite requirement analyst and offshore development lead.He compares the original specification and the review report and answers queries raisedby the offshore team and gives inputs for closing the gaps. The customer may at timesdecline to divulge certain sensitive details that his organization may not permit to be
301
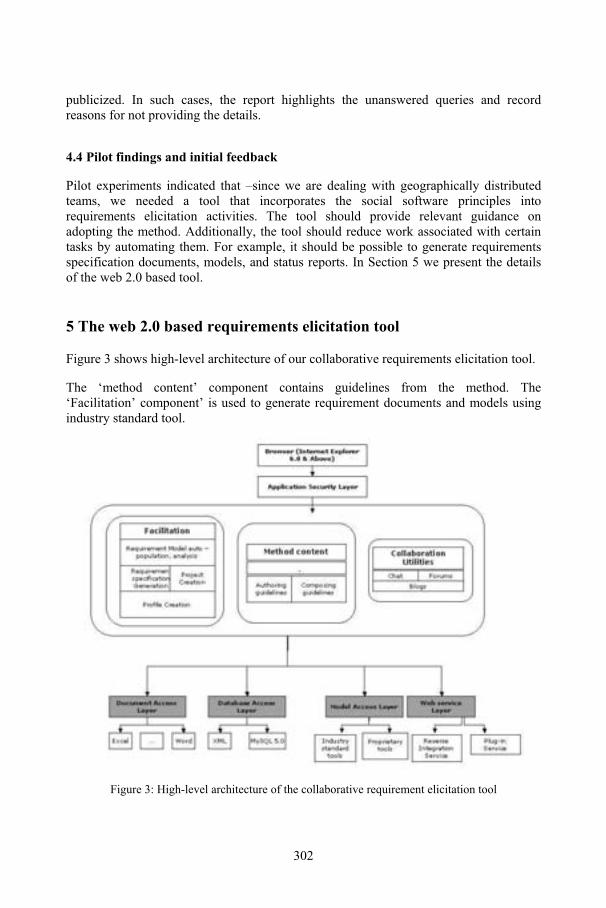
publicized. In such cases, the report highlights the unanswered queries and recordreasons for not providing the details.
4.4 Pilot findings and initial feedback
Pilot experiments indicated that –since we are dealing with geographically distributedteams, we needed a tool that incorporates the social software principles intorequirements elicitation activities. The tool should provide relevant guidance onadopting the method. Additionally, the tool should reduce work associated with certaintasks by automating them. For example, it should be possible to generate requirementsspecification documents, models, and status reports. In Section 5 we present the detailsof the web 2.0 based tool.
5 The web 2.0 based requirements elicitation tool
Figure 3 shows high-level architecture of our collaborative requirements elicitation tool.
The ‘method content’ component contains guidelines from the method. The‘Facilitation’ component’ is used to generate requirement documents and models usingindustry standard tool.
Figure 3: High-level architecture of the collaborative requirement elicitation tool
302
The ‘Collaboration utilities’ component embodies the social software components suchas chat sessions with experts, forums, blog, RSS alerts. The document access layer,database access layer and model access layer facilitate storing of data, generation ofrequirements specification and requirement models respectively. From the ‘web serviceslayer’, the ‘reverse integration service’ makes it possible to work directly with modelingtools and documents and communicate the latest state of the model to the respective usercontrol libraries.
6 Evaluation of our approach on field
In this section we discuss our experience in applying our method and toolset in acollaborative environment. We present results from a large insurance project.
6.1 Using the method and toolset in a collaborative environment
• The requirements analyst selects to work in the ‘insurance domain’. The toolpresents templates designed to capture business goals, business processes, andbusiness rules specific to the insurance domain.
• The in-built crosschecks and verifications are presented in the form of alerts thatappear after she completes a set of activities. For example, the tool gives herreminders to align stakeholder expectations with business goals when she identifiesa managerial user and his expectation
• The tool also guides her through identification of use cases by presenting a specificdefinition of granularity of use cases and their detailing using lightweight templatesdefined in our method.
• She ensures that the terms used in business entity models; glossary and use casespecifications are consistent. She is able to identify gaps in the originally capturedrequirements using manual and tool-assisted analysis. The tool generates scenariosand inconsistencies. She shares these results with the development lead andcustomer in the form of queries.
• The development team lead and customer receive notifications about the uploadedartifacts. They can download the specifications and models and review them. Therequirement analysts discusses generated scenarios with the customer and thedevelopment lead. The scenarios communicate in the ‘language of examples ‘andthus are helpful in identifying unobvious requirements. If sections in a specificationare not satisfactory or unclear with respect to specified verification &validationcriteria (such as alignment with business goals, compliance with business rules,scope as defined by focus of current engagement), they can adds comments in thespecification. A review report that highlights the kind of discrepancies mentionedabove is generated and shared with the requirement analyst and the customer forcross-verification.
303
• The requirement analyst, development lead and customer communicate using chatsessions and close gaps in the original specification iteratively. The improvedrequirement specifications- documents and models are shared with all participants.
• Throughout the exercise all stakeholders can can start discussion threads onimportant topics that necessitate discussions. This helps in informalcommunications and a rapport that is otherwise difficult due to the distributed natureof the development.
6.2 Project overview
In a group insurance system, the insurance company ‘LifeCare’ provides Quotations toEmployers through the Employer’s Agents, and if accepted by the Employers, a Schemeis set up for the employees of the Employer with all relevant details. After a Scheme isset up, periodic renewals of the Scheme are carried out. The insurance project hadQuotations, New Business, Renewals and Alterations modules. The Quotations modulewas related to providing quotations to Employers. The New Business module wasrelated to setting up of a new Scheme for the Employer. The Renewals module wasrelated to periodic renewals of these Schemes and Alterations was related to ad hocchanges to any of these details. New Business which was more complex thanQuotations, was taken up for the exercise. In the New Business module, Schemes arecreated by Users to cater to Employers who wish to cover pension and life of theirselected employees – Members of the Scheme. Schemes can be of different types likeTypeA, TypeB and TypeC. Agents are people or companies that service Schemes.Agents can be grouped under Intermediaries. A User can be either an Internal User, anAgent or an Intermediary. A Scheme can have a Legal Arrangement and the LegalArrangement is managed by a Trustee. A Trustee can be the same person/company thatis the Employer. A Trustee has a Status, which can be either Active or Inactive.Members are added to the Scheme with details of the pension and/or life assurance andother benefits that are to be provided. The details are sent for automatic underwriting,which sometimes need manual intervention. Once the underwriting is successfullycompleted, the Scheme goes Live and is said to be operational
6.3 Results of manual verification
While capturing and mapping process steps to tasks, several instances of inconsistencieswere detected between the process steps specified by managerial users and tasksperformed by direct users. We present an example next.
The following task captured from clerks at LifeCare did not correspond to any of theprocess steps narrated by managerial users. The managers were interviewed to fill in thegaps and corresponding process details were captured.
Task: For a scheme ‘type A’, employees of grade ‘Director’ are identified for ‘manualintervention’.
304
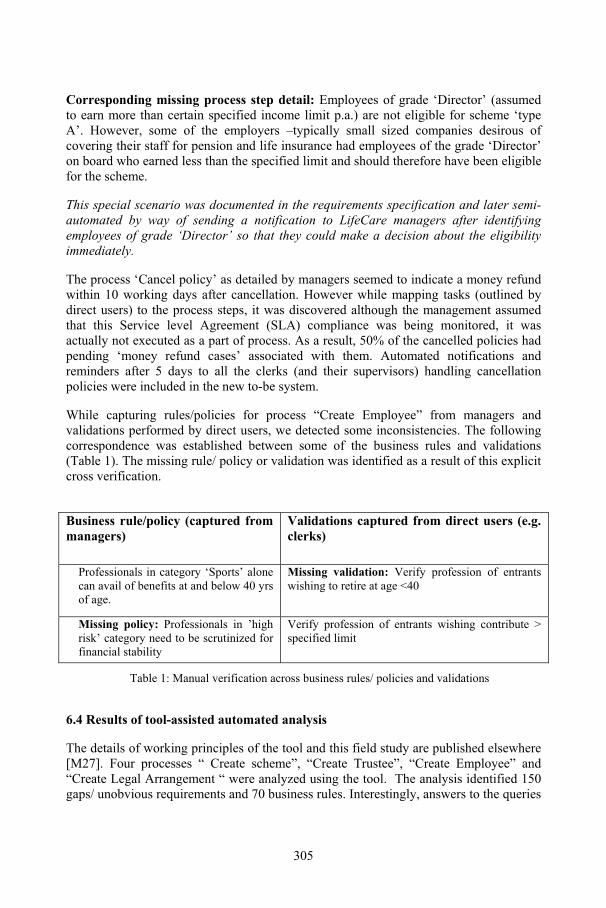
Corresponding missing process step detail: Employees of grade ‘Director’ (assumedto earn more than certain specified income limit p.a.) are not eligible for scheme ‘typeA’. However, some of the employers –typically small sized companies desirous ofcovering their staff for pension and life insurance had employees of the grade ‘Director’on board who earned less than the specified limit and should therefore have been eligiblefor the scheme.
This special scenario was documented in the requirements specification and later semi-automated by way of sending a notification to LifeCare managers after identifyingemployees of grade ‘Director’ so that they could make a decision about the eligibilityimmediately.
The process ‘Cancel policy’ as detailed by managers seemed to indicate a money refundwithin 10 working days after cancellation. However while mapping tasks (outlined bydirect users) to the process steps, it was discovered although the management assumedthat this Service level Agreement (SLA) compliance was being monitored, it wasactually not executed as a part of process. As a result, 50% of the cancelled policies hadpending ‘money refund cases’ associated with them. Automated notifications andreminders after 5 days to all the clerks (and their supervisors) handling cancellationpolicies were included in the new to-be system.
While capturing rules/policies for process “Create Employee” from managers andvalidations performed by direct users, we detected some inconsistencies. The followingcorrespondence was established between some of the business rules and validations(Table 1). The missing rule/ policy or validation was identified as a result of this explicitcross verification.
Table 1: Manual verification across business rules/ policies and validations
6.4 Results of tool-assisted automated analysis
The details of working principles of the tool and this field study are published elsewhere[M27]. Four processes “ Create scheme”, “Create Trustee”, “Create Employee” and“Create Legal Arrangement “ were analyzed using the tool. The analysis identified 150gaps/ unobvious requirements and 70 business rules. Interestingly, answers to the queries
Business rule/policy (captured frommanagers)
Validations captured from direct users (e.g.clerks)
Professionals in category ‘Sports’ alonecan avail of benefits at and below 40 yrsof age.
Missing validation: Verify profession of entrantswishing to retire at age <40
Missing policy: Professionals in ’highrisk’ category need to be scrutinized forfinancial stability
Verify profession of entrants wishing contribute >specified limit
305
raised as a result of our analysis could not be gathered from the documentation. Theteam did not know answers to more than half of the queries. Of the requirements elicitedin the exercise, 30% were detected by our approach and would have otherwise beenunobvious and undetected requirements resulting in ‘requirements errors’ that areuncovered in later phases. The web2.0 based tool made it easy to interact with theinvolved stakeholder in an informal way frequently to raise queries, close gaps andinconsistencies.
7 Conclusions
In this work, we have addressed the problem of identification of unobvious requirementsin globally distributed projects. We have identified key roles involved in therequirements elicitation process and have devised appropriate method chunks relevant toeach role. We have tested our suggestions through pilot experiments and used thefindings to enhance our method and to build a web2.0 based collaborative requirementselicitation tool. The tool presents to each role, the method chunk that is relevant to it,assists in carrying out the activities, provides notifications about activities ongoing andcompleted and thus helps to orchestrate the requirements elicitation exercise. We haveevaluated our approach in several real-life large global development exercises. Asindicated in the case study, we have contributed to identification of unobviousrequirements and thus helped in reducing the pain at the time of acceptance testing.
8 Scope of future work
Another important aspect of requirements elicitation in the social software context issemantic assistance to this collaborative exercise by way of addressing (1) synonymy ofterms (2) most commonly accepted terminology in a domain (3) additional terms thatcomplement detected terms in a given context and (4) meaning of a term in a givencontext. We are working towards developing a method and framework that providescontext-sensitive knowledge assistance taking into account the prevalent terminologies(folksonomies that evolve thereof) in a domain and mapping them with domainontologies that employ the semantic web concepts.
9 Acknowledgements
We thank G. Muralikrishna for his efforts in taking our method to field and sharing theresults with us.
306
References
[D1] Davis A.M., Software Requirements: Objects, Functions and States. Prentice Hall, 1995[SFG2] Sharp H., Finkelstein A., and Galal G.. Stakeholder identification in the requirements
engineering process. In Proc.of the 10th Int. Work. on Datab. & Exp. Sys. Appl., 1999,387–391
[P3] Potts C.,Metaphors of intent. In Proc. of the IEEE Int.Req. Eng. Conf. (RE), 2001,31-39[A4] Aoyama M. Persona-and-scenario based requirements engineering for software
embedded in digital consumer products. In Proc. of the IEEE Int. Req. Eng. Conf. (RE),2005,85–94,
[CE5] Cohene T. and Easterbrook S., Contextual risk analysis for interview designs. In Proc. ofthe IEEE Int. Req. Eng. Conf (RE), 2005, 95–104
[SFS6] Sutcliffe S., Fickas M. and Sohlberg M., PC-RE a method for personal and contextrequirements engineering with some experience. Req. Eng. J., 11(3) (2006), 1–17
[MR7] Maiden N.and Robertson S., Integrating creativity into requirements processes:Experiences with an air traffic management system. In Proc. of the IEEE Int. Req. Eng.Conf (RE), 2005, 105–116,
[M8] Morasco J, Software development productivity and project success rates: Are weattacking the right problem? http://www-128.ibm.com/developerworks/rational/library/feb06/marasco/index.html
[M9] Morasco J., The requirements translation challenge --- can you meet it?http://articles.techrepublic.com.com/5100-3513-6128696.html
[DZ10] Damian, D.E.; Zowghi, D., The impact of stakeholders’ geographical distribution onmanaging requirements in a multi-site organization, Req.Engg, 2002. Proc. IEEE JointInternational Conference on Volume, Issue, 2002, 319 – 328
[H11] Herbsleb, James D., Global Software Engineering: The Future of Socio-technicalCoordination, Future of Software Engineering, 2007. FOSE apos;07, Volume ,23-25May, 2007.188 – 198
[HMPR12] Hevner A.R., March S.T., Park J., Ram S., MIS Quarterly Vol. 28 No. 1, March(2004), 75- 105
[VK13] Vaishnavi V, Kuechler W, Design research in Information Systems ,http://www.isworld.org/Researchdesign/derisISworld.htm
[MS14] March, S.T., and G. Smith, “Design and Natural Science Research on Information.Technology,” Decision Support Systems, 15, 4, 1995, 251-266,
[BGM15] Bhat, J.M., Gupta, M., and Murthy, S.N., Overcoming Requirements EngineeringChallenges: Lessons from Offshore utsourcing. IEEE Software, 23, 5 2006,. 38-44.
[D16] Damian, D., Stakeholders in Global RE: Lessons learned from practice. IEEE Software,(2007), 21-27
[DM17] Damian, D. and Moitra, D., Global Software Development: How Far Have We Come?IEEE Software, 23,5 (2006),17-19.
[DZ18] Damian, D.E. and Zowghi, D., Requirements Engineering challenges in multi-sitesoftware development organizations. Req Engg Journal 8,(2003),149-160.
[HC19] Jo Hanisch and Brian Corbitt , Impediments to requirements engineering during. Globalsoftware development,Euro.Journ.ofInf.Systems(2007)16, 793–805.
[2H0] Hsieh, Y., Culture and Shared Understanding in Distributed Requirements Engineering.in Int Conf on Global Software Engg.2006.Florianopolis, Brazil.
[SSC21] Sinha, V., Sengupta, B., and Chandra, S., Enabling Collaboration in DistributedRequirements Management., IEEE Software, 23, 5 (2006), 52- 61.
[CA22] Cheng, B. and Atlee, J., Research Directions in Requirements Engineering, in Future ofSoftware Engineering, 2007, FOSE apos;07, Volume 23-25 May, 2007.285-303
[KWE23] L. Kolos-Mazuryk, R. Wieringa, P. van Eck. , Development of a RequirementsEngineering Method For Pervasive Services. RE '05, Paris France. August 2005.
307

[GSV24] Ghaisas S, Shrotri U and Venkatesh R. , Requirement-centric method for ApplicationDevelopment. Workshop in Engineering methods to support Information SystemsEvolution (EMSISE'03).September2003,Geneva. http://cui.unige.ch/dbresearch/EMSISE03/Rp03.pdf
[SBV25] Shrotri, U.; Bhaduri, P.; Venkatesh, R., Model checking visual specification ofrequirements, First International Conference on Software Engineering and FormalMethods, 2003.Proceedings. Volume , Issue , 25-26 Sept. 2003, 202 – 209
[GVKKR26] Smita Ghaisas, R Venkatesh, Alka Kanhere, Amit Kumar, Manish Kumar andPreethu Rose, Identifying unobvious requirements- an exemplar of the Design Scienceapproach, 2008, Proc of the Third International Conference on Design Science Researchin Inf. Systems and Tech. (DESRIST 2008), 335-340
[M27] G. Muralikrishna, Requirements Modeling -- Experience from an Insurance Project,Fourth IEEE International Conference on Software Engg and Formal Methods (SEFM2006), 11-15 September 2006, Pune, India. IEEE Comp. Soc. 2006, 157-166
308
AWeb Platform for Social Requirements Engineering
Steffen Lohmann1, Sebastian Dietzold2, Philipp Heim1, Norman Heino2
1Interactive Systems and Interaction DesignUniversity of Duisburg-Essen
Lotharstrasse 65, 45057 Duisburg, Germany{lohmann, heim}@interactivesystems.info
2Agile Knowledge Engineering and Semantic WebUniversity of Leipzig
Johannisgasse 26, 04009 Leipzig, Germany{dietzold, heino}@informatik.uni-leipzig.de
Abstract: This paper presents a web platform that applies concepts from thedomain of Social Software to requirements engineering. The platform implementsseveral community-oriented features that support collaboration and knowledgesharing and aim to foster the engagement of larger groups of stakeholders in thecollection, discussion, development, and structuring of software requirements.
1 Motivation
Today’s requirements engineering (RE) tools are primarily designed to support arelatively small group of experts in the capturing, structuring, development, andmanagement of software requirements. The direct engagement of larger groups ofstakeholders (e.g., end-users) is usually not an issue as commercial tools such asDOORS, RequisitePRO, or CaliberRM are too heavyweight in order to be used byuntrained stakeholders that have only little expertise in requirements engineering [DG07,NSK00]. Furthermore, existing tool solutions provide only limited support forinteraction and collaboration among a large number of diverse stakeholders [Wh07,De07]. For these reasons, participants are often forced to switch to additional tools (e.g.,e-mail, instant messaging) or face-to-face contact for communication and collaborationin the requirements engineering process.
However, if participants are geographically distributed, face-to-face contact is ratherlimited. On the other hand, using additional collaboration tools requires furtherinstallations and a change of the application environment resulting in an increased effortand participation barrier for the stakeholders. But the main problem of all collaborationamong stakeholders that happens independently of RE tools is that it cannot be fullytracked by the RE tools and therefore provides little to no transparency and traceability:For instance, the collaboration process that takes place before a requirement is entered inthe RE tool is often insufficiently documented and therefore hard to retrace.
309
In order to overcome these drawbacks of tool-independent collaboration, RE solutionsmust offer integrated features that better support collaboration among stakeholders.These features should be easy-to-use and should foster stakeholder engagement but mustalso allow to track and trace the collaboration activities. The advent and great success ofa new generation of web-based, community-centered applications – often subsumedunder the label Social Software – might stimulate the integration of these types ofcollaboration features in RE environments. Some typical characteristics of SocialSoftware are community- and user-orientation, simplicity, quick collaboration, self-organization, social feedback, transparency, and emerging structures (cp. Hi06]) – theseare also central issues for any RE solution that supports social requirements engineering.In summary, Social Software Engineering (SSE) can be defined as “the application ofprocesses, methods, and tools to enable community-driven creation, management,deployment, and use of software in online environments” [Ha08, p. 531].
Based on these ideas, we developed a web platform within the SoftWiki project [SW09]that offers lightweight support for social requirements engineering. The platform enablesa large number of geographically distributed stakeholders to collaboratively collect,discuss, semantically enrich, and classify software requirements. This paper presentsselected features of the web platform that illustrate how Social Software concepts mightfruitfully complement RE practices in an integrated fashion and might encouragestakeholder groups that would not use conventional requirements engineering tools toactively participate and collaborate in software development.
2 Web Platform for Social Requirements Engineering
Fulfilling an essential prerequisite of all Social Software, the RE platform can be easilyinstalled on a server in the internet (or intranet) allowing it to be used from any locationwith internet access. Since the platform is completely web-based only a web browser isrequired in order to take part, without any need for further application or plug-ininstallations. This helps to reduce the participation barrier and fosters distributedcollaboration.
2.1 Balancing Self-Organization and Moderation
The web platform follows the Wiki philosophy [LC01] as it is driven by the ideas ofquick collaboration and little regulation: In general, every registered user is allowed toedit and discuss all existing requirements, to enter new ones, or to define relationsbetween requirements. Similar to Wikis, every change is logged in a revision historyalong with the author’s name allowing to track, review, and selectively rollback changes,which guarantees transparency as a key issue in RE. Though not implemented in thecurrent version, sophisticated visualizations based on the data of the revision historymight additionally be offered to support traceability as another key issue in RE, forinstance, by visualizing the traces in the change history of requirements [DC06].
310
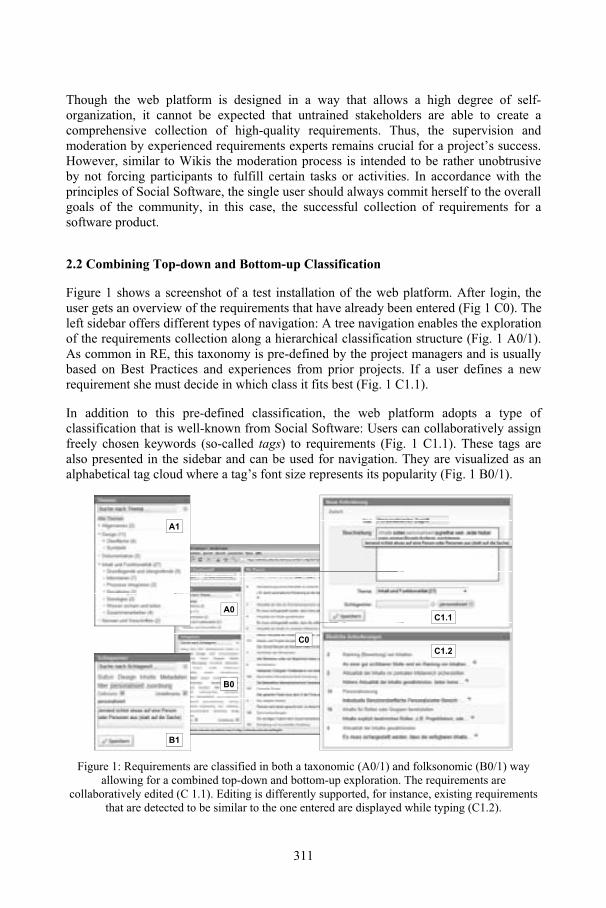
Though the web platform is designed in a way that allows a high degree of self-organization, it cannot be expected that untrained stakeholders are able to create acomprehensive collection of high-quality requirements. Thus, the supervision andmoderation by experienced requirements experts remains crucial for a project’s success.However, similar to Wikis the moderation process is intended to be rather unobtrusiveby not forcing participants to fulfill certain tasks or activities. In accordance with theprinciples of Social Software, the single user should always commit herself to the overallgoals of the community, in this case, the successful collection of requirements for asoftware product.
2.2 Combining Top-down and Bottom-up Classification
Figure 1 shows a screenshot of a test installation of the web platform. After login, theuser gets an overview of the requirements that have already been entered (Fig 1 C0). Theleft sidebar offers different types of navigation: A tree navigation enables the explorationof the requirements collection along a hierarchical classification structure (Fig. 1 A0/1).As common in RE, this taxonomy is pre-defined by the project managers and is usuallybased on Best Practices and experiences from prior projects. If a user defines a newrequirement she must decide in which class it fits best (Fig. 1 C1.1).
In addition to this pre-defined classification, the web platform adopts a type ofclassification that is well-known from Social Software: Users can collaboratively assignfreely chosen keywords (so-called tags) to requirements (Fig. 1 C1.1). These tags arealso presented in the sidebar and can be used for navigation. They are visualized as analphabetical tag cloud where a tag’s font size represents its popularity (Fig. 1 B0/1).
A0
A1
B0
B1
C0
C1.1
C1.2
Figure 1: Requirements are classified in both a taxonomic (A0/1) and folksonomic (B0/1) wayallowing for a combined top-down and bottom-up exploration. The requirements are
collaboratively edited (C 1.1). Editing is differently supported, for instance, existing requirementsthat are detected to be similar to the one entered are displayed while typing (C1.2).
311
Thus, the web platform offers both a top-down (taxonomic) and bottom-up (so-calledfolksonomic) approach of classification, which can be used in combination whennavigating in the requirements collection. For instance, a set of requirements resultingfrom a selection of a class in the taxonomy tree can be further filtered by selecting tagsfrom the tag cloud and vice versa. To ease combined navigation, at each time only tagsare shown in the cloud that enable additional filtering.
2.3 Maturing Vocabulary: From Tags to Glossary Terms
Even though tagging is a popular and successful concept in Social Software, it is alsovery ambiguous as freely chosen keywords of users can have several meanings.However, ambiguity is normally to be avoided in the definition of softwarerequirements. Requirements should generally be formulated in a way that fosters sharedunderstanding and leaves minimal room for divergent interpretations. Ambiguous,uncommon or technical terms need to be further defined. Therefore, the web platformimplements an advanced form of tagging by allowing to add definitions to tags: If a tagis selected from the tag cloud, the user can enter a description that explains its meaningin a textbox below the cloud (Fig. 1 B1). In doing so, the user transforms an undefinedtag in a defined tag that is visually distinguished in the cloud. That way, the participantssuccessively create a glossary for central terms in the requirements collection.
In addition, the platform assists in the correct interpretation of a requirement’s meaningby highlighting all defined tags in the text and showing their definitions in tooltips (Fig.1 C1.1). That way, users can easily lookup an ambiguous, technical or unknown term’smeaning if this meaning has already been defined by other users. Since the highlightingis already provided while a stakeholder enters her requirement, it also advises thestakeholders to check for existing definitions and hence prevents the misuse of alreadydefined terms when expressing requirements.
The user-assigned tags can moreover be used to update a project’s taxonomy from timeto time: For instance, popular tags (i.e., tags with a large font size in the cloud) might beconsidered as valuable to be integrated in the taxonomy at some stage of development orin a subsequent project.
2.4 Social Feedback and Prioritization of Requirements
In addition, the web platform offers discussion and rating features as they are well-known from other Social Software contexts (see Fig. 2). These social feedbackmechanisms might be very helpful for authors of requirements as they give some hintswhere a requirement needs to be improved or more precisely defined. They canfurthermore provide a valuable starting point for prioritization of requirements.
In general, we distinguish three types of social feedback: commenting, rating, andvoting. Comments can be used to discuss requirements and help to improve their quality.Ratings are similar to comments but additionally allow to judge a requirement’s qualityon a five point scale. Voting enables users to express their agreement or disagreement
312
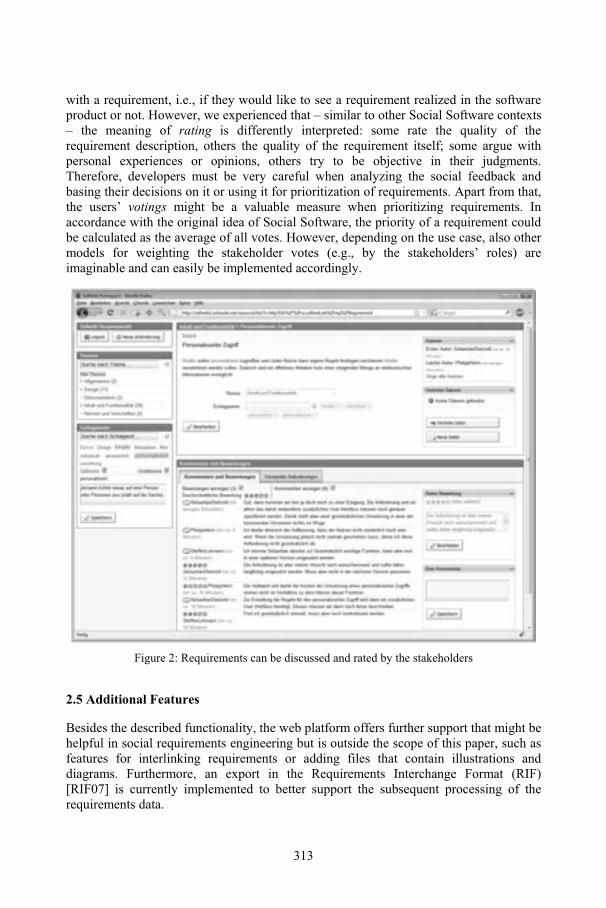
with a requirement, i.e., if they would like to see a requirement realized in the softwareproduct or not. However, we experienced that – similar to other Social Software contexts– the meaning of rating is differently interpreted: some rate the quality of therequirement description, others the quality of the requirement itself; some argue withpersonal experiences or opinions, others try to be objective in their judgments.Therefore, developers must be very careful when analyzing the social feedback andbasing their decisions on it or using it for prioritization of requirements. Apart from that,the users’ votings might be a valuable measure when prioritizing requirements. Inaccordance with the original idea of Social Software, the priority of a requirement couldbe calculated as the average of all votes. However, depending on the use case, also othermodels for weighting the stakeholder votes (e.g., by the stakeholders’ roles) areimaginable and can easily be implemented accordingly.
Figure 2: Requirements can be discussed and rated by the stakeholders
2.5 Additional Features
Besides the described functionality, the web platform offers further support that might behelpful in social requirements engineering but is outside the scope of this paper, such asfeatures for interlinking requirements or adding files that contain illustrations anddiagrams. Furthermore, an export in the Requirements Interchange Format (RIF)[RIF07] is currently implemented to better support the subsequent processing of therequirements data.
313
Another novelty is the technical backend of the web platform that builds on SemanticWeb standards. It is based on OntoWiki [ADR06], a tool for distributed knowledgeengineering, and uses several approved vocabularies (e.g., SKOS, FOAF, SIOC). Theconceptual structure of the web platform itself is also described in ontological form[Ri07]. This allows for a high semantic interoperability and enables easy import andexport of parts of the platform’s contents in RDF format, for instance, the interlinkedrequirements, the taxonomy and folksonomy, or the users’ social network structure. Theconfiguration of the platform, such as the modification of the taxonomy or theadministration of users, is also realized in the OntoWiki backend.
3 Discussion and Conclusion
In this paper, we have presented a web platform that applies several concepts of SocialSoftware to requirements engineering. As has become apparent, a central challengeconsists in balancing conflicting demands: On the one hand, an adequate solution shouldfollow Social Software principles, such as simplicity, community-orientation, quickcollaboration, and social feedback, in order to activate larger groups of stakeholders todirectly participate in requirements engineering. On the other hand, sufficient formalitymust be provided in order to serve typical demands of requirements engineering, such asstructured access or efficient analysis and post-processing of the collected requirements.
The presented approach aims particularly at supporting early phases of requirementsengineering with many distributed participants and much informal collaboration. Itfocuses on simplicity and ease of participation instead of advanced and powerfulrequirements management features. It emphasizes the social experience of developingrequirements for a software system: Diverse stakeholders are enabled to collaborativelycollect, discuss, improve, and structure requirements, even without training andexperience. Under the supervision of experts in the field, the requirements areformulated in natural language and are successively improved by all participants. Thesegoals do explicitly not exclude the possibility of later ‘cleaning’ and refinement of therequirements by experienced engineers and in established requirements managementtools.
The presented web platform should not be regarded as a comprehensive solution butrather as a starting point and first step towards better support for integrated collaboration.To further examine the feasibility of this approach, much more work is needed. So far,we cannot make any reliable statement on how well the web platform performs in realworld contexts. Evaluations within use cases of industry partners from the project are inpreparation and are expected to provide some valuable insights regarding the generalacceptance and experienced benefits of a web platform for social requirementsengineering.
314
References
[ADR06] Auer, S.; Dietzold, S.; Riechert, T.: OntoWiki – A Tool for Social, Semantic Colla-boration. In: Proceedings of the 5th International Semantic Web Conference (ISWC2006), LNCS 4273. Springer, Berlin, Heidelberg, 2006; pp. 736-749.
[De07] Decker, B.; Ras, E.; Rech, J.; Jaubert, P.; Rieth, M.: Wiki-Based StakeholderParticipation in Requirements Engineering. In: IEEE Software, 24(2), 2007; pp. 28-35
[DG07] Delgadillo, L.; Gotel, O.: Story-Wall: A Concept for Lightweight RequirementsManagement. In: Proceedings of the 15th International Requirements EngineeringConference (RE'07). IEEE; pp. 377-378.
[DC06] Duan, C.; Cleland-Huang, J.: Visualization and Analysis in Automated Trace Retrieval.In: Proceedings of the 1st International Workshop on Requirements EngineeringVisualization (REV’06). IEEE, 2006.
[Ha08] Hammouda, I.; Bosch, J.; Jazayeri, M.; Mikkonen, T.: 1st International Workshop onSocial Software Engineering and Applications (SoSEA 2008). In: Proceedings of the23rd IEEE/ACM International Conference on Automated Software Engineering (ASE2008). IEEE, 2008; pp. 531-532.
[Hi06] Hippner, Hajo: Bedeutung, Anwendungen und Einsatzpotenziale von Social Software.In: HMD – Praxis der Wirtschaftsinformatik, 252, 2006; pp. 6-16.
[LC01] Leuf, B.; Cunningham, W.: The Wiki Way: Quick Collaboration on the Web. Addison-Wesley Longman, Amsterdam, 2001.
[NSK00] Nikula, U.; Sajaniemi, J.; Kälviäinen, H.: A State-of-the-Practice Survey onRequirements Engineering in Small- and Medium-Sized Enterprises. Research report,Telecom Business Research Center Lappeenranta, 2000.
[RIF07] Requirements Interchange Format (RIF), 1.1a, 2007; www.automotive-his.de/rif/[Ri07] Riechert, T.; Lauenroth, K.; Lehmann, J.; Auer, S.: Towards Semantic based
Requirements Engineering. In: Proceedings of the 7th International Conferenceon Knowledge Management. J.UCS, 2007; pp. 144-151
[SW09] SoftWiki – Cooperative research project funded by the BMBF, http://softwiki.de[Wh07] Whitehead, J.: Collaboration in Software Engineering: A Roadmap. In: 2007 Future of
Software Engineering. IEEE, 2007; pp. 214-225
315

Community Driven Elicitation of Requirements withEntertaining Social Software
Anna Hannemann, Christian Hocken, Ralf KlammaRWTH Aachen University
Information systemsAhornstr. 55, 52056 Aachen, Germany
{hannemann | hocken | klamma }@dbis.rwth-aachen.de
Abstract: With the new business models of the Web 2.0 the need for continuousrequirements engineering becomes even more important. Future applications are in’perpetual beta’ and well-understood user needs are a competitive advantage in a bil-lion dollar market. However, user communities have to be addressed with new Web2.0 style elicitation tools, since support by communities is offered at will in the mostcases. In this paper, we research community-driven elicitation processes and their toolsupport. Identification of user needs with and without proposed Web 2.0 style elicita-tion processes are modeled explicitly using the strategic modeling approach i*. In acase study we implemented a Bubble Annotation Tool (BAT) for enjoyable, intuitiveand traceable interaction within communities performing requirements engineeringprocesses. First experiences with the tool in a study conducted to elicit requirementsfor an iPhone application are reported and discussed.
1 Introduction
Recent developments in information and communication technology exhibit a rapid in-crease of web-based information systems. One of the key success components of Web 2.0[O’R05] services is and will be the support for online communities, thereby introducingsocial concepts to enable people to meet and interact on the web. However, the appli-cation of social software in communities such as in organizations or enterprises is stilllimited. The essential research question is how to adapt social platforms to the needs ofa certain professional community. The emerging business concept based on the Long Tailtheory [And04] shifts the focus of many companies from few big customers to many smallones. Due to this business principle a customer turns into a long-tail community, with verydiverse, spread all over the world members. This community is subject to an ongoing evo-lution process. Both the community experience changes over the time (because of learningand knowledge exchange processes within community), and also the community structureevolves (i.e. a community can either expand or shrink, get more loose or more tight, therecan be many or no newcomers). Thereby, the requirements of community changes. Ob-viously, successful development of web services requires new requirements engineering(RE) concepts, which will consider not only technical but also social-psychological andstructural aspects of communities.
317
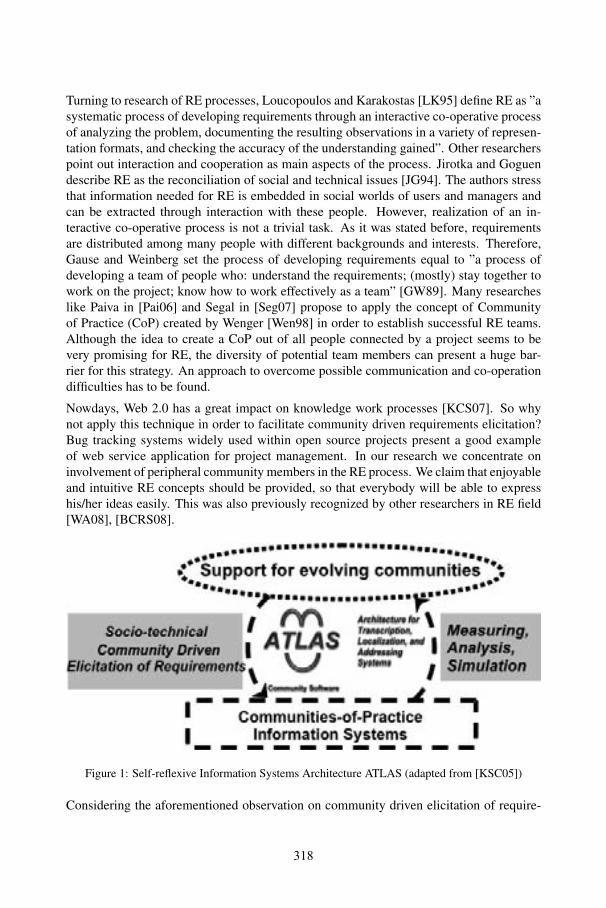
Turning to research of RE processes, Loucopoulos and Karakostas [LK95] define RE as ”asystematic process of developing requirements through an interactive co-operative processof analyzing the problem, documenting the resulting observations in a variety of represen-tation formats, and checking the accuracy of the understanding gained”. Other researcherspoint out interaction and cooperation as main aspects of the process. Jirotka and Goguendescribe RE as the reconciliation of social and technical issues [JG94]. The authors stressthat information needed for RE is embedded in social worlds of users and managers andcan be extracted through interaction with these people. However, realization of an in-teractive co-operative process is not a trivial task. As it was stated before, requirementsare distributed among many people with different backgrounds and interests. Therefore,Gause and Weinberg set the process of developing requirements equal to ”a process ofdeveloping a team of people who: understand the requirements; (mostly) stay together towork on the project; know how to work effectively as a team” [GW89]. Many researcheslike Paiva in [Pai06] and Segal in [Seg07] propose to apply the concept of Communityof Practice (CoP) created by Wenger [Wen98] in order to establish successful RE teams.Although the idea to create a CoP out of all people connected by a project seems to bevery promising for RE, the diversity of potential team members can present a huge bar-rier for this strategy. An approach to overcome possible communication and co-operationdifficulties has to be found.
Nowdays, Web 2.0 has a great impact on knowledge work processes [KCS07]. So whynot apply this technique in order to facilitate community driven requirements elicitation?Bug tracking systems widely used within open source projects present a good exampleof web service application for project management. In our research we concentrate oninvolvement of peripheral community members in the RE process. We claim that enjoyableand intuitive RE concepts should be provided, so that everybody will be able to expresshis/her ideas easily. This was also previously recognized by other researchers in RE field[WA08], [BCRS08].
Figure 1: Self-reflexive Information Systems Architecture ATLAS (adapted from [KSC05])
Considering the aforementioned observation on community driven elicitation of require-
318
ments a reflective system architecture ATLAS [KSC05] previously developed by our group(Figure 1) presents an appropriate solution. The design principles of ATLAS build onideas of joining usability and sociability by constantly assessing and supporting commu-nity needs. In its reflective conception the socio-technical information systems developedon the basis of ATLAS are tightly interwoven with a set of media-centric self-monitoringtools for the communities served. Hence, communities can constantly measure, analyzeand simulate their ongoing activities. The usage of MPEG-7 as a basis of provided servicesis a core concept that helps to ensure interoperability and scalability of ATLAS communityinformation systems. First, in order to analyze already existing possibilities for extractionof community requirements within ATLAS architecture both human and technologicalactors and their interconnectivity were modeled with i* [Yu95] , as i* has proven to besuitable to capture the various relationships and rationales of the actors involved. Then,the model was extended by tools for community driven elicitation of requirements. Ac-cording to the sketches model we have designed and implemented Bubble Annotation Tool(BAT).
The rest of the paper is organized as follows: in Section 2 community driven elicitation ofrequirements modeled with i* [Yu95] is presented. To prove the proposed concept BATwas developed. Its functionalities, structure and also application scenarios are given inSection 3. The technology for data representation and architecture concepts used by BATare introduced in Section 4. First testing results of BAT for RE are sketched in Section 5.Summary and outlook conclude this paper (Section 6).
2 Modeling Community Driven Elicitation of Requirements
The agent-based graphical modeling language i*, which was developed for early require-ments engineering, has proven to be particularly suitable as a modeling instrument in REbecause it explicitly deals with dependency relations, besides other notions like actors,goals, resources, and tasks. In order to conceptualize community driven elicitation ofrequirements techniques and their deployment in the RE world, we first modeled howcommunity needs can be approached without extra facilities (Figure 2, green objects).The whole CoP consists of two main not necessarily independent communities: develop-ers and stakeholders. The softgoal [Yu95] of the first group is to satisfy users’ needs ofthe second group. As we assume that the stakeholders’ community is extremely big andits members are spread all over the world, the standard approaches to collect user needsare not applicable. One method we identified is to monitor the system usage (providemonitoring). Monitoring data can be analyzed and knowledge about user preferences canbe extracted (analyze system usage). However, this analysis answers only the questions”who” and ”how”, but not ”why” and ”what would be better”. Next we presumed that sev-eral communication media (forums, wikis, blogs, etc.) exist, provided either by developersor by third parties, where CoP can exchange information via communication entry. Thesesocial platforms are normally used to ask questions, to exchange experience or to giveadvice. Analysis of these data (analyze comm. data) can also be used for requirementsidentification. A big challenge for the analysis presents data uncertainty, data amount and
319
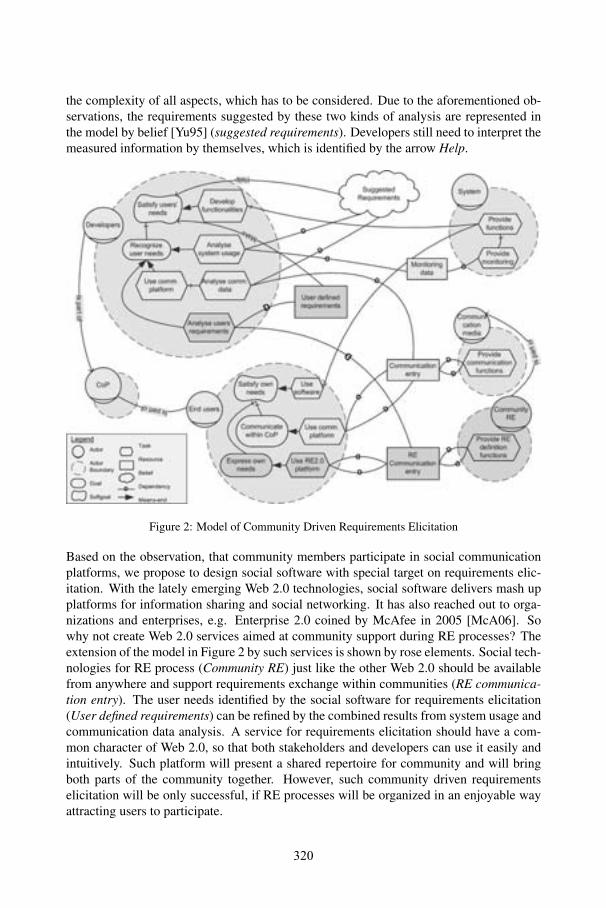
the complexity of all aspects, which has to be considered. Due to the aforementioned ob-servations, the requirements suggested by these two kinds of analysis are represented inthe model by belief [Yu95] (suggested requirements). Developers still need to interpret themeasured information by themselves, which is identified by the arrow Help.
Figure 2: Model of Community Driven Requirements Elicitation
Based on the observation, that community members participate in social communicationplatforms, we propose to design social software with special target on requirements elic-itation. With the lately emerging Web 2.0 technologies, social software delivers mash upplatforms for information sharing and social networking. It has also reached out to orga-nizations and enterprises, e.g. Enterprise 2.0 coined by McAfee in 2005 [McA06]. Sowhy not create Web 2.0 services aimed at community support during RE processes? Theextension of the model in Figure 2 by such services is shown by rose elements. Social tech-nologies for RE process (Community RE) just like the other Web 2.0 should be availablefrom anywhere and support requirements exchange within communities (RE communica-tion entry). The user needs identified by the social software for requirements elicitation(User defined requirements) can be refined by the combined results from system usage andcommunication data analysis. A service for requirements elicitation should have a com-mon character of Web 2.0, so that both stakeholders and developers can use it easily andintuitively. Such platform will present a shared repertoire for community and will bringboth parts of the community together. However, such community driven requirementselicitation will be only successful, if RE processes will be organized in an enjoyable wayattracting users to participate.
320
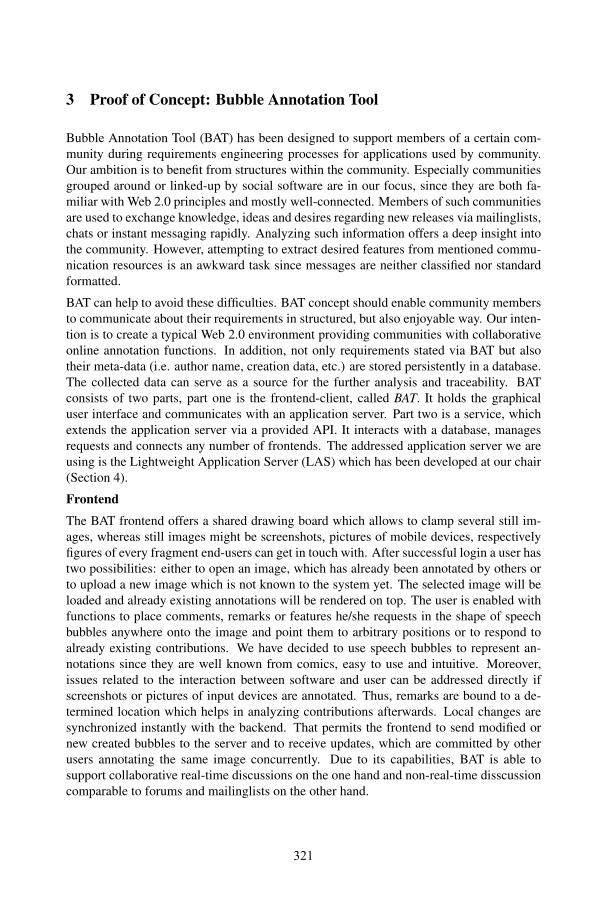
3 Proof of Concept: Bubble Annotation Tool
Bubble Annotation Tool (BAT) has been designed to support members of a certain com-munity during requirements engineering processes for applications used by community.Our ambition is to benefit from structures within the community. Especially communitiesgrouped around or linked-up by social software are in our focus, since they are both fa-miliar with Web 2.0 principles and mostly well-connected. Members of such communitiesare used to exchange knowledge, ideas and desires regarding new releases via mailinglists,chats or instant messaging rapidly. Analyzing such information offers a deep insight intothe community. However, attempting to extract desired features from mentioned commu-nication resources is an awkward task since messages are neither classified nor standardformatted.
BAT can help to avoid these difficulties. BAT concept should enable community membersto communicate about their requirements in structured, but also enjoyable way. Our inten-tion is to create a typical Web 2.0 environment providing communities with collaborativeonline annotation functions. In addition, not only requirements stated via BAT but alsotheir meta-data (i.e. author name, creation data, etc.) are stored persistently in a database.The collected data can serve as a source for the further analysis and traceability. BATconsists of two parts, part one is the frontend-client, called BAT. It holds the graphicaluser interface and communicates with an application server. Part two is a service, whichextends the application server via a provided API. It interacts with a database, managesrequests and connects any number of frontends. The addressed application server we areusing is the Lightweight Application Server (LAS) which has been developed at our chair(Section 4).
Frontend
The BAT frontend offers a shared drawing board which allows to clamp several still im-ages, whereas still images might be screenshots, pictures of mobile devices, respectivelyfigures of every fragment end-users can get in touch with. After successful login a user hastwo possibilities: either to open an image, which has already been annotated by others orto upload a new image which is not known to the system yet. The selected image will beloaded and already existing annotations will be rendered on top. The user is enabled withfunctions to place comments, remarks or features he/she requests in the shape of speechbubbles anywhere onto the image and point them to arbitrary positions or to respond toalready existing contributions. We have decided to use speech bubbles to represent an-notations since they are well known from comics, easy to use and intuitive. Moreover,issues related to the interaction between software and user can be addressed directly ifscreenshots or pictures of input devices are annotated. Thus, remarks are bound to a de-termined location which helps in analyzing contributions afterwards. Local changes aresynchronized instantly with the backend. That permits the frontend to send modified ornew created bubbles to the server and to receive updates, which are committed by otherusers annotating the same image concurrently. Due to its capabilities, BAT is able tosupport collaborative real-time discussions on the one hand and non-real-time disscussioncomparable to forums and mailinglists on the other hand.
321
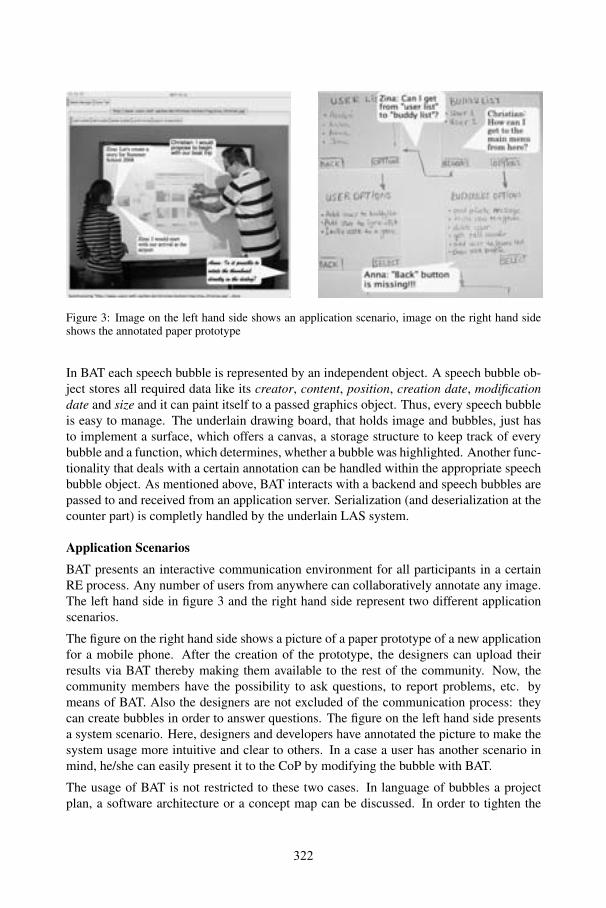
Figure 3: Image on the left hand side shows an application scenario, image on the right hand sideshows the annotated paper prototype
In BAT each speech bubble is represented by an independent object. A speech bubble ob-ject stores all required data like its creator, content, position, creation date, modificationdate and size and it can paint itself to a passed graphics object. Thus, every speech bubbleis easy to manage. The underlain drawing board, that holds image and bubbles, just hasto implement a surface, which offers a canvas, a storage structure to keep track of everybubble and a function, which determines, whether a bubble was highlighted. Another func-tionality that deals with a certain annotation can be handled within the appropriate speechbubble object. As mentioned above, BAT interacts with a backend and speech bubbles arepassed to and received from an application server. Serialization (and deserialization at thecounter part) is completly handled by the underlain LAS system.
Application Scenarios
BAT presents an interactive communication environment for all participants in a certainRE process. Any number of users from anywhere can collaboratively annotate any image.The left hand side in figure 3 and the right hand side represent two different applicationscenarios.
The figure on the right hand side shows a picture of a paper prototype of a new applicationfor a mobile phone. After the creation of the prototype, the designers can upload theirresults via BAT thereby making them available to the rest of the community. Now, thecommunity members have the possibility to ask questions, to report problems, etc. bymeans of BAT. Also the designers are not excluded of the communication process: theycan create bubbles in order to answer questions. The figure on the left hand side presentsa system scenario. Here, designers and developers have annotated the picture to make thesystem usage more intuitive and clear to others. In a case a user has another scenario inmind, he/she can easily present it to the CoP by modifying the bubble with BAT.
The usage of BAT is not restricted to these two cases. In language of bubbles a projectplan, a software architecture or a concept map can be discussed. In order to tighten the
322
community we suggest to use BAT for annotating not only project materials but also com-munity pictures: e.g. from together visited conferences, exhibitions, etc. In that way, eventhe community experience will be shared, as those who have not participated in the pic-tured situations can gain information about missed events.
BAT-Service
The backend called BAT-service and presents a service, which is executed by the applica-tion server (LAS) [SKJR06], developed in our research group. BAT-service implements aninterface with methods that can be invoked by the frontend. These methods offer a bunchof functionalities like creation, retrieval and storage of speech bubbles but also accesscontrol and management functions for pictures. The task of the service is to map speechbubble objects received from clients to valid MPEG-7 and, additionally, build speech bub-ble objects from existing MPEG-7 data which can be transmitted back to the frontend.Thus, complex operations like storing annotations in an appropriate format are swapped tothe backend and the underlain application server. Due to the fact that LAS offers an APIwith management functions dealing with the manipulation of XML data, there is no needto parse single MPEG-7 documents by the backend itself. Bubbles and image metadataare sent to or received from an XML database (see Section 4 for further details).
Annotations in MPEG-7
Listing 1: MPEG-7 annotation example1 <Mpeg7>2 <D e s c r i p t i o n t y p e =” C o n t e n t E n t i t y T y p e ”>3 <M u l t i m e d i a C o n t e n t t y p e =” ImageType ”>4 <Image i d =” img 160440431 ”>5 <S p a t i a l D e c o m p o s i t i o n gap=” t r u e ” o v e r l a p =” t r u e ”>6 <S t i l l R e g i o n f o n t S i z e =” 25 ” f o n t T y p e =” A r i a l ” t e x t T y p e =” s c e n e ”7 i d =” s r t 1 6 3 0 1 1 9 5 7 ” t y p e =” ImageTextType ”>8 <S p a t i a l M a s k>9 <SubRegion>
10 <Polygon>11 <Coords dim=” 2 5 ”>12 501 482 701 482 701 582 501 582 795 54013 </ Coords>14 </ Polygon>15 </ SubRegion>16 </ S p a t i a l M a s k>17 <Text l a n g =” en ”>18 Anna: I s i t p o s s i b l e t o r o t a t e t h e t h u m b n a i l d i r e c t l y i n t h e d i a l o g ?19 </ Tex t>20 </ S t i l l R e g i o n>21 </ S p a t i a l D e c o m p o s i t i o n>22 </ Image>23 </ M u l t i m e d i a C o n t e n t>24 </ D e s c r i p t i o n>25 </ Mpeg7>
In order to represent annotations the ImageTextType Description Scheme (DS) of MPEG-7 (Section 4) is applied. Speech bubbles are treated as polygons defined by a quintupleholding the coordinates of the pointer plus all anchor points of the bubble’s body. MPEG-7
323
entry of one of the bubble annotations illustrated in Figure 3 is presented in Listing 1.
In this format all interactions with BAT are saved to an XML database. Thus, during theRE an easy to analyze data pool is created. The collected data presents a rich source forboth requirements evolution and cross-media network analysis. In [Poh96] Pohl empha-sizes that the RE process should be traceable. The author names three applications for thetrace information: integration of changes, during system development and for improvingacceptance of the system. Hereby, BAT collects all data needed for full traceability: userid, image id and content (Listing 1). The date and time of record creation is saved by thedatabase automatically. Thus, requirements emerged during communication through BATcan be traced.
The three dimensions - user, content, image - present a very encouraging resource forcross-media analysis. Various networks based on different aspects can be extracted fromthis data. Usually, only two dimensions: user and content are available. The media dimen-sion opens a new possibility for analysis. By means of the analysis of the CoP networkroles of community members can be identified and, therefore, the knowledge creation andsharing can be approved [RCB02].
4 Technologies
Lightweight Application Server
The Lightweight Application Server (LAS) [SKJR06] is a system developed and contin-uously improved in our research group. LAS is completly written in Java and thereforeplatform independent. Current installations are running on Solaris, Linux, Mac OS andWindows. LAS is designed as a modular system and provides an API, whereby developerscan simply write extensions. Such extensions - in LAS terminology ”services” - enhancefunctionality and implement new features, which can be executed by connected clients(e.g.the BAT backend introduced in previous section is a service). One advantage of LASis out of the box support for tasks dealing with MPEG-7. Applications, which draw onLAS, are able to handle a huge amount of metadata easily. The API provides functionsfor interaction with an XML-database storing MPEG-7 documents. Examples of offeredmethods are add, remove, update or execute xPath. Further advantages affect the process-ing of MPEG-7 data within services. There is no need to parse XML files. Data receivedfrom or sent to the database are expected to be binding class instances, which present ob-jects created from Apache XMLBeans. Apache XMLBeans is a set of Java classes that canbe built automatically for a given XML schema representing XML tags as Java classes[Fou07]. During processing XML data LAS checks all changes against the descriptionscheme in order to verify, whether only valid changes are committed to the database. Oth-erwise an exception is thrown.
Interaction with users is handled through connectors. Two server-side connectors imple-menting HTTP and SOAP are available at present. We also provide client-connectorswritten in Java either using HTTP or SOAP, which can be integrated in new projects. Con-
324
necting LAS from PHP or Python is possible, too. Thus, new applications are not limitedto Java which is indispensable for web 2.0 software. In this way LAS gives us a chance toassemble new ideas related to MPEG-7 rapidly.
Users can connect to LAS and invoke designated service methods, in case they have suf-ficient access rights. The rights management is very fine-grained within LAS. Nearby thepossibility to assign access rights to a single user, they can also be granted to a predefinedgroup of users. Access can be granted to whole services, but also to a single method.Hence, the principles of LAS rights management is comparable with those of the rightsmanagement in UNIX filesystem.
MPEG-7
MPEG-7 [MSS02] also known as Multimedia Content Description Interface is a powerfulISO standard (ISO/IEC 15938) defined by the Moving Picture Experts Group.
MPEG-7 is designed to store metadata for any kind of media. Thus, it is not a standardto encode content like MPEG-1 and MPEG-2, but to describe it. Typical application areasof the standard are digital libraries, broadcasting stations, etc. or, summarized, all institu-tions, which have to handle a huge amount of media, whereby handling implies effectivesearch and retrieval.
MPEG-7 is XML-based and roughly defines three parts:
Descriptors Descriptors are used to define specific features of multimedia content likespatial regions or titles within a scene.
Description Schemes Description Schemes are predefined structures which manage therelationship between different components. Components may be Descriptors or De-scription Schemes.
Description Definition Language The Description Definition Language is xml-based anddefines the structural relations between descriptors. Furthermore, new descriptionschemes can be created or existing ones can be modified.
Due to the fact that the MPEG-7 language is an extension of the XML language one canrevert to technologies like xQuery and xPath to query for media information. This becomeseven more powerful, if all data is stored in an appropriate XML database. One benefit ofusing MPEG-7 in requirements engineering tools is its interoperability. Due to the factthat it is developed by a huge community a lot of tools exist, which can handle MPEG-7data. Thus, annotations are easy to handle even, if a tool which generated metadata for themedia file is not available.
325
5 First Results on Requirement Elicitation with BAT
One of the core community supporting services of LAS is New Media Viewer (NMV)[KCG+08]. NMV provides a wide range of image editing and annotation functions. Userscan tag, upload and search any type of media e.g. images or videos. This media manage-ment service runs on both desktop and mobile devices like Nokia N95. However, hardwaredoes not stay constant. Emerging new technologies result in an evolution of commu-nity needs. The iPhone presents such an innovative technology, which finds continuouslyincreasing popularity among people. Therefore, our community decided to develop aniPhone version of NMV.
The RE process for the new NMV version for the iPhone (iNMV) was executed in twoseparate groups of community members. The first group was equipped with printed outNMV screenshots. The second group was equipped with BAT. Also the possibility to up-load images (e.g. screenshots) to the media repository, which can then be annotated viaBAT, was provided. Both groups worked very efficiently and generated many require-ments for iNMV. After ”RE session” surveys with questions about the RE process werefilled out by every participant. One of the important findings was, that all members of theBAT session rated the question ”it made fun to express my requirements” with ”stronglyagree”. Whereby, in case of session without BAT almost 30% selected an option ”un-decided”. These results supports our hypothesis, that BAT serves enjoyable RE. Further,more people using BAT felt, that it was easy to specify the requirement they wanted todiscuss (80%, ”strongly agree”) and to understand what their colleagues were talkingabout (40%, ”strongly agree”), than participants using paper screenshots (42% and 28%respectively). An explanation for these results was found in the process reflection afterthe session. Participants of the session without BAT pointed out that ”a facility to makean issue under discussion available to everybody was missing”. As everybody was work-ing on his/her personal sheets, it was difficult to explain own ideas and understand thoseof others. In case of using BAT this problems did not occur, because the actions of thegroup were visible for everybody after each synchronization. Although, there were only9% more satisfied users in session with BAT (80%) than without BAT (71%), several par-ticipants of the latter one pointed out, that RE worked so well, only because of a smallgroup size (7).
Based on the RE workshop results, it can be concluded, that BAT was accepted by thecommunity. The application of BAT can increase the funniness of the RE process. Alsothe processing of workshop outcomes generated with BAT was easier than results sketchedon printouts. Bubble annotated pictures are saved in MPEG-7 format in a DB2 databaseand, therefore, can easily be analyzed with xPath. Whereby, the paper prototypes can onlybe analyzed manually. In spite of generally positive feedback on BAT from the users, manysuggestions for the improvement of BAT were made by the community. Also participantspresumed, that ”BAT will have greater advantage in cases, when RE participants have towork distantly”. In the next future a distant RE session with and without BAT is planed.
326
6 Summary and Outlook
In this paper we proposed to apply social software for co-operative and interactive RE. Weanalyzed existing concepts for RE process. The i*-model of possible requirements elici-tation for world wide spread communities was presented in this paper. Shared repertoirepresents one of the three dimensions by which practice becomes a source of coherenceof a community. Concentrating on the aspects of CoP building, we defined the need forintuitive, enjoyable and interactive tools. We claimed that social software presents a verypromising approach for community driven requirements elicitation. As a proof of conceptBubble Annotation Tool has been created. BAT allows community discussion in form ofspeech bubbles. Any number of users from anywhere in the world can communicate bymeans of bubbles, synchronously. A great benefit of BAT is that all data created by thisservice is saved to a database in MPEG-7 format. Thus, the RE process is continuouslytraced and a data analysis based on different aspects (e.g. media, author, content) can beeasily performed.
First experiences with the tool in a study conducted to elicit requirements for an iPhoneapplication showed, that BAT makes the RE process more enjoyable for the users. Theusers provided several suggestions on BAT improvement. Their realization is current workin progress. At the same time we started creating a navigation dashboard composed ofvarious cross-media analysis methods applied to the data collected by BAT in order torealize community-awareness.
References
[And04] Chris Anderson. The Long Tail. Wired, October 2004.
[BCRS08] Bernd Brugge, Oliver Creighton, Max Reiss, and Harald Stang. Applying a Video-based Requirements Engineering Technique to an Airport Scenario. In Third Interna-tional Workshop on Multimedia and Enjoyable Requirements Engineering (MERE’08),September 2008.
[Fou07] The Apache Software Foundation. Apache XMLBeans, Juni 2007.
[GW89] Donald C. Gause and Gerald M. Weinberg. Exploring Requirements: Quality BeforeDesign. Dorset House Publishing Co., Inc., New York, NY, USA, 1989.
[JG94] Marina Jirotka and Joseph A. Goguen, editors. Requirements engineering: social andtechnical issues. Academic Press Professional, Inc., San Diego, CA, USA, 1994.
[KCG+08] Ralf Klamma, Yiwei Cao, Anna Glukhova, Andreas Hahne, and Dominik Renzel. Non-linear Story-telling in a Mobile World. In K. Tochtermann and et. al, editors, Proceed-ings of I-Know’08 and I-Media’08, International Conferences on Knowledge Manage-ment and New Media Technology, pages 218–225, Graz, Austria, September 3-5 2008.
[KCS07] Ralf Klamma, Yiwei Cao, and Marc Spaniol. Watching the Blogosphere: KnowledgeSharing in the Web 2.0. In N. Nicolov and et al., editors, International Conferenceon Weblogs and Social Media, pages 105–112, Boulder, Colorado, USA, March 26-28,2007.
327
[KSC05] Ralf Klamma, Marc Spaniol, and Yiwei Cao. Community Hosting with MPEG-7 com-pliant Multimedia Support. Journal of Universal Knowledge Management, 1(1):36–44,2005.
[LK95] Pericles Loucopoulos and Vassilios Karakostas. System Requirements Engineering.McGraw-Hill, 1995.
[McA06] A. P. McAfee. Enterprise 2.0: The Dawn of Emergent Collaboration. In MIT SloanManagement Review, volume 47, pages 21–28, 2006.
[MSS02] BS Manjunath, P. Salembier, and T. Sikora. Introduction to MPEG-7: MultimediaContent Description Interface. Wiley, 2002.
[O’R05] Tim O’Reilly. What Is Web 2.0 – Design Patterns and Business Models for the NextGeneration of Software. www.oreillynet.com, 2005.
[Pai06] Elizangela Andrade Paiva. The Test Community of Practice Experience in Brazil.Global Software Engineering, 2006. ICGSE ’06. International Conference on, pages247–248, Oct. 2006.
[Poh96] Klaus Pohl. Process-Centered Requirements Engineering. John Wiley & Sons, Inc.,New York, NY, USA, 1996.
[RCB02] Andrew Parker Rob Cross and Stephen P. Borgatti. A bird’s-eye view: Using socialnetwork analysis to improve knowledge creation and sharing, 2002.
[Seg07] Judith Segal. Some Problems of Professional End User Developers. Visual Languagesand Human-Centric Computing, 2007. VL/HCC 2007. IEEE Symposium on, pages 111–118, Sept. 2007.
[SKJR06] Marc Spaniol, Ralf Klamma, Holger Janßen, and Dominik Renzel. LAS: A LightweightApplication Server for MPEG-7 Services in Community Engines. In K. Tochtermannand H. Maurer, editors, Proceedings of I-KNOW ’06, 6th International Conference onKnowledge Management, Graz, Austria, September 6 - 8, J.UCS (Journal of UniversalComputer Science) Proceedings, pages 592–599. Springer-Verlag, 2006.
[WA08] Amanda M. Williams and Thomas A. Alspaugh. Articularing software requirementscomic book style. In Third International Workshop on Multimedia and Enjoyable Re-quirements Engineering (MERE’08), September 2008.
[Wen98] Etienne Wenger. Communities of Practice: Learning, Meaning, and Identity. Cam-bridge University Press, Cambridge, UK, 1998.
[Yu95] Eric Yu. Model ling Strategic Relationships for Process Reengineering. PhD thesis,University of Toronto, 1995.
328
Communication is the key – Support Durable KnowledgeSharing in Software Engineering by Microblogging
Wolfgang ReinhardtUniversity of Paderborn, Institute for Computer Science
Abstract: Communication is undoubtedly one of the key elements of successful soft-ware development. Especially in larger groups communication is the critical point ingathering and forming relevant information, share knowledge and create functioningproducts. Some studies stressed out the fact that informal, ad hoc communicationtake up a significant part of the developers working time. Nonetheless the support ofinter-project and inter-organisational communication seems to play a minor part in thedevelopment of IDEs and software development platforms. In this paper we discusscommunication and knowledge sharing in software engineering and introduce an ap-proach to support social software engineering by microblogging. This approach is tobe studied in future projects.
1 Introduction
People and their interactions are the new topic of interest in the past few years. Softwaredevelopers are embedded in a social framework of colleagues, projects and organisationsand produce many types of artefacts for a broad spectrum of people. Beside of the variousneeded working appliances, communication is undoubtedly a critical point in the processof software engineering especially those in groups. Communication plays an importantrole in gathering and forming of all relevant information, dependences and users needsand wishes (Cherry and Robbilard, 2004; Seaman, 1996). Several studies stressed thefact, that informal ad hoc communications are a very important part of the overall commu-nication in a software engineering team. These ad hoc activities are defined as interactionsforming a logical communicative unit containing one or more sequences with obvious in-ternal continuousness, while remaining unattached from the ambient process (Cherry andRobillard, 2008).
Even though these ad-hoc conversations represent an important part of the daily work of adeveloper they are rarely or even not supported by the instruments available for support-ing software development processes. On the other side, spoken communication or thosevia other chat tools are mostly fleeting and therefore not useful for a durable process ofknowledge sharing and further development. Within the last two years a novel mode ofcommunication emerged with microblogging, which could also be advantageous for theuse in distributed and co-located software teams as it can be saved persistently and isfurther kept out of restrictions of formal communication. In the meantime, there are mul-tiple open source microblogging applications available (cf. THWS, 2008), which can be
329
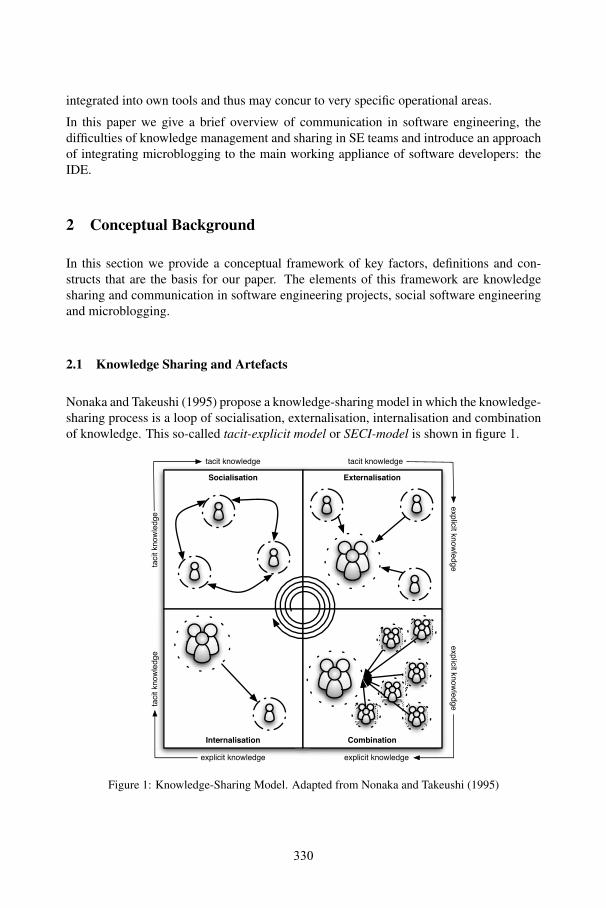
330
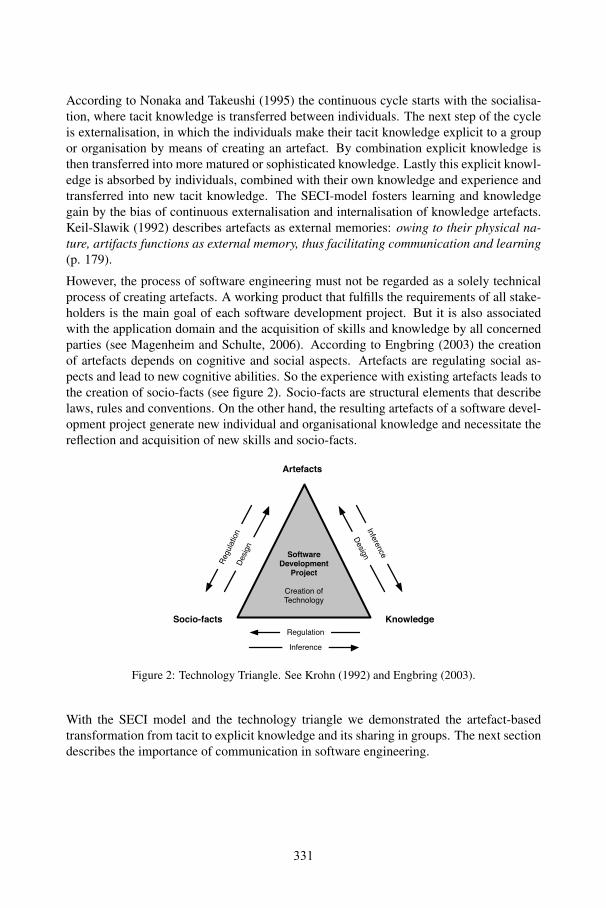
According to Nonaka and Takeushi (1995) the continuous cycle starts with the socialisa-tion, where tacit knowledge is transferred between individuals. The next step of the cycleis externalisation, in which the individuals make their tacit knowledge explicit to a groupor organisation by means of creating an artefact. By combination explicit knowledge isthen transferred into more matured or sophisticated knowledge. Lastly this explicit knowl-edge is absorbed by individuals, combined with their own knowledge and experience andtransferred into new tacit knowledge. The SECI-model fosters learning and knowledgegain by the bias of continuous externalisation and internalisation of knowledge artefacts.Keil-Slawik (1992) describes artefacts as external memories: owing to their physical na-ture, artifacts functions as external memory, thus facilitating communication and learning(p. 179).
However, the process of software engineering must not be regarded as a solely technicalprocess of creating artefacts. A working product that fulfills the requirements of all stake-holders is the main goal of each software development project. But it is also associatedwith the application domain and the acquisition of skills and knowledge by all concernedparties (see Magenheim and Schulte, 2006). According to Engbring (2003) the creationof artefacts depends on cognitive and social aspects. Artefacts are regulating social as-pects and lead to new cognitive abilities. So the experience with existing artefacts leads tothe creation of socio-facts (see figure 2). Socio-facts are structural elements that describelaws, rules and conventions. On the other hand, the resulting artefacts of a software devel-opment project generate new individual and organisational knowledge and necessitate thereflection and acquisition of new skills and socio-facts.
SoftwareDevelopment
Project
Creation ofTechnology
Artefacts
Socio-facts Knowledge
Regulation
Inference
Regulation
Design
Inference
Design
Figure 2: Technology Triangle. See Krohn (1992) and Engbring (2003).
With the SECI model and the technology triangle we demonstrated the artefact-basedtransformation from tacit to explicit knowledge and its sharing in groups. The next sectiondescribes the importance of communication in software engineering.
331
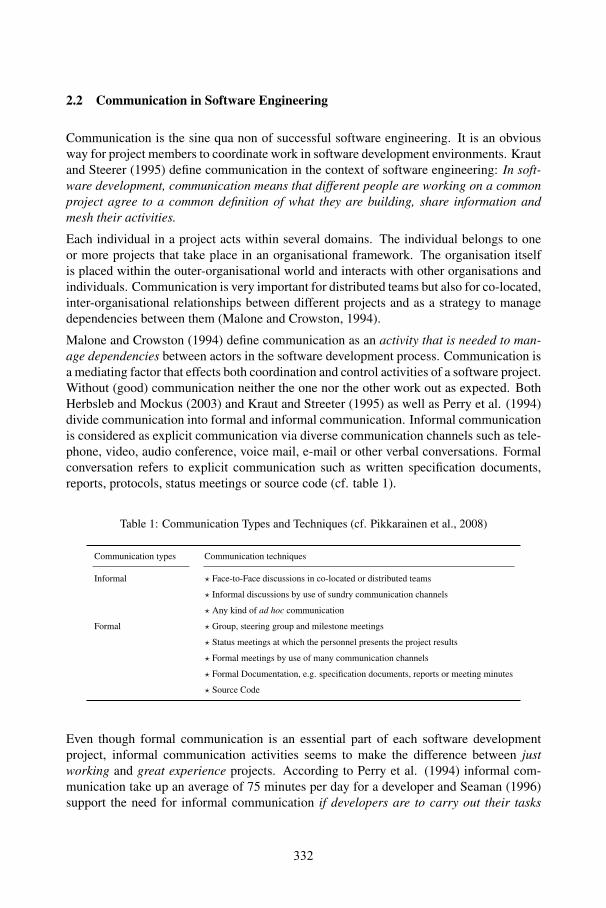
2.2 Communication in Software Engineering
Communication is the sine qua non of successful software engineering. It is an obviousway for project members to coordinate work in software development environments. Krautand Steerer (1995) define communication in the context of software engineering: In soft-ware development, communication means that different people are working on a commonproject agree to a common definition of what they are building, share information andmesh their activities.
Each individual in a project acts within several domains. The individual belongs to oneor more projects that take place in an organisational framework. The organisation itselfis placed within the outer-organisational world and interacts with other organisations andindividuals. Communication is very important for distributed teams but also for co-located,inter-organisational relationships between different projects and as a strategy to managedependencies between them (Malone and Crowston, 1994).
Malone and Crowston (1994) define communication as an activity that is needed to man-age dependencies between actors in the software development process. Communication isa mediating factor that effects both coordination and control activities of a software project.Without (good) communication neither the one nor the other work out as expected. BothHerbsleb and Mockus (2003) and Kraut and Streeter (1995) as well as Perry et al. (1994)divide communication into formal and informal communication. Informal communicationis considered as explicit communication via diverse communication channels such as tele-phone, video, audio conference, voice mail, e-mail or other verbal conversations. Formalconversation refers to explicit communication such as written specification documents,reports, protocols, status meetings or source code (cf. table 1).
Table 1: Communication Types and Techniques (cf. Pikkarainen et al., 2008)
Communication types Communication techniques
Informal % Face-to-Face discussions in co-located or distributed teams
% Informal discussions by use of sundry communication channels
% Any kind of ad hoc communication
Formal % Group, steering group and milestone meetings
% Status meetings at which the personnel presents the project results
% Formal meetings by use of many communication channels
% Formal Documentation, e.g. specification documents, reports or meeting minutes
% Source Code
Even though formal communication is an essential part of each software developmentproject, informal communication activities seems to make the difference between justworking and great experience projects. According to Perry et al. (1994) informal com-munication take up an average of 75 minutes per day for a developer and Seaman (1996)support the need for informal communication if developers are to carry out their tasks
332
adequately.
Robillard and Robillard (2000) point out in their study that collaborative ad hoc activi-ties can take up to 41% of the developers time. These ad hoc activities are defined asinteractions forming a logical communicative unit containing one or more sequences withobvious internal continuousness, while remaining unattached from the ambient process(Cherry and Robillard, 2008). Ad hoc communications arises when one team memberspontaneously interrupts a team-mate to ask him a question or to provide unsolicited in-formation (p. 495).
Usually, regular face-to-face communication is considered one of the best ways to spreadknowledge and build trust in a team. For co-located teams productivity seems to rise, ifworking in the same room (Espinosa and Carmel, 2003). This is because the co-locationfosters collaboration by allowing continuous interactive communication. Software qualityrises when two team members team up and collaborate in the agile software practice ofpair programming (cf. Reinhardt, 2006). New communication channels in software en-gineering should try to impose the feeling of a common working room. This impressionbolsters the nonchalant, formal and informal use of the communication channel. Herbsleband Mockus (2003) call this effect the virtual 30 meters.
2.3 Microblogging
Microblogging is the latest form of blogging where messages are typically not longer than140 characters. Templeton (2008) defines microblogging as a small scale form of blogging,generally made up of short, succinct messages, used by both consumers and businesses toshare news, post status updates and carry on conversations. These micro-messages can berestricted to a certain number of individuals, sent exclusively to a specific contact, or madeavailable to the World Wide Web. Microblogging has impressively become more and morepopular in the last two years, and Twitter1 is probably the most well-known microbloggingplatform currently available on the web, when compared with other microblogging tools,such as Plurk2, Jaiku3 and Pownce4 or the Open Source Tool Identica5 (Java et al., 2007).While regular weblogs are mainly used for writing short essays, knowledge saving anddiscourse, microblogging is proving extremely useful for the fast exchanges of thoughts,ideas and information sharing (Ebner and Schiefner, 2008). With the Open Source appli-cation Laconica6, there is an alternative to Twitter that is usable on own servers and in owneducational and professional settings. In the last year we have witnessed the use of suchapproach as a powerful component of one’s networking activity, and more importantlyseems to become a relevant part of one’s informal learning.
Another interesting part of microblogging is the possibility of hashtagging one’s micro-
1http://twitter.com2http://www.plurk.com3http://www.jaiku.com4http://pownce.com5http://identi.ca6http://laconi.ca
333
posts. The use of hashtags is extremely useful when sharing and contributing to a specifictopic, event or project. Hashtags are a simple way of grouping messages together with a# sign followed by a tag. With the aid of this hashtag all messages with the same hashtagcan be aggregated and regarded in a larger context.
2.4 Social Software Engineering
The term Social Software Engineering can be read by two different means, which coverdifferent fields of software development. If we emphasize the first two words, thus wehave [Social Software] Engineering – the process of drafting and creating social softwareapplications. But if we particularly have a look at the last two words Social [SoftwareEngineering], then we talk about social, non-technical aspects of the software developmentprocess.
[Social Software] Engineering characterizes the implementation of so called Social Soft-ware. The term does not focus on the engineering process as such, but the developedsocial software. Thus questions like which types of social software do exist and how dothe engineering process of them differ? are in the focus of research. Furthermore [SocialSoftware] Engineering deals with the problem how social software can be integrated inthe IT landscape in enterprises (Enterprise 2.0) and how introductory processes and themanagement of social software distinguishes from those of non-social software.
Social [Software Engineering] mainly considers social, non-technical aspects of develop-ing software. At this point we need to ask which parts of the everyday work of a softwareengineer can be described as social relevant. Communication, collaboration and informa-tion exchange are in centre of Social [Software Engineering] research – typical results arevisualisations of communication flows and social networks. On the other hand motiva-tional aspects and incentives belong to the second understand of the term.
3 Tools to support the Software Development Process
The everyday work of a software engineer is nowadays shaped by a multitude of instru-ments. The most principle one is the integrated development environment (IDE), where-with the most important artefacts – the source code – are created. An IDE is a piece ofsoftware that provides comprehensive functionalities to support software developers. AnIDE usually consists of a source code editor, an integrated compiler, automatic build toolsand a code debugger. IDEs are designed to maximize the productivity of a developer,because of the highly integrated build tools. Because of its complexity it takes long tounderstand all facets of an IDE and the high productivity only comes after a long time ofworking with it. IDEs are strongly put in the centre of focus in regards of process andworking tools optimization during the last years, so that they already contain importantfeatures of software quality assurance as well as of monitoring. Besides the IDE the de-veloper also operates with a word processor composing documents, reports and meeting
334
minutes. Additionally, he uses a browser for information searches as well as for use ofweb-based supporting instruments such as wikis or issue trackers. Furthermore, he actswith an e-mail-client and various instruments of digital communication. According to theproject type and structure and the organisational size the multitude of instruments often isextended by applications for software configuration management (SCM) and applicationlifecycle management (ALM).
As Pressman (2004) states SCM is a set of activities designed to control change by identi-fying the work products that are likely to change, establishing relationships among them,defining mechanisms for managing different versions of these work products, controllingthe changes imposed, and auditing and reporting on the changes made. So SCM is thetask of tracking and controlling all changes in a software product. Among the practices ofSCM are version control and the definition of milestones. ALM is the chaining of busi-ness management to software engineering enabled by tools that facilitate and integrate re-quirements management, architecture, coding, testing, tracking, and release management.(deJong, 2008)
None of the known instruments supports the process of social [software engineering] ad-equately. They all concentrate strongly on the procedural and organisational assistance ofthe software development process and provide support to the developer primarily in for-mal communication, the processing of tasks and the solution of problems. The support ofprocess-oriented interactions between the team members as well as the technical supportof informal communication does not happen in most cases. From our point of view, bothplatforms for SCM as well as for ALM applications should become more social applica-tions and further enhance the interpersonal communication, ad hoc chats and the exchangeof experiences. For us microblogging is a slight approach to realise a first social feature(the fast informal broadcast communication). In a consequent development of a socialsoftware configuration management platform (SSCMP) further efficient phenomenon ofthe web 2.0 should be integrated including expert finding, tagging, social bookmarking,etc.
4 Support communication of software engineering teams by micro-blogging
As mentioned earlier ad hoc communication constitutes a main part of the daily work ofa software developer. Common organisations run multiple projects with different tasksat the same time, which interface each other. To strengthen the inter- and intra-project-communication, we propose to implement microblogging within software engineering.Perry et al. (1994) and Cherry and Robbilard (2004) point out that many intra-projectissues are solved by spontaneous ad hoc communication of the project members. Thisproblem solving potential also exists in inter-project settings. When members of differentprojects meet, they discuss problems, solutions and best practices from their projects. Thisinformation reaches a wider organisational public and thus contribute to knowledge acqui-sition and learning. Nevertheless these spoken communications are problematical, since
335
the information exchanged are fleeting. As long as the communication is not recorded,transcribed or save in any other kind of persistent artefact, the information cannot be usedin other setting, from other individuals or groups.
Many software development teams use instant messengers to quickly exchange thoughts,information and shouts for help. These messages as well are not usable during a down-stream information search. As long as the content of the chat is not externalised in someway7 and made explicit, the knowledge is unusable for the working and learning process.Individual and organisational knowledge development is very tight coupled to this cycleof tacit-to-explicit-to-tacit knowledge sharing. The SECI model of Nonaka and Takeushi(1995) as well as the technology triangle (Krohn, 1992 and Engbring, 2003) show thatknowledge acquisition is mainly based on externalised artefacts. Only these seizable in-formation objects allow the individual and organisational knowledge development to takeplace (cf. Keil-Slawik, 1992). Each microblogging service provider saves all the sentmessages persistently. Each message stays accessible until the sender decides to deleteit8 and thus can be accessed from any person in the senders network. If we assume thatevery developer is mutual connected to each other developer in an organisation, each ofthe messages can durable be searched for hints, solutions or experts.
4.1 A Prototype for Microblogging from the IDE
Eclipse9 is one of the frequently used integrated development environments (IDE) in con-temporary software development projects. Because of this, and the ease of extending theplatform with own plugins via the plug-in architecture we choose Eclipse for developing amicroblogging plugin. Figure 3 shows the first prototype of an Eclipse Twitter client.
The prototype has been created based on the Eclipse Rich Client Platform (RCP) andintegrates itself seamless in the user interface of the IDE. The credentials for the Twitteraccount are once saved in the Eclipse system preferences for each developer. The plugincreates a specific view in Eclipse with which messages via Twitter can be send. The pluginuses the API provided by Twitter to send messages. Because of the seamless integrationof the IDE the developer does not need to leave his working environment for sendingmessages but is able to directly continue on his coding work. Due to the flexible use ofhashtags in Twitter messages the developer can easily change the context (and thus therecipients) of his message.
7There are many ways to externalise the content of such a quick chat: one of the concerned team memberscould write an e-mail, a report, or just a source code comment.
8Maybe it is a good idea to store all messages redundantly to counter vandalism or accidental deletes. Ofcourse this one is a very critical point due to data privacy and personality rights.
9http:www.eclipse.org
336
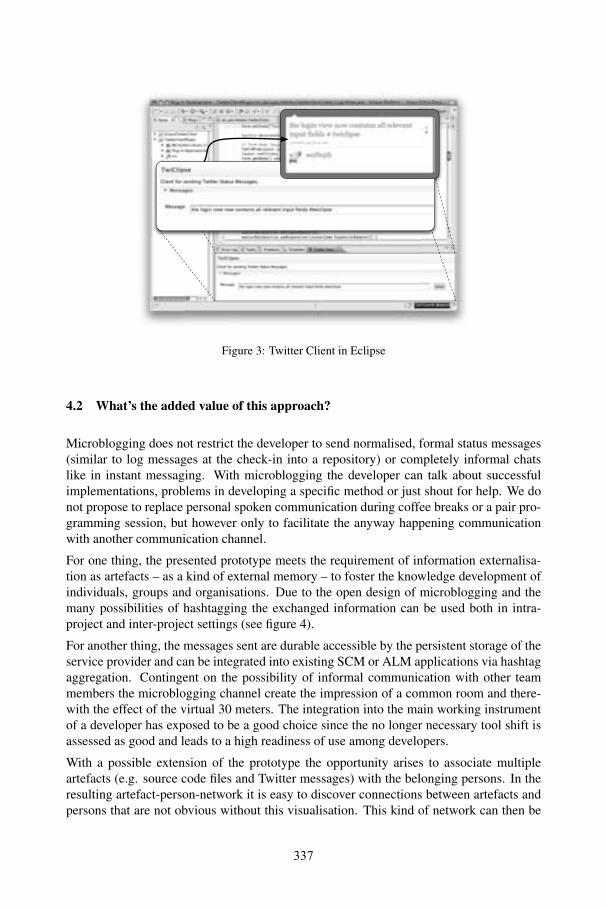
337
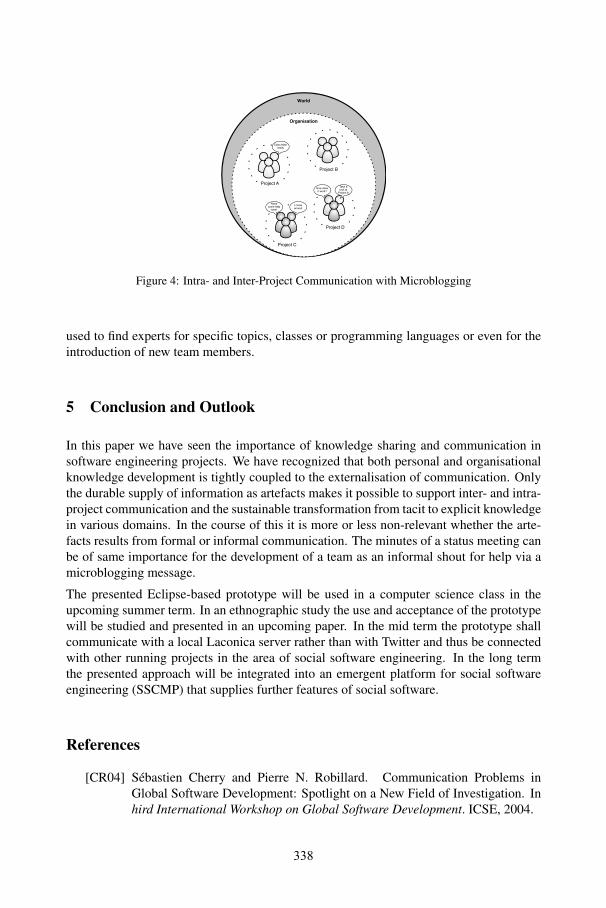
338
[CR08] Sébastien Cherry and Pierre N. Robillard. The social side of softwareengineering–A real ad hoc collaboration network. International Journal ofHuman-Computer Studies, 66(7):495 – 505, 2008. Collaborative and socialaspects of software development.
[deJ08] Jennifer deJong. Mea culpa, ALM toolmakers say. http://www.sdtimes.com/content/article.aspx?ArticleID=31952,April 2008.
[EC03] J. Alberto Espinosa and Erran Carmel. The impact of time separation oncoordination in global software teams: a conceptual foundation. SoftwareProcess: Improvement and Practice, 8, 2003.
[Eng03] Dieter Engbring. Informatik im Herstellungs- und Nutzungskontext. PhDthesis, University of Paderborn, 2003.
[ES08] Martin Ebner and Mandy Schiefner. Microblogging - more than fun? InProceedings of the IADIS Mobile Learning Conference, pages 155–159, 2008.
[GC05] Tim Goles and Wynne W. Chin. Information systems outsourcing relationshipfactors: detailed conceptualization and initial evidence. SIGMIS Database,36(4):47–67, 2005.
[GR08] Judith Good and Pablo Romero. Collaborative and social aspects of softwaredevelopment. International Journal of Human-Computer Studies, 66(7):481– 483, 2008. Collaborative and social aspects of software development.
[HM03] J.D. Herbsleb and A. Mockus. An empirical study of speed and communi-cation in globally distributed software development. Software Engineering,IEEE Transactions on, 29(6):481–494, June 2003.
[JMT05] Michael John, Frank Maurer, and Bjørnar Tessem. Human and social factorsof software engineering: workshop summary. SIGSOFT Softw. Eng. Notes,30(4):1–6, 2005.
[JSFT07] Akshay Java, Xiaodan Song, Tim Finin, and Belle Tseng. Why We Twitter:Understanding Microblogging Usage and Communities. In Procedings of theJoint 9th WEBKDD and 1st SNA-KDD Workshop 2007, August 2007.
[Kro92] Wolfgang Krohn. Technik-Kultur-Arbeit, chapter Zum historischen Verständ-nis der Technik, pages 27–34. 1992.
[KS92] Reinhard Keil-Slawik. Software Development and Reality Construction, chap-ter Artifacts in Software Design, pages 168–188. Springer, 1992.
[KS95] Robert E. Kraut and Lynn A. Streeter. Coordination in software development.Commun. ACM, 38(3):69–81, 1995.
[MC94] Thomas W. Malone and Kevin Crowston. The interdisciplinary study of co-ordination. ACM Comput. Surv., 26(1):87–119, 1994.
339
[MS06] Johannes Magenheim and Carsten Schulte. Social, ethical and technical issuesin formatics - An integrated approach. Education and Information Technolo-gies, 11(3-4):319–339, 2006.
[NT95] Ikujiro Nonaka and Hirotaka Takeuchi. The Knowledge Creating Company:How Japanese Companies Create the Dynamics of Innovation. Oxford Uni-versity Press, 1995.
[PHS+08] M. Pikkarainen, J. Haikara, O. Salo, P. Abrahamsson, and J. Still. The im-pact of agile practices on communication in software development. EmpiricalSoftw. Engg., 13(3):303–337, 2008.
[Pre04] Roger S. Pressman. Software engineering : a practitioner’s approach. Mc-Graw Hill Higher Education, 6 edition, 2004.
[PSV94] Dewayne E. Perry, Nancy Staudenmayer, and Lawrence G. Votta. People,Organizations, and Process Improvement. IEEE Softw., 11(4):36–45, 1994.
[Rei06] Wolfgang Reinhardt. Einfluss agiler Softwareentwicklung auf die Kompeten-zentwicklung in der universitären Informatikausbildung. Analyse und Bewer-tung empirischer Studien zum Pair Programming. Master’s thesis, Universityof Paderborn, 2006.
[RR00] Pierre N. Robillard and Martin P. Robillard. Types of collaborative work insoftware engineering. J. Syst. Softw., 53(3):219–224, 2000.
[Sea96] Carolyn B. Seaman. Organizational Issues in Software Development: An Em-pirical Study of Communication. PhD thesis, University of Maryland, 1996.
[SMB+04] Forrest Shull, Manoel G. Mendoncça, Victor Basili, Jeffrey Carver, José C.Maldonado, Sandra Fabbri, Guilherme Horta Travassos, and Maria CristinaFerreira. Knowledge-Sharing Issues in Experimental Software Engineering.Empirical Software Engineering, 9(1-2):111–137, March 2004.
[SN04] John A. Scott and David Nisse. Guide to Software Engineering Body ofKnowledge, chapter 7: Software configuration management. IEEE ComputerSociety, 2004.
[SR05] Helen Sharp and Hugh Robinson. Some social factors of software engineer-ing: the maverick, community and technical practices. In HSSE ’05: Pro-ceedings of the 2005 workshop on Human and social factors of software en-gineering, pages 1–6, New York, NY, USA, 2005. ACM.
[Tem08] Mike Templeton. Microblogging Defined. http://microblink.com/2008/11/11/microblogging-defined/ (02.12.2008), November2008.
[THW08] THWS. The Twitter-clone/twitter-like sites collection. http://www.thws.cn/articles/twitter-clones.html (02.12.2008), 2008.
340
Improving Knowledge Sharing in Distributed Teams byCapturing and Recommending Informal Knowledge1
Hans-Jörg Happel
FZI Forschungszentrum InformatikKarlsruhe, Germany
Walid Maalej
Technische Universität MünchenMunich, Germany
Due to an increasingly distributed workforce, teams are often separated by or-ganizational, geographical or temporal boundaries, which cause substantial col-laboration and knowledge exchange problems. Accordingly, tool-support forcollaboration and knowledge sharing is particularly important for distributedteams. In this paper, we discuss how knowledge exchange in the domain ofsoftware development can be improved by capturing informal knowledge andrecommending to share or access it.
1 Introduction
The development and maintenance of large and complex systems, which exceed theabilities of a single human worker, led to the concept of division of labor: decompos-ing a system into smaller modules creates manageable units of work. Decompositionintroduces dependencies among the modules and thus requires coordination to createan integrated system in the end. Since an increasing number of projects are carried outin a distributed fashion, an effective and efficient coordination and knowledge sharingis considered a major success factor for such organizations [Cum04, Han99].In this paper, we introduce our position on how to improve knowledge sharing indistributed teams. First we characterize coordination and knowledge sharing in distri-buted work settings. Then we discuss means for supporting knowledge sharing in acollaborative software development environment.
2 Coordination and knowledge sharing in distributed teams
Distributed work has become popular in recent years due to several reasons such ascost reduction, availability of human resources or intra-organizational collaboration[Ols00]. The modularization of complex artifacts is thus often mirrored by a modula-rization of the project teams, which produce these artifacts [KM06].
1 This work has been partly supported by the TEAM project, which is funded the EU-IST pro-gram under grant FP6-35111 and the BMBF-funded project WAVES.
341
Many distributed and outsourced projects suffer from coordination problems since theoverall coordination capacity is lower due to a reduced communication bandwidth[Ols00]. Since distributed teams are less efficient than collocated ones, collaborationresearch is focusing on tool-support for creating “virtual 30 meters” [HM03]. Corechallenges in realizing these virtual 30 meters are coordination and knowledge shar-ing among the team members.The need for coordination stems from the modularity of the artifacts under develop-ment. The decomposition of artifacts creates dependencies, which require coordina-tion. Coordination can thus be defined as “the process of managing dependenciesbetween activities” [MC94]. Accordingly, most coordination requirements can betraced back to explicit dependencies among the subsystems of artifacts. Coordinationissues are central to collaboration research, which e.g. analyzes suitable coordinationmechanisms for different kinds of dependencies [Tho67] and tools for supportingcommunication, awareness and workflow management.While coordination problems in distributed settings are understood and supported in aconsiderable way, we argue that further support for knowledge sharing is required.Knowledge sharing can be defined as the ”dual problem of searching for (looking forand identifying) and transferring (moving and incorporating) knowledge across orga-nizational subunits” [Han99].In contrast to coordination, knowledge sharing is not directly rooted in explicit de-pendencies of technical artifacts, but in dependencies among organizational entities.The modularity of the organizational subsystem has a deep impact on the communica-tion patterns of an organization since it forms channels and filters along organization-al interfaces, to reduce complexity by selecting relevant information [HC90]. Howev-er, this has negative impact on knowledge sharing across organizational units, sincethe average information flow runs dry with increasing organizational or geographicaldistance. Additionally, distributed work settings amplify barriers for knowledge shar-ing such as reduced motivation and trust [CC02, Des03]. The allocation of knowledgecan thus be inefficient when collaboratively developing a system in a distributed or-ganization.
3 Supporting knowledge sharing in distributed software teams
Due to the popularity of Open Source and offshoring development models, softwaredevelopment is one of the most distributed and knowledge intensive businesses, inwhich people with different backgrounds and expertise levels collaborate. The crucialimpact of coordination on the efficiency of software development projects is well-known [Ols00] and empirical studies have shown that technically driven design deci-sions influence coordination and knowledge sharing in development teams, which canin turn decrease productivity [HM03].While collaboration support gets increasingly integrated into software developmenttools [CS+04], the exchange of knowledge and expertise in development teams re-mains largely unsupported beyond basic communication and document sharing tools.Most work on knowledge support is focused on supporting knowledge access. Exam-ples are systems like Hipikat [CSB05] that help developers to access reusable know-
342
ledge artifacts such as documents or source code. However, these approaches assumean existing repository of knowledge artifacts and do not discuss how these reposito-ries are built and maintained. The Experience Factory [BCR94] (EF) describes aframework for building repositories of reusable knowledge. However, an EF requirescostly knowledge extraction and refinement processes to create high-quality reusableassets, as well as centralized organizational responsibility in order to maintain theknowledge repository.Finally, the mentioned approaches fail to support sharing of small pieces of expe-rience, which are usually exchanged during informal communication in collocatedsettings. For example, during a coffee break, team members share activities they havecarried out to resolve a certain bug, lessons learned on configuring a particular com-ponent before reusing it, the name of an expert on a particular technology, or a know-ledge source such as a Web site to answer development questions.A notable approach in the direction of sharing such small pieces of informal know-ledge is the mylyn project [KM06], which monitors interactions inside an IDE, whiledevelopers carry out their tasks. Based on these interactions, mylyn computes a relev-ance value for artifacts in a given task and hides or blurs them in the user interfacewhen they are deemed not relevant for the current task. This approach is called “Task-Focused User Interface”. Mylyn is implemented as a plug-in for the Eclipse IntegratedDevelopment Environment (IDE) and allows sharing the gathered information withother developers.
We envision an advanced approach to support knowledge sharing in distributed soft-ware teams. It is based on the following assumptions:
• A lot of useful information and pieces of experiences are implicit and notformally captured by the developers, in form of documentation.
• Developers have private explicit knowledge, which is not shared with colla-borators (especially in distributed work settings).
We aim to support both the capturing of implicit knowledge and the diffusion of ex-isting private knowledge in distributed software development teams. Basic enablersfor our approach are the observation of developer’s activities and the exchange ofsuch data among the developers in a team. Observation leads in particular to sessio-nizing the developer’s workday into problem-solution cycles, recognizing problemsituations (such as information needs or program errors) and capturing informationaccessed to solve such problems. In our prototypical implementation, this is realizedby a context observation framework, which records developer’s interactions with histools such as the IDE, the web browser and the collaboration and communicationtools. These interactions are further processed, aggregated and then persisted in anontology-based, distributed metadata infrastructure (c.f. [MH08]).Regarding the diffusion of existing knowledge, we aim to incentivize developers toshare knowledge, by recommending not only the information to share but also otherteam members to whom such information is valuable. Therefore, our approach ana-lyzes the overall information behavior within the working group, mainly based onquery logs (c.f. [Hap08]). Query logs are also used to identify sought information,which is not yet available for a team. Complemented by context observation data, we
343
are able to find out developers with expertise on a certain topic. We then recommendthem to capture particular information. As an example, developers fixing a bug willbe asked to document their solution, if the system knows that other collaboratingdevelopers faced the same or similar issues.
4 Conclusion
In this paper, we described the problem of coordination and knowledge sharing indistributed teams, and argued that existing work focuses on coordination, while know-ledge sharing is still neglected – especially in software development. Based on this,we discussed existing work in collaborative software development and sketched ourapproach for fostering knowledge sharing and capture. Capturing and formalizingsmall pieces of developers’ experiences, as well as recommending to sharing privateinformation to other colleagues who need it are the mail enablers. We are currentlyworking on the implementation and evaluation on these concepts in several projects.
5 Literature
[BCR94] Victor R. Basili, Gianluigi Caldiera, and H. Dieter Rombach. Experience Factory. InJohn J. Marciniak (ed.), Encyclopedia of Software Engineering, John Wiley & Sons,1994.
[CC02] Angel Cabrera and Elizabeth F. Cabrera. Knowledge-sharing dilemmas. OrganizationStudies, 23:687–710, 2002.
[CD+04] Li-Te Cheng, Cleidson R.B. de Souza, Susanne Hupfer, John Patterson, and StevenRoss. Building collaboration into IDEs. Queue, 1(9):40–50, 2004.
[CSB05] Davor Cubranic, Janice Singer, and Kellogg S. Booth. Hipikat: A project memory forsoftware development. IEEE Trans. Softw. Eng., 31(6):446–465, 2005.
[Cum04] Jonathan N. Cummings. Work groups, structural diversity, and knowledge sharing.Management Science, 50(3):352–364, 2004.
[Des03] Kevin C. Desouza. Barriers to effective use of knowledge management systems insoftware engineering. Commun. ACM, 46(1):99–101, 2003.
[Han99] Hansen, M.T.: The search-transfer problem: The role of weak ties in sharing know-ledge across organization subunits. Administrative Science Quarterly, 44:82–111,1999.
[Hap08] Hans-Jörg Happel: Closing information gaps with inverse search. In 7th InternationalConference on Practical Aspects of Knowledge Management, LNCS. Springer, 2008.
[HC90] Henderson, Rebecca M.; Clark, Kim B.: Architectural innovation: the reconfigurationof existing product technologies and the failure of established firms. In: Administra-tive Science Quarterly 35 (1990), p. 9-30.
[HM03] Herbsleb, James D. ; Mockus, Audris: Formulation and preliminary test of an empiri-cal theory of coordination in software engineering. In: Proceedings of the 9th Euro-pean software engineering conference. ACM Press, 2003, p. 138-137
[KM06] Mik Kersten and Gail C. Murphy. Using task context to improve programmer produc-tivity. In SIGSOFT ’06/FSE-14: Proceedings of the 14th ACM SIGSOFT interna-tional symposium on Foundations of software engineering, p. 1–11, NY, USA, 2006.ACM.
344

[KS95] Kraut, Robert E. ; Streeter, Lynn A.: Coordination in Software Development. In:Commun. ACM 38 (1995), March, No. 3, p. 69-81
[MH08] Walid Maalej, Hans-Jörg Happel: A Lightweight Approach for Knowledge Sharing inDistributed Software Teams. PAKM 2008, LNCS. Springer, 2008
[MC94] Malone, T. W. & Crowston, K.: The interdisciplinary study of coordination. ACMComputing Surveys, 1994 (March), 26 (1), 87-119.
[Ols00] Gary M. Olson and Judith S. Olson. Distance matters. Human-Computer Interaction,15(2/3):139–178, 2000.
[Tho67] Thompson, James D.: Organizations in Action. McGraw-Hill, New York, 1967
345

Annals of Knowledge Sharing in Distributed SoftwareDevelopment Environments: Experience from Open Source
Software Projects
Sulayman K. Sowe, Rishab Ghosh, and Luc Soete
Collaborative Creativity Group, UNUMERIT. Keizer Karelplein, 19, 6211 TCMaastricht, The Netherlands
[email protected], [email protected], [email protected]
Abstract: Empirical research aimed at understanding how individuals interact andshare their knowledge in a distributed software development environment hastraditionally been very difficult because the source of knowledge, the code, hasbeen a guarded secret and software developers and users were seldom in contact,thus making it difficult to study, in situ, all the individuals involved in the softwaredevelopment process. Free/Open Source Software (F/OSS) projects presentsrenewed opportunities, as well as challenges, in understanding collaboration andknowledge sharing amongst software developers and users in distributed softwaredevelopment environments. In this paper, we discuss how developers and usersshare their knowledge and collaborate in the software development process.Knowledge sharing metrics, software repositories, and suitable methodologies forstudying knowledge sharing are presented. The paper aims to stimulate discussion,present our current understanding, and empirical research opportunities andchallenges in knowledge sharing in distributed collective practices F/OSSprojects.
1 Introduction
Free and Open Source Software (henceforth F/OSS) has fundamentally changed the waywe initiate software projects, develop, distribute, and maintain software. For the firsttime, the Bazaar model (Re99) provides software engineers an alternative to theCathedral model or traditional way of developing closed source software. According tothe Cathedral model, software development takes place in a centralized way, with welldefined roles for each software development phase. In the bazaar model, roles are notclearly defined and usually software users are treated as codevelopers. In many projects,developers are also the users of the software they develop. This has a number ofadvantages including; (i) blurring the developeruser communication gap and facilitatingcollaboration between all individuals involved in software development, use, andsupport; (ii) making it easier to study the knowledge sharing activities since projectparticipants are cohabitants of the same project or technology space.
347
However, we posit that every successful Bazaar styled F/OSS project has some elementsof Cathedral style development in it. Some of the differences between the two modelsare in the areas of user involvement, openness and sharing of software source code, highdegree of collaboration between software developers and potential users, informality inthe communities involved in various projects, etc. The vibrant F/OSS developmentprocess only succeeds because many people volunteer their time and effort to share theirknowledge and develop the software. F/OSS projects represent ''Distributed CollectivePractices'' (Tw06) where users are not isolated from direct involvement in thedevelopment process as it unfolds. Every member has access to another member and theproject's resources; increasing the chance for participants to easily interact and sharetheir knowledge. The success of any project highly depends on the quality of interactionbetween all participating agents, because this kind of ‘‘talking to each other’’ is vital forthe cooperation and resolution of any conflicts which may arise and the establishment oftrust among software development teams (SSA07; ES03).
The F/OSS development process facilitates the creation, diffusion, and transformation ofsoftware knowledge at a rate unprecedented in the history of software development. Theprospects for expert software developers and novice users to understand the softwaredevelopment process are now great. The interaction between complex softwareinfrastructures and the sociotechnical aspects of the software can now be studiedwithout organizational barriers. However, our understanding of knowledge sharing in F/OSS projects is challenged by the fact that; (i) coordination and collaboration tools forknowledge sharing can present technological barriers for some users, (ii) individuals oreven infrastructures are often located at large distances from each other, which makesexchanging knowledge facetoface hard, and (iii) the ecology of project's communitiesis such that people with varying needs, knowledge, and skills participate in the softwaredevelopment process.
Notwithstanding these challenges, empirical studies addressing collaboration andknowledge sharing in software development teams are made easy by the availability ofdata in software repositories. Researchers can now understand who is involved, who istalking to whom, what is talked about, and the nature of collaboration in the softwaredevelopment process. Our presentation in this paper leverages this opportunity andmakes uses of mailing lists data to discuss how software development teams collaborateand share their knowledge in F/OSS projects. Our aim is to provide a platform to discussand share current understandings and challenges facing empirical research aimed atunderstanding knowledge sharing, in terms of email exchanges, in open source projects.
348
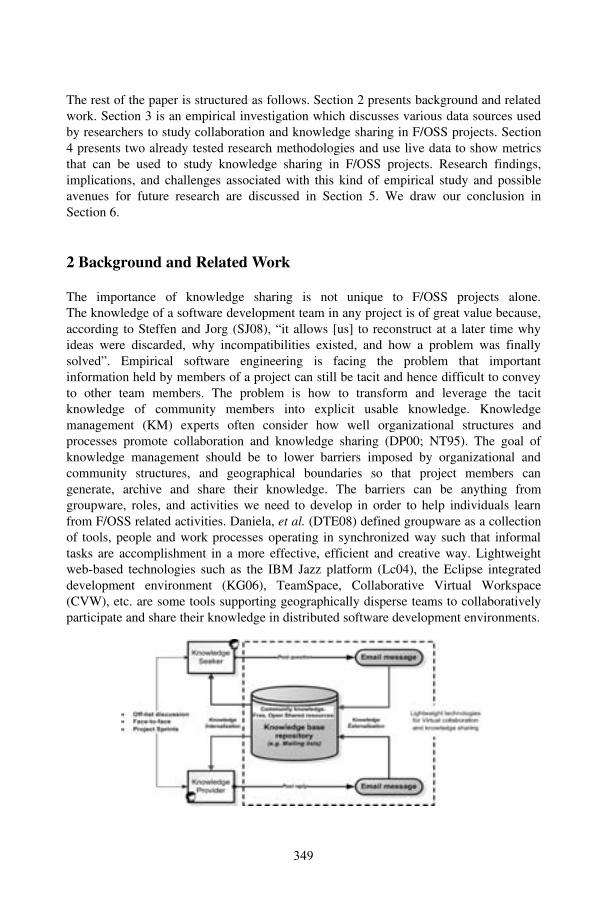
The rest of the paper is structured as follows. Section 2 presents background and relatedwork. Section 3 is an empirical investigation which discusses various data sources usedby researchers to study collaboration and knowledge sharing in F/OSS projects. Section4 presents two already tested research methodologies and use live data to show metricsthat can be used to study knowledge sharing in F/OSS projects. Research findings,implications, and challenges associated with this kind of empirical study and possibleavenues for future research are discussed in Section 5. We draw our conclusion inSection 6.
2 Background and Related Work
The importance of knowledge sharing is not unique to F/OSS projects alone.The knowledge of a software development team in any project is of great value because,according to Steffen and Jorg (SJ08), “it allows [us] to reconstruct at a later time whyideas were discarded, why incompatibilities existed, and how a problem was finallysolved”. Empirical software engineering is facing the problem that importantinformation held by members of a project can still be tacit and hence difficult to conveyto other team members. The problem is how to transform and leverage the tacitknowledge of community members into explicit usable knowledge. Knowledgemanagement (KM) experts often consider how well organizational structures andprocesses promote collaboration and knowledge sharing (DP00; NT95). The goal ofknowledge management should be to lower barriers imposed by organizational andcommunity structures, and geographical boundaries so that project members cangenerate, archive and share their knowledge. The barriers can be anything fromgroupware, roles, and activities we need to develop in order to help individuals learnfrom F/OSS related activities. Daniela, et al. (DTE08) defined groupware as a collectionof tools, people and work processes operating in synchronized way such that informaltasks are accomplishment in a more effective, efficient and creative way. Lightweightwebbased technologies such as the IBM Jazz platform (Lc04), the Eclipse integrateddevelopment environment (KG06), TeamSpace, Collaborative Virtual Workspace(CVW), etc. are some tools supporting geographically disperse teams to collaborativelyparticipate and share their knowledge in distributed software development environments.
349
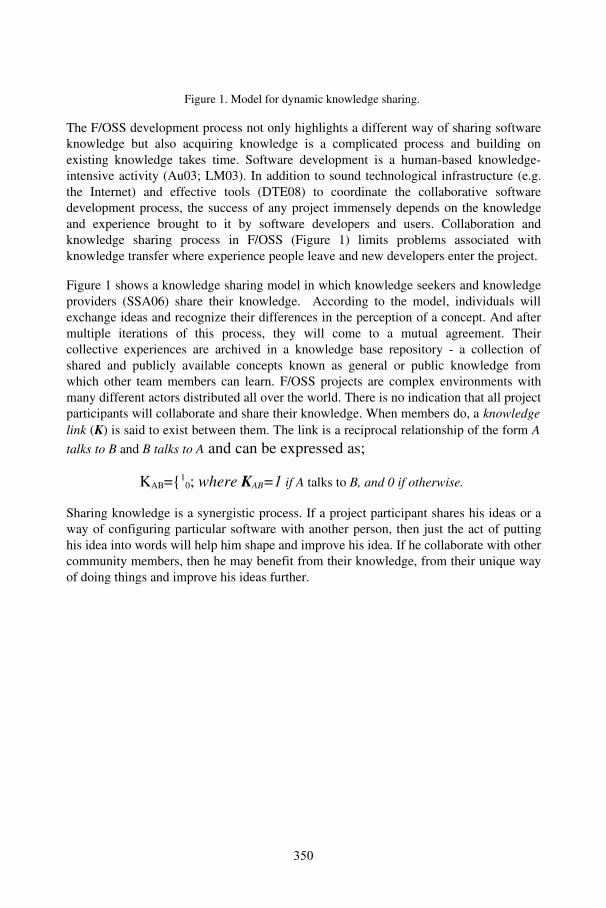
Figure 1. Model for dynamic knowledge sharing.
The F/OSS development process not only highlights a different way of sharing softwareknowledge but also acquiring knowledge is a complicated process and building onexisting knowledge takes time. Software development is a humanbased knowledgeintensive activity (Au03; LM03). In addition to sound technological infrastructure (e.g.the Internet) and effective tools (DTE08) to coordinate the collaborative softwaredevelopment process, the success of any project immensely depends on the knowledgeand experience brought to it by software developers and users. Collaboration andknowledge sharing process in F/OSS (Figure 1) limits problems associated withknowledge transfer where experience people leave and new developers enter the project.
Figure 1 shows a knowledge sharing model in which knowledge seekers and knowledgeproviders (SSA06) share their knowledge. According to the model, individuals willexchange ideas and recognize their differences in the perception of a concept. And aftermultiple iterations of this process, they will come to a mutual agreement. Theircollective experiences are archived in a knowledge base repository a collection ofshared and publicly available concepts known as general or public knowledge fromwhich other team members can learn. F/OSS projects are complex environments withmany different actors distributed all over the world. There is no indication that all projectparticipants will collaborate and share their knowledge. When members do, a knowledgelink (K) is said to exist between them. The link is a reciprocal relationship of the form Atalks to B and B talks to A and can be expressed as;
KAB={10; where KAB=1 if A talks to B, and 0 if otherwise.
Sharing knowledge is a synergistic process. If a project participant shares his ideas or away of configuring particular software with another person, then just the act of puttinghis idea into words will help him shape and improve his idea. If he collaborate with othercommunity members, then he may benefit from their knowledge, from their unique wayof doing things and improve his ideas further.
350
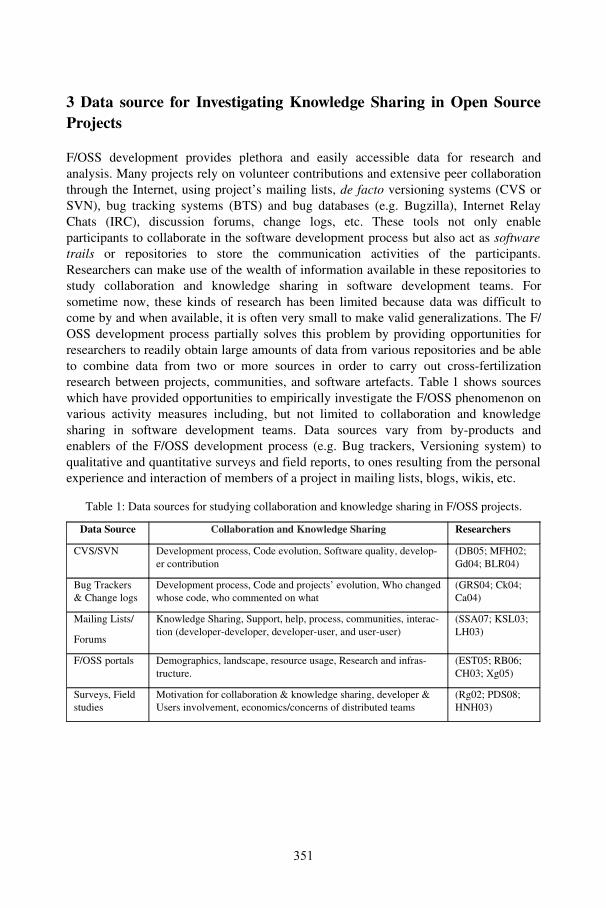
3 Data source for Investigating Knowledge Sharing in Open SourceProjects
F/OSS development provides plethora and easily accessible data for research andanalysis. Many projects rely on volunteer contributions and extensive peer collaborationthrough the Internet, using project’s mailing lists, de facto versioning systems (CVS orSVN), bug tracking systems (BTS) and bug databases (e.g. Bugzilla), Internet RelayChats (IRC), discussion forums, change logs, etc. These tools not only enableparticipants to collaborate in the software development process but also act as softwaretrails or repositories to store the communication activities of the participants.Researchers can make use of the wealth of information available in these repositories tostudy collaboration and knowledge sharing in software development teams. Forsometime now, these kinds of research has been limited because data was difficult tocome by and when available, it is often very small to make valid generalizations. The F/OSS development process partially solves this problem by providing opportunities forresearchers to readily obtain large amounts of data from various repositories and be ableto combine data from two or more sources in order to carry out crossfertilizationresearch between projects, communities, and software artefacts. Table 1 shows sourceswhich have provided opportunities to empirically investigate the F/OSS phenomenon onvarious activity measures including, but not limited to collaboration and knowledgesharing in software development teams. Data sources vary from byproducts andenablers of the F/OSS development process (e.g. Bug trackers, Versioning system) toqualitative and quantitative surveys and field reports, to ones resulting from the personalexperience and interaction of members of a project in mailing lists, blogs, wikis, etc.
Table 1: Data sources for studying collaboration and knowledge sharing in F/OSS projects.
Data Source Collaboration and Knowledge Sharing Researchers
CVS/SVN Development process, Code evolution, Software quality, developer contribution
(DB05; MFH02;Gd04; BLR04)
Bug Trackers& Change logs
Development process, Code and projects’ evolution, Who changedwhose code, who commented on what
(GRS04; Ck04;Ca04)
Mailing Lists/
Forums
Knowledge Sharing, Support, help, process, communities, interaction (developerdeveloper, developeruser, and useruser)
(SSA07; KSL03;LH03)
F/OSS portals Demographics, landscape, resource usage, Research and infrastructure.
(EST05; RB06;CH03; Xg05)
Surveys, Fieldstudies
Motivation for collaboration & knowledge sharing, developer &Users involvement, economics/concerns of distributed teams
(Rg02; PDS08;HNH03)
351
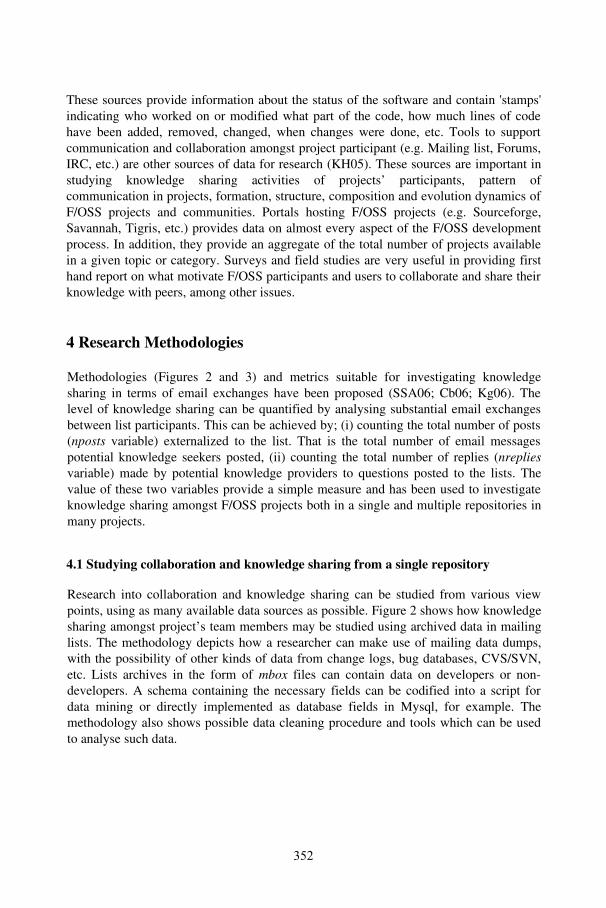
These sources provide information about the status of the software and contain 'stamps'indicating who worked on or modified what part of the code, how much lines of codehave been added, removed, changed, when changes were done, etc. Tools to supportcommunication and collaboration amongst project participant (e.g. Mailing list, Forums,IRC, etc.) are other sources of data for research (KH05). These sources are important instudying knowledge sharing activities of projects’ participants, pattern ofcommunication in projects, formation, structure, composition and evolution dynamics ofF/OSS projects and communities. Portals hosting F/OSS projects (e.g. Sourceforge,Savannah, Tigris, etc.) provides data on almost every aspect of the F/OSS developmentprocess. In addition, they provide an aggregate of the total number of projects availablein a given topic or category. Surveys and field studies are very useful in providing firsthand report on what motivate F/OSS participants and users to collaborate and share theirknowledge with peers, among other issues.
4 Research Methodologies
Methodologies (Figures 2 and 3) and metrics suitable for investigating knowledgesharing in terms of email exchanges have been proposed (SSA06; Cb06; Kg06). Thelevel of knowledge sharing can be quantified by analysing substantial email exchangesbetween list participants. This can be achieved by; (i) counting the total number of posts(nposts variable) externalized to the list. That is the total number of email messagespotential knowledge seekers posted, (ii) counting the total number of replies (nrepliesvariable) made by potential knowledge providers to questions posted to the lists. Thevalue of these two variables provide a simple measure and has been used to investigateknowledge sharing amongst F/OSS projects both in a single and multiple repositories inmany projects.
4.1 Studying collaboration and knowledge sharing from a single repository
Research into collaboration and knowledge sharing can be studied from various viewpoints, using as many available data sources as possible. Figure 2 shows how knowledgesharing amongst project’s team members may be studied using archived data in mailinglists. The methodology depicts how a researcher can make use of mailing data dumps,with the possibility of other kinds of data from change logs, bug databases, CVS/SVN,etc. Lists archives in the form of mbox files can contain data on developers or nondevelopers. A schema containing the necessary fields can be codified into a script fordata mining or directly implemented as database fields in Mysql, for example. Themethodology also shows possible data cleaning procedure and tools which can be usedto analyse such data.
352
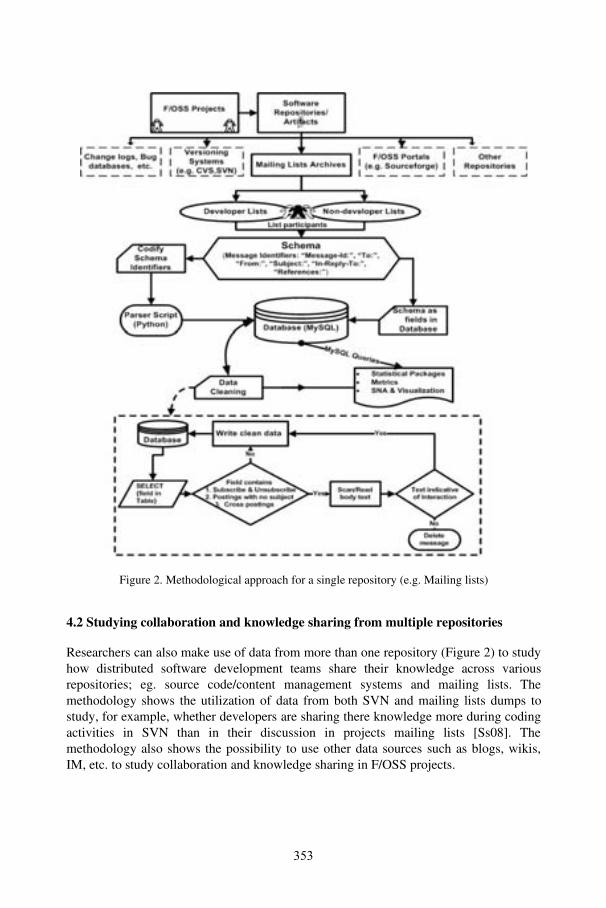
Figure 2. Methodological approach for a single repository (e.g. Mailing lists)
4.2 Studying collaboration and knowledge sharing from multiple repositories
Researchers can also make use of data from more than one repository (Figure 2) to studyhow distributed software development teams share their knowledge across variousrepositories; eg. source code/content management systems and mailing lists. Themethodology shows the utilization of data from both SVN and mailing lists dumps tostudy, for example, whether developers are sharing there knowledge more during codingactivities in SVN than in their discussion in projects mailing lists [Ss08]. Themethodology also shows the possibility to use other data sources such as blogs, wikis,IM, etc. to study collaboration and knowledge sharing in F/OSS projects.
353
Figure 3: Methodological approach for multiple repositories (e.g. SVN and Mailing lists)
5 Findings, Implications and Challenges
Being it single or multiple repositories, trends are beginning to emerge which shed lighton our understanding as to how software development teams collaborate and share theirknowledge in a distributed software developments, aka, F/OSS projects.
5.1 The nature of the collaboration and knowledge sharing
The nature of collaboration in F/OSS projects is skewed in all posting and replyingactivities (figure 4). A small percentage of individuals are responsible for most of theactivities. Cliques of developers, usually the core team, intensively collaborate and sharetheir knowledge amongst themselves to muster and drive the project forward. In fact thisobservation holds for almost all kinds of collaborative activities on the internet, givingrise to the powerlaw distribution (SSA07, Kg06).
354
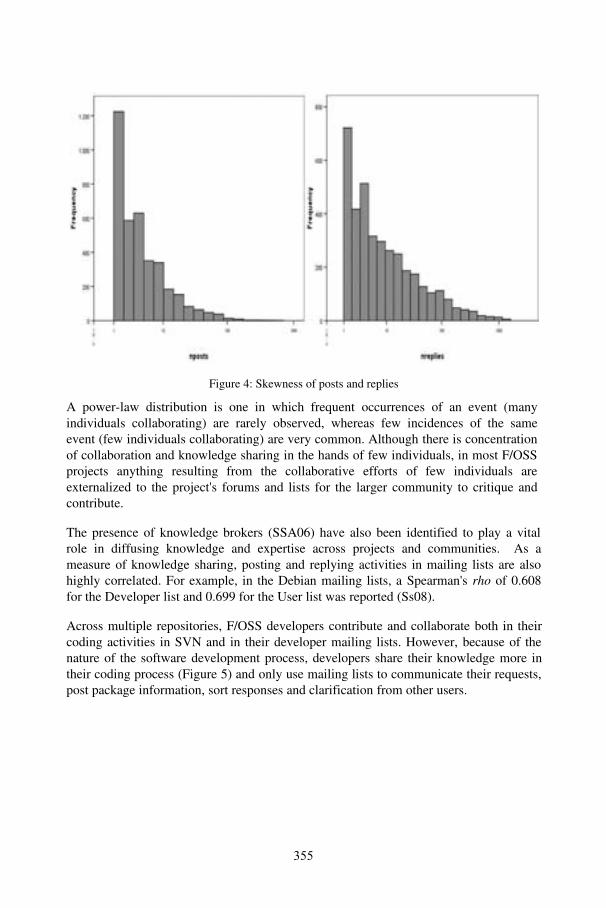
Figure 4: Skewness of posts and replies
A powerlaw distribution is one in which frequent occurrences of an event (manyindividuals collaborating) are rarely observed, whereas few incidences of the sameevent (few individuals collaborating) are very common. Although there is concentrationof collaboration and knowledge sharing in the hands of few individuals, in most F/OSSprojects anything resulting from the collaborative efforts of few individuals areexternalized to the project's forums and lists for the larger community to critique andcontribute.
The presence of knowledge brokers (SSA06) have also been identified to play a vitalrole in diffusing knowledge and expertise across projects and communities. As ameasure of knowledge sharing, posting and replying activities in mailing lists are alsohighly correlated. For example, in the Debian mailing lists, a Spearman's rho of 0.608for the Developer list and 0.699 for the User list was reported (Ss08).
Across multiple repositories, F/OSS developers contribute and collaborate both in theircoding activities in SVN and in their developer mailing lists. However, because of thenature of the software development process, developers share their knowledge more intheir coding process (Figure 5) and only use mailing lists to communicate their requests,post package information, sort responses and clarification from other users.
355
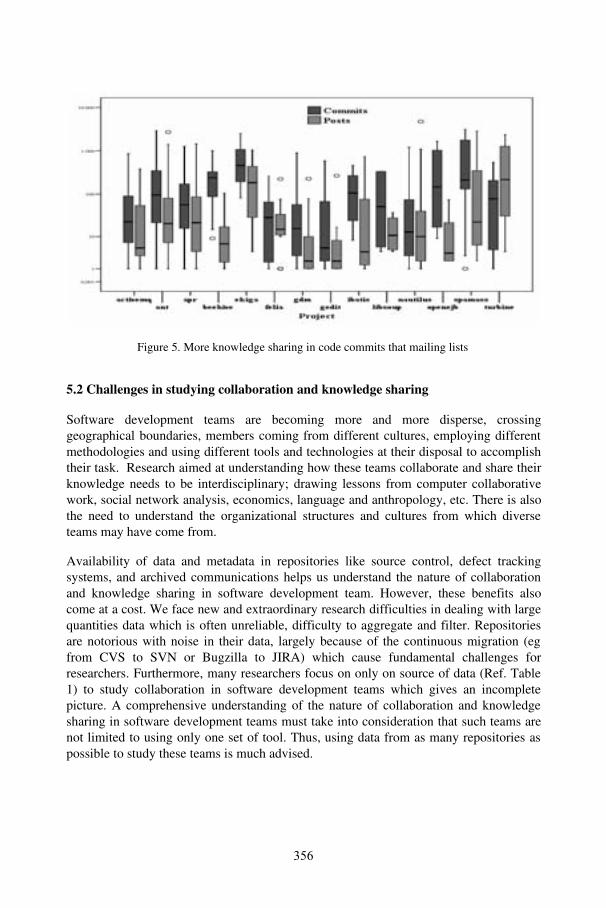
Figure 5. More knowledge sharing in code commits that mailing lists
5.2 Challenges in studying collaboration and knowledge sharing
Software development teams are becoming more and more disperse, crossinggeographical boundaries, members coming from different cultures, employing differentmethodologies and using different tools and technologies at their disposal to accomplishtheir task. Research aimed at understanding how these teams collaborate and share theirknowledge needs to be interdisciplinary; drawing lessons from computer collaborativework, social network analysis, economics, language and anthropology, etc. There is alsothe need to understand the organizational structures and cultures from which diverseteams may have come from.
Availability of data and metadata in repositories like source control, defect trackingsystems, and archived communications helps us understand the nature of collaborationand knowledge sharing in software development team. However, these benefits alsocome at a cost. We face new and extraordinary research difficulties in dealing with largequantities data which is often unreliable, difficulty to aggregate and filter. Repositoriesare notorious with noise in their data, largely because of the continuous migration (egfrom CVS to SVN or Bugzilla to JIRA) which cause fundamental challenges forresearchers. Furthermore, many researchers focus on only on source of data (Ref. Table1) to study collaboration in software development teams which gives an incompletepicture. A comprehensive understanding of the nature of collaboration and knowledgesharing in software development teams must take into consideration that such teams arenot limited to using only one set of tool. Thus, using data from as many repositories aspossible to study these teams is much advised.
356
Current tools allow software development teams to rollback changes, track and recordsource code and commits history, set continuous integration of builds, see which featuresare being built, tested, approved, bugsome, etc. However, in order to foster collaborationand knowledge sharing in software development teams, it is vital that these tools, sourcecontrol and bug trackers in particular, start integrating ontology based folksonomics,tagging, semantic web, and social networks technologies in their design architecture.These may enable team members “see” who is who, who can and should do what, andwhen a certain task should be done and completed.
6 Conclusion
In this paper we have compiled our experience in F/OSS to discuss the dynamics ofcollaboration and knowledge sharing is distributed software development teams. Aknowledge sharing model was introduced to develop understanding of the dynamics ofknowledge sharing in F/OSS projects. Our empirical investigation discusses various datasources and metrics used by researchers to study collaboration and knowledge sharing.We presented two research methodologies and used data to discuss the nature ofknowledge sharing in F/OSS project.
We have argued that software development teams are diverse and complex. Some of thepoints we raised in this paper may be very important in helping define the researchagenda aimed at comprehensive understanding of collaboration and knowledge insoftware development teams; (i) diversify and enrich research by studying these teamsfrom many types of repositories, (ii) draw lessons from many fields includingeconomics, sociology, CSWC, etc., (iii) improve design architecture of collaboration andknowledge sharing tools by incorporating semantic web, social software, social networkstechnologies, and (iv) researchers to start investigating how software development teamscollaborate in other mundane tools, which are playing and increasing role in the daytoday communication between members; IRC, IM, blogs, Wikis.
Acknowledgement
This research is partly funded by the FLOSSMetrics (http://flossmetrics.org/), FP6 Project ID:IST5033547.
Reference:
[Au03] Aurum, A.; Jeffery, R.; Wohlin, C.; Handzic, M. (Eds.) Managing Software EngineeringKnowledge. Springer, 2003.
[BLR04] Jesus. M. Barahona, L. Lopez, and G. Robles. Community structure of modules in theapache project. In Proceedings of the 4th Workshop on Open Source SoftwareEngineering, Edinburgh, Scotland, 2004.
357
[Ca04] Capiluppi Andrea. Improving comprehension and cooperation through code structure. eProceedings of the 4th Workshop on Open Source Software Engineering, Int. Conf.Software Engineering, May, 2004.
[Cb06] Christian Bird; Alex Gourley; Prem Devanbu; Michael Gertz; Anand Swaminathan.Mining email social networks. In MSR ’06: Proceedings of the 2006 internationalworkshop on Mining software repositories, pp: 137–143, 2006.
[Ck04] Chen, K., Schach, S. R., Yu, L., Offutt, J., and Heller, G. Z. 2004. OpenSource ChangeLogs. Empirical Software Engineering, 9(3), pages 197210, 2004.
[CH03] Crowston, K., H. A. & Howison, J. Defining Open Source Software Project Success.Proc. of International Conference on Information Systems, ICIS 2003, 2003.
[ES03] Elliott, M. and Scacchi, W. Free Software Development: Cooperation and Conflict in AVirtual Organizational Culture. In S. Koch (ed.), Free/Open Source SoftwareDevelopment, IDEA Press, Chapter 7, Pages 152172, 2003.
[LH03] Lakhani, K. & Hippel, E. How open source software works: "free" usertouserassistance. Research Policy, Vol. 32, pages 923943, 2003.
[Lc04] LiTe Cheng; Cleidson R.B. de Souza; Susanne Hupfer; John Patterson; Steven Ross.Building Collaboration into IDEs. Queue, 1(9), pp: 40–50, 2004.
[LM03] G. F. Lanzara and M. Morner. The knowledge ecology of opensource software projects.In European Group of Organizational Studies (EGOS Colloquium), Copenhagen., 2003.
[DP00] Davenport, T.; Prusak, L. Working Knowledge. How Organizations Manage What theyKnow, Havard Business School, Boston, 2000
[DTE08] Daniela de Freitas Guilhermino Trindade;Tania Fatima Calvi Tait1;Elisa Hatsue MoriyaHuzita1. A tool for supporting the communication in distributed software developmentenvironment. Journal of Computer Science & Technology, 8 (2), pp: 118124, 2008.
[DB05] DinhTrong, T.; Bieman, J. M. The FreeBSD Project: A Replication Case Study of OpenSource Development. IEEE Transactions on Software Engineering, Vol. 31, pages481494, 2005.
[Gd04] German, D. M. Using software trails to reconstruct the evolution of software. Journal ofsoftware maintenance and evolution. Research and Practice, Vol.16(6), pages 367384,2004.
[GRS04] Gasser, L.; Ripoche, G.; Sandusky, B. Research Infrastructure for Empirical Science ofF/OSS Proceedings of ICSE Workshop on Mining Software Repositories, 2004.
[Gg02] Rishab A. Ghosh; Bernhard Krieger; Ruediger Glott; Gregorio Robles. Free/libre andopen source software: Survey and study. Technical report, International Institute ofInfonomics, University of Maastricht, The Netherlands, June 2002.
[KG06] Kersten, M; Gail, M. Using Task Context to Improve Programmer Productivity.SIGSOFT, pages 1–11, 2006.
[HNH03]Hertel, G.; Niedner, S. & Herrmann, S. Motivation of Software Developers in OpenSource Projects: An Internetbased Survey of Contributors to the Linux Kernel. 2003.
[Khh05] Koch S. Hahsler M. Discussion of a largescale open source data collectionmethodology. In Proceedings of the 38th Hawaii International Conference on SystemSciences (IEEE, HICSS ’05Track 7), Jan 0306, Big Island, Hawaii, page 197b., 2005.
[Kg06] Kuk, G. Strategic Interaction and Knowledge Sharing in the KDE Developer MailingList. Management Science, Vol. 52, pages 10311042, 2006.
[KSL03] Krogh, G.; Spaeth, S. Lakhani, K. Community, joining, and specialisation in open sourcesoftware innovation: a case study. Research Policy, 32, pages 12171241, 2003
[MFH02]Mockus, A.; Fielding, R.; Herbsleb, J. Two case studies of open source softwaredevelopment: Apache and Mozilla. Transactions on Software Engineering andMethodology, Vol. 11(3), pages 138, 2002.
[SJ08] Steffen Lohmann and Jorg Niesenhaus. Towards Continuous Integration of Knowledge
358
Management into Game Development. Proceedings of IKNOW ’08 and IMEDIA '08Graz, Austria, September 35, 2008.
[NT95] Nonaka, I.; Takeuchi, G. The Knowledge Creating Company. Oxford University Press.,1995.
[PDS08] Panjer, L. D., Damian, D., and Storey, M. 2008. Cooperation and coordination concernsin a distributed software development project. In Proceedings of the 2008 internationalWorkshop on Cooperative and Human Aspects of Software Engineering, Leipzig,Germany, May 13 13, 2008.
[Re99] Raymond, E. S. The cathedral and the bazaar. Fristmonday, 3(3), 1999.[RB06] Robles, G. and Barahona, J. Geographical Location of Developers at SourceForge MSR
2006, Shanghai, China, 2006.[SSA06] Sowe, S. K.; Stamelos, I.; Angelis, L. Identifying knowledge brokers that yield software
engineering knowledge in oss projects. Information and Software Technology, Vol. 48,pages 1025–1033, 2006.
[SSA07] Sowe, S. K.; Stamelos, I.; Angelis, L. Understanding knowledge sharing activities infree/open source software projects: An empirical study. Journal of Systems andSoftware, Vol. 81(3), pp: 431446, 2008.
[Sow08] Sulayman K. Sowe, Ioannis Samoladas, Ioannis Stamelos, Lefteris Angelis. Are FLOSSdevelopers committing to CVS/SVN as much as they are talking in mailing lists?Challenges for Integrating data from Multiple Repositories. 3rd International Workshopon Public Data about Software Development (WoPDaSD). September 7th 10th 2008,Milan, Italy.
[EST05] Elliott S.; Singer J.; Timothy, L. Studying software engineers: Data collection techniquesfor software field studies. Empirical Software Engineering, Vol. 10, pages 311–342,2005.
[Tw06] Turner, William; Bowker, Geoffrey; Gasser, Les; Zacklad, Manuel. Informationinfrastructures for distributed collective practices. Computer Supported CooperativeWork, Vol.15(23), pages 93–110, 2006.
[Xg05] Xu, J.; Gao, Y.; Christley, S. & Madey, S. A topological Analysis of the Open SourceSoftware Development Community. IEEE Proceedings of the 38th Hawaii InternationalConference on System Sciences, (IEEE, HICSS '05Track 7), Jan 0306, BigIsland,Hawaii., 2005, 198a.
359

Modellgetriebene Softwarearchitektur –Evolution, Integration und Migration
(MSEIM)
Inhaltsverzeichnis
Workshop Modellgetriebene Softwarearchitektur – Evolution,Integration und Migration (MSEIM2009)Michael Goedicke, Maritta Heisel, Sascha Hunold, Stefan Kühne,Matthias Riebisch, Niels Streekmann .......................................................................... 363
Anwendung von grafischen Validierungsregeln bei der Entwicklung von IT-IntegrationsprozessenJens Drawehn, Sven Feja.............................................................................................. 367
Berechnung von Modelldifferenzen als Basis für die Evolution vonProzessmodellenStanley Hillner, Heiko Kern, Stefan Kühne .................................................................. 375
Deriving Software Architectures from Problem DescriptionsDenis Hatebur, Maritta Heisel .................................................................................... 383
Softwaremodernisierung durch werkzeugunterstütztes Verschiebenvon CodeblöckenMarvin Ferber, Sascha Hunold, Thomas Rauber, Björn Krellner,Thomas Reichel, Gudula Rünger.................................................................................. 393
Workshop Modellgetriebene Softwarearchitektur –
Evolution, Integration und Migration
(MSEIM 2009)
Michael Goedicke1, Maritta Heisel2, Sascha Hunold3, Stefan Kühne4, Matthias Rie-bisch5, Niels Streekmann6
1 Specification of Software Systems, Universität Duisburg-Essen,[email protected]
2 Software Engineering, Universität Duisburg-Essen,[email protected]
3 Lehrstuhl für Angewandte Informatik II, Universität Bayreuth,[email protected]
4 Betriebliche Informationssysteme, Universität Leipzig,[email protected]
5 Fachgebiet Softwaresysteme / Prozessinformatik, Technische Universität Ilmenau,[email protected]
6 Technologiecluster "Enterprise Application Integration", OFFIS,[email protected]
1 Motivation
Softwarearchitekturen sind wichtige Artefakte zur Unterstützung der Software-Entwick-lung und Software-Evolution. Sie dienen der grundlegenden Beschreibung von Softwa-resystemen und dienen damit auch als Ausgangspunkt zur Weiterentwicklung bestehen-der Systeme. Diese Weiterentwicklung umfasst neben der Evolution bestehender Softwa-resysteme auch die Integration mit anderen Systemen und die Migration in neue System-umgebungen. Die modellgetriebene Softwareentwicklung, die zunehmende Verbreitungsowohl in der Wissenschaft als auch im Einsatz in der Praxis findet, stellt mit den ver-folgten Zielstellungen Automatisierung, Komplexitätsreduzierung sowie Qualitätssteige-rung einen vielversprechenden Ansatz zur Unterstützung der dafür notwendigen Aufga-ben dar. Der Einsatz modellgetriebener Entwicklungsansätze im Kontext bestehenderLegacy-Systeme wirft jedoch auch zahlreiche Fragen hinsichtlich Vorgehen, Methoden,Werkzeuge und Strategien auf.
363
2 Ziele des Workshops
Der Workshop „Modellgetriebene Softwarearchitektur - Evolution, Integration und Mig-ration“ soll dazu beitragen, die Ansätze zur Einbindung bestehender Systeme in einenmodellgetriebenen Softwareentwicklungsprozess zu thematisieren. Dies soll sowohl aufakademischer Ebene als auch im Austausch mit Industrievertretern geschehen, um prak-tische Problemstellungen und Lösungsansätze mit akademischen Methoden integrierenzu können.
Der Workshop soll in erster Linie als Diskussions- und Austauschplattform dienen. Wis-senschaftler und Praktiker sind dazu aufgerufen aktuelle Probleme und Lösungsansätzezu präsentieren, um diese mit den Workshop-Teilnehmern zu diskutieren. Das Ziel dabeiist, die vorgestellten Arbeiten voranzutreiben und neue Ansatzpunkte für Problemlösun-gen und Kooperationen zwischen Forschungs- und Industriegruppen zu finden.
Beiträge aus den folgenden Bereichen waren erwünscht:
• Modellierungsmethoden und Architekturmodelle für Integration und Migration• Methoden und Verfahren architekturbasierter Migration bestehender Systeme• Werkzeuge für modellgetriebene Integration und Migration• Methoden und Verfahren zur Ableitung und Validierung von Architekturen beste-
hender Systeme• Modellanalysen im Integrations- und Migrationsprozess• Visualisierung und Simulation von Integration• Modellgetriebene Evolution bestehender Systeme• Wiederverwendung durch modellgetriebene Entwicklungsansätze• Modellbasiertes Re-Engineering monolithischer Legacy-Systeme• Reverse-Engineering und Codeextraktion von Nutzerschnittstellen und Geschäfts-
prozessen• Performance und Skalierbarkeit von Integrations- und Migrationslösungen• Test und Verifikation von Software- und Modelltransformationen• Validierung dynamischer Aspekte in Integrationsmodellen• Modellgetriebene Produktlinienarchitekturen für die Integration in spezifischen E-
Business-Domänen• Einführung serviceorientierter Architekturen unter Berücksichtigung bestehender
Systeme• Standards und Standardtechnologien für die Softwarearchitektur• Vorgehensmodelle für die architekturbasierte Evolution, Integration und Migration
von Softwaresystemen
364
3 Workshopverlauf
Der Workshop konnte mit 18 Teilnehmern aus Industrie und Forschung einen guten Zu-spruch verzeichnen. Der Workshop bestand aus vier Vorträgen zu den angenommen Bei-trägen. Zu jedem Vortrag gab es eine rege Diskussion.
Zwei der Beiträge beschäftigen sich mit verschiedenen Aspekten der Geschäftsprozess-modellierung. Dabei liegt der Schwerpunkt des Beitrags „Anwendung von grafischenValidierungsregeln bei der Entwicklung von IT-Integrationsprozessen“ auf der Validie-rung der modellierten Geschäftsprozesse. Es wird eine Methode vorgestellt, wie ein bes-tehender Validierungsmechanismus in den Entwicklungsprozess eingebunden werdenkann. Der Beitrag „Berechnung von Modelldifferenzen als Basis für die Evolution vonProzessmodellen“ hingegen konzentriert sich auf die Änderung von Geschäftsprozess-modellen im Entwicklungsprozess. Es werden Methoden für die Berechnung von Diffe-renzen und Kriterien für die Evaluierung von Differenzbildungswerkzeugen vorgestellt.
Die beiden weiteren Beiträge beschäftigen sich mit zwei weiteren Teilgebieten modell-getriebener Softwareentwicklung: der Ableitung von Software-Architekturen aus denAnforderungen und der Modernisierung bestehender Softwaresysteme mit Hilfe vonModelltransformationen. Der Beitrag „Deriving Software Architectures from ProblemDescriptions“ führt zur systematischen Erstellung eine sechsstufige Anforderungsanaly-sephase ein. Aus den in dieser Phase erstellten Modellen wird eine Schichtenarchitekturabgeleitet. Der Beitrag „Softwaremodernisierung durch werkzeugunterstütztes Verschie-ben von Codeblöcken“ stellt als Teilgebiet der Modernisierung von Softwaresystemenein Verfahren vor, wie und unter welchen Voraussetzungen zusammenhängende Teilevon Klassen in diesen Systemen verschoben werden können, um die Komplexität desSystems zu reduzieren.
4 Organisation
Veranstaltungsreihe
Der Workshop war der Nachfolger eines bereits im Jahr 2008 im Rahmen der KonferenzSoftware-Engineering veranstalteten gleichnamigen Workshops. Zudem wurde er alsNachfolger vorangehender Veranstaltungen organisiert. Bei der Konferenz Software En-gineering 2007 fand bereits der Workshop „Softwarearchitektur und Migration“ statt.Die Workshops ORA2006 und ORA2007 „Architekturen, Objektorientierung und Reen-gineering“ wurden als gemeinsame Veranstaltungen der oben bereits genannten GI-Fachgruppen OOSE, FG-SWA und SRE durchgeführt.
365
Als weiterer Vorläufer für diesen Workshop wurde im Februar 2007 ein gemeinsamerWorkshop der Projekte MINT, OrViA und TransBS mit dem Titel „Transformation ofLegacy-Software“ auf Schloß Dagstuhl veranstaltet. Weitere Workshops, die aus diesenProjekten heraus organisiert wurden, sind die Workshopreihe MSI, die die Synergienzwischen modellgetriebener Entwicklung, serviceorientierten Architekturen und IT-Ma-nagement thematisiert und von Mitarbeitern des Projekts MINT organisiert wird, sowieder OrViA-Workshop „Integration betrieblicher Informationssysteme“, der dem Erfah-rungsaustausch auf dem Gebiet modellgetriebener Entwicklung diente, im Rahmen der14. Leipziger Informatik-Tage.
Review-Prozess
Alle Beiträge wurden durch mindestens 3 Mitglieder des Programmkomitees anonymbegutachtet. Im Workshopband wurden die entsprechend der Gutachterhinweise überar-beiteten Beiträge aufgenommen.
Organisationskomitee
• Michael Goedicke, Universität Duisburg-Essen• Maritta Heisel, Universität Duisburg-Essen• Sascha Hunold, Universität Bayreuth• Stefan Kühne, Universität Leipzig• Matthias Riebisch, TU Ilmenau• Niels Streekmann, OFFIS
Programmkomitee
• Steffen Becker, FZI• Klaus-Peter Fähnrich, Universität Leipzig• Michael Goedicke, Universität Duisburg-Essen• Peter Hänsgen, Intershop Research• Wilhelm Hasselbring, Universität Oldenburg• Florian Heidenreich, Technische Universität Dresden• Maritta Heisel, Universität Duisburg-Essen• Klaus Pohl, Universität Duisburg-Essen• Elke Pulvermüller, Universität Osnabrück• Thomas Rauber, Universität Bayreuth• Ralf Reussner, Universität Karlsruhe• Matthias Riebisch, TU Ilmenau• Gudula Rünger, Technische Universität Chemnitz• Andreas Speck, Christian-Albrechts-Universität zu Kiel• Ulrike Steffens, OFFIS• Maik Thränert, Universität Leipzig• Andreas Winter, Johannes-Gutenberg-Universität Mainz
366
Anwendung von grafischen Validierungsregeln bei derEntwicklung von IT-Integrationsprozessen
Jens Drawehn und Sven Feja
[email protected], [email protected]
Abstract: Zunehmend stellt die Modellierung von (Geschafts-)Prozessmodellen denAusgangspunkt der Entwicklung von Software bspw. basierend auf Service-orientiertenArchitekturen dar. Um die syntaktische und semantische Korrektheit der Modelle zuuberprufen, sind sinnvoll einsetzbare Mechanismen notwendig. Die syntaktische Pru-fung wird meist direkt von den Modellierungswerkzeugen unterstutzt. Hingegen gibtes kaum Ansatze zum Einsatz von Validierungstechniken – wie dem Model Checking –auf Geschaftsprozessebene. Außerdem wird die Wiederverwendung von Validierungs-regeln bisher vernachlassigt.
In diesem Beitrag wird die Erweiterung eines auf grafischen Validierungsregeln(EPK-G-CTL) basierenden Verfahren vorgestellt, mit dem fachliche Prozessmodellegezielt auf semantische Aspekte uberpruft werden konnen. Im Fokus der Betrachtun-gen steht die Frage, wie der Validierungsmechanismus in den Entwicklungsprozesseingebunden werden kann, so dass fur die Entwickler ein erkennbarer Nutzen entsteht.Dabei sind die Aspekte der einfachen Erstellung und Anwendbarkeit sowie der Wie-derverwendbarkeit der Validierungsregeln von Bedeutung.
1 Einleitung
Im BMBF-geforderten Forschungsprojekt OrViA [FKT08] wurde ein durchgangiges Fra-mework fur die fachlich getriebene Realisierung von IT-Integrationsprojekten entwickelt,dem sowohl die Prinzipien der modellgetriebenen Softwareentwicklung [SVEH07] alsauch das Konzept der Service-orientierten Architekturen (SOA) [MLM+06] zugrunde lie-gen. Dabei erfolgt die Gestaltung der IT-Integrationsszenarien primar anhand der Prozes-se. Einer vergleichenden Betrachtung verschiedener Vorgehensweisen in SOA-Projekten[HWSD07] zufolge handelt es sich dabei um einen Top-Down-Ansatz.
Eine der wesentlichen Zielstellungen von SOA-Projekten besteht in der Unterstutzung derlangfristigen Entwicklung und Pflege von Softwarelandschaften. Durch die Wiederver-wendung von Services soll eine hohere Flexibilitat bei der Umsetzung neuer Anforde-rungen erreicht werden. Da Services im Sinne des Konzepts der SOA nicht als reine IT-Funktionen zu betrachten sind, sondern vielmehr Geschaftsfunktionen realisieren [TS07],ergeben sich dabei neue Anforderungen an den Softwareentwicklungsprozess. Unter ande-rem stellt sich bei der Erstellung neuer Services die Frage, wie die semantische Korrektheitder modellierten Szenarien beurteilt werden kann.
Fur die fachliche Modellierung von Geschaftsprozessen steht die Werkzeugkategorie der
367
Geschaftsprozessmodellierungswerkzeuge (Business Process Modeling Tools, BPMT) zurVerfugung. Eine Untersuchung zu den Einsatzmoglichkeiten von BPMT in SOA-Projektenfindet sich in [DH08]. Allgemein zeichnet sich der Trend ab, BPMT und die damit ab-gebildeten Prozess- und sonstigen Modelle zunehmend im Sinne der modellgetriebenenSoftwareentwicklung zu nutzen. Dies wirft die Frage auf, wie man die semantische Kor-rektheit der Prozessmodelle sichern kann. Grundsatzlich bieten BPMTs die Moglichkeitsemantische Informationen im Zusammenhang mit den Prozessen zu erfassen. Diese In-formation sind aber nicht geeignet fur automatische Modellprufungsverfahren – wie demModel Checking. Der Grund ist die nicht formale Hinterlegung der semantischen Infor-mationen. Dies erschwert außerdem die Erreichung des Ziels der Wiederverwendbarkeit,Wartbarkeit und Pflegbarkeit von Geschaftslogik, welche in den oben geschilderten Sze-narien gefordert werden. Letztendlich existieren in der Praxis keine etablierten, standardi-sierten Formate und Verfahren zur semantischen Prufung von Geschaftsprozessmodellenauf der Modellebene.
Daher wird in diesem Beitrag ein Ansatz zur Formulierung von wiederverwendbaren, gra-fischen Validierungsregeln vorgestellt. Die grafische Modellierung der Regeln basiert da-bei auf [FFS08]. Der Fokus in diesem Beitrag liegt auf der Wiederverwendbarkeit vonValidierungsregeln. Diese wird durch die Zuordnung der Regeln in verschiedene inhaltli-che Reichweiten erzielt.
2 Hintergrund
Geschaftsprozessmodelle bilden mittlerweile den zentralen Punkt der Unternehmens- undSoftwareentwicklung. Daher wird zunehmend versucht durch ”explizite Modellierung undImplementierung von Geschaftsregeln” [End04] die Geschaftslogik direkt in die verwen-deten Modelle aufzunehmen. Die Geschaftslogik wird in sogenannten Geschaftsregeln for-muliert. Der Begriff der Geschaftsregel ist dabei laut [HH00]:
”A business rule is a statement that defines or constrains some aspect of the business.”
Dabei wird zwischen verschiedenen Typen unterschieden. In [End04] findet sich ein um-fassendes Schemata zur Klassifikation der Geschaftsregeln. Die Klassifikation der Ge-schaftsregeln unterscheidet sich zwischen den verschiedenen Autoren aufgrund der unter-schiedlichen Blickpunkte [Bus08]. Die Business Rule Group unterscheidet zwischen denBlickpunkten Business Perspective und der Information System Perspective. Die letzereist die uberwiegend in diesem Beitrag betrachtete Perspektive. Diese Regeln setzen denFokus auf die semantische d. h. fachliche Korrektheit der Geschaftsprozesse.
Geschaftsregeln konnen grundsatzlich zur Spezifikation von Softwaresystemen genutztwerden. [End04] schlagt die direkte Entwicklung von Geschaftprozesen aus modelliertenGeschaftsregeln vor. Hingegen wird in [Ger04] festgestellt, dass die Wiederverwendbar-keit und Flexibilitat von Geschaftsregeln erst durch die getrennte Verwaltung von Regelnund Geschaftsprozessen ermoglicht wird. Dieser Ansatz wird von dem in [FFS08] vor-gestellten Verfahren verfolgt. Dabei werden Geschaftsregeln auf der Basis von Modell-
368
prufungstechniken (dem Model Checking) als Validierungssregeln definiert. Diese Vali-dierungsregeln sind temporale Regeln, die in der vorgestellten Notation auf der Ebene vonGeschaftsprozessen erstellt werden konnen. Allerdings enthalt das in [FFS08] vorgestellteVerfahren bisher nicht die Moglichkeit allgemeingultige, wiederverwendbare Regeln bzw.Anforderungen zu erstellen, da die Validierung nur direkt uber den Namen des betroffenenGeschaftsprozesselements stattfindet.
3 Das Szenario ”Elektronische Steuererklarung”
In diesem Abschnitt wird die Anwendung des Validierungsmechanismus anhand einesSzenarios aus der Domane der Steuerverwaltung beispielhaft beschrieben. Ziel der aktu-ellen Vorhaben ELSTER und EloSt ist die durchgangige, medienbruchfreie elektronischeVerarbeitung von Einkommenssteuer-Erklarungen beginnend beim Burger. Herausforde-rungen bei der Realisierung dieser Projekte bestehen in organisatorischen Unterschie-den, heterogenen IT-Strukturen, unterschiedlich guter IT-Ausstattung der verschiedenenFinanzverwaltungen und Finanzamter und der Berucksichtigung landerspezifischen Be-sonderheiten. Eine Beschreibung des Szenarios und der Rahmenbedingungen findet sichin [PD08].
Im Fokus der Betrachtungen stehen hier der IT-Integrationsprozess und der Einsatz desValidierungsverfahrens bei dessen Entwicklung. Zielstellung ist die Verfugbarkeit einesServices von Seiten der Finanzbehorde fur die Burger, die damit die Moglichkeit erhalten,ihre Steuererklarungen in elektronischer Form in einem standardisierten Format an einFinanzamt zu ubergeben. Das fachliche Prozessmodell ist in Abbildung 1 dargestellt. Furdie Realisierung des Szenarios wurden verschiedene Methoden und Werkzeuge eingesetzt.Fur den hier relevanten Ausschnitt der Entwicklung des Integrationsprozesses wurden derARIS SOA Architect fur die Geschaftsprozessmodellierung und der Oracle BPEL ProcessManager fur die Ausfuhrung der Prozesse verwendet. Die Transformation des fachlichenModells in das ausfuhrbare Format BPEL leistet der ARIS SOA Architect.
Die Validierungsregeln liegen in ARIS in Form von EPK-G-CTL-Diagrammen vor. Abbil-dung 2 zeigt drei beispielhafte Validierungsregeln. Die allgemeingultige Regel Persistenzvon Datenobjekten wurde in einem fruher modellierten Szenario entwickelt. Wenn fur einDatenobjekt die Eigenschaft Persistenz gefordert zutrifft, verlangt die Regel, dass auf allengultigen Pfaden des Prozessmodells ein Service aufgerufen wird, an den dieses Datenob-jekt ubergeben wird und der die Eigenschaft Persistenz erfullt aufweist. Im Modell ist dieInformation hinterlegt, dass fur die ELSTER-Nachricht die Eigenschaft Persistenz gefor-dert zutrifft. Dadurch wird die Regel im modellierten Szenario wirksam.
Die domanenspezifische Regel Unveranderbarkeit druckt aus, dass das spezifische Date-nobjekt ELSTER-Nachricht im Ablauf eines Prozesses nicht verandert werden darf. Dieszenariospezifische Regel Eingangsstempel bezieht sich ebenfalls ausschließlich auf dieELSTER-Nachricht. Sie verlangt, dass die ELSTER-Nachricht im ersten Prozessschritt aneinen Service ubergeben wird, der die Eigenschaft Persistenz erfullt aufweist. Eine ge-naue Erlauterung der Regeln und die Zuordnung zu den Regeltypen erfolgt im nachstenAbschnitt.
369
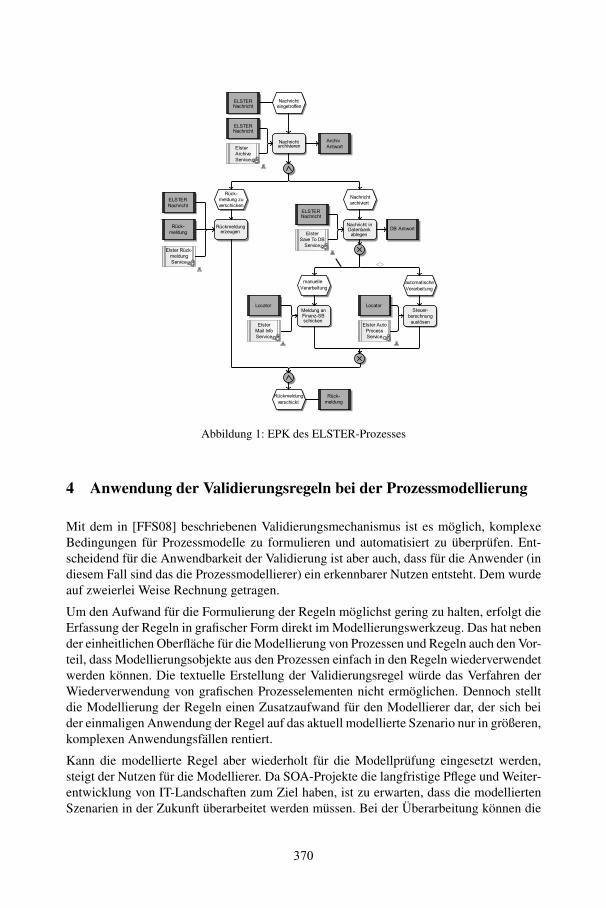
=,)9E6)9AB6+<BAEF??B+
=,)9E6)9A,E)96;6BEB+
7/)3(
-B0D>+< 5>
;BEC)96)3B+
7/)3-B0D>+<BE5B><B+
7/)3-B0D>+<
;BEC)96)3A
=,)9E6)9A
,E)96;6BEA
=,)9E6)9A 6+%,AB+*,+3,*0B<B+
-,+>B00B
.BE,E*B6A>+<
@B0D>+< ,+#6+,+5(4&C)96)3B+
,>AF-,A6C)9B
.BE,E*B6A>+<
4AB>BE(
*BEB)9+>+<
,>C02CB+
$!41$7=,)9E6)9A
'E)96;
'+A8FEA
%& '+A8FEA7/)3(
-B0D>+<
!F),AFE
$!41$7=,)9E6)9A
$!41$7
=,)9E6)9A
$!41$7=,)9E6)9A
7/)3(
-B0D>+<
!F),AFE
$0CABE
'E)96;B
4BE;6)B
$0CABE '>AF
:EF)BCC
4BE;6)B
$0CABE
@,60 "+?F
4BE;6)B
$0CABE 7/)3(
-B0D>+<
4BE;6)B
$0CABE
4,;B 1F %&
4BE;6)B
Abbildung 1: EPK des ELSTER-Prozesses
4 Anwendung der Validierungsregeln bei der Prozessmodellierung
Mit dem in [FFS08] beschriebenen Validierungsmechanismus ist es moglich, komplexeBedingungen fur Prozessmodelle zu formulieren und automatisiert zu uberprufen. Ent-scheidend fur die Anwendbarkeit der Validierung ist aber auch, dass fur die Anwender (indiesem Fall sind das die Prozessmodellierer) ein erkennbarer Nutzen entsteht. Dem wurdeauf zweierlei Weise Rechnung getragen.
Um den Aufwand fur die Formulierung der Regeln moglichst gering zu halten, erfolgt dieErfassung der Regeln in grafischer Form direkt im Modellierungswerkzeug. Das hat nebender einheitlichen Oberflache fur die Modellierung von Prozessen und Regeln auch den Vor-teil, dass Modellierungsobjekte aus den Prozessen einfach in den Regeln wiederverwendetwerden konnen. Die textuelle Erstellung der Validierungsregel wurde das Verfahren derWiederverwendung von grafischen Prozesselementen nicht ermoglichen. Dennoch stelltdie Modellierung der Regeln einen Zusatzaufwand fur den Modellierer dar, der sich beider einmaligen Anwendung der Regel auf das aktuell modellierte Szenario nur in großeren,komplexen Anwendungsfallen rentiert.
Kann die modellierte Regel aber wiederholt fur die Modellprufung eingesetzt werden,steigt der Nutzen fur die Modellierer. Da SOA-Projekte die langfristige Pflege und Weiter-entwicklung von IT-Landschaften zum Ziel haben, ist zu erwarten, dass die modelliertenSzenarien in der Zukunft uberarbeitet werden mussen. Bei der Uberarbeitung konnen die
370
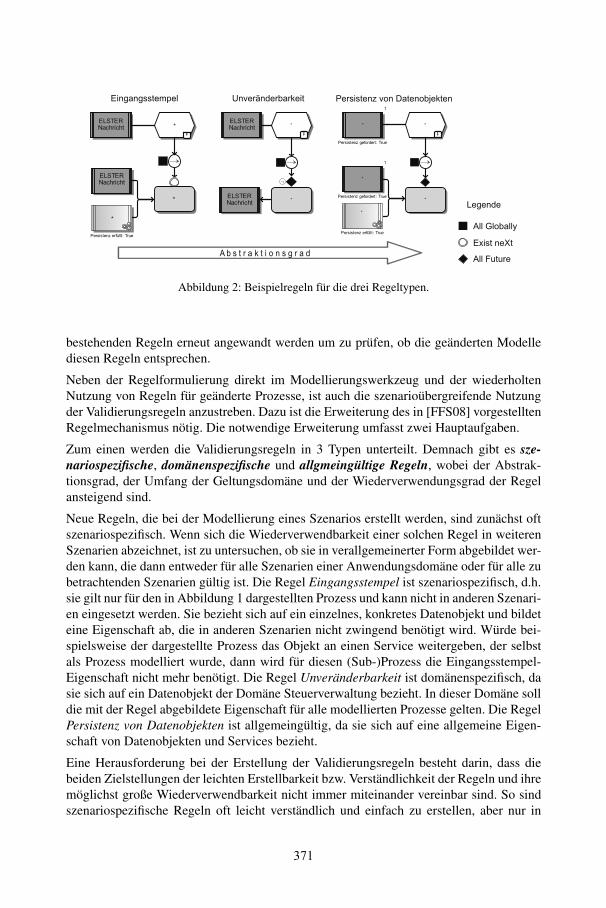
#@41#7=*E6>3E68 (
(
#@41#7=*E6>3E68
(
:?>;3;8?GJ ?><F++8& 1>5?
(
'
(
:?>;3;8?GJ 9?<D>B?>8& 1>5?
(
'
(
:?>;3;8?GJ 9?<D>B?>8& 1>5?
(
:?>;3;8?GJ ?><F++8& 1>5?
#3G9*G9;;8?IA?+ :?>;3;8?GJ 2DG $*8?GD)0?-8?G
@?9?GB?
%++ !+D)*++K
#/3;8 G?,8
%++ "585>?
(
(
.G2?>HGB?>)*>-?38
#@41#7=*E6>3E68
#@41#7=*E6>3E68
* ( , + " ) # + % $ ! , & " ) '
Abbildung 2: Beispielregeln fur die drei Regeltypen.
bestehenden Regeln erneut angewandt werden um zu prufen, ob die geanderten Modellediesen Regeln entsprechen.
Neben der Regelformulierung direkt im Modellierungswerkzeug und der wiederholtenNutzung von Regeln fur geanderte Prozesse, ist auch die szenarioubergreifende Nutzungder Validierungsregeln anzustreben. Dazu ist die Erweiterung des in [FFS08] vorgestelltenRegelmechanismus notig. Die notwendige Erweiterung umfasst zwei Hauptaufgaben.
Zum einen werden die Validierungsregeln in 3 Typen unterteilt. Demnach gibt es sze-nariospezifische, domanenspezifische und allgmeingultige Regeln, wobei der Abstrak-tionsgrad, der Umfang der Geltungsdomane und der Wiederverwendungsgrad der Regelansteigend sind.
Neue Regeln, die bei der Modellierung eines Szenarios erstellt werden, sind zunachst oftszenariospezifisch. Wenn sich die Wiederverwendbarkeit einer solchen Regel in weiterenSzenarien abzeichnet, ist zu untersuchen, ob sie in verallgemeinerter Form abgebildet wer-den kann, die dann entweder fur alle Szenarien einer Anwendungsdomane oder fur alle zubetrachtenden Szenarien gultig ist. Die Regel Eingangsstempel ist szenariospezifisch, d.h.sie gilt nur fur den in Abbildung 1 dargestellten Prozess und kann nicht in anderen Szenari-en eingesetzt werden. Sie bezieht sich auf ein einzelnes, konkretes Datenobjekt und bildeteine Eigenschaft ab, die in anderen Szenarien nicht zwingend benotigt wird. Wurde bei-spielsweise der dargestellte Prozess das Objekt an einen Service weitergeben, der selbstals Prozess modelliert wurde, dann wird fur diesen (Sub-)Prozess die Eingangsstempel-Eigenschaft nicht mehr benotigt. Die Regel Unveranderbarkeit ist domanenspezifisch, dasie sich auf ein Datenobjekt der Domane Steuerverwaltung bezieht. In dieser Domane solldie mit der Regel abgebildete Eigenschaft fur alle modellierten Prozesse gelten. Die RegelPersistenz von Datenobjekten ist allgemeingultig, da sie sich auf eine allgemeine Eigen-schaft von Datenobjekten und Services bezieht.
Eine Herausforderung bei der Erstellung der Validierungsregeln besteht darin, dass diebeiden Zielstellungen der leichten Erstellbarkeit bzw. Verstandlichkeit der Regeln und ihremoglichst große Wiederverwendbarkeit nicht immer miteinander vereinbar sind. So sindszenariospezifische Regeln oft leicht verstandlich und einfach zu erstellen, aber nur in
371
geringem Maße wiederverwendbar. Sehr weit abstrahierte, allgemeingultige Regeln sindprinzipiell gut wiederverwendbar, aber oft schwierig zu verstehen. In solchen Fallen istdas Ergebnis der Validierung mit der Aussage, dass ein Prozess einer bestimmten Re-gel nicht entspricht, fur den Modellierer schwierig zu interpretieren. Deshalb ist es nichttrivial, den ”richtigen” Abtstraktionsgrad einer Validierungsregel und damit auch den Re-geltyp zu bestimmen. Allgemeingultige oder domanenspezifische Regeln mussen dabeinicht in jedem Szenario von Bedeutung sein: Wenn z.B. die Persistenz von Datenobjektenin einem modellierten Szenario keine Rolle spielt, sind die fur die Regel Persistenz vonDatenobjekten entscheidenden Attribute nicht befullt, diese Regel kommt daher nicht zurAusfuhrung und der Modellierer erhalt keine Fehlermeldung. Szenariospezifische Regelndagegen sollten auf das betreffende Szenario anwendbar sein, ansonsten sind sie entwederuberflussig oder aber es liegt die Vermutung nahe, dass ein Modellierungsfehler vorliegt.Deshalb erhalt der Benutzer mit den Ergebnissen der Validierung die Information, wel-che szenariospezifischen Regeln nicht anwendbar sind. Fur die (vermutlich weit großere)Zahl von domanenspezifischen und allgemeingultigen Regeln wird eine solche Informati-on nicht ausgegeben.
Zum anderen muss der Validierungsmechanismus aus [FFS08] auf Aussagen zu Eigen-schaften bzw. Attributen der Modellelemente erweitert werden. Szenariospezifische Re-geln wie die in Abschnitt 3 beschriebene Regel ”Eingangsstempel” treffen Aussagen uberkonkrete Objekte. Da Benennungen von Objekten durch den Modellierer oft frei vergebenwerden, sind einer Wiederverwendung solcher Regeln in anderen Szenarien enge Gren-zen gesetzt. Wiederverwendbare Regeln konnen nur uber Eigenschaften von Objektengesteuert werden, die szenarioubergreifend von Bedeutung sind. Bei der in Abschnitt 3beschriebenen Regel ”Persistenz von Datenobjekten” werden bspw. 2 Attribute genutzt,die Aussagen daruber treffen, ob fur ein Datenobjekt (bzw. eine Nachricht) Persistenz ge-fordert wird bzw. ob ein aufgerufener Service die Persistenz herstellt. Dabei ist es aus Sichtdes Prozessmodellierers von Vorteil, dass diese Objekte nicht bei der Modellierung eineseinzelnen Prozesses erzeugt werden, sondern prozessunabhangig zur Verfugung gestelltwerden. Dadurch entsteht fur den Modellierer in diesem Fall weder fur die Formulierungder (bereits vorhandenen) Regel noch fur die Erfassung der Validierungsattribute ein Zu-satzaufwand.
5 Technische Realisierung
Der Einsatz von Modellprufungstechniken erfordert deren Einbindung in den Modellie-rungsprozess von Geschaftsprozess- bzw. Intergrationsmodellen. In Abbildung 3 ist einmogliches Vorgehensmodell dargestellt. Die Modellierung beginnt dabei mit einem neu er-stellten Modell oder (falls vorhanden) basierend auf einem Referenzmodell. Um einem neuerstellten Modell die Zuordnung von existierenden Validierungsregeln zu ermoglichen,besitzt das Modell Attribute, uber welche sich die Szenario- oder Domanenzugehorigkeitfestlegen lasst. Bei Referenzmodellen sind diese Attribute bereits gesetzt. Durch die Zu-ordnung der Modelle zu Szenarien und Domanen werden dem Modell aus dem Datenbe-stand Validierungsregeln die entsprechenden Regeln, sowie die allgemeingultigen Regeln,
372
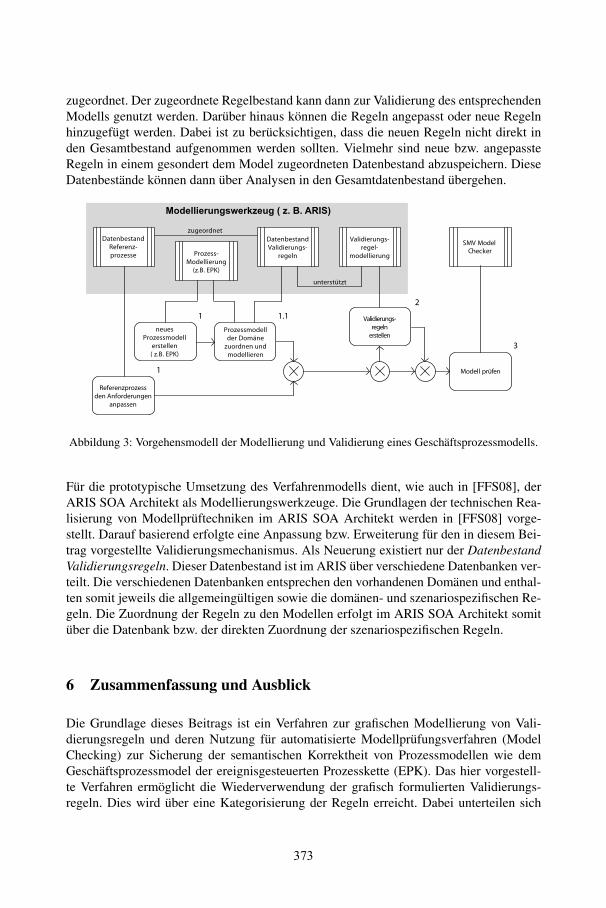
zugeordnet. Der zugeordnete Regelbestand kann dann zur Validierung des entsprechendenModells genutzt werden. Daruber hinaus konnen die Regeln angepasst oder neue Regelnhinzugefugt werden. Dabei ist zu berucksichtigen, dass die neuen Regeln nicht direkt inden Gesamtbestand aufgenommen werden sollten. Vielmehr sind neue bzw. angepassteRegeln in einem gesondert dem Model zugeordneten Datenbestand abzuspeichern. DieseDatenbestande konnen dann uber Analysen in den Gesamtdatenbestand ubergehen.
1
Referenzprozessden Anforderungen
anpassen
1neues
Prozessmodellerstellen( z.B. EPK)
2
zugeordnet
Validierungs-regelnerstellen
3
Modell prüfen
Prozess-Modellierung(z.B. EPK)
SMV ModelChecker
.'1/))+/&$(-%#/&*"/$- ! "5 25 4,036
1.1
Prozessmodellder Domänezuordnen undmodellieren
DatenbestandReferenz-prozesse
DatenbestandValidierungs-
regeln
Validierungs-regel-
modellierung
unterstützt
Abbildung 3: Vorgehensmodell der Modellierung und Validierung eines Geschaftsprozessmodells.
Fur die prototypische Umsetzung des Verfahrenmodells dient, wie auch in [FFS08], derARIS SOA Architekt als Modellierungswerkzeuge. Die Grundlagen der technischen Rea-lisierung von Modellpruftechniken im ARIS SOA Architekt werden in [FFS08] vorge-stellt. Darauf basierend erfolgte eine Anpassung bzw. Erweiterung fur den in diesem Bei-trag vorgestellte Validierungsmechanismus. Als Neuerung existiert nur der DatenbestandValidierungsregeln. Dieser Datenbestand ist im ARIS uber verschiedene Datenbanken ver-teilt. Die verschiedenen Datenbanken entsprechen den vorhandenen Domanen und enthal-ten somit jeweils die allgemeingultigen sowie die domanen- und szenariospezifischen Re-geln. Die Zuordnung der Regeln zu den Modellen erfolgt im ARIS SOA Architekt somituber die Datenbank bzw. der direkten Zuordnung der szenariospezifischen Regeln.
6 Zusammenfassung und Ausblick
Die Grundlage dieses Beitrags ist ein Verfahren zur grafischen Modellierung von Vali-dierungsregeln und deren Nutzung fur automatisierte Modellprufungsverfahren (ModelChecking) zur Sicherung der semantischen Korrektheit von Prozessmodellen wie demGeschaftsprozessmodel der ereignisgesteuerten Prozesskette (EPK). Das hier vorgestell-te Verfahren ermoglicht die Wiederverwendung der grafisch formulierten Validierungs-regeln. Dies wird uber eine Kategorisierung der Regeln erreicht. Dabei unterteilen sich
373
die Regeln nach ihrer inhaltlichen Reichweite. Bei einer kontinuierlichen Nutzung desVerfahrens uber einen langeren Zeitraum wird eine Regeldatenbank aufgebaut, die allge-meingultige, domanenspezifische und szenariospezifische Regeln enthalt.
Die bessere Wiederverwendbarkeit der Regeln und die grafische Darstellungsform verein-facht, wie oben beschrieben, die Formulierung der Regeln gegenuber einer textbasiertenErstellung. Dennoch ist fur die Regelerstellung ein grundsatzliches Verstandnis der zu-grundeliegenden Mechanismen erforderlich. Fur die Zukunft ist geplant, die Regelerstel-lung durch die Verwendung von Mustern bzw. Regelbausteinen sowie durch Assistentennoch besser zu unterstutzen. Der Einsatz von Mustern ermoglicht die effiziente Erstellungkomplexer Regeln. Ebenso kann eine angemessene Benutzerfuhrung durch dialogbasierteAssistenten eine wertvolle Unterstutzung fur den Modellierer darstellen.
Literatur
[Bus08] Business Rules Group. What is a Business Rule?http://www.businessrulesgroup.org/defnbrg.shtml, December 2008.
[DH08] Jens Drawehn und Oliver Hoß. Ausfuhrung von Geschaftsprozessen. In Dieter Spathund Anette Weisbecker, Hrsg., Business Process Management Tools 2008 - Eine eva-luierende Marktstudie zu aktuellen Werkzeugen. Fraunhofer IRB Verlag, 2008.
[End04] Rainer Endl. Regelbasierte Entwicklung betrieblicher Informationssysteme. Eul, J,2004.
[FFS08] Sven Feja, Daniel Fotsch und Sebastian Stein. Grafische Validierungsregeln am Bei-spiel von EPKs. In Software Engineering 2008, Fachtagung des GI-Fachbereichs Soft-waretechnik, 18.-22.2.2008 in Munchen, LNI, Seiten 198–204. GI, 2008.
[FKT08] Klaus-Peter Fahnrich, Stefan Kuhne und Maik Thranert, Hrsg. Model-Driven Integra-tion Engineering. Universitat Leipzig, 2008.
[Ger04] Rik Gerrits. Business rules, can they be re-used? Business Rules Journal, 5, 2004.
[HH00] David Hay und Keri Anderson Healy. Defining Business Rules What Are They Real-ly? http://www.businessrulesgroup.org/first paper/BRG-whatisBR 3ed.pdf, July 2000.
[HWSD07] Oliver Hoß, Anette Weisbecker, Thomas Specht und Jens Drawehn. Migration zu ser-viceorientierten Architekturen - top-down oder bottom-up? In Knut Hildebrand, Hrsg.,HMD - Praxis der Wirtschaftsinformatik, Jgg. 257, Seiten 39–46. dpunkt.verlag, 2007.
[MLM+06] C. Matthew MacKenzie, Ken Laskey, Francis McCabe, Peter F Brown und RebekahMetz. Reference Model for Service Oriented Architecture 1.0, August 2006.
[PD08] Oliver Pape und Jens Drawehn. Anwendungsszenario Elektronische Steuererklarung.In Klaus-Peter Fahnrich, Stefan Kuhne und Maik Thranert, Hrsg., Model-Driven Inte-gration Engineering, Seiten 157–170. Universitat Leipzig, 2008.
[SVEH07] Thomas Stahl, Markus Volter, Sven Efftinge und Arno Hase. Modellgetriebene Soft-wareentwicklung - Techniken, Engineering, Management. dpunkt.verlag, 2007.
[TS07] Stefan Tilkov und Gernot Starke. SOA aus technischer Perspektive. In SOA-Expertenwissen, Kapitel 1.3, Seite 16ff. dpunkt.verlag, 2007.
374
Berechnung von Modelldifferenzen als Basis fur dieEvolution von Prozessmodellen
Stanley Hillner, Heiko Kern, Stefan KuhneUniversitat Leipzig, Institut fur Informatik, Betriebliche Informationssysteme
Johannisgasse 26, 04103 Leipzig{hillner, kern, kuehne}@informatik.uni-leipzig.de
Abstract: In diesem Beitrag wird die Berechnung von Differenzen zwischen Prozess-modellen betrachtet. Hierzu werden verschiedene Ansatze und Werkzeuge zur Berech-nung von Differenzen beschrieben. Ausgehend von einem konkreten Anwendungsfall– einer EPK-zu-BPEL-Transformation – werden verschieden Testkriterien aufgestellt,die anschließend zur Evaluierung von zwei Differenzbildungswerkzeugen dienen. Ab-schließend werden die Ergebnisse der Untersuchung entsprechend dargestellt.
1 Einleitung
Einen Schwerpunkt der modellgetriebenen serviceorientierten Integration bildet die (teil-)automatisierte Abbildung von fachlichen Geschaftsprozessmodellen auf technische Orche-strierungsmodelle [TK08]. Mogliche Anforderungen fur eine solche Abbildung wurden inKuhne u. a. [KSI08] untersucht und darauf aufbauend ein Rahmenwerk zur Transformati-on von Geschaftsprozessmodellen definiert. Eine Evaluierung dieses Rahmenwerks wurdeam Beispiel der Transformation von Ereignisgesteuerten Prozessketten (EPK) [KNS92] indie Business Process Execution Language for Web Services (BPEL) durchgefuhrt, wobeiu. a. auf das Problem von Modellanderungen in den unterschiedlichen Abstraktionsebenenhingewiesen wurde [SKD+08]. Die Anderung der Geschaftsprozessmodelle wird meistensdurch Weiterentwicklung der Geschaftsprozesse und die Anderung der Orchestrierungs-modelle wird durch das Hinzufugen von technischen Verfeinerungen bzw. Informationenhervorgerufen. Damit eine erneute Transformation der weiterentwickelten Geschaftspro-zessmodelle moglich ist, ohne die Anderungen in den Orchestrierungsmodellen zu verlie-ren, wird in diesem Artikel eine Losung vorgeschlagen, die auf der Differenzberechnungzwischen Prozessmodellen basiert. Hierzu werden Ansatze und Werkzeuge zur Berech-nung von Modelldifferenzen beschrieben (vgl. Abschnitt 2), an einem konkreten Beispiel– einer EPK-zu-BPEL-Transformation – angewendet und anhand bestimmter Testkriterienevaluiert (vgl. Abschnitt 3).
375
2 Modelldifferenzen
2.1 Berechnung von Modelldifferenzen
In diesem Abschnitt werden zwei Moglichkeiten zur Berechnung von Modelldifferenzenaufgezeigt. Dabei bilden jeweils die beiden Modelle Morig (Originalmodell) und Mmod
(modifiziertes Modell) die Grundlage der nachfolgenden Betrachtungen.
Eine Moglichkeit zur Differenzberechnung ist die Aufzeichnung samtlicher Anderungenan Morig . Das Ergebnis dieses Ansatzes ist ein Protokoll, welches alle Schritte aufzeigt,die notig sind, um Mmod aus Morig zu erzeugen. Dieser Ansatz zeichnet sich vor allemdadurch aus, dass die Anderungen zu 100% erfasst werden. Negativ ist anzumerken, dasssich dieses Vorgehen der Differenzermittlung bspw. schwer fur verteilte Modellierung um-setzen lasst.
Ein anderer verbreiteter Ansatz zur Ermittlung von Differenzen besteht darin, einen Ver-gleich zwischen beiden Modellen vorzunehmen und aufbauend auf den ermittelten Ver-gleichswerten eine Modelldifferenz zu berechnen. Fur diesen Ansatz wurden im Wesent-lichen drei Phasen identifiziert, welche sich in der Praxis haufig nur in kleineren Detailsunterscheiden. Diese Phasen werden nachfolgend kurz betrachtet.
Matching ist die Berechnung von Ahnlichkeiten zwischen Elementen aus Morig undMmod. Hier existieren verschiedene Vorgehensweisen, welche bspw. anhand vonUUIDs (Universally Unique Identifier) die Gleichheit von Modellelementen fest-stellen, oder die Ahnlichkeit anhand anderer Vergleichskriterien wie dem Namen,dem Typ des Modellelements oder den referenzierten Modellelemente berechnen.Bei letzterem Vorgehen ist es durchaus ublich, den Vergleich der Modelle durch ge-wisse Bedingungen einzuschranken, welche die Komplexitat des Vergleichs starkreduzieren konnen. Die durch den Vergleich ermittelten Matching-Werte stellen denAhnlichkeitsgrad der Elemente aus Morig und Mmod dar, wobei 0 keine Ahnlichkeitbeudetet und der Wert 1 fur vollstandige Ahnlichkeit der Elemente steht.
Mapping bezeichnet die Ermittlung von korrespondierenden Modellelementen. Elemen-te korrespondieren, falls sie dasselbe konzeptionelle Artefakt beschreiben. Ziel desMappings ist es, ausgehend vom zuvor berechneten Matching der Modelle eine Ab-bildung zwischen Morig und Mmod zu ermitteln. Im Falle der zuvor angesprochenenVerwendung von UUIDs ergeben sich beim Matching der Modelle lediglich Uber-einstimmungen von 0 oder 1, wodurch das Mapping der Elemente offensichtlich ist.In allen anderen Fallen resultieren Vergleichswerte zwischen 0 und 1, aus welchenin dieser Phase die optimale Kombination der Elemente berechnet werden muss.
Diff-Bildung ist die Berechnung und Darstellung der Differenzen beider Modelle. In die-ser letzten Phase ist es erforderlich, einen erneuten Vergleich der im Mapping er-mittelten, korrespondierenden Modellelemente vorzunehmen. Dadurch werden Un-terschiede der Elementeigenschaften wie Attribute oder Referenzen erkannt. DieUnterschiede auf Modell- und Elementebene werden anschließend zu einem Diffe-renzmodell zusammengefasst.
376
2.2 Werkzeugunterstutzung
Fur die Berechnung von Modelldifferenzen steht eine Vielzahl an Werkzeugen zur Ver-fugung [ADMR05, RB01, Sch07], wobei in diesem Beitrag eine eingeschrankte Auswahluntersucht wurde. Die Betrachtungen beschranken sich in diesem Artikel auf Werkzeu-ge, welche Modelle des Eclipse Modeling Framework (EMF) verarbeiten konnen, da dieModelle, welche dem Anwendungsfall zugrunde liegen, im EMF-Format vorliegen. Nach-folgend werden drei Werkzeuge vorgestellt.
EMF Compare1 ist Teil des Eclipse Modeling Framework Technology (EMFT)2-Projekts.Es berechnet die Differenz zwischen beliebigen EMF-Modellen, indem es einen Ver-gleichsalgorithmus verwendet, welcher die Elemente beider Modelle anhand speziellerKriterien gegenuberstellt. Die verwendeten Vergleichskriterien sind die Metatypen, Na-men, Attribute und Referenzen sowie die Position der Elemente im Modellbaum. Der Ver-gleich von Attributen wird bspw. auf Basis von String-Werten unter Zuhilfenahme derEditierdistanz von Levensthein berechnet. Die Differenzen werden in einem EMF-Modellserialisiert und konnen somit in EMF weiter verarbeitet werden.
Der Model Matcher [Hil08] ist ein Projekt der Universitat Leipzig und setzt ebenfallsden Vergleichsansatz auf Basis verschiedener Vergleichskriterien um. Dieses Werkzeugverwendet ahnliche Eigenschaften der Modellelemente fur den Vergleich, wie das zu-vor genannte EMF Compare. Die Elemente werden hinsichtlich ihrer Metatypen, ihrenContainment-Beziehungen sowie samtlicher Attribute und Referenzen gegenuber gestellt.Im Gegensatz zu EMF Compare werden Ahnlichkeiten von Attributen mit Hilfe ihrer na-tiven Vergleichsoperationen ermittelt. Des Weiteren wird die Position der Elemente imModellbaum i. d. R. nicht vorgenommen. Diese dient lediglich wahrend des Mappings alsHilfestellung bei der Verarbeitung von grenzwertigen Ergebnissen. Auch hier wird dieermittelte Differenz beider Modelle als EMF-Modell serialisiert.
Das letzte hier genannte Werkzeug ist der bereits im EMF enthaltene Change Recorder.Der Change Recorder stellt eine Realisierung des Protokollierungsansatzes dar und ist so-mit potentiell fehlerunanfalliger als die beiden zuvor genannten Werkzeuge. Er erstellteine Beschreibung der vorgenommenen Anderungen am Modell und stellt diese als ei-genstandiges EMF-Modell zur Verfugung.
3 Anwendungsfall: EPK-zu-BPEL-Transformation
3.1 Beschreibung des Anwendungsfalls
Die zuvor vorgestellten Werkzeuge sollen anhand eines Anwendungsfalls, der EPK-zu-BPEL-Transformation, hinsichtlich bestimmter Testkriterien untersucht werden. Der be-trachtete Anwendungsfall in Abbildung 1 zeigt zwei unterschiedliche Verwendungsmog-
1http://www.eclipse.org/modeling/emft/?project=compare2http://www.eclipse.org/modeling/emft
377
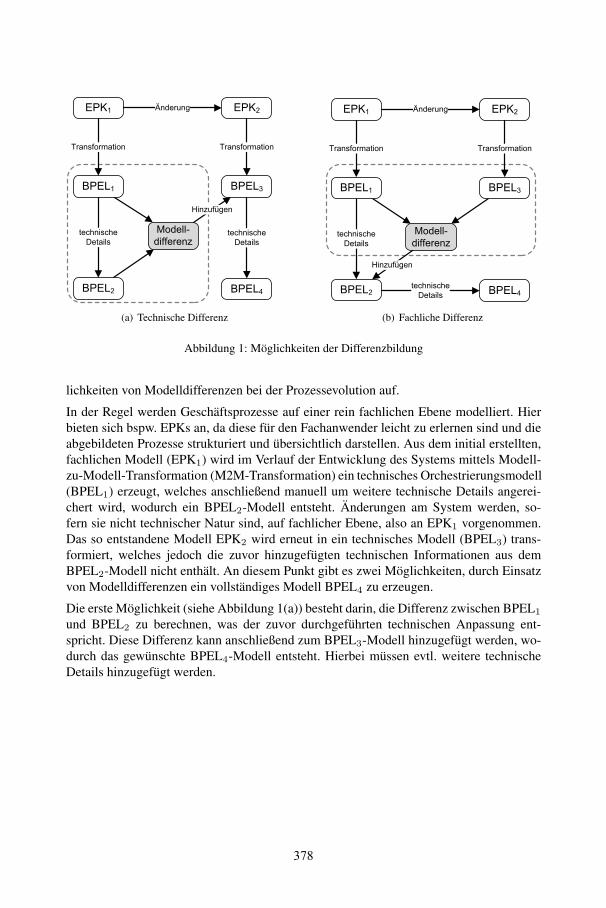
EPK1 EPK2
BPEL4
Änderung
Transformation Transformation
technischeDetails
BPEL1 BPEL3
BPEL2
Modell-differenz
technischeDetails
Hinzufügen
(a) Technische Differenz
EPK1 EPK2
BPEL4
Änderung
Transformation Transformation
technischeDetails
BPEL1 BPEL3
BPEL2
Modell-differenz
technischeDetails
Hinzufügen
(b) Fachliche Differenz
Abbildung 1: Moglichkeiten der Differenzbildung
lichkeiten von Modelldifferenzen bei der Prozessevolution auf.
In der Regel werden Geschaftsprozesse auf einer rein fachlichen Ebene modelliert. Hierbieten sich bspw. EPKs an, da diese fur den Fachanwender leicht zu erlernen sind und dieabgebildeten Prozesse strukturiert und ubersichtlich darstellen. Aus dem initial erstellten,fachlichen Modell (EPK1) wird im Verlauf der Entwicklung des Systems mittels Modell-zu-Modell-Transformation (M2M-Transformation) ein technisches Orchestrierungsmodell(BPEL1) erzeugt, welches anschließend manuell um weitere technische Details angerei-chert wird, wodurch ein BPEL2-Modell entsteht. Anderungen am System werden, so-fern sie nicht technischer Natur sind, auf fachlicher Ebene, also an EPK1 vorgenommen.Das so entstandene Modell EPK2 wird erneut in ein technisches Modell (BPEL3) trans-formiert, welches jedoch die zuvor hinzugefugten technischen Informationen aus demBPEL2-Modell nicht enthalt. An diesem Punkt gibt es zwei Moglichkeiten, durch Einsatzvon Modelldifferenzen ein vollstandiges Modell BPEL4 zu erzeugen.
Die erste Moglichkeit (siehe Abbildung 1(a)) besteht darin, die Differenz zwischen BPEL1
und BPEL2 zu berechnen, was der zuvor durchgefuhrten technischen Anpassung ent-spricht. Diese Differenz kann anschließend zum BPEL3-Modell hinzugefugt werden, wo-durch das gewunschte BPEL4-Modell entsteht. Hierbei mussen evtl. weitere technischeDetails hinzugefugt werden.
378
Die zweite Moglichkeit (siehe Abbildung 1(b)) ist durch die Berechnung der Differenzzwischen den Modellen BPEL1 und BPEL3 gegeben, was der Anderung auf fachlicherEbene entspricht. Diese Differenz wird anschließend zum Modell BPEL2 hinzugefugtund um weitere technische Details erweitert, wodurch ebenfalls das gewunschte BPEL4-Modell entsteht.
3.2 Werkzeugtests
Aufbauend auf dem zuvor beschriebenen Anwendungsfall sollen die beiden WerkzeugeEMF Compare und Model Matcher (siehe Kapitel 2.2) fur die Berechnung der Modell-differenzen zwischen den BPEL-Modellen getestet werden. Der Change Recorder wirdhierbei nicht in die Untersuchung einbezogen, da dieser durch den Protokollierungsan-satz immer eine korrekte Differenz ermittelt. Deshalb wurde eine Gegenuberstellung mitWerkzeugen, denen der Vergleichsansatz zu Grunde liegt, keinen Sinn machen. Des Weite-ren ist eine Protokollierung der fachlichen Anderungen zwischen den technischen BPEL-Modellen durch die vorgenommene M2M-Transformation nicht durchfuhrbar.
Der Werkzeugtest untersucht, wie unterschiedliche Arten von Modellanderungen erkanntund dargestellt werden. Dies soll zum einen die Verwendung der angesprochenen Ver-gleichskriterien evaluieren und zum anderen eventuelle, daraus resultierende Starken undSchwachen einzelner Ansatze aufzeigen. Nachfolgend werden drei Kategorien von Ande-rungsoperationen abgegrenzt.
Kategorie 1: Diese erste Kategorie umfasst Anderungen auf Modellebene wie das Hin-zufugen oder Loschen von einzelnen Modellelementen. Bezogen auf den Anwen-dungsfall treten derartige Anderungen auf, wenn bspw. ein neuer Web-Service ineinen Geschaftsprozess eingegliedert wird, oder aber ein nicht mehr benotigter Ser-vice entfernt wird.
Kategorie 2: In dieser Kategorie werden Veranderungen auf Elementebene betrachtet.Es werden Elementeigenschaften wie Attribute oder auch Referenzen auf andereElemente modifiziert. Derartige Anderungen treten bspw. bei der Anpassung vonServices eines Prozesses auf. Hier kann es vorkommen, dass die Adresse oder auchder Name eines verwendeten Dienstes modifiziert werden muss. Diese Anderun-gen erzeugen beim Matching der Modelle niedrige Vergleichswerte, aus denen beimspateren Mapping potenzielle Schwierigkeiten resultieren.
Kategorie 3: Abschließend werden erneut Anderungen auf Modellebene betrachtet. Hiersollen die Auswirkungen von Elementverschiebungen ermittelt werden. Elemen-te werden als verschoben betrachtet, wenn sie ihre Position im EMF-Modellbaumandern. In diesem Kontext sind zwei Arten von Verschiebung zu betrachten: Ele-mentverschiebungen, die die Semantik des Modells nicht beeinflussen und Element-verschiebungen, die die Semantik des Modells andern.
379
3.3 Auswertung der Tests
Nachfolgend werden die von den Werkzeugen berechneten Differenzen betrachtet undRuckschlusse auf die Verwendung bestimmter Vergleichskriterien gezogen sowie Pro-blemfelder des Matchings und Mappings aufgezeigt.
Kategorie 1: Wahrend der Tests dieser Kategorie wurde beobachtet, dass die hinzugefug-ten und geloschten Modellelemente von beiden Werkzeugen in jedem Fall korrektidentifiziert wurden. Weiterhin wurde festgestellt, dass fur die Ermittlung von hin-zugefugten bzw. entfernten Elementen nur wenige Vergleichskriterien notig waren,sofern die ubrigen Modellelemente keine gravierenden Veranderungen aufwiesen.Ein Problemfeld, welches sich wahrend der Tests offenbarte, ist die Darstellung derberechneten Differenz. Anforderungen an das Differenzmodell in dieser Kategoriesind zum einen, dass es mindestens die hinzugefugten und geloschten Elemente aus-weist und zum anderen, dass keine redundante Erfassung der Anderungen vorliegt.Es wurde beobachtet, dass beide Werkzeuge zwar die Anderungen identifizierenkonnten, allerdings unterschiedlich darstellen. Der Model Matcher weist die Ande-rungen redundant aus (durch Aufzeigen der Anderungen an EMF-internen Referen-zen), was bei einer automatischen Weiterverarbeitung des Differenzmodells ledig-lich die Performanz beeintrachtigen wurde. Im Gegensatz dazu sind die Differen-zen von EMF Compare minimaler als erforderlich. Hier werden bspw. hinzugefugteElemente, welche Kinder von ebenfalls hinzugefugten Elementen sind, nicht expli-zit aufgefuhrt. Diese mussen bei einer Verarbeitung des Differenzmodells aus Morig
bzw. Mmod erneut separat ermittelt werden.
Kategorie 2: Diese Kategorie zeigte sowohl Probleme bei den Vergleichskriterien beiderWerkzeuge, als auch beim Mapping der Werkzeuge auf. Beide Werkzeuge warennicht in der Lage, alle Differenzen korrekt zu ermitteln. Problematisch zeigten sichdie von EMF Compare verwendeten String-basierten Attributvergleiche, bei denendie Levenstheins Editierdistanz genutzt wird und die Verwendung von Baumpositio-nen wahrend des Matchings der Modelle. Werden diese Kriterien fur den Vergleichgenutzt, kann es vorkommen, dass die ermittelten Vergleichswerte ungerechtfertigtnegativ oder positiv beeinflusst werden. Dies ist bspw. der Fall, wenn die geandertenElemente nur wenige Attribute besitzen, welche zum Vergleich herangezogen wer-den konnen. In diesem Fall kann es schwierig sein, ein geeignetes Mapping zu bil-den. Der Model Matcher verwendet hingegen die Datentyp-spezifischen Vergleichs-operatoren fur Attributvergleiche und berucksichtigt die Positionen der Elementenur, falls nach dem Matching mehrere mogliche Kombinationen fur ein Elementexistieren, um eine eindeutige Abbildung zu finden. Dies fuhrte wahrend der Testsoft zu besseren Ergebnissen. Ein weiteres Problemfeld, welches identifiziert wurde,ist die Verwendung von Schwellenwerten fur das Mapping der Modellelemente. DasProblem besteht darin, einen geeigneten Wert zu finden, welcher die Untergrenzefur die Abbildung der Elemente festlegt. Bei EMF Compare konnte beobachtet wer-den, dass diese Schwellenwerte teilweise nicht uberschritten wurden, obwohl kor-respondierende Elemente existierten. Der Model Matcher verzichtet hingegen auf
380
die Verwendung von Schwellenwerten und pruft fur jeden maximalen Vergleichs-wert, ob dieser auch in entgegengesetzter Richtung maximal ist. Dies fuhrt wahrenddes Mappings oft zu besseren Ergebnissen, da es moglich ist, korrespondierendeElemente auch mit niedrigen Vergleichswerten zu ermitteln.
Kategorie 3: Die Tests dieser Kategorie wurden vom Model Matcher ohne Probleme be-waltigt, EMF Compare berechnete hingegen teilweise fehlerhafte Differenzen. Wur-de bspw. der Ablauf des Prozesses geandert, mussten die einzelnen Aktivitaten desProzesses verschoben werden. Diese Verschiebung wirkte sich jedoch auf verschie-dene Referenzen aus, wodurch diese Anderungen durch beide Werkzeuge korrekterkannt wurden. Wurde jedoch ein Element verschoben, ohne den Container zuwechseln, wurden von EMF Compare durch die Verwendung der Baumpositionensowie durch Verwendung der Editierdistanz in einigen Fallen Elemente als geloschtund neu hinzugefugt betrachtet. Dies ist vor allem dann der Fall, wenn die verscho-benen Modellelemente nur wenige Attribute besitzen und Elemente mit ahnlichenAttributwerten existieren. Eine mogliche Losung des Problems setzt die Erkennungder Art der vorliegenden Verschiebungen voraus. Fraglich ist jedoch, wie Element-bewegungen, die die Semantik des Modells andern von denen abgegrenzt werdenkonnen, die die Semantik des Modells nicht andern. Eine denkbare Losung ist ei-ne Konfiguration der Vergleichsalgorithmen, um dem Vergleich Informationen uberdas verwendete Metamodell bereitzustellen.
4 Zusammenfassung
In diesem Artikel wurden Ansatze zur Ermittlung von Modelldifferenzen sowie eine Aus-wahl an differenzberechnenden Werkzeugen vorgestellt. Referenzen zu weiteren Werk-zeugen wurden ebenfalls in Kapitel 2.2 genannt. Weiter existieren zahlreiche Arbeiten,welche Differenzen aus verschiedenen Blickwinkeln betrachten. So werden bspw. nebender Berechnung von Differenzen im Kontext der modellgetriebenen Softwareentwicklung[AP03, KPP06, Tou06, XiS05] Differenzen von XML-Modellen [WDC03] oder auch Da-tenbankschemata und Ontologien [ADMR05, RB01, HB08] untersucht.
Im Speziellen wurde der Einsatz von Modelldifferenzen bei der Modellierung von Ge-schaftsprozessen als Moglichkeit vorgestellt, notwendige manuelle Eingriffe bei der Evo-lution von Prozessmodellen moglichst minimal zu halten. Fur die vorgestellten Verfahren,die Differenzen zweier Modelle zu ermitteln, ergaben sich verschiedene Einsatzfelder. Sostellt bspw. die Protokollierung der Anderungen an Modellen die mit Abstand genaues-te Methode dar, welche jedoch nicht in jedem Fall verwendet werden kann. In diesenFallen ist es wichtig, auf alternative Methoden zur Differenzberechnung zuruckgreifen zukonnen. Zur Evaluierung zweier Berechnungsansatze wurde abschließend eine Reihe vonTests mit den zugehorigen Werkzeugen EMF Compare und Model Matcher durchgefuhrt.
381
Literatur
[ADMR05] David Aumuller, Hong-Hai Do, Sabine Massmann und Erhard Rahm. Schema and on-tology matching with COMA++. In SIGMOD ’05: Proceedings of the 2005 ACM SIG-MOD international conference on Management of data, Seiten 906–908, New York,NY, USA, 2005. ACM.
[AP03] Marcus Alanen und Ivan Porres. Difference and Union of Models. In ”UML“ 2003 –The Unified Modeling Language, Modeling Languages and Applications, Seiten 2–17.2003.
[FKT08] Klaus-Peter Fahnrich, Stefan Kuhne und Maik Thranert. Model-Driven IntegrationEngineering – Modellierung, Validierung und Transformation zur Integration betrieb-licher Anwendungssysteme. Leipziger Beitrage zur Informatik, Band XI. EigenverlagLeipziger Informatik-Verbund (LIV), Leipzig, September 2008.
[HB08] Peter Hansgen und Stefan Butz. Modellgetriebenes Verfahren zur Migration relationa-ler Datenbanken. In Fahnrich et al. [FKT08], Seiten 189–203.
[Hil08] Stanley Hillner. Berechnung und Anwendung von Modelldifferenzen im Geschaftspro-zessmanagement. Bachelorarbeit, Universitat Leipzig, September 2008.
[KNS92] G. Keller, M. Nuttgens und August-Wilhelm Scheer. Semantische Prozeßmodellierungauf der Grundlage ”Ereignisgesteuerter Prozeßketten (EPK)“. Arbeitsbericht Heft 89,Institut fur Wirtschaftsinformatik Universitat Saarbrucken, 1992.
[KPP06] Dimitrios S. Kolovos, Richard F. Paige und Fiona A.C. Polack. Model comparison: afoundation for model composition and model transformation testing. In GaMMa ’06:Proceedings of the 2006 international workshop on Global integrated model manage-ment, Seiten 13–20, New York, NY, USA, 2006. ACM.
[KSI08] Stefan Kuhne, Sebastian Stein und Konstantin Ivanov. Abbildung fachlicher Prozess-modelle auf BPEL-basierte Laufzeitumgebungen. In Fahnrich et al. [FKT08], Seiten93–110.
[RB01] Erhard Rahm und Philip A. Bernstein. A survey of approaches to automatic schemamatching. The VLDB Journal, 10(4):334–350, 2001.
[Sch07] Maik Schmidt. SiDiff: generische, auf Ahnlichkeiten basierende Berechnung vonModelldifferenzen. In Ernst-Erich Doberkat und Udo Kelter, Hrsg., Softwaretechnik-Trends, Jgg. 27, 2007.
[SKD+08] Sebastian Stein, Stefan Kuhne, Jens Drawehn, Sven Feja und Werner Rotzoll. Evaluati-on of OrViA Framework for Model-Driven SOA Implementations: An Industrial CaseStudy. In Marlon Dumas, Manfred Reichert und Ming-Chien Shan, Hrsg., BusinessProcess Management, Jgg. 5240 of LNCS, Seiten 310–325, Milan, Italy, September2–4 2008. Springer.
[TK08] Maik Thranert und Stefan Kuhne. Model-Driven Integration Engineering zur Integra-tion betrieblicher Anwendungssysteme. In Fahnrich et al. [FKT08], Seiten 17–33.
[Tou06] Antoine Toulme. Presentation of EMF Compare Utility. Eclipse Summit Europe 2006,November 2006.
[WDC03] Y. Wang, D. Dewitt und J. Cai. X-Diff: A Fast Change Detection Algorithm for XMLDocuments, 2003.
[XiS05] UMLDiff: an algorithm for object-oriented design differencing, New York, NY, USA,2005. ACM.
382
Deriving Software Architecturesfrom Problem Descriptions
Denis Hatebur and Maritta HeiselUniversitat Duisburg-Essen
[email protected], [email protected]
Abstract: We show how software architectures (including interface descriptions) canbe derived from artifacts set up in the analysis phase of the software lifecycle. Theanalysis phase consists of six steps, where various models are constructed. Especially,the software development problem is decomposed into simple subproblems. The mod-els set up in the analysis phase form the basis for (i) defining software architecturesrelated to single subproblems, (ii) merging the subproblem architectures to obtain theoverall software architecture, and (iii) to define the interfaces between the compo-nents of the overall architecture. The approach is based on problem patterns (problemframes) and the architectural style of layered software architectures.
1 IntroductionSoftware development problems occurring in practice are mostly complex in nature. Theirsolution requires a thorough requirements analysis and a careful design. Requirementsanalysis and the development of an appropriate software architecture are closely relatedand should be conducted in a systematic way.
In this paper, we present a method to derive software architectures from artifacts thatare set up during the requirements analysis phase of the software lifecycle. That methodmakes use of patterns for requirements analysis as well as for developing software ar-chitectures. Requirements patterns are related to architectural patterns. Furthermore, thedecomposition of complex problems into simpler subproblems plays an important role.Finally, information about the environment in which the software will operate is taken intoaccount.
In the following, we describe a model-driven process for requirements analysis that isbased on problem frames [Jac01] in Sect. 2. This process produces a number of artifactsthat can be used to systematically derive a software architecture. Section 3 describes thisderivation. Section 4 describes related work. Section 5 summarizes the contributions ofthis paper.
2 Requirements Engineering Using Problem FramesOur method for deriving software architectures works in connection with a pattern-basedapproach to requirements analysis. It makes use of patterns capturing different classes ofsoftware development problems, called problem frames [Jac01].
383
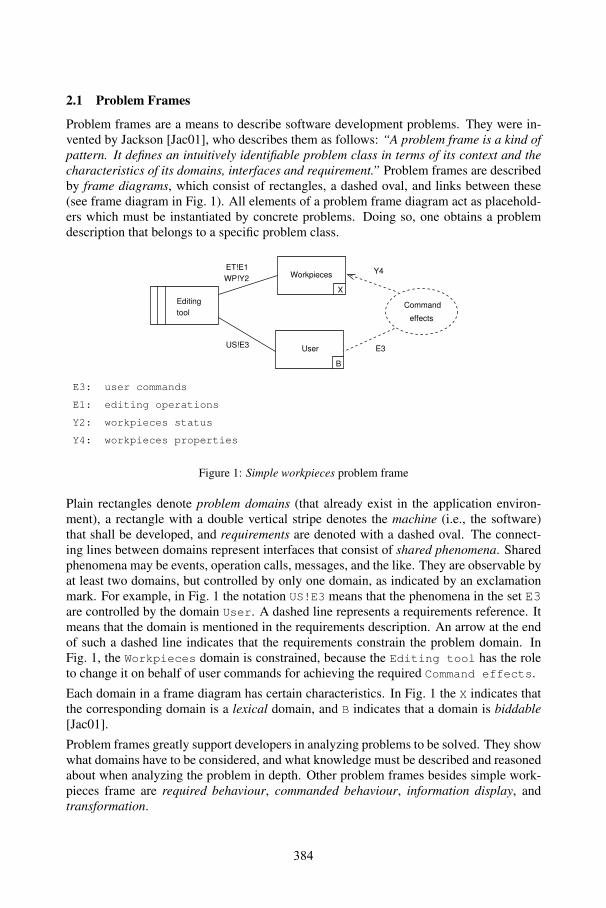
2.1 Problem Frames
Problem frames are a means to describe software development problems. They were in-vented by Jackson [Jac01], who describes them as follows: “A problem frame is a kind ofpattern. It defines an intuitively identifiable problem class in terms of its context and thecharacteristics of its domains, interfaces and requirement.” Problem frames are describedby frame diagrams, which consist of rectangles, a dashed oval, and links between these(see frame diagram in Fig. 1). All elements of a problem frame diagram act as placehold-ers which must be instantiated by concrete problems. Doing so, one obtains a problemdescription that belongs to a specific problem class.
E3
Y4
tooleffects
WP!Y2X
Workpieces
User
ET!E1
US!E3
CommandEditing
B
E3: user commands
E1: editing operations
Y2: workpieces status
Y4: workpieces properties
Figure 1: Simple workpieces problem frame
Plain rectangles denote problem domains (that already exist in the application environ-ment), a rectangle with a double vertical stripe denotes the machine (i.e., the software)that shall be developed, and requirements are denoted with a dashed oval. The connect-ing lines between domains represent interfaces that consist of shared phenomena. Sharedphenomena may be events, operation calls, messages, and the like. They are observable byat least two domains, but controlled by only one domain, as indicated by an exclamationmark. For example, in Fig. 1 the notation US!E3 means that the phenomena in the set E3are controlled by the domain User. A dashed line represents a requirements reference. Itmeans that the domain is mentioned in the requirements description. An arrow at the endof such a dashed line indicates that the requirements constrain the problem domain. InFig. 1, the Workpieces domain is constrained, because the Editing tool has the roleto change it on behalf of user commands for achieving the required Command effects.
Each domain in a frame diagram has certain characteristics. In Fig. 1 the X indicates thatthe corresponding domain is a lexical domain, and B indicates that a domain is biddable[Jac01].
Problem frames greatly support developers in analyzing problems to be solved. They showwhat domains have to be considered, and what knowledge must be described and reasonedabout when analyzing the problem in depth. Other problem frames besides simple work-pieces frame are required behaviour, commanded behaviour, information display, andtransformation.
384
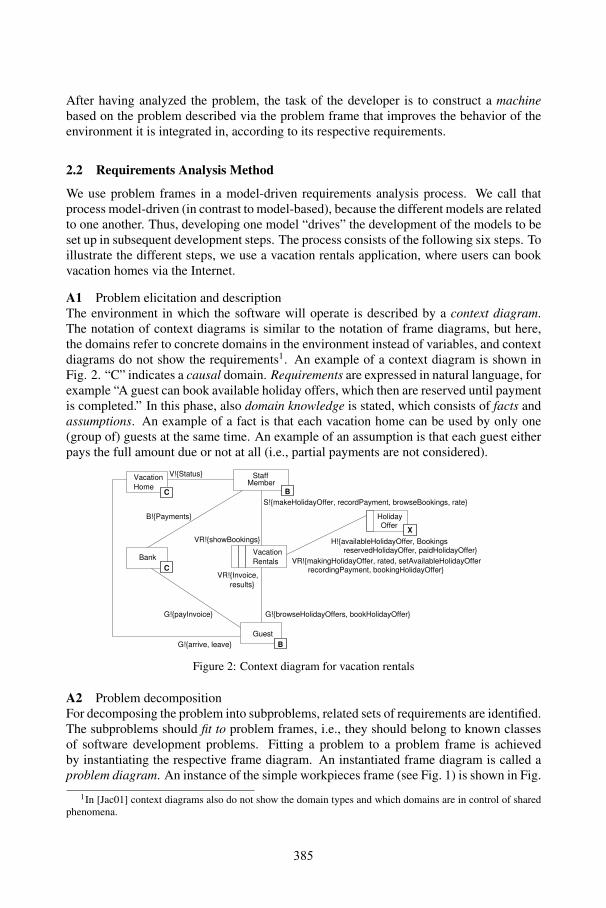
After having analyzed the problem, the task of the developer is to construct a machinebased on the problem described via the problem frame that improves the behavior of theenvironment it is integrated in, according to its respective requirements.
2.2 Requirements Analysis Method
We use problem frames in a model-driven requirements analysis process. We call thatprocess model-driven (in contrast to model-based), because the different models are relatedto one another. Thus, developing one model “drives” the development of the models to beset up in subsequent development steps. The process consists of the following six steps. Toillustrate the different steps, we use a vacation rentals application, where users can bookvacation homes via the Internet.
A1 Problem elicitation and descriptionThe environment in which the software will operate is described by a context diagram.The notation of context diagrams is similar to the notation of frame diagrams, but here,the domains refer to concrete domains in the environment instead of variables, and contextdiagrams do not show the requirements1. An example of a context diagram is shown inFig. 2. “C” indicates a causal domain. Requirements are expressed in natural language, forexample “A guest can book available holiday offers, which then are reserved until paymentis completed.” In this phase, also domain knowledge is stated, which consists of facts andassumptions. An example of a fact is that each vacation home can be used by only one(group of) guests at the same time. An example of an assumption is that each guest eitherpays the full amount due or not at all (i.e., partial payments are not considered).
Vacation
Rentals
Guest
StaffMember
Bank
Vacation
HomeC
B
B
HolidayOffer
X
C
G!{browseHolidayOffers, bookHolidayOffer}
V!{Status}
G!{payInvoice}
G!{arrive, leave}
reservedHolidayOffer, paidHolidayOffer}
recordingPayment, bookingHolidayOffer}
S!{makeHolidayOffer, recordPayment, browseBookings, rate}
VR!{makingHolidayOffer, rated, setAvailableHolidayOffer
H!{availableHolidayOffer, Bookings
VR!{Invoice,
results}
B!{Payments}
VR!{showBookings}
Figure 2: Context diagram for vacation rentals
A2 Problem decompositionFor decomposing the problem into subproblems, related sets of requirements are identified.The subproblems should fit to problem frames, i.e., they should belong to known classesof software development problems. Fitting a problem to a problem frame is achievedby instantiating the respective frame diagram. An instantiated frame diagram is called aproblem diagram. An instance of the simple workpieces frame (see Fig. 1) is shown in Fig.
1In [Jac01] context diagrams also do not show the domain types and which domains are in control of sharedphenomena.
385
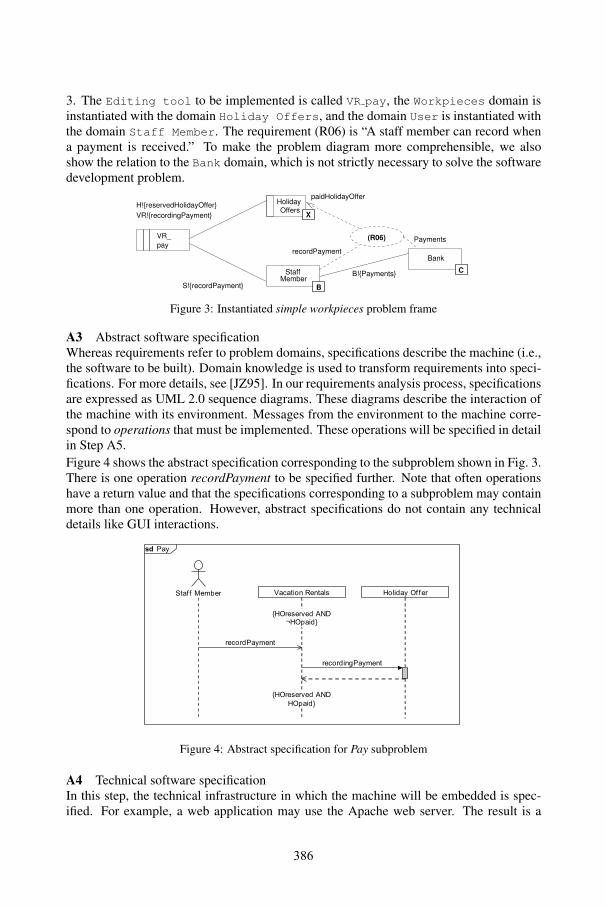
3. The Editing tool to be implemented is called VR pay, the Workpieces domain isinstantiated with the domain Holiday Offers, and the domain User is instantiated withthe domain Staff Member. The requirement (R06) is “A staff member can record whena payment is received.” To make the problem diagram more comprehensible, we alsoshow the relation to the Bank domain, which is not strictly necessary to solve the softwaredevelopment problem.
VR_
pay
HolidayOffers
X
StaffMember
B
Bank
C
S!{recordPayment}
VR!{recordingPayment}
H!{reservedHolidayOffer}
(R06) Payments
paidHolidayOffer
recordPayment
B!{Payments}
Figure 3: Instantiated simple workpieces problem frame
A3 Abstract software specificationWhereas requirements refer to problem domains, specifications describe the machine (i.e.,the software to be built). Domain knowledge is used to transform requirements into speci-fications. For more details, see [JZ95]. In our requirements analysis process, specificationsare expressed as UML 2.0 sequence diagrams. These diagrams describe the interaction ofthe machine with its environment. Messages from the environment to the machine corre-spond to operations that must be implemented. These operations will be specified in detailin Step A5.Figure 4 shows the abstract specification corresponding to the subproblem shown in Fig. 3.There is one operation recordPayment to be specified further. Note that often operationshave a return value and that the specifications corresponding to a subproblem may containmore than one operation. However, abstract specifications do not contain any technicaldetails like GUI interactions.
"! )'&
%$'# # "!:8!6 4'2'$0., *!,$'(= ;.(09'& 7##!6
5;76!=!63!9 1/-+;7?'09>
6!2.69)'&:!,$
6!2.690,<)'&:!,$
5;76!=!63!9 1/-
;7?'09>
Figure 4: Abstract specification for Pay subproblem
A4 Technical software specificationIn this step, the technical infrastructure in which the machine will be embedded is spec-ified. For example, a web application may use the Apache web server. The result is a
386
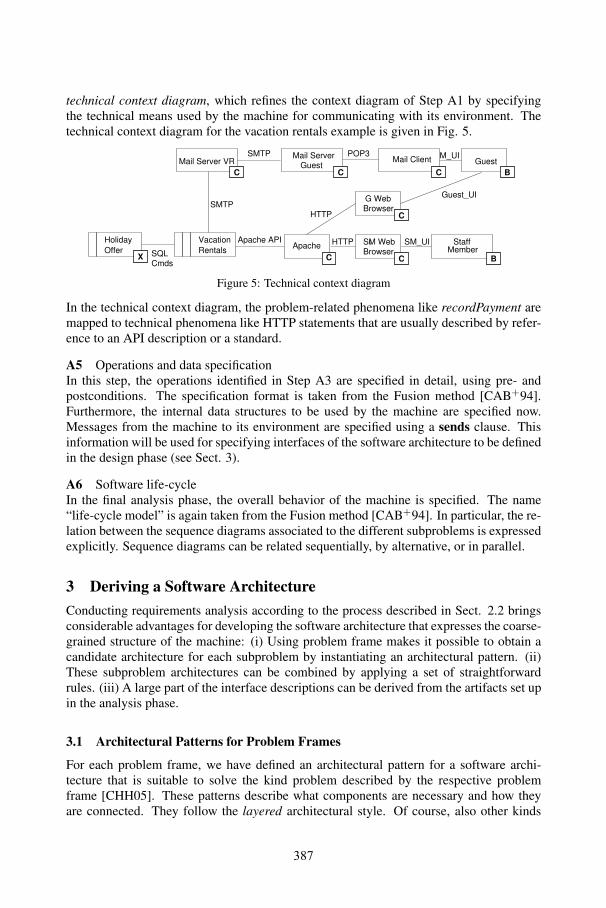
technical context diagram, which refines the context diagram of Step A1 by specifyingthe technical means used by the machine for communicating with its environment. Thetechnical context diagram for the vacation rentals example is given in Fig. 5.
Vacation
RentalsStaff
Member
GuestMail Server VR
Holiday
Offer SQLCmds
SMTP Mail ServerGuest
POP3Mail Client
ApacheApache API
SMTP
HTTP SM_UI
Browser
Guest_UI
HTTP
t
BrowserSM Web
G Web
M_UI
X
C C C
B
B
C
CC
Figure 5: Technical context diagram
In the technical context diagram, the problem-related phenomena like recordPayment aremapped to technical phenomena like HTTP statements that are usually described by refer-ence to an API description or a standard.
A5 Operations and data specificationIn this step, the operations identified in Step A3 are specified in detail, using pre- andpostconditions. The specification format is taken from the Fusion method [CAB+94].Furthermore, the internal data structures to be used by the machine are specified now.Messages from the machine to its environment are specified using a sends clause. Thisinformation will be used for specifying interfaces of the software architecture to be definedin the design phase (see Sect. 3).
A6 Software life-cycleIn the final analysis phase, the overall behavior of the machine is specified. The name“life-cycle model” is again taken from the Fusion method [CAB+94]. In particular, the re-lation between the sequence diagrams associated to the different subproblems is expressedexplicitly. Sequence diagrams can be related sequentially, by alternative, or in parallel.
3 Deriving a Software ArchitectureConducting requirements analysis according to the process described in Sect. 2.2 bringsconsiderable advantages for developing the software architecture that expresses the coarse-grained structure of the machine: (i) Using problem frame makes it possible to obtain acandidate architecture for each subproblem by instantiating an architectural pattern. (ii)These subproblem architectures can be combined by applying a set of straightforwardrules. (iii) A large part of the interface descriptions can be derived from the artifacts set upin the analysis phase.
3.1 Architectural Patterns for Problem Frames
For each problem frame, we have defined an architectural pattern for a software archi-tecture that is suitable to solve the kind problem described by the respective problemframe [CHH05]. These patterns describe what components are necessary and how theyare connected. They follow the layered architectural style. Of course, also other kinds
387
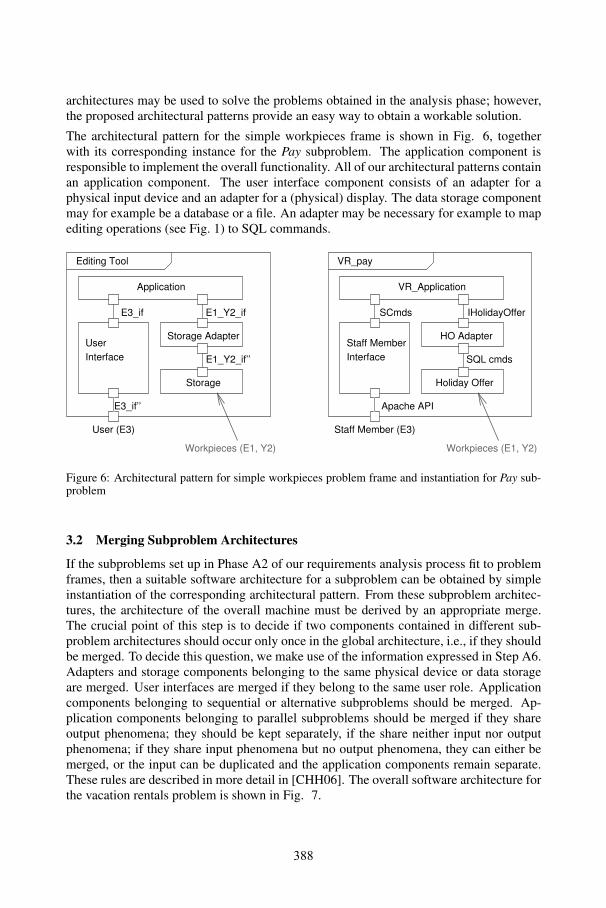
architectures may be used to solve the problems obtained in the analysis phase; however,the proposed architectural patterns provide an easy way to obtain a workable solution.
The architectural pattern for the simple workpieces frame is shown in Fig. 6, togetherwith its corresponding instance for the Pay subproblem. The application component isresponsible to implement the overall functionality. All of our architectural patterns containan application component. The user interface component consists of an adapter for aphysical input device and an adapter for a (physical) display. The data storage componentmay for example be a database or a file. An adapter may be necessary for example to mapediting operations (see Fig. 1) to SQL commands.
Application
Interface
User
User (E3)
Workpieces (E1, Y2)
Storage Adapter
Storage
Editing Tool
E3_if
E3_if’’
E1_Y2_if
E1_Y2_if’’
VR_Application
Interface
VR_pay
Staff Member (E3)
Holiday Offer
Workpieces (E1, Y2)
IHolidayOffer
SQL cmds
SCmds
Staff MemberHO Adapter
Apache API
Figure 6: Architectural pattern for simple workpieces problem frame and instantiation for Pay sub-problem
3.2 Merging Subproblem Architectures
If the subproblems set up in Phase A2 of our requirements analysis process fit to problemframes, then a suitable software architecture for a subproblem can be obtained by simpleinstantiation of the corresponding architectural pattern. From these subproblem architec-tures, the architecture of the overall machine must be derived by an appropriate merge.The crucial point of this step is to decide if two components contained in different sub-problem architectures should occur only once in the global architecture, i.e., if they shouldbe merged. To decide this question, we make use of the information expressed in Step A6.Adapters and storage components belonging to the same physical device or data storageare merged. User interfaces are merged if they belong to the same user role. Applicationcomponents belonging to sequential or alternative subproblems should be merged. Ap-plication components belonging to parallel subproblems should be merged if they shareoutput phenomena; they should be kept separately, if the share neither input nor outputphenomena; if they share input phenomena but no output phenomena, they can either bemerged, or the input can be duplicated and the application components remain separate.These rules are described in more detail in [CHH06]. The overall software architecture forthe vacation rentals problem is shown in Fig. 7.
388
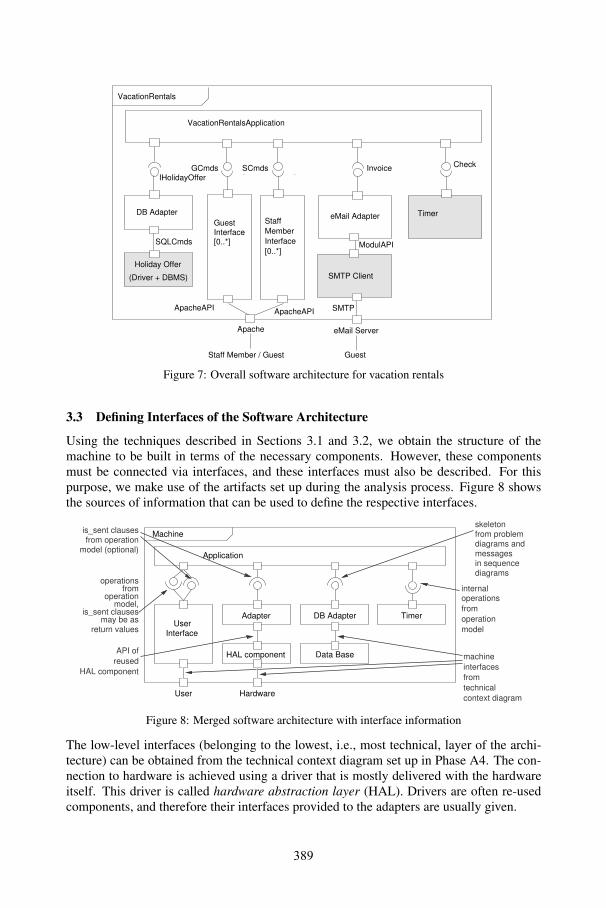
Timer
Check
eMail Adapter
SMTP
eMail Server
Guest
SMTP Client
Invoice
ModulAPI
DB Adapter
Apache
Staff Member / Guest
IHolidayOffer
VacationRentalsApplication
(Driver + DBMS)
Holiday Offer
VacationRentals
SQLCmds [0..*]InterfaceGuest
ApacheAPI
GCmds SCmds
Staff
Member
Interface
[0..*]
ApacheAPI
Figure 7: Overall software architecture for vacation rentals
3.3 Defining Interfaces of the Software Architecture
Using the techniques described in Sections 3.1 and 3.2, we obtain the structure of themachine to be built in terms of the necessary components. However, these componentsmust be connected via interfaces, and these interfaces must also be described. For thispurpose, we make use of the artifacts set up during the analysis process. Figure 8 showsthe sources of information that can be used to define the respective interfaces.
Application
Machine
Data Base
InterfaceUser
DB Adapter Timer
is_sent clauses
from
operation
model
operationsinternal
machine
interfaces
from
technical
context diagram
HAL componentAPI of
reused
HAL component
User Hardware
Adapter
operationsfrom
operation
is_sent clausesmay be as
return values
model,
from operationmodel (optional)
skeletonfrom problemdiagrams andmessagesin sequencediagrams
Figure 8: Merged software architecture with interface information
The low-level interfaces (belonging to the lowest, i.e., most technical, layer of the archi-tecture) can be obtained from the technical context diagram set up in Phase A4. The con-nection to hardware is achieved using a driver that is mostly delivered with the hardwareitself. This driver is called hardware abstraction layer (HAL). Drivers are often re-usedcomponents, and therefore their interfaces provided to the adapters are usually given.
389
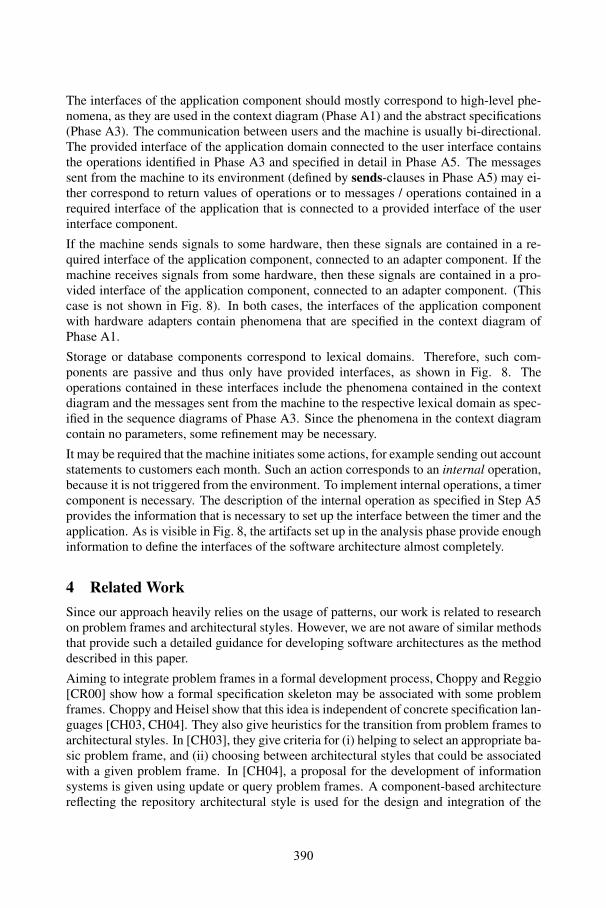
The interfaces of the application component should mostly correspond to high-level phe-nomena, as they are used in the context diagram (Phase A1) and the abstract specifications(Phase A3). The communication between users and the machine is usually bi-directional.The provided interface of the application domain connected to the user interface containsthe operations identified in Phase A3 and specified in detail in Phase A5. The messagessent from the machine to its environment (defined by sends-clauses in Phase A5) may ei-ther correspond to return values of operations or to messages / operations contained in arequired interface of the application that is connected to a provided interface of the userinterface component.
If the machine sends signals to some hardware, then these signals are contained in a re-quired interface of the application component, connected to an adapter component. If themachine receives signals from some hardware, then these signals are contained in a pro-vided interface of the application component, connected to an adapter component. (Thiscase is not shown in Fig. 8). In both cases, the interfaces of the application componentwith hardware adapters contain phenomena that are specified in the context diagram ofPhase A1.
Storage or database components correspond to lexical domains. Therefore, such com-ponents are passive and thus only have provided interfaces, as shown in Fig. 8. Theoperations contained in these interfaces include the phenomena contained in the contextdiagram and the messages sent from the machine to the respective lexical domain as spec-ified in the sequence diagrams of Phase A3. Since the phenomena in the context diagramcontain no parameters, some refinement may be necessary.
It may be required that the machine initiates some actions, for example sending out accountstatements to customers each month. Such an action corresponds to an internal operation,because it is not triggered from the environment. To implement internal operations, a timercomponent is necessary. The description of the internal operation as specified in Step A5provides the information that is necessary to set up the interface between the timer and theapplication. As is visible in Fig. 8, the artifacts set up in the analysis phase provide enoughinformation to define the interfaces of the software architecture almost completely.
4 Related WorkSince our approach heavily relies on the usage of patterns, our work is related to researchon problem frames and architectural styles. However, we are not aware of similar methodsthat provide such a detailed guidance for developing software architectures as the methoddescribed in this paper.
Aiming to integrate problem frames in a formal development process, Choppy and Reggio[CR00] show how a formal specification skeleton may be associated with some problemframes. Choppy and Heisel show that this idea is independent of concrete specification lan-guages [CH03, CH04]. They also give heuristics for the transition from problem frames toarchitectural styles. In [CH03], they give criteria for (i) helping to select an appropriate ba-sic problem frame, and (ii) choosing between architectural styles that could be associatedwith a given problem frame. In [CH04], a proposal for the development of informationsystems is given using update or query problem frames. A component-based architecturereflecting the repository architectural style is used for the design and integration of the
390
different system parts. In [CHH05] a systematic proposal for architectural patterns associ-ated with basic problem frames is given. The UML 2 composite structure notation allowsone to express interfaces, and the problem frames phenomena are systematically taken intoaccount.The approach developed by Hall, Rapanotti et al. [HJL+02, RHJN04] is quite comple-mentary to ours, since the idea developed there is to introduce architectural concepts intoproblem frames (introducing “AFrames”) so as to benefit from existing architectures. In[HJL+02], the applicability of problem frames is extended to include domains with ex-isting architectural support, and to allow both for an annotated machine domain, and forannotations to discharge the frame concern. In [RHJN04], “AFrames” are presented cor-responding to the architectural styles Pipe-and-Filter and Model-View-Controller (MVC),and applied to transformation and control problems.Barroca et al. [BFJ+04] extend the problem frame approach with coordination concepts.This leads to a description of coordination interfaces in terms of services and events (re-ferred to respectively here as actuators and sensors) together with required properties, andthe use of coordination rules to describe the machine behavior.
5 ConclusionsWe have shown that software architectures can be developed in a routine way, startingfrom a rigorous model-driven requirements analysis process. The techniques describedin Sections 3.1 and 3.2 have been published before. The requirements analysis processdescribed in Section 2.2, however, is new and has not been published previously. It differsfrom the process described in [CHH06] especially by introduction of the technical contextdiagram in Phase A4 and the operation model in Phase A5. These two artifacts make itpossible to derive not only the components of a software architecture in a systematic way,but also its interfaces. Thus, the procedure described in Section 3.3 is also new.As for the applicability of the method, we do not see any principal limitations. Evennon-functional requirements such as security or usability can be treated in a similar way[HHS06, WS06]. However, the described approach does not cover the deployment viewon the software to be developed. Hence, in its current form it is best suited for “single-host” software. However, the method could be enhanced to cover the deployment view,too.Since the method is quite systematic, tool support for its application is envisaged. Cur-rently, we mostly use standard UML tools. As a first step towards specialized tool support,we have implemented a first prototype that allows to define and semantically check prob-lem frames [HHS08].Tool support and a further completion of the method (e.g., by integrating deploymentviews) are subject of future work.
References
[BFJ+04] Leonor Barroca, Jose Luiz Fiadeiro, Michael Jackson, Robin C. Laney, and Bashar Nu-seibeh. Problem Frames: A Case for Coordination. In Rocco De Nicola, Gian Luigi
391
Ferrari, and Greg Meredith, editors, Coordination Models and Languages, 6th Interna-tional Conference, COORDINATION 2004, Pisa, Italy, February 24-27, 2004, Proceed-ings, pages 5–19, 2004.
[CAB+94] D. Coleman, P. Arnold, S. Bodoff, C. Dollin, H. Gilchrist, F. Hayes, and P. Jeremaes.Object-Oriented Development: The Fusion Method. Prentice Hall, 1994. (out of print).
[CH03] Christine Choppy and Maritta Heisel. Use of Patterns in Formal Development: System-atic Transition From Problems to Architectural Designs. In M. Wirsing, R. Hennicker,and D. Pattinson, editors, Recent Trends in Algebraic Development Techniques, 16thWADT, Selected Papers, LNCS 2755, pages 205–220. Springer Verlag, 2003.
[CH04] Christine Choppy and Maritta Heisel. Une approache a base de ”patrons” pour laspecification et le developpement de systemes d’information. In Proceedings ApprochesFormelles dans l’Assistance au Developpement de Logiciels - AFADL’2004, pages 61–76, 2004.
[CHH05] C. Choppy, D. Hatebur, and M. Heisel. Architectural Patterns for Problem Frames. IEEProceedings – Software, Special Issue on Relating Software Requirements and Archi-tectures, 152(4):198–208, 2005.
[CHH06] C. Choppy, D. Hatebur, and M. Heisel. Component composition through architecturalpatterns for problem frames. In Proc. XIII Asia Pacific Software Engineering Confer-ence, pages 27–34. IEEE Computer Society, 2006.
[CR00] Christine Choppy and Gianna Reggio. Using CASL to Specify the Requirementsand the Design: A Problem Specific Approach. In D. Bert, C. Choppy, andP. D. Mosses, editors, Recent Trends in Algebraic Development Techniques, 14thWADT, Selected Papers, LNCS 1827, pages 104–123. Springer Verlag, 2000. see:ftp://ftp.disi.unige.it/person/ReggioG/ ChoppyReggio99a.ps.
[HHS06] Denis Hatebur, Maritta Heisel, and Holger Schmidt. Security Engineering using Prob-lem Frames. In Gunter Muller, editor, Proc. International Conference on Emerg-ing Trends in Information and Communication Security, LNCS 3995, pages 238–253.Springer-Verlag, 2006.
[HHS08] Denis Hatebur, Maritta Heisel, and Holger Schmidt. A Formal Metamodel for ProblemFrames. In Proceedings of the International Conference on Model Driven Engineer-ing Languages and Systems (MODELS), volume 5301, pages 68–82. Springer Berlin /Heidelberg, 2008.
[HJL+02] Jon G. Hall, Michael Jackson, Robin C. Laney, Bashar Nuseibeh, and Lucia Rapan-otti. Relating Software Requirements and Architectures using Problem Frames. In Pro-ceedings of IEEE International Requirements Engineering Conference (RE’02), Essen,Germany, 9-13 September 2002.
[Jac01] M. Jackson. Problem Frames. Analyzing and structuring software development prob-lems. Addison-Wesley, 2001.
[JZ95] M. Jackson and P. Zave. Deriving Specifications from Requirements: an Example. InProc. 17th Int. Conf. on Software Engineering, Seattle, USA, pages 15–24. ACM Press,1995.
[RHJN04] Lucia Rapanotti, Jon G. Hall, Michael Jackson, and Bashar Nuseibeh. ArchitectureDriven Problem Decomposition. In Proceedings of 12th IEEE International Require-ments Engineering Conference (RE’04), Kyoto, Japan, 6-10 September 2004.
[WS06] Ina Wentzlaff and Markus Specker. Pattern-based Development of User-Friendly WebApplications. In Workshop Proceedings of the 6th International Conference on WebEngineering (ICWE’06), New York, USA, 2006. ACM Press.
392
Softwaremodernisierung durch werkzeugunterstütztesVerschieben von Codeblöcken
Marvin Ferber, Sascha Hunold, Thomas RauberLehrstuhl für Angewandte Informatik II, Universität Bayreuth
{marvin.ferber, hunold, rauber}@uni-bayreuth.de
Björn Krellner, Thomas Reichel, Gudula RüngerProfessur Praktische Informatik, Technische Universität Chemnitz
{bjoern.krellner, thomas.reichel, ruenger}@informatik.tu-chemnitz.de
Abstract: Das Zerlegen und Verschieben von Funktionen innerhalb einerSoftware ist ein wichtiges Mittel zur Umstrukturierung von Legacy-Anwen-dungen. Damit können sowohl die Komplexität einzelner Klassen reduziertals auch Komponenten durch Neuimplementierungen ersetzt werden. In demvorliegenden Artikel wird beschrieben, wie und unter welchen Voraussetzun-gen zusammenhängende Teile von Klassen verschoben werden können. Dazuwerden MemberGroups betrachtet, die einen zusammengehörenden Teil vonKlassen darstellen und vom Rest der Klasse unabhängig sind. Das vorgestellteVerfahren wird anhand eines Codebeispiels erläutert.
1 Einleitung
Wartung und Weiterentwicklung großer Softwaresysteme ist ein weitreichendes Pro-blem in der Softwareindustrie. Die Größe und Komplexität einzelner Softwaresys-teme ist für einen einzelnen Programmierer kaum noch zu überblicken. Trotzdemunterliegt die Software ständig neuen Anforderungen und Kundenwünschen, die esnotwendig machen, Teile des Gesamtsystems anzupassen oder neue Komponentenzu integrieren. Dadurch muss die Architektur und das Design verschiedener Kom-ponenten angepasst werden. Aufgrund bestehender Strukturen können diese Än-derungen oftmals nur behelfsmäßig in die Software eingearbeitet werden [Mas05].Diese und weitere Probleme von Legacy-Software werden auch als Code Decay be-zeichnet [EGK+01]. Eine ökonomisch tragbare Weiterentwicklung der über Jahregewachsenen Software ist oft nur durch eine Reorganisation der Gesamtarchitekturmöglich.Das Projekt TransBS1 beschäftigt sich mit der Legacy-Problematik von monolithi-scher Geschäftssoftware (z. B. ERP-Systeme). In [HKK+08] wird das favorisierteVorgehen zur Modernisierung derartiger Softwaresysteme beschrieben. Mit dem
1Das diesem Bericht zugrundeliegende Vorhaben wurde mit Mitteln des Bundesministeriumsfür Bildung, und Forschung unter dem Förderkennzeichen 01 ISF 10 A gefördert. Die Verantwor-tung für den Inhalt dieser Veröffentlichung liegt beim Autor.
393
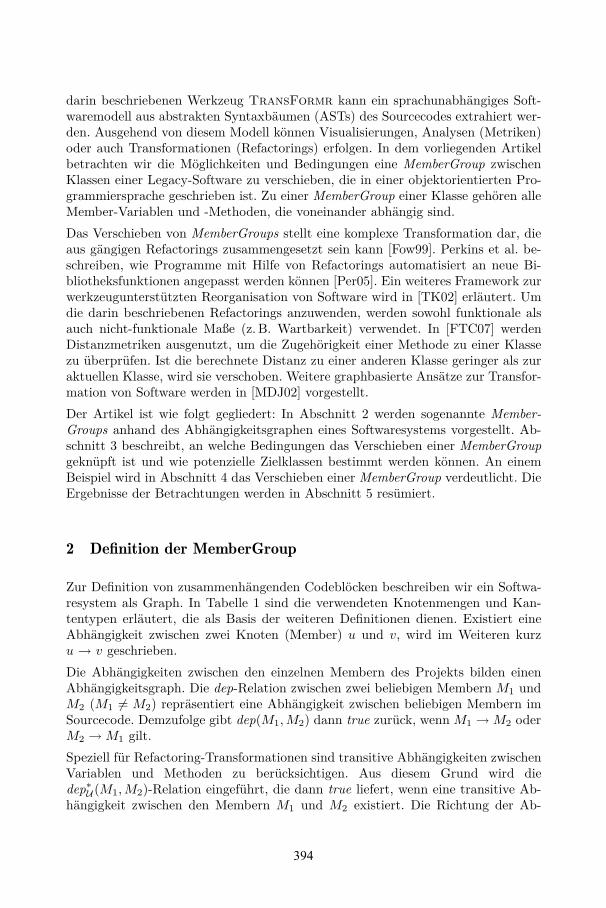
darin beschriebenen Werkzeug TransFormr kann ein sprachunabhängiges Soft-waremodell aus abstrakten Syntaxbäumen (ASTs) des Sourcecodes extrahiert wer-den. Ausgehend von diesem Modell können Visualisierungen, Analysen (Metriken)oder auch Transformationen (Refactorings) erfolgen. In dem vorliegenden Artikelbetrachten wir die Möglichkeiten und Bedingungen eine MemberGroup zwischenKlassen einer Legacy-Software zu verschieben, die in einer objektorientierten Pro-grammiersprache geschrieben ist. Zu einer MemberGroup einer Klasse gehören alleMember-Variablen und -Methoden, die voneinander abhängig sind.Das Verschieben von MemberGroups stellt eine komplexe Transformation dar, dieaus gängigen Refactorings zusammengesetzt sein kann [Fow99]. Perkins et al. be-schreiben, wie Programme mit Hilfe von Refactorings automatisiert an neue Bi-bliotheksfunktionen angepasst werden können [Per05]. Ein weiteres Framework zurwerkzeugunterstützten Reorganisation von Software wird in [TK02] erläutert. Umdie darin beschriebenen Refactorings anzuwenden, werden sowohl funktionale alsauch nicht-funktionale Maße (z. B. Wartbarkeit) verwendet. In [FTC07] werdenDistanzmetriken ausgenutzt, um die Zugehörigkeit einer Methode zu einer Klassezu überprüfen. Ist die berechnete Distanz zu einer anderen Klasse geringer als zuraktuellen Klasse, wird sie verschoben. Weitere graphbasierte Ansätze zur Transfor-mation von Software werden in [MDJ02] vorgestellt.Der Artikel ist wie folgt gegliedert: In Abschnitt 2 werden sogenannte Member-Groups anhand des Abhängigkeitsgraphen eines Softwaresystems vorgestellt. Ab-schnitt 3 beschreibt, an welche Bedingungen das Verschieben einer MemberGroupgeknüpft ist und wie potenzielle Zielklassen bestimmt werden können. An einemBeispiel wird in Abschnitt 4 das Verschieben einer MemberGroup verdeutlicht. DieErgebnisse der Betrachtungen werden in Abschnitt 5 resümiert.
2 Definition der MemberGroup
Zur Definition von zusammenhängenden Codeblöcken beschreiben wir ein Softwa-resystem als Graph. In Tabelle 1 sind die verwendeten Knotenmengen und Kan-tentypen erläutert, die als Basis der weiteren Definitionen dienen. Existiert eineAbhängigkeit zwischen zwei Knoten (Member) u und v, wird im Weiteren kurzu → v geschrieben.Die Abhängigkeiten zwischen den einzelnen Membern des Projekts bilden einenAbhängigkeitsgraph. Die dep-Relation zwischen zwei beliebigen Membern M1 undM2 (M1 (= M2) repräsentiert eine Abhängigkeit zwischen beliebigen Membern imSourcecode. Demzufolge gibt dep(M1,M2) dann true zurück, wennM1 →M2 oderM2 →M1 gilt.Speziell für Refactoring-Transformationen sind transitive Abhängigkeiten zwischenVariablen und Methoden zu berücksichtigen. Aus diesem Grund wird diedep∗U (M1,M2)-Relation eingeführt, die dann true liefert, wenn eine transitive Ab-hängigkeit zwischen den Membern M1 und M2 existiert. Die Richtung der Ab-
394
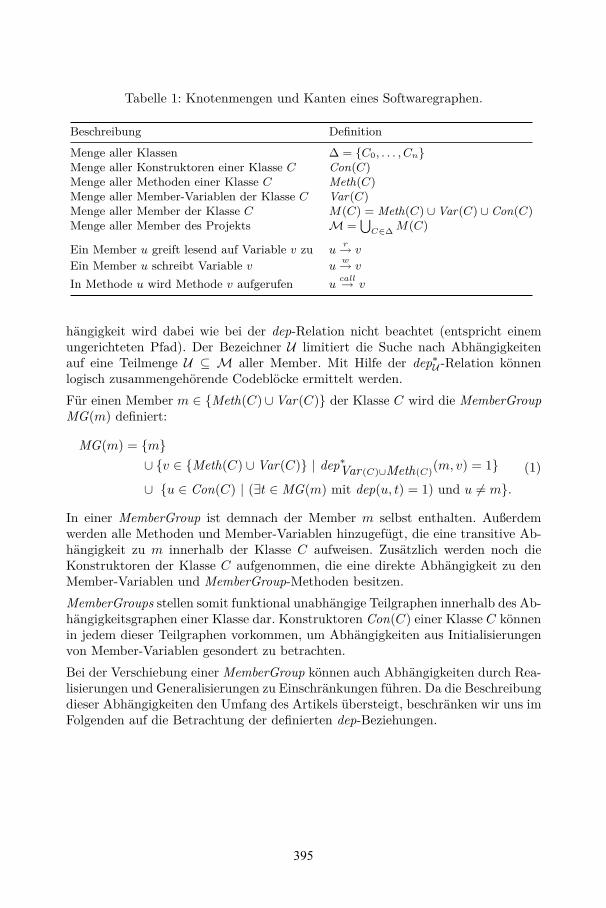
Tabelle 1: Knotenmengen und Kanten eines Softwaregraphen.
Beschreibung Definition
Menge aller Klassen Δ = {C0, . . . , Cn}Menge aller Konstruktoren einer Klasse C Con(C)Menge aller Methoden einer Klasse C Meth(C)Menge aller Member-Variablen der Klasse C Var(C)Menge aller Member der Klasse C M(C) = Meth(C) ∪Var(C) ∪ Con(C)Menge aller Member des Projekts M =
!C∈ΔM(C)
Ein Member u greift lesend auf Variable v zu ur→ v
Ein Member u schreibt Variable v uw→ v
In Methode u wird Methode v aufgerufen ucall→ v
hängigkeit wird dabei wie bei der dep-Relation nicht beachtet (entspricht einemungerichteten Pfad). Der Bezeichner U limitiert die Suche nach Abhängigkeitenauf eine Teilmenge U ⊆ M aller Member. Mit Hilfe der dep∗U -Relation könnenlogisch zusammengehörende Codeblöcke ermittelt werden.Für einen Member m ∈ {Meth(C)∪Var(C)} der Klasse C wird die MemberGroupMG(m) definiert:
MG(m) = {m}∪ {v ∈ {Meth(C) ∪Var(C)} | dep∗Var(C)∪Meth(C)(m, v) = 1}∪ {u ∈ Con(C) | (∃t ∈ MG(m) mit dep(u, t) = 1) und u (= m}.
(1)
In einer MemberGroup ist demnach der Member m selbst enthalten. Außerdemwerden alle Methoden und Member-Variablen hinzugefügt, die eine transitive Ab-hängigkeit zu m innerhalb der Klasse C aufweisen. Zusätzlich werden noch dieKonstruktoren der Klasse C aufgenommen, die eine direkte Abhängigkeit zu denMember-Variablen und MemberGroup-Methoden besitzen.MemberGroups stellen somit funktional unabhängige Teilgraphen innerhalb des Ab-hängigkeitsgraphen einer Klasse dar. Konstruktoren Con(C) einer Klasse C könnenin jedem dieser Teilgraphen vorkommen, um Abhängigkeiten aus Initialisierungenvon Member-Variablen gesondert zu betrachten.Bei der Verschiebung einer MemberGroup können auch Abhängigkeiten durch Rea-lisierungen und Generalisierungen zu Einschränkungen führen. Da die Beschreibungdieser Abhängigkeiten den Umfang des Artikels übersteigt, beschränken wir uns imFolgenden auf die Betrachtung der definierten dep-Beziehungen.
395
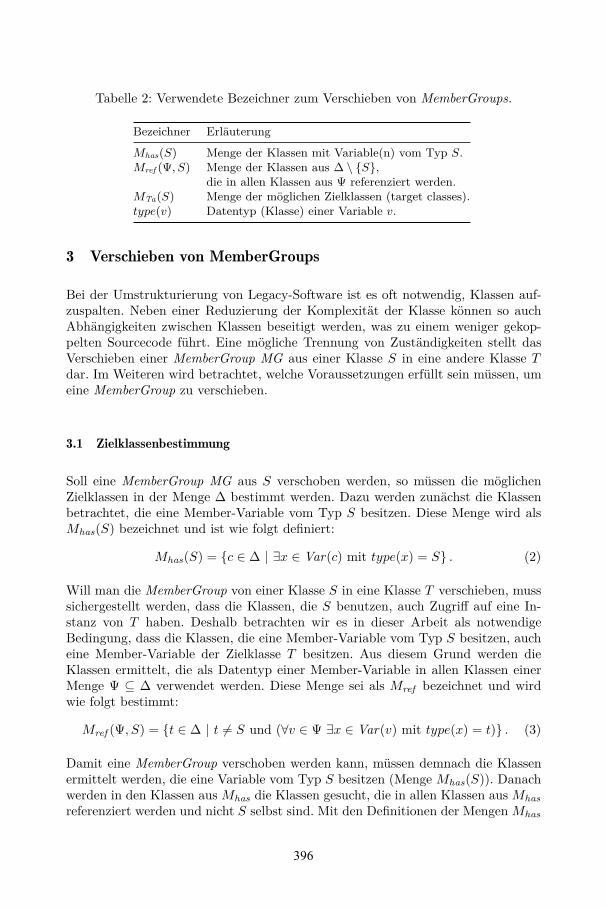
Tabelle 2: Verwendete Bezeichner zum Verschieben von MemberGroups.
Bezeichner Erläuterung
Mhas(S) Menge der Klassen mit Variable(n) vom Typ S.Mref (Ψ, S) Menge der Klassen aus Δ \ {S},
die in allen Klassen aus Ψ referenziert werden.MTa(S) Menge der möglichen Zielklassen (target classes).type(v) Datentyp (Klasse) einer Variable v.
3 Verschieben von MemberGroups
Bei der Umstrukturierung von Legacy-Software ist es oft notwendig, Klassen auf-zuspalten. Neben einer Reduzierung der Komplexität der Klasse können so auchAbhängigkeiten zwischen Klassen beseitigt werden, was zu einem weniger gekop-pelten Sourcecode führt. Eine mögliche Trennung von Zuständigkeiten stellt dasVerschieben einer MemberGroup MG aus einer Klasse S in eine andere Klasse Tdar. Im Weiteren wird betrachtet, welche Voraussetzungen erfüllt sein müssen, umeine MemberGroup zu verschieben.
3.1 Zielklassenbestimmung
Soll eine MemberGroup MG aus S verschoben werden, so müssen die möglichenZielklassen in der Menge Δ bestimmt werden. Dazu werden zunächst die Klassenbetrachtet, die eine Member-Variable vom Typ S besitzen. Diese Menge wird alsMhas(S) bezeichnet und ist wie folgt definiert:
Mhas(S) = {c ∈ Δ | ∃x ∈ Var(c) mit type(x) = S} . (2)
Will man die MemberGroup von einer Klasse S in eine Klasse T verschieben, musssichergestellt werden, dass die Klassen, die S benutzen, auch Zugriff auf eine In-stanz von T haben. Deshalb betrachten wir es in dieser Arbeit als notwendigeBedingung, dass die Klassen, die eine Member-Variable vom Typ S besitzen, aucheine Member-Variable der Zielklasse T besitzen. Aus diesem Grund werden dieKlassen ermittelt, die als Datentyp einer Member-Variable in allen Klassen einerMenge Ψ ⊆ Δ verwendet werden. Diese Menge sei als Mref bezeichnet und wirdwie folgt bestimmt:
Mref (Ψ, S) = {t ∈ Δ | t (= S und (∀v ∈ Ψ ∃x ∈ Var(v) mit type(x) = t)} . (3)
Damit eine MemberGroup verschoben werden kann, müssen demnach die Klassenermittelt werden, die eine Variable vom Typ S besitzen (Menge Mhas(S)). Danachwerden in den Klassen ausMhas die Klassen gesucht, die in allen Klassen ausMhasreferenziert werden und nicht S selbst sind. Mit den Definitionen der MengenMhas
396
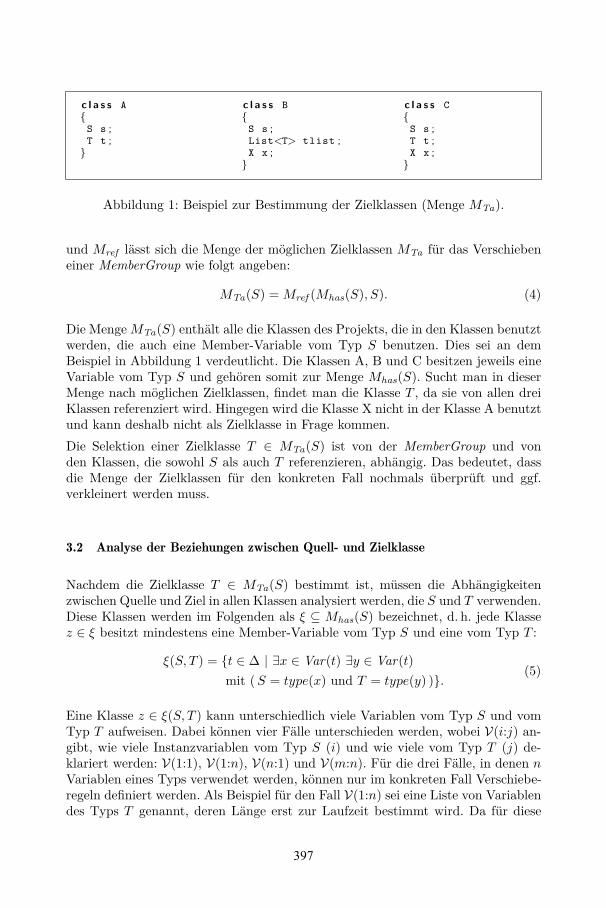
c l a s s A{
S s ;T t ;
}
c l a s s B{
S s ;List<T> tlist ;X x ;
}
c l a s s C{
S s ;T t ;X x ;
}
Abbildung 1: Beispiel zur Bestimmung der Zielklassen (Menge MTa).
und Mref lässt sich die Menge der möglichen Zielklassen MTa für das Verschiebeneiner MemberGroup wie folgt angeben:
MTa(S) =Mref (Mhas(S), S). (4)
Die MengeMTa(S) enthält alle die Klassen des Projekts, die in den Klassen benutztwerden, die auch eine Member-Variable vom Typ S benutzen. Dies sei an demBeispiel in Abbildung 1 verdeutlicht. Die Klassen A, B und C besitzen jeweils eineVariable vom Typ S und gehören somit zur Menge Mhas(S). Sucht man in dieserMenge nach möglichen Zielklassen, findet man die Klasse T , da sie von allen dreiKlassen referenziert wird. Hingegen wird die Klasse X nicht in der Klasse A benutztund kann deshalb nicht als Zielklasse in Frage kommen.Die Selektion einer Zielklasse T ∈ MTa(S) ist von der MemberGroup und vonden Klassen, die sowohl S als auch T referenzieren, abhängig. Das bedeutet, dassdie Menge der Zielklassen für den konkreten Fall nochmals überprüft und ggf.verkleinert werden muss.
3.2 Analyse der Beziehungen zwischen Quell- und Zielklasse
Nachdem die Zielklasse T ∈ MTa(S) bestimmt ist, müssen die Abhängigkeitenzwischen Quelle und Ziel in allen Klassen analysiert werden, die S und T verwenden.Diese Klassen werden im Folgenden als ξ ⊆ Mhas(S) bezeichnet, d. h. jede Klassez ∈ ξ besitzt mindestens eine Member-Variable vom Typ S und eine vom Typ T :
ξ(S, T ) = {t ∈ Δ | ∃x ∈ Var(t) ∃y ∈ Var(t)mit (S = type(x) und T = type(y) )}. (5)
Eine Klasse z ∈ ξ(S, T ) kann unterschiedlich viele Variablen vom Typ S und vomTyp T aufweisen. Dabei können vier Fälle unterschieden werden, wobei V(i:j) an-gibt, wie viele Instanzvariablen vom Typ S (i) und wie viele vom Typ T (j) de-klariert werden: V(1:1), V(1:n), V(n:1) und V(m:n). Für die drei Fälle, in denen nVariablen eines Typs verwendet werden, können nur im konkreten Fall Verschiebe-regeln definiert werden. Als Beispiel für den Fall V(1:n) sei eine Liste von Variablendes Typs T genannt, deren Länge erst zur Laufzeit bestimmt wird. Da für diese
397
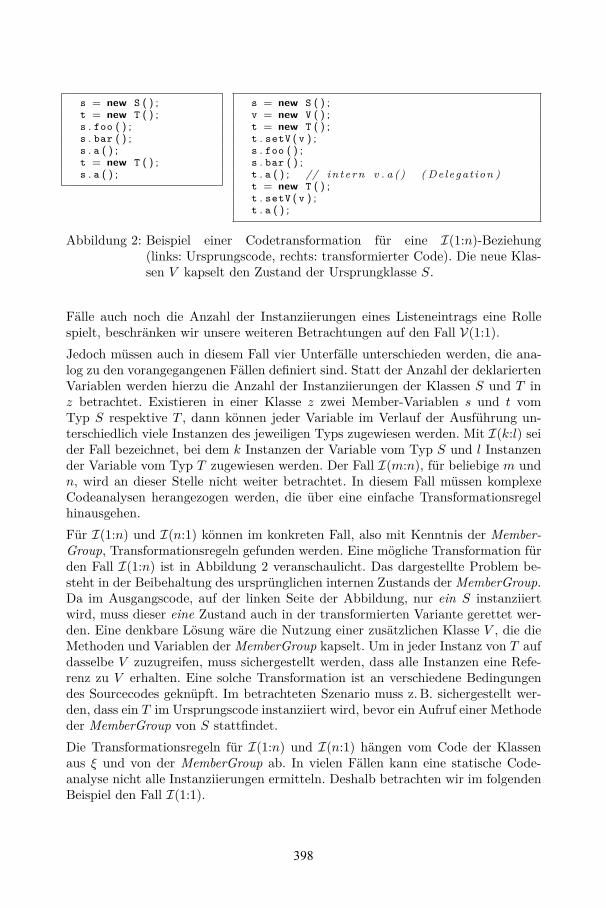
s = new S ( ) ;t = new T ( ) ;s . foo ( ) ;s . bar ( ) ;s . a ( ) ;t = new T ( ) ;s . a ( ) ;
s = new S ( ) ;v = new V ( ) ;t = new T ( ) ;t . setV ( v ) ;s . foo ( ) ;s . bar ( ) ;t . a ( ) ; // i n t e r n v . a () ( De legat ion )t = new T ( ) ;t . setV ( v ) ;t . a ( ) ;
Abbildung 2: Beispiel einer Codetransformation für eine I(1:n)-Beziehung(links: Ursprungscode, rechts: transformierter Code). Die neue Klas-sen V kapselt den Zustand der Ursprungklasse S.
Fälle auch noch die Anzahl der Instanziierungen eines Listeneintrags eine Rollespielt, beschränken wir unsere weiteren Betrachtungen auf den Fall V(1:1).Jedoch müssen auch in diesem Fall vier Unterfälle unterschieden werden, die ana-log zu den vorangegangenen Fällen definiert sind. Statt der Anzahl der deklariertenVariablen werden hierzu die Anzahl der Instanziierungen der Klassen S und T inz betrachtet. Existieren in einer Klasse z zwei Member-Variablen s und t vomTyp S respektive T , dann können jeder Variable im Verlauf der Ausführung un-terschiedlich viele Instanzen des jeweiligen Typs zugewiesen werden. Mit I(k:l) seider Fall bezeichnet, bei dem k Instanzen der Variable vom Typ S und l Instanzender Variable vom Typ T zugewiesen werden. Der Fall I(m:n), für beliebige m undn, wird an dieser Stelle nicht weiter betrachtet. In diesem Fall müssen komplexeCodeanalysen herangezogen werden, die über eine einfache Transformationsregelhinausgehen.Für I(1:n) und I(n:1) können im konkreten Fall, also mit Kenntnis der Member-Group, Transformationsregeln gefunden werden. Eine mögliche Transformation fürden Fall I(1:n) ist in Abbildung 2 veranschaulicht. Das dargestellte Problem be-steht in der Beibehaltung des ursprünglichen internen Zustands der MemberGroup.Da im Ausgangscode, auf der linken Seite der Abbildung, nur ein S instanziiertwird, muss dieser eine Zustand auch in der transformierten Variante gerettet wer-den. Eine denkbare Lösung wäre die Nutzung einer zusätzlichen Klasse V , die dieMethoden und Variablen der MemberGroup kapselt. Um in jeder Instanz von T aufdasselbe V zuzugreifen, muss sichergestellt werden, dass alle Instanzen eine Refe-renz zu V erhalten. Eine solche Transformation ist an verschiedene Bedingungendes Sourcecodes geknüpft. Im betrachteten Szenario muss z. B. sichergestellt wer-den, dass ein T im Ursprungscode instanziiert wird, bevor ein Aufruf einer Methodeder MemberGroup von S stattfindet.Die Transformationsregeln für I(1:n) und I(n:1) hängen vom Code der Klassenaus ξ und von der MemberGroup ab. In vielen Fällen kann eine statische Code-analyse nicht alle Instanziierungen ermitteln. Deshalb betrachten wir im folgendenBeispiel den Fall I(1:1).
398
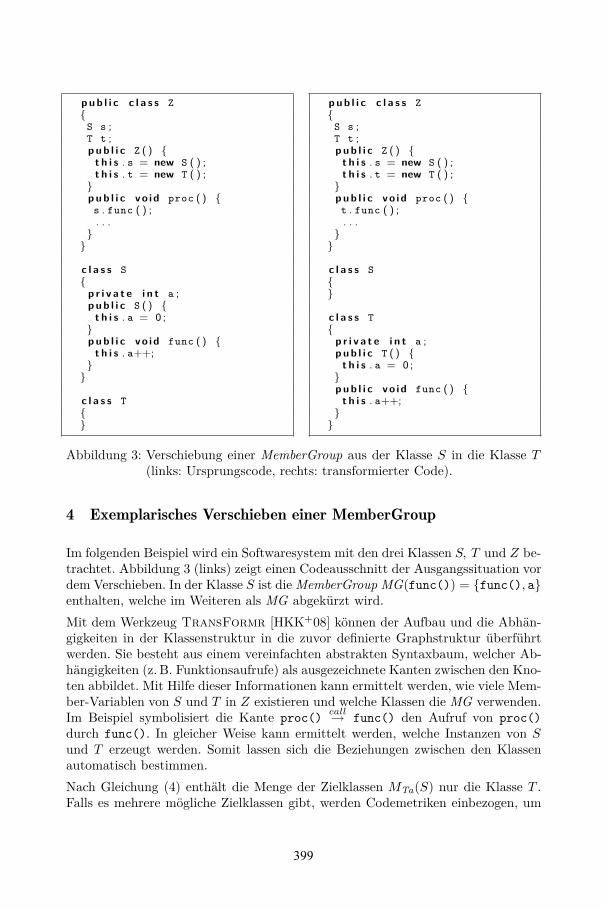
p u b l i c c l a s s Z{
S s ;T t ;p u b l i c Z ( ) {
t h i s . s = new S ( ) ;t h i s . t = new T ( ) ;
}p u b l i c vo id proc ( ) {s . func ( ) ;. . .
}}
c l a s s S{
p r i v a t e i n t a ;p u b l i c S ( ) {
t h i s . a = 0 ;}p u b l i c vo id func ( ) {
t h i s . a++;}
}
c l a s s T{}
p u b l i c c l a s s Z{
S s ;T t ;p u b l i c Z ( ) {
t h i s . s = new S ( ) ;t h i s . t = new T ( ) ;
}p u b l i c vo id proc ( ) {t . func ( ) ;. . .
}}
c l a s s S{}
c l a s s T{
p r i v a t e i n t a ;p u b l i c T ( ) {
t h i s . a = 0 ;}p u b l i c vo id func ( ) {
t h i s . a++;}
}
Abbildung 3: Verschiebung einer MemberGroup aus der Klasse S in die Klasse T(links: Ursprungscode, rechts: transformierter Code).
4 Exemplarisches Verschieben einer MemberGroup
Im folgenden Beispiel wird ein Softwaresystem mit den drei Klassen S, T und Z be-trachtet. Abbildung 3 (links) zeigt einen Codeausschnitt der Ausgangssituation vordem Verschieben. In der Klasse S ist die MemberGroup MG(func()) = {func(), a}enthalten, welche im Weiteren als MG abgekürzt wird.Mit dem Werkzeug TransFormr [HKK+08] können der Aufbau und die Abhän-gigkeiten in der Klassenstruktur in die zuvor definierte Graphstruktur überführtwerden. Sie besteht aus einem vereinfachten abstrakten Syntaxbaum, welcher Ab-hängigkeiten (z. B. Funktionsaufrufe) als ausgezeichnete Kanten zwischen den Kno-ten abbildet. Mit Hilfe dieser Informationen kann ermittelt werden, wie viele Mem-ber-Variablen von S und T in Z existieren und welche Klassen die MG verwenden.Im Beispiel symbolisiert die Kante proc() call→ func() den Aufruf von proc()durch func(). In gleicher Weise kann ermittelt werden, welche Instanzen von Sund T erzeugt werden. Somit lassen sich die Beziehungen zwischen den Klassenautomatisch bestimmen.Nach Gleichung (4) enthält die Menge der Zielklassen MTa(S) nur die Klasse T .Falls es mehrere mögliche Zielklassen gibt, werden Codemetriken einbezogen, um
399
z. B. die Abhängigkeiten innerhalb der Software durch eine Transformation zu re-duzieren.Das vorliegende Codebeispiel enthält eine V(1:1)-Beziehung von Variablen, da ge-nau eine Variable jedes Typs deklariert wurde. Außerdem handelt es sich um eineI(1:1)-Beziehung zwischen den Variablen, da beide Member-Variablen einmal imKonstruktor instanziiert werden. Für diese Art von Beziehung zwischen S und Tlässt sich die MemberGroup wie folgt verschieben:
1 resolveNameClashes ( ) ;2 moveMemberGroup ( ) ;3 replaceMemberGroupReferences ( ) ;
Die Methode resolveNameClashes() löst Kollisionen zwischen übereinstimmen-den Bezeichnern in MG und M(T ) auf. Danach wird der Teilgraph der Member-Group mit allen Variablen und Methoden von S nach T verschoben. Dies wirdvon moveMemberGroup() realisiert und umfasst auch Statements, die Variablenvon MG im Konstruktor von S initialisieren. Diese Statements werden an dasEnde des Konstruktors von T verschoben werden. Abschließend werden durchreplaceMemberGroupReferences() alle Aufrufe der Methoden von MG in derKlasse Z durch die Referenz zur Zielklasse T ersetzt. In Abbildung 3 (Codeaus-schnitt rechts) sind die Klassen S, T und Z nach der Verschiebung dargestellt.
5 Zusammenfassung
Die Modernisierung von Legacy-Software erfordert vor allem eine Modularisierung,die mit einer Reduzierung der Komplexität des Gesamtsystems einhergeht. Aus die-sem Grund müssen Refactoring-Methoden gefunden werden, die den Entwicklern inWerkzeugen (wie IDEs) die Möglichkeit bieten, verschiedene Umstrukturierungenautomatisch durchzuführen. In diesem Artikel wird das Verschieben von Member-Groups zwischen zwei Klassen einer Software betrachtet, die in einer objektorien-tierten Programmiersprache geschrieben wurde. Es wird gezeigt, welche Voraus-setzungen gegeben sein müssen, damit eine solche Aufgabe automatisch ausgeführtwerden kann. Außerdem wird beschrieben, wie die Klassen anzupassen sind, die dieQuell- und Zielklasse der Transformation verwenden. Abschließend wird an einemSoftwarebeispiel das Verschieben einer MemberGroup demonstriert.
Literatur
[EGK+01] Stephen G. Eick, Todd L. Graves, Alan F. Karr, James S. Marron und AudrisMockus. Does Code Decay? Assessing the Evidence from Change ManagementData. IEEE Trans. Softw. Eng., 27(1):1–12, 2001.
[Fow99] Martin Fowler. Refactoring: Improving the Design of Existing Code. Addison-Wesley, Boston, MA, USA, 1999.
400
[FTC07] Marios Fokaefs, Nikolaos Tsantalis und Alexander Chatzigeorgiou. JDeodo-rant: Identification and Removal of Feature Envy Bad Smells. 23rd IEEE Int.Conf. Softw. Maint. (ICSM 2007), Seiten 519–520, October 2007.
[HKK+08] S. Hunold, M. Korch, B. Krellner, T. Rauber, T. Reichel und G. Rünger.Transformation of Legacy Software into Client/Server Applications throughPattern-Based Rearchitecturing. In Proc. 32nd IEEE Int. Comp. Softw. andAppl. Conf., Seiten 303–310, Los Alamitos, CA, USA, 2008. IEEE Comp. Soc.
[Mas05] Dieter Masak. Legacysoftware: Das lange Leben der Altsysteme. Springer,Berlin, 2005.
[MDJ02] Tom Mens, Serge Demeyer und Dirk Janssens. Formalising Behaviour Pre-serving Program Transformations. In ICGT ’02: Proc. 1st Int. Conf. GraphTransformation, Seiten 286–301, London, UK, 2002. Springer-Verlag.
[Per05] Jeff H. Perkins. Automatically Generating Refactorings to Support API Evo-lution. Seiten 111–114, New York, NY, USA, September 2005. ACM.
[TK02] Ladan Tahvildari und Kostas Kontogiannis. A Software Transformation Fra-mework for Quality-Driven Object-Oriented Re-engineering. Proc. Int. Conf.Softw. Maint. (ICSM’02), Seiten 596–605, 2002.
401

P-1 Gregor Engels, Andreas Oberweis, AlbertZündorf (Hrsg.): Modellierung 2001.
P-2 Mikhail Godlevsky, Heinrich C. Mayr(Hrsg.): Information Systems Technologyand its Applications, ISTA’2001.
P-3 Ana M. Moreno, Reind P. van de Riet(Hrsg.): Applications of Natural Lan-guage to Information Systems,NLDB’2001.
P-4 H. Wörn, J. Mühling, C. Vahl, H.-P.Meinzer (Hrsg.): Rechner- und sensor-gestützte Chirurgie; Workshop des SFB414.
P-5 Andy Schürr (Hg.): OMER – Object-Oriented Modeling of Embedded Real-Time Systems.
P-6 Hans-Jürgen Appelrath, Rolf Beyer, UweMarquardt, Heinrich C. Mayr, ClaudiaSteinberger (Hrsg.): Unternehmen Hoch-schule, UH’2001.
P-7 Andy Evans, Robert France, Ana Moreira,Bernhard Rumpe (Hrsg.): Practical UML-Based Rigorous Development Methods –Countering or Integrating the extremists,pUML’2001.
P-8 Reinhard Keil-Slawik, Johannes Magen-heim (Hrsg.): Informatikunterricht undMedienbildung, INFOS’2001.
P-9 Jan von Knop, Wilhelm Haverkamp(Hrsg.): Innovative Anwendungen inKommunikationsnetzen, 15. DFN Arbeits -tagung.
P-10 Mirjam Minor, Steffen Staab (Hrsg.): 1stGerman Workshop on Experience Man-agement: Sharing Experiences about theSharing Experience.
P-11 Michael Weber, Frank Kargl (Hrsg.):Mobile Ad-Hoc Netzwerke, WMAN2002.
P-12 Martin Glinz, Günther Müller-Luschnat(Hrsg.): Modellierung 2002.
P-13 Jan von Knop, Peter Schirmbacher andViljan Mahni_ (Hrsg.): The ChangingUniversities – The Role of Technology.
P-14 Robert Tolksdorf, Rainer Eckstein(Hrsg.): XML-Technologien für das Se-mantic Web – XSW 2002.
P-15 Hans-Bernd Bludau, Andreas Koop(Hrsg.): Mobile Computing in Medicine.
P-16 J. Felix Hampe, Gerhard Schwabe (Hrsg.):Mobile and Collaborative Busi-ness 2002.
P-17 Jan von Knop, Wilhelm Haverkamp(Hrsg.): Zukunft der Netze –Die Verletz-barkeit meistern, 16. DFN Arbeitstagung.
P-18 Elmar J. Sinz, Markus Plaha (Hrsg.):Modellierung betrieblicher Informations-systeme – MobIS 2002.
P-19 Sigrid Schubert, Bernd Reusch, NorbertJesse (Hrsg.): Informatik bewegt – Infor-matik 2002 – 32. Jahrestagung der Gesell-schaft für Informatik e.V. (GI) 30.Sept.-3.Okt. 2002 in Dortmund.
P-20 Sigrid Schubert, Bernd Reusch, NorbertJesse (Hrsg.): Informatik bewegt – Infor-matik 2002 – 32. Jahrestagung der Gesell-schaft für Informatik e.V. (GI) 30.Sept.-3.Okt. 2002 in Dortmund (Ergänzungs-band).
P-21 Jörg Desel, Mathias Weske (Hrsg.):Promise 2002: Prozessorientierte Metho-den und Werkzeuge für die Entwicklungvon Informationssystemen.
P-22 Sigrid Schubert, Johannes Magenheim,Peter Hubwieser, Torsten Brinda (Hrsg.):Forschungsbeiträge zur “Didaktik derInformatik” – Theorie, Praxis, Evaluation.
P-23 Thorsten Spitta, Jens Borchers, Harry M.Sneed (Hrsg.): Software Management2002 – Fortschritt durch Beständigkeit
P-24 Rainer Eckstein, Robert Tolksdorf(Hrsg.): XMIDX 2003 – XML-Technologien für Middleware – Middle-ware für XML-Anwendungen
P-25 Key Pousttchi, Klaus Turowski (Hrsg.):Mobile Commerce – Anwendungen undPerspektiven – 3. Workshop MobileCommerce, Universität Augsburg,04.02.2003
P-26 Gerhard Weikum, Harald Schöning,Erhard Rahm (Hrsg.): BTW 2003: Daten-banksysteme für Business, Technologieund Web
P-27 Michael Kroll, Hans-Gerd Lipinski, KayMelzer (Hrsg.): Mobiles Computing inder Medizin
P-28 Ulrich Reimer, Andreas Abecker, SteffenStaab, Gerd Stumme (Hrsg.): WM 2003:Professionelles Wissensmanagement – Er-fahrungen und Visionen
P-29 Antje Düsterhöft, Bernhard Thalheim(Eds.): NLDB’2003: Natural LanguageProcessing and Information Systems
P-30 Mikhail Godlevsky, Stephen Liddle,Heinrich C. Mayr (Eds.): InformationSystems Technology and its Applications
P-31 Arslan Brömme, Christoph Busch (Eds.):BIOSIG 2003: Biometric and ElectronicSignatures
GI-Edition Lecture Notes in Informatics
P-32 Peter Hubwieser (Hrsg.): InformatischeFachkonzepte im Unterricht – INFOS2003
P-33 Andreas Geyer-Schulz, Alfred Taudes(Hrsg.): Informationswirtschaft: EinSektor mit Zukunft
P-34 Klaus Dittrich, Wolfgang König, AndreasOberweis, Kai Rannenberg, WolfgangWahlster (Hrsg.): Informatik 2003 –Innovative Informatikanwendungen (Band 1)
P-35 Klaus Dittrich, Wolfgang König, AndreasOberweis, Kai Rannenberg, WolfgangWahlster (Hrsg.): Informatik 2003 –Innovative Informatikanwendungen (Band 2)
P-36 Rüdiger Grimm, Hubert B. Keller, KaiRannenberg (Hrsg.): Informatik 2003 –Mit Sicherheit Informatik
P-37 Arndt Bode, Jörg Desel, Sabine Rath-mayer, Martin Wessner (Hrsg.): DeLFI2003: e-Learning Fachtagung Informatik
P-38 E.J. Sinz, M. Plaha, P. Neckel (Hrsg.):Modellierung betrieblicher Informations-systeme – MobIS 2003
P-39 Jens Nedon, Sandra Frings, Oliver Göbel(Hrsg.): IT-Incident Management & IT-Forensics – IMF 2003
P-40 Michael Rebstock (Hrsg.): Modellierungbetrieblicher Informationssysteme – Mo-bIS 2004
P-41 Uwe Brinkschulte, Jürgen Becker, Diet-mar Fey, Karl-Erwin Großpietsch, Chris-tian Hochberger, Erik Maehle, ThomasRunkler (Edts.): ARCS 2004 – Organicand Pervasive Computing
P-42 Key Pousttchi, Klaus Turowski (Hrsg.):Mobile Economy – Transaktionen undProzesse, Anwendungen und Dienste
P-43 Birgitta König-Ries, Michael Klein,Philipp Obreiter (Hrsg.): Persistance,Scalability, Transactions – Database Me-chanisms for Mobile Applications
P-44 Jan von Knop, Wilhelm Haverkamp, EikeJessen (Hrsg.): Security, E-Learning. E-Services
P-45 Bernhard Rumpe, Wofgang Hesse (Hrsg.):Modellierung 2004
P-46 Ulrich Flegel, Michael Meier (Hrsg.):Detection of Intrusions of Malware &Vulnerability Assessment
P-47 Alexander Prosser, Robert Krimmer(Hrsg.): Electronic Voting in Europe –Technology, Law, Politics and Society
P-48 Anatoly Doroshenko, Terry Halpin,Stephen W. Liddle, Heinrich C. Mayr(Hrsg.): Information Systems Technologyand its Applications
P-49 G. Schiefer, P. Wagner, M. Morgenstern,U. Rickert (Hrsg.): Integration und Daten-sicherheit – Anforderungen, Konflikte undPerspektiven
P-50 Peter Dadam, Manfred Reichert (Hrsg.):INFORMATIK 2004 – Informatik ver-bindet (Band 1) Beiträge der 34. Jahresta-gung der Gesellschaft für Informatik e.V.(GI), 20.-24. September 2004 in Ulm
P-51 Peter Dadam, Manfred Reichert (Hrsg.):INFORMATIK 2004 – Informatik ver-bindet (Band 2) Beiträge der 34. Jahresta-gung der Gesellschaft für Informatik e.V.(GI), 20.-24. September 2004 in Ulm
P-52 Gregor Engels, Silke Seehusen (Hrsg.):DELFI 2004 – Tagungsband der 2. e-Learning Fachtagung Informatik
P-53 Robert Giegerich, Jens Stoye (Hrsg.):German Conference on Bioinformatics –GCB 2004
P-54 Jens Borchers, Ralf Kneuper (Hrsg.):Softwaremanagement 2004 – Outsourcingund Integration
P-55 Jan von Knop, Wilhelm Haverkamp, EikeJessen (Hrsg.): E-Science und Grid Ad-hoc-Netze Medienintegration
P-56 Fernand Feltz, Andreas Oberweis, BenoitOtjacques (Hrsg.): EMISA 2004 – Infor-mationssysteme im E-Business und E-Government
P-57 Klaus Turowski (Hrsg.): Architekturen,Komponenten, Anwendungen
P-58 Sami Beydeda, Volker Gruhn, JohannesMayer, Ralf Reussner, Franz Schweiggert(Hrsg.): Testing of Component-BasedSystems and Software Quality
P-59 J. Felix Hampe, Franz Lehner, KeyPousttchi, Kai Ranneberg, Klaus Turowski(Hrsg.): Mobile Business – Processes,Platforms, Payments
P-60 Steffen Friedrich (Hrsg.): Unterrichtskon-zepte für inforrmatische Bildung
P-61 Paul Müller, Reinhard Gotzhein, Jens B.Schmitt (Hrsg.): Kommunikation in ver-teilten Systemen
P-62 Federrath, Hannes (Hrsg.): „Sicherheit2005“ – Sicherheit – Schutz und Zuver-lässigkeit
P-63 Roland Kaschek, Heinrich C. Mayr,Stephen Liddle (Hrsg.): Information Sys-tems – Technology and ist Applications
P-64 Peter Liggesmeyer, Klaus Pohl, MichaelGoedicke (Hrsg.): Software Engineering2005
P-65 Gottfried Vossen, Frank Leymann, PeterLockemann, Wolffried Stucky (Hrsg.):Datenbanksysteme in Business, Techno-logie und Web
P-66 Jörg M. Haake, Ulrike Lucke, DjamshidTavangarian (Hrsg.): DeLFI 2005: 3.deutsche e-Learning Fachtagung Infor-matik
P-67 Armin B. Cremers, Rainer Manthey, PeterMartini, Volker Steinhage (Hrsg.):INFORMATIK 2005 – Informatik LIVE(Band 1)
P-68 Armin B. Cremers, Rainer Manthey, PeterMartini, Volker Steinhage (Hrsg.):INFORMATIK 2005 – Informatik LIVE(Band 2)
P-69 Robert Hirschfeld, Ryszard Kowalcyk,Andreas Polze, Matthias Weske (Hrsg.):NODe 2005, GSEM 2005
P-70 Klaus Turowski, Johannes-Maria Zaha(Hrsg.): Component-oriented EnterpriseApplication (COAE 2005)
P-71 Andrew Torda, Stefan Kurz, MatthiasRarey (Hrsg.): German Conference onBioinformatics 2005
P-72 Klaus P. Jantke, Klaus-Peter Fähnrich,Wolfgang S. Wittig (Hrsg.): MarktplatzInternet: Von e-Learning bis e-Payment
P-73 Jan von Knop, Wilhelm Haverkamp, EikeJessen (Hrsg.): “Heute schon das Morgensehen“
P-74 Christopher Wolf, Stefan Lucks, Po-WahYau (Hrsg.): WEWoRC 2005 – WesternEuropean Workshop on Research inCryptology
P-75 Jörg Desel, Ulrich Frank (Hrsg.): Enter-prise Modelling and Information SystemsArchitecture
P-76 Thomas Kirste, Birgitta König-Riess, KeyPousttchi, Klaus Turowski (Hrsg.): Mo-bile Informationssysteme – Potentiale,Hindernisse, Einsatz
P-77 Jana Dittmann (Hrsg.): SICHERHEIT2006
P-78 K.-O. Wenkel, P. Wagner, M. Morgens-tern, K. Luzi, P. Eisermann (Hrsg.): Land-und Ernährungswirtschaft im Wandel
P-79 Bettina Biel, Matthias Book, VolkerGruhn (Hrsg.): Softwareengineering 2006
P-80 Mareike Schoop, Christian Huemer,Michael Rebstock, Martin Bichler(Hrsg.): Service-Oriented ElectronicCommerce
P-81 Wolfgang Karl, Jürgen Becker, Karl-Erwin Großpietsch, Christian Hochberger,Erik Maehle (Hrsg.): ARCS´06
P-82 Heinrich C. Mayr, Ruth Breu (Hrsg.):Modellierung 2006
P-83 Daniel Huson, Oliver Kohlbacher, AndreiLupas, Kay Nieselt and Andreas Zell(eds.): German Conference on Bioinfor-matics
P-84 Dimitris Karagiannis, Heinrich C. Mayr,(Hrsg.): Information Systems Technologyand its Applications
P-85 Witold Abramowicz, Heinrich C. Mayr,(Hrsg.): Business Information Systems
P-86 Robert Krimmer (Ed.): Electronic Voting2006
P-87 Max Mühlhäuser, Guido Rößling, RalfSteinmetz (Hrsg.): DELFI 2006: 4. e-Learning Fachtagung Informatik
P-88 Robert Hirschfeld, Andreas Polze,Ryszard Kowalczyk (Hrsg.): NODe 2006,GSEM 2006
P-90 Joachim Schelp, Robert Winter, UlrichFrank, Bodo Rieger, Klaus Turowski(Hrsg.): Integration, Informationslogistikund Architektur
P-91 Henrik Stormer, Andreas Meier, MichaelSchumacher (Eds.): European Conferenceon eHealth 2006
P-92 Fernand Feltz, Benoît Otjacques, AndreasOberweis, Nicolas Poussing (Eds.): AIM2006
P-93 Christian Hochberger, Rüdiger Liskowsky(Eds.): INFORMATIK 2006 – Informatikfür Menschen, Band 1
P-94 Christian Hochberger, Rüdiger Liskowsky(Eds.): INFORMATIK 2006 – Informatikfür Menschen, Band 2
P-95 Matthias Weske, Markus Nüttgens (Eds.):EMISA 2005: Methoden, Konzepte undTechnologien für die Entwicklung vondienstbasierten Informationssystemen
P-96 Saartje Brockmans, Jürgen Jung, YorkSure (Eds.): Meta-Modelling and Ontolo-gies
P-97 Oliver Göbel, Dirk Schadt, Sandra Frings,Hardo Hase, Detlef Günther, Jens Nedon(Eds.): IT-Incident Mangament & IT-Forensics – IMF 2006
P-98 Hans Brandt-Pook, Werner Simonsmeierund Thorsten Spitta (Hrsg.): Beratung inder Softwareentwicklung – Modelle,Methoden, Best Practices
P-99 Andreas Schwill, Carsten Schulte, MarcoThomas (Hrsg.): Didaktik der Informatik
P-100 Peter Forbrig, Günter Siegel, MarkusSchneider (Hrsg.): HDI 2006: Hochschul-didaktik der Informatik
P-101 Stefan Böttinger, Ludwig Theuvsen, Susanne Rank, Marlies Morgenstern (Hrsg.):Agrarinformatik im Spannungsfeldzwischen Regionalisierung und globalenWertschöpfungsketten
P-102 Otto Spaniol (Eds.): Mobile Services andPersonalized Environments
P-103 Alfons Kemper, Harald Schöning, ThomasRose, Matthias Jarke, Thomas Seidl,Christoph Quix, Christoph Brochhaus(Hrsg.): Datenbanksysteme in Business,Technologie und Web (BTW 2007)
P-104 Birgitta König-Ries, Franz Lehner,Rainer Malaka, Can Türker (Hrsg.)MMS 2007: Mobilität und mobileInformationssysteme
P-105 Wolf-Gideon Bleek, Jörg Raasch, Heinz Züllighoven (Hrsg.)Software Engineering 2007
P-106 Wolf-Gideon Bleek, Henning Schwentner, Heinz Züllighoven (Hrsg.)Software Engineering 2007 – Beiträge zu den Workshops
P-107 Heinrich C. Mayr,Dimitris Karagiannis (eds.)Information SystemsTechnology and its Applications
P-108 Arslan Brömme, Christoph Busch,Detlef Hühnlein (eds.)BIOSIG 2007:Biometrics andElectronic Signatures
P-109 Rainer Koschke, Otthein Herzog, Karl-Heinz Rödiger, Marc Ronthaler (Hrsg.)INFORMATIK 2007Informatik trifft LogistikBand 1
P-110 Rainer Koschke, Otthein Herzog, Karl-Heinz Rödiger, Marc Ronthaler (Hrsg.)INFORMATIK 2007Informatik trifft LogistikBand 2
P-111 Christian Eibl, Johannes Magenheim,Sigrid Schubert, Martin Wessner (Hrsg.)DeLFI 2007:5. e-Learning FachtagungInformatik
P-112 Sigrid Schubert (Hrsg.)Didaktik der Informatik in Theorie und Praxis
P-113 Sören Auer, Christian Bizer, ClaudiaMüller, Anna V. Zhdanova (Eds.)The Social Semantic Web 2007 Proceedings of the 1st Conference onSocial Semantic Web (CSSW)
P-114 Sandra Frings, Oliver Göbel, Detlef Günther,Hardo G. Hase, Jens Nedon, Dirk Schadt,Arslan Brömme (Eds.)IMF2007 IT-incidentmanagement & IT-forensicsProceedings of the 3rd InternationalConference on IT-Incident Management& IT-Forensics
P-115 Claudia Falter, Alexander Schliep,Joachim Selbig, Martin Vingron and Dirk Walther (Eds.)German conference on bioinformaticsGCB 2007
P-116 Witold Abramowicz, Leszek Maciszek (Eds.)Business Process and Services Computing1st International Working Conference onBusiness Process and Services ComputingBPSC 2007
P-117 Ryszard Kowalczyk (Ed.)Grid service engineering and manegementThe 4th International Conference on GridService Engineering and ManagementGSEM 2007
P-118 Andreas Hein, Wilfried Thoben, Hans-Jürgen Appelrath, Peter Jensch (Eds.)European Conference on ehealth 2007
P-119 Manfred Reichert, Stefan Strecker, KlausTurowski (Eds.)Enterprise Modelling and InformationSystems ArchitecturesConcepts and Applications
P-120 Adam Pawlak, Kurt Sandkuhl, Wojciech Cholewa, Leandro Soares Indrusiak (Eds.)Coordination of CollaborativeEngineering - State of the Art and FutureChallenges
P-121 Korbinian Herrmann, Bernd Bruegge (Hrsg.) Software Engineering 2008Fachtagung des GI-FachbereichsSoftwaretechnik
P-122 Walid Maalej, Bernd Bruegge (Hrsg.)Software Engineering 2008 -WorkshopbandFachtagung des GI-FachbereichsSoftwaretechnik

P-123 Michael H. Breitner, Martin Breunig, ElgarFleisch, Ley Pousttchi, Klaus Turowski (Hrsg.)Mobile und UbiquitäreInformationssysteme – Technologien,Prozesse, MarktfähigkeitProceedings zur 3. Konferenz Mobile undUbiquitäre Informationssysteme (MMS 2008)
P-124 Wolfgang E. Nagel, Rolf Hoffmann, Andreas Koch (Eds.) 9th Workshop on Parallel Systems andAlgorithms (PASA)Workshop of the GI/ITG Speciel InterestGroups PARS and PARVA
P-125 Rolf A.E. Müller, Hans-H. Sundermeier, Ludwig Theuvsen, Stephanie Schütze, Marlies Morgenstern (Hrsg.) Unternehmens-IT:Führungsinstrument oderVerwaltungsbürdeReferate der 28. GIL Jahrestagung
P-126 Rainer Gimnich, Uwe Kaiser, JochenQuante, Andreas Winter (Hrsg.) 10th Workshop Software Reengineering(WSR 2008)
P-127 Thomas Kühne, Wolfgang Reisig,Friedrich Steimann (Hrsg.) Modellierung 2008
P-128 Ammar Alkassar, Jörg Siekmann (Hrsg.)Sicherheit 2008Sicherheit, Schutz und ZuverlässigkeitBeiträge der 4. Jahrestagung desFachbereichs Sicherheit der Gesellschaftfür Informatik e.V. (GI)2.-4. April 2008Saarbrücken, Germany
P-129 Wolfgang Hesse, Andreas Oberweis (Eds.)Sigsand-Europe 2008Proceedings of the Third AIS SIGSANDEuropean Symposium on Analysis,Design, Use and Societal Impact ofInformation Systems
P-130 Paul Müller, Bernhard Neumair,Gabi Dreo Rodosek (Hrsg.) 1. DFN-Forum Kommunikations -technologien Beiträge der Fachtagung
P-131 Robert Krimmer, Rüdiger Grimm (Eds.) 3rd International Conference on ElectronicVoting 2008Co-organized by Council of Europe,Gesellschaft für Informatik and E-Voting.CC
P-132 Silke Seehusen, Ulrike Lucke, Stefan Fischer (Hrsg.) DeLFI 2008:Die 6. e-Learning Fachtagung Informatik
P-133 Heinz-Gerd Hegering, Axel Lehmann,Hans Jürgen Ohlbach, ChristianScheideler (Hrsg.) INFORMATIK 2008Beherrschbare Systeme – dank InformatikBand 1
P-134 Heinz-Gerd Hegering, Axel Lehmann,Hans Jürgen Ohlbach, ChristianScheideler (Hrsg.) INFORMATIK 2008Beherrschbare Systeme – dank InformatikBand 2
P-135 Torsten Brinda, Michael Fothe,Peter Hubwieser, Kirsten Schlüter (Hrsg.)Didaktik der Informatik –Aktuelle Forschungsergebnisse
P-136 Andreas Beyer, Michael Schroeder (Eds.) German Conference on BioinformaticsGCB 2008
P-137 Arslan Brömme, Christoph Busch, DetlefHühnlein (Eds.)BIOSIG 2008: Biometrics and ElectronicSignatures
P-138 Barbara Dinter, Robert Winter, PeterChamoni, Norbert Gronau, KlausTurowski (Hrsg.)Synergien durch Integration undInformationslogistikProceedings zur DW2008
P-139 Georg Herzwurm, Martin Mikusz (Hrsg.)Industrialisierung des Software-ManagementsFachtagung des GI-FachausschussesManagement der Anwendungs entwick -lung und -wartung im FachbereichWirtschaftsinformatik
P-140 Oliver Göbel, Sandra Frings, DetlefGünther, Jens Nedon, Dirk Schadt (Eds.)IMF 2008 - IT Incident Management &IT Forensics
P-141 Peter Loos, Markus Nüttgens, Klaus Turowski, Dirk Werth (Hrsg.)Modellierung betrieblicher Informations -systeme (MobIS 2008)Modellierung zwischen SOA undCompliance Management
P-142 R. Bill, P. Korduan, L. Theuvsen, M. Morgenstern (Hrsg.)Anforderungen an die Agrarinformatikdurch Globalisierung undKlimaveränderung
P-143 Peter Liggesmeyer, Gregor Engels, Jürgen Münch, Jörg Dörr, Norman Riegel (Hrsg.)Software Engineering 2009Fachtagung des GI-FachbereichsSoftwaretechnik
P-144 Johann-Christoph Freytag, Thomas Ruf,Wolfgang Lehner, Gottfried Vossen(Hrsg.)Datenbanksysteme in Business,Technologie und Web (BTW)
P-145 Knut Hinkelmann, Holger Wache (Eds.)WM2009: 5th Conference on ProfessionalKnowledge Management
P-146 Markus Bick, Martin Breunig,Hagen Höpfner (Hrsg.)Mobile und UbiquitäreInformationssysteme – Entwicklung,Implementierung und Anwendung4. Konferenz Mobile und UbiquitäreInformationssysteme (MMS 2009)
P-147 Witold Abramowicz, Leszek Maciaszek,Ryszard Kowalczyk, Andreas Speck (Eds.) Business Process, Services Computingand Intelligent Service ManagementBPSC 2009 · ISM 2009 · YRW-MBP 2009
P-148 Christian Erfurth, Gerald Eichler,Volkmar Schau (Eds.)9th International Conference on InnovativeInternet Community SystemsI2CS 2009
P-149 Paul Müller, Bernhard Neumair, Gabi Dreo Rodosek (Hrsg.)2. DFN-ForumKommunikationstechnologien Beiträge der Fachtagung
P-150 Jürgen Münch, Peter Liggesmeyer (Hrsg.)Software Engineering 2009 - Workshopband
The titles can be purchased at:
Köllen Druck + Verlag GmbHErnst-Robert-Curtius-Str. 14 · D-53117 BonnFax: +49 (0)228/9898222E-Mail: [email protected]