
Proceedings - BMSD
322
-
Upload
khangminh22 -
Category
Documents
-
view
0 -
download
0
Transcript of Proceedings - BMSD

BMSD 2014 Proceedings of the
Fourth International Symposium on Business Modeling and Software Design
Luxembourg, Grand Duchy of Luxembourg
24-26 June 2014
Organized by IICREST - Interdisciplinary Institute for Collaboration and Research on
Enterprise Systems and Technology
In Collaboration with TUDOR - Public Research Centre Henri Tudor
Cooperating Organizations: SIKS - the Dutch Research School for Information and Knowledge Systems
AUTH - Aristotle University of Thessaloniki CTIT - Center for Telematics and Information Technology
AMAKOTA Ltd.

II
Copyright © 2014 SCITEPRESS - Science and Technology Publications All rights reserved
Edited by Boris Shishkov
Graphics Production by Bozhana Yankova
Compiled in Portugal
Printed in Bulgaria
ISBN: 978-989-758-032-1
Depósito Legal: 374971/14
http://www.is-bmsd.org

III
KEYNOTE SPEAKERS ..................................................................................................................... IV
CHAIR AND PROGRAM COMMITTEE ................................................................................................ V
BEST PAPERS SELECTION ........................................................................................................... VIII
FOREWORD .................................................................................................................................... IX
CONTENTS .................................................................................................................................. XIII
BRIEF CONTENTS

IV
Henderik Proper
Public Research Centre Henri Tudor
Grand Duchy of Luxembourg
Roel Wieringa
University of Twente
The Netherlands
KEYNOTE SPEAKERS

V
CHAIR
Boris Shishkov, IICREST, Bulgaria
PROGRAM COMMITTEE
Hamideh Afsarmanesh, University of Amsterdam,
The Netherlands
Marco Aiello, University of Groningen, The
Netherlands
Mehmet Aksit, University of Twente, The
Netherlands
Antonia Albani, University of St. Gallen,
Switzerland
Ognyan Andreev, Technical University of Sofia,
Bulgaria
Paulo Anita, Delft University of Technology, The
Netherlands
Rumen Arnaudov, Technical University of Sofia,
Bulgaria
Colin Atkinson, University of Mannheim, Germany
Paris Avgeriou, University of Groningen, The
Netherlands
Csaba Boer, TBA, The Netherlands
Boyan Bontchev, Sofia University St. Kliment
Ohridski, Bulgaria
Frances Brazier, Delft University of Technology,
The Netherlands
Barrett Bryant, University of North Texas, USA
Cinzia Cappiello, Politecnico di Milano, Italy
Jorge Cardoso, University of Coimbra, Portugal
Kuo-Ming Chao, Coventry University, UK
Ruzanna Chitchyan, University of Leicester, UK
Samuel Chong, Capgemini, UK
Dimitar Christozov, American University in
Bulgaria - Blagoevgrad, Bulgaria
José Cordeiro, Polytechnic Institute of Setúbal,
Portugal
Dumitru Dan Burdescu, University of Craiova,
Romania
Joop De Jong, University of Applied Sciences
Utrecht, The Netherlands
Jan L. G. Dietz, Delft University of Technology,
The Netherlands
Teduh Dirgahayu, Universitas Islam Indonesia,
Indonesia
Lyubka Doukovska, Bulgarian Academy of
Sciences, Bulgaria
Chiara Francalanci, Politecnico di Milano, Italy
CHAIR AND PROGRAM COMMITTEE

VI
Boris Fritscher, University of Lausanne, Switzerland
J. Paul Gibson, T&MSP - Telecom & Management
SudParis, France
Arash Golnam, EPFL, Switzerland
Rafael Gonzalez, Javeriana University, Colombia
Clever Ricardo Guareis de Farias, University of São
Paulo, Brazil
Jens Gulden, University of Duisburg-Essen, Germany
Markus Helfert, Dublin City University, Ireland
Philip Huysmans, University of Antwerp, Belgium
Ilian Ilkov, IBM, The Netherlands
Ivan Ivanov, SUNY Empire State College, USA
Dmitry Kan, AlphaSense Inc., Russia
Dimitris Karagiannis, University of Vienna, Austria
Marite Kirikova, Riga Technical University, Latvia
Samuel Kounev, Karlsruhe Institute of Technology,
Germany
José Paulo Leal, University of Porto, Portugal
Kecheng Liu, University of Reading, UK
Leszek Maciaszek, Wroclaw University of
Economics, Poland
Jelena Marincic, University of Twente, The
Netherlands
Michele Missikoff, Institute for Systems Analysis and
Computer Science, Italy
Dimitris Mitrakos, Aristotle University of
Thessaloniki, Greece
Preslav Nakov, Qatar Computing Research Institute -
Qatar Foundation, Qatar
Ricardo Neisse, European Commission Joint Research
Center, Italy
Bart Nieuwenhuis, University of Twente, The
Netherlands
Selmin Nurcan, University Paris 1 Pantheon
Sorbonne, France
Olga Ormandjieva, Concordia University, Canada
Sietse Overbeek, University of Duisburg-Essen,
Germany
Mike Papazoglou, Tilburg University, The
Netherlands
Marcin Paprzycki, Polish Academy of Sciences,
Poland
Oscar Pastor, Universidad Politécnica de Valencia,
Spain
Henderik Proper, Public Research Centre - Henri
Tudor, Grand Duchy of Luxembourg
Ricardo Queirós, IPP, Portugal
Jolita Ralyte, University of Geneva, Switzerland
Gil Regev, EPFL / Itecor, Switzerland
PROGRAM COMMITTEE (CONT.)

VII
Wenge Rong, Beihang University, China
Ella Roubtsova, Open University, The Netherlands
Irina Rychkova, University Paris 1 Pantheon
Sorbonne, France
Shazia Sadiq, University of Queensland, Australia
Valery Sokolov, Yaroslavl State University, Russia
Richard Starmans, Utrecht University, The
Netherlands
Cosmin Stoica Spahiu, University of Craiova,
Romania
Coen Suurmond, RBK Group, The Netherlands
Bedir Tekinerdogan, Bilkent University, Turkey
Linda Terlouw, ICRIS B.V., The Netherlands
Yasar Tonta, Hacettepe University, Turkey
Roumiana Tsankova, Technical University of Sofia,
Bulgaria
Marten van Sinderen, University of Twente, The
Netherlands
Maria Virvou, University of Piraeus, Greece
Roel Wieringa, University of Twente, The
Netherlands
Shin-Jer Yang, Soochow University, Taiwan
Benjamin Yen, University of Hong Kong, China
Fani Zlatarova, Elizabethtown College, USA
PROGRAM COMMITTEE (CONT.)

VIII
The authors of around ten selected papers presented at BMSD 2014 will be invited by Springer-Verlag to submit revised and extended versions of their papers for publication in a Springer LNBIP Series book.
BEST PAPERS SELECTION
IX
When developing an information system, we need adequate underlying business / enterprise models that would help appropriately considering the real-life business context in which the information system would have to operate. This challenge is being addressed by numerous researchers whose efforts have been inspired by the goal of closing the gap between enterprise modeling and software design. Even though some results have been delivered in this direction, we do not observe actual improvements yet and still many information systems development projects go over time/budget, and the user satisfaction remains low. Moreover, the greater current computing and hardware possibilities inspire developers to offer more and more “built in” intelligence for the benefit of the user, which is nevertheless causing even lower user satisfaction and even frustration – the ways in which many software systems “think” for the user, “decide” what should be the needs of the user, “adapt” to inferred user habits, and so on, are widely unacceptable for the public. More and more we hear people saying that human behavior is too complex to be graspable by a programmed software system in an adequate and nearly exhaustive way. At the same time, we believe that we should not deny the inspiring progress software development has reached. Instead, we may better learn to what extent we should rely on software and we should improve our ability to align software to its real-life (business) context – here enterprise models are claimed to be crucial (not only for understanding and/or (re-)engineering the enterprise under consideration but also for adequately developing on top a supportive software system). Automating (partially) enterprise processes by means of software systems can only be accomplished in a methodological and systematic way, if based on corresponding enterprise models. Said otherwise, software generation should stem from corresponding enterprise modeling, by aligning enterprise modeling concepts and corresponding software specification concepts. Only such an enterprise-software alignment could actually guarantee that: (a) the software system would be properly integrated in its enterprise context; (b) an enterprise-software traceability would be possible allowing not only for software updates driven by new requirements but also for possible enterprise re-engineering activities, inspired by a goal to better fit the enterprise to the IT platform(s) used; (c) re-use could be an issue, counting on enterprise modeling constructs and software components. This points to the emerging discipline of enterprise engineering that addresses challenges such as agility and adaptability of enterprises, and is partially inspired by the goal of better facilitating the development of supportive (with regard to enterprises) software systems. Nevertheless, most current enterprises represent complex, evolving networked organizations while most current software systems are composed of sophisticated components and driven by complex rules. Thus, neither enterprise models nor software specification models can usefully be built starting from the scratch – what we need are (generic) enterprise modeling patterns and possibility to adequately reflect such patterns in corresponding software components. Closing the gap between enterprise modeling and software design in a component-based way has been an important research challenge for years already. All this has been dominant for BMSD, the international symposium on Business Modeling and Software Design, bringing together researchers and practitioners interested in business/enterprise modeling and its relationship to software design, and demonstrating for a fourth consecutive year a high quality of papers and presentations as well
FOREWORD
X
as a stimulating discussion environment. The theme of BMSD 2014 (the Fourth International Symposium on Business Modeling and Software Design) is: “GENERIC BUSINESS MODELING PATTERNS AND SOFTWARE RE-USE”, and the scientific areas of interest to the symposium are: (a) business models and requirements; (b) business models and services; (c) business models and software; (d) information systems architectures. Further, there are three application-oriented special sessions, namely: a special session on e-Health Services and Technologies, a special session on Intelligent Systems and Business Analysis, and an Industrial Track. These special sessions are bringing additional practice-driven value to the symposium. This book contains the proceedings of BMSD 2014, held in Luxembourg, Grand Duchy of Luxembourg, on 24-26 June 2014. The proceedings consists of 37 high-quality research and experience papers that have not been published previously. These papers have undergone a detailed peer-review process and were selected based on rigorous quality standards. The symposium has been organized and sponsored by the Interdisciplinary Institute for Collaboration and Research on Enterprise Systems and Technology (IICREST), in collaboration with the Public Research Centre Henri Tudor (TUDOR). Cooperating organizations have been the Dutch Research School for Information and Knowledge Systems (SIKS), Aristotle University of Thessaloniki (AUTH), the UTwente Center for Telematics and Information Technology (CTIT), and AMAKOTA Ltd. The fourth edition of BMSD follows three inspiring events, namely: Sofia 2011, Geneva 2012, and Noordwijkerhout 2013. We are proud to have succeeded in establishing and maintaining high scientific quality and stimulating collaborative atmosphere – the BMSD Community is characterized by competence, motivation, sharing, and innovativeness. In addressing the above-mentioned research challenges and areas, BMSD 2014 has considered a large number of research topics: from more conceptual ones, such as enterprise modeling, modeling languages, meta-modeling, ontologies, business rules, enterprise regulations, model-driven adaptability, intelligent systems, and Semiotics, to more technical ones, such as software specification, use cases, database clusters, model-driven testing, and ‘e-applications’ (in Healthcare and Business), from more business-oriented ones, such as business model design, enterprise architecture management, business process simulation, enterprise resource planning and strategies, and requirements specification, to software architectures –related topics. We believe that all these research contributions highlight challenging (technical) problems and present innovative solutions relevant to the scientific areas mentioned already. The 37 published papers (including several Invited Papers) were selected from 52 submissions and 12 of these papers were selected for a 30-minutes oral presentation (Full Papers); in addition, 25 papers were selected for a 20-minutes oral presentation (Short Papers and Special Sessions Papers).

XI
Hence, the full-paper acceptance ratio of 23% (the same as in 2013) shows a high level of quality which we intend to maintain and reinforce in the following editions of the symposium. Further, the BMSD’14 authors are from: Austria, Belgium, Bulgaria, China, Germany, India, Ireland, Italy, Japan, Kazakhstan, Luxembourg, The Netherlands, Poland, Portugal, Russia, Spain, Switzerland, Taiwan, Tunisia, UK, and USA (listed alphabetically); this makes in total 21 countries (compared to 14 countries having been represented in 2013, 11 countries – in 2012, and 10 countries – in 2011); 7 countries, nevertheless, have been represented in all 4 BMSD editions so far, these are: Belgium, Bulgaria, Germany, The Netherlands, Switzerland, Russia, and UK. This clearly indicates for a very strong European influence and also for our succeeding to add on the “BMSD Map” impressive non-European countries. The current proceedings’ Publisher is SCITEPRESS and we deliver not only printed proceedings but also an electronic version of the proceedings – all presented papers will be made available at the SCITEPRESS Digital Library by September, 2014. Furthermore, the proceedings will be submitted for indexation by DBLP (Computer Science Bibliography). Finally, the authors of around ten selected papers presented at BMSD 2014 will be invited by Springer-Verlag to submit revised and extended versions of their papers for publication in a Springer LNBIP (Lecture Notes in Business Information Processing) Series book. The high quality of the BMSD 2014 program is enhanced by two Keynote Lectures, delivered by distinguished guests who are renowned experts in their fields, including (alphabetically): Henderik Proper (Public Research Centre Henri Tudor, Grand Duchy of Luxembourg) and Roel Wieringa (University of Twente, The Netherlands). In addition, the Keynote Speakers and other BMSD’14 participants will take part in a panel discussion and also in other discussions stimulating community building and facilitating possible R&D project acquisition initiatives. These high points in the symposium program would definitely contribute to maintaining the event’s high quality and its stable and motivated Community. Building and interesting and successful program for the symposium required the dedicated efforts of many people. Firstly, we must thank the Authors, whose research and development achievements are recorded here. Also, the Program Committee members each deserve credit for the diligent and rigorous peer-reviewing. Further, we would like to mention the excellent organization provided by the IICREST team (supported by its logistics partner, AMAKOTA Ltd.) – the team did all necessary work for delivering a stimulating and productive event; the greatly appreciated support of Dimitris Mitrakos is to be especially mentioned here. We appreciate the local support brought forward by our Colleagues from the Public Research Centre Henri Tudor. We appreciate as well the willingness of SCITEPRESS to publish the current proceedings and we bring forward special compliments to Vitor Pedrosa for his devoted and professional work with regard to the proceedings preparation. We are indebted to Alexander Verbraeck from TU Delft for

XII
all his encouraging support. Last but not least, we thank the Keynote Speakers for their invaluable contribution and for taking the time to synthesize and deliver their talks. We wish you all an inspiring symposium and an enjoyable stay in the beautiful city of Luxembourg. We look forward to seeing you next year in Milan, Italy, for the Fifth International Symposium on Business Modeling and Software Design (BMSD 2015), details of which will be made available at http://www.is-bmsd.org.
Boris Shishkov
IICREST, Bulgaria

XIII
KEYNOTE SPEAKERS
Exploring the Challenges of Modelling Landscapes Henderik Proper 3
The Structure of Goal Models in Requirements Engineering Roel Wieringa 5
FULL PAPERS
Power-Modelling - Toward a More Versatile Approach to Creating and Using Conceptual Models Ulrich Frank 9
A Meta-architecture for Service-oriented Systems and Applications Leszek A. Maciaszek, Tomasz Skalniak and Grzegorz Biziel 20
Improving Computer-Support for Collaborative Business Model Design and Exploration Marin Zec, Peter Dürr, Alexander W. Schneider and Florian Matthes 29
Agile Enterprise Architecture Management - An Analysis on the Application of Agile Principles Matheus Hauder, Sascha Roth, Christopher Schulz and Florian Matthes 38
Context-Sensitive Impact Analysis for Enterprise Architecture Management Melanie Langermeier, Christian Saad and Bernhard Bauer 47
The Intertwinement of Architectural Governance and Enterprise IT-Architecture - Enterprise IT-Architecture Viewed as Boundary Object from a Complex Adaptive Systems View Marijn Janssen 56
A Relation-Algebra Language to Specify Declarative Business Rules Lex Wedemeijer 63
Modelling Capability and Affordance as Properties of Human/Machine Resource Systems Vaughan Michell and Ella Roubtsova 74
Using UML to Specify Artifact-centric Business Process Models Montserrat Estañol, Anna Queralt, Maria-Ribera Sancho and Ernest Teniente 84
Is the Value Concept a Valuable Concept for Information Systems? Coen Suurmond 94
A Test Generator for Model-Based Testing Ella Roubtsova and Serguei Roubtsov 103
Model-Driven QoS-aware Approach for the Sensor Network Assel Akzhalova 113
CONTENTS

XIV
SHORT PAPERS
Modelling Information Systems Using Nomis - A Practical View of Its Aplication and Its Insights to Business Processes José Cordeiro 125
An Approach to the Context-oriented Use Case Analysis Kalinka Kaloyanova and Neli Maneva 135
Validating Value Network Business Models by Ontologies José Granjo, Marzieh Bakhshandeh, João Pombinho, Miguel Mira da Silva and Artur Caetano 142
Actors Based Competences Supporting Enterprise Modeling Changes Marwen Jabloun, Yemna Sayeb, Henda Ben Ghezala and Khaled Gaaloul 148
Towards a Generic Data Model for REA Based Applications Bernhard Wally and Christian Huemer 153
Towards Simulation of Business Processes - Transforming BPMN Models to Enterprise Dynamics Models Ralf Schepers, Tobias Minning, Yannik Moog and Ingo J. Timm 159
On Advanced Business Simulations - Converging Operational and Strategic Levels Marc Drobek, Wasif Gilani, David Redlich, Thomas Molka and Danielle Soban 166
Multi-Level Business Modeling and Simulation Koen Casier, Marlies Van der Wee, Sofie Verbrugge, Heritiana Ranaivoson, Tanguy Coenen and Camille Reynders 172
A Component Abstraction for Localized, Composable, Machine Manipulable Enterprise Specification Vinay Kulkarni, Tony Clark and Balbir Barn 180
Business Requirements - Normative Approach to Behavior Modeling Askhat Omarov, Rustem Kamun and Timur Umarov 186
Towards an Integrated Model for Enterprise Interoperability Wided Guédria 196
Applying Business Process Modeling Tools in Enterprise Resource Planning System Replacements - A Case Study Stephan Groß and Justus Holler 202
Future Business Model for Cellular Microgrids Intisar Ali Sajjad, Roberto Napoli and Gianfranco Chicco 209
Comparison of Data Management Strategies for Multi-Tenant Database Cluster Evgeny Boytsov and Valery Sokolov 217
Service Composition Based on Semantic Vocabulary YuHui Ning, ShuXia Yu, YuYue Du and Wei Liu 223
Reflecting on the Ambient Intelligence Vision - A Cyber-Physical-Social Perspective Olga Murdoch, Michael O’Grady, Rem Collier and Gregory M. P. O’Hare 229
Business Model Design - An Evaluation of Paper-based and Computer-Aided Canvases Boris Fritscher and Yves Pigneur 236
BYOD: The Next Wave of Consumerization of IT - The Impact of BYOD on the Enterprise IT Landscape Ivan I. Ivanov 245

XV
SPECIAL SESSION ON E-HEALTH SERVICES AND TECHNOLOGIES (EHST)
Responsive Universal Design with Universal User Profiles and CSS User Queries Hao-Wen Yang and Hsing Mei 255
The Effect of Touch Care for Baby by Mother Yoko Hirohashi, Chieko Kato, Mayumi Oyama-Higa, Sang-jae Lee, Tomoe Sano and Masato Ichikawa 261
SPECIAL SESSION ON INTELLIGENT SYSTEMS AND BUSINESS ANALYSIS
Uncertainty Modeling in the Process of SMEs Financial Mechanism Using Intuitionistic Fuzzy Estimations George L. Shahpazov, Lyubka A. Doukovska and Vassia K. Atanassova 271
Significance of the Predictive Maintenance Strategies for SMEs Mincho B. Hadjiski, Lyubka A. Doukovska, Stefan L. Kojnov, Vladimir V. Monov and Vassil G. Nikov 276
Artificial Intelligence Neural Networks Applications in Forecasting Financial Markets and Stock Prices Veselin L. Shahpazov, Lyubka A. Doukovska and Dimitar N. Karastoyanov 282
Intercriteria Decision Making Approach to EU Member States Competitiveness Analysis Vassia K. Atanassova, Lyubka A. Doukovska, Krassimir T. Atanassov and Deyan G. Mavrov 289
INDUSTRIAL TRACK
Value-driven Design and Implementation of Business Processes - Transferring Strategy into Execution at Pace with Certainty Mathias Kirchmer 297
AUTHOR INDEX 303


KEYNOTE SPEAKERS


Exploring the Challenges of Modelling Landscapes
Henderik Proper Public Research Centre Henri Tudor, Grand Duchy of Luxembourg
Abstract: In enterprise modelling, a wide range of models and languages is used to support different purposes. If left uncontrolled, this can easily result in a fragmented perspective on the enterprise, its processes and IT support. On its turn, this negatively affects traceability, the ability to do cross-cutting analysis, and the overall coherence of models. Different strategies are suggested to achieve model integration. They mainly address syntactic-semantics aspects of models/languages, and only to a limited extent their pragmatics. In actual use, the ‘standardising’ and ‘integrating’ effects of traditional approaches (e.g. UML, ArchiMate) erodes. This is typically manifested by the emergence of local ‘dialects’, ‘light weight versions’, as well as extensions of the standard to cover ‘missing aspects’. This presentation aims to create more awareness of the factors that are at play when creating integrated modelling landscapes. Relying on our ongoing research, we develop a fundamental understanding of the driving forces and challenges related to modelling and linguistic variety within modelling landscapes. In particular, the presentation discusses the effect of a priori fixed languages in modelling and model integration efforts, and argues that they bring about the risk of neglecting the pragmatic richness needed across practical modelling situations.
BRIEF BIOGRAPHY
Prof.dr. Henderik A. Proper, Erik for friends, is a senior research manager at Public Research Centre - Henri Tudor in Luxembourg. He is also professor of information systems at the Radboud University Nijmegen, The Netherlands. He is one of the co-initiators of the development of the ArchiMate language for Enterprise Architecture. At Tudor, he leads the research programme on enterprise engineering. Erik has co-authored two books on enterprise architecture, and provided substantial contributions to two other books on this topic. He is also an editor in-chief of the book series on Enterprise Engineering, published by Springer. His home on the web can be found at “http://www.erikproper.eu”.
3


The Structure of Goal Models in Requirements Engineering
Roel Wieringa University of Twente, The Netherlands
Abstract: Requirements engineering is the activity to mutually align business goals with software systems behavior. In goal-oriented RE, goal models are used in a systematic process to exploit the interaction between the properties of the business context of a software system and properties of the system itself in order to contribute to stakeholder goals. In this talk I will describe this process and give examples to illustrate it. I then highlight several aspects of the structure of goal models, including means-end structures, temporal structures and contribution structures, and show what role they play in reasoning about organization design and software design.
BRIEF BIOGRAPHY
Roel Wieringa (http://www.cs.utwente.nl/~roelw) is Chair of Information Systems at the University of Twente, The Netherlands. His research interests include requirements engineering, risk assessment, and design research methodology. He has written two books, on Requirements Engineering and on the Design of Reactive Systems. His next book, Design Science Methodology for Information Systems and Software Engineering will appear in 2014 with Springer.
5


FULL PAPERS

Power-ModellingToward a More Versatile Approach to Creating and Using Conceptual Models
Ulrich FrankUniversity of Duisburg-Essen, Essen, Germany
Keywords: DSML, Interactive Modelling, Multi-level Modelling, Empowerment.
Abstract: The prospects of conceptual modelling are widely undisputed. Nevertheless the current practice of conceptualmodelling remains unsatisfactory. Usually, modelling languages offer primitive concepts only—with respec-tive effects on productivity and model quality. The creation of models is restricted to early phases of systemlife-cycle. Hence, the benefits of models in later phases are ignored. Furthermore, the creation and use ofconceptual models is still restricted to experts only. In this paper, the outline of a new modelling paradigm,referred to as power-modelling, is presented. It builds on the potential of domain-specific modelling languages(DSML), application frameworks and reference models. It regards models as the primary medium to perceive,interact with and change systems and the environment they are supposed to operate in during the entire sys-tem life-cycle. For this purpose, power-modelling is built on an extensible set of multi-level DSML that fitthe conceptual perspectives of a wide range of prospective users and a common representation of models andcode, which allows overcoming the notorious problem of synchronizing models and code.
1 INTRODUCTION
If maturity comes with age, a few decades of researchand application should have resulted in a widely per-fected state of conceptual modelling. There are in-deed various signs of maturity. Both in InformationSystems and Computer Science it seems undisputedthat conceptual models are a prerequisite to managethe complexity of large software systems. Further-more, it is acknowledged that conceptual models aremuch better suited than code to involve prospectiveusers and other stakeholders in the process of devel-oping software. The benefits of conceptual models fordesigning software systems do not come as a surprise.After all, software systems are linguistic artefacts. Onthe one hand, they are realized with some kind of im-plementation language. On the other hand, as non-physical artefacts they can be perceived—and used—by humans only through some kind of linguistic rep-resentation. At best, this linguistic representation cor-responds to the language used in the targeted do-main. Conceptual models are aimed at reconstructingdomain-specific languages in a way that prospectiveusers perceive them as familiar, while at the same timethey allow for transformations into implementation-level languages. By structuring and eventually au-tomating the transformation of models into code, as
it is pursued by approaches to model-driven softwaredevelopment (Atkinson and Kuhne, 2003; France andRumpe, 2007), conceptual modelling is promising tosubstantially improve the productivity of developingsoftware systems.
But conceptual modelling is not restricted to mod-elling software systems. Exploiting the potential ofinformation systems often requires re-organizing re-spective action systems. Consequently, correspond-ing modelling approaches, such as business processmodelling, turned out to be a good choice for sup-porting people with analysing and (re-) structuring ac-tion systems. The insight that corporate action sys-tems do not only comprise business processes, butalso other subjects, such as goals, resources or or-ganizational structure, contributed to the emergenceof approaches to enterprise modelling (Scheer, 1992;Ferstl and Sinz, 2006; Frank, 2013). By integrat-ing conceptual models of software systems with con-ceptual models of action systems, enterprise modelspromise to provide a foundation for jointly analysingand designing information systems and the relevantorganizational context. Since more and more orga-nizations have given up developing software on theirown, the original idea of using conceptual modelsfor designing software systems does not fit the de-mands of many organizations anymore. At the same
9
time, the ever growing complexity of IT infrastruc-tures created additional challenges. Again, concep-tual models of IT infrastructures, including variousrepresentations of their high-level structure or archi-tecture, have evolved as a remedy. While respectivemodels are often part of enterprise modelling meth-ods, they are also featured by approaches to enterprisearchitecture, which in general aim mainly at managersand therefore emphasize a higher level of abstraction(Lankhorst, 2005; Proper et al., 2010; Buckl et al.,2010). Therefore, conceptual modelling supports awide range of activities related to analysing, design-ing and managing IT infrastructures and correspond-ing action systems. A relatively large research com-munity, both in Information Systems and ComputerScience, may serve as further evidence for the matu-rity of the field.
However, our brief assessment of the field’s con-tributions may be deceptive—and maturity may haveits downsides, too. As we shall see, there are seri-ous reasons for not being satisfied with the state ofthe art in conceptual modelling. There are even rea-sons to challenge the current paradigm of concep-tual modelling. In any case, it does not seem ap-propriate to further follow existing paths of researchby focussing solely on problems within this paradigmwithout leaning back once in a while to reflect uponother ways to conceptualize, develop, maintain anduse models. While I had my doubts for some timewhether we are doing the right thing, I started to in-tentionally abandon some characteristics of concep-tual modelling which I had not only taken for granted,but which I used to preach enthusiastically. I amstill in the—sometimes painful, sometimes exciting—process of realigning my perspective and my researchagenda. However, a few ideas have emerged that Iregard as promising. One of them is subject of thispaper. I dared calling it “power-modelling”, not onlyto express that it might be suited to substantially pro-mote the power of modelling as a tool to create andmodify systems, but also to empower users by sup-porting them with sophisticated, but convenient in-struments to use and modify the systems they workwith.
The paper starts with a critical review of the cur-rent state of the art. Subsequently, an overview ofapproaches that address certain shortcomings of con-ceptual modelling is given. Against this background,I will describe the idea of power-modelling by out-lining the foundational concepts and by illustratinghow it could be implemented. Since the respectiveresearch is in a very early stage and faces serious chal-lenges, the conclusions will especially focus on futureresearch.
2 CONCEPTUAL MODELLING: ACRITICAL REVIEW
There are various reasons, why the current state ofconceptual modelling might not be regarded as satis-factory (Frank, 2014a). At first, there is the soberingfact that the dissemination of conceptual modellingin practice is still rather modest. Many software de-velopers still regard it as dispensable. Managers per-ceive it as a cost-driver that does not deliver measur-able benefit. Finally, prospective users are often notkeen to look into conceptual models, nor are they ca-pable of designing them on their own. The unsatis-factory adoption in practice may be contributed to alack of respective professional education among to-day’s workforce. However, I am afraid, we wouldtake the easy way out, if we were satisfied with thisexplanation. There are other, more essential reasonsfor questioning the power of current approaches toconceptual modelling, which also may, in part, hin-der its acceptance and dissemination in practice. Theyrelate to the economics of modelling and the psycho-logical assumptions underlying the construction andperception of conceptual models.
2.1 Economics of Modelling
With respect to economics of modelling, three as-pects are of particular relevance. At first, there isthe productivity of creating, analysing and modify-ing conceptual models, i.e. the time these activitiestake for a certain outcome. While modelling produc-tivity depends on modellers’ skills and experiences, itis also affected by the available modelling languagesand tools. A modelling language can contribute toproductivity by providing reusable artefacts and byallowing for abstractions that foster reuse and adapta-tion of models. Currently, most modelling languagesare restricted to a few semantic primitives that remindof basic ontologies like the one suggested by (Bunge,1977) or (Grossmann, 1983). While generic conceptssuch as “entity type”, “class”, “attribute”, etc. canbe applied to any domain—which is the purpose ofa general ontology—they require modellers to recon-struct all concepts of a model from scratch. Hence,they promote a wide range of reuse, which should im-prove economies of scale e.g. of modelling tools, butin a particular case, their contribution to productivityis very poor. Imagine, you would have to describe adomain such as accounting and you were restricted toa language that consisted of generic concepts like theones provided by the ERM and the UML! Further-more, modelling languages provide only a few ab-straction concepts such as classification, generaliza-
Fourth International Symposium on Business Modeling and Software Design
10
tion or encapsulation. As a consequence, similaritiesbetween a range of models can often not be accountedfor by abstracting on a set of common properties. Thelack of abstraction is especially painful in businessprocess modelling, where reuse is widely restrictedto copy&paste (Frank, 2012). Second, there is littleprotection of investment. The use of conceptual mod-els is widely restricted to the build time phase. Inlater phases, models are used for documentation only,if they are used at all. Even in those cases, wheremodels were used to generate code, they will usuallyget devalued over time, because during maintenancechanges are directly applied to code and synchroniz-ing models and code, beside representing a seriouschallenge, does not happen. Third, the benefit of mod-els depends on their quality. However, judging thequality of conceptual models is a demanding task andrequires experts. Current modelling languages andtools hardly contribute to model quality, since theirgeneric concepts allow for almost any kind of absurdmodels as long as they are syntactically correct. Froma managerial perspective there is the additional prob-lem that the economics of modelling is hard to judge.While it is often not trivial to determine modellingcosts in advance, quantifying the benefits of modelsex ante is almost impossible. As long as managersare not convinced that modelling is suited to generatesubstantial benefit, the lack of legitimate quantifica-tion methods creates a serious obstacle to conceptualmodelling in practice.
2.2 Cognitive Capabilities
Conceptual modelling is based on basic assumptionsthat most members of the modelling community—including myself—are convinced of. First, there isthe assumption that the analysis and design of com-plex systems recommends a rational approach, i.e.an approach that is characterized by the differenti-ated consideration of pros and cons and that puts em-phasis on justifying decisions. Second, related to thefirst assumption, following a Kantian tradition, a ra-tional perspective demands for focussing on concepts.Conceptual modelling is typically aimed at the recon-struction of terms used in the domain of interest. Re-ferring to existing terminology is supposed to makeconceptual models accessible by people working inthe domain. At the same time, a reconstruction isrequired in order to create concepts that fit the spe-cific modelling purpose and that facilitate mappingto implementation languages. As a consequence, itit common to specify concepts according to the def-initions of types or classes in implementation lan-guages. While these basic ideas make perfect sense,
they are based on an idealization that is seriously chal-lenged by research in cognitive psychology. There isa plethora of work that shows the rather limited abil-ity of most humans to precise and consistent think-ing, for an overview see (Kahneman et al., 1982).Furthermore, the way people acquire and use con-cepts is often in clear contrast with the definitions weuse in conceptual modelling (Lakoff, 1990). Amongthe most relevant insights are the following: Con-cepts are often not associated with (extensional) defi-nitions, but rather with a few typical examples (proto-types”). Conceptual categories are often perceived ashaving no clear boundaries (membership gradience”,(Lakoff, 1990), p. 12). The last example is of es-pecial relevance for our investigation: Most cognitivemodels are embodied with respect to use.” ((Lakoff,1990), p. 12) As a consequence, we cannot expectprospective users to be much interested in and capableof thinking in concepts as we use them for modellingpurposes.
2.3 Preliminary Conclusion
Our brief analysis of the current state of conceptualmodelling resulted in a number of problems. Thatdoes not mean, however, to question the idea of con-ceptual modelling in general. In order to cope withcomplexity and change there is no alternative for usother than to somehow develop models. Without ab-straction not only our understanding of systems andof the world in general will remain poor, but so wouldbe our ability to design and implement systems. Nev-ertheless, those problems should make us think. Inparticular, there are three areas that demand for moreattention. There is need to promote modelling pro-ductivity. For this purpose, reuse has to be fosteredby providing modelling constructs that incorporatedomain-specific semantics. To promote model qual-ity, the reusable artefacts offered to users should bethoroughly developed and tested. At the same time,economies of scale are crucial. For this purpose, anartefact needs to be reused in a wide range of cases,which may create a conflict to modelling productiv-ity. To improve the involvement of prospective users,models, new forms of presenting concepts and mod-els to users are required. Since there is evidence thatpeople imagine or learn concepts by associating themwith contexts of use, it might be advisable to developmodelling environments that focus on the use of con-cepts. The use of models during later phases of thesystem life-cycle demands for developing scenariosthat illustrate the respective benefit. In addition, tech-nical challenges, such as solving the notorious prob-lem of synchronizing code and model have to be ad-
Power-Modelling - Toward a More Versatile Approach to Creating and Using Conceptual Models
11
dressed.
3 SELECTED APPROACHES
There have been various approaches that addresssome of the problems elucidated above. Some of themare aimed at improving modelling productivity andmodel quality, while others focus on implementationissues or on user involvement.
3.1 Focus on Productivity and Quality
Reference models are based on a convincing idea. Bydeveloping models that serve as a reference for cer-tain domains, the costs for realizing large models inrespective domains could be reduced substantially. Atthe same time, reference models should be developedwith outstanding care and expertise. Therefore, theyshould effectively improve model quality. Further-more, reference models do not only stress a descrip-tive intention, i.e. representing a domain as it is, butalso a prescriptive intention, i.e. representing concep-tualisations that seem especially favourable for the fu-ture development of organizations in the targeted do-main. Despite their convincing foundation, the dis-semination of reference models in practice remainedextremely modest. Domain-specific modelling lan-guages (DSMLs) are build on a similar idea. Differentfrom general-purpose modelling languages (GPMLs),they comprise domain-specific concepts, thus free-ing modellers from the need to specify these con-cepts from scratch. At the same time, DSMLs fea-ture usually, but not necessarily, a concrete syntaxthat is adapted to representations known in the do-main they cover. In addition to promoting productiv-ity through improved reuse and ergonomics, DSMLalso contribute to model quality, since their syntaxand semantics facilitate preventing models that are alltoo strange. Modelling is more convenient, and therange of possible models is clearly restricted com-pared to a GPML.
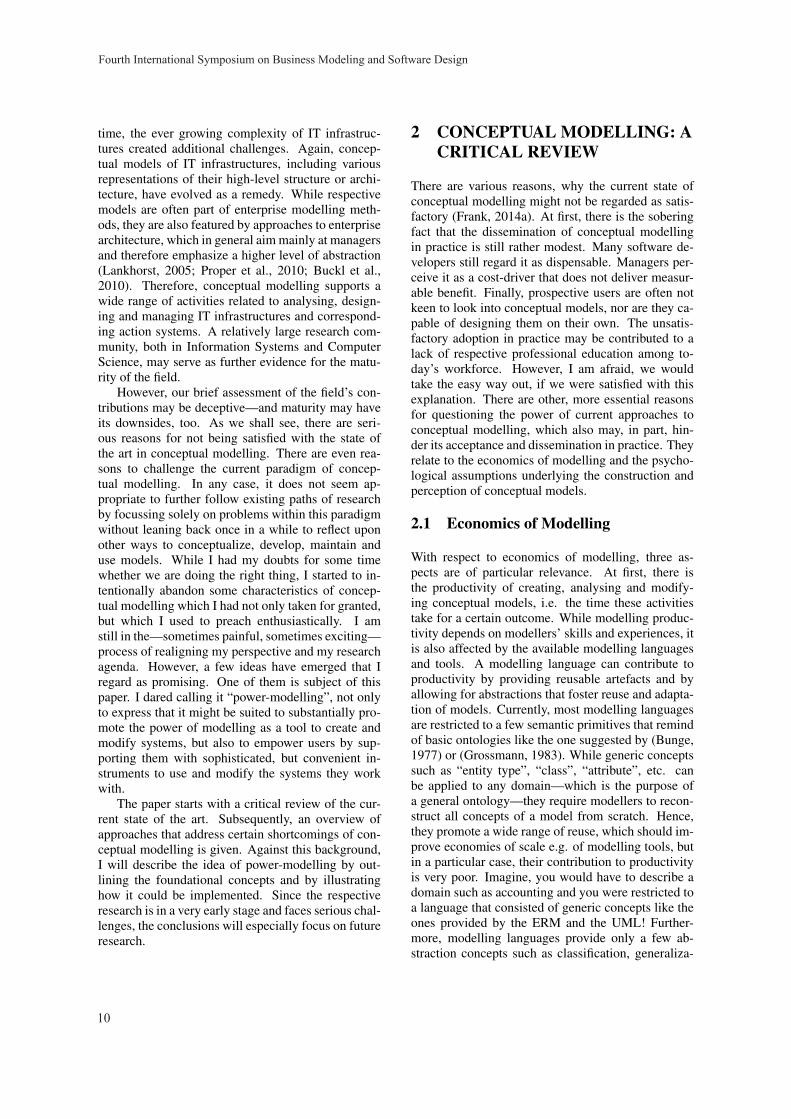
While DSMLs are certainly suited to address theproductivity challenge, they are not the silver bullet ofconceptual modelling, since they face a fundamentalconflict of system design. On the one hand, increasingproductivity demands for concepts that are specific toa particular domain, i.e. that incorporate a high de-gree of domain-specific semantics. On the other hand,economies of scale demand for DSMLs that cover awider domain, i.e. that include a smaller degree ofdomain-specific semantics. This fundamental conflictof designing DSMLs is illustrated in fig. 1
Level of (domain-specific) Semantics
Po
ten
tia
l P
rod
uctivity G
ain
Sca
le o
f R
eu
se
Figure 1: The fundamental conflict of designing DSMLs.
3.2 Focus on Implementation
If one regards a model mainly as an instrument for de-veloping software, the transformation of models intocode is a major aspect of increasing the value of mod-els. Some time ago, Wiederhold et al. proposed an ap-proach, called “megaprogramming” to substantiallypromote the productivity of programming large ap-plication systems (Wiederhold et al., 1992). Eventhough they do not explicitly speak of modelling,there are clear relations to conceptual modelling intheir work. They suggest to compose large softwaresystems from “megamodules”. Megamodules can bethought of as domain-specific abstraction: megamod-ules “capture the functionality of services providedby large organizations like banks, airline reservationsystems, and city transportation systems. ... Theconcepts, terminology, and interpretation paradigm ofa megamodule is called its ontology.” (Wiederholdet al., 1992), p. 89. However, the representation ofmegamodules as well as their composition happens onthe code level only. Therefore, they are hardly suitedfor being used by non-experts. It is, however, con-ceivable to combine the idea of megamodules with arepresentation that corresponds more clearly to a ter-minology users are familiar with. Even though meg-amodules, like DSML, promote domain-specific arte-facts, their use is based on a bottom-up approach inthe sense that a system is created from some kindof building block without providing a blueprint forthe overall design. Application frameworks stress atop-down approach. An application framework rep-resents an architecture and the partial implementa-tion of a class of application systems. “Black box”frameworks can be adapted only through interfaces,while “white box” frameworks allow for modifyingtheir code. Frameworks can substantially boost theproductivity of application development. However,while the adaptability of black box frameworks is
Fourth International Symposium on Business Modeling and Software Design
12
limited, using white box frameworks efficiently re-quires considerable effort. Similar to megamodulesthe representation of frameworks is usually restrictedto code. Approaches to model-driven software de-velopment take advantage of conceptual models fordesigning systems. At the same time, they promoteimplementation productivity by aiming at generatingsoftware systems from models (France and Rumpe,2007), (Stahl and Volter, 2006). To cope with a mul-titude of platforms and programming languages, spe-cific effort has been put on generating platform- andlanguage-independent representations that allow fora straightforward transformation into particular im-plementations (Mellor, 2004), (Pastor and Molina,2007). Even though model-driven software develop-ment is suited to improve development productivityand software quality, it remains unsatisfactory withrespect to the evolution of software systems: Usuallyit is not possible to generate an entire software systemfrom models, i.e. there is need for manual extensions.As a consequence, the evolution of code and modelshas to be synchronized. While there are a few ap-proaches that address the challenge of synchronizingmodels and code (e.g. (Balz et al., 2010), (Agrawal,2003)), they are not satisfactory, because they cannotalways ensure consistency.
3.3 Focus on User Involvement
To some extent, the development of DSML and corre-sponding editors is aimed at making modelling moreconvenient for users who are not trained in concep-tual modelling. The idea of using models at run time(Blair et al., 2009), while also contributing to theprotection of investments, may be suited to motivatemore people to use models: as a conceptual represen-tation of the systems they interact with and may wantto modify. However, recent research in this area ismainly focused on software engineering aspects suchas synchronisation of models and systems, e.g. (Songet al., 2011), or self-adapting systems, e.g. (Amouiet al., 2012), (Morin et al., 2009). Krogstie proposesusing models during the entire life-cycle of a systemto emphasize user empowerment (Krogstie, 2007).For this purpose, modelling should not longer be re-stricted to system development. Instead, for mod-elling to have a “larger effect”, he proposes “to en-able all knowledge workers to be active modelers.”(p. 305). Enterprise software systems should be pre-sented to their users as “interactive models”, the useof which is “about discovering, externalizing, captur-ing, expressing, representing, sharing and managingenterprise knowledge.” (p. 306). In addition to knownapproaches to enterprise modelling, Krogstie stresses
the need for more intuitive representations of models,such as “visual scenes for pro-action learning” anddescriptions of the relevant context that focus on ac-tions (p. 308). Using models as objects and objectiva-tion of organizational knowledge work and of individ-ual learning is appealing. However, Krogstie remainsvague about the realization of his vision. He suggestsa “model-generated workplace (MGWP)” that “is aworking environment for the business users involvedin running the business operations” (p. 312), but hedoes not provide details of how to accomplish “inte-grated modelling and execution platforms” (p. 308).
4 OUTLINE OFPOWER-MODELLING
The idea presented in this section was inspired by var-ious streams of work, some of which are describedabove. It is also a result of our long-standing-workon enterprise modelling that confronted us with someserious problem we were not able to solve as longas we were still bound to the traditional principles ofconceptual modelling and of implementing modellingtools. Hence, the outline of power-modelling is alsoan attempt to suggest a new paradigm of creating andusing conceptual models.
4.1 Objectives and Challenges
Against the background of our previous discussion,the following objectives mark desirable features of afuture conception and realization of modelling.
Objective O1: A powerful approach to conceptualmodelling should enable the use of models during theentire life-cycle of a system. Rationale: The com-plexity of enterprise systems demand for a represen-tation that users are able to understand, not only to ob-tain a better comprehension of a software system, butalso of the the context, since an increasing part of anenterprise is represented by its software systems. Atthe same time, people need (cognitive) models any-way to make sense of software systems and of organi-zations. Therefore, explicit models that fit the cogni-tive capabilities of users should be suited to increaseorganizational transparency. Objective O2: Concep-tual models that represent software systems and thecontext they operate in should be interactive. Ratio-nale: In order to serve as a universal interface to en-terprise systems that fosters user empowerment, mod-els need to allow for navigation, for searching and formodifying their states—not only during build time,but during run time. Objective O3: Conceptual mod-els should provide access to their conceptual foun-
Power-Modelling - Toward a More Versatile Approach to Creating and Using Conceptual Models
13
dation, i.e. to the modelling language they are de-fined with, i.e. respective modelling tools should beself-reflective. Rationale: Users may want to get abetter understanding of the concepts the models theyinteract with are based on. Furthermore, advancedusers may even want to change those concepts. Ob-jective O4: Conceptual models should be constructedfrom concepts that are used in professional discoursein the relevant domain. Rationale: Domain-specificconcepts promote modelling productivity and makethe use of modelling concepts more intuitive. Objec-tive O5: Conceptual models of an enterprise shouldcover multiple perspectives and foster their integra-tion. Rationale: The complexity of many organiza-tions goes along with specialization which in turn re-sults in different professional perspectives and lan-guages. In order to satisfy the demand for provid-ing users with representations they are familiar with,models of an enterprise need to account for differentperspectives. On the one hand, that relates to pro-viding modelling concepts which correspond to thetechnical language that is characteristic for a certainperspective. On the other hand, it should also bepossible to present a model using different notations,both graphical and textual, in order to satisfy differ-ent cognitive styles. Objective O6: To increase theeconomics of modelling economies of scale have tobe increased by promoting reuse. Rationale: Today,the effort it takes to develop elaborate models is of-ten still prohibitively high. The above objectives cre-ate considerable challenges. Among those, three arehard to overcome within the current paradigm. Aim-ing at both, modelling concepts that reflect particu-lar, domain-specific technical languages, and that pro-mote economies of scale faces an obvious conflict:A language can either be more domain-oriented orbuilt for serving more general purpose. Using mod-els at run time that allow interacting with and eventu-ally changing a software system demands a tight in-tegration of models and code in order to keep theirchanges in synch. However, this is almost impossi-ble due to limitations of prevalent programming lan-guages. The elements of a model on M1 are repre-sented as objects on M0, even though they are con-ceptually located on M1. This is the case, too, forthe representation of metaclasses in meta model edi-tors. As a consequence, there is need to generate code(objects on M0 cannot be further instantiated), whichcreates the notorious problem of synchronizing mod-els and code. The lack of abstraction concepts in pro-cess modelling languages creates a serious obstaclefor reuse. While generalisation/specialisation may beregarded as a suitable approach, it cannot be appliedto processes in a straightforward way: To satisfy the
substitutability constraint (Liskov and Wing, 1994),specialisation has to be monotonic, which is impossi-ble to achieve for process models (Frank, 2012)
4.2 Cornerstones of Power-Modelling
For the vision of power-modelling to become real, thecurrent paradigm is not sufficient. There is need tochange our perspective on conceptual modelling andto aim at a different linguistic foundation—both ofmodelling and implementation languages. The fol-lowing aspects mark cornerstones of a conception ofpower-modelling.
Emphasis on DSML: DSMLs that are recon-structed from existing technical terminologies (objec-tive O4) promise clear advantages with respect to pro-ductivity, model quality and comprehensibility. Forthis purpose, we can build on an existing integratedset of DSMLs for enterprise modelling (Frank, 2013).
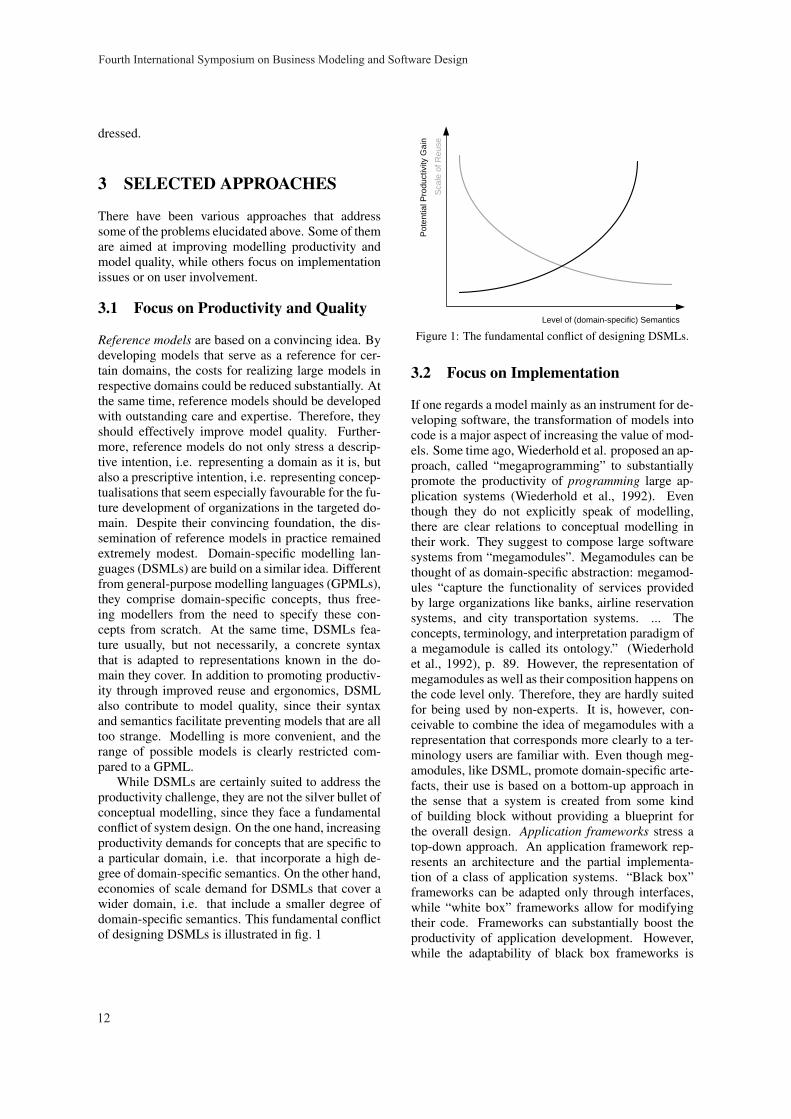
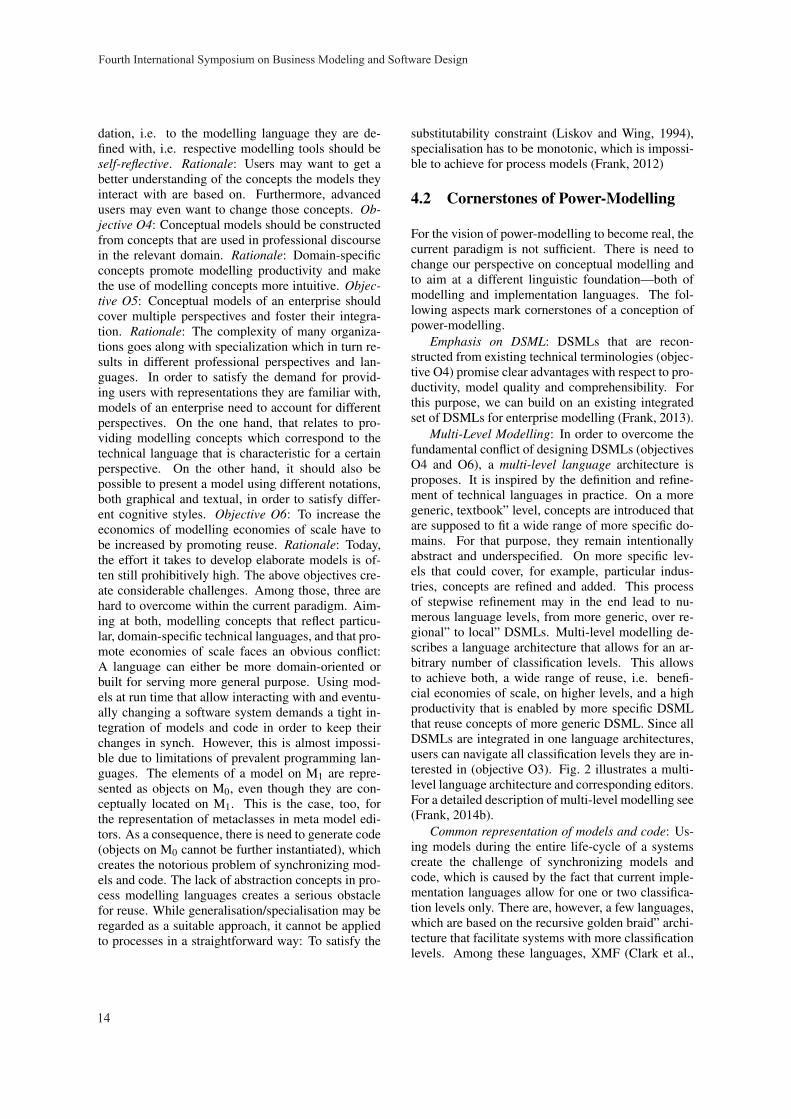
Multi-Level Modelling: In order to overcome thefundamental conflict of designing DSMLs (objectivesO4 and O6), a multi-level language architecture isproposes. It is inspired by the definition and refine-ment of technical languages in practice. On a moregeneric, textbook” level, concepts are introduced thatare supposed to fit a wide range of more specific do-mains. For that purpose, they remain intentionallyabstract and underspecified. On more specific lev-els that could cover, for example, particular indus-tries, concepts are refined and added. This processof stepwise refinement may in the end lead to nu-merous language levels, from more generic, over re-gional” to local” DSMLs. Multi-level modelling de-scribes a language architecture that allows for an ar-bitrary number of classification levels. This allowsto achieve both, a wide range of reuse, i.e. benefi-cial economies of scale, on higher levels, and a highproductivity that is enabled by more specific DSMLthat reuse concepts of more generic DSML. Since allDSMLs are integrated in one language architectures,users can navigate all classification levels they are in-terested in (objective O3). Fig. 2 illustrates a multi-level language architecture and corresponding editors.For a detailed description of multi-level modelling see(Frank, 2014b).
Common representation of models and code: Us-ing models during the entire life-cycle of a systemscreate the challenge of synchronizing models andcode, which is caused by the fact that current imple-mentation languages allow for one or two classifica-tion levels only. There are, however, a few languages,which are based on the recursive golden braid” archi-tecture that facilitate systems with more classificationlevels. Among these languages, XMF (Clark et al.,
Fourth International Symposium on Business Modeling and Software Design
14
Reference DSML
Language Designer
Organisational Unit
Position
Specific DSML(Local „Dialect“)
Organisation Analyst
Department
Team Market Analyst
Particular OrganisationModel
Manager
Marketing DepartmentQuality Circle
Product Group PG 1
MarketAnalyst MA2
Market ResearchTeam
Committee
Quality Circle
Meta Modeling Language
Meta Language Designer
MetaEntity
AssociationMetaAttribute
Metamodel Editor
Organisation Schema Editor
Specific Organisation Editor
specifies
specifies
specifies
foundation of
createscreates
Figure 2: Illustration of multi-level language architecture.
2008b), (Clark et al., 2008a) is particularly suited forsupporting power-modelling. First, it enables an ar-bitrary number of classification levels. Second, itis accompanied by a (meta) modelling environment,Xmodeler, that features a common representation ofmodels and code, hence, it eliminates the need forsynchronizing models and code and facilitates the useof models during the entire life-cycle of a system.In order to develop a suitable foundation of multi-level modelling and multi-level enterprise systems,we modified the metamodel of XMF (Frank, 2014b).By overcoming the separation of model and code,every system can be seen as a collection of modelswhich can be used interactively (objective O2) withmultiple representations that can be exchanged basedon an implementation of the model-view-controllerpattern (for details see (Clark et al., 2008a)).
Wider conception of conceptual modelling: In theexisting paradigm, a conceptual model is created from
the concepts of a modelling language, typically ar-ranged in diagrams that represent some kind of agraph. However, modelling can also be thought ofas an act of configuration that makes use of existing,more generic models and of DSML. In that case, mod-elling is more interactive, where a respective mod-elling system suggests alternative modelling optionsand requests user preferences. Since many users makesense out of action context rather than of singular con-cepts, interactive modelling should also go along withthe representation of the context a model is supposedto address. A prototypical context could be providedby an enterprise model that integrates various per-spectives on the enterprise (Frank, 2013) (objectiveO5). Furthermore, such a wider conception would in-clude to not restrict modelling to drawing diagrams.Instead, models would be accessible through the ele-ments of a graphical user interface, through tables oreven through plain text. While it makes sense to re-
Power-Modelling - Toward a More Versatile Approach to Creating and Using Conceptual Models
15
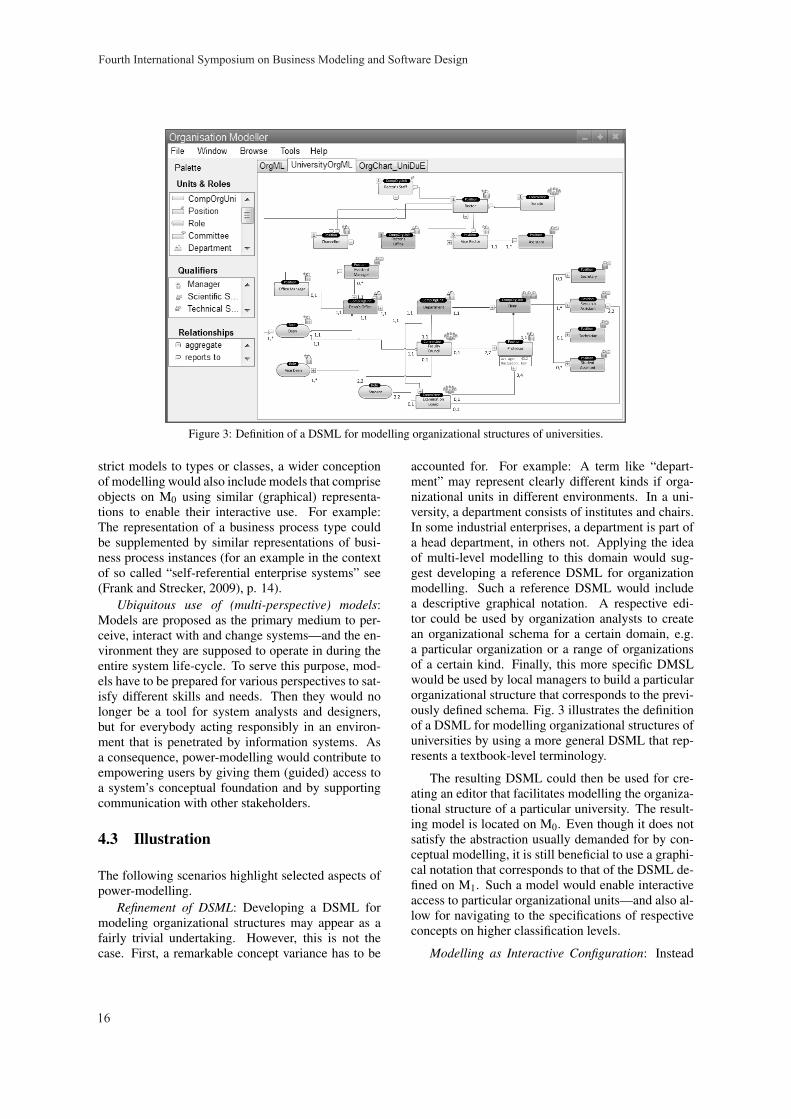
Figure 3: Definition of a DSML for modelling organizational structures of universities.
strict models to types or classes, a wider conceptionof modelling would also include models that compriseobjects on M0 using similar (graphical) representa-tions to enable their interactive use. For example:The representation of a business process type couldbe supplemented by similar representations of busi-ness process instances (for an example in the contextof so called “self-referential enterprise systems” see(Frank and Strecker, 2009), p. 14).
Ubiquitous use of (multi-perspective) models:Models are proposed as the primary medium to per-ceive, interact with and change systems—and the en-vironment they are supposed to operate in during theentire system life-cycle. To serve this purpose, mod-els have to be prepared for various perspectives to sat-isfy different skills and needs. Then they would nolonger be a tool for system analysts and designers,but for everybody acting responsibly in an environ-ment that is penetrated by information systems. Asa consequence, power-modelling would contribute toempowering users by giving them (guided) access toa system’s conceptual foundation and by supportingcommunication with other stakeholders.
4.3 Illustration
The following scenarios highlight selected aspects ofpower-modelling.
Refinement of DSML: Developing a DSML formodeling organizational structures may appear as afairly trivial undertaking. However, this is not thecase. First, a remarkable concept variance has to be
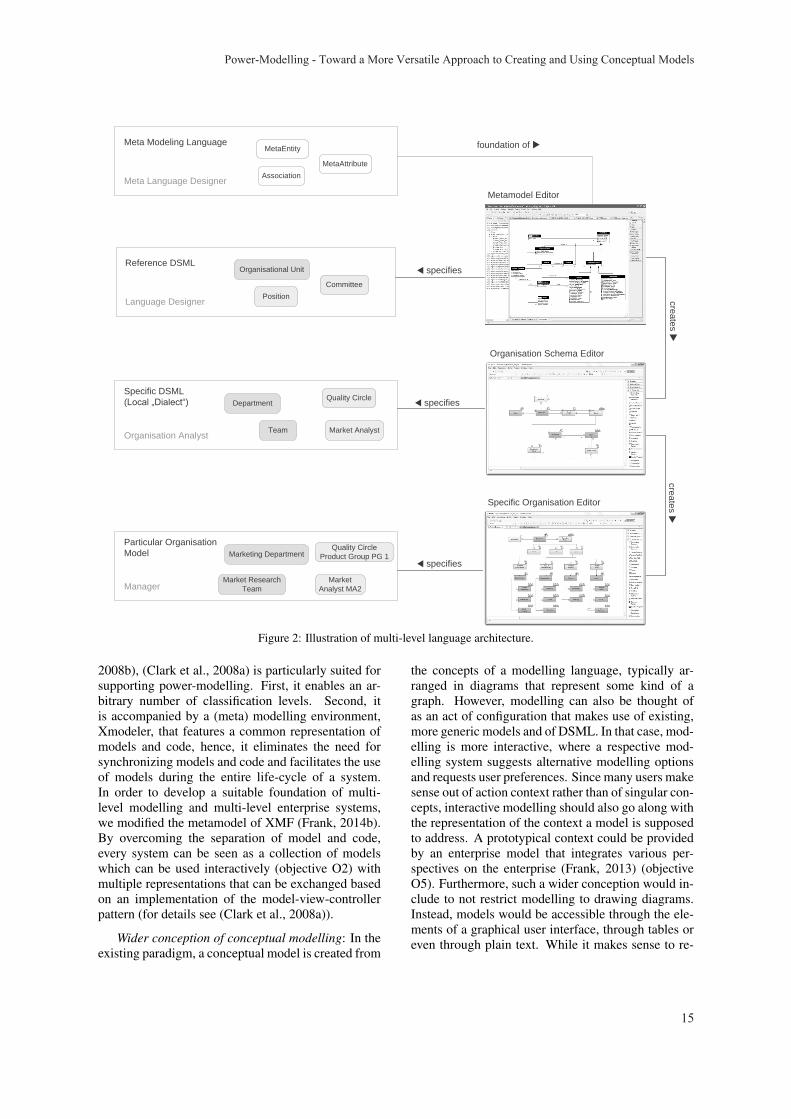
accounted for. For example: A term like “depart-ment” may represent clearly different kinds if orga-nizational units in different environments. In a uni-versity, a department consists of institutes and chairs.In some industrial enterprises, a department is part ofa head department, in others not. Applying the ideaof multi-level modelling to this domain would sug-gest developing a reference DSML for organizationmodelling. Such a reference DSML would includea descriptive graphical notation. A respective edi-tor could be used by organization analysts to createan organizational schema for a certain domain, e.g.a particular organization or a range of organizationsof a certain kind. Finally, this more specific DMSLwould be used by local managers to build a particularorganizational structure that corresponds to the previ-ously defined schema. Fig. 3 illustrates the definitionof a DSML for modelling organizational structures ofuniversities by using a more general DSML that rep-resents a textbook-level terminology.
The resulting DSML could then be used for cre-ating an editor that facilitates modelling the organiza-tional structure of a particular university. The result-ing model is located on M0. Even though it does notsatisfy the abstraction usually demanded for by con-ceptual modelling, it is still beneficial to use a graphi-cal notation that corresponds to that of the DSML de-fined on M1. Such a model would enable interactiveaccess to particular organizational units—and also al-low for navigating to the specifications of respectiveconcepts on higher classification levels.
Modelling as Interactive Configuration: Instead
Fourth International Symposium on Business Modeling and Software Design
16
CO 1
CO 2
CO 3
CR 1
CR 2
CR 3
S 1
S 2
Figure 4: Configuration through stepwise selection of intended model properties.
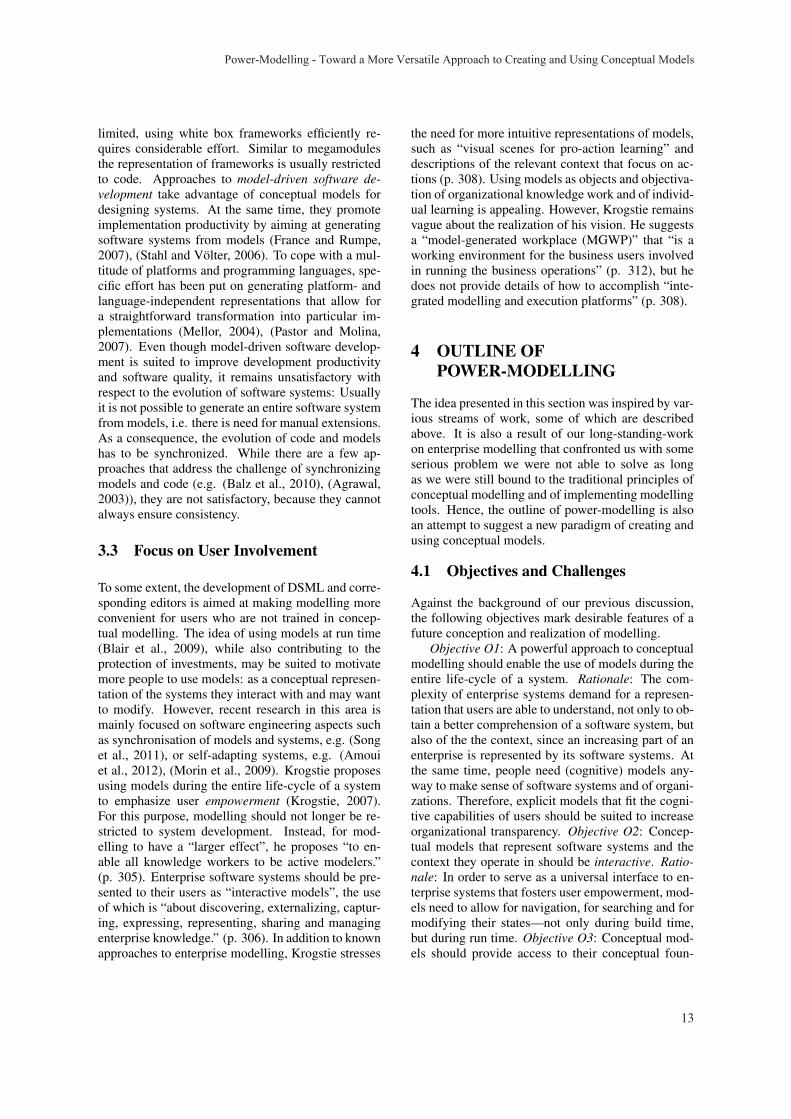
of creating a model bottom-up from the concepts pro-vided by a modelling language, the following sce-nario shows how a model can be created by combin-ing reference models, application frameworks, multi-level modelling and a common representation of mod-els and code to not only create models more conve-niently but to realize a corresponding implementationat the same time. The scenario is based on the exis-tence of a repository of various reference models thatwere created with a set of integrated DSMLs. It isaimed a modelling and thereby implementing an or-der management system for food retailing. Fig. 4 il-lustrates the use of a tool that facilitates the config-uration of particular models from an existing set ofreference models. At first, the user would specify thetargeted domain by selecting options from lists pre-sented by the modelling tool. Based on that selection,a set of possibly fitting business process types wouldbe presented to the user. After selecting one businessprocess type, the user could refine the process modelby selecting from properties that are offered by thesystem. In case, the control flow requires further mod-ification, the user could modify it using a respectiveDSML for business process modelling.
5 CONCLUSIONS AND FUTURERESEARCH
The presented outline of a new approach to creatingand using conceptual models has a twofold motiva-tion. On the one hand, it stresses the need for lean-ing back once in a while and questioning assumptionsthat we tend to take for granted. On the other hand,it presents the cornerstones of a more versatile andpowerful approach to conceptual modelling. The pre-sentation of the vision is focussed on illustrating theidea in order to inspire a discussion about its benefitsand about potential enhancements. Nevertheless, therequired foundation, especially a multi-level languagearchitecture and a common representation of modelsand code, is available. It has been developed duringthe recent years (Frank, 2014b), (Frank and Strecker,2009) and builds on a mature meta-programming lan-guage (Clark et al., 2008b). While it required to giveup certain assumptions that we had taken for granted,such as the rigid dichotomy of instantiation and spe-cialization, it opens new ways of designing and imple-menting systems that are represented to users as mod-els on different levels of abstraction. This paradigmshift requires not only giving up “standard” languagearchitectures like MOF (Object Management Group,2006), but also replacing existing implementation lan-guages. Therefore, it may be regarded by some as notrealistic. However, if we, at least in academia, do not
Power-Modelling - Toward a More Versatile Approach to Creating and Using Conceptual Models
17

give up the widespread fixation on mainstream tech-nology, progress will hardly be possible. There is stilla long way to go. Future research needs to addressthe development of reference models on different lev-els of abstraction that are specified with respectiveDSML. There is also need to develop advanced pat-terns of interaction that support the configuration andmodification of models. Last but not least, it is re-quired to overcome the limitations of current imple-mentation languages by moving to more flexible lan-guages architecture like the one XMF is based on.
REFERENCES
Agrawal, A. (2003). Metamodel based model transfor-mation language to facilitate domain specific modeldriven architecture. In Crocker, R. and Steele, G.L. J., editors, Companion of the 18th Annual ACMSIGPLAN Conference on Object-Oriented Program-ming, Systems, Languages, and Applications (OOP-SLA 2003), pages 118–119, New York. ACM.
Amoui, M., Derakhshanmanesh, M., Ebert, J., and Tahvil-dari, L. (2012). Achieving dynamic adaptation viamanagement and interpretation of runtime models.Journal of Systems and Software, 85(12):2720–2737.
Atkinson, C. and Kuhne, T. (2003). Model-driven devel-opment: a metamodeling foundation. IEEE Software,20(5):36–41.
Balz, M., Striewe, M., and Goedicke, M. (2010). Continu-ous maintenance of multiple abstraction levels in pro-gram code. In Proceedings of the 2nd InternationalWorkshop on Future Trends of Model-Driven Devel-opment (FTMDD 2010).
Blair, G., Bencomo, N., and France, R. B. (2009). [email protected]: Computer. Computer, 42(10):22–27.
Buckl, S., Matthes, F., Roth, S., Schulz, C., and Schweda,C. (2010). A conceptual framework for enterprise ar-chitecture design. In Proper, E., Lankhorst, M. M.,Schonherr, M., Barjis, J., and Overbeek, S., edi-tors, Trends in Enterprise Architecture Research, vol-ume 70 of Lecture Notes in Business Information Pro-cessing, pages 44–56. Springer, Berlin and Heidelbergand New York.
Bunge, M. (1977). Treatise on Basic Philosophy: Volume3: Ontology I: The Furniture of the World. Reidel,Dordrecht.
Clark, T., Sammut, P., and Willans, J. (2008a). Appliedmetamodelling: a foundation for language driven de-velopment.
Clark, T., Sammut, P., and Willans, J. (2008b). Superlan-guages: developing languages and applications withXMF. Ceteva.
Ferstl, O. K. and Sinz, E. J. (2006). Modeling of businesssystems using som. In Bernus, P., Mertins, K., andSchmidt, G., editors, Handbook on Architectures ofInformation Systems, International Handbooks on In-formation Systems, pages 347–367. Springer, Berlinand Heidelberg and New York.
France, R. B. and Rumpe, B. (2007). Model-driven devel-opment of complex software: A research roadmap. InBriand, L. C. and Wolf, A. L., editors, Workshop onthe Future of Software Engineering (FOSE ’07), pages37–54. IEEE CS Press.
Frank, U. (2012). Specialisation in business process mod-elling: Motivation, approaches and limitations. icb re-search report, no. 51, university of duisburg-essen.
Frank, U. (2013). Multi-perspective enterprise modeling:Foundational concepts, prospects and future researchchallenges. online first: http://link.springer.com/article/10.1007/s10270-012-0273-9. Software andSystems Modeling.
Frank, U. (2014a). Enterprise modelling: The next steps.Enterprise Modelling and Information Systems Archi-tectures, 9(1):24–40.
Frank, U. (2014b). Multilevel modeling: Toward a newparadigm of conceptual modeling and informationsystems design. Business and Information SystemsEngineering, 6:accepted for publication.
Frank, U. and Strecker, S. (2009). Beyond erp systems: Anoutline of self-referential enterprise systems: Require-ments, conceptual foundation and design options. icbresearch report, no. 31, university of duisburg-essen.
Grossmann, R. (1983). The Categorical Structure of theWorld. Indiana University Press, Bloomington.
Kahneman, D., Slovic, P., and Tversky, A., editors (1982).Judgment under uncertainty: Heuristics and biases.Cambridge University Press, Cambridge and NewYork.
Krogstie, J. (2007). Modelling of the people, by the peo-ple, for the people. In Krogstie, J., Opdahl, A.,and Brinkkemper, S., editors, Conceptual Modellingin Information Systems Engineering, pages 305–318.Springer Berlin Heidelberg.
Lakoff, G. (1990). Women, fire and dangerous things: Whatcategories reveal about the mind. Univ. of ChicagoPress, Chicago, 1 edition.
Lankhorst, M. M. (2005). Enterprise architecture at work:Modelling, communication, and analysis. Springer,Berlin and Heidelberg and New York.
Liskov, B. H. and Wing, J. M. (1994). A behavioral no-tion of subtyping. ACM Transactions on Program-ming Languages and Systems, 16:1811–1841.
Mellor, S. J. (2004). MDA distilled: Principles of model-driven architecture. Addison-Wesley object technol-ogy series. Addison-Wesley, Boston.
Morin, B., Barais, O., Jezequel, J.-M., Fleurey, F., and Sol-berg, A. (2009). [email protected] to support dy-namic adaptation. IEEE Computer, 42(10):46–53.
Object Management Group (2006). Meta object facility(mof) core specification: Version 2.0.
Pastor, O. and Molina, J. C. (2007). Model-Driven Architec-ture in Practice: A Software Production EnvironmentBased on Conceptual Modeling. Springer, Berlin andNew York.
Proper, E., Lankhorst, M. M., Schonherr, M., Barjis, J., andOverbeek, S., editors (2010). Trends in EnterpriseArchitecture Research: 5th Workshop, TEAR 2010,
Fourth International Symposium on Business Modeling and Software Design
18

Delft, The Netherlands, November 12, 2010, Proceed-ings, volume 70 of Lecture Notes in Business Infor-mation Processing. Springer, Berlin and Heidelbergand New York.
Scheer, A.-W. (1992). Architecture of Integrated Informa-tion Systems: Foundations of Enterprise Modelling.Springer, Berlin and New York.
Song, H., Huang, G., Chauvel, F., Xiong, Y., Hu, Z.,Sun, Y., and Mei, H. (2011). Supporting runtimesoftware architecture: A bidirectional-transformation-based approach. Journal of Systems and Software,84(5):711–723.
Stahl, T. and Volter, M. (2006). Model-driven softwaredevelopment: Technology, engineering, management.John Wiley, Chichester and England and Hoboken andNJ.
Wiederhold, G., Wegner, P., and Ceri, S. (1992). Towardmegaprogramming. Commun. ACM, 35(11):89–99.
Power-Modelling - Toward a More Versatile Approach to Creating and Using Conceptual Models
19
A Meta-architecture for Service-oriented Systems and Applications
Leszek A. Maciaszek1,2, Tomasz Skalniak1 and Grzegorz Biziel1 1Wrocław University of Economics, Komandorska 118/120, 53-345 Wrocław, Poland
2Macquaire University, Sydney, Australia [email protected], {tomasz.skalniak, grzegorz.biziel}@ue.wroc.pl
Keywords: Meta-architecture, Architectural Design, Service-oriented Systems and Applications, System and Software Complexity, Dependency Relationships, Software Quality, Software Adaptability, Holon Abstraction.
Abstract: The paper proposes a new meta-architecture as a reference model for developing service-oriented systems and applications. The seven-layer meta-architecture is called STCBMER (Smart Client - Template - Bean - Controller - Mediator - Entity - Resource). The purpose of it is to reduce software complexity and ensure the quality of adaptability defined as the degree to which an information system or application is difficult to understand, maintain and evolve. The main difficulty stems from complex interactions (dependencies) between system elements. The dependencies can be minimized if the system under development adheres to the architectural design and can be verified by analysing the implementation code. The paper reinforces the proposition that an architectural intent for adaptive complex systems requires some sort of hierarchical layered structure (according to the holon abstraction as an approach to restraining software complexity).
1 INTRODUCTION
The main concern and objective of software architectural design is to manage complexity in resulting systems and applications. Software complexity must not be higher than the complexity of the problem domain addressed by the software. If it is higher, we say that the software solution is over-complex (unnecessarily complicated). The main condition for lowering software complexity is to base its architectural design on a complexity-minimizing architectural framework or reference model (i.e. a meta-architecture).
Complexity is an axiomatic, but relative concept, which can only be properly interpreted by its relation to its contrary notion of simplicity (Agazzi, 2002). Something is complex because it is not simple, and vice versa.
Complexity is also a multi-faceted concept – what is complex from one point of view may be simple from another point of view. In other words, complexity is the combination of several attributes, which need to be examined separately “so that we can understand exactly what it is that is responsible for the overall “complexity”. Nevertheless, practitioners and researchers alike find great appeal in generating a single, comprehensive measure to express “complexity”” (Fenton and Pfleeger, 1997).
In our opinion, a complexity measure, if one can be generated, should be seen as an overriding measure of systems and software quality. Therefore, complexity is a derivative of characteristics constituting system/application quality. As noted by Robert Glass (2005) “the task of building quality into software is almost the same as the task of making it maintainable” (or adaptable in our parlance).
The SQuaRE standard (ISO, 2011) identifies eight quality characteristics, of which the quality of maintainability represents the instrumentation side of complexity. The standard identifies further five sub-characteristics of maintainability: modularity, reusability, analysability, modifiability, and testability. We believe that a better term for these sub-characteristics is adaptability (or adaptiveness) rather than maintainability. Adaptability is a broader concept combining understand-ability as a precondition of maintainability and maintainability as a precondition of evolve-ability.
System/software adaptability is underpinned by its complexity, measured as the count of (permitted) dependency relationships in the system/software, where: “A dependency is a relationship that signifies that a single or a set of model elements requires other model elements for their specification or implementation. This means that the complete
20
semantics of the depending elements is either semantically or structurally dependent on the definition of the supplier element(s).”(OMG, 2009).
In our research, we address the last of the five deep questions in computing identified by Jeannette Wing (2008): “(How) can we build complex systems simply?”. We have argued that a valid answer to this question is to construct system/software according to dependency-minimizing meta-architecture (e.g. Maciaszek and Liong, 2005).
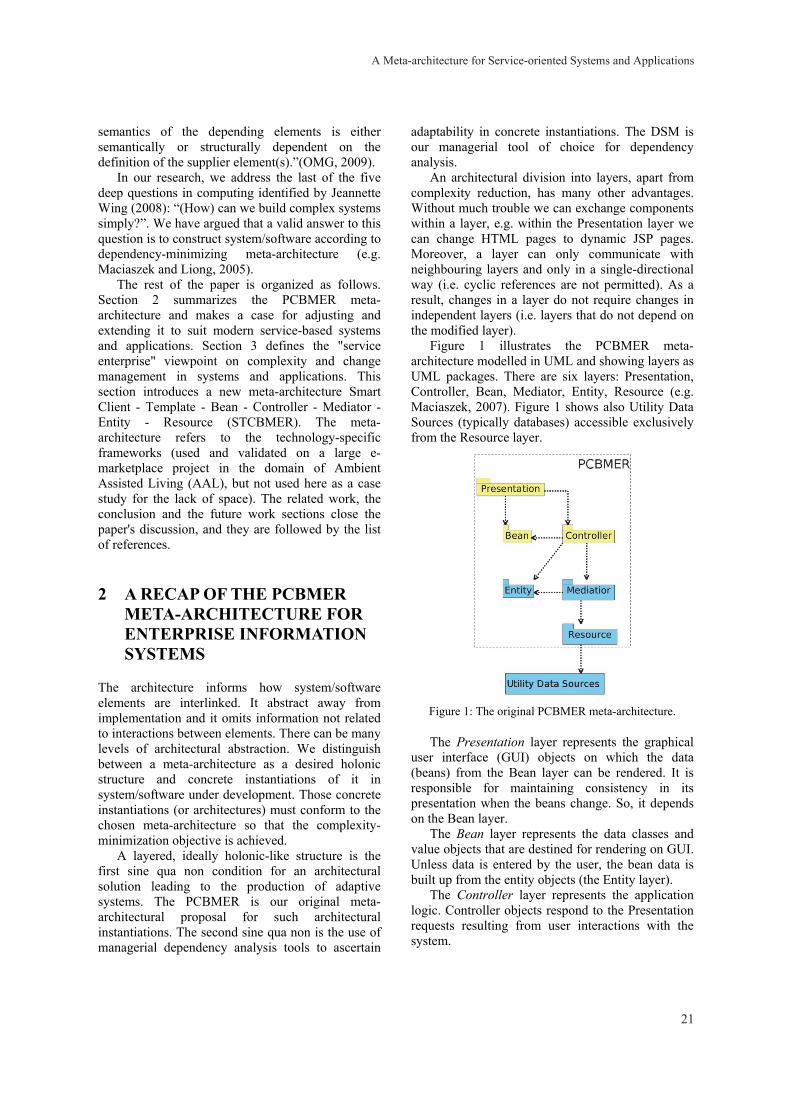
The rest of the paper is organized as follows. Section 2 summarizes the PCBMER meta-architecture and makes a case for adjusting and extending it to suit modern service-based systems and applications. Section 3 defines the "service enterprise" viewpoint on complexity and change management in systems and applications. This section introduces a new meta-architecture Smart Client - Template - Bean - Controller - Mediator - Entity - Resource (STCBMER). The meta-architecture refers to the technology-specific frameworks (used and validated on a large e-marketplace project in the domain of Ambient Assisted Living (AAL), but not used here as a case study for the lack of space). The related work, the conclusion and the future work sections close the paper's discussion, and they are followed by the list of references.
2 A RECAP OF THE PCBMER META-ARCHITECTURE FOR ENTERPRISE INFORMATION SYSTEMS
The architecture informs how system/software elements are interlinked. It abstract away from implementation and it omits information not related to interactions between elements. There can be many levels of architectural abstraction. We distinguish between a meta-architecture as a desired holonic structure and concrete instantiations of it in system/software under development. Those concrete instantiations (or architectures) must conform to the chosen meta-architecture so that the complexity-minimization objective is achieved.
A layered, ideally holonic-like structure is the first sine qua non condition for an architectural solution leading to the production of adaptive systems. The PCBMER is our original meta-architectural proposal for such architectural instantiations. The second sine qua non is the use of managerial dependency analysis tools to ascertain
adaptability in concrete instantiations. The DSM is our managerial tool of choice for dependency analysis.
An architectural division into layers, apart from complexity reduction, has many other advantages. Without much trouble we can exchange components within a layer, e.g. within the Presentation layer we can change HTML pages to dynamic JSP pages. Moreover, a layer can only communicate with neighbouring layers and only in a single-directional way (i.e. cyclic references are not permitted). As a result, changes in a layer do not require changes in independent layers (i.e. layers that do not depend on the modified layer).
Figure 1 illustrates the PCBMER meta-architecture modelled in UML and showing layers as UML packages. There are six layers: Presentation, Controller, Bean, Mediator, Entity, Resource (e.g. Maciaszek, 2007). Figure 1 shows also Utility Data Sources (typically databases) accessible exclusively from the Resource layer.
Figure 1: The original PCBMER meta-architecture.
The Presentation layer represents the graphical user interface (GUI) objects on which the data (beans) from the Bean layer can be rendered. It is responsible for maintaining consistency in its presentation when the beans change. So, it depends on the Bean layer.
The Bean layer represents the data classes and value objects that are destined for rendering on GUI. Unless data is entered by the user, the bean data is built up from the entity objects (the Entity layer).
The Controller layer represents the application logic. Controller objects respond to the Presentation requests resulting from user interactions with the system.
A Meta-architecture for Service-oriented Systems and Applications
21
The Entity layer responds to Controller and Mediator. It contains business objects retrieved from the database or created for successive storage in the database. Many entity classes are container classes (i.e. they contain business objects and methods for adding and removing objects as well as methods to iterate over objects).
The Mediator layer mediates between Entity and Resource classes. It manages business transactions, enforces business rules, instantiates business objects in the Entity layer, and in general manages the memory cache of the application. Architecturally, Mediator serves two main purposes. Firstly, to isolate the Entity and Resource layers so that changes in any one of them can be introduced independently. Secondly, to mediate between the Controller and Entity/Resource layers when Controller requests data, but it does not know if the data has previously been loaded from the database into memory.
The Resource layer is responsible for all communications with external persistent data sources (databases, web services, etc.). This is where the connections to the database servers are established, queries to persistent data are constructed, and the database transactions are instigated.
The downward arrows between the PCBMER layers signify acyclic dependency relationships. Cyclic dependencies are the main characteristic of over-complex systems and the culprit of the lack of adaptability in such systems. The Downward Dependency Principle (DDP) and the Cycle Elimination Principle (CEP) are two main architectural principles of PCBMER (Maciaszek and Liong, 2005).
The DDP principle ensures that all message dependencies (function calls) have downward direction (message dependencies signify tightly coupled communication, such as in Remote Method Invocation (RMI) - not to be confused with asynchronous messaging, such as in Java Messaging Service (JMS)).
Higher PCBMER layers depend on lower layers, but not vice versa (at least not from the viewpoint of message dependencies). As a result, managing change in lower layers is more troublesome and we need to endeavour to apply extra care to designing lower layers, so that they are more stable (i.e. more resilient to changes).
The DDP principle is further constrained by the Neighbour Communication Principle (NCP). This principle ensures that objects can communicate with distant layers only by utilizing chains of message
passing through neighbouring layers. Occasional claims in the literature that such message passing impacts performance are misguided, in particular in the context of enterprise information systems in which performance is invariably related to input/output data transfers to/from databases (performance penalty of in-memory processing is negligible in this context).
The CEP principle demands that cycles of messages are disallowed between objects. The principle applies to objects of any granularity (methods, classes, components, services, packages, subsystems, etc.). This does not mean that call-backs are disallowed. It just means that call-backs must be implemented using other than straight message passing techniques. The two principal techniques are event processing and the use of interfaces, sometimes combined to achieve a desired effect. Additionally, clustering and de-clustering of objects can result in elimination of some cycles. Maciaszek and Liong (2005) contains a detailed description of cycle-elimination techniques.
The Upward Notification Principle (UNP) is a separately-listed principle to counteract the stringent DDP rule and to enforce the CEP principle in communications between layers. This principle requires that lower layers rely on event processing (publish/subscribe protocols) and interfaces to communicate with objects in higher layers.
The PCBMER meta-architectural framework has been created for and validated in development of large scale "stovepipe" enterprise information systems and applications. The software production in such projects is entirely in the hands and minds of the software development team. However, modern software production is not "stovepipe" any more. Software development projects are not standalone undertakings - they are endeavours in systems integration. Complexity management and delivery of adaptable solutions takes on a new dimension.
Firstly, the shift from systems development to systems integration manifests itself on the software level by the shift from synchronous message passing to asynchronous event processing (Maciaszek, 2008a). This has an obvious business explanation. Integration implies dependency on the code that is not our own and not under direct control of the developers (or rather integrators, to be precise). Frequently, this is the code of our business partners who are unlikely to open it up for synchronous message passing from/to our code. But even in case of the integration projects within the same organization, the independent nature of separate business processes (and the software supporting
Fourth International Symposium on Business Modeling and Software Design
22
them) is unlikely to permit or warrant synchronous interoperability. Moreover, whether integrating with external systems or with internal systems, synchronous message passing typically would require some level of intervention in the source code of the system we integrate with. Clearly, this is almost never an option.
Secondly, and related to the systems integration issue, another paradigm shift has been observed in modern software production - the shift from in-house software ownership to trusted provisioning of service-based systems and applications. Grounded in the Service Oriented Architecture (SOA) model of computation, this shift has created a new dimension to our understanding of software complexity and delivery of adaptable Software as a Service (SaaS) solutions. The first and foremost concern are the implications for architectural design of such systems and applications. This is discussed next.
3 THE STCBMER META-ARCHITECTURE FOR SERVICE ENTERPRISE
Founded on cloud computing, the SaaS phenomenon exerts new business and pricing models for using information systems without owning them. Service-oriented systems have emerged as a new scientific abstraction allowing orchestration of service resources and processes according to value propositions (co-creation of value).
Service systems and applications have become a commodity - like telephone, water, energy, gas, etc. Associated with this observation, several dichotomies have emerged. On one hand, software products are servitized; on the other hand, software services are productized (Cusumano, 2008). On one hand, vendors of Component of the Shelf (COTS) enterprise information systems use Internet as a service delivery mode; on the other hand, productized services are delivered over Internet as enablers and productivity enhancers in the service economy.
The above dichotomies have posed new challenges on the very idea of complexity and change management in a modern-age service enterprise. The responsibilities for complexity and change management have shifted to producers and suppliers/vendors of service systems and applications, but much of the risk is endured by the enterprises receiving/buying the services. It comes as no surprise that enterprises seek to alleviate the
risks and try not to lose control over their own destiny.
The main objective and sine qua non in such service enterprises must be to ensure the adaptability of received service systems and applications. This in turn implies a demand for a layered, modular and dependency-minimizing architecture in such systems and applications, so that the service enterprise can understand, maintain and evolve its software solutions. In this context, it does not matter if a service system or application is delivered as a complete SaaS solution or it is delivered as componentized web services from which a system or application is constructed. In all cases a level of trust between providers and recipients of services is necessary, and in all cases we need to ensure the quality of adaptability in service solutions.
Interestingly, but also paradoxically, the service systems and applications are built on the technologies that, by their very nature, support adaptability. The concepts such as loose coupling, abstraction, orchestration, implementation neutrality, configurability, discoverability, statelessness, immediate access, etc. are exactly the ideas of adaptable architectural design. In the remainder of the paper, we propose a meta-architecture for adaptable architectural design of SOA systems and applications. The meta-architecture has evolved from the PCBMER meta-architecture and it is called Smart Client - Template - Bean - Controller - Mediator - Entity - Resource (STCBMER).
The seven layers of the STCBMER meta-architecture can be grouped into three main architectural modules as shown in Figure 2. The three modules - Smart Client Logic, Application Logic, and Business Logic - work in different address spaces separated by the technology of web services. The SOA technology is responsible for discovering web services, providing service binding, and orchestrating an exchange of information through web service interactions. The service discovery dependencies can be realized through WSDL (Web Services Description Language). The service binding dependencies can be realized through SOAP (Simple Object Access Protocol) or REST (Representational State Transfer) invocations.
A Meta-architecture for Service-oriented Systems and Applications
23
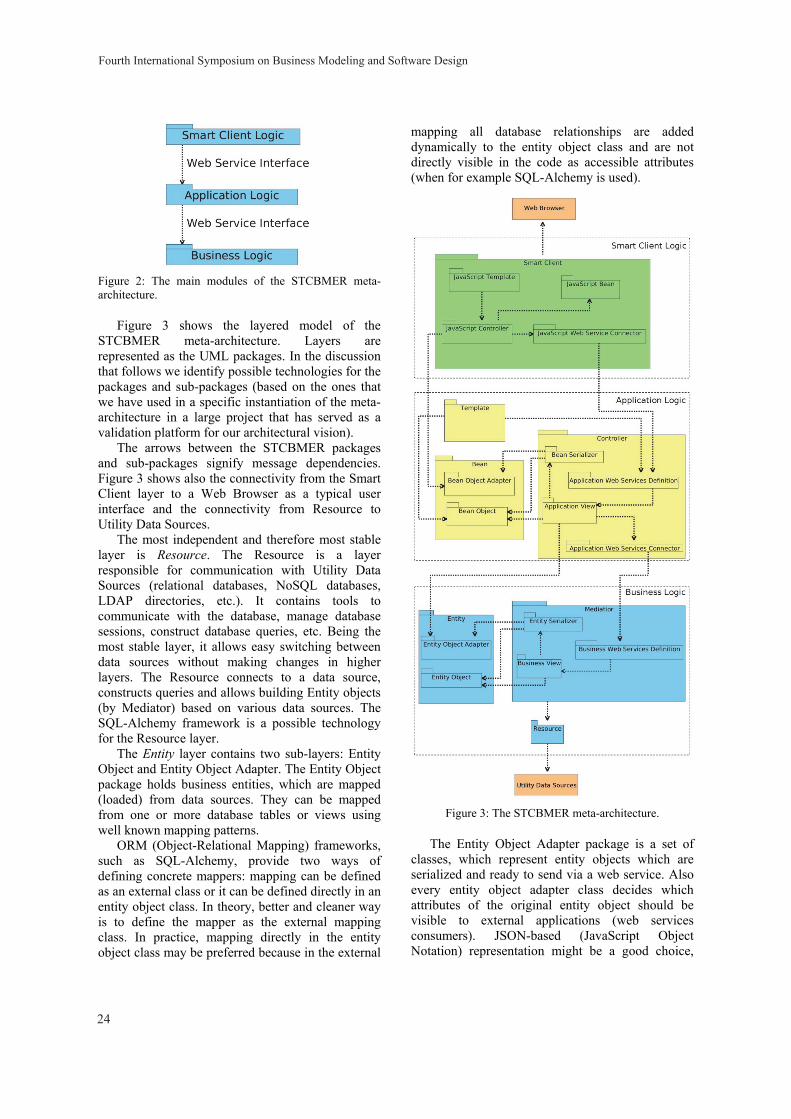
Figure 2: The main modules of the STCBMER meta-architecture.
Figure 3 shows the layered model of the STCBMER meta-architecture. Layers are represented as the UML packages. In the discussion that follows we identify possible technologies for the packages and sub-packages (based on the ones that we have used in a specific instantiation of the meta-architecture in a large project that has served as a validation platform for our architectural vision).
The arrows between the STCBMER packages and sub-packages signify message dependencies. Figure 3 shows also the connectivity from the Smart Client layer to a Web Browser as a typical user interface and the connectivity from Resource to Utility Data Sources.
The most independent and therefore most stable layer is Resource. The Resource is a layer responsible for communication with Utility Data Sources (relational databases, NoSQL databases, LDAP directories, etc.). It contains tools to communicate with the database, manage database sessions, construct database queries, etc. Being the most stable layer, it allows easy switching between data sources without making changes in higher layers. The Resource connects to a data source, constructs queries and allows building Entity objects (by Mediator) based on various data sources. The SQL-Alchemy framework is a possible technology for the Resource layer.
The Entity layer contains two sub-layers: Entity Object and Entity Object Adapter. The Entity Object package holds business entities, which are mapped (loaded) from data sources. They can be mapped from one or more database tables or views using well known mapping patterns.
ORM (Object-Relational Mapping) frameworks, such as SQL-Alchemy, provide two ways of defining concrete mappers: mapping can be defined as an external class or it can be defined directly in an entity object class. In theory, better and cleaner way is to define the mapper as the external mapping class. In practice, mapping directly in the entity object class may be preferred because in the external
mapping all database relationships are added dynamically to the entity object class and are not directly visible in the code as accessible attributes (when for example SQL-Alchemy is used).
Figure 3: The STCBMER meta-architecture.
The Entity Object Adapter package is a set of classes, which represent entity objects which are serialized and ready to send via a web service. Also every entity object adapter class decides which attributes of the original entity object should be visible to external applications (web services consumers). JSON-based (JavaScript Object Notation) representation might be a good choice,
Fourth International Symposium on Business Modeling and Software Design
24
especially if the web service is built with a REST Web Service. JSON is a native JavaScript type, so it suits well web programming, and it is a reasonable alternative to the XML (eXtensible Markup Language).
The Mediator layer is responsible for managing business transactions and business rules as well as loading and unloading business objects (entity objects). This layer manipulates entity objects and defines a kind of Facade pattern, which offers access to them: getting, saving, creating, deleting, editing and caching.
As a technology-specific example, the Mediator could use the SQL-Alchemy or other ORM framework to communicate with the Resource layer (which also could be based on the SQL-Alchemy) to load/unload entity objects. Entity objects manipulation (the Mediator) could be available as a set of simple Python functions as well as a set of web services defined with the Pyramid web framework (as in our platform of choice) and accessible via the REST interface. Those functions should be defined in the Business View sub-package and are called “business views”.
To construct a web service (view) from a Python function, a programmer can use a special decorator (Decorator pattern) provided by the Pyramid framework. Since all web methods (views) are available via the REST (Representational State Transfer) interface, every web service should be accessible with a given URI (Uniform Resource Identifier). Routing from a given URI to a specific web service is done by the Pyramid itself. This functionality in the STCBMER meta-architecture is realized by the Business Web Service Definition package (and analogously by the Application Web Service Definition package in the Application Layer).
In the SOAP-based web service the Business Web Service Definition package should also build a WSDL document describing the web API (Application Programming Interface) of the Business Logic. If the API is built as a REST interface, this package should also define the mappers (routes) from a specific URI to a given view (web service). In the Pyramid web framework all the routes are defined by programmers using regex (regular expression) patterns. To serialize and send business objects via the REST interface, the Mediator uses the Entity Serializer. Every serialized entity object is a JSON object, with structure defined in the Entity Object Adapter package.
The Controller layer defines the application logic (different from the Mediator's business logic). In our
technology-specific scenario, the application logic is captured in a set of functions (Application View sub-package) accessed as pure Python functions or web services. Each function (web service) is called a view (just like in the Mediator layer). The Controller uses the Mediator to get entity object adapters to create and operate on Bean objects. Mapping between the Entity Object Adapter and the Bean Object classes is done by the Application View package. Because the Mediator is accessed via the REST interface, there is a need to cover the REST communication with a Facade component responsible for a networking communication.
The Controller is equipped with the Application Web Service Connector sub-package used by application views to realize the Mediator communication and orchestration. All web services (views) are available through the REST interface. This is why the Controller contains the Application Web Service Definition sub-package, which can be built with the Pyramid framework, and works in the same way as an analogue package in the Mediator layer.
Controller's views return different types of data. Sometimes they pass prepared data to the Template package (bean objects) to get from it an HTML document. Sometimes views provide only pure bean objects in the serialized (JSON) notation (bean object adapters – analogously to entity object adapters). This kind of data can be used by different web services, for example JavaScript Controllers or other applications.
In Figure 3 we present only one application consuming the Business Layer (plus the Smart Client application), but in the STCBMER model the Business Layer can serve the business services (as web services) to more than one application written in various technologies.
The Bean layer is just a set of classes that define application objects. Objects of those classes can be used by the Template layer to generate the web front-end (HTML, CSS, eventually JavaScript). But in some cases Bean objects are just returned as a result of invoking an application view (a web service). In this case they are mapped by the Bean Serializer to the bean object adapters. Bean objects are defined dynamically by Controller views and can be stored in JSON notation, which is close to a native type of Dictionary in Python and it is a native type for the JavaScript language. The JSON notation is nowadays widely used in web systems because the text representation of JSON objects (which in the end is sent via HTTP) is quite lightweight and easy to parse in various technologies.
A Meta-architecture for Service-oriented Systems and Applications
25
The Template layer is responsible for generating a web front-end using Bean objects (prepared by the Controller module in views). While views (Controller) construct data to be displayed, the Template is responsible for how data will be displayed. In our technology-specific solution, the Template layer uses the Mako template library written in Python and is responsible for generating HTML documents (sometimes with some additional CSS and JavaScript, if the documents have to be prepared dynamically). In general the Template layer is used also to generate different types of documents which might be needed by various remote applications/systems.
The Smart Client layer consists of the JavaScript Controller, JavaScript Template, JavaScript Bean and JavaScript Web Service Connector. In our e-marketplace project (not described here, as mentioned in passing), all modules except the JavaScript Web Service Connector are provided by the Angular.js framework, which is based on the M-V-VM (Model-View-ViewModel) pattern. This pattern is used by a large number of web frameworks, also by JavaScript frameworks, working usually in a homogeneous memory environment (all objects can access each other).
The ViewModel listens to the Model object (usually as a Subscriber), and after triggering an event, does some application logic (for example changing the state of other Model objects). In the end, the ViewModel can publish its own event object, so that the View (which is usually a Subscriber) could re-render the user interface based on ViewModel attributes (which the ViewModel defines for each Model – similar to the Adapter pattern). Of course, the Angular.js framework is just our platform of choice for the Smart Client layer in our e-marketplace project and it could be realised with different technologies based on various patterns (M-V-VM is just an example).
The STCBMER meta-architecture is an extension of the PCBMER meta-architecture to cater for service-oriented systems and applications. Both meta-architectures share the same complexity-minimizing architectural principles. The four principles discussed earlier (namely CEP, DDP, UNP, and NCP) are all honoured by the STCBMER meta-architecture.
4 RELATED WORK
The word "architecture" is an overloaded term in computing. It is used to denote physical architectural
design as well as logical architectural design. In its physical meaning, it refers to the allocation of software components, and communication patterns between them, to computing nodes forming architectural tiers. In its logical meaning (as addressed in this paper), it refers to the allocation of software components, and communication patterns between them, to computing packages forming architectural layers. In between these physical and logical meanings, there are various mixed uses of the word "architecture", including SOA, ADL (Architecture Description Language), Enterprise Architecture, etc.
Although the term "architecture" is overloaded and even overused in the literature, it comes as a surprise that very little research has been reported on layered architectural design for the development of software systems and applications. While complete meta-architectural proposals are difficult to find, the literature is full of architectural guidelines and patterns of which the Core J2EE Patterns (Alur et al., 2003) and the PEAA (Patterns of Enterprise Application Architecture) (Fowler, 2003) have made most impact on our work.
The philosophical underpinning of structuring our models of meta-architectures into hierarchical layers comes from the holonic approach to science as the most promising way to take control over complexity of artificial systems (Koestler, 1967; Koestler, 1980; Capra, 1982; Agazzi, 2002). Apart from dismissing network structures as untenable for construction of complex adaptive systems, the holonic approach explains so called SOHO (Self-regulating Open Hierarchic Order) properties in biological systems. These properties provide a basis for better understanding of human-made systems and how adaptive complex systems should be modelled.
Software complexity underpins all efforts to achieve software quality. Software quality models and standards, such as SQuaRE (ISO, 2011), tend to concentrate on software product quality, but recognize that it is not possible to produce a quality product without having a quality process that defines lifecycle activities. It is in the very nature of software engineering that a major activity within a software quality process is change management.
There is a growing body of research on service change management (e.g. Wang and Wang, 2013), but we do not know of published works that would link change management in service-oriented systems to architectural design as the crux of complexity management and software adaptability.
Fourth International Symposium on Business Modeling and Software Design
26
Similarly with regard to software metrics - a huge number of generic software metrics have been proposed (e.g. Fenton and Pfleeger, 1997). There exist also proposals of metrics targeting service-oriented systems (e.g. Perepletchikov and Ryan, 2011). However, the metrics are not sufficiently linked to the quality assurance processes that would be enforcing architectural design in the software. In other words, the metrics are reactive rather than proactive.
The same observation applies to the DSM method as a visualization of software complexity as well as a vehicle for calculating complexity metrics (Eppinger and Browning, 2012; Sangal et al., 2005). The expressive power of DSM has been mostly used for discovering complexity problems in the software, and for fixing problems like cyclic dependencies, but there is a lack of tangible results reporting round-trip engineering use of DSM to control software complexity.
5 CONCLUSION
The introduction and description of the STCBMER meta-architecture is a contribution of this paper. When we started working on a meta-architecture proposal for service-oriented systems and applications, we expected a notable departure from our PCBMER meta-architecture developed for conventional enterprise systems. It has turned out that STCBMER and PCBMER are similar.
The STCBMER introduces one new layer built with JavaScript and few new sub-packages. A web browser is now an explicit part of the new model.
The Entity and the Bean layers are now defined with more details. Each consists of two sub-packages: one containing the real objects (the Entity Object and the Bean Object) and the second representing objects ready to send via a web service interface (the Entity Object Adapter and the Application Object Adapter).
To map business/application objects to proper adapters, special packages are introduced: the Entity Serializer and the Bean Serializer. Since the communication between the Smart Client Logic, the Application Logic and the Business Logic is organized with a web service technology, special web service packages are introduced. The first type of packages needed to organize a web service communication, are packages which contain the API definition: the Business Web Service Definition and the Application Web Service Definition. Those packages define how the API of each layer looks
like. The second type of packages are web service connectors: the JavaScript Web Service Connector and the Application Web Service Connector.
Some differences between STCBMER and the PCBMER can be noticed in dependency relationships. New dependencies exist to reflect the fact that the new meta-architecture works in a web service environment. For example in the PCBMER the direct dependency between Controller and the Entity (Controller’s objects construct Bean objects from the Entity objects) is in the STCBMER defined as a dependency between the Controller package and the Entity Object Adapter package. But since the Entity Object Adapter is a sub-package of the Entity package, dependency between the Controller and the Entity layers still exists.
Other differences can also be noticed – not in the architecture definition but in default technical environment. The PCBMER has not been defined to work in a web environment, or in a service-oriented model. The STCBMER is an elaborated version of PCBMER designed to be able to work in those environments.
6 FUTURE WORK
The STCBMER meta-architecture proposed in this paper has been validated in the field on a large project for the e-marketplace domain. However, the usability of the meta-architecture is only a partial proof of its value. In the follow-up research we need to develop concrete metrics that can be used to measure complexity of comparable versions of software designs and systems built according to the STCBMER framework.
The metrics will measure dependency relationships in software. To this aim, we first need to classify all kinds of dependencies in service-oriented systems and applications that have a clear impact on software complexity. At the beginning we will concentrate on coarse-grained dependencies: message dependencies (addressed in this paper, but not in the context of metrics), event dependencies and interface dependencies. For the service-oriented systems and applications, a special attention will need to be placed on the interface dependencies as they constitute the essence of web services. As an important aspect of our future research, we will need to discuss the strengths/weights of various kinds of dependencies on the complexity and adaptability of software.
We stress that the complexity metrics are not absolute measures – their value is only in
A Meta-architecture for Service-oriented Systems and Applications
27
comparison to other (previous) versions of system/application architectural designs and in successive versions of software products. In Maciaszek (2008b) we discussed the ways of using DSM (Dependency Structure Matrix) for the analysis and comparison of system/software complexity. Today many tools exist that support the DSM method and that additionally integrate with popular IDE-s, such as Eclipse, Visual Studio or IntelliJ.
The tool support is important here as the complexity management has both forward and reverse-engineering dimension. The software needs to be forward-engineered according to its architectural design, but we also need to validate the code conformance with the architectural principles.
Contemporary tools offer visualization of dependencies in the code-base not just at particular levels, such as method-to-method, class-to-class, directory-to-directory, but also across levels, such as function-to-type, namespace-to-class, jar-to-method. One of such tools is Structure101 (Structure, 2014).
Structure101 and most other tools are predominantly reverse engineering tools, more reactive than proactive. Structure101 provides, however, a specialized module, called Architecture Development Environment (ADE), to define architectural rules and guide conformance inside an IDE. The “proactivity” remains at the architecture (instantiation) level and meta-architecture is offered by the tool itself, but we plan to use ADE to define the STCBMER principles for various industrial studies and software development projects.
REFERENCES
Agazzi, E., 2002. What is Complexity? In Agazzi, E., Montecucco, L. (Eds) Complexity and Emergence. Proceedings of the Annual Meeting of the International Academy of the Philosophy of Science, pp. 3-11, World Scientific.
Alur, D., Crupi, J., Malks, D., 2003. Core J2EE Patterns: Best Practices and Design Strategies, 2nd ed., Prentice Hall.
Capra, F. (1982): The Turning Point. Science, Society, and the Rising Culture. Flamingo.
Cusumano, M.A., 2008. The Changing Software Business: Moving from Products to Services, IEEE Computer, January, pp.20-27.
Eppinger, S.D., Browning T.R., 2012. Design Structure Matrix Methods and Applications, The MIT Press.
Fenton, N.E., Pfleeger, S.L., 1997. Software Metrics. A Rigorous and Practical Approach, 2nd ed., PWS Publishing Company.
Fowler, M., 2003. Patterns of Enterprise Application
Architecture, Addison-Wesley. Glass, R.L., 2005. The Link Between Software Quality
and Software Maintenance. IT Metrics and Productivity Journal, November, p.29.
ISO, 2011. International Standard ISO/IEC 2510: Systems and Software Engineering - Systems and Software Quality Requirements and Evaluation (SQuaRE) - System and Software Quality Models, ISO/IEC.
Koestler, A., 1980. Bricks to Babel, Random House. Koestler, A., 1967. The Ghost in the Machine, Penguin
Group, London. Maciaszek, L.A., 2008a. Adaptive Integration of
Enterprise and B2B Applications. In Filipe, J., Shishkov, B., Helfert, M. (Eds), ICSOFT 2006, CCIS 10 Springer-Verlag.
Maciaszek, L.A., 2007. An Investigation of Software Holons - The 'adHOCS' Approach. In Argumenta Oeconomica Vol.19, No.1-2, pp.1-40.
Maciaszek, L.A., 2008b. Analiza struktur zależności w zarządzaniu intencją architektoniczną systemu (Dependency Structure Analysis for Managing Architectural Intent), In Huzar, Z., Mazur, Z. (Eds), Inżynieria Oprogramowania – Od Teorii do Praktyki, pp.13-26, Wydawnictwa Komunikacji i Łączności, Warszawa.
Maciaszek, L.A., 2009. Architecture-Centric Software Quality Management, In Cordeiro, J., Hammoudi, S., Filipe, J. (Eds), Web Information Systems and Technologies, WEBIST 2008, LNBIP 18, Springer.
Maciaszek, L.A., 2006. From Hubs Via Holons to an Adaptive Meta-Architecture – the “AD-HOC” Approach. In Sacha, K. (Ed.), IFIP International Federation for Information Processing, Vol. 227, Software Engineering Techniques: Design for Quality, pp.1-13, Springer.
Maciaszek, L.A., Liong, B.L., 2005. Practical Software Engineering. A Case-Study Approach. Addison-Wesley.
OMG, 2009. Unified Modeling Language™ (OMG UML), Superstructure, Version 2.2.
Perepletchikov, M., Ryan, C., 2011: A Controlled Experiment for Evaluating the Impact of Coupling on the Maintainability of Service-Oriented Software, IEEE Trans. On Soft. Eng., Vol. 37, No. 4, pp.449-465
Sangal, N. Jordan, E. Sinha, V., Jackson, D., 2005. Using Dependency Models to Manage Complex Software Architecture, In Procs. OOPSLA’05, pp.167-176, ACM.
Structure, 2014. Structure101, http://structure101.com/, viewed February 2014.
Wang Yi., Wang Ying (2013). A Survey of Change Management in Service-Based Environments, In SOCA, pp.259-273, Springer
Wing, J.M., 2008. Five Deep Questions in Computing. Comm. of the ACM, Vol. 51, No.1, pp.58-60.
Fourth International Symposium on Business Modeling and Software Design
28
Improving Computer-Support forCollaborative Business Model Design and Exploration
Marin Zec1, Peter Durr2, Alexander W. Schneider1 and Florian Matthes1
1Fakultat fur Informatik, Technische Universitat Munchen, Boltzmannstr. 3, 85748 Garching, Germany2Applied Social Sciences, Munich University of Applied Sciences, Am Stadtpark 20, 81243 Munchen, Germany
{marin.zec, alexander.schneider, matthes}@tum.de, [email protected]
Keywords: Business Model Innovation, Business Model Canvas, Business Model Development, Business ModelExploration, Morphological Analysis, Computer-Aided Business Model Design, Computer-Aided BusinessModel Generation, Group Dynamics
Abstract: Finding a viable and sustainable business model is a major challenge not only for startup companies. Estab-lished companies are re-thinking their existing business models and explore new business opportunities. TheBusiness Model Canvas is currently one of the most popular frameworks for business model innovation. Whilecomputer-aided design (CAD) tools are well-established in mechanical engineering, business model design isstill mostly done using pen-and-paper methods. In this paper, we (1) discuss benefits and shortcomings ofthe Business Model Canvas approach, (2) show how it can borrow techniques from General MorphologicalAnalysis to overcome shortcomings, and (3) derive three key requirements for future collaborative CAD toolsfor business model design. Our analysis contributes to an understanding of how software support can improvecollaborative design and evaluation of business models.
1 INTRODUCTION
Business model innovation plays an increasingly im-portant role for both startup as well as mature com-panies due to increasing competition (Mitchell andColes, 2003; Mitchell and Coles, 2004). On one hand,the primary organizational goal of startup companiesis to generate a viable business model – sometimes re-sulting in disruption of whole markets. On the otherhand, established companies primarily aim to executetheir business model as efficiently as possible. As aresult, they tend to struggle with rapid and/or pro-found market changes.
However, many established companies realize thestrategic importance of business model innovation forthe sustainability of their organization (e.g. Ama-zon Web Services, a collection of cloud computingservices offered by Amazon.com in addition to theirprimary e-commerce business). Consequently, anincreasing number of companies strive for continu-ous business model innovation. They pursue vari-ous strategies to do so, such as promoting and estab-lishing intrapreneurship, corporate venturing or cre-ation of corporate venture capital units. Examples in-clude Google Ventures, Siemens Venture Capital andUnilever Ventures. Still business model innovation re-
mains to be a complex problem for both startups andmore mature companies (Chesbrough, 2010).
Business model innovation is typically conductedin teamwork since expertise in different domains suchas marketing, engineering and accounting is neededfor holistic business model design. However, eachexpert tends to maintain his/her domain-specific men-tal model and terminology. Boundary objects makecollaboration across different groups possible sincethey provide a common point of reference for discus-sion and collaboration. Individuals/groups with dif-ferent background can interpret them differently with-out surrendering the shared boundary object’s iden-tity (Carlile, 2002). The Business Model Canvas(BMC) (Osterwalder and Pigneur, 2010), an artifactdesigned to facilitate business model design by pro-viding a problem structure and focus of thought (Ep-pler et al., 2011), can serve as boundary object forbusiness model innovation.
The BMC was at first proposed as a pen-and-paperor whiteboard tool for business model design work-shops. However, Osterwalder et al. (2013) call forCAD software for business modeling since they ex-pect it to yield benefits for strategic planning similarto the benefits and features CAD software brought toengineering or architecture, e.g. “[. . . ] speed, rapid
29
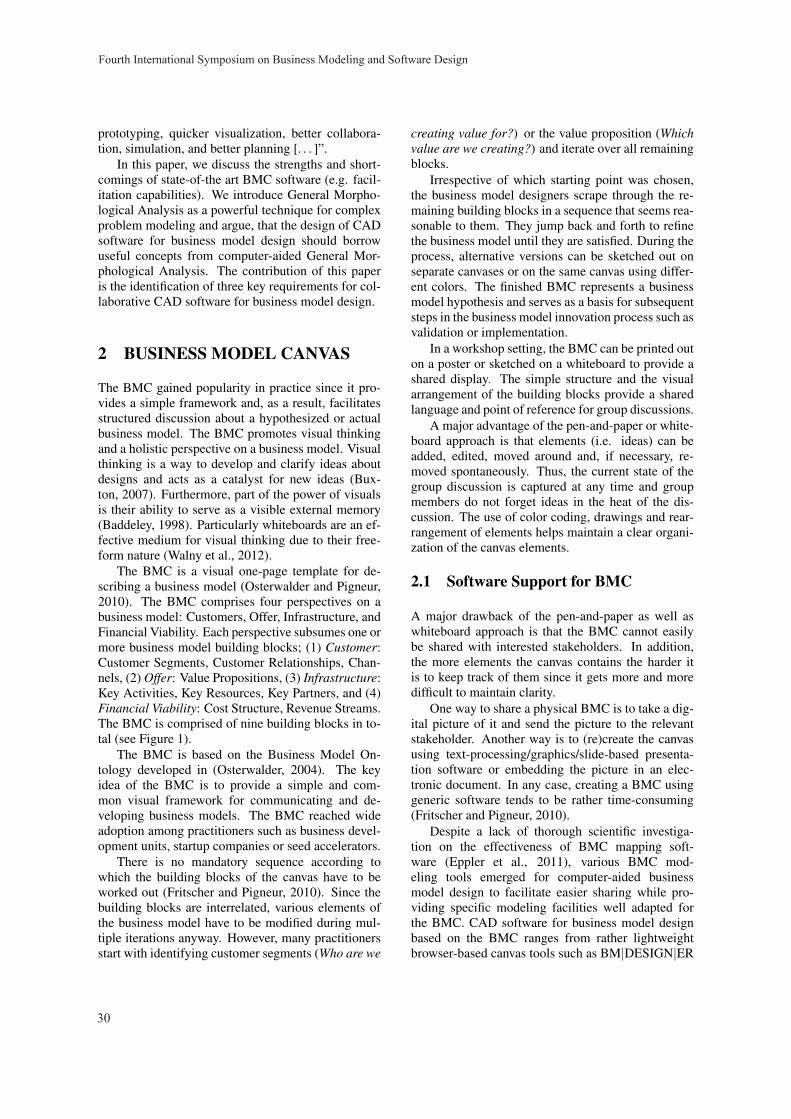
prototyping, quicker visualization, better collabora-tion, simulation, and better planning [. . . ]”.
In this paper, we discuss the strengths and short-comings of state-of-the art BMC software (e.g. facil-itation capabilities). We introduce General Morpho-logical Analysis as a powerful technique for complexproblem modeling and argue, that the design of CADsoftware for business model design should borrowuseful concepts from computer-aided General Mor-phological Analysis. The contribution of this paperis the identification of three key requirements for col-laborative CAD software for business model design.
2 BUSINESS MODEL CANVAS
The BMC gained popularity in practice since it pro-vides a simple framework and, as a result, facilitatesstructured discussion about a hypothesized or actualbusiness model. The BMC promotes visual thinkingand a holistic perspective on a business model. Visualthinking is a way to develop and clarify ideas aboutdesigns and acts as a catalyst for new ideas (Bux-ton, 2007). Furthermore, part of the power of visualsis their ability to serve as a visible external memory(Baddeley, 1998). Particularly whiteboards are an ef-fective medium for visual thinking due to their free-form nature (Walny et al., 2012).
The BMC is a visual one-page template for de-scribing a business model (Osterwalder and Pigneur,2010). The BMC comprises four perspectives on abusiness model: Customers, Offer, Infrastructure, andFinancial Viability. Each perspective subsumes one ormore business model building blocks; (1) Customer:Customer Segments, Customer Relationships, Chan-nels, (2) Offer: Value Propositions, (3) Infrastructure:Key Activities, Key Resources, Key Partners, and (4)Financial Viability: Cost Structure, Revenue Streams.The BMC is comprised of nine building blocks in to-tal (see Figure 1).
The BMC is based on the Business Model On-tology developed in (Osterwalder, 2004). The keyidea of the BMC is to provide a simple and com-mon visual framework for communicating and de-veloping business models. The BMC reached wideadoption among practitioners such as business devel-opment units, startup companies or seed accelerators.
There is no mandatory sequence according towhich the building blocks of the canvas have to beworked out (Fritscher and Pigneur, 2010). Since thebuilding blocks are interrelated, various elements ofthe business model have to be modified during mul-tiple iterations anyway. However, many practitionersstart with identifying customer segments (Who are we
creating value for?) or the value proposition (Whichvalue are we creating?) and iterate over all remainingblocks.
Irrespective of which starting point was chosen,the business model designers scrape through the re-maining building blocks in a sequence that seems rea-sonable to them. They jump back and forth to refinethe business model until they are satisfied. During theprocess, alternative versions can be sketched out onseparate canvases or on the same canvas using differ-ent colors. The finished BMC represents a businessmodel hypothesis and serves as a basis for subsequentsteps in the business model innovation process such asvalidation or implementation.
In a workshop setting, the BMC can be printed outon a poster or sketched on a whiteboard to provide ashared display. The simple structure and the visualarrangement of the building blocks provide a sharedlanguage and point of reference for group discussions.
A major advantage of the pen-and-paper or white-board approach is that elements (i.e. ideas) can beadded, edited, moved around and, if necessary, re-moved spontaneously. Thus, the current state of thegroup discussion is captured at any time and groupmembers do not forget ideas in the heat of the dis-cussion. The use of color coding, drawings and rear-rangement of elements helps maintain a clear organi-zation of the canvas elements.
2.1 Software Support for BMC
A major drawback of the pen-and-paper as well aswhiteboard approach is that the BMC cannot easilybe shared with interested stakeholders. In addition,the more elements the canvas contains the harder itis to keep track of them since it gets more and moredifficult to maintain clarity.
One way to share a physical BMC is to take a dig-ital picture of it and send the picture to the relevantstakeholder. Another way is to (re)create the canvasusing text-processing/graphics/slide-based presenta-tion software or embedding the picture in an elec-tronic document. In any case, creating a BMC usinggeneric software tends to be rather time-consuming(Fritscher and Pigneur, 2010).
Despite a lack of thorough scientific investiga-tion on the effectiveness of BMC mapping soft-ware (Eppler et al., 2011), various BMC mod-eling tools emerged for computer-aided businessmodel design to facilitate easier sharing while pro-viding specific modeling facilities well adapted forthe BMC. CAD software for business model designbased on the BMC ranges from rather lightweightbrowser-based canvas tools such as BM|DESIGN|ER
Fourth International Symposium on Business Modeling and Software Design
30
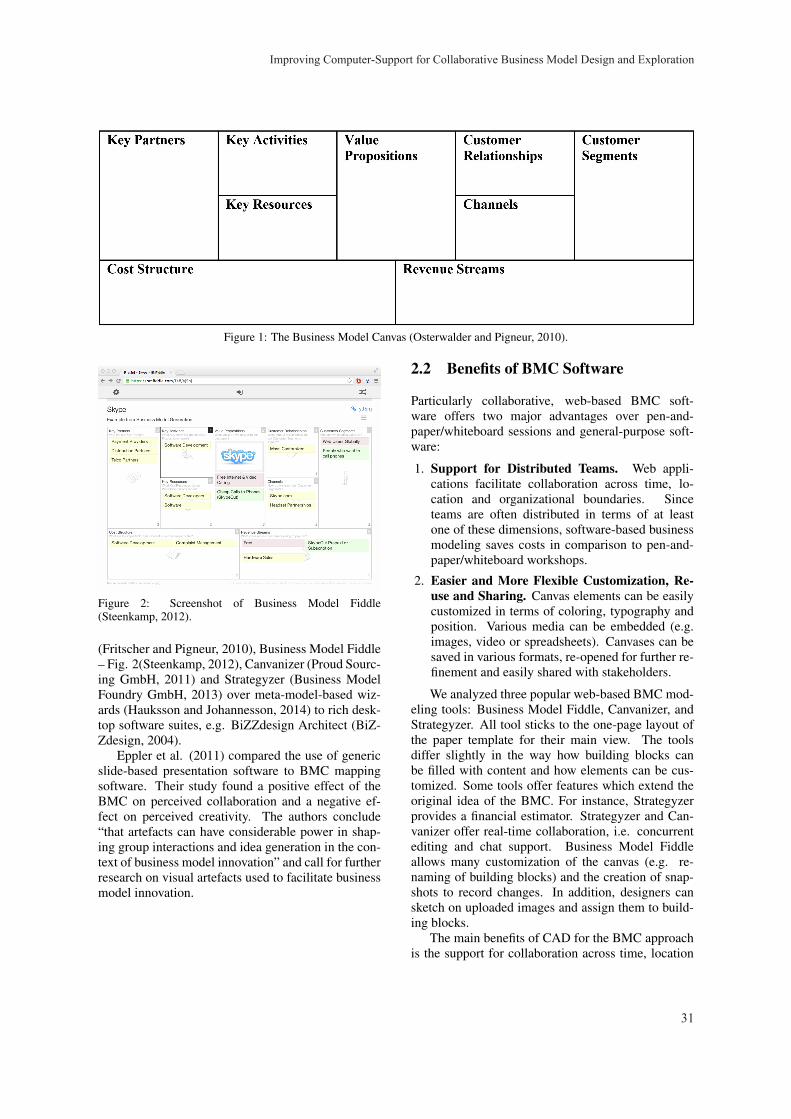
Figure 1: The Business Model Canvas (Osterwalder and Pigneur, 2010).
Figure 2: Screenshot of Business Model Fiddle(Steenkamp, 2012).
(Fritscher and Pigneur, 2010), Business Model Fiddle– Fig. 2(Steenkamp, 2012), Canvanizer (Proud Sourc-ing GmbH, 2011) and Strategyzer (Business ModelFoundry GmbH, 2013) over meta-model-based wiz-ards (Hauksson and Johannesson, 2014) to rich desk-top software suites, e.g. BiZZdesign Architect (BiZ-Zdesign, 2004).
Eppler et al. (2011) compared the use of genericslide-based presentation software to BMC mappingsoftware. Their study found a positive effect of theBMC on perceived collaboration and a negative ef-fect on perceived creativity. The authors conclude“that artefacts can have considerable power in shap-ing group interactions and idea generation in the con-text of business model innovation” and call for furtherresearch on visual artefacts used to facilitate businessmodel innovation.
2.2 Benefits of BMC Software
Particularly collaborative, web-based BMC soft-ware offers two major advantages over pen-and-paper/whiteboard sessions and general-purpose soft-ware:
1. Support for Distributed Teams. Web appli-cations facilitate collaboration across time, lo-cation and organizational boundaries. Sinceteams are often distributed in terms of at leastone of these dimensions, software-based businessmodeling saves costs in comparison to pen-and-paper/whiteboard workshops.
2. Easier and More Flexible Customization, Re-use and Sharing. Canvas elements can be easilycustomized in terms of coloring, typography andposition. Various media can be embedded (e.g.images, video or spreadsheets). Canvases can besaved in various formats, re-opened for further re-finement and easily shared with stakeholders.
We analyzed three popular web-based BMC mod-eling tools: Business Model Fiddle, Canvanizer, andStrategyzer. All tool sticks to the one-page layout ofthe paper template for their main view. The toolsdiffer slightly in the way how building blocks canbe filled with content and how elements can be cus-tomized. Some tools offer features which extend theoriginal idea of the BMC. For instance, Strategyzerprovides a financial estimator. Strategyzer and Can-vanizer offer real-time collaboration, i.e. concurrentediting and chat support. Business Model Fiddleallows many customization of the canvas (e.g. re-naming of building blocks) and the creation of snap-shots to record changes. In addition, designers cansketch on uploaded images and assign them to build-ing blocks.
The main benefits of CAD for the BMC approachis the support for collaboration across time, location
Improving Computer-Support for Collaborative Business Model Design and Exploration
31
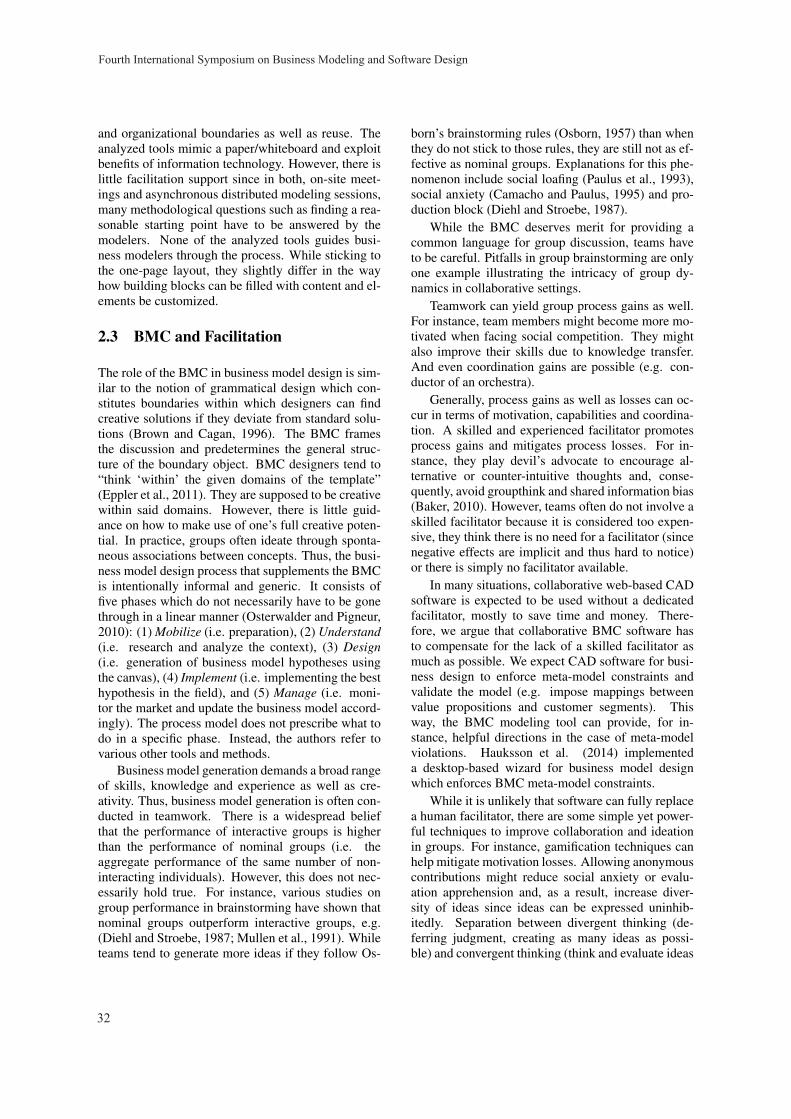
and organizational boundaries as well as reuse. Theanalyzed tools mimic a paper/whiteboard and exploitbenefits of information technology. However, there islittle facilitation support since in both, on-site meet-ings and asynchronous distributed modeling sessions,many methodological questions such as finding a rea-sonable starting point have to be answered by themodelers. None of the analyzed tools guides busi-ness modelers through the process. While sticking tothe one-page layout, they slightly differ in the wayhow building blocks can be filled with content and el-ements be customized.
2.3 BMC and Facilitation
The role of the BMC in business model design is sim-ilar to the notion of grammatical design which con-stitutes boundaries within which designers can findcreative solutions if they deviate from standard solu-tions (Brown and Cagan, 1996). The BMC framesthe discussion and predetermines the general struc-ture of the boundary object. BMC designers tend to“think ‘within’ the given domains of the template”(Eppler et al., 2011). They are supposed to be creativewithin said domains. However, there is little guid-ance on how to make use of one’s full creative poten-tial. In practice, groups often ideate through sponta-neous associations between concepts. Thus, the busi-ness model design process that supplements the BMCis intentionally informal and generic. It consists offive phases which do not necessarily have to be gonethrough in a linear manner (Osterwalder and Pigneur,2010): (1) Mobilize (i.e. preparation), (2) Understand(i.e. research and analyze the context), (3) Design(i.e. generation of business model hypotheses usingthe canvas), (4) Implement (i.e. implementing the besthypothesis in the field), and (5) Manage (i.e. moni-tor the market and update the business model accord-ingly). The process model does not prescribe what todo in a specific phase. Instead, the authors refer tovarious other tools and methods.
Business model generation demands a broad rangeof skills, knowledge and experience as well as cre-ativity. Thus, business model generation is often con-ducted in teamwork. There is a widespread beliefthat the performance of interactive groups is higherthan the performance of nominal groups (i.e. theaggregate performance of the same number of non-interacting individuals). However, this does not nec-essarily hold true. For instance, various studies ongroup performance in brainstorming have shown thatnominal groups outperform interactive groups, e.g.(Diehl and Stroebe, 1987; Mullen et al., 1991). Whileteams tend to generate more ideas if they follow Os-
born’s brainstorming rules (Osborn, 1957) than whenthey do not stick to those rules, they are still not as ef-fective as nominal groups. Explanations for this phe-nomenon include social loafing (Paulus et al., 1993),social anxiety (Camacho and Paulus, 1995) and pro-duction block (Diehl and Stroebe, 1987).
While the BMC deserves merit for providing acommon language for group discussion, teams haveto be careful. Pitfalls in group brainstorming are onlyone example illustrating the intricacy of group dy-namics in collaborative settings.
Teamwork can yield group process gains as well.For instance, team members might become more mo-tivated when facing social competition. They mightalso improve their skills due to knowledge transfer.And even coordination gains are possible (e.g. con-ductor of an orchestra).
Generally, process gains as well as losses can oc-cur in terms of motivation, capabilities and coordina-tion. A skilled and experienced facilitator promotesprocess gains and mitigates process losses. For in-stance, they play devil’s advocate to encourage al-ternative or counter-intuitive thoughts and, conse-quently, avoid groupthink and shared information bias(Baker, 2010). However, teams often do not involve askilled facilitator because it is considered too expen-sive, they think there is no need for a facilitator (sincenegative effects are implicit and thus hard to notice)or there is simply no facilitator available.
In many situations, collaborative web-based CADsoftware is expected to be used without a dedicatedfacilitator, mostly to save time and money. There-fore, we argue that collaborative BMC software hasto compensate for the lack of a skilled facilitator asmuch as possible. We expect CAD software for busi-ness design to enforce meta-model constraints andvalidate the model (e.g. impose mappings betweenvalue propositions and customer segments). Thisway, the BMC modeling tool can provide, for in-stance, helpful directions in the case of meta-modelviolations. Hauksson et al. (2014) implementeda desktop-based wizard for business model designwhich enforces BMC meta-model constraints.
While it is unlikely that software can fully replacea human facilitator, there are some simple yet power-ful techniques to improve collaboration and ideationin groups. For instance, gamification techniques canhelp mitigate motivation losses. Allowing anonymouscontributions might reduce social anxiety or evalu-ation apprehension and, as a result, increase diver-sity of ideas since ideas can be expressed uninhib-itedly. Separation between divergent thinking (de-ferring judgment, creating as many ideas as possi-ble) and convergent thinking (think and evaluate ideas
Fourth International Symposium on Business Modeling and Software Design
32
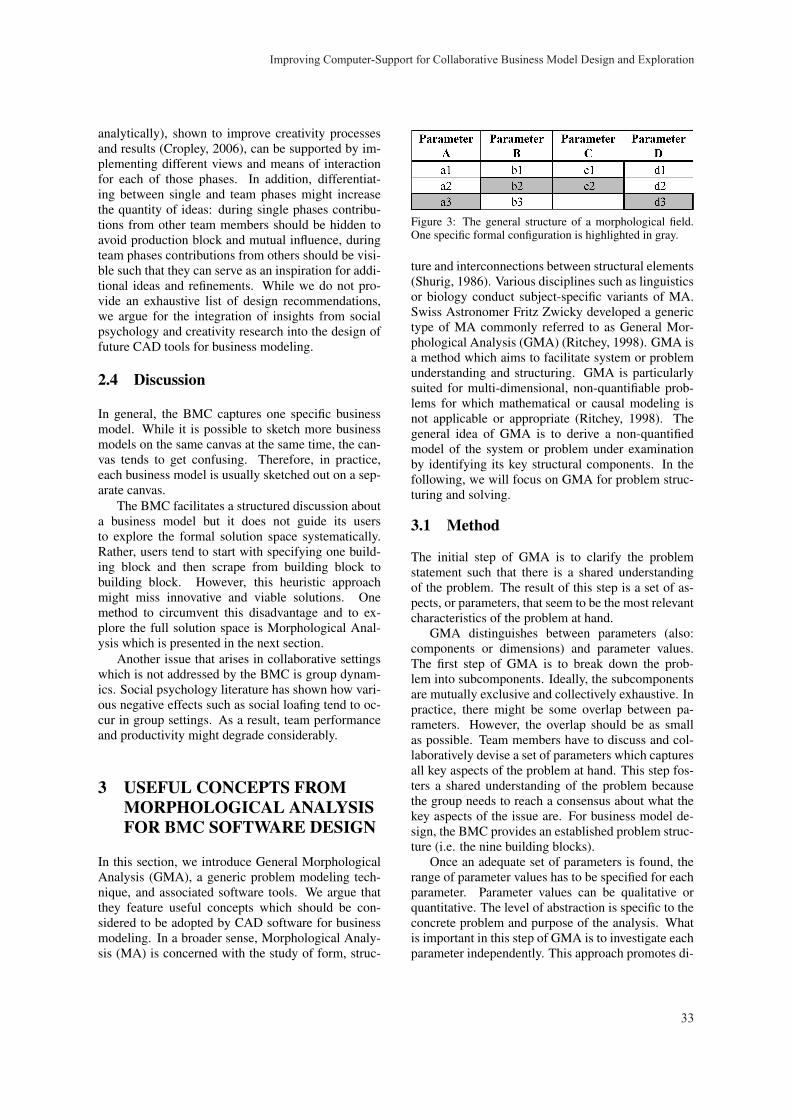
analytically), shown to improve creativity processesand results (Cropley, 2006), can be supported by im-plementing different views and means of interactionfor each of those phases. In addition, differentiat-ing between single and team phases might increasethe quantity of ideas: during single phases contribu-tions from other team members should be hidden toavoid production block and mutual influence, duringteam phases contributions from others should be visi-ble such that they can serve as an inspiration for addi-tional ideas and refinements. While we do not pro-vide an exhaustive list of design recommendations,we argue for the integration of insights from socialpsychology and creativity research into the design offuture CAD tools for business modeling.
2.4 Discussion
In general, the BMC captures one specific businessmodel. While it is possible to sketch more businessmodels on the same canvas at the same time, the can-vas tends to get confusing. Therefore, in practice,each business model is usually sketched out on a sep-arate canvas.
The BMC facilitates a structured discussion abouta business model but it does not guide its usersto explore the formal solution space systematically.Rather, users tend to start with specifying one build-ing block and then scrape from building block tobuilding block. However, this heuristic approachmight miss innovative and viable solutions. Onemethod to circumvent this disadvantage and to ex-plore the full solution space is Morphological Anal-ysis which is presented in the next section.
Another issue that arises in collaborative settingswhich is not addressed by the BMC is group dynam-ics. Social psychology literature has shown how vari-ous negative effects such as social loafing tend to oc-cur in group settings. As a result, team performanceand productivity might degrade considerably.
3 USEFUL CONCEPTS FROMMORPHOLOGICAL ANALYSISFOR BMC SOFTWARE DESIGN
In this section, we introduce General MorphologicalAnalysis (GMA), a generic problem modeling tech-nique, and associated software tools. We argue thatthey feature useful concepts which should be con-sidered to be adopted by CAD software for businessmodeling. In a broader sense, Morphological Analy-sis (MA) is concerned with the study of form, struc-
Figure 3: The general structure of a morphological field.One specific formal configuration is highlighted in gray.
ture and interconnections between structural elements(Shurig, 1986). Various disciplines such as linguisticsor biology conduct subject-specific variants of MA.Swiss Astronomer Fritz Zwicky developed a generictype of MA commonly referred to as General Mor-phological Analysis (GMA) (Ritchey, 1998). GMA isa method which aims to facilitate system or problemunderstanding and structuring. GMA is particularlysuited for multi-dimensional, non-quantifiable prob-lems for which mathematical or causal modeling isnot applicable or appropriate (Ritchey, 1998). Thegeneral idea of GMA is to derive a non-quantifiedmodel of the system or problem under examinationby identifying its key structural components. In thefollowing, we will focus on GMA for problem struc-turing and solving.
3.1 Method
The initial step of GMA is to clarify the problemstatement such that there is a shared understandingof the problem. The result of this step is a set of as-pects, or parameters, that seem to be the most relevantcharacteristics of the problem at hand.
GMA distinguishes between parameters (also:components or dimensions) and parameter values.The first step of GMA is to break down the prob-lem into subcomponents. Ideally, the subcomponentsare mutually exclusive and collectively exhaustive. Inpractice, there might be some overlap between pa-rameters. However, the overlap should be as smallas possible. Team members have to discuss and col-laboratively devise a set of parameters which capturesall key aspects of the problem at hand. This step fos-ters a shared understanding of the problem becausethe group needs to reach a consensus about what thekey aspects of the issue are. For business model de-sign, the BMC provides an established problem struc-ture (i.e. the nine building blocks).
Once an adequate set of parameters is found, therange of parameter values has to be specified for eachparameter. Parameter values can be qualitative orquantitative. The level of abstraction is specific to theconcrete problem and purpose of the analysis. Whatis important in this step of GMA is to investigate eachparameter independently. This approach promotes di-
Improving Computer-Support for Collaborative Business Model Design and Exploration
33
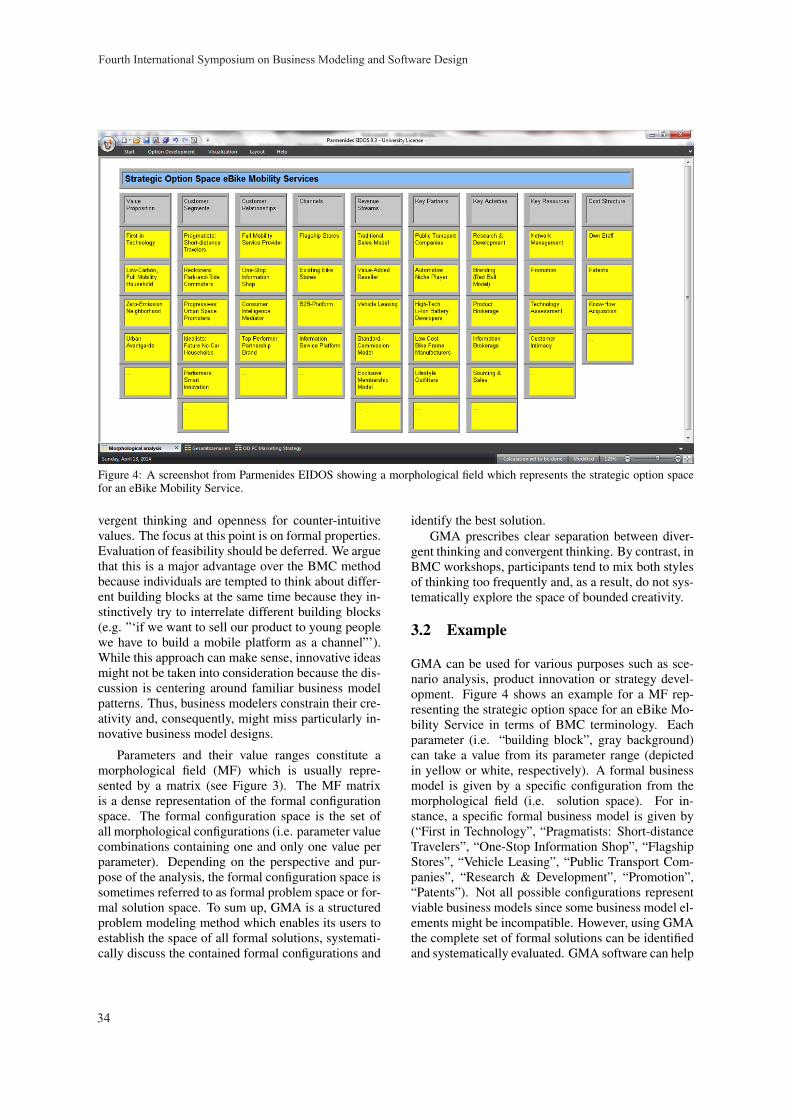
Figure 4: A screenshot from Parmenides EIDOS showing a morphological field which represents the strategic option spacefor an eBike Mobility Service.
vergent thinking and openness for counter-intuitivevalues. The focus at this point is on formal properties.Evaluation of feasibility should be deferred. We arguethat this is a major advantage over the BMC methodbecause individuals are tempted to think about differ-ent building blocks at the same time because they in-stinctively try to interrelate different building blocks(e.g. ”‘if we want to sell our product to young peoplewe have to build a mobile platform as a channel”’).While this approach can make sense, innovative ideasmight not be taken into consideration because the dis-cussion is centering around familiar business modelpatterns. Thus, business modelers constrain their cre-ativity and, consequently, might miss particularly in-novative business model designs.
Parameters and their value ranges constitute amorphological field (MF) which is usually repre-sented by a matrix (see Figure 3). The MF matrixis a dense representation of the formal configurationspace. The formal configuration space is the set ofall morphological configurations (i.e. parameter valuecombinations containing one and only one value perparameter). Depending on the perspective and pur-pose of the analysis, the formal configuration space issometimes referred to as formal problem space or for-mal solution space. To sum up, GMA is a structuredproblem modeling method which enables its users toestablish the space of all formal solutions, systemati-cally discuss the contained formal configurations and
identify the best solution.GMA prescribes clear separation between diver-
gent thinking and convergent thinking. By contrast, inBMC workshops, participants tend to mix both stylesof thinking too frequently and, as a result, do not sys-tematically explore the space of bounded creativity.
3.2 Example
GMA can be used for various purposes such as sce-nario analysis, product innovation or strategy devel-opment. Figure 4 shows an example for a MF rep-resenting the strategic option space for an eBike Mo-bility Service in terms of BMC terminology. Eachparameter (i.e. “building block”, gray background)can take a value from its parameter range (depictedin yellow or white, respectively). A formal businessmodel is given by a specific configuration from themorphological field (i.e. solution space). For in-stance, a specific formal business model is given by(“First in Technology”, “Pragmatists: Short-distanceTravelers”, “One-Stop Information Shop”, “FlagshipStores”, “Vehicle Leasing”, “Public Transport Com-panies”, “Research & Development”, “Promotion”,“Patents”). Not all possible configurations representviable business models since some business model el-ements might be incompatible. However, using GMAthe complete set of formal solutions can be identifiedand systematically evaluated. GMA software can help
Fourth International Symposium on Business Modeling and Software Design
34
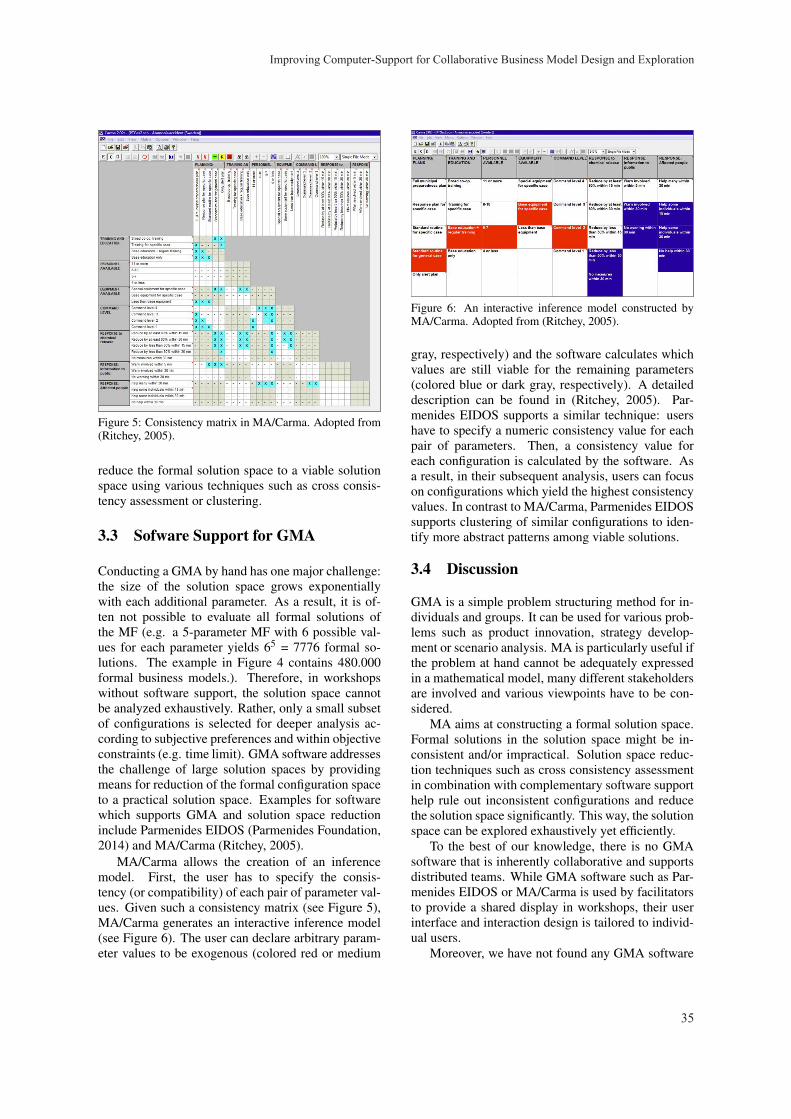
Figure 5: Consistency matrix in MA/Carma. Adopted from(Ritchey, 2005).
reduce the formal solution space to a viable solutionspace using various techniques such as cross consis-tency assessment or clustering.
3.3 Sofware Support for GMA
Conducting a GMA by hand has one major challenge:the size of the solution space grows exponentiallywith each additional parameter. As a result, it is of-ten not possible to evaluate all formal solutions ofthe MF (e.g. a 5-parameter MF with 6 possible val-ues for each parameter yields 65 = 7776 formal so-lutions. The example in Figure 4 contains 480.000formal business models.). Therefore, in workshopswithout software support, the solution space cannotbe analyzed exhaustively. Rather, only a small subsetof configurations is selected for deeper analysis ac-cording to subjective preferences and within objectiveconstraints (e.g. time limit). GMA software addressesthe challenge of large solution spaces by providingmeans for reduction of the formal configuration spaceto a practical solution space. Examples for softwarewhich supports GMA and solution space reductioninclude Parmenides EIDOS (Parmenides Foundation,2014) and MA/Carma (Ritchey, 2005).
MA/Carma allows the creation of an inferencemodel. First, the user has to specify the consis-tency (or compatibility) of each pair of parameter val-ues. Given such a consistency matrix (see Figure 5),MA/Carma generates an interactive inference model(see Figure 6). The user can declare arbitrary param-eter values to be exogenous (colored red or medium
Figure 6: An interactive inference model constructed byMA/Carma. Adopted from (Ritchey, 2005).
gray, respectively) and the software calculates whichvalues are still viable for the remaining parameters(colored blue or dark gray, respectively). A detaileddescription can be found in (Ritchey, 2005). Par-menides EIDOS supports a similar technique: usershave to specify a numeric consistency value for eachpair of parameters. Then, a consistency value foreach configuration is calculated by the software. Asa result, in their subsequent analysis, users can focuson configurations which yield the highest consistencyvalues. In contrast to MA/Carma, Parmenides EIDOSsupports clustering of similar configurations to iden-tify more abstract patterns among viable solutions.
3.4 Discussion
GMA is a simple problem structuring method for in-dividuals and groups. It can be used for various prob-lems such as product innovation, strategy develop-ment or scenario analysis. MA is particularly useful ifthe problem at hand cannot be adequately expressedin a mathematical model, many different stakeholdersare involved and various viewpoints have to be con-sidered.
MA aims at constructing a formal solution space.Formal solutions in the solution space might be in-consistent and/or impractical. Solution space reduc-tion techniques such as cross consistency assessmentin combination with complementary software supporthelp rule out inconsistent configurations and reducethe solution space significantly. This way, the solutionspace can be explored exhaustively yet efficiently.
To the best of our knowledge, there is no GMAsoftware that is inherently collaborative and supportsdistributed teams. While GMA software such as Par-menides EIDOS or MA/Carma is used by facilitatorsto provide a shared display in workshops, their userinterface and interaction design is tailored to individ-ual users.
Moreover, we have not found any GMA software
Improving Computer-Support for Collaborative Business Model Design and Exploration
35
that accounts for psychological aspects and group dy-namics. However, we argue that BMC software de-sign can borrow from GMA and respective software.They key advantage of the software-based GMA ap-proach to modeling of complex problems such asbusiness model innovation is the systematic construc-tion of the formal solution space and leveraging soft-ware to find viable solutions within the practical solu-tion space.
A key feature of MA/Carma is the constructionof an inference model of the solution space. Design-ers can interact with the model and analyze the de-pendencies of strategic decisions by treating specificparameter values as fixed input. Given a consistencymatrix, the software automatically calculates whichoptions remain to be viable for all other parameters.We argue that such an inference model provides moreinsights into the business modeling space than the de-piction of the BMC. The BMC is a descriptive modelthat only represents one particular business model (ormultiple descriptive models if colors are used.).
4 KEY REQUIREMENTS FORFUTURE BMC SOFTWARE
In the previous sections, we identified three key re-quirements for future CAD software for businessmodel design: (1) the ability to perform an interactive“what-if” analysis (inference capability), (2) method-ical guidance throughout the design process (facilita-tion capability) to mitigate negative effects of groupdynamics, and (3) the ability to collaborate acrosstime, location and organizational boundaries (supportof distributed teams).
The inference capability enables designers to ex-periment with business models by declaring partic-ular business model elements as exogenous and an-alyzing the implications for the remaining buildingblocks. The facilitation capability offers guidanceduring the design process in order to increase cre-ativity of the designers while limiting negative effectsstemming from group dynamics. In addition, bor-rowing techniques from GMA software, future BMCsoftware might provide a concrete process model forsystematic generation of business models within theconceptual boundaries of the BMC while still allow-ing and promoting creativity (i.e. parameter (value)definition, cross consistency assessment and config-uration space reduction). The support of distributedteams refers to the ability to carry out the businessmodel design process cost-efficiently in a distributedsetting.
Collaborative, web-based CAD software support-
ing the BMC is readily available. Thus, there is BMCsupport for distributed teams. However, those toolslack inference and facilitation capabilities.
Therefore, we propose to extend BMC softwareby borrowing concepts from GMA and respectivesoftware. Neither BMC methodology nor GMA ad-dress potential group process losses such as motiva-tion loss (e.g. social loafing) or skill impairment (e.g.social anxiety). Thus, groups might not exploit theirfull cognitive and creative potential.
We argue that methods as well as tools for col-laborative business model generation have to addressnegative effects of teamwork and try to mitigate them.Skilled human facilitators might accomplish this task.However, assessing the skill of a human facilitator ishard. In addition, in some contexts there is no possi-bility to hire an experienced facilitator or it might beconsidered too expensive.
The absence of a facilitator can be compensated inBMC software by implementing various facilitationand creativity techniques. For instance, creativity canbe increased by clearly separating between divergentand convergent thinking phases. Alternating betweenindividual and team ideation helps decreasing nega-tive impact of anchoring and groupthink. Anonymitycan help reduce social anxiety. On the other hand,anonymity might increase social loafing since contri-butions cannot be attributed to individuals and, thus,individuals might ”‘hide”’ behind the team. Facilita-tion capabilities have to be well-conceived and evalu-ated.
5 CONCLUSION AND FUTUREWORK
We identified benefits and shortcomings of state-of-the art CAD software for the BMC methodology.We agree with Osterwalder, Fritscher et al. thatCAD software for business model design is likelyto improve strategic planning, particularly for dis-tributed business model design teams which face in-creasing competition (Osterwalder and Pigneur, 2013;Fritscher and Pigneur, 2014). The BMC deservesmerit for providing a common (visual) language forbusiness model design. However, we think that CADsupport for business model design is still only in its in-fancy and that various questions need to be answeredabout how to design effective next-generation CADsoftware for collaborative business model design. Weexpect future BMC software to leverage the potentialof software support and provide additional value thatgoes beyond mere digitization of the BMC approach.
Our next step is to refine the general requirements
Fourth International Symposium on Business Modeling and Software Design
36

identified in this paper. Then, we will build a pro-totype which implements the ideas discussed above(e.g. inference and facilitation capabilities) and vali-date our hypotheses.
REFERENCES
Baddeley, A. (1998). Recent developments in workingmemory. Current opinion in neurobiology, 8(2):234–238.
Baker, D. F. (2010). Enhancing group decision making: Anexercise to reduce shared information bias. Journal ofManagement Education, 34(2):249–279.
BiZZdesign (2004). BiZZdesign Architect. http://www.bizzdesign.com. [Online; accessed April 15,2014].
Brown, K. N. and Cagan, J. (1996). Grammatical designand bounded creativity. Carnegie Mellon University,Department of Mechanical Engineering.
Business Model Foundry GmbH (2013). Strategyzer.http://www.strategyzer.com. [Online; accessed April15, 2014].
Buxton, B. (2007). The Anatomy of Sketching. MorganKaufmann, San Francisco and CA and USA.
Camacho, L. M. and Paulus, P. B. (1995). The role of so-cial anxiousness in group brainstorming. Journal ofPersonality and Social Psychology, (68):1071–1080.
Carlile, P. R. (2002). A pragmatic view of knowledge andboundaries: Boundary objects in new product devel-opment. Organization Science, 13(4):442–455.
Chesbrough, H. (2010). Business model innovation: Op-portunities and barriers. Long Range Planning, 43(2-3):354–363.
Cropley, A. (2006). In praise of convergent thinking. Cre-ativity Research Journal, 18(3):391–404.
Diehl, M. and Stroebe, W. (1987). Productivity loss inbrainstorming groups: Toward the solution of a rid-dle. Journal of Personality and Social Psychology,53(3):497–509.
Eppler, M. J., Hoffmann, F., and Bresciani, S. (2011). Newbusiness models through collaborative idea genera-tion. International Journal of Innovation Manage-ment, 15(6):1323–1341.
Fritscher, B. and Pigneur, Y. (2010). Supporting businessmodel modelling: A compromise between creativityand constraints. In Task Models and Diagrams forUser Interface Design, 8th International Workshop,Revised Selected Papers, pages 28–43, Brussels andBelgium.
Fritscher, B. and Pigneur, Y. (2014). Computer aided busi-ness model design: Analysis of key features adoptedby users. In 47th Hawaii International Conference onSystem Science, pages 3929–3938, Waikoloa and HIand USA.
Hauksson, H. and Johannesson, P. (2014). Metamodelingfor business model design. facilitating developmentand communication of business model canvas (bmc)models with an omg standards-based metamodel. In
The 8th International Workshop on Value Modelingand Business Ontology (VMBO 2014), Berlin andGermany.
Mitchell, D. W. and Coles, C. B. (2003). The ultimate com-petitive advantage of continuing business model inno-vation. Journal of Business Strategy, 24(5):15–21.
Mitchell, D. W. and Coles, C. B. (2004). Establishing a con-tinuing business model innovation process. Journal ofBusiness Strategy, 25(3):39–49.
Mullen, B., Johnson, C., and Salas, E. (1991). Productivityloss in brainstorming groups: A meta-analytic integra-tion. Basic and Applied Social Psychology, (12):3–23.
Osborn, A. F. (1957). Applied imagination: Principlesand Procedures of Creative Problem Solving. CharlesScribner’s Sons, New York and NY and USA.
Osterwalder, A. (2004). The business model ontology:A proposition in a design science approach, volumeHEC 173. Institut d’Informatique et Organisation,Lausanne and Switzerland.
Osterwalder, A. and Pigneur, Y. (2010). Business ModelGeneration: a handbook for visionaries, game chang-ers, and challengers. Jon Wiley & Sons.
Osterwalder, A. and Pigneur, Y. (2013). Designing businessmodels and similar strategic objects: The contributionof is. Journal of the Association for Information Sys-tems, 14(5):237–244.
Parmenides Foundation (2014). Parmenides EIDOS.https://www.parmenides-foundation.org/application/.[Online; accessed April 15, 2014].
Paulus, P. B., Dzindolet, M. T., Poletes, G., and Cama-cho, L. M. (1993). Perception of performance ingroup brainstorming: The illusion of group produc-tivity. Personality and Social Psychology Bulletin,(19):78–89.
Proud Sourcing GmbH (2011). Canvanizer.http://www.canvanizer.com. [Online; accessedApril 15, 2014].
Ritchey, T. (1998). Fritz Zwicky, Morphology and PolicyAnalysis. In 16th Euro Conference on OperationalAnalysis, Brussels.
Ritchey, T. (2005). MA/Carma: Advanced Com-puter Support for General Morphological Analysis.http://www.swemorph.com/macarma.html. [Online;accessed April 15, 2014].
Shurig, R. (1986). Morphology: A knowledge tool. SystemsResearch, 3:9–19.
Steenkamp, J. (2012). Business Model Fiddle.http://www.bmfiddle.com. [Online; accessedApril 15, 2014].
Walny, J., Carpendale, S., Henry Riche, N., Venolia, G.,and Fawcett, P. (2012). Visual thinking in action:Visualizations as used on whiteboards. IEEE Trans-actions on Visualizations and Computer Graphics,18(12):2779–2788.
Improving Computer-Support for Collaborative Business Model Design and Exploration
37
Agile Enterprise Architecture Management An Analysis on the Application of Agile Principles
Matheus Hauder1, Sascha Roth1, Christopher Schulz2 and Florian Matthes1 1Software Engineering for Business Information Systems (SEBIS), Technical University Munich,
Boltzmannstraße 3, 85748 Garching, Germay 2Syracom, Parkring 4, 85748 Garching, Germany
{matheus.hauder, roth, matthes}@tum.de, [email protected]
Keywords: Enterprise Architecture Management, Survey, Agile, Enterprise Architecture Framework.
Abstract: Enterprise Architecture (EA) management has proven to be an efficient instrument to align business and IT from a holistic perspective. Many organizations have established a permanent EA management function responsible for modeling, analyzing, and defining the current and future EA state as well as the roadmap. Similar as in software development, EA management initiatives face challenges that delay results, complicate the collaboration, and deteriorate the overall work quality. While in software development, agile principles and values reflected in tangible methods like Scrum and Extreme Programming are increasingly adopted by organizations, there is little known whether these practices have already made their way into EA management. Based on three research questions, this paper sheds light on the status-quo of agile principles applied to EA management. We present results of an online survey among 105 industry experts working for more than 10 industry sectors across 22 different countries.
1 INTRODUCTION
Globalization, frequently altering market conditions, and the pressing need to reduce operating costs force organizations to carry out complex business transformations at a regular interval. However, performed without a holistic and explicit picture of the organization, these transformations are likely to fail (Ross et al., 2006). An Enterprise Architecture (EA) serves as a common means to look at an entire organization as a whole. It captures both, business aspects (e.g., business processes, business objects) and IT aspects (e.g., interfaces, networks, devices) as well as their interrelations (Buschle et al., 2012).
Being applied by an increasing number of enterprises, the corresponding discipline EA management fosters the mutual alignment of business and IT (Weill and Ross, 2009).
EA management deals with capturing, modeling, analyzing, and defining the current, planned, and future architecture in conjunction with the roadmap leading from the as-is to the target state (The Open Group, 2011). However, EA management faces various challenges ranging for instance from the late return on investment to the delayed valuation of the disciplines by concerned stakeholders (cf. e.g.
(Hauder et al., 2013), (Lucke et al., 2010) and (Lucke et al., 2012).
When looking on the domain of software development, researchers likewise to practitioners propose the adherence to so-called agile values helping to address these types of challenges (Schwaber, 2004). Key to these values are agile principles like the avoidance of waste (Gloger, 2010), an early stakeholder involvement (Beck et al., 2001), and gathering feedback at an ongoing basis (Highsmith and Cockburn, 2001).
In many cases these principles are based on lean production practices initially applied by the Japanese car manufacturer Toyota (Deming, 2000), (Holweg, 2007). As of today, the benefits of agile principles to software development are still discussed controversially (Reifer et al., 2003).
Several similarities between software development - centering rather on single systems - and EA management - focusing on the holistic management of systems of systems - can be drawn. Both disciplines have to handle frequently changing requirements while ensuring a close collaboration among the multi-disciplinary stakeholders. Focusing on the latter, researchers have already proposed to apply agile practices known from the development
38
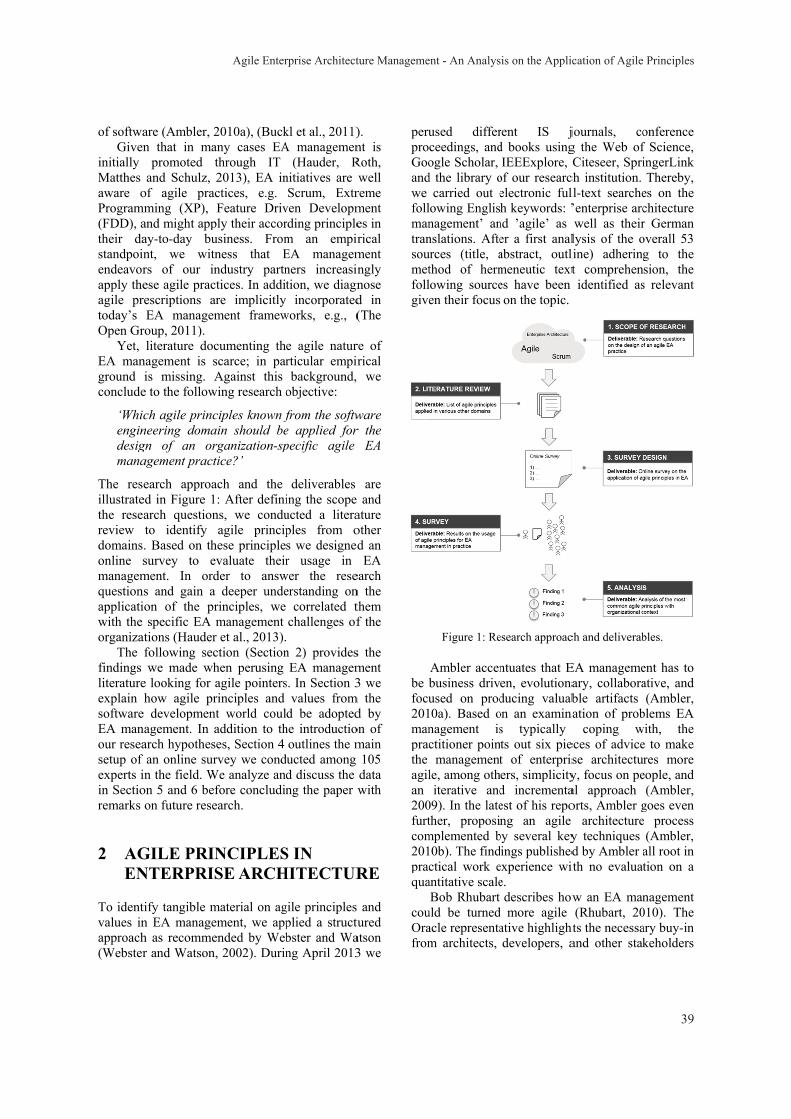
of softwaGiven
initially Matthes aware oProgram(FDD), atheir dastandpoiendeavorapply theagile prtoday’s Open Gr
Yet, EA manground conclude
‘Whiengindesigmana
The resillustratethe resereview domainsonline smanagemquestionapplicatiwith the organiza
The findings literatureexplain softwareEA manour reseasetup of experts iin Sectioremarks
2 AGEN
To identvalues inapproach(Webster
are (Ambler, 2n that in ma
promoted and Schulz,
of agile pramming (XP),
and might appay-to-day bunt, we witrs of our inese agile pracrescriptions a
EA managemroup, 2011). literature doc
nagement is sis missing. A
e to the follow
ch agile princneering domagn of an oragement pract
earch approaed in Figure 1arch questionto identify . Based on thsurvey to ement. In ordns and gain aion of the pr
specific EA ations (Hauderfollowing secwe made wh
e looking for how agile pr
e developmennagement. In aarch hypothes
f an online surin the field. Won 5 and 6 beon future rese
GILE PRINTERPRI
tify tangible mn EA manageh as recommer and Watson
2010a), (Buckany cases EAthrough IT 2013), EA inctices, e.g. Feature Driv
ply their accorusiness. Fromtness that Endustry partn
ctices. In addiare implicitlyment framew
cumenting thscarce; in parAgainst this
wing research o
ciples known fain should berganization-sptice?’
ach and the 1: After definins, we conduagile princip
hese principleevaluate theirder to answ
a deeper underinciples, wemanagement
r et al., 2013).ction (Sectionhen perusing agile pointersrinciples and
nt world couladdition to thses, Section 4 rvey we cond
We analyze anfore concludinearch.
NCIPLESSE ARCH
material on agement, we appended by Webn, 2002). Durin
kl et al., 2011)A managemen
(Hauder, Rnitiatives are Scrum, Extr
ven Developmrding principlem an empirEA managemners increasintion, we diagn
incorporatedworks, e.g., (
e agile naturrticular empirbackground,
objective:
from the softwe applied forpecific agile
deliverables ing the scope ucted a literaples from os we designedr usage in
wer the reseerstanding on
correlated tchallenges of
n 2) providesEA managem
s. In Section 3values from
d be adoptedhe introductiooutlines the m
ducted among d discuss the ng the paper w
S IN HITECTUR
gile principles plied a structubster and Wang April 2013
). nt is Roth, well
reme ment es in rical ment ngly nose d in (The
re of rical
we
ware r the
EA
are and ature other d an EA
earch n the them f the
s the ment 3 we
m the d by on of main 105 data with
RE
and ured
atson 3 we
peruproGooandwe follmantransoumetfollgive
be bfocu201manpracthe agilan 200furtcom201pracqua
couOrafrom
used differceedings, andogle Scholar,
d the library ocarried out e
lowing Englisnagement’ annslations. Afteurces (title, athod of hermlowing sourceen their focus
Figure 1: Re
Ambler accenbusiness drivused on prod
10a). Based onagement isctitioner poin
managementle, among othiterative and
09). In the latether, proposinmplemented b10b). The findctical work e
antitative scaleBob Rhubart
uld be turnedacle representam architects,
rent IS jd books usingIEEExplore, C
of our researcelectronic fulh keywords: ’
nd ’agile’ as er a first analabstract, outlmeneutic textes have been on the topic.
esearch approac
ntuates that Een, evolutionaducing valuab
on an examinas typically ts out six piet of enterprisers, simplicityd incrementaest of his repong an agile
by several keyings published
experience wite. describes howmore agile
ative highlightdevelopers, a
journals, cog the Web ofCiteseer, Spri
ch institution. ll-text searche’enterprise arcwell as theirlysis of the oline) adheringt comprehenidentified as
ch and deliverab
EA managemeary, collaborable artifacts
nation of probcoping w
eces of advicese architectuy, focus on peal approach orts, Ambler g architecturey techniques d by Ambler aith no evaluat
w an EA man(Rhubart, 20
hts the necessaand other stak
onference f Science, ingerLink Thereby,
es on the chitecture r German overall 53 g to the sion, the s relevant
bles.
ent has to ative, and (Ambler,
blems EA with, the e to make res more
eople, and (Ambler,
goes even e process
(Ambler, all root in tion on a
nagement 010). The ary buy-in keholders
Agile Enterprise Architecture Management - An Analysis on the Application of Agile Principles
39
at all levels of the organization. Next to the importance of conversation in particular with the developing teams, the manager considers the involvement of enterprise architects at the project level as very crucial. Again, all suggestions are based on in-the-field work based on a single company (employee) perspective.
Friedrichsen and Schrewe see typical EA management problems (e.g. losing sight of fundamentals, becoming a slave of the EA management framework) as a reason to introduce agile values (Friedrichsen and Schrewe, 2010). The consultants advise to launch an EA management initiative with clear goals and a limited scope while always keeping potential risks in mind. In their eyes, frameworks and tools have to be considered as toolboxes that ensure to reach the stated goals more efficiently.
While Eric Landes recommends applying concrete techniques like retrospectives and lessons learned action items, iterative cycles, as well as automated acceptance criteria in the emergent design of an architecture (Landes, 2012), Scott Nelson assumes two distinct viewpoints when discussing the similarities and differences of managing enterprises architectures vs. developing software in an agile manner (Nelson, 2012).
As another industry expert and active blogger, Gabhart advises to avoid big bang EA management projects attempting to “boil the ocean”, thus are too big in scope (Gabhart, 2013). Instead of that, the author proposes to start off small, building up an EA management capability in an incremental and iterative 4-step process. Lastly, the staff member Gattadahalli of the former IT Company EDS shares the knowledge of an agile management of EAs in terms of seven critical success factors (Gattadahalli, 2004).
After having introduced EA management to the reader of their book, Bente, Bombach, and Langade proposes six so-called building blocks helping to render the discipline more agile and lean (Bente et al., 2012). Benefiting from examined sources paired with their professional experience, Bente et al., describe how to streamline the architecture processes, setup an agile EA project, and foster collaboration and participation. Even though their explanations are backed by several fictitious examples, no quantitative results are provided that would prove the adoption of agile practices in EA management.
To respond to the problems often encountered in EA management, Shirazi et al. propose a framework rendering the discipline more agile (Shirazi and
Rouhani, 2009). Named Agile Enterprise Architecture Framework (AEAF), the artifact consists of seven models and eleven interactions both based on agile principles and values. Even if the authors do not indicate any relations, the five viewpoints and six project aspects also included in AEAF resemble the Zachman framework (Zachman, 1987).
Although AEAF touches on several agile aspects like regular feedback or focus on cooperation, the research group’s paper neither proves the empirical relevance of an agile EA management nor it validate the framework work in practice.
Rooted in lean principles, information technology architectures, and systems engineering methods, Comm and Mathaisel propose the Lean Enterprise Architecture (LEA), a three-phase structure to organize the activities for the transformation of the enterprise to agility (Comm and Mathaisel, 2010). The researchers combine their framework with concepts from the Lean Enterprise Transformation Engineering while also incorporating lean principles and practices in the resulting process. However, their work does not detail on these principles or explains how an agile enterprise should evolve its EA.
As one of the most popular approaches, The Open Group Architecture Framework (TOGAF) 9.1 does not explicitly recommend to manage an EA in an agile style (The Open Group, 2011). In turn, a more agile organization is considered as a surplus brought along by a “good” enterprise architecture. Notwithstanding, with concepts like iterations to develop a comprehensive architecture landscape and architecture, to manage changes to the organization’s architecture capability, as well as appropriate stakeholder management the EA framework TOGAF promotes important agile principles.
The striving for agile principles and values enhancing the efficiency of EA management is mainly found in practitioners’ circles. While only a small number of experts emphasize the misfit of both disciplines, e.g. (Nicholette, 2007), the majority of industry authors consider agile means as being well suited for EA management (Banerjee, 2011). As of January 2014, few academic publications and frameworks embrace or even mention to apply an agile management means for EAs. Studied sources are very new, indicating that the mind-set of an agile EA management is still nascent. No contribution was found that investigated on the current status quo of agile practices in industry.
Fourth International Symposium on Business Modeling and Software Design
40
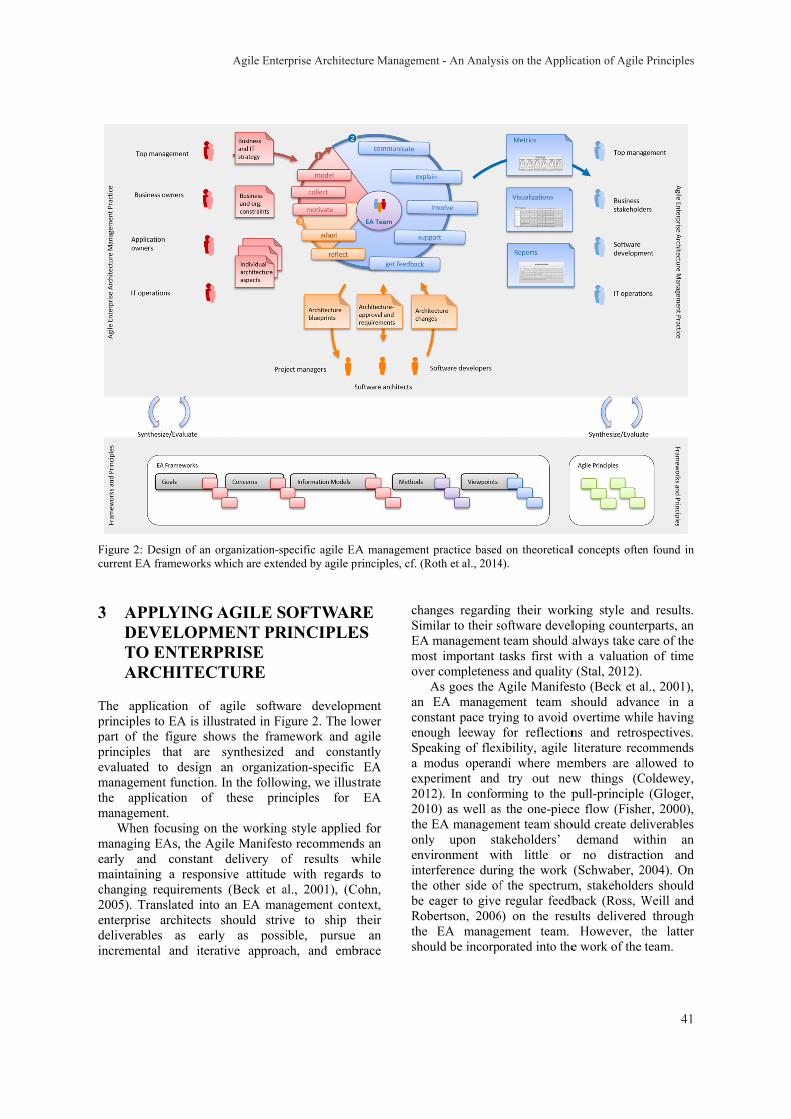
Figure 2: current EA
3 APDETOAR
The appprinciplepart of tprincipleevaluatedmanagemthe appmanagem
Whenmanaginearly anmaintainchanging2005). Tenterprisdeliverabincremen
Design of an A frameworks w
PPLYING EVELOPMO ENTERPRCHITEC
plication of es to EA is illuthe figure shes that are d to design ment functionplication of ment. n focusing on
ng EAs, the And constant
ning a respong requirementTranslated intose architects bles as earntal and iter
organization-spwhich are exten
AGILE SMENT PRPRISE
CTURE
agile softwustrated in Fig
hows the framsynthesized an organiza
. In the followthese prin
n the workinggile Manifest
delivery onsive attitudets (Beck et ao an EA man
should strivrly as possiative approac
pecific agile EAnded by agile pr
OFTWARRINCIPLE
are developmgure 2. The lo
mework and aand consta
ation-specific wing, we illustnciples for
g style appliedo recommend
of results wwith regard
al., 2001), (Cnagement contve to ship tible, pursue ch, and emb
A managementrinciples, cf. (R
RE ES
ment ower agile antly
EA trate EA
d for ds an while ds to ohn,
ntext, their
an brace
chaSimEAmosove
an conenoSpea mexp201201the onlyenvintethe be Robthe sho
t practice basedRoth et al., 2014
anges regardinmilar to their s
management st important t
er completenesAs goes the AEA manage
nstant pace tryough leeway eaking of flexmodus operanperiment and 12). In confor10) as well as
EA managemy upon sta
vironment wierference duri
other side ofeager to givebertson, 2006
EA manageould be incorpo
d on theoretical4).
ng their workoftware develteam should a
tasks first witss and quality Agile Manifesment team s
ying to avoid for reflection
xibility, agile ndi where me
try out newrming to the ps the one-piecment team shoakeholders’ ith little or ng the work f the spectrum
regular feedb6) on the resuement team. orated into the
l concepts often
king style anloping countealways take cth a valuation
y (Stal, 2012). sto (Beck et ashould advanovertime whins and retrosliterature reco
embers are alw things (Cpull-principle
ce flow (Fisheould create del
demand wino distract
(Schwaber, 2m, stakeholdeback (Ross, Wults delivered
However, te work of the
n found in
d results. erparts, an are of the n of time
al., 2001), nce in a ile having spectives. ommends llowed to
Coldewey, e (Gloger, er, 2000), liverables ithin an tion and
2004). On rs should
Weill and d through the latter team.
Agile Enterprise Architecture Management - An Analysis on the Application of Agile Principles
41
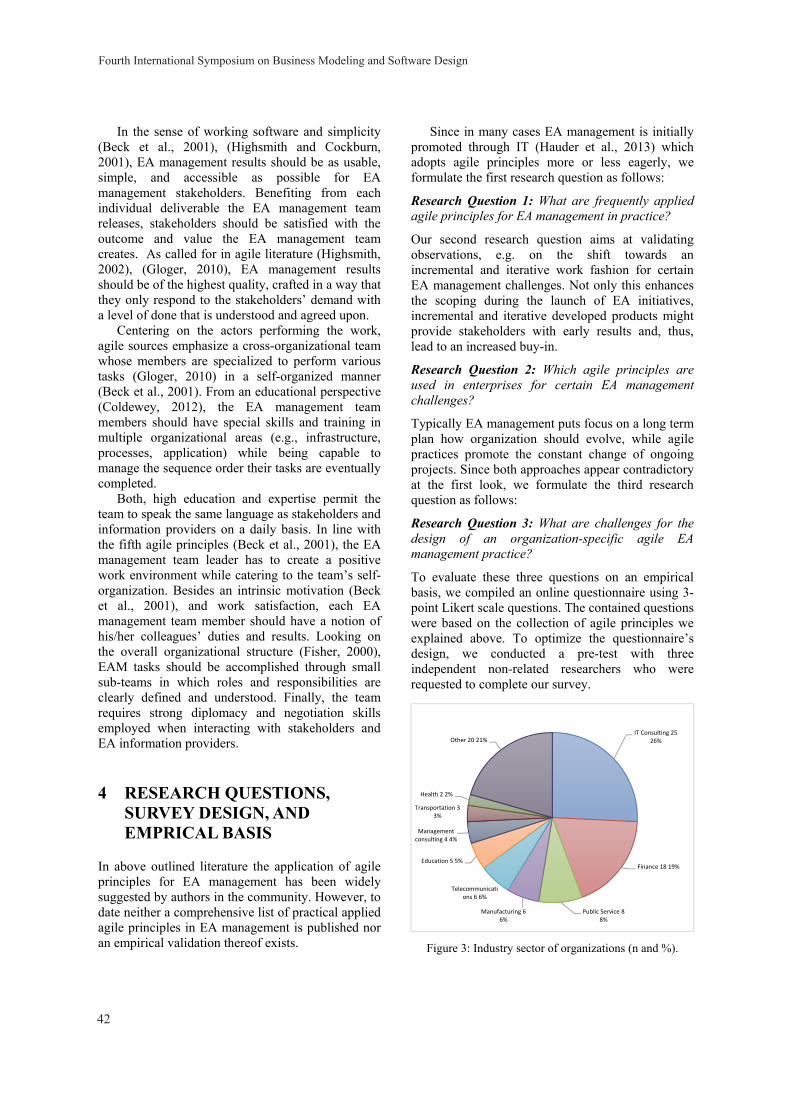
In the sense of working software and simplicity (Beck et al., 2001), (Highsmith and Cockburn, 2001), EA management results should be as usable, simple, and accessible as possible for EA management stakeholders. Benefiting from each individual deliverable the EA management team releases, stakeholders should be satisfied with the outcome and value the EA management team creates. As called for in agile literature (Highsmith, 2002), (Gloger, 2010), EA management results should be of the highest quality, crafted in a way that they only respond to the stakeholders’ demand with a level of done that is understood and agreed upon.
Centering on the actors performing the work, agile sources emphasize a cross-organizational team whose members are specialized to perform various tasks (Gloger, 2010) in a self-organized manner (Beck et al., 2001). From an educational perspective (Coldewey, 2012), the EA management team members should have special skills and training in multiple organizational areas (e.g., infrastructure, processes, application) while being capable to manage the sequence order their tasks are eventually completed.
Both, high education and expertise permit the team to speak the same language as stakeholders and information providers on a daily basis. In line with the fifth agile principles (Beck et al., 2001), the EA management team leader has to create a positive work environment while catering to the team’s self-organization. Besides an intrinsic motivation (Beck et al., 2001), and work satisfaction, each EA management team member should have a notion of his/her colleagues’ duties and results. Looking on the overall organizational structure (Fisher, 2000), EAM tasks should be accomplished through small sub-teams in which roles and responsibilities are clearly defined and understood. Finally, the team requires strong diplomacy and negotiation skills employed when interacting with stakeholders and EA information providers.
4 RESEARCH QUESTIONS, SURVEY DESIGN, AND EMPRICAL BASIS
In above outlined literature the application of agile principles for EA management has been widely suggested by authors in the community. However, to date neither a comprehensive list of practical applied agile principles in EA management is published nor an empirical validation thereof exists.
Since in many cases EA management is initially promoted through IT (Hauder et al., 2013) which adopts agile principles more or less eagerly, we formulate the first research question as follows:
Research Question 1: What are frequently applied agile principles for EA management in practice?
Our second research question aims at validating observations, e.g. on the shift towards an incremental and iterative work fashion for certain EA management challenges. Not only this enhances the scoping during the launch of EA initiatives, incremental and iterative developed products might provide stakeholders with early results and, thus, lead to an increased buy-in.
Research Question 2: Which agile principles are used in enterprises for certain EA management challenges?
Typically EA management puts focus on a long term plan how organization should evolve, while agile practices promote the constant change of ongoing projects. Since both approaches appear contradictory at the first look, we formulate the third research question as follows:
Research Question 3: What are challenges for the design of an organization-specific agile EA management practice?
To evaluate these three questions on an empirical basis, we compiled an online questionnaire using 3-point Likert scale questions. The contained questions were based on the collection of agile principles we explained above. To optimize the questionnaire’s design, we conducted a pre-test with three independent non-related researchers who were requested to complete our survey.
Figure 3: Industry sector of organizations (n and %).
IT Consulting 25 26%
Finance 18 19%
Public Service 8 8%
Manufacturing 6 6%
Telecommunications 6 6%
Education 5 5%
Management consulting 4 4%
Transportation 3 3%
Health 2 2%
Other 20 21%
Fourth International Symposium on Business Modeling and Software Design
42
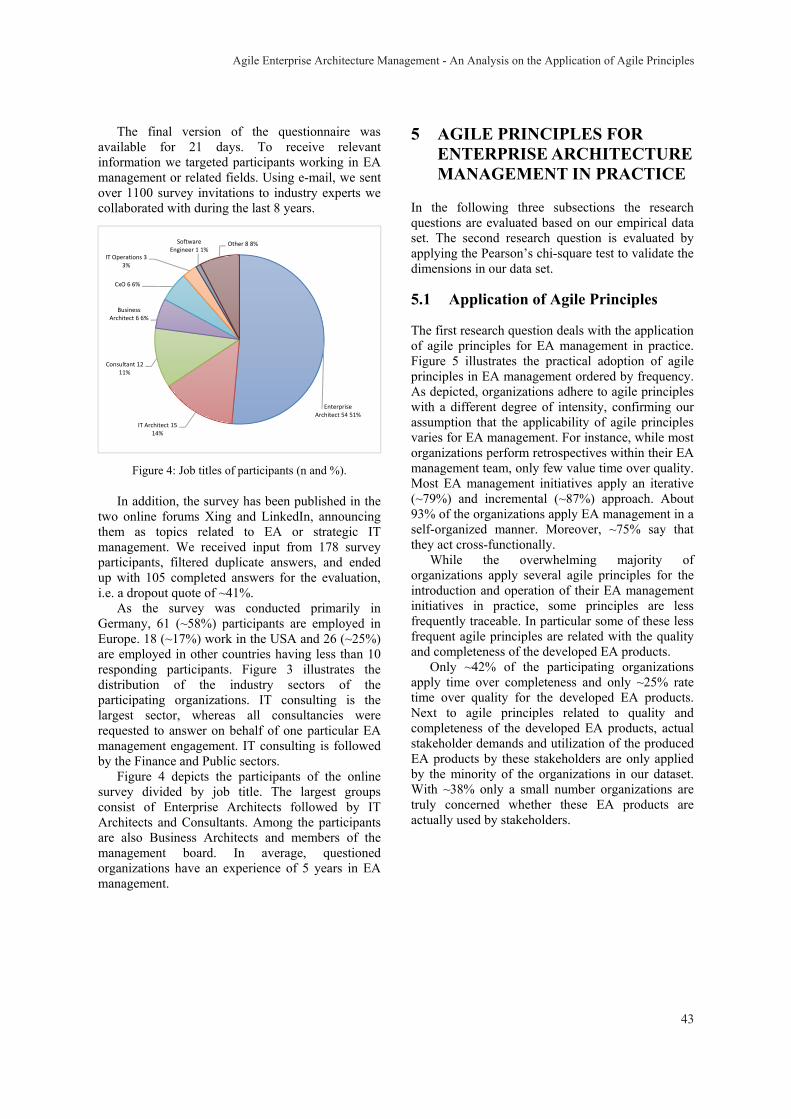
The final version of the questionnaire was available for 21 days. To receive relevant information we targeted participants working in EA management or related fields. Using e-mail, we sent over 1100 survey invitations to industry experts we collaborated with during the last 8 years.
Figure 4: Job titles of participants (n and %).
In addition, the survey has been published in the two online forums Xing and LinkedIn, announcing them as topics related to EA or strategic IT management. We received input from 178 survey participants, filtered duplicate answers, and ended up with 105 completed answers for the evaluation, i.e. a dropout quote of ~41%.
As the survey was conducted primarily in Germany, 61 (~58%) participants are employed in Europe. 18 (~17%) work in the USA and 26 (~25%) are employed in other countries having less than 10 responding participants. Figure 3 illustrates the distribution of the industry sectors of the participating organizations. IT consulting is the largest sector, whereas all consultancies were requested to answer on behalf of one particular EA management engagement. IT consulting is followed by the Finance and Public sectors.
Figure 4 depicts the participants of the online survey divided by job title. The largest groups consist of Enterprise Architects followed by IT Architects and Consultants. Among the participants are also Business Architects and members of the management board. In average, questioned organizations have an experience of 5 years in EA management.
5 AGILE PRINCIPLES FOR ENTERPRISE ARCHITECTURE MANAGEMENT IN PRACTICE
In the following three subsections the research questions are evaluated based on our empirical data set. The second research question is evaluated by applying the Pearson’s chi-square test to validate the dimensions in our data set.
5.1 Application of Agile Principles
The first research question deals with the application of agile principles for EA management in practice. Figure 5 illustrates the practical adoption of agile principles in EA management ordered by frequency. As depicted, organizations adhere to agile principles with a different degree of intensity, confirming our assumption that the applicability of agile principles varies for EA management. For instance, while most organizations perform retrospectives within their EA management team, only few value time over quality. Most EA management initiatives apply an iterative (~79%) and incremental (~87%) approach. About 93% of the organizations apply EA management in a self-organized manner. Moreover, ~75% say that they act cross-functionally.
While the overwhelming majority of organizations apply several agile principles for the introduction and operation of their EA management initiatives in practice, some principles are less frequently traceable. In particular some of these less frequent agile principles are related with the quality and completeness of the developed EA products.
Only ~42% of the participating organizations apply time over completeness and only ~25% rate time over quality for the developed EA products. Next to agile principles related to quality and completeness of the developed EA products, actual stakeholder demands and utilization of the produced EA products by these stakeholders are only applied by the minority of the organizations in our dataset. With ~38% only a small number organizations are truly concerned whether these EA products are actually used by stakeholders.
Enterprise Architect 54 51%
IT Architect 15 14%
Consultant 12 11%
Business Architect 6 6%
CxO 6 6%
IT Operations 3 3%
Software Engineer 1 1%
Other 8 8%
Agile Enterprise Architecture Management - An Analysis on the Application of Agile Principles
43
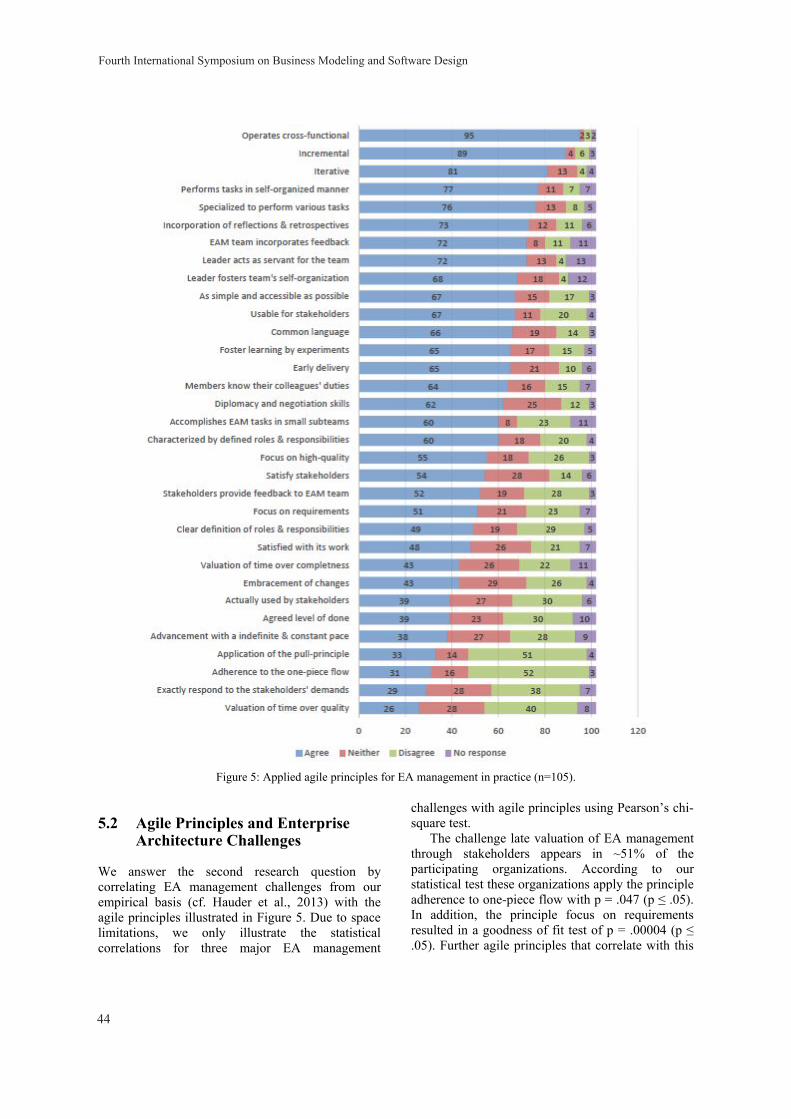
Figure 5: Applied agile principles for EA management in practice (n=105).
5.2 Agile Principles and Enterprise Architecture Challenges
We answer the second research question by correlating EA management challenges from our empirical basis (cf. Hauder et al., 2013) with the agile principles illustrated in Figure 5. Due to space limitations, we only illustrate the statistical correlations for three major EA management
challenges with agile principles using Pearson’s chi-square test.
The challenge late valuation of EA management through stakeholders appears in ~51% of the participating organizations. According to our statistical test these organizations apply the principle adherence to one-piece flow with p = .047 (p ≤ .05). In addition, the principle focus on requirements resulted in a goodness of fit test of p = .00004 (p ≤ .05). Further agile principles that correlate with this
Fourth International Symposium on Business Modeling and Software Design
44
challenge are advancement with an indefinite & constant pace p = .002 (p ≤ .05), stakeholders provide feedback to EA management team p = .0002 (p ≤ .05), agreed level of done p = .009 (p ≤ .05), useable for stakeholders p = .042 (p ≤ .05), and as simple and accessible as possible p = .005 (p ≤ .05). All other agile principles were not statistically dependent on this challenge for the given relevance.
Around ~38% of the organizations are struggling with outdated EA results. This means that architecture descriptions are often outdated before they are complete and often understood as a project rather than a continuous process. The agile principles characterized by defined roles & responsibilities correlates with p = .004 (p ≤ .05), members knows their colleagues’ duties with p = .0001 (p ≤ .05), focus on high quality p = .005 (p ≤ .05), satisfied with its work p = .001 (p ≤ .05), adherence to one-piece flow p = .00001 (p ≤ .05), incorporation of reflections & retrospectives p = .001 (p ≤ .05), agreed level of done p = .0001 (p ≤ .05), and usable for stakeholders p = .001 (p ≤ .05).
Reluctant information providers are a challenge for ~65% of the organizations. This is a very critical problem since enterprise architects heavily rely on the information and knowledge provided by stakeholders. The agile principle satisfied with its work correlates with p = .043 (p ≤ .05), focus on requirements p = .00001 (p ≤ .05), application of the pull principle p = .009 (p ≤ .05), embracement of changes p = .030 (p ≤ .05), valuation of time over quality p = .004 (p ≤ .05), as simple and accessible as possible p = .00001 (p ≤ .05), and exactly respond to stakeholders’ demand p = .003 (p ≤ .05) correlate with this challenge.
5.3 Designing an Agile Enterprise Architecture Management Practice
Designing an agile EA management practice is a challenging issue. While EA management frameworks typically work towards a long range vision of the organization or a business case, agile practices incorporate findings from ongoing projects immediately in the process. To put it in another way, both approaches appear contradictory due to their top-down and planning (EA management) respectively bottom-up and emergent course of action.
Regarding the challenges EA management initiatives in organizations are faced with neither of these approaches can solve all challenges on his own. Integrating both approaches within one agile EA management practice that is tailored to the
specific demand of the organizational context would be desirable. The findings presented in this paper provide an initial empirical basis for further research on an agile EA management practice. This compromises the development of agile EA management roles, activities, and deliverables.
6 CONCLUSIONS
In this paper we provided an empirical foundation for agile principles applied to EA management by today’s organizations. Due to the survey design, the asked industry experts could only confirm or reject the application of an agile principle for EA management. Details about their actual implementation are yet to be revealed. As of today, this might be challenging, given the scarce literature on agile EA management and only the implicit adoption through EA frameworks. Regarding our survey results, a potential bias might originate from the lack of a common understanding on how to operationalize agile principles in EA management.
Further research could examine the impact of agile principles on the success and benefits of EA management initiatives. Thereby, the efforts should account for different organizational factors like the size of the business, structure, EA management experience, industry, and tool support. Further studies could also focus on the correlation (and later causalities) between challenges encountered in EA management and possible mitigation through agile principles.
REFERENCES
Ambler, S. W. (2009): Agile Enterprise Architecture. http://www.agiledata.org/essays/enterpriseArchitecture.html. Last opened: 27/08/2013.
Ambler, S. W. (2010a): Agile and Enterprise Architecture. https://www.ibm.com/developerworks/mydeveloperworks/blogs/ambler/entry/agile_and_enterprise_architecture?lang=en. Last opened: 27/08/2013.
Ambler, S. W. (2010b): Agile Architecture: Strategies for Scaling Agile Development. http://www.agile modeling.com/essays/agileArchitecture.htm. Last opened: 27/08/2013.
Banerjee, U. (2011): Agile development and Enterprise Architecture practice - Can they coexist. Technology Trend Analysis. http://setandbma.wordpress.com/ 2011/04/11/agile-development-and-enterprise-architecture-practice-can-they-coexist. Last opened: 27/08/2013.
Beck, K., Beedle, M., Bennekum, A. van, Cockburn, A.,
Agile Enterprise Architecture Management - An Analysis on the Application of Agile Principles
45

Cunningham, W., Fowler, M., Grenning, J., et al. (2001): Manifesto for Agile Software Development. Agile Alliance. http://agilemanifesto.org. Last opened: 27/08/2013.
Bente, S., Bombach, U., & Langade, S. (2012): Collaborative Enterprise Architecture: Enriching EA with Lean, Agile, and Enterprise 2.0 Practices. 1st ed. Morgan Kaufmann, Burlington.
Buckl, S., Matthes, F., Monahov, I., Roth, S., Schulz, C., & Schweda, C. M. (2011): Towards an Agile Design of the Enterprise Architecture Management Function. 6th International Workshop on Trends in Enterprise Architecture Research (TEAR). Helsinki.
Buschle, M., Grunow, S., Matthes, F., Ekstedt, M., Hauder, M., & Roth, S. (2012): Automating enterprise architecture documentation using an enterprise service bus. In Proceedings of the 18th Americas Conference on Information Systems. Washington.
Cohn M. (2005): Agile Estimating and Planning, Prentice Hall PTR, Upper Saddle River.
Coldewey, J. 2012: Was heißt hier eigentlich “Agil”? Kennzeichen agiler Organisationen. In ObjektSpektrum 05/2012.
Comm, C. L., & Mathaisel, D. F. X. (2010): A Lean Enterprise Architecture for Business Process Re-engineering and Re-marketing. 12th International Conference on Enterprise Information Systems (pp. 497–500). Madeira.
Deming, W. E. (2000): Out of the Crisis. MIT press, Cambridge.
Fisher, K. (2000): Leading Self-Directing Work Teams. McGraw-Hill, New York.
Friedrichsen, U., & Schrewe, I. (2010): Leichtgewichtige Unternehmensarchitekturen – Wie Agilität bei der Einführung eines EA Management helfen kann. In OBJEKTspektrum, EAM/2010.
Gabhart, K. (2013): Generating Value through Information Architecture. http://archvalue.com/agile-enterprise-architecture (last opened: 27/08/2013)
Gattadahalli, S. (2004): Agile Enterprise Architecture (AEA) - 7 Steps to Success. London.
Gloger, B. (2010): Scrum. In Informatik-Spektrum, 33(2): 195–200.
Hauder, M., Roth, S., Matthes, F., & Schulz, C. (2013): Organizational factors influencing enterprise architecture management challenges. 21st European Conference on Information Systems (ECIS). Utrecht.
Highsmith J. (2002): Agile Software Development Ecosystems. Pearson Education, Indianapolis.
Highsmith, J., & Cockburn, A. (2001): Agile software development: the business of innovation. In Computer, 34(9): 120–127.
Holweg, Matthias (2007): The genealogy of lean production. In Journal of Operations Management 25 (2): 420–437.
Landes, E. (2012): Agile Software Development Concepts for Enterprise Architects. http://www.devx.com/ architect/Article/47842. Last opened: 27/08/2013.
Lucke, C., Krell, S., & Lechner, U. (2010): Critical Issues in Enterprise Architecting - A Literature Review. In
AMCIS 2010 Proceedings (pp. 1-11). Association for Information Systems.
Lucke, C., Bürger, M., Diefenbach, T., Freter, J., & Lechner, U. (2012): Categories of Enterprise Architecting Issues - An Empirical Investigation based on Expert Interviews. In D. C. Mattfeld & S. Robra-Bissantz (Eds.), Multikonferenz Wirtschaftsinformatik (pp. 999-1010). GITO mbH Verlag, Berlin.
Nelson, S. (2012): Making Enterprise Architecture Work in Agile Environments. http://www.devx.com/ architect/Article/47871. Last opened: 27/08/2013.
Nicholette, D. (2007): Enterprise Architecture and Agile. Musings of a Software Development Manager. http://edgibbs.com/2007/10/04/enterprise-architecture-and-agile. Last opened: 27/08/2013.
Reifer, D. J., Maurer, F., & Erdogmus, H. (2003): Scaling agile methods. Software, IEEE, 20(4): 12-14.
Roth, S., Zec, M. & Matthes, F. (2014): Enterprise Architecture Visualization Tool Survey 2014. Technical Report, Technische Universität München.
Ross, J. W., Weill, P., & Robertson, D. (2006): Enterprise architecture as strategy: Creating a foundation for business execution. Harvard Business Press, Boston.
Webster, J., & Watson, R. T. (2002): Analyzing the Past to Prepare for the Future: Writing a Literature Review. MIS Quarterly, 26(2): 13–23.
Weill, P., & Ross, J. W. (2009): IT Savvy: What top executives must know to go from pain to gain. Harvard Business Press, Boston.
Rhubart, B. (2010): Agile Enterprise Architecture. Oracle Magazine. http://www.oracle.com/technetwork/issue-archive/2010/10-nov/o60architect-175580.html. Last opened: 27/08/2013.
Schwaber, K. (2004): Agile Project Management with Scrum. 1st ed., Microsoft Press, Redmond, Washington.
Shirazi, H. M., Rouhani, B. D., & Shirazi, M. M. (2009): A Framework for Agile Enterprise Architecture. In International Journal of Intelligent Information Technology Application, 2(4): 182–186.
Stal, M. (2012): Softwarearchitektur und Agilität - Freund oder Feind?. OOP 2012. München.
The Open Group (2011): TOGAF® Version 9.1, Van Haren Publishing, Zaltbommel.
Zachman, J. A. (1987): A framework for information systems architecture. In IBM systems journal, 26(3): 276-292.
Fourth International Symposium on Business Modeling and Software Design
46
Context-Sensitive Impact Analysis for Enterprise ArchitectureManagement
Melanie Langermeier, Christian Saad and Bernhard BauerSoftware Methodologies for Distributed Systems, University of Augsburg, Germany
{langermeier, saad, bauer}@ds-lab.org
Keywords: Enterprise Architecture Analysis, Impact Analysis, Change Propagation, Data Flow Analysis.
Abstract: Since Enterprise Architecture (EA) models are typically very large, it is often difficult for humans to fullygrasp their contents. Due to this inherent complexity, the task of generating additional value from thesemodels is very challenging without a suitable analysis method. Impact analysis, which is able to determinethe effects which changes have on other architectural elements, can therefore provide valuable information foran enterprise architect. Whether an element is affected by a change depends on its context, i.e. its (transitive)connections to other elements and their status with respect to the analysis. In this paper we propose a context-sensitive approach to the implementation of impact analyses. This method relies on the technique of data-flowanalysis to propagate the effects of changes throughout the model. As a consequence, the specification can bedefined in a very generic fashion, which only relies on relationship classes. Therefore it can be easily adaptedto organization-specific EA meta models as only the relationship types have to be mapped to the respectiveclasses.
1 INTRODUCTION
Enterprise Architecture Management (EAM) pro-vides methods for managing the inherent complexityof the large IT infrastructures encountered in manyorganizations. As a result, Enterprise Architecture(EA) models usually contain many elements whichare connected through complex relationships. It istherefore vital to provide suitable methods for (semi-)automatically analyzing their contents to be able tobenefit from this methodology once it has been suc-cessfully established in an organization.
Although much research has been done in the EAdomain, most of this work focuses on methodolo-gies for the development and the representation of en-terprise models. By contrast, approaches and tech-niques which explore possible applications scenariosare very rare (Narman et al., 2012; Niemann, 2006).Regarding the analysis of EA models, a major fo-cal point exists in their quantification. This encom-passes the definition and computation of quality at-tributes such as application usage and service avail-ability. (Narman et al., 2012) Furthermore, it is pos-sible to evaluate the performance and cost aspects inthe different layers of enterprise models (Jonkers andIacob, 2009). Finally, (Matthes et al., 2012) establisha catalog of KPIs to measure EA management goals.
One of the most important analysis methods how-ever, is the so-called impact analysis which allows tosimulate the effects of changes (e.g. the modificationof a CRM system) and to assess risks in the currentarchitecture (e.g. which business operations wouldbe affected if a specific server goes offline) (de Boeret al., 2005). To generate this information, an impactanalysis has to evaluate the dependencies between thearchitecture’s constituents. However, in order to makeproper assertions about these relationships, it is neces-sary to evaluate each element in its respective context.This means, that its relationships with other elementsin the model have to be taken into consideration. Forexample, to examine the impact of a server failure onbusiness processes, one has to determine which ap-plications rely on this server. This requires a carefulevaluation of indirect and transitive paths in the modelto ensure that all necessary information is retrieved,while at the same time excluding irrelevant relation-ships.
Existing approaches and tools for the creation andanalysis of EA models usually rely on a static metamodel structure. This can be a problem since eachorganization tends to employ its own meta model,making the adaption of existing analyses very difficult(Kurpjuweit and Aier, 2009). To rectify this situation,more flexible methods for handling structural depen-
47
dencies are required.In this paper we present a technique which sup-
ports the context-sensitive impact analysis of EAmodels. It is based on the principle of data-flow anal-ysis, a method which originates from the field of com-piler construction. Using this approach, it is possibleto derive context-sensitive information by propagat-ing contextual information along the model’s edges.Since the developed analysis distinguishes betweendifferent semantic relationship classes it can be easilyadapted to the conventions in different organizationsby mapping the relationship types in the respectivetarget domain to the proposed categories. Further-more, it is possible to extend the analysis with indi-vidual impact propagation rules. To demonstrate theviability as well as the generic applicability of thisapproach, we implement multiple impact analyses fordifferent EAM languages.
2 IMPACT AND DEPENDENCYANALYSIS
According to (Bohner, 2002), determining the effectsof a change requires an iterative and discovery-basedapproach. Change impact analysis can be performedfor a single software system, but also on an architec-tural level for a full application landscape or an en-terprise architecture. A related topic which is also ofinterest in this context is the analysis of dependencyrelationships.
Typically, any change which is made to a modelelement also affects its neighboring elements (directimpact). However, as these changes may in turn af-fect other elements (indirect impact), the effect prop-agates throughout the model. Consequently, even asmall change in a single element can cause ripple-effects, resulting in non-trivial consequences. Whilethe direct impact can be derived from the connectiv-ity graph, the computation of indirect impacts (n-levelimpacts) requires reachability information. However,since this method approximates potential impacts, ittends to overestimate the result by generating false-positives. The precision of the analysis can be im-proved by using a constraint mechanism or by incor-porating structural and semantic information (Bohner,2002).
Most of the work regarding impact analysisof software focuses on the code level (Lehnert,2011). Approaches which evaluate architectures usu-ally only regard concepts such as components, pack-ages, classes, interfaces and methods. Due to thelimited amount of supported types and the domain-specific characteristics, these approaches are not suit-
able for use in EAM.Nevertheless, some techniques which target the
UML are more closely related to the EAM domain.(Briand et al., 2003) propose a methodology for sub-jecting analysis and design documents to an impactanalysis to detect side effects of changes in the con-text of UML-based development. To restrict the setof affected model elements they propose the use of acoupling measure and a predictive statistical model.The impact analysis itself is specified using the OCL.(von Knethen and Grund, 2003) developed an ap-proach which supports traceability by providing re-quirements engineers, project planers and maintain-ers with the ability to monitor the effects that changeshave on software systems. They differentiate betweenthree types of relationships to define the traces: repre-sentation, refinement and dependency. To determinethe change impact, they (semi-)automatically analyzerequirement traces using these three categories.
(Kurpjuweit and Aier, 2009) and (Saat, 2010) pro-pose techniques for EA dependency analysis. Saatfocuses on time-related aspects (org. ”zeitbezogeneAbhangingkeitsanalysen”) by considering for each el-ement its life time, the status (current or proposed) aswell as the life cycle phase with its duration. How-ever, no execution or implementation details are pro-vided for this approach. Kurpjuweit and Aier devel-oped a formal method for flexible and generic depen-dency analysis. To determine dependent elements,they use the transitive closure of a set of relations.They also define an expansion function, which allowsto consider special relation semantics, e.g. hierarchi-cal refinement or reflective relation types.
(Holschke et al., 2009) as well as (Tang et al.,2007) propose the use of Bayesian Belief Networks(BBN) for EA modeling. These approaches rely oncausal dependencies as well as inference methods forBBN and a diagnosis analysis to determine the im-pact. The former realizes a failure impact analysis,theoretically described in the pattern catalogue (Bucklet al., 2008), using the diagnostic analysis1 and themodeling tool GeNIe. As a result, architectural com-ponents can be ranked with respect to their critical-ity for a business process. However, this approachfocuses on availability, not on changes. Tang et al.employ a combination of predictive reasoning to de-termine affected elements and diagnostic reasoning todetermine the cause of a change. Prior to the analy-sis, the architect has to assign a probability to eachroot node and a conditional probability table to each
1Jagt, R.M.: Support for Multiple Cause Diagnosis withBayesian Networks. Vol. M. Sc. Delft University of Tech-nology, the Netherlands and Information Sciences Depart-ment, University of Pittsburgh, PA, USA, Pittsburgh (2002)
Fourth International Symposium on Business Modeling and Software Design
48
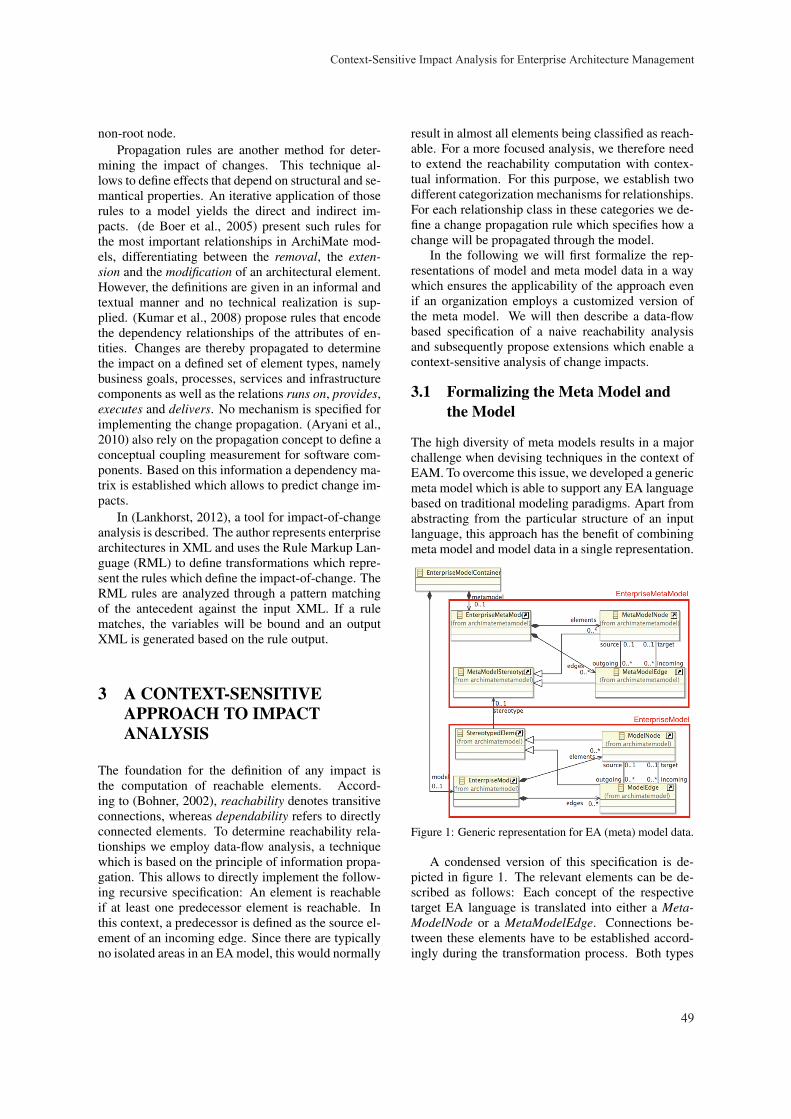
non-root node.Propagation rules are another method for deter-
mining the impact of changes. This technique al-lows to define effects that depend on structural and se-mantical properties. An iterative application of thoserules to a model yields the direct and indirect im-pacts. (de Boer et al., 2005) present such rules forthe most important relationships in ArchiMate mod-els, differentiating between the removal, the exten-sion and the modification of an architectural element.However, the definitions are given in an informal andtextual manner and no technical realization is sup-plied. (Kumar et al., 2008) propose rules that encodethe dependency relationships of the attributes of en-tities. Changes are thereby propagated to determinethe impact on a defined set of element types, namelybusiness goals, processes, services and infrastructurecomponents as well as the relations runs on, provides,executes and delivers. No mechanism is specified forimplementing the change propagation. (Aryani et al.,2010) also rely on the propagation concept to define aconceptual coupling measurement for software com-ponents. Based on this information a dependency ma-trix is established which allows to predict change im-pacts.
In (Lankhorst, 2012), a tool for impact-of-changeanalysis is described. The author represents enterprisearchitectures in XML and uses the Rule Markup Lan-guage (RML) to define transformations which repre-sent the rules which define the impact-of-change. TheRML rules are analyzed through a pattern matchingof the antecedent against the input XML. If a rulematches, the variables will be bound and an outputXML is generated based on the rule output.
3 A CONTEXT-SENSITIVEAPPROACH TO IMPACTANALYSIS
The foundation for the definition of any impact isthe computation of reachable elements. Accord-ing to (Bohner, 2002), reachability denotes transitiveconnections, whereas dependability refers to directlyconnected elements. To determine reachability rela-tionships we employ data-flow analysis, a techniquewhich is based on the principle of information propa-gation. This allows to directly implement the follow-ing recursive specification: An element is reachableif at least one predecessor element is reachable. Inthis context, a predecessor is defined as the source el-ement of an incoming edge. Since there are typicallyno isolated areas in an EA model, this would normally
result in almost all elements being classified as reach-able. For a more focused analysis, we therefore needto extend the reachability computation with contex-tual information. For this purpose, we establish twodifferent categorization mechanisms for relationships.For each relationship class in these categories we de-fine a change propagation rule which specifies how achange will be propagated through the model.
In the following we will first formalize the rep-resentations of model and meta model data in a waywhich ensures the applicability of the approach evenif an organization employs a customized version ofthe meta model. We will then describe a data-flowbased specification of a naive reachability analysisand subsequently propose extensions which enable acontext-sensitive analysis of change impacts.
3.1 Formalizing the Meta Model andthe Model
The high diversity of meta models results in a majorchallenge when devising techniques in the context ofEAM. To overcome this issue, we developed a genericmeta model which is able to support any EA languagebased on traditional modeling paradigms. Apart fromabstracting from the particular structure of an inputlanguage, this approach has the benefit of combiningmeta model and model data in a single representation.
Figure 1: Generic representation for EA (meta) model data.
A condensed version of this specification is de-picted in figure 1. The relevant elements can be de-scribed as follows: Each concept of the respectivetarget EA language is translated into either a Meta-ModelNode or a MetaModelEdge. Connections be-tween these elements have to be established accord-ingly during the transformation process. Both types
Context-Sensitive Impact Analysis for Enterprise Architecture Management
49
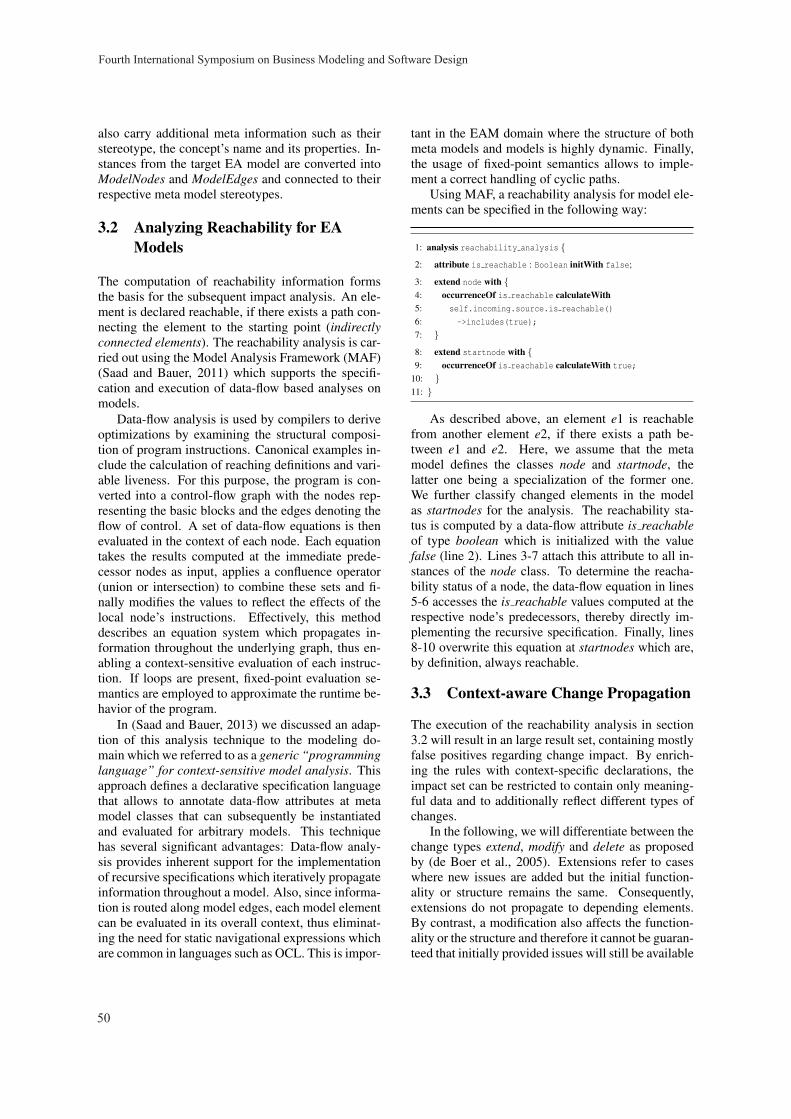
also carry additional meta information such as theirstereotype, the concept’s name and its properties. In-stances from the target EA model are converted intoModelNodes and ModelEdges and connected to theirrespective meta model stereotypes.
3.2 Analyzing Reachability for EAModels
The computation of reachability information formsthe basis for the subsequent impact analysis. An ele-ment is declared reachable, if there exists a path con-necting the element to the starting point (indirectlyconnected elements). The reachability analysis is car-ried out using the Model Analysis Framework (MAF)(Saad and Bauer, 2011) which supports the specifi-cation and execution of data-flow based analyses onmodels.
Data-flow analysis is used by compilers to deriveoptimizations by examining the structural composi-tion of program instructions. Canonical examples in-clude the calculation of reaching definitions and vari-able liveness. For this purpose, the program is con-verted into a control-flow graph with the nodes rep-resenting the basic blocks and the edges denoting theflow of control. A set of data-flow equations is thenevaluated in the context of each node. Each equationtakes the results computed at the immediate prede-cessor nodes as input, applies a confluence operator(union or intersection) to combine these sets and fi-nally modifies the values to reflect the effects of thelocal node’s instructions. Effectively, this methoddescribes an equation system which propagates in-formation throughout the underlying graph, thus en-abling a context-sensitive evaluation of each instruc-tion. If loops are present, fixed-point evaluation se-mantics are employed to approximate the runtime be-havior of the program.
In (Saad and Bauer, 2013) we discussed an adap-tion of this analysis technique to the modeling do-main which we referred to as a generic “programminglanguage” for context-sensitive model analysis. Thisapproach defines a declarative specification languagethat allows to annotate data-flow attributes at metamodel classes that can subsequently be instantiatedand evaluated for arbitrary models. This techniquehas several significant advantages: Data-flow analy-sis provides inherent support for the implementationof recursive specifications which iteratively propagateinformation throughout a model. Also, since informa-tion is routed along model edges, each model elementcan be evaluated in its overall context, thus eliminat-ing the need for static navigational expressions whichare common in languages such as OCL. This is impor-
tant in the EAM domain where the structure of bothmeta models and models is highly dynamic. Finally,the usage of fixed-point semantics allows to imple-ment a correct handling of cyclic paths.
Using MAF, a reachability analysis for model ele-ments can be specified in the following way:
1: analysis reachability analysis {
2: attribute is reachable : Boolean initWith false;
3: extend node with {4: occurrenceOf is reachable calculateWith5: self.incoming.source.is reachable()
6: ->includes(true);
7: }
8: extend startnode with {9: occurrenceOf is reachable calculateWith true;
10: }11: }
As described above, an element e1 is reachablefrom another element e2, if there exists a path be-tween e1 and e2. Here, we assume that the metamodel defines the classes node and startnode, thelatter one being a specialization of the former one.We further classify changed elements in the modelas startnodes for the analysis. The reachability sta-tus is computed by a data-flow attribute is reachableof type boolean which is initialized with the valuefalse (line 2). Lines 3-7 attach this attribute to all in-stances of the node class. To determine the reacha-bility status of a node, the data-flow equation in lines5-6 accesses the is reachable values computed at therespective node’s predecessors, thereby directly im-plementing the recursive specification. Finally, lines8-10 overwrite this equation at startnodes which are,by definition, always reachable.
3.3 Context-aware Change Propagation
The execution of the reachability analysis in section3.2 will result in an large result set, containing mostlyfalse positives regarding change impact. By enrich-ing the rules with context-specific declarations, theimpact set can be restricted to contain only meaning-ful data and to additionally reflect different types ofchanges.
In the following, we will differentiate between thechange types extend, modify and delete as proposedby (de Boer et al., 2005). Extensions refer to caseswhere new issues are added but the initial function-ality or structure remains the same. Consequently,extensions do not propagate to depending elements.By contrast, a modification also affects the function-ality or the structure and therefore it cannot be guaran-teed that initially provided issues will still be available
Fourth International Symposium on Business Modeling and Software Design
50
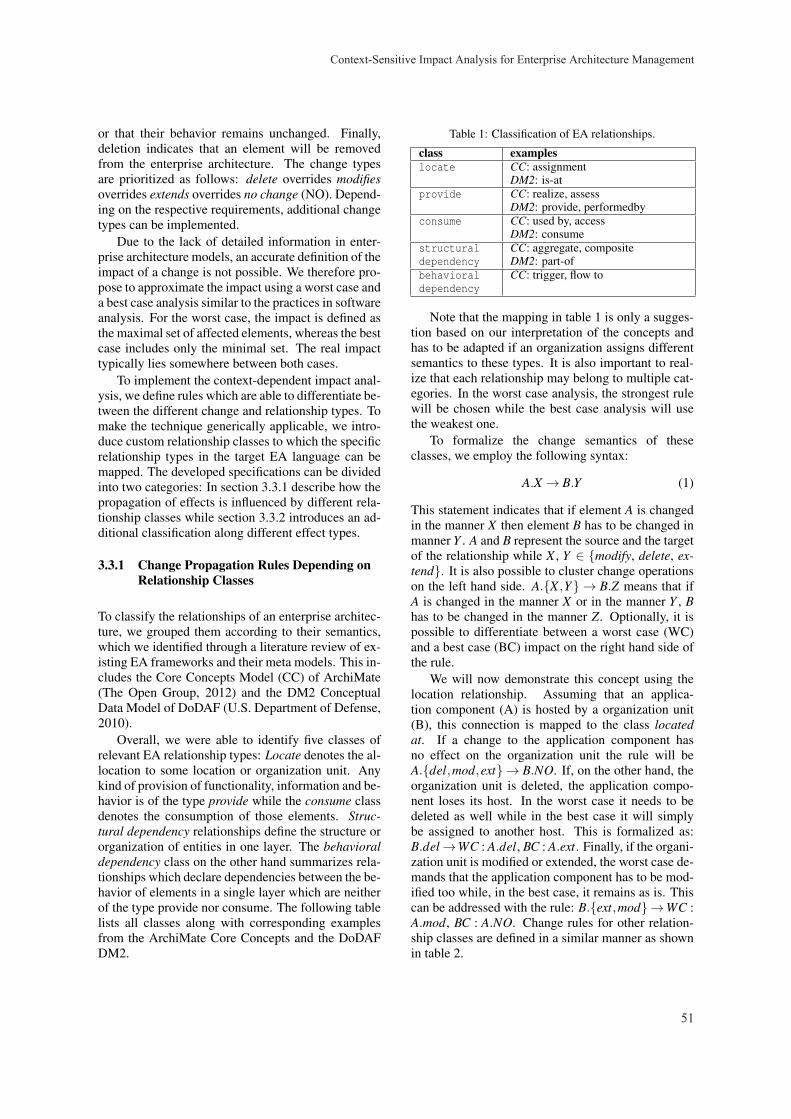
or that their behavior remains unchanged. Finally,deletion indicates that an element will be removedfrom the enterprise architecture. The change typesare prioritized as follows: delete overrides modifiesoverrides extends overrides no change (NO). Depend-ing on the respective requirements, additional changetypes can be implemented.
Due to the lack of detailed information in enter-prise architecture models, an accurate definition of theimpact of a change is not possible. We therefore pro-pose to approximate the impact using a worst case anda best case analysis similar to the practices in softwareanalysis. For the worst case, the impact is defined asthe maximal set of affected elements, whereas the bestcase includes only the minimal set. The real impacttypically lies somewhere between both cases.
To implement the context-dependent impact anal-ysis, we define rules which are able to differentiate be-tween the different change and relationship types. Tomake the technique generically applicable, we intro-duce custom relationship classes to which the specificrelationship types in the target EA language can bemapped. The developed specifications can be dividedinto two categories: In section 3.3.1 describe how thepropagation of effects is influenced by different rela-tionship classes while section 3.3.2 introduces an ad-ditional classification along different effect types.
3.3.1 Change Propagation Rules Depending onRelationship Classes
To classify the relationships of an enterprise architec-ture, we grouped them according to their semantics,which we identified through a literature review of ex-isting EA frameworks and their meta models. This in-cludes the Core Concepts Model (CC) of ArchiMate(The Open Group, 2012) and the DM2 ConceptualData Model of DoDAF (U.S. Department of Defense,2010).
Overall, we were able to identify five classes ofrelevant EA relationship types: Locate denotes the al-location to some location or organization unit. Anykind of provision of functionality, information and be-havior is of the type provide while the consume classdenotes the consumption of those elements. Struc-tural dependency relationships define the structure ororganization of entities in one layer. The behavioraldependency class on the other hand summarizes rela-tionships which declare dependencies between the be-havior of elements in a single layer which are neitherof the type provide nor consume. The following tablelists all classes along with corresponding examplesfrom the ArchiMate Core Concepts and the DoDAFDM2.
Table 1: Classification of EA relationships.
class exampleslocate CC: assignment
DM2: is-atprovide CC: realize, assess
DM2: provide, performedbyconsume CC: used by, access
DM2: consumestructuraldependency
CC: aggregate, compositeDM2: part-of
behavioraldependency
CC: trigger, flow to
Note that the mapping in table 1 is only a sugges-tion based on our interpretation of the concepts andhas to be adapted if an organization assigns differentsemantics to these types. It is also important to real-ize that each relationship may belong to multiple cat-egories. In the worst case analysis, the strongest rulewill be chosen while the best case analysis will usethe weakest one.
To formalize the change semantics of theseclasses, we employ the following syntax:
A.X → B.Y (1)
This statement indicates that if element A is changedin the manner X then element B has to be changed inmanner Y . A and B represent the source and the targetof the relationship while X , Y ∈ {modify, delete, ex-tend}. It is also possible to cluster change operationson the left hand side. A.{X ,Y} → B.Z means that ifA is changed in the manner X or in the manner Y , Bhas to be changed in the manner Z. Optionally, it ispossible to differentiate between a worst case (WC)and a best case (BC) impact on the right hand side ofthe rule.
We will now demonstrate this concept using thelocation relationship. Assuming that an applica-tion component (A) is hosted by a organization unit(B), this connection is mapped to the class locatedat. If a change to the application component hasno effect on the organization unit the rule will beA.{del,mod,ext} → B.NO. If, on the other hand, theorganization unit is deleted, the application compo-nent loses its host. In the worst case it needs to bedeleted as well while in the best case it will simplybe assigned to another host. This is formalized as:B.del→WC : A.del, BC : A.ext. Finally, if the organi-zation unit is modified or extended, the worst case de-mands that the application component has to be mod-ified too while, in the best case, it remains as is. Thiscan be addressed with the rule: B.{ext,mod}→WC :A.mod, BC : A.NO. Change rules for other relation-ship classes are defined in a similar manner as shownin table 2.
Context-Sensitive Impact Analysis for Enterprise Architecture Management
51
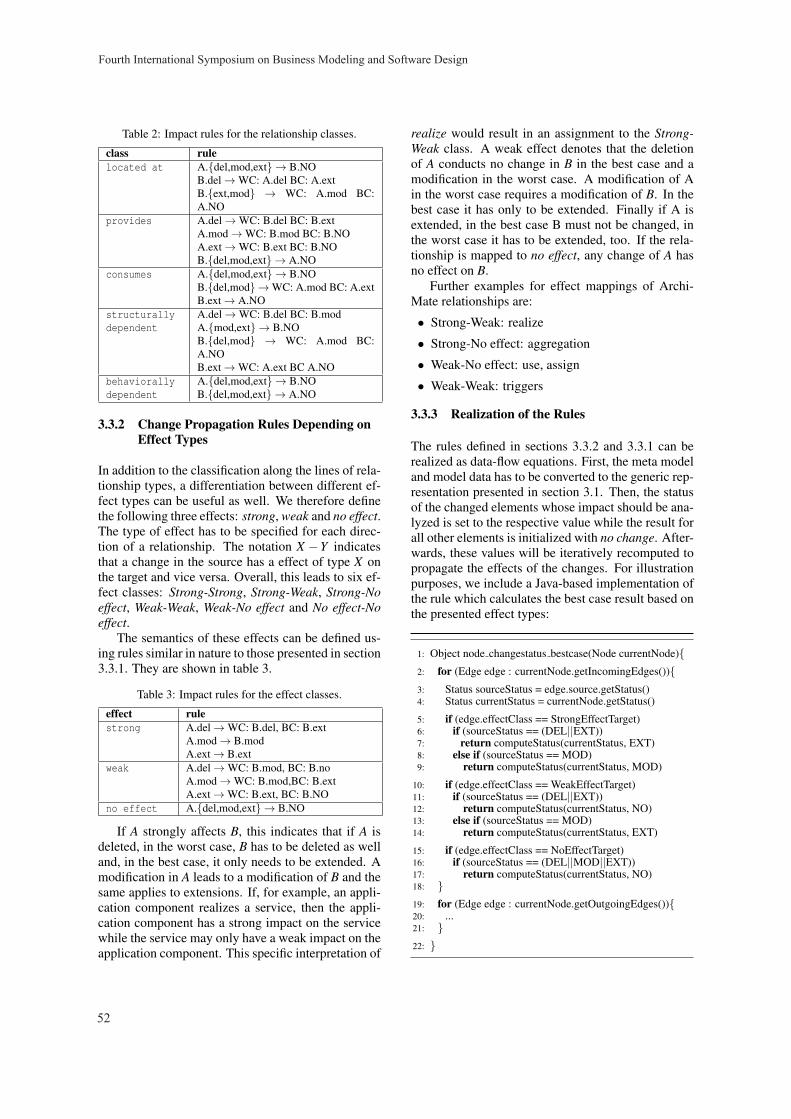
Table 2: Impact rules for the relationship classes.
class rulelocated at A.{del,mod,ext} → B.NO
B.del→WC: A.del BC: A.extB.{ext,mod} → WC: A.mod BC:A.NO
provides A.del→WC: B.del BC: B.extA.mod→WC: B.mod BC: B.NOA.ext→WC: B.ext BC: B.NOB.{del,mod,ext} → A.NO
consumes A.{del,mod,ext} → B.NOB.{del,mod} →WC: A.mod BC: A.extB.ext→ A.NO
structurallydependent
A.del→WC: B.del BC: B.modA.{mod,ext} → B.NOB.{del,mod} → WC: A.mod BC:A.NOB.ext→WC: A.ext BC A.NO
behaviorallydependent
A.{del,mod,ext} → B.NOB.{del,mod,ext} → A.NO
3.3.2 Change Propagation Rules Depending onEffect Types
In addition to the classification along the lines of rela-tionship types, a differentiation between different ef-fect types can be useful as well. We therefore definethe following three effects: strong, weak and no effect.The type of effect has to be specified for each direc-tion of a relationship. The notation X −Y indicatesthat a change in the source has a effect of type X onthe target and vice versa. Overall, this leads to six ef-fect classes: Strong-Strong, Strong-Weak, Strong-Noeffect, Weak-Weak, Weak-No effect and No effect-Noeffect.
The semantics of these effects can be defined us-ing rules similar in nature to those presented in section3.3.1. They are shown in table 3.
Table 3: Impact rules for the effect classes.
effect rulestrong A.del→WC: B.del, BC: B.ext
A.mod→ B.modA.ext→ B.ext
weak A.del→WC: B.mod, BC: B.noA.mod→WC: B.mod,BC: B.extA.ext→WC: B.ext, BC: B.NO
no effect A.{del,mod,ext} → B.NO
If A strongly affects B, this indicates that if A isdeleted, in the worst case, B has to be deleted as welland, in the best case, it only needs to be extended. Amodification in A leads to a modification of B and thesame applies to extensions. If, for example, an appli-cation component realizes a service, then the appli-cation component has a strong impact on the servicewhile the service may only have a weak impact on theapplication component. This specific interpretation of
realize would result in an assignment to the Strong-Weak class. A weak effect denotes that the deletionof A conducts no change in B in the best case and amodification in the worst case. A modification of Ain the worst case requires a modification of B. In thebest case it has only to be extended. Finally if A isextended, in the best case B must not be changed, inthe worst case it has to be extended, too. If the rela-tionship is mapped to no effect, any change of A hasno effect on B.
Further examples for effect mappings of Archi-Mate relationships are:
• Strong-Weak: realize
• Strong-No effect: aggregation
• Weak-No effect: use, assign
• Weak-Weak: triggers
3.3.3 Realization of the Rules
The rules defined in sections 3.3.2 and 3.3.1 can berealized as data-flow equations. First, the meta modeland model data has to be converted to the generic rep-resentation presented in section 3.1. Then, the statusof the changed elements whose impact should be ana-lyzed is set to the respective value while the result forall other elements is initialized with no change. After-wards, these values will be iteratively recomputed topropagate the effects of the changes. For illustrationpurposes, we include a Java-based implementation ofthe rule which calculates the best case result based onthe presented effect types:
1: Object node changestatus bestcase(Node currentNode){2: for (Edge edge : currentNode.getIncomingEdges()){3: Status sourceStatus = edge.source.getStatus()4: Status currentStatus = currentNode.getStatus()
5: if (edge.effectClass == StrongEffectTarget)6: if (sourceStatus == (DEL||EXT))7: return computeStatus(currentStatus, EXT)8: else if (sourceStatus == MOD)9: return computeStatus(currentStatus, MOD)
10: if (edge.effectClass == WeakEffectTarget)11: if (sourceStatus == (DEL||EXT))12: return computeStatus(currentStatus, NO)13: else if (sourceStatus == MOD)14: return computeStatus(currentStatus, EXT)
15: if (edge.effectClass == NoEffectTarget)16: if (sourceStatus == (DEL||MOD||EXT))17: return computeStatus(currentStatus, NO)18: }19: for (Edge edge : currentNode.getOutgoingEdges()){20: ...21: }22: }
Fourth International Symposium on Business Modeling and Software Design
52
The status of the current element (currentNode)depends on the status of the connected elements aswell as the direction of the relationship. Therefore,to correctly determine the change status, all incom-ing (lines 2 - 18) and outgoing edges (lines 19 - 21)have to be processed. The status value which hasbeen computed for a connected element is retrievedthrough an invocation of getStatus() (line 3). Thiscall instructs the data-flow solver to recursively com-pute and return the requested value. Based on the typeof each incoming edge, it is then decided whether ithas a strong effect (line 5), a weak effect (10) or noeffect (15) on its target. The concrete type of thechange is determined by evaluating the status of theedge’s source element (lines 6-9, 11-14, 16-17). Fi-nally, computeStatus() is invoked to compute and re-turn the status of the local element. To implement thepriorization relationships between the change types,e.g. to ensure that a weak change like no change can-not override a stronger one like delete, this methodtakes both the current and the newly computed statusas input. A similar approach is used to calculate theresult for the source elements of outgoing edges (line19-21).
3.4 Customization of the ImpactAnalysis
In the case where the rules proposed in section 3.3are not sufficient to capture all requirements of theorganization, it is possible to customize the analysis.For example, if a specific relationship type cannot bemapped to one of the proposed classes, a new rulecan be created. In addition to evaluating relation-ship types and change status of connected elements,a rule may also consider the type of the connectedelements or class properties. It would also be possi-ble to extend the rule definitions with the ability toquantify a change (e.g. in terms of costs). Thesefeatures can be implemented through additional data-flow attributes. For example, to compute potentialsavings on IT maintenance, the maintenance costs ofall deleted application and infrastructure componentsand their corresponding services could be aggregated.
Another customization consists of a modificationof the rule set to support change probabilities. Insteadof a single status, we can define four separate data-flow attributes, which compute the respective prob-abilities for the types delete, modification, extensionand no change. Additionally, the rule specificationwould have to be extended. For example, a rule couldbe defined as:
P(A.del) = X → P(B.del) = 0.8×X (2)
This means that if the probability that A is deleted isX , then the probability that B has to be deleted is 0.8×X or, in other words, if A is deleted then in 80% of thecases B will be deleted as well.
4 EVALUATION
Most of the research work regarding change impactanalysis has been carried out theoretically and thushas not yet been applied to real architecture models(e.g. (de Boer et al., 2005), (Kurpjuweit and Aier,2009), (Kumar et al., 2008)). An exception exists inthe work of (Tang et al., 2007) who employ predic-tive and diagnostic reasoning in BBN. However, onedisadvantage of their approach can be found in thehigh effort required to annotate probability informa-tion. The technique proposed in this paper simpli-fies analysis specification through a generic represen-tation of model data and through predefined and ex-tensible categorizations of relationships and effects.
Many existing approaches do not address prob-lems relating to cyclic dependencies or contradictingresults, the latter one for example being a weaknessof the tooling proposed by (Lankhorst, 2012). Fur-thermore, the issue of the scalability of the techniquewhich is based on pattern matching and model trans-formations is not considered and the employed RMLtechnique is highly dependent on specific usage sce-narios as well as on the respectively chosen EA lan-guage. By utilizing the data-flow analysis methodwith its inherent support for cyclic dependencies, re-cursive specifications and iterative result computa-tion, we are able to address these challenges. Thescalability of DFA (and the Model Analysis Frame-work in particular) has been demonstrated in the con-text of other domains including the analysis of exten-sive AUTOSAR models (Kienberger et al., 2014).
For a practical evaluation, we implemented theproposed methods in the form of an addin for MID In-novator (MID GmbH, 2014) using the MIDWagen ex-ample which is shipped with the tooling. MIDWagendescribes the IT landscape of a car rental organizationwith its actors, business services, business processes,application components and services as well as therequired infrastructure components and services. Al-though it is not a real world example, the level of de-tail and the extensibility of the underlying EA lan-guage enables a thorough evaluation of the viabilityand the robustness of our technique.
To illustrate the application of our approach, wefocus on a modification of the Booking System. Weassume that this component, which is responsible forpayment transactions, has to be modified due to secu-
Context-Sensitive Impact Analysis for Enterprise Architecture Management
53
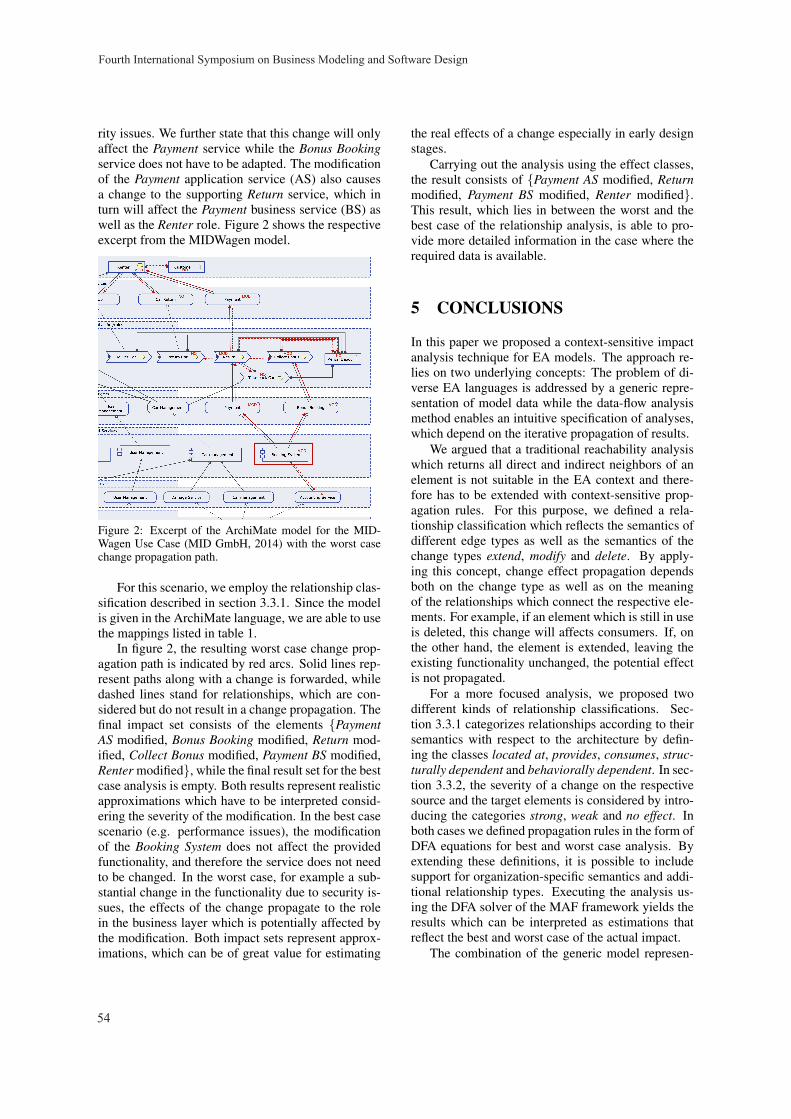
rity issues. We further state that this change will onlyaffect the Payment service while the Bonus Bookingservice does not have to be adapted. The modificationof the Payment application service (AS) also causesa change to the supporting Return service, which inturn will affect the Payment business service (BS) aswell as the Renter role. Figure 2 shows the respectiveexcerpt from the MIDWagen model.
Figure 2: Excerpt of the ArchiMate model for the MID-Wagen Use Case (MID GmbH, 2014) with the worst casechange propagation path.
For this scenario, we employ the relationship clas-sification described in section 3.3.1. Since the modelis given in the ArchiMate language, we are able to usethe mappings listed in table 1.
In figure 2, the resulting worst case change prop-agation path is indicated by red arcs. Solid lines rep-resent paths along with a change is forwarded, whiledashed lines stand for relationships, which are con-sidered but do not result in a change propagation. Thefinal impact set consists of the elements {PaymentAS modified, Bonus Booking modified, Return mod-ified, Collect Bonus modified, Payment BS modified,Renter modified}, while the final result set for the bestcase analysis is empty. Both results represent realisticapproximations which have to be interpreted consid-ering the severity of the modification. In the best casescenario (e.g. performance issues), the modificationof the Booking System does not affect the providedfunctionality, and therefore the service does not needto be changed. In the worst case, for example a sub-stantial change in the functionality due to security is-sues, the effects of the change propagate to the rolein the business layer which is potentially affected bythe modification. Both impact sets represent approx-imations, which can be of great value for estimating
the real effects of a change especially in early designstages.
Carrying out the analysis using the effect classes,the result consists of {Payment AS modified, Returnmodified, Payment BS modified, Renter modified}.This result, which lies in between the worst and thebest case of the relationship analysis, is able to pro-vide more detailed information in the case where therequired data is available.
5 CONCLUSIONS
In this paper we proposed a context-sensitive impactanalysis technique for EA models. The approach re-lies on two underlying concepts: The problem of di-verse EA languages is addressed by a generic repre-sentation of model data while the data-flow analysismethod enables an intuitive specification of analyses,which depend on the iterative propagation of results.
We argued that a traditional reachability analysiswhich returns all direct and indirect neighbors of anelement is not suitable in the EA context and there-fore has to be extended with context-sensitive prop-agation rules. For this purpose, we defined a rela-tionship classification which reflects the semantics ofdifferent edge types as well as the semantics of thechange types extend, modify and delete. By apply-ing this concept, change effect propagation dependsboth on the change type as well as on the meaningof the relationships which connect the respective ele-ments. For example, if an element which is still in useis deleted, this change will affects consumers. If, onthe other hand, the element is extended, leaving theexisting functionality unchanged, the potential effectis not propagated.
For a more focused analysis, we proposed twodifferent kinds of relationship classifications. Sec-tion 3.3.1 categorizes relationships according to theirsemantics with respect to the architecture by defin-ing the classes located at, provides, consumes, struc-turally dependent and behaviorally dependent. In sec-tion 3.3.2, the severity of a change on the respectivesource and the target elements is considered by intro-ducing the categories strong, weak and no effect. Inboth cases we defined propagation rules in the form ofDFA equations for best and worst case analysis. Byextending these definitions, it is possible to includesupport for organization-specific semantics and addi-tional relationship types. Executing the analysis us-ing the DFA solver of the MAF framework yields theresults which can be interpreted as estimations thatreflect the best and worst case of the actual impact.
The combination of the generic model represen-
Fourth International Symposium on Business Modeling and Software Design
54
tations, extensible DFA-based analysis specificationsand the classification approach for relationships en-sures that this technique can be applied to the variousEA conventions found in different organizations. Fur-ther work has to be done to determine a suitable visu-alization of the results. It would also be interesting toevaluate rules for other impact scenarios such as fail-ure impact analysis which analyzes the availability ofarchitecture elements. Finally, it should be exploredhow the computation of best and worst case resultscould be improved through an integration of proba-bility distributions. At the moment we only support asimple and naive way for the integration of probabili-ties.
ACKNOWLEDGEMENTS
This work was partially sponsered by the FuE-Programm Informations- und Kommunikationstech-nik Bayern. The authors would like to thank MIDGmbH for providing their demo use case, licenses fortheir tool as well as for their support during the im-plementation.
REFERENCES
Aryani, A., Peake, I., and Hamilton, M. (2010). Domain-based change propagation analysis: An enterprise sys-tem case study. In 2010 IEEE International Confer-ence on Software Maintenance (ICSM), pages 1–9.
Bohner, S. (2002). Software change impacts-an evolvingperspective. In International Conference on SoftwareMaintenance, 2002. Proceedings, pages 263–272.
Briand, L., Labiche, Y., and O’Sullivan, L. (2003). Impactanalysis and change management of UML models. InInternational Conference on Software Maintenance,2003. ICSM 2003. Proceedings, pages 256–265.
Buckl, S., Ernst, A., Lankes, J., and Matthes, F. (2008).Enterprise Architecture Management Pattern Catalog(Version 1.0). Technical Report TB 0801, TechnicalUniversity Munich, Chair for Informatics 19.
de Boer, F., Bonsangue, M., Groenewegen, L., Stam, A.,Stevens, S., and van der Torre, L. (2005). Changeimpact analysis of enterprise architectures. In Infor-mation Reuse and Integration, Conf, 2005. IRI -2005IEEE International Conference on., pages 177 – 181.
Holschke, O., Nrman, P., Flores, W., Eriksson, E., andSchnherr, M. (2009). Using enterprise architecturemodels and bayesian belief networks for failure im-pact analysis. In Service-Oriented ComputingICSOC2008 Workshops, page 339350.
Jonkers, H. and Iacob, M.-E. (2009). Performance andcost analysis of service-oriented enterprise architec-tures. Global Implications of Modern Enterprise In-
formation Systems: Technologies and Applications,IGI Global.
Kienberger, J., Minnerup, P., Kuntz, S., and Bauer, B.(2014). Analysis and Validation of AUTOSAR Mod-els.
Kumar, A., Raghavan, P., Ramanathan, J., and Ramnath, R.(2008). Enterprise Interaction Ontology for ChangeImpact Analysis of Complex Systems. In IEEE Asia-Pacific Services Computing Conference, 2008. AP-SCC ’08, pages 303 –309.
Kurpjuweit, S. and Aier, S. (2009). Ein allgemeinerAnsatz zur Ableitung von Abhngigkeitsanalysen aufUnternehmensarchitekturmodellen. Wirtschaftinfor-matik Proceedings 2009.
Lankhorst, M. (2012). Enterprise Architecture at Work.Springer-Verlag Berlin and Heidelberg GmbH & Co.KG, Berlin.
Lehnert, S. (2011). A review of software change impactanalysis. Ilmenau University of Technology, Tech.Rep.
Matthes, F., Monahov, I., Schneider, A., and Schulz, C.(2012). EAM KPI Catalog v 1.0. Technical report,Technical University Munich.
MID GmbH (2014). MID Innovator for Enterprise Ar-chitects. in: http://www.mid.de/produkte/innovator-enterprise-modeling.html, accessed 15/04/2014.
Narman, P., Buschle, M., and Ekstedt, M. (2012). An enter-prise architecture framework for multi-attribute infor-mation systems analysis. Software & Systems Model-ing, pages 1–32.
Niemann, K. D. (2006). From enterprise architecture to ITgovernance. Springer.
Saad, C. and Bauer, B. (2011). The Model Analysis Frame-work - An IDE for Static Model Analysis. In Pro-ceedings of the Industry Track of Software LanguageEngineering (ITSLE) in the context of the 4th Interna-tional Conference on Software Language Engineering(SLE’11).
Saad, C. and Bauer, B. (2013). Data-flow based ModelAnalysis and its Applications. In Proceedings of the16th International Conference on Model Driven Engi-neering Languages and Systems (MoDELS’13).
Saat, J. (2010). Zeitbezogene Abhangigkeitsanalysender Unternehmensarchitektur. MultikonferenzWirtschaftsinformatik 2010, page 29.
Tang, A., Nicholson, A., Jin, Y., and Han, J. (2007). Usingbayesian belief networks for change impact analysis inarchitecture design. Journal of Systems and Software,80(1):127148.
The Open Group (2012). ArchiMate 2.0 specification: OpenGroup Standard. Van Haren Publishing.
U.S. Department of Defense (2010). The DoDAFArchitecture Framework Version 2.02. in:http://dodcio.defense.gov/dodaf20.aspx, accessed15/03/2015.
von Knethen, A. and Grund, M. (2003). QuaTrace: atool environment for (semi-) automatic impact analy-sis based on traces. In International Conference onSoftware Maintenance, 2003. ICSM 2003. Proceed-ings, pages 246–255.
Context-Sensitive Impact Analysis for Enterprise Architecture Management
55
The Intertwinement of Architectural Governance and Enterprise IT-Architecture
Enterprise IT-Architecture Viewed as Boundary Object from a Complex Adaptive Systems View
Marijn Janssen Faculty of Technology, Policy & Management, Delft University of Technology, Jaffalaan 5, Delft, The Netherlands
Keywords: Enterprise Architecture, IT-Architecture, Governance, Architectural Governance, Organizational Networks, Public-private Networks, Business Networks, Boundary Objects, Complex Adaptive Systems.
Abstract: Organizations collaborate more and more in networks in which the boundaries between organizations are flux to changes. The collaborating organizations have various degrees of technology-readiness, capabilities, heterogeneous systems and processes which are developed over time. Despite these differences these organizations have to work together in a loosely coupled structure, where the overall process performance depends on the weakest chain. This paper explores the intertwinement of governance and enterprise IT-architecture (EA) by adopting a complex adaptive systems perspective and viewing EA as boundary object. Architects can act as boundary spanners and architectural models and documents as boundary artefact. Both help in creating shared understanding. Governance and EA are intertwined and need to be developed in concert to realize its value. Our analysis shows that architecture and governance are mutual dependent and influence each other.
1 INTRODUCTION
Organizations cooperate more and more in networks and are exchanging information with each other. Often this is donated as organizational networks (Provan and Milward, 2001), business networks (Short and Venkatraman, 1992), public-private networks (Grimsey and Lewis, 2007). The essence is that a number of organizations work together in a loosely coupled structure which is subject to variations. Organizational network arrangements are aimed at coordinating horizontal and vertical dependencies between agencies.
Often the collaborating organizations are heterogeneous in many aspects which complicates cooperation. Each of the organizations have their own systems and their IT-architecture which has been developed independently of the other organizations. Whereas collaboration requires interoperability at all levels including the technical, syntax, semantic and pragmatic level. the pragmatic layer refers to the context-sensitive aspect of meaning (Singh, 2002).
Enterprise IT-architecture (EA) is based on
statements of how an enterprise wants to use its Information and Communication Technology (ICT) to accomplish its strategy and relate this to the vision of what ICT has to offer for the enterprise and how this should be realized. EA is an instrument to ensure that in business networks can be collaborated in an interoperability, a flexible and agile manner. EA can be used to align the own IT with the IT of other organizations and guide design decisions and new initiatives. As such, it is closely intertwined with architectural governance (AG). A lack of effective IT governance can easily result in failed development projects or lack of collaboration (Peterson, 2004). AG can be viewed as the processes and authority for decision-making concerning the use and development of EA.
Despite the significance of having governance the architecture function is often disconnected from the other parts of the enterprise. An EA identifies the main components of the enterprise, its information systems, the ways in which these components work together in order to achieve defined objectives and the way in which the systems support business processes. Architectures are meaningless if they are
56
not adopted and used. Furthermore, architectures need to be flexible and agile to incorporate new technology. Enterprise Architecture and Governance (EAG) is an upcoming field which influence the use, success and adoption of new technology. The relationship between EA and AG has been given limited attention and are influenced and shaped by each other. In this paper this relationship is further explored. In the next section we explore the literature and conclude that
2 BACKGROUND
2.1 Organizational Networks
Networks have become a form of organizing in which multiple organizations collaborate together. These organizations are often autonomous and make their own decisions. Organizations cooperation in a business network typically differ in many aspects, including. • Objectives and interests • Organization structures, • Degree of technology-readiness • Heterogeneous type systems • Set of standards and architectural choices • Service level agreements • Set of capabilities
These characteristics makes it often hard to collaborate in networks. In addition there might be differences like culture and challenges like unclear responsibilities which further complicate collaboration. Yet linking among organizations is vital, because the connect organizations to one another.
2.2 Enterprise IT-Architecture
Enterprise IT-architecture (EA) aims to bridge the gap between organizational and technology aspects by looking at various levels of abstraction and adopting different stakeholder views (Zachman, 1987). EA can describe or prescribe the dependencies among a large number of heterogeneous elements to ensure that these elements are addressed. In this way, EA can guide design decisions and provide direction for progressing towards a next generation infrastructure (Janssen et al., 2009).
In essence, EA should address the dependencies among a large number of heterogeneous elements at both the organizational and technical levels (Doucet
et al., 2008). Traditionally, the purpose is to effectively align the strategies of enterprises with their business processes and the coordination of their resources (Zachman, 1987). EAs define and interrelate data, hardware, software, and communication resources, as well as the supporting organization required to maintain the overall physical structure required by the architecture (Richardson et al., 1990). The primary strength of the EA approach is that it has well-defined concepts and instruments to control and develop complex, technological systems. Nevertheless, much of the past research on EA can be criticized for taking a technologist view or being too abstract. Architecture models, principles and standards make up the content of EA (e.g. Simon et al., 2013, Janssen and Hjort-Madsen, 2007).
2.3 Architectural Governance
Architecture and governance are viewed as interrelated for a long time. Spewak (1992) introduces architecture as a process. Architecture as a process giving directions to the development of a system. In contrast, architecture as an instrument is a blueprint describing the relationships among the components in the system. The Architecture as a process view looks at how the architecture is used as an organizational routine to shape information projects.
Governance represents the framework for decision rights and accountabilities to encourage desirable behaviour in the use of resources (Weill, 2004). Architectural Governance is necessary for creating, designing, assembling, maintaining and exploiting EA. Once the decision to introduce a EA is made a coordinated set of governance mechanisms is necessary. Architects and managers will follow these governance mechanisms on a daily basis to guide EA development and maintenance.
In general there are three kinds of governance mechanisms: (1) decision-making structures, (2) alignment processes and (3) formal communications (Weill and Ross, 2005). Decision-making structures refer to the organisational committees and roles for decision-making. Alignment processes are management techniques for securing widespread and effective involvement in the architecture use, the making of architectural decisions and EA implementation. This includes the way the EA function is funded. Formal communications is about the communication between EA function and the other parts of the organization and should ensure a good relationships between the both of them.
The Intertwinement of Architectural Governance and Enterprise IT-Architecture - Enterprise IT-Architecture Viewed asBoundary Object from a Complex Adaptive Systems View
57
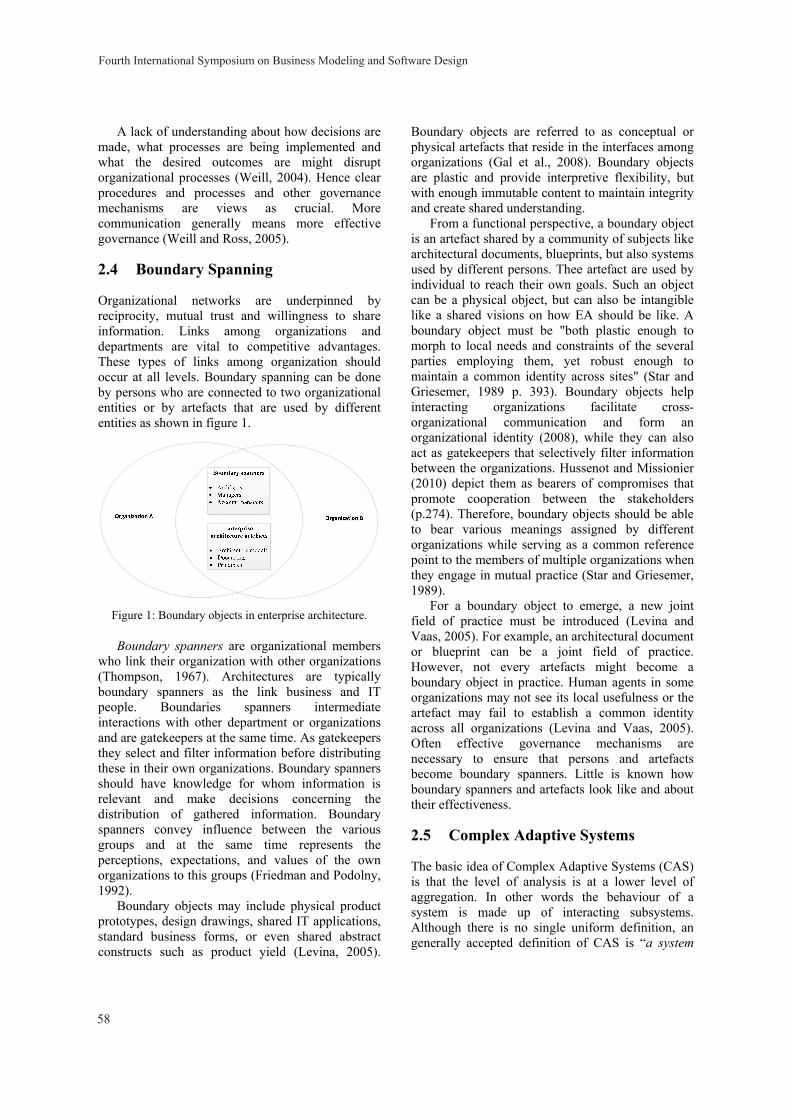
A lack of understanding about how decisions are made, what processes are being implemented and what the desired outcomes are might disrupt organizational processes (Weill, 2004). Hence clear procedures and processes and other governance mechanisms are views as crucial. More communication generally means more effective governance (Weill and Ross, 2005).
2.4 Boundary Spanning
Organizational networks are underpinned by reciprocity, mutual trust and willingness to share information. Links among organizations and departments are vital to competitive advantages. These types of links among organization should occur at all levels. Boundary spanning can be done by persons who are connected to two organizational entities or by artefacts that are used by different entities as shown in figure 1.
Figure 1: Boundary objects in enterprise architecture.
Boundary spanners are organizational members who link their organization with other organizations (Thompson, 1967). Architectures are typically boundary spanners as the link business and IT people. Boundaries spanners intermediate interactions with other department or organizations and are gatekeepers at the same time. As gatekeepers they select and filter information before distributing these in their own organizations. Boundary spanners should have knowledge for whom information is relevant and make decisions concerning the distribution of gathered information. Boundary spanners convey influence between the various groups and at the same time represents the perceptions, expectations, and values of the own organizations to this groups (Friedman and Podolny, 1992).
Boundary objects may include physical product prototypes, design drawings, shared IT applications, standard business forms, or even shared abstract constructs such as product yield (Levina, 2005).
Boundary objects are referred to as conceptual or physical artefacts that reside in the interfaces among organizations (Gal et al., 2008). Boundary objects are plastic and provide interpretive flexibility, but with enough immutable content to maintain integrity and create shared understanding.
From a functional perspective, a boundary object is an artefact shared by a community of subjects like architectural documents, blueprints, but also systems used by different persons. Thee artefact are used by individual to reach their own goals. Such an object can be a physical object, but can also be intangible like a shared visions on how EA should be like. A boundary object must be "both plastic enough to morph to local needs and constraints of the several parties employing them, yet robust enough to maintain a common identity across sites" (Star and Griesemer, 1989 p. 393). Boundary objects help interacting organizations facilitate cross-organizational communication and form an organizational identity (2008), while they can also act as gatekeepers that selectively filter information between the organizations. Hussenot and Missionier (2010) depict them as bearers of compromises that promote cooperation between the stakeholders (p.274). Therefore, boundary objects should be able to bear various meanings assigned by different organizations while serving as a common reference point to the members of multiple organizations when they engage in mutual practice (Star and Griesemer, 1989).
For a boundary object to emerge, a new joint field of practice must be introduced (Levina and Vaas, 2005). For example, an architectural document or blueprint can be a joint field of practice. However, not every artefacts might become a boundary object in practice. Human agents in some organizations may not see its local usefulness or the artefact may fail to establish a common identity across all organizations (Levina and Vaas, 2005). Often effective governance mechanisms are necessary to ensure that persons and artefacts become boundary spanners. Little is known how boundary spanners and artefacts look like and about their effectiveness.
2.5 Complex Adaptive Systems
The basic idea of Complex Adaptive Systems (CAS) is that the level of analysis is at a lower level of aggregation. In other words the behaviour of a system is made up of interacting subsystems. Although there is no single uniform definition, an generally accepted definition of CAS is “a system
Fourth International Symposium on Business Modeling and Software Design
58
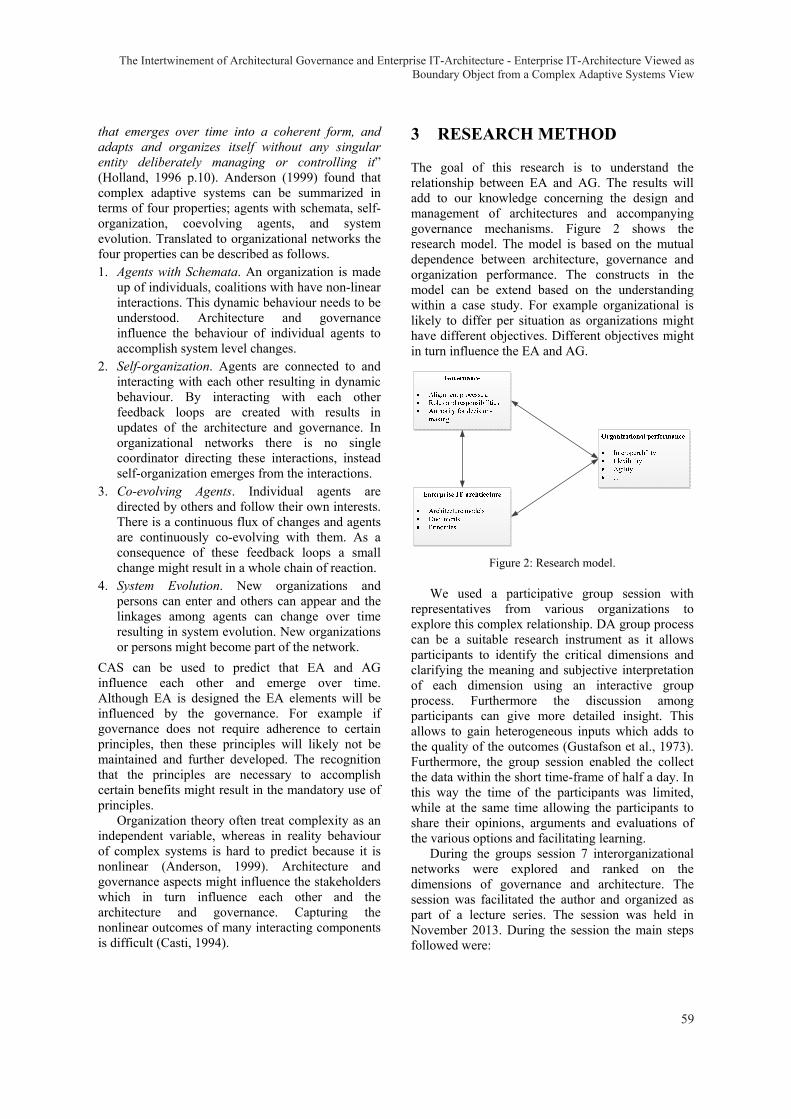
that emerges over time into a coherent form, and adapts and organizes itself without any singular entity deliberately managing or controlling it” (Holland, 1996 p.10). Anderson (1999) found that complex adaptive systems can be summarized in terms of four properties; agents with schemata, self-organization, coevolving agents, and system evolution. Translated to organizational networks the four properties can be described as follows. 1. Agents with Schemata. An organization is made
up of individuals, coalitions with have non-linear interactions. This dynamic behaviour needs to be understood. Architecture and governance influence the behaviour of individual agents to accomplish system level changes.
2. Self-organization. Agents are connected to and interacting with each other resulting in dynamic behaviour. By interacting with each other feedback loops are created with results in updates of the architecture and governance. In organizational networks there is no single coordinator directing these interactions, instead self-organization emerges from the interactions.
3. Co-evolving Agents. Individual agents are directed by others and follow their own interests. There is a continuous flux of changes and agents are continuously co-evolving with them. As a consequence of these feedback loops a small change might result in a whole chain of reaction.
4. System Evolution. New organizations and persons can enter and others can appear and the linkages among agents can change over time resulting in system evolution. New organizations or persons might become part of the network.
CAS can be used to predict that EA and AG influence each other and emerge over time. Although EA is designed the EA elements will be influenced by the governance. For example if governance does not require adherence to certain principles, then these principles will likely not be maintained and further developed. The recognition that the principles are necessary to accomplish certain benefits might result in the mandatory use of principles.
Organization theory often treat complexity as an independent variable, whereas in reality behaviour of complex systems is hard to predict because it is nonlinear (Anderson, 1999). Architecture and governance aspects might influence the stakeholders which in turn influence each other and the architecture and governance. Capturing the nonlinear outcomes of many interacting components is difficult (Casti, 1994).
3 RESEARCH METHOD
The goal of this research is to understand the relationship between EA and AG. The results will add to our knowledge concerning the design and management of architectures and accompanying governance mechanisms. Figure 2 shows the research model. The model is based on the mutual dependence between architecture, governance and organization performance. The constructs in the model can be extend based on the understanding within a case study. For example organizational is likely to differ per situation as organizations might have different objectives. Different objectives might in turn influence the EA and AG.
Figure 2: Research model.
We used a participative group session with representatives from various organizations to explore this complex relationship. DA group process can be a suitable research instrument as it allows participants to identify the critical dimensions and clarifying the meaning and subjective interpretation of each dimension using an interactive group process. Furthermore the discussion among participants can give more detailed insight. This allows to gain heterogeneous inputs which adds to the quality of the outcomes (Gustafson et al., 1973). Furthermore, the group session enabled the collect the data within the short time-frame of half a day. In this way the time of the participants was limited, while at the same time allowing the participants to share their opinions, arguments and evaluations of the various options and facilitating learning.
During the groups session 7 interorganizational networks were explored and ranked on the dimensions of governance and architecture. The session was facilitated the author and organized as part of a lecture series. The session was held in November 2013. During the session the main steps followed were:
The Intertwinement of Architectural Governance and Enterprise IT-Architecture - Enterprise IT-Architecture Viewed asBoundary Object from a Complex Adaptive Systems View
59
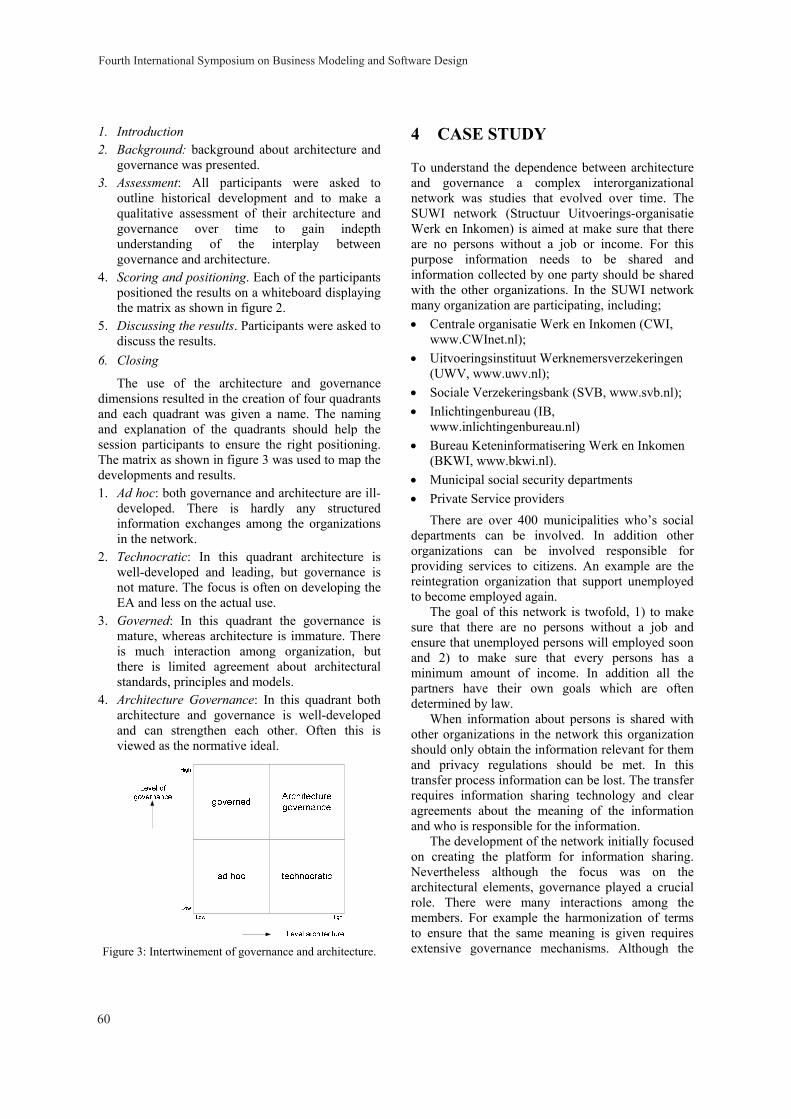
1. Introduction 2. Background: background about architecture and
governance was presented. 3. Assessment: All participants were asked to
outline historical development and to make a qualitative assessment of their architecture and governance over time to gain indepth understanding of the interplay between governance and architecture.
4. Scoring and positioning. Each of the participants positioned the results on a whiteboard displaying the matrix as shown in figure 2.
5. Discussing the results. Participants were asked to discuss the results.
6. Closing
The use of the architecture and governance dimensions resulted in the creation of four quadrants and each quadrant was given a name. The naming and explanation of the quadrants should help the session participants to ensure the right positioning. The matrix as shown in figure 3 was used to map the developments and results. 1. Ad hoc: both governance and architecture are ill-
developed. There is hardly any structured information exchanges among the organizations in the network.
2. Technocratic: In this quadrant architecture is well-developed and leading, but governance is not mature. The focus is often on developing the EA and less on the actual use.
3. Governed: In this quadrant the governance is mature, whereas architecture is immature. There is much interaction among organization, but there is limited agreement about architectural standards, principles and models.
4. Architecture Governance: In this quadrant both architecture and governance is well-developed and can strengthen each other. Often this is viewed as the normative ideal.
Figure 3: Intertwinement of governance and architecture.
4 CASE STUDY
To understand the dependence between architecture and governance a complex interorganizational network was studies that evolved over time. The SUWI network (Structuur Uitvoerings-organisatie Werk en Inkomen) is aimed at make sure that there are no persons without a job or income. For this purpose information needs to be shared and information collected by one party should be shared with the other organizations. In the SUWI network many organization are participating, including; • Centrale organisatie Werk en Inkomen (CWI,
www.CWInet.nl); • Uitvoeringsinstituut Werknemersverzekeringen
(UWV, www.uwv.nl); • Sociale Verzekeringsbank (SVB, www.svb.nl); • Inlichtingenbureau (IB,
www.inlichtingenbureau.nl) • Bureau Keteninformatisering Werk en Inkomen
(BKWI, www.bkwi.nl). • Municipal social security departments • Private Service providers
There are over 400 municipalities who’s social departments can be involved. In addition other organizations can be involved responsible for providing services to citizens. An example are the reintegration organization that support unemployed to become employed again.
The goal of this network is twofold, 1) to make sure that there are no persons without a job and ensure that unemployed persons will employed soon and 2) to make sure that every persons has a minimum amount of income. In addition all the partners have their own goals which are often determined by law.
When information about persons is shared with other organizations in the network this organization should only obtain the information relevant for them and privacy regulations should be met. In this transfer process information can be lost. The transfer requires information sharing technology and clear agreements about the meaning of the information and who is responsible for the information.
The development of the network initially focused on creating the platform for information sharing. Nevertheless although the focus was on the architectural elements, governance played a crucial role. There were many interactions among the members. For example the harmonization of terms to ensure that the same meaning is given requires extensive governance mechanisms. Although the
Fourth International Symposium on Business Modeling and Software Design
60
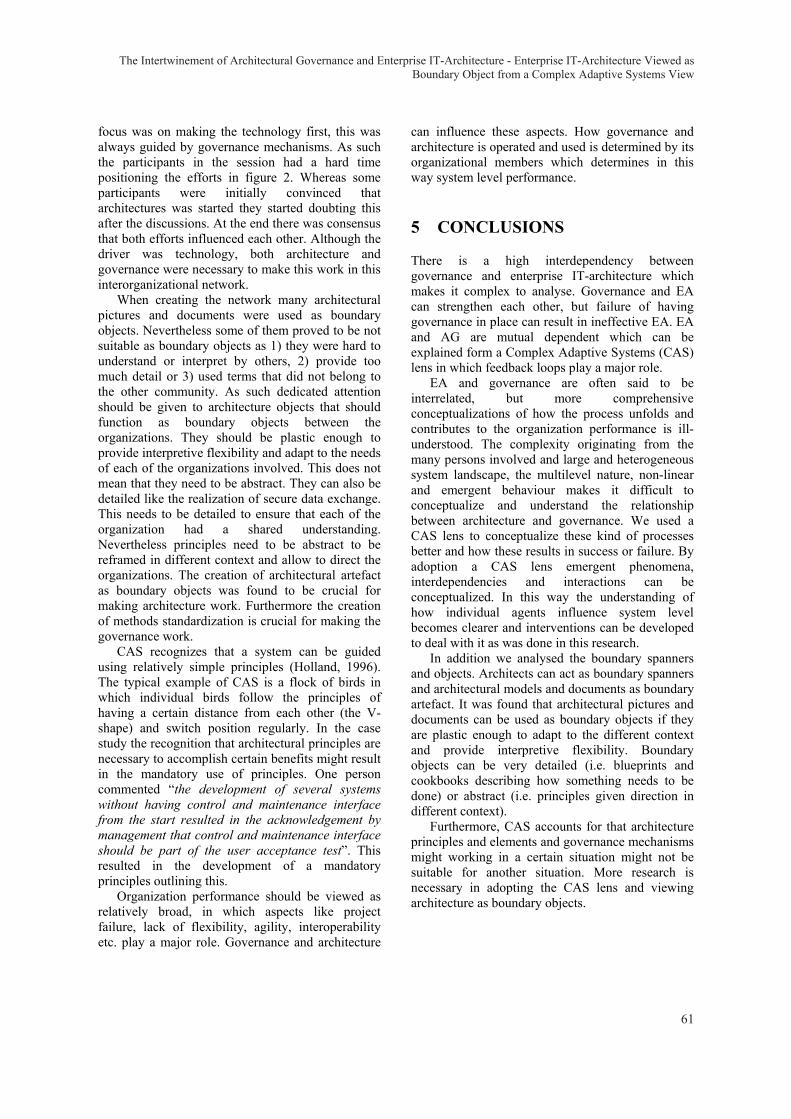
focus was on making the technology first, this was always guided by governance mechanisms. As such the participants in the session had a hard time positioning the efforts in figure 2. Whereas some participants were initially convinced that architectures was started they started doubting this after the discussions. At the end there was consensus that both efforts influenced each other. Although the driver was technology, both architecture and governance were necessary to make this work in this interorganizational network.
When creating the network many architectural pictures and documents were used as boundary objects. Nevertheless some of them proved to be not suitable as boundary objects as 1) they were hard to understand or interpret by others, 2) provide too much detail or 3) used terms that did not belong to the other community. As such dedicated attention should be given to architecture objects that should function as boundary objects between the organizations. They should be plastic enough to provide interpretive flexibility and adapt to the needs of each of the organizations involved. This does not mean that they need to be abstract. They can also be detailed like the realization of secure data exchange. This needs to be detailed to ensure that each of the organization had a shared understanding. Nevertheless principles need to be abstract to be reframed in different context and allow to direct the organizations. The creation of architectural artefact as boundary objects was found to be crucial for making architecture work. Furthermore the creation of methods standardization is crucial for making the governance work.
CAS recognizes that a system can be guided using relatively simple principles (Holland, 1996). The typical example of CAS is a flock of birds in which individual birds follow the principles of having a certain distance from each other (the V-shape) and switch position regularly. In the case study the recognition that architectural principles are necessary to accomplish certain benefits might result in the mandatory use of principles. One person commented “the development of several systems without having control and maintenance interface from the start resulted in the acknowledgement by management that control and maintenance interface should be part of the user acceptance test”. This resulted in the development of a mandatory principles outlining this.
Organization performance should be viewed as relatively broad, in which aspects like project failure, lack of flexibility, agility, interoperability etc. play a major role. Governance and architecture
can influence these aspects. How governance and architecture is operated and used is determined by its organizational members which determines in this way system level performance.
5 CONCLUSIONS
There is a high interdependency between governance and enterprise IT-architecture which makes it complex to analyse. Governance and EA can strengthen each other, but failure of having governance in place can result in ineffective EA. EA and AG are mutual dependent which can be explained form a Complex Adaptive Systems (CAS) lens in which feedback loops play a major role.
EA and governance are often said to be interrelated, but more comprehensive conceptualizations of how the process unfolds and contributes to the organization performance is ill-understood. The complexity originating from the many persons involved and large and heterogeneous system landscape, the multilevel nature, non-linear and emergent behaviour makes it difficult to conceptualize and understand the relationship between architecture and governance. We used a CAS lens to conceptualize these kind of processes better and how these results in success or failure. By adoption a CAS lens emergent phenomena, interdependencies and interactions can be conceptualized. In this way the understanding of how individual agents influence system level becomes clearer and interventions can be developed to deal with it as was done in this research.
In addition we analysed the boundary spanners and objects. Architects can act as boundary spanners and architectural models and documents as boundary artefact. It was found that architectural pictures and documents can be used as boundary objects if they are plastic enough to adapt to the different context and provide interpretive flexibility. Boundary objects can be very detailed (i.e. blueprints and cookbooks describing how something needs to be done) or abstract (i.e. principles given direction in different context).
Furthermore, CAS accounts for that architecture principles and elements and governance mechanisms might working in a certain situation might not be suitable for another situation. More research is necessary in adopting the CAS lens and viewing architecture as boundary objects.
The Intertwinement of Architectural Governance and Enterprise IT-Architecture - Enterprise IT-Architecture Viewed asBoundary Object from a Complex Adaptive Systems View
61

REFERENCES
Anderson, P. 1999. Complexity theory and organization science. Organization Science, 10, 216-232.
Casti, J. 1994. Complexification: Explaining a Paradoxical World Through the Science of Surprise, New York, HarperCollins.
Doucet, G., Gøtze, J., Saha, P. & Bernard, S. 2008. Coherency Management: Using Enterprise Architecture for Alignment, Agility, and Assurance. Journal of Enterprise Architecture, 4, 9-20.
Friedman, R. A. & Podolny, J. 1992. Differentiation of boundary spanning roles: labor negotiations and implications for role conflict Administrative Science Quarterly, 37, 28-47.
Gal, U., Lyytinen, K. & Yoo, Y. 2008. The dynamics of IT boundary objects, information infrastructures, and organisational identities: the introduction of 3D modelling technologies into the architecture, engineering, and construction industry. European Journal of Information Systems, 17, 290-304.
Grimsey, D. & Lewis, M. K. 2007. Public Private Partnerships: The Worldwide Revolution in Infrastructure Provision and Project Finance, Cheltenham, UK, Edward Elgar Publishing Limited.
Gustafson, D. H., R.K., S., L., D. A. & G.W., W. 1973. A comparative study of differences in subjective likelihood estimates made by individuals, interacting groups, Delphi groups, and nominal groups. Organizational Behavior and Human Performance, 9, 280-291.
Holland, J. H. 1996. Hidden order. How adaptation creates complexity, Reading, MA, Addison Wesley.
Hussenot, A. & Missonier, S. 2010. A deeper understanding of evolution of the role of the object in organizational process: The concept of “mediation object”. Journal of Organizational Change Management, 23, 269-286.
Janssen, M., Chun, S. A. & Gil-Garcia, J. R. 2009. Building the next generation of digital government infrastructures Government Information Quarterly, 26, 233-237.
Janssen, M. & Hjort-Madsen, K. 2007. Analyzing Enterprise Architecture in National Governments: The Cases of Denmark and the Netherlands. In: SPRAGUE, R. (ed.) 40th Annual Hawaii International Conference on System Sciences (HICSS'07). Big Island, Hawaii: IEEE.
Levina, N. 2005. Collaborating on Multiparty Information Systems Development Projects: A Collective Reflection-in-Action View. Information Systems Research, 16, 109–130.
Levina, N. & Vaas, E. 2005. The Emergence of Boundary Spanning Competence in Practice: Implications for Implementation and Use of Information Systems. MIS Quarterly, 29, 335-363.
Peterson, R. 2004. Crafting Information Technology Governance. Information Systems Management, 21, 7-22.
Provan, K. G. & Milward, H. B. 2001. Do Networks Really Work? A Framework for Evaluating Public-Sector Organizational Networks. Public Administration Review, 61, 414-423.
Richardson, L., Jackson, B. M. & Dickson, G. 1990. A Principle-Based Enterprise Architecture: Lessons From Texaco and Star Enterprise. MIS Quarterly, 14, 385-403.
Short, J. & Venkatraman, N. 1992. Beyond business process redesign: redefining Baxter's business network. Sloan Management Review, 34, 7-21.
Simon, D., Fischbach, K. & Schoder, D. 2013. An Exploration of Enterprise Architecture Research. Communications of The Association for Information Systems, 32, 1-72,.
Singh M. P. 2002. The pragmatic web. IEEE Internet Computing, 6, 4-5.
Spewak, S. H. 1992. Enterprise architecture planning. Developing a blueprint for data, applications and Technology, New York, John Wiley.
Star, S. L. & Griesemer, J. R. 1989. Institutional ecology, ‘translations’ and boundary objects: amateurs and professionals in Berkeley’s museum of vertebrate zoology, 1907-1939. Social Studies of Science, 19, 387-420.
Thompson, J. D. 1967. Organizations in Action, New York, McGraw-Hill.
Weill, P. 2004. Don’t Just Lead, Govern: How best Performing Organisations Govern IT. MIS Quarterly Executive, 3, 1-17.
Weill, P. & Ross, J. W. 2005. A matrixed approach to designing IT governance. MIT Sloan Management Review, 46, 26-34.
Zachman, J. A. 1987. A Framework for Information Systems Architecture. IBM Systems Journal, 26, 276-292.
Fourth International Symposium on Business Modeling and Software Design
62
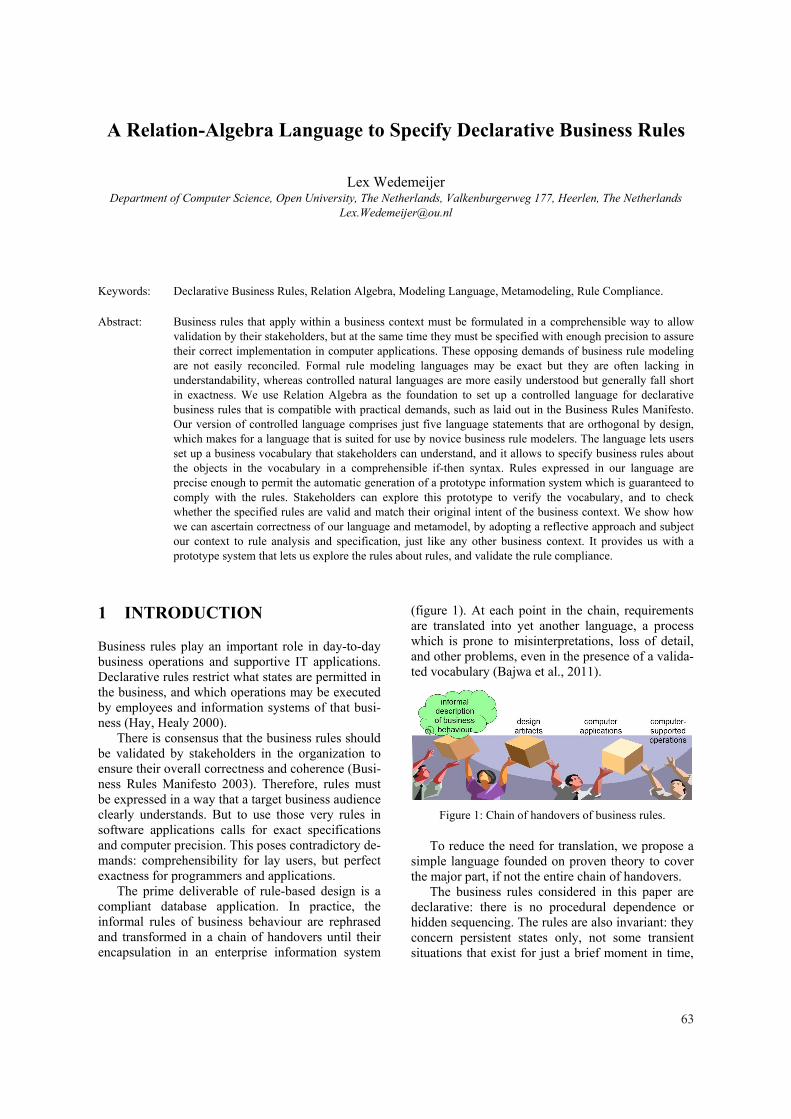
A Relation-Algebra Language to Specify Declarative Business Rules
Lex Wedemeijer Department of Computer Science, Open University, The Netherlands, Valkenburgerweg 177, Heerlen, The Netherlands
Keywords: Declarative Business Rules, Relation Algebra, Modeling Language, Metamodeling, Rule Compliance.
Abstract: Business rules that apply within a business context must be formulated in a comprehensible way to allow validation by their stakeholders, but at the same time they must be specified with enough precision to assure their correct implementation in computer applications. These opposing demands of business rule modeling are not easily reconciled. Formal rule modeling languages may be exact but they are often lacking in understandability, whereas controlled natural languages are more easily understood but generally fall short in exactness. We use Relation Algebra as the foundation to set up a controlled language for declarative business rules that is compatible with practical demands, such as laid out in the Business Rules Manifesto. Our version of controlled language comprises just five language statements that are orthogonal by design, which makes for a language that is suited for use by novice business rule modelers. The language lets users set up a business vocabulary that stakeholders can understand, and it allows to specify business rules about the objects in the vocabulary in a comprehensible if-then syntax. Rules expressed in our language are precise enough to permit the automatic generation of a prototype information system which is guaranteed to comply with the rules. Stakeholders can explore this prototype to verify the vocabulary, and to check whether the specified rules are valid and match their original intent of the business context. We show how we can ascertain correctness of our language and metamodel, by adopting a reflective approach and subject our context to rule analysis and specification, just like any other business context. It provides us with a prototype system that lets us explore the rules about rules, and validate the rule compliance.
1 INTRODUCTION
Business rules play an important role in day-to-day business operations and supportive IT applications. Declarative rules restrict what states are permitted in the business, and which operations may be executed by employees and information systems of that busi-ness (Hay, Healy 2000).
There is consensus that the business rules should be validated by stakeholders in the organization to ensure their overall correctness and coherence (Busi-ness Rules Manifesto 2003). Therefore, rules must be expressed in a way that a target business audience clearly understands. But to use those very rules in software applications calls for exact specifications and computer precision. This poses contradictory de-mands: comprehensibility for lay users, but perfect exactness for programmers and applications.
The prime deliverable of rule-based design is a compliant database application. In practice, the informal rules of business behaviour are rephrased and transformed in a chain of handovers until their encapsulation in an enterprise information system
(figure 1). At each point in the chain, requirements are translated into yet another language, a process which is prone to misinterpretations, loss of detail, and other problems, even in the presence of a valida-ted vocabulary (Bajwa et al., 2011).
Figure 1: Chain of handovers of business rules.
To reduce the need for translation, we propose a simple language founded on proven theory to cover the major part, if not the entire chain of handovers.
The business rules considered in this paper are declarative: there is no procedural dependence or hidden sequencing. The rules are also invariant: they concern persistent states only, not some transient situations that exist for just a brief moment in time,
63
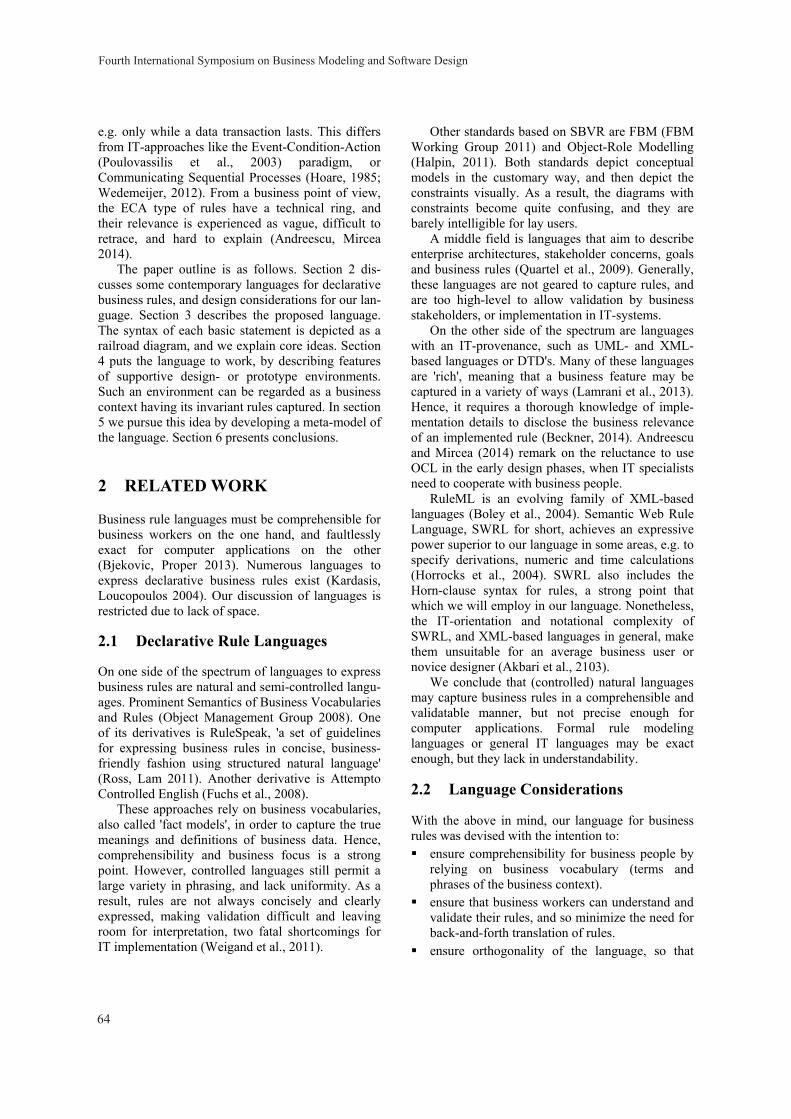
e.g. only while a data transaction lasts. This differs from IT-approaches like the Event-Condition-Action (Poulovassilis et al., 2003) paradigm, or Communicating Sequential Processes (Hoare, 1985; Wedemeijer, 2012). From a business point of view, the ECA type of rules have a technical ring, and their relevance is experienced as vague, difficult to retrace, and hard to explain (Andreescu, Mircea 2014).
The paper outline is as follows. Section 2 dis-cusses some contemporary languages for declarative business rules, and design considerations for our lan-guage. Section 3 describes the proposed language. The syntax of each basic statement is depicted as a railroad diagram, and we explain core ideas. Section 4 puts the language to work, by describing features of supportive design- or prototype environments. Such an environment can be regarded as a business context having its invariant rules captured. In section 5 we pursue this idea by developing a meta-model of the language. Section 6 presents conclusions.
2 RELATED WORK
Business rule languages must be comprehensible for business workers on the one hand, and faultlessly exact for computer applications on the other (Bjekovic, Proper 2013). Numerous languages to express declarative business rules exist (Kardasis, Loucopoulos 2004). Our discussion of languages is restricted due to lack of space.
2.1 Declarative Rule Languages
On one side of the spectrum of languages to express business rules are natural and semi-controlled langu-ages. Prominent Semantics of Business Vocabularies and Rules (Object Management Group 2008). One of its derivatives is RuleSpeak, 'a set of guidelines for expressing business rules in concise, business-friendly fashion using structured natural language' (Ross, Lam 2011). Another derivative is Attempto Controlled English (Fuchs et al., 2008).
These approaches rely on business vocabularies, also called 'fact models', in order to capture the true meanings and definitions of business data. Hence, comprehensibility and business focus is a strong point. However, controlled languages still permit a large variety in phrasing, and lack uniformity. As a result, rules are not always concisely and clearly expressed, making validation difficult and leaving room for interpretation, two fatal shortcomings for IT implementation (Weigand et al., 2011).
Other standards based on SBVR are FBM (FBM Working Group 2011) and Object-Role Modelling (Halpin, 2011). Both standards depict conceptual models in the customary way, and then depict the constraints visually. As a result, the diagrams with constraints become quite confusing, and they are barely intelligible for lay users.
A middle field is languages that aim to describe enterprise architectures, stakeholder concerns, goals and business rules (Quartel et al., 2009). Generally, these languages are not geared to capture rules, and are too high-level to allow validation by business stakeholders, or implementation in IT-systems.
On the other side of the spectrum are languages with an IT-provenance, such as UML- and XML-based languages or DTD's. Many of these languages are 'rich', meaning that a business feature may be captured in a variety of ways (Lamrani et al., 2013). Hence, it requires a thorough knowledge of imple-mentation details to disclose the business relevance of an implemented rule (Beckner, 2014). Andreescu and Mircea (2014) remark on the reluctance to use OCL in the early design phases, when IT specialists need to cooperate with business people.
RuleML is an evolving family of XML-based languages (Boley et al., 2004). Semantic Web Rule Language, SWRL for short, achieves an expressive power superior to our language in some areas, e.g. to specify derivations, numeric and time calculations (Horrocks et al., 2004). SWRL also includes the Horn-clause syntax for rules, a strong point that which we will employ in our language. Nonetheless, the IT-orientation and notational complexity of SWRL, and XML-based languages in general, make them unsuitable for an average business user or novice designer (Akbari et al., 2103).
We conclude that (controlled) natural languages may capture business rules in a comprehensible and validatable manner, but not precise enough for computer applications. Formal rule modeling languages or general IT languages may be exact enough, but they lack in understandability.
2.2 Language Considerations
With the above in mind, our language for business rules was devised with the intention to: ensure comprehensibility for business people by
relying on business vocabulary (terms and phrases of the business context).
ensure that business workers can understand and validate their rules, and so minimize the need for back-and-forth translation of rules.
ensure orthogonality of the language, so that
Fourth International Symposium on Business Modeling and Software Design
64
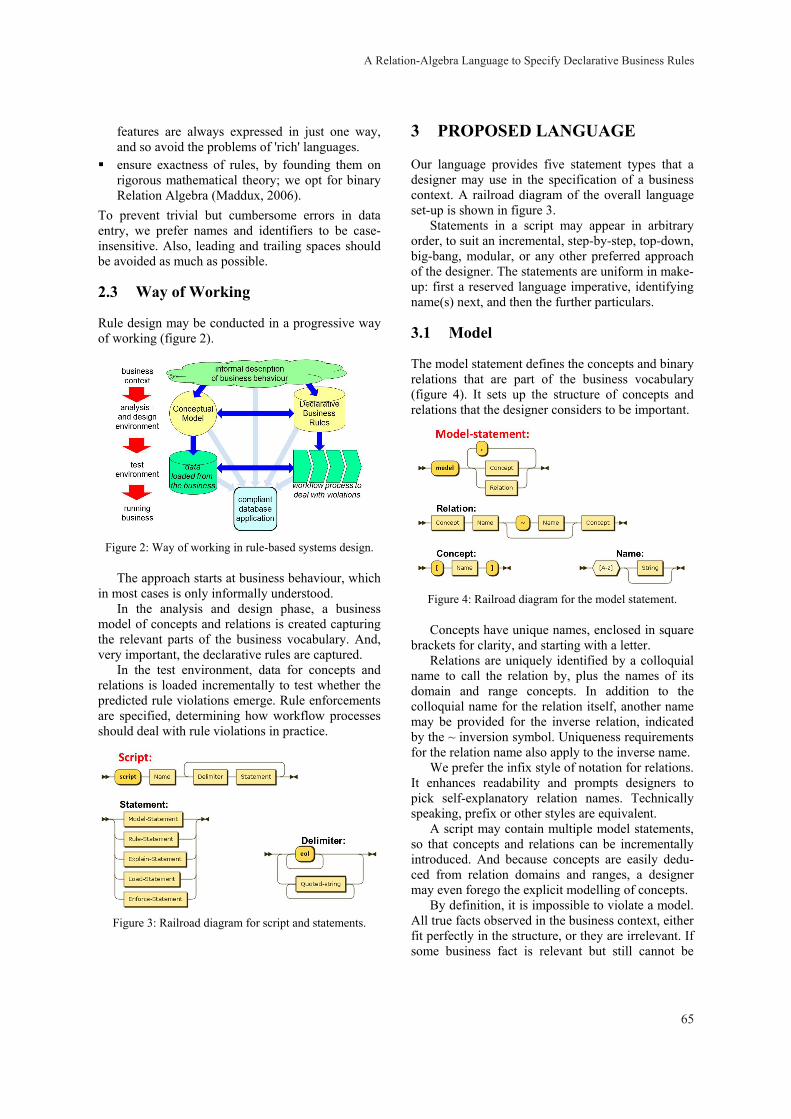
features are always expressed in just one way, and so avoid the problems of 'rich' languages.
ensure exactness of rules, by founding them on rigorous mathematical theory; we opt for binary Relation Algebra (Maddux, 2006).
To prevent trivial but cumbersome errors in data entry, we prefer names and identifiers to be case-insensitive. Also, leading and trailing spaces should be avoided as much as possible.
2.3 Way of Working
Rule design may be conducted in a progressive way of working (figure 2).
Figure 2: Way of working in rule-based systems design.
The approach starts at business behaviour, which in most cases is only informally understood.
In the analysis and design phase, a business model of concepts and relations is created capturing the relevant parts of the business vocabulary. And, very important, the declarative rules are captured.
In the test environment, data for concepts and relations is loaded incrementally to test whether the predicted rule violations emerge. Rule enforcements are specified, determining how workflow processes should deal with rule violations in practice.
Figure 3: Railroad diagram for script and statements.
3 PROPOSED LANGUAGE
Our language provides five statement types that a designer may use in the specification of a business context. A railroad diagram of the overall language set-up is shown in figure 3.
Statements in a script may appear in arbitrary order, to suit an incremental, step-by-step, top-down, big-bang, modular, or any other preferred approach of the designer. The statements are uniform in make-up: first a reserved language imperative, identifying name(s) next, and then the further particulars.
3.1 Model
The model statement defines the concepts and binary relations that are part of the business vocabulary (figure 4). It sets up the structure of concepts and relations that the designer considers to be important.
Figure 4: Railroad diagram for the model statement.
Concepts have unique names, enclosed in square brackets for clarity, and starting with a letter.
Relations are uniquely identified by a colloquial name to call the relation by, plus the names of its domain and range concepts. In addition to the colloquial name for the relation itself, another name may be provided for the inverse relation, indicated by the ~ inversion symbol. Uniqueness requirements for the relation name also apply to the inverse name.
We prefer the infix style of notation for relations. It enhances readability and prompts designers to pick self-explanatory relation names. Technically speaking, prefix or other styles are equivalent.
A script may contain multiple model statements, so that concepts and relations can be incrementally introduced. And because concepts are easily dedu-ced from relation domains and ranges, a designer may even forego the explicit modelling of concepts.
By definition, it is impossible to violate a model. All true facts observed in the business context, either fit perfectly in the structure, or they are irrelevant. If some business fact is relevant but still cannot be
A Relation-Algebra Language to Specify Declarative Business Rules
65
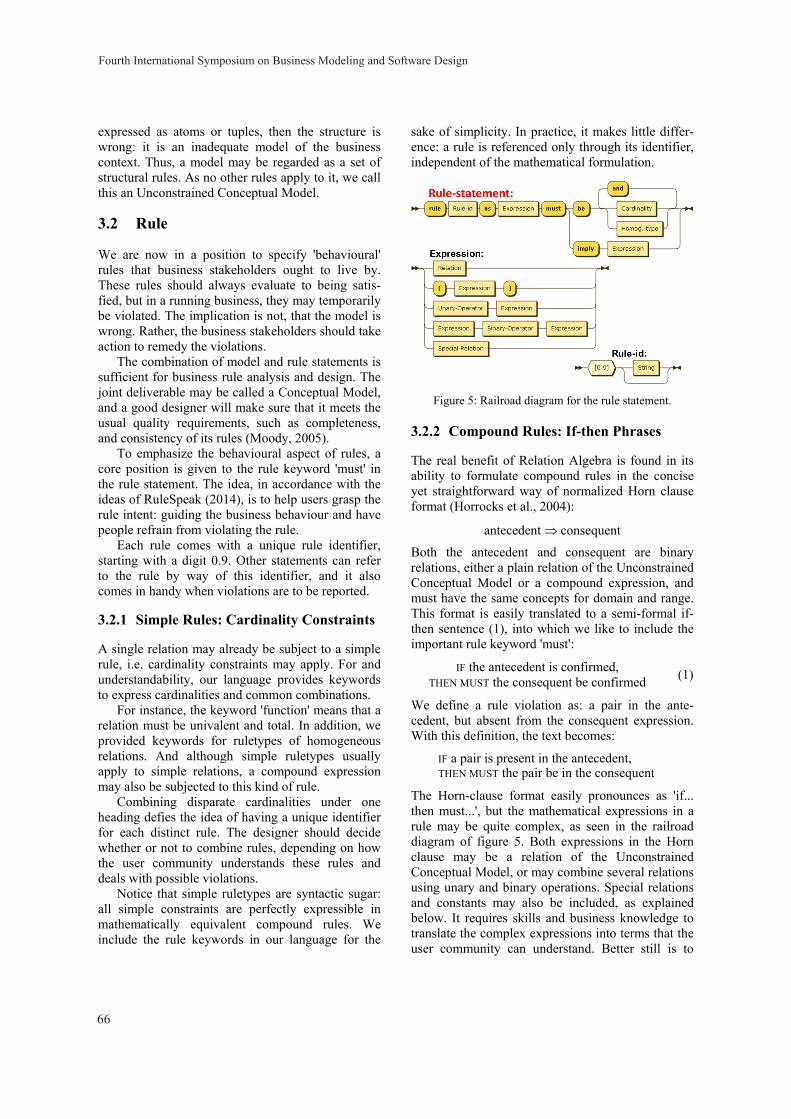
expressed as atoms or tuples, then the structure is wrong: it is an inadequate model of the business context. Thus, a model may be regarded as a set of structural rules. As no other rules apply to it, we call this an Unconstrained Conceptual Model.
3.2 Rule
We are now in a position to specify 'behavioural' rules that business stakeholders ought to live by. These rules should always evaluate to being satis-fied, but in a running business, they may temporarily be violated. The implication is not, that the model is wrong. Rather, the business stakeholders should take action to remedy the violations.
The combination of model and rule statements is sufficient for business rule analysis and design. The joint deliverable may be called a Conceptual Model, and a good designer will make sure that it meets the usual quality requirements, such as completeness, and consistency of its rules (Moody, 2005).
To emphasize the behavioural aspect of rules, a core position is given to the rule keyword 'must' in the rule statement. The idea, in accordance with the ideas of RuleSpeak (2014), is to help users grasp the rule intent: guiding the business behaviour and have people refrain from violating the rule.
Each rule comes with a unique rule identifier, starting with a digit 0.9. Other statements can refer to the rule by way of this identifier, and it also comes in handy when violations are to be reported.
3.2.1 Simple Rules: Cardinality Constraints
A single relation may already be subject to a simple rule, i.e. cardinality constraints may apply. For and understandability, our language provides keywords to express cardinalities and common combinations.
For instance, the keyword 'function' means that a relation must be univalent and total. In addition, we provided keywords for ruletypes of homogeneous relations. And although simple ruletypes usually apply to simple relations, a compound expression may also be subjected to this kind of rule.
Combining disparate cardinalities under one heading defies the idea of having a unique identifier for each distinct rule. The designer should decide whether or not to combine rules, depending on how the user community understands these rules and deals with possible violations.
Notice that simple ruletypes are syntactic sugar: all simple constraints are perfectly expressible in mathematically equivalent compound rules. We include the rule keywords in our language for the
sake of simplicity. In practice, it makes little differ-ence: a rule is referenced only through its identifier, independent of the mathematical formulation.
Figure 5: Railroad diagram for the rule statement.
3.2.2 Compound Rules: If-then Phrases
The real benefit of Relation Algebra is found in its ability to formulate compound rules in the concise yet straightforward way of normalized Horn clause format (Horrocks et al., 2004):
antecedent ⇒ consequent
Both the antecedent and consequent are binary relations, either a plain relation of the Unconstrained Conceptual Model or a compound expression, and must have the same concepts for domain and range. This format is easily translated to a semi-formal if-then sentence (1), into which we like to include the important rule keyword 'must':
IF the antecedent is confirmed, THEN MUST the consequent be confirmed (1)
We define a rule violation as: a pair in the ante-cedent, but absent from the consequent expression. With this definition, the text becomes:
IF a pair is present in the antecedent, THEN MUST the pair be in the consequent
The Horn-clause format easily pronounces as 'if... then must...', but the mathematical expressions in a rule may be quite complex, as seen in the railroad diagram of figure 5. Both expressions in the Horn clause may be a relation of the Unconstrained Conceptual Model, or may combine several relations using unary and binary operations. Special relations and constants may also be included, as explained below. It requires skills and business knowledge to translate the complex expressions into terms that the user community can understand. Better still is to
Fourth International Symposium on Business Modeling and Software Design
66
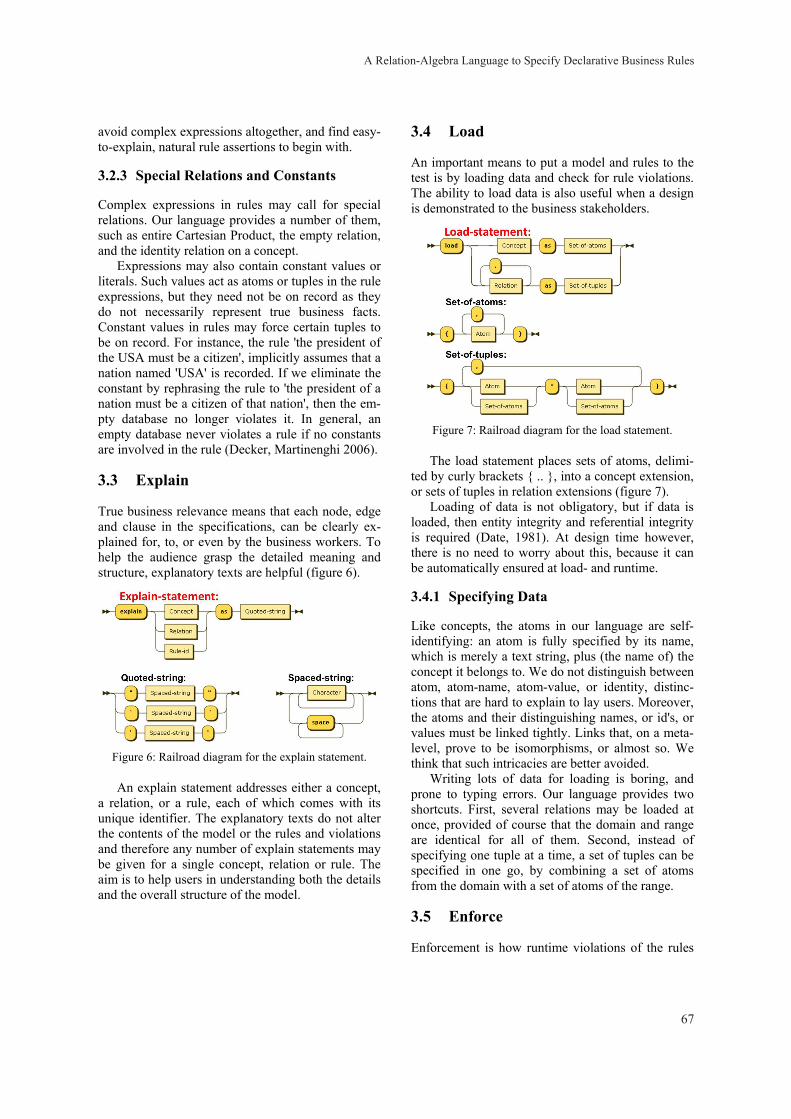
avoid complex expressions altogether, and find easy-to-explain, natural rule assertions to begin with.
3.2.3 Special Relations and Constants
Complex expressions in rules may call for special relations. Our language provides a number of them, such as entire Cartesian Product, the empty relation, and the identity relation on a concept.
Expressions may also contain constant values or literals. Such values act as atoms or tuples in the rule expressions, but they need not be on record as they do not necessarily represent true business facts. Constant values in rules may force certain tuples to be on record. For instance, the rule 'the president of the USA must be a citizen', implicitly assumes that a nation named 'USA' is recorded. If we eliminate the constant by rephrasing the rule to 'the president of a nation must be a citizen of that nation', then the em-pty database no longer violates it. In general, an empty database never violates a rule if no constants are involved in the rule (Decker, Martinenghi 2006).
3.3 Explain
True business relevance means that each node, edge and clause in the specifications, can be clearly ex-plained for, to, or even by the business workers. To help the audience grasp the detailed meaning and structure, explanatory texts are helpful (figure 6).
Figure 6: Railroad diagram for the explain statement.
An explain statement addresses either a concept, a relation, or a rule, each of which comes with its unique identifier. The explanatory texts do not alter the contents of the model or the rules and violations and therefore any number of explain statements may be given for a single concept, relation or rule. The aim is to help users in understanding both the details and the overall structure of the model.
3.4 Load
An important means to put a model and rules to the test is by loading data and check for rule violations. The ability to load data is also useful when a design is demonstrated to the business stakeholders.
Figure 7: Railroad diagram for the load statement.
The load statement places sets of atoms, delimi-ted by curly brackets { .. }, into a concept extension, or sets of tuples in relation extensions (figure 7).
Loading of data is not obligatory, but if data is loaded, then entity integrity and referential integrity is required (Date, 1981). At design time however, there is no need to worry about this, because it can be automatically ensured at load- and runtime.
3.4.1 Specifying Data
Like concepts, the atoms in our language are self-identifying: an atom is fully specified by its name, which is merely a text string, plus (the name of) the concept it belongs to. We do not distinguish between atom, atom-name, atom-value, or identity, distinc-tions that are hard to explain to lay users. Moreover, the atoms and their distinguishing names, or id's, or values must be linked tightly. Links that, on a meta-level, prove to be isomorphisms, or almost so. We think that such intricacies are better avoided.
Writing lots of data for loading is boring, and prone to typing errors. Our language provides two shortcuts. First, several relations may be loaded at once, provided of course that the domain and range are identical for all of them. Second, instead of specifying one tuple at a time, a set of tuples can be specified in one go, by combining a set of atoms from the domain with a set of atoms of the range.
3.5 Enforce
Enforcement is how runtime violations of the rules
A Relation-Algebra Language to Specify Declarative Business Rules
67
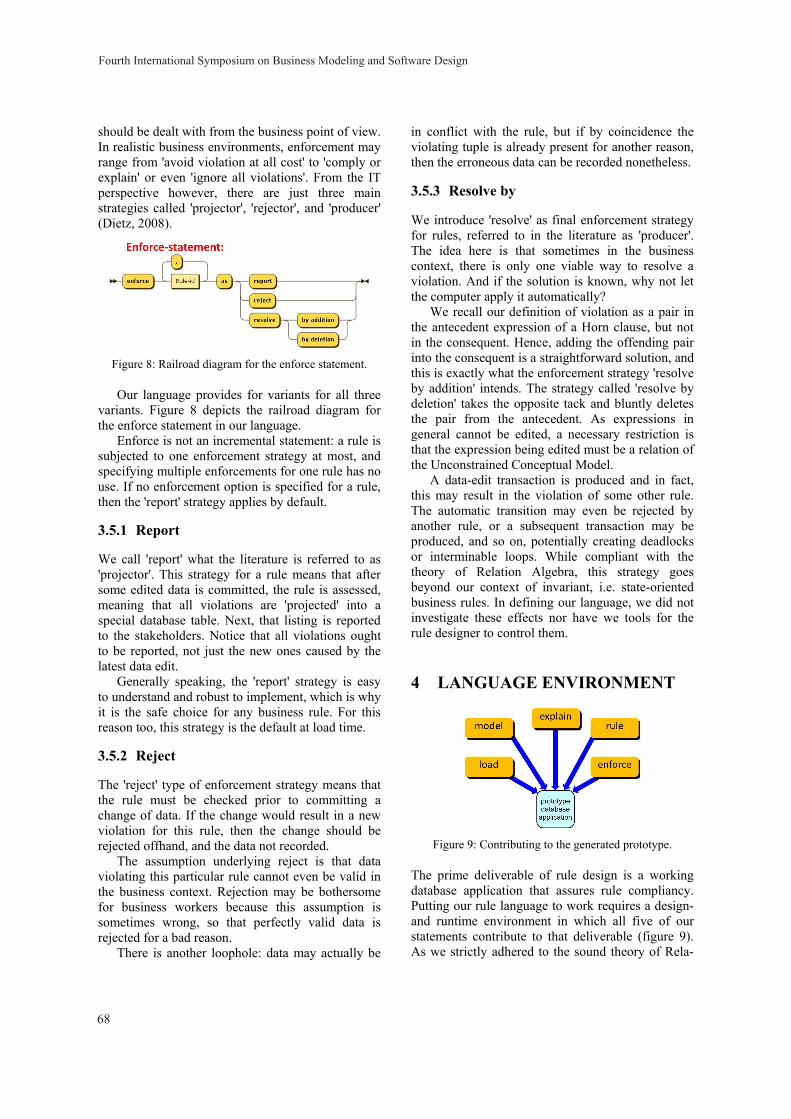
should be dealt with from the business point of view. In realistic business environments, enforcement may range from 'avoid violation at all cost' to 'comply or explain' or even 'ignore all violations'. From the IT perspective however, there are just three main strategies called 'projector', 'rejector', and 'producer' (Dietz, 2008).
Figure 8: Railroad diagram for the enforce statement.
Our language provides for variants for all three variants. Figure 8 depicts the railroad diagram for the enforce statement in our language.
Enforce is not an incremental statement: a rule is subjected to one enforcement strategy at most, and specifying multiple enforcements for one rule has no use. If no enforcement option is specified for a rule, then the 'report' strategy applies by default.
3.5.1 Report
We call 'report' what the literature is referred to as 'projector'. This strategy for a rule means that after some edited data is committed, the rule is assessed, meaning that all violations are 'projected' into a special database table. Next, that listing is reported to the stakeholders. Notice that all violations ought to be reported, not just the new ones caused by the latest data edit.
Generally speaking, the 'report' strategy is easy to understand and robust to implement, which is why it is the safe choice for any business rule. For this reason too, this strategy is the default at load time.
3.5.2 Reject
The 'reject' type of enforcement strategy means that the rule must be checked prior to committing a change of data. If the change would result in a new violation for this rule, then the change should be rejected offhand, and the data not recorded.
The assumption underlying reject is that data violating this particular rule cannot even be valid in the business context. Rejection may be bothersome for business workers because this assumption is sometimes wrong, so that perfectly valid data is rejected for a bad reason.
There is another loophole: data may actually be
in conflict with the rule, but if by coincidence the violating tuple is already present for another reason, then the erroneous data can be recorded nonetheless.
3.5.3 Resolve by
We introduce 'resolve' as final enforcement strategy for rules, referred to in the literature as 'producer'. The idea here is that sometimes in the business context, there is only one viable way to resolve a violation. And if the solution is known, why not let the computer apply it automatically?
We recall our definition of violation as a pair in the antecedent expression of a Horn clause, but not in the consequent. Hence, adding the offending pair into the consequent is a straightforward solution, and this is exactly what the enforcement strategy 'resolve by addition' intends. The strategy called 'resolve by deletion' takes the opposite tack and bluntly deletes the pair from the antecedent. As expressions in general cannot be edited, a necessary restriction is that the expression being edited must be a relation of the Unconstrained Conceptual Model.
A data-edit transaction is produced and in fact, this may result in the violation of some other rule. The automatic transition may even be rejected by another rule, or a subsequent transaction may be produced, and so on, potentially creating deadlocks or interminable loops. While compliant with the theory of Relation Algebra, this strategy goes beyond our context of invariant, i.e. state-oriented business rules. In defining our language, we did not investigate these effects nor have we tools for the rule designer to control them.
4 LANGUAGE ENVIRONMENT
Figure 9: Contributing to the generated prototype.
The prime deliverable of rule design is a working database application that assures rule compliancy. Putting our rule language to work requires a design- and runtime environment in which all five of our statements contribute to that deliverable (figure 9). As we strictly adhered to the sound theory of Rela-
Fourth International Symposium on Business Modeling and Software Design
68
tion Algebra, the generated prototype is guaranteed to comply with the invariant rules in the script.
4.1 Design Time Interface
A design time interface should support a designer to create, expand, refine and correct her script, and also to save the script to continue work at a later time.
A graphic display of the Unconstrained Concep-tual Model, with drag-and-drop and rearrange featu-res to uncluttered the diagram, is a wonderful help in composing and understanding. Still, it is the model, the rule statements and explanations that should be at the core of the design effort, not the diagram.
The rule statement calls for a smart formula editor, with an option to link each rule expression to corresponding nodes or edges in the model diagram. Various flags would also be desirable, such as flags for faulty expressions, rule inconsistencies, potential simplifications of rules, or unconstrained relations.
The explain statement can well be supported by providing text editing functions in a mouse-over of the diagram.
The load statement needs generous support to let a designer include a full load of initial data in the script, and integrity should be taken care of automatically, at load time at the latest. Copy and paste of realistic data acquired from the business arena would be greatly appreciated. Automatic generation of datasets in compliance or violation of a specific rule, would also be desirable.
Lastly, no special support appears to be required for the enforce statement at design time.
4.2 Load Time Interface
At load time, all data in the script should be loaded into the Unconstrained Conceptual Model. Only the 'report' enforcement strategy is feasible at this time, to prevent undesired outcomes or even deadlocks caused by 'reject' or 'resolve' types of enforcement.
But data integrity must be made to hold. Refe-rential integrity holds that each tuple refers to atoms on record in the domain and range, respectively. One option is to apply 'cascading delete', i.e. ignore all tuples that refer to a unrecorded atom. The opposite option is more attractive, i.e. to automatically insert the domain and range atoms of all tuples. Entity integrity holds that duplicates of an atom or tuple already on record, should not be loaded.
Once data is loaded into the Unconstrained Conceptual Model, only then should the rules be checked and violations reported. The report should enable the designer to trace each violation: what rule
is violated, which atoms and tuples play a part. A smart designer selects her data for loading in
such a way that each violation is clearly understood, explained, and repaired. If a violation cannot be understood, then either the loaded atoms and tuples make no sense in the business, or the rule itself is in doubt. Or if particular violations can only be repaired by rigorously deleting data, then apparently some rules are contradictory. In any case, business people should be consulted to clarify the issue.
4.3 Runtime Interface
The script captures the rules of the business context, and a computer interface serves to confront the business community with their rules. Conveniently, it makes little difference how a designer organizes her statements in the script, because the business users are not exposed to the script directly.
A minimal requirement is a browse-and-explain interface. This should help users understand their exact business rules and violations. It ought to depict uncluttered diagrams of the entire Conceptual Model or parts thereof. It should display relevant explanati-ons for all the concepts, relations and rules in the diagram. Also for each rule a complete list of all persistent violations must be provided, with explanations and traces how each violating tuple is determined from the corresponding Horn-clause formula. From there, the interface should support drill-down features to scrutinize partial populations or even individual instances in the diagrams.
Second, a demonstration interface is appreciated to emulate a workflow case in a (partial) business process. A series of predefined datasets is loaded in sequence, showing the emergence and subsequent resolution of violations as new data is being entered.
Adjusting rule enforcements on the fly in the runtime interface is still better. This would allow experimentation how to deal with rule violations and to probe the effects on the workflow processing.
The real benefit of our language is to generate a rule-compliant runtime prototype application with full data edit capabilities. Business people can then put that prototype to the question by entering all conceivable kinds of business data, view the responses by the system, and come to understand the workflow processes for dealing with the violations of their business rules.
5 LANGUAGE METAMODEL
So far, we discussed the modelling of an arbitrary
A Relation-Algebra Language to Specify Declarative Business Rules
69
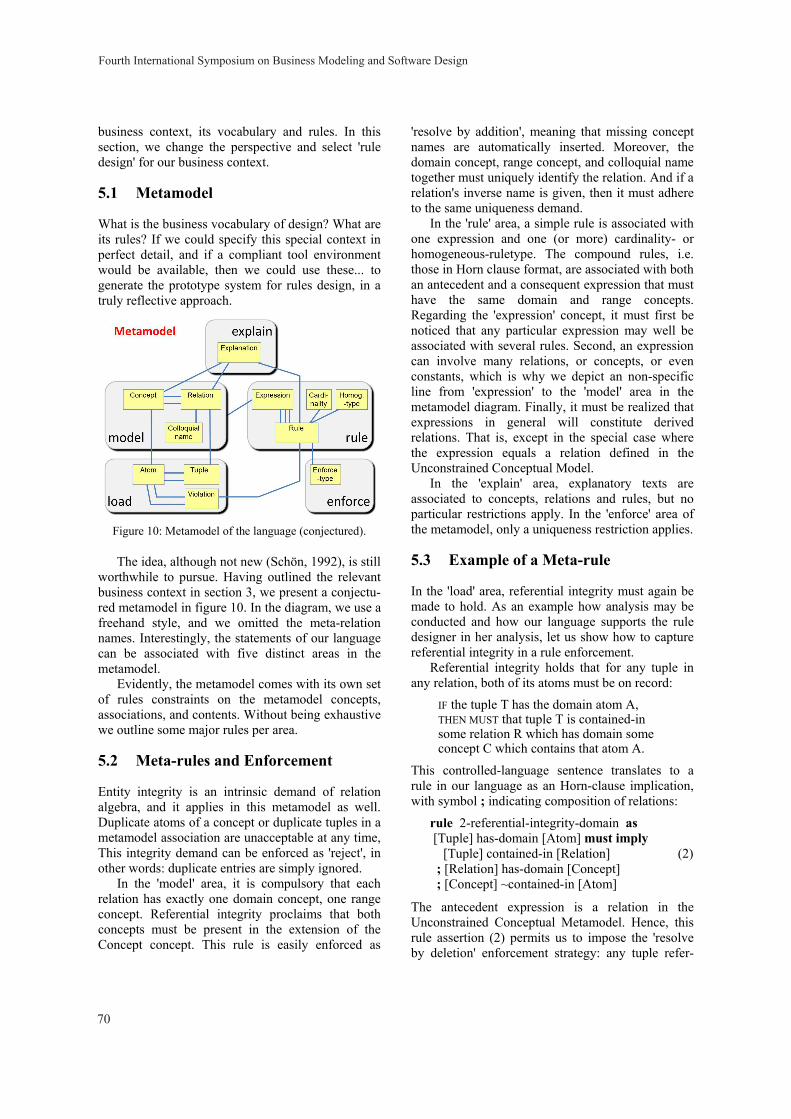
business context, its vocabulary and rules. In this section, we change the perspective and select 'rule design' for our business context.
5.1 Metamodel
What is the business vocabulary of design? What are its rules? If we could specify this special context in perfect detail, and if a compliant tool environment would be available, then we could use these... to generate the prototype system for rules design, in a truly reflective approach.
Figure 10: Metamodel of the language (conjectured).
The idea, although not new (Schön, 1992), is still worthwhile to pursue. Having outlined the relevant business context in section 3, we present a conjectu-red metamodel in figure 10. In the diagram, we use a freehand style, and we omitted the meta-relation names. Interestingly, the statements of our language can be associated with five distinct areas in the metamodel.
Evidently, the metamodel comes with its own set of rules constraints on the metamodel concepts, associations, and contents. Without being exhaustive we outline some major rules per area.
5.2 Meta-rules and Enforcement
Entity integrity is an intrinsic demand of relation algebra, and it applies in this metamodel as well. Duplicate atoms of a concept or duplicate tuples in a metamodel association are unacceptable at any time, This integrity demand can be enforced as 'reject', in other words: duplicate entries are simply ignored.
In the 'model' area, it is compulsory that each relation has exactly one domain concept, one range concept. Referential integrity proclaims that both concepts must be present in the extension of the Concept concept. This rule is easily enforced as
'resolve by addition', meaning that missing concept names are automatically inserted. Moreover, the domain concept, range concept, and colloquial name together must uniquely identify the relation. And if a relation's inverse name is given, then it must adhere to the same uniqueness demand.
In the 'rule' area, a simple rule is associated with one expression and one (or more) cardinality- or homogeneous-ruletype. The compound rules, i.e. those in Horn clause format, are associated with both an antecedent and a consequent expression that must have the same domain and range concepts. Regarding the 'expression' concept, it must first be noticed that any particular expression may well be associated with several rules. Second, an expression can involve many relations, or concepts, or even constants, which is why we depict an non-specific line from 'expression' to the 'model' area in the metamodel diagram. Finally, it must be realized that expressions in general will constitute derived relations. That is, except in the special case where the expression equals a relation defined in the Unconstrained Conceptual Model.
In the 'explain' area, explanatory texts are associated to concepts, relations and rules, but no particular restrictions apply. In the 'enforce' area of the metamodel, only a uniqueness restriction applies.
5.3 Example of a Meta-rule
In the 'load' area, referential integrity must again be made to hold. As an example how analysis may be conducted and how our language supports the rule designer in her analysis, let us show how to capture referential integrity in a rule enforcement.
Referential integrity holds that for any tuple in any relation, both of its atoms must be on record:
IF the tuple T has the domain atom A, THEN MUST that tuple T is contained-in some relation R which has domain some concept C which contains that atom A.
This controlled-language sentence translates to a rule in our language as an Horn-clause implication, with symbol ; indicating composition of relations:
rule 2-referential-integrity-domain as [Tuple] has-domain [Atom] must imply [Tuple] contained-in [Relation] ; [Relation] has-domain [Concept] ; [Concept] ~contained-in [Atom]
(2)
The antecedent expression is a relation in the Unconstrained Conceptual Metamodel. Hence, this rule assertion (2) permits us to impose the 'resolve by deletion' enforcement strategy: any tuple refer-
Fourth International Symposium on Business Modeling and Software Design
70

ring to an unrecorded atom is immediately deleted. This strategy is known as 'cascading delete' in relational database technology. A similar meta-rule will do for the atoms in the range of the relation.
The rule of integrity must hold at runtime, but still its enforcement strategy can be made to vary. A 'reject' or 'report' strategy may be better in a running business environment. Moreover, at load time the 'resolve by addition' strategy is to be preferred.
This illustrates how there are unresolved issues in the analysis and design of the metamodel calling for further research. Another issue is how to deal with constant values in rule expressions.
6 CONCLUSIONS
We proposed a rule language to capture and express declarative business rules. The language, combining business vocabulary with precise mathematical features, is comprehensible for business users, and precise enough to generate rule-compliant IT appli-cations. We outlined how the language may be employed in design- and runtime interfaces.
6.1 Expressive Power of the Language
We claim that the language has adequate expressive power for rule design and analysis.
Following the ideas of SBVR, our language is founded on business vocabulary, compelling the designer to use the plain business phrases for the relevant terms and facts, a major strength of our language. Declarative, invariant business rules are described in a comprehensible if-then syntax. In our experience, this is a great help for people reading a script. In particular, the 'must' keyword provides an immediate clue of what a rule intends to say, even when complicated expressions are involved.
Our language has a clear, uniform makeup. This, and the simple naming regime make for easy-to-read scripts that are straightforward to interpret by business people, even without supportive IT-tools. Each line in a script starts with an imperative keyword that clearly indicates the focus of that line, underpinning the orthogonality of our language. The reserved keywords of our language are concise and learnable, appealing for both skilled business workers and novice rule designers.
Statements of our language are orthogonal by design. Each statement addresses a single aspect of the business context. The language statements are loosely coupled, but as some statements necessarily depend upon previous ones, complete independence
is not possible. No restrictions apply to the order or sequence of
statements. The designer may first specify all aspects of one business feature, or start a model with a few rules in one section of the script and add a section with load statements later, etc. Therefore, no particular design approach is forced upon the designer. Having said that, a strong point of our language is that it does force a designer to consider all business features of the relevant rules, and to capture its aspects in distinct statements. For business users, it makes little difference how the statements in the script are organized, because in theory, users do not browse the script but use a dedicated interface to explore the rule-based design. In practice however, users will probably read it, and even begin to add and amend the script.
Our statements are devoid of typical IT jargon such as primary-keys and attributes, functional dependencies, cascading deletes, etc. Imperative ECA-type rules cannot be formulated in our language, with one exception. The enforce statement variant called 'resolve' does initiate data editing operations in response to a rule violation. This is a digression from the strictly declarative and invariant nature of our language, the consequences of which need to be further researched.
In our opinion, rule design for a business context is a superior approach than the dual approach of creating on the one hand an implementation data model with objects, entities, keys, and an activity model with data transitions and processing features on the other. Business stakeholders have little affinity with such refined IT-models, and lack the ability to validate the correct implementation in computer applications.
6.2 Language Extensions
Several extensions to the language may be considered to enhance usability for stakeholders and compliancy of the implementations. Of course, expressive power and understandability for business users should not be affected.
Support for specialization/generalization relati-ons among concepts is one possible extension. This is somewhat problematic for Relation Algebra theory because an atom might belong to more than one concept for some time, or even switch over time: a person is student at one time, and teacher at another. Specialization/generalization is relatively unimportant in business practice, where models often do not need it or can use a work-around.
Better support for the 'resolve' enforcement
A Relation-Algebra Language to Specify Declarative Business Rules
71
strategy is needed. Fundamental research is called for to understand the coordination of rules, and to prevent contradictory enforcement strategies.
Support for the Role-based Access standard (Edward et al., 2011) is also suggested. Instances of a Role concept should be assigned the right to access all contents of certain concepts and relations in the Unconstrained Conceptual Model. It calls for a mix of model and metamodel capabilities, thus extending the ideas exposed in section 5.
A serious shortcoming of Relation Algebra is that it lacks arithmetic and temporal capabilities: it cannot express calculations such as 'add 18% VAT' or comparisons like 'if born before 1980'. Support for this kind of rules will greatly enhance usability, provided that the orthogonality of the language and most importantly, the clear and uniform expression of declarative rules in if-then syntax is safeguarded.
6.3 Future Research
We indicate some areas of ongoing research that may improve the applicability of our approach, methods, and tools for business rules design.
Currently, texts available for explanations in the user interface are only static. Ongoing research aims to determine what instructions or explanations in which interfaces are most helpful to achieve high-quality designs (Michels, 2011).
Integration of our language with the typical IT-domain of Semantic Web Rule Language is being researched (Grosof, 2013). The aim is to improve the expressive power without compromising orthogonality of the language and comprehensibility of the if-then syntax of rules.
Interface design is an ongoing area of research. In this paper, we proposed to compose and then compile scripts. But instead of compiling, an inter-pretative way of working might provide better support for the designer and business stakeholders.
Research is being conducted to develop the reflective meta-modelling approach, its vocabulary and the rules of rule design. The idea is to build a generator from this; a generator that is capable of converting any rule-based design into a fully functional and compliant prototype application.
The vision is that in the future, stakeholders may formulate and validate their own business rules, and do so in a language with enough precision to enable a straightforward implementation in computer appli-cations, without the intervention of IT specialists.
REFERENCES
Akbari I., Yan B.. Visualizing SWRL Rules. At ceur-ws.org
Andreescu A., Mircea M., 2014. Issues and Challenges of Business Rules Modeling in Software Systems for Business Management. Informatica Economică 18(1)
Bajwa I.S., Lee M.G., Bordbar B., 2011. SBVR Business Rules Generation from Natural Language Specification. AAAI Spring Symposium: AI for Business Agility
Beckner M., 2014. Custom Business Rules. BizTalk 2013 EDI for Health Care, Apress. p.105-116
Bjekovic M., Proper H.A., 2013. Challenges of Modelling Landscapes. BMSD – Business Modeling and Software Design, 3rd Int. Symposium, p.11-22.
Boley H., Paschke A. et al., 2010. RuleML 1.0: overarching specification of web rules. LNCS 6403(4) p.162-178
Business Rules Manifesto 2003. Edited RG Ross. At www.businessrulesgroup.org.
Date C., 1981. Referential integrity. VLDB. Decker H., Martinenghi D., 2006. A relaxed approach to
integrity and inconsistency in databases. Logic for Programming, AI, and Reasoning, Springer.
Dietz J.L.G., 2008. On the Nature of Business Rules. Advances in Enterprise Engineering. Springer. 10. p.1-15.
Edward J.C., Timothy R., Rick K., 2011. Role Engineering: Methods and Standards. IT Professional. 13: p.54-57.
FBM Working Group, 2011. Fact Based Modelling. At www.factbasedmodeling.eu/Data/sites/1/media/FBM1002WD06.pdf.
Fuchs N.E., Kaljurand K., Kuhn T., 2008. Attempto Controlled English for knowledge representation. Reasoning Web, Springer p.104-124
Grosof B., Kifer M., 2013. Rulelog: Syntax and Semantics. doi=10.1.1.359.9882
Halpin T., 2011. Fact-Orientation and Conceptual Logic. 15th IEEE International on Enterprise Distributed Object Computing Conference p.14-19
Hay D., Healy K.A., 2000. Defining Business Rules ~What Are They Really? At www.businessrulesgroup.org/ first_paper/BRG-whatisBR_3ed.pdf.
Hoare CAR, 1985. Communicating Sequential Processes. Prentice-hall Englewood Cliffs
Horrocks I., Patel-Schneider P.F., et al., 2004. SWRL: A semantic web rule language combining OWL and RuleML. W3C Member submission
Kardasis P., Loucopoulos P., 2004. Expressing and organising business rules. Information and Software Technology 46(11) p.701-718
Lamrani M., El Amrani Y., Ettouhami A., 2013. On Formalizing Predefined OCL Properties. International Journal of Computer, Information Science and Engineering 7(1)
Maddux R.D., 2006. Relation algebras. Studies in Logic and the Foundations of Mathematics. Elsevier. Vol 150. p. 289-525.
Fourth International Symposium on Business Modeling and Software Design
72

Michels G. et al., 2011. Ampersand. Relational and Algebraic Methods in Computer Science. Eds H. de Swart. Springer 6663. p.280-293.
Moody D 2005. Theoretical and practical issues in evaluating the quality of conceptual models. Data & Knowledge Engineering 55(3) p.243-276
Object Management Group, 2008. SBVR: Semantics of Business Vocabulary and Business Rules, Version 1.0. At doc.omg.org/formal/08-01-02.pdf.
Poulovassilis A., Papamarkos G., Wood P.T., 2006. Event-condition-action rule languages for the semantic web. EDBT 2006, Springer. p.855-864
Quartel D., Engelsman W., et al. 2009. A Goal-oriented requirements modelling language for enterprise archi-tecture. Enterprise Distributed Object Computing.
Ross R.G., Lam G.S.W., 2011. Building Business Solutions: Business Analysis with Business Rules. Business Rules Solutions LLC
RuleSpeak, 2014. RuleSpeak Sentence Forms, Specifying Natural-Language Business Rules. At rulespeak.com.
Schön D.A., 1992. Designing as reflective conversation with the materials of a design situation. Knowledge-Based Systems 5(1) p.3-14.
Wedemeijer L., 2012. A comparison of Two Business Rules Engineering Approaches. BMSD – Business Modeling and Software Design, 2nd Int. Symposium, p.113-121.
Weigand H., van den Heuvel W.J., Hiel M., 2011. Business policy compliance in service-oriented systems. Information Systems 36(4) p.791-807.
A Relation-Algebra Language to Specify Declarative Business Rules
73
Modelling Capability and Affordance as Properties of Human/Machine Resource Systems
Vaughan Michell 1 and Ella Roubtsova 2 1Informatics Research Centre, Henley Business School, University of Reading, U.K.
2Open University of the Netherlands, Heerlen, the Netherlands [email protected], [email protected]
Keywords: Capability, Affordance, CPN, Critical Affordance Factor, Affordance Mechanism, Affordance Path, Affordance Chain.
Abstract: Understanding how and why the capability of one set of business resources, its structural arrangements and mechanisms compared to another works can provide competitive advantage in terms of new business processes and product and service development. However, most business models of capability are descriptive and lack formal modelling language to qualitatively and quantifiably compare capabilities, Gibson’s theory of affordance, the potential for action, provides a formal basis for a more robust and quantitative model, but most formal affordance models are complex and abstract and lack support for real-world applications. We aim to understand the ‘how’ and ‘why’ of business capability, by developing a quantitative and qualitative model that underpins earlier work on Capability-Affordance Modelling – CAM. This paper integrates an affordance based capability model and the formalism of Coloured Petri Nets to develop a simulation model. Using the model, we show how capability depends on the space time path of interacting resources, the mechanism of transition and specific critical affordance factors relating to the values of the variables for resources, people and physical objects. We show how the model can identify the capabilities of resources to enable the capability to inject a drug and anaesthetise a patient.
1 INTRODUCTION
Capability is complex, with wide variations in meaning and evaluation. Capability can refer to the human action ability to do something, (Prahalad and Hamel, 1990) (Gallouj and Weinstein, 1997). Capability also refers to an object’s abilities (Beimborn et al, 2005) and the ability of groups of resources to perform a task (Grant, 1991) via a process (Makadok, 2001). Capability relates both to tangible visible transformations, (eg manufacturing an object) and intangible transformations, eg teaching, where information is transferred and tacit knowledge is created (Michell, 2013). The ability to transform resources is the basis of business competitive advantage, where the product resources have greater monetary value than the input resources and cost of work done.
1.1 Paper Objectives and Layout
Our focus is: modelling the capability of a system of business resources to identify how and why it is able
to meet a specific capability goal. Such a model enables comparison/selection of the best system of resources for a specific task (Michell, 2012). It also aids understanding the resource properties and dispositions required for a capability-affordance system to achieve a goal. The paper is in 6 sections. Section 2 Introduces affordance and effectivity to formalise the capability model. Section 3 reviews formal affordance models and their shortcomings in relation to capability affordance modelling. Section 4 develops a proposed model for capability analysis using CPN. Section 5 provides an example application of the model. Section 6/7 discusses the use and benefits of the model and our conclusions.
74
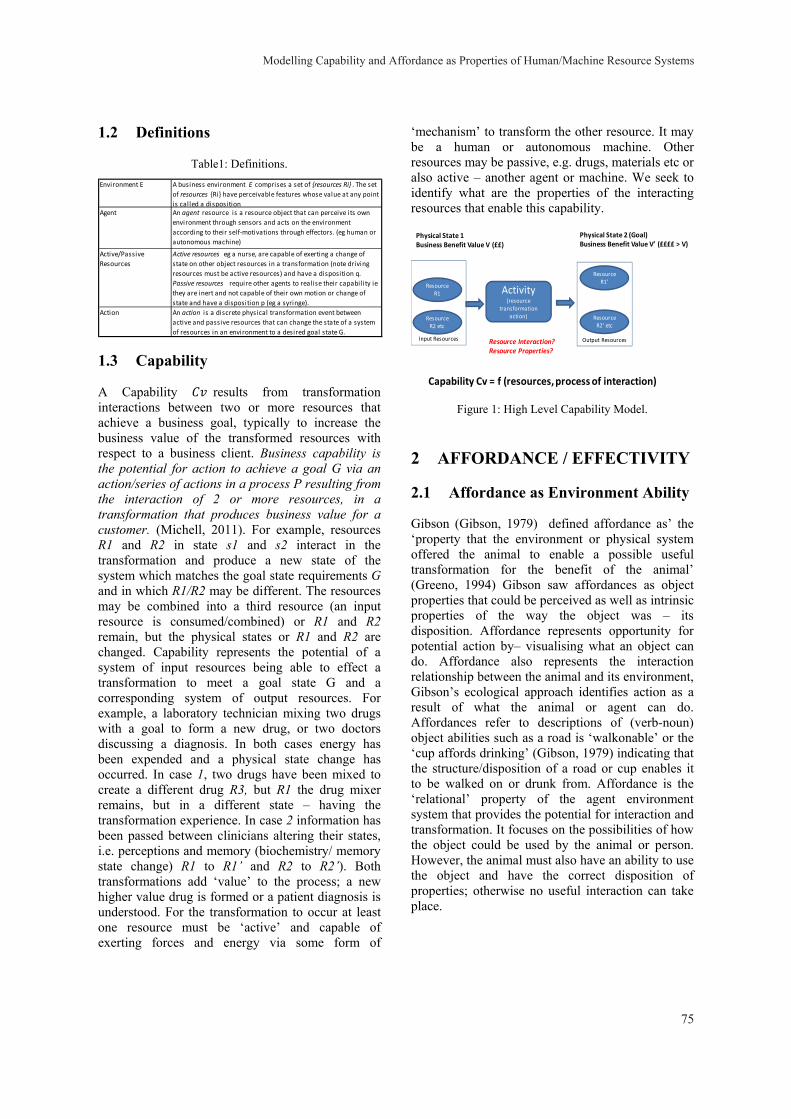
1.2 Definitions
Table1: Definitions.
1.3 Capability
A Capability results from transformation interactions between two or more resources that achieve a business goal, typically to increase the business value of the transformed resources with respect to a business client. Business capability is the potential for action to achieve a goal G via an action/series of actions in a process P resulting from the interaction of 2 or more resources, in a transformation that produces business value for a customer. (Michell, 2011). For example, resources R1 and R2 in state s1 and s2 interact in the transformation and produce a new state of the system which matches the goal state requirements G and in which R1/R2 may be different. The resources may be combined into a third resource (an input resource is consumed/combined) or R1 and R2 remain, but the physical states or R1 and R2 are changed. Capability represents the potential of a system of input resources being able to effect a transformation to meet a goal state G and a corresponding system of output resources. For example, a laboratory technician mixing two drugs with a goal to form a new drug, or two doctors discussing a diagnosis. In both cases energy has been expended and a physical state change has occurred. In case 1, two drugs have been mixed to create a different drug R3, but R1 the drug mixer remains, but in a different state – having the transformation experience. In case 2 information has been passed between clinicians altering their states, i.e. perceptions and memory (biochemistry/ memory state change) R1 to R1’ and R2 to R2’). Both transformations add ‘value’ to the process; a new higher value drug is formed or a patient diagnosis is understood. For the transformation to occur at least one resource must be ‘active’ and capable of exerting forces and energy via some form of
‘mechanism’ to transform the other resource. It may be a human or autonomous machine. Other resources may be passive, e.g. drugs, materials etc or also active – another agent or machine. We seek to identify what are the properties of the interacting resources that enable this capability.
Figure 1: High Level Capability Model.
2 AFFORDANCE / EFFECTIVITY
2.1 Affordance as Environment Ability
Gibson (Gibson, 1979) defined affordance as’ the ‘property that the environment or physical system offered the animal to enable a possible useful transformation for the benefit of the animal’ (Greeno, 1994) Gibson saw affordances as object properties that could be perceived as well as intrinsic properties of the way the object was – its disposition. Affordance represents opportunity for potential action by– visualising what an object can do. Affordance also represents the interaction relationship between the animal and its environment, Gibson’s ecological approach identifies action as a result of what the animal or agent can do. Affordances refer to descriptions of (verb-noun) object abilities such as a road is ‘walkonable’ or the ‘cup affords drinking’ (Gibson, 1979) indicating that the structure/disposition of a road or cup enables it to be walked on or drunk from. Affordance is the ‘relational’ property of the agent environment system that provides the potential for interaction and transformation. It focuses on the possibilities of how the object could be used by the animal or person. However, the animal must also have an ability to use the object and have the correct disposition of properties; otherwise no useful interaction can take place.
Environment E A business environment E comprises a set of {resources Ri} . The set of resources {Ri} have perceivable features whose value at any point is called a disposition
Agent An agent resource is a resource object that can perceive its own environment through sensors and acts on the environment according to their self-motivations through effectors. (eg human or autonomous machine)
Active/Passive Resources
Active resources eg a nurse, are capable of exerting a change of state on other object resources in a transformation (note driving resources must be active resources) and have a disposition q. Passive resources require other agents to realise their capabil ity ie they are inert and not capable of their own motion or change of state and have a disposition p (eg a syringe).
Action An action is a discrete physical transformation event between active and passive resources that can change the state of a system of resources in an environment to a desired goal state G.
Activity(resource
transformation action)
Physical State 2 (Goal)Business Benefit Value V’ (££££ > V)
Physical State 1Business Benefit Value V (££)
Resource R1
Resource R2 etc
Resource R1’
Resource R2’ etc
Capability Cv = f (resources, process of interaction)
Output ResourcesInput Resources Resource Interaction?Resource Properties?
Modelling Capability and Affordance as Properties of Human/Machine Resource Systems
75
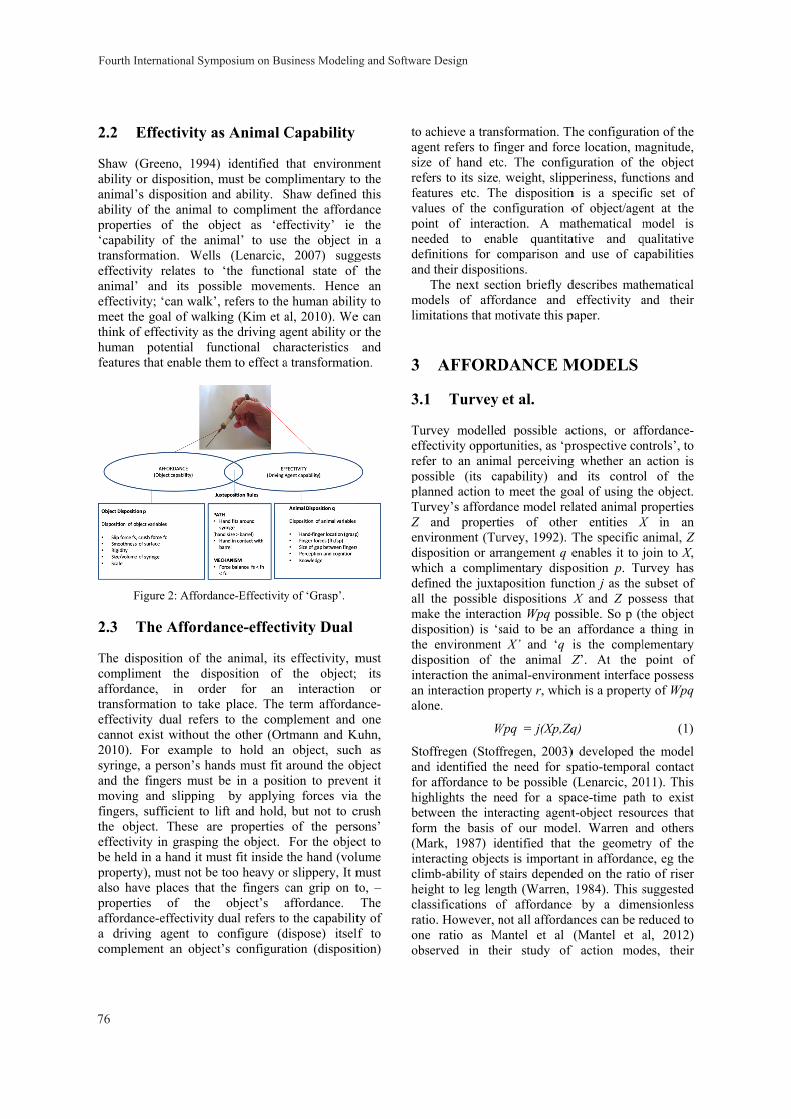
2.2 E
Shaw (Gability oanimal’sability opropertie‘capabilitransformeffectivitanimal’ effectivitmeet thethink of human features
Fi
2.3 T
The dispcomplimaffordantransformeffectivitcannot e2010). Fsyringe, and the moving fingers, the objeeffectivitbe held ipropertyalso havpropertieaffordana drivincomplem
Effectivity a
Greeno, 1994r disposition,
s disposition aof the animal es of the oity of the anmation. Wellty relates to and its pos
ty; ‘can walk’e goal of walkeffectivity as potential fu
that enable th
igure 2: Afforda
The Afforda
position of thment the disnce, in ordmation to takty dual refers
exist without tFor example a person’s hafingers must and slippingsufficient to
ect. These arty in graspingin a hand it m
y), must not beve places thates of the
nce-effectivity ng agent to ment an objec
as Animal C
4) identified must be com
and ability. Sto complimebject as ‘ef
nimal’ to usels (Lenarcic,
‘the functiossible movem’, refers to theking (Kim et a
the driving agunctional chahem to effect a
ance-Effectivity
ance-effect
he animal, its sposition of der for an e place. The s to the comthe other (Ort
to hold an ands must fit
be in a posi by applyinlift and hold,re properties g the object.
must fit inside e too heavy ort the fingers c
object’s adual refers toconfigure (d
ct’s configura
Capability
that environmmplimentary toShaw defined nt the afforda
ffectivity’ ie e the object i
2007) suggonal state of ments. Hencee human abilital, 2010). Wegent ability oraracteristics
a transformatio
y of ‘Grasp’.
ivity Dual
effectivity, mthe object; interaction
term affordamplement and
tmann and Kuobject, such
around the obtion to preven
ng forces via but not to cof the persFor the objecthe hand (volr slippery, It mcan grip on taffordance. o the capabilitdispose) itselfation (disposit
ment o the
this ance
the in a gests f the e an ty to
e can r the and
on.
must its or
ance-one
Kuhn, h as bject ent it a the crush sons’ ct to lume must to, – The
ty of f to tion)
to aagesizerefefeatvalupoinneedefiand
modlim
3
3.1
TurefferefeposplanTurZenvdispwhidefiall makdispthe dispintean ialon
Stoandfor highbetwform(Mainteclimheigclasrationeobs
achieve a transent refers to fie of hand etcers to its size,tures etc. Thues of the cont of intera
eded to enafinitions for cd their dispositThe next secdels of affoitations that m
AFFORD
1 Turvey
rvey modelledectivity opporter to an animssible (its canned action torvey’s affordaand properti
vironment (Tuposition or arrich a complim
fined the juxtathe possible
ke the interacposition) is ‘s
environmentposition of teraction the aninteraction prone.
W
ffregen (Stoffd identified th
affordance tohlights the nween the intem the basis ark, 1987) ideracting objecmb-ability of sght to leg lenssifications oo. However, n
e ratio as Mserved in the
sformation. Thnger and forcc. The config weight, slipp
he dispositiononfiguration oction. A ma
able quantitacomparison antions. tion briefly d
ordance and motivate this p
DANCE M
et al.
d possible actunities, as ‘pr
mal perceivingapability) ando meet the goance model relies of other
urvey, 1992). Trangement q ementary dispoaposition funcdispositions tion Wpq possaid to be an t X’ and ‘q ithe animal Znimal-environoperty r, whic
Wpq = j(Xp,Zq
fregen, 2003)he need for spo be possible eed for a spaeracting agentof our mode
dentified that ts is importanstairs dependegth (Warren,
of affordance not all afforda
Mantel et al eir study of
he configuratice location, mguration of thperiness, funcn is a specifof object/ageathematical mative and qnd use of ca
describes matheffectivity a
paper.
MODELS
ctions, or afrospective con
g whether an d its controoal of using thlated animal p
er entities XThe specific aenables it to josition p. Tu
ction j as the X and Z pos
ssible. So p (taffordance a
is the complZ’. At the
nment interfacch is a propert
q)
) developed thpatio-tempora(Lenarcic, 20ace-time patht-object resou
el. Warren anthe geometr
nt in affordanced on the rati1984). This s
e by a dimeances can be re(Mantel et a
f action mod
ion of the magnitude,
he object ctions and fic set of ent at the model is
qualitative apabilities
hematical and their
ffordance-ntrols’, to action is
l of the he object. properties X in an animal, Z join to X, urvey has subset of
ssess that the object a thing in lementary point of
ce possess ty of Wpq
(1)
he model al contact 011). This h to exist urces that nd others ry of the ce, eg the o of riser suggested ensionless educed to al, 2012) des, their
Fourth International Symposium on Business Modeling and Software Design
76
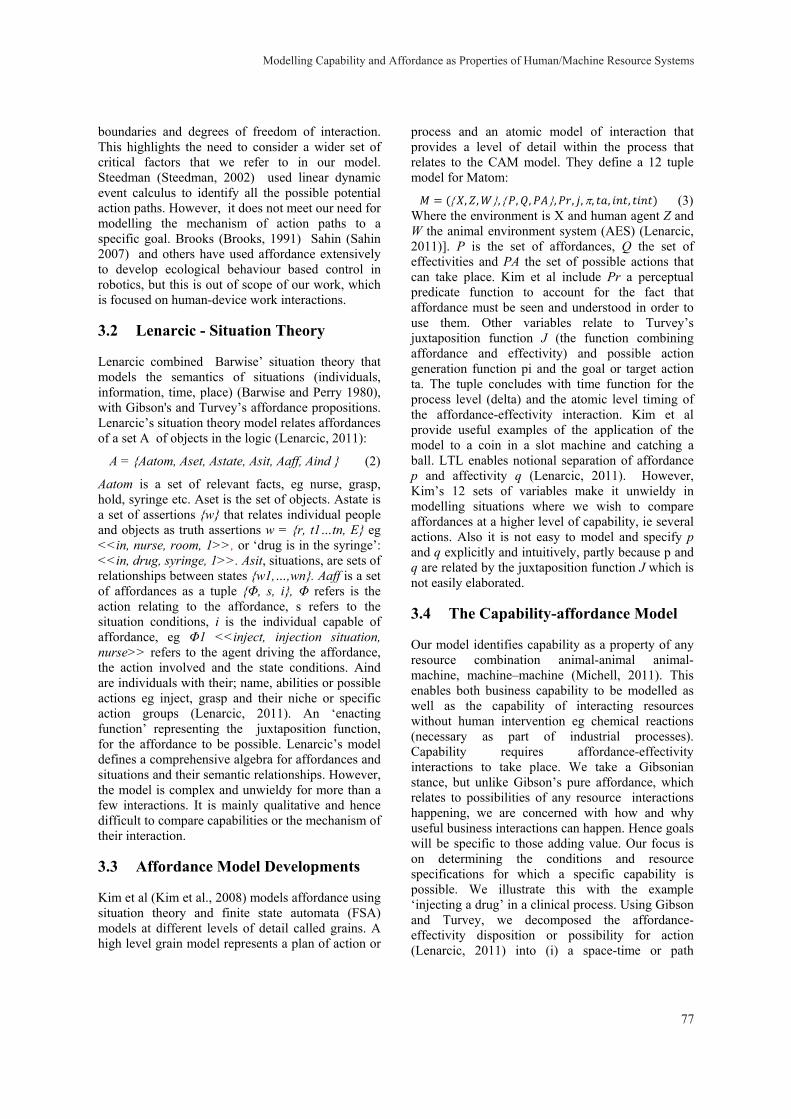
boundaries and degrees of freedom of interaction. This highlights the need to consider a wider set of critical factors that we refer to in our model. Steedman (Steedman, 2002) used linear dynamic event calculus to identify all the possible potential action paths. However, it does not meet our need for modelling the mechanism of action paths to a specific goal. Brooks (Brooks, 1991) Sahin (Sahin 2007) and others have used affordance extensively to develop ecological behaviour based control in robotics, but this is out of scope of our work, which is focused on human-device work interactions.
3.2 Lenarcic - Situation Theory
Lenarcic combined Barwise’ situation theory that models the semantics of situations (individuals, information, time, place) (Barwise and Perry 1980), with Gibson's and Turvey’s affordance propositions. Lenarcic’s situation theory model relates affordances of a set A of objects in the logic (Lenarcic, 2011):
A = {Aatom, Aset, Astate, Asit, Aaff, Aind } (2)
Aatom is a set of relevant facts, eg nurse, grasp, hold, syringe etc. Aset is the set of objects. Astate is a set of assertions {w} that relates individual people and objects as truth assertions w = {r, t1…tn, E} eg <<in, nurse, room, 1>>, or ‘drug is in the syringe’: <<in, drug, syringe, 1>>. Asit, situations, are sets of relationships between states {w1,…,wn}. Aaff is a set of affordances as a tuple {Φ, s, i}, Φ refers is the action relating to the affordance, s refers to the situation conditions, i is the individual capable of affordance, eg Φ1 <<inject, injection situation, nurse>> refers to the agent driving the affordance, the action involved and the state conditions. Aind are individuals with their; name, abilities or possible actions eg inject, grasp and their niche or specific action groups (Lenarcic, 2011). An ‘enacting function’ representing the juxtaposition function, for the affordance to be possible. Lenarcic’s model defines a comprehensive algebra for affordances and situations and their semantic relationships. However, the model is complex and unwieldy for more than a few interactions. It is mainly qualitative and hence difficult to compare capabilities or the mechanism of their interaction.
3.3 Affordance Model Developments
Kim et al (Kim et al., 2008) models affordance using situation theory and finite state automata (FSA) models at different levels of detail called grains. A high level grain model represents a plan of action or
process and an atomic model of interaction that provides a level of detail within the process that relates to the CAM model. They define a 12 tuple model for Matom:
= ({ , , }, { , , }, , , π, , , ) (3)Where the environment is X and human agent Z and W the animal environment system (AES) (Lenarcic, 2011)]. P is the set of affordances, Q the set of effectivities and PA the set of possible actions that can take place. Kim et al include Pr a perceptual predicate function to account for the fact that affordance must be seen and understood in order to use them. Other variables relate to Turvey’s juxtaposition function J (the function combining affordance and effectivity) and possible action generation function pi and the goal or target action ta. The tuple concludes with time function for the process level (delta) and the atomic level timing of the affordance-effectivity interaction. Kim et al provide useful examples of the application of the model to a coin in a slot machine and catching a ball. LTL enables notional separation of affordance p and affectivity q (Lenarcic, 2011). However, Kim’s 12 sets of variables make it unwieldy in modelling situations where we wish to compare affordances at a higher level of capability, ie several actions. Also it is not easy to model and specify p and q explicitly and intuitively, partly because p and q are related by the juxtaposition function J which is not easily elaborated.
3.4 The Capability-affordance Model
Our model identifies capability as a property of any resource combination animal-animal animal-machine, machine–machine (Michell, 2011). This enables both business capability to be modelled as well as the capability of interacting resources without human intervention eg chemical reactions (necessary as part of industrial processes). Capability requires affordance-effectivity interactions to take place. We take a Gibsonian stance, but unlike Gibson’s pure affordance, which relates to possibilities of any resource interactions happening, we are concerned with how and why useful business interactions can happen. Hence goals will be specific to those adding value. Our focus is on determining the conditions and resource specifications for which a specific capability is possible. We illustrate this with the example ‘injecting a drug’ in a clinical process. Using Gibson and Turvey, we decomposed the affordance-effectivity disposition or possibility for action (Lenarcic, 2011) into (i) a space-time or path
Modelling Capability and Affordance as Properties of Human/Machine Resource Systems
77

disposition and (ii) a mechanism disposition (Michell, 2012). At the point of transition Turvey’s juxtaposition function J must be represented by both a path and a mechanism, both meet critical affordance factor values that make the state transition possible. The capability of a system of agents and objects is the sum of all the affordance-effectivity interactions within the system. This is equivalent to W, the AES- animal in environment system in Kim (Kim et al., 2008). The affordance-effectivity interactions are part of a process where paths represent the what Kim calls ‘high grain’ interactions and affordance chains represent parts of agents or objects eg syringe components such as the plunger and the barrel interacting.
3.4.1 Affordance Path
The affordance path relates to the space-time affordance-effectivity dual interaction requirements that if the agent and object don’t spatially come into contact or a region of influence with each other, affordance won’t occur (Lenarcic, 2011). Hence part of the animal disposition q and the object disposition p conditions must relate to space-time rules regarding the contact/interaction geometry between object and animal. In the syringe example, the syringe position and orientation (p variables) must match the hand/finger positions (q variables). If the structural spatial arrangement or disposition of the interacting resources do not complement each other, the interaction and capability will not be present, ie if the syringe is too big to fit in the hand or lacks grip and leverage points.
An affordance path AP is the set of possible space-time movement and geometric configuration conditions that must exist to enable the affordance mechanisms to act and execute the capability. (adapted from Michell, 2012) At the interaction point between resources, the space time path of animal and object must be the same. Movement and dynamics of the agent in its previous states must be such that it leads to the special agent spatial disposition q which matches the special spatial disposition of the object p at time t of transformation. This becomes a more difficult problem of kinematics when both animal and object are moving and the geometry changes, as in Kim’s ball catching example (Kim et al., 2010).
3.4.2 Affordance Mechanism
Having the right spatial disposition alone is not enough. There must be an energy and interaction mechanism to get the resources into contact and to
enable the desired cause and effect. For the syringe to be gripped, the hand must exert force on it through the fingers to prevent slipping and crushing. The use of forces in this case is the ‘mechanism’ or what enables the transformation – to hold the syringe. The affordance transformation mechanism refers to the laws of nature that must hold for the cause and effect interaction between the resources to take place. The most common mechanism in substantive interactions is force, supplied by an animal or machine agent. The affordance mechanism is the cause and effect transformation at the interface between the two or more interacting resources and its properties that enable the transformation (adapted from Michell 2013).
Mechanism refers to the behaviour and properties of the energy transfer that drives the transformation eg human energy, chemical, electrical etc. This fits with Gibson’s ecological approach. Other mechanisms exist. Chemical mechanisms, enable a substance eg sugar to dissolve in a fluid, if the sugar has appropriate properties ie sufficient surface area and if the sugar’s bonds can be broken by a fluid such as water. This represents an object-object transformation between the water and sugar. The mechanism of electric induction depends on the properties of a wire and electromagnetic field and enables an electric current to appear in a wire. This mechanism is necessary for affordance and capability of an electric motor ie a motor affords rotation. Without it the motor has no capability or affordance. Mechanisms are not confined to substantive actions, but include human cognition sense making – or semiosis (Stamper and Liu 1994). The mechanism for the nurse holding the syringe includes the need to perceive the situation (position of the syringe) and the affordance of the object (can the syringe be held – how big/heavy is it, will it fit?). Holding the syringe ‘to give an injection’ requires different knowledge and skill (repeated affordance experience) than a simple grasp (Andre, 2011) to actualise the affordance–effectivity action of ‘inject’. Hence mechanisms should ideally include cognitive resources in terms of ‘know what, how and why’ that enable the agent to make intelligent decisions to enable the resources to interact. The complete capability model should include perception, cognitive behaviours (Michell, 2013) and capability mechanisms that will affect whether the animal is able to a) perceive and b) understand and bring the resources appropriately together with the right disposition to enable the path and mechanism to effect transformation. For space reasons we only include a brief perception example.
Fourth International Symposium on Business Modeling and Software Design
78
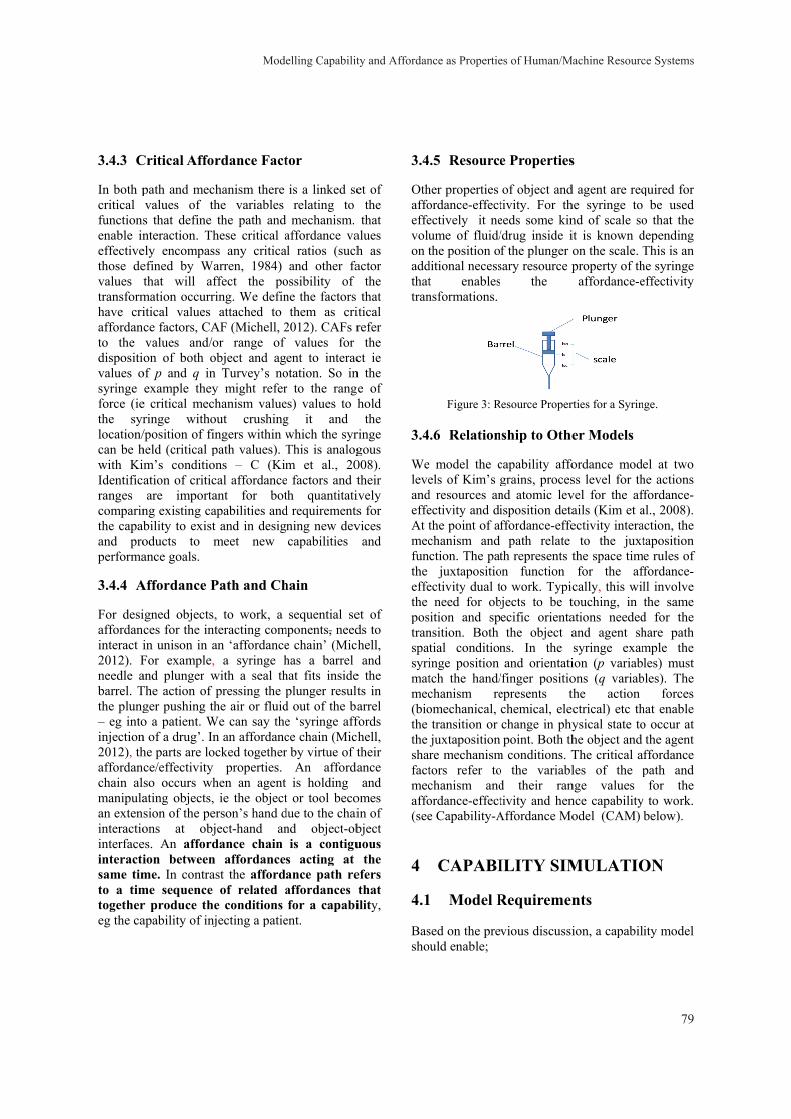
3.4.3 C
In both pcritical functionsenable ineffectivethose devalues transformhave criaffordanto the dispositivalues osyringe force (iethe syrlocation/can be hwith KiIdentificranges comparinthe capaband properforma
3.4.4 A
For desiaffordaninteract i2012). Fneedle abarrel. Tthe plung– eg intoinjection2012), thaffordanchain almanipulaan exteninteractiointerfaceinteractisame timto a timtogethereg the ca
Critical Affo
path and mecvalues of ths that define nteraction. Th
ely encompasefined by Wathat will af
mation occurritical values
nce factors, CAvalues and/oon of both o
of p and q inexample they
e critical mecringe witho/position of fiheld (critical pim’s conditioation of criticare importa
ng existing caability to existoducts to mance goals.
Affordance P
igned objectsnces for the intin unison in aFor example,and plunger wThe action of ger pushing tho a patient. Wn of a drug’. Inhe parts are lonce/effectivity so occurs whating objects, sion of the peons at objes. An affordion betweenme. In contrame sequence r produce theapability of inj
rdance Fact
chanism there he variables the path and
hese critical ass any criticaarren, 1984) ffect the poring. We defin
attached to AF (Michell, 2or range of object and agn Turvey’s noy might referhanism value
out crushingngers within wpath values). Tons – C (Kimcal affordanceant for botapabilities andt and in desigmeet new
Path and Ch
, to work, a teracting coman ‘affordance a syringe h
with a seal thpressing the phe air or fluid
We can say then an affordanc
ocked togetherproperties.
hen an agentie the object
erson’s hand dject-hand andance chain
n affordanceast the afford
of related ae conditions jecting a patie
tor
is a linked serelating to mechanism.
affordance vaal ratios (such
and other faossibility of ne the factors
them as cri2012). CAFs r
values for ent to interac
otation. So inr to the ranges) values to hg it and which the syrThis is analogm et al., 20
e factors and tth quantitatid requirementsning new devcapabilities
hain
sequential semponents, need
e chain’ (Michhas a barrel hat fits insideplunger result
d out of the bae ‘syringe affce chain (Michr by virtue of t
An affordais holding
t or tool becodue to the chaind object-obis a contigu
s acting at ance path reaffordances for a capabi
ent.
et of the
that alues h as actor
the that
itical refer
the ct ie
n the e of hold
the ringe gous 008). their ively s for vices
and
et of ds to hell, and
e the ts in arrel fords hell, their ance and
omes in of bject uous
the efers that ility,
3.4
Othaffoeffevoluon taddthattran
3.4
WeleveandeffeAt tmecfunthe effethe postranspasyrimatmec(biothe the shafactmecaffo(see
4
4.1
Bassho
.5 Resource
her properties ordance-effectectively it neume of fluid/the position o
ditional necesst enablesnsformations.
Figure 3: R
.6 Relation
e model the cels of Kim’s g
d resources anectivity and dithe point of afchanism and ction. The pat
juxtapositioectivity dual t
need for obsition and spnsition. Both tial conditioninge position tch the hand/chanism reomechanical, transition or juxtaposition re mechanismtors refer tochanism andordance-effecte Capability-A
CAPABI
1 Model R
sed on the preould enable;
e Properties
of object andtivity. For theeds some kin/drug inside if the plunger osary resource p the
Resource Proper
nship to Othe
capability affograins, procesnd atomic levisposition detaffordance-effe
path relate th represents t
on function o work. Typic
bjects to be tecific orientathe object a
ns. In the and orientati
/finger positioepresents tchemical, elechange in phypoint. Both th
m conditions. To the variabld their rantivity and henAffordance Mo
ILITY SIM
Requiremen
vious discussi
s
d agent are reqhe syringe to nd of scale soit is known don the scale. Tproperty of thaffordance-e
rties for a Syrin
er Models
fordance modess level for thvel for the afails (Kim et aectivity intera
to the juxtthe space timfor the af
cally, this wiltouching, in ations neededand agent shsyringe examion (p variabons (q variabthe action ectrical) etc thysical state tohe object and The critical ales of the p
nge values nce capabilityodel (CAM)
MULATIO
nts
ion, a capabil
quired for be used
o that the depending This is an
he syringe effectivity
nge.
el at two he actions ffordance-al., 2008). action, the taposition e rules of
ffordance-ll involve the same
d for the hare path mple the les) must
bles). The forces
hat enable o occur at the agent ffordance path and for the
y to work. below).
ON
ity model
Modelling Capability and Affordance as Properties of Human/Machine Resource Systems
79
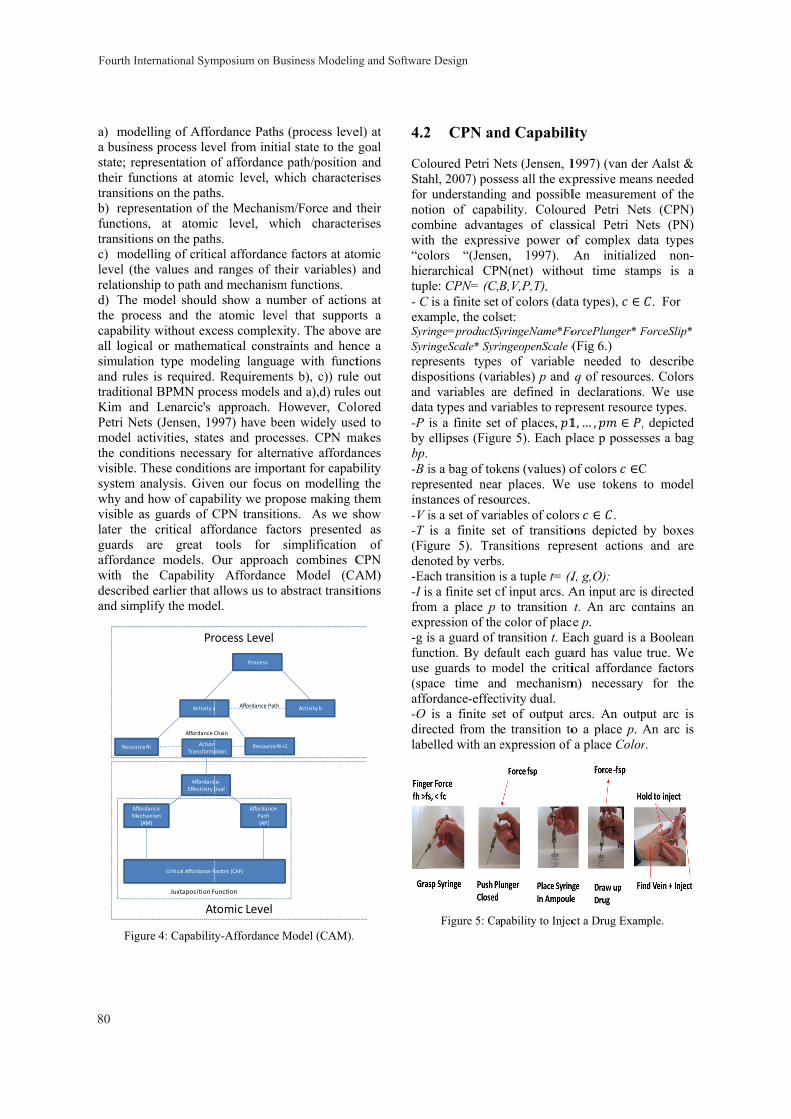
a) modea businestate; reptheir funtransitionb) reprefunctionstransitionc) modelevel (threlationsd) The mthe proccapabilitall logicsimulatioand ruletraditionKim andPetri Nemodel athe condvisible. Tsystem awhy andvisible alater theguards affordanwith thdescribedand simp
Figu
Resource
AfforMec
(A
elling of Affoss process levpresentation onctions at atomns on the pathesentation of ts, at atomicns on the pathelling of critic
he values and ship to path anmodel should
cess and the ty without excal or mathemon type modes is required.
nal BPMN prod Lenarcic's
ets (Jensen, 19activities, stateditions necessThese conditioanalysis. Gived how of capabas guards of Ce critical affare great
nce models. Oe Capabilityd earlier that aplify the mode
ure 4: Capabilit
Activity a
e Ri
AffordancEffectivity D
ActionTransforma
Affordance C
rdance hanism AM)
Critical Affordance F
Pr
AtJuxtaposition F
ordance Paths vel from initiaof affordance mic level, wh
hs. the Mechanismc level, whihs. cal affordance
ranges of thend mechanismd show a num
atomic levelcess complexi
matical constraeling languag Requirement
ocess models aapproach. H
997) have beees and procesary for alternons are imporen our focus bility we propCPN transitiofordance facttools for s
Our approachy Affordance allows us to ael.
ty-Affordance M
Process
a
Resource Ri+1
ce-Dual
ation
Chain
Affordance Path
Affordance Path(AP)
Factors (CAF)
rocess Level
tomic Levelunction
(process leveal state to the path/position
hich character
m/Force and tich character
e factors at atoeir variables)
m functions. mber of actionl that suppority. The aboveaints and henge with functts b), c)) ruleand a),d) rules
However, Coloen widely usesses. CPN manative affordantant for capabon modelling
pose making tns. As we sors presentedsimplification h combines C
Model (CAabstract transit
Model (CAM).
Activity b
1
el) at goal and
rises
their rises
omic and
ns at rts a e are
nce a tions e out s out ored
ed to akes nces
bility g the them show d as
of CPN AM) tions
4.2
ColStahfor noticomwith“cohiertupl- CexaSyriSyrireprdispanddata-P by bp.-B ireprinst-V i-T(Figden-Ea-I isfromexp-g ifunuse(spaaffo-O direlabe
2 CPN an
loured Petri Nhl, 2007) possunderstandin
ion of capabmbine advanth the express
olors “(Jenserarchical CPNle: CPN= (C,Bis a finite set
ample, the colsinge=productSyingeScale* Syriresents typespositions (vard variables ara types and vais a finite setellipses (Figu
is a bag of tokresented neartances of resouis a set of variis a finite segure 5). Trannoted by verbsach transition is a finite set om a place ppression of theis a guard of tction. By defguards to m
ace time anordance-effectis a finite se
ected from thelled with an e
Figure 5: Ca
nd Capabili
Nets (Jensen, 1sess all the expg and possibl
bility. Colourages of classsive power oen, 1997). N(net) withoB,V,P,T), of colors (dat
set: yringeName*FoingeopenScale (s of variableiables) p and re defined in ariables to rep
of places, 1ure 5). Each p
kens (values) or places. We urces. iables of coloret of transitionsitions repres. is a tuple t= (If input arcs. Ato transition
e color of plactransition t. Eafault each gua
model the critid mechanismtivity dual. et of output ae transition toexpression of
pability to Injec
ity
1997) (van dexpressive meanle measuremered Petri Netsical Petri N
of complex dAn initializ
out time stam
ta types), ∈orcePlunger* F(Fig 6.)
e needed to q of resourcedeclarations.
present resourc1,… , ∈ ,place p posses
of colors ∈Cuse tokens
rs ∈ . ons depicted besent actions
(I, g,O): An input arc ist. An arc co
ce p. ach guard is aard has value ical affordanc
m) necessary
arcs. An outpo a place p. A
f a place Color
ct a Drug Exam
r Aalst & ns needed ent of the ts (CPN)
Nets (PN) data types ed non-
mps is a
. For
ForceSlip*
describe es. Colors . We use ce types. depicted
sses a bag
C to model
by boxes and are
s directed ntains an
a Boolean true. We
ce factors for the
put arc is An arc is r.
mple.
Fourth International Symposium on Business Modeling and Software Design
80
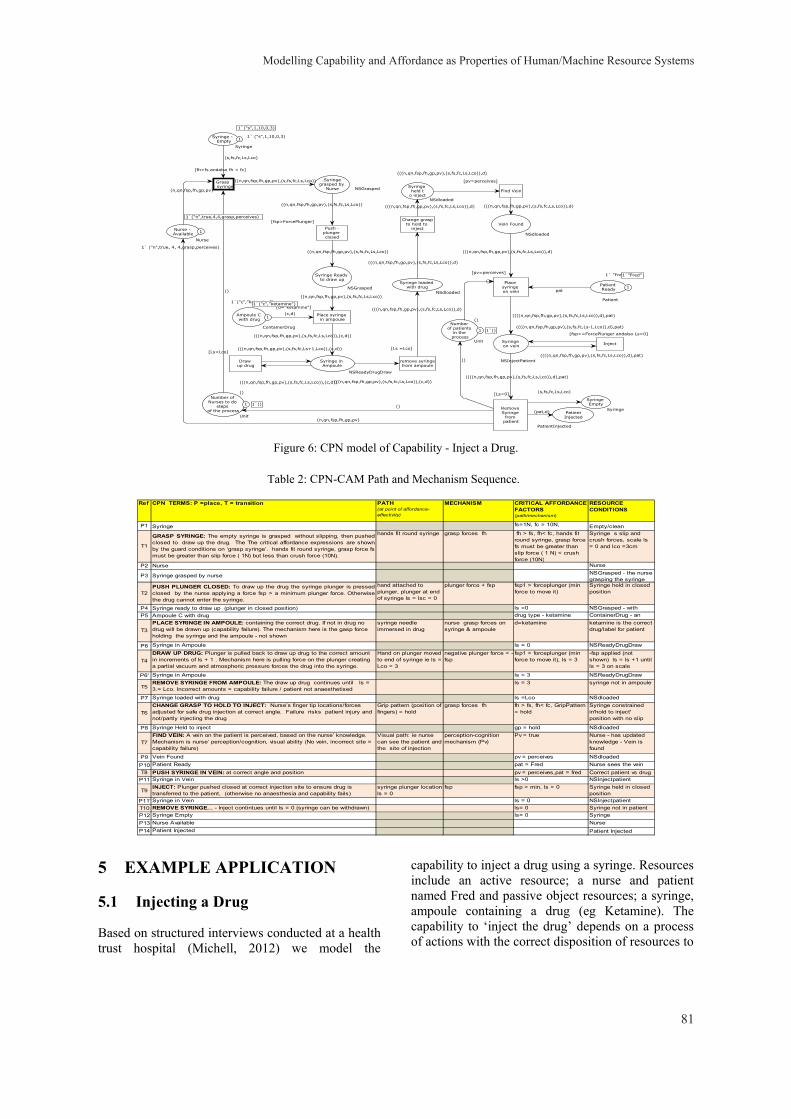
Figure 6: CPN model of Capability - Inject a Drug.
5 EXAMPLE APPLICATION
5.1 Injecting a Drug
Based on structured interviews conducted at a health trust hospital (Michell, 2012) we model the
capability to inject a drug using a syringe. Resources include an active resource; a nurse and patient named Fred and passive object resources; a syringe, ampoule containing a drug (eg Ketamine). The capability to ‘inject the drug’ depends on a process of actions with the correct disposition of resources to
Syringe - Empty
Syringe
1` ("s",1,10,0,3)
Nurse - Available
Nurse
1` ("n",true, 4, 4,grasp,perceives)
.Syringe grasped by
Nurse NSGrasped
Syringe Ready to draw up
NSGrasped
Ampoule C with drug
ContainerDrug
1`("c","ketamine")
Syringe in Ampoule
NSReadyDrugDraw
Syringe loaded with drug
NSdloaded
Vein Found
NSdloaded
Patient Ready
Patient
1` "Fred"
Syringe Empty
SyringePatientInjected
PatientInjected
Syringe on vein
NSInjectPatient
Number of Nurses to do
steps of the process
Unit
()
Number of patients
in the process
Unit
()
Syringe held t
o injectNSdloaded
Grasp - syringe
[fh>fs andalso fh < fc]
Push -plunger closed
[fsp>ForcePlunger]
Place syringe in ampoule
[d="ketamine"]
Draw up drug
[Ls<Lco]
remove syringefrom ampoule
[Ls =Lco]
Change graspto hold to
inject
Place syringe on vein
[pv=perceives]
Remove Syringe
from patient
[Ls=0]
Inject
[fsp>=ForcePlunger andalso Ls>0]
Find Vein
[pv=perceives]
(s,fs,fc,Ls,Lco)
(n,qn,fsp,fh,gp,pv)
((n,qn,fsp,fh,gp,pv),(s,fs,fc,Ls,Lco))
((n,qn,fsp,fh,gp,pv),(s,fs,fc,Ls,Lco))
((n,qn,fsp,fh,gp,pv),(s,fs,fc,Ls,Lco))
((n,qn,fsp,fh,gp,pv),(s,fs,fc,Ls,Lco))
(c,d)
(((n,qn,fsp,fh,gp,pv),(s,fs,fc,Ls,Lco)),(c,d))
(((n,qn,fsp,fh,gp,pv),(s,fs,fc,Ls+1,Lco)),(c,d))
(((n,qn,fsp,fh,gp,pv),(s,fs,fc,Ls,Lco)),(c,d))
(((n,qn,fsp,fh,gp,pv),(s,fs,fc,Ls,Lco)),d)
(((n,qn,fsp,fh,gp,pv),(s,fs,fc,Ls,Lco)),d)
(((n,qn,fsp,fh,gp,pv),(s,fs,fc,Ls,Lco)),d)
pat
(pat,d)
(((n,qn,fsp,fh,gp,pv),(s,fs,fc,Ls,Lco)),(c,d))((((n,qn,fsp,fh,gp,pv),(s,fs,fc,Ls,Lco)),d),pat)
((((n,qn,fsp,fh,gp,pv),(s,fs,fc,Ls,Lco)),d),pat)
((((n,qn,fsp,fh,gp,pv),(s,fs,fc,Ls-1,Lco)),d),pat)
(s,fs,fc,Ls,Lco)
((((n,qn,fsp,fh,gp,pv),(s,fs,fc,Ls,Lco)),d),pat)
()
()
()
()
(((n,qn,fsp,fh,gp,pv),(s,fs,fc,Ls,Lco)),d)
(((n,qn,fsp,fh,gp,pv),(s,fs,fc,Ls,Lco)),d)
(((n,qn,fsp,fh,gp,pv),(s,fs,fc,Ls,Lco)),d)
(n,qn,fsp,fh,gp,pv)
1
1`("s",1,10,0,3)
1
1`("n",true,4,4,grasp,perceives)
1
1`("c","ketamine")
1
1`"Fred"
1 1`()
1 1`()
Ref CPN TERMS: P =place, T = transition PATH (at point of affordance-effectivity)
MECHANISM CRITICAL AFFORDANCE FACTORS (path/mechanism)
RESOURCE CONDITIONS
P1 Syringe fs=1N, fc = 10N, Empty/clean
T1
GRASP SYRINGE: The empty syringe is grasped without slipping, then pushedclosed to draw up the drug. The The critical affordance expressions are shownby the guard conditions on ‘grasp syringe’. hands fit round syringe, grasp force fs must be greater than slip force ( 1N) but less than crush force (10N).
hands fit round syringe grasp forces fh fh > fs, fh< fc, hands fit round syringe, grasp force fs must be greater than slip force ( 1 N) < crush force (10N)
Syringe s slip and crush forces, scale ls = 0 and lco =3cm
P2 Nurse Nurse
P3 Syringe grasped by nurse NSGrasped - the nurse grasping the syringe
T2PUSH PLUNGER CLOSED: To draw up the drug the syringe plunger is pressedclosed by the nurse applying a force fsp > a minimum plunger force. Otherwisethe drug cannot enter the syringe.
hand attached to plunger, plunger at end of syringe ls = lsc = 0
plunger force + fsp fsp1 > forceplunger (min force to move it)
Syringe held in closed position
P4 Syringe ready to draw up (plunger in closed position) ls =0 NSGrasped - with P5 Ampoule C with drug drug type - ketamine ContainerDrug - an
T3PLACE SYRINGE IN AMPOULE: containing the correct drug. If not in drug no drug will be drawn up (capability failure). The mechanism here is the gasp force holding the syringe and the ampoule - not shown
syringe needle immersed in drug
nurse grasp forces on syringe & ampoule
d=ketamine ketamine is the correct drug/label for patient
P6 Syringe in Ampoule ls = 0 NSReadyDrugDraw
T4DRAW UP DRUG: Plunger is pulled back to draw up drug to the correct amount in increments of ls + 1 . Mechanism here is pulling force on the plunger creating a partial vacuum and atmospheric pressure forces the drug into the syringe.
Hand on plunger moved to end of syringe ie ls = Lco = 3
negative plunger force = -fsp
fsp1 > forceplunger (min force to move it), ls = 3
-fsp applied (not shown) ls = ls +1 until ls = 3 on scale
P6' Syringe in Ampoule ls = 3 NSReadyDrugDraw
T5REMOVE SYRINGE FROM AMPOULE: The draw up drug continues until ls = 3.= Lco. Incorrect amounts = capability failure / patient not anaesthetised
ls = 3 syringe not in ampoule
P7 Syringe loaded with drug ls =Lco NSdloaded
T6CHANGE GRASP TO HOLD TO INJECT: Nurse’s finger tip locations/forces adjusted for safe drug injection at correct angle. Failure risks patient injury and not/partly injecting the drug
Grip pattern (position of fingers) = hold
grasp forces fh fh > fs, fh< fc, GripPattern = hold
Syringe constrained in'hold to inject' position with no slip
P8 Syringe Held to inject gp = hold NSdloaded
T7FIND VEIN: A vein on the patient is perceived, based on the nurse’ knowledge. Mechanism is nurse’ perception/cognition, visual ability (No vein, incorrect site = capability failure)
Visual path: ie nurse can see the patient and the site of injection
perception-cognition mechanism (Pv)
Pv = true Nurse - has updated knowledge - Vein is found
P9 Vein Found pv = perceives NSdloaded
P10 Patient Ready pat = Fred Nurse sees the veinT8 PUSH SYRINGE IN VEIN: at correct angle and position pv = perceives,pat = fred Correct patient vs drug
P11 Syringe in Vein ls >0 NSInjectpatient
T9INJECT: Plunger pushed closed at correct injection site to ensure drug is transferred to the patient, (otherwise no anaesthesia and capability fails)
syringe plunger location ls = 0
fsp fsp > min, ls > 0 Syringe held in closed position
P11' Syringe in Vein ls = 0 NSInjectpatientT10 REMOVE SYRINGE... - Inject contintues until ls = 0 (syringe can be withdrawn) ls= 0 Syringe not in patientP12 Syringe Empty ls= 0 SyringeP13 Nurse Available NurseP14 Patient Injected Patient Injected
Table 2: CPN-CAM Path and Mechanism Sequence.
Modelling Capability and Affordance as Properties of Human/Machine Resource Systems
81
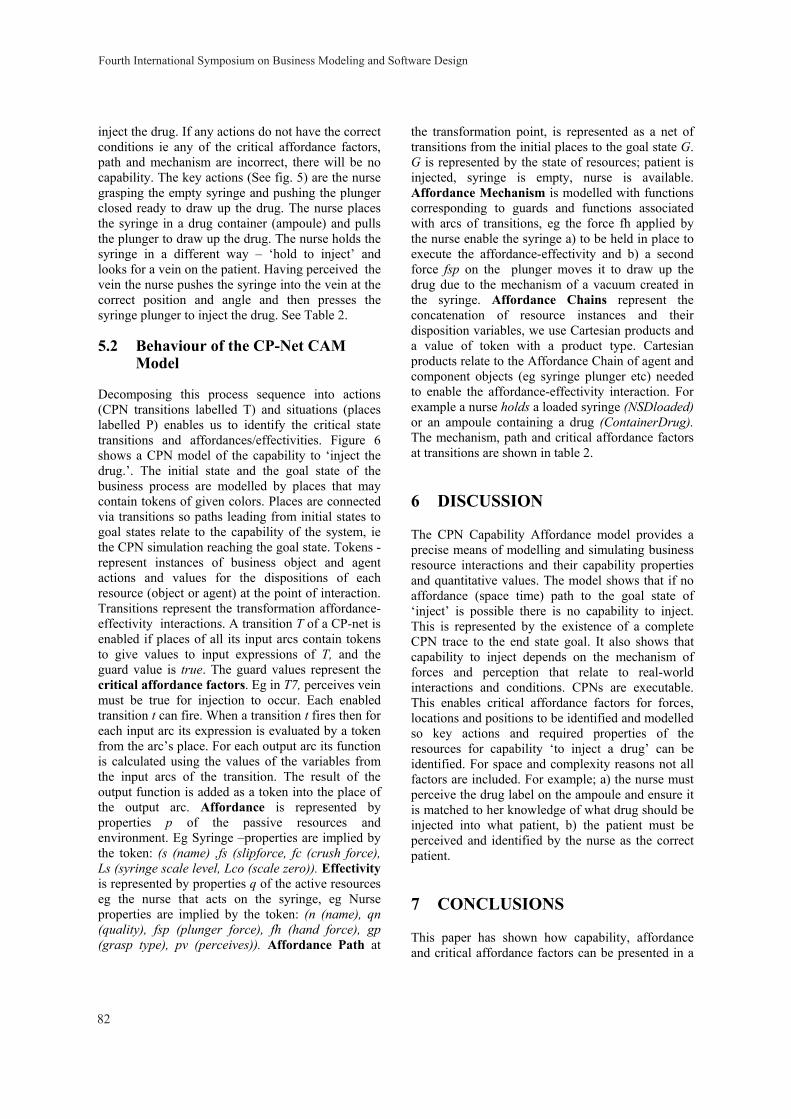
inject the drug. If any actions do not have the correct conditions ie any of the critical affordance factors, path and mechanism are incorrect, there will be no capability. The key actions (See fig. 5) are the nurse grasping the empty syringe and pushing the plunger closed ready to draw up the drug. The nurse places the syringe in a drug container (ampoule) and pulls the plunger to draw up the drug. The nurse holds the syringe in a different way – ‘hold to inject’ and looks for a vein on the patient. Having perceived the vein the nurse pushes the syringe into the vein at the correct position and angle and then presses the syringe plunger to inject the drug. See Table 2.
5.2 Behaviour of the CP-Net CAM Model
Decomposing this process sequence into actions (CPN transitions labelled T) and situations (places labelled P) enables us to identify the critical state transitions and affordances/effectivities. Figure 6 shows a CPN model of the capability to ‘inject the drug.’. The initial state and the goal state of the business process are modelled by places that may contain tokens of given colors. Places are connected via transitions so paths leading from initial states to goal states relate to the capability of the system, ie the CPN simulation reaching the goal state. Tokens - represent instances of business object and agent actions and values for the dispositions of each resource (object or agent) at the point of interaction. Transitions represent the transformation affordance-effectivity interactions. A transition T of a CP-net is enabled if places of all its input arcs contain tokens to give values to input expressions of T, and the guard value is true. The guard values represent the critical affordance factors. Eg in T7, perceives vein must be true for injection to occur. Each enabled transition t can fire. When a transition t fires then for each input arc its expression is evaluated by a token from the arc’s place. For each output arc its function is calculated using the values of the variables from the input arcs of the transition. The result of the output function is added as a token into the place of the output arc. Affordance is represented by properties p of the passive resources and environment. Eg Syringe –properties are implied by the token: (s (name) ,fs (slipforce, fc (crush force), Ls (syringe scale level, Lco (scale zero)). Effectivity is represented by properties q of the active resources eg the nurse that acts on the syringe, eg Nurse properties are implied by the token: (n (name), qn (quality), fsp (plunger force), fh (hand force), gp (grasp type), pv (perceives)). Affordance Path at
the transformation point, is represented as a net of transitions from the initial places to the goal state G. G is represented by the state of resources; patient is injected, syringe is empty, nurse is available. Affordance Mechanism is modelled with functions corresponding to guards and functions associated with arcs of transitions, eg the force fh applied by the nurse enable the syringe a) to be held in place to execute the affordance-effectivity and b) a second force fsp on the plunger moves it to draw up the drug due to the mechanism of a vacuum created in the syringe. Affordance Chains represent the concatenation of resource instances and their disposition variables, we use Cartesian products and a value of token with a product type. Cartesian products relate to the Affordance Chain of agent and component objects (eg syringe plunger etc) needed to enable the affordance-effectivity interaction. For example a nurse holds a loaded syringe (NSDloaded) or an ampoule containing a drug (ContainerDrug). The mechanism, path and critical affordance factors at transitions are shown in table 2.
6 DISCUSSION
The CPN Capability Affordance model provides a precise means of modelling and simulating business resource interactions and their capability properties and quantitative values. The model shows that if no affordance (space time) path to the goal state of ‘inject’ is possible there is no capability to inject. This is represented by the existence of a complete CPN trace to the end state goal. It also shows that capability to inject depends on the mechanism of forces and perception that relate to real-world interactions and conditions. CPNs are executable. This enables critical affordance factors for forces, locations and positions to be identified and modelled so key actions and required properties of the resources for capability ‘to inject a drug’ can be identified. For space and complexity reasons not all factors are included. For example; a) the nurse must perceive the drug label on the ampoule and ensure it is matched to her knowledge of what drug should be injected into what patient, b) the patient must be perceived and identified by the nurse as the correct patient.
7 CONCLUSIONS
This paper has shown how capability, affordance and critical affordance factors can be presented in a
Fourth International Symposium on Business Modeling and Software Design
82
CPN model. It shows how capability depends on; a) the existence of a possible path of interaction between the resources (nurse, syringe, ampoule, patient), b) a mechanism of transition (forces and drug interaction in this case), c) specific critical affordance factors relating to the actual value of the affordance and effectivity variables for resources such as people and objects within instances, d) That these variables relate to Gibson’s original explanation of affordance disposition and the affordance-effectivity dual relationship. Future work will focus on the detail of a single action and its affordance-effectivity relationship by decomposing this into affordance path, mechanism and affordance factors, including perception and planning as well as control actions.
REFERENCES
Andre 2011: http://www.usernomics.com/AnthonyAndre. PDApresentation.WhatMakesAPrefilledSyringeUsableAndErgonomic.July2011.pdf
Beimborn, D., Martin S.F., Homann U. 2005. Capability Oriented Modelling of the Firm. IPSI
Conference. Brooks R.A.. New approaches to robotics. Science,
253(5025):1227, 1991. Gallouj, F., Weinstein O., 1997. Innovation in services.
Research Policy, Vol 26, Issues 4-5. Gibson, J.: The Ecological Approach to Visual Perception.
Houghton Mifflin Company, Boston (1979)California Management Review.
Greeno J.G. Gibson's affordances. Psychological Review, 101(2):336- 342,1994..
Jensen. K., Coloured Petri Nets.Springer.1997 Kim, N., Thiruvengada, H., Rothrock, L., Wysk, R. A., &
Shin, D., (2008). Modelling of affordances in human-involved complex systems using finite state automata (FSA). IEEE Transactions on Systems, Man, and Cybernetics-Part A: Humans and Systems.
Kim, N. H., (2010). The Formalism of Affordance in Human-machine Cooperative Systems Using Finite State Automata (FSA) (Doctoral dissertation, The Pennsylvania State University).
Lenarčič, A. (2011). Formalizing affordances in situation theory (Unpublished master’s thesis).Brock University, Department of Computer Science, Ontario, Canada.
Lenarčič, A., & Winter, M. (2013). Affordances in Situation Theory. Ecological Psychology, 25(2), 155-181.
Makadok, R. 2001. Towards a synthesis of the resource based dynamic capability views of rent creation. Strategic Management Journal.22: 387–401.
Mantel, B., Hoppenot, P., & Colle, E. (2012). Perceiving for Acting With Teleoperated Robots: Ecological Principles to Human–Robot Interaction Design.
Systems, Man and Cybernetics, Part A: Systems and Humans, IEEE Transactions on, 42(6), 1460-1475.
Mark, L. (1987). Eye height-scale information about affordances: A study of sitting and stair climbing. Journal of Experimental Psychology: Human Perception and Performance, 13, 360–370.
Michell, V.A.(2011) A Focused Approach to Business Capability. First International Symposium on Business Modelling and Software Design – BMSD 2011, Sofia, Bulgaria, pp. 105–113.
Michell V.A. (2012) The Capability Affordance Model: Comparing Medical Capabilities. In: B. Shishkov (Ed.) Business Modeling and Software Design – BMSD’12 Revised Selected Papers, Springer-Verlag – Lecture Notes in Business Information Processing, Berlin-Heidelberg.
Michell V.A. Cognition capabilities and the capability-affordance model. Business Modelling and Software Design BMSD 13 Noordwijkerhout, Netherlands 8-10 July 2013
Ortmann, J. and Kuhn, W. (2010). Affordances as Qualities. In Galton, A. and Mizoguchi,R., editor, Formal Ontology in Information Systems Proceedings of the Sixth International Conference (FOIS 2010), volume 209 of Frontiers in ArtificialIntelligence and Applications, pages 117–130, Amsterdam Berlin Tokyo Washington,DC. IOS Press.
Prahalad, C.K., Hamel G.: The Core Competence of the Corporation. HBR, May- June 2-15(1990)
Sahin E., Cakmak, M., Dogar, M.R. Ugur, E.. Ucoluk G.. To Afford or Not to Afford: A New Formalization of Affordances Toward Affordance-Based Robot Control. Adaptive Behavior, 15(4):447-472, 2007.
Stamper (1994) SE4 Organisational dynamics social norms and information systems
Steedman M.. Formalizing affordance. Proceedings of the 24th Annual Meeting of the Cognitive Science Society, pages 834-839, 2002.
Stoffregen. T .A. Affordances as Properties of the Animal-Environment System. Ecological Psychology, 15(2):115-134, 2003.
Turvey, M.T.: Affordances and Prospective Control: An Outline of the Ontology. Ecological Psychology 4(3), 173–187 (1992)
Van der Aalst W.M.P. and Stahl. C. Modeling Business Processes - A Petri Net-Oriented Approach. The MIT Press, 2011.
Warren, W.H.: Perceiving Affordances: A Visual Guidance of Stair Climbing. Journal of Experimental Psychology: Human Perception and Performance 10(5), 683–703 (1984)
Modelling Capability and Affordance as Properties of Human/Machine Resource Systems
83
Using UML to Specify Artifact-centric Business Process Models
Montserrat Estanol1, Anna Queralt2, Maria-Ribera Sancho1,2 and Ernest Teniente1
1Universitat Politecnica de Catalunya, Jordi Girona 1-3, 08034 Barcelona, Spain2Barcelona Supercomputing Center, Jordi Girona 31, 08034 Barcelona, Spain
{estanyol, ribera, teniente}@essi.upc.edu, [email protected]
Keywords: Business Artifacts, BALSA Framework, UML, Business Process Modeling
Abstract: Business process modeling using an artifact-centric approach has raised a significant interest over the lastfew years. One of the research challenges in this area is looking for different approaches to represent all thedimensions in artifact-centric business process models. Bearing this in mind, the present paper proposes howto specify artifact-centric business process models by means of diagrams based on UML. The advantages ofbasing our work on UML are many: it is a semi-formal language with a precise semantics; it is widely usedand easy to understand; and it provides an artifact-centric specification which incorporates also some aspectsof process-awareness.
1 INTRODUCTION
Business process models have been traditionallybased on an activity-centric or process-centric per-spective, defining how a business process or workflowis supposed to operate, but giving little importance tothe information produced or needed by the process(Damaggio et al., 2011).
In contrast, the artifact-centric (or data-centric)approach to process modeling considers data as akey element in the business process specification.Business artifacts, representing the data, model keybusiness-relevant entities which are updated by a setof services that implement business process tasks.The main advantage of artifact-centric business pro-cess models over process-centric approaches is thatit is possible to perform semantic reasoning on themodel. That is, the meaning of the tasks can be for-mally defined and it is possible to automatically checkfor any inherent contradictions in their definition. Theartifact-centric approach to business process model-ing has been successfully applied in practice (Bhat-tacharya et al., 2007a) and it has been shown to havea great intuitive appeal to business managers and tosystem developers.
To facilitate the analysis of artifact-centric pro-cess models, (Hull, 2008; Bhattacharya et al., 2009)proposed the use of the BALSA (Business Artifacts,Lifecycles, Services and Associations) framework.This framework establishes the common ground forartifact-centric business process modeling by defin-
ing four different dimensions which, ideally, shouldbe present in any artifact-centric process model:
• Business Artifacts. They represent meaningfuldata for the business, and as such they hold infor-mation needed for the process. Each artifact cor-responds to a real life entity, and therefore may berelated to other business artifacts. A business ar-tifact has an identity and its progress through theworkflow can be tracked.
• Lifecycles. Lifecycles represent the evolution ofan artifact, showing the relevant stages in its life,from the moment it is created until it is destroyedor archived.
• Services. They represent tasks (i.e. meaningfulunits of work) that evolve the artifact in order toachieve the process’s goals. They create, updateand delete business artifacts.
• Associations. Associations represent constraintsin the manner how services make changes to ar-tifacts. This means that associations can restrictthe order in which services are executed. Theymay be specified using a procedural specification(e.g. a workflow) or in a declarative way (e.g.condition-action rules).
Notice that, for the remainder of this work, we use theterm service with the meaning defined above, whichdiffers from its definition in Service Science.
One of the research challenges in artifact-centricbusiness process modeling is to find the “best” model
84
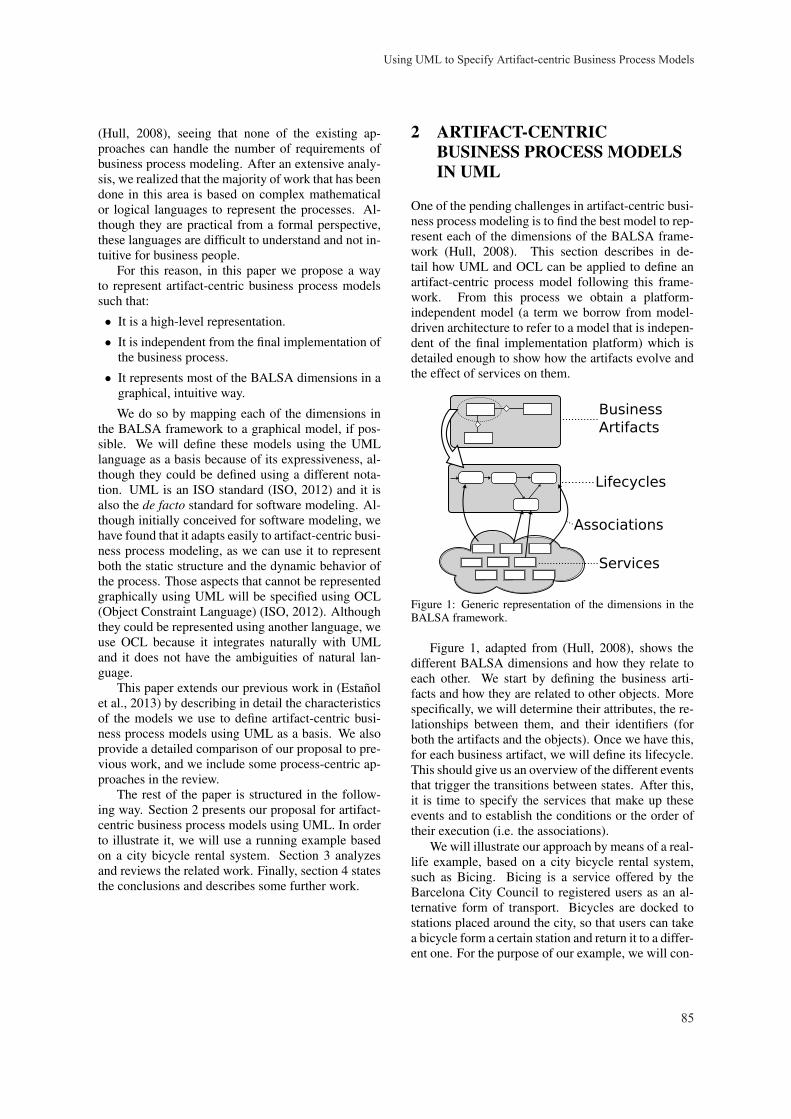
(Hull, 2008), seeing that none of the existing ap-proaches can handle the number of requirements ofbusiness process modeling. After an extensive analy-sis, we realized that the majority of work that has beendone in this area is based on complex mathematicalor logical languages to represent the processes. Al-though they are practical from a formal perspective,these languages are difficult to understand and not in-tuitive for business people.
For this reason, in this paper we propose a wayto represent artifact-centric business process modelssuch that:
• It is a high-level representation.
• It is independent from the final implementation ofthe business process.
• It represents most of the BALSA dimensions in agraphical, intuitive way.
We do so by mapping each of the dimensions inthe BALSA framework to a graphical model, if pos-sible. We will define these models using the UMLlanguage as a basis because of its expressiveness, al-though they could be defined using a different nota-tion. UML is an ISO standard (ISO, 2012) and it isalso the de facto standard for software modeling. Al-though initially conceived for software modeling, wehave found that it adapts easily to artifact-centric busi-ness process modeling, as we can use it to representboth the static structure and the dynamic behavior ofthe process. Those aspects that cannot be representedgraphically using UML will be specified using OCL(Object Constraint Language) (ISO, 2012). Althoughthey could be represented using another language, weuse OCL because it integrates naturally with UMLand it does not have the ambiguities of natural lan-guage.
This paper extends our previous work in (Estanolet al., 2013) by describing in detail the characteristicsof the models we use to define artifact-centric busi-ness process models using UML as a basis. We alsoprovide a detailed comparison of our proposal to pre-vious work, and we include some process-centric ap-proaches in the review.
The rest of the paper is structured in the follow-ing way. Section 2 presents our proposal for artifact-centric business process models using UML. In orderto illustrate it, we will use a running example basedon a city bicycle rental system. Section 3 analyzesand reviews the related work. Finally, section 4 statesthe conclusions and describes some further work.
2 ARTIFACT-CENTRICBUSINESS PROCESS MODELSIN UML
One of the pending challenges in artifact-centric busi-ness process modeling is to find the best model to rep-resent each of the dimensions of the BALSA frame-work (Hull, 2008). This section describes in de-tail how UML and OCL can be applied to define anartifact-centric process model following this frame-work. From this process we obtain a platform-independent model (a term we borrow from model-driven architecture to refer to a model that is indepen-dent of the final implementation platform) which isdetailed enough to show how the artifacts evolve andthe effect of services on them.
Business Artifacts
Lifecycles
Services
Associations
Figure 1: Generic representation of the dimensions in theBALSA framework.
Figure 1, adapted from (Hull, 2008), shows thedifferent BALSA dimensions and how they relate toeach other. We start by defining the business arti-facts and how they are related to other objects. Morespecifically, we will determine their attributes, the re-lationships between them, and their identifiers (forboth the artifacts and the objects). Once we have this,for each business artifact, we will define its lifecycle.This should give us an overview of the different eventsthat trigger the transitions between states. After this,it is time to specify the services that make up theseevents and to establish the conditions or the order oftheir execution (i.e. the associations).
We will illustrate our approach by means of a real-life example, based on a city bicycle rental system,such as Bicing. Bicing is a service offered by theBarcelona City Council to registered users as an al-ternative form of transport. Bicycles are docked tostations placed around the city, so that users can takea bicycle form a certain station and return it to a differ-ent one. For the purpose of our example, we will con-
Using UML to Specify Artifact-centric Business Process Models
85
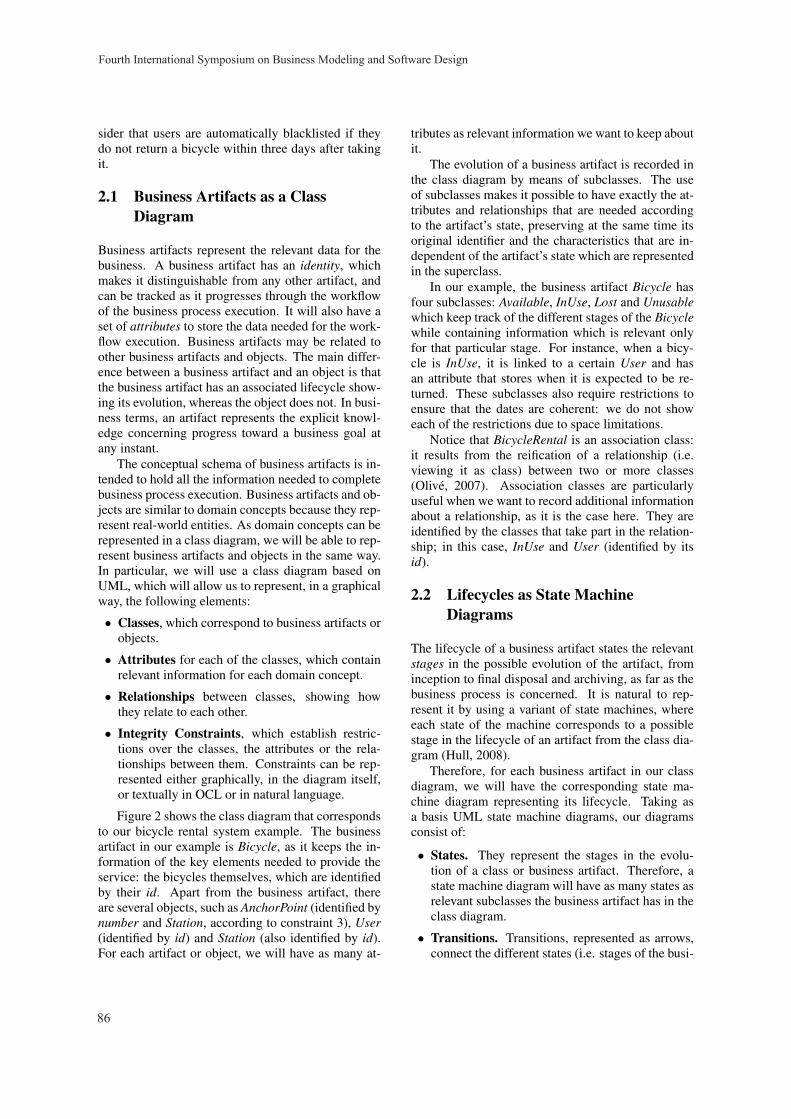
sider that users are automatically blacklisted if theydo not return a bicycle within three days after takingit.
2.1 Business Artifacts as a ClassDiagram
Business artifacts represent the relevant data for thebusiness. A business artifact has an identity, whichmakes it distinguishable from any other artifact, andcan be tracked as it progresses through the workflowof the business process execution. It will also have aset of attributes to store the data needed for the work-flow execution. Business artifacts may be related toother business artifacts and objects. The main differ-ence between a business artifact and an object is thatthe business artifact has an associated lifecycle show-ing its evolution, whereas the object does not. In busi-ness terms, an artifact represents the explicit knowl-edge concerning progress toward a business goal atany instant.
The conceptual schema of business artifacts is in-tended to hold all the information needed to completebusiness process execution. Business artifacts and ob-jects are similar to domain concepts because they rep-resent real-world entities. As domain concepts can berepresented in a class diagram, we will be able to rep-resent business artifacts and objects in the same way.In particular, we will use a class diagram based onUML, which will allow us to represent, in a graphicalway, the following elements:
• Classes, which correspond to business artifacts orobjects.
• Attributes for each of the classes, which containrelevant information for each domain concept.
• Relationships between classes, showing howthey relate to each other.
• Integrity Constraints, which establish restric-tions over the classes, the attributes or the rela-tionships between them. Constraints can be rep-resented either graphically, in the diagram itself,or textually in OCL or in natural language.
Figure 2 shows the class diagram that correspondsto our bicycle rental system example. The businessartifact in our example is Bicycle, as it keeps the in-formation of the key elements needed to provide theservice: the bicycles themselves, which are identifiedby their id. Apart from the business artifact, thereare several objects, such as AnchorPoint (identified bynumber and Station, according to constraint 3), User(identified by id) and Station (also identified by id).For each artifact or object, we will have as many at-
tributes as relevant information we want to keep aboutit.
The evolution of a business artifact is recorded inthe class diagram by means of subclasses. The useof subclasses makes it possible to have exactly the at-tributes and relationships that are needed accordingto the artifact’s state, preserving at the same time itsoriginal identifier and the characteristics that are in-dependent of the artifact’s state which are representedin the superclass.
In our example, the business artifact Bicycle hasfour subclasses: Available, InUse, Lost and Unusablewhich keep track of the different stages of the Bicyclewhile containing information which is relevant onlyfor that particular stage. For instance, when a bicy-cle is InUse, it is linked to a certain User and hasan attribute that stores when it is expected to be re-turned. These subclasses also require restrictions toensure that the dates are coherent: we do not showeach of the restrictions due to space limitations.
Notice that BicycleRental is an association class:it results from the reification of a relationship (i.e.viewing it as class) between two or more classes(Olive, 2007). Association classes are particularlyuseful when we want to record additional informationabout a relationship, as it is the case here. They areidentified by the classes that take part in the relation-ship; in this case, InUse and User (identified by itsid).
2.2 Lifecycles as State MachineDiagrams
The lifecycle of a business artifact states the relevantstages in the possible evolution of the artifact, frominception to final disposal and archiving, as far as thebusiness process is concerned. It is natural to rep-resent it by using a variant of state machines, whereeach state of the machine corresponds to a possiblestage in the lifecycle of an artifact from the class dia-gram (Hull, 2008).
Therefore, for each business artifact in our classdiagram, we will have the corresponding state ma-chine diagram representing its lifecycle. Taking asa basis UML state machine diagrams, our diagramsconsist of:
• States. They represent the stages in the evolu-tion of a class or business artifact. Therefore, astate machine diagram will have as many states asrelevant subclasses the business artifact has in theclass diagram.
• Transitions. Transitions, represented as arrows,connect the different states (i.e. stages of the busi-
Fourth International Symposium on Business Modeling and Software Design
86
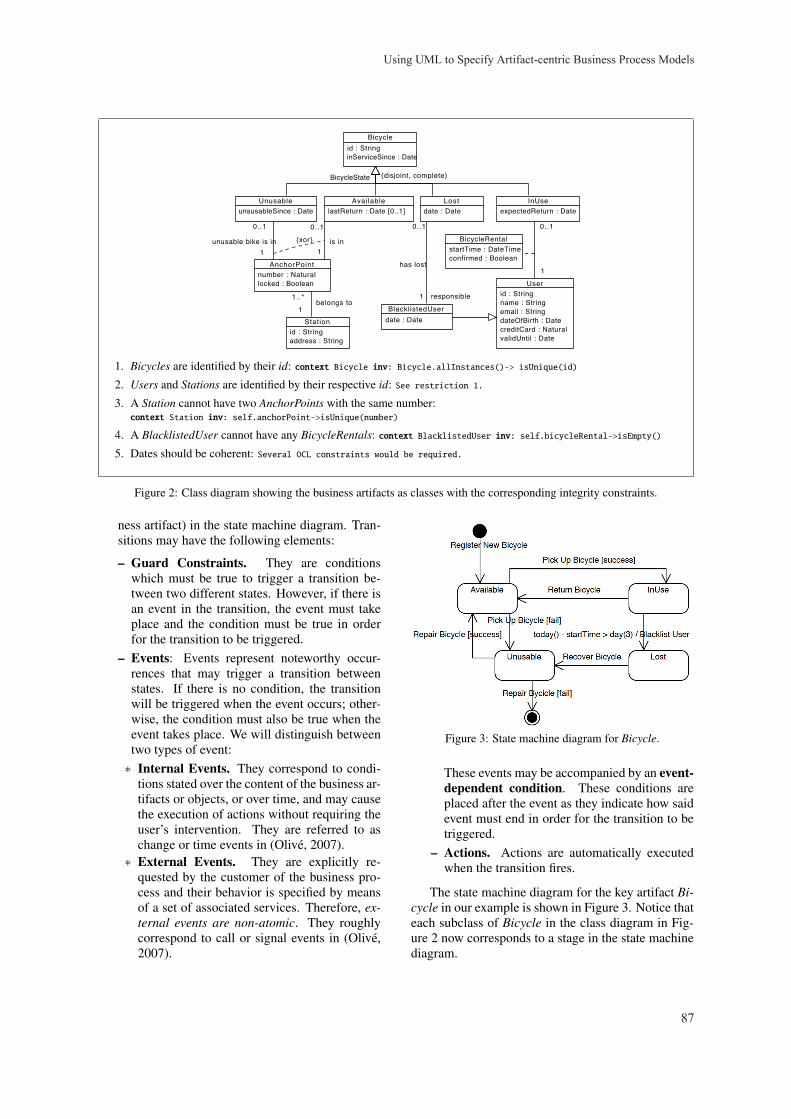
id : String inServiceSince : Date
Bicycle
id : String name : String email : String dateOfBirth : Date creditCard : Natural validUntil : Date
User number : Natural locked : Boolean
AnchorPoint
startTime : DateTime confirmed : Boolean
BicycleRental
expectedReturn : DateInUse
unsusableSince : DateUnusable
date : DateLost
date : DateBlacklistedUser
lastReturn : Date [0..1]Available
id : String address : String
Station
BicycleState
1
0..1
responsible
0..1
11
0..1 0..1
1
1..*
1
has lost
belongs to
{xor}
{disjoint, complete}
unusable bike is in is in
Visual Paradigm for UML Community Edition [not for commercial use]
1. Bicycles are identified by their id: context Bicycle inv: Bicycle.allInstances()-> isUnique(id)
2. Users and Stations are identified by their respective id: See restriction 1.
3. A Station cannot have two AnchorPoints with the same number:context Station inv: self.anchorPoint->isUnique(number)
4. A BlacklistedUser cannot have any BicycleRentals: context BlacklistedUser inv: self.bicycleRental->isEmpty()
5. Dates should be coherent: Several OCL constraints would be required.
Figure 2: Class diagram showing the business artifacts as classes with the corresponding integrity constraints.
ness artifact) in the state machine diagram. Tran-sitions may have the following elements:
– Guard Constraints. They are conditionswhich must be true to trigger a transition be-tween two different states. However, if there isan event in the transition, the event must takeplace and the condition must be true in orderfor the transition to be triggered.
– Events: Events represent noteworthy occur-rences that may trigger a transition betweenstates. If there is no condition, the transitionwill be triggered when the event occurs; other-wise, the condition must also be true when theevent takes place. We will distinguish betweentwo types of event:∗ Internal Events. They correspond to condi-
tions stated over the content of the business ar-tifacts or objects, or over time, and may causethe execution of actions without requiring theuser’s intervention. They are referred to aschange or time events in (Olive, 2007).
∗ External Events. They are explicitly re-quested by the customer of the business pro-cess and their behavior is specified by meansof a set of associated services. Therefore, ex-ternal events are non-atomic. They roughlycorrespond to call or signal events in (Olive,2007).
Figure 3: State machine diagram for Bicycle.
These events may be accompanied by an event-dependent condition. These conditions areplaced after the event as they indicate how saidevent must end in order for the transition to betriggered.
– Actions. Actions are automatically executedwhen the transition fires.
The state machine diagram for the key artifact Bi-cycle in our example is shown in Figure 3. Notice thateach subclass of Bicycle in the class diagram in Fig-ure 2 now corresponds to a stage in the state machinediagram.
Using UML to Specify Artifact-centric Business Process Models
87
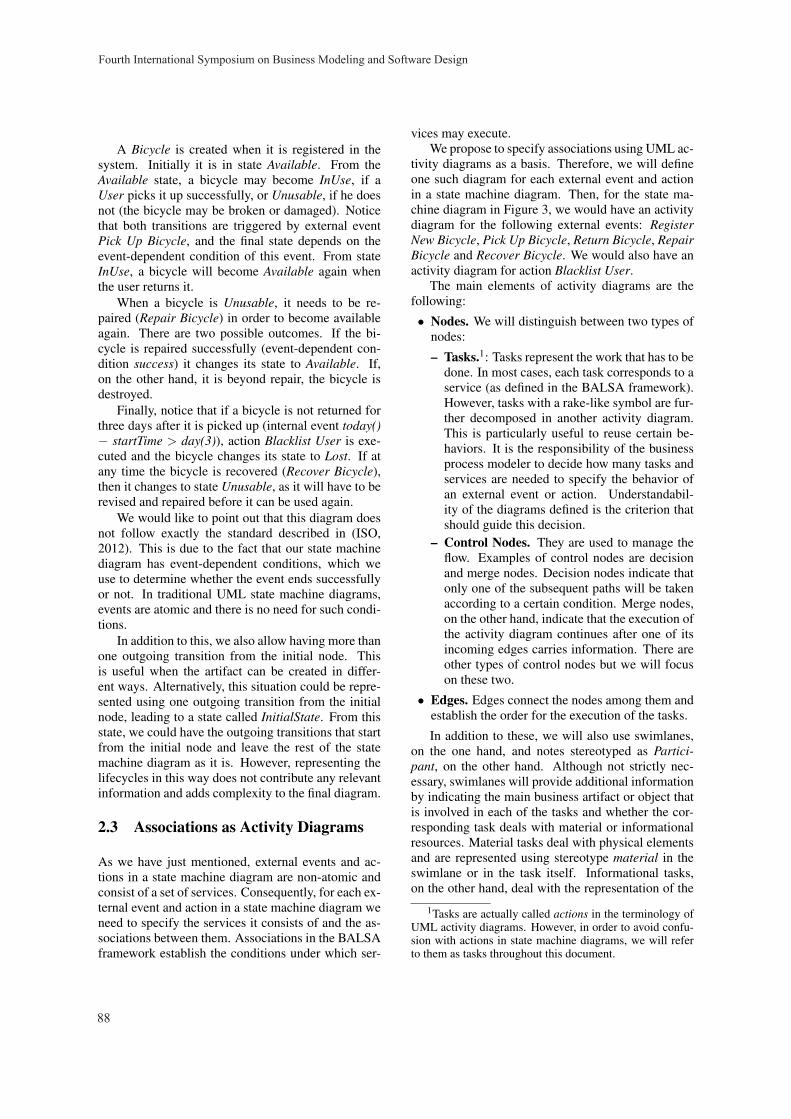
A Bicycle is created when it is registered in thesystem. Initially it is in state Available. From theAvailable state, a bicycle may become InUse, if aUser picks it up successfully, or Unusable, if he doesnot (the bicycle may be broken or damaged). Noticethat both transitions are triggered by external eventPick Up Bicycle, and the final state depends on theevent-dependent condition of this event. From stateInUse, a bicycle will become Available again whenthe user returns it.
When a bicycle is Unusable, it needs to be re-paired (Repair Bicycle) in order to become availableagain. There are two possible outcomes. If the bi-cycle is repaired successfully (event-dependent con-dition success) it changes its state to Available. If,on the other hand, it is beyond repair, the bicycle isdestroyed.
Finally, notice that if a bicycle is not returned forthree days after it is picked up (internal event today()− startTime > day(3)), action Blacklist User is exe-cuted and the bicycle changes its state to Lost. If atany time the bicycle is recovered (Recover Bicycle),then it changes to state Unusable, as it will have to berevised and repaired before it can be used again.
We would like to point out that this diagram doesnot follow exactly the standard described in (ISO,2012). This is due to the fact that our state machinediagram has event-dependent conditions, which weuse to determine whether the event ends successfullyor not. In traditional UML state machine diagrams,events are atomic and there is no need for such condi-tions.
In addition to this, we also allow having more thanone outgoing transition from the initial node. Thisis useful when the artifact can be created in differ-ent ways. Alternatively, this situation could be repre-sented using one outgoing transition from the initialnode, leading to a state called InitialState. From thisstate, we could have the outgoing transitions that startfrom the initial node and leave the rest of the statemachine diagram as it is. However, representing thelifecycles in this way does not contribute any relevantinformation and adds complexity to the final diagram.
2.3 Associations as Activity Diagrams
As we have just mentioned, external events and ac-tions in a state machine diagram are non-atomic andconsist of a set of services. Consequently, for each ex-ternal event and action in a state machine diagram weneed to specify the services it consists of and the as-sociations between them. Associations in the BALSAframework establish the conditions under which ser-
vices may execute.We propose to specify associations using UML ac-
tivity diagrams as a basis. Therefore, we will defineone such diagram for each external event and actionin a state machine diagram. Then, for the state ma-chine diagram in Figure 3, we would have an activitydiagram for the following external events: RegisterNew Bicycle, Pick Up Bicycle, Return Bicycle, RepairBicycle and Recover Bicycle. We would also have anactivity diagram for action Blacklist User.
The main elements of activity diagrams are thefollowing:
• Nodes. We will distinguish between two types ofnodes:
– Tasks.1: Tasks represent the work that has to bedone. In most cases, each task corresponds to aservice (as defined in the BALSA framework).However, tasks with a rake-like symbol are fur-ther decomposed in another activity diagram.This is particularly useful to reuse certain be-haviors. It is the responsibility of the businessprocess modeler to decide how many tasks andservices are needed to specify the behavior ofan external event or action. Understandabil-ity of the diagrams defined is the criterion thatshould guide this decision.
– Control Nodes. They are used to manage theflow. Examples of control nodes are decisionand merge nodes. Decision nodes indicate thatonly one of the subsequent paths will be takenaccording to a certain condition. Merge nodes,on the other hand, indicate that the execution ofthe activity diagram continues after one of itsincoming edges carries information. There areother types of control nodes but we will focuson these two.
• Edges. Edges connect the nodes among them andestablish the order for the execution of the tasks.
In addition to these, we will also use swimlanes,on the one hand, and notes stereotyped as Partici-pant, on the other hand. Although not strictly nec-essary, swimlanes will provide additional informationby indicating the main business artifact or object thatis involved in each of the tasks and whether the cor-responding task deals with material or informationalresources. Material tasks deal with physical elementsand are represented using stereotype material in theswimlane or in the task itself. Informational tasks,on the other hand, deal with the representation of the
1Tasks are actually called actions in the terminology ofUML activity diagrams. However, in order to avoid confu-sion with actions in state machine diagrams, we will referto them as tasks throughout this document.
Fourth International Symposium on Business Modeling and Software Design
88
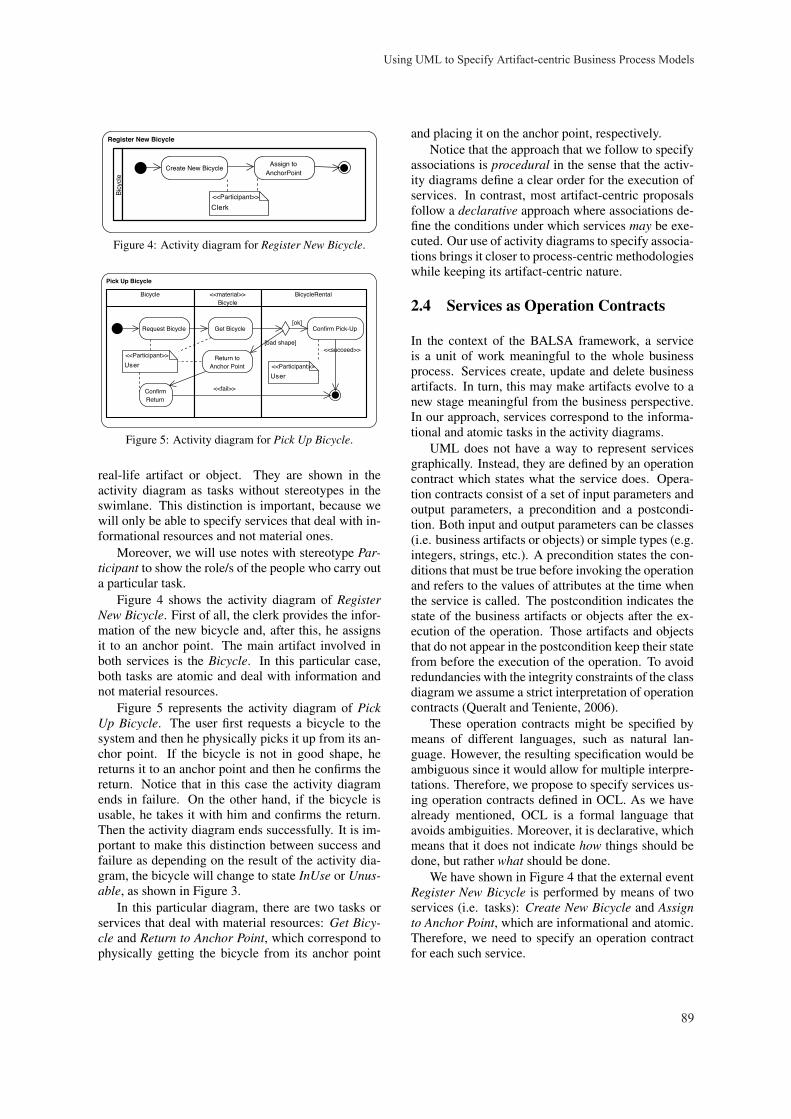
ActivityDiagram
Register New Bicycle
Return Bicycle
Repair Bicycle
Pick Up for Repair [DEPRECATED]
Pick Up Bicycle
<<material>>Place Bicycle in
Anchor PointConfirm Bicycle
Return
<<material>>Repair Bicycle
Mark Bicycleas Available
DeleteBicycle
<<material>>Dismantle Bicycle
<<material>>Anchor Bicycle to
Anchor Point
Change Status toBeingRepaired
<<material>>Move Bicylce to
Warehouse
Bicy
cle
Bicycle <<material>>Bicycle
BicycleRental
Assign toAnchorPoint
Create New Bicycle
<<Participant>>
Request Bicycle Get Bicycle
ConfirmReturn
Confirm Pick-Up
Return toAnchor Point
<<Participant>>
<<Participant>>
<<fail>>[impossible to repair]
<<succeed>>[repaired]
<<fail>>
[bad shape]
[ok]
<<succeed>>
Visual Paradigm for UML Community Edition [not for commercial use]
Figure 4: Activity diagram for Register New Bicycle.
Pick Up Bicycle
Bicycle <<material>>Bicycle
BicycleRental
Request Bicycle Get Bicycle
ConfirmReturn
Confirm Pick-Up
Return toAnchor Point
<<Participant>>
<<Participant>>
<<fail>>
[bad shape]
[ok]
<<succeed>>
Figure 5: Activity diagram for Pick Up Bicycle.
real-life artifact or object. They are shown in theactivity diagram as tasks without stereotypes in theswimlane. This distinction is important, because wewill only be able to specify services that deal with in-formational resources and not material ones.
Moreover, we will use notes with stereotype Par-ticipant to show the role/s of the people who carry outa particular task.
Figure 4 shows the activity diagram of RegisterNew Bicycle. First of all, the clerk provides the infor-mation of the new bicycle and, after this, he assignsit to an anchor point. The main artifact involved inboth services is the Bicycle. In this particular case,both tasks are atomic and deal with information andnot material resources.
Figure 5 represents the activity diagram of PickUp Bicycle. The user first requests a bicycle to thesystem and then he physically picks it up from its an-chor point. If the bicycle is not in good shape, hereturns it to an anchor point and then he confirms thereturn. Notice that in this case the activity diagramends in failure. On the other hand, if the bicycle isusable, he takes it with him and confirms the return.Then the activity diagram ends successfully. It is im-portant to make this distinction between success andfailure as depending on the result of the activity dia-gram, the bicycle will change to state InUse or Unus-able, as shown in Figure 3.
In this particular diagram, there are two tasks orservices that deal with material resources: Get Bicy-cle and Return to Anchor Point, which correspond tophysically getting the bicycle from its anchor point
and placing it on the anchor point, respectively.Notice that the approach that we follow to specify
associations is procedural in the sense that the activ-ity diagrams define a clear order for the execution ofservices. In contrast, most artifact-centric proposalsfollow a declarative approach where associations de-fine the conditions under which services may be exe-cuted. Our use of activity diagrams to specify associa-tions brings it closer to process-centric methodologieswhile keeping its artifact-centric nature.
2.4 Services as Operation Contracts
In the context of the BALSA framework, a serviceis a unit of work meaningful to the whole businessprocess. Services create, update and delete businessartifacts. In turn, this may make artifacts evolve to anew stage meaningful from the business perspective.In our approach, services correspond to the informa-tional and atomic tasks in the activity diagrams.
UML does not have a way to represent servicesgraphically. Instead, they are defined by an operationcontract which states what the service does. Opera-tion contracts consist of a set of input parameters andoutput parameters, a precondition and a postcondi-tion. Both input and output parameters can be classes(i.e. business artifacts or objects) or simple types (e.g.integers, strings, etc.). A precondition states the con-ditions that must be true before invoking the operationand refers to the values of attributes at the time whenthe service is called. The postcondition indicates thestate of the business artifacts or objects after the ex-ecution of the operation. Those artifacts and objectsthat do not appear in the postcondition keep their statefrom before the execution of the operation. To avoidredundancies with the integrity constraints of the classdiagram we assume a strict interpretation of operationcontracts (Queralt and Teniente, 2006).
These operation contracts might be specified bymeans of different languages, such as natural lan-guage. However, the resulting specification would beambiguous since it would allow for multiple interpre-tations. Therefore, we propose to specify services us-ing operation contracts defined in OCL. As we havealready mentioned, OCL is a formal language thatavoids ambiguities. Moreover, it is declarative, whichmeans that it does not indicate how things should bedone, but rather what should be done.
We have shown in Figure 4 that the external eventRegister New Bicycle is performed by means of twoservices (i.e. tasks): Create New Bicycle and Assignto Anchor Point, which are informational and atomic.Therefore, we need to specify an operation contractfor each such service.
Using UML to Specify Artifact-centric Business Process Models
89
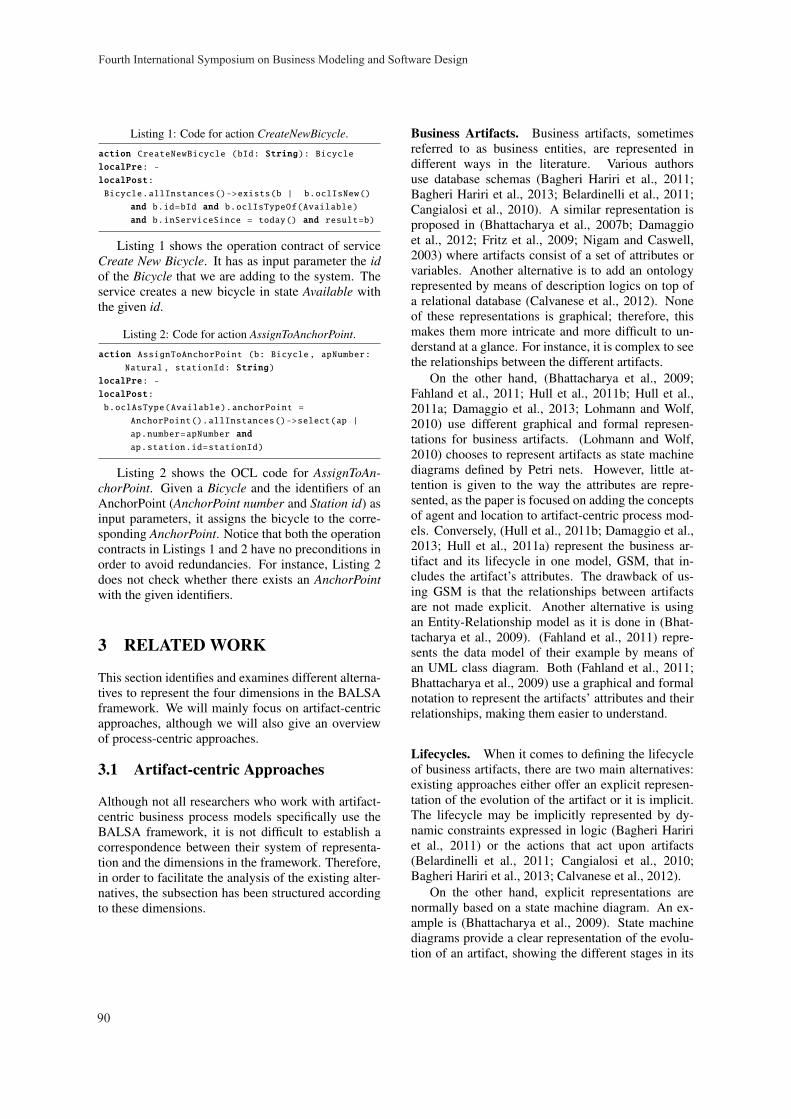
Listing 1: Code for action CreateNewBicycle.
action CreateNewBicycle (bId: String): Bicycle
localPre: -
localPost:
Bicycle.allInstances()->exists(b | b.oclIsNew()
and b.id=bId and b.oclIsTypeOf(Available)
and b.inServiceSince = today() and result=b)
Listing 1 shows the operation contract of serviceCreate New Bicycle. It has as input parameter the idof the Bicycle that we are adding to the system. Theservice creates a new bicycle in state Available withthe given id.
Listing 2: Code for action AssignToAnchorPoint.
action AssignToAnchorPoint (b: Bicycle, apNumber:
Natural, stationId: String)
localPre: -
localPost:
b.oclAsType(Available).anchorPoint =
AnchorPoint().allInstances()->select(ap |
ap.number=apNumber and
ap.station.id=stationId)
Listing 2 shows the OCL code for AssignToAn-chorPoint. Given a Bicycle and the identifiers of anAnchorPoint (AnchorPoint number and Station id) asinput parameters, it assigns the bicycle to the corre-sponding AnchorPoint. Notice that both the operationcontracts in Listings 1 and 2 have no preconditions inorder to avoid redundancies. For instance, Listing 2does not check whether there exists an AnchorPointwith the given identifiers.
3 RELATED WORK
This section identifies and examines different alterna-tives to represent the four dimensions in the BALSAframework. We will mainly focus on artifact-centricapproaches, although we will also give an overviewof process-centric approaches.
3.1 Artifact-centric Approaches
Although not all researchers who work with artifact-centric business process models specifically use theBALSA framework, it is not difficult to establish acorrespondence between their system of representa-tion and the dimensions in the framework. Therefore,in order to facilitate the analysis of the existing alter-natives, the subsection has been structured accordingto these dimensions.
Business Artifacts. Business artifacts, sometimesreferred to as business entities, are represented indifferent ways in the literature. Various authorsuse database schemas (Bagheri Hariri et al., 2011;Bagheri Hariri et al., 2013; Belardinelli et al., 2011;Cangialosi et al., 2010). A similar representation isproposed in (Bhattacharya et al., 2007b; Damaggioet al., 2012; Fritz et al., 2009; Nigam and Caswell,2003) where artifacts consist of a set of attributes orvariables. Another alternative is to add an ontologyrepresented by means of description logics on top ofa relational database (Calvanese et al., 2012). Noneof these representations is graphical; therefore, thismakes them more intricate and more difficult to un-derstand at a glance. For instance, it is complex to seethe relationships between the different artifacts.
On the other hand, (Bhattacharya et al., 2009;Fahland et al., 2011; Hull et al., 2011b; Hull et al.,2011a; Damaggio et al., 2013; Lohmann and Wolf,2010) use different graphical and formal represen-tations for business artifacts. (Lohmann and Wolf,2010) chooses to represent artifacts as state machinediagrams defined by Petri nets. However, little at-tention is given to the way the attributes are repre-sented, as the paper is focused on adding the conceptsof agent and location to artifact-centric process mod-els. Conversely, (Hull et al., 2011b; Damaggio et al.,2013; Hull et al., 2011a) represent the business ar-tifact and its lifecycle in one model, GSM, that in-cludes the artifact’s attributes. The drawback of us-ing GSM is that the relationships between artifactsare not made explicit. Another alternative is usingan Entity-Relationship model as it is done in (Bhat-tacharya et al., 2009). (Fahland et al., 2011) repre-sents the data model of their example by means ofan UML class diagram. Both (Fahland et al., 2011;Bhattacharya et al., 2009) use a graphical and formalnotation to represent the artifacts’ attributes and theirrelationships, making them easier to understand.
Lifecycles. When it comes to defining the lifecycleof business artifacts, there are two main alternatives:existing approaches either offer an explicit represen-tation of the evolution of the artifact or it is implicit.The lifecycle may be implicitly represented by dy-namic constraints expressed in logic (Bagheri Haririet al., 2011) or the actions that act upon artifacts(Belardinelli et al., 2011; Cangialosi et al., 2010;Bagheri Hariri et al., 2013; Calvanese et al., 2012).
On the other hand, explicit representations arenormally based on a state machine diagram. An ex-ample is (Bhattacharya et al., 2009). State machinediagrams provide a clear representation of the evolu-tion of an artifact, showing the different stages in its
Fourth International Symposium on Business Modeling and Software Design
90
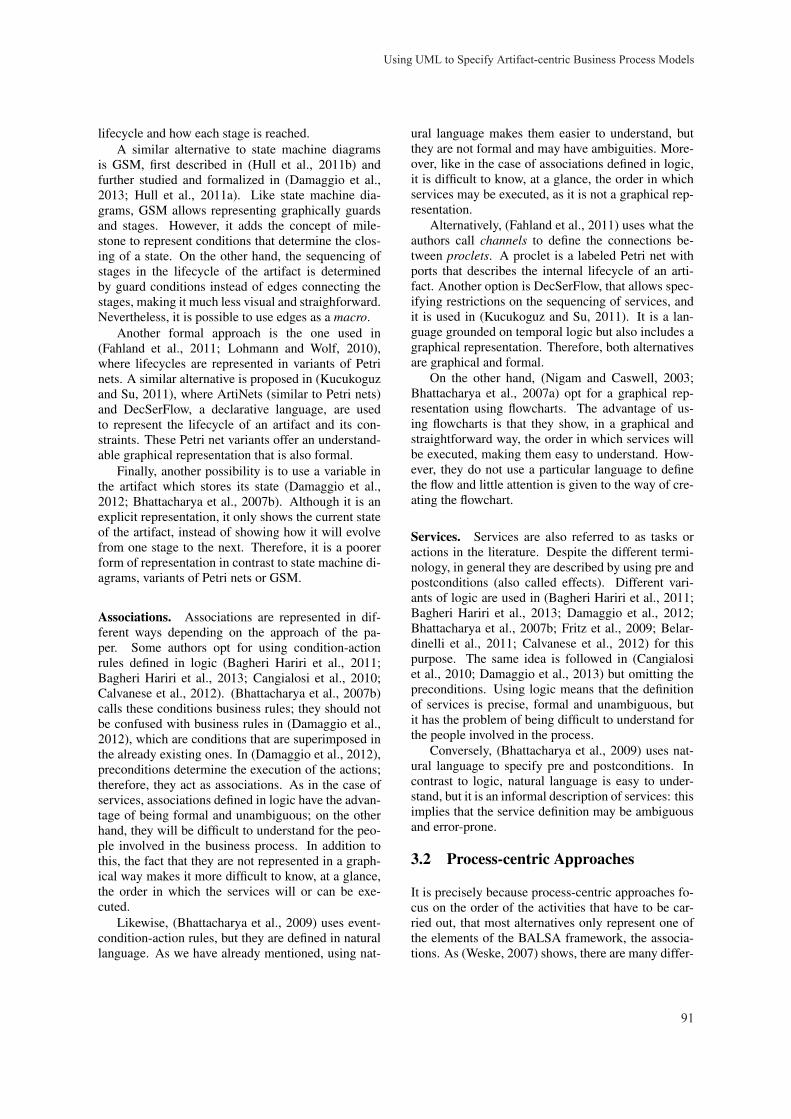
lifecycle and how each stage is reached.A similar alternative to state machine diagrams
is GSM, first described in (Hull et al., 2011b) andfurther studied and formalized in (Damaggio et al.,2013; Hull et al., 2011a). Like state machine dia-grams, GSM allows representing graphically guardsand stages. However, it adds the concept of mile-stone to represent conditions that determine the clos-ing of a state. On the other hand, the sequencing ofstages in the lifecycle of the artifact is determinedby guard conditions instead of edges connecting thestages, making it much less visual and straighforward.Nevertheless, it is possible to use edges as a macro.
Another formal approach is the one used in(Fahland et al., 2011; Lohmann and Wolf, 2010),where lifecycles are represented in variants of Petrinets. A similar alternative is proposed in (Kucukoguzand Su, 2011), where ArtiNets (similar to Petri nets)and DecSerFlow, a declarative language, are usedto represent the lifecycle of an artifact and its con-straints. These Petri net variants offer an understand-able graphical representation that is also formal.
Finally, another possibility is to use a variable inthe artifact which stores its state (Damaggio et al.,2012; Bhattacharya et al., 2007b). Although it is anexplicit representation, it only shows the current stateof the artifact, instead of showing how it will evolvefrom one stage to the next. Therefore, it is a poorerform of representation in contrast to state machine di-agrams, variants of Petri nets or GSM.
Associations. Associations are represented in dif-ferent ways depending on the approach of the pa-per. Some authors opt for using condition-actionrules defined in logic (Bagheri Hariri et al., 2011;Bagheri Hariri et al., 2013; Cangialosi et al., 2010;Calvanese et al., 2012). (Bhattacharya et al., 2007b)calls these conditions business rules; they should notbe confused with business rules in (Damaggio et al.,2012), which are conditions that are superimposed inthe already existing ones. In (Damaggio et al., 2012),preconditions determine the execution of the actions;therefore, they act as associations. As in the case ofservices, associations defined in logic have the advan-tage of being formal and unambiguous; on the otherhand, they will be difficult to understand for the peo-ple involved in the business process. In addition tothis, the fact that they are not represented in a graph-ical way makes it more difficult to know, at a glance,the order in which the services will or can be exe-cuted.
Likewise, (Bhattacharya et al., 2009) uses event-condition-action rules, but they are defined in naturallanguage. As we have already mentioned, using nat-
ural language makes them easier to understand, butthey are not formal and may have ambiguities. More-over, like in the case of associations defined in logic,it is difficult to know, at a glance, the order in whichservices may be executed, as it is not a graphical rep-resentation.
Alternatively, (Fahland et al., 2011) uses what theauthors call channels to define the connections be-tween proclets. A proclet is a labeled Petri net withports that describes the internal lifecycle of an arti-fact. Another option is DecSerFlow, that allows spec-ifying restrictions on the sequencing of services, andit is used in (Kucukoguz and Su, 2011). It is a lan-guage grounded on temporal logic but also includes agraphical representation. Therefore, both alternativesare graphical and formal.
On the other hand, (Nigam and Caswell, 2003;Bhattacharya et al., 2007a) opt for a graphical rep-resentation using flowcharts. The advantage of us-ing flowcharts is that they show, in a graphical andstraightforward way, the order in which services willbe executed, making them easy to understand. How-ever, they do not use a particular language to definethe flow and little attention is given to the way of cre-ating the flowchart.
Services. Services are also referred to as tasks oractions in the literature. Despite the different termi-nology, in general they are described by using pre andpostconditions (also called effects). Different vari-ants of logic are used in (Bagheri Hariri et al., 2011;Bagheri Hariri et al., 2013; Damaggio et al., 2012;Bhattacharya et al., 2007b; Fritz et al., 2009; Belar-dinelli et al., 2011; Calvanese et al., 2012) for thispurpose. The same idea is followed in (Cangialosiet al., 2010; Damaggio et al., 2013) but omitting thepreconditions. Using logic means that the definitionof services is precise, formal and unambiguous, butit has the problem of being difficult to understand forthe people involved in the process.
Conversely, (Bhattacharya et al., 2009) uses nat-ural language to specify pre and postconditions. Incontrast to logic, natural language is easy to under-stand, but it is an informal description of services: thisimplies that the service definition may be ambiguousand error-prone.
3.2 Process-centric Approaches
It is precisely because process-centric approaches fo-cus on the order of the activities that have to be car-ried out, that most alternatives only represent one ofthe elements of the BALSA framework, the associa-tions. As (Weske, 2007) shows, there are many differ-
Using UML to Specify Artifact-centric Business Process Models
91
ent languages to represent business processes from aprocess-centric perspective such as BPMN, UML ac-tivity diagrams, Workflow nets or YAWL. Althoughsome of these languages have the ability to representthe data needed in the flow (even if in a limited way),process-centric proposals focus on the ordering of theactivities or tasks and do not deal with the data.
However, in some cases they do take data into con-sideration. For instance, (Trcka et al., 2009) repre-sents the associations between services in a WFD-net(WorkFlow nets annotated with Data). The annota-tion of tasks in the WFD-Net can be seen as a rudi-mentary way of specifying services, as it allows indi-cating which data is created, read and written. Sim-ilarly, (Ly et al., 2006) uses WSM nets which repre-sent both the control flow and the data flow, althoughthe data flow is limited to read and write dependen-cies between activities and data. In like manner, (Liuet al., 2007) represents associations in an operationalmodel, which shows tasks (or services) as nodes con-nected using arrows or edges. The operational modelalso shows the transfer of artifacts between tasks byindicating them over the edges. However, details ofartifacts are not shown.
3.3 Summary of Related Work
As we have seen, none of the approaches that we haveanalyzed uses the same language to represent all theelements in the BALSA framework, and many timesthe chosen representation is not graphical, making themodels more difficult to grasp. This is aggravated bythe fact that, in some cases, the chosen language is avariant of logic which, although formal, makes it nextto impossible for business people to comprehend. Theuse of natural language also has its drawbacks: whileit may be easily understood, it may lead to ambigui-ties and errors.
4 CONCLUSIONS
This paper shows a way to model all of the BALSAdimensions in an artifact-centric business processmodel using several diagrams based on UML. The useof an activity diagram to represent the associationsbetween services brings it closer to process-centricmethodologies and makes it easier to understand thancondition-action rules defined in logic or even naturallanguage.
In contrast to other approaches, using diagramsbased on UML and OCL as a basis to represent all ofthe dimensions of the model integrates them naturally.Moreover, UML has several advantages: first of all, it
is a graphical, high-level language, and therefore theresulting models are easy to understand by businessmanagers, analysts and developers. Secondly, UMLand OCL are standard languages. Last but not least,both UML and OCL can be translated into logic (seefor instance (Queralt and Teniente, 2012)) in order tofacilitate reasoning on the resulting specification.
Finally, our proposal offers the advantages of agraphical representation, understandable by the users,without losing the capacity of being used for reason-ing in the future since it is based on a semi-formalnotation that avoids ambiguities. As further work, wewould like to study the applicability of our approachby analyzing the input provided by the business stake-holders. We would also like to apply this work toa business process model which has more than onebusiness artifact. Last but not least, we intend to de-fine a way to perform automatic reasoning on our di-agrams in order to validate their correctness, appro-priateness and their quality before they are put intopractice.
ACKNOWLEDGEMENTS
This work has been partially supported by theMinisterio de Ciencia e Innovacion under projectsTIN2011-24747 and TIN2008-00444, Grupo Consol-idado, the FEDER funds and Universitat Politecnicade Catalunya.
REFERENCES
Bagheri Hariri, B., Calvanese, D., De Giacomo, G.,De Masellis, R., and Felli, P. (2011). Foundations ofrelational artifacts verification. In Rinderle-Ma, S.,Toumani, F., and Wolf, K., editors, BPM 2011, vol-ume 6896 of LNCS, pages 379–395. Springer.
Bagheri Hariri, B. et al. (2013). Verification of relationaldata-centric dynamic systems with external services.In PODS, pages 163–174. ACM.
Belardinelli, F., Lomuscio, A., and Patrizi, F. (2011). Veri-fication of deployed artifact systems via data abstrac-tion. In Kappel, G., Maamar, Z., and Nezhad, H.R. M., editors, ICSOC 2011, volume 7084 of LNCS,pages 142–156. Springer Berlin Heidelberg.
Bhattacharya, K., Caswell, N. S., Kumaran, S., Nigam, A.,and Wu, F. Y. (2007a). Artifact-centered operationalmodeling: lessons from customer engagements. IBMSyst. J., 46(4):703–721.
Bhattacharya, K., Gerede, C., Hull, R., Liu, R., and Su, J.(2007b). Towards formal analysis of artifact-centricbusiness process models. In Alonso, G., Dadam, P.,and Rosemann, M., editors, BPM 2007, volume 4714of LNCS, pages 288–304. Springer.
Fourth International Symposium on Business Modeling and Software Design
92

Bhattacharya, K., Hull, R., and Su, J. (2009). A Data-Centric Design Methodology for Business Processes.In Handbook of Research on Business Process Man-agement, pages 1–28.
Calvanese, D., Giacomo, G. D., Lembo, D., Montali, M.,and Santoso, A. (2012). Ontology-based governanceof data-aware processes. In Krotzsch, M. and Straccia,U., editors, RR, volume 7497 of LNCS, pages 25–41.Springer.
Cangialosi, P., Giacomo, G. D., Masellis, R. D., and Rosati,R. (2010). Conjunctive artifact-centric services. InMaglio, P. P., Weske, M., Yang, J., and Fantinato, M.,editors, ICSOC 2010, volume 6470 of LNCS, pages318–333. Springer.
Damaggio, E., Deutsch, A., Hull, R., and Vianu, V. (2011).Automatic verification of data-centric business pro-cesses. In Rinderle-Ma, S., Toumani, F., and Wolf,K., editors, BPM 2011, volume 6896, pages 3–16.Springer.
Damaggio, E., Deutsch, A., and Vianu, V. (2012). Artifactsystems with data dependencies and arithmetic. ACMTrans. Database Syst., 37(3):22.
Damaggio, E., Hull, R., and Vaculın, R. (2013). On theequivalence of incremental and fixpoint semantics forbusiness artifacts with Guard Stage Milestone lifecy-cles. Information Systems, 38(4):561 – 584. Specialsection on BPM 2011 conference.
Estanol, M., Queralt, A., Sancho, M. R., and Teniente, E.(2013). Artifact-centric business process models inUML. In La Rosa, M. and Soffer, P., editors, BusinessProcess Management Workshops 2012, volume 132 ofLNBIP, pages 292–303. Springer.
Fahland, D., Leoni, M. D., van Dongen, B. F., and van derAalst, W. M. P. (2011). Behavioral conformance ofartifact-centric process models. In Abramowicz, W.,editor, BIS 2011, volume 87 of LNBIP, pages 37–49.Springer.
Fritz, C., Hull, R., and Su, J. (2009). Automatic construc-tion of simple artifact-based business processes. InFagin, R., editor, ICDT 2009, volume 361, pages 225–238. ACM.
Hull, R. (2008). Artifact-centric business process mod-els: Brief survey of research results and challenges.In Meersman, R. and Tari, Z., editors, OTM 2008,volume 5332 of LNCS, pages 1152–1163. SpringerBerlin / Heidelberg.
Hull, R. et al. (2011a). Business artifacts with guard-stage-milestone lifecycles: managing artifact interactionswith conditions and events. In Eyers, D. M., Etzion,O., Gal, A., Zdonik, S. B., and Vincent, P., editors,DEBS, pages 51–62. ACM.
Hull, R. et al. (2011b). Introducing the Guard-Stage-Milestone Approach for Specifying Business EntityLifecycles. In Bravetti, M. and Bultan, T., editors,WS-FM 2010, volume 6551 of LNCS, pages 1–24.
ISO (2012). ISO/IEC 19505-2:2012 - OMG UML su-perstructure 2.4.1. Available at: http://www.iso.org/iso/iso catalogue/catalogue tc/catalogue detail.htm?csnumber=52854.
ISO (2012). ISO/IEC 19507:2012 - OMG OCL ver-sion 2.3.1. Available at: http://www.iso.org/
iso/iso catalogue/catalogue tc/catalogue detail.htm?csnumber=57306.
Kucukoguz, E. and Su, J. (2011). On lifecycle constraintsof artifact-centric workflows. In Bravetti, M. and Bul-tan, T., editors, WS-FM 2010, volume 6551 of LNCS,pages 71–85. Springer.
Liu, R., Bhattacharya, K., and Wu, F. Y. (2007). Model-ing Business Contexture and Behavior Using BusinessArtifacts. In Krogstie, J., Opdahl, A., and Sindre, G.,editors, CAiSE 2007, volume 4495 of LNCS, pages324–339. Springer.
Lohmann, N. and Wolf, K. (2010). Artifact-Centric Chore-ographies. In Maglio, P. P., Weske, M., Yang, J., andFantinato, M., editors, ICSOC 2010, volume 6470 ofLNCS, pages 32–46. Springer.
Ly, L. T., Rinderle, S., and Dadam, P. (2006). Semantic Cor-rectness in Adaptive Process Management Systems.In Dustdar, S., Fiadeiro, J., and Sheth, A., editors,BPM 2006, volume 4102 of LNCS, pages 193–208.LNCS.
Nigam, A. and Caswell, N. S. (2003). Business artifacts:an approach to operational specification. IBM Syst. J.,42(3):428–445.
Olive, A. (2007). Conceptual Modeling of Information Sys-tems. Springer, Berlin.
Queralt, A. and Teniente, E. (2006). Specifying the se-mantics of operation contracts in conceptual model-ing. In Journal on Data Semantics VII, volume 4244of LNCS, pages 33–56. Springer Berlin / Heidelberg.
Queralt, A. and Teniente, E. (2012). Verification and val-idation of UML conceptual schemas with OCL con-straints. ACM Trans. Softw. Eng. Methodol., 21(2):13.
Trcka, N., Aalst, W. M. P. V. D., and Sidorova, N. (2009).Data-Flow Anti-patterns : Discovering Data-Flow Er-rors in Workflows. In van Eck, P., Gordijn, J., andWieringa, R., editors, CAiSE 2009, volume 5565 ofLNCS, pages 425–439.
Weske, M. (2007). Business Process Management: Con-cepts, Languages, Architectures. Springer, Berlin Hei-delberg.
Using UML to Specify Artifact-centric Business Process Models
93
Is the Value Concept a Valuable Concept for Information Systems?
Coen Suurmond RBK Group, Keulenstraat 18, Deventer, The Netherlands
Keywords: Value, Value Chain, Supply Chain, Lean.
Abstract: The creation of value and value chains are popular terms in business management literature. The question is what is exactly meant by value, and what the usefulness of the concept is for operational information systems. In the paper different uses of the term value will be analysed. Subsequently the creation of value for customers will be analysed from a business point of view. The conclusion is that operational processes deal with specifications and norms, which are themselves translations of a background notion of value for the customer in combination with value for the company itself.
1 INTRODUCTION
VAT. Value Added Tax. This fiscal construct shows in its simplicity the core of two aspects of the concept of value in enterprises: value is a financial concept and value is known after the fact. The principle of taxing added value is very simple: an enterprise pays tax over the difference between the total amount billed by its suppliers and the total amount billed to its customers per period of time. The difference between these two values is assumed to be the added value over this period. The present inventory does not factor into determining the added value.
However, when the same tax authorities tax the profits of an enterprise, the situation is very different. In this context it is of great importance to correctly value the present inventory and all other assets of an enterprise. In speculative trade an enterprise can exclusively buy and stockpile goods during a given period, without selling anything, but still make a profit if the inventory is valued at a higher price than the purchase price + purchasing costs + storage costs (e.g. when the current price of the goods is higher than the purchase price paid, this principle forms the foundation for futures trading).
These two fiscal points of view indicate the two different principles of judging value. In the case of VAT only the value of actual sales matters, and this can be objectively determined (although tax consultants can make a nice profit by creatively using fiscal entities and transnational intercompany constructions to ‘optimise’ VAT taxations). For the
determination of profits both tangible and intangible assets have to be valued within the boundaries of a framework of fiscal rules (again, subject to ‘optimisation’ by tax consultants).
In the literature about the creation of value and analysing the value chain in a supply chain the same basis seems to be used as that underlying the fiscal principle of VAT. The value of a good is the sum of the costs and the added value is the difference between costs and revenues. At the same time one would expect this approach to add something new to the time-honoured questions of costs and the optimisation of business processes (increasing the efficiency, producing at the lowest cost per produced unit). A reductive view of value as the margin between sales and costs do not address the value-related issues of the attractiveness of the products for the customers before the sales, and the satisfaction of the customers with the products afterwards. Indeed, customer attractiveness and customer satisfaction is an important issue in e.g. the balanced scorecard approach.
In the last few decennia there has been a lot of attention for the efficient set up and execution of business processes in its entirety in management science. This used to be different (or less explicit), the focus used to be much more on performing individual tasks as efficiently as possible. Think of concepts as economy of scale and specialisation or the model of an assembly line as an ideal image of the production process. The transition from “task thinking” to “process thinking” coincides with the analysis of Japanese success stories (that were in
94
turn based on an analysis of Western success stories!) and with the attention for the added value of a process step and the so-called value chain.
Nowadays, the term “value” is used many times and in many ways in the literature about organisations and business processes. It is after all a “valuable” term, it has a very positive connotation. Few people will campaign against the addition of value in business processes, or against eliminating activities that do not add value. At the same time, this is the weakness of the term: what does someone mean when he speaks about the value of a product or service or about the value chain? And if someone discusses the addition of value, what is it that the value is added to? For whom is the value added? Packaging and labelling of crates do not add value to the product itself, but contribute to the efficiency of logistics. Who are the stakeholders in the value chain?
The main part of this paper will discuss the possible role of the value concept in the design of an enterprise information system. How can the value chain approach help in the modelling of business processes, and what kind of information should the information system provide to monitor the value chain? More specifically, how can the value chain approach help in the daily operational control loops in the primary processes?
A prerequisite for the analysis of the possible contribution of the value chain approach is the analysis of the value concept itself. This will be done in a short discussion of the literature about the value chain. Here, three different scopes will be identified: the strategic scope, the business process management scope, and the operational scope.
2 VALUE CONCEPTS AND VALUE MEANINGS IN LITERATURE
Among its meanings of ‘value’ the OED lists: (1) “That amount of a commodity, medium of exchange, etc., considered to be an equivalent for something else; a fair or satisfactory equivalent or return” (2) “The material or monetary worth of a thing; the amount of money, goods, etc., for which a thing can be exchanged or traded” (3) “The extent or amount of a specified standard or measure of length, quantity, etc” (4) “valour” (5) “The worth, usefulness, or importance of a thing; relative merit or status according to the estimated desirability or utility of a thing” (OED, 2007). The first two entries
relate to the exchange value or more specifically the monetary value of a good, the third entry is the objective meaning of the value according to a specific measurement scale while the final entry relates to the utility of a good.
An example of a very reductive application of the value chain concept is the work of Markus Baum about the value chain in the service industry. He cites the definition of Kaplinky and Morris of the value chain “The value chain describes the full range of activities which are required to bring a product or service from conception, through the different phases of production (involving a combination of physical transformation and the input of various producer services), delivery to final consumers, and final disposal after use.” (Baum 2013, Kaplinsky and Morris 2002), and subsequently analysis the value chain in consulting firms exclusively in terms of a costing model. The value chain approach is used for the classification of the activities in the consulting company as either value adding (billable) or value enabling (non-billable), without any reference to the value of the service to the customer.
In Western literature the emphasis is on the first two meanings and the analysis of the value chain is primarily concerned with cutting costs to improve the competitive position and the financial results. In Japanese literature the emphasis is much more on the final meanings and the focus is on avoiding waste of any kind to improve the quality of the processes. The latter can in part lead to a direct improvement of the financial results, but will always be beneficial to the continuity of the enterprise.
For further analysis of the concept of value it is useful to distinguish a number of scopes where the value concept is employed. Firstly the strategic scope, where entrepreneurs together with internal and external strategic consultants analyse and design corporate strategies. This is the field of Michael Porter, who devised the concept of the value chain as an instrument for strategic analysis. The unit of analysis is the business unit, and Porter states “differences among competitor value chains are a key source of competitive advantage” and “the value chains of such subsets [variations within a business unit for different items] of a firm are closely related, however, and can only be understood in the context of the business unit chain” (Porter, 1985).
Secondly we have the process scope, where business processes are analysed, modelled, and perhaps reengineered. Remarkably, in the seminal work of Business Process Reengineering no mention is made of the value chain. Here reengineering is
Is the Value Concept a Valuable Concept for Information Systems?
95
defined as “starting over” and rejecting conventional wisdom and to keep processes simple “in order to meet the contemporary demands of quality, service, flexibility, and low cost” (Hammer and Champy, 1993). Later on, in Beyond Reengineering, Hammer discusses an exhaustive classification of all work activities in three types: (1) value adding, (2) value enabling, and (3) waste (Hammer, 1996), but the book contains no further use of the value chain concept. In Value Stream Mapping, Martin and Osterling propagate the value stream approach. The relationship with the value chain concept is not discussed, despite the semantic kinship of the two concepts. Like the value chain, the value stream is about the added value of the business processes. Unlike the strategic focus of the value chain, the value stream focuses on business processes and workflows. A value stream is defined as “the sequence of activities an organisation undertakes to deliver on a customer request” (Martin and Osterling, 2014). Moreover, an extended value stream includes those activities that precede or follow on the actual customer request, and the value-enabling value streams support the delivery of value. In other words: the same classification of work activities as we find with Hammer, and a strong connection to the lean movement as initiated by Womack and Jones.
The third scope is concerned with the application of the value chain concept in business modelling for IT systems, for example in the Business Process Management by Mathias Weske. First, he discusses value chains as “a well known approach in business administration to organize the work that a company conducts to achieve its business goals” (Weske, 2013). In the next chapter, Weske presents a hierarchy of the value system, which is composed of value chains, which in turn are composed of business functions. Instead of the decomposition of high level business functions, this approach decomposes the high level business processes, as represented by the value chain. The business functions themselves are further decomposed in business processes and in the next step the business processes are decomposed in activities.
All scopes have two characteristics in common: (1) process orientation and (2) ambiguity or non-specificity of the value concept. It is clear that activities in business processes should contribute to the adding of value to products either directly (value adding activities) or indirectly (value enabling activities). The meaning of the term value itself, however, is mostly lacking. From the literature it can be derived that the meaning of value as in “exchange
value” is always present. In value adding activities the assumption is that the value of labour and other resources flows directly into the products. In value enabling activities the value of labour and other resources is transferred later on to the products. The value of the products is expressed in the price the customer pays for the product, but the intrinsic value of the product is its usability and attractiveness with regard to the consumer.
3 USABILITY OF THE VALUE CONCEPT
3.1 Analysis of Value Enabling Activities
The strategy of a company determines on which markets the company will be present, in which role, and with which products. For the development of a new strategy, or for the evaluation of an existing strategy, Porter’s value chain approach might be used, amongst other approaches. The resulting strategy will be expressed in a number of quantitative targets and a number of high level organisational norms. The latter will reflect the non-quantitative values that the company wants to create for the customer and for all other internal and external stakeholders.
The targets and norms will have to be translated into operational facilities, specifications and procedures. These are value enabling activities in the company. Activities can be differentiated according to their nature and horizon. Bigger investments in production and storage facilities have a horizon of several years; minor changes of the physical layout and changes in the organisation of the business processes have a typical horizon of a month up to a year; small changes in the organisation of resources might have a horizon of several days or weeks. The common factor in all these activities is their orientation on expected volumes of production, and on expected variability and volatility of demand. These activities are bigger or smaller investments in intangible assets, in order to improve the effectiveness and efficiency of the primary processes (just as a reminder: a fixed asset represent a value on the balance sheet of the company). Sound management requires that the presuppositions on which these value enabling activities are based are carefully checked before and after, in that sense creating a control loop to be supported by the enterprise information system.
Fourth International Symposium on Business Modeling and Software Design
96
Apart from availability of the physical facilities and the organisation of the business processes, a further prerequisite for the actual execution of value creating activities is the determination of the range of products, the definition of each product, and the specification of the production processes, the raw materials and the resources. These definitions and specifications will bring forth further operational norms for inbound logistics, operations, and outbound logistics; and a calculation of the cost price. Product development, process development, and the marketing of the products are all value enabling activities. The marketing function (often both in a marketing department and in actual sales) translates the strategy in actual products for actual markets, and specifies the product qualities and possible (‘tolerable’) cost prices. This is the translation of value for the customer into specifications and norms for production.
Note: obviously, the marketing function often clashes with the production function, and in a healthy company product and process development is an iterative process in which marketing, sales, production, and quality assurance functions are involved. Nevertheless, the main point is that the marketing function translates perceived customer value into product specifications.
3.2 Analysis of Value Creating Activities
In de daily operation, actual products are produced, shipped, and billed to actual customers. The organisation of production might be make to order, make to stock, finish to order, and many other possibilities, but the bottom line is the fulfilment of customer orders. In most situations, the balancing of demand and supply is a major challenge. The simplest model is pure make to order: the primary processes are only processing actual orders, and all resources are made available on demand. However, the normal situation is that primary processes are executed based on expected demand. When the expectation is correct, customer orders can be delivered quickly and the company has minimal stocks. A mismatch of expectation and actual demand results in bigger stocks and later delivery of customer orders. Clearly, elements of customer value are involved here. Shorter lead times are better for the customer, and stocks cost money and erode profits. The ideal situation for the customer is a storage facility nearby, and his demand can be fulfilled immediately (indeed, this involves both the Just-In-Time concept and the Vendor-Managed-
Inventory concept). These customer values are formally or informally translated into a kind of service level agreement, where lead times and delivery frequencies are specified. Production planning will seek the balance between (1) fulfilment of customer orders within the specified lead times, (2) minimal stocks; and (3) maximum efficiency. Production itself must be efficient and it must deliver quality (as specified).
Given all the talk about value creating processes, it a strange phenomenon that conventional information systems use concepts such as Demand Management and Sales and Operations Planning (Vollman e.a. 2005). Demand and sales are externally triggered by the market. What is managed and planned by the company is the availability of products for the markets, given the variability and volatility of the markets (Packowski, 2014). Rigid “sales planning” will yield suboptimal responses to market forces and cause less availability of products and higher costs in the supply chain.
3.3 Management and Control of Value Creating Activities
The value creating activities are controlled by two objectives: creating value for the customer, and creating value for the company itself (margin). The direct indicators for the creation of customer value are the checks on the quality of the product, on the quality of the production processes, and on the quality of the delivery processes. The direct indicators for the creation of value for the company itself are production data about inputs and outputs for the various process steps. In the daily execution of the primary processes, the creation of the customer values within agreed and reasonable boundaries have priority, and operational costs come in second place. However, all deviations of production costs from the standards outside a reasonable bandwidth should be explained, and all explanations should be categorised and kept for periodical analysis. Any deviation is an indicator for either a faulty specification or norm, or some unforeseen irregularity in the outside world that forced an adaptation in the primary processes. Small but regular deviations with internal causes might be more important than big and irregular deviations from outside causes. Incidentally, all deviations should be explained, not only the negative ones. When consumption of resources is below the specification, it might indicate that the process was not correctly executed, or data was not correctly captured, or that under certain circumstances fewer resources are needed than specified. In all cases, the
Is the Value Concept a Valuable Concept for Information Systems?
97
deviation should be explained. Over a longer period of time, however, the value
for the company itself has priority in the evaluation of the deviations from the specifications. Analysis of the differences will suggest causes in one or more of the following categories: substandard execution of the primary processes themselves, too many disturbances of the primary processes from the ordering processes within the agreed and reasonable boundaries (caused either externally or internally!) , or too many unforeseen or unallowed disturbances from the ordering processes. The company will act to improve the internal processes, to adapt the specifications and norms, to agree different terms with the customer, or to adapt the ordering processes.
Besides consumption and net output all kinds of waste will have to be measured as well as an integral part of the capturing of production data. The OEE approach forms a good example of this for individual production lines (Hansen, 2001). For non-line processes all kinds of stoppage, rejection, degradation and waste will have to be measured as well. By also recording the cause (no resources available, no removal of output possible, machine defects in the line, insufficient quality of raw materials) and verifying these causes a continuous PDCA cycle will come into effect. For example consider production losses due to rush orders. The first step is specifically writing the additional set up times against this specific rush order. The second step is checking where the rush order originated from: internal laxity (by whom?), or a late order by a customer. When it concerns an incidental rush order by this customer and this falls within the commercial agreements, then there is no problem. When the same customer keeps on placing rush orders, sales will have to take action with this customer. When continuously incidental rush orders by different customers lead to process losses that are not taken into account in the cost price, then action will have to be taken on the production side, on the commercial side, or both. In each of these considerations and actions “value for the customer” plays an essential part by its influence on the price of the product and, especially, by its influence on service levels, but these are background norms. Human considerations and interpretation leads to the establishment of standards for the production, and deviations from these standards will have to be noted and explained. Individual employees might do valuable things for creating value for the customer by dealing with disruptions, at the expense of extra consumption of resources. These disruptions can
originate from the customers themselves (last minute changes in orders), from internal departments upstream or downstream, or from suppliers. The more the enterprise is able to deal with disruptions and to dampen their effects, the more the enterprise will contribute to the stability of the processes of its customers, and in this way create value for them.
3.4 Management and Control of Value Enabling Activities
The value enabling activities are instigated by a set of expectations or plans of future events. Management of the value enabling activities requires a continuous check on the actual course of events and on the actual contribution to the creation of value. Signs of possible drift, slow and continuous changes in the business environment, should be observed carefully, because an accumulation of tiny changes under the radar might have a big impact. More important, the value enabling activities should be checked continuously for their contribution to the value creating processes. It means searching for patterns in the deviations in the daily operations, and searching for operational improvement. The deviations might be found either in defective products, processing problems, or meeting customer demands.
Each and every check, however, deals with specifications and norms. Value in itself is not measurable, only its translations in specifications and norms (and an expectation is an implicit, unexpressed, norm). As the creation of value for both the customer and the company itself is the ultimate objective, a major management issue is the validity of the translation itself. A further issue is the way the organisation measures deviations from the specification or norm. A body mass index does not measure the health of an individual, it is just an indicator for health risks. A best before date does not represent the freshness of the food, it represents just an amount of days after production date as an indicator for freshness (under the assumption the product is kept in the right environment).
3.5 Margin Management
Margin management is an instrument for managing both value creating and value enabling activities by monitoring the service levels in combination with the differences between normative and actual consumption of resources. The final outcome of margin management is ultimately expressed in the financial results (normative and actual). The real
Fourth International Symposium on Business Modeling and Software Design
98
value however lies in analyses of causes and explanations of deviations. Daily checks and daily questions about anomalies and differences keep the employees alert and provides valuable information to the “value enablers” about the primary processes as executed under pressure of reality (this is an example of elicitation of possible relevant differences between model and reality). Searching for patterns over time can bring trends to the fore that require adaptations in the way the primary processes are set up.
In analysis of deviations both causes and explanations are important. Cause and effect belongs to causal chains, “Y happened because of X”. Explanations have a different nature, explanations are about intentions and norms. The organisation of the primary processes and the specifications of products and processes are the cause of chains of events with input and output. A malfunctioning machine is the cause of an amount of rejected finished product. An unreliable forecast causes loss of net production time. A late customer order, however, might be the explanation of a late departure of a truck. Or the first order of a new customer can be the explanation of extra consumption of resources (the salesperson had emphasised that “first time right” was an absolute requirement for this order). To put it differently, explanations, not causes, give information about intended value for a stakeholder in the value chain.
Important is that margin management does not necessary operate on the level of the individual order or job. It operates on the level where production data can be captured meaningfully and reliable, which is often on a higher aggregation level than capturing the consumption of each and every resource per each and every job. For different resources different levels of aggregation might be used. E.g., quantities of raw materials, semi-finished products and finished products are captured per job, or output per job and input per line; labor is captured per department, energy is captured per area, and waste per line. In margin management this does not really matter for the management mechanism itself: just calculate the normative consumption on the aggregation level on which the consumption data are captured, make the comparisons, analyse the deviations, and record causes and explanations. Here again, value created is not the prime focus, but consumption service levels. The creation of value can be an important issue, but only in an explanation of a difference. A refinement of this mechanism is the capturing of losses (compared with the general norm) with cause and/or explanation as an integral
part of the primary processes, with checking of the actual differences afterwards.
3.6 Recapitulation
The concept of value has no place in an operational information system. It might be a very useful concept in the determination of the strategy of a company, but it has to be translated into concrete specifications and norms to be of operational use. Management should continuously check the translation of values in specifications and norms, and analyse the patterns in deviations. Operational people do not create value; operational people create products according to specifications and behave according to norms. Customer value and corporate value are the indirect results of the work of operational people.
However, norms and specifications may conflict. In these cases the behaviour of the employees in the business processes is no longer a routine of following rules, but values and priorities have to be weighed. It is here that the values for the customer and the values for the company that lie behind all the specifications and rules come into play. Both in making the judgement and in accounting for the choice afterwards, it is important that the values as perceived by the employee are made explicit and are evaluated. Just because the people in the primary processes have different information and are dealing directly with the products or the customer, they may shed a valuable light on the perception of value.
4 EXAMPLE: RETAILER
As an example case we consider a big retailer that operates nationwide and has a market share over 20%. The main product segments are fresh products with a short shelf life (meat, vegetables, fruit, bread), food products with a longer shelf life, dry grocery products, and non-food products. The operation of such a retailer is composed of the stores, distribution facilities consisting of distribution centres and transport from the distribution centres to the stores, and the supply to the distribution centres.
The category management department determines which products of which brands are carried at what prices, as well as the way in which the products are offered to the customer. The replenishment function can be located at the individual stores (ordering procedure) or it can be centralised (pushing of products to the stores). The
Is the Value Concept a Valuable Concept for Information Systems?
99
grocery and non-food products are always supplied by third parties. Fresh products such as bread or meat can either be supplied by third parties or produced by the retailer itself. Food products with a longer shelf life are usually supplied by third parties.
For the retailer as a company two primary values can be distinguished: the contribution of the different product segment to the financial results, and the importance and reputation of the product segment by the customer. The latter is a contribution to the pull of the retailer to get the customers into the store and as such is also a factor in the revenue of other segments. The former contribution has a direct financial nature and can be determined by the usual means (which have to a certain extent a discretionary component). The second contribution is primarily of a qualitative nature and has financial effects besides. The attractiveness and image of a retailer determine in part whether a customer is going to do his shopping there, thus contributing to the results. The attractiveness to the customer is determined by the presentation and availability of products in the stores and by the quality and price of the products. The responsibility for these aspects is located partly with category management and partly with the replenishment processes.
The replenishment function is supported by a number of logistic processes. Distribution logistics is a trade-off of on the one hand lead times, frequency and size of the deliveries and costs on the other hand. The shorter the lead times, the more frequent delivery can be and the lower the ordering volume, the better the replenishment process can be performed. However, the logistic costs will be lowest when the number of deliveries is as low as possible, when the utilisation of the capacity of the vehicles is as high as possible, and when handling costs in the preparation of the branch order, in order picking, and in transport are as low as possible. In planning the deliveries a longer lead time means more efficient processes in the preparation of the order fulfilment and transport.
The options for the consumer are determined by the number of products on offer and is expressed by the number of different articles, the different article variants (low cost, premium, organic, …) and/or brands (national brands, store brands, no-brands) and the various packaging sizes. The other side of the coin is that sometimes the consumer cannot see the forest for the trees anymore and gets lost among the options. At this point the freedom of choice flips to a necessity of choosing and the diversity on offer can become a negative feature for the consumer. This is why the presentation of products is of such
importance in category management: a logical division of products with the right presentation both on the product itself and on the shelves helps the consumer to make a choice; a multitude of overlapping product categories with poor consumer information (such as unclear logo’s) will deter customers.
Value for the customer of the retailer means an attractive shop, and full shelves with the right products. Who creates this value? Primarily the shop designer, category management and replenishment. What are the employees doing in the primary processes of the internal and external suppliers of the retailer? They produce the right products, not directly according to the wishes of the consumer, but by producing in accordance with the specifications. Part of the specifications are determined by the end product itself, and are meant to be appreciated by the consumer. Part of the specifications are determined by the logistic processes (both packaging and information issues), and contribute to lower logistic costs and a faster throughput. The first element contributes to value for money for the consumer and/or the profit of the retailer, the second element contributes to availability and freshness of the products, another value for the consumer. Evidently, as any healthy company the retailer strives for profits and market share. Consumer value is a means to an end. Perceived value is boosted by marketing campaigns, attractiveness is enhanced by sport sponsoring. A retailer is no charity institution, and talk about consumer value sometimes is quite hollow. What matters is that the retailer must provide value for money, and translates this abstract concept via category managements and replenishment functions in operational specifications and norms.
5 RELATED WORK
The “value chain” concept is strongly process-oriented, while at the same time the determination of value is strongly product-oriented. In the literature, the value of a product in a business sense is mainly seen as the difference between costs and revenue (and the costing model is considered unproblematic). On the other hand, the literature often discusses the creation of value for the customer. This means that the product has characteristics that make it valuable to the customer. The process approach of the value chain claims to analyse the business processes according to their contribution to the value of the product for the customer. This approach has strong
Fourth International Symposium on Business Modeling and Software Design
100
connections to the lean philosophy originating in Japan. However, there is a difference in emphasis: while the value chain analysis is primarily concerned with the contribution to value, the lean approach emphasises the avoidance of waste of any kind. This is an important distinction: the contribution of value looks at the difference between costs and revenues; the lean approach looks at all kinds of waste, regardless of value, in order to arrive at a product with the right characteristics. Both tend to take the usability and attractiveness for the customer for granted.
For the application of the value concept for operational processes two approaches must be considered, namely the supply chain approach and the lean approach. The supply chain approach is in part dealing with the same issues as the value chain concept, and the value chain could be described as encompassing the value chain. The problem with the supply chain, however, is the ostensible denial of the market mechanism. Take the following definition: “Supply Chain Management can be redefined as a strategic channel management of networks of business integrated together through information technologies and empowered to execute superlative, customer-winning value at the lowest cost through the digital, real-time synchronisation of products and services, vital marketplace information, and logistics delivery capabilities with demand priorities” (Ross 2011). A very ambitious and verbose definition, but what does it mean in our real world? Who are the actors, and what is the relationship between the actors? The supposition is that the actors are interdependent companies, acting for the greater good of the optimal supply chain as a whole. But, low level market-oriented questions remain: who orchestrates the supply chain? Which companies take the profit from the surplus value of the supply chain? Power relations between companies matter, and when a weaker company cooperates with a stronger market power, chances are that the weaker company is squeezed to the point of barely surviving (or pushed beyond that point). Co-creation of value is a very nice idea when you are the stronger partner, for the weaker partner it implies the denial of independent value creation for its own good.
The connection of the value chain with the lean approach is much more fruitful. But where the value chain talks about the creation of value, one of the main focal points of the lean approach is the elimination of waste. Another main focal point is the quality of both process and product. These two forces result in the effective and efficient production of the specified products. Provided that the specified
products are of value for the customer, the creation of value is unavoidable outcome of the lean process.
6 CONCLUSIONS
The concepts of “value” and “value chain” have been introduced by Porter as an approach to support strategic decision making by the enterprise. Afterwards, these concepts have been applied increasingly to the analysis of business processes, with a strong connection to the ideas of the lean approach. The concepts seem to focus primarily on financial issues, translated to results as the difference between costs and revenues. This inclination to cost aspects has two implications for the usability in an operational context. Firstly, people in operational processes are not primarily engaged with cost as such, they are doing their job in an effective and efficient way. Both the organisation of the processes and the execution of the processes contribute to low costs, but people are accountable for working according to specification and for avoiding waste of resources. The second implication is that the usability of the products is not determined by the processes themselves, but by the product specification. This is the area of product development and marketing, where the issues of offering the right products for the right price for the target markets are addressed.
An important aspect of the value chain is the interaction of the company with the customers. In this context, the primary processes should be able to adapt to some degree of variability and volatility of demand. To which degree is determined by the market strategy of the company, and translated into operational norms for the primary processes. Again, value for the customer is decoupled from the operational processes via operational norms. Operational people are dealing with these norms and not with their own individual perception of value for the customer (unless the company attributes this specifically to some employees).
The value concept is a fuzzy concept, in the sense that the concept has different meanings that are used in a fuzzy way. One core meaning is practically useless as it will not add value to any discussion: value as the margin between cost and revenues. Another core meaning is usability for the customer, and this is an important notion (and has always been so). The value chain seems to be using this notion, but does not clearly say so. In determining the strategy of a company this meaning of value (and value chain) might well be used.
Is the Value Concept a Valuable Concept for Information Systems?
101

In the analysis of the processes and activities within the company the classification of value creating, value enabling, and other (wasted) activities can provide a useful vocabulary. For the actual activities, however, the value notion is no more than a background notion. The ‘usability for the customer’ must be translated in specifications and norms, that are the guidelines for the execution of the primary processes. In resolving conflicting norms in the execution of the primary processes the value for the customer (and the value for the company) might be factored in, both in making choices in the process and in defending them afterwards.
REFERENCES
OED, 2007. Shorter Oxford English Dictionary, Oxford University Press. Oxford, 6th edition
Baum, B.B., 2013. Service Business Costing, Springer Gabler. Wiesbaden.
Kaplinsky, R., Morris, M., 2002. A Handbook for Value Chain Research, Institute for Development Studies. Available at http://www.globalvaluechains.org/tools.html
Porter, M.E., 1985. Competitive Advantage, Free Press. New York.
Hammer, M., Champy J., 1993. Reengineering the Corporation, Nicholas Brealey. London.
Hammer, M. 1996. Beyond Reengineering, Harper.New York.
Martin, K., Osterling, M., 2014. Value Stream Mapping, McGraw-Hill. New York.
Womack, J.P., Jones, D.T., Roos, D., 1990. The Machine that Changed the World, Free Press. New York.
Womack, J.P., Jones, D.T., 1996. Lean Thinking, Simeon Schuster. London.
Weske, M., 2007. Business Process Management, Springer. Berlin.
Vollmann, T.E., Berry, W.L., Whybark, D.C., Jacobs, F.R., 2005. Manufacturing Planning & Control Systems for Supply Chain Management, McGraw-Hill. New York, 5th edition.
Pachlowski,, J., 2014. Lean Supply Chain Planning, CRC Press. Boca Raton.
Hansen, R.C., 2001. Overall Equipment Effectiveness, Industrial Press. New York.
Fernie, J., Sparks, L., 2014. Retail Logistics: changes and challenges. In: Logistics and Retail Management, Kogan Page. London.
Nielsen, A.C., 2006. Consumer-Centric Category Management, John Wiley. Hoboken NJ.
Ross, D.F. 2011. Introduction to Supply Chain Management Technologies, CRC Press. Boca Raton, 2nd edition
Fourth International Symposium on Business Modeling and Software Design
102
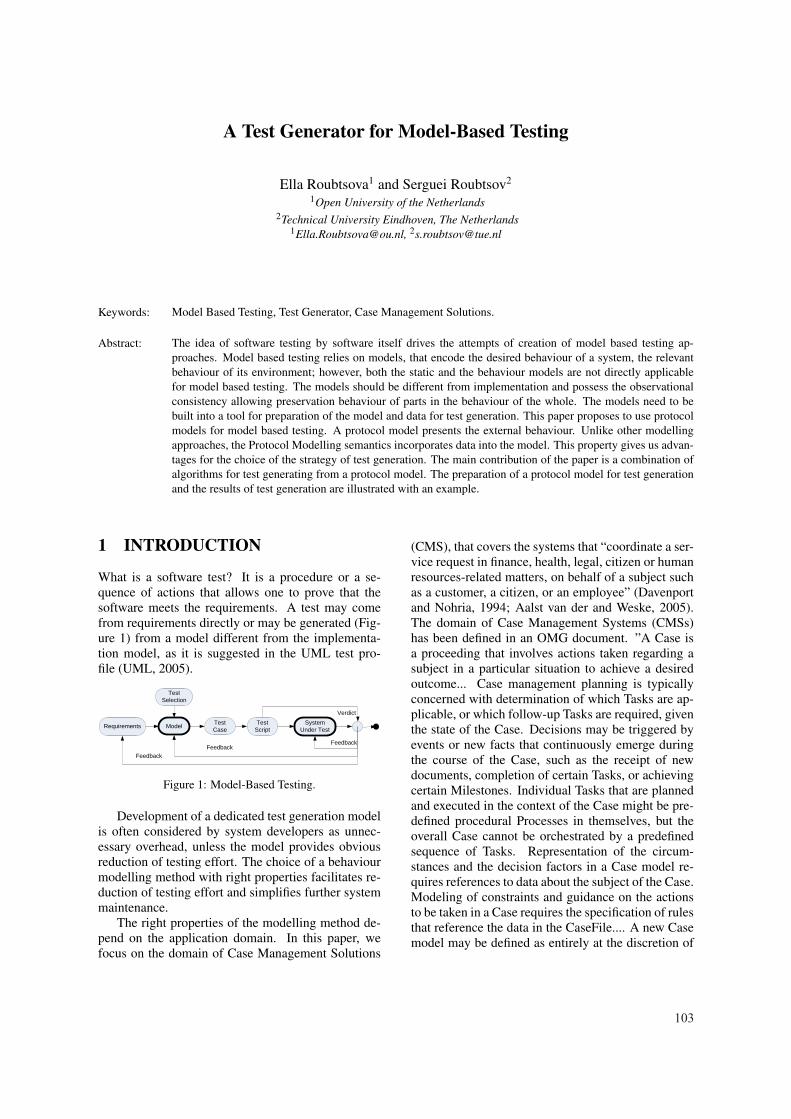
A Test Generator for Model-Based Testing
Ella Roubtsova1 and Serguei Roubtsov2
1Open University of the Netherlands2Technical University Eindhoven, The Netherlands
[email protected], [email protected]
Keywords: Model Based Testing, Test Generator, Case Management Solutions.
Abstract: The idea of software testing by software itself drives the attempts of creation of model based testing ap-proaches. Model based testing relies on models, that encode the desired behaviour of a system, the relevantbehaviour of its environment; however, both the static and the behaviour models are not directly applicablefor model based testing. The models should be different from implementation and possess the observationalconsistency allowing preservation behaviour of parts in the behaviour of the whole. The models need to bebuilt into a tool for preparation of the model and data for test generation. This paper proposes to use protocolmodels for model based testing. A protocol model presents the external behaviour. Unlike other modellingapproaches, the Protocol Modelling semantics incorporates data into the model. This property gives us advan-tages for the choice of the strategy of test generation. The main contribution of the paper is a combination ofalgorithms for test generating from a protocol model. The preparation of a protocol model for test generationand the results of test generation are illustrated with an example.
1 INTRODUCTION
What is a software test? It is a procedure or a se-quence of actions that allows one to prove that thesoftware meets the requirements. A test may comefrom requirements directly or may be generated (Fig-ure 1) from a model different from the implementa-tion model, as it is suggested in the UML test pro-file (UML, 2005).
Requirements ModelSystem
Under Test
Test
Case
Test
Script
Test
Selection
Verdict
FeedbackFeedback
Feedback
Figure 1: Model-Based Testing.
Development of a dedicated test generation modelis often considered by system developers as unnec-essary overhead, unless the model provides obviousreduction of testing effort. The choice of a behaviourmodelling method with right properties facilitates re-duction of testing effort and simplifies further systemmaintenance.
The right properties of the modelling method de-pend on the application domain. In this paper, wefocus on the domain of Case Management Solutions
(CMS), that covers the systems that “coordinate a ser-vice request in finance, health, legal, citizen or humanresources-related matters, on behalf of a subject suchas a customer, a citizen, or an employee” (Davenportand Nohria, 1994; Aalst van der and Weske, 2005).The domain of Case Management Systems (CMSs)has been defined in an OMG document. ”A Case isa proceeding that involves actions taken regarding asubject in a particular situation to achieve a desiredoutcome... Case management planning is typicallyconcerned with determination of which Tasks are ap-plicable, or which follow-up Tasks are required, giventhe state of the Case. Decisions may be triggered byevents or new facts that continuously emerge duringthe course of the Case, such as the receipt of newdocuments, completion of certain Tasks, or achievingcertain Milestones. Individual Tasks that are plannedand executed in the context of the Case might be pre-defined procedural Processes in themselves, but theoverall Case cannot be orchestrated by a predefinedsequence of Tasks. Representation of the circum-stances and the decision factors in a Case model re-quires references to data about the subject of the Case.Modeling of constraints and guidance on the actionsto be taken in a Case requires the specification of rulesthat reference the data in the CaseFile.... A new Casemodel may be defined as entirely at the discretion of
103
human participants initially, but it should be expectedto evolve as repeatable patterns and best practicesemerge.” (OMG, 2013) A CMS supports communica-tion of the system with different business actors. Thesystem reaction to the requests of actors is determinis-tically defined by business rules. It should not containimplementation details. Business rules are formulatedusing visible states of the system expressed with data.Therefore, the behaviour modelling method should(1) result in a deterministic models,(2) present only visible system states and(3) enable expressions with relevant data and datatransformation.The distinguished property of these systems is the fre-quent need of change and subsequent testing due tothe changes of law regulations and business optimiza-tion. Modelling approaches which facilitate indepen-dent modelling of a change and its composition withthe old model can reduce modelling and testing effort.
In this paper, we address the problem of model-based testing of CMSs. First, we analyse the mod-elling techniques in order to select the one that isthe most suitable for CMSs. Second, we propose amethod of using the chosen modelling technique fortest generation and the corresponding algorithms.
2 MODELLING APPROACHESTO MODEL-BASED TESTING
The first research question that we answer in the paperis: Is there a modelling approach most suitable to thedomain of Case Management Systems?
We start our analysis with the approaches stan-dardised in the UML (OMG, 2003).
2.1 Modelling Approaches in the UML
Use Cases are used to describe the scenarios of inter-actions between the system and the environment. UseCases are presented in a combination of the naturallanguage and informal diagrams. The informal andpartial use case does not cover system requirements,does not use data, does not support the compositionof models.
Interaction Diagrams (Sequence Diagrams andCommunication Diagrams) can be used to express in-teraction of communicating objects during their life-time. Normally, one such diagram presents one se-quence of interaction. If decision points are used, aninteraction diagram can present a restricted numberof sequences. A set of interaction diagrams usuallypresents only a subset of possible sequences. Com-position of interaction diagrams is not defined in the
UML. The suggestions for ”mechanical” composi-tion (Roubtsova and Kuiper, 2003; Greenyer et al.,2008; Hanenberg et al., 2007) do not guarantee thespecification of complete behaviour.
Activity Diagrams provide a flow based model-ing medium, similar to Petri Nets (Petri and Reisig,2008). They are used to show “the sequence andconditions for coordinating behaviors” rather than be-haviours of objects. (OMG, 2003). This means thatActivity Diagrams are not suitable for representingthe behavior of an object model and, as a conse-quence, the separate modelling of requirements is notalways possible.
State Machines exist in two variants: BehavioralState Machines (BSM) and Protocol State Machines(PSM) (OMG, 2003).
A Behavior State Machine usually presents behav-ior of one class. “Behavior is modeled as a traversalof a graph of state nodes interconnected by one ormore joined transition arcs that are triggered by thedispatching of series of (event) occurrences. Duringthis traversal, the state machine executes a series ofactivities associated with various elements of the statemachine.” (OMG, 2003) A transition label e[g]/a in-cludes an event e that triggers the transition, a guardg that restricts the condition of a transition firing andthe action a that happens if the transition takes place.The composition semantics for BSMs defines an eventqueue which holds the incoming event instances un-til they are dispatched, an event dispatcher mecha-nism that selects event instances from the queue, andan event processor which processes dispatched eventinstances according to the general semantics of theUML state machines. Event instances being results ofsome actions within the system or in the environmentare conveyed to one or more BMSs (OMG, 2003). Anevent is received by a BMS if it is placed on the eventqueue of the BMS. An event is dispatched when it isremoved from the queue and delivered to the state ma-chine for processing. If an event is dispatched, it mayresult in one or more transitions. If no transition isenabled, then the event is discarded. Finally the eventis consumed and it is no longer available for process-ing. The consumption of events depends on the activestate of a state machine. If an event triggers a tran-sition in the current state, it is dispatched and con-sumed. “A state may specify a set of event types thatmay be deferred in the state. An event instance thatdoes not trigger any transition in the current state willnot be dispatched if its type matches with the typeof one of the deferred events. Instead it remains inthe event queue while another not deferred messageis dispatched instead” (OMG, 2003). In other words,
• if an event recognized by a machine that enables
Fourth International Symposium on Business Modeling and Software Design
104
a transition in its current state, then it can be con-sumed;
• if an event recognized by a machine that does notenable a transition in the current, an this event isincluded in the list of deferred events for this state,it is kept in a queue for later processing;
• otherwise the event is discarded (McNeile andRoubtsova, 2009).
This means that processing of an event by differentmachines is asynchronous and the result of processingis non-deterministic. If an event can cause firing oftwo transitions, which transition can happen first isnot defined.
Thus, BSMs do provide complete behavior de-scriptions and can provide model based executionneeded for MBT. However, BSM do not result in de-terministic models and do not meet our requirementsfor the modelling method for MBT of CMS.
The UML Protocol State Machines (PSMs) areused to express the transitions that a classifier can trig-ger. A PSM is a way to define a life cycle of an ob-ject, or an order of the invocation of its operations.PSMs can express usage scenarios of object classesand interfaces. The effect actions of transitions arenot specified in a PSM transition as the trigger itselfis the operation. However, pre- and post- conditionsare specified, so that the label of a transition is ofthe form [precondition] event/ [postcondition]. Theoccurrence of an event that a PSM cannot handle isviewed as a precondition violation, but the consequentbehavior is left open. “The interpretation of the recep-tion of an event in an unexpected situation (currentstate, state invariant, and pre-condition) is a semanticvariation point: the event can be ignored, rejected, ordeferred; an exception can be raised; or the applica-tion can stop on an error. It corresponds semanticallyto a pre-condition violation, for which no predefinedbehavior is defined in UML” (OMG, 2003). UnlikeBSMs, PSMs can (to a limited extent) be composed.“A class may have several protocol state machines.This happens frequently, for example, when a classinherits several parent classes having protocol statemachine, when the protocols are orthogonal.” (OMG,2003). However, the semantics of composition forPSMs is undefined.
As a result of the above analysis we conclude thatnone of the UML behaviour modelling approaches aresatisfying enough to meet the requirements to mod-elling Case Management Systems.
2.2 Outside the UML
The MBT approaches often experiment with labeledtransition systems with different semantics. For ex-
ample, the Labelled Transition Systems (LTSs) usedby Kervinen at al. (Kervinen et al., 2006) (s0,S,E,T )( s0 is an initial state; S - a set of states; E is a setof events; T ⊆ S×E × S) is a deterministic model.There is no state in which any output transition sharethe same action name. The LTSs can be composed us-ing the CSP parallel composition (Hoare, 1985). Alsothere are rules of matching events that are used forsynchronous composition.
LTSs used by Kervinen at al. (Kervinen et al.,2006) meet most of our requirements to the modellingmethod for CMS. Such LTSs are able to provide thebasis of MBT implementation. The shortcoming istheir abstraction from data.
The Protocol Modelling technique (McNeile andSimons, 2006) overcomes the above mentioned short-comings of LTSs. Protocol Modelling uses the CSPparallel composition (Hoare, 1985) extended by A.McNeile to enable the composition of models withdata (McNeile and Simons, 2006). It is provenin (McNeile and Roubtsova, 2008) that protocol mod-els possess the property called observational consis-tency. This property means that a protocol machinemay be added to and deleted from the model or lo-cally changed and the trace behaviour of other proto-col machines is not affected by the behaviour of of theadded, deleted or modified protocol machines (Mc-Neile and Roubtsova, 2008). We argue that, poten-tially, observational consistency of protocol modelscan reduce the modelling and testing effort when theCMS is changed.
3 PROTOCOL MODELLING FORMBT
Our second research question is: How can a protocolmodel be used for test generation?
3.1 What is a Protocol Model?
The building blocks of a Protocol Model are proto-col machines and events. They are instances of corre-spondingly protocol machine types and event types.
A protocol machine type is an LTS extended toenable modelling with data:
PMi = (s0i ,Si,Ei,Ai,CBi,Ti), where
• s0i is the initial state;
• Si is a non-empty finite set of states.
• Ei is a finite set of recognized event types ei, com-ing from the environment.
A Test Generator for Model-Based Testing
105
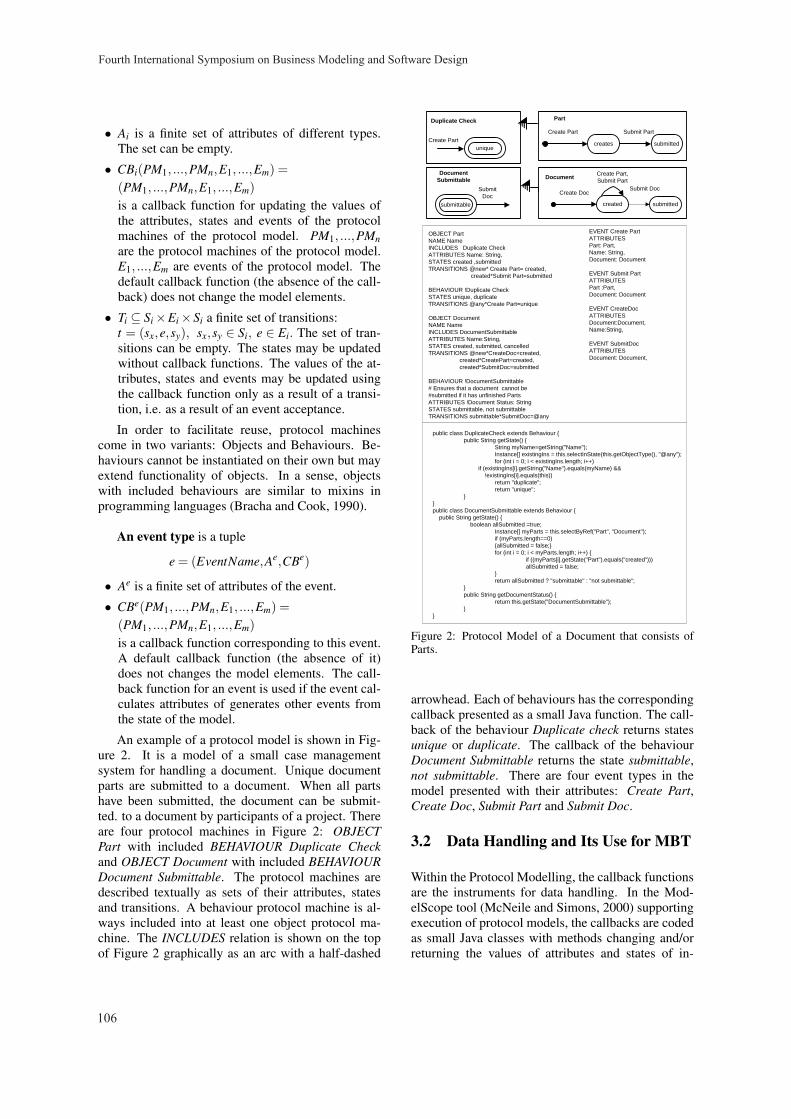
• Ai is a finite set of attributes of different types.The set can be empty.
• CBi(PM1, ...,PMn,E1, ...,Em) =
(PM1, ...,PMn,E1, ...,Em)
is a callback function for updating the values ofthe attributes, states and events of the protocolmachines of the protocol model. PM1, ...,PMnare the protocol machines of the protocol model.E1, ...,Em are events of the protocol model. Thedefault callback function (the absence of the call-back) does not change the model elements.
• Ti ⊆ Si×Ei×Si a finite set of transitions:t = (sx,e,sy), sx,sy ∈ Si, e ∈ Ei. The set of tran-sitions can be empty. The states may be updatedwithout callback functions. The values of the at-tributes, states and events may be updated usingthe callback function only as a result of a transi-tion, i.e. as a result of an event acceptance.
In order to facilitate reuse, protocol machinescome in two variants: Objects and Behaviours. Be-haviours cannot be instantiated on their own but mayextend functionality of objects. In a sense, objectswith included behaviours are similar to mixins inprogramming languages (Bracha and Cook, 1990).
An event type is a tuple
e = (EventName,Ae,CBe)
• Ae is a finite set of attributes of the event.
• CBe(PM1, ...,PMn,E1, ...,Em) =
(PM1, ...,PMn,E1, ...,Em)
is a callback function corresponding to this event.A default callback function (the absence of it)does not changes the model elements. The call-back function for an event is used if the event cal-culates attributes of generates other events fromthe state of the model.
An example of a protocol model is shown in Fig-ure 2. It is a model of a small case managementsystem for handling a document. Unique documentparts are submitted to a document. When all partshave been submitted, the document can be submit-ted. to a document by participants of a project. Thereare four protocol machines in Figure 2: OBJECTPart with included BEHAVIOUR Duplicate Checkand OBJECT Document with included BEHAVIOURDocument Submittable. The protocol machines aredescribed textually as sets of their attributes, statesand transitions. A behaviour protocol machine is al-ways included into at least one object protocol ma-chine. The INCLUDES relation is shown on the topof Figure 2 graphically as an arc with a half-dashed
submitted
Create Part Submit Part
Part
created
Create Doc
DocumentCreate Part,
Submit Part
createsunique
Create Part
Duplicate Check
public class DuplicateCheck extends Behaviour {
public String getState() {
String myName=getString("Name");
Instance[] existingIns = this.selectInState(this.getObjectType(), "@any");
for (int i = 0; i < existingIns.length; i++)
if (existingIns[i].getString("Name").equals(myName) &&
!existingIns[i].equals(this))
return "duplicate";
return "unique";
}
}
public class DocumentSubmittable extends Behaviour {
public String getState() {
boolean allSubmitted =true;
Instance[] myParts = this.selectByRef("Part", "Document");
if (myParts.length==0)
{allSubmitted = false;}
for (int i = 0; i < myParts.length; i++) {
if ((myParts[i].getState("Part").equals("created")))
allSubmitted = false;
}
return allSubmitted ? "submittable" : "not submittable";
}
public String getDocumentStatus() {
return this.getState("DocumentSubmittable");
}
}
OBJECT Part
NAME Name
INCLUDES Duplicate Check
ATTRIBUTES Name: String,
STATES created ,submitted
TRANSITIONS @new* Create Part= created,
created*Submit Part=submitted
BEHAVIOUR !Duplicate Check
STATES unique, duplicate
TRANSITIONS @any*Create Part=unique
OBJECT Document
NAME Name
INCLUDES DocumentSubmittable
ATTRIBUTES Name:String,
STATES created, submitted, cancelled
TRANSITIONS @new*CreateDoc=created,
created*CreatePart=created,
created*SubmitDoc=submitted
BEHAVIOUR !DocumentSubmittable
# Ensures that a document cannot be
#submitted if it has unfinished Parts
ATTRIBUTES !Document Status: String
STATES submittable, not submittable
TRANSITIONS submittable*SubmitDoc=@any
EVENT Create Part
ATTRIBUTES
Part: Part,
Name: String,
Document: Document
EVENT Submit Part
ATTRIBUTES
Part :Part,
Document: Document
EVENT CreateDoc
ATTRIBUTES
Document:Document,
Name:String,
EVENT SubmitDoc
ATTRIBUTES
Document: Document,
submittable
Submit
Doc
Document
Submittable
submitted
Submit Doc
Figure 2: Protocol Model of a Document that consists ofParts.
arrowhead. Each of behaviours has the correspondingcallback presented as a small Java function. The call-back of the behaviour Duplicate check returns statesunique or duplicate. The callback of the behaviourDocument Submittable returns the state submittable,not submittable. There are four event types in themodel presented with their attributes: Create Part,Create Doc, Submit Part and Submit Doc.
3.2 Data Handling and Its Use for MBT
Within the Protocol Modelling, the callback functionsare the instruments for data handling. In the Mod-elScope tool (McNeile and Simons, 2000) supportingexecution of protocol models, the callbacks are codedas small Java classes with methods changing and/orreturning the values of attributes and states of in-
Fourth International Symposium on Business Modeling and Software Design
106
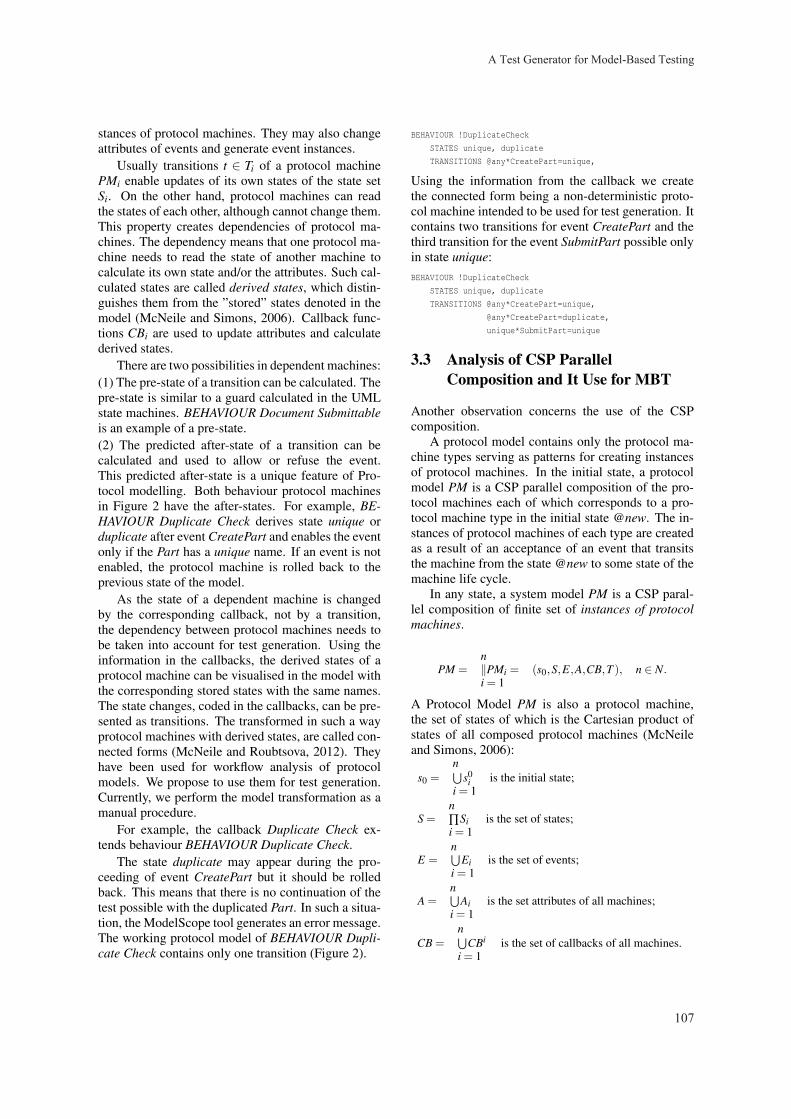
stances of protocol machines. They may also changeattributes of events and generate event instances.
Usually transitions t ∈ Ti of a protocol machinePMi enable updates of its own states of the state setSi. On the other hand, protocol machines can readthe states of each other, although cannot change them.This property creates dependencies of protocol ma-chines. The dependency means that one protocol ma-chine needs to read the state of another machine tocalculate its own state and/or the attributes. Such cal-culated states are called derived states, which distin-guishes them from the ”stored” states denoted in themodel (McNeile and Simons, 2006). Callback func-tions CBi are used to update attributes and calculatederived states.
There are two possibilities in dependent machines:(1) The pre-state of a transition can be calculated. Thepre-state is similar to a guard calculated in the UMLstate machines. BEHAVIOUR Document Submittableis an example of a pre-state.(2) The predicted after-state of a transition can becalculated and used to allow or refuse the event.This predicted after-state is a unique feature of Pro-tocol modelling. Both behaviour protocol machinesin Figure 2 have the after-states. For example, BE-HAVIOUR Duplicate Check derives state unique orduplicate after event CreatePart and enables the eventonly if the Part has a unique name. If an event is notenabled, the protocol machine is rolled back to theprevious state of the model.
As the state of a dependent machine is changedby the corresponding callback, not by a transition,the dependency between protocol machines needs tobe taken into account for test generation. Using theinformation in the callbacks, the derived states of aprotocol machine can be visualised in the model withthe corresponding stored states with the same names.The state changes, coded in the callbacks, can be pre-sented as transitions. The transformed in such a wayprotocol machines with derived states, are called con-nected forms (McNeile and Roubtsova, 2012). Theyhave been used for workflow analysis of protocolmodels. We propose to use them for test generation.Currently, we perform the model transformation as amanual procedure.
For example, the callback Duplicate Check ex-tends behaviour BEHAVIOUR Duplicate Check.
The state duplicate may appear during the pro-ceeding of event CreatePart but it should be rolledback. This means that there is no continuation of thetest possible with the duplicated Part. In such a situa-tion, the ModelScope tool generates an error message.The working protocol model of BEHAVIOUR Dupli-cate Check contains only one transition (Figure 2).
BEHAVIOUR !DuplicateCheck
STATES unique, duplicate
TRANSITIONS @any*CreatePart=unique,
Using the information from the callback we createthe connected form being a non-deterministic proto-col machine intended to be used for test generation. Itcontains two transitions for event CreatePart and thethird transition for the event SubmitPart possible onlyin state unique:BEHAVIOUR !DuplicateCheck
STATES unique, duplicate
TRANSITIONS @any*CreatePart=unique,
@any*CreatePart=duplicate,
unique*SubmitPart=unique
3.3 Analysis of CSP ParallelComposition and It Use for MBT
Another observation concerns the use of the CSPcomposition.
A protocol model contains only the protocol ma-chine types serving as patterns for creating instancesof protocol machines. In the initial state, a protocolmodel PM is a CSP parallel composition of the pro-tocol machines each of which corresponds to a pro-tocol machine type in the initial state @new. The in-stances of protocol machines of each type are createdas a result of an acceptance of an event that transitsthe machine from the state @new to some state of themachine life cycle.
In any state, a system model PM is a CSP paral-lel composition of finite set of instances of protocolmachines.
nPM = ‖PMi = (s0,S,E,A,CB,T ), n ∈ N.
i = 1
A Protocol Model PM is also a protocol machine,the set of states of which is the Cartesian product ofstates of all composed protocol machines (McNeileand Simons, 2006):
ns0 =
⋃s0
i is the initial state;i = 1
nS = ∏Si is the set of states;
i = 1n
E =⋃
Ei is the set of events;i = 1n
A =⋃
Ai is the set attributes of all machines;i = 1
nCB =
⋃CBi is the set of callbacks of all machines.
i = 1
A Test Generator for Model-Based Testing
107
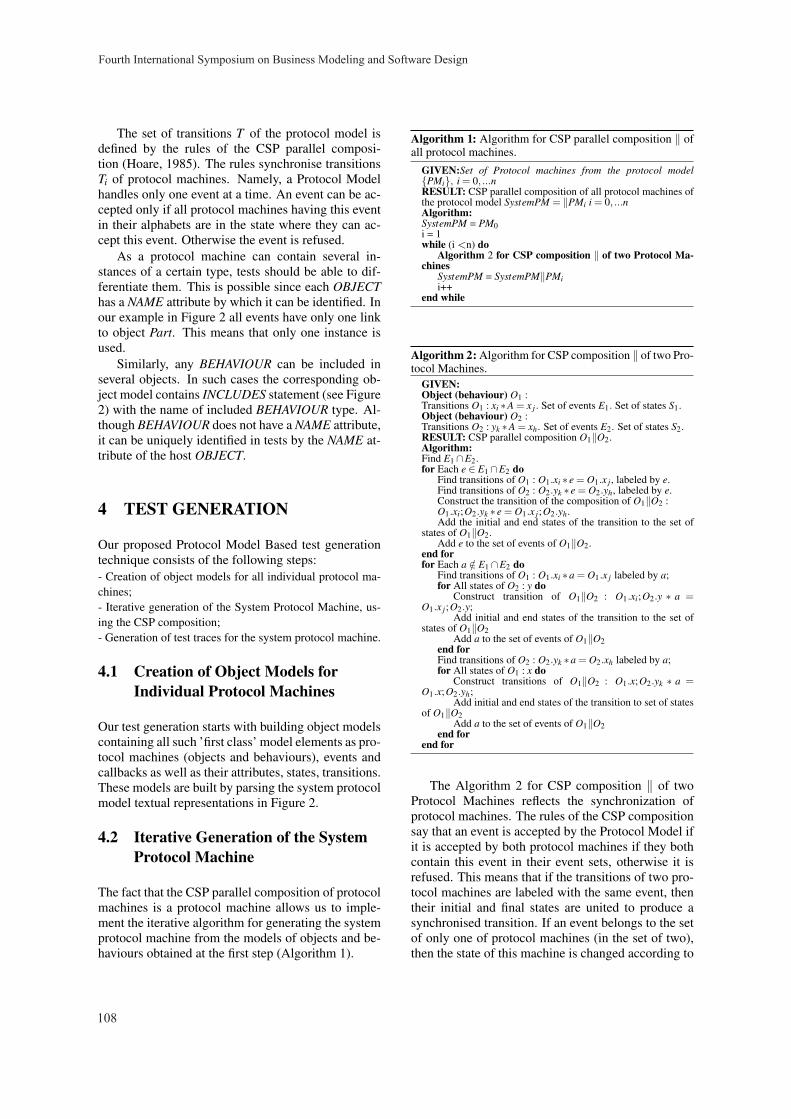
The set of transitions T of the protocol model isdefined by the rules of the CSP parallel composi-tion (Hoare, 1985). The rules synchronise transitionsTi of protocol machines. Namely, a Protocol Modelhandles only one event at a time. An event can be ac-cepted only if all protocol machines having this eventin their alphabets are in the state where they can ac-cept this event. Otherwise the event is refused.
As a protocol machine can contain several in-stances of a certain type, tests should be able to dif-ferentiate them. This is possible since each OBJECThas a NAME attribute by which it can be identified. Inour example in Figure 2 all events have only one linkto object Part. This means that only one instance isused.
Similarly, any BEHAVIOUR can be included inseveral objects. In such cases the corresponding ob-ject model contains INCLUDES statement (see Figure2) with the name of included BEHAVIOUR type. Al-though BEHAVIOUR does not have a NAME attribute,it can be uniquely identified in tests by the NAME at-tribute of the host OBJECT.
4 TEST GENERATION
Our proposed Protocol Model Based test generationtechnique consists of the following steps:- Creation of object models for all individual protocol ma-chines;- Iterative generation of the System Protocol Machine, us-ing the CSP composition;- Generation of test traces for the system protocol machine.
4.1 Creation of Object Models forIndividual Protocol Machines
Our test generation starts with building object modelscontaining all such ’first class’ model elements as pro-tocol machines (objects and behaviours), events andcallbacks as well as their attributes, states, transitions.These models are built by parsing the system protocolmodel textual representations in Figure 2.
4.2 Iterative Generation of the SystemProtocol Machine
The fact that the CSP parallel composition of protocolmachines is a protocol machine allows us to imple-ment the iterative algorithm for generating the systemprotocol machine from the models of objects and be-haviours obtained at the first step (Algorithm 1).
Algorithm 1: Algorithm for CSP parallel composition ‖ ofall protocol machines.
GIVEN:Set of Protocol machines from the protocol model{PMi}, i = 0, ...nRESULT: CSP parallel composition of all protocol machines ofthe protocol model SystemPM = ‖PMi i = 0, ...nAlgorithm:SystemPM = PM0i = 1while (i <n) do
Algorithm 2 for CSP composition ‖ of two Protocol Ma-chines
SystemPM = SystemPM‖PMii++
end while
Algorithm 2: Algorithm for CSP composition ‖ of two Pro-tocol Machines.
GIVEN:Object (behaviour) O1 :Transitions O1 : xi ∗A = x j. Set of events E1. Set of states S1.Object (behaviour) O2 :Transitions O2 : yk ∗A = xh. Set of events E2. Set of states S2.RESULT: CSP parallel composition O1‖O2.Algorithm:Find E1 ∩E2.for Each e ∈ E1 ∩E2 do
Find transitions of O1 : O1.xi ∗ e = O1.x j , labeled by e.Find transitions of O2 : O2.yk ∗ e = O2.yh, labeled by e.Construct the transition of the composition of O1‖O2 :O1.xi;O2.yk ∗ e = O1.x j;O2.yh.Add the initial and end states of the transition to the set of
states of O1‖O2.Add e to the set of events of O1‖O2.
end forfor Each a /∈ E1 ∩E2 do
Find transitions of O1 : O1.xi ∗a = O1.x j labeled by a;for All states of O2 : y do
Construct transition of O1‖O2 : O1.xi;O2.y ∗ a =O1.x j;O2.y;
Add initial and end states of the transition to the set ofstates of O1‖O2
Add a to the set of events of O1‖O2end forFind transitions of O2 : O2.yk ∗a = O2.xh labeled by a;for All states of O1 : x do
Construct transitions of O1‖O2 : O1.x;O2.yk ∗ a =O1.x;O2.yh;
Add initial and end states of the transition to set of statesof O1‖O2
Add a to the set of events of O1‖O2end for
end for
The Algorithm 2 for CSP composition ‖ of twoProtocol Machines reflects the synchronization ofprotocol machines. The rules of the CSP compositionsay that an event is accepted by the Protocol Model ifit is accepted by both protocol machines if they bothcontain this event in their event sets, otherwise it isrefused. This means that if the transitions of two pro-tocol machines are labeled with the same event, thentheir initial and final states are united to produce asynchronised transition. If an event belongs to the setof only one of protocol machines (in the set of two),then the state of this machine is changed according to
Fourth International Symposium on Business Modeling and Software Design
108
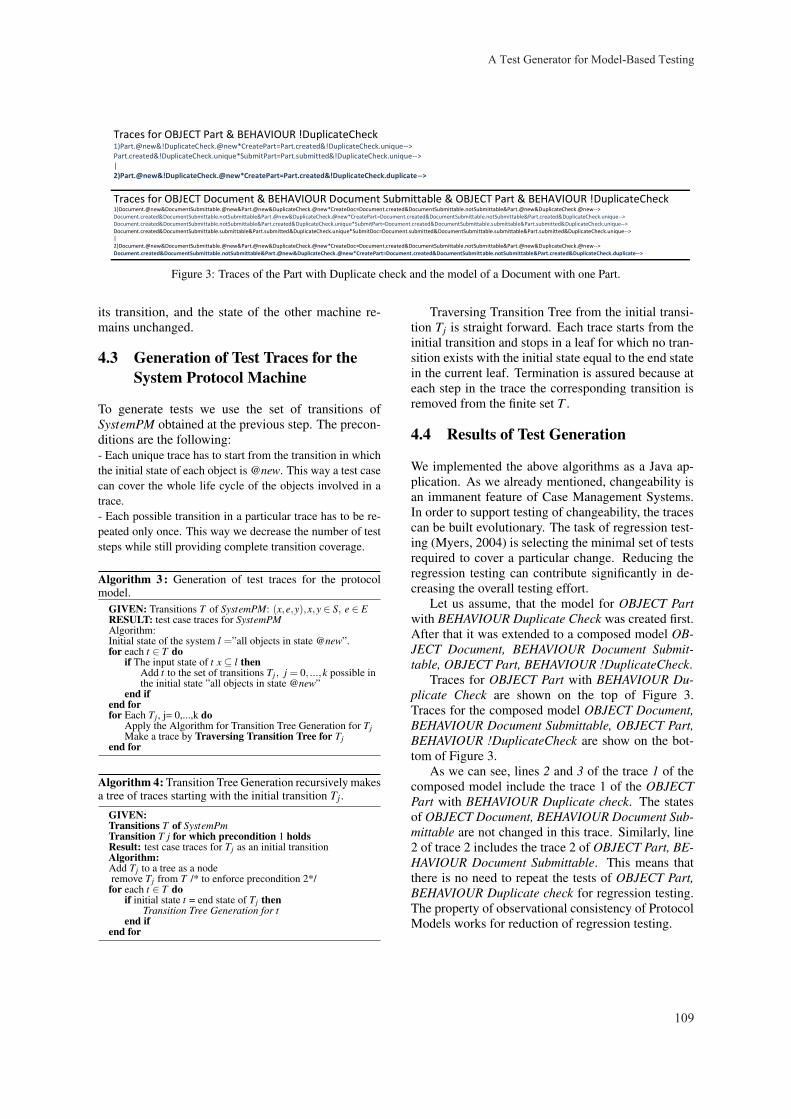
Traces for OBJECT Part & BEHAVIOUR !DuplicateCheck 1)Part.@new&!DuplicateCheck.@new*CreatePart=Part.created&!DuplicateCheck.unique--> Part.created&!DuplicateCheck.unique*SubmitPart=Part.submitted&!DuplicateCheck.unique--> | 2)Part.@new&!DuplicateCheck.@new*CreatePart=Part.created&!DuplicateCheck.duplicate-->
Traces for OBJECT Document & BEHAVIOUR Document Submittable & OBJECT Part & BEHAVIOUR !DuplicateCheck 1)Document.@new&DocumentSubmittable.@new&Part.@new&DuplicateCheck.@new*CreateDoc=Document.created&DocumentSubmittable.notSubmittable&Part.@new&DuplicateCheck.@new--> Document.created&DocumentSubmittable.notSubmittable&Part.@new&DuplicateCheck.@new*CreatePart=Document.created&DocumentSubmittable.notSubmittable&Part.created&DuplicateCheck.unique-->
Document.created&DocumentSubmittable.notSubmittable&Part.created&DuplicateCheck.unique*SubmitPart=Document.created&DocumentSubmittable.submittable&Part.submitted&DuplicateCheck.unique-->Document.created&DocumentSubmittable.submittable&Part.submitted&DuplicateCheck.unique*SubmitDoc=Document.submitted&DocumentSubmittable.submittable&Part.submitted&DuplicateCheck.unique--> | 2)Document.@new&DocumentSubmittable.@new&Part.@new&DuplicateCheck.@new*CreateDoc=Document.created&DocumentSubmittable.notSubmittable&Part.@new&DuplicateCheck.@new--> Document.created&DocumentSubmittable.notSubmittable&Part.@new&DuplicateCheck.@new*CreatePart=Document.created&DocumentSubmittable.notSubmittable&Part.created&DuplicateCheck.duplicate-->
Figure 3: Traces of the Part with Duplicate check and the model of a Document with one Part.
its transition, and the state of the other machine re-mains unchanged.
4.3 Generation of Test Traces for theSystem Protocol Machine
To generate tests we use the set of transitions ofSystemPM obtained at the previous step. The precon-ditions are the following:- Each unique trace has to start from the transition in whichthe initial state of each object is @new. This way a test casecan cover the whole life cycle of the objects involved in atrace.- Each possible transition in a particular trace has to be re-peated only once. This way we decrease the number of teststeps while still providing complete transition coverage.
Algorithm 3 : Generation of test traces for the protocolmodel.
GIVEN: Transitions T of SystemPM: (x,e,y),x,y ∈ S, e ∈ ERESULT: test case traces for SystemPMAlgorithm:Initial state of the system l =”all objects in state @new”.for each t ∈ T do
if The input state of t x⊆ l thenAdd t to the set of transitions Tj, j = 0, ...,k possible inthe initial state ”all objects in state @new”
end ifend forfor Each Tj , j= 0,...,k do
Apply the Algorithm for Transition Tree Generation for TjMake a trace by Traversing Transition Tree for Tj
end for
Algorithm 4: Transition Tree Generation recursively makesa tree of traces starting with the initial transition Tj.
GIVEN:Transitions T of SystemPmTransition T j for which precondition 1 holdsResult: test case traces for Tj as an initial transitionAlgorithm:Add Tj to a tree as a noderemove Tj from T /* to enforce precondition 2*/for each t ∈ T do
if initial state t = end state of Tj thenTransition Tree Generation for t
end ifend for
Traversing Transition Tree from the initial transi-tion Tj is straight forward. Each trace starts from theinitial transition and stops in a leaf for which no tran-sition exists with the initial state equal to the end statein the current leaf. Termination is assured because ateach step in the trace the corresponding transition isremoved from the finite set T .
4.4 Results of Test Generation
We implemented the above algorithms as a Java ap-plication. As we already mentioned, changeability isan immanent feature of Case Management Systems.In order to support testing of changeability, the tracescan be built evolutionary. The task of regression test-ing (Myers, 2004) is selecting the minimal set of testsrequired to cover a particular change. Reducing theregression testing can contribute significantly in de-creasing the overall testing effort.
Let us assume, that the model for OBJECT Partwith BEHAVIOUR Duplicate Check was created first.After that it was extended to a composed model OB-JECT Document, BEHAVIOUR Document Submit-table, OBJECT Part, BEHAVIOUR !DuplicateCheck.
Traces for OBJECT Part with BEHAVIOUR Du-plicate Check are shown on the top of Figure 3.Traces for the composed model OBJECT Document,BEHAVIOUR Document Submittable, OBJECT Part,BEHAVIOUR !DuplicateCheck are show on the bot-tom of Figure 3.
As we can see, lines 2 and 3 of the trace 1 of thecomposed model include the trace 1 of the OBJECTPart with BEHAVIOUR Duplicate check. The statesof OBJECT Document, BEHAVIOUR Document Sub-mittable are not changed in this trace. Similarly, line2 of trace 2 includes the trace 2 of OBJECT Part, BE-HAVIOUR Document Submittable. This means thatthere is no need to repeat the tests of OBJECT Part,BEHAVIOUR Duplicate check for regression testing.The property of observational consistency of ProtocolModels works for reduction of regression testing.
A Test Generator for Model-Based Testing
109
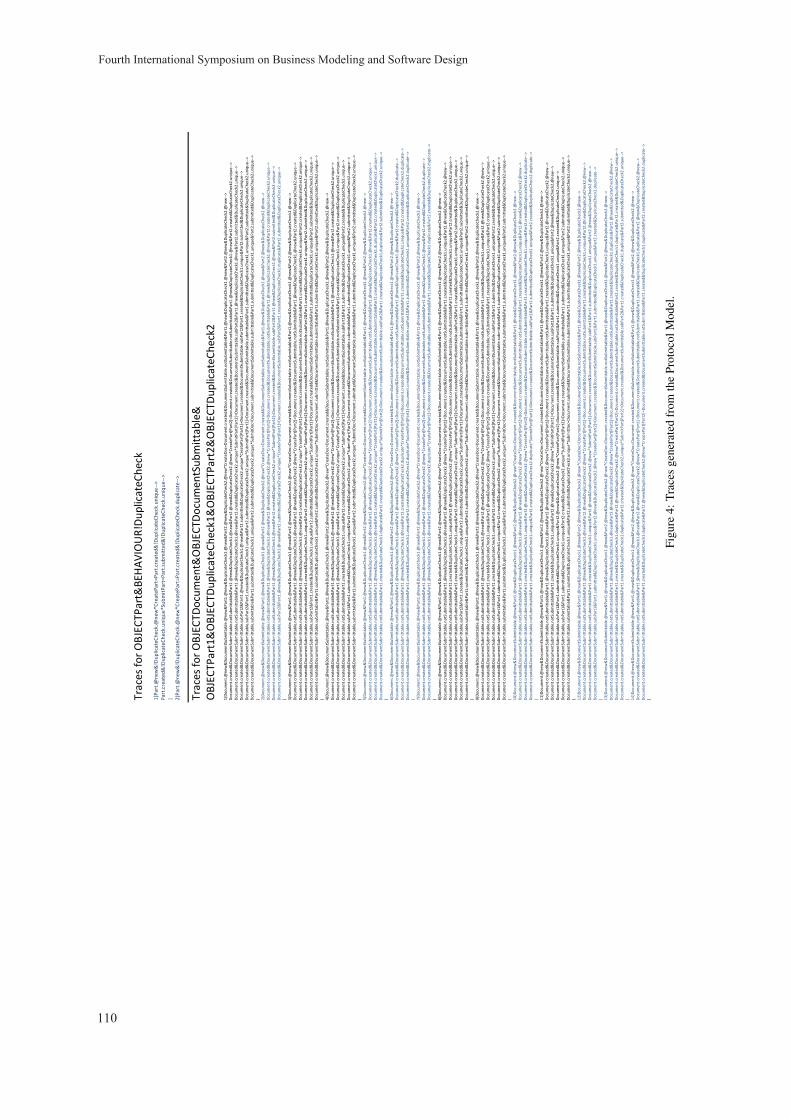
Trac
es f
or
OB
JEC
TPar
t&B
EHA
VIO
UR
!Du
plic
ateC
hec
k 1
)Par
t.@
new
&!D
up
licat
eCh
eck.
@n
ew*C
reat
ePar
t=P
art.
crea
ted
&!D
up
licat
eCh
eck
.un
iqu
e--
>
Par
t.cr
eate
d&
!Du
plic
ateC
hec
k.u
niq
ue
*Su
bm
itP
art=
Par
t.su
bm
itte
d&
!Du
plic
ateC
hec
k.u
niq
ue
-->
| 2
)Par
t.@
new
&!D
up
licat
eCh
eck.
@n
ew*C
reat
ePar
t=P
art.
crea
ted
&!D
up
licat
eCh
eck
.du
plic
ate
-->
Tr
aces
fo
r O
BJE
CTD
ocu
men
t&O
BJE
CTD
ocu
men
tSu
bm
itta
ble
&
OB
JEC
TPar
t1&
OB
JEC
TDu
plic
ateC
hec
k1&
OB
JEC
TPar
t2&
OB
JEC
TDu
plic
ateC
hec
k2
1)D
ocu
men
t.@
new
&D
ocu
men
tSu
bm
itta
ble
.@n
ew&
Par
t1.@
new
&D
up
licat
eCh
eck1
.@n
ew&
Par
t2.@
new
&D
up
licat
eCh
eck2
.@n
ew*C
reat
eD
oc=
Do
cum
ent.
crea
ted
&D
ocu
men
tSu
bm
itta
ble
.no
tSu
bm
itta
ble
&P
art1
.@n
ew&
Du
plic
ateC
hec
k1.@
new
&P
art2
.@n
ew&
Du
plic
ateC
hec
k2.@
new
-->
Do
cum
ent.
crea
ted
&D
ocu
men
tSu
bm
itta
ble
.no
tSu
bm
itta
ble
&P
art1
.@n
ew&
Du
plic
ateC
hec
k1.@
new
&P
art2
.@n
ew&
Du
plic
ate
Ch
eck2
.@n
ew*
Cre
ateP
art[
Par
t2]=
Do
cum
ent.
crea
ted
&D
ocu
men
tSu
bm
itta
ble
.no
tSu
bm
itta
ble
&P
art1
.@n
ew&
Du
plic
ate
Ch
eck1
.@n
ew&
Par
t2.c
reat
ed
&D
up
licat
eC
hec
k2.u
niq
ue
-->
Do
cum
ent.
crea
ted
&D
ocu
men
tSu
bm
itta
ble
.no
tSu
bm
itta
ble
&P
art1
.@n
ew&
Du
plic
ateC
hec
k1.@
new
&P
art2
.cre
ated
&D
up
licat
eCh
eck2
.un
iqu
e*Su
bm
itP
art[
Par
t2]=
Do
cum
ent.
crea
ted
&D
ocu
men
tSu
bm
itta
ble
.su
bP
art2
&P
art1
.@n
ew&
Du
plic
ateC
hec
k1.@
new
&P
art2
.su
bm
itte
d&
Du
plic
ateC
hec
k2.u
niq
ue
-->
Do
cum
ent.
crea
ted
&D
ocu
men
tSu
bm
itta
ble
.su
bP
art2
&P
art1
.@n
ew&
Du
plic
ate
Ch
eck1
.@n
ew&
Par
t2.s
ub
mit
ted
&D
up
licat
eCh
eck2
.un
iqu
e*C
reat
ePa
rt[P
art1
]=D
ocu
men
t.cr
eate
d&
Do
cum
entS
ub
mit
tab
le.s
ub
Par
t2&
Par
t1.c
reat
ed&
Du
plic
ateC
hec
k1.u
niq
ue
&P
art2
.su
bm
itte
d&
Du
plic
ateC
hec
k2.u
niq
ue
-->
Do
cum
ent.
crea
ted
&D
ocu
men
tSu
bm
itta
ble
.su
bP
art2
&P
art1
.cre
ate
d&
Du
plic
ateC
hec
k1.u
niq
ue&
Par
t2.s
ub
mit
ted
&D
up
licat
eCh
eck2
.un
iqu
e*S
ub
mit
Par
t[P
art1
]=D
ocu
men
t.cr
eate
d&
Do
cum
entS
ub
mit
tab
le.s
ub
mit
tab
le&
Par
t1.s
ub
mit
ted
&D
up
licat
eC
hec
k1.u
niq
ue&
Par
t2.s
ub
mit
ted
&D
up
licat
eCh
eck2
.un
iqu
e--
> D
ocu
men
t.cr
eate
d&
Do
cum
entS
ub
mit
tab
le.s
ub
mit
tab
le&
Par
t1.s
ub
mit
ted
&D
up
licat
eCh
eck1
.un
iqu
e&
Par
t2.s
ub
mit
ted
&D
up
licat
eCh
eck2
.un
iqu
e*S
ub
mit
Do
c=D
ocu
men
t.su
bm
itte
d&
Do
cum
en
tSu
bm
itta
ble
.su
bm
itta
ble
&P
art1
.su
bm
itte
d&
Du
plic
ateC
hec
k1.u
niq
ue&
Par
t2.s
ub
mit
ted
&D
up
licat
eC
hec
k2.u
niq
ue-
->
| 2)D
ocu
men
t.@
new
&D
ocu
men
tSu
bm
itta
ble
.@n
ew&
Par
t1.@
new
&D
up
licat
eCh
eck1
.@n
ew&
Par
t2.@
new
&D
up
licat
eCh
eck2
.@n
ew*C
reat
eD
oc=
Do
cum
ent.
crea
ted
&D
ocu
men
tSu
bm
itta
ble
.no
tSu
bm
itta
ble
&P
art1
.@n
ew&
Du
plic
ateC
hec
k1.@
new
&P
art2
.@n
ew&
Du
plic
ateC
hec
k2.@
new
-->
Do
cum
ent.
crea
ted
&D
ocu
men
tSu
bm
itta
ble
.no
tSu
bm
itta
ble
&P
art1
.@n
ew&
Du
plic
ateC
hec
k1.@
new
&P
art2
.@n
ew&
Du
plic
ate
Ch
eck2
.@n
ew*
Cre
ateP
art[
Par
t2]=
Do
cum
ent.
crea
ted
&D
ocu
men
tSu
bm
itta
ble
.no
tSu
bm
itta
ble
&P
art1
.@n
ew&
Du
plic
ate
Ch
eck1
.@n
ew&
Par
t2.c
reat
ed
&D
up
licat
eC
hec
k2.u
niq
ue-
->
Do
cum
ent.
crea
ted
&D
ocu
men
tSu
bm
itta
ble
.no
tSu
bm
itta
ble
&P
art1
.@n
ew&
Du
plic
ateC
hec
k1.@
new
&P
art2
.cre
ated
&D
up
licat
eCh
eck2
.un
iqu
e*Su
bm
itP
art[
Par
t2]=
Do
cum
ent.
crea
ted
&D
ocu
men
tSu
bm
itta
ble
.su
bP
art2
&P
art1
.@n
ew&
Du
plic
ateC
hec
k1.@
new
&P
art2
.su
bm
itte
d&
Du
plic
ateC
hec
k2.u
niq
ue-
->
Do
cum
ent.
crea
ted
&D
ocu
men
tSu
bm
itta
ble
.su
bP
art2
&P
art1
.@n
ew&
Du
plic
ate
Ch
eck1
.@n
ew&
Par
t2.s
ub
mit
ted
&D
up
lica
teC
hec
k2.u
niq
ue
*Cre
ateP
art[
Par
t1]=
Do
cum
ent.
crea
ted
&D
ocu
men
tSu
bm
itta
ble
.su
bP
art2
&P
art1
.cre
ated
&D
up
licat
eCh
eck1
.du
plic
ate&
Par
t2.s
ub
mit
ted
&D
up
licat
eCh
eck2
.un
iqu
e-->
| 3
)Do
cum
ent.
@n
ew&
Do
cum
entS
ub
mit
tab
le.@
new
&P
art1
.@n
ew&
Du
plic
ateC
hec
k1.@
new
&P
art2
.@n
ew&
Du
plic
ateC
hec
k2.@
new
*Cre
ate
Do
c=D
ocu
men
t.cr
eate
d&
Do
cum
entS
ub
mit
tab
le.n
otS
ub
mit
tab
le&
Par
t1.@
new
&D
up
licat
eCh
eck1
.@n
ew&
Par
t2.@
new
&D
up
lica
teC
hec
k2.@
new
-->
Do
cum
ent.
crea
ted
&D
ocu
men
tSu
bm
itta
ble
.no
tSu
bm
itta
ble
&P
art1
.@n
ew&
Du
plic
ateC
hec
k1.@
new
&P
art2
.@n
ew&
Du
plic
ate
Ch
eck2
.@n
ew
*C
reat
ePar
t[P
art2
]=D
ocu
men
t.cr
eate
d&
Do
cum
entS
ub
mit
tab
le.n
otS
ub
mit
tab
le&
Par
t1.@
new
&D
up
licat
eC
hec
k1.@
new
&P
art2
.cre
ate
d&
Du
plic
ate
Ch
eck2
.un
iqu
e-->
D
ocu
men
t.cr
eate
d&
Do
cum
entS
ub
mit
tab
le.n
otS
ub
mit
tab
le&
Par
t1.@
new
&D
up
licat
eCh
eck1
.@n
ew&
Par
t2.c
reat
ed&
Du
plic
ateC
hec
k2.u
niq
ue*
Cre
ateP
art[
Par
t1]=
Do
cum
ent.
crea
ted
&D
ocu
men
tSu
bm
itta
ble
.no
tSu
bm
itta
ble
&P
art1
.cre
ate
d&
Du
plic
ateC
hec
k1.u
niq
ue&
Par
t2.c
reat
ed&
Du
plic
ateC
hec
k2.u
niq
ue-
->
Do
cum
ent.
crea
ted
&D
ocu
men
tSu
bm
itta
ble
.no
tSu
bm
itta
ble
&P
art1
.cre
ate
d&
Du
plic
ateC
hec
k1.u
niq
ue
&P
art2
.cre
ated
&D
up
licat
eC
hec
k2.u
niq
ue*
Sub
mit
Par
t[P
art2
]=D
ocu
men
t.cr
eate
d&
Do
cum
en
tSu
bm
itta
ble
.su
bP
art2
&P
art1
.cre
ated
&D
up
licat
eCh
eck1
.un
iqu
e&P
art2
.su
bm
itte
d&
Du
plic
ateC
hec
k2.u
niq
ue-
->
Do
cum
ent.
crea
ted
&D
ocu
men
tSu
bm
itta
ble
.su
bP
art2
&P
art1
.cre
ate
d&
Du
plic
ateC
hec
k1.u
niq
ue&
Par
t2.s
ub
mit
ted
&D
up
licat
eCh
eck2
.un
iqu
e*S
ub
mit
Par
t[P
art1
]=D
ocu
men
t.cr
eate
d&
Do
cum
entS
ub
mit
tab
le.s
ub
mit
tab
le&
Par
t1.s
ub
mit
ted
&D
up
lica
teC
hec
k1.u
niq
ue&
Par
t2.s
ub
mit
ted
&D
up
licat
eCh
eck2
.un
iqu
e-->
D
ocu
men
t.cr
eate
d&
Do
cum
entS
ub
mit
tab
le.s
ub
mit
tab
le&
Par
t1.s
ub
mit
ted
&D
up
licat
eCh
eck1
.un
iqu
e&
Par
t2.s
ub
mit
ted
&D
up
licat
eCh
eck2
.un
iqu
e*S
ub
mit
Do
c=D
ocu
men
t.su
bm
itte
d&
Do
cum
en
tSu
bm
itta
ble
.su
bm
itta
ble
&P
art1
.su
bm
itte
d&
Du
plic
ateC
hec
k1.u
niq
ue&
Par
t2.s
ub
mit
ted
&D
up
licat
eC
hec
k2.u
niq
ue
-->
| 4)D
ocu
men
t.@
new
&D
ocu
men
tSu
bm
itta
ble
.@n
ew&
Par
t1.@
new
&D
up
licat
eCh
eck1
.@n
ew&
Par
t2.@
new
&D
up
licat
eCh
eck2
.@n
ew*C
reat
eD
oc=
Do
cum
ent.
crea
ted
&D
ocu
men
tSu
bm
itta
ble
.no
tSu
bm
itta
ble
&P
art1
.@n
ew&
Du
pli
cate
Ch
eck1
.@n
ew&
Par
t2.@
new
&D
up
licat
eCh
eck2
.@n
ew--
> D
ocu
men
t.cr
eate
d&
Do
cum
entS
ub
mit
tab
le.n
otS
ub
mit
tab
le&
Par
t1.@
new
&D
up
licat
eCh
eck1
.@n
ew&
Par
t2.@
new
&D
up
licat
eC
hec
k2.@
new
*C
reat
ePar
t[P
art2
]=D
ocu
men
t.cr
eate
d&
Do
cum
entS
ub
mit
tab
le.n
otS
ub
mit
tab
le&
Par
t1.@
new
&D
up
licat
eC
hec
k1.@
new
&P
art2
.cre
ate
d&
Du
plic
ate
Ch
eck2
.un
iqu
e-->
D
ocu
men
t.cr
eate
d&
Do
cum
entS
ub
mit
tab
le.n
otS
ub
mit
tab
le&
Par
t1.@
new
&D
up
licat
eCh
eck1
.@n
ew&
Par
t2.c
reat
ed&
Du
plic
ateC
hec
k2.u
niq
ue*
Cre
ateP
art[
Par
t1]=
Do
cum
ent.
crea
ted
&D
ocu
men
tSu
bm
itta
ble
.no
tSu
bm
itta
ble
&P
art1
.cre
ate
d&
Du
plic
ateC
hec
k1.u
niq
ue&
Par
t2.c
reat
ed&
Du
plic
ateC
hec
k2.u
niq
ue
-->
Do
cum
ent.
crea
ted
&D
ocu
men
tSu
bm
itta
ble
.no
tSu
bm
itta
ble
&P
art1
.cre
ate
d&
Du
plic
ateC
hec
k1.u
niq
ue
&P
art2
.cre
ated
&D
up
licat
eC
hec
k2.u
niq
ue*
Sub
mit
Par
t[P
art1
]=D
ocu
men
t.cr
eate
d&
Do
cum
en
tSu
bm
itta
ble
.su
bP
art1
&P
art1
.su
bm
itte
d&
Du
plic
ateC
hec
k1.u
niq
ue&
Par
t2.c
reat
ed&
Du
plic
ateC
hec
k2.u
niq
ue
-->
Do
cum
ent.
crea
ted
&D
ocu
men
tSu
bm
itta
ble
.su
bP
art1
&P
art1
.su
bm
itte
d&
Du
plic
ateC
hec
k1.u
niq
ue&
Pa
rt2
.cre
ated
&D
up
licat
eC
hec
k2.u
niq
ue*
Sub
mit
Par
t[P
art2
]=D
ocu
men
t.cr
eate
d&
Do
cum
en
tSu
bm
itta
ble
.su
bm
itta
ble
&P
art1
.su
bm
itte
d&
Du
plic
ateC
hec
k1.u
niq
ue&
Par
t2.s
ub
mit
ted
&D
up
licat
eCh
eck2
.un
iqu
e--
> D
ocu
men
t.cr
eate
d&
Do
cum
entS
ub
mit
tab
le.s
ub
mit
tab
le&
Par
t1.s
ub
mit
ted
&D
up
licat
eCh
eck1
.un
iqu
e&
Par
t2.s
ub
mit
ted
&D
up
licat
eCh
eck2
.un
iqu
e*S
ub
mit
Do
c=D
ocu
men
t.su
bm
itte
d&
Do
cum
en
tSu
bm
itta
ble
.su
bm
itta
ble
&P
art1
.su
bm
itte
d&
Du
plic
ateC
hec
k1.u
niq
ue&
Par
t2.s
ub
mit
ted
&D
up
licat
eC
hec
k2.u
niq
ue
-->
| 5)D
ocu
men
t.@
new
&D
ocu
men
tSu
bm
itta
ble
.@n
ew&
Par
t1.@
new
&D
up
licat
eCh
eck1
.@n
ew&
Par
t2.@
new
&D
up
licat
eCh
eck2
.@n
ew*C
reat
eD
oc=
Do
cum
ent.
crea
ted
&D
ocu
men
tSu
bm
itta
ble
.no
tSu
bm
itta
ble
&P
art1
.@n
ew&
Du
plic
ateC
hec
k1.@
new
&P
art2
.@n
ew&
Du
plic
ateC
hec
k2.@
new
-->
Do
cum
ent.
crea
ted
&D
ocu
men
tSu
bm
itta
ble
.no
tSu
bm
itta
ble
&P
art1
.@n
ew&
Du
plic
ateC
hec
k1.@
new
&P
art2
.@n
ew&
Du
plic
ate
Ch
eck2
.@n
ew*
Cre
ateP
art[
Par
t2]=
Do
cum
ent.
crea
ted
&D
ocu
men
tSu
bm
itta
ble
.no
tSu
bm
itta
ble
&P
art1
.@n
ew&
Du
plic
ate
Ch
eck1
.@n
ew&
Par
t2.c
reat
ed
&D
up
licat
eC
hec
k2.u
niq
ue
-->
Do
cum
ent.
crea
ted
&D
ocu
men
tSu
bm
itta
ble
.no
tSu
bm
itta
ble
&P
art1
.@n
ew&
Du
plic
ateC
hec
k1.@
new
&P
art2
.cre
ated
&D
up
licat
eCh
eck2
.un
iqu
e*C
reat
ePar
t[P
art1
]=D
ocu
men
t.cr
eate
d&
Do
cum
entS
ub
mit
tab
le.n
otS
ub
mit
tab
le&
Par
t1.c
reat
ed
&D
up
licat
eCh
eck1
.du
plic
ate&
Par
t2.c
reat
ed&
Du
plic
ateC
hec
k2.u
niq
ue-
->
Do
cum
ent.
crea
ted
&D
ocu
men
tSu
bm
itta
ble
.no
tSu
bm
itta
ble
&P
art1
.cre
ate
d&
Du
plic
ateC
hec
k1.d
up
licat
e&P
art2
.cre
ated
&D
up
licat
eCh
eck2
.un
iqu
e*Su
bm
itP
art[
Par
t2]=
Do
cum
ent.
crea
ted
&D
ocu
men
tSu
bm
itta
ble
.su
bP
art2
&P
art1
.cre
ated
&D
up
licat
eCh
eck1
.du
plic
ate&
Par
t2.s
ub
mit
ted
&D
up
licat
eCh
eck2
.un
iqu
e-->
| 6
)Do
cum
ent.
@n
ew&
Do
cum
entS
ub
mit
tab
le.@
new
&P
art1
.@n
ew&
Du
plic
ateC
hec
k1.@
new
&P
art2
.@n
ew&
Du
plic
ateC
hec
k2.@
new
*Cre
ate
Do
c=D
ocu
men
t.cr
eate
d&
Do
cum
entS
ub
mit
tab
le.n
otS
ub
mit
tab
le&
Par
t1.@
new
&D
up
licat
eCh
eck1
.@n
ew&
Par
t2.@
new
&D
up
licat
eCh
eck2
.@n
ew--
> D
ocu
men
t.cr
eate
d&
Do
cum
entS
ub
mit
tab
le.n
otS
ub
mit
tab
le&
Par
t1.@
new
&D
up
licat
eCh
eck1
.@n
ew&
Par
t2.@
new
&D
up
licat
eC
hec
k2.@
new
*C
reat
ePar
t[P
art2
]=D
ocu
men
t.cr
eate
d&
Do
cum
entS
ub
mit
tab
le.n
otS
ub
mit
tab
le&
Par
t1.@
new
&D
up
licat
eC
hec
k1.@
new
&P
art2
.cre
ate
d&
Du
plic
ate
Ch
eck2
.du
plic
ate
-->
Do
cum
ent.
crea
ted
&D
ocu
men
tSu
bm
itta
ble
.no
tSu
bm
itta
ble
&P
art1
.@n
ew&
Du
plic
ateC
hec
k1.@
new
&P
art2
.cre
ated
&D
up
licat
eCh
eck2
.du
plic
ate
*Cre
ate
Par
t[P
art1
]=D
ocu
men
t.cr
eate
d&
Do
cum
entS
ub
mit
tab
le.n
otS
ub
mit
tab
le&
Par
t1.c
reat
ed&
Du
plic
ateC
hec
k1.u
niq
ue&
Par
t2.c
reat
ed
&D
up
lica
teC
hec
k2.d
up
licat
e-->
D
ocu
men
t.cr
eate
d&
Do
cum
entS
ub
mit
tab
le.n
otS
ub
mit
tab
le&
Par
t1.c
rea
ted
&D
up
licat
eCh
eck1
.un
iqu
e&
Par
t2.c
reat
ed&
Du
plic
ate
Ch
eck2
.du
plic
ate
*Su
bm
itP
art[
Par
t1]=
Do
cum
ent.
crea
ted
&D
ocu
men
tSu
bm
itta
ble
.su
bP
art1
&P
art1
.su
bm
itte
d&
Du
plic
ateC
hec
k1.u
niq
ue&
Pa
rt2
.cre
ated
&D
up
licat
eC
hec
k2.d
up
licat
e-->
| 7
)Do
cum
ent.
@n
ew&
Do
cum
entS
ub
mit
tab
le.@
new
&P
art1
.@n
ew&
Du
plic
ateC
hec
k1.@
new
&P
art2
.@n
ew&
Du
plic
ateC
hec
k2.@
new
*Cre
ate
Do
c=D
ocu
men
t.cr
eate
d&
Do
cum
entS
ub
mit
tab
le.n
otS
ub
mit
tab
le&
Par
t1.@
new
&D
up
licat
eCh
eck1
.@n
ew&
Par
t2.@
new
&D
up
licat
eCh
eck2
.@n
ew--
> D
ocu
men
t.cr
eate
d&
Do
cum
entS
ub
mit
tab
le.n
otS
ub
mit
tab
le&
Par
t1.@
new
&D
up
licat
eCh
eck1
.@n
ew&
Par
t2.@
new
&D
up
licat
eC
hec
k2.@
new
*C
reat
ePar
t[P
art2
]=D
ocu
men
t.cr
eate
d&
Do
cum
entS
ub
mit
tab
le.n
otS
ub
mit
tab
le&
Par
t1.@
new
&D
up
licat
eC
hec
k1.@
new
&P
art2
.cre
ate
d&
Du
plic
ate
Ch
eck2
.du
plic
ate
-->
Do
cum
ent.
crea
ted
&D
ocu
men
tSu
bm
itta
ble
.no
tSu
bm
itta
ble
&P
art1
.@n
ew&
Du
plic
ateC
hec
k1.@
new
&P
art2
.cre
ated
&D
up
licat
eCh
eck2
.du
plic
ate
*Cre
ate
Par
t[P
art1
]=D
ocu
men
t.cr
eate
d&
Do
cum
entS
ub
mit
tab
le.n
otS
ub
mit
tab
le&
Par
t1.c
reat
ed&
Du
plic
ateC
hec
k1.d
up
licat
e&P
art2
.cre
ated
&D
up
licat
eCh
eck2
.du
plic
ate-
->
| 8)D
ocu
men
t.@
new
&D
ocu
men
tSu
bm
itta
ble
.@n
ew&
Par
t1.@
new
&D
up
licat
eCh
eck1
.@n
ew&
Par
t2.@
new
&D
up
licat
eCh
eck2
.@n
ew*C
reat
eD
oc=
Do
cum
ent.
crea
ted
&D
ocu
men
tSu
bm
itta
ble
.no
tSu
bm
itta
ble
&P
art1
.@n
ew&
Du
plic
ateC
hec
k1.@
new
&P
art2
.@n
ew&
Du
plic
ateC
hec
k2.@
new
-->
Do
cum
ent.
crea
ted
&D
ocu
men
tSu
bm
itta
ble
.no
tSu
bm
itta
ble
&P
art1
.@n
ew&
Du
plic
ateC
hec
k1.@
new
&P
art2
.@n
ew&
Du
plic
ate
Ch
eck2
.@n
ew*
Cre
ateP
art[
Par
t1]=
Do
cum
ent.
crea
ted
&D
ocu
men
tSu
bm
itta
ble
.no
tSu
bm
itta
ble
&P
art1
.cre
ate
d&
Du
plic
ate
Ch
eck1
.un
iqu
e&P
art2
.@n
ew&
Du
plic
ateC
hec
k2.@
new
-->
Do
cum
ent.
crea
ted
&D
ocu
men
tSu
bm
itta
ble
.no
tSu
bm
itta
ble
&P
art1
.cre
ate
d&
Du
plic
ateC
hec
k1.u
niq
ue
&P
art2
.@n
ew&
Du
plic
ateC
hec
k2.@
new
*C
rea
teP
art[
Par
t2]=
Do
cum
ent.
crea
ted
&D
ocu
men
tSu
bm
itta
ble
.no
tSu
bm
itta
ble
&P
art1
.cre
ate
d&
Du
plic
ateC
hec
k1.u
niq
ue
&P
art2
.cre
ated
&D
up
licat
eCh
eck2
.un
iqu
e-->
D
ocu
men
t.cr
eate
d&
Do
cum
entS
ub
mit
tab
le.n
otS
ub
mit
tab
le&
Par
t1.c
rea
ted
&D
up
licat
eCh
eck1
.un
iqu
e&
Par
t2.c
reat
ed&
Du
plic
ate
Ch
eck2
.un
iqu
e*
Sub
mit
Par
t[P
art2
]=D
ocu
men
t.cr
eate
d&
Do
cum
en
tSu
bm
itta
ble
.su
bP
art2
&P
art1
.cre
ated
&D
up
licat
eCh
eck1
.un
iqu
e&P
art2
.su
bm
itte
d&
Du
plic
ateC
hec
k2.u
niq
ue-
->
Do
cum
ent.
crea
ted
&D
ocu
men
tSu
bm
itta
ble
.su
bP
art2
&P
art1
.cre
ate
d&
Du
plic
ateC
hec
k1.u
niq
ue&
Par
t2.s
ub
mit
ted
&D
up
licat
eCh
eck2
.un
iqu
e*S
ub
mit
Par
t[P
art1
]=D
ocu
men
t.cr
eate
d&
Do
cum
entS
ub
mit
tab
le.s
ub
mit
tab
le&
Par
t1.s
ub
mit
ted
&D
up
licat
eC
hec
k1.u
niq
ue&
Par
t2.s
ub
mit
ted
&D
up
licat
eCh
eck2
.un
iqu
e--
> D
ocu
men
t.cr
eate
d&
Do
cum
entS
ub
mit
tab
le.s
ub
mit
tab
le&
Par
t1.s
ub
mit
ted
&D
up
licat
eCh
eck1
.un
iqu
e&
Par
t2.s
ub
mit
ted
&D
up
licat
eCh
eck2
.un
iqu
e*S
ub
mit
Do
c=D
ocu
men
t.su
bm
itte
d&
Do
cum
en
tSu
bm
itta
ble
.su
bm
itta
ble
&P
art1
.su
bm
itte
d&
Du
plic
ateC
hec
k1.u
niq
ue&
Par
t2.s
ub
mit
ted
&D
up
licat
eC
hec
k2.u
niq
ue
-->
| 9)D
ocu
men
t.@
new
&D
ocu
men
tSu
bm
itta
ble
.@n
ew&
Par
t1.@
new
&D
up
licat
eCh
eck1
.@n
ew&
Par
t2.@
new
&D
up
licat
eCh
eck2
.@n
ew*C
reat
eD
oc=
Do
cum
ent.
crea
ted
&D
ocu
men
tSu
bm
itta
ble
.no
tSu
bm
itta
ble
&P
art1
.@n
ew&
Du
plic
ateC
hec
k1.@
new
&P
art2
.@n
ew&
Du
plic
ateC
hec
k2.@
new
-->
Do
cum
ent.
crea
ted
&D
ocu
men
tSu
bm
itta
ble
.no
tSu
bm
itta
ble
&P
art1
.@n
ew&
Du
plic
ateC
hec
k1.@
new
&P
art2
.@n
ew&
Du
plic
ate
Ch
eck2
.@n
ew*
Cre
ateP
art[
Par
t1]=
Do
cum
ent.
crea
ted
&D
ocu
men
tSu
bm
itta
ble
.no
tSu
bm
itta
ble
&P
art1
.cre
ate
d&
Du
plic
ate
Ch
eck1
.un
iqu
e&P
art2
.@n
ew&
Du
plic
ateC
hec
k2.@
new
-->
Do
cum
ent.
crea
ted
&D
ocu
men
tSu
bm
itta
ble
.no
tSu
bm
itta
ble
&P
art1
.cre
ate
d&
Du
plic
ateC
hec
k1.u
niq
ue
&P
art2
.@n
ew&
Du
plic
ateC
hec
k2.@
new
*C
rea
teP
art[
Par
t2]=
Do
cum
ent.
crea
ted
&D
ocu
men
tSu
bm
itta
ble
.no
tSu
bm
itta
ble
&P
art
1.c
reat
ed
&D
up
licat
eCh
eck1
.un
iqu
e&P
art2
.cre
ated
&D
up
licat
eCh
eck2
.un
iqu
e--
> D
ocu
men
t.cr
eate
d&
Do
cum
entS
ub
mit
tab
le.n
otS
ub
mit
tab
le&
Par
t1.c
rea
ted
&D
up
licat
eCh
eck1
.un
iqu
e&
Par
t2.c
reat
ed&
Du
plic
ate
Ch
eck2
.un
iqu
e*
Sub
mit
Par
t[P
art1
]=D
ocu
men
t.cr
eate
d&
Do
cum
en
tSu
bm
itta
ble
.su
bP
art1
&P
art1
.su
bm
itte
d&
Du
plic
ateC
hec
k1.u
niq
ue&
Par
t2.c
reat
ed&
Du
plic
ateC
hec
k2.u
niq
ue
-->
Do
cum
ent.
crea
ted
&D
ocu
men
tSu
bm
itta
ble
.su
bP
art1
&P
art1
.su
bm
itte
d&
Du
plic
ateC
hec
k1.u
niq
ue&
Pa
rt2
.cre
ated
&D
up
licat
eC
hec
k2.u
niq
ue*
Sub
mit
Par
t[P
art2
]=D
ocu
men
t.cr
eate
d&
Do
cum
en
tSu
bm
itta
ble
.su
bm
itta
ble
&P
art1
.su
bm
itte
d&
Du
plic
ateC
hec
k1.u
niq
ue&
Par
t2.s
ub
mit
ted
&D
up
licat
eCh
eck2
.un
iqu
e--
> D
ocu
men
t.cr
eate
d&
Do
cum
entS
ub
mit
tab
le.s
ub
mit
tab
le&
Par
t1.s
ub
mit
ted
&D
up
licat
eCh
eck1
.un
iqu
e&
Par
t2.s
ub
mit
ted
&D
up
licat
eCh
eck2
.un
iqu
e*S
ub
mit
Do
c=D
ocu
men
t.su
bm
itte
d&
Do
cum
en
tSu
bm
itta
ble
.su
bm
itta
ble
&P
art1
.su
bm
itte
d&
Du
plic
ateC
hec
k1.u
niq
ue&
Par
t2.s
ub
mit
ted
&D
up
licat
eC
hec
k2.u
niq
ue
-->
| 10
)Do
cum
ent.
@n
ew&
Do
cum
entS
ub
mit
tab
le.@
new
&P
art1
.@n
ew&
Du
plic
ateC
hec
k1.@
new
&P
art2
.@n
ew&
Du
plic
ateC
hec
k2.@
new
*C
reat
eDo
c=D
ocu
men
t.cr
eate
d&
Do
cum
entS
ub
mit
tab
le.n
otS
ub
mit
tab
le&
Par
t1.@
new
&D
up
licat
eCh
eck1
.@n
ew&
Par
t2.@
new
&D
up
licat
eCh
eck2
.@n
ew--
>
Do
cum
ent.
crea
ted
&D
ocu
men
tSu
bm
itta
ble
.no
tSu
bm
itta
ble
&P
art1
.@n
ew&
Du
plic
ateC
hec
k1.@
new
&P
art2
.@n
ew&
Du
plic
ate
Ch
eck2
.@n
ew*
Cre
ateP
art[
Par
t1]=
Do
cum
ent.
crea
ted
&D
ocu
men
tSu
bm
itta
ble
.no
tSu
bm
itta
ble
&P
art1
.cre
ate
d&
Du
plic
ate
Ch
eck1
.un
iqu
e&P
art2
.@n
ew&
Du
plic
ateC
hec
k2.@
new
-->
Do
cum
ent.
crea
ted
&D
ocu
men
tSu
bm
itta
ble
.no
tSu
bm
itta
ble
&P
art1
.cre
ate
d&
Du
plic
ateC
hec
k1.u
niq
ue
&P
art2
.@n
ew&
Du
plic
ateC
hec
k2.@
new
*C
rea
teP
art[
Par
t2]=
Do
cum
ent.
crea
ted
&D
ocu
men
tSu
bm
itta
ble
.no
tSu
bm
itta
ble
&P
art1
.cre
ate
d&
Du
plic
ateC
hec
k1.u
niq
ue&
Par
t2.c
reat
ed&
Du
plic
ateC
hec
k2.d
up
lica
te--
> D
ocu
men
t.cr
eate
d&
Do
cum
entS
ub
mit
tab
le.n
otS
ub
mit
tab
le&
Par
t1.c
rea
ted
&D
up
licat
eCh
eck1
.un
iqu
e&
Par
t2.c
reat
ed&
Du
plic
ate
Ch
eck2
.du
plic
ate
*Su
bm
itP
art[
Par
t1]=
Do
cum
ent.
crea
ted
&D
ocu
men
tSu
bm
itta
ble
.su
bP
art1
&P
art1
.su
bm
itte
d&
Du
plic
ateC
hec
k1.u
niq
ue&
Par
t2.c
reat
ed&
Du
plic
ate
Ch
eck2
.du
plic
ate-
->
| 11
)Do
cum
ent.
@n
ew&
Do
cum
entS
ub
mit
tab
le.@
new
&P
art1
.@n
ew&
Du
plic
ateC
hec
k1.@
new
&P
art2
.@n
ew&
Du
plic
ateC
hec
k2.@
new
*C
reat
eDo
c=D
ocu
men
t.cr
eate
d&
Do
cum
entS
ub
mit
tab
le.n
otS
ub
mit
tab
le&
Par
t1.@
new
&D
up
licat
eCh
eck1
.@n
ew&
Par
t2.@
new
&D
up
licat
eCh
eck2
.@n
ew--
>
Do
cum
ent.
crea
ted
&D
ocu
men
tSu
bm
itta
ble
.no
tSu
bm
itta
ble
&P
art1
.@n
ew&
Du
plic
ateC
hec
k1.@
new
&P
art2
.@n
ew&
Du
plic
ate
Ch
eck2
.@n
ew*
Cre
ateP
art[
Par
t1]=
Do
cum
ent.
crea
ted
&D
ocu
men
tSu
bm
itta
ble
.no
tSu
bm
itta
ble
&P
art1
.cre
ate
d&
Du
plic
ate
Ch
eck1
.un
iqu
e&P
art2
.@n
ew&
Du
plic
ateC
hec
k2.@
new
-->
Do
cum
ent.
crea
ted
&D
ocu
men
tSu
bm
itta
ble
.no
tSu
bm
itta
ble
&P
art1
.cre
ate
d&
Du
plic
ateC
hec
k1.u
niq
ue
&P
art2
.@n
ew&
Du
plic
ateC
hec
k2.@
new
*Su
bm
itP
art[
Par
t1]=
Do
cum
en
t.cr
eate
d&
Do
cum
entS
ub
mit
tab
le.s
ub
Par
t1&
Par
t1.s
ub
mit
ted
&D
up
licat
eCh
eck1
.un
iqu
e&P
art2
.@n
ew&
Du
plic
ateC
hec
k2.@
new
-->
Do
cum
ent.
crea
ted
&D
ocu
men
tSu
bm
itta
ble
.su
bP
art1
&P
art1
.su
bm
itte
d&
Du
plic
ateC
hec
k1.u
niq
ue&
Pa
rt2
.@n
ew&
Du
plic
ateC
hec
k2.@
new
*Cre
ateP
art
[Par
t2]=
Do
cum
ent.
crea
ted
&D
ocu
men
tSu
bm
itta
ble
.su
bP
art1
&P
art1
.su
bm
itte
d&
Du
plic
ateC
hec
k1.u
niq
ue&
Par
t2.c
reat
ed&
Du
plic
ateC
hec
k2.u
niq
ue-
->
Do
cum
ent.
crea
ted
&D
ocu
men
tSu
bm
itta
ble
.su
bP
art1
&P
art1
.su
bm
itte
d&
Du
plic
ateC
hec
k1.u
niq
ue&
Pa
rt2
.cre
ated
&D
up
licat
eC
hec
k2.u
niq
ue*
Sub
mit
Par
t[P
art2
]=D
ocu
men
t.cr
eate
d&
Do
cum
en
tSu
bm
itta
ble
.su
bm
itta
ble
&P
art1
.su
bm
itte
d&
Du
plic
ateC
hec
k1.u
niq
ue&
Par
t2.s
ub
mit
ted
&D
up
licat
eCh
eck2
.un
iqu
e--
> D
ocu
men
t.cr
eate
d&
Do
cum
entS
ub
mit
tab
le.s
ub
mit
tab
le&
Par
t1.s
ub
mit
ted
&D
up
licat
eCh
eck1
.un
iqu
e&
Par
t2.s
ub
mit
ted
&D
up
lica
teC
hec
k2.u
niq
ue
*Su
bm
itD
oc=
Do
cum
ent.
sub
mit
ted
&D
ocu
me
ntS
ub
mit
tab
le.s
ub
mit
tab
le&
Par
t1.s
ub
mit
ted
&D
up
licat
eCh
eck1
.un
iqu
e&P
art2
.su
bm
itte
d&
Du
plic
ate
Ch
eck2
.un
iqu
e-->
| 1
2)D
ocu
men
t.@
new
&D
ocu
men
tSu
bm
itta
ble
.@n
ew&
Par
t1.@
new
&D
up
licat
eCh
eck1
.@n
ew&
Par
t2.@
new
&D
up
licat
eCh
eck2
.@n
ew*
Cre
ateD
oc=
Do
cum
ent.
crea
ted
&D
ocu
men
tSu
bm
itta
ble
.no
tSu
bm
itta
ble
&P
art1
.@n
ew&
Du
plic
ateC
hec
k1.@
new
&P
art2
.@n
ew&
Du
plic
ateC
hec
k2.@
new
-->
D
ocu
men
t.cr
eate
d&
Do
cum
entS
ub
mit
tab
le.n
otS
ub
mit
tab
le&
Par
t1.@
new
&D
up
licat
eCh
eck1
.@n
ew&
Par
t2.@
new
&D
up
licat
eC
hec
k2.@
new
*C
reat
ePar
t[P
art1
]=D
ocu
men
t.cr
eate
d&
Do
cum
entS
ub
mit
tab
le.n
otS
ub
mit
tab
le&
Par
t1.c
reat
ed
&D
up
licat
eC
hec
k1.u
niq
ue&
Par
t2.@
new
&D
up
licat
eCh
eck2
.@n
ew--
> D
ocu
men
t.cr
eate
d&
Do
cum
entS
ub
mit
tab
le.n
otS
ub
mit
tab
le&
Par
t1.c
rea
ted
&D
up
licat
eCh
eck1
.un
iqu
e&
Par
t2.@
new
&D
up
licat
eCh
eck2
.@n
ew*
Sub
mit
Par
t[P
art1
]=D
ocu
me
nt.
crea
ted
&D
ocu
men
tSu
bm
itta
ble
.su
bP
art1
&P
art1
.su
bm
itte
d&
Du
plic
ateC
hec
k1.u
niq
ue&
Par
t2.@
new
&D
up
lica
teC
hec
k2.@
new
-->
Do
cum
ent.
crea
ted
&D
ocu
men
tSu
bm
itta
ble
.su
bP
art1
&P
art1
.su
bm
itte
d&
Du
plic
ateC
hec
k1.u
niq
ue&
Pa
rt2
.@n
ew&
Du
plic
ateC
hec
k2.@
new
*Cre
ateP
art[
Par
t2]=
Do
cum
ent.
crea
ted
&D
ocu
men
tSu
bm
itta
ble
.su
bP
art1
&P
art1
.su
bm
itte
d&
Du
plic
ateC
hec
k1.u
niq
ue&
Par
t2.c
reat
ed&
Du
plic
ateC
hec
k2.d
up
licat
e-->
| 1
3)D
ocu
men
t.@
new
&D
ocu
men
tSu
bm
itta
ble
.@n
ew&
Par
t1.@
new
&D
up
licat
eCh
eck1
.@n
ew&
Par
t2.@
new
&D
up
licat
eCh
eck2
.@n
ew*
Cre
ateD
oc=
Do
cum
ent.
crea
ted
&D
ocu
men
tSu
bm
itta
ble
.no
tSu
bm
itta
ble
&P
art1
.@n
ew&
Du
plic
ateC
hec
k1.@
new
&P
art2
.@n
ew&
Du
plic
ateC
hec
k2.@
new
-->
D
ocu
men
t.cr
eate
d&
Do
cum
entS
ub
mit
tab
le.n
otS
ub
mit
tab
le&
Par
t1.@
new
&D
up
licat
eCh
eck1
.@n
ew&
Par
t2.@
new
&D
up
licat
eC
hec
k2.@
new
*C
reat
ePa
rt[P
art1
]=D
ocu
men
t.cr
eate
d&
Do
cum
entS
ub
mit
tab
le.n
otS
ub
mit
tab
le&
Par
t1.c
reat
ed
&D
up
licat
eC
hec
k1.d
up
licat
e&P
art2
.@n
ew&
Du
plic
ateC
he
ck2
.@n
ew--
> D
ocu
men
t.cr
eate
d&
Do
cum
entS
ub
mit
tab
le.n
otS
ub
mit
tab
le&
Par
t1.c
rea
ted
&D
up
licat
eCh
eck1
.du
plic
ate&
Par
t2.@
new
&D
up
licat
eCh
eck2
.@n
ew*
Cre
ateP
art[
Par
t2]=
Do
cum
ent.
crea
ted
&D
ocu
men
tSu
bm
itta
ble
.no
tSu
bm
itta
ble
&P
art1
.cre
ated
&D
up
licat
eCh
eck1
.du
plic
ate&
Par
t2.c
rea
ted
&D
up
licat
eCh
eck2
.un
iqu
e-->
D
ocu
men
t.cr
eate
d&
Do
cum
entS
ub
mit
tab
le.n
otS
ub
mit
tab
le&
Par
t1.c
rea
ted
&D
up
licat
eCh
eck1
.du
plic
ate&
Par
t2.c
reat
ed&
Du
plic
ateC
hec
k2.u
niq
ue*
Sub
mit
Par
t[P
art2
]=D
ocu
men
t.cr
eate
d&
Do
cum
entS
ub
mit
tab
le.s
ub
Par
t2&
Par
t1.c
reat
ed&
Du
plic
ateC
hec
k1.d
up
licat
e&P
art2
.su
bm
itte
d&
Du
plic
ateC
hec
k2.u
niq
ue-
->
| 14
)Do
cum
ent.
@n
ew&
Do
cum
entS
ub
mit
tab
le.@
new
&P
art1
.@n
ew&
Du
plic
ateC
hec
k1.@
new
&P
art2
.@n
ew&
Du
plic
ateC
hec
k2.@
new
*C
reat
eDo
c=D
ocu
men
t.cr
eate
d&
Do
cum
entS
ub
mit
tab
le.n
otS
ub
mit
tab
le&
Par
t1.@
new
&D
up
licat
eCh
eck1
.@n
ew&
Par
t2.@
new
&D
up
licat
eCh
eck2
.@n
ew--
>
Do
cum
ent.
crea
ted
&D
ocu
men
tSu
bm
itta
ble
.no
tSu
bm
itta
ble
&P
art1
.@n
ew&
Du
plic
ateC
hec
k1.@
new
&P
art2
.@n
ew&
Du
plic
ate
Ch
eck2
.@n
ew*
Cre
ateP
art[
Par
t1]=
Do
cum
ent.
crea
ted
&D
ocu
men
tSu
bm
itta
ble
.no
tSu
bm
itta
ble
&P
art1
.cre
ate
d&
Du
plic
ate
Ch
eck1
.du
plic
ate&
Par
t2.@
new
&D
up
licat
eCh
eck2
.@n
ew--
> D
ocu
men
t.cr
eate
d&
Do
cum
entS
ub
mit
tab
le.n
otS
ub
mit
tab
le&
Par
t1.c
rea
ted
&D
up
licat
eCh
eck1
.du
plic
ate&
Par
t2.@
new
&D
up
licat
eCh
eck2
.@n
ew*
Cre
ateP
art[
Par
t2]=
Do
cum
ent.
crea
ted
&D
ocu
men
tSu
bm
itta
ble
.no
tSu
bm
itta
ble
&P
art1
.cre
ated
&D
up
licat
eCh
eck1
.du
plic
ate&
Par
t2.c
reat
ed
&D
up
licat
eCh
eck2
.du
plic
ate-
->
|
Figu
re4:
Trac
esge
nera
ted
from
the
Prot
ocol
Mod
el.
Fourth International Symposium on Business Modeling and Software Design
110
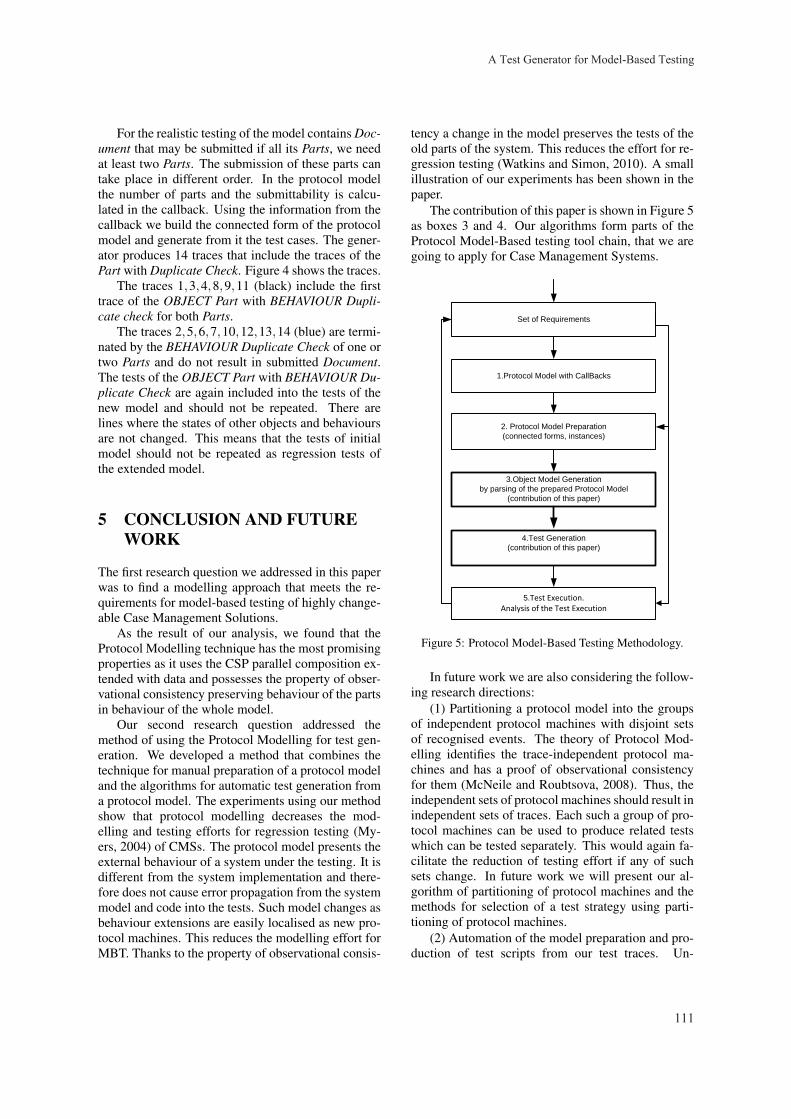
For the realistic testing of the model contains Doc-ument that may be submitted if all its Parts, we needat least two Parts. The submission of these parts cantake place in different order. In the protocol modelthe number of parts and the submittability is calcu-lated in the callback. Using the information from thecallback we build the connected form of the protocolmodel and generate from it the test cases. The gener-ator produces 14 traces that include the traces of thePart with Duplicate Check. Figure 4 shows the traces.
The traces 1,3,4,8,9,11 (black) include the firsttrace of the OBJECT Part with BEHAVIOUR Dupli-cate check for both Parts.
The traces 2,5,6,7,10,12,13,14 (blue) are termi-nated by the BEHAVIOUR Duplicate Check of one ortwo Parts and do not result in submitted Document.The tests of the OBJECT Part with BEHAVIOUR Du-plicate Check are again included into the tests of thenew model and should not be repeated. There arelines where the states of other objects and behavioursare not changed. This means that the tests of initialmodel should not be repeated as regression tests ofthe extended model.
5 CONCLUSION AND FUTUREWORK
The first research question we addressed in this paperwas to find a modelling approach that meets the re-quirements for model-based testing of highly change-able Case Management Solutions.
As the result of our analysis, we found that theProtocol Modelling technique has the most promisingproperties as it uses the CSP parallel composition ex-tended with data and possesses the property of obser-vational consistency preserving behaviour of the partsin behaviour of the whole model.
Our second research question addressed themethod of using the Protocol Modelling for test gen-eration. We developed a method that combines thetechnique for manual preparation of a protocol modeland the algorithms for automatic test generation froma protocol model. The experiments using our methodshow that protocol modelling decreases the mod-elling and testing efforts for regression testing (My-ers, 2004) of CMSs. The protocol model presents theexternal behaviour of a system under the testing. It isdifferent from the system implementation and there-fore does not cause error propagation from the systemmodel and code into the tests. Such model changes asbehaviour extensions are easily localised as new pro-tocol machines. This reduces the modelling effort forMBT. Thanks to the property of observational consis-
tency a change in the model preserves the tests of theold parts of the system. This reduces the effort for re-gression testing (Watkins and Simon, 2010). A smallillustration of our experiments has been shown in thepaper.
The contribution of this paper is shown in Figure 5as boxes 3 and 4. Our algorithms form parts of theProtocol Model-Based testing tool chain, that we aregoing to apply for Case Management Systems.
1.Protocol Model with CallBacks
3.Object Model Generation
by parsing of the prepared Protocol Model
(contribution of this paper)
2. Protocol Model Preparation
(connected forms, instances)
4.Test Generation
(contribution of this paper)
5.Test Execution. Analysis of the Test Execution
Set of Requirements
Figure 5: Protocol Model-Based Testing Methodology.
In future work we are also considering the follow-ing research directions:
(1) Partitioning a protocol model into the groupsof independent protocol machines with disjoint setsof recognised events. The theory of Protocol Mod-elling identifies the trace-independent protocol ma-chines and has a proof of observational consistencyfor them (McNeile and Roubtsova, 2008). Thus, theindependent sets of protocol machines should result inindependent sets of traces. Each such a group of pro-tocol machines can be used to produce related testswhich can be tested separately. This would again fa-cilitate the reduction of testing effort if any of suchsets change. In future work we will present our al-gorithm of partitioning of protocol machines and themethods for selection of a test strategy using parti-tioning of protocol machines.
(2) Automation of the model preparation and pro-duction of test scripts from our test traces. Un-
A Test Generator for Model-Based Testing
111

like other modeling methods, the protocol modelingmakes use of callbacks that calculate data and states.Running the callbacks during the process of the gen-eration of tests scripts from the test traces, generationof which is described in this paper, we are going tobuild executable tests.
REFERENCES
Aalst van der, W. and Weske, M. (2005). Case Handling: anew paradigm for business process support. Data &Knowledge Engineering, 52(2):129–162.
Bracha, G. and Cook, W. (1990). Mixin-based inheri-tance. OOPSLA/ECOOP ’90 Proceedings of the Eu-ropean conference on object-oriented programmingon Object-oriented programming systems, languages,and applications, pages 303–311.
Davenport, T. and Nohria, N. (1994). Case Managementand the Integration of Labor. Sloan Management Re-view.
Greenyer, J., Rieke, J., Travkin, O., and Kindler, E. (2008).TGGs for Transforming UML to CSP: Contribution tothe ACTIVE 2007 Graph Transformation Tools Con-test. University of Paderborn,Technical Report tr-ri-08-287.
Hanenberg, S., Stein, D., and Unland, R. (2007). Fromaspect-oriented design to aspect-oriented programs:tool-supported translation of JPDDs into code. InAOSD, pages 49–62.
Hoare, C. (1985). Communicating Sequential Processes.Prentice-Hall International.
Kervinen, A., Maunumaa, M., Paakkonen, T., and Katara,M. (2006). Model-Based Testing Through a GUI.volume 3997 of Lecture Notes in Computer Science,pages 16–31.
McNeile, A. and Roubtsova, E. (2008). CSP parallel com-position of aspect models. AOM’08, pages 13–18.
McNeile, A. and Roubtsova, E. (2009). Composition Se-mantics for Executable and Evolvable BehaviouralModeling in MDA. BM-MDA’09,ACM DL:ISBN:978-1-60558-503-1, pages 1–8.
McNeile, A. and Roubtsova, E. (2012). Motivation andguaranteed completion in workflow. LNBIP, 142:16–42.
McNeile, A. and Simons, N. (2000). http://www.metama-xim.com/.
McNeile, A. and Simons, N. (2006). Protocol Modelling.A Modelling Approach that Supports Reusable Be-havioural Abstractions. Software and System Model-ing, 5(1):91–107.
Myers, G. (2004). The Art of Software Testing. Wiley.OMG (2003). Unified Modeling Language: Superstructure
version 2.1.1 formal/2007-02-03.OMG (2013). Case Management Model
and Notation (CMMN). FTF Beta 1.http://www.omg.org/spec/CMMN/121101.
Petri, C. and Reisig, W. (2008). Petri net, volume 3. Schol-arpedia: 3(4):6477.
Roubtsova, E. and Kuiper, R. (2003). Process Semanticsfor UML Component Specifications to Assess Inheri-tance. Electr. Notes Theor. Comput. Sci., 72(3):145–159.
UML (2005). Testing profile. formal/05-07-07,Version 1.0.Watkins, J. and Simon, M. (2010). Testing IT. 2nd ed. Cam-
bridge University Press.
Fourth International Symposium on Business Modeling and Software Design
112
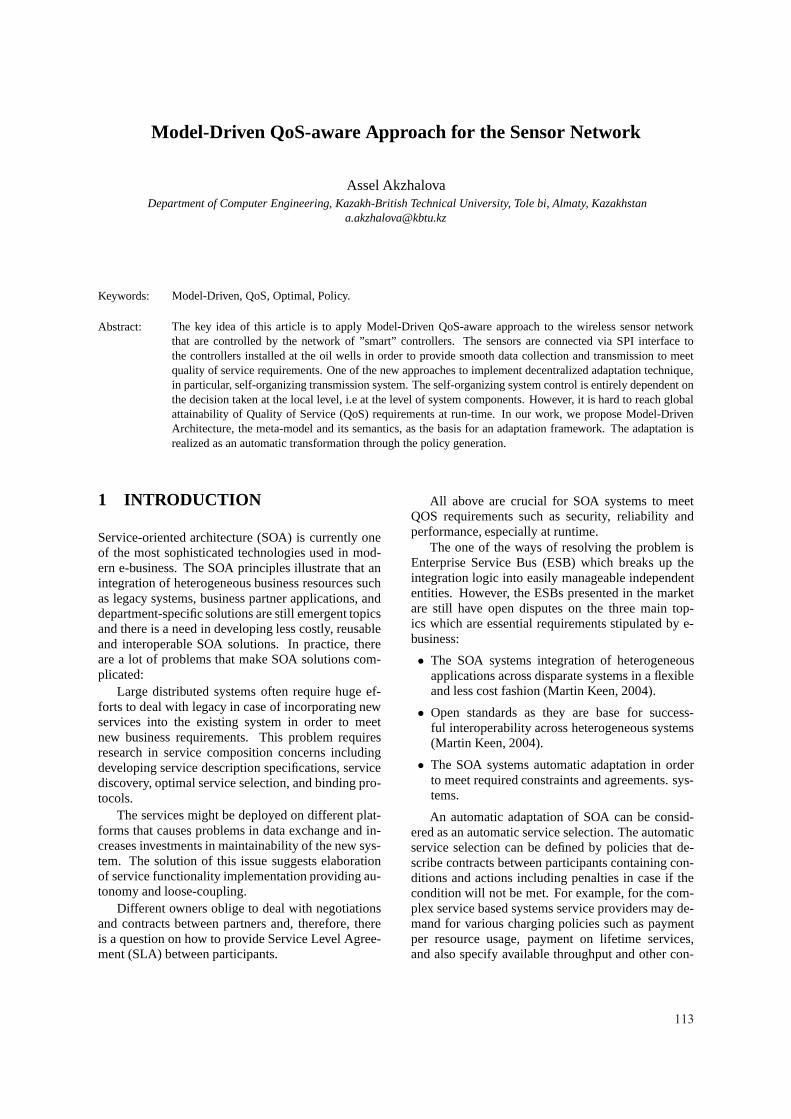
Model-Driven QoS-aware Approach for the Sensor Network
Assel AkzhalovaDepartment of Computer Engineering, Kazakh-British Technical University, Tole bi, Almaty, Kazakhstan
Keywords: Model-Driven, QoS, Optimal, Policy.
Abstract: The key idea of this article is to apply Model-Driven QoS-aware approach to the wireless sensor networkthat are controlled by the network of ”smart” controllers. The sensors are connected via SPI interface tothe controllers installed at the oil wells in order to provide smooth data collection and transmission to meetquality of service requirements. One of the new approaches to implement decentralized adaptation technique,in particular, self-organizing transmission system. The self-organizing system control is entirely dependent onthe decision taken at the local level, i.e at the level of system components. However, it is hard to reach globalattainability of Quality of Service (QoS) requirements at run-time. In our work, we propose Model-DrivenArchitecture, the meta-model and its semantics, as the basis for an adaptation framework. The adaptation isrealized as an automatic transformation through the policygeneration.
1 INTRODUCTION
Service-oriented architecture (SOA) is currently oneof the most sophisticated technologies used in mod-ern e-business. The SOA principles illustrate that anintegration of heterogeneous business resources suchas legacy systems, business partner applications, anddepartment-specific solutions are still emergent topicsand there is a need in developing less costly, reusableand interoperable SOA solutions. In practice, thereare a lot of problems that make SOA solutions com-plicated:
Large distributed systems often require huge ef-forts to deal with legacy in case of incorporating newservices into the existing system in order to meetnew business requirements. This problem requiresresearch in service composition concerns includingdeveloping service description specifications, servicediscovery, optimal service selection, and binding pro-tocols.
The services might be deployed on different plat-forms that causes problems in data exchange and in-creases investments in maintainability of the new sys-tem. The solution of this issue suggests elaborationof service functionality implementation providing au-tonomy and loose-coupling.
Different owners oblige to deal with negotiationsand contracts between partners and, therefore, thereis a question on how to provide Service Level Agree-ment (SLA) between participants.
All above are crucial for SOA systems to meetQOS requirements such as security, reliability andperformance, especially at runtime.
The one of the ways of resolving the problem isEnterprise Service Bus (ESB) which breaks up theintegration logic into easily manageable independententities. However, the ESBs presented in the marketare still have open disputes on the three main top-ics which are essential requirements stipulated by e-business:
• The SOA systems integration of heterogeneousapplications across disparate systems in a flexibleand less cost fashion (Martin Keen, 2004).
• Open standards as they are base for success-ful interoperability across heterogeneous systems(Martin Keen, 2004).
• The SOA systems automatic adaptation in orderto meet required constraints and agreements. sys-tems.
An automatic adaptation of SOA can be consid-ered as an automatic service selection. The automaticservice selection can be defined by policies that de-scribe contracts between participants containing con-ditions and actions including penalties in case if thecondition will not be met. For example, for the com-plex service based systems service providers may de-mand for various charging policies such as paymentper resource usage, payment on lifetime services,and also specify available throughput and other con-
113
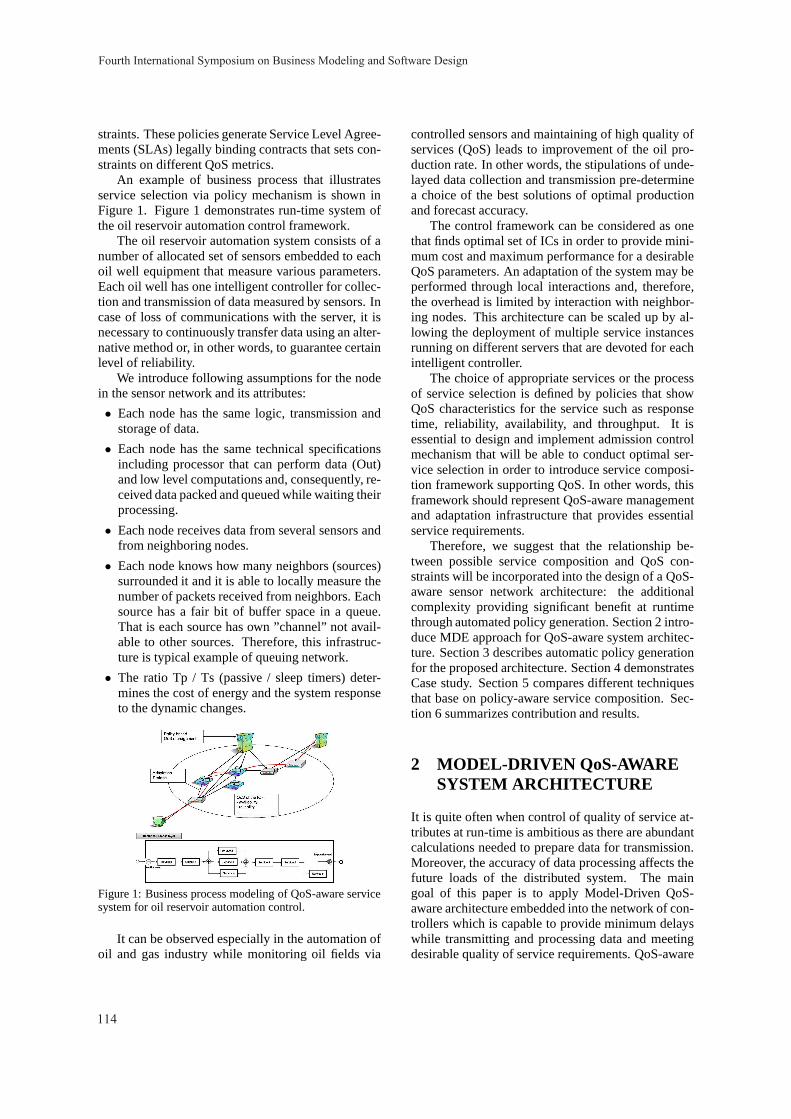
straints. These policies generate Service Level Agree-ments (SLAs) legally binding contracts that sets con-straints on different QoS metrics.
An example of business process that illustratesservice selection via policy mechanism is shown inFigure 1. Figure 1 demonstrates run-time system ofthe oil reservoir automation control framework.
The oil reservoir automation system consists of anumber of allocated set of sensors embedded to eachoil well equipment that measure various parameters.Each oil well has one intelligent controller for collec-tion and transmission of data measured by sensors. Incase of loss of communications with the server, it isnecessary to continuously transfer data using an alter-native method or, in other words, to guarantee certainlevel of reliability.
We introduce following assumptions for the nodein the sensor network and its attributes:
• Each node has the same logic, transmission andstorage of data.
• Each node has the same technical specificationsincluding processor that can perform data (Out)and low level computations and, consequently, re-ceived data packed and queued while waiting theirprocessing.
• Each node receives data from several sensors andfrom neighboring nodes.
• Each node knows how many neighbors (sources)surrounded it and it is able to locally measure thenumber of packets received from neighbors. Eachsource has a fair bit of buffer space in a queue.That is each source has own ”channel” not avail-able to other sources. Therefore, this infrastruc-ture is typical example of queuing network.
• The ratio Tp / Ts (passive / sleep timers) deter-mines the cost of energy and the system responseto the dynamic changes.
Figure 1: Business process modeling of QoS-aware servicesystem for oil reservoir automation control.
It can be observed especially in the automation ofoil and gas industry while monitoring oil fields via
controlled sensors and maintaining of high quality ofservices (QoS) leads to improvement of the oil pro-duction rate. In other words, the stipulations of unde-layed data collection and transmission pre-determinea choice of the best solutions of optimal productionand forecast accuracy.
The control framework can be considered as onethat finds optimal set of ICs in order to provide mini-mum cost and maximum performance for a desirableQoS parameters. An adaptation of the system may beperformed through local interactions and, therefore,the overhead is limited by interaction with neighbor-ing nodes. This architecture can be scaled up by al-lowing the deployment of multiple service instancesrunning on different servers that are devoted for eachintelligent controller.
The choice of appropriate services or the processof service selection is defined by policies that showQoS characteristics for the service such as responsetime, reliability, availability, and throughput. It isessential to design and implement admission controlmechanism that will be able to conduct optimal ser-vice selection in order to introduce service composi-tion framework supporting QoS. In other words, thisframework should represent QoS-aware managementand adaptation infrastructure that provides essentialservice requirements.
Therefore, we suggest that the relationship be-tween possible service composition and QoS con-straints will be incorporated into the design of a QoS-aware sensor network architecture: the additionalcomplexity providing significant benefit at runtimethrough automated policy generation. Section 2 intro-duce MDE approach for QoS-aware system architec-ture. Section 3 describes automatic policy generationfor the proposed architecture. Section 4 demonstratesCase study. Section 5 compares different techniquesthat base on policy-aware service composition. Sec-tion 6 summarizes contribution and results.
2 MODEL-DRIVEN QoS-AWARESYSTEM ARCHITECTURE
It is quite often when control of quality of service at-tributes at run-time is ambitious as there are abundantcalculations needed to prepare data for transmission.Moreover, the accuracy of data processing affects thefuture loads of the distributed system. The maingoal of this paper is to apply Model-Driven QoS-aware architecture embedded into the network of con-trollers which is capable to provide minimum delayswhile transmitting and processing data and meetingdesirable quality of service requirements. QoS-aware
Fourth International Symposium on Business Modeling and Software Design
114
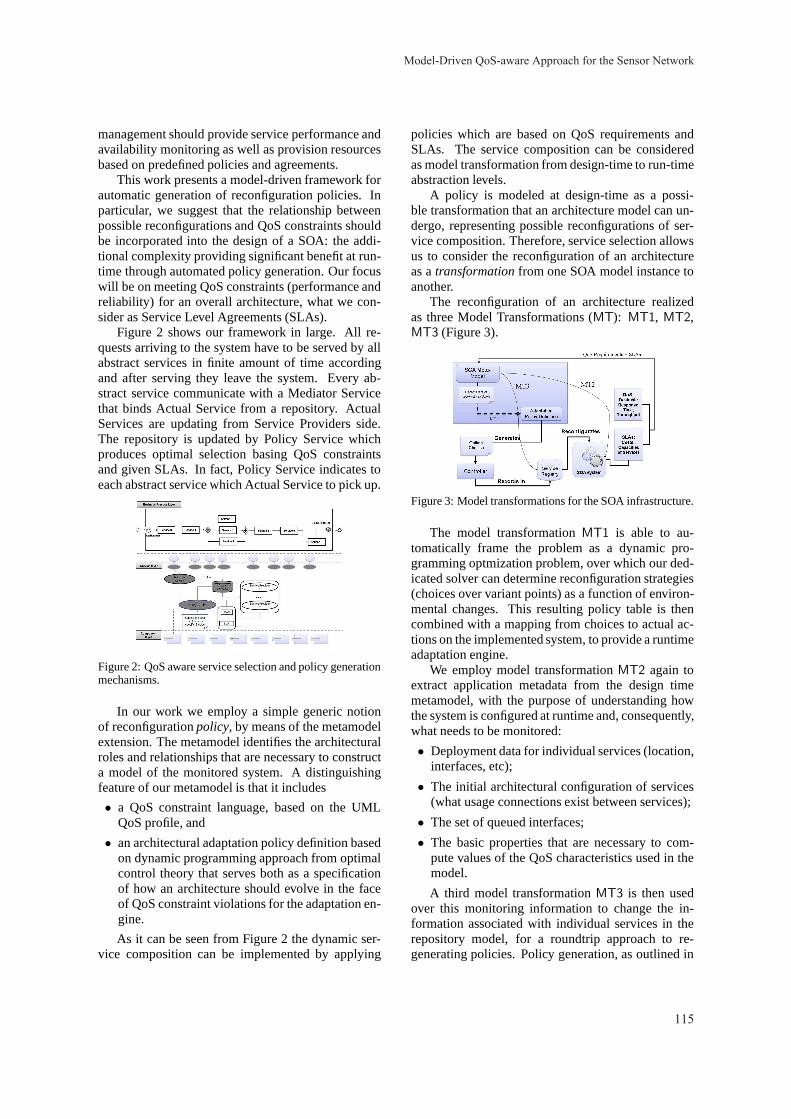
management should provide service performance andavailability monitoring as well as provision resourcesbased on predefined policies and agreements.
This work presents a model-driven framework forautomatic generation of reconfiguration policies. Inparticular, we suggest that the relationship betweenpossible reconfigurations and QoS constraints shouldbe incorporated into the design of a SOA: the addi-tional complexity providing significant benefit at run-time through automated policy generation. Our focuswill be on meeting QoS constraints (performance andreliability) for an overall architecture, what we con-sider as Service Level Agreements (SLAs).
Figure 2 shows our framework in large. All re-quests arriving to the system have to be served by allabstract services in finite amount of time accordingand after serving they leave the system. Every ab-stract service communicate with a Mediator Servicethat binds Actual Service from a repository. ActualServices are updating from Service Providers side.The repository is updated by Policy Service whichproduces optimal selection basing QoS constraintsand given SLAs. In fact, Policy Service indicates toeach abstract service which Actual Service to pick up.
Figure 2: QoS aware service selection and policy generationmechanisms.
In our work we employ a simple generic notionof reconfigurationpolicy, by means of the metamodelextension. The metamodel identifies the architecturalroles and relationships that are necessary to constructa model of the monitored system. A distinguishingfeature of our metamodel is that it includes
• a QoS constraint language, based on the UMLQoS profile, and
• an architectural adaptation policy definition basedon dynamic programming approach from optimalcontrol theory that serves both as a specificationof how an architecture should evolve in the faceof QoS constraint violations for the adaptation en-gine.
As it can be seen from Figure 2 the dynamic ser-vice composition can be implemented by applying
policies which are based on QoS requirements andSLAs. The service composition can be consideredas model transformation from design-time to run-timeabstraction levels.
A policy is modeled at design-time as a possi-ble transformation that an architecture model can un-dergo, representing possible reconfigurations of ser-vice composition. Therefore, service selection allowsus to consider the reconfiguration of an architectureas atransformationfrom one SOA model instance toanother.
The reconfiguration of an architecture realizedas three Model Transformations (MT): MT1, MT2,MT3 (Figure 3).
Figure 3: Model transformations for the SOA infrastructure.
The model transformationMT1 is able to au-tomatically frame the problem as a dynamic pro-gramming optmization problem, over which our ded-icated solver can determine reconfiguration strategies(choices over variant points) as a function of environ-mental changes. This resulting policy table is thencombined with a mapping from choices to actual ac-tions on the implemented system, to provide a runtimeadaptation engine.
We employ model transformationMT2 again toextract application metadata from the design timemetamodel, with the purpose of understanding howthe system is configured at runtime and, consequently,what needs to be monitored:
• Deployment data for individual services (location,interfaces, etc);
• The initial architectural configuration of services(what usage connections exist between services);
• The set of queued interfaces;
• The basic properties that are necessary to com-pute values of the QoS characteristics used in themodel.
A third model transformationMT3 is then usedover this monitoring information to change the in-formation associated with individual services in therepository model, for a roundtrip approach to re-generating policies. Policy generation, as outlined in
Model-Driven QoS-aware Approach for the Sensor Network
115
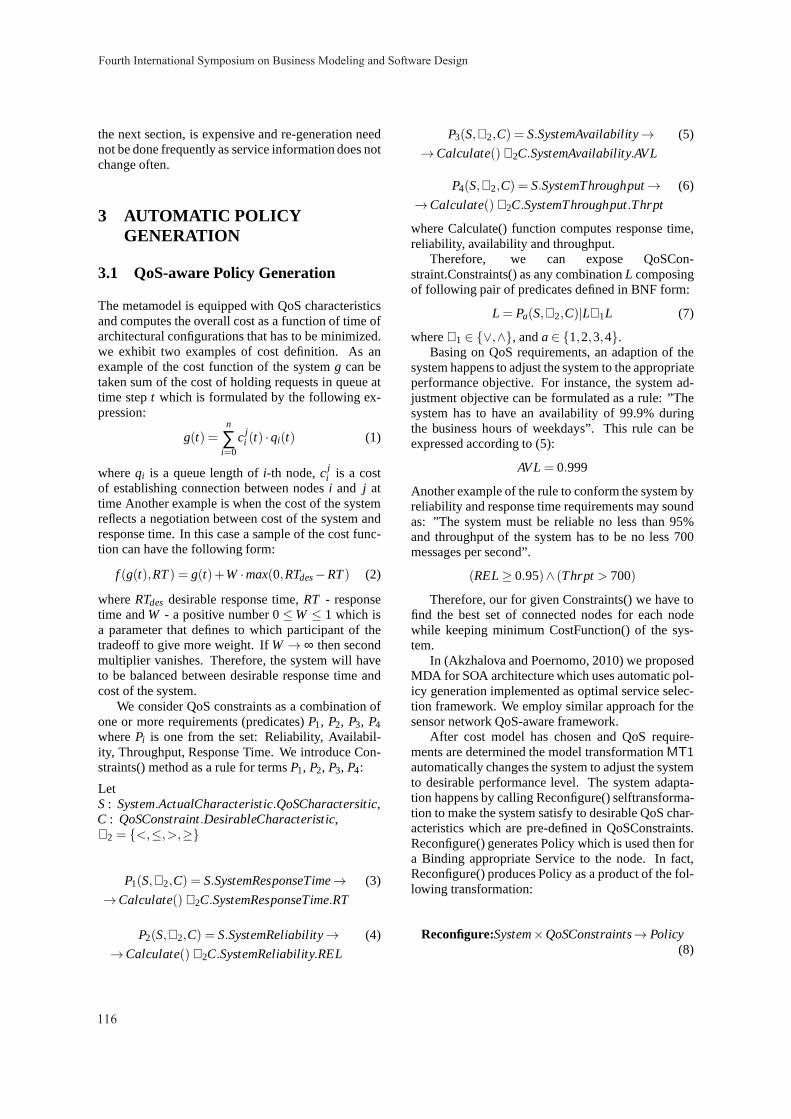
the next section, is expensive and re-generation neednot be done frequently as service information does notchange often.
3 AUTOMATIC POLICYGENERATION
3.1 QoS-aware Policy Generation
The metamodel is equipped with QoS characteristicsand computes the overall cost as a function of time ofarchitectural configurations that has to be minimized.we exhibit two examples of cost definition. As anexample of the cost function of the systemg can betaken sum of the cost of holding requests in queue attime stept which is formulated by the following ex-pression:
g(t) =n
∑i=0
c ji (t) ·qi(t) (1)
whereqi is a queue length ofi-th node,c ji is a cost
of establishing connection between nodesi and j attime Another example is when the cost of the systemreflects a negotiation between cost of the system andresponse time. In this case a sample of the cost func-tion can have the following form:
f (g(t),RT) = g(t)+W ·max(0,RTdes−RT) (2)
whereRTdes desirable response time,RT - responsetime andW - a positive number 0≤W ≤ 1 which isa parameter that defines to which participant of thetradeoff to give more weight. IfW→ ∞ then secondmultiplier vanishes. Therefore, the system will haveto be balanced between desirable response time andcost of the system.
We consider QoS constraints as a combination ofone or more requirements (predicates)P1, P2, P3, P4wherePi is one from the set: Reliability, Availabil-ity, Throughput, Response Time. We introduce Con-straints() method as a rule for termsP1, P2, P3, P4:
LetS: System.ActualCharacteristic.QoSCharactersitic,C : QoSConstraint.DesirableCharacteristic,∇2 = {<,≤,>,≥}
P1(S,∇2,C) = S.SystemResponseTime→ (3)
→Calculate() ∇2C.SystemResponseTime.RT
P2(S,∇2,C) = S.SystemReliability→ (4)
→Calculate() ∇2C.SystemReliability.REL
P3(S,∇2,C) = S.SystemAvailability→ (5)
→Calculate() ∇2C.SystemAvailability.AVL
P4(S,∇2,C) = S.SystemThroughput→ (6)
→Calculate() ∇2C.SystemThroughput.Thrpt
where Calculate() function computes response time,reliability, availability and throughput.
Therefore, we can expose QoSCon-straint.Constraints() as any combinationL composingof following pair of predicates defined in BNF form:
L = Pa(S,∇2,C)|L∇1L (7)
where∇1 ∈ {∨,∧}, anda∈ {1,2,3,4}.Basing on QoS requirements, an adaption of the
system happens to adjust the system to the appropriateperformance objective. For instance, the system ad-justment objective can be formulated as a rule: ”Thesystem has to have an availability of 99.9% duringthe business hours of weekdays”. This rule can beexpressed according to (5):
AVL= 0.999
Another example of the rule to conform the system byreliability and response time requirements may soundas: ”The system must be reliable no less than 95%and throughput of the system has to be no less 700messages per second”.
(REL≥ 0.95)∧ (Thrpt> 700)
Therefore, our for given Constraints() we have tofind the best set of connected nodes for each nodewhile keeping minimum CostFunction() of the sys-tem.
In (Akzhalova and Poernomo, 2010) we proposedMDA for SOA architecture which uses automatic pol-icy generation implemented as optimal service selec-tion framework. We employ similar approach for thesensor network QoS-aware framework.
After cost model has chosen and QoS require-ments are determined the model transformationMT1
automatically changes the system to adjust the systemto desirable performance level. The system adapta-tion happens by calling Reconfigure() selftransforma-tion to make the system satisfy to desirable QoS char-acteristics which are pre-defined in QoSConstraints.Reconfigure() generates Policy which is used then fora Binding appropriate Service to the node. In fact,Reconfigure() produces Policy as a product of the fol-lowing transformation:
Reconfigure:System×QoSConstraints→ Policy(8)
Fourth International Symposium on Business Modeling and Software Design
116
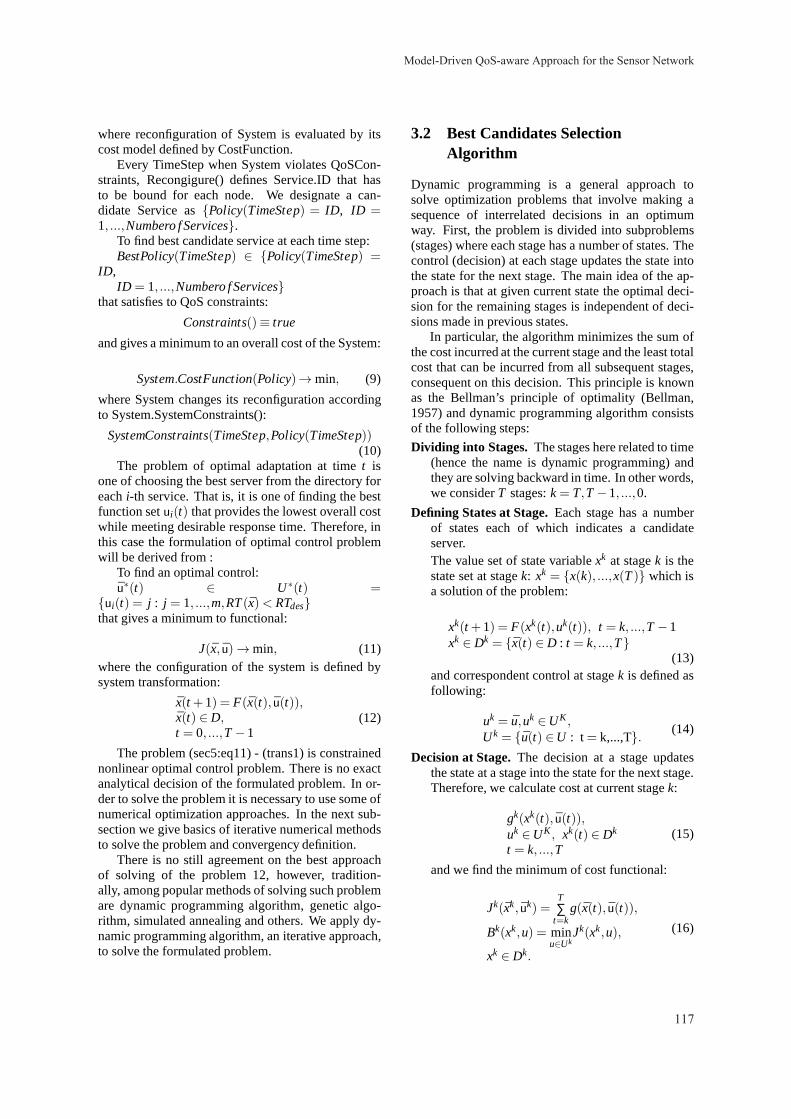
where reconfiguration of System is evaluated by itscost model defined by CostFunction.
Every TimeStep when System violates QoSCon-straints, Recongigure() defines Service.ID that hasto be bound for each node. We designate a can-didate Service as{Policy(TimeStep) = ID, ID =1, ...,Numbero f Services}.
To find best candidate service at each time step:BestPolicy(TimeStep) ∈ {Policy(TimeStep) =
ID,ID = 1, ...,Numbero f Services}
that satisfies to QoS constraints:
Constraints()≡ true
and gives a minimum to an overall cost of the System:
System.CostFunction(Policy)→min, (9)
where System changes its reconfiguration accordingto System.SystemConstraints():
SystemConstraints(TimeStep,Policy(TimeStep))(10)
The problem of optimal adaptation at timet isone of choosing the best server from the directory foreachi-th service. That is, it is one of finding the bestfunction setui(t) that provides the lowest overall costwhile meeting desirable response time. Therefore, inthis case the formulation of optimal control problemwill be derived from :
To find an optimal control:u∗(t) ∈ U∗(t) =
{ui(t) = j : j = 1, ...,m,RT(x)< RTdes}that gives a minimum to functional:
J(x, u)→min, (11)where the configuration of the system is defined bysystem transformation:
x(t +1) = F(x(t), u(t)),x(t) ∈D,
t = 0, ...,T−1(12)
The problem (sec5:eq11) - (trans1) is constrainednonlinear optimal control problem. There is no exactanalytical decision of the formulated problem. In or-der to solve the problem it is necessary to use some ofnumerical optimization approaches. In the next sub-section we give basics of iterative numerical methodsto solve the problem and convergency definition.
There is no still agreement on the best approachof solving of the problem 12, however, tradition-ally, among popular methods of solving such problemare dynamic programming algorithm, genetic algo-rithm, simulated annealing and others. We apply dy-namic programming algorithm, an iterative approach,to solve the formulated problem.
3.2 Best Candidates SelectionAlgorithm
Dynamic programming is a general approach tosolve optimization problems that involve making asequence of interrelated decisions in an optimumway. First, the problem is divided into subproblems(stages) where each stage has a number of states. Thecontrol (decision) at each stage updates the state intothe state for the next stage. The main idea of the ap-proach is that at given current state the optimal deci-sion for the remaining stages is independent of deci-sions made in previous states.
In particular, the algorithm minimizes the sum ofthe cost incurred at the current stage and the least totalcost that can be incurred from all subsequent stages,consequent on this decision. This principle is knownas the Bellman’s principle of optimality (Bellman,1957) and dynamic programming algorithm consistsof the following steps:
Dividing into Stages. The stages here related to time(hence the name is dynamic programming) andthey are solving backward in time. In other words,we considerT stages:k= T,T−1, ...,0.
Defining States at Stage.Each stage has a numberof states each of which indicates a candidateserver.The value set of state variablexk at stagek is thestate set at stagek: xk = {x(k), ...,x(T)} which isa solution of the problem:
xk(t +1) = F(xk(t),uk(t)), t = k, ...,T−1xk ∈ Dk = {x(t) ∈ D : t = k, ...,T}
(13)and correspondent control at stagek is defined asfollowing:
uk = u,uk ∈UK ,
Uk = {u(t) ∈U : t = k,...,T}.(14)
Decision at Stage.The decision at a stage updatesthe state at a stage into the state for the next stage.Therefore, we calculate cost at current stagek:
gk(xk(t), u(t)),uk ∈UK
, xk(t) ∈ Dk
t = k, ...,T(15)
and we find the minimum of cost functional:
Jk(xk, uk) =T∑
t=kg(x(t), u(t)),
Bk(xk,u) = minu∈Uk
Jk(xk,u),
xk ∈ Dk.
(16)
Model-Driven QoS-aware Approach for the Sensor Network
117
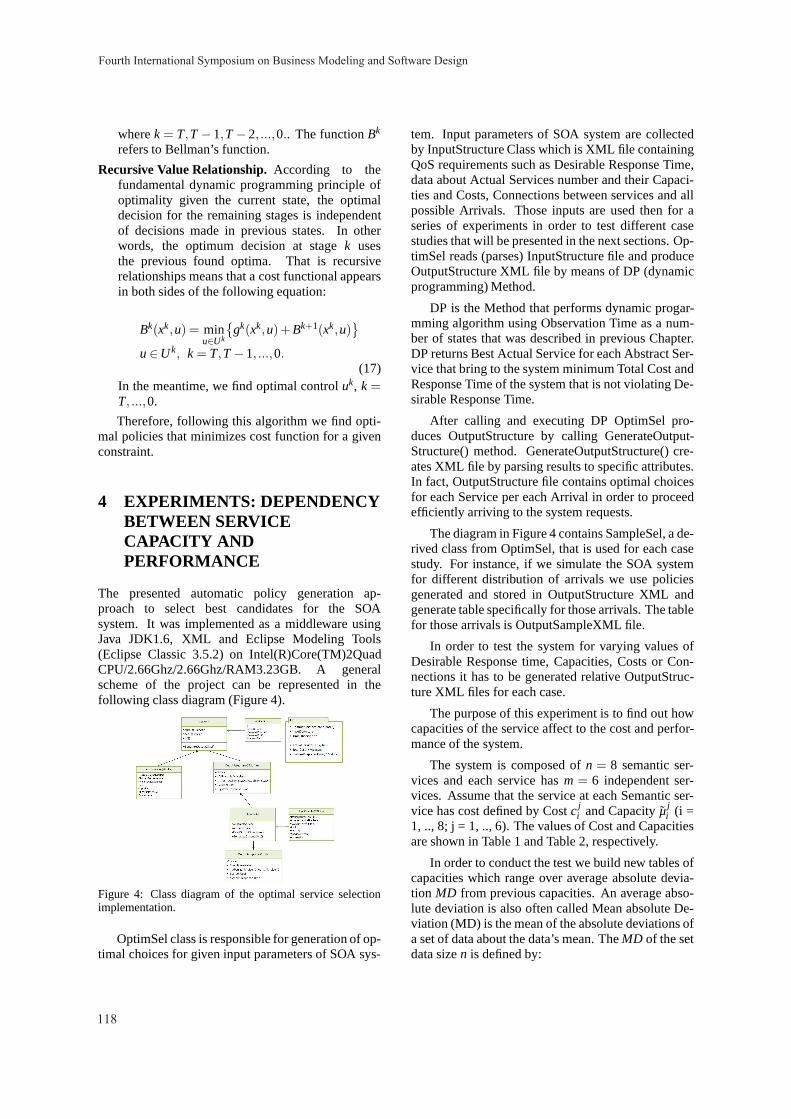
wherek = T,T−1,T−2, ...,0.. The functionBk
refers to Bellman’s function.
Recursive Value Relationship.According to thefundamental dynamic programming principle ofoptimality given the current state, the optimaldecision for the remaining stages is independentof decisions made in previous states. In otherwords, the optimum decision at stagek usesthe previous found optima. That is recursiverelationships means that a cost functional appearsin both sides of the following equation:
Bk(xk,u) = minu∈Uk
{
gk(xk,u)+Bk+1(xk,u)}
u∈Uk, k= T,T−1, ...,0.
(17)In the meantime, we find optimal controluk, k =T, ...,0.
Therefore, following this algorithm we find opti-mal policies that minimizes cost function for a givenconstraint.
4 EXPERIMENTS: DEPENDENCYBETWEEN SERVICECAPACITY ANDPERFORMANCE
The presented automatic policy generation ap-proach to select best candidates for the SOAsystem. It was implemented as a middleware usingJava JDK1.6, XML and Eclipse Modeling Tools(Eclipse Classic 3.5.2) on Intel(R)Core(TM)2QuadCPU/2.66Ghz/2.66Ghz/RAM3.23GB. A generalscheme of the project can be represented in thefollowing class diagram (Figure 4).
Figure 4: Class diagram of the optimal service selectionimplementation.
OptimSel class is responsible for generation of op-timal choices for given input parameters of SOA sys-
tem. Input parameters of SOA system are collectedby InputStructure Class which is XML file containingQoS requirements such as Desirable Response Time,data about Actual Services number and their Capaci-ties and Costs, Connections between services and allpossible Arrivals. Those inputs are used then for aseries of experiments in order to test different casestudies that will be presented in the next sections. Op-timSel reads (parses) InputStructure file and produceOutputStructure XML file by means of DP (dynamicprogramming) Method.
DP is the Method that performs dynamic progar-mming algorithm using Observation Time as a num-ber of states that was described in previous Chapter.DP returns Best Actual Service for each Abstract Ser-vice that bring to the system minimum Total Cost andResponse Time of the system that is not violating De-sirable Response Time.
After calling and executing DP OptimSel pro-duces OutputStructure by calling GenerateOutput-Structure() method. GenerateOutputStructure() cre-ates XML file by parsing results to specific attributes.In fact, OutputStructure file contains optimal choicesfor each Service per each Arrival in order to proceedefficiently arriving to the system requests.
The diagram in Figure 4 contains SampleSel, a de-rived class from OptimSel, that is used for each casestudy. For instance, if we simulate the SOA systemfor different distribution of arrivals we use policiesgenerated and stored in OutputStructure XML andgenerate table specifically for those arrivals. The tablefor those arrivals is OutputSampleXML file.
In order to test the system for varying values ofDesirable Response time, Capacities, Costs or Con-nections it has to be generated relative OutputStruc-ture XML files for each case.
The purpose of this experiment is to find out howcapacities of the service affect to the cost and perfor-mance of the system.
The system is composed ofn = 8 semantic ser-vices and each service hasm = 6 independent ser-vices. Assume that the service at each Semantic ser-vice has cost defined by Costc j
i and Capacity ˜µji (i =
1, .., 8; j = 1, .., 6). The values of Cost and Capacitiesare shown in Table 1 and Table 2, respectively.
In order to conduct the test we build new tables ofcapacities which range over average absolute devia-tion MD from previous capacities. An average abso-lute deviation is also often called Mean absolute De-viation (MD) is the mean of the absolute deviations ofa set of data about the data’s mean. TheMD of the setdata sizen is defined by:
Fourth International Symposium on Business Modeling and Software Design
118
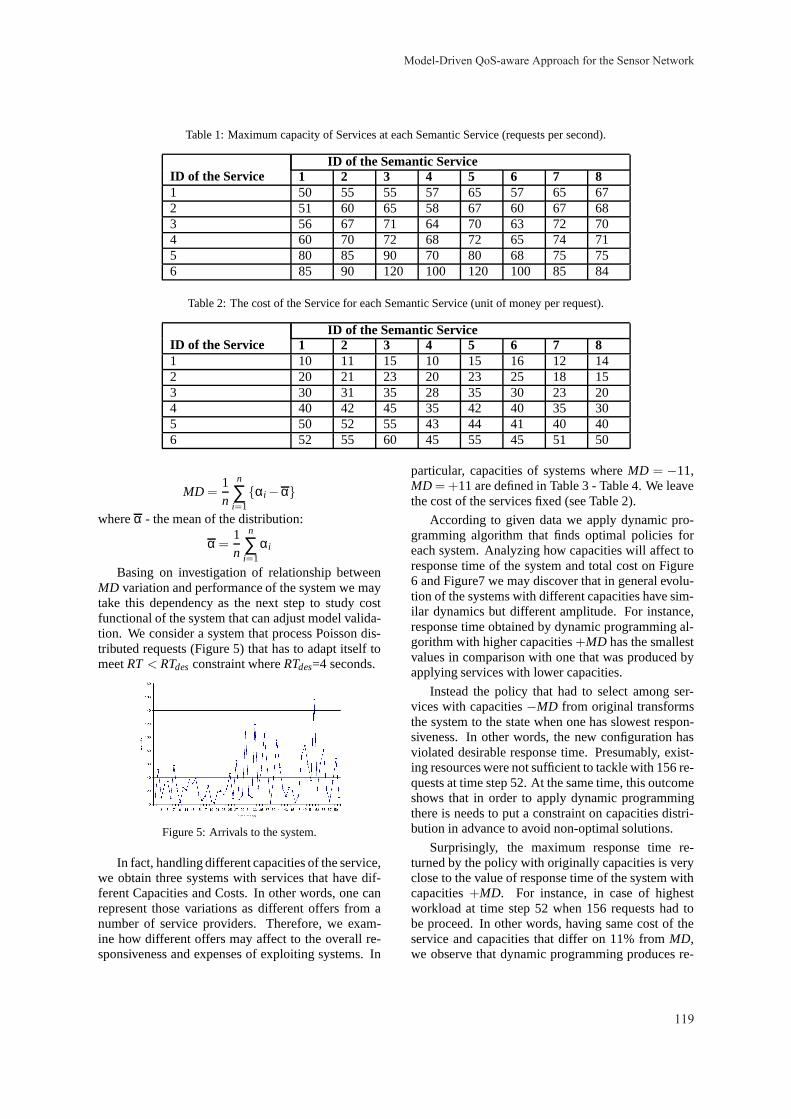
Table 1: Maximum capacity of Services at each Semantic Service (requests per second).
ID of the ServiceID of the Semantic Service
1 2 3 4 5 6 7 81 50 55 55 57 65 57 65 672 51 60 65 58 67 60 67 683 56 67 71 64 70 63 72 704 60 70 72 68 72 65 74 715 80 85 90 70 80 68 75 756 85 90 120 100 120 100 85 84
Table 2: The cost of the Service for each Semantic Service (unit of money per request).
ID of the ServiceID of the Semantic Service
1 2 3 4 5 6 7 81 10 11 15 10 15 16 12 142 20 21 23 20 23 25 18 153 30 31 35 28 35 30 23 204 40 42 45 35 42 40 35 305 50 52 55 43 44 41 40 406 52 55 60 45 55 45 51 50
MD =1n
n
∑i=1{αi−α}
whereα - the mean of the distribution:
α =1n
n
∑i=1
αi
Basing on investigation of relationship betweenMD variation and performance of the system we maytake this dependency as the next step to study costfunctional of the system that can adjust model valida-tion. We consider a system that process Poisson dis-tributed requests (Figure 5) that has to adapt itself tomeetRT< RTdesconstraint whereRTdes=4 seconds.
Figure 5: Arrivals to the system.
In fact, handling different capacities of the service,we obtain three systems with services that have dif-ferent Capacities and Costs. In other words, one canrepresent those variations as different offers from anumber of service providers. Therefore, we exam-ine how different offers may affect to the overall re-sponsiveness and expenses of exploiting systems. In
particular, capacities of systems whereMD = −11,MD =+11 are defined in Table 3 - Table 4. We leavethe cost of the services fixed (see Table 2).
According to given data we apply dynamic pro-gramming algorithm that finds optimal policies foreach system. Analyzing how capacities will affect toresponse time of the system and total cost on Figure6 and Figure7 we may discover that in general evolu-tion of the systems with different capacities have sim-ilar dynamics but different amplitude. For instance,response time obtained by dynamic programming al-gorithm with higher capacities+MD has the smallestvalues in comparison with one that was produced byapplying services with lower capacities.
Instead the policy that had to select among ser-vices with capacities−MD from original transformsthe system to the state when one has slowest respon-siveness. In other words, the new configuration hasviolated desirable response time. Presumably, exist-ing resources were not sufficient to tackle with 156 re-quests at time step 52. At the same time, this outcomeshows that in order to apply dynamic programmingthere is needs to put a constraint on capacities distri-bution in advance to avoid non-optimal solutions.
Surprisingly, the maximum response time re-turned by the policy with originally capacities is veryclose to the value of response time of the system withcapacities+MD. For instance, in case of highestworkload at time step 52 when 156 requests had tobe proceed. In other words, having same cost of theservice and capacities that differ on 11% fromMD,we observe that dynamic programming produces re-
Model-Driven QoS-aware Approach for the Sensor Network
119
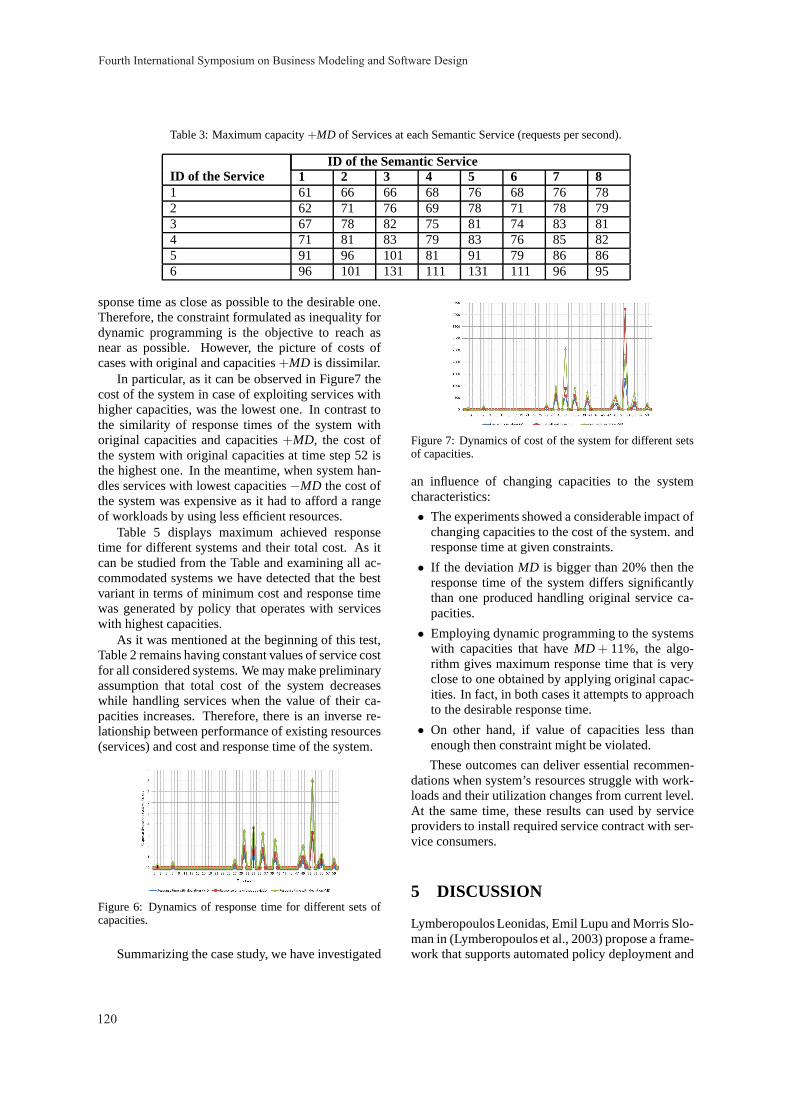
Table 3: Maximum capacity+MD of Services at each Semantic Service (requests per second).
ID of the ServiceID of the Semantic Service
1 2 3 4 5 6 7 81 61 66 66 68 76 68 76 782 62 71 76 69 78 71 78 793 67 78 82 75 81 74 83 814 71 81 83 79 83 76 85 825 91 96 101 81 91 79 86 866 96 101 131 111 131 111 96 95
sponse time as close as possible to the desirable one.Therefore, the constraint formulated as inequality fordynamic programming is the objective to reach asnear as possible. However, the picture of costs ofcases with original and capacities+MD is dissimilar.
In particular, as it can be observed in Figure7 thecost of the system in case of exploiting services withhigher capacities, was the lowest one. In contrast tothe similarity of response times of the system withoriginal capacities and capacities+MD, the cost ofthe system with original capacities at time step 52 isthe highest one. In the meantime, when system han-dles services with lowest capacities−MD the cost ofthe system was expensive as it had to afford a rangeof workloads by using less efficient resources.
Table 5 displays maximum achieved responsetime for different systems and their total cost. As itcan be studied from the Table and examining all ac-commodated systems we have detected that the bestvariant in terms of minimum cost and response timewas generated by policy that operates with serviceswith highest capacities.
As it was mentioned at the beginning of this test,Table 2 remains having constant values of service costfor all considered systems. We may make preliminaryassumption that total cost of the system decreaseswhile handling services when the value of their ca-pacities increases. Therefore, there is an inverse re-lationship between performance of existing resources(services) and cost and response time of the system.
Figure 6: Dynamics of response time for different sets ofcapacities.
Summarizing the case study, we have investigated
Figure 7: Dynamics of cost of the system for different setsof capacities.
an influence of changing capacities to the systemcharacteristics:
• The experiments showed a considerable impact ofchanging capacities to the cost of the system. andresponse time at given constraints.
• If the deviationMD is bigger than 20% then theresponse time of the system differs significantlythan one produced handling original service ca-pacities.
• Employing dynamic programming to the systemswith capacities that haveMD + 11%, the algo-rithm gives maximum response time that is veryclose to one obtained by applying original capac-ities. In fact, in both cases it attempts to approachto the desirable response time.
• On other hand, if value of capacities less thanenough then constraint might be violated.
These outcomes can deliver essential recommen-dations when system’s resources struggle with work-loads and their utilization changes from current level.At the same time, these results can used by serviceproviders to install required service contract with ser-vice consumers.
5 DISCUSSION
Lymberopoulos Leonidas, Emil Lupu and Morris Slo-man in (Lymberopoulos et al., 2003) propose a frame-work that supports automated policy deployment and
Fourth International Symposium on Business Modeling and Software Design
120
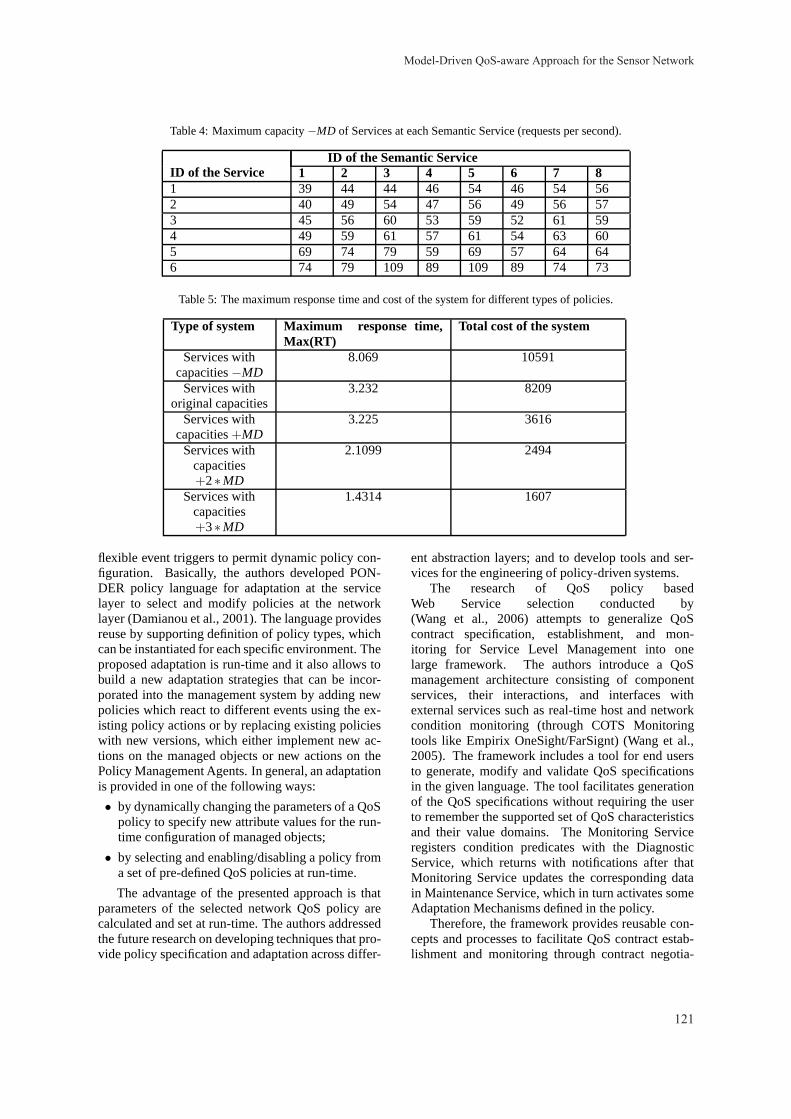
Table 4: Maximum capacity−MD of Services at each Semantic Service (requests per second).
ID of the ServiceID of the Semantic Service
1 2 3 4 5 6 7 81 39 44 44 46 54 46 54 562 40 49 54 47 56 49 56 573 45 56 60 53 59 52 61 594 49 59 61 57 61 54 63 605 69 74 79 59 69 57 64 646 74 79 109 89 109 89 74 73
Table 5: The maximum response time and cost of the system for different types of policies.
Type of system Maximum response time,Max(RT)
Total cost of the system
Services withcapacities−MD
8.069 10591
Services withoriginal capacities
3.232 8209
Services withcapacities+MD
3.225 3616
Services withcapacities+2∗MD
2.1099 2494
Services withcapacities+3∗MD
1.4314 1607
flexible event triggers to permit dynamic policy con-figuration. Basically, the authors developed PON-DER policy language for adaptation at the servicelayer to select and modify policies at the networklayer (Damianou et al., 2001). The language providesreuse by supporting definition of policy types, whichcan be instantiated for each specific environment. Theproposed adaptation is run-time and it also allows tobuild a new adaptation strategies that can be incor-porated into the management system by adding newpolicies which react to different events using the ex-isting policy actions or by replacing existing policieswith new versions, which either implement new ac-tions on the managed objects or new actions on thePolicy Management Agents. In general, an adaptationis provided in one of the following ways:
• by dynamically changing the parameters of a QoSpolicy to specify new attribute values for the run-time configuration of managed objects;
• by selecting and enabling/disabling a policy froma set of pre-defined QoS policies at run-time.
The advantage of the presented approach is thatparameters of the selected network QoS policy arecalculated and set at run-time. The authors addressedthe future research on developing techniques that pro-vide policy specification and adaptation across differ-
ent abstraction layers; and to develop tools and ser-vices for the engineering of policy-driven systems.
The research of QoS policy basedWeb Service selection conducted by(Wang et al., 2006) attempts to generalize QoScontract specification, establishment, and mon-itoring for Service Level Management into onelarge framework. The authors introduce a QoSmanagement architecture consisting of componentservices, their interactions, and interfaces withexternal services such as real-time host and networkcondition monitoring (through COTS Monitoringtools like Empirix OneSight/FarSignt) (Wang et al.,2005). The framework includes a tool for end usersto generate, modify and validate QoS specificationsin the given language. The tool facilitates generationof the QoS specifications without requiring the userto remember the supported set of QoS characteristicsand their value domains. The Monitoring Serviceregisters condition predicates with the DiagnosticService, which returns with notifications after thatMonitoring Service updates the corresponding datain Maintenance Service, which in turn activates someAdaptation Mechanisms defined in the policy.
Therefore, the framework provides reusable con-cepts and processes to facilitate QoS contract estab-lishment and monitoring through contract negotia-
Model-Driven QoS-aware Approach for the Sensor Network
121
tion, resource management, diagnostics and adapta-tion mechanisms. However, as the authors note in(Wang et al., 2006), it has to be done the furtherresearch and development of dynamic QoS-drivenresource management algorithms for Service LevelManagement.
This work presents a way to tackle with aboveproblems by introducing model-driven approach toSOA together with the optimal control technique astransformation for the SOA meta-model in order toautomatically reconfigure the system in less costlyway.
6 CONCLUSIONS
The policy generation was formulated as an optimalcontrol problem which allows automatically gener-ate appropriate configuration of the service-orientedsystem to meet QoS constraints. It means that pro-posed approach is generic in terms of choosing dif-ferent level of QoS requirements and applying differ-ent techniques to solve the optimal control problem.The model is extensible as the QoS requirements maybe included during system design. We have offereddynamic programming approach as the solution ofthe formulated problems. The case study investigateshow different parameters of the service-oriented sys-tem and constraints affect to the performance and dy-namics of system utilization. We have evaluated ob-tained results and formulated recommendations andbest strategies for employing dynamic programmingapproach to dynamically adapt SOA according to de-sirable QoS characteristics.
REFERENCES
Akzhalova, A. and Poernomo, I. (2010). Model driven ap-proach for dynamic service composition based on qosconstraints.Services, IEEE Congress on, 0:590–597.
Bellman, R. (1957). Dynamic Programming. PrincetonUniversity Press.
Damianou, N., Dulay, N., Lupu, E., and Sloman, M. (2001).The ponder policy specification language. In Sloman,M., Lobo, J., and Lupu, E., editors,POLICY, volume1995 of Lecture Notes in Computer Science, pages18–38. Springer.
Lymberopoulos, L., Lupu, E., and Sloman, M. (2003). Anadaptive policy-based framework for network servicesmanagement.J. Netw. Syst. Manage., 11(3):277–303.
Martin Keen, Amit Acharya, e. a. (2004).Patterns: Im-plementing an SOA Using an Enterprise Service Bus.IBM Corp., Riverton, NJ, USA.
Wang, C., Wang, G., Wang, H., Chen, A., and Santiago,R. (2006). Quality of service (qos) contract spec-ification, establishment, and monitoring for servicelevel management. InEDOCW ’06: Proceedings ofthe 10th IEEE on International Enterprise DistributedObject Computing Conference Workshops, page 49.IEEE Computer Society.
Wang, G., Wang, C., Chen, A., Wang, H., Fung, C.,Uczekaj, S., Chen, Y.-L., Guthmiller, W. G., and Lee,J. (2005). Service level management using qos mon-itoring, diagnostics, and adaptation for networked en-terprise systems. InEDOC ’05: Proceedings of theNinth IEEE International EDOC Enterprise Comput-ing Conference, pages 239–250. IEEE Computer So-ciety.
Fourth International Symposium on Business Modeling and Software Design
122

SHORT PAPERS

Modelling Information Systems Using Nomis A Practical View of Its Aplication and Its Insights to Business Processes
José Cordeiro E.S.T. Setúbal, I.P.S, Campus do IPS, Setúbal, Portugal
Keywords: Information Systems, Information Systems Modelling, Human-Centred Information Systems, Human Relativism, Organisational Semiotics, Theory of Organized Activity, Enterprise Ontology, NOMIS.
Abstract: NOMIS – NOrmative Modelling of Information Systems presents a new way of think, model and develop information systems. This new approach has its foundation in a simple and specific ontology known as Human Relativism (HR). HR philosophical stance acknowledges the human element central role within any information system (IS) leading us to use observable human actions as the IS kernel modelling element. Using observable human actions is claimed as a step towards achieving the desired modelling objectivity and precision that most natural sciences and engineering have. NOMIS has also its roots on three IS socio-technical approaches, namely Organisational Semiotics, the Theory of Organised Activity and Enterprise Ontology from where its specific vision and views of IS are inspired. Modelling IS with NOMIS can be done by representing NOMIS Vision with the NOMIS Models - a set of diagrams and tables using the NOMIS provided notation or, otherwise, a set of UML profiles created for it. In this paper we provide an overview of NOMIS and some modelling application examples that intend to highlight some new and important concepts introduced by NOMIS. Our focus will be in the most innovative aspects and their relevance to business systems understanding and modelling.
1 INTRODUCTION
Information systems failure was a popular research topic two decades ago (e.g. Sauer, 1997). Nowadays, computerized systems (CS) have evolved, people got familiarized with them and, many issues now go unnoticed. Some of them are revealed when we want do something with a CS and we find out that that particular action is not available, or when we don’t know how to do it because there is no information to help us and many other common situations. Also Information System Development (ISD) and, in particular, computer programming is still lacking a solid theoretical foundation. Requirements are gathered with no solid rules; programs are developed based mostly on practice guided by experience and established software patterns, programming structures and data models have many different flavours depending on the implementation.
NOMIS – NOrmative Modelling of Information Systems presents a new way of think, model and develop information systems (IS) that intends to improve modelling objectivity and precision. This is accomplished by: (1) adopting a new ontology
named Human Relativism that recognizes the central role of the human element within an IS, the unpredictability factor it introduces, and a way of reduce this unpredictability; (2) proposing a new vision of IS composed by different views inspired by the ideas of three known socio-technical approaches namely Organisational Semiotics (Liu, 2000), the Theory of Organized Activity (Holt, 1997) and Enterprise Ontology (Dietz, 2006); (3) defining a modelling notation and a set of diagrams to represent NOMIS Vision and views.
In this paper NOMIS Foundations, including HR, NOMIS Vision and NOMIS Models, will be briefly presented. The focus and contribution, however, will be in the most innovative aspects of NOMIS approach and its effects on modelling of business systems. This will be shown using a simple case study that will be modelled using NOMIS Models where some key concepts will be highlighted. The examples will highlight some issues of current business modelling and some neglected and new aspects of it.
125
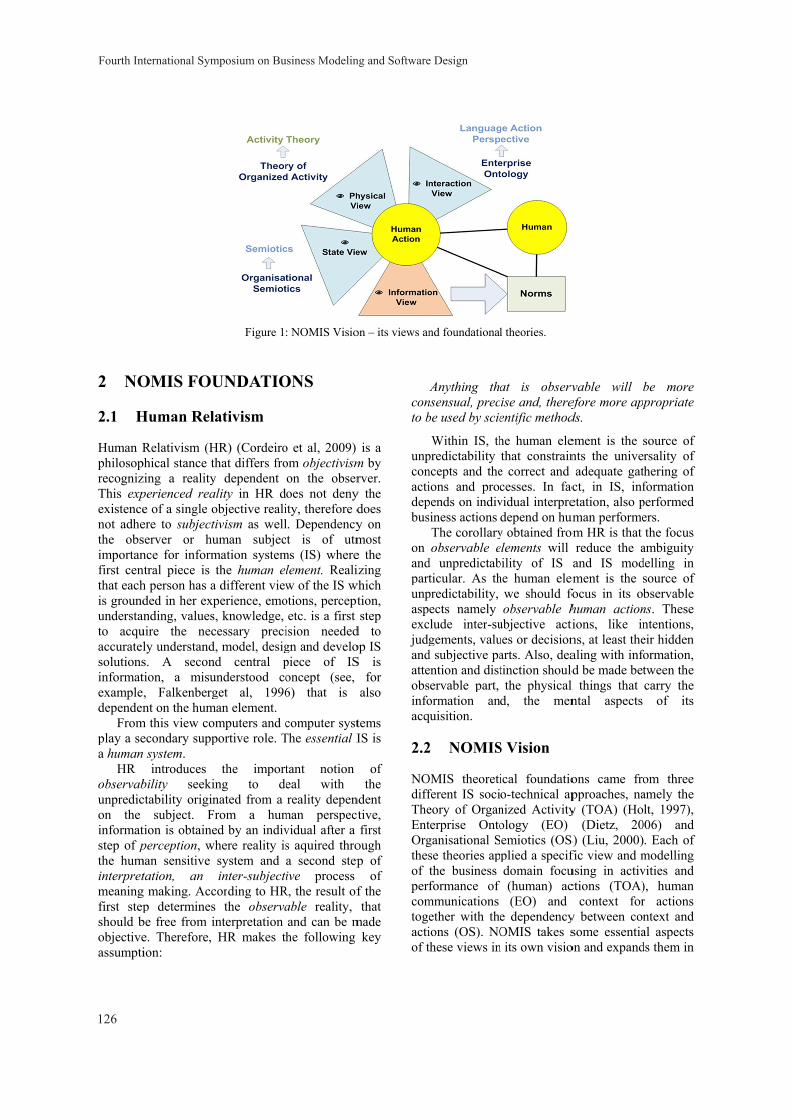
2 NO
2.1 H
Human RphilosoprecognizThis expexistencenot adhethe obsimportanfirst centhat eachis groundunderstato acquaccuratelsolutionsinformatexampledependen
Fromplay a sea human
HR observabunpredicon the informatstep of pthe huminterpretmeaningfirst stepshould bobjectiveassumpti
OMIS FOU
Human Rel
Relativism (Hphical stance tzing a realityperienced reae of a single oere to subjectserver or hunce for informntral piece is h person has aded in her exp
anding, valuesuire the necly understands. A secontion, a misu, Falkenbergnt on the hum
m this view coecondary supp system.
introduces bility seekictability origin
subject. Ftion is obtaineperception, w
man sensitive tation, an
g making. Accp determines
be free from ie. Therefore, ion:
Figure 1
UNDATIO
ativism
HR) (Cordeirothat differs froy dependent ality in HR dobjective realitivism as welluman subjecmation systemthe human el
a different viewperience, emo, knowledge,
cessary precid, model, designd central punderstood coget al, 1996
man element. mputers and c
portive role. T
the importing to denated from a rom a humed by an indiv
where reality issystem and inter-subjecti
cording to HRs the observainterpretation HR makes th
: NOMIS Visio
ONS
o et al, 2009) om objectivismon the obseroes not denyity, therefore dl. Dependencyct is of utmms (IS) wherelement. Realiw of the IS w
otions, perceptetc. is a first
ision neededgn and developiece of ISoncept (see, 6) that is
computer systThe essential I
tant notion eal with reality depen
man perspectvidual after a s aquired throa second stepive process
R, the result ofable reality, and can be mhe following
on – its views an
is a m by rver.
y the does y on most e the izing
which tion, step
d to op IS S is
for also
tems IS is
of the
ndent tive, first
ough p of
of f the that
made key
conto b
unpconactidepbus
on andpartunpaspexcjudgandatteobsinfoacq
2.2
NOdiffTheEntOrgthesof perfcomtogeactiof t
nd foundational
Anything thansensual, precbe used by scie
Within IS, thpredictability ncepts and theions and procpends on indivsiness actions The corollaryobservable e
d unpredictabticular. As th
predictability, ects namely
clude inter-sugements, valu
d subjective paention and distservable part, ormation anquisition.
2 NOMIS
OMIS theoretiferent IS socieory of Organterprise Ontoganisational Sse theories apthe business formance of
mmunications ether with theions (OS). NOthese views in
l theories.
at is observise and, therefentific method
he human elethat constrain
e correct and cesses. In facvidual interpredepend on hum
y obtained fromelements will bility of IS he human elem
we should foobservable h
ubjective actiues or decisionarts. Also, deatinction shouldthe physical
d, the men
S Vision
ical foundatioo-technical apnized Activityology (EO) emiotics (OSplied a specifdomain focu(human) ac(EO) and
e dependencyOMIS takes s
n its own visio
vable will before more appds.
ement is the nts the univeadequate gat
ct, in IS, infetation, also p
uman performeom HR is that
reduce the aand IS mod
ement is the sfocus in its obhuman actiontions, like inns, at least thealing with infod be made betl things that ntal aspects
ons came fropproaches, nay (TOA) (Ho
(Dietz, 20S) (Liu, 2000)fic view and musing in activctions (TOA)
context fory between consome essentia
on and expand
be more propriate
source of rsality of
thering of formation performed ers. the focus
ambiguity delling in source of bservable
ns. These ntentions, eir hidden formation, tween the carry the
of its
om three amely the lt, 1997),
006) and . Each of
modelling vities and ), human r actions ntext and al aspects ds them in
Fourth International Symposium on Business Modeling and Software Design
126
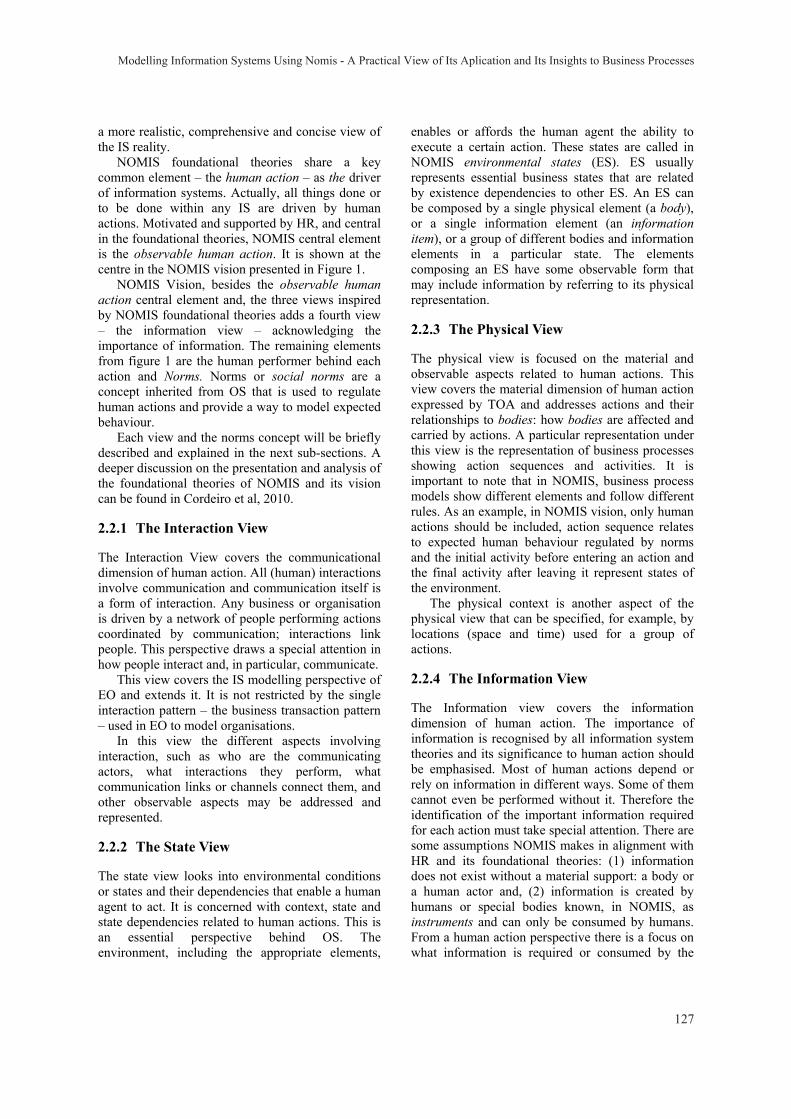
a more realistic, comprehensive and concise view of the IS reality.
NOMIS foundational theories share a key common element – the human action – as the driver of information systems. Actually, all things done or to be done within any IS are driven by human actions. Motivated and supported by HR, and central in the foundational theories, NOMIS central element is the observable human action. It is shown at the centre in the NOMIS vision presented in Figure 1.
NOMIS Vision, besides the observable human action central element and, the three views inspired by NOMIS foundational theories adds a fourth view – the information view – acknowledging the importance of information. The remaining elements from figure 1 are the human performer behind each action and Norms. Norms or social norms are a concept inherited from OS that is used to regulate human actions and provide a way to model expected behaviour.
Each view and the norms concept will be briefly described and explained in the next sub-sections. A deeper discussion on the presentation and analysis of the foundational theories of NOMIS and its vision can be found in Cordeiro et al, 2010.
2.2.1 The Interaction View
The Interaction View covers the communicational dimension of human action. All (human) interactions involve communication and communication itself is a form of interaction. Any business or organisation is driven by a network of people performing actions coordinated by communication; interactions link people. This perspective draws a special attention in how people interact and, in particular, communicate.
This view covers the IS modelling perspective of EO and extends it. It is not restricted by the single interaction pattern – the business transaction pattern – used in EO to model organisations.
In this view the different aspects involving interaction, such as who are the communicating actors, what interactions they perform, what communication links or channels connect them, and other observable aspects may be addressed and represented.
2.2.2 The State View
The state view looks into environmental conditions or states and their dependencies that enable a human agent to act. It is concerned with context, state and state dependencies related to human actions. This is an essential perspective behind OS. The environment, including the appropriate elements,
enables or affords the human agent the ability to execute a certain action. These states are called in NOMIS environmental states (ES). ES usually represents essential business states that are related by existence dependencies to other ES. An ES can be composed by a single physical element (a body), or a single information element (an information item), or a group of different bodies and information elements in a particular state. The elements composing an ES have some observable form that may include information by referring to its physical representation.
2.2.3 The Physical View
The physical view is focused on the material and observable aspects related to human actions. This view covers the material dimension of human action expressed by TOA and addresses actions and their relationships to bodies: how bodies are affected and carried by actions. A particular representation under this view is the representation of business processes showing action sequences and activities. It is important to note that in NOMIS, business process models show different elements and follow different rules. As an example, in NOMIS vision, only human actions should be included, action sequence relates to expected human behaviour regulated by norms and the initial activity before entering an action and the final activity after leaving it represent states of the environment.
The physical context is another aspect of the physical view that can be specified, for example, by locations (space and time) used for a group of actions.
2.2.4 The Information View
The Information view covers the information dimension of human action. The importance of information is recognised by all information system theories and its significance to human action should be emphasised. Most of human actions depend or rely on information in different ways. Some of them cannot even be performed without it. Therefore the identification of the important information required for each action must take special attention. There are some assumptions NOMIS makes in alignment with HR and its foundational theories: (1) information does not exist without a material support: a body or a human actor and, (2) information is created by humans or special bodies known, in NOMIS, as instruments and can only be consumed by humans. From a human action perspective there is a focus on what information is required or consumed by the
Modelling Information Systems Using Nomis - A Practical View of Its Aplication and Its Insights to Business Processes
127
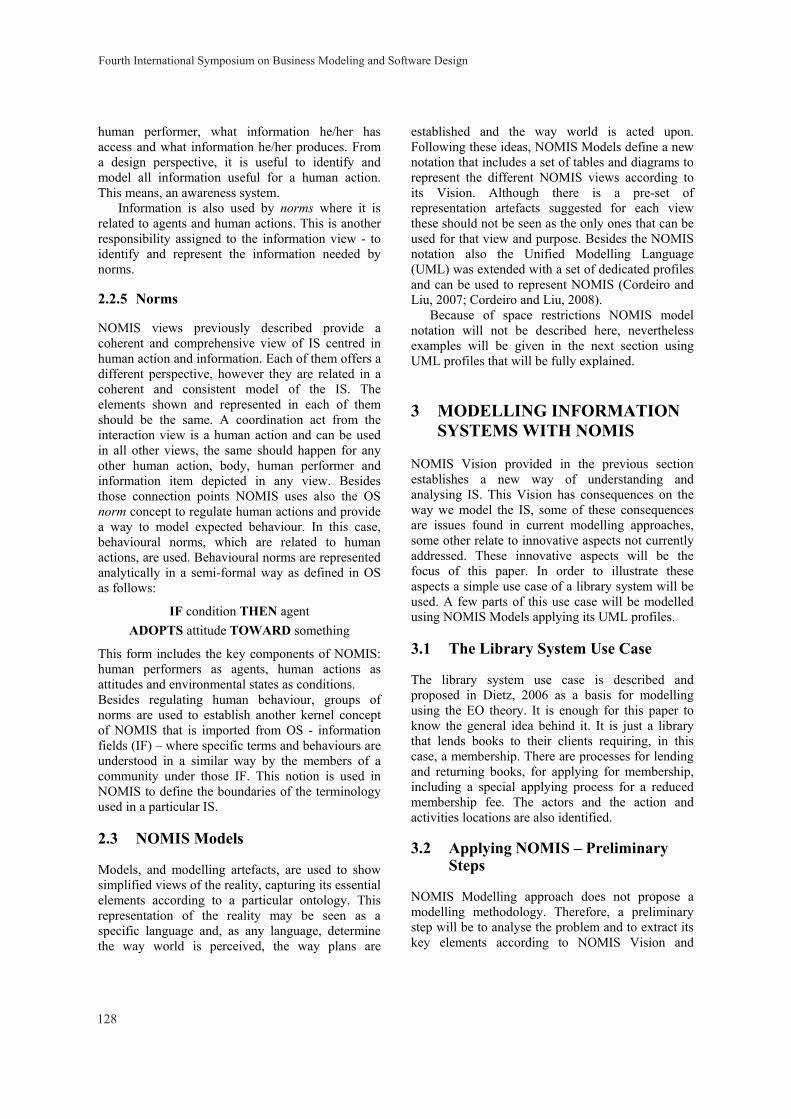
human performer, what information he/her has access and what information he/her produces. From a design perspective, it is useful to identify and model all information useful for a human action. This means, an awareness system.
Information is also used by norms where it is related to agents and human actions. This is another responsibility assigned to the information view - to identify and represent the information needed by norms.
2.2.5 Norms
NOMIS views previously described provide a coherent and comprehensive view of IS centred in human action and information. Each of them offers a different perspective, however they are related in a coherent and consistent model of the IS. The elements shown and represented in each of them should be the same. A coordination act from the interaction view is a human action and can be used in all other views, the same should happen for any other human action, body, human performer and information item depicted in any view. Besides those connection points NOMIS uses also the OS norm concept to regulate human actions and provide a way to model expected behaviour. In this case, behavioural norms, which are related to human actions, are used. Behavioural norms are represented analytically in a semi-formal way as defined in OS as follows:
IF condition THEN agent ADOPTS attitude TOWARD something
This form includes the key components of NOMIS: human performers as agents, human actions as attitudes and environmental states as conditions. Besides regulating human behaviour, groups of norms are used to establish another kernel concept of NOMIS that is imported from OS - information fields (IF) – where specific terms and behaviours are understood in a similar way by the members of a community under those IF. This notion is used in NOMIS to define the boundaries of the terminology used in a particular IS.
2.3 NOMIS Models
Models, and modelling artefacts, are used to show simplified views of the reality, capturing its essential elements according to a particular ontology. This representation of the reality may be seen as a specific language and, as any language, determine the way world is perceived, the way plans are
established and the way world is acted upon. Following these ideas, NOMIS Models define a new notation that includes a set of tables and diagrams to represent the different NOMIS views according to its Vision. Although there is a pre-set of representation artefacts suggested for each view these should not be seen as the only ones that can be used for that view and purpose. Besides the NOMIS notation also the Unified Modelling Language (UML) was extended with a set of dedicated profiles and can be used to represent NOMIS (Cordeiro and Liu, 2007; Cordeiro and Liu, 2008). Because of space restrictions NOMIS model notation will not be described here, nevertheless examples will be given in the next section using UML profiles that will be fully explained.
3 MODELLING INFORMATION SYSTEMS WITH NOMIS
NOMIS Vision provided in the previous section establishes a new way of understanding and analysing IS. This Vision has consequences on the way we model the IS, some of these consequences are issues found in current modelling approaches, some other relate to innovative aspects not currently addressed. These innovative aspects will be the focus of this paper. In order to illustrate these aspects a simple use case of a library system will be used. A few parts of this use case will be modelled using NOMIS Models applying its UML profiles.
3.1 The Library System Use Case
The library system use case is described and proposed in Dietz, 2006 as a basis for modelling using the EO theory. It is enough for this paper to know the general idea behind it. It is just a library that lends books to their clients requiring, in this case, a membership. There are processes for lending and returning books, for applying for membership, including a special applying process for a reduced membership fee. The actors and the action and activities locations are also identified.
3.2 Applying NOMIS – Preliminary Steps
NOMIS Modelling approach does not propose a modelling methodology. Therefore, a preliminary step will be to analyse the problem and to extract its key elements according to NOMIS Vision and
Fourth International Symposium on Business Modeling and Software Design
128
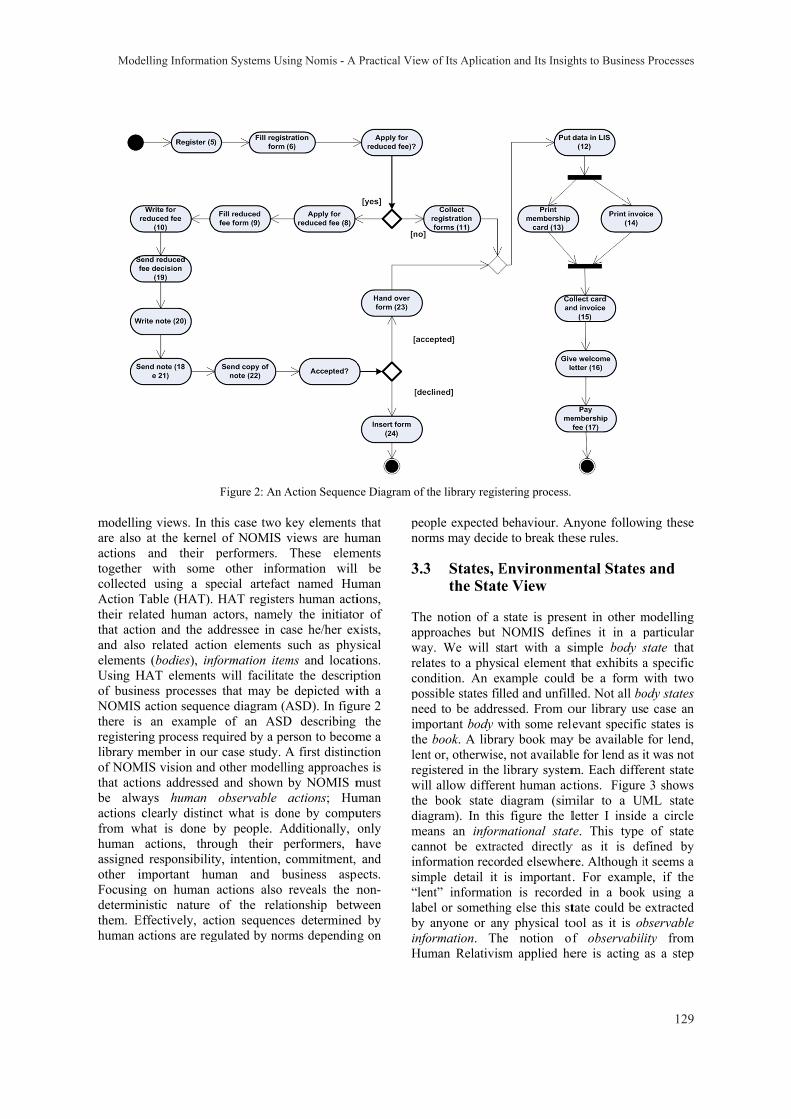
modellinare also actions together collectedAction Ttheir relathat actioand alsoelementsUsing Hof businNOMIS there is registerinlibrary mof NOMthat actiobe alwaactions cfrom whhuman assignedother imFocusingdeterminthem. Efhuman a
ng views. In that the kerneland their with some
d using a spTable (HAT). ated human aon and the ad
o related actios (bodies), inf
HAT elementsness processes
action sequenan example
ng process reqmember in our
MIS vision andons addressedays human clearly distinchat is done bactions, thro
d responsibilitmportant hug on human nistic nature ffectively, ac
actions are reg
Figure 2: An A
his case two kl of NOMIS performers. other infor
pecial artefacHAT register
actors, namelddressee in con elements formation items will facilitats that may bence diagram (Ae of an ASDquired by a per case study. A
d other modelld and shown observable
ct what is doby people. Aough their pty, intention, uman and b
actions also of the relat
tion sequencegulated by nor
Action Sequenc
key elementsviews are huThese elem
rmation will t named Hurs human actiy the initiatoase he/her exsuch as physms and locatite the descripe depicted wiASD). In figuD describing erson to becomA first distincling approacheby NOMIS mactions; Hu
one by compuAdditionally, operformers, hcommitment,
business aspereveals the n
tionship betwes determinedrms depending
ce Diagram of t
that uman ments l be uman ions, or of xists, sical ions. ption ith a ure 2
the me a ction es is must
uman uters only have and
ects. non-
ween d by g on
peonor
3.3
Theappwayrelaconposneeimpthe lentregiwillthe diagmeacaninfosim“lenlabeby infoHum
the library regis
ople expected ms may decid
3 States, Ethe Stat
e notion of a proaches but y. We will sates to a physndition. An exssible states filed to be addreportant body w
book. A librat or, otherwiseistered in the l allow differe
book state gram). In thisans an inform
nnot be extraormation recor
mple detail it nt” informatioel or somethinanyone or an
ormation. Thman Relativis
stering process.
behaviour. Ade to break the
Environmete View
state is preseNOMIS defitart with a sical element txample couldlled and unfillessed. From owith some releary book maye, not availabllibrary system
ent human acdiagram (sims figure the lmational statacted directlyrded elsewheris important.
on is recordeng else this stny physical tohe notion ofsm applied he
Anyone followese rules.
ental States
ent in other mines it in a psimple body sthat exhibits a
d be a form led. Not all boour library uslevant specificy be available le for lend as im. Each diffe
ctions. Figuremilar to a UMletter I insidete. This typey as it is dere. Although it. For exampled in a booktate could be ool as it is obf observabilere is acting
wing these
s and
modelling particular state that a specific with two ody states e case an c states is
for lend, it was not
erent state e 3 shows ML state e a circle
of state efined by it seems a le, if the
k using a extracted bservable lity from as a step
Modelling Information Systems Using Nomis - A Practical View of Its Aplication and Its Insights to Business Processes
129
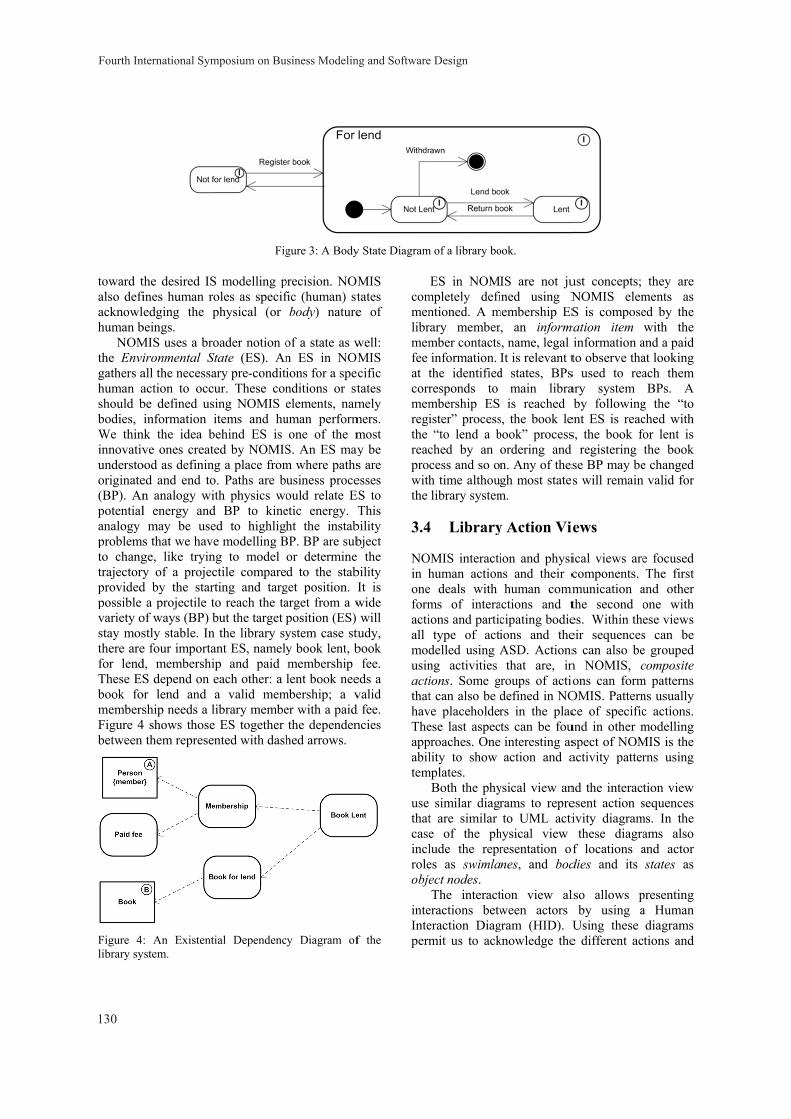
toward talso defiacknowlhuman b
NOMthe Envigathers ahuman ashould bbodies, We thininnovativunderstooriginate(BP). Anpotentialanalogy problemsto changtrajectoryprovidedpossible variety ostay mosthere arefor lendThese ESbook fomembersFigure 4between
Figure 4library sy
the desired ISines human roedging the p
beings. MIS uses a broironmental Stall the necessaaction to occube defined usinformation i
nk the idea bve ones create
ood as defininged and end ton analogy wil energy and
may be uses that we havege, like tryiny of a projec
d by the starta projectile t
of ways (BP) bstly stable. Ine four importad, membershiS depend on e
or lend and ship needs a l
4 shows thosethem represen
: An Existentiystem.
Fig
S modelling poles as specifphysical (or
oader notion otate (ES). Anary pre-conditur. These coning NOMIS items and hu
behind ES is ed by NOMISg a place from
o. Paths are bth physics wo
d BP to kineed to highlige modelling B
ng to model ctile compareting and targto reach the tabut the target p
n the library syant ES, namelyip and paid each other: a a valid memlibrary membee ES together nted with dash
ial Dependenc
gure 3: A Body
precision. NOMfic (human) st
body) nature
of a state as wn ES in NOMions for a specnditions or stelements, namuman performone of the m
S. An ES maym where pathsusiness proceould relate Eetic energy. Tht the instab
BP. BP are subor determine d to the stab
get position. Iarget from a wposition (ES) ystem case stuy book lent, bmembership lent book nee
mbership; a ver with a paid the dependen
hed arrows.
cy Diagram of
y State Diagram
MIS tates e of
well: MIS cific tates mely mers. most y be s are esses
ES to This
bility bject the
bility It is wide will
tudy, book
fee. eds a valid d fee. ncies
f the
commenlibrmemfee at tcorrmemregithe reacprowiththe
3.4
NOin honeformactiall modusinactithathavTheappabiltem
usethatcaseinclroleobje
inteInteperm
m of a library bo
ES in NOMmpletely defintioned. A mrary membermber contactsinformation. the identifiedresponds to mbership ES ister” process“to lend a b
ched by an cess and so onh time althouglibrary system
4 Library
OMIS interactihuman action
e deals with ms of interaions and partictype of acti
delled using Ang activities ions. Some gt can also be d
ve placeholderese last aspecproaches. Onelity to show
mplates. Both the physimilar diagr
t are similar e of the phlude the repres as swimlaect nodes. The interact
eractions betweraction Diagmit us to ack
ook.
IS are not juined using N
membership ES, an inform
s, name, legal It is relevant t
d states, BPsmain librais reached
s, the book lebook” processordering and n. Any of thesgh most state
m.
y Action Vi
ion and physins and their c
human commactions and tcipating bodieions and theASD. Actionsthat are, in
roups of actiodefined in NOrs in the placts can be fouinteresting asaction and a
ysical view anrams to repreto UML acti
hysical view resentation ofnes, and bod
tion view alween actors
gram (HID). Uknowledge the
ust concepts; NOMIS elemS is compose
mation item information ato observe thas used to reaary system by following
ent ES is reacs, the book fo
d registering se BP may be
es will remain
iews
ical views arecomponents.
mmunication athe second oes. Within theeir sequencess can also ben NOMIS, cions can formOMIS. Patternce of specific
und in other mspect of NOMactivity patter
nd the interactesent action sivity diagramthese diagra
f locations adies and its
lso allows pby using a
Using these e different ac
they are ments as ed by the with the
and a paid at looking ach them BPs. A
g the “to ched with for lent is the book
e changed valid for
e focused The first
and other one with ese views s can be e grouped composite
m patterns ns usually c actions. modelling MIS is the rns using
tion view sequences
ms. In the ams also and actor states as
presenting a Human diagrams tions and
Fourth International Symposium on Business Modeling and Software Design
130
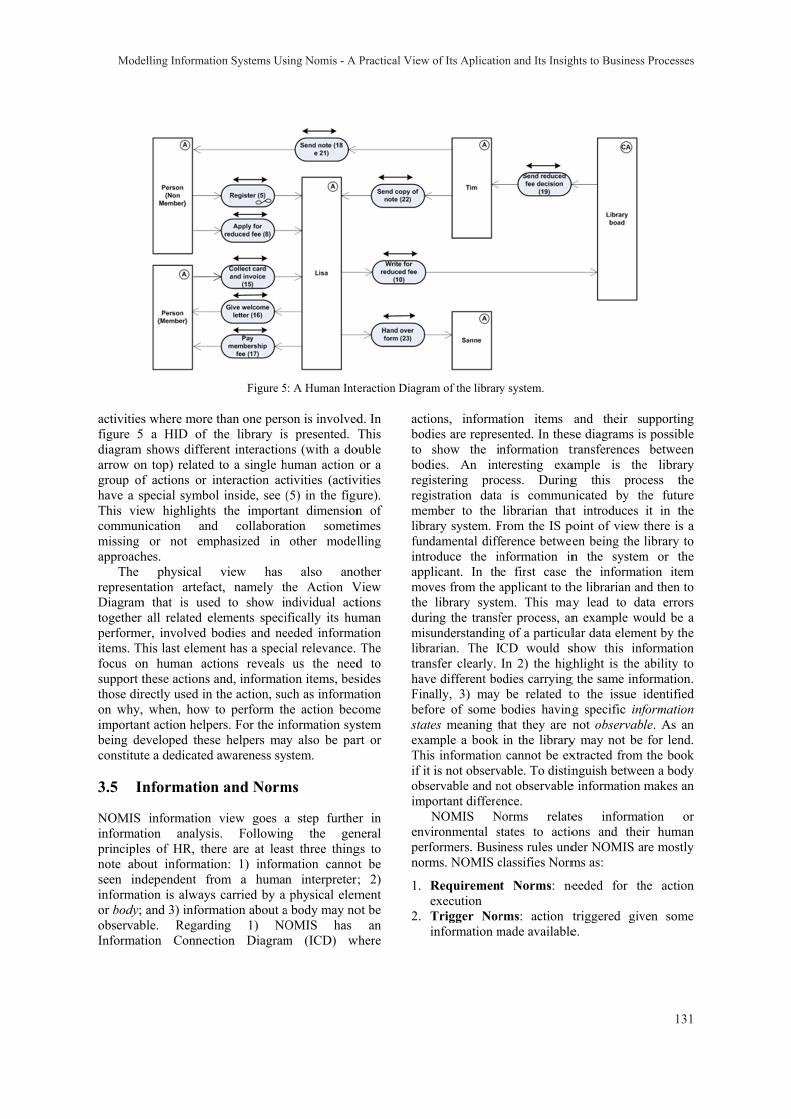
activitiesfigure 5diagram arrow ongroup ofhave a sThis viecommunmissing approach
The represenDiagramtogether performeitems. Thfocus onsupport tthose diron why,importanbeing deconstitut
3.5 In
NOMIS informatprinciplenote aboseen indinformator body; observabInformat
s where more a HID of tshows differe
n top) related f actions or ispecial symboew highlightsnication and
or not emphes.
physical ntation artefacm that is used
all related eler, involved bhis last elemen human actthese actions arectly used in when, how
nt action helpeeveloped theste a dedicated
nformation
information tion analysies of HR, theout informatiodependent frtion is alwaysand 3) inform
ble. Regardition Connect
Figure 5
than one persthe library isent interactionto a single h
interaction acol inside, see (s the importad collaboratphasized in
view has ct, namely thd to show inlements specibodies and neent has a specitions reveals and, informatithe action, suto perform thers. For the ine helpers maawareness sy
n and Norm
view goes as. Followin
ere are at leaon: 1) informom a human
s carried by a mation about aing 1) NOtion Diagram
5: A Human Inte
son is involveds presented. Tns (with a do
human action tivities (activ(5) in the figuant dimensiontion sometiother model
also anohe Action Vndividual actifically its hueeded informaial relevance.
us the needion items, bes
uch as informahe action becnformation sysy also be par
ystem.
ms
a step furtheng the genst three thing
mation cannotn interpreter;physical elem
a body may noOMIS has m (ICD) w
eraction Diagra
d. In This
ouble or a
vities ure). n of imes lling
other View tions
uman ation The
d to sides ation come stem rt or
er in neral gs to t be ; 2) ment ot be
an where
actibodto bodregiregimemlibrfunintrappmovthe durmislibrtranhavFinbefostatexaThiif itobsimp
envperfnor
1.
2.
am of the library
ions, informadies are repres
show the indies. An intistering procistration datamber to the rary system. Fdamental diff
roduce the inplicant. In thves from the a
library systeing the transf
sunderstandingrarian. The Insfer clearly. ve different boally, 3) may
fore of some tes meaning tample a book is informationt is not observservable and nportant differeNOMIS N
vironmental sformers. Busims. NOMIS c
Requiremenexecution Trigger Norinformation m
y system.
ation items sented. In thesnformation tteresting exacess. Duringa is communlibrarian that
From the IS pference betweenformation ine first case applicant to them. This mayfer process, ang of a particulCD would sIn 2) the hig
odies carrying be related t
bodies havingthat they are nin the library
n cannot be exvable. To distinnot observableence. Norms relate
tates to actioness rules und
classifies Norm
t Norms: ne
rms: action tmade available
and their suse diagrams istransferences ample is theg this procnicated by tht introduces
point of view een being the n the systemthe informat
he librarian anay lead to dan example wolar data elemeshow this infghlight is the g the same infoto the issue g specific infnot observab
y may not be xtracted from nguish betwee
e information
es informaons and theider NOMIS ams as:
eeded for th
triggered give.
upporting s possible
between e library cess the he future it in the there is a library to
m or the tion item nd then to ata errors ould be a ent by the formation ability to
formation. identified formation le. As an for lend. the book
en a body makes an
tion or ir human
are mostly
he action
ven some
Modelling Information Systems Using Nomis - A Practical View of Its Aplication and Its Insights to Business Processes
131
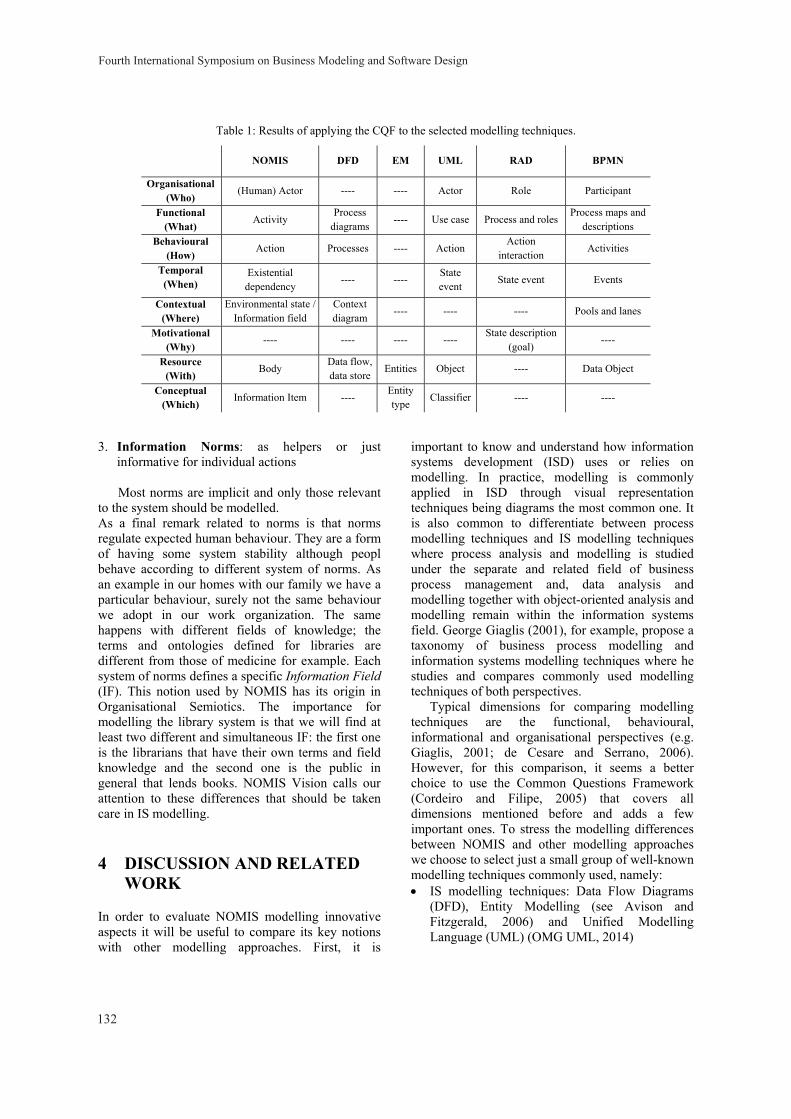
Table 1: Results of applying the CQF to the selected modelling techniques.
NOMIS DFD EM UML RAD BPMN
Organisational (Who)
(Human) Actor ---- ---- Actor Role Participant
Functional (What)
Activity Process
diagrams ---- Use case Process and roles
Process maps and descriptions
Behavioural (How)
Action Processes ---- Action Action
interaction Activities
Temporal (When)
Existential dependency
---- ---- State event
State event Events
Contextual (Where)
Environmental state / Information field
Context diagram
---- ---- ---- Pools and lanes
Motivational (Why)
---- ---- ---- ---- State description
(goal) ----
Resource (With)
Body Data flow, data store
Entities Object ---- Data Object
Conceptual (Which)
Information Item ---- Entity type
Classifier ---- ----
3. Information Norms: as helpers or just informative for individual actions Most norms are implicit and only those relevant
to the system should be modelled. As a final remark related to norms is that norms regulate expected human behaviour. They are a form of having some system stability although peopl behave according to different system of norms. As an example in our homes with our family we have a particular behaviour, surely not the same behaviour we adopt in our work organization. The same happens with different fields of knowledge; the terms and ontologies defined for libraries are different from those of medicine for example. Each system of norms defines a specific Information Field (IF). This notion used by NOMIS has its origin in Organisational Semiotics. The importance for modelling the library system is that we will find at least two different and simultaneous IF: the first one is the librarians that have their own terms and field knowledge and the second one is the public in general that lends books. NOMIS Vision calls our attention to these differences that should be taken care in IS modelling.
4 DISCUSSION AND RELATED WORK
In order to evaluate NOMIS modelling innovative aspects it will be useful to compare its key notions with other modelling approaches. First, it is
important to know and understand how information systems development (ISD) uses or relies on modelling. In practice, modelling is commonly applied in ISD through visual representation techniques being diagrams the most common one. It is also common to differentiate between process modelling techniques and IS modelling techniques where process analysis and modelling is studied under the separate and related field of business process management and, data analysis and modelling together with object-oriented analysis and modelling remain within the information systems field. George Giaglis (2001), for example, propose a taxonomy of business process modelling and information systems modelling techniques where he studies and compares commonly used modelling techniques of both perspectives.
Typical dimensions for comparing modelling techniques are the functional, behavioural, informational and organisational perspectives (e.g. Giaglis, 2001; de Cesare and Serrano, 2006). However, for this comparison, it seems a better choice to use the Common Questions Framework (Cordeiro and Filipe, 2005) that covers all dimensions mentioned before and adds a few important ones. To stress the modelling differences between NOMIS and other modelling approaches we choose to select just a small group of well-known modelling techniques commonly used, namely: • IS modelling techniques: Data Flow Diagrams
(DFD), Entity Modelling (see Avison and Fitzgerald, 2006) and Unified Modelling Language (UML) (OMG UML, 2014)
Fourth International Symposium on Business Modeling and Software Design
132
• Business process modelling techniques: Role Activity Diagrams (RAD) (Ould, 1995; Ould, 2005), Business Process Modelling Notation (BPMN) (OMG BPMN, 2014).
The results of applying the CQF to these modelling techniques is shown in table 1. This table helps to have a broader view of the main aspects covered by each technique. In this case NOMIS furnishes a better coverage of the analysed dimensions together with UML and BPMN, although BPMN is more specific. It should be noted that many methodologies use more than one modelling technique (for example EM and DFD) to help them representing better the organisational domain. Nevertheless, this broader view does not really emphasize the benefits of using NOMIS, in this case it is necessary to look into a few particular aspects of NOMIS. To start with, the human centeredness of NOMIS realized by its exclusive modelling of human observable actions is one of the most important differences to other approaches. Anything done in a business or organisation is always done by humans through human actions. Any action performed by a machine becomes part of its technical implementation and at most, may only be judged and accepted in the business domain. Also, this focus on human action allows some key social aspects to be correctly addressed, such as responsibility, commitment, interests and intentions that have a strong emphasis in NOMIS foundational theories. The next difference is the use of context in NOMIS. In NOMIS context is addressed in different ways: firstly through the use of environmental states which are necessary conditions for a group of actions to be performed, secondly regarding each individual action by covering all elements, including information items related to that action and, thirdly, through information fields that provide a field of shared understanding for each IS used element. The analysed modelling techniques do not restrict actions to human actions mixing technical details with organisational elements and making difficult to understand and establish properly the organisational-technical boundary. Also these techniques do not make a proper context for understanding each model element. NOMIS does this by allowing each element to be perceived under an information field (IF) scope allowing for a similar element be understood differently under different IFs also represented in NOMIS models. Another difference is coherence and consistency as any NOMIS views sees the same reality where an element of one view is always related to the same element in another view. This cannot be done when a methodology chooses to use
different modelling techniques for representing the same organisational reality. In this case UML may overcome this difficulty, however UML was not thought to model the business domain which results in having many problems to represent it besides mixing technical details and using an object-oriented paradigm (Avison and Fitzgerald, 2006). Another differentiating aspect of NOMIS is human communication that is not addressed by other modelling techniques despite its importance in organisations. In this case BMPN is an exception having a conversation diagram and recognizing the important of this organisational view. A last major distinct aspect in NOMIS is the notion, representation and use of norms. All analysed modelling techniques use a sequential or parallel flow for actions, but they do not recognise it as being human dependent and possibly not followed (also, because they use the same flow for machine actions). In NOMIS the use of norms recognizes properly the human dependent nature of human action process flows.
5 CONCLUSIONS
This paper briefly presented NOMIS – a new modelling approach for information systems that integrates the theories of Organisational Semiotics, Enterprise Ontology and the Theory of Organized Activity. NOMIS is strongly founded in the philosophical stance of Human Relativism that is expected to provide the necessary modelling precision. NOMIS is fully described in (Cordeiro, 2011).
The focus of this paper was to show some important innovative modelling aspects of NOMIS that may be useful for a better understanding of IS and business systems. These aspects were also compared within different dimensions with similar concepts used by a small set of other well-known modelling techniques.
REFERENCES
Avison, D. and Fitzgerald, G., (2006). Information Systems Development: Methodologies, Techniques and Tools, 4th Ed, McGraw-Hill Education, UK.
de Cesare, S. and Serrano, A., (2006). Collaborative Modeling Using UML and Business Process Simulation. In Proceedings of the 39th Annual Hawaii International Conference on System Sciences, Vol. 1.
Modelling Information Systems Using Nomis - A Practical View of Its Aplication and Its Insights to Business Processes
133

Cordeiro, J. (2011). Normative Approach to Information systems Modelling. PhD Thesis. The University of Reading, UK.
Cordeiro, J. and Filipe, J., (2005). Comparative Analysis of Ontology Charting with other Modelling Techniques. In Proceedings of the 8th International Workshop on Organisational Semiotics. Toulouse.
Cordeiro, J. and Liu, K., (2007). UML 2 Profiles for Ontology Charts and Diplans - Issues on Meta-modelling. In Proceedings of the 2nd International Workshop on Enterprise Modelling and Information Systems Architectures. St. Goar, Germany.
Cordeiro, J. and Liu, K., (2008). A UML Profile for Enterprise Ontology. In Proceedings of the 2nd International Workshop on Enterprise Systems and Technology. Enschede, the Netherlands.
Cordeiro, J., Filipe, J. and Liu, K., (2009). Towards a Human Oriented Approach to Information Systems Development. In Proceedings of the 3rd International Workshop on Enterprise Systems and Technology. Sofia, Bulgaria.
Cordeiro, J., Filipe, J. and Liu, K., (2010). NOMIS – A Human Centred Modelling Approach of Information Systems. In Proceedings of the 4th International Workshop on Enterprise Systems and Technology. Athens, Greece.
Dietz, J., (2006). Enterprise Ontology, Theory and Methodology. Springer-Verlag, Berlin Heidelberg, Germany.
Falkenberg, E., Hesse, W., Lindgreen, P., Nilsson, B., Oei, J., Rolland, C., Stamper, R., Van Assche, F. Verrijn-Stuart, A. and Voss, K. (1996) FRISCO : A Framework of Information System Concepts, The IFIP WG 8.1 Task Group FRISCO, December 1996.
Giaglis, G., (2001). A Taxonomy of Business Process Modelling and Information Systems Modeling Techniques, In International Journal of Flexible Manufacturing Systems, 13, pages 209-228.
Holt, A., (1997). Organized Activity and Its Support by Computer. Kluwer Academic Publishers, Dordrecht, The Netherlands.
Liu, K., (2000). Semiotics in Information Systems Engineering. Cambridge University Press, Cambridge, UK.
OMG BPMN [online], (2014). Object Management Group / Business Process Modelling Notation. Available from: http://www.bpmn.org [2014].
OMG UML [online], (2014). Object Management Group Unified Modelling Language. Available from: http://www.uml.org [2014].
Ould, M. A., (1995). Business Processes – Modelling and Analysis for Re-Engineering and Improvement. John Wiley & Sons, Chichester, England.
Ould, M. A., (2005). Business Process Management – A Rigorous Approach. The British Computer Society, Wiltshire, UK.
Sauer, C., (1997). Deciding the Future for IS Failures: Not the Choice You Might Think. In Re-Thinking Management Information Systems. Galliers, R.D., & Currie, W. (eds)., Oxford University Press.
Fourth International Symposium on Business Modeling and Software Design
134
An Approach to the Context-oriented Use Case Analysis
Kalinka Kaloyanova1 and Neli Maneva2 1Faculty of Mathematics and Informatics, Sofia University, 5 J. Bourchier Blvd., Sofia, Bulgaria
2Institute of Mathematics and Informatics, BAS, Acad. G. Bonchev Str., Bl.8, Sofia, Bulgaria [email protected], [email protected]
Keywords: Requirements Engineering, Use Case Analysis, Information Systems Development, Multiple-criteria Decision Making, Comparative Analysis.
Abstract: The paper describes our efforts to propose a feasible solution of a significant problem in information systems development – requirements engineering, based on use cases. The adjustable use case quality model is constructed and used within the Comparative Analysis method to support the decision making during the use case analysis process. Two real-life problems related to this process are described and their solutions through the suggested approach are given.
1 INTRODUCTION
Nowadays the volumes of information are continually increasing, the methods for storing and searching information become more complex and the software users - more demanding. One way to meet their expectations is to assure an effective engineering of the elucidated user-defined requirements. Requirements Engineering (RE) as a subfield of both Information Systems (IS) and Software Engineering (SE) concerns the real-life needs of the users and the constraints for the systems to be built.
Recognizing the importance of the RE in any software intensive system’s life cycle and understanding the significant role of the requirements elicitation activity, we address a challenging issue – providing systematic approaches to the construction and constantly improvement of the requirements for information systems development.
The goal of this paper is to present our approach to IS requirements engineering, based on quality use cases. The applicability of a formal method for the proposed context-oriented use case analysis is investigated in Section 2. The most difficult activity – use case quality modelling in a specified context, is described in Section 3. Two examples are given, illustrating how the method can be successfully applied. In the Conclusions section some directions for future research and experimental work are shared.
2 BASIC DEFINITIONS AND RELATED APPROACHES
Requirements engineering is one of the initial and very important activities in software development. Lately its significance is realized and there are plenty of methods, frameworks, tools, etc., supporting RE (Pressman, 2009), (Sommerville, 2011), (Denny, 2005). From practitioner’s point of view the great variety of approaches and available tools are more distractive than useful. This is especially true for information systems development, where the main requirements come from end users and usually are ambiguous, contradictory and incomplete (Pokorny, 2010). Due to such reasons the iterative approaches usually are more effective, because they support the requirements refinement in a more constructive way (Kaloyanova, 2012).
2.1 Use Case Modelling
A common form for describing functional requirements for a system is the use case modelling (Maciaszek, 2005). It captures user requirements of a new system by detailing all scenarios that the users will perform. Each use case describes a specific way of using the designed system by actors – users with specific roles, trying to achieve their goals (Sinnig, 2010). The set of all use cases defined by actors describes the system functionality (Cockburn, 2000).
135
Use case modelling usually is recognized as a part of Requirement engineering discipline of the Unified Process (UP) that is focused primarily on the functional requirements of the system (Kruchten, 2004). The non-functional requirements are divided by the UP approach into several categories. The acronym FURPS+ presents the functional and several important non-functional requirements, which are quite relevant to IS development –usability, reliability, performance, and supportability of the system (Larman, 2004).
The use case model describes not only the system behaviour, but it also defines the boundary of the system and how this system communicates with different actors.
Besides, as use case modelling is a part of the UP, starting from the first phase of it - Inception, the use cases capture functionality of the system in an iterative process that is not only understandable for the users, but could also be detailed in the next phases of the UP – Elaboration and Construction.
Use cases are described in natural language. So they can be easily understood by non-technical people and can be further discussed by users, clients, analysts, designers, developers and their managers.
The use cases can be written with different level of details (Larman, 2004): Brief – one-paragraph summary, focused on the
main success scenario; Casual – multiple paragraphs, covered various
scenarios of user-system interaction; Fully dressed – all scenarios are written in detail,
comprising some supporting sections, such as preconditions, post-conditions, special requirements, etc.
The different forms of use cases description can be created during successive iterations, following the UP. In this way, at every step some new information is added to the use case description. The analysis usually starts with a set of use cases in brief format and detail them through the next iterations. In order to do this systematically, the use cases have to be ranked, taking into account their significance, risk, complexity or other criterion of prioritization.
Several questions arise here - how to implement the use case definition method in practice and how to evaluate the quality of use case description in different iterations. The analysts need a technique that supports a stable evolution of the specifications of every element of software functionality, described by the corresponding use case.
A number of works discuss different sides of the use case development – formalization (Sinning, 2009), content (Cockburn, 2000), inspection
techniques (Anda, 2002), etc. Most of the research publications about the use case modelling are summarized in (Torner, 2006). Although the intensive research in the area it is hard to find a method that represents a holistic view on all aspects of the use case transformation.
In this paper we introduce a use case quality model for the description of the functionality, presented at different consecutive iterations of the same use case. Further this quality model can be built into a method allowing not only to assess the achieved use case quality, but to facilitate some decisions, made during the process of quality improvement. We base our approach on the formal Comparative Analysis method (Maneva, 2007). This method was chosen primarily because it shares the main objectives and methods of the broad theory of the Multiple Criteria Decision Making, trying to specify and apply them systematically.
2.2 Comparative Analysis
We will present the essence of the Comparative Analysis (CA) in order to explain how it can be used for the activity under consideration – use case analysis.
Comparative Analysis is a study of the quality content of a set of homogeneous objects and their mutual comparison in order to select the best, to rank them (establishing a preference order) or to classify each object to one of the predefined quality categories.
For CA use we distinguish two main roles: the CA Analyst, responsible for all aspects of CA implementation, and a CA customer – a single person or a group of individuals, tasked with making a decision in a given situation. Depending on the identified problem to be solved at a given moment, a case should be opened to determine the context of the desired Comparative Analysis.
Each case is specified by the following elements:
case={View, Goal, Object, Competitors, Task, Level }
The View describes the CA customer’s role and the perspective from which the CA will be performed.
The Goal expresses the main customer’s intentions in CA accomplishment such as to describe, analyse, estimate, improve, predict or any other, formulated by the Customer, defining the case.
The Object represents the item under consideration. In the field of software engineering any studied object belongs to one of the following groups: products, processes or resources. For each
Fourth International Symposium on Business Modeling and Software Design
136
object for CA application, a quality model should be created – a set of characteristics, selected to represent the quality content in this context, and the relationships among them.
According to the goal, the set C of Competitors, C = {C1, C2, … , Cn} – the instances of the objects to be compared – should be chosen.
The element Task of a case can be Selection (finding the best), Ranking (producing an ordered list), Classification (splitting the competitors to a few preliminary defined quality groups) or any combination of them.
The parameter Level defines the overall complexity of the CA and depends on the importance of the problem under consideration and on the resources needed for CA implementation.
Usually the object quality model is presented as a hierarchy. At the top of the hierarchy is the total object quality. The first level comprises some user-oriented attributes, called factors. The next level describes a number of object-dependent attributes, providing quality. These criteria can be further decomposed to more simple and measurable characteristics. To each node at the hierarchy structure a weight (a coefficient of importance) is assigned, and for the leaves of the hierarchy some appropriate metrics are defined. Starting a bottom-up evaluation of characteristics at each level in the hierarchy and applying a modification of the MECCA (Multi-Element Component Comparison and Analysis) method, described in (Bowen, 1985), we can obtain the quantitative measures of all factors and fill the competitors-factors matrix E(nxm), where n is the number of the competitors, defined in the set C, and m is the number of the quality factors. Each element Ei,j is the measure of the i-th competitor with respect to the j-th quality factor. The obtained matrix E is further used as input to the software tools, implementing the required selection, ranking or classification methods.
Additional details about the CA method can be found in a number of recent publications. In this paper we provide only the information, absolutely necessary for understanding the CA application as a method, supporting decision making.
3 A CONTEXT-ORIENTED USE CASE ANALYSIS
The CA method can be used in any decision making situation within the use case analysis, after specifying its context.
According to the definition already given in
Section 2.2, the concrete situation for a particular decision making can be stated by a case, comprising six elements: case={View, Goal, Object, Competitors, Task, Level} The View describes the CA customer’s role and focuses on the perspective of the Comparative Analysis. Taking into account the responsibilities and typical tasks of the main participants in the use case analysis, the following Customer’s roles have been identified till now: Business Analyst, User, IS developer. Thus a lot of situations can be further specified, reflecting the specific participant’s point of view to the analysed context.
As the Goal expresses the main Customer’s intentions in CA accomplishment and bearing in mind the goal-oriented use case definition and its further improvement, the Analyst should decompose the goal stated for use case analysis to a number of CA-related goals, e.g. to describe, assess, estimate, improve, predict, etc.
The element Object, as it was mentioned above, represents the item under consideration. Particularly for the use case analysis, the following objects, classified in three groups, can be studied:
Products – use case, collection of use cases, use cases source (discussion memos, documentation, specifications, user’s and developer’s stories), prototypes for checking selected use case characteristics, like completeness, usefulness, etc.
Processes, related to use case analysis: elicitation, quality assessment, prioritization, documenting, maintenance, tracking, etc.
Resources, related to use case analysis: technological (e.g. method, technique, tool), or project-oriented (people, team, performance).
For each studied object a quality model should be created – a set of characteristics, selected to represent the quality content, and the relationships among them.
According to the goal, the set C of Competitors – the instances of the objects to be mutually studied and compared – should be chosen. If the Goal is only to create the quality model of the object under consideration, the set C is empty.
There are no special considerations, when we define the element Task of a situation for use case analysis. As usual, the task can be Selection, Ranking, Classification or any combination of them.
It is not difficult to define the degree of complexity (simple, medium or high) presented by the element Level.
One of the challenges in the implementation of the CA is the construction of a model, adequate to the quality content of the object, pointed in a given
An Approach to the Context-oriented Use Case Analysis
137

case. According to the prescriptions, the Analyst is responsible for accomplishment of this task, which is with very high cognitive complexity and usually requires unified efforts of the Analyst and the Customer, ordered the CA.
3.1 A Quality Model for Object “Use Case”
As an example, we will describe the basic hierarchical model, constructed for the quality of object “use case”. In this model we propose three user-oriented characteristics (factors) – Applicability, Validity and Utility.
The factor Applicability concerns the relation between the use case and the real system functionality and addresses the question of the use case legality. Next follows a brief definition of the quality characteristics selected for this factor and the corresponding metrics for the leaves of the tree structure.
The hierarchy obtained after the decomposition of the Applicability factor is shown in Table 1.
The first level of the hierarchy comprises three criteria affecting the factor Applicability - Accuracy, Trackability, and Adequacy.
Table 1: Decomposition of the factor Applicability.
Factor Applicability Criteria Item-Oriented Characteristics
Accuracy Trackability Adequacy Robustness
Completeness Correctness
Accuracy defines how the use case corresponds
to the reality. It shows whether the goal of this use case could be reached by the presented use case description. Accuracy can be measured by the ratio of correct features to the total number of features, described in the use case.
Trackability reflects whether the changes in reality can be accompanied by changes in the use case.
The Adequacy criterion is more complex. It should be evaluated by answering several important questions like: Is the use case robust? Is the use case complete? Are all possible
scenarios defined? Is the use case correct? Is the right sequence of
steps described in the scenarios? In the frame of Adequacy the characteristic
Correctness can be measured by the ratio of correct
steps to the total number of steps, described in the use case. More sophisticated evaluation of the correctness can be done by splitting this characteristic into two more – Compliance and Homogeneity, defined as follows: – Compliance: Does the use case description
follow the proper separation between the positive scenario and other alternative scenarios?
– Homogeneity: Are the descriptions of all scenarios with the same level of details?
The second suggested factor Validity concerns the inner capacity of the use case to produce results corresponding to the expected ones.
Table 2: Decomposition of the factor Validity.
Factor Validity Criteria Item-Oriented Characteristics
Reliability Modifiability Complexity
Modularity Understandability Self-descriptive
Concise Structured
Measurability Table 2 illustrates the proposed hierarchy for this
factor based on the selected quality criteria: Reliability, Modifiability, Understandability and Measurability.
The quality criterion Reliability is evaluated through the answers of two questions: Is the use case adequate? Is the use case robust? The next criterion Modifiability shows how easily the use case can be modified. It is decomposed further in two measurable characteristics: - Complexity – can be considered as textual or algorithmic, measured by the appropriately constructed metrics; - Modularity – usually measured by the number of all alternative scenarios. Nevertheless the quality criterion Understandability is well known concept, for the use case analysis it concerns variety of details, which can be taken into account: Is the use case self-descriptive? Are all steps
clear to follow? Is the use case concise? Is the description of the
steps brief and clear? Is the use case well structured? Do all scenarios
fit each other? Is the main positive scenario properly defined and all alternative scenarios are adequate to it?
Fourth International Symposium on Business Modeling and Software Design
138

The used metrics here reflect the structure – linear (usually for the brief form of the use case) or hierarchical (for the description of the alternative scenarios and their connections to the steps of the main positive scenario).
When we consider the criterion Measurability, it is obligatory to select some concrete metrics for use case assessment like: The number of steps of the successfull scenario; The number of steps, performed by each actor,
involved into the success scenario; The number of system steps, described by the
success scenario; The number of all alternative scenarios; The number of steps of alternative scenarios; The number of steps of the negative alternative
scenarios; The number of all steps, described in the studied
use case; The number of preconditions in the studied use
case. The third factor Utility deals with the relation between use case and users and addresses the question of the possibility to derive conclusions from the created use case. The proposed hierarchy for this factor is shown in Table 3, presenting a number of quality characteristics.
Table 3: Decomposition of the factor Utility.
Factor Utility Criteria Item-Oriented Characteristics Content Fidelity
Constructiveness Stability
Usability Effectiveness
Efficiency User satisfaction
The Content criterion focuses on the text
description. Several questions arise here: What does the use case represent? Is use case detailed enough? Are all steps clear
and described with appropriate level of detail? The criterion Fidelity answers the question if
different users will get similar results using the same use case.
The next criterion - Constructiveness explains how the use case facilitates some future IS-related activities like design, coding, testing, etc.
The criterion Stability explains if the use case can be manipulated to obtain false results or if the new version of the use case corrupts any of the previous versions.
The last considered criterion Usability can be evaluated from three different perspectives: - Effectiveness: Does the use case match the purpose? Are all steps of the main positive scenarios leading to the goal? - Efficiency: Does the use case fulfil the stated goal with minimal resources? Is the sequence of the steps is the shortest way to the goal? - User satisfaction: Can be measured by the percentage of unsatisfied users and the average rating, given by users.
3.2 A Quality Model for Object “A Set of Use Cases”
This object can appear in a situation involving a set U of interconnected use cases, which can be studied as a whole due to some customer’s considerations. For this object a simple linear model can be created, comprising four quality characteristics - Completeness, Consistency, Relevance, and Correctness.
For the purposes of the use case analysis we define their meaning as follows: Completeness – the set U comprises all developed use cases, necessary to described the functionality of a system or a system’s compound element – component, subsystem, etc.; Consistency – all involved in U use cases are in reasonable and logical harmony, without any contradictions in their content; Relevance – all involved in U use cases should possess a direct and clearly identified connection to the studied system’s functionality. For this factor two measures have been applied – Recall and Precision:
Recall measures how exhaustive a description of the scenarios is. It can be calculated by the following formula:
Recall = x / (x+y) * 100%, where - x is the number of described in U relevant
scenarios, - y is the number of the relevant, but not
described yet in U scenarios. Precision measures the amount of noise in
scenarios description, based on the formula: Precision = x / (x+z) * 100%, where - x is the number of described in U relevant
scenarios; - z is the number of described in U, but non-
relevant scenarios. The last quality characteristic – Correctness, is related to some scenarios errors in U, which have
An Approach to the Context-oriented Use Case Analysis
139
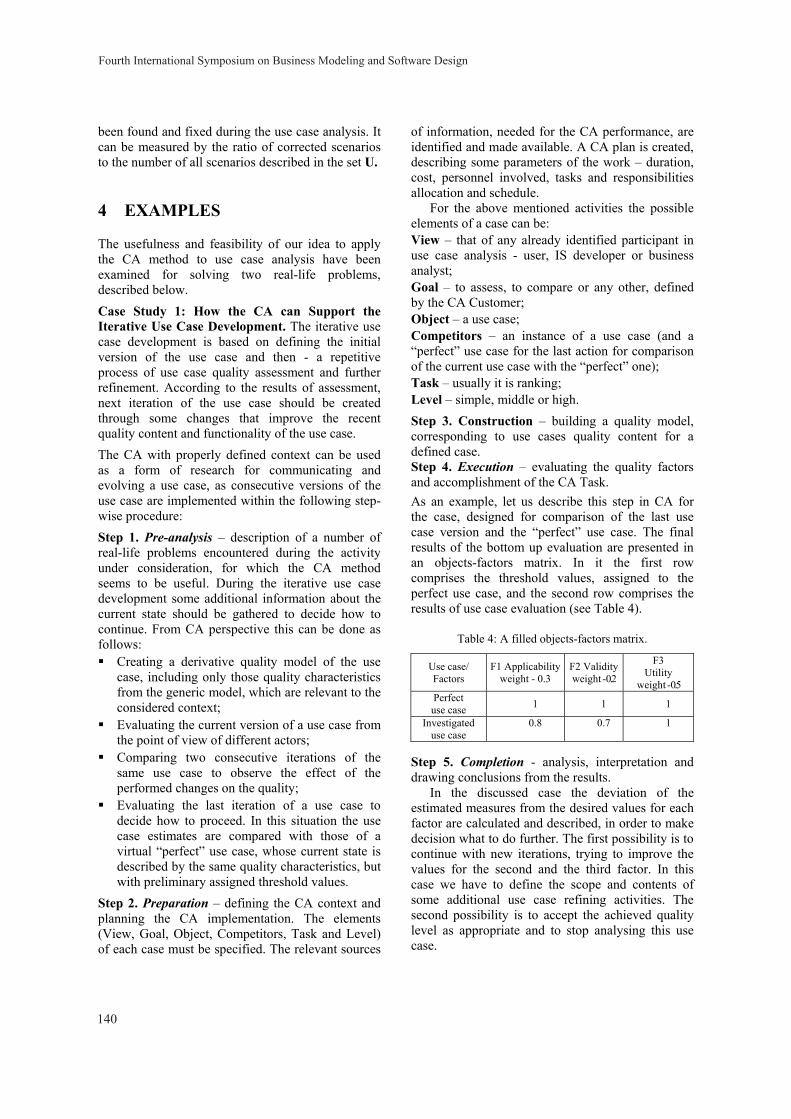
been found and fixed during the use case analysis. It can be measured by the ratio of corrected scenarios to the number of all scenarios described in the set U.
4 EXAMPLES
The usefulness and feasibility of our idea to apply the CA method to use case analysis have been examined for solving two real-life problems, described below. Case Study 1: How the CA can Support the Iterative Use Case Development. The iterative use case development is based on defining the initial version of the use case and then - a repetitive process of use case quality assessment and further refinement. According to the results of assessment, next iteration of the use case should be created through some changes that improve the recent quality content and functionality of the use case. The CA with properly defined context can be used as a form of research for communicating and evolving a use case, as consecutive versions of the use case are implemented within the following step-wise procedure:
Step 1. Pre-analysis – description of a number of real-life problems encountered during the activity under consideration, for which the CA method seems to be useful. During the iterative use case development some additional information about the current state should be gathered to decide how to continue. From CA perspective this can be done as follows: Creating a derivative quality model of the use
case, including only those quality characteristics from the generic model, which are relevant to the considered context;
Evaluating the current version of a use case from the point of view of different actors;
Comparing two consecutive iterations of the same use case to observe the effect of the performed changes on the quality;
Evaluating the last iteration of a use case to decide how to proceed. In this situation the use case estimates are compared with those of a virtual “perfect” use case, whose current state is described by the same quality characteristics, but with preliminary assigned threshold values.
Step 2. Preparation – defining the CA context and planning the CA implementation. The elements (View, Goal, Object, Competitors, Task and Level) of each case must be specified. The relevant sources
of information, needed for the CA performance, are identified and made available. A CA plan is created, describing some parameters of the work – duration, cost, personnel involved, tasks and responsibilities allocation and schedule.
For the above mentioned activities the possible elements of a case can be: View – that of any already identified participant in use case analysis - user, IS developer or business analyst; Goal – to assess, to compare or any other, defined by the CA Customer; Object – a use case; Competitors – an instance of a use case (and a “perfect” use case for the last action for comparison of the current use case with the “perfect” one); Task – usually it is ranking; Level – simple, middle or high.
Step 3. Construction – building a quality model, corresponding to use cases quality content for a defined case. Step 4. Execution – evaluating the quality factors and accomplishment of the CA Task. As an example, let us describe this step in CA for the case, designed for comparison of the last use case version and the “perfect” use case. The final results of the bottom up evaluation are presented in an objects-factors matrix. In it the first row comprises the threshold values, assigned to the perfect use case, and the second row comprises the results of use case evaluation (see Table 4).
Table 4: A filled objects-factors matrix.
Use case/ Factors
F1 Applicability weight - 0.3
F2 Validity weight - 0.2
F3 Utility
weight - 0.5 Perfect use case 1 1 1
Investigated use case
0.8 0.7 1
Step 5. Completion - analysis, interpretation and drawing conclusions from the results.
In the discussed case the deviation of the estimated measures from the desired values for each factor are calculated and described, in order to make decision what to do further. The first possibility is to continue with new iterations, trying to improve the values for the second and the third factor. In this case we have to define the scope and contents of some additional use case refining activities. The second possibility is to accept the achieved quality level as appropriate and to stop analysing this use case.
Fourth International Symposium on Business Modeling and Software Design
140

Case Study 2: How the CA Can Support the Use Case Prioritization. One of the most difficult problems in use case analysis is to create an ordered list of all identified as important use cases. Such prioritization will make possible to perform the use case analysis in a more systematic and efficient way, facilitating the proper distribution of the planned and usually insufficient resources. A Real-life Problem: After the use case quality content assessment is done, it is necessary to assign a priority to each use case in a given set of already developed use cases.
Some cases for this problem can be defined as a combination of the following elements: View – can be that of the User, Business Analyst, Project manager or IS Developer; Goal – to compare the use cases, selected for prioritization; Object – use case; Competitors – all developed use cases, chosen to be prioritized; Task – ranking to produce an ordered list of the compared use cases; Level – simple, middle or high.
5 CONCLUSIONS
The main purpose of this paper is to propose a systematic approach to the creation and continuous improvement of use cases, based on the Comparative Analysis method. It supports the decision making in some significant situations for the use case analysis.
The basic advantage of the CA is the possibility for adjustment to the context, specified by the elements of the investigated case. The most difficult activity – object quality modelling – has been described and illustrated with models for two basic objects – use case and a set of use cases. As example, three CA successful implementations in the field of use case analysis have been given.
Some possible directions for future work can be: To identify and describe entirely some other CA
situations within the use case analysis, so as to enrich the collection of the re-used items – situations, models, metrics, etc.;
To examine the possibility to apply the CA to other use case related activities as validating, tracking, change management, design and implementation of already defined use cases.
ACKNOWLEDGEMENTS
This work is partly supported by the National Scientific Research Fund under the Contract ДТК 02-69/2009 and partially supported by Sofia University “St. Kl. Ohridski” SRF/2014 under the Contract “Successful Practices for Information Systems Analysis and Design”.
REFERENCES
Anda, B., D. Sjøberg, 2002. Towards an Inspection Technique for Use Case Models, In Proceedings of the 14th Int. Conf. on Software Engineering and Knowledge Engineering, pp. 127-134.
Bowen, T., G.B. Wigle, J. Tsai, 1985. Specification of software quality attributes, Software quality evaluation guidebook, RADC-TR-85-37, vol.III.
Cockburn, A., 2000. Writing Effective Use Cases, Addison-Wesley.
Denny, R., 2005. Succeeding with Use Cases: Working Smart to Deliver Quality, Addison Wesley.
Kaloyanova, K., 2012. Design from Data: How To Use Requirements for Better IS Analysis and Design, Proceedings of the Int. Conference Informatics in Scientific Knowledge, pp. 189-197.
Kruchten, P., 2004. The Rational Unified Process: An Introduction, Pearson Education.
Larman, G., 2004. Applying UML and Patterns: An Introduction to Object-Oriented analysis and Design and Iterative Development, 3rd Edition, Prentice Hall.
Maciaszek, L., 2005. Requirements Analysis and System Design, Addison-Wesley Longman, Inc.
Maneva, N., 2007. Comparative Analysis: A Feasible Software Engineering Method, Serdica J. of Computing, 1(1), pp. 1-12.
Pokorny, J. at all, 2010. Information Systems Development: Business Systems and Services: Modelling and Development, Springer.
Pressman, R., 2009. Software Engineering: A Practitioner's Approach, 7th Edition, McGraw-Hill.
Sinnig, D., P. Chalin., F Khendek, 2009, LTS Semantics for Use Case Models, In Proceedings of the 2009 ACM symposium on Applied Computing, pp. 365-370.
Sinnig, D., H. Javahery, 2010. Mastering Use Cases: Capturing Functional Requirements for Interactive Applications, In Proceedings of the 2nd ACM SIGCHI symposium on Engineering interactive computing systems, pp. 373-374.
Sommerville, I., 2011. Software Engineering, 9th Edition, Addison Wesley.
Tornew, F., M. Ivarsson, F. Pettersson, P. Ohman, 2006. Defect in automotive use cases, In Proc. of 2006 ACM/IEEE international symposium on Empirical software engineering, pp.115-123.
An Approach to the Context-oriented Use Case Analysis
141
Validating Value Network Business Models by Ontologies
José Granjo1, Marzieh Bakhshandeh1,2, João Pombinho1, Miguel Mira da Silva1 and Artur Caetano1,2 1Instituto Superior Técnico, Universidade de Lisboa, Av. Rovisco Pais 1, 1049-001 Lisbon, Portugal
2Information Systems Group, INESC-ID,Rua Alves Redol 9, 1000-029 Lisboa, Portugal {jose.granjo, marzieh.bakhshandeh, jpmp, mms, artur.caetano}@tecnico.ulisboa.pt
Keywords: Business Model Canvas, e3value, ArchiMate, Ontology Integration, Meta-model, OWL, SPARQL.
Abstract: Different meta-models allow modeling the business of an organization from different perspectives. The Business Model Canvas focus is close to the strategy of the organization. E3value allows modeling of value networks and ArchiMate allows alignment from business models to IT infrastructure. When models of these three meta-models coexist for a certain value network, they must be consistent. Currently, there is no way to validate such consistency automatically. We propose a solution, using ontologies and ontology mapping techniques (OWL, OWL.DL, SPARQL) that helps to validate instantiated models automatically, based on a set of mapping rules between the three meta-models. In this work, the mappings between Business Model Canvas, e3value and ArchiMate are identified and formalized through ontologies. The formalized mapping is then applied to a case study and exploited, together with reasoning techniques.
1 INTRODUCTION
Innovative business models challenge the traditionally established ways of generating value, resulting in advantage to a company. We have seen, over time, that innovative business models can dare the subsistence of other established companies or even create complete new markets.
Having a shared understanding of what is the business model of a company, by representing it, eliminates possible interpretation ambiguities.
The Business Model Canvas (BMC) (Osterwalder & Pigneur, 2010) is a tool for representing the business model of a company. When a company is executing its business, it is part of a network of companies that exchange value with the final goal of delivering value to customers. e3value (Gordijn & Akkermans, 2003) allows modeling of value networks: the value exchanges between actors in the network.
BMC allows representing the business model of an organization on a higher-level (or strategic) perspective. e3value is closer to operationalization of business, by showing value transactions of the value network. On a lower-level, business processes can be modeled with ArchiMate (The Open Group, 2012), a service-oriented enterprise architecture modeling language, which considers three different layers: business, application and technology.
Toghether, these three meta-models allow the alignment from business models to information technology and infrastructure.
When modeling the business of an organization and its value network, several of these models can be instantiated. If theys coexist for a value network, they must be consistent and there is no way to automatically validate such consistency between model components. We aim to analyze the possibility to perform this validation between models by using ontologies. An ontology is a formal, explicit specification of a shared conceptualization (Gruber & others, 1993). Such search for inconsistencies helps business to IT alignment.
In section 2, the research proposal is presented, and next, in section 3, we reference each meta-model. Afterwards (section 4), the mapping rules between the three meta-models are presented. In section 5, a validation has been done with an example case study. Finally, conclusions and future work are discussed.
2 RESEARCH PROPOSAL
As depicted in figure 1, a validation method for models of BMC, e3value and ArchiMate is proposed, based on a set of mapping rules between
142
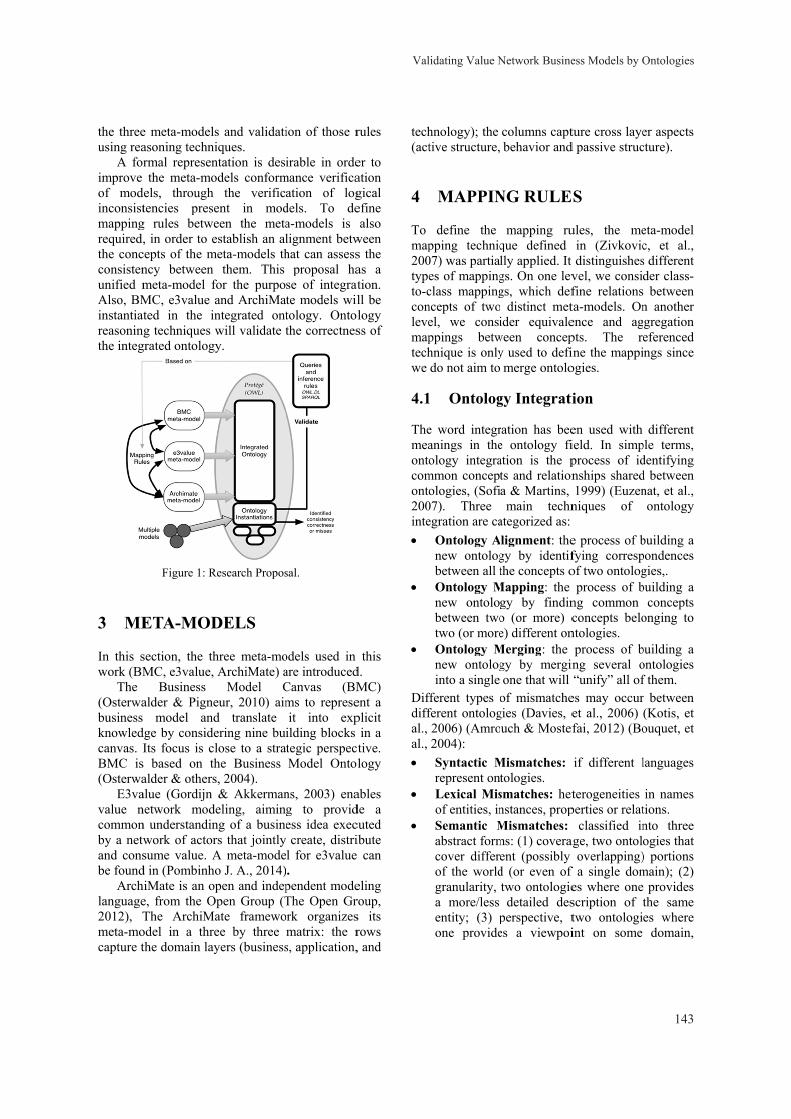
the threeusing rea
A foimprove of modinconsistmappingrequired,the concconsistenunified mAlso, BMinstantiareasoninthe integ
3 ME
In this swork (BM
The (Osterwabusinessknowledcanvas. IBMC is(Osterwa
E3vavalue ncommonby a netwand consbe found
Archlanguage2012), Tmeta-mocapture t
e meta-modelasoning technirmal representhe meta-mo
dels, through tencies prese
g rules betwe, in order to e
cepts of the mncy between meta-model fMC, e3value ated in the inng techniques grated ontolog
ETA-MOD
section, the thMC, e3value,
Business alder & Pigne model and
dge by consideIts focus is c
s based on thalder & othersalue (Gordijn network modn understandinwork of actorsume value. Ad in (PombinhhiMate is an oe, from the OThe ArchiM
odel in a threthe domain lay
Figure 1: R
s and validatiiques. ntation is desiodels conform
the verificent in modeen the metaestablish an al
meta-models ththem. This
for the purpoand ArchiMantegrated ontwill validate t
gy.
DELS
hree meta-moArchiMate) a
Model Ceur, 2010) aimd translate ering nine builose to a strahe Business s, 2004). & Akkerman
deling, aiminng of a businers that jointlyA meta-modeo J. A., 2014)
open and indepOpen Group (T
ate framewoee by three yers (business
Research Propos
ion of those r
irable in ordemance verificaation of logdels. To dea-models is lignment betwhat can assess
proposal hase of integratte models wiltology. Ontolthe correctnes
odels used in are introducedCanvas (BMms to represeit into expilding blocks tegic perspectModel Ontol
ns, 2003) enag to providess idea execcreate, distri
l for e3value . pendent modeThe Open Gr
ork organizesmatrix: the rs, application,
sal.
rules
er to ation gical efine also
ween s the as a tion. ll be logy ss of
this d. MC) ent a plicit in a tive. logy
ables de a cuted ibute can
eling roup, s its rows , and
tech(act
4
To map200typeto-cconlevemaptechwe
4.1
Themeaontocomonto200inte•
•
•
Difdiffal., al., •
•
•
hnology); the tive structure,
MAPPIN
define the pping techniq07) was partiales of mappingclass mappingncepts of twoel, we consippings betwhnique is onlydo not aim to
1 Ontolog
e word integranings in theology integra
mmon conceptologies, (Sofi
07). Three egration are ca
Ontology Anew ontologbetween all tOntology Mnew ontologbetween twotwo (or moreOntology Mnew ontologinto a single
fferent types oferent ontolog2006) (Amro2004): Syntactic Mrepresent ontLexical Misof entities, inSemantic Mabstract formcover differeof the worldgranularity,a more/less entity; (3) pone provide
columns captbehavior and
NG RULE
mapping ruque defined lly applied. It gs. On one levgs, which def distinct metider equivale
ween concepy used to defimerge ontolo
gy Integrati
ration has beee ontology fiation is the pts and relationa & Martins, main techn
ategorized as: lignment: thegy by identifthe concepts o
Mapping: the gy by findino (or more) ce) different on
Merging: the gy by merginone that will
of mismatchegies (Davies, euch & Mostef
Mismatches: tologies. smatches: hetnstances, propMismatches: ms: (1) coveraent (possibly d (or even of two ontologiedetailed des
perspective, tes a viewpoi
ture cross layed passive struc
ES
ules, the mein (Zivkovic
t distinguishesvel, we considfine relationsta-models. Onence and agpts. The reine the mappiogies.
ion
en used with ield. In simpprocess of idnships shared1999) (Euzen
niques of
e process of bfying correspof two ontolog
process of bng common concepts belo
ntologies. process of b
ing several o“unify” all of
es may occuret al., 2006) fai, 2012) (Bo
if different l
terogeneities perties or relat
classified inage, two ontolo
overlapping)f a single domes where onescription of ttwo ontologiint on some
er aspects cture).
eta-model c, et al., s different der class-
between n another gregation eferenced ngs since
different ple terms, dentifying d between nat, et al., ontology
building a pondences gies,. building a
concepts onging to
building a ontologies f them. r between (Kotis, et ouquet, et
languages
in names tions. nto three ogies that ) portions main); (2)
provides the same es where
domain,
Validating Value Network Business Models by Ontologies
143

which is different from the viewpoint adopted in another ontology.
For mapping BMC, e3value and ArchiMate, there were two kinds of mismatches: lexical mismatch, where the same entity is represented by two different names, such as, Customer Segments and Business Actor; and coverage mismatch, where from the same point of view, in the same context and with comparable vocabulary, part of the domain that is described differs and there are only overlapping parts (Value Proposition and Goal). Most ontology mapping approaches focus on automating the discovery of a mappings. This case, requires an exact mapping, so the mappings were done manually using (Zivkovic, et al., 2007).
4.2 Mapping BMC to e3value
Previous work (Gordijn, et al., 2005) shows connections between concepts of BMC and e3value to understand similarities and differences between both ontologies to possibly integrate them in order to improve representation, design and analysis of business models. The defined mapping rules (table 1) are inspired on previous work.
4.3 Mapping BMC to ArchiMate
Another work (Meertens, et al., 2012) explored the connection between BMC an ArchiMate, where the concepts of BMC were successfully mapped to e3value. The defined mapping rules (table 2) are inspired on previous work. We do not consider any
mapping between Customer Relationships (CR) and Business Collaboration because CR refers to the types of relationships an organization maintains with its customers. Key Partners is only a list of partners, so the mapping is simplified to Business Actor. Cost Structure is not mapped to Value because it is only the cost of performing Key Activities and maintaining Key Resources.
4.4 Mapping e3value to ArchiMate
Direct transformation from e3value to ArchiMate is inhibited by different levels of abstraction between the economic transactions modeled in e3value and ArchiMate (de Kinderen, et al., 2012). The same authors use DEMO (Dietz, 2006) as a bridge for the different levels of abstraction of e3value and ArchiMate (de Kinderen, et al., 2012). Another work (Pombinho J. A., 2014) defines the mapping between e3value and DEMO in a more grounded, formal and thorough way. Namely, it specifies a detailed mapping based on the coordination acts and facts of the transactional pattern and the corresponding competences by the value actors. Additionally, the authors define a Value-oriented Solution Development Process in (Pombinho, 2013) that specifies a process for incrementally developing value networks by alternating coherent value and construction models. Table 3 shows the defined mapping rules.
Table 1: BMC-e3value meta-model concepts mapping.
BMC concept E3value concept Mapping rationale
Customer Segment
Actor Equivalence. The Customer Segments are groups of people that a company aims to reach, while Actor is an independent economic entity that generates profit or increases its utility. (1:1)
Market Segment Analogous to Actor. Market Segment is a specialization of Actor.
Key Partner Actor Equivalence. Key Partners is the group of partners that help the businesses execution. Analogous mapping to Customer Segment. (1:1)
Channel Value Transmission Aggregation. A value transmission can be the delivery of value to customers through a certain channel. (many:1)
Key Activity Value Activity
Equivalence. Key Activities are the most important things a company must do to make its business model work, while an actor performs a Value Activity for profit or to increase its utility. (1:many)
Value Transmission Aggregation. A Key Activity can involve a value exchange (to obtain a needed resource) with a Key Partner. (many:1)
Key Resources Value Object Equivalence. A Key Resource acquired from a Key Partner. (1:1) Revenue Stream Value Transmission Equivalence to inbound and monetary value exchange. (1:1)
Value Proposition Value Interface
Equivalence. A value interface defines the group of value objects the company is willing to provide. Those value objects are also defined in the outbound value ports belonging to the value interface. (1:1)
Actor Actor Equivalence. The Actor concept is the owner of a BMC. (1:1)
Fourth International Symposium on Business Modeling and Software Design
144
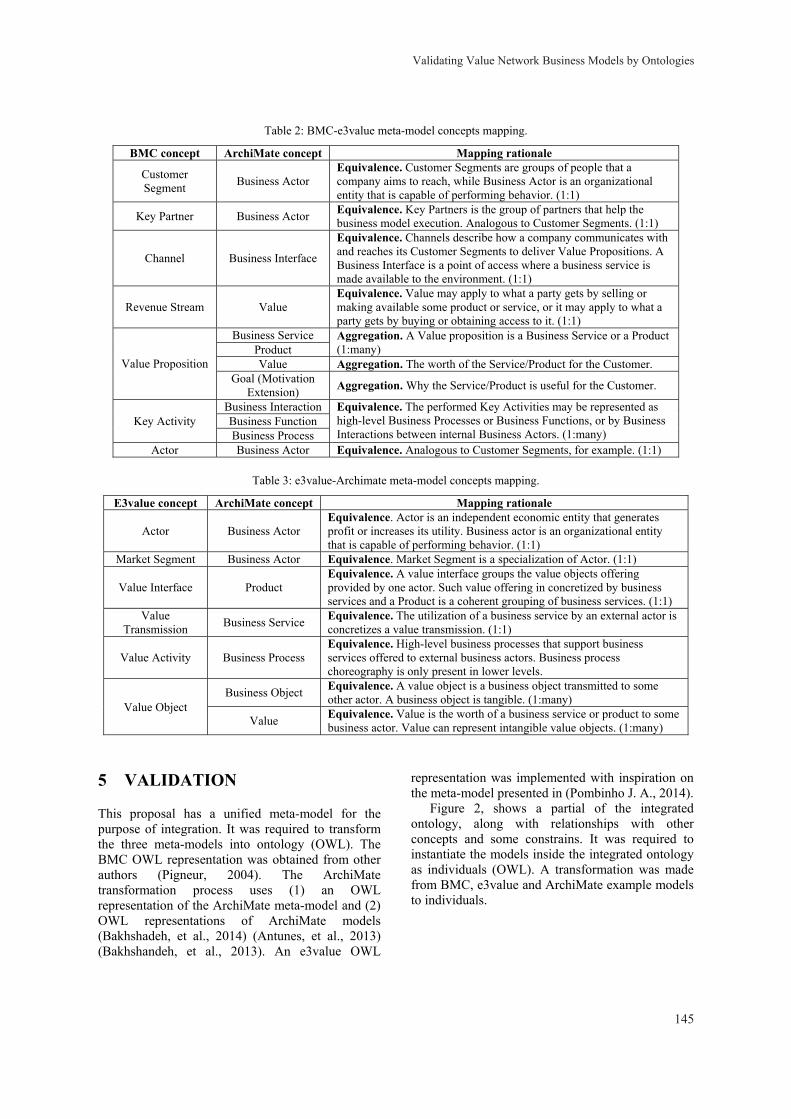
Table 2: BMC-e3value meta-model concepts mapping.
BMC concept ArchiMate concept Mapping rationale
Customer Segment Business Actor
Equivalence. Customer Segments are groups of people that a company aims to reach, while Business Actor is an organizational entity that is capable of performing behavior. (1:1)
Key Partner Business Actor Equivalence. Key Partners is the group of partners that help the business model execution. Analogous to Customer Segments. (1:1)
Channel Business Interface
Equivalence. Channels describe how a company communicates with and reaches its Customer Segments to deliver Value Propositions. A Business Interface is a point of access where a business service is made available to the environment. (1:1)
Revenue Stream Value Equivalence. Value may apply to what a party gets by selling or making available some product or service, or it may apply to what a party gets by buying or obtaining access to it. (1:1)
Value Proposition
Business Service Aggregation. A Value proposition is a Business Service or a Product (1:many) Product
Value Aggregation. The worth of the Service/Product for the Customer. Goal (Motivation
Extension) Aggregation. Why the Service/Product is useful for the Customer.
Key Activity Business Interaction Equivalence. The performed Key Activities may be represented as
high-level Business Processes or Business Functions, or by Business Interactions between internal Business Actors. (1:many)
Business Function Business Process
Actor Business Actor Equivalence. Analogous to Customer Segments, for example. (1:1)
Table 3: e3value-Archimate meta-model concepts mapping.
E3value concept ArchiMate concept Mapping rationale
Actor Business Actor Equivalence. Actor is an independent economic entity that generates profit or increases its utility. Business actor is an organizational entity that is capable of performing behavior. (1:1)
Market Segment Business Actor Equivalence. Market Segment is a specialization of Actor. (1:1)
Value Interface Product Equivalence. A value interface groups the value objects offering provided by one actor. Such value offering in concretized by business services and a Product is a coherent grouping of business services. (1:1)
Value Transmission Business Service Equivalence. The utilization of a business service by an external actor is
concretizes a value transmission. (1:1)
Value Activity Business Process Equivalence. High-level business processes that support business services offered to external business actors. Business process choreography is only present in lower levels.
Value Object Business Object Equivalence. A value object is a business object transmitted to some
other actor. A business object is tangible. (1:many)
Value Equivalence. Value is the worth of a business service or product to some business actor. Value can represent intangible value objects. (1:many)
5 VALIDATION
This proposal has a unified meta-model for the purpose of integration. It was required to transform the three meta-models into ontology (OWL). The BMC OWL representation was obtained from other authors (Pigneur, 2004). The ArchiMate transformation process uses (1) an OWL representation of the ArchiMate meta-model and (2) OWL representations of ArchiMate models (Bakhshadeh, et al., 2014) (Antunes, et al., 2013) (Bakhshandeh, et al., 2013). An e3value OWL
representation was implemented with inspiration on the meta-model presented in (Pombinho J. A., 2014).
Figure 2, shows a partial of the integrated ontology, along with relationships with other concepts and some constrains. It was required to instantiate the models inside the integrated ontology as individuals (OWL). A transformation was made from BMC, e3value and ArchiMate example models to individuals.
Validating Value Network Business Models by Ontologies
145
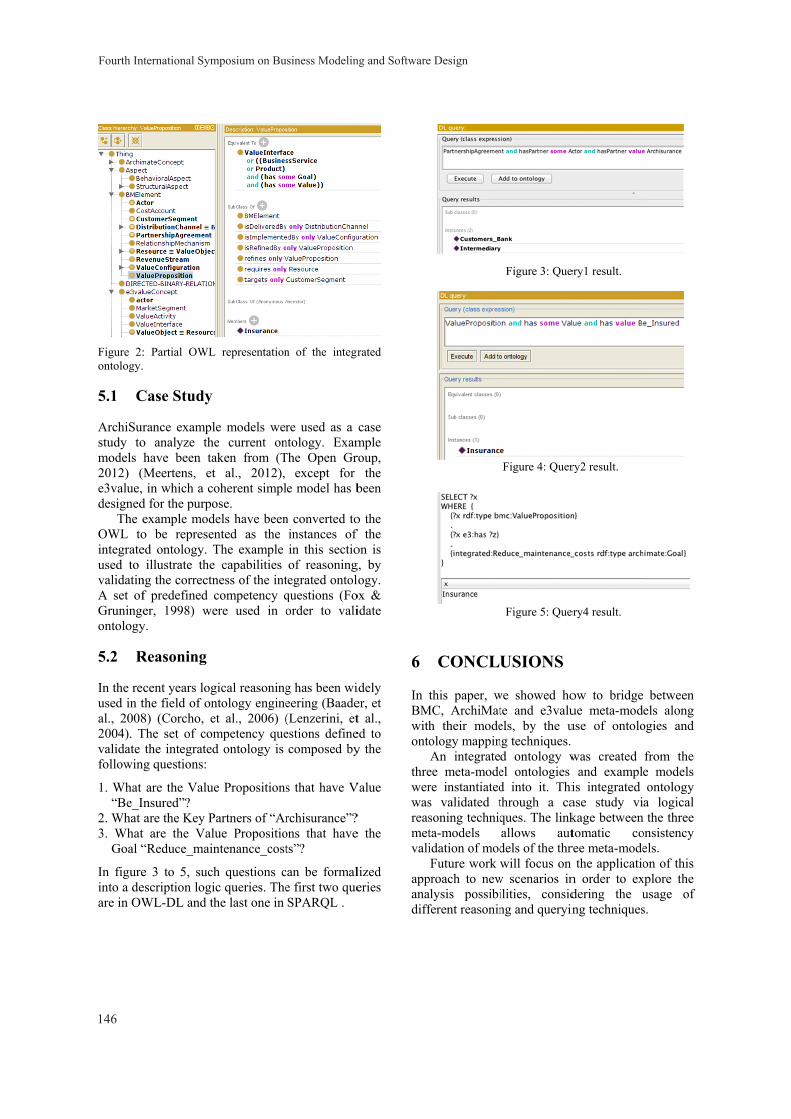
Figure 2:ontology.
5.1 C
ArchiSurstudy tomodels 2012) (e3value, designed
The eOWL tointegrateused to validatinA set ofGruningeontology
5.2 R
In the reused in tal., 20082004). Tvalidate followin
1. What “Be_I
2. What 3. What
Goal “
In figureinto a deare in OW
: Partial OWL
Case Study
rance examplo analyze thehave been taMeertens, etin which a co
d for the purpoexample modo be represened ontology. T
illustrate theng the correctnf predefined cer, 1998) we
y.
Reasoning
cent years logthe field of on8) (Corcho, eThe set of com
the integratedng questions:
are the Valuensured”? are the Key P
t are the Val“Reduce_main
e 3 to 5, suchescription logiWL-DL and th
L representation
le models were current onaken from (Tt al., 2012), oherent simplose. dels have beennted as the The example
e capabilities ness of the intcompetency qere used in o
gical reasoningntology engineet al., 2006) (mpetency qued ontology is
e Propositions
Partners of “Arue Propositiontenance_cost
h questions cic queries. Thehe last one in
n of the integr
re used as a ntology. ExamThe Open Gr
except for le model has b
n converted toinstances of in this sectioof reasoning
tegrated ontolquestions (Foorder to vali
g has been wieering (Baade(Lenzerini, etestions definecomposed by
s that have V
rchisurance”?ons that havets”?
can be formale first two queSPARQL .
rated
case mple roup,
the been
o the f the on is g, by logy. ox & idate
idely er, et t al., ed to y the
Value
? e the
lized eries
6
In BMwithonto
threwerwasreasmetvali
appanadiff
CONCLU
this paper, wMC, ArchiMat
h their modeology mappinAn integrate
ee meta-modere instantiateds validated tsoning techniqta-models idation of modFuture work
proach to newalysis possibiferent reasonin
USIONS
we showed hote and e3valuels, by the ung techniques. d ontology wel ontologies d into it. Thithrough a caques. The linkallows autdels of the thrwill focus on
w scenarios inilities, considng and queryin
Figure 3: Que
Figure 4: Quer
Figure 5: Que
ow to bridge ue meta-moduse of ontolo was created
and exampleis integrated ase study vikage between tomatic coree meta-mode the application order to exdering the ung techniques
ery1 result.
ry2 result.
ery4 result.
between els along
ogies and
from the e models ontology
a logical the three
onsistency els. on of this
xplore the usage of s.
Fourth International Symposium on Business Modeling and Software Design
146

ACKNOWLEDGEMENTS
This project is partially supported by the European Commission under the 7th Framework Programme (FP7/2007-2013) under grant agreement 269940, TIMBUS project (http://timbusproject.net). Also, by national funds through FCT – Fundação para a Ciência e a Tecnologia, under project PEst-OE/EEI/LA0021/2013.
REFERENCES
Amrouch, S. & Mostefai, S., 2012. Survey on the literature of ontology mapping, alignment and merging. s.l., s.n., pp. 1-5.
Antunes, G. et al., 2013. Using ontologies for enterprise architecture model alignment. s.l., s.n.
Baader, F., Horrocks, I. & Sattler, U., 2008. Description logics. Foundations of Artificial Intelligence, Volume 3, pp. 135-179.
Bakhshadeh, M., Morais, A., Caetano, A. & Borbinha, J., 2014. Ontology Transformation of Enterprise Architecture Models. In: Technological Innovation for Collective Awareness Systems. s.l.:Springer, pp. 55-62.
Bakhshandeh, M. et al., 2013. A Modular Ontology for the Enterprise Architecture Domain. s.l., s.n., pp. 5-12.
Bouquet, P. et al., 2004. D2. 2.1 Specification of a common framework for characterizing alignment.
Corcho, O., Fernández-López, M. & Gómez-Pérez, A., 2006. Ontological engineering: principles, methods, tools and languages. In: Ontologies for software engineering and software technology. s.l.:Springer, pp. 1-48.
Davies, J., Studer, R. & Warren, P., 2006. Semantic Web technologies: trends and research in ontology-based systems. s.l.:Wiley. com.
de Kinderen, S., Gaaloul, K. & Proper, H. A., 2012. Bridging value modelling to ArchiMate via transaction modelling. Software & Systems Modeling, pp. 1-15.
de Kinderen, S., Gaaloul, K. & Proper, H. E., 2012. Integrating value modelling into archimate. In: Exploring Services Science. s.l.:Springer, pp. 125-139.
Dietz, J. L. G., 2006. Enterprise Ontology: Theory and Methodology. s.l.:Springer.
Euzenat, J., Euzenat, J., Shvaiko, P. & others, 2007. Ontology matching. s.l.:Springer.
Fox, M. S. & Gruninger, M., 1998. Enterprise modeling. AI magazine, 19(3), p. 109.
Gordijn, J. & Akkermans, J., 2003. Value-based requirements engineering: exploring innovative e-commerce ideas. Requirements engineering, 8(2), pp. 114-134.
Gordijn, J., Osterwalder, A. & Pigneur, Y., 2005. Comparing two business model ontologies for designing e-business models and value constellations. Proceedings of the 18th Bled eConference, Bled, Slovenia, pp. 6-8.
Gruber, T. R. & others, 1993. A translation approach to portable ontology specifications. Knowledge acquisition, 5(2), pp. 199-220.
Kotis, K., Vouros, G. A. & Stergiou, K., 2006. Towards automatic merging of domain ontologies: The HCONE-merge approach. Web Semantics: Science, Services and Agents on the World Wide Web, 4(1), pp. 60-79.
Lenzerini, M., Milano, D. & Poggi, A., 2004. Ontology representation & reasoning. Universit di Roma La Sapienza, Roma, Italy, Tech. Rep. NoE InterOp (IST-508011).
Meertens, L. O. et al., 2012. Mapping the business model canvas to ArchiMate. s.l., s.n., pp. 1694-1701.
Osterwalder, A. & others, 2004. The business model ontology: A proposition in a design science approach. Institut d'Informatique et Organisation. Lausanne, Switzerland, University of Lausanne, Ecole des Hautes Etudes Commerciales HEC, Volume 173.
Osterwalder, A. & Pigneur, Y., 2010. Business model generation: a handbook for visionaries, game changers, and challengers. s.l.:John Wiley & Sons.
Pigneur, Y., 2004. Modeling the business model ontology with Protégé and OWL, s.l.: s.n.
Pombinho, J. A. D., T. J., 2013. Value-oriented Solution Development Process - uncovering the rationale behind organization components.. s.l., s.n.
Pombinho, J. A. D., T. J., 2014. Linking Value Chains – Combining e3Value and DEMO for specifying Value Networks. s.l., s.n.
Sofia, A. G.-P. P. H. & Martins, J. P., 1999. Some issues on ontology integration. s.l., s.n.
The Open Group, 2012. ArchiMate 2.0 Specification. s.l.:s.n.
Zivkovic, S., Kuhn, H. & Karagiannis, D., 2007. Facilitate Modelling Using Method Integration: An Approach Using Mappings and Integration Rules. s.l., s.n., pp. 2038-2049.
Validating Value Network Business Models by Ontologies
147
Actors Based Competences Supporting Enterprise Modeling Changes
Marwen Jabloun, Yemna Sayeb and Henda Ben Ghezala Riadi–GDL Laboratory, Manouba University, Manouba, Tunis, Tunisia
[email protected], [email protected], [email protected]
Khaled Gaaloul Public Research Centre Henri Tudor, Luxembourg
Keywords: Enterprise Architecture, Actor, Competency, Performance, Ontology.
Abstract: The competitive environment of companies triggers changes having impacts on the enterprise information system. In this context, Enterprise Architecture (EA) offers instruments to steer enterprises changes and to ensure cohesion and alignment between the different aspects of an enterprise. Despite considerable numbers of EA frameworks, there are not many giving importance to actors competencies supporting EA changes when modeling. In this paper, we present an approach based on competencies to support enterprises’ changes. In doing so, we introduce a performance assessment method from the process modeling to the competence selection using a competence-oriented ontology. Moreover, we develop a prototype as an evaluation part of our work illustrated by a case study supporting EA decision making.
1 INTRODUCTION
The growing importance of alignment, compliance and manageability issues have increased the attention to EA (Braun et al., 2005). EA promises to better align technical projects with business needs, where business values could best be realized by a holistic approach to systems architecture that explicitly looked at every important issue from every important perspective (Zachman, 1987).
EA presents methodology for guiding changes. Those changes can impact different levels of the enterprise. This needs an approach steering EA changes. More specifically, the organizational aspect is more and more considered where actors, roles and competencies have a fundamental contribution in the success or the failure of desired changes (Gagnon, 2008). Enterprise performance depends on the alignment of the corporate strategy and business process. The performance of business process depends on the involved actors. These actors have skills to achieve their tasks using relevant IT systems (CIGREF, 2008). Hence, any EA change should take into account actor’s competencies to assess its performance. The importance of actor and competency concept is clearly shown in enterprise
models while ignoring change issues (Le Boulaire et al., 2008).
In this paper, we aim to focus on competencies management supporting EA change. Our approach is based, firstly, on a BPEL (business process execution language) process that optimizes EA change scenarios. The BPEL process ensures the orchestration of services using business rules from our performance assessment method. The performance assessment integrates, then, a competence-oriented ontology to ensure capturing relevant information for actors’ performance (e.g., skills, training, etc.). Finally, we develop a prototype as an evaluation part of our work illustrated by a case study supporting EA decision making.
The remainder of this paper is structured as follows. Section 2 introduces the research context and problem statements. The approach is presented in section 3, where we explain our methodology to monitor process execution based a competence-oriented ontology. Section 4 evaluates our work illustrated by a real world scenario. Section 5 concludes and discusses future works.
148
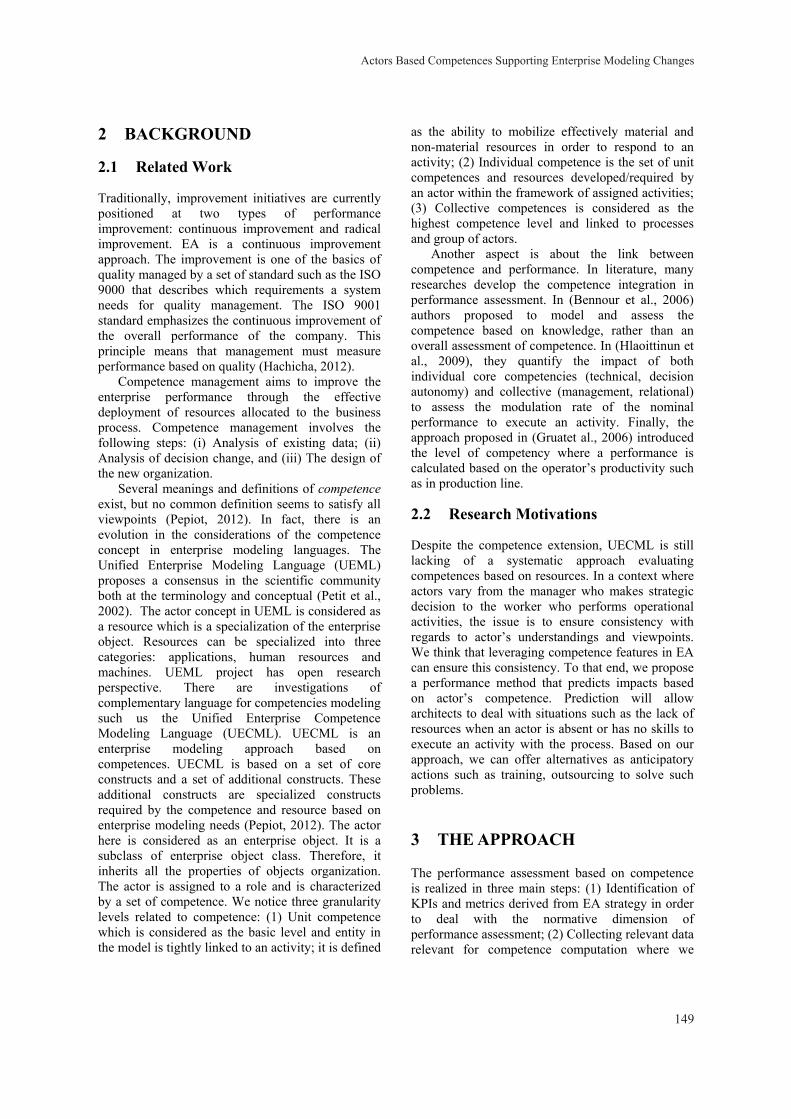
2 BACKGROUND
2.1 Related Work
Traditionally, improvement initiatives are currently positioned at two types of performance improvement: continuous improvement and radical improvement. EA is a continuous improvement approach. The improvement is one of the basics of quality managed by a set of standard such as the ISO 9000 that describes which requirements a system needs for quality management. The ISO 9001 standard emphasizes the continuous improvement of the overall performance of the company. This principle means that management must measure performance based on quality (Hachicha, 2012).
Competence management aims to improve the enterprise performance through the effective deployment of resources allocated to the business process. Competence management involves the following steps: (i) Analysis of existing data; (ii) Analysis of decision change, and (iii) The design of the new organization.
Several meanings and definitions of competence exist, but no common definition seems to satisfy all viewpoints (Pepiot, 2012). In fact, there is an evolution in the considerations of the competence concept in enterprise modeling languages. The Unified Enterprise Modeling Language (UEML) proposes a consensus in the scientific community both at the terminology and conceptual (Petit et al., 2002). The actor concept in UEML is considered as a resource which is a specialization of the enterprise object. Resources can be specialized into three categories: applications, human resources and machines. UEML project has open research perspective. There are investigations of complementary language for competencies modeling such us the Unified Enterprise Competence Modeling Language (UECML). UECML is an enterprise modeling approach based on competences. UECML is based on a set of core constructs and a set of additional constructs. These additional constructs are specialized constructs required by the competence and resource based on enterprise modeling needs (Pepiot, 2012). The actor here is considered as an enterprise object. It is a subclass of enterprise object class. Therefore, it inherits all the properties of objects organization. The actor is assigned to a role and is characterized by a set of competence. We notice three granularity levels related to competence: (1) Unit competence which is considered as the basic level and entity in the model is tightly linked to an activity; it is defined
as the ability to mobilize effectively material and non-material resources in order to respond to an activity; (2) Individual competence is the set of unit competences and resources developed/required by an actor within the framework of assigned activities; (3) Collective competences is considered as the highest competence level and linked to processes and group of actors.
Another aspect is about the link between competence and performance. In literature, many researches develop the competence integration in performance assessment. In (Bennour et al., 2006) authors proposed to model and assess the competence based on knowledge, rather than an overall assessment of competence. In (Hlaoittinun et al., 2009), they quantify the impact of both individual core competencies (technical, decision autonomy) and collective (management, relational) to assess the modulation rate of the nominal performance to execute an activity. Finally, the approach proposed in (Gruatet al., 2006) introduced the level of competency where a performance is calculated based on the operator’s productivity such as in production line.
2.2 Research Motivations
Despite the competence extension, UECML is still lacking of a systematic approach evaluating competences based on resources. In a context where actors vary from the manager who makes strategic decision to the worker who performs operational activities, the issue is to ensure consistency with regards to actor’s understandings and viewpoints. We think that leveraging competence features in EA can ensure this consistency. To that end, we propose a performance method that predicts impacts based on actor’s competence. Prediction will allow architects to deal with situations such as the lack of resources when an actor is absent or has no skills to execute an activity with the process. Based on our approach, we can offer alternatives as anticipatory actions such as training, outsourcing to solve such problems.
3 THE APPROACH
The performance assessment based on competence is realized in three main steps: (1) Identification of KPIs and metrics derived from EA strategy in order to deal with the normative dimension of performance assessment; (2) Collecting relevant data relevant for competence computation where we
Actors Based Competences Supporting Enterprise Modeling Changes
149
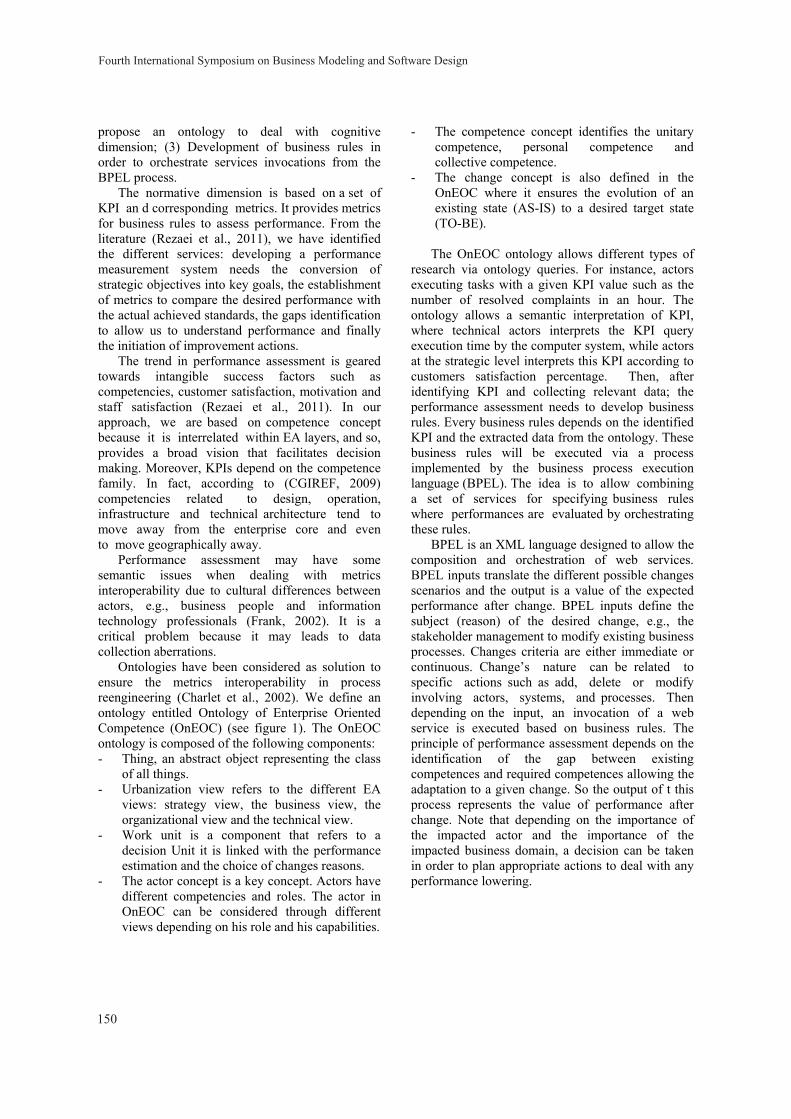
propose an ontology to deal with cognitive dimension; (3) Development of business rules in order to orchestrate services invocations from the BPEL process.
The normative dimension is based on a set of KPI an d corresponding metrics. It provides metrics for business rules to assess performance. From the literature (Rezaei et al., 2011), we have identified the different services: developing a performance measurement system needs the conversion of strategic objectives into key goals, the establishment of metrics to compare the desired performance with the actual achieved standards, the gaps identification to allow us to understand performance and finally the initiation of improvement actions.
The trend in performance assessment is geared towards intangible success factors such as competencies, customer satisfaction, motivation and staff satisfaction (Rezaei et al., 2011). In our approach, we are based on competence concept because it is interrelated within EA layers, and so, provides a broad vision that facilitates decision making. Moreover, KPIs depend on the competence family. In fact, according to (CGIREF, 2009) competencies related to design, operation, infrastructure and technical architecture tend to move away from the enterprise core and even to move geographically away.
Performance assessment may have some semantic issues when dealing with metrics interoperability due to cultural differences between actors, e.g., business people and information technology professionals (Frank, 2002). It is a critical problem because it may leads to data collection aberrations.
Ontologies have been considered as solution to ensure the metrics interoperability in process reengineering (Charlet et al., 2002). We define an ontology entitled Ontology of Enterprise Oriented Competence (OnEOC) (see figure 1). The OnEOC ontology is composed of the following components: - Thing, an abstract object representing the class
of all things. - Urbanization view refers to the different EA
views: strategy view, the business view, the organizational view and the technical view.
- Work unit is a component that refers to a decision Unit it is linked with the performance estimation and the choice of changes reasons.
- The actor concept is a key concept. Actors have different competencies and roles. The actor in OnEOC can be considered through different views depending on his role and his capabilities.
- The competence concept identifies the unitary competence, personal competence and collective competence.
- The change concept is also defined in the OnEOC where it ensures the evolution of an existing state (AS-IS) to a desired target state (TO-BE).
The OnEOC ontology allows different types of
research via ontology queries. For instance, actors executing tasks with a given KPI value such as the number of resolved complaints in an hour. The ontology allows a semantic interpretation of KPI, where technical actors interprets the KPI query execution time by the computer system, while actors at the strategic level interprets this KPI according to customers satisfaction percentage. Then, after identifying KPI and collecting relevant data; the performance assessment needs to develop business rules. Every business rules depends on the identified KPI and the extracted data from the ontology. These business rules will be executed via a process implemented by the business process execution language (BPEL). The idea is to allow combining a set of services for specifying business rules where performances are evaluated by orchestrating these rules.
BPEL is an XML language designed to allow the composition and orchestration of web services. BPEL inputs translate the different possible changes scenarios and the output is a value of the expected performance after change. BPEL inputs define the subject (reason) of the desired change, e.g., the stakeholder management to modify existing business processes. Changes criteria are either immediate or continuous. Change’s nature can be related to specific actions such as add, delete or modify involving actors, systems, and processes. Then depending on the input, an invocation of a web service is executed based on business rules. The principle of performance assessment depends on the identification of the gap between existing competences and required competences allowing the adaptation to a given change. So the output of t this process represents the value of performance after change. Note that depending on the importance of the impacted actor and the importance of the impacted business domain, a decision can be taken in order to plan appropriate actions to deal with any performance lowering.
Fourth International Symposium on Business Modeling and Software Design
150
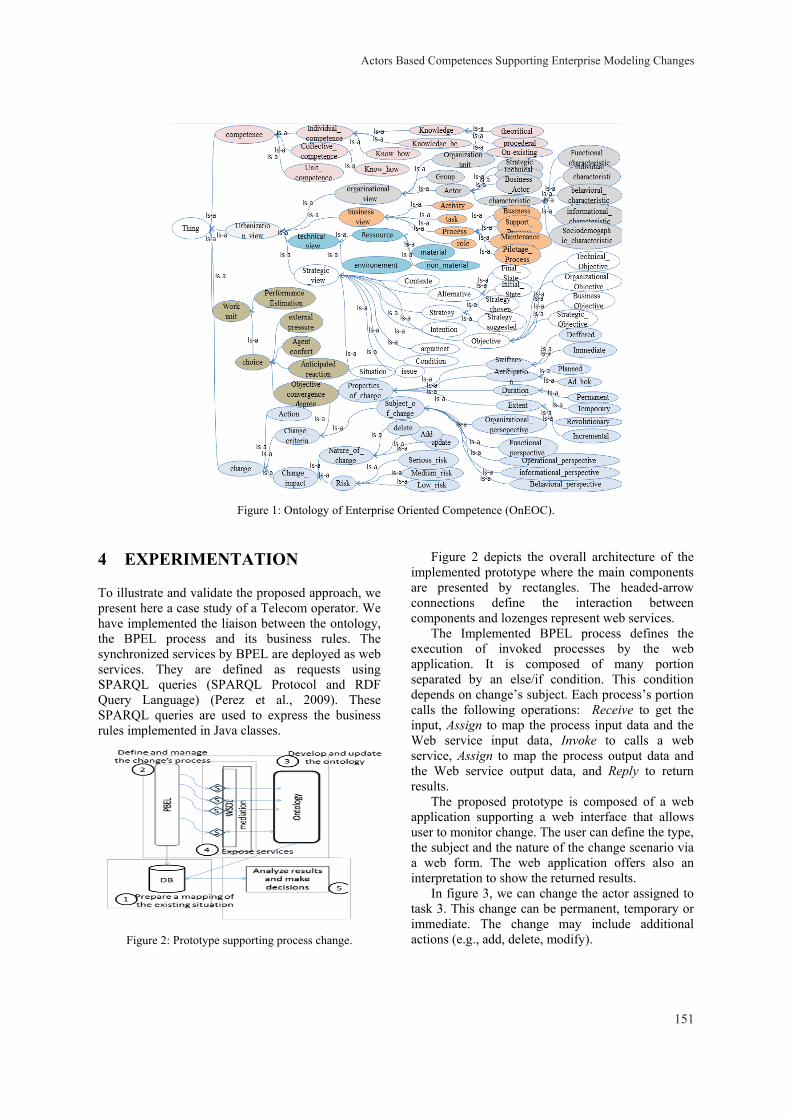
Figure 1: Ontology of Enterprise Oriented Competence (OnEOC).
4 EXPERIMENTATION
To illustrate and validate the proposed approach, we present here a case study of a Telecom operator. We have implemented the liaison between the ontology, the BPEL process and its business rules. The synchronized services by BPEL are deployed as web services. They are defined as requests using SPARQL queries (SPARQL Protocol and RDF Query Language) (Perez et al., 2009). These SPARQL queries are used to express the business rules implemented in Java classes.
Figure 2: Prototype supporting process change.
Figure 2 depicts the overall architecture of the implemented prototype where the main components are presented by rectangles. The headed-arrow connections define the interaction between components and lozenges represent web services.
The Implemented BPEL process defines the execution of invoked processes by the web application. It is composed of many portion separated by an else/if condition. This condition depends on change’s subject. Each process’s portion calls the following operations: Receive to get the input, Assign to map the process input data and the Web service input data, Invoke to calls a web service, Assign to map the process output data and the Web service output data, and Reply to return results.
The proposed prototype is composed of a web application supporting a web interface that allows user to monitor change. The user can define the type, the subject and the nature of the change scenario via a web form. The web application offers also an interpretation to show the returned results.
In figure 3, we can change the actor assigned to task 3. This change can be permanent, temporary or immediate. The change may include additional actions (e.g., add, delete, modify).
Actors Based Competences Supporting Enterprise Modeling Changes
151
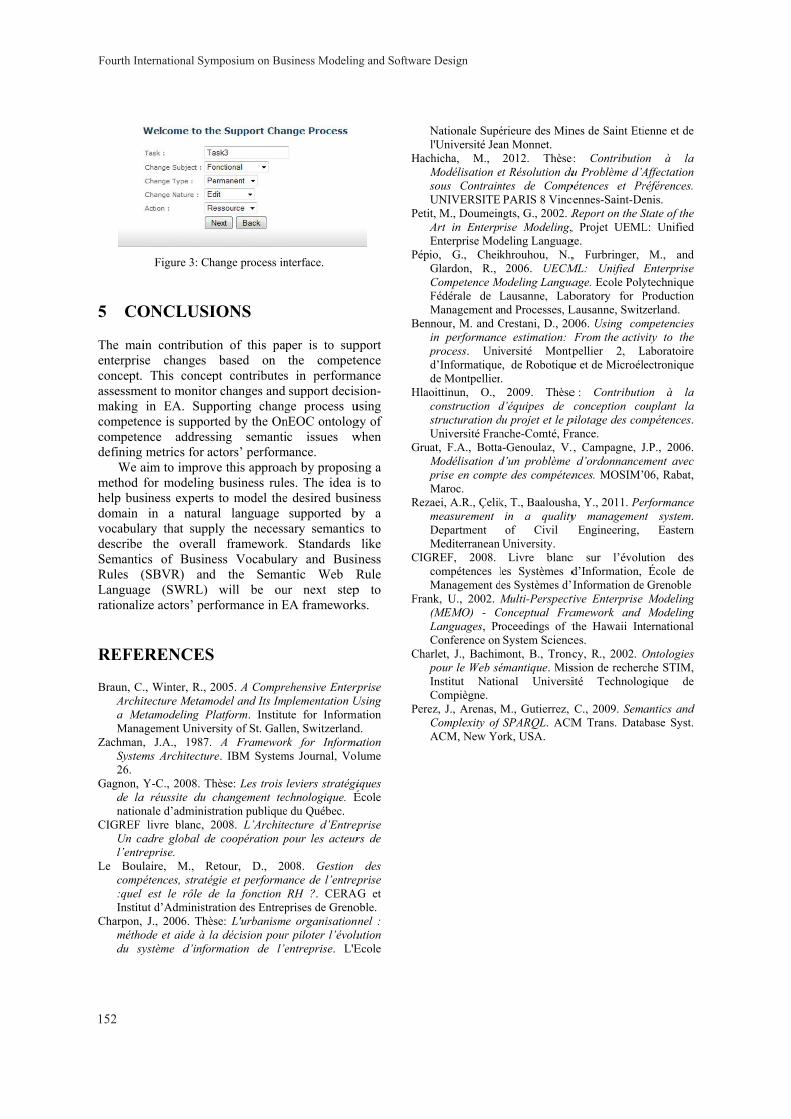
5 CO
The maienterprisconcept. assessmemaking competencompetendefining
We amethod help busdomain vocabuladescribe SemanticRules (Languagrationaliz
REFE
Braun, C.Archia MeMana
ZachmanSystem26.
Gagnon, Yde lanation
CIGREF Un cal’entr
Le Boulcomp:quel Institu
Charpon, méthodu sy
Figure 3: Ch
ONCLUSI
in contributiose changes
This concepent to monitorin EA. Suppnce is suppornce addressmetrics for ac
aim to improvfor modeling
siness experts in a natura
ary that suppthe overall
cs of Busine(SBVR) andge (SWRL) ze actors’ per
ERENCES
., Winter, R., 2itecture Metamoetamodeling Plagement Univer, J.A., 1987. ms Architecture
Y-C., 2008. Tha réussite du cnale d’administ
livre blanc, 2adre global dereprise. laire, M., Reétences, stratégest le rôle d
ut d’AdministraJ., 2006. Thès
ode et aide à laystème d’infor
hange process in
IONS
on of this papbased on
pt contributesr changes and porting changrted by the Onsing semantictors’ perform
ve this approacbusiness ruleto model the
al language ly the necessl framework.ess Vocabulad the Sema
will be ouformance in E
2005. A Compreodel and Its Implatform. Institursity of St. Galle
A Framewore. IBM System
hèse: Les trois changement tectration publique2008. L’Architee coopération p
etour, D., 20gie et performa
de la fonction ation des Entrepse: L'urbanisma décision pourrmation de l’e
nterface.
per is to supthe compete
s in performasupport decis
ge process unEOC ontologic issues w
mance. ch by proposies. The idea ie desired busi
supported bsary semantic. Standards
ary and Busintic Web R
ur next stepEA framework
ehensive Enterpplementation U
ute for Informaen, Switzerlandrk for Informams Journal, Vol
leviers stratégichnologique. Ée du Québec. ecture d’Entreppour les acteur
008. Gestion ance de l’entrepRH ?. CERAG
prises de Grenoe organisationnr piloter l’évoluentreprise. L'E
pport ence ance sion-using gy of when
ing a is to iness by a cs to
like iness Rule
p to ks.
prise Using ation d. ation lume
iques École
prise rs de
des prise G et
oble. nel : ution Ecole
Hac
Peti
Pép
Ben
p
Hla
Gru
p
Rez
CIG
Fran
Chap
Pere
Nationale Supél'Université Jea
chicha, M., Modélisation esous ContrainUNIVERSITE
it, M., DoumeinArt in EnterprEnterprise Modio, G., CheikGlardon, R., Competence MFédérale de LManagement a
nnour, M. and Cin performancprocess. Unid’Informatiquede Montpellieroittinun, O., construction dstructuration dUniversité Fran
uat, F.A., BottaModélisation dprise en comptMaroc.
zaei, A.R., Çelikmeasurement Department Mediterranean
GREF, 2008. compétences lManagement dnk, U., 2002. M(MEMO) - CLanguages, PrConference on
arlet, J., Bachimpour le Web séInstitut NatioCompiègne. ez, J., Arenas,Complexity of ACM, New Yo
érieure des Minan Monnet. 2012. Thèse
et Résolution duntes de Comp
PARIS 8 Vincngts, G., 2002. Rrise Modeling,deling Languagkhrouhou, N.,
2006. UECMModeling Langua
Lausanne, Labnd Processes, L
Crestani, D., 20ce estimation: versité Montp
e, de Robotique.
2009. Thèsed’équipes de du projet et le pnche-Comté, Fra-Genoulaz, V.d’un problème te des compéten
k, T., Baaloushain a qualityof Civil University. Livre blanc
les Systèmes ddes Systèmes d’Multi-Perspect
Conceptual Fraroceedings of tSystem Scienc
mont, B., Troncémantique. Misonal Universi
M., Gutierrez, SPARQL. ACM
ork, USA.
nes de Saint Eti
e: Contributiou Problème d’A
pétences et Prcennes-Saint-DeReport on the S, Projet UEMLge. , Furbringer,
ML: Unified Eage. Ecole Polyboratory for PLausanne, Switz006. Using comFrom the activ
tpellier 2, Le et de Microél
e : Contributioconception co
pilotage des comrance. ., Campagne, J
d’ordonnancences. MOSIM’
ha, Y., 2011. Pey managemen
Engineering,
c sur l’évolud’Information, Information de
tive Enterprise amework and the Hawaii Int
ces. ncy, R., 2002. Ossion de rechercité Technolog
C., 2009. SemM Trans. Data
ienne et de
on à la Affectation références. enis. State of the L: Unified
M., and Enterprise ytechnique Production zerland. mpetencies vity to the Laboratoire ectronique
on à la ouplant la mpétences.
J.P., 2006. ment avec 06, Rabat,
erformance nt system.
Eastern
ution des École de
e Grenoble Modeling Modeling
ternational
Ontologies che STIM, gique de
antics and abase Syst.
Fourth International Symposium on Business Modeling and Software Design
152
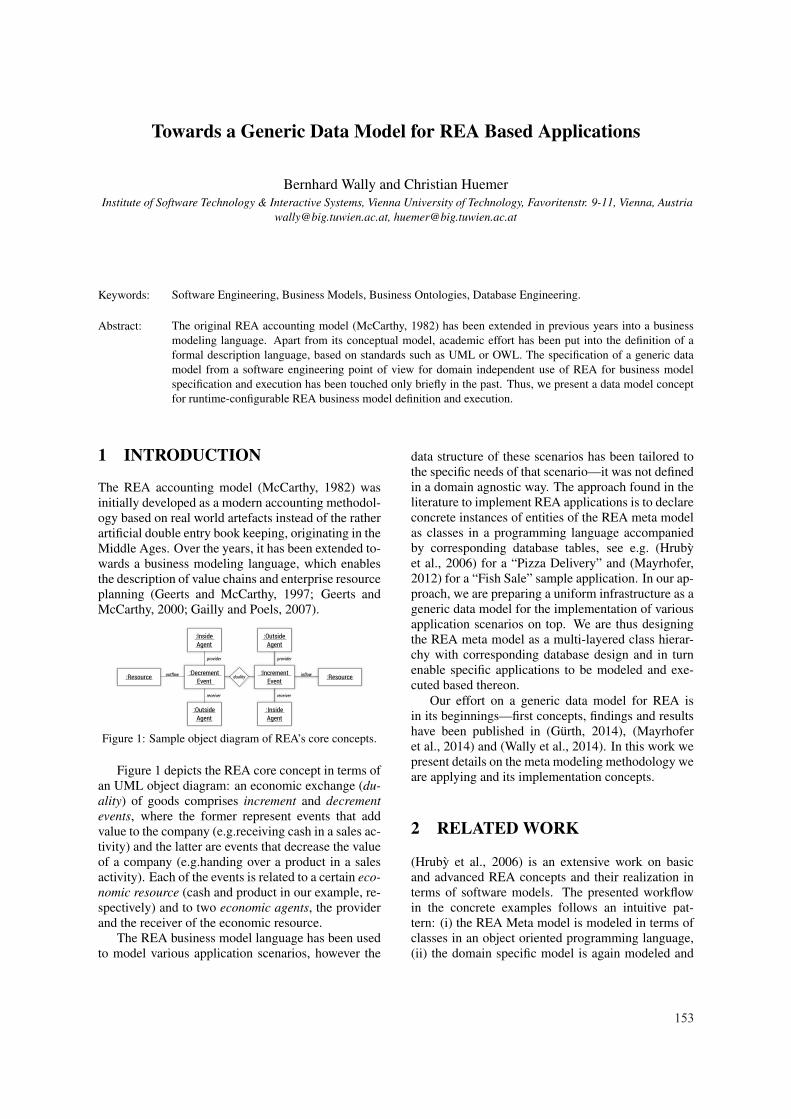
Towards a Generic Data Model for REA Based Applications
Bernhard Wally and Christian HuemerInstitute of Software Technology & Interactive Systems, Vienna University of Technology, Favoritenstr. 9-11, Vienna, Austria
[email protected], [email protected]
Keywords: Software Engineering, Business Models, Business Ontologies, Database Engineering.
Abstract: The original REA accounting model (McCarthy, 1982) has been extended in previous years into a businessmodeling language. Apart from its conceptual model, academic effort has been put into the definition of aformal description language, based on standards such as UML or OWL. The specification of a generic datamodel from a software engineering point of view for domain independent use of REA for business modelspecification and execution has been touched only briefly in the past. Thus, we present a data model conceptfor runtime-configurable REA business model definition and execution.
1 INTRODUCTION
The REA accounting model (McCarthy, 1982) wasinitially developed as a modern accounting methodol-ogy based on real world artefacts instead of the ratherartificial double entry book keeping, originating in theMiddle Ages. Over the years, it has been extended to-wards a business modeling language, which enablesthe description of value chains and enterprise resourceplanning (Geerts and McCarthy, 1997; Geerts andMcCarthy, 2000; Gailly and Poels, 2007).
Figure 1: Sample object diagram of REA’s core concepts.
Figure 1 depicts the REA core concept in terms ofan UML object diagram: an economic exchange (du-ality) of goods comprises increment and decrementevents, where the former represent events that addvalue to the company (e.g.receiving cash in a sales ac-tivity) and the latter are events that decrease the valueof a company (e.g.handing over a product in a salesactivity). Each of the events is related to a certain eco-nomic resource (cash and product in our example, re-spectively) and to two economic agents, the providerand the receiver of the economic resource.
The REA business model language has been usedto model various application scenarios, however the
data structure of these scenarios has been tailored tothe specific needs of that scenario—it was not definedin a domain agnostic way. The approach found in theliterature to implement REA applications is to declareconcrete instances of entities of the REA meta modelas classes in a programming language accompaniedby corresponding database tables, see e.g. (Hrubyet al., 2006) for a “Pizza Delivery” and (Mayrhofer,2012) for a “Fish Sale” sample application. In our ap-proach, we are preparing a uniform infrastructure as ageneric data model for the implementation of variousapplication scenarios on top. We are thus designingthe REA meta model as a multi-layered class hierar-chy with corresponding database design and in turnenable specific applications to be modeled and exe-cuted based thereon.
Our effort on a generic data model for REA isin its beginnings—first concepts, findings and resultshave been published in (Gurth, 2014), (Mayrhoferet al., 2014) and (Wally et al., 2014). In this work wepresent details on the meta modeling methodology weare applying and its implementation concepts.
2 RELATED WORK
(Hruby et al., 2006) is an extensive work on basicand advanced REA concepts and their realization interms of software models. The presented workflowin the concrete examples follows an intuitive pat-tern: (i) the REA Meta model is modeled in terms ofclasses in an object oriented programming language,(ii) the domain specific model is again modeled and
153
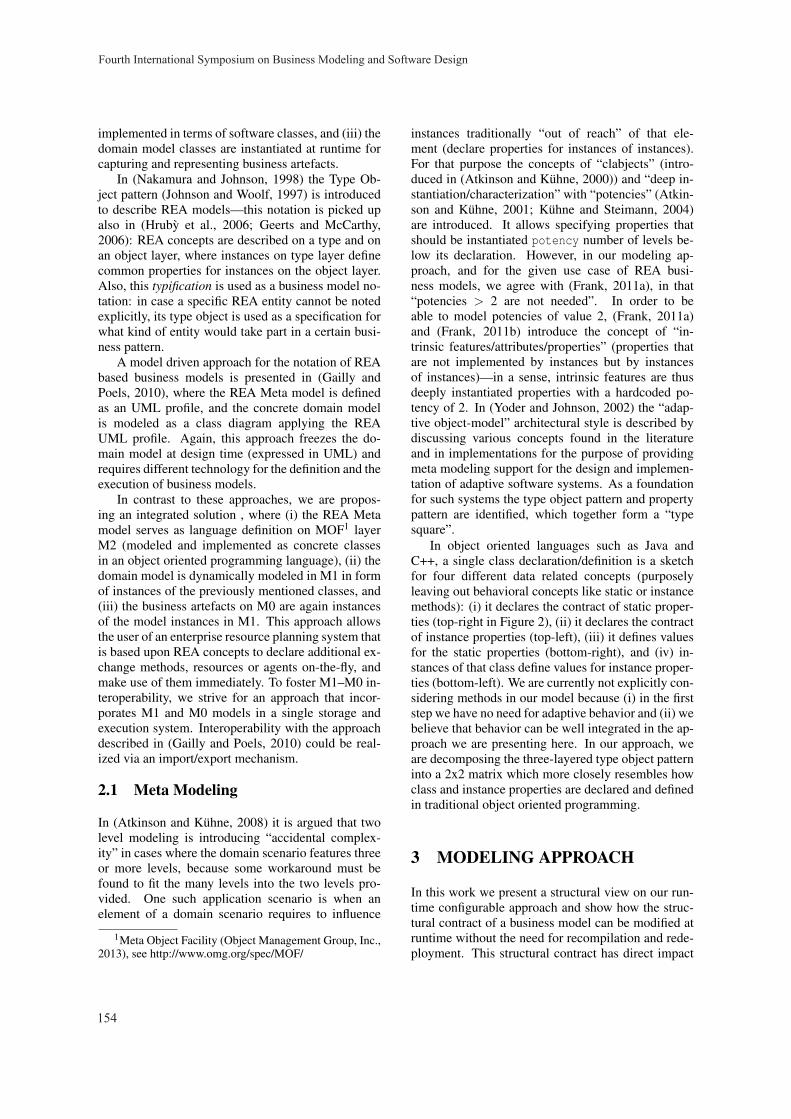
implemented in terms of software classes, and (iii) thedomain model classes are instantiated at runtime forcapturing and representing business artefacts.
In (Nakamura and Johnson, 1998) the Type Ob-ject pattern (Johnson and Woolf, 1997) is introducedto describe REA models—this notation is picked upalso in (Hruby et al., 2006; Geerts and McCarthy,2006): REA concepts are described on a type and onan object layer, where instances on type layer definecommon properties for instances on the object layer.Also, this typification is used as a business model no-tation: in case a specific REA entity cannot be notedexplicitly, its type object is used as a specification forwhat kind of entity would take part in a certain busi-ness pattern.
A model driven approach for the notation of REAbased business models is presented in (Gailly andPoels, 2010), where the REA Meta model is definedas an UML profile, and the concrete domain modelis modeled as a class diagram applying the REAUML profile. Again, this approach freezes the do-main model at design time (expressed in UML) andrequires different technology for the definition and theexecution of business models.
In contrast to these approaches, we are propos-ing an integrated solution , where (i) the REA Metamodel serves as language definition on MOF1 layerM2 (modeled and implemented as concrete classesin an object oriented programming language), (ii) thedomain model is dynamically modeled in M1 in formof instances of the previously mentioned classes, and(iii) the business artefacts on M0 are again instancesof the model instances in M1. This approach allowsthe user of an enterprise resource planning system thatis based upon REA concepts to declare additional ex-change methods, resources or agents on-the-fly, andmake use of them immediately. To foster M1–M0 in-teroperability, we strive for an approach that incor-porates M1 and M0 models in a single storage andexecution system. Interoperability with the approachdescribed in (Gailly and Poels, 2010) could be real-ized via an import/export mechanism.
2.1 Meta Modeling
In (Atkinson and Kuhne, 2008) it is argued that twolevel modeling is introducing “accidental complex-ity” in cases where the domain scenario features threeor more levels, because some workaround must befound to fit the many levels into the two levels pro-vided. One such application scenario is when anelement of a domain scenario requires to influence
1Meta Object Facility (Object Management Group, Inc.,2013), see http://www.omg.org/spec/MOF/
instances traditionally “out of reach” of that ele-ment (declare properties for instances of instances).For that purpose the concepts of “clabjects” (intro-duced in (Atkinson and Kuhne, 2000)) and “deep in-stantiation/characterization” with “potencies” (Atkin-son and Kuhne, 2001; Kuhne and Steimann, 2004)are introduced. It allows specifying properties thatshould be instantiated potency number of levels be-low its declaration. However, in our modeling ap-proach, and for the given use case of REA busi-ness models, we agree with (Frank, 2011a), in that“potencies > 2 are not needed”. In order to beable to model potencies of value 2, (Frank, 2011a)and (Frank, 2011b) introduce the concept of “in-trinsic features/attributes/properties” (properties thatare not implemented by instances but by instancesof instances)—in a sense, intrinsic features are thusdeeply instantiated properties with a hardcoded po-tency of 2. In (Yoder and Johnson, 2002) the “adap-tive object-model” architectural style is described bydiscussing various concepts found in the literatureand in implementations for the purpose of providingmeta modeling support for the design and implemen-tation of adaptive software systems. As a foundationfor such systems the type object pattern and propertypattern are identified, which together form a “typesquare”.
In object oriented languages such as Java andC++, a single class declaration/definition is a sketchfor four different data related concepts (purposelyleaving out behavioral concepts like static or instancemethods): (i) it declares the contract of static proper-ties (top-right in Figure 2), (ii) it declares the contractof instance properties (top-left), (iii) it defines valuesfor the static properties (bottom-right), and (iv) in-stances of that class define values for instance proper-ties (bottom-left). We are currently not explicitly con-sidering methods in our model because (i) in the firststep we have no need for adaptive behavior and (ii) webelieve that behavior can be well integrated in the ap-proach we are presenting here. In our approach, weare decomposing the three-layered type object patterninto a 2x2 matrix which more closely resembles howclass and instance properties are declared and definedin traditional object oriented programming.
3 MODELING APPROACH
In this work we present a structural view on our run-time configurable approach and show how the struc-tural contract of a business model can be modified atruntime without the need for recompilation and rede-ployment. This structural contract has direct impact
Fourth International Symposium on Business Modeling and Software Design
154
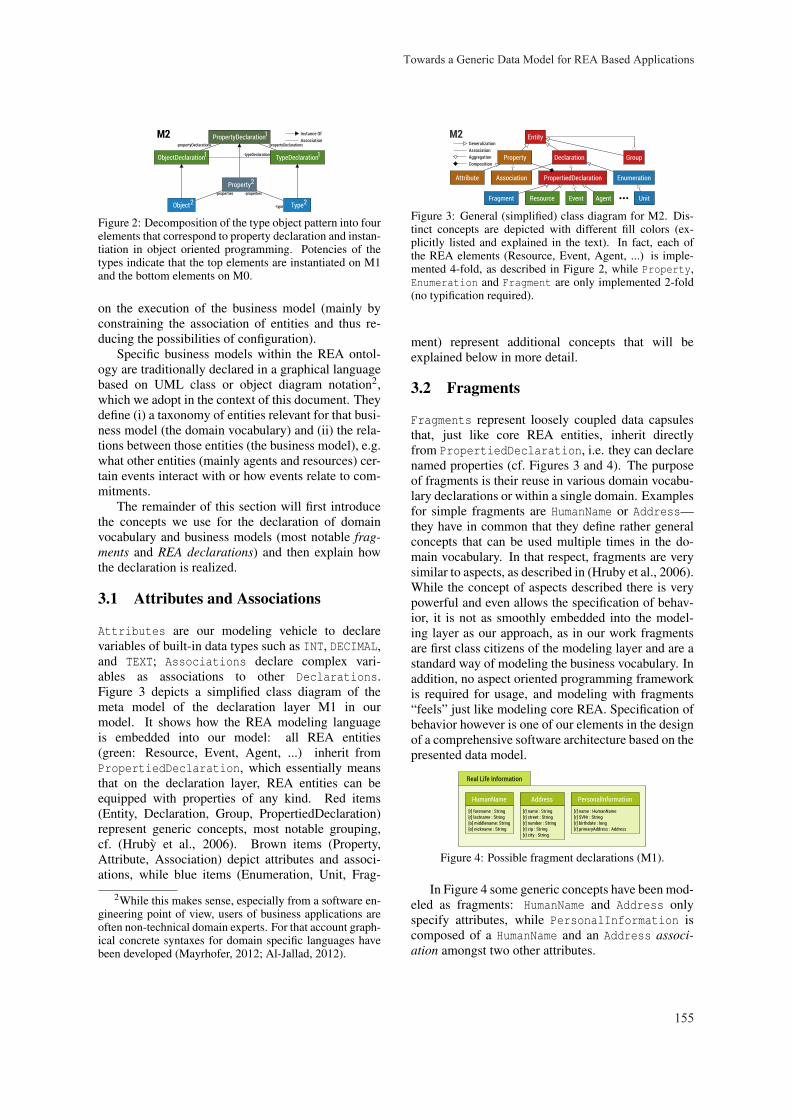
Figure 2: Decomposition of the type object pattern into fourelements that correspond to property declaration and instan-tiation in object oriented programming. Potencies of thetypes indicate that the top elements are instantiated on M1and the bottom elements on M0.
on the execution of the business model (mainly byconstraining the association of entities and thus re-ducing the possibilities of configuration).
Specific business models within the REA ontol-ogy are traditionally declared in a graphical languagebased on UML class or object diagram notation2,which we adopt in the context of this document. Theydefine (i) a taxonomy of entities relevant for that busi-ness model (the domain vocabulary) and (ii) the rela-tions between those entities (the business model), e.g.what other entities (mainly agents and resources) cer-tain events interact with or how events relate to com-mitments.
The remainder of this section will first introducethe concepts we use for the declaration of domainvocabulary and business models (most notable frag-ments and REA declarations) and then explain howthe declaration is realized.
3.1 Attributes and Associations
Attributes are our modeling vehicle to declarevariables of built-in data types such as INT, DECIMAL,and TEXT; Associations declare complex vari-ables as associations to other Declarations.Figure 3 depicts a simplified class diagram of themeta model of the declaration layer M1 in ourmodel. It shows how the REA modeling languageis embedded into our model: all REA entities(green: Resource, Event, Agent, ...) inherit fromPropertiedDeclaration, which essentially meansthat on the declaration layer, REA entities can beequipped with properties of any kind. Red items(Entity, Declaration, Group, PropertiedDeclaration)represent generic concepts, most notable grouping,cf. (Hruby et al., 2006). Brown items (Property,Attribute, Association) depict attributes and associ-ations, while blue items (Enumeration, Unit, Frag-
2While this makes sense, especially from a software en-gineering point of view, users of business applications areoften non-technical domain experts. For that account graph-ical concrete syntaxes for domain specific languages havebeen developed (Mayrhofer, 2012; Al-Jallad, 2012).
Figure 3: General (simplified) class diagram for M2. Dis-tinct concepts are depicted with different fill colors (ex-plicitly listed and explained in the text). In fact, each ofthe REA elements (Resource, Event, Agent, ...) is imple-mented 4-fold, as described in Figure 2, while Property,Enumeration and Fragment are only implemented 2-fold(no typification required).
ment) represent additional concepts that will beexplained below in more detail.
3.2 Fragments
Fragments represent loosely coupled data capsulesthat, just like core REA entities, inherit directlyfrom PropertiedDeclaration, i.e. they can declarenamed properties (cf. Figures 3 and 4). The purposeof fragments is their reuse in various domain vocabu-lary declarations or within a single domain. Examplesfor simple fragments are HumanName or Address—they have in common that they define rather generalconcepts that can be used multiple times in the do-main vocabulary. In that respect, fragments are verysimilar to aspects, as described in (Hruby et al., 2006).While the concept of aspects described there is verypowerful and even allows the specification of behav-ior, it is not as smoothly embedded into the model-ing layer as our approach, as in our work fragmentsare first class citizens of the modeling layer and are astandard way of modeling the business vocabulary. Inaddition, no aspect oriented programming frameworkis required for usage, and modeling with fragments“feels” just like modeling core REA. Specification ofbehavior however is one of our elements in the designof a comprehensive software architecture based on thepresented data model.
Figure 4: Possible fragment declarations (M1).
In Figure 4 some generic concepts have been mod-eled as fragments: HumanName and Address onlyspecify attributes, while PersonalInformation iscomposed of a HumanName and an Address associ-ation amongst two other attributes.
Towards a Generic Data Model for REA Based Applications
155
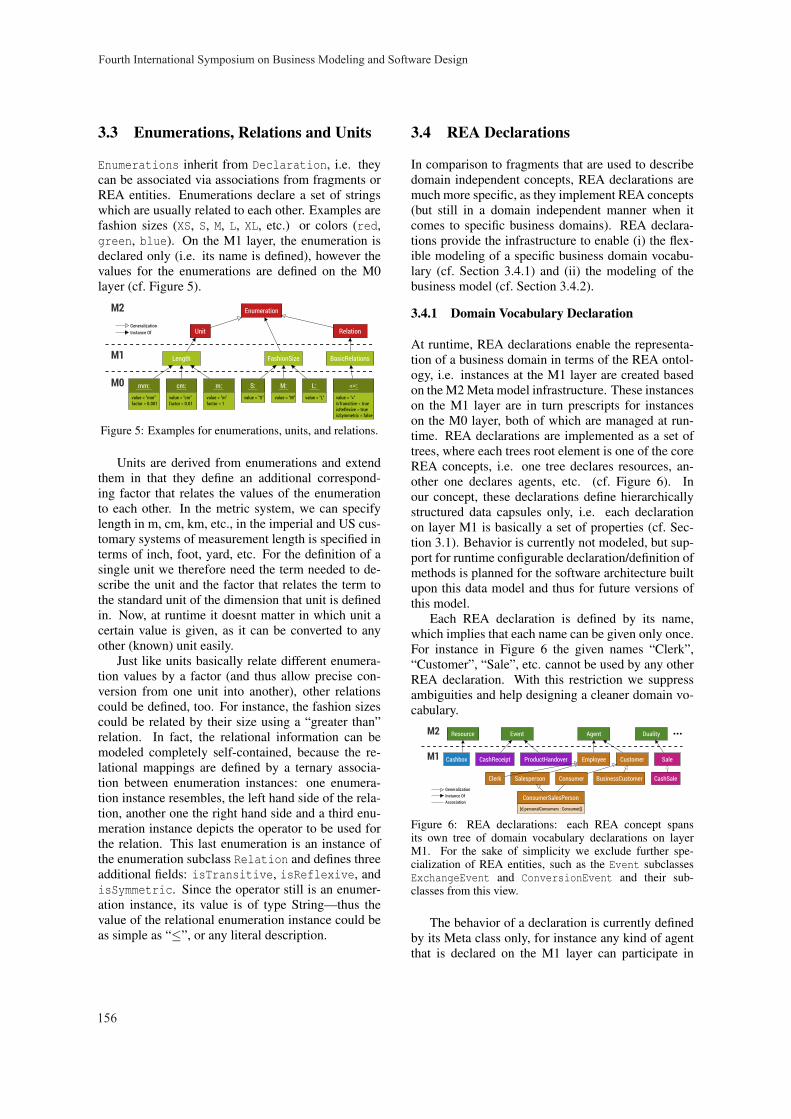
3.3 Enumerations, Relations and Units
Enumerations inherit from Declaration, i.e. theycan be associated via associations from fragments orREA entities. Enumerations declare a set of stringswhich are usually related to each other. Examples arefashion sizes (XS, S, M, L, XL, etc.) or colors (red,green, blue). On the M1 layer, the enumeration isdeclared only (i.e. its name is defined), however thevalues for the enumerations are defined on the M0layer (cf. Figure 5).
Figure 5: Examples for enumerations, units, and relations.
Units are derived from enumerations and extendthem in that they define an additional correspond-ing factor that relates the values of the enumerationto each other. In the metric system, we can specifylength in m, cm, km, etc., in the imperial and US cus-tomary systems of measurement length is specified interms of inch, foot, yard, etc. For the definition of asingle unit we therefore need the term needed to de-scribe the unit and the factor that relates the term tothe standard unit of the dimension that unit is definedin. Now, at runtime it doesnt matter in which unit acertain value is given, as it can be converted to anyother (known) unit easily.
Just like units basically relate different enumera-tion values by a factor (and thus allow precise con-version from one unit into another), other relationscould be defined, too. For instance, the fashion sizescould be related by their size using a “greater than”relation. In fact, the relational information can bemodeled completely self-contained, because the re-lational mappings are defined by a ternary associa-tion between enumeration instances: one enumera-tion instance resembles, the left hand side of the rela-tion, another one the right hand side and a third enu-meration instance depicts the operator to be used forthe relation. This last enumeration is an instance ofthe enumeration subclass Relation and defines threeadditional fields: isTransitive, isReflexive, andisSymmetric. Since the operator still is an enumer-ation instance, its value is of type String—thus thevalue of the relational enumeration instance could beas simple as “≤”, or any literal description.
3.4 REA Declarations
In comparison to fragments that are used to describedomain independent concepts, REA declarations aremuch more specific, as they implement REA concepts(but still in a domain independent manner when itcomes to specific business domains). REA declara-tions provide the infrastructure to enable (i) the flex-ible modeling of a specific business domain vocabu-lary (cf. Section 3.4.1) and (ii) the modeling of thebusiness model (cf. Section 3.4.2).
3.4.1 Domain Vocabulary Declaration
At runtime, REA declarations enable the representa-tion of a business domain in terms of the REA ontol-ogy, i.e. instances at the M1 layer are created basedon the M2 Meta model infrastructure. These instanceson the M1 layer are in turn prescripts for instanceson the M0 layer, both of which are managed at run-time. REA declarations are implemented as a set oftrees, where each trees root element is one of the coreREA concepts, i.e. one tree declares resources, an-other one declares agents, etc. (cf. Figure 6). Inour concept, these declarations define hierarchicallystructured data capsules only, i.e. each declarationon layer M1 is basically a set of properties (cf. Sec-tion 3.1). Behavior is currently not modeled, but sup-port for runtime configurable declaration/definition ofmethods is planned for the software architecture builtupon this data model and thus for future versions ofthis model.
Each REA declaration is defined by its name,which implies that each name can be given only once.For instance in Figure 6 the given names “Clerk”,“Customer”, “Sale”, etc. cannot be used by any otherREA declaration. With this restriction we suppressambiguities and help designing a cleaner domain vo-cabulary.
Figure 6: REA declarations: each REA concept spansits own tree of domain vocabulary declarations on layerM1. For the sake of simplicity we exclude further spe-cialization of REA entities, such as the Event subclassesExchangeEvent and ConversionEvent and their sub-classes from this view.
The behavior of a declaration is currently definedby its Meta class only, for instance any kind of agentthat is declared on the M1 layer can participate in
Fourth International Symposium on Business Modeling and Software Design
156
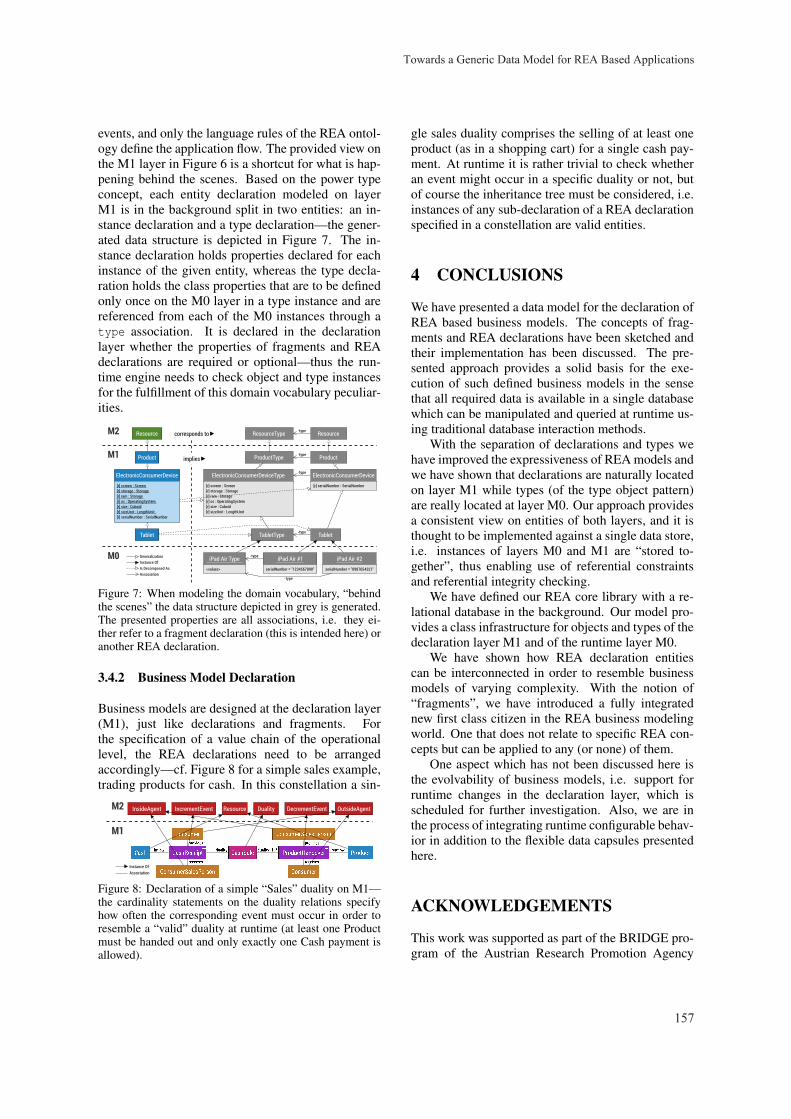
events, and only the language rules of the REA ontol-ogy define the application flow. The provided view onthe M1 layer in Figure 6 is a shortcut for what is hap-pening behind the scenes. Based on the power typeconcept, each entity declaration modeled on layerM1 is in the background split in two entities: an in-stance declaration and a type declaration—the gener-ated data structure is depicted in Figure 7. The in-stance declaration holds properties declared for eachinstance of the given entity, whereas the type decla-ration holds the class properties that are to be definedonly once on the M0 layer in a type instance and arereferenced from each of the M0 instances through atype association. It is declared in the declarationlayer whether the properties of fragments and REAdeclarations are required or optional—thus the run-time engine needs to check object and type instancesfor the fulfillment of this domain vocabulary peculiar-ities.
Figure 7: When modeling the domain vocabulary, “behindthe scenes” the data structure depicted in grey is generated.The presented properties are all associations, i.e. they ei-ther refer to a fragment declaration (this is intended here) oranother REA declaration.
3.4.2 Business Model Declaration
Business models are designed at the declaration layer(M1), just like declarations and fragments. Forthe specification of a value chain of the operationallevel, the REA declarations need to be arrangedaccordingly—cf. Figure 8 for a simple sales example,trading products for cash. In this constellation a sin-
Figure 8: Declaration of a simple “Sales” duality on M1—the cardinality statements on the duality relations specifyhow often the corresponding event must occur in order toresemble a “valid” duality at runtime (at least one Productmust be handed out and only exactly one Cash payment isallowed).
gle sales duality comprises the selling of at least oneproduct (as in a shopping cart) for a single cash pay-ment. At runtime it is rather trivial to check whetheran event might occur in a specific duality or not, butof course the inheritance tree must be considered, i.e.instances of any sub-declaration of a REA declarationspecified in a constellation are valid entities.
4 CONCLUSIONS
We have presented a data model for the declaration ofREA based business models. The concepts of frag-ments and REA declarations have been sketched andtheir implementation has been discussed. The pre-sented approach provides a solid basis for the exe-cution of such defined business models in the sensethat all required data is available in a single databasewhich can be manipulated and queried at runtime us-ing traditional database interaction methods.
With the separation of declarations and types wehave improved the expressiveness of REA models andwe have shown that declarations are naturally locatedon layer M1 while types (of the type object pattern)are really located at layer M0. Our approach providesa consistent view on entities of both layers, and it isthought to be implemented against a single data store,i.e. instances of layers M0 and M1 are “stored to-gether”, thus enabling use of referential constraintsand referential integrity checking.
We have defined our REA core library with a re-lational database in the background. Our model pro-vides a class infrastructure for objects and types of thedeclaration layer M1 and of the runtime layer M0.
We have shown how REA declaration entitiescan be interconnected in order to resemble businessmodels of varying complexity. With the notion of“fragments”, we have introduced a fully integratednew first class citizen in the REA business modelingworld. One that does not relate to specific REA con-cepts but can be applied to any (or none) of them.
One aspect which has not been discussed here isthe evolvability of business models, i.e. support forruntime changes in the declaration layer, which isscheduled for further investigation. Also, we are inthe process of integrating runtime configurable behav-ior in addition to the flexible data capsules presentedhere.
ACKNOWLEDGEMENTS
This work was supported as part of the BRIDGE pro-gram of the Austrian Research Promotion Agency
Towards a Generic Data Model for REA Based Applications
157

(FFG) under grant number 841287—a joint researcheffort of Vienna University of Technology and even-tus Marketingservice GmbH.
REFERENCESAl-Jallad, M. M. (2012). REA business modeling language:
Toward a REA based domain specific visual language.Student thesis, KTH Royal Institute of Technology.
Atkinson, C. and Kuhne, T. (2000). Meta-level indepen-dent modelling. In International Workshop on ModelEngineering at 14th European Conference on Object-Oriented Programming, pages 12–16.
Atkinson, C. and Kuhne, T. (2001). The essence of multi-level metamodeling. In Goos, G., Hartmanis, J., andLeeuwen, J. v., editors, UML 2001—The Unified Mod-eling Language. Modeling Languages, Concepts, andTools, Lecture Notes in Computer Science, pages 19–33. Springer.
Atkinson, C. and Kuhne, T. (2008). Reducing accidentalcomplexity in domain models. Software & SystemsModeling, 7(3):345–359.
Frank, U. (2011a). The MEMO meta modelling language(MML) and language architecture. ICB-Research Re-port 43, Institute for Computer Science and BusinessInformation Systems, University Duisburg-Essen.
Frank, U. (2011b). Some guidelines for the conception ofdomain-specific modelling languages. In Nuttgens,M., Thomas, O., and Weber, B., editors, 4th Inter-national Workshop on Enterprise Modelling and In-formation Systems Architectures (EMISA 2011), vol-ume P-190 of Lecture Notes in Informatics, pages93–106, Bonn. Gesellschaft fur Informatik, KollenDruck+Verlag GmbH.
Gailly, F. and Poels, G. (2007). Towards ontology-driven in-formation systems: Redesign and formalization of theREA ontology. In Abramowicz, W., editor, BusinessInformation Systems, volume 4439 of Lecture Notesin Computer Science, pages 245–259. Springer BerlinHeidelberg.
Gailly, F. and Poels, G. (2010). Conceptual modeling us-ing domain ontologies. improving the domain-specificquality of conceptual schemas. In 10th Workshop onDomain-Specific Modeling, pages 18:1–18:6. ACM.
Geerts, G. L. and McCarthy, W. E. (1997). Modeling busi-ness enterprises as value-added process hierarchieswith resource-event-agent object templates. In Suther-land, J., Casanave, C., Miller, J., Patel, P., and Hol-lowell, G., editors, Business Object Design and Im-plementation, pages 94–113. Springer London.
Geerts, G. L. and McCarthy, W. E. (2000). The ontologicalfoundation of REA enterprise information systems. InAnnual Meeting of the American Accounting Associa-tion, Philadelphia, PA, volume 362, pages 127–150.
Geerts, G. L. and McCarthy, W. E. (2006). Policy-levelspecifications in REA enterprise information systems.Journal of Information Systems, 20(2):37–63.
Gurth, T. (2014). Business model driven ERP customiza-tion. Master’s thesis, Faculty of Informatics, ViennaUniversity of Technology.
Hruby, P., Kiehn, J., and Scheller, C. V. (2006). Model-Driven Design using Business Patterns. Springer.
Johnson, R. and Woolf, B. (1997). Type object. In Martin,R. C., Riehle, D., and Buschmann, F., editors, Pat-tern Languages of Program Design 3, chapter TypeObject, pages 47–65. Addison-Wesley Longman Pub-lishing Co., Inc., Boston, MA, USA.
Kuhne, T. and Steimann, F. (2004). Tiefe charakterisierung.In Rumpe, B. and Hesse, W., editors, Modellierung2004, volume P-45 of Lecture Notes in Informatics,pages 109–120, Bonn. Gesellschaft fur Informatik,Kollen Druck+Verlag GmbH.
Mayrhofer, D. (2012). REA-DSL: Business Model DrivenData Engineering. PhD dissertation, Vienna Univer-sity of Technology.
Mayrhofer, D., Mazak, A., Wally, B., Huemer, C., and Re-gatschnig, P. (2014). REAlist: Towards a businessmodel adapting multi-tenant ERP system in the cloud.In 8th International Workshop on Value Modeling andBusiness Ontology (VMBO 2014).
McCarthy, W. E. (1982). The REA accounting model: Ageneralized framework for accounting systems in ashared data environment. The Accounting Review,57(3):554–578.
Nakamura, H. and Johnson, R. E. (1998). Adaptive frame-work for the REA accounting model. In OOPSLA’98Workshop on Business Object Design and Implemen-tation IV.
Object Management Group, Inc. (2013). OMG Meta ObjectFacility (MOF) Core Specification. Object Manage-ment Group, Inc.
Wally, B., Mazak, A., Mayrhofer, D., and Huemer, C.(2014). A generic REA software architecture basedon fragments and declarations. In 8th InternationalWorkshop on Value Modeling and Business Ontology(VMBO 2014).
Yoder, J. W. and Johnson, R. (2002). The adaptive object-model architectural style. In Software Architecture,pages 3–27. Springer.
Fourth International Symposium on Business Modeling and Software Design
158
Towards Simulation of Business ProcessesTransforming BPMN Models to Enterprise Dynamics Models
Ralf Schepers, Tobias Minning, Yannik Moog and Ingo J. TimmBusiness Informatics I, University of Trier, Trier, Germany
{ralf.schepers, s4tominn, s4yamoog, ingo.timm}@uni-trier.de
Keywords: Business Process Simulation, Material Flow Simulation, Enterprise Dynamics (ED), BPMN.
Abstract: Due to the ISO 9001 certification and process oriented-organization, many business process models are avail-able at enterprises and public institutions. They are e.g. used for documentation or for introducing processesto new employees. As a de-facto standard notation BPMN “Business Process Model and Notation” is widelyused. These process models can support static analyses of business processes. Dynamic analysis, e.g., bysimulation is beneficial for in-depth analysis and optimization. However, only few approaches are available toperform simulation on basis of BPMN. In the production engineering domain, process simulation for analysisand optimization is a de-facto standard. In this domain, material flow simulation is a valid method of analysis,planning and construction.In this paper, we discuss the potentials and shortcomings of transforming BPMN models to a material flowsimulation model. On the basis of an analysis of BPMN and material flow simulation, we identified require-ments for transforming. Four levels of transformation complexity are defined. Furthermore we developedmatching relation from BPMN elements to material flow elements. As proof of concept, we implemented thetransformation process using Enterprise Dynamics and evaluated its outcome. The benefits and limitations ofthis approach are discussed in the paper in front of evaluation and related work.
1 INTRODUCTION
The ISO 9001 certification represents an authorita-tive reference of quality management. Since 2009,Switzerland’s public institutions have to be compliedwith ISO 9001(eCH eGov, 2013). One requirementof this certification is the documentation of businessprocesses. BPMN 2.0 (Business Process Model andNotation) is a common standard for process nota-tion(Freund and Ruecker, 2012), which has been cho-sen by Switzerland. In consequence, for each cer-tified institution (in Switzerland), the business pro-cesses are available in BPMN. Those are used, e.g.,for documentation and analysis matters. The model-ing and maintenance of business process documents isresource intensive. So an additional value should beadded. On basis of the process models, static analy-sis are enabled, however, as underlying research ques-tion of this paper, the question occurs, if it is possibleto derive a standard process for dynamic analysis ofbusiness processes.
There exists already the approach to simulate busi-ness processes by business process simulation. But itlacks on a low leeway in decision-making (Shannon,
1998) and missing standards(Januszczak and Hook,2011). To re-use existing models in simulation, atransformation approach into executable models isnecessary. To improve support of decision-making,the method of material flow simulation will be used,because simulation is a well-defined process methodfor analysis in engineering. Due to the relevance ofBPMN standards and the possibility of the conversionwithin the standards, the transformation from BPMNmodels to executable simulation models will be an-alyzed. As a first step, our objective is to study thetransfer of BPMN into an existing simulation environ-ment. This will be evaluated by the implementation ofthe transformation function in a simulation system i.e.Incontrol Enterprise Dynamics.
2 FUNDAMENTALS
Due to our research objective, BPMN and the meanof material flow simulation will be introduced in thefollowing sections.
159
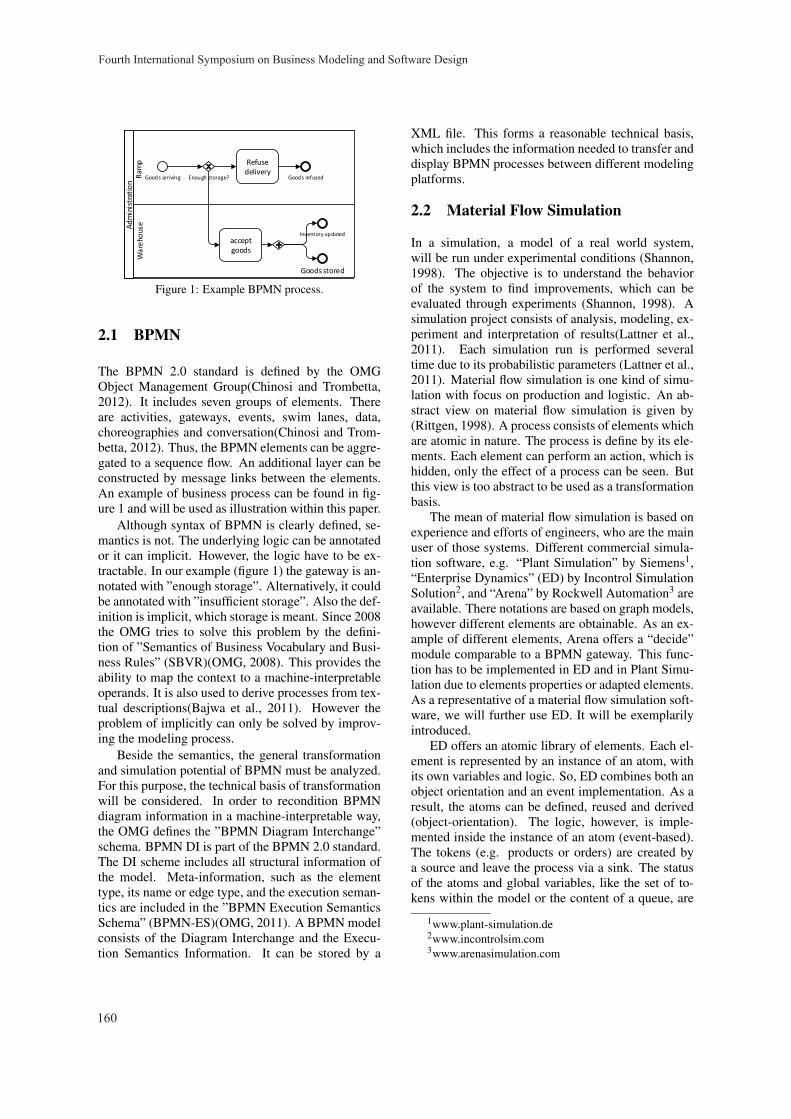
Ad
min
istr
ati
on
Ra
mp
Wa
reh
ou
se
Goods arriving Enough storage?
Refuse
delivery
accept
goods
Inventory updated
Goods stored
Goods refused
Figure 1: Example BPMN process.
2.1 BPMN
The BPMN 2.0 standard is defined by the OMGObject Management Group(Chinosi and Trombetta,2012). It includes seven groups of elements. Thereare activities, gateways, events, swim lanes, data,choreographies and conversation(Chinosi and Trom-betta, 2012). Thus, the BPMN elements can be aggre-gated to a sequence flow. An additional layer can beconstructed by message links between the elements.An example of business process can be found in fig-ure 1 and will be used as illustration within this paper.
Although syntax of BPMN is clearly defined, se-mantics is not. The underlying logic can be annotatedor it can implicit. However, the logic have to be ex-tractable. In our example (figure 1) the gateway is an-notated with ”enough storage”. Alternatively, it couldbe annotated with ”insufficient storage”. Also the def-inition is implicit, which storage is meant. Since 2008the OMG tries to solve this problem by the defini-tion of ”Semantics of Business Vocabulary and Busi-ness Rules” (SBVR)(OMG, 2008). This provides theability to map the context to a machine-interpretableoperands. It is also used to derive processes from tex-tual descriptions(Bajwa et al., 2011). However theproblem of implicitly can only be solved by improv-ing the modeling process.
Beside the semantics, the general transformationand simulation potential of BPMN must be analyzed.For this purpose, the technical basis of transformationwill be considered. In order to recondition BPMNdiagram information in a machine-interpretable way,the OMG defines the ”BPMN Diagram Interchange”schema. BPMN DI is part of the BPMN 2.0 standard.The DI scheme includes all structural information ofthe model. Meta-information, such as the elementtype, its name or edge type, and the execution seman-tics are included in the ”BPMN Execution SemanticsSchema” (BPMN-ES)(OMG, 2011). A BPMN modelconsists of the Diagram Interchange and the Execu-tion Semantics Information. It can be stored by a
XML file. This forms a reasonable technical basis,which includes the information needed to transfer anddisplay BPMN processes between different modelingplatforms.
2.2 Material Flow Simulation
In a simulation, a model of a real world system,will be run under experimental conditions (Shannon,1998). The objective is to understand the behaviorof the system to find improvements, which can beevaluated through experiments (Shannon, 1998). Asimulation project consists of analysis, modeling, ex-periment and interpretation of results(Lattner et al.,2011). Each simulation run is performed severaltime due to its probabilistic parameters (Lattner et al.,2011). Material flow simulation is one kind of simu-lation with focus on production and logistic. An ab-stract view on material flow simulation is given by(Rittgen, 1998). A process consists of elements whichare atomic in nature. The process is define by its ele-ments. Each element can perform an action, which ishidden, only the effect of a process can be seen. Butthis view is too abstract to be used as a transformationbasis.
The mean of material flow simulation is based onexperience and efforts of engineers, who are the mainuser of those systems. Different commercial simula-tion software, e.g. “Plant Simulation” by Siemens1,“Enterprise Dynamics” (ED) by Incontrol SimulationSolution2, and “Arena” by Rockwell Automation3 areavailable. There notations are based on graph models,however different elements are obtainable. As an ex-ample of different elements, Arena offers a “decide”module comparable to a BPMN gateway. This func-tion has to be implemented in ED and in Plant Simu-lation due to elements properties or adapted elements.As a representative of a material flow simulation soft-ware, we will further use ED. It will be exemplarilyintroduced.
ED offers an atomic library of elements. Each el-ement is represented by an instance of an atom, withits own variables and logic. So, ED combines both anobject orientation and an event implementation. As aresult, the atoms can be defined, reused and derived(object-orientation). The logic, however, is imple-mented inside the instance of an atom (event-based).The tokens (e.g. products or orders) are created bya source and leave the process via a sink. The statusof the atoms and global variables, like the set of to-kens within the model or the content of a queue, are
1www.plant-simulation.de2www.incontrolsim.com3www.arenasimulation.com
Fourth International Symposium on Business Modeling and Software Design
160
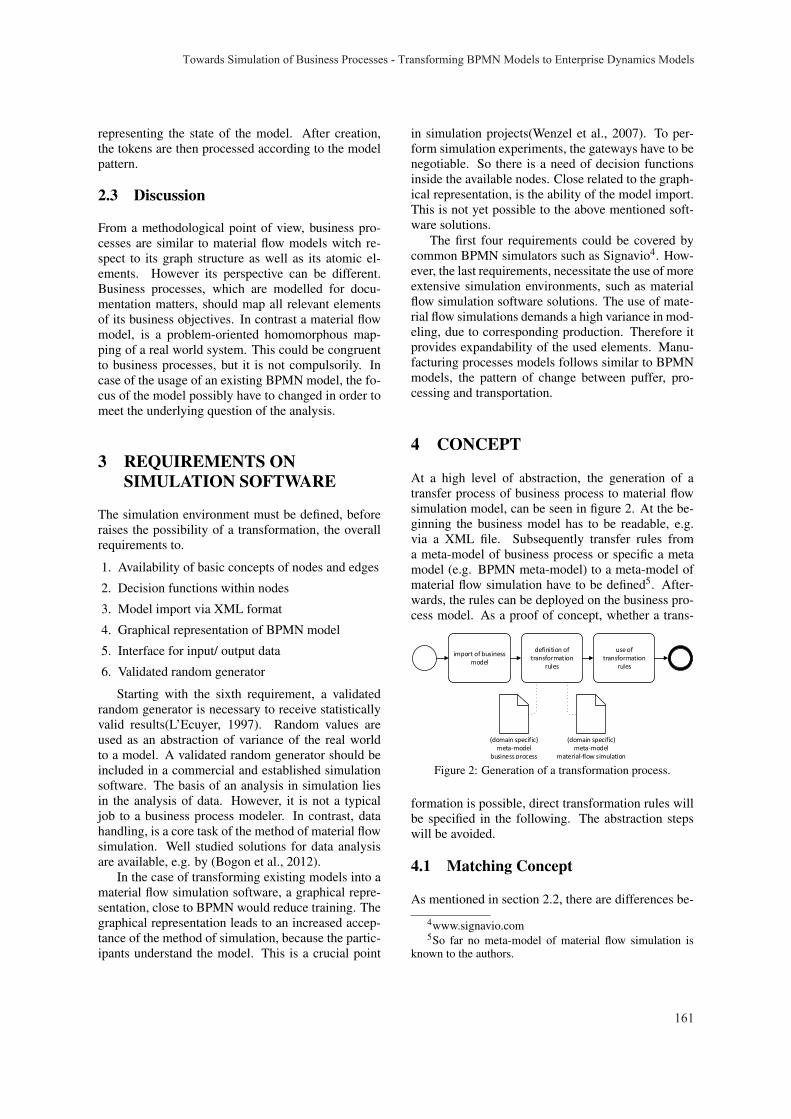
representing the state of the model. After creation,the tokens are then processed according to the modelpattern.
2.3 Discussion
From a methodological point of view, business pro-cesses are similar to material flow models witch re-spect to its graph structure as well as its atomic el-ements. However its perspective can be different.Business processes, which are modelled for docu-mentation matters, should map all relevant elementsof its business objectives. In contrast a material flowmodel, is a problem-oriented homomorphous map-ping of a real world system. This could be congruentto business processes, but it is not compulsorily. Incase of the usage of an existing BPMN model, the fo-cus of the model possibly have to changed in order tomeet the underlying question of the analysis.
3 REQUIREMENTS ONSIMULATION SOFTWARE
The simulation environment must be defined, beforeraises the possibility of a transformation, the overallrequirements to.
1. Availability of basic concepts of nodes and edges
2. Decision functions within nodes
3. Model import via XML format
4. Graphical representation of BPMN model
5. Interface for input/ output data
6. Validated random generator
Starting with the sixth requirement, a validatedrandom generator is necessary to receive statisticallyvalid results(L’Ecuyer, 1997). Random values areused as an abstraction of variance of the real worldto a model. A validated random generator should beincluded in a commercial and established simulationsoftware. The basis of an analysis in simulation liesin the analysis of data. However, it is not a typicaljob to a business process modeler. In contrast, datahandling, is a core task of the method of material flowsimulation. Well studied solutions for data analysisare available, e.g. by (Bogon et al., 2012).
In the case of transforming existing models into amaterial flow simulation software, a graphical repre-sentation, close to BPMN would reduce training. Thegraphical representation leads to an increased accep-tance of the method of simulation, because the partic-ipants understand the model. This is a crucial point
in simulation projects(Wenzel et al., 2007). To per-form simulation experiments, the gateways have to benegotiable. So there is a need of decision functionsinside the available nodes. Close related to the graph-ical representation, is the ability of the model import.This is not yet possible to the above mentioned soft-ware solutions.
The first four requirements could be covered bycommon BPMN simulators such as Signavio4. How-ever, the last requirements, necessitate the use of moreextensive simulation environments, such as materialflow simulation software solutions. The use of mate-rial flow simulations demands a high variance in mod-eling, due to corresponding production. Therefore itprovides expandability of the used elements. Manu-facturing processes models follows similar to BPMNmodels, the pattern of change between puffer, pro-cessing and transportation.
4 CONCEPT
At a high level of abstraction, the generation of atransfer process of business process to material flowsimulation model, can be seen in figure 2. At the be-ginning the business model has to be readable, e.g.via a XML file. Subsequently transfer rules froma meta-model of business process or specific a metamodel (e.g. BPMN meta-model) to a meta-model ofmaterial flow simulation have to be defined5. After-wards, the rules can be deployed on the business pro-cess model. As a proof of concept, whether a trans-
import of business
model
definition of
transformation
rules
use of
transformation
rules
(domain specific)
meta-model
business process
(domain specific)
meta-model
material-flow simulation
Figure 2: Generation of a transformation process.
formation is possible, direct transformation rules willbe specified in the following. The abstraction stepswill be avoided.
4.1 Matching Concept
As mentioned in section 2.2, there are differences be-
4www.signavio.com5So far no meta-model of material flow simulation is
known to the authors.
Towards Simulation of Business Processes - Transforming BPMN Models to Enterprise Dynamics Models
161
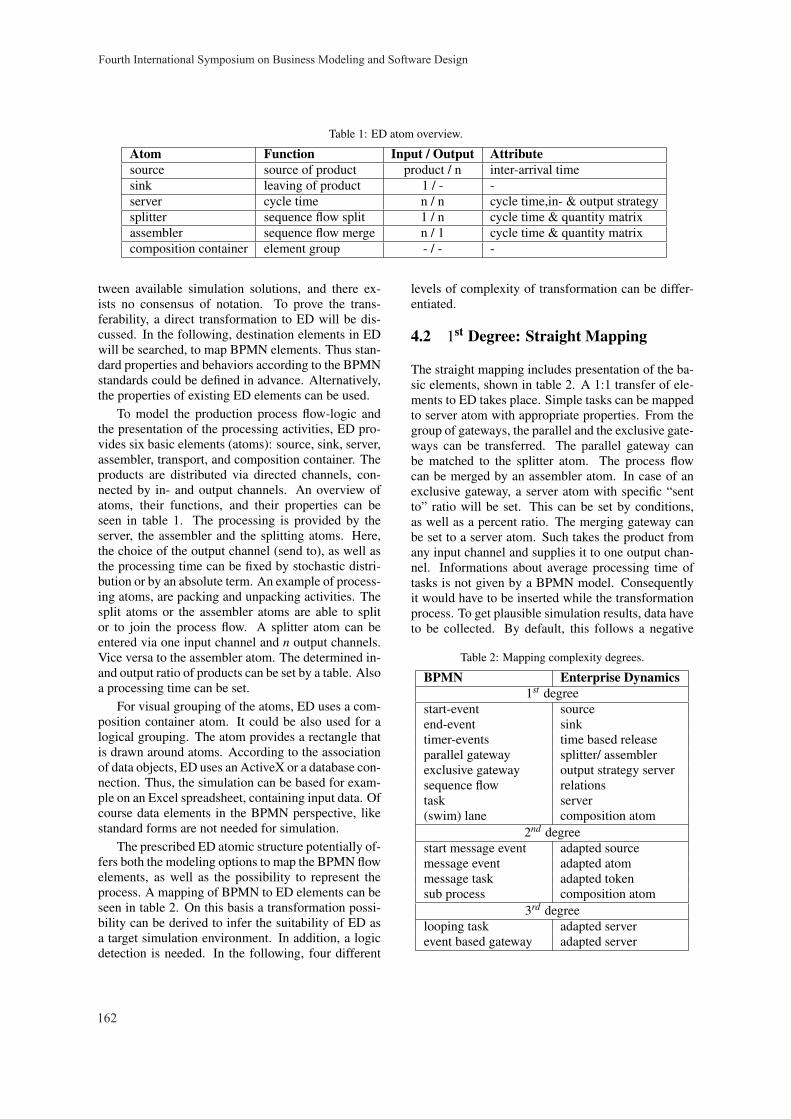
Table 1: ED atom overview.
Atom Function Input / Output Attributesource source of product product / n inter-arrival timesink leaving of product 1 / - -server cycle time n / n cycle time,in- & output strategysplitter sequence flow split 1 / n cycle time & quantity matrixassembler sequence flow merge n / 1 cycle time & quantity matrixcomposition container element group - / - -
tween available simulation solutions, and there ex-ists no consensus of notation. To prove the trans-ferability, a direct transformation to ED will be dis-cussed. In the following, destination elements in EDwill be searched, to map BPMN elements. Thus stan-dard properties and behaviors according to the BPMNstandards could be defined in advance. Alternatively,the properties of existing ED elements can be used.
To model the production process flow-logic andthe presentation of the processing activities, ED pro-vides six basic elements (atoms): source, sink, server,assembler, transport, and composition container. Theproducts are distributed via directed channels, con-nected by in- and output channels. An overview ofatoms, their functions, and their properties can beseen in table 1. The processing is provided by theserver, the assembler and the splitting atoms. Here,the choice of the output channel (send to), as well asthe processing time can be fixed by stochastic distri-bution or by an absolute term. An example of process-ing atoms, are packing and unpacking activities. Thesplit atoms or the assembler atoms are able to splitor to join the process flow. A splitter atom can beentered via one input channel and n output channels.Vice versa to the assembler atom. The determined in-and output ratio of products can be set by a table. Alsoa processing time can be set.
For visual grouping of the atoms, ED uses a com-position container atom. It could be also used for alogical grouping. The atom provides a rectangle thatis drawn around atoms. According to the associationof data objects, ED uses an ActiveX or a database con-nection. Thus, the simulation can be based for exam-ple on an Excel spreadsheet, containing input data. Ofcourse data elements in the BPMN perspective, likestandard forms are not needed for simulation.
The prescribed ED atomic structure potentially of-fers both the modeling options to map the BPMN flowelements, as well as the possibility to represent theprocess. A mapping of BPMN to ED elements can beseen in table 2. On this basis a transformation possi-bility can be derived to infer the suitability of ED asa target simulation environment. In addition, a logicdetection is needed. In the following, four different
levels of complexity of transformation can be differ-entiated.
4.2 1st Degree: Straight Mapping
The straight mapping includes presentation of the ba-sic elements, shown in table 2. A 1:1 transfer of ele-ments to ED takes place. Simple tasks can be mappedto server atom with appropriate properties. From thegroup of gateways, the parallel and the exclusive gate-ways can be transferred. The parallel gateway canbe matched to the splitter atom. The process flowcan be merged by an assembler atom. In case of anexclusive gateway, a server atom with specific “sentto” ratio will be set. This can be set by conditions,as well as a percent ratio. The merging gateway canbe set to a server atom. Such takes the product fromany input channel and supplies it to one output chan-nel. Informations about average processing time oftasks is not given by a BPMN model. Consequentlyit would have to be inserted while the transformationprocess. To get plausible simulation results, data haveto be collected. By default, this follows a negative
Table 2: Mapping complexity degrees.
BPMN Enterprise Dynamics1st degree
start-event sourceend-event sinktimer-events time based releaseparallel gateway splitter/ assemblerexclusive gateway output strategy serversequence flow relationstask server(swim) lane composition atom
2nd degreestart message event adapted sourcemessage event adapted atommessage task adapted tokensub process composition atom
3rd degreelooping task adapted serverevent based gateway adapted server
Fourth International Symposium on Business Modeling and Software Design
162
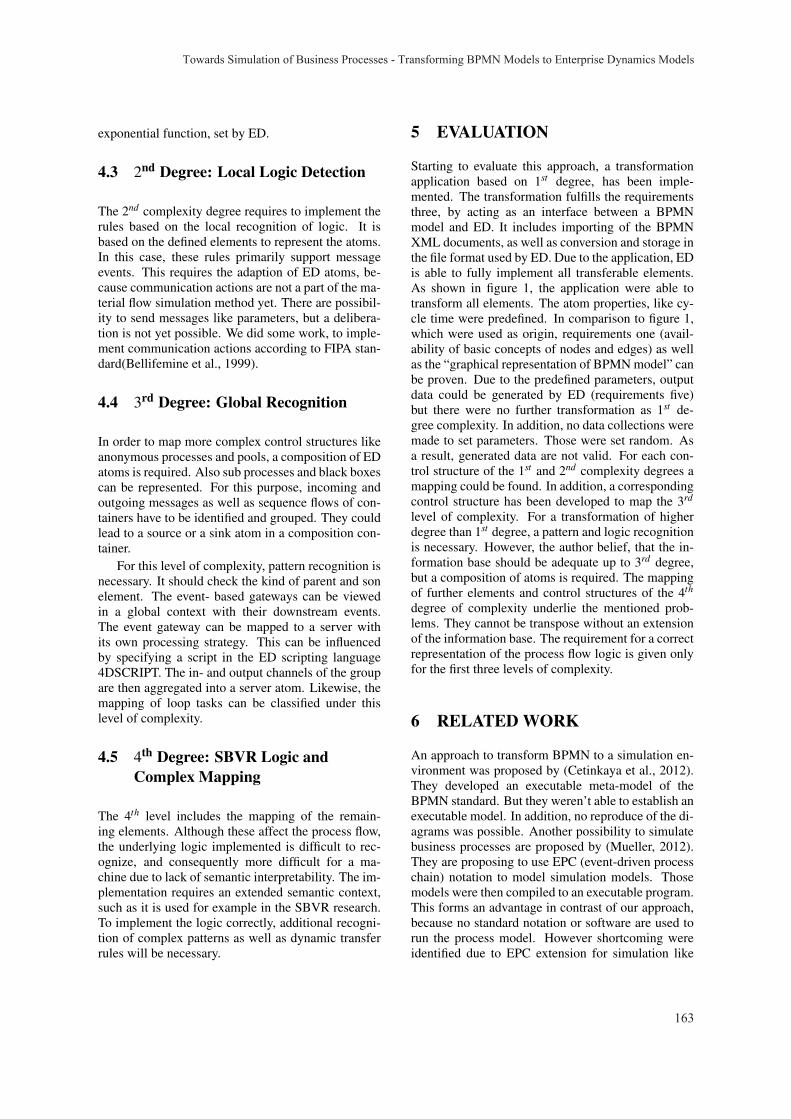
exponential function, set by ED.
4.3 2nd Degree: Local Logic Detection
The 2nd complexity degree requires to implement therules based on the local recognition of logic. It isbased on the defined elements to represent the atoms.In this case, these rules primarily support messageevents. This requires the adaption of ED atoms, be-cause communication actions are not a part of the ma-terial flow simulation method yet. There are possibil-ity to send messages like parameters, but a delibera-tion is not yet possible. We did some work, to imple-ment communication actions according to FIPA stan-dard(Bellifemine et al., 1999).
4.4 3rd Degree: Global Recognition
In order to map more complex control structures likeanonymous processes and pools, a composition of EDatoms is required. Also sub processes and black boxescan be represented. For this purpose, incoming andoutgoing messages as well as sequence flows of con-tainers have to be identified and grouped. They couldlead to a source or a sink atom in a composition con-tainer.
For this level of complexity, pattern recognition isnecessary. It should check the kind of parent and sonelement. The event- based gateways can be viewedin a global context with their downstream events.The event gateway can be mapped to a server withits own processing strategy. This can be influencedby specifying a script in the ED scripting language4DSCRIPT. The in- and output channels of the groupare then aggregated into a server atom. Likewise, themapping of loop tasks can be classified under thislevel of complexity.
4.5 4th Degree: SBVR Logic andComplex Mapping
The 4th level includes the mapping of the remain-ing elements. Although these affect the process flow,the underlying logic implemented is difficult to rec-ognize, and consequently more difficult for a ma-chine due to lack of semantic interpretability. The im-plementation requires an extended semantic context,such as it is used for example in the SBVR research.To implement the logic correctly, additional recogni-tion of complex patterns as well as dynamic transferrules will be necessary.
5 EVALUATION
Starting to evaluate this approach, a transformationapplication based on 1st degree, has been imple-mented. The transformation fulfills the requirementsthree, by acting as an interface between a BPMNmodel and ED. It includes importing of the BPMNXML documents, as well as conversion and storage inthe file format used by ED. Due to the application, EDis able to fully implement all transferable elements.As shown in figure 1, the application were able totransform all elements. The atom properties, like cy-cle time were predefined. In comparison to figure 1,which were used as origin, requirements one (avail-ability of basic concepts of nodes and edges) as wellas the “graphical representation of BPMN model” canbe proven. Due to the predefined parameters, outputdata could be generated by ED (requirements five)but there were no further transformation as 1st de-gree complexity. In addition, no data collections weremade to set parameters. Those were set random. Asa result, generated data are not valid. For each con-trol structure of the 1st and 2nd complexity degrees amapping could be found. In addition, a correspondingcontrol structure has been developed to map the 3rd
level of complexity. For a transformation of higherdegree than 1st degree, a pattern and logic recognitionis necessary. However, the author belief, that the in-formation base should be adequate up to 3rd degree,but a composition of atoms is required. The mappingof further elements and control structures of the 4th
degree of complexity underlie the mentioned prob-lems. They cannot be transpose without an extensionof the information base. The requirement for a correctrepresentation of the process flow logic is given onlyfor the first three levels of complexity.
6 RELATED WORK
An approach to transform BPMN to a simulation en-vironment was proposed by (Cetinkaya et al., 2012).They developed an executable meta-model of theBPMN standard. But they weren’t able to establish anexecutable model. In addition, no reproduce of the di-agrams was possible. Another possibility to simulatebusiness processes are proposed by (Mueller, 2012).They are proposing to use EPC (event-driven processchain) notation to model simulation models. Thosemodels were then compiled to an executable program.This forms an advantage in contrast of our approach,because no standard notation or software are used torun the process model. However shortcoming wereidentified due to EPC extension for simulation like
Towards Simulation of Business Processes - Transforming BPMN Models to Enterprise Dynamics Models
163
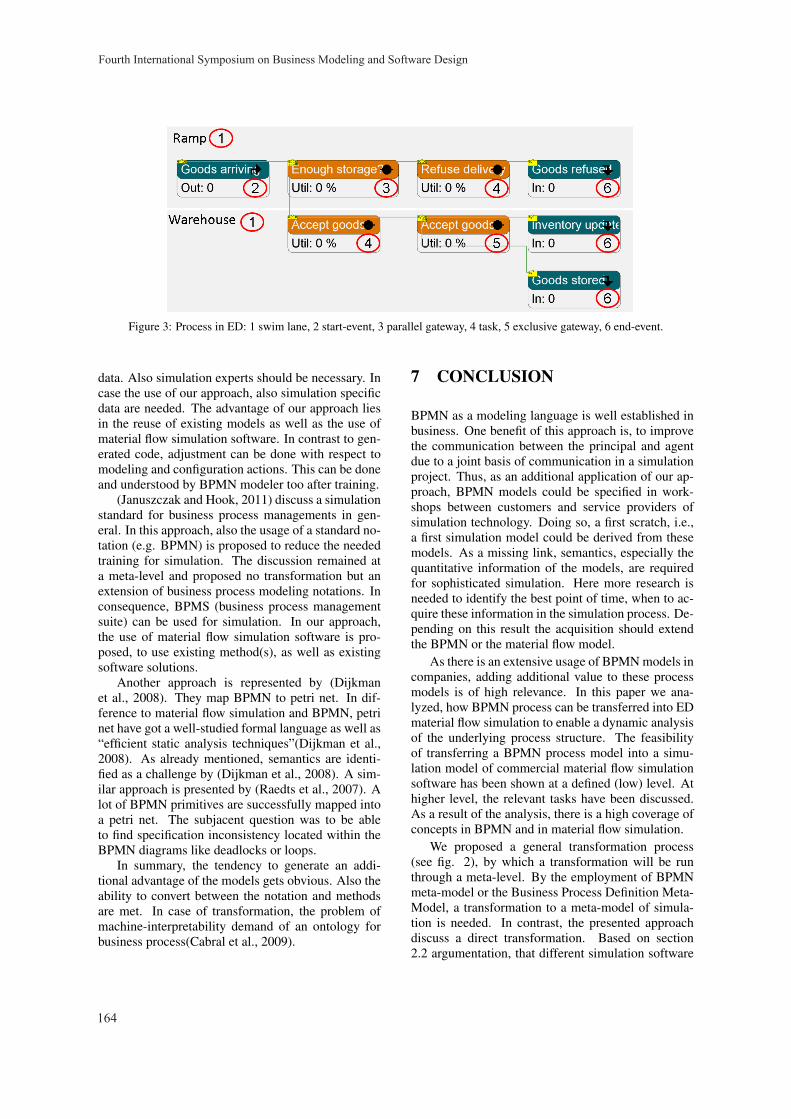
Figure 3: Process in ED: 1 swim lane, 2 start-event, 3 parallel gateway, 4 task, 5 exclusive gateway, 6 end-event.
data. Also simulation experts should be necessary. Incase the use of our approach, also simulation specificdata are needed. The advantage of our approach liesin the reuse of existing models as well as the use ofmaterial flow simulation software. In contrast to gen-erated code, adjustment can be done with respect tomodeling and configuration actions. This can be doneand understood by BPMN modeler too after training.
(Januszczak and Hook, 2011) discuss a simulationstandard for business process managements in gen-eral. In this approach, also the usage of a standard no-tation (e.g. BPMN) is proposed to reduce the neededtraining for simulation. The discussion remained ata meta-level and proposed no transformation but anextension of business process modeling notations. Inconsequence, BPMS (business process managementsuite) can be used for simulation. In our approach,the use of material flow simulation software is pro-posed, to use existing method(s), as well as existingsoftware solutions.
Another approach is represented by (Dijkmanet al., 2008). They map BPMN to petri net. In dif-ference to material flow simulation and BPMN, petrinet have got a well-studied formal language as well as“efficient static analysis techniques”(Dijkman et al.,2008). As already mentioned, semantics are identi-fied as a challenge by (Dijkman et al., 2008). A sim-ilar approach is presented by (Raedts et al., 2007). Alot of BPMN primitives are successfully mapped intoa petri net. The subjacent question was to be ableto find specification inconsistency located within theBPMN diagrams like deadlocks or loops.
In summary, the tendency to generate an addi-tional advantage of the models gets obvious. Also theability to convert between the notation and methodsare met. In case of transformation, the problem ofmachine-interpretability demand of an ontology forbusiness process(Cabral et al., 2009).
7 CONCLUSION
BPMN as a modeling language is well established inbusiness. One benefit of this approach is, to improvethe communication between the principal and agentdue to a joint basis of communication in a simulationproject. Thus, as an additional application of our ap-proach, BPMN models could be specified in work-shops between customers and service providers ofsimulation technology. Doing so, a first scratch, i.e.,a first simulation model could be derived from thesemodels. As a missing link, semantics, especially thequantitative information of the models, are requiredfor sophisticated simulation. Here more research isneeded to identify the best point of time, when to ac-quire these information in the simulation process. De-pending on this result the acquisition should extendthe BPMN or the material flow model.
As there is an extensive usage of BPMN models incompanies, adding additional value to these processmodels is of high relevance. In this paper we ana-lyzed, how BPMN process can be transferred into EDmaterial flow simulation to enable a dynamic analysisof the underlying process structure. The feasibilityof transferring a BPMN process model into a simu-lation model of commercial material flow simulationsoftware has been shown at a defined (low) level. Athigher level, the relevant tasks have been discussed.As a result of the analysis, there is a high coverage ofconcepts in BPMN and in material flow simulation.
We proposed a general transformation process(see fig. 2), by which a transformation will be runthrough a meta-level. By the employment of BPMNmeta-model or the Business Process Definition Meta-Model, a transformation to a meta-model of simula-tion is needed. In contrast, the presented approachdiscuss a direct transformation. Based on section2.2 argumentation, that different simulation software
Fourth International Symposium on Business Modeling and Software Design
164
have got different natured, but similar notations, thepresented approach is limited to following aspects:
1. static specific rules (BPMN to ED)
2. portability of approach to other material flow sim-ulation is not ensured
3. portability of approach to other business processmodeling notations like EPC is not ensured
The negotiability to other material flow simula-tion software systems as well as other modeling no-tations is disputable. Difference between modelingmethods (e.g. focus) of other software and notations,lead to different used elements. As a result, there isno standardized meta-model of material flow simu-lation. However, relevant tasks, e.g. logic detectionremain relevant to other modeling notations as wellsas to other material flow simulation software. Furtherresearch steps will include the analysis of commonmaterial flow simulation software. In comparison toBPMN notation, an ontology based approach will bedeveloped. Goal is the interoperability of BPMN tomaterial flow simulation software.
REFERENCES
Bajwa, I. S., Lee, M. G., and Bordbar, B. (2011). Sbvrbusiness rules generation from natural language spec-ification. In AAAI Spring Symposium: AI for BusinessAgility. AAAI.
Bellifemine, F., Poggi, A., and Rimassa, G. (1999). JADE- A FIPA-compliant agent framework, pages 97–108.The Practical Application Company Ltd.
Bogon, T., Jessen, U., Lattner, A. D., Paraskevopoulos, D.,Schmitz, M., Spieckermann, S., Timm, I. J., and Wen-zel, S. (2012). Towards assisted input and output dataanalysis in manufacturing simulation: The EDASimapproach. In Laroque, C., Himmelspach, J., Pasupa-thy, R., Rose, O., and Uhrmacher, A. M., editors, Win-ter Simulation Conference (WSC 2012).
Cabral, L., Norton, B., and Domingue, J. (2009). The busi-ness process modelling ontology. In Proceedings ofthe 4th International Workshop on Semantic BusinessProcess Management, SBPM ’09, pages 9–16, NewYork, NY, USA. ACM.
Cetinkaya, D., Verbraeck, A., and Seck, M. D. (2012).Model transformation from bpmn to devs in themdd4ms framework. In Wainer, G. A. and Moster-man, P. J., editors, SpringSim (TMS-DEVS), page 28.SCS/ACM.
Chinosi, M. and Trombetta, A. (2012). Bpmn: An intro-duction to the standard. Computer Standards & Inter-faces, 34(1):124–134.
Dijkman, R. M., Dumas, M., and Ouyang, C. (2008). Se-mantics and analysis of business process models inbpmn. Inf. Softw. Technol., 50(12):1281–1294.
eCH eGov (2013). ech-0073 dokumentation.
Freund, J. and Ruecker, B. (2012). Praxishandbuch BPMN2.0. Hanser, Mnchen; Wien, dritte edition.
Januszczak, J. and Hook, G. (2011). Simulation standardfor business process management. In Simulation Con-ference (WSC), Proceedings of the 2011 Winter, pages741–751.
Lattner, A. D., Pitsch, H., Timm, I. J., Spieckermann, S.,and Wenzel, S. (2011). Assistsim–towards automationof simulation studies in logistics. SNE, page 119.
L’Ecuyer, P. (1997). Uniform random number generators:A review. In Proceedings of the 29th Conference onWinter Simulation, WSC ’97, pages 127–134, Wash-ington, DC, USA. IEEE Computer Society.
Mueller, C. (2012). Generation of epc based simulationmodels. In Troitzsch, K. G., Mohring, M., and Lotz-mann, U., editors, ECMS, pages 301–305. EuropeanCouncil for Modeling and Simulation.
OMG (2008). Semantics of business vocabulary and busi-ness rules (sbvr), v1.0. Technical report, Object Man-agement Group.
OMG (2011). Business Process Model and Notation(BPMN), Version 2.0.
Raedts, I., Petkovic, M., Usenko, Y. S., van der Werf, J. M.E. M., Groote, J. F., and Somers, L. J. (2007). Trans-formation of bpmn models for behaviour analysis. InAugusto, J. C., Barjis, J., and Ultes-Nitsche, U., edi-tors, MSVVEIS, pages 126–137. INSTICC PRESS.
Rittgen, P. (1998). Prozeßtheorie der Ablaufplanung.: Alge-braische Modellierung von Prozessen, Ressourcenre-striktionen und Zeit. Teubner-Reihe Wirtschaftsinfor-matik. Teubner B.G. GmbH.
Shannon, R. E. (1998). Introduction to the art and science ofsimulation. In Proceedings of the 30th Conference onWinter Simulation, WSC ’98, pages 7–14, Los Alami-tos, CA, USA. IEEE Computer Society Press.
Wenzel, S., Collisi-Bohmer, S., Weiß, M., Rose, O., andPitsch, H. (2007). Qualitatskriterien fur die Sim-ulation in Produktion und Logistik: Planung undDurchfuhrung von Simulationsstudien. (VDI-Buch)Chemische Technik Verfahrenstechnik. Springer.
Towards Simulation of Business Processes - Transforming BPMN Models to Enterprise Dynamics Models
165
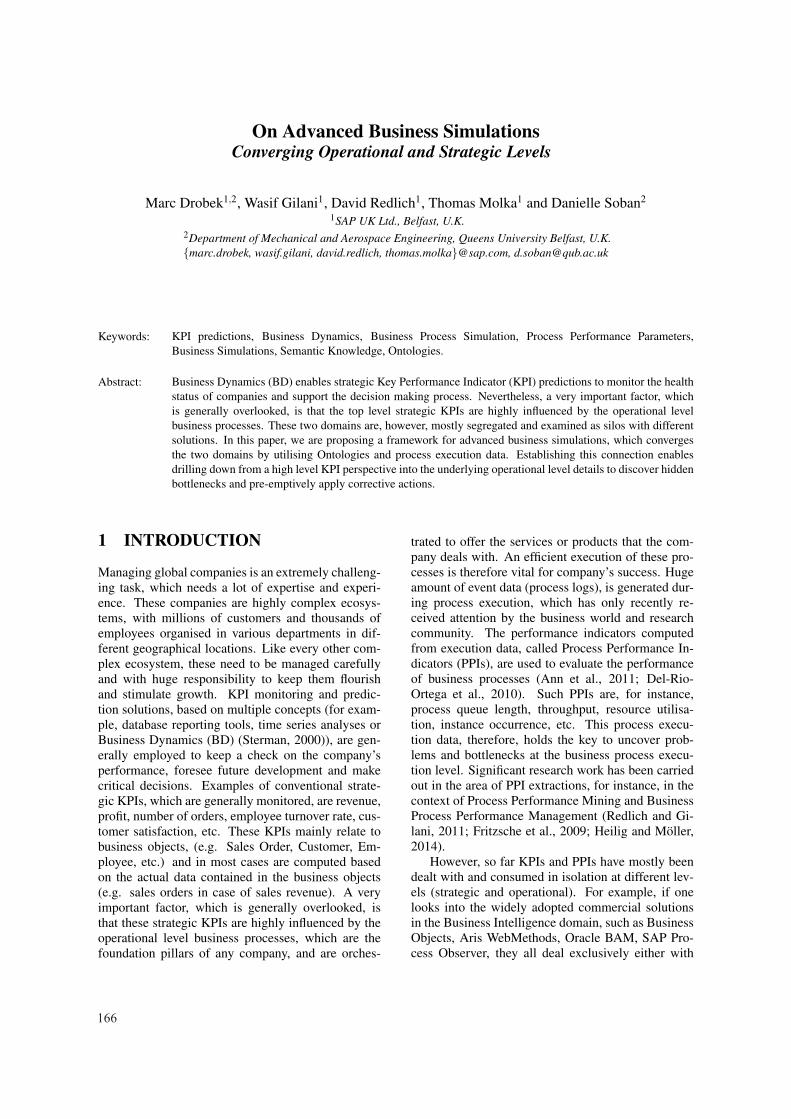
On Advanced Business SimulationsConverging Operational and Strategic Levels
Marc Drobek1,2, Wasif Gilani1, David Redlich1, Thomas Molka1 and Danielle Soban2
1SAP UK Ltd., Belfast, U.K.2Department of Mechanical and Aerospace Engineering, Queens University Belfast, U.K.{marc.drobek, wasif.gilani, david.redlich, thomas.molka}@sap.com, [email protected]
Keywords: KPI predictions, Business Dynamics, Business Process Simulation, Process Performance Parameters,Business Simulations, Semantic Knowledge, Ontologies.
Abstract: Business Dynamics (BD) enables strategic Key Performance Indicator (KPI) predictions to monitor the healthstatus of companies and support the decision making process. Nevertheless, a very important factor, whichis generally overlooked, is that the top level strategic KPIs are highly influenced by the operational levelbusiness processes. These two domains are, however, mostly segregated and examined as silos with differentsolutions. In this paper, we are proposing a framework for advanced business simulations, which convergesthe two domains by utilising Ontologies and process execution data. Establishing this connection enablesdrilling down from a high level KPI perspective into the underlying operational level details to discover hiddenbottlenecks and pre-emptively apply corrective actions.
1 INTRODUCTION
Managing global companies is an extremely challeng-ing task, which needs a lot of expertise and experi-ence. These companies are highly complex ecosys-tems, with millions of customers and thousands ofemployees organised in various departments in dif-ferent geographical locations. Like every other com-plex ecosystem, these need to be managed carefullyand with huge responsibility to keep them flourishand stimulate growth. KPI monitoring and predic-tion solutions, based on multiple concepts (for exam-ple, database reporting tools, time series analyses orBusiness Dynamics (BD) (Sterman, 2000)), are gen-erally employed to keep a check on the company’sperformance, foresee future development and makecritical decisions. Examples of conventional strate-gic KPIs, which are generally monitored, are revenue,profit, number of orders, employee turnover rate, cus-tomer satisfaction, etc. These KPIs mainly relate tobusiness objects, (e.g. Sales Order, Customer, Em-ployee, etc.) and in most cases are computed basedon the actual data contained in the business objects(e.g. sales orders in case of sales revenue). A veryimportant factor, which is generally overlooked, isthat these strategic KPIs are highly influenced by theoperational level business processes, which are thefoundation pillars of any company, and are orches-
trated to offer the services or products that the com-pany deals with. An efficient execution of these pro-cesses is therefore vital for company’s success. Hugeamount of event data (process logs), is generated dur-ing process execution, which has only recently re-ceived attention by the business world and researchcommunity. The performance indicators computedfrom execution data, called Process Performance In-dicators (PPIs), are used to evaluate the performanceof business processes (Ann et al., 2011; Del-Rio-Ortega et al., 2010). Such PPIs are, for instance,process queue length, throughput, resource utilisa-tion, instance occurrence, etc. This process execu-tion data, therefore, holds the key to uncover prob-lems and bottlenecks at the business process execu-tion level. Significant research work has been carriedout in the area of PPI extractions, for instance, in thecontext of Process Performance Mining and BusinessProcess Performance Management (Redlich and Gi-lani, 2011; Fritzsche et al., 2009; Heilig and Moller,2014).
However, so far KPIs and PPIs have mostly beendealt with and consumed in isolation at different lev-els (strategic and operational). For example, if onelooks into the widely adopted commercial solutionsin the Business Intelligence domain, such as BusinessObjects, Aris WebMethods, Oracle BAM, SAP Pro-cess Observer, they all deal exclusively either with
166
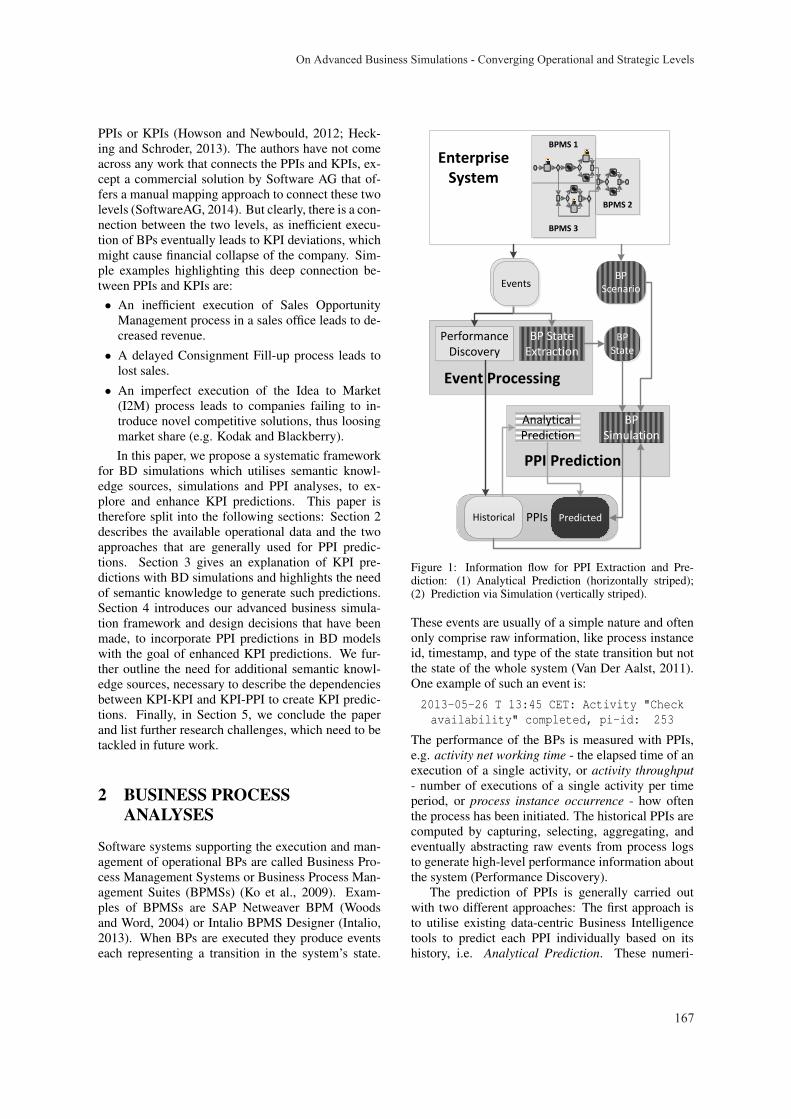
PPIs or KPIs (Howson and Newbould, 2012; Heck-ing and Schroder, 2013). The authors have not comeacross any work that connects the PPIs and KPIs, ex-cept a commercial solution by Software AG that of-fers a manual mapping approach to connect these twolevels (SoftwareAG, 2014). But clearly, there is a con-nection between the two levels, as inefficient execu-tion of BPs eventually leads to KPI deviations, whichmight cause financial collapse of the company. Sim-ple examples highlighting this deep connection be-tween PPIs and KPIs are:• An inefficient execution of Sales Opportunity
Management process in a sales office leads to de-creased revenue.
• A delayed Consignment Fill-up process leads tolost sales.
• An imperfect execution of the Idea to Market(I2M) process leads to companies failing to in-troduce novel competitive solutions, thus loosingmarket share (e.g. Kodak and Blackberry).In this paper, we propose a systematic framework
for BD simulations which utilises semantic knowl-edge sources, simulations and PPI analyses, to ex-plore and enhance KPI predictions. This paper istherefore split into the following sections: Section 2describes the available operational data and the twoapproaches that are generally used for PPI predic-tions. Section 3 gives an explanation of KPI pre-dictions with BD simulations and highlights the needof semantic knowledge to generate such predictions.Section 4 introduces our advanced business simula-tion framework and design decisions that have beenmade, to incorporate PPI predictions in BD modelswith the goal of enhanced KPI predictions. We fur-ther outline the need for additional semantic knowl-edge sources, necessary to describe the dependenciesbetween KPI-KPI and KPI-PPI to create KPI predic-tions. Finally, in Section 5, we conclude the paperand list further research challenges, which need to betackled in future work.
2 BUSINESS PROCESSANALYSES
Software systems supporting the execution and man-agement of operational BPs are called Business Pro-cess Management Systems or Business Process Man-agement Suites (BPMSs) (Ko et al., 2009). Exam-ples of BPMSs are SAP Netweaver BPM (Woodsand Word, 2004) or Intalio BPMS Designer (Intalio,2013). When BPs are executed they produce eventseach representing a transition in the system’s state.
Enterprise System
BPMS 1
Event Processing
Performance Discovery
BPMS 3
BPMS 2
Events
PPIsHistorical Predicted
BP Simulation
BP Scenario
BP State Extraction
BP State
PPI Prediction
Analytical Prediction
Events
Figure 1: Information flow for PPI Extraction and Pre-diction: (1) Analytical Prediction (horizontally striped);(2) Prediction via Simulation (vertically striped).
These events are usually of a simple nature and oftenonly comprise raw information, like process instanceid, timestamp, and type of the state transition but notthe state of the whole system (Van Der Aalst, 2011).One example of such an event is:
2013-05-26 T 13:45 CET: Activity "Checkavailability" completed, pi-id: 253
The performance of the BPs is measured with PPIs,e.g. activity net working time - the elapsed time of anexecution of a single activity, or activity throughput- number of executions of a single activity per timeperiod, or process instance occurrence - how oftenthe process has been initiated. The historical PPIs arecomputed by capturing, selecting, aggregating, andeventually abstracting raw events from process logsto generate high-level performance information aboutthe system (Performance Discovery).
The prediction of PPIs is generally carried outwith two different approaches: The first approach isto utilise existing data-centric Business Intelligencetools to predict each PPI individually based on itshistory, i.e. Analytical Prediction. These numeri-
On Advanced Business Simulations - Converging Operational and Strategic Levels
167
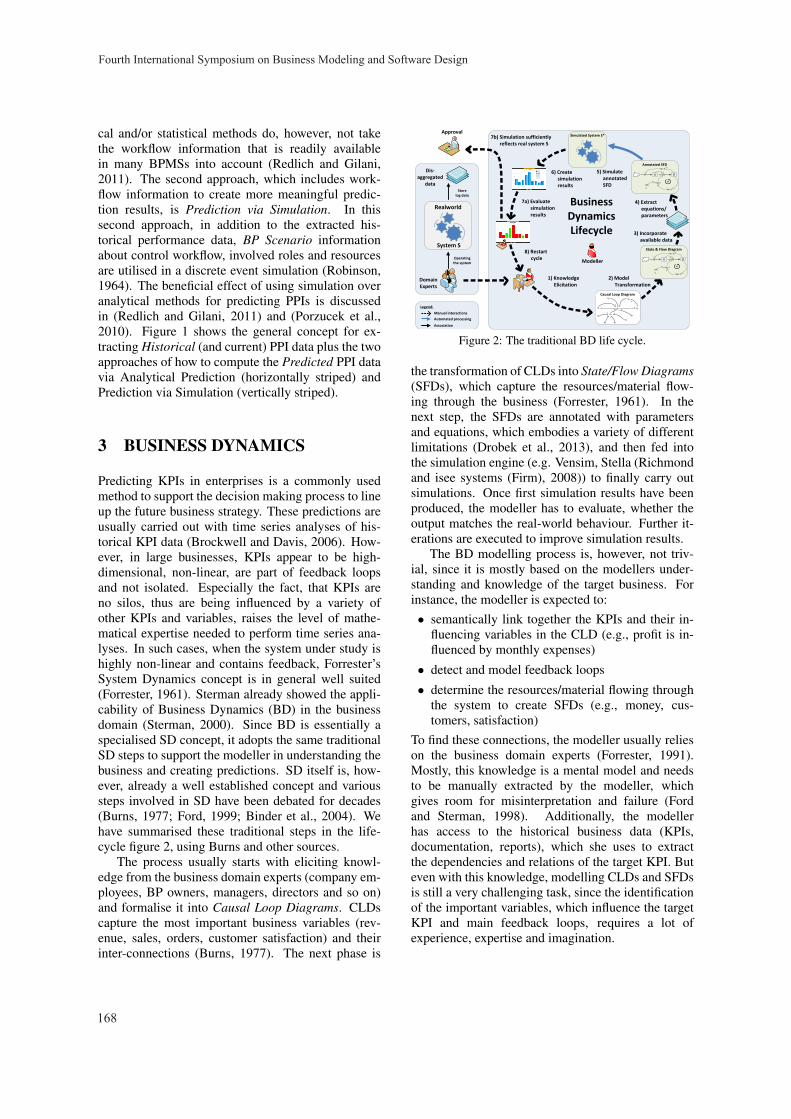
cal and/or statistical methods do, however, not takethe workflow information that is readily availablein many BPMSs into account (Redlich and Gilani,2011). The second approach, which includes work-flow information to create more meaningful predic-tion results, is Prediction via Simulation. In thissecond approach, in addition to the extracted his-torical performance data, BP Scenario informationabout control workflow, involved roles and resourcesare utilised in a discrete event simulation (Robinson,1964). The beneficial effect of using simulation overanalytical methods for predicting PPIs is discussedin (Redlich and Gilani, 2011) and (Porzucek et al.,2010). Figure 1 shows the general concept for ex-tracting Historical (and current) PPI data plus the twoapproaches of how to compute the Predicted PPI datavia Analytical Prediction (horizontally striped) andPrediction via Simulation (vertically striped).
3 BUSINESS DYNAMICS
Predicting KPIs in enterprises is a commonly usedmethod to support the decision making process to lineup the future business strategy. These predictions areusually carried out with time series analyses of his-torical KPI data (Brockwell and Davis, 2006). How-ever, in large businesses, KPIs appear to be high-dimensional, non-linear, are part of feedback loopsand not isolated. Especially the fact, that KPIs areno silos, thus are being influenced by a variety ofother KPIs and variables, raises the level of mathe-matical expertise needed to perform time series ana-lyses. In such cases, when the system under study ishighly non-linear and contains feedback, Forrester’sSystem Dynamics concept is in general well suited(Forrester, 1961). Sterman already showed the appli-cability of Business Dynamics (BD) in the businessdomain (Sterman, 2000). Since BD is essentially aspecialised SD concept, it adopts the same traditionalSD steps to support the modeller in understanding thebusiness and creating predictions. SD itself is, how-ever, already a well established concept and varioussteps involved in SD have been debated for decades(Burns, 1977; Ford, 1999; Binder et al., 2004). Wehave summarised these traditional steps in the life-cycle figure 2, using Burns and other sources.
The process usually starts with eliciting knowl-edge from the business domain experts (company em-ployees, BP owners, managers, directors and so on)and formalise it into Causal Loop Diagrams. CLDscapture the most important business variables (rev-enue, sales, orders, customer satisfaction) and theirinter-connections (Burns, 1977). The next phase is
Figure 2: The traditional BD life cycle.
the transformation of CLDs into State/Flow Diagrams(SFDs), which capture the resources/material flow-ing through the business (Forrester, 1961). In thenext step, the SFDs are annotated with parametersand equations, which embodies a variety of differentlimitations (Drobek et al., 2013), and then fed intothe simulation engine (e.g. Vensim, Stella (Richmondand isee systems (Firm), 2008)) to finally carry outsimulations. Once first simulation results have beenproduced, the modeller has to evaluate, whether theoutput matches the real-world behaviour. Further it-erations are executed to improve simulation results.
The BD modelling process is, however, not triv-ial, since it is mostly based on the modellers under-standing and knowledge of the target business. Forinstance, the modeller is expected to:• semantically link together the KPIs and their in-
fluencing variables in the CLD (e.g., profit is in-fluenced by monthly expenses)
• detect and model feedback loops
• determine the resources/material flowing throughthe system to create SFDs (e.g., money, cus-tomers, satisfaction)
To find these connections, the modeller usually relieson the business domain experts (Forrester, 1991).Mostly, this knowledge is a mental model and needsto be manually extracted by the modeller, whichgives room for misinterpretation and failure (Fordand Sterman, 1998). Additionally, the modellerhas access to the historical business data (KPIs,documentation, reports), which she uses to extractthe dependencies and relations of the target KPI. Buteven with this knowledge, modelling CLDs and SFDsis still a very challenging task, since the identificationof the important variables, which influence the targetKPI and main feedback loops, requires a lot ofexperience, expertise and imagination.
Fourth International Symposium on Business Modeling and Software Design
168
Enterprise System
Event Processing
Performance Discovery
Events
PPIsHistorical Predicted
BP Scenario
BP State Extraction
BP StateEvents
BD Lifecycle
Semantic Knowledge
Model
KPIs
Predicted
CLDcreation
SFDcreation
Enhanced CLD
SFD
BusinessProcess
Level
StrategicLevel
BusinessData
Historical
BP Simulation
BD Simulation (SFD)
Simulation Engine
ExternalVariable
BPMS 1
BPMS 3
BPMS 2
Figure 3: Framework for linking strategic KPIs with operational PPIs.
4 AN ADVANCED BUSINESSSIMULATION FRAMEWORK
As stated earlier in the introductory section, and high-lighted with examples, the strategic KPIs are highlyinfluenced by the execution of BPs at the operationallevel. However, the strategic level decision makers(head of sales, board members, etc.) lack the processlevel visibility to make informed decisions. Establish-ing a link between the PPIs and KPIs will enable thisprocess visibility. Our proposed framework solution,in addition to the strategic KPIs, also incorporates thepredicted PPIs in the BD life cycle, thus establish-ing a link between the operational and strategic level.With these links, our framework enables identifyingand addressing issues and bottlenecks pro-actively atthe operational level before they start impacting thestrategic KPIs. Figure 3 shows a schematic descrip-tion of our advanced business simulation framework.The two main approaches to compute PPI predictionsare described in Section 2. Our framework employsthe second approach, Prediction via Simulation, be-cause it preserves the control flow information of thetargeted BPs and thereby helps to exploit the bene-fits of behavioural simulations (Porzucek et al., 2010).Additionally, the KPI prediction process via BD sim-ulation is orchestrated following the BD life cycleprovided in Section 3 (shown in figure 2). The con-nection between the operational and strategic level isestablished by including the PPIs in the CLD creationprocess. This is done by applying causal indicators,such as correlations and Granger causality (Granger,
1969), among the KPIs and PPIs and further extract-ing their semantic dependencies from available en-terprise ontologies, as described later. The precom-puted PPIs are an additional input data source, whendesigning these enhanced CLDs in our framework.Once an enhanced CLD is transformed into an SFD,it is simulated and finally KPI predictions are gener-ated. In a standard BD simulation run, each elementapart from static parameters or converters is simu-lated. Since the PPIs are more accurately calculatedvia event processing and BP simulations (as shown infigure 1), they are not recomputed again in the BDsimulation. The reason behind this accuracy is theavailability of highly formalised and well structuredbehavioural models and event data that enables an au-tomated prediction process. The PPIs are therefore,by definition, considered to be parameters or convert-ers in a BD simulation run, even though, they alsochange over time. Our solution introduces a new BDelement type called ”external variable”, which mapsto a precomputed PPI. Such an external variable is notinfluenced by any of the other BD elements, but is stillcontinuously updated with each simulation run at theoperational level.
The creation of CLDs has always been a non-trivial task, as discussed in Section 3. By introduc-ing an additional operational PPI input, this prob-lem becomes even more challenging. This raises theneed for a definition of some sort of a ”dependencymodel” to provide a guideline on how to link to-gether operational data to the KPIs. Such a modelneeds to describe the relations and dependencies be-
On Advanced Business Simulations - Converging Operational and Strategic Levels
169
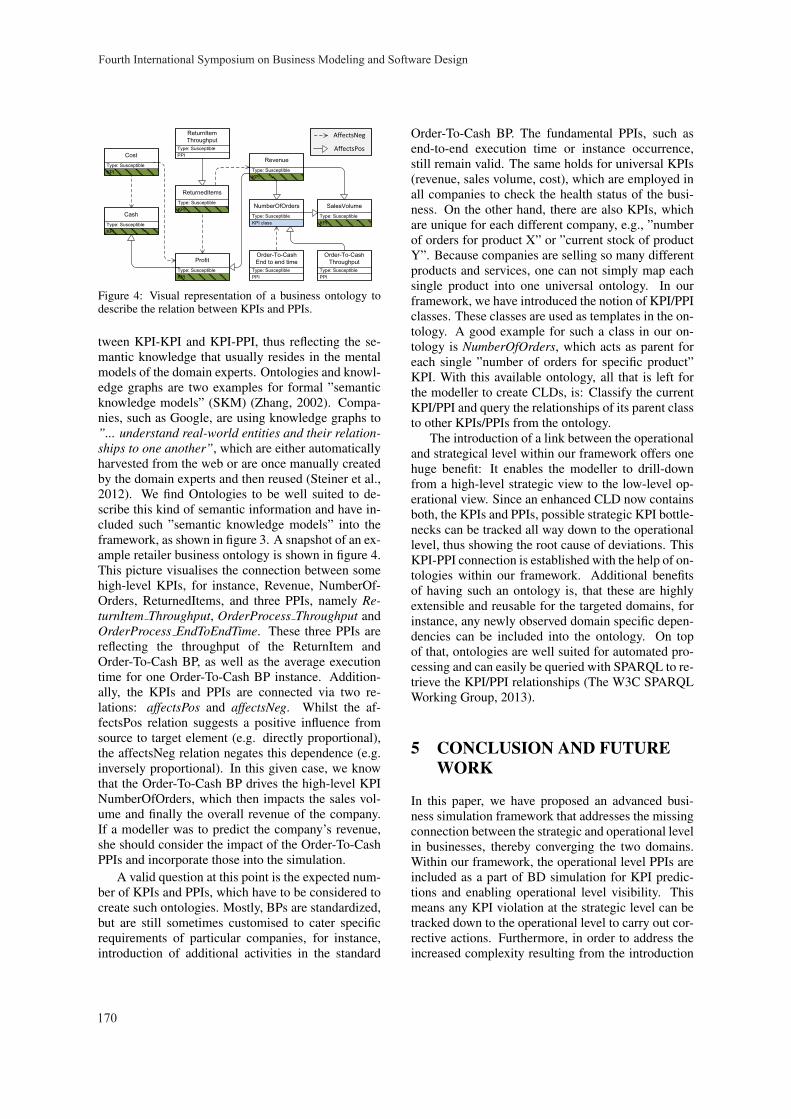
Figure 4: Visual representation of a business ontology todescribe the relation between KPIs and PPIs.
tween KPI-KPI and KPI-PPI, thus reflecting the se-mantic knowledge that usually resides in the mentalmodels of the domain experts. Ontologies and knowl-edge graphs are two examples for formal ”semanticknowledge models” (SKM) (Zhang, 2002). Compa-nies, such as Google, are using knowledge graphs to”... understand real-world entities and their relation-ships to one another”, which are either automaticallyharvested from the web or are once manually createdby the domain experts and then reused (Steiner et al.,2012). We find Ontologies to be well suited to de-scribe this kind of semantic information and have in-cluded such ”semantic knowledge models” into theframework, as shown in figure 3. A snapshot of an ex-ample retailer business ontology is shown in figure 4.This picture visualises the connection between somehigh-level KPIs, for instance, Revenue, NumberOf-Orders, ReturnedItems, and three PPIs, namely Re-turnItem Throughput, OrderProcess Throughput andOrderProcess EndToEndTime. These three PPIs arereflecting the throughput of the ReturnItem andOrder-To-Cash BP, as well as the average executiontime for one Order-To-Cash BP instance. Addition-ally, the KPIs and PPIs are connected via two re-lations: affectsPos and affectsNeg. Whilst the af-fectsPos relation suggests a positive influence fromsource to target element (e.g. directly proportional),the affectsNeg relation negates this dependence (e.g.inversely proportional). In this given case, we knowthat the Order-To-Cash BP drives the high-level KPINumberOfOrders, which then impacts the sales vol-ume and finally the overall revenue of the company.If a modeller was to predict the company’s revenue,she should consider the impact of the Order-To-CashPPIs and incorporate those into the simulation.
A valid question at this point is the expected num-ber of KPIs and PPIs, which have to be considered tocreate such ontologies. Mostly, BPs are standardized,but are still sometimes customised to cater specificrequirements of particular companies, for instance,introduction of additional activities in the standard
Order-To-Cash BP. The fundamental PPIs, such asend-to-end execution time or instance occurrence,still remain valid. The same holds for universal KPIs(revenue, sales volume, cost), which are employed inall companies to check the health status of the busi-ness. On the other hand, there are also KPIs, whichare unique for each different company, e.g., ”numberof orders for product X” or ”current stock of productY”. Because companies are selling so many differentproducts and services, one can not simply map eachsingle product into one universal ontology. In ourframework, we have introduced the notion of KPI/PPIclasses. These classes are used as templates in the on-tology. A good example for such a class in our on-tology is NumberOfOrders, which acts as parent foreach single ”number of orders for specific product”KPI. With this available ontology, all that is left forthe modeller to create CLDs, is: Classify the currentKPI/PPI and query the relationships of its parent classto other KPIs/PPIs from the ontology.
The introduction of a link between the operationaland strategical level within our framework offers onehuge benefit: It enables the modeller to drill-downfrom a high-level strategic view to the low-level op-erational view. Since an enhanced CLD now containsboth, the KPIs and PPIs, possible strategic KPI bottle-necks can be tracked all way down to the operationallevel, thus showing the root cause of deviations. ThisKPI-PPI connection is established with the help of on-tologies within our framework. Additional benefitsof having such an ontology is, that these are highlyextensible and reusable for the targeted domains, forinstance, any newly observed domain specific depen-dencies can be included into the ontology. On topof that, ontologies are well suited for automated pro-cessing and can easily be queried with SPARQL to re-trieve the KPI/PPI relationships (The W3C SPARQLWorking Group, 2013).
5 CONCLUSION AND FUTUREWORK
In this paper, we have proposed an advanced busi-ness simulation framework that addresses the missingconnection between the strategic and operational levelin businesses, thereby converging the two domains.Within our framework, the operational level PPIs areincluded as a part of BD simulation for KPI predic-tions and enabling operational level visibility. Thismeans any KPI violation at the strategic level can betracked down to the operational level to carry out cor-rective actions. Furthermore, in order to address theincreased complexity resulting from the introduction
Fourth International Symposium on Business Modeling and Software Design
170
of PPIs into BD simulations, we have designed andimplemented additional SKMs. These SKMs (ontolo-gies) provide knowledge about relations and depen-dencies of KPIs and PPIs, and can be used as busi-ness dictionaries to look up relationships of KPIs andPPIs either manually or automatically. An automatedconsumption of SKMs can further be used to auto-mate the BD simulation process for continuous KPIpredictions in real-time. So far this approach is uni-directional, because we have only incorporated PPIsas main influencing factor towards KPIs. For futurework, it would be interesting to analyse the KPI influ-ence towards PPIs as well. We believe, that the pre-diction of PPIs could also be beneficially impactedby incorporating the simulated KPIs. The next stepwould be, to evaluate the framework in the context ofan industrial use-case, to demonstrate improved KPIpredictions.
REFERENCES
Ann, R., Chase, G., Omar, R., Taylor, J., and von Rosing,M. (2011). Applying Real-World BPM in an SAP En-vironment. Galileo Press, Bonn.
Binder, T., Vox, A., Belyazid, S., Haraldsson, H. V., andSvensson, M. (2004). Developing System Dynamicsmodels from Causal Loop Diagrams. Technical re-port, University of Luebeck, Germany; Lund Univer-sity, Sweden.
Brockwell, P. J. and Davis, R. A. (2006). Time Series: The-ory and Methods. Springer, second edition.
Burns, J. R. (1977). Converting signed digraphs to For-rester schematics and converting Forrester schematicsto Differential equations. IEEE Transactions on sys-tems, man, and cybernetics, 10:695–707.
Del-Rio-Ortega, A., Resinas, M., and Ruiz-Cortes, A.(2010). Defining Process Performance Indicators : AnOntological Approach. On the Move to MeaningfulInternet Systems: OTM 2010, 6426:555–572.
Drobek, M., Gilani, W., and Soban, D. (2013). Parameterestimation and equation formulation in Business Dy-namics. In Third International Symposium on Busi-ness Modeling and Software Design, Noordwijker-hout. ScitePress.
Ford, A. (1999). Modeling the environment: An Intro-duction to System Dynamics Models of EnvironmentalSystems. Island Press, Washington, D.C.
Ford, D. N. and Sterman, J. D. (1998). Expert knowledgeelicitation to improve formal and mental models. Sys-tem Dynamics Review, 14(4):309–340.
Forrester, J. W. (1961). Industrial Dynamics. MIT Press;currently available from Pegasus Communications;Waltham, MA, Cambridge, MA.
Forrester, J. W. (1991). System Dynamics and the Lessonsof 35 Years. pages 1–35.
Fritzsche, M., Picht, M., Gilani, W., Spence, I., Brown,J., and Kilpatrick, P. (2009). Extending BPM Envi-ronments of Your Choice with Performance RelatedDecision Support. In Business Process Management,pages 97–112. Springer.
Granger, C. W. J. (1969). Investigating Causal Relationsby Econometric Models and Cross-spectral Methods.Econometrica, 37(3):424–438.
Hecking, M. and Schroder, C. (2013). Current Implementa-tion Level of Business Process Management in Corpo-rate Practice: A Quantitative Analysis. GRIN Verlag.
Heilig, B. and Moller, M. (2014). Business Process Man-agement mit SAP NetWeaver BPM. Galileo PressGmbh, 1st edition.
Howson, C. and Newbould, E. (2012). SAP BusinessOb-jects BI 4.0 The Complete Reference 3/E. McGraw-Hill Osborne, 3rd edition.
Intalio (2013). BPMS designer; http://www.intalio.com/products/bpms/overview/.
Ko, R. K. L., Lee, S. S. G., and Lee, E. W. (2009). Busi-ness process management (BPM) standards: a survey.Business Process Management Journal.
Porzucek, T., Kluth, S., Fritzsche, M., and Redlich, D.(2010). Combination of a Discrete Event Simula-tion and an Analytical Performance Analysis throughModel-Transformations. In IEEE ECBS, pages 183–192.
Redlich, D. and Gilani, W. (2011). Event-Driven Process-Centric Performance Prediction via Simulation. InBPM Workshops.
Richmond, B. and isee systems (Firm) (2008). An Introduc-tion to Systems Thinking: STELLA Software.
Robinson, S. (1964). Simulation - The Practice of ModelDevelopment and Use. John Wiley & Sons.
SoftwareAG (2014). Software AG: webMethods, lastaccessed: April 2014; http://www.softwareag.com/corporate/products/wm/bpm/overview/default.asp.
Steiner, T., Verborgh, R., Troncy, R., Gabarro, J., and Walle,R. V. D. (2012). Adding Realtime Coverage to theGoogle Knowledge Graph. In Proceedings of theISWC 2012.
Sterman, J. D. (2000). Business Dynamics: Systems think-ing and modeling for a complex world. McGraw-Hill,New York, NY.
The W3C SPARQL Working Group (2013). SPARQLQuery Language for RDF; http://www.w3.org/TR/rdf-sparql-query/.
Van Der Aalst, W. (2011). Process Mining - Discov-ery, Conformance and Enhancement of Business Pro-cesses. Springer.
Woods, D. and Word, J. (2004). SAP Netweaver for Dum-mies. Wiley Hoboken.
Zhang, L. (2002). Knowledge Graph Theory and StructuralParsing. Ph.d. thesis, University of Twente.
On Advanced Business Simulations - Converging Operational and Strategic Levels
171
Multi-Level Business Modeling and Simulation
Koen Casier, Marlies Van der Wee, Sofie Verbrugge Internet Based Communication Networks and Services research group –IBCN, Ghent University, Belgium
Heritiana Ranaivoson, Tanguy Coenen, Camille Reynders SMIT research group, Vrije Universiteit Brussel, Belgium
Keywords: Cost Benefit Analysis, Computer Networks, Computational Modeling, Graphical Models, Cost Benefit Modeling, Business Modeling.
Abstract: The rapid succession of technological advances leads to important convergences of applications, devices and networks. More and more firms, previously locked in a niche, are exposed to a more global market and interactions with other firms. Pushing a new offer on the market requires a thorough understanding of this altered market. In essence, pushing a new offer requires basic business modeling and simulation. Often, this is performed by making a “back of the envelope” calculation. This calculation quickly grows out of proportions if the novel business proposition requires interactions with many other parties. In this paper, we present a scalable multi-level business modeling and quantification approach. It combines the intuitive structure and interactive discussions of a multi-user business modeling tool, while directly linking to a lower level for more technical modeling and simulation of costs and revenues. By combining these two levels of refinement, the business aspects are clearly separated from the calculation techniques, increasing ease and speed of modeling at the business side. Delegating the cost calculations to the more technical models allows for a truthful and reliable mimicking of the actual structure and costs. To achieve this, several detailed cost modeling languages are presented and linked to the higher level business modeling. Finally, this multi-level business modeling and simulation approach is applied to the case of an open access fibre to the home network deployment. The results clearly show the power of using such a multi-level business modeling and simulation approach.
1 INTRODUCTION
Increasing competitive pressure makes business model innovation an important issue for most companies. Especially collaborative business models, which require a strategic fit between various stakeholders involved, require an intensive interaction and consensus building related to assumptions, architectures and outcomes. Like many other creative processes (architecture, software design, new product development, etc.), business model innovation can also be supported by tools (Coenen et al, 2010). However, while a few basic frameworks exist, tool development for collaborative business model innovation is still in its infancy.
Many business modelling approaches start from a conceptual visualization of the context of one offering on the market, typically of one firm
(Osterwalder et al, 2005) and (Al-Debei et al, 2010). The extended notion of a multi-firm interaction with several offerings and objectives exists and is typically visualized by means of a value network (Pijpers 2011). Still, most approaches are aimed at visualizing the interactions, often around one central firm and looking at one final offering on the market. A more truthful representation of reality in a business model should be seen as a network or graph of actors, the activities they perform, and all kinds of interactions between these actors. In order to be useful in advanced analysis, such business model should be set up according to a standardized ontology for which we used the SIMBU method (Coenen et al, 2009) as a starting point. The simple but expressive ontology proposed there, allows for the creation of complex business models and permits the support of consecutive simulations, to give users a better basis for decision making.
172
Although a business model consists of smaller elements as roles, actors, activities, value streams, etc., this is much too high level to estimate costs, revenues, losses or profits. Traditional cost benefit analysis, on the other hand, takes a closer look at the economics of a new investment, starting from dedicated calculations (Analysys Mason, 2008) in isolated cases and working with generic and reusable cost modeling languages and calculations (Van der Wee et al, 2012). Making dedicated calculations requires every researcher to redo the modeling if they have no access to the original model. Additionally, it does not allow extending and linking to other models. Building complex models will benefit from reusability, verification, exchange between researchers and business experts and linking to other models. Additionally using domain specific languages as opposed to grand tools with many parameters, will increase the transparency and ease of reading and understanding. Combining both approaches by working with standardized, reusable, domain specific languages will increase the strength of the business models.
On the one hand business experts (e.g. CEOs, entrepreneurs) talk about the roles and interactions of the different actors in a business model when they want to introduce a novel product or service on the market. On the other hand, a cost-benefit analysis is typically built for an isolated business case (one actor only), using dedicated, purpose-built models. If both approaches can be captured with the right level of detail and domain specific intuitive models and linked to each other, this will lead to additional information on the full business model, as well as on the isolated business cases. The combination of approaches will allow business experts to work on a higher level and design the business model as links between more detailed cost-benefit models, e.g. cloud infrastructure, network installation, etc. These models are then delegated to technical experts and more detailed modeling languages. A repository of models and fragments at both levels will increase the applicability of the approach and the speed of prototyping business models. This paper presents the combined approach, which is under active research and development and is called hereafter the BEMES (Business Modeling and Simulation) approach.
In this paper, the BEMES approach is applied to a prototype business model for a fiber to the home (FTTH) case, where one physical infrastructure FTTH provider is installing a new FTTH network and opening up this network in a non-discriminatory way to all available network and service providers. The multi-level business modeling approach allows
visualizing the main business interactions rapidly, and learns about the profitability of all actors at the same time. It also shows the ways one firm’s failing business case can be made viable within the group of actors in the full business model.
In section II, the BEMES business modeling tool is rapidly introduced and then compared to some of the main existing business modeling approaches.
As mentioned above, the business models need to be complemented with a cost-benefit analysis in order to get correct and useful advice and information from the business model. Building a reliable cost-benefit analysis also benefits from using problem specific modeling languages. In Section III, an overview of existing and novel cost modeling languages (technical expert tools) is presented.
In Section IV, both levels of modeling are linked to each other. As a proof of concept, a multi-level model for an open access FTTH network is built and the results of this model are inspected.
Finally, Section V concludes by summing up the main findings of this work and by presenting future steps in the development and extension of this multi-level business modeling and simulation approach.
2 BUSINESS MODELING
People use business modeling with the aim to analyze the current functioning of a firm or an industry, identify challenges, and possibly propose better business configurations. When building the business model, users need a highly interactive tool for drawing and discussing on their view of the industry actors and their interactions. It should be sufficiently high level, and no detailed cost and revenue discussions or simulations should be necessary at this level. The BEMES Business Modeling, proposed in this paper, is based on the SIMBU method (Coenen et al, 2009). It features a value-flow based approach, and uses a simple and intuitive ontology specifically designed to allow for collaborative business modelling.
With BEMES, building a business model consists in identifying every actor, their activities and the interactions between their activities. A business model configuration corresponds to a given business model with specific values (e.g. cost amounts, revenue percentages, etc.). It is easy to compare different configurations or scenarios by playing with these values within the given business model. It is also possible to compare different approaches in setting up a working business model
Multi-Level Business Modeling and Simulation
173
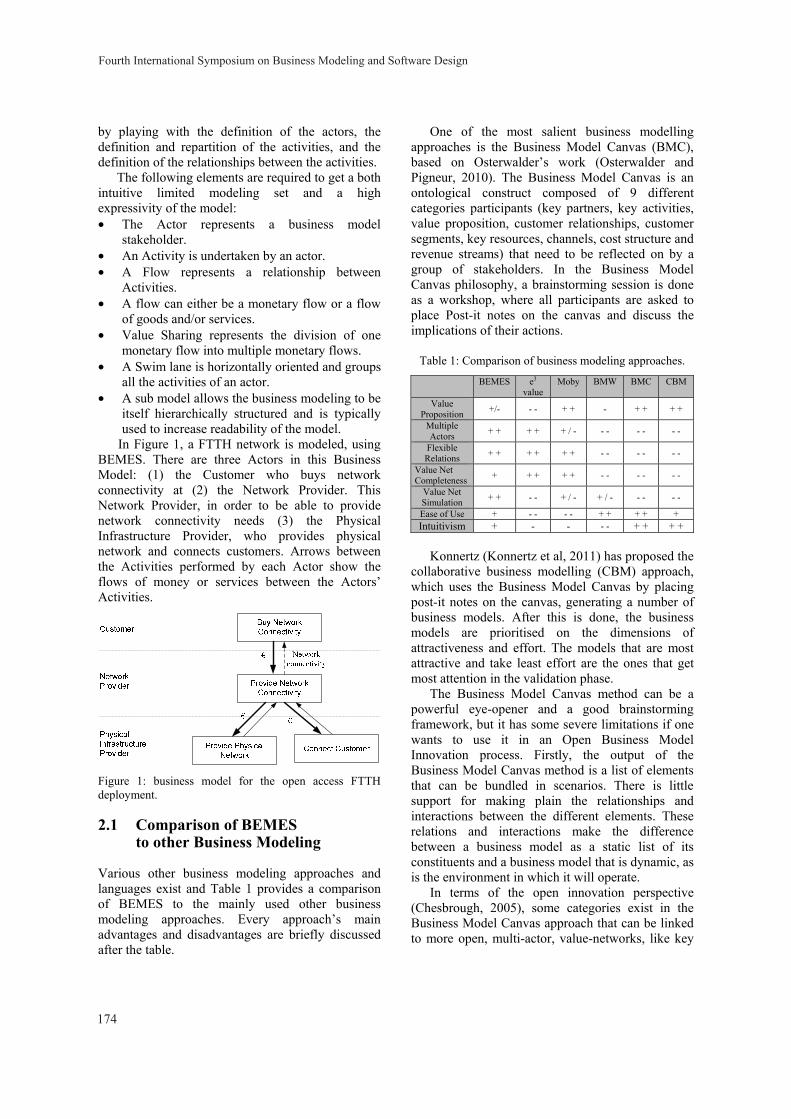
by playing with the definition of the actors, the definition and repartition of the activities, and the definition of the relationships between the activities.
The following elements are required to get a both intuitive limited modeling set and a high expressivity of the model: • The Actor represents a business model
stakeholder. • An Activity is undertaken by an actor. • A Flow represents a relationship between
Activities. • A flow can either be a monetary flow or a flow
of goods and/or services. • Value Sharing represents the division of one
monetary flow into multiple monetary flows. • A Swim lane is horizontally oriented and groups
all the activities of an actor. • A sub model allows the business modeling to be
itself hierarchically structured and is typically used to increase readability of the model.
In Figure 1, a FTTH network is modeled, using BEMES. There are three Actors in this Business Model: (1) the Customer who buys network connectivity at (2) the Network Provider. This Network Provider, in order to be able to provide network connectivity needs (3) the Physical Infrastructure Provider, who provides physical network and connects customers. Arrows between the Activities performed by each Actor show the flows of money or services between the Actors’ Activities.
Figure 1: business model for the open access FTTH deployment.
2.1 Comparison of BEMES to other Business Modeling
Various other business modeling approaches and languages exist and Table 1 provides a comparison of BEMES to the mainly used other business modeling approaches. Every approach’s main advantages and disadvantages are briefly discussed after the table.
One of the most salient business modelling approaches is the Business Model Canvas (BMC), based on Osterwalder’s work (Osterwalder and Pigneur, 2010). The Business Model Canvas is an ontological construct composed of 9 different categories participants (key partners, key activities, value proposition, customer relationships, customer segments, key resources, channels, cost structure and revenue streams) that need to be reflected on by a group of stakeholders. In the Business Model Canvas philosophy, a brainstorming session is done as a workshop, where all participants are asked to place Post-it notes on the canvas and discuss the implications of their actions.
Table 1: Comparison of business modeling approaches.
BEMES e3 value
Moby BMW BMC CBM
Value Proposition +/- - - + + - + + + +
Multiple Actors + + + + + / - - - - - - -
Flexible Relations + + + + + + - - - - - -
Value Net Completeness + + + + + - - - - - -
Value Net Simulation + + - - + / - + / - - - - -
Ease of Use + - - - - + + + + + Intuitivism + - - - - + + + +
Konnertz (Konnertz et al, 2011) has proposed the
collaborative business modelling (CBM) approach, which uses the Business Model Canvas by placing post-it notes on the canvas, generating a number of business models. After this is done, the business models are prioritised on the dimensions of attractiveness and effort. The models that are most attractive and take least effort are the ones that get most attention in the validation phase.
The Business Model Canvas method can be a powerful eye-opener and a good brainstorming framework, but it has some severe limitations if one wants to use it in an Open Business Model Innovation process. Firstly, the output of the Business Model Canvas method is a list of elements that can be bundled in scenarios. There is little support for making plain the relationships and interactions between the different elements. These relations and interactions make the difference between a business model as a static list of its constituents and a business model that is dynamic, as is the environment in which it will operate.
In terms of the open innovation perspective (Chesbrough, 2005), some categories exist in the Business Model Canvas approach that can be linked to more open, multi-actor, value-networks, like key
Fourth International Symposium on Business Modeling and Software Design
174
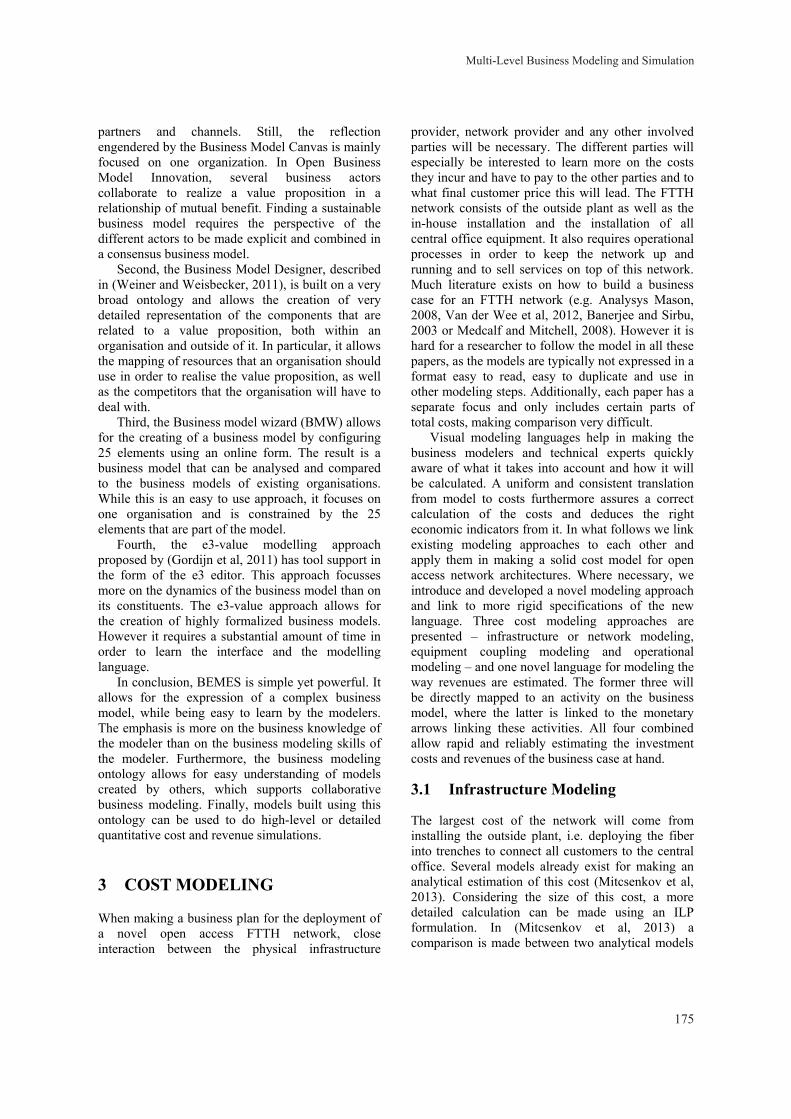
partners and channels. Still, the reflection engendered by the Business Model Canvas is mainly focused on one organization. In Open Business Model Innovation, several business actors collaborate to realize a value proposition in a relationship of mutual benefit. Finding a sustainable business model requires the perspective of the different actors to be made explicit and combined in a consensus business model.
Second, the Business Model Designer, described in (Weiner and Weisbecker, 2011), is built on a very broad ontology and allows the creation of very detailed representation of the components that are related to a value proposition, both within an organisation and outside of it. In particular, it allows the mapping of resources that an organisation should use in order to realise the value proposition, as well as the competitors that the organisation will have to deal with.
Third, the Business model wizard (BMW) allows for the creating of a business model by configuring 25 elements using an online form. The result is a business model that can be analysed and compared to the business models of existing organisations. While this is an easy to use approach, it focuses on one organisation and is constrained by the 25 elements that are part of the model.
Fourth, the e3-value modelling approach proposed by (Gordijn et al, 2011) has tool support in the form of the e3 editor. This approach focusses more on the dynamics of the business model than on its constituents. The e3-value approach allows for the creation of highly formalized business models. However it requires a substantial amount of time in order to learn the interface and the modelling language.
In conclusion, BEMES is simple yet powerful. It allows for the expression of a complex business model, while being easy to learn by the modelers. The emphasis is more on the business knowledge of the modeler than on the business modeling skills of the modeler. Furthermore, the business modeling ontology allows for easy understanding of models created by others, which supports collaborative business modeling. Finally, models built using this ontology can be used to do high-level or detailed quantitative cost and revenue simulations.
3 COST MODELING
When making a business plan for the deployment of a novel open access FTTH network, close interaction between the physical infrastructure
provider, network provider and any other involved parties will be necessary. The different parties will especially be interested to learn more on the costs they incur and have to pay to the other parties and to what final customer price this will lead. The FTTH network consists of the outside plant as well as the in-house installation and the installation of all central office equipment. It also requires operational processes in order to keep the network up and running and to sell services on top of this network. Much literature exists on how to build a business case for an FTTH network (e.g. Analysys Mason, 2008, Van der Wee et al, 2012, Banerjee and Sirbu, 2003 or Medcalf and Mitchell, 2008). However it is hard for a researcher to follow the model in all these papers, as the models are typically not expressed in a format easy to read, easy to duplicate and use in other modeling steps. Additionally, each paper has a separate focus and only includes certain parts of total costs, making comparison very difficult.
Visual modeling languages help in making the business modelers and technical experts quickly aware of what it takes into account and how it will be calculated. A uniform and consistent translation from model to costs furthermore assures a correct calculation of the costs and deduces the right economic indicators from it. In what follows we link existing modeling approaches to each other and apply them in making a solid cost model for open access network architectures. Where necessary, we introduce and developed a novel modeling approach and link to more rigid specifications of the new language. Three cost modeling approaches are presented – infrastructure or network modeling, equipment coupling modeling and operational modeling – and one novel language for modeling the way revenues are estimated. The former three will be directly mapped to an activity on the business model, where the latter is linked to the monetary arrows linking these activities. All four combined allow rapid and reliably estimating the investment costs and revenues of the business case at hand.
3.1 Infrastructure Modeling
The largest cost of the network will come from installing the outside plant, i.e. deploying the fiber into trenches to connect all customers to the central office. Several models already exist for making an analytical estimation of this cost (Mitcsenkov et al, 2013). Considering the size of this cost, a more detailed calculation can be made using an ILP formulation. In (Mitcsenkov et al, 2013) a comparison is made between two analytical models
Multi-Level Business Modeling and Simulation
175
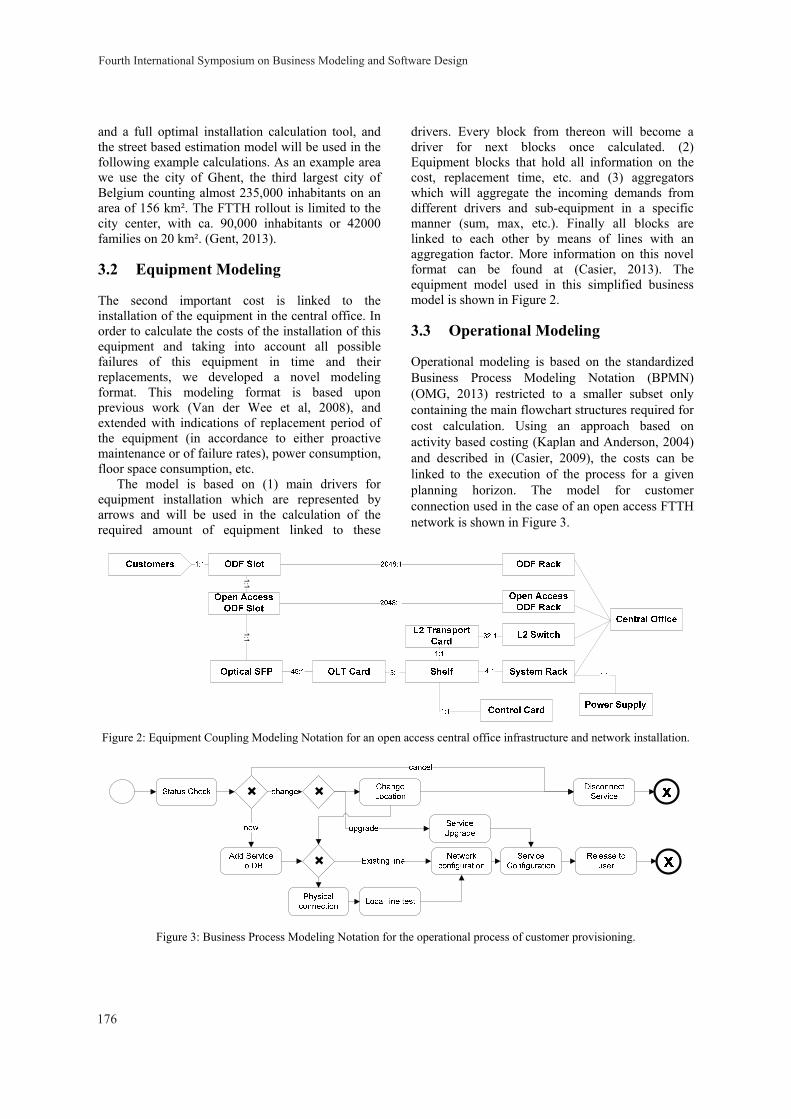
and a full optimal installation calculation tool, and the street based estimation model will be used in the following example calculations. As an example area we use the city of Ghent, the third largest city of Belgium counting almost 235,000 inhabitants on an area of 156 km². The FTTH rollout is limited to the city center, with ca. 90,000 inhabitants or 42000 families on 20 km². (Gent, 2013).
3.2 Equipment Modeling
The second important cost is linked to the installation of the equipment in the central office. In order to calculate the costs of the installation of this equipment and taking into account all possible failures of this equipment in time and their replacements, we developed a novel modeling format. This modeling format is based upon previous work (Van der Wee et al, 2008), and extended with indications of replacement period of the equipment (in accordance to either proactive maintenance or of failure rates), power consumption, floor space consumption, etc.
The model is based on (1) main drivers for equipment installation which are represented by arrows and will be used in the calculation of the required amount of equipment linked to these
drivers. Every block from thereon will become a driver for next blocks once calculated. (2) Equipment blocks that hold all information on the cost, replacement time, etc. and (3) aggregators which will aggregate the incoming demands from different drivers and sub-equipment in a specific manner (sum, max, etc.). Finally all blocks are linked to each other by means of lines with an aggregation factor. More information on this novel format can be found at (Casier, 2013). The equipment model used in this simplified business model is shown in Figure 2.
3.3 Operational Modeling
Operational modeling is based on the standardized Business Process Modeling Notation (BPMN) (OMG, 2013) restricted to a smaller subset only containing the main flowchart structures required for cost calculation. Using an approach based on activity based costing (Kaplan and Anderson, 2004) and described in (Casier, 2009), the costs can be linked to the execution of the process for a given planning horizon. The model for customer connection used in the case of an open access FTTH network is shown in Figure 3.
Figure 2: Equipment Coupling Modeling Notation for an open access central office infrastructure and network installation.
Figure 3: Business Process Modeling Notation for the operational process of customer provisioning.
1:11:1
+ +
+
Fourth International Symposium on Business Modeling and Software Design
176
3.4 Revenue Modeling
Once the full network, the equipment and the operational expenditures are modeled, all costs of the business model can be calculated. Still, this is only part of the analysis and should be complemented with a modeling of the revenues for each activity in the business model. The revenue modeling is aiming to calculate the revenues based on the costs and the number of paying customers. As such it has a notion of a fixed revenue scheme but also of an adaptive scheme aiming at break-even or a profit over break-even with an adjustable timing on when to get up to this point. Additionally the revenue model allows switching between revenue schemes at a given time or condition (e.g. critical customer mass reached). This revenue modeling allows answering questions on the main economic indicators such as profitability, minimal and advised pricing or payback period. A more formal specification of the full model is given in (Casier, 2013). The models used in pricing the open access and the final connection price are kept deliberately very simple, where we assume each role to aim for 20% profit over a planning horizon of 10 years. Deploying the physical infrastructure of the network will make an exception to this and aim for 10% profit over a planning horizon of 20 years.
4 MULTI-LEVEL MODELING
The multi-level modeling links the cost and revenue models to the respective higher level elements, activities and monetary flows in the business model. A cost estimation model is attached to each activity in the business model actually leading to costs in its execution. A revenue model is attached to each monetary flow between two activities. Finally, additional input (e.g. amount of customers or price of equipment) can be defined as time-dependent values and linked to the models of the activities. Once all inputs are defined, all activities causing costs and all monetary flows are linked to a cost, respectively a revenue model; the business model can be fully simulated.
The calculation starts from the activities of the graph which have no outgoing monetary value exchanges, or in other words, which use no service from a lower level activity for which they are charged. The costs in these blocks can be fully
calculated using their internally attached cost model. In the case of Figure 1 the cost for the physical infrastructure can readily be calculated. When this cost is known together with the expected amount of customers, executions, etc., this should be charged to the revenue model and linked to the monetary incoming arrow(s) to be able to calculate pricing and total revenues. Again in Figure 1 the amount the PIP will charge to the NP for the use of its infrastructure can now be calculated. The same calculation steps can be taken for connecting the customers and the price charged for this role to the NP. At this point the network provisioning is becoming the next point in the calculation, as all outgoing value exchanges linked to this activity are fully quantified. And finally this allows calculating the price to charge to the end customer. This recursive scheme allows all activities and monetary flows in any business model to be fully quantified.
We translated Figure 1 into a business model configuration that can be simulated by attaching the infrastructure cost model to the physical infrastructure deployment role, linking the equipment model for the active equipment to the network deployment role and finally operational model to the network provisioning role. We assume all monetary flows to aim for 20% profit on the costs of the role (and underlying roles). As mentioned the infrastructure considers only 10% profit. Additional information can be exchanged between models, as for instance the amount of installed equipment will be the driving value for operational maintenance.
When calculating the business model for the given scenario, the different cost components are calculated in terms of the amount of customers in the area (physical infrastructure) and the amount of customers to connect to the network. The first is equal to the amount of inhabitants in Ghent and for the second, we consider a bass adoption curve with as market potential 95%, with innovation (p) 0.03 and imitation (q) 0.38. A demand aggregation of 30% is expected as a boundary condition for the FTTH network deployment. All costs of the physical infrastructure and network provider are discounted with a discount factor of 5% respectively 10%.
Figure 4 gives the results for the cumulative discounted costs, revenues and outcome for the 10 years for (top) the PIP infrastructure, (middle) the PIP operational expenditures and (bottom) the overall NP outcome.
In this business case the PIP will have to charge a price of €235 per customer per year to the NP for the use of its infrastructure and a price of €42 for
Multi-Level Business Modeling and Simulation
177
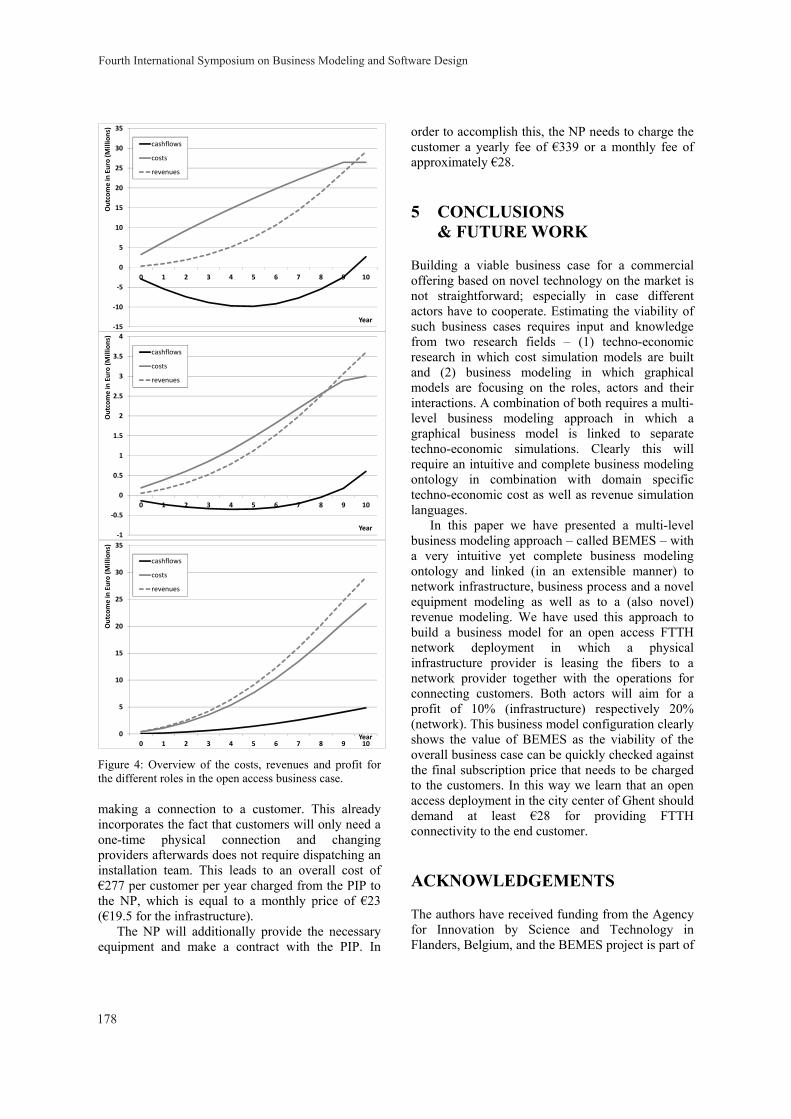
Figure 4: Overview of the costs, revenues and profit for the different roles in the open access business case.
making a connection to a customer. This already incorporates the fact that customers will only need a one-time physical connection and changing providers afterwards does not require dispatching an installation team. This leads to an overall cost of €277 per customer per year charged from the PIP to the NP, which is equal to a monthly price of €23 (€19.5 for the infrastructure).
The NP will additionally provide the necessary equipment and make a contract with the PIP. In
order to accomplish this, the NP needs to charge the customer a yearly fee of €339 or a monthly fee of approximately €28.
5 CONCLUSIONS & FUTURE WORK
Building a viable business case for a commercial offering based on novel technology on the market is not straightforward; especially in case different actors have to cooperate. Estimating the viability of such business cases requires input and knowledge from two research fields – (1) techno-economic research in which cost simulation models are built and (2) business modeling in which graphical models are focusing on the roles, actors and their interactions. A combination of both requires a multi-level business modeling approach in which a graphical business model is linked to separate techno-economic simulations. Clearly this will require an intuitive and complete business modeling ontology in combination with domain specific techno-economic cost as well as revenue simulation languages.
In this paper we have presented a multi-level business modeling approach – called BEMES – with a very intuitive yet complete business modeling ontology and linked (in an extensible manner) to network infrastructure, business process and a novel equipment modeling as well as to a (also novel) revenue modeling. We have used this approach to build a business model for an open access FTTH network deployment in which a physical infrastructure provider is leasing the fibers to a network provider together with the operations for connecting customers. Both actors will aim for a profit of 10% (infrastructure) respectively 20% (network). This business model configuration clearly shows the value of BEMES as the viability of the overall business case can be quickly checked against the final subscription price that needs to be charged to the customers. In this way we learn that an open access deployment in the city center of Ghent should demand at least €28 for providing FTTH connectivity to the end customer.
ACKNOWLEDGEMENTS
The authors have received funding from the Agency for Innovation by Science and Technology in Flanders, Belgium, and the BEMES project is part of
-15
-10
-5
0
5
10
15
20
25
30
35
0 1 2 3 4 5 6 7 8 9 10
Out
com
e in
Eur
o (M
illio
ns)
Year
cashflows
costs
revenues
-1
-0.5
0
0.5
1
1.5
2
2.5
3
3.5
4
0 1 2 3 4 5 6 7 8 9 10
Out
com
e in
Eur
o (M
illio
ns)
Year
cashflows
costs
revenues
0
5
10
15
20
25
30
35
0 1 2 3 4 5 6 7 8 9 10
Out
com
e in
Eur
o (M
illio
ns)
Year
cashflows
costs
revenues
Fourth International Symposium on Business Modeling and Software Design
178

the FI-WARE: Future Internet Core Platform European project (grant-nr. 285248).
REFERENCES
Al-Debei, Mutaz M., Avison D.. "Developing a unified framework of the business model concept." European Journal of Information Systems 19.3 (2010): 359-376
Analysys Mason, “Final report for the Broadband Stakeholder Group: The costs of deploying fibre-based next-generation broadband infrastructure”, Ref: 12726-371 (8 September 2008).
Banerjee A. and Sirbu M., “Towards Technologically and Competitively Neutral Fiber to the Home (FttH) Infrastructure,” in Proceedings of The 31st Research Conference on Communication, Information and Internet Policy, Washington DC, USA (19-21 September 2003).
Casier K, Techno-Economic Evaluation of a Next Generation Access Network Deployment in a Competitive Setting, PhD degree at the Faculty of Engineering of the Ghent University obtained, October 8th 2009
Casier K, Revenue Modeling Wizard Specification, 2013, http://forge.fi-ware.eu/plugins/mediawiki/wiki /fiware/index.php/FIWARE.OpenSpecification.Apps.BusinessCalculator.Revenue
Casier K., The Equipment Coupling Modeling Notation (ECMN) Specification, 2013, http://forge.fi-ware.eu/plugins/mediawiki/wiki/fiware/index.php/ FIWARE.OpenSpecification.Apps.BusinessCalculator.ECMN
Chesbrough, H. W. “Open innovation : the new imperative for creating and profiting from technology” Boston, Mass.: Harvard Business School Press., 2005
Coenen, T., De Waele L., Ballon P.. "The Simbu method-Supporting creativity in business modelling for open innovation” 2009
Coenen, T., Ranaivoson, H., Ballon, P. “Tool support for the Open Business Model Innovation funnel”. Proceedings of ISPIM Innovation Symposium 2010, Quebec, Canada.
Gent, Gent in Cijfers, Online information on the city of Ghent (Dutch), http://gent.buurtmonitor.be/
Gordijn, J., De Leenheer P., and Razo-Zapata I. "Generating Service Value Webs by Hierarchical Configuration: A Case in Intellectual Property Rights Clearing." System Sciences (HICSS), 2011 44th Hawaii International Conference on. IEEE, 2011
Kaplan R.S., Anderson S.: “Time–Driven Activity-Based Costing,” Harvard Business Review, 2004, vol. 82, no. 11, pp. 131-138.
Konnertz, L, Rohrbeck R., and Knab S. "How collaborative business modeling can be used to jointly explore sustainability innovations."ISPIM Annual Conference, Hamburg, Germany. 2011.
Medcalf R., Mitchell S., “Fiber to the Home: Technology Wars”,
http://www.cisco.com/web/about/ac79/docs/wp/Tech_Wars_Part__1_Ext_EI_0128.pdf (January 2008).
Mitcsenkov A., et al., Geometric versus Geographic Models for the Estimation of an FTTH Deployment, Telecom Systems Journal special issue, May 2016 (accepted)
Object Management Group/Business Process Management Initiative, http://www.bpmn.org/
Ostenwalder A., Pigneur Y., Tucci C.L., Clarifying Business Models: Origins, Present, and Future of the Concept, Communications of AIS, Volume 15, Article 1, 2005
Osterwalder, A. & Pigneur, Y., 2010. Business Model Generation: A Handbook for Visionaries, Game Changers, and Challengers, Hoboken, New Jersey: John Wiley & Sons
Pijpers V. • De Leenheer P., • Gordijn J.,• Akkermans H., Using conceptual models to explore business-ICT alignment in networked value constellations, Requirements Engineering (13 October 2011), pp. 1-24
Van der Wee M., et al., A modular and hierarchically structured techno-economic model for FTTH deployments. Comparison of technology and equipment placement as function of population density and number of flexibility points, ONDM 2012
Weiner N, Weisbecker A. "A Business Model Framework for the Design and Evaluation of Business Models in the Internet of Services." SRII Global Conference (SRII), 2011 Annual. IEEE, 2011
Multi-Level Business Modeling and Simulation
179
A Component Abstraction for Localized, Composable, Machine Manipulable Enterprise Specification
Vinay Kulkarni1, Tony Clark2 and Balbir Barn2 1Tata Research Development and Design Centre, Tata Consultancy Services, 54B Hadapsar Industrial Estate, Pune, India
2Middlesex University, London, U.K. [email protected], {t.n.clark, b.barn}@mdx.ac.uk
Keywords: Enterprise Modelling, Component.
Abstract: Enterprise modelling aims to specify an enterprise in terms of high-level models that address key problems such as business-IT alignment, enterprise transformation and optimal operation. No two situations in real world enterprises are exactly alike but there may be significant overlap. Relative ignorance of such overlaps forces essentially the same problem, albeit in a different context, to be repeatedly solved from scratch. This is a time-, effort- and cost-intensive endeavour. To overcome this problem and facilitate reuse, we propose a model-centric component abstraction that enables specification of the what, the how and the why concerns of enterprise in a localized, composable and machine manipulable manner. We present a meta-model, describe concrete syntax for its textual representation, and discuss the required model processing machinery.
1 INTRODUCTION
Modern enterprises operate in a highly dynamic environment wherein changes due to a variety of external change drivers require rapid responses within a highly constrained setting. This calls for precise understanding of: what is the enterprise, how it operates and why it so operates, the set of change drivers, a set of possible to-be states, and a quantitative and qualitative to-be state evaluation criteria. Understanding is typically required at several levels of granularity: a department, a business unit, the entire enterprise etc. The scale of a modern enterprise means this understanding exists only for highly localized parts and typically in the form of documents or descriptive models (Zachmann 1999, TOGAF). Popular enterprise modelling tools, e.g., ArchiMate (http://www.visual-paradigm.com) offer little support for the quantitative or qualitative analysis of enterprise models. As a result, experts are forced to rely solely on their experience when faced with a specific problem. Thus, fractured incomplete knowledge and sole reliance on human expertise emerge as the principal contributing factors leading to change responses that are inaccurate, inefficient and ineffective.
Key decision-makers in enterprises face generic problems: business-IT alignment, optimizing cost of
IT to business, transformation with certainty etc. These problems manifest differently in different contexts and yet share significant commonality. For instance, the details of wealth management bank merger differs on a case by case basis; however cases have much in common both in terms of problem formulation as well as solution. Current Enterprise Modelling state-of-the-art as well as of-practice completely ignores this commonality. As a result, each problem instance needs to be solved afresh. This is a highly cost-, time-, and effort-intensive endeavour.
The problems we seek to solve are: (i) to reduce excessive dependence on human experts for decision making, (ii) to address the commonality across different instances of a generic problem and, (iii) to address scale and complexity.
Our proposition addresses the problems as follows: (i) the what, why and how perspectives of an enterprise are captured in terms of a core conceptual meta-model, (ii) DSLs and patterns are used to capture reusable knowledge and translated in terms of the core concepts into a kernel language, (iii) the kernel language supports features to address scale and complexity including composition, encapsulation, and higher-order features.
Our approach is extensible through the use of a plug-in architecture supporting DSL-based models translated to an executable kernel language defined
180
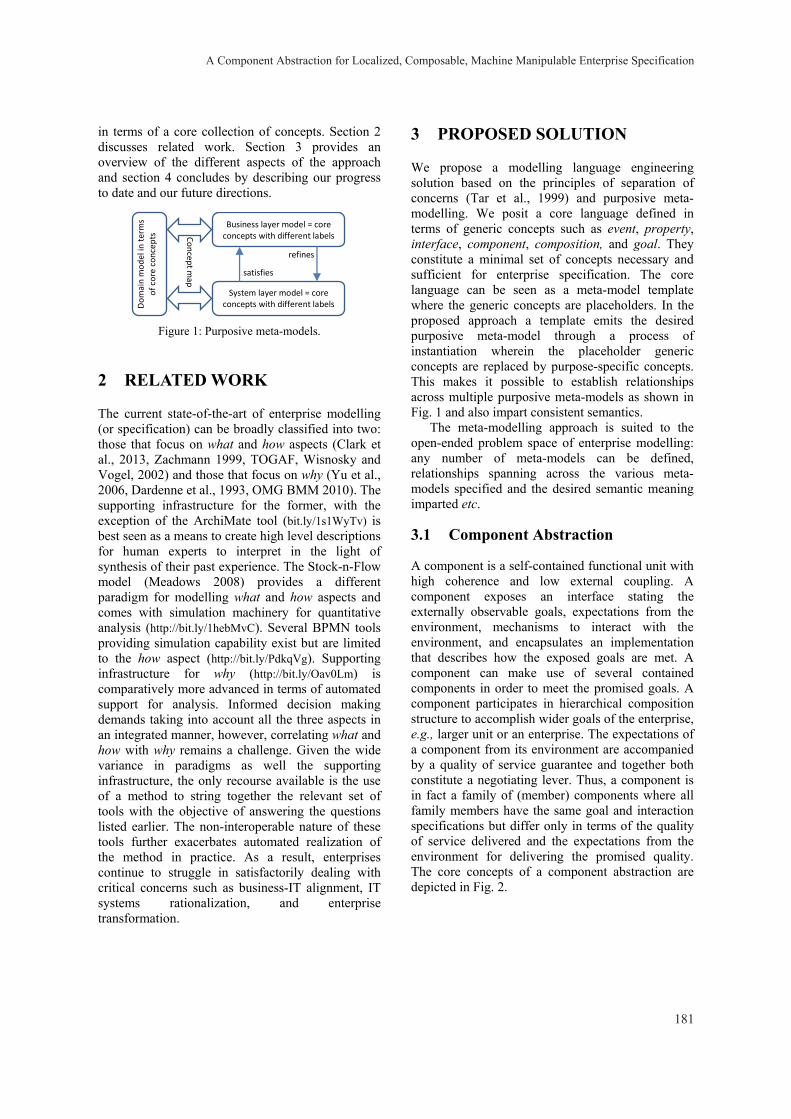
in terms of a core collection of concepts. Section 2 discusses related work. Section 3 provides an overview of the different aspects of the approach and section 4 concludes by describing our progress to date and our future directions.
Figure 1: Purposive meta-models.
2 RELATED WORK
The current state-of-the-art of enterprise modelling (or specification) can be broadly classified into two: those that focus on what and how aspects (Clark et al., 2013, Zachmann 1999, TOGAF, Wisnosky and Vogel, 2002) and those that focus on why (Yu et al., 2006, Dardenne et al., 1993, OMG BMM 2010). The supporting infrastructure for the former, with the exception of the ArchiMate tool (bit.ly/1s1WyTv) is best seen as a means to create high level descriptions for human experts to interpret in the light of synthesis of their past experience. The Stock-n-Flow model (Meadows 2008) provides a different paradigm for modelling what and how aspects and comes with simulation machinery for quantitative analysis (http://bit.ly/1hebMvC). Several BPMN tools providing simulation capability exist but are limited to the how aspect (http://bit.ly/PdkqVg). Supporting infrastructure for why (http://bit.ly/Oav0Lm) is comparatively more advanced in terms of automated support for analysis. Informed decision making demands taking into account all the three aspects in an integrated manner, however, correlating what and how with why remains a challenge. Given the wide variance in paradigms as well the supporting infrastructure, the only recourse available is the use of a method to string together the relevant set of tools with the objective of answering the questions listed earlier. The non-interoperable nature of these tools further exacerbates automated realization of the method in practice. As a result, enterprises continue to struggle in satisfactorily dealing with critical concerns such as business-IT alignment, IT systems rationalization, and enterprise transformation.
3 PROPOSED SOLUTION
We propose a modelling language engineering solution based on the principles of separation of concerns (Tar et al., 1999) and purposive meta-modelling. We posit a core language defined in terms of generic concepts such as event, property, interface, component, composition, and goal. They constitute a minimal set of concepts necessary and sufficient for enterprise specification. The core language can be seen as a meta-model template where the generic concepts are placeholders. In the proposed approach a template emits the desired purposive meta-model through a process of instantiation wherein the placeholder generic concepts are replaced by purpose-specific concepts. This makes it possible to establish relationships across multiple purposive meta-models as shown in Fig. 1 and also impart consistent semantics.
The meta-modelling approach is suited to the open-ended problem space of enterprise modelling: any number of meta-models can be defined, relationships spanning across the various meta-models specified and the desired semantic meaning imparted etc.
3.1 Component Abstraction
A component is a self-contained functional unit with high coherence and low external coupling. A component exposes an interface stating the externally observable goals, expectations from the environment, mechanisms to interact with the environment, and encapsulates an implementation that describes how the exposed goals are met. A component can make use of several contained components in order to meet the promised goals. A component participates in hierarchical composition structure to accomplish wider goals of the enterprise, e.g., larger unit or an enterprise. The expectations of a component from its environment are accompanied by a quality of service guarantee and together both constitute a negotiating lever. Thus, a component is in fact a family of (member) components where all family members have the same goal and interaction specifications but differ only in terms of the quality of service delivered and the expectations from the environment for delivering the promised quality. The core concepts of a component abstraction are depicted in Fig. 2.
Domain m
odel in term
s of core concepts Business layer model = core
concepts with different labels
System layer model = core concepts with different labels
satisfies refines
Concep
t map
A Component Abstraction for Localized, Composable, Machine Manipulable Enterprise Specification
181
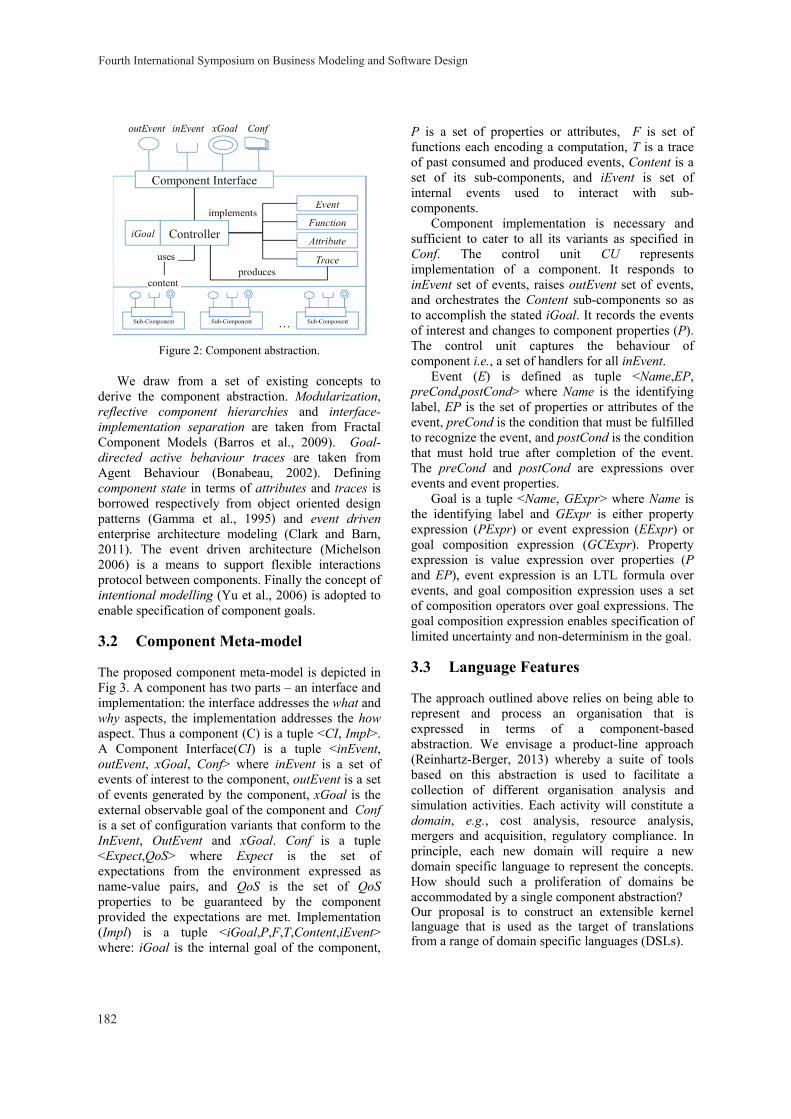
Figure 2: Component abstraction.
We draw from a set of existing concepts to derive the component abstraction. Modularization, reflective component hierarchies and interface-implementation separation are taken from Fractal Component Models (Barros et al., 2009). Goal-directed active behaviour traces are taken from Agent Behaviour (Bonabeau, 2002). Defining component state in terms of attributes and traces is borrowed respectively from object oriented design patterns (Gamma et al., 1995) and event driven enterprise architecture modeling (Clark and Barn, 2011). The event driven architecture (Michelson 2006) is a means to support flexible interactions protocol between components. Finally the concept of intentional modelling (Yu et al., 2006) is adopted to enable specification of component goals.
3.2 Component Meta-model
The proposed component meta-model is depicted in Fig 3. A component has two parts – an interface and implementation: the interface addresses the what and why aspects, the implementation addresses the how aspect. Thus a component (C) is a tuple <CI, Impl>. A Component Interface(CI) is a tuple <inEvent, outEvent, xGoal, Conf> where inEvent is a set of events of interest to the component, outEvent is a set of events generated by the component, xGoal is the external observable goal of the component and Conf is a set of configuration variants that conform to the InEvent, OutEvent and xGoal. Conf is a tuple <Expect,QoS> where Expect is the set of expectations from the environment expressed as name-value pairs, and QoS is the set of QoS properties to be guaranteed by the component provided the expectations are met. Implementation (Impl) is a tuple <iGoal,P,F,T,Content,iEvent> where: iGoal is the internal goal of the component,
P is a set of properties or attributes, F is set of functions each encoding a computation, T is a trace of past consumed and produced events, Content is a set of its sub-components, and iEvent is set of internal events used to interact with sub-components.
Component implementation is necessary and sufficient to cater to all its variants as specified in Conf. The control unit CU represents implementation of a component. It responds to inEvent set of events, raises outEvent set of events, and orchestrates the Content sub-components so as to accomplish the stated iGoal. It records the events of interest and changes to component properties (P). The control unit captures the behaviour of component i.e., a set of handlers for all inEvent.
Event (E) is defined as tuple <Name,EP, preCond,postCond> where Name is the identifying label, EP is the set of properties or attributes of the event, preCond is the condition that must be fulfilled to recognize the event, and postCond is the condition that must hold true after completion of the event. The preCond and postCond are expressions over events and event properties.
Goal is a tuple <Name, GExpr> where Name is the identifying label and GExpr is either property expression (PExpr) or event expression (EExpr) or goal composition expression (GCExpr). Property expression is value expression over properties (P and EP), event expression is an LTL formula over events, and goal composition expression uses a set of composition operators over goal expressions. The goal composition expression enables specification of limited uncertainty and non-determinism in the goal.
3.3 Language Features
The approach outlined above relies on being able to represent and process an organisation that is expressed in terms of a component-based abstraction. We envisage a product-line approach (Reinhartz-Berger, 2013) whereby a suite of tools based on this abstraction is used to facilitate a collection of different organisation analysis and simulation activities. Each activity will constitute a domain, e.g., cost analysis, resource analysis, mergers and acquisition, regulatory compliance. In principle, each new domain will require a new domain specific language to represent the concepts. How should such a proliferation of domains be accommodated by a single component abstraction? Our proposal is to construct an extensible kernel language that is used as the target of translations from a range of domain specific languages (DSLs).
Fourth International Symposium on Business Modeling and Software Design
182
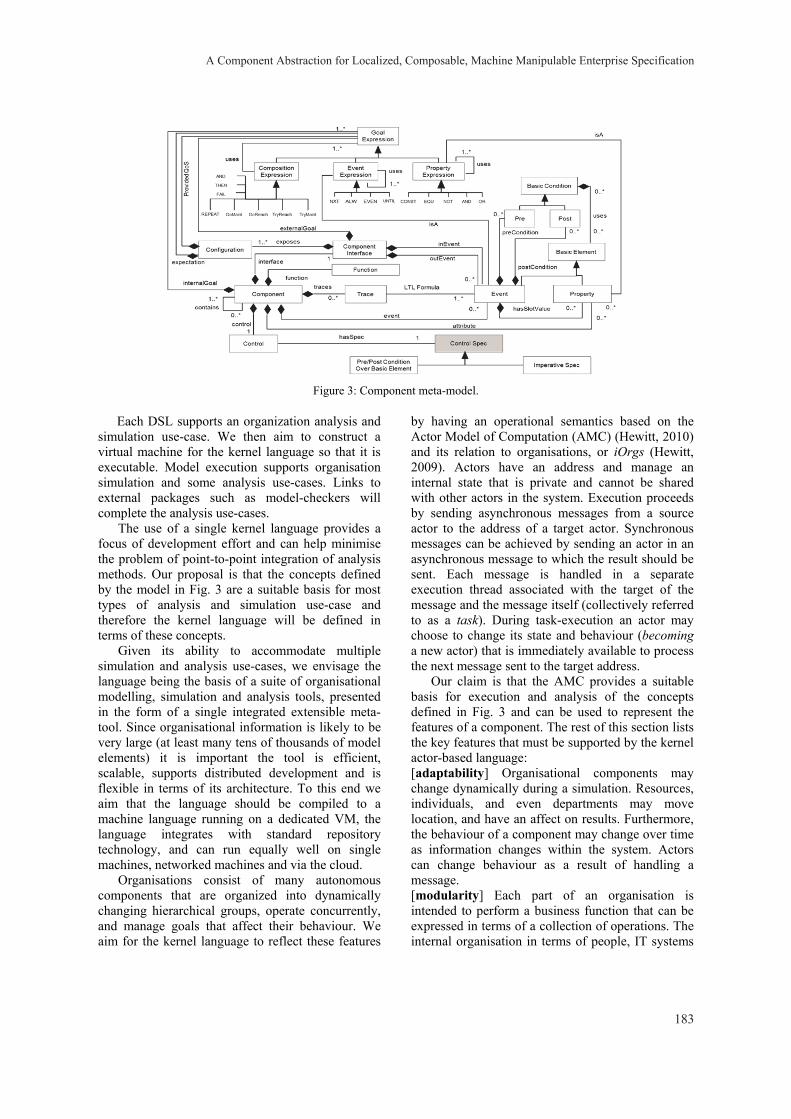
Figure 3: Component meta-model.
Each DSL supports an organization analysis and simulation use-case. We then aim to construct a virtual machine for the kernel language so that it is executable. Model execution supports organisation simulation and some analysis use-cases. Links to external packages such as model-checkers will complete the analysis use-cases.
The use of a single kernel language provides a focus of development effort and can help minimise the problem of point-to-point integration of analysis methods. Our proposal is that the concepts defined by the model in Fig. 3 are a suitable basis for most types of analysis and simulation use-case and therefore the kernel language will be defined in terms of these concepts.
Given its ability to accommodate multiple simulation and analysis use-cases, we envisage the language being the basis of a suite of organisational modelling, simulation and analysis tools, presented in the form of a single integrated extensible meta-tool. Since organisational information is likely to be very large (at least many tens of thousands of model elements) it is important the tool is efficient, scalable, supports distributed development and is flexible in terms of its architecture. To this end we aim that the language should be compiled to a machine language running on a dedicated VM, the language integrates with standard repository technology, and can run equally well on single machines, networked machines and via the cloud.
Organisations consist of many autonomous components that are organized into dynamically changing hierarchical groups, operate concurrently, and manage goals that affect their behaviour. We aim for the kernel language to reflect these features
by having an operational semantics based on the Actor Model of Computation (AMC) (Hewitt, 2010) and its relation to organisations, or iOrgs (Hewitt, 2009). Actors have an address and manage an internal state that is private and cannot be shared with other actors in the system. Execution proceeds by sending asynchronous messages from a source actor to the address of a target actor. Synchronous messages can be achieved by sending an actor in an asynchronous message to which the result should be sent. Each message is handled in a separate execution thread associated with the target of the message and the message itself (collectively referred to as a task). During task-execution an actor may choose to change its state and behaviour (becoming a new actor) that is immediately available to process the next message sent to the target address.
Our claim is that the AMC provides a suitable basis for execution and analysis of the concepts defined in Fig. 3 and can be used to represent the features of a component. The rest of this section lists the key features that must be supported by the kernel actor-based language: [adaptability] Organisational components may change dynamically during a simulation. Resources, individuals, and even departments may move location, and have an affect on results. Furthermore, the behaviour of a component may change over time as information changes within the system. Actors can change behaviour as a result of handling a message. [modularity] Each part of an organisation is intended to perform a business function that can be expressed in terms of a collection of operations. The internal organisation in terms of people, IT systems
A Component Abstraction for Localized, Composable, Machine Manipulable Enterprise Specification
183
and the implementation of various business processes is usually hidden. The AMC provides an interface of message handlers for each actor. Both the state and the implementation of the message interface are hidden from the outside. The specification of an actor in terms of its external interface can be expressed in terms of LTL formulas that constitute the external goal for a component. [autonomy] A key feature of an organisation is that the behaviour of each sub-component is autonomous. A particular department is responsible for its own behaviour and can generate output without the need for a stimulus. The AMC is highly concurrent with each actor being able to spawn multiple threads and over which other actors have no control (unless granted by the thread originator). [distribution] An organisation may be distributed and this may be an important feature of its simulation. Furthermore, we have a requirement that the tooling for organisational analysis and simulation should support distributed concurrent development. The AMC is message-based and seamlessly supports execution in the same address space, via a network connection or in the cloud. [intent] In addition to autonomous behaviour, an organisation component exhibits intent. This might take the form of an internal goal that guides the behaviour of the component to ensure that it contributes to the overall mission of the organisation. Although actors do not directly provides support for such goals, we intend to use results from the field of Multi-Agent Systems (van der Hoek, 2008) where support for goal-based reasoning is provided within each agent when determining how to handle messages. [composition] An organisation is an assembly of components. As noted above, the topology of an organisation may be static or dynamic. Actors can be nested in more than one way. Actor behaviours are declared and new actors are dynamically created with an initial behaviour (much like Java classes). The scope of actor behaviours can be nested to provide modularity. Adding a dynamically created actor to the state of a parent actor provides composition. Such actors can be sent as part of messages. If the source actor retains the address, then the communicated actor becomes shared between the source and the target of the message. [extensibility] Our aim is to support a number of simulation and analysis use-cases. As such the kernel language will need to support a collection of independent domains. Whilst we expect the DSLs to target the kernel language it is likely that each domain will have its own fundamental concepts and
actions (so-called Therbligs, (Stanton, 2006)). We envisage such domain-specific features being defined in the kernel language and then pre-loaded to form an augmented target language for DSL translations. [event-driven] Organisational components cannot rely on when communications occur and where they originate. In addition, a component may simply cause an event to occur without knowing who will consume the event. This is to be contrasted with message-based communication where the target is always known to the source and where sometimes the message carries information about the source that becomes available to the target. The AMC is based on message passing where the source knows the address of the target. Given that the kernel language is the target of DSL transformations, support for event-based communication becomes an architectural issue where events are simply messages that are sent to an actor container that is responsible for delivering event-messages to dynamically changing collections of actors. Providing that the transformation establishes the correct assembly of actors and conforms to an appropriate message passing protocol then component events are supported without needing to make them an intrinsic part of the kernel.
Figure 4: The ESL Kernel.
Fig. 4 shows the kernel features of a language called ESL that is currently under development. It has been designed to support the features that are
Fourth International Symposium on Business Modeling and Software Design
184
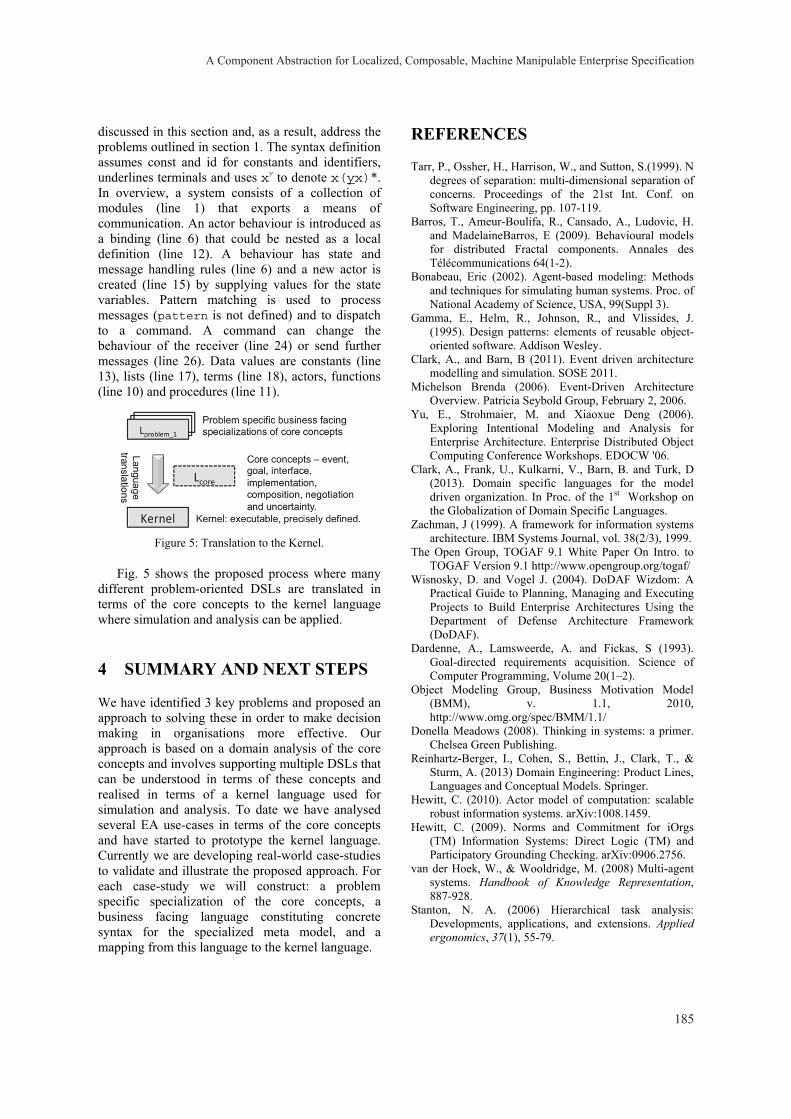
discussed in this section and, as a result, address the problems outlined in section 1. The syntax definition assumes const and id for constants and identifiers, underlines terminals and uses xy to denote x(yx)*. In overview, a system consists of a collection of modules (line 1) that exports a means of communication. An actor behaviour is introduced as a binding (line 6) that could be nested as a local definition (line 12). A behaviour has state and message handling rules (line 6) and a new actor is created (line 15) by supplying values for the state variables. Pattern matching is used to process messages (pattern is not defined) and to dispatch to a command. A command can change the behaviour of the receiver (line 24) or send further messages (line 26). Data values are constants (line 13), lists (line 17), terms (line 18), actors, functions (line 10) and procedures (line 11).
Figure 5: Translation to the Kernel.
Fig. 5 shows the proposed process where many different problem-oriented DSLs are translated in terms of the core concepts to the kernel language where simulation and analysis can be applied.
4 SUMMARY AND NEXT STEPS
We have identified 3 key problems and proposed an approach to solving these in order to make decision making in organisations more effective. Our approach is based on a domain analysis of the core concepts and involves supporting multiple DSLs that can be understood in terms of these concepts and realised in terms of a kernel language used for simulation and analysis. To date we have analysed several EA use-cases in terms of the core concepts and have started to prototype the kernel language. Currently we are developing real-world case-studies to validate and illustrate the proposed approach. For each case-study we will construct: a problem specific specialization of the core concepts, a business facing language constituting concrete syntax for the specialized meta model, and a mapping from this language to the kernel language.
REFERENCES
Tarr, P., Ossher, H., Harrison, W., and Sutton, S.(1999). N degrees of separation: multi-dimensional separation of concerns. Proceedings of the 21st Int. Conf. on Software Engineering, pp. 107-119.
Barros, T., Ameur-Boulifa, R., Cansado, A., Ludovic, H. and MadelaineBarros, E (2009). Behavioural models for distributed Fractal components. Annales des Télécommunications 64(1-2).
Bonabeau, Eric (2002). Agent-based modeling: Methods and techniques for simulating human systems. Proc. of National Academy of Science, USA, 99(Suppl 3).
Gamma, E., Helm, R., Johnson, R., and Vlissides, J. (1995). Design patterns: elements of reusable object-oriented software. Addison Wesley.
Clark, A., and Barn, B (2011). Event driven architecture modelling and simulation. SOSE 2011.
Michelson Brenda (2006). Event-Driven Architecture Overview. Patricia Seybold Group, February 2, 2006.
Yu, E., Strohmaier, M. and Xiaoxue Deng (2006). Exploring Intentional Modeling and Analysis for Enterprise Architecture. Enterprise Distributed Object Computing Conference Workshops. EDOCW '06.
Clark, A., Frank, U., Kulkarni, V., Barn, B. and Turk, D (2013). Domain specific languages for the model driven organization. In Proc. of the 1st Workshop on the Globalization of Domain Specific Languages.
Zachman, J (1999). A framework for information systems architecture. IBM Systems Journal, vol. 38(2/3), 1999.
The Open Group, TOGAF 9.1 White Paper On Intro. to TOGAF Version 9.1 http://www.opengroup.org/togaf/
Wisnosky, D. and Vogel J. (2004). DoDAF Wizdom: A Practical Guide to Planning, Managing and Executing Projects to Build Enterprise Architectures Using the Department of Defense Architecture Framework (DoDAF).
Dardenne, A., Lamsweerde, A. and Fickas, S (1993). Goal-directed requirements acquisition. Science of Computer Programming, Volume 20(1–2).
Object Modeling Group, Business Motivation Model (BMM), v. 1.1, 2010, http://www.omg.org/spec/BMM/1.1/
Donella Meadows (2008). Thinking in systems: a primer. Chelsea Green Publishing.
Reinhartz-Berger, I., Cohen, S., Bettin, J., Clark, T., & Sturm, A. (2013) Domain Engineering: Product Lines, Languages and Conceptual Models. Springer.
Hewitt, C. (2010). Actor model of computation: scalable robust information systems. arXiv:1008.1459.
Hewitt, C. (2009). Norms and Commitment for iOrgs (TM) Information Systems: Direct Logic (TM) and Participatory Grounding Checking. arXiv:0906.2756.
van der Hoek, W., & Wooldridge, M. (2008) Multi-agent systems. Handbook of Knowledge Representation, 887-928.
Stanton, N. A. (2006) Hierarchical task analysis: Developments, applications, and extensions. Applied ergonomics, 37(1), 55-79.
A Component Abstraction for Localized, Composable, Machine Manipulable Enterprise Specification
185
Business RequirementsNormative Approach to Behavior Modeling
Askhat Omarov, Rustem Kamun and Timur UmarovDepartment of Computer Engineering, Kazakh-British Technical University, 59 Tole bi str., Almaty, Kazakhstan
{askhat.omarov91, r.kamun}@gmail.com, [email protected]
Keywords: Business Modeling, Organizational Semiotics, Deontic Logic, Responsibility, Requirements Formalization,Normative Positions, MEASUR.
Abstract: This paper attempts to formalize abstract requirements by amalgamating the MEASUR methodology withdeontic logic and the limited version of the theory of normative positions. This amalgamation is performedin a manner that would potentially decrease the complexity inevitably embedded in the formalized abstractrequirements so as to be able to target a wide range of non-technical users involved in the initial stages ofsoftware development lifecycle. This amalgamation is embraced by an artifact which represents a businessmodel that avoids specifying software systems as a highly technical document and is rather referred to as acomputational independent model of the MDA framework of software development.
1 INTRODUCTION
Business process engineering represents a criticalarea of concern in enterprise. It is becoming in-creasingly important to specify structured initial re-quirements for the business model which will (i)best fit the environment and the market demandsand (ii) adapt to different changes that may happen.Since organizations are modeled using different the-ories, approaches, and solutions, it is our belief that,whichever approach is taken, the questions of com-plexity of modeling tools and insufficient depth of in-formation description still remain.
Different new trends in requirements elicitationand gathering for the overall process of informationsystems’ engineering were revealed. Among theseapproaches we can underline the one, which relatesorganizations to a set of interacting agents and enti-ties while recognizing these objects via signs. Thisparadigm of modeling is regarded as organizationalsemiotics and represents an emergent discipline thatstudies the nature, characteristics, and features of in-formation and how this information can be interactedbetween agents in the most optimal way within thecontexts of organizations and business domains. OSfinds its roots in semiotics and treats organizations asinformation systems, within which information is cre-ated, processed, distributed, stored and used.
The concept of organizational business modelingof the enterprise is driven by principles of adapting
business processes to ever-changing market condi-tions in order to provide better services and productsto clients. This is practically achieved by modelingindividual business tasks and connecting them intologically organized activities to form workflows thatwould rapidly and effectively respond to the environ-ment changes. Participants (humans or machines) areintimately related to these workflows by controllingand executing them in one way or another, subjectto the knowledge possessed and the roles that theseparticipants play. Equally important is the concept ofcontractual relationships formed among participantsover the course of their interaction with an emphasison social aspects of an organizational setting. How-ever, most of the business processes with differentfunctional ontological descriptions and annotationsstill lack complete operational semantics being de-fined within the requirements specifications.
In our attempt to address this problem, we relateto the following theories. One school of thought, ledby Stamper and Liu, espouses a natural framework forthe notions of behavioral patterns, roles, and relation-ships, conceptualized via the philosophy of languageand communication, the theory of speech acts, andcomputational semiotics. Another school of thought,led by Kanger, Porn, and Lindahl, supports so calledthe theory of normative positions which is a combi-nation of deontic logic and logic of action and agencyto provide a formal account of complex social inter-actions within organizations. As such concepts are
186
new and not usually discussed in the wider fields ofenterprise software engineering. Similarly, use of for-mal methods such as B and Event-B is a rare prac-tice in the software engineering community for theirinherent complexity in the software specification pro-cess. On the contrary, there also exist informal busi-ness process specification languages such as BPMN,BPEL, and WWF which are easier and handy in use.
There are several attempts to formalize require-ments and provide formal semantics for unstructuredor semi-formal requirements specifications. The au-thors in (Ponsard and Dieul, 2008) address this bybridging the semantic gap between the semi-formalrequirements and formal models using a goal-orientedapproach and regulation modeling and further refinethem into formal specifications. Besides formaliza-tion an important role in developing, for example,critical systems is played by validation. This is thor-oughly addressed by (Cimatti et al., 2010), in whichthe authors describe their methodology and a series oftechniques for formalization and validation of high-level abstract requirements. The language used is acombination of first-order, temporal, and hybrid logic.Reliability as one of the most important properties ofany systems, including critical ones, is raised by (vanLamsweerde, 2001) while discussing requirementsengineering in terms of developing high-quality re-quirements. The arguments is built in the light of therelated techniques for goal-oriented description of re-quirements, multiparadigm specification and so on.
This paper describes our approach and explainsbearing of the modeling methodologies on informa-tion systems. We try to describe how the relatively in-formal methodology can incorporate normative tech-niques to make this language structured and com-puter interpretable for future machine use to imple-ment model transformations. Because these conceptsform a common root for modern logic and thereforeformal methods, we find that we can potentially ex-ploit our framework via model transformation ideasto derive a method for developing better business pro-cesses models from business requirements models.Our approach amalgamates the MEASUR methodol-ogy with the limited version of the theory of norma-tive positions. This provides an additional level ofsemantics by “attaching” the notion of responsibilityto the agents. The paper proceeds as follows:
• Section 2 provides an overview of the methodol-ogy MEASUR and gives a flavor of the normativeapproach in business modeling;
• Section 3 describes the proposed approach of for-malizing MEASUR and defines the so-called nor-mative tableaux;
• Section 4 provides an example of applying the
approach in the example of making an electronicpurchase and gives normative tableaux of severalcommunication acts; and
• Section 5 briefly elaborates on future work of theresearch group.
2 BACKGROUND
In his definition of speech acts (Searle, 1969; Searle,1971), Searle emphasizes the importance of so calledproper circumstances in which speech acts have to beused. Uttering speech acts in proper circumstancescauses construction or alteration of the world, e.g.creating an obligation. Searle also calls these propercircumstances rules of use. In our following discus-sion, term norms will be used to designate rules ofusing speech acts effectively.
2.1 Methodology MEASUR
Method for Eliciting, Analyzing and Specifying UserRequirements (MEASUR) represents a radically newset of norm-oriented methods for business systemsmodeling and requirements specification for softwaredevelopment (Liu, 2000). MEASUR is a result ofmore than 30 years of research. The idea of MEASURis that it sees the organizations as information systemswith the set of agents, their corresponding set of po-tential actions (affordances) and set of norms whichgovern agents behavior. MEASUR offers five phasesfor business modeling and software development ofwhich three the most important phases are problemarticulation methods, semantic analysis method andnorm analysis method.
The general ontological theory is concerned withfundamental questions of classifying everything thatexists in the world into different categories, describ-ing that everything while it exists, and seeking toelicit possible hierarchies and dependencies amongthe things that make up that everything. Liu (Liu,2000) defines the term everything as constituent no-tions such as thing, entity, individual, universal, par-ticular, substance, event, process and state. These no-tions are embraced with the general ontological study.
Although there are different types of ontologiesrelated to knowledge and its representation, the onlytype of ontology that semantic analysis is relevant tois that which recognizes only our own behavior in ac-cordance with our own ambiance. This type of ontol-ogy can be defined as a collection of representationaldata that models a certain domain of knowledge ordiscourse. Everything that exists in the world is de-pendent on the agents behavior. In other words, the
Business Requirements - Normative Approach to Behavior Modeling
187

meaning of a thing is related to the ability of the agentto recognize that thing as a particular entity.
Knowledge representation is an image of theworld in our minds and is created by our perceptionsof reality. The representation that we perceive, a sur-rogate, represents a substitute for the real entity it-self. The correspondence between the entities andtheir surrogates forms the semantics for the represen-tation. What we learn about the surrounding worldforms our understanding about it. This understandingallows us to recognize the things that we know. Otherthings that we do not possess any knowledge aboutand hence cannot recognize them, do not exist in thesense of such entities in the world. By recognition wemean assigning meaning to things and knowing theirproperties. As we learn more about the world, the on-tology changes accordingly. In other words, the pos-sessed knowledge shapes a repertoire of our behavior.
With relation to the semantics, Liu (Liu, 2000)introduces the term affordance and defines it as apattern of behavior of a human (or agent) which helearns through perceiving an ambient world. What anagent does is directed by his knowledge. The pro-cess of learning, or gaining knowledge about a cer-tain set of facts, is in intimate relationship with thebehavior and this relationship is bipartite. On the onehand, an agent learns the environment through his ac-tions. On the other hand, the agents set of actionsconstrained by his behavior manifests knowledge thathe possesses.
In any particular environment, whether an orga-nization or a community, actions of its participants 1must conform to the internal rules of behavior. Herethe term behavior ensues from a social or a businesscontext. Every agent has a set of certain actions toperform in accordance with the external conditions.The rules that members must adhere to is also re-ferred to as norms. In the technical context, we aremodeling the interaction between machines and hu-mans, which can universally be referred to as agents.In terms of (Liu, 2000), the process of acting withinthe required norms represents invariant patterns of be-havior or mechanisms of agents. Agents interact witheach other which inevitably creates different relationpatterns. The questions of modeling and formalizingthese relations between agents is studied by the theoryof normative positions.
The MEASUR methodology is a set of methodsfor business modeling and requirements specificationfor information systems. MEASUR can be used toanalyze and specify an organization’s business pro-cesses. As a traditional software system develop-ment lifecycle, MEASUR methodology of informa-tion systems modelling and requirements specifica-
tion for software system development is divided intothe following three stages (Liu, 2000):
1. Articulation of the problem, where a businessrequirements problem statement is developed inpartnership with the client.
2. Semantic Analysis, where the requirements prob-lem statement is encoded as an ontology, identify-ing the main roles, relationships and actions.
3. Norm Analysis, where the dynamics of the state-ment are identified as social norms, deontic state-ments of rights, responsibilities and obligations.
The processes of the first stage are comparable toother well known approaches to requirements speci-fication. The last two stages require some elaborationand have their own unique associated notations.
The ultimate deliverable of these three stages iswhat we will refer to as anormative ontology. A nor-mative ontology consists of what might be called asemi-formal requirements document, in the sense thatit can be understood readily by clients, business ana-lysts and developers. This model breaks down an in-formation system into a set of business data, commu-nicating agents (stakeholders, departments, computerprograms) and business processes that agents can in-voke in order to manipulate data between each other.The model consists of a role-and-relationships ontol-ogy together with a set of norms that formally definethe structure and expected and permitted interactionswithin an organization and its processes.
2.2 The Normative Perspective
The theory of normative positions is based on the fun-damental principles of deontic logic. Deontic logic isa formal system and represents a field of symboliclogic which is concerned with normative conceptssuch as obligation, permission, and prohibition usedin contractual relationships for classifying actions andstates of affairs. The word deontic comes from Greekand means “of that which is binding”. Standard De-ontic Logic (SDL, KD, or simply D) is the most stud-ied and axiomatically defined system of deontic logic.SDL 1) represents a monadic deontic logic because itsdeontic operator is a one-place operator, 2) builds onpropositional logic, and 3) is formally specified by aKripke-style semantics. SDL uses the following nota-tion to denote its main concepts: ObA stands for it isobligatory thatA and PeA – it is permissible thatA.
Deontic logic have not yet found wide applicationin technical areas such as Computer Science. How-ever, deontic modalities could be efficiently used inspecifying technical requirements for different busi-ness domains. For instance, modality obligatory may
Fourth International Symposium on Business Modeling and Software Design
188
well model the requirement that a system must checkwhether a buyer have enough money in his back ac-count before making a purchase in an on-line or phys-ical store; and modality permissible can be applied tospecify a rule that a bank may check (it is permissi-ble that bank checks) credit history of a client beforeissuing a loan. More on the definition and a Kripke-style possible world semantics for SDL can be foundin (McNamara, 2006).
The theory of normative positions was originallyinspired by analytical study of law and originated inthe works of Stig Kanger (Kanger, 1972; Kanger,1985), Ingmar Porn (Porn, 1970; Porn, 1977), andLars Lindahl (Lindahl, 1977; Lindahl, 1994). TheKanger- Lindahl theory is characterized by attemptsto apply modal logic – mainly standard deontic logic,the field of logic concerned with obligations and per-missions – and the logic of action and agency to theconcepts of legal and normative relations which Wes-ley Newcomb Hohfeld (1879–1918), an American ju-rist, had regarded to as the fundamental legal concep-tions of jurisprudence (Hohfeld, 1964). These nor-mative relations are alternatively referred to as nor-mative positions that take the forms of obligations,permissions, duties, and rights of agents of a com-munity, society or some other form of organization.By agents here we mean humans, machines, or both.The Kanger-Lindahl theory also embraces the formalrepresentation of more complex normative positionssuch as entitlement, authorization and responsibility.
Besides the areas of legal knowledge representa-tion (e.g. representation of laws, regulations, legalcontracts, etc.), where the theory of normative posi-tions found its initial application, there are also otherareas such as Computer Science, where the theorycontributed much for formal representation of rela-tions between agents. For example, Jones and Sergot(Jones and Sergot, 1992; Jones and Sergot, 1993) de-scribe a modified version of the Kanger-Lindahl the-ory and attempt to apply it to the problem of accesscontrol and security policies specifications and analy-sis for databases. In (Jones and Sergot, 1993), authorsillustrate by an example of library regulations for gov-erning the procedures of loaning books that the use offormal methods in developing system specificationshave to be taken seriously whenever it is necessaryto analyze an ideal case and an actual one and seehow the actual behavior deviates from that of ideal.Use of such formal methods as deontic logic can helpin revealing the possibility of violations, i.e. thosedeviations that had actually occurred. According toJones and Sergot (Jones and Sergot, 1993), the use ofdeontic logic will in general allow (i) to reason withthe specifications developed, (ii) to be able to test the
internal consistency of the system specifications as awhole, and (iii) to use theorem provers to implementand test different components of the system.
In the works of Kanger, Porn, and Lindahl(Kanger, 1972; Kanger, 1985; Porn, 1970; Porn,1977; Lindahl, 1977; Lindahl, 1994), deontic logicwas merged with logic of action and agency to pro-vide a formal account of complex social interactionswithin organizations, which can be related to the tech-nical context by applying it to the multi-agent envi-ronment. They introduce a so-called relativised modaloperator which is designated as Ea, where a representsa responsible agent. The approach is partially simi-lar to that of dynamic logic in the sense that it alsoassumes that an action, if performed, should bringabout a certain state of affairs. For example, expres-sion [a]A would mean that after performing actionait is necessarily the case thatA holds. In other words,a must bring aboutA. Analogously,〈a〉A means thatafter performing actiona it is possibly the case thatAholds, ora might bring aboutA.
However, in the theory of normative positions allactions are associated with their respective responsi-ble agents which makes the semantics comparativelymore expressive. When modeling business systemsusing this theory we now have to deal with the ele-ment of agent’s responsibility embedded in the pro-cess of bringing about new states of affairs. The over-all concept is formalized by
EaA, (1)
which is read as “agenta sees to it thatA is the case”or similarly “agenta brings it about thatA”. It is im-portant to note that actions in this case represent a re-lationship between agents and the state of affairs thatthese agents bring about.
The following expressions are properties for theaction operator. The first axiom schema implies thatthe action operator is asuccessoperator:
⊢ EaA→ A. (2)
It is read as: if agenta brings it about thatA thenAis indeed the case. The second property represents arule of inference:
I f ⊢ A↔ B then⊢ (EaA↔ EaB). (3)
Although the approach of combination of deonticlogic with action logic is reminiscent of that of dy-namic logic by its rules and operators, the theory ofnormative positions provides higher expressivity in away that, unlike in dynamic logic: (i) by using op-eratorEaA one can express different atomic positionsagenta can be in with respect to a particular state ofaffairsA; and (ii) usingEa operator gives another im-portant advantage, namely, one can also formalise a
Business Requirements - Normative Approach to Behavior Modeling
189
normative interpersonal relationship by means of iter-ating the action operators:
EaEbA. (4)
The examples of using this form of iteration can bedemonstrated by the following:
Ea¬EaA and ¬PeEb¬EaA (5)
where the former effectively implies that agenta re-frains from seeing to it thatA and the latter means thatthe agentb is forbidden to prevent agenta from see-ing to it thatA. The detailed definition is described byJones and Sergot in (Jones and Sergot, 1993).
The main building block of our proposed method-ology for formalizing requirements is a tableau. Iteffectively uses the MEASUR constructs and the nor-mative positions for describing the roles of the agents.A deeper analysis of the approach is required forclearer understanding of how MEASUR and the nor-mative perspective are combined. We describe it inthe next section.
3 FORMALIZING MEASUR
MEASUR and, in particular, NORMA, is a curiouslymongrel beast. Its originator, Roland Stamper, whilehaving a firmly applied background in system devel-opment, was influenced by ideas from philosophy oflanguage and the expressive possibilities of deonticlogic. However, in spite of drawing upon these ideasto develop the language and approach, it was always,first and foremost, a semiformal approach to require-ments analysis, lacking a full formal semantics foranalysis and reasoning.
The way in which MEASUR currently treatsnorms is analogous to the use of OCL within UML,that is syntaxes of OCL and UML are based on for-mal languages, but within their respective methodsthey do not have a precise semantics, which we givefor MEASUR. In this paper, we provide what mightbe called a faithful formalization of MEASUR by re-stricting its norms to precisely the kind of logical lan-guage that inspired its notion of behavioral norm: thatis, a limited version of deontic logic, combined withnotions of agency inspired by the theory of normativepositions. This will be defined as a first-order logictogether with a straightforward semantics.
3.1 Normative Tableaux
The language proposed in this paper is somewhatmore complex, due to its relational nature and con-formance to an ontology. However, we need not study
the full set of formulae given: werestrictour attentionto a subset of normative formulae that correspond tothe informal schema for behavioural norms given inDefinition 3.1.
A MEASUR normative definition is of the form:
if trigger occurs and thepre-condition is satisfied,
thenagentperforms an action so thatpost-condition
is Obliged/Permitted/Impermissible from resulting.
Importantly, MEASUR norms never contain deonticquantifiers within the trigger, pre-condition or post-condition statements. Furthermore, actual communi-cation acts are only mentioned in the post-condition:the trigger and pre-condition statement only refer torelations from the ontology. All three elements of thedefinition can refer to agents and entities, however.Finally, the prescription of an agent’s responsibilityand a given deontic obligation are only given in theimplication of the constraint.
We can therefore restrict our attention to a subsetof behavioral norms for a given ontology that natu-rally preserves these syntactic constraints within ourformalization, now defined.
Definition 3.1 (Formal behavioral norms for an ontol-ogy). The set ofbehavioral normsis defined to be anyformula of the form
G→ EaDPost (6)
where
• D is a deontic operator Ob (obligatorily) or Pe(permissibly).
• The only free variables occurring in G and DEFare agent or entity variables from VarAGENT andVarENT ITY.
The idea of a behavioral norm is to associateknowledge and information with agents, who pro-duce and are responsible for it. From a philosophicalperspective, truth is then defined as something thatan agent brings about and is responsible for. Fromthe perspective of determining how to implement anormative ontology as a workflow-based system, weview agents as corresponding to subsystems, businessentities to specifications of data and behavioral normsto expected dynamic interaction protocols betweensubsystems.
MEASUR and, in particular, our logical restric-tion of MEASUR, allows much flexibility when de-tailing the intended meaning of communication acts.This can be done by clarifying assertions. When itcomes to the question of implementation of a com-munication act, an analyst will always ask the client:what is entailed by this act? The client will then ex-plain what changes the act is expected to make on the
Fourth International Symposium on Business Modeling and Software Design
190
elements of the ontology. We encode this descriptionas adefinition DEFof the actA, of the form
A→ DEF (7)
andDEF → A (8)
henceforth abbreviated as
A↔ DEF (9)
whereDEF is any MEASUR formula not involvingcommunication acts, bothA and DEF sharing thesame free variables.
We are now ready to define our formal notionof a MEASUR requirement analysis document. Es-sentially, it consists of an ontology and pairs ofbehavioral norms and definitions, called normativetableaux.
Definition 3.2 (Normative tableaux). A requirementsspecification prescribes the action an agent is obliged(or permitted) to perform given the preconditionshold and consists of pairs of behavioural norms, eachpaired with definitions of the form
REQ= {(Gi → Eb i Di Ai ,Ai ↔
DEFi | i = 1, . . . ,n} (10)
where
• each Di is a deontic operator Ob or Pe.• Ai is a single communication act.• The only free variables occurring in Gi , DEFi and
Ai are agent or entity variables from VarAGENTand VarENTITY.
Each pair is called a normative tableaux.A modelM is a collection of these requirement
pieces prescribed for some system and said to satisfyREQ if it validates the quantified conjunction of allREQ’s normative tableaux. That is,M satisfies REQwhen
M |=
∀x1 : T1 • . . . ,xn : Tk•G1 → Eb1 D1 A1∧A1 ↔ DEF1∧ . . .∧Gn → Ebn D1 An∧An ↔ DEFn
(11)
where x1 : T1, . . . ,xn : Tk is the list of all free variablescontained in the formulae of the tableaux.
A model for an ontology together with a set of be-havioral normsB1, . . . ,Bn is one in which each normis true forM. Depending on the model and the inter-pretation, this might be an abstract representation of asystem execution, or might actually be an implemen-tation of the specification: for example, one in whicheach possible world corresponds to an actual systemstate.
4 THE METHODOLOGY IN USE
This section will describe the methodology of speci-fying norms within the framework of new improvedMEASUR. These norms specify, given certain condi-tions are true, an agent is obliged / permitted / imper-mitted to see to it that certain state of affairs is true.These types of normative specifications are not de-scriptive enough for requirements engineers to modelchanges in states of affairs with the necessary depth ofdata definition. Therefore, we need additional annota-tions for our norms, which we refer to asdefinitions.We hereafter present this norm/definition pair as socallednormative tableaux.
In formalizing MEASUR, we illustrate norms ascommunication acts that are enabled by an agent, us-ing the elements of agency and action of the theoryof normative positions. In the framework of new im-proved MEASUR, in order to specify norms we useso called normative tableaux. Tableau is a table fordefining norms and their data definitions. In otherwords, each normative tableau illustrates a norm as apre-condition and a responsibility expression that re-lates an agent to a particular communication act takenfrom MEASUR ontology. A tableau also providesfurther notation for these norms in the form of defi-nitions, so that each norm is paired with its definition.All norms have their definitions to obtain a certaindepth of data definition and to be able to manipulatewith these data. We need these definitions within ournew MEASUR in order to provide ways for require-ment engineers to define and describe data in conjunc-tion with ontologies.
4.1 Case Study
The subject of our example is to process an ordermade by a customer using her credit card. The mean-ing of processing an order embraces herein such ac-tivities as receiving a new order, processing its data(price, customer’s credit card information), invoicingand dispatching an order, interactions with warehouseand rejecting an order. In performing these activi-ties in the order specified, we examine interaction be-tween three involved players in an organized manner.
The first player, which starts the whole process ofordering is Customer. This player orders products,thereby creating a new instance of order and sends itto the electronic ordering system, which further pro-cesses it in a sequence specified below. The electronicordering system eOrder initiates one activity after an-other and at some point starts interaction with yet an-other player called Warehouse. All these activitiesand communications between different players shift
Business Requirements - Normative Approach to Behavior Modeling
191

the order from one state to another. All orders have astrict correspondence with its particular customer andall orders are stored in the system during their pro-cessing until they are rejected. The activity of rejec-tion removes the order from the system and cancelsthe correspondence with its particular customer.
The activities of making a purchase using our sys-tem is of the following order:
1. When a customer makes an on-line order, he ini-tiates an interaction with the electronic orderingsystem by creating a new instance of the order andchanging the status of this order to “received”.
2. Electronic ordering system initiates the next ac-tivity which processes this new order by checkingorder’s data and customer’s solvency. If this checkis successful, then the status of this order changesfrom “received” to “pending”. Otherwise, if theorder’s total cost is higher than customer’s creditcard limit, then the status of his order changes to“rejected”, which starts the rejecting process byremoving the order from the system.
3. When the order’s state changes to “pending” andif the product ordered is in stock, the system ini-tiates the process of invoicing it by changing itsstatus to “invoiced”.
4. If the order is not available in the stock, thenthe electronic ordering system initiates a com-munication to the warehouse by starting the “re-questincrease” activity.
5. After successful invoicing, the order’s statuschanges to “dispatched” to indicate that the orderis dispatched.
The diagram for this example may be similar toUML’s sequence or activity diagrams. But, it is dif-ferent in the way of providing more expressive defini-tions for activities, interactions, and the notion of re-sponsibility. We will employ this example to illustratethe use of the MEASUR methodology its formalizedversion.
We first represent knowledge as a domain ontol-ogy encompassing such entities as agents, actions,and relationships between them. The ontologies ofMEASUR’s semantic analysis are similar to those of,for example, OWL: they decompose a problem do-main into roles and relationships. Ontologies enableus to identify the kinds of data that are of importanceto business processes. A key difference with OWL isthe ability to directly representagentsandactionsasentities within an ontology. This is useful from theperspective of business process analysis, as it enablesus to identify tasks of a workflow and relate them todata and identify what agent within the organizationhas responsibility for the task.
In our treatment, affordances are viewed asclas-sificationsof things within a business system, withan ontology defining a type structure for the system.An actual executing system consists of a collectionof affordanceinstanceswhich possess the structureprescribed by the ontology and obey any further con-straints imposed by an associated set of norms.
In our case study, we model an electronic orderingsystem. The purchasing system playereOrder is re-lated to theCustomeragent and theWarehouseagent.Customerorders products fromeOrder by initializ-ing the interaction.eOrder receives data describingthe order and performs further processing which nor-mally includes checking availability of the product inthe system, customer’s solvency, invoicing, dispatch-ing, and rejecting. If processing is successful, the sys-tem files an invoice for the purchase and subsequentlydispatches it. If the product is unavailable,eOrdersends a request to the warehouse to increase the stockto further proceed with the order. If processing is un-successful,eOrderrejects the order.
An ontology for the purchasing system is given inFig. 1. Agents are represented as ovals and businessentities as rectangles with curved edges. Communica-tion acts and relations are shown as rectangles, withthe former differentiated by the use of an exclamationmark! before the act’s name.
All affordances (including agents and business en-tities) have a number of typed attributes, defining thekinds of states it may be in. We permit navigationthrough an affordance’s attributes and related affor-dances in the object-oriented style of the OCL.
The system involves processes that cross theboundaries of two subsystems: a customer agent, anorder processing system, and a product warehousesystem. These three subsystems are represented asagents in the ontology,Customer, eOrderandWare-house, respectively. By default all agents except forCustomercontain start and end attributes.
An order is associated with its customer, definedby the orderedby relationship holding between thecustomeragent andorder entity. An order can standin anorderedrelationship with theeOrderagent, af-ter it has been successfully processed. Communica-tion act !receiveorder corresponds to the initial re-ception of data. TheProcessingcommunication actfurther deals with the newly arrived order and checkswhether the client’s credit limit allows for the pur-chase. Namely, it checks whether the total cost ofthe purchase is less than the credit limit of the cus-tomer. This condition results in the following out-comes: if the credit limit is lower than the total costof the purchase then the system rejects the order, oth-erwise it initiates the invoicing process (denoted by
Fourth International Symposium on Business Modeling and Software Design
192
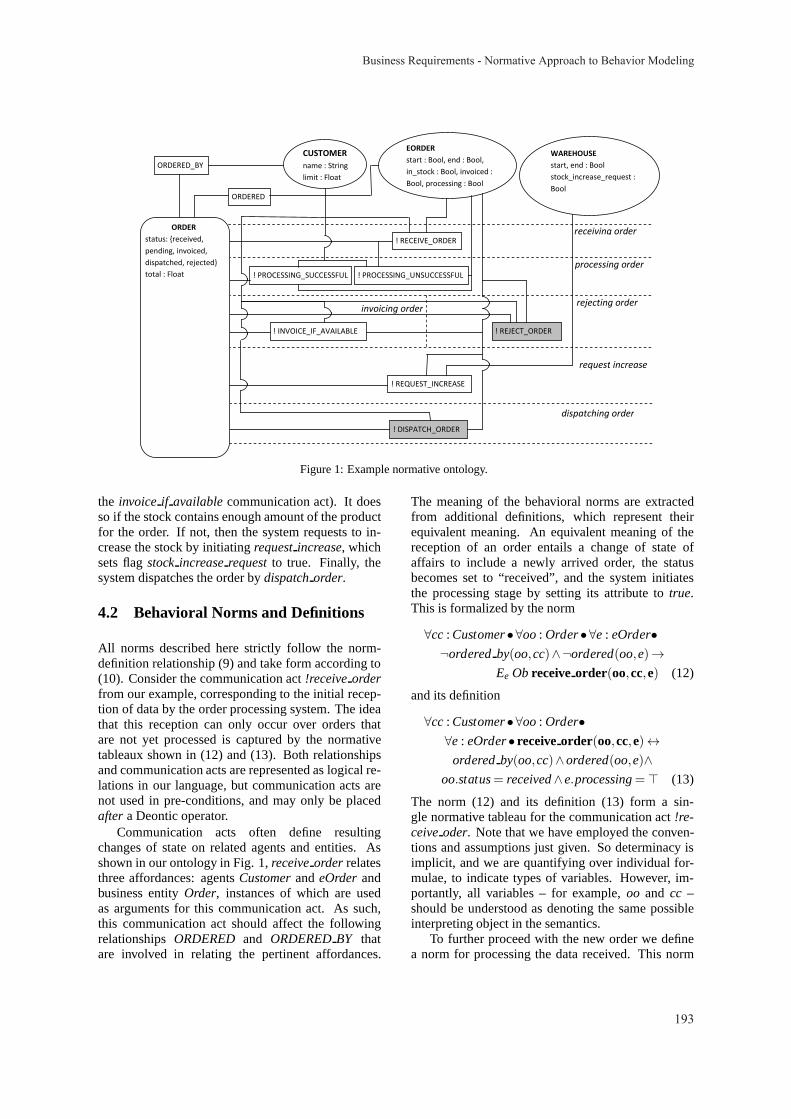
WAREHOUSE
start, end : Bool
stock_increase_request :
Bool
EORDER
start : Bool, end : Bool,
in_stock : Bool, invoiced :
Bool, processing : Bool
CUSTOMER
name : String
limit : Float
ORDERED_BY
! RECEIVE_ORDER
! PROCESSING_SUCCESSFUL
receiving order
processing order
ORDERED
! INVOICE_IF_AVAILABLE
invoicing order rejecting order
! REJECT_ORDER
request increase
! REQUEST_INCREASE
dispatching order
! DISPATCH_ORDER
ORDER
status: {received,
pending, invoiced,
dispatched, rejected}
total : Float ! PROCESSING_UNSUCCESSFUL
Figure 1: Example normative ontology.
the invoice if availablecommunication act). It doesso if the stock contains enough amount of the productfor the order. If not, then the system requests to in-crease the stock by initiatingrequestincrease, whichsets flagstockincreaserequestto true. Finally, thesystem dispatches the order bydispatchorder.
4.2 Behavioral Norms and Definitions
All norms described here strictly follow the norm-definition relationship (9) and take form according to(10). Consider the communication act!receiveorderfrom our example, corresponding to the initial recep-tion of data by the order processing system. The ideathat this reception can only occur over orders thatare not yet processed is captured by the normativetableaux shown in (12) and (13). Both relationshipsand communication acts are represented as logical re-lations in our language, but communication acts arenot used in pre-conditions, and may only be placedafter a Deontic operator.
Communication acts often define resultingchanges of state on related agents and entities. Asshown in our ontology in Fig. 1,receiveorder relatesthree affordances: agentsCustomerandeOrderandbusiness entityOrder, instances of which are usedas arguments for this communication act. As such,this communication act should affect the followingrelationshipsORDERED and ORDEREDBY thatare involved in relating the pertinent affordances.
The meaning of the behavioral norms are extractedfrom additional definitions, which represent theirequivalent meaning. An equivalent meaning of thereception of an order entails a change of state ofaffairs to include a newly arrived order, the statusbecomes set to “received”, and the system initiatesthe processing stage by setting its attribute totrue.This is formalized by the norm
∀cc : Customer•∀oo : Order•∀e : eOrder•
¬orderedby(oo,cc)∧¬ordered(oo,e)→
Ee Ob receiveorder(oo,cc,e) (12)
and its definition
∀cc : Customer•∀oo : Order•
∀e : eOrder• receiveorder(oo,cc,e)↔
orderedby(oo,cc)∧ordered(oo,e)∧
oo.status= received∧e.processing=⊤ (13)
The norm (12) and its definition (13) form a sin-gle normative tableau for the communication act!re-ceiveoder. Note that we have employed the conven-tions and assumptions just given. So determinacy isimplicit, and we are quantifying over individual for-mulae, to indicate types of variables. However, im-portantly, all variables – for example,oo and cc –should be understood as denoting the same possibleinterpreting object in the semantics.
To further proceed with the new order we definea norm for processing the data received. This norm
Business Requirements - Normative Approach to Behavior Modeling
193

effectively defines the requirement to check the pay-ment (in order to be able to proceed with the orderin a successful manner, it is important that thetotalfor the purchase does not exceed thelimit value in thecredit card) and order related data. It should also benoted that another requirement to enable this norm isthat the order should already bereceivedfrom apar-ticular customer. In order to model a system whichbehaves in a discrete fashion, normprocessingis splitinto two cases:processsuccessful
∀cc : Customer•∀oo : Order•∀e : eOrder•
orderedby(oo,cc)∧ordered(oo,e)∧
oo.status= received∧e.processing=⊤∧
oo.total < cc.limit →
Ee Obprocesssuccessful(oo,cc,e) (14)
with its definition
∀cc : Customer•∀oo : Order•∀e : eOrder•
processsuccessful(oo,cc,e)↔
oo.status= pending (15)
andprocessunsuccessful
∀cc : Customer•∀oo : Order•∀e : eOrder•
orderedby(oo,cc)∧ordered(oo,e)∧
oo.status= received∧e.processing=⊤∧
oo.total ≥ cc.limit →
Ee Obprocessunsuccessful(oo,cc,e) (16)
with its definition
∀cc : Customer•∀oo : Order•∀e : eOrder•
processunsuccessful(oo,cc,e)↔
oo.status= re jected (17)
If the pre-conditions ofprocesssuccessfulhold thenthe norm changes the status topending, as it is de-picted in (14), which enables the!invoice if availablecommunication act. Otherwise, the system initiatesrejecting of the order by settingstatusto rejectedas itis illustrated in (16). Below we show the norm and itsdefinition for invoicing.
∀cc : Customer•∀oo : Order•∀e : eOrder•
orderedby(oo,cc)∧ordered(oo,e)∧
oo.status= pending∧e.in stock=⊤→
Ee Ob invoice if available(oo,cc,e) (18)
∀cc : Customer•∀oo : Order•∀e : eOrder•
invoice if available(oo,cc,e)↔
oo.status= invoiced∧e.order invoiced=⊤ (19)
Invoicing the order and increasing the stock are fol-lowed by the dispatching process. We depict its defi-nition.
∀cc : Customer•∀oo : Order•∀e : eOrder•
orderedby(oo,cc)∧ordered(oo,e)∧
oo.status= invoiced→
Ee Obdispatch order(oo,cc,e) (20)
∀cc : Customer•∀oo : Order•∀e : eOrder•
dispatch order(oo,cc,e)↔
oo.status= dispatched (21)
Dispatching relatesCustomerto eOrder and Orderand uses their instances for pre-conditions and tochange the state of affairs towards updating the sta-tus to dispatched. This communication act finishesthe ordering process. If processing was not success-ful, in other words if pre-conditions for normpro-cessunsuccessfulwere true, then theeOrdersystemrejects the order in accordance with the norm in (22).
∀cc : Customer•∀oo : Order•∀e : eOrder•
orderedby(oo,cc)∧ordered(oo,e)∧
oo.status= re jected→
Ee Ob reject order(oo,cc,e) (22)
and its definition
∀oo : Order•∀e : eOrder•
reject order(oo,cc,e)↔
¬ordered(oo,e)∧¬orderedby(oo,cc) (23)
According to Fig. 1, there exist other communicationacts such asinvoice if availableand dispatchorderand their norm-definition pairs can also be definedin a similar way we have defined tableaux (12)–(23).The norm-definition relationship is important as ex-pression in the definition part of the tableaux fur-ther elaborates each norm that precedes this defini-tion. For example, the norm with its argumentsre-ceiveorder(oo,cc,e)defined in (12) has a meaning ofmapping certain objects together while defining a newinstance of the order, in that:
• orderedby(oo,cc) means that instance of orderoo is mapped to the instance of an abstract ma-chinecc (that models a customer),
• ordered(oo,e) means that instance of orderoo ismapped to the instance of machinee (that modelsa system),
• oo.status= receivedmeans that the status shouldnow change its value toreceived, and
Fourth International Symposium on Business Modeling and Software Design
194
• e.processing=⊤ means that the processing statusof the system should now change toprocessingtoinvoke the next norm.
All other subsequent norms are similar in the waythey are read.
5 CONCLUSION
In this paper, we have shown an approach of combin-ing the MEASUR methodology and the limited ver-sion of the theory of normative positions to modelnorms and normative ontologies. The level of abstrac-tion pertinent to this approach effectively correspondsto early stages of business modeling. The model thatwe obtain as a result is a piece of knowledge whichcan (semi-formally) describe a functional structure ofa company (e.g., stakeholders, departments, people,business processes, communications between theseprocesses, etc.).
The approach described in this paper represents acombination of MEASUR with the theory of norma-tive positions limited to the kinds of norms used inthis methodology and describe business rules whichspecify interaction between two agents for achievingcertain goals. Since the MEASUR methodology isa set of methods for business modeling and require-ments specification for information systems, it can beused to analyze and specify an organization’s busi-ness processes. The term affordance is introduced inthis paper as a set of actions formed by the knowledgethat an agent gains from existing in the environmentand learning by interacting. The artifact developedcan effectively be used as a high-level structured re-quirements specifications that can be turned into moreconcrete models using a range of different transfor-mation and refinement techniques (e.g. Model-drivenArchitecture or refinement of B-based models), whichwill be the subject of our future work. We intendto see how the developed methodology can be usefulin both developing formalized and structured require-ments and semantically better fit the modular designspecifications using formal languages such as B andEvent-B.
REFERENCES
Cimatti, A., Roveri, M., Susi, A., and Tonetta, S. (2010).Formalization and Validation of Safety-Critical Re-quirements.EPTCS.
Hohfeld, W. (1964). Fundamental Legal Conceptions AsApplied in Judicial Reasoning. Dartmouth Publishing.
Jones, A. and Sergot, M. (1992). Formal Specification ofSecurity Requirements Using the Theory of Norma-tive Positions. Proceedings of the Second EuropeanSymposium on Research in Computer.
Jones, A. and Sergot, M. (1993). On the Characterizationof Law and Computer Systems: The Normative Sys-tems Perspective.Deontic Logic in Computer Science:Normative System Specification.
Kanger, S. (1972).Law and Logic. Theoria.Kanger, S. (1985). On Realization of Human Rights.Ac-
tion, Logic and Social Theory.Lindahl, L. (1977).Position and Change – A Study in Law
and Logic. D. Reidel Publishing Company.Lindahl, L. (1994). Stig Kanger’s Theory of Rights.Logic,
Methodology and Philosophy of Science.Liu, K. (2000).Semiotics in Information Systems Engineer-
ing. Cambridge University Press.McNamara, P. (2006). Deontic Logic.Stanford Encyclope-
dia of Philosophy.Ponsard, C. and Dieul, E. (2008). From Requirements Mod-
els to Formal Specifications in B.ReMo2V.Porn, I. (1970).The Power of Logic. Blackwell Oxford.Porn, I. (1977). Action Theory and Social Science: Some
Formal Models. D. Reidel, Dordrecht.Searle, J. (1969).Speech acts: An Essay in the Philosophy
of Language. Cambridge University Press.Searle, J. (1971).The Philosophy of Language. Oxford
University Press.van Lamsweerde, A. (2001). Building formal requirements
models for reliable software.Reliable Software Tech-nologies.
Business Requirements - Normative Approach to Behavior Modeling
195
Towards an Integrated Model for Enterprise Interoperability
Wided GuedriaSSI, CRP Henri Tudor, 29 JFK, Luxembourg-Kircheberg, Luxembourg
Keywords: Enterprise Interoperability, Interoperability Maturity, Framework, Integrated Model.
Abstract: One of the challenges faced by a network of enterprises is the development of interoperability between itsmembers. Transformations in this context are usually driven by Enterprise Interoperability (EI) problems thatmay be faced. In order to quickly overcome these problems, enterprises need characterizing and assessinginteroperability to be prepared to establish means for collaboration. Maturity models have been developedin response to this challenge. In this paper, we propose to define an integrated model based on a maturitymodel and an ontological formalization of the enterprise interoperability domain. This will allow diagnosinginteroperability problems when assessing interoperability. The integrated model could be used improve thecapability of an enterprise to interoperate based on a shared understanding of interoperability.
1 INTRODUCTION
As information systems and technologies grow incomplexity and scope, the need for a coherentand comprehensive modeling approach becomes ofparamount importance. The enterprise architecturedeals with these issues in a coherent and integral fash-ion while at the same time a medium to achieve ashared understanding and conceptualization amongall stakeholders involved and govern enterprise de-velopment based on this conceptualization (Proper,2008). The intent of an enterprise architecture is todetermine how an organization can most effectivelyachieve its current and future objectives. Amongthese objectives, we focus on improving the capabilityof the enterprise to interoperate with future partners.
The complexity of an organization can be hugedue to many processes, departments and informationsystems involved. To provide architects with somestructure, architecture frameworks have been intro-duced. These frameworks intend to aid architects byproviding a meta-model (e.g. an ontology) which usesdifferent abstraction levels to map all kinds of infor-mation needed. As part of EA, some of the modelsshould be dedicated to interoperability, as an impor-tant issue that have to be taken into account to reachthe business objectives. To our knowledge, none ofthe existing Enterprise Interoperability (EI) frame-works proposes a shared understanding and concep-tualization of interoperability while improving the ca-pability of an enterprise to interoperate.
In this paper, we propose to define an integratedframework that defines and improves the enterpriseinteroperability. The paper is structured as follows:section 2 defines the research ontext and reviews someof the related work. Based on that, section 3 definesand describes the integrated framework. Section 4gives an example to use the proposed model. Con-clusion and future work are outlined in section 5.
2 RELATED WORK
In the current globalised and networked society, en-terprises need to collaborate with other enterprises tomeet their own added values and to exploit the marketopportunities. A major issue in global collaborationand cooperation is the development of interoperabil-ity. Many definitions of interoperability have beenproposed in the literature. A review of them can befound in (Guedria, 2012). The most known definitionis the one proposed by the IEEE, considering inter-operability as the ability of two or more systems orcomponents to exchange information and to use theinformation that has been exchanged (IEEE, 1990).
2.1 Enterprise InteroperabilityFrameworks
The main purpose of an interoperability frameworkis to provide an organising mechanism so that con-cepts, problems and knowledge on EI can be repre-
196
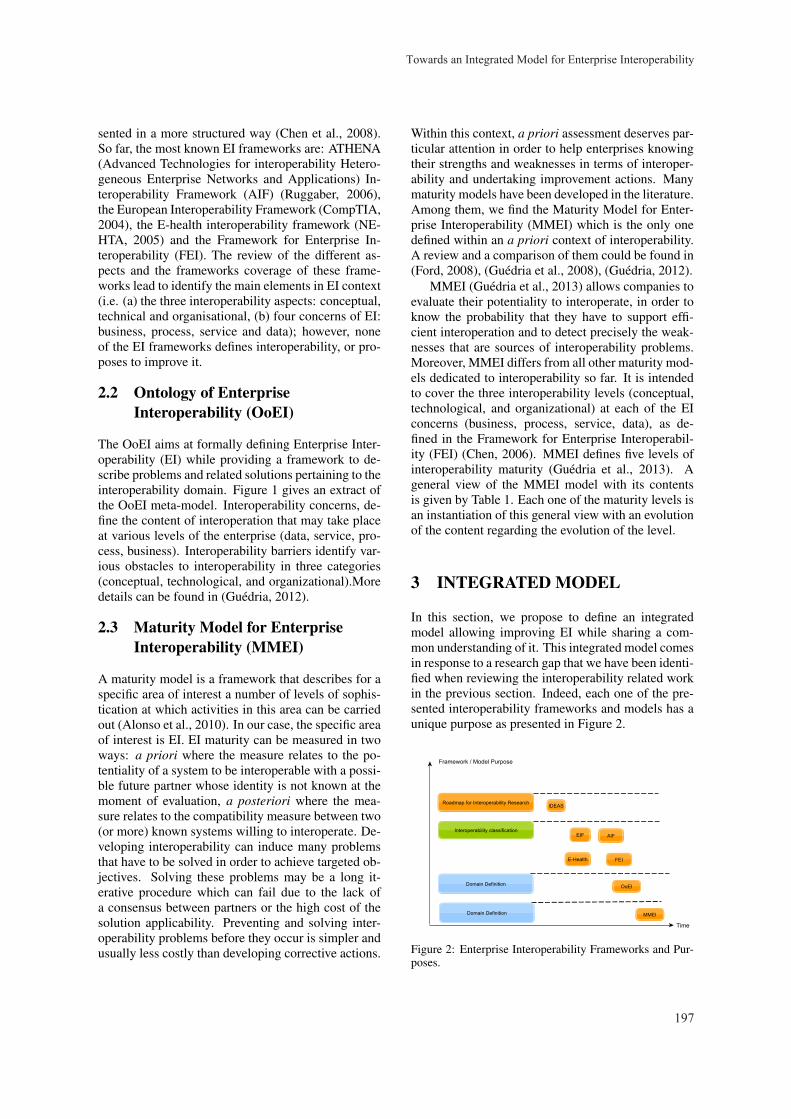
sented in a more structured way (Chen et al., 2008).So far, the most known EI frameworks are: ATHENA(Advanced Technologies for interoperability Hetero-geneous Enterprise Networks and Applications) In-teroperability Framework (AIF) (Ruggaber, 2006),the European Interoperability Framework (CompTIA,2004), the E-health interoperability framework (NE-HTA, 2005) and the Framework for Enterprise In-teroperability (FEI). The review of the different as-pects and the frameworks coverage of these frame-works lead to identify the main elements in EI context(i.e. (a) the three interoperability aspects: conceptual,technical and organisational, (b) four concerns of EI:business, process, service and data); however, noneof the EI frameworks defines interoperability, or pro-poses to improve it.
2.2 Ontology of EnterpriseInteroperability (OoEI)
The OoEI aims at formally defining Enterprise Inter-operability (EI) while providing a framework to de-scribe problems and related solutions pertaining to theinteroperability domain. Figure 1 gives an extract ofthe OoEI meta-model. Interoperability concerns, de-fine the content of interoperation that may take placeat various levels of the enterprise (data, service, pro-cess, business). Interoperability barriers identify var-ious obstacles to interoperability in three categories(conceptual, technological, and organizational).Moredetails can be found in (Guedria, 2012).
2.3 Maturity Model for EnterpriseInteroperability (MMEI)
A maturity model is a framework that describes for aspecific area of interest a number of levels of sophis-tication at which activities in this area can be carriedout (Alonso et al., 2010). In our case, the specific areaof interest is EI. EI maturity can be measured in twoways: a priori where the measure relates to the po-tentiality of a system to be interoperable with a possi-ble future partner whose identity is not known at themoment of evaluation, a posteriori where the mea-sure relates to the compatibility measure between two(or more) known systems willing to interoperate. De-veloping interoperability can induce many problemsthat have to be solved in order to achieve targeted ob-jectives. Solving these problems may be a long it-erative procedure which can fail due to the lack ofa consensus between partners or the high cost of thesolution applicability. Preventing and solving inter-operability problems before they occur is simpler andusually less costly than developing corrective actions.
Within this context, a priori assessment deserves par-ticular attention in order to help enterprises knowingtheir strengths and weaknesses in terms of interoper-ability and undertaking improvement actions. Manymaturity models have been developed in the literature.Among them, we find the Maturity Model for Enter-prise Interoperability (MMEI) which is the only onedefined within an a priori context of interoperability.A review and a comparison of them could be found in(Ford, 2008), (Guedria et al., 2008), (Guedria, 2012).
MMEI (Guedria et al., 2013) allows companies toevaluate their potentiality to interoperate, in order toknow the probability that they have to support effi-cient interoperation and to detect precisely the weak-nesses that are sources of interoperability problems.Moreover, MMEI differs from all other maturity mod-els dedicated to interoperability so far. It is intendedto cover the three interoperability levels (conceptual,technological, and organizational) at each of the EIconcerns (business, process, service, data), as de-fined in the Framework for Enterprise Interoperabil-ity (FEI) (Chen, 2006). MMEI defines five levels ofinteroperability maturity (Guedria et al., 2013). Ageneral view of the MMEI model with its contentsis given by Table 1. Each one of the maturity levels isan instantiation of this general view with an evolutionof the content regarding the evolution of the level.
3 INTEGRATED MODEL
In this section, we propose to define an integratedmodel allowing improving EI while sharing a com-mon understanding of it. This integrated model comesin response to a research gap that we have been identi-fied when reviewing the interoperability related workin the previous section. Indeed, each one of the pre-sented interoperability frameworks and models has aunique purpose as presented in Figure 2.
Figure 2: Enterprise Interoperability Frameworks and Pur-poses.
Towards an Integrated Model for Enterprise Interoperability
197
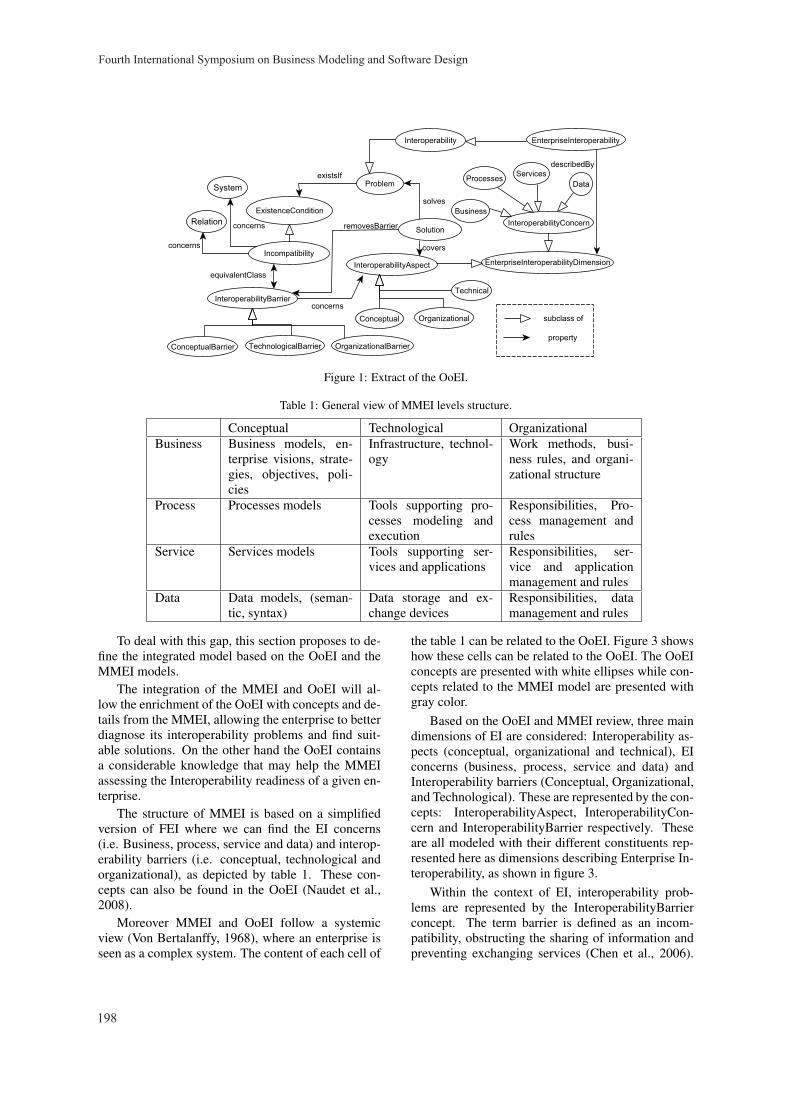
Figure 1: Extract of the OoEI.
Table 1: General view of MMEI levels structure.
Conceptual Technological OrganizationalBusiness Business models, en-
terprise visions, strate-gies, objectives, poli-cies
Infrastructure, technol-ogy
Work methods, busi-ness rules, and organi-zational structure
Process Processes models Tools supporting pro-cesses modeling andexecution
Responsibilities, Pro-cess management andrules
Service Services models Tools supporting ser-vices and applications
Responsibilities, ser-vice and applicationmanagement and rules
Data Data models, (seman-tic, syntax)
Data storage and ex-change devices
Responsibilities, datamanagement and rules
To deal with this gap, this section proposes to de-fine the integrated model based on the OoEI and theMMEI models.
The integration of the MMEI and OoEI will al-low the enrichment of the OoEI with concepts and de-tails from the MMEI, allowing the enterprise to betterdiagnose its interoperability problems and find suit-able solutions. On the other hand the OoEI containsa considerable knowledge that may help the MMEIassessing the Interoperability readiness of a given en-terprise.
The structure of MMEI is based on a simplifiedversion of FEI where we can find the EI concerns(i.e. Business, process, service and data) and interop-erability barriers (i.e. conceptual, technological andorganizational), as depicted by table 1. These con-cepts can also be found in the OoEI (Naudet et al.,2008).
Moreover MMEI and OoEI follow a systemicview (Von Bertalanffy, 1968), where an enterprise isseen as a complex system. The content of each cell of
the table 1 can be related to the OoEI. Figure 3 showshow these cells can be related to the OoEI. The OoEIconcepts are presented with white ellipses while con-cepts related to the MMEI model are presented withgray color.
Based on the OoEI and MMEI review, three maindimensions of EI are considered: Interoperability as-pects (conceptual, organizational and technical), EIconcerns (business, process, service and data) andInteroperability barriers (Conceptual, Organizational,and Technological). These are represented by the con-cepts: InteroperabilityAspect, InteroperabilityCon-cern and InteroperabilityBarrier respectively. Theseare all modeled with their different constituents rep-resented here as dimensions describing Enterprise In-teroperability, as shown in figure 3.
Within the context of EI, interoperability prob-lems are represented by the InteroperabilityBarrierconcept. The term barrier is defined as an incom-patibility, obstructing the sharing of information andpreventing exchanging services (Chen et al., 2006).
Fourth International Symposium on Business Modeling and Software Design
198
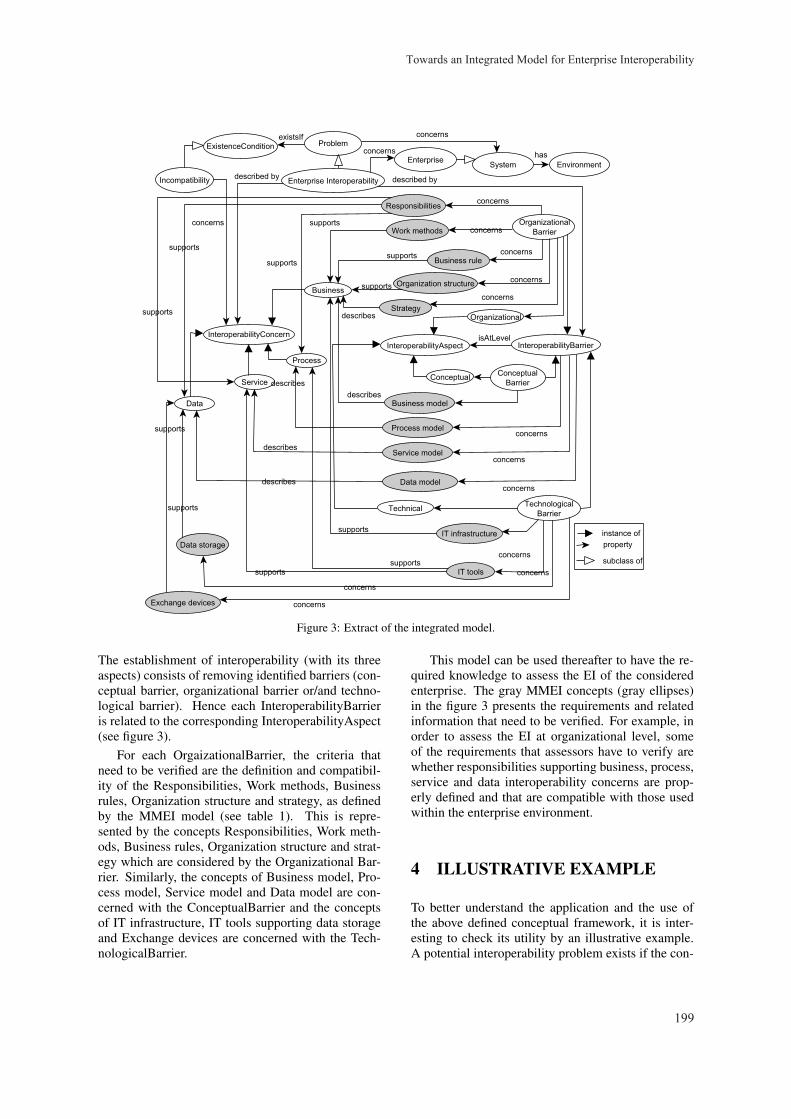
Figure 3: Extract of the integrated model.
The establishment of interoperability (with its threeaspects) consists of removing identified barriers (con-ceptual barrier, organizational barrier or/and techno-logical barrier). Hence each InteroperabilityBarrieris related to the corresponding InteroperabilityAspect(see figure 3).
For each OrgaizationalBarrier, the criteria thatneed to be verified are the definition and compatibil-ity of the Responsibilities, Work methods, Businessrules, Organization structure and strategy, as definedby the MMEI model (see table 1). This is repre-sented by the concepts Responsibilities, Work meth-ods, Business rules, Organization structure and strat-egy which are considered by the Organizational Bar-rier. Similarly, the concepts of Business model, Pro-cess model, Service model and Data model are con-cerned with the ConceptualBarrier and the conceptsof IT infrastructure, IT tools supporting data storageand Exchange devices are concerned with the Tech-nologicalBarrier.
This model can be used thereafter to have the re-quired knowledge to assess the EI of the consideredenterprise. The gray MMEI concepts (gray ellipses)in the figure 3 presents the requirements and relatedinformation that need to be verified. For example, inorder to assess the EI at organizational level, someof the requirements that assessors have to verify arewhether responsibilities supporting business, process,service and data interoperability concerns are prop-erly defined and that are compatible with those usedwithin the enterprise environment.
4 ILLUSTRATIVE EXAMPLE
To better understand the application and the use ofthe above defined conceptual framework, it is inter-esting to check its utility by an illustrative example.A potential interoperability problem exists if the con-
Towards an Integrated Model for Enterprise Interoperability
199
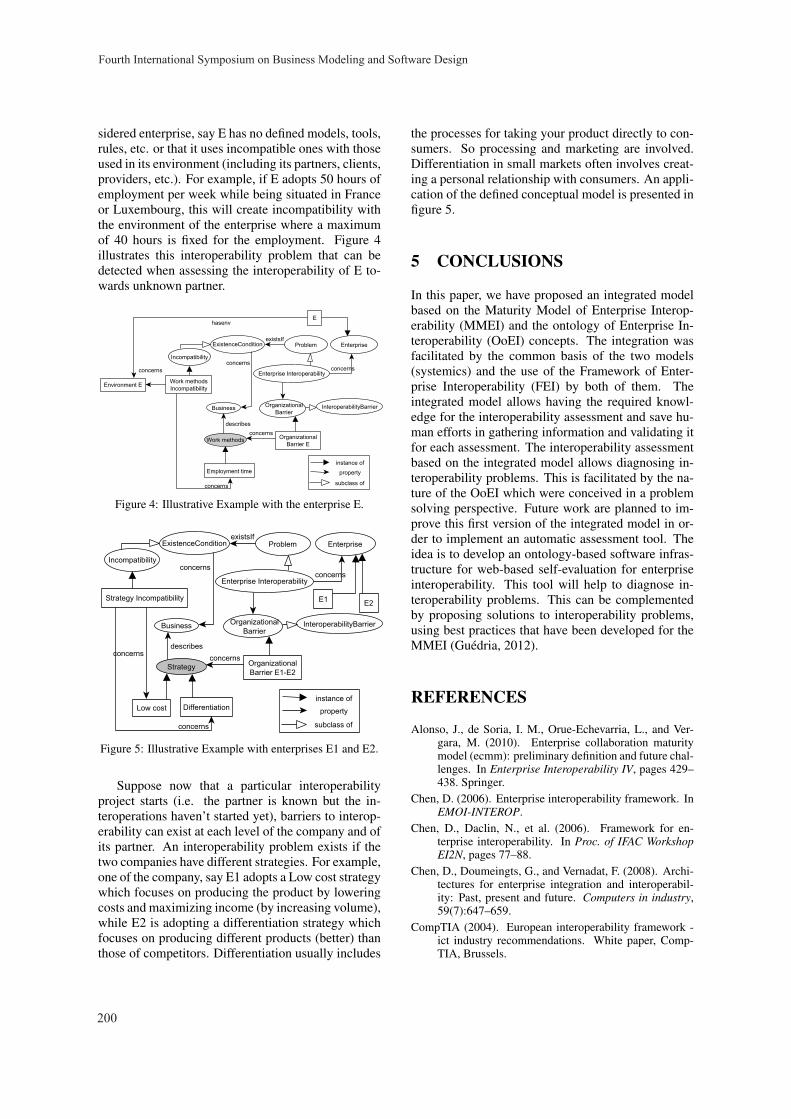
sidered enterprise, say E has no defined models, tools,rules, etc. or that it uses incompatible ones with thoseused in its environment (including its partners, clients,providers, etc.). For example, if E adopts 50 hours ofemployment per week while being situated in Franceor Luxembourg, this will create incompatibility withthe environment of the enterprise where a maximumof 40 hours is fixed for the employment. Figure 4illustrates this interoperability problem that can bedetected when assessing the interoperability of E to-wards unknown partner.
Figure 4: Illustrative Example with the enterprise E.
Figure 5: Illustrative Example with enterprises E1 and E2.
Suppose now that a particular interoperabilityproject starts (i.e. the partner is known but the in-teroperations haven’t started yet), barriers to interop-erability can exist at each level of the company and ofits partner. An interoperability problem exists if thetwo companies have different strategies. For example,one of the company, say E1 adopts a Low cost strategywhich focuses on producing the product by loweringcosts and maximizing income (by increasing volume),while E2 is adopting a differentiation strategy whichfocuses on producing different products (better) thanthose of competitors. Differentiation usually includes
the processes for taking your product directly to con-sumers. So processing and marketing are involved.Differentiation in small markets often involves creat-ing a personal relationship with consumers. An appli-cation of the defined conceptual model is presented infigure 5.
5 CONCLUSIONS
In this paper, we have proposed an integrated modelbased on the Maturity Model of Enterprise Interop-erability (MMEI) and the ontology of Enterprise In-teroperability (OoEI) concepts. The integration wasfacilitated by the common basis of the two models(systemics) and the use of the Framework of Enter-prise Interoperability (FEI) by both of them. Theintegrated model allows having the required knowl-edge for the interoperability assessment and save hu-man efforts in gathering information and validating itfor each assessment. The interoperability assessmentbased on the integrated model allows diagnosing in-teroperability problems. This is facilitated by the na-ture of the OoEI which were conceived in a problemsolving perspective. Future work are planned to im-prove this first version of the integrated model in or-der to implement an automatic assessment tool. Theidea is to develop an ontology-based software infras-tructure for web-based self-evaluation for enterpriseinteroperability. This tool will help to diagnose in-teroperability problems. This can be complementedby proposing solutions to interoperability problems,using best practices that have been developed for theMMEI (Guedria, 2012).
REFERENCES
Alonso, J., de Soria, I. M., Orue-Echevarria, L., and Ver-gara, M. (2010). Enterprise collaboration maturitymodel (ecmm): preliminary definition and future chal-lenges. In Enterprise Interoperability IV, pages 429–438. Springer.
Chen, D. (2006). Enterprise interoperability framework. InEMOI-INTEROP.
Chen, D., Daclin, N., et al. (2006). Framework for en-terprise interoperability. In Proc. of IFAC WorkshopEI2N, pages 77–88.
Chen, D., Doumeingts, G., and Vernadat, F. (2008). Archi-tectures for enterprise integration and interoperabil-ity: Past, present and future. Computers in industry,59(7):647–659.
CompTIA (2004). European interoperability framework -ict industry recommendations. White paper, Comp-TIA, Brussels.
Fourth International Symposium on Business Modeling and Software Design
200

Ford, T. (2008). Measuring System Interoperability: An i-Score Improvement. Proceedings of the 6th AnnualConference on Systems Engineering Research.
Guedria, W. (Bordeaux, France, 2012). A Contributionto Enterprise Interoperability Maturity Assessment.Ph.D. thesis, University of Bordeaux1.
Guedria, W., Naudet, Y., and Chen, D. (2008). Interoper-ability maturity models–survey and comparison–. InOn the move to meaningful Internet systems: OTM2008 Workshops, pages 273–282. Springer.
Guedria, W., Naudet, Y., and Chen, D. (2013). Maturitymodel for enterprise interoperability. Enterprise In-formation Systems, (ahead-of-print):1–28.
IEEE (1990). IEEE standard computer dictionary: A com-pilation of ieee standard computer glossaries. Insti-tute of Electrical and Electronics Engineers.
Naudet, Y., Latour, T., and D.Chen (2008). A systemic ap-proach to interoperability formalization. In IFAC08workshops.
NEHTA (2005). Towards an interoperability framework,version 1.8. White paper, National E-Health Transi-tion Authority, Australia.
Proper, E. (2008). Enterprise Architecture: Creating Valueby Informed Governance. Springer.
Ruggaber, R. (2006). Athena-advanced technologies forinteroperability of heterogeneous enterprise networksand their applications. Interoperability of enterprisesoftware and applications, pages 459–460.
Von Bertalanffy, L. (1968). General System Theory:Foundations, Development, Applications. GeorgesBraziller, Inc., New York, USA.
Towards an Integrated Model for Enterprise Interoperability
201
Applying Business Process Modeling Tools in Enterprise Resource Planning System Replacements
A Case Study
Stephan Groß1 and Justus Holler2 1Prof. Becker GmbH, Luetke Berg 4-6, 48341 Altenberge, Germany
2University of Muenster – ERCIS, Leonardo-Campus 3, 48149 Muenster, Germany [email protected], [email protected]
Keywords: Change Management, Business Process Modeling Tool, Enterprise Resource Planning.
Abstract: Enterprise resource planning systems are the IT backbone of companies in the IT markets and in all those where efficient and integrated business processes are a necessity to stay competitive. As the markets change also the IT requirements do and the need for an Enterprise resource planning system replacement rises. This article argues that business process modeling tools can be used to document and communicate changes in the operational and organizational structure related to the replacement. The suitability of a tool with typical modeling features is evaluated within a project. The findings regarding semantics, structure, documentation, and re-usability are discussed and an outlook for future research is given.
1 MOTIVATION
In order to meet the constantly rising market expectations information technology (IT) does matter (Carr, 2003). Especially for large companies with complex and interleaved processes a well-designed Enterprise resource planning system (ERP system) supporting all business processes (Davenport, 1998) is of particular importance. During ERP system usage a point will be reached where the individual adaptation (in case of individual software) or the updates (in case of a standard ERP system e. g. SAP AG's ERP Central Component, SAP ECC) are not satisfying the customer needs anymore or are too costly. At this point in time the replacement of the complete ERP system is required. The migration from the old system to the new one is a complex and time-consuming project (Huang, Hung, Chen & Ku, 2004; Peslak, Subramanian & Clayton, 2008). This project and its subprojects are nearly always supported by external consultants because the required ERP system knowledge is not present and the human resources are missing.
In such projects tools like Microsoft Project or more sophisticated tools are often used. In this article we focus on business process modeling tools (BPM tools) supporting the change management
subproject. Literature states, that these tools have a positive influence on critical success factors like understanding the current and new business processes including their IT and organizational interrelations (as-is and to-be models) (Holland & Light, 1999; Nah, Lau & Kuang, 2001). Hence, we argue that BPM tools are particularly well suited in documenting and communicating the changes.
But often the usage of the BPM tool is a project in its own. A full grown tool like the Architecture of Integrated Information Systems Toolset (ARIS Toolset) (Scheer & Nüttgens, 2000) is too complex for simply supporting the external consultants with their documentation. In contrast, tools like Microsoft Visio or Microsoft PowerPoint are too limited regarding their modeling functionalities. Therefore, the research questions of this article are:
RQ1: Are BPM tools well suited for documenting and communicating changes related to ERP replacements?
RQ2: Which features are especially relevant for a BPM tool in order to efficiently support the documentation and communication of changes in the context of an ERP replacement?
The remaining article is structured as follows: in the next section the case and research method is
202
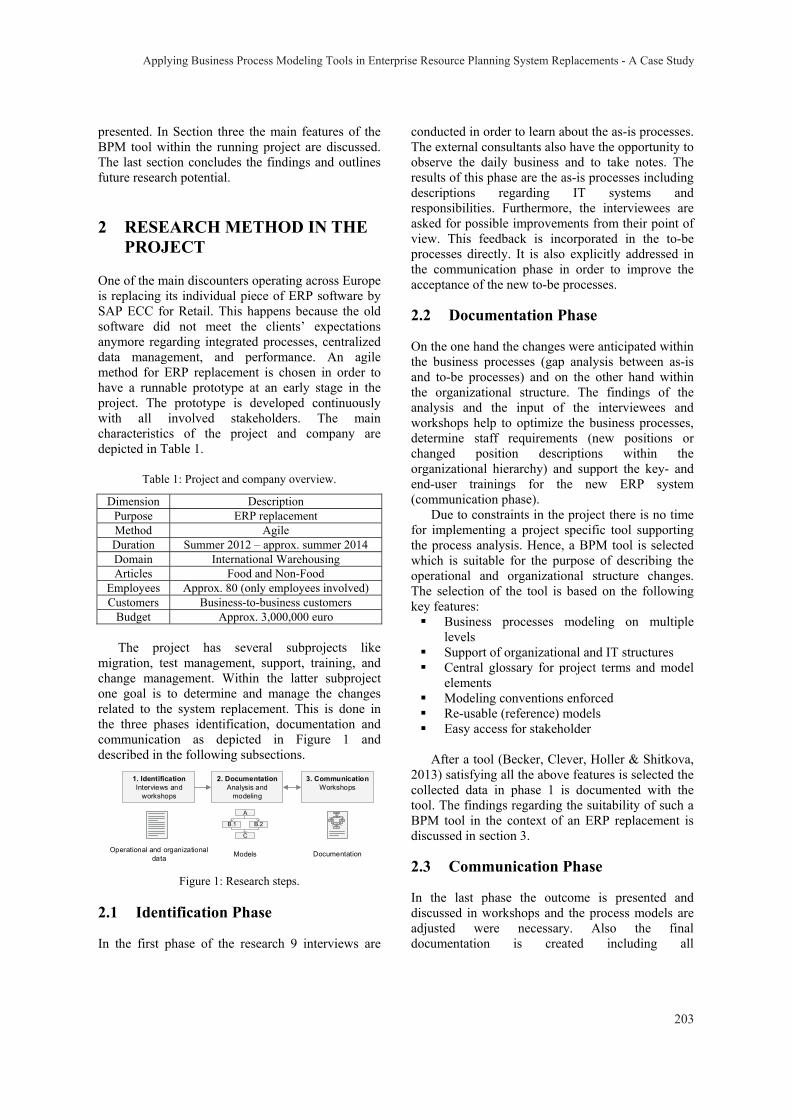
presented. In Section three the main features of the BPM tool within the running project are discussed. The last section concludes the findings and outlines future research potential.
2 RESEARCH METHOD IN THE PROJECT
One of the main discounters operating across Europe is replacing its individual piece of ERP software by SAP ECC for Retail. This happens because the old software did not meet the clients’ expectations anymore regarding integrated processes, centralized data management, and performance. An agile method for ERP replacement is chosen in order to have a runnable prototype at an early stage in the project. The prototype is developed continuously with all involved stakeholders. The main characteristics of the project and company are depicted in Table 1.
Table 1: Project and company overview.
Dimension Description Purpose ERP replacement Method Agile Duration Summer 2012 – approx. summer 2014 Domain International Warehousing Articles Food and Non-Food
Employees Approx. 80 (only employees involved) Customers Business-to-business customers
Budget Approx. 3,000,000 euro The project has several subprojects like
migration, test management, support, training, and change management. Within the latter subproject one goal is to determine and manage the changes related to the system replacement. This is done in the three phases identification, documentation and communication as depicted in Figure 1 and described in the following subsections.
Figure 1: Research steps.
2.1 Identification Phase
In the first phase of the research 9 interviews are
conducted in order to learn about the as-is processes. The external consultants also have the opportunity to observe the daily business and to take notes. The results of this phase are the as-is processes including descriptions regarding IT systems and responsibilities. Furthermore, the interviewees are asked for possible improvements from their point of view. This feedback is incorporated in the to-be processes directly. It is also explicitly addressed in the communication phase in order to improve the acceptance of the new to-be processes.
2.2 Documentation Phase
On the one hand the changes were anticipated within the business processes (gap analysis between as-is and to-be processes) and on the other hand within the organizational structure. The findings of the analysis and the input of the interviewees and workshops help to optimize the business processes, determine staff requirements (new positions or changed position descriptions within the organizational hierarchy) and support the key- and end-user trainings for the new ERP system (communication phase).
Due to constraints in the project there is no time for implementing a project specific tool supporting the process analysis. Hence, a BPM tool is selected which is suitable for the purpose of describing the operational and organizational structure changes. The selection of the tool is based on the following key features:
Business processes modeling on multiple levels
Support of organizational and IT structures Central glossary for project terms and model
elements Modeling conventions enforced Re-usable (reference) models Easy access for stakeholder After a tool (Becker, Clever, Holler & Shitkova,
2013) satisfying all the above features is selected the collected data in phase 1 is documented with the tool. The findings regarding the suitability of such a BPM tool in the context of an ERP replacement is discussed in section 3.
2.3 Communication Phase
In the last phase the outcome is presented and discussed in workshops and the process models are adjusted were necessary. Also the final documentation is created including all
1. IdentificationInterviews and
workshops
2. DocumentationAnalysis and
modeling
3. CommunicationWorkshops
Operational and organizational data Models Documentation
A
B.1 B.2
C
A
B.1 B.2
C
E
G
Applying Business Process Modeling Tools in Enterprise Resource Planning System Replacements - A Case Study
203
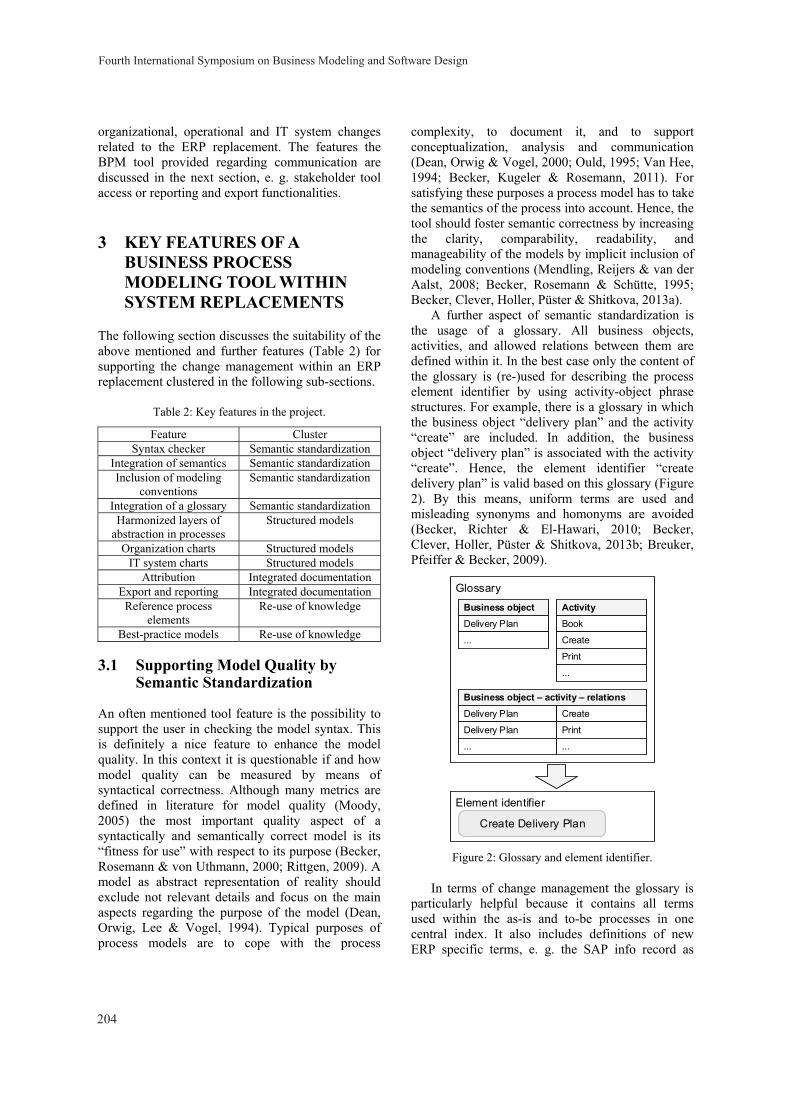
organizational, operational and IT system changes related to the ERP replacement. The features the BPM tool provided regarding communication are discussed in the next section, e. g. stakeholder tool access or reporting and export functionalities.
3 KEY FEATURES OF A BUSINESS PROCESS MODELING TOOL WITHIN SYSTEM REPLACEMENTS
The following section discusses the suitability of the above mentioned and further features (Table 2) for supporting the change management within an ERP replacement clustered in the following sub-sections.
Table 2: Key features in the project.
Feature Cluster Syntax checker Semantic standardization
Integration of semantics Semantic standardization Inclusion of modeling
conventions Semantic standardization
Integration of a glossary Semantic standardization Harmonized layers of
abstraction in processes Structured models
Organization charts Structured models IT system charts Structured models
Attribution Integrated documentation Export and reporting Integrated documentation
Reference process elements
Re-use of knowledge
Best-practice models Re-use of knowledge
3.1 Supporting Model Quality by Semantic Standardization
An often mentioned tool feature is the possibility to support the user in checking the model syntax. This is definitely a nice feature to enhance the model quality. In this context it is questionable if and how model quality can be measured by means of syntactical correctness. Although many metrics are defined in literature for model quality (Moody, 2005) the most important quality aspect of a syntactically and semantically correct model is its “fitness for use” with respect to its purpose (Becker, Rosemann & von Uthmann, 2000; Rittgen, 2009). A model as abstract representation of reality should exclude not relevant details and focus on the main aspects regarding the purpose of the model (Dean, Orwig, Lee & Vogel, 1994). Typical purposes of process models are to cope with the process
complexity, to document it, and to support conceptualization, analysis and communication (Dean, Orwig & Vogel, 2000; Ould, 1995; Van Hee, 1994; Becker, Kugeler & Rosemann, 2011). For satisfying these purposes a process model has to take the semantics of the process into account. Hence, the tool should foster semantic correctness by increasing the clarity, comparability, readability, and manageability of the models by implicit inclusion of modeling conventions (Mendling, Reijers & van der Aalst, 2008; Becker, Rosemann & Schütte, 1995; Becker, Clever, Holler, Püster & Shitkova, 2013a).
A further aspect of semantic standardization is the usage of a glossary. All business objects, activities, and allowed relations between them are defined within it. In the best case only the content of the glossary is (re-)used for describing the process element identifier by using activity-object phrase structures. For example, there is a glossary in which the business object “delivery plan” and the activity “create” are included. In addition, the business object “delivery plan” is associated with the activity “create”. Hence, the element identifier “create delivery plan” is valid based on this glossary (Figure 2). By this means, uniform terms are used and misleading synonyms and homonyms are avoided (Becker, Richter & El-Hawari, 2010; Becker, Clever, Holler, Püster & Shitkova, 2013b; Breuker, Pfeiffer & Becker, 2009).
Figure 2: Glossary and element identifier.
In terms of change management the glossary is particularly helpful because it contains all terms used within the as-is and to-be processes in one central index. It also includes definitions of new ERP specific terms, e. g. the SAP info record as
Glossary
ActivityBusiness objectDelivery Plan Book
Business object – activity – relations Delivery Plan Create
PrintDelivery Plan
Create
...
...
......
Element identifier
Create Delivery Plan
Fourth International Symposium on Business Modeling and Software Design
204
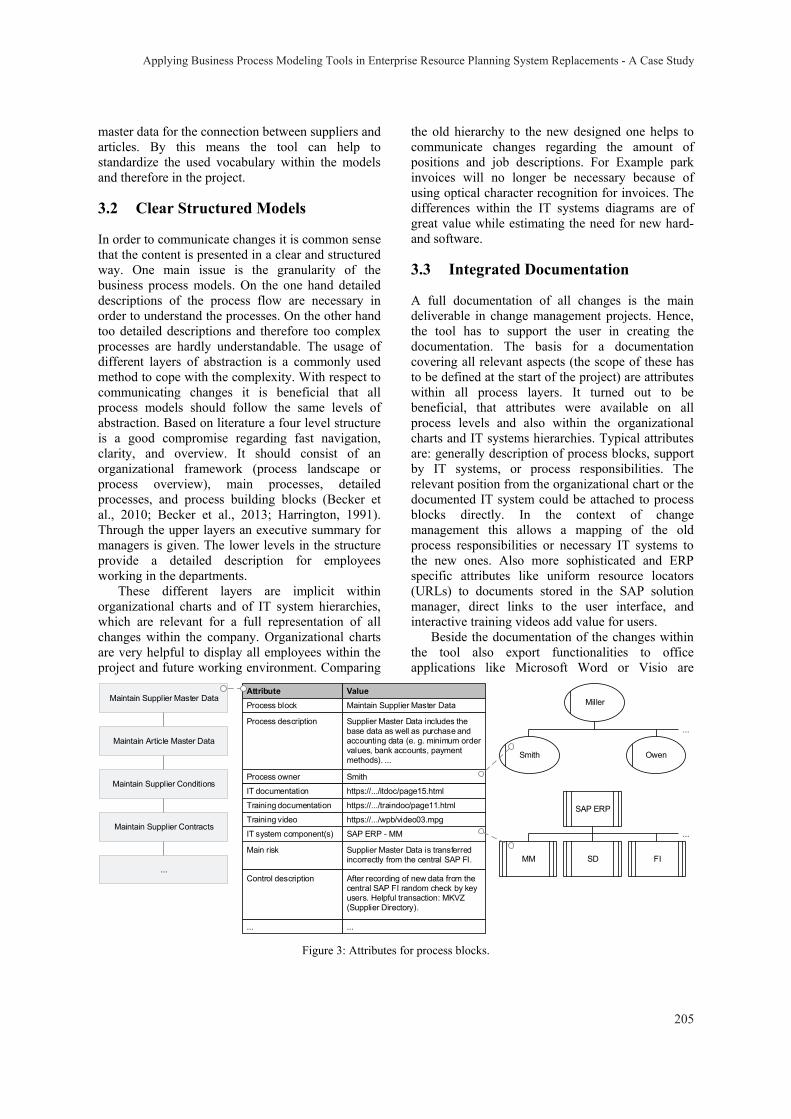
master data for the connection between suppliers and articles. By this means the tool can help to standardize the used vocabulary within the models and therefore in the project.
3.2 Clear Structured Models
In order to communicate changes it is common sense that the content is presented in a clear and structured way. One main issue is the granularity of the business process models. On the one hand detailed descriptions of the process flow are necessary in order to understand the processes. On the other hand too detailed descriptions and therefore too complex processes are hardly understandable. The usage of different layers of abstraction is a commonly used method to cope with the complexity. With respect to communicating changes it is beneficial that all process models should follow the same levels of abstraction. Based on literature a four level structure is a good compromise regarding fast navigation, clarity, and overview. It should consist of an organizational framework (process landscape or process overview), main processes, detailed processes, and process building blocks (Becker et al., 2010; Becker et al., 2013; Harrington, 1991). Through the upper layers an executive summary for managers is given. The lower levels in the structure provide a detailed description for employees working in the departments.
These different layers are implicit within organizational charts and of IT system hierarchies, which are relevant for a full representation of all changes within the company. Organizational charts are very helpful to display all employees within the project and future working environment. Comparing
the old hierarchy to the new designed one helps to communicate changes regarding the amount of positions and job descriptions. For Example park invoices will no longer be necessary because of using optical character recognition for invoices. The differences within the IT systems diagrams are of great value while estimating the need for new hard- and software.
3.3 Integrated Documentation
A full documentation of all changes is the main deliverable in change management projects. Hence, the tool has to support the user in creating the documentation. The basis for a documentation covering all relevant aspects (the scope of these has to be defined at the start of the project) are attributes within all process layers. It turned out to be beneficial, that attributes were available on all process levels and also within the organizational charts and IT systems hierarchies. Typical attributes are: generally description of process blocks, support by IT systems, or process responsibilities. The relevant position from the organizational chart or the documented IT system could be attached to process blocks directly. In the context of change management this allows a mapping of the old process responsibilities or necessary IT systems to the new ones. Also more sophisticated and ERP specific attributes like uniform resource locators (URLs) to documents stored in the SAP solution manager, direct links to the user interface, and interactive training videos add value for users.
Beside the documentation of the changes within the tool also export functionalities to office applications like Microsoft Word or Visio are
Figure 3: Attributes for process blocks.
Value
SAP ERP
MM
Process owner Smith
IT system component(s) SAP ERP - MM
IT documentation https://.../itdoc/page15.html
Training documentation https://.../traindoc/page11.html
Training video https://.../wpb/video03.mpg
Main risk Supplier Master Data is transferred incorrectly from the central SAP FI.
Control description After recording of new data from the central SAP FI random check by key users. Helpful transaction: MKVZ (Supplier Directory).
... ...
SD
AttributeMiller
Smith Owen
...
FI
...
Process description Supplier Master Data includes the base data as well as purchase and accounting data (e. g. minimum order values , bank accounts, payment methods). ...
Process block Maintain Supplier Master DataMaintain Supplier Master Data
Maintain Article Master Data
Maintain Supplier Conditions
Maintain Supplier Contracts
...
Applying Business Process Modeling Tools in Enterprise Resource Planning System Replacements - A Case Study
205
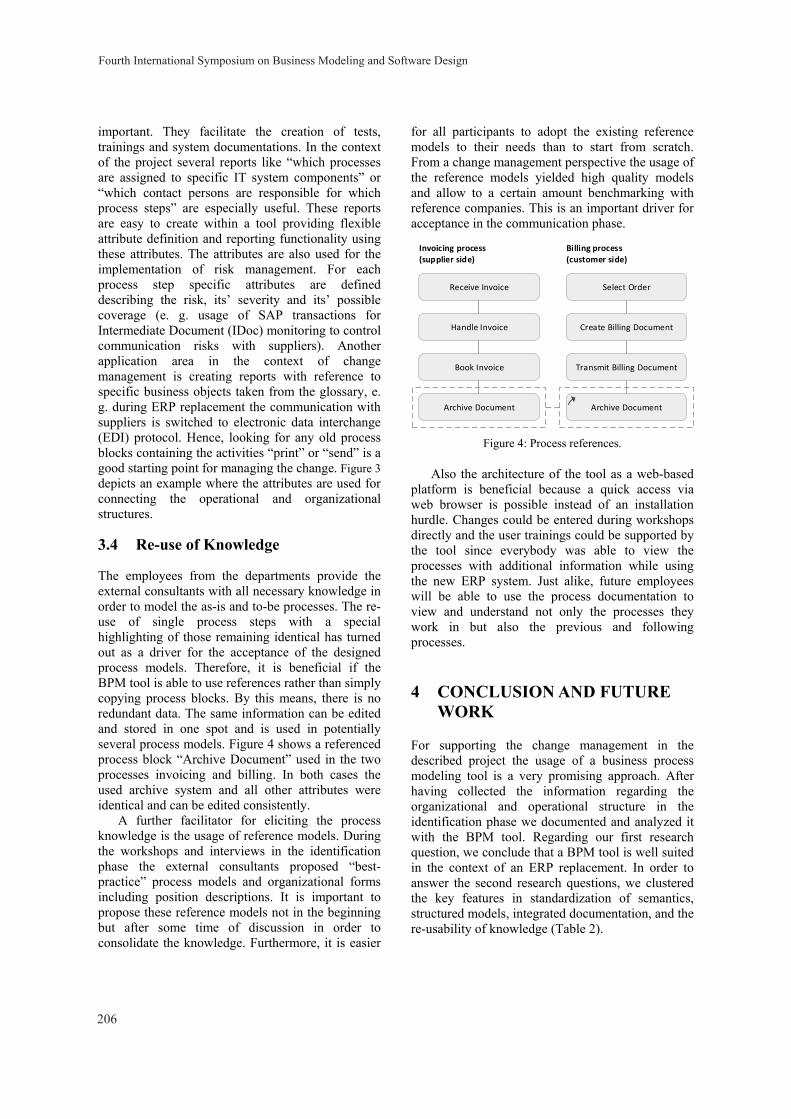
important. They facilitate the creation of tests, trainings and system documentations. In the context of the project several reports like “which processes are assigned to specific IT system components” or “which contact persons are responsible for which process steps” are especially useful. These reports are easy to create within a tool providing flexible attribute definition and reporting functionality using these attributes. The attributes are also used for the implementation of risk management. For each process step specific attributes are defined describing the risk, its’ severity and its’ possible coverage (e. g. usage of SAP transactions for Intermediate Document (IDoc) monitoring to control communication risks with suppliers). Another application area in the context of change management is creating reports with reference to specific business objects taken from the glossary, e. g. during ERP replacement the communication with suppliers is switched to electronic data interchange (EDI) protocol. Hence, looking for any old process blocks containing the activities “print” or “send” is a good starting point for managing the change. Figure 3 depicts an example where the attributes are used for connecting the operational and organizational structures.
3.4 Re-use of Knowledge
The employees from the departments provide the external consultants with all necessary knowledge in order to model the as-is and to-be processes. The re-use of single process steps with a special highlighting of those remaining identical has turned out as a driver for the acceptance of the designed process models. Therefore, it is beneficial if the BPM tool is able to use references rather than simply copying process blocks. By this means, there is no redundant data. The same information can be edited and stored in one spot and is used in potentially several process models. Figure 4 shows a referenced process block “Archive Document” used in the two processes invoicing and billing. In both cases the used archive system and all other attributes were identical and can be edited consistently.
A further facilitator for eliciting the process knowledge is the usage of reference models. During the workshops and interviews in the identification phase the external consultants proposed “best-practice” process models and organizational forms including position descriptions. It is important to propose these reference models not in the beginning but after some time of discussion in order to consolidate the knowledge. Furthermore, it is easier
for all participants to adopt the existing reference models to their needs than to start from scratch. From a change management perspective the usage of the reference models yielded high quality models and allow to a certain amount benchmarking with reference companies. This is an important driver for acceptance in the communication phase.
Figure 4: Process references.
Also the architecture of the tool as a web-based platform is beneficial because a quick access via web browser is possible instead of an installation hurdle. Changes could be entered during workshops directly and the user trainings could be supported by the tool since everybody was able to view the processes with additional information while using the new ERP system. Just alike, future employees will be able to use the process documentation to view and understand not only the processes they work in but also the previous and following processes.
4 CONCLUSION AND FUTURE WORK
For supporting the change management in the described project the usage of a business process modeling tool is a very promising approach. After having collected the information regarding the organizational and operational structure in the identification phase we documented and analyzed it with the BPM tool. Regarding our first research question, we conclude that a BPM tool is well suited in the context of an ERP replacement. In order to answer the second research questions, we clustered the key features in standardization of semantics, structured models, integrated documentation, and the re-usability of knowledge (Table 2).
Invoicing process (supplier side)
Billing process(customer side)
Transmit Billing Document
Archive Document
Handle Invoice
Select OrderReceive Invoice
Create Billing Document
Book Invoice
Archive Document
Fourth International Symposium on Business Modeling and Software Design
206
Although the feedback within the project is positive (we are in the communication phase while writing this article), there are several potentials regarding integration, collaboration, and visualization we would like to address. We believe these do not only apply to the specific combination of used BPM tool and SAP ECC in our case. They are also relevant in comparable projects and for future BPM tool developments and research.
Integration: A strong link between the BPM tool and the new ERP system would probably increase the acceptance of the tool, e. g. a single sign on functionality.
Collaboration: Automatic version management was missing. We believe from our practical work during the project that the possibility to have a full version control of the models similar to a text document in a SharePoint environment is of great value. The version management would allow to trace the modified parts of a model, e. g. before and after a change request is implemented. Furthermore, some sort of social media integration would have been beneficial. Either to comment the different versions of the models in the review process or to interact with the process owner e. g. via chat directly. The web-based version of the tool was great for distributing the process models via a simple link. Nevertheless, in few situations during more informal meetings a mobile application would have enhanced the acceptance and would have further simplified the communication. For both solutions – the web-based and a possible mobile application – a more sophisticated user access control is needed, e. g. a guest access for a supplier. The authorization rules have to ensure that the supplier can only access the relevant and maybe new processes (e. g. transmission of shipping notifications). Similar user access control mechanisms would be relevant for the approval and monitoring of (new) process versions. E. g. processes are initially stored with the status “wait for approval”. After the new version is reviewed and released, the processes will be unlocked for all authorized employees.
Visualization: In several situations one model or different models were compared. A supporting function for a comparison of two versions of one model (e. g. as-is and the to-be) or for two IT system charts is missing but would have simplified the work for the consultant. A further aspect of the visualization is the tool visualization itself in different web browsers. Partly the tool behaved differently what definitely has to be considered when using a web-based tool in a company.
Beside the above mentioned potentials and open issues we want to continue with our evaluation until the ERP replacement is over. We are looking forward to use the BPM tool in future ERP replacements or implementations.
REFERENCES
Becker, J., Clever, N., Holler, J. & Shitkova, M., 2013. icebricks: Business Process Modeling on the Basis of Semantic Standardization. In Proceedings of the Design Science Research in Information Systems and Technologies (DESRIST). Helsinki, Finland, pp. 394–399.
Becker, J., Clever, N., Holler, J., Püster, J. & Shitkova, M., 2013a. Integrating Process Modeling Methodology, Language and Tool – A Design Science Approach. In Practice of Enterprise Modeling 2013 (PoEM 2013). Riga, Latvia: IFIP International Federation for Information Processing, pp. 221–235.
Becker, J., Clever, N., Holler, J., Püster, J. & Shitkova, M., 2013b. Semantically Standardized and Transparent Process Model Collections via Process Building Blocks. In Proceedings of the 5th International Conference on Information, Process, and Knowledge Management (eKNOW). Nice, France, pp. 172–177.
Becker, J., Kugeler, M. & Rosemann, M., 2011. Process Management: A Guide for the Design of Business Processes 2nd ed., Berlin, Germany: Springer.
Becker, J., Richter, O. & El-Hawari, T., 2010. Vertriebsinformationssysteme zwischen Standardisierung und Flexibilisierung: Referenzmodelle für die Prozesse im Vertrieb. In J. Becker et al., eds. Vertriebsinformationssysteme: Standardisierung, Individualisierung, Hybridisierung und Internetisierung. Berlin, Heidelberg, Germany: Springer, pp. 3–18.
Becker, J., Rosemann, M. & Schütte, R., 1995. Grundsätze ordnungsmäßiger Modellierung. Wirtschaftsinformatik, 37(5), pp. 435–445.
Becker, J., Rosemann, M. & von Uthmann, C., 2000. Guidelines of Business Process Modeling. In W. Van Der Aalst, J. Desel & A. Oberweis, eds. Business Process Management: Models, Techniques and Empirical Studies. Berlin, Germany: Springer, pp. 30–49.
Breuker, D., Pfeiffer, D. & Becker, J., 2009. Reducing the variations in intra- and interorganizational business process modeling – An empirical evaluation. In Wirtschaftsinformatik Proceedings 2009., pp. 203–212.
Carr, N.G., 2003. IT Doesn’t Matter. Educause Review, 38, pp. 24–38.
Davenport, T.H., 1998. Putting the Enterprise into the Enterprise System. Harvard Business Review, 76(4), pp. 121–131.
Applying Business Process Modeling Tools in Enterprise Resource Planning System Replacements - A Case Study
207

Dean, D., Orwig, R., Lee, J. & Vogel, D., 1994. Modeling with a group modeling tool: group support, model quality, and validation. In Twenty-Seventh Hawaii International Conference. Wailea, HI, USA: IEEE, pp. 214–223.
Dean, D., Orwig, R. & Vogel, D., 2000. Facilitation methods for collaborative modeling tools. Group Decision and Negotiation, 9(2), pp. 109–128.
Harrington, H.J., 1991. Business Process Improvement: The Breakthrough Strategy for Total Quality, Productivity, and Competitiveness, New York, USA: McGraw-Hill.
Holland, C.P. & Light, B., 2002. A Critical Success Factors Model For ERP Implementation. IEEE software, 16(3), pp. 30–36.
Huang, S.-M., Hung, Y.-C., Chen, H.-G. & Ku, C.-Y., 2004. Transplanting the Best Practice for Implementation of an ERP System: A Structured Inductive Study of an International Company. Computer Information Systems, 44(4), pp. 101–110.
Mendling, J., Reijers, H. & van der Aalst, W.M.P., 2008. Seven Process Modeling Guidelines (7PMG). Information and Software Technology, 52(2), pp. 127–136.
Moody, D.L., 2005. Theoretical and practical issues in evaluating the quality of conceptual models: current state and future directions. Data & Knowledge Engineering, 55(3), pp. 243–276.
Nah, F.F.-H., Lau, J.L.-S. & Kuang, J., 2001. Critical factors for successful implementation of enterprise systems. Business Process Management Journal, 7(3), pp. 285–296.
Ould, M.A., 1995. Business Processes: Modelling and analysis for re-engineering and improvement, New York, USA: Wiley Chichester.
Peslak, A.R., Subramanian, G.H. & Clayton, G.E., 2008. The Phases of ERP Software Implementation and Maintenance: A Model for Predicting Preferred ERP Use. Journal of Computer Information Systems, 48(2), pp. 25–33.
Rittgen, P., 2009. Collaborative modeling of business processes: a comparative case study. In Proceedings of the 2009 ACM symposium on Applied Computing. Honolulu, Hawaii, USA: ACM, pp. 225–230.
Scheer, A. & Nüttgens, M., 2000. ARIS Architecture and Reference Models for Business Process Management, Berlin Heidelberg, Germany: Springer.
Van Hee, K.M., 1994. Information systems engineering: a formal approach, New York, USA: Cambridge University Press.
Fourth International Symposium on Business Modeling and Software Design
208
Future Business Model for Cellular Microgrids
Intisar Ali Sajjad, Roberto Napoli and Gianfranco Chicco Energy Department, Politecnico di Torino, Turin, Italy
Keywords: Microgrids, Regulations, Business Model, Consumers, Entrepreneurship.
Abstract: Different studies which were carried out in the past revealed that the environment for microgrids is very complex and uncertain due to regulatory and legal barriers. Across and within the developed countries the suggestions and views of regulatory authorities and legal bindings about the infrastructure and operation of microgrids are quite different. According to the present scenario, the viability of microgrids mainly depends upon how microgrids are framed, who owns them, which are the customers served from them and how much revenue is generated from them. This paper investigates the potential barriers in current business models to deploy microgrids and proposes a business model, centric to users, with the concept of consumers owned microgrid.
1 INTRODUCTION
There are lots of uncertainties in the power system, especially for electric utility systems. These uncertainties range from capital costs and financing to fuel price fluctuations and operational costs. Due to these trends, it is very difficult to assess and formulate long term capacity planning. The ultimate impact is on consumers to compensate the additional costs through different tariff elements like fuel adjustment charges, capacity charges, etc. On the other hand, there are much more uncertainties associated with the capital costs and financing due to inflation and changing interest rates. This has affected the utilities’ ability to obtain bonding for long term projects. The regulatory framework is also a key player affecting the day to day operation, together with the structure of the electricity market. In some aspects the regulation supports the utility industry to operate a stable, economic and reliable system, but in other cases it decreases the attraction of investors to invest in the system to cater for future challenges (Schweppe, Tabors and Kirtley, 1981).
The power system business has been restructured in the last decades. This was done to increase system efficiency, decrease costs and emissions, and attain reliability by using new emerging technologies in the generation, transmission and distribution sectors. Smart grid has been the unifying concept for the application of these emerging technologies. These technologies are based on the revolutionary findings
in the field of power electronics, artificial intelligence, computer applications, networking abilities. These technologies have the ability to change the behavior of the electricity distribution system into an active one, where each component has the capability to talk and listen. But the goals have not been achieved yet. The progress is very slow and there is lack of investments in the field of smart grids. The major reason is the structure of the current business model in power market especially on the distribution side, more centric on utilities but less on consumers (Schweppe, Tabors and Kirtley, 1981).
Microgrids are the systems that link different distributed energy sources into a single small network and give service to its consumers with all or partial of their energy demands by increasing energy efficiency, reliability and reduce emission and energy costs (Center for Energy and Hyams, 2010). Fast growth in distributed generation, emerging ICT, power electronics technologies, efficient storage has made the dream of microgrids true and implementable. But one aspect that is not favorable, are the power market policies, regulations and legal bindings. These are very important components to attract investments from public and private sectors. One of the important reasons for the lag of such components may be the monopolization of the market, especially at the distribution level.
King (2006) assessed the different microgrid business models considering the ownership status.
209
According to these models, the owner is responsible for all type of services and quality indices to consumers. The owner may be a utility, a single landlord, multiple individuals or firms, a single individual, or a single firm. Center for Energy and Hyams (2010) used this concept and further categorized the business models of King (2006) using physical and virtual microgrids. Center for Energy and Hyams (2010) also gives more detailed business models for utility, non-utility, also considering virtual microgrids depending on the aggregation level.
The main theme behind the proposed business model is to split the power system network into autonomous parts that replicate the small world concept. This technical splitting should be followed on the same lines as the splitting of communities. This concept of small world has been used in different real world applications including power systems, transportation system, social networks, and medical science (Pagani and Aiello, 2013; Bork et al., 2004; Hidefum, 2013; Eppstein et al., 2013). Each small world should have operating autonomy and ownership by the customers with responsibility. The business model should be structured in such a way that it will attract private investments and should leave space for entrepreneurship.
The rest of the paper is organized as follows. Section 2 gives a brief overview about the relationship between innovations and entrepreneurship. Section 3 and 4 discusses about the current business models and their pitfalls. Section 5 discusses about the proposed possible vision for the future business model centric to the active consumers. This paper is concluded in Section 6.
2 INNOVATIONS AND ENTREPRENEURSHIP
Entrepreneurship is the basic idea behind the possible business model of microgrids. Shane (2003) explains entrepreneurship and gives some characteristics of an entrepreneur that introduces innovations and new gears and transforms innovations into profit and financial goods.
The role of opportunities carries central importance to establish an enterprise. Opportunities generate a situation to create means for the establishment of a profitable enterprise. Different economist and business experts explain their way to explore opportunities, with different theories.
In 1934, Schumpeter linked opportunities with innovations and said that new information is necessarily important for the existence of enterprise business. Technological, political, economic, regulatory changes provide new information to entrepreneur to recombine resources for more valuable and fruitful enterprise (Schumpeter, 1934; Urban and von Hippel, 1988). In contrast with Schumpeter, the theory presented by Kirzner states that the opportunities may need only differential access to existing information. People in a specific field use the information that they know to efficiently manage resources, but the decision making process has always shortcomings. These shortcomings lead to obtain and recombine resources for profitable business. Most of the research is done on Schumpeter’s opportunities due to its diverse and innovation friendly nature (Urban and von Hippel, 1988; Schumpeter, 1934).
2.1 Consumer Centric Enterprises
The work on consumer centric enterprises started about 4 decades ago, and today it is clear that such firms and enterprises are very successful due to advances in technology, communication and computing (von Hippel, 2005).
Enos (1962) reported that the most of the innovations in the oil refining sector were developed by user companies. Also Freeman (1968) presented the results about the chemical production processes that most licensed processes were developed by user companies. More than 80% of common and important scientific instruments and semiconductor processes were developed by users. Empirical studies also proved that up to 40% of users of any services or products are engaged in developing or modifying products/services (von Hippel, 2005; Herstatt and von Hippel, 1992; Morrison, Roberts, von Hippel, 2000; Franke and von Hippel, 2003; Lüthje, 2004; Franke and Shah, 2003, Luthje, Herstatt and von Hippel, 2002).
Open source projects are one example of the above business model, where people develop products or services for themselves and share it free of cost or with very low cost to other consumers and users, e.g., open source and free software, Linux and Android applications.
2.2 Economics of Innovations
In 1957 Robert Solow presented the economic growth model based on innovation. He defined growth as the change in Gross Domestic Product
Fourth International Symposium on Business Modeling and Software Design
210
(GDP) per hour of labor per unit time (Solow, 1957). Recent prominent advances in literature give the concept of knowledge spillovers and human capital (Romer, 1986; Romer, 1990; Lucas, 1988).
3 CURRENT PRACTICES IN THE DEVELOPMENT OF MICROGRIDS
Today’s scenario in the distribution system is centralized to utility and has very small or no participation of consumers.
A feedback system has been developed through smart metering, and these meters have been installed in huge quantities in some countries (Renner et al., 2011). In the past, the consumers had rarely received such kind of feedback from the operator or utility. As a result, they had a little opportunity to adapt themselves according to the need of the utility. The same case occurred for a utility to judge what kind of service (e.g., to improve continuity of supply) the consumers would really like to buy.
Research has revealed the fact that utilities may be reluctant to offer consumer centric services and price structures due to the issue of reduction in electricity sales. As far as the increasing trend of smart meters is concerned, this is only being used, in majority of the cases, to reduce cost related to billing data collection and remote load management (Kelly, Meiners and Rouse, 2007).
There are some microgrid projects like San Diego Gas and Electric’s Beach Cities microgrid, Perfect power, Danish Cell Controller, AGTFTC/MCAGCC microgrid, which are implemented with participation of utilities and the private sector (GEA, 2012; GEI, 2014; Kelly, Meiners and Rouse, 2007; Becker, 2013; Russell and Sagoo, 2013). Some initiatives have also been taken in developing countries to promote the concept of smart and micro grids (Warshay, 2013).
4 PITTFALLS OF EXISTING BUSINESS MODELS
There are many participants, including utilities and consumers, in the construction of a microgrid. So, all parties are the potential candidates for the receipt of benefits obtained from microgrid services, e.g., peak load reduction. The main problem here is the definition of mechanisms for proportionate
investments from participants. Also there is no adequate market on the distribution level to support microgrids (in broader sense, smart grids) to monetize benefits, and this leads to investments stranding especially from the private sector.
There are no appropriate existing regulations to compensate microgrids is case of participation in grid stability. Potential benefits of microgrid are negated in current regulatory framework, e.g., distributed generation is not allowed to manipulate peak loads (Becker, 2013). Furthermore, most of the focus in the design of microgrids in on electricity, but microgrids should be considered more widely in a multi-energy perspective.
There are many smart grid and microgrid projects implemented worldwide (as the ones summarized in Section 3), but the development is very slow. One of the main reasons for slow development is the lack of private sector interest in investments. This lack of interest is due to: Utility’s “Big Brother” role, indicating how and
when the consumers will use their appliances and processes.
Inappropriate feed-in and net metering tariffs. Consumer’s energy purchase options are very limited.
No or very low consumer’s involvement in adopting innovations and their promotion.
Current business model doesn’t allow consumers to participate in energy business and its services.
Very little control of consumers over electricity bills.
5 FUTURE PERSPECTIVE OF BUSINESS MODEL
Potential questions of interest for the implementation of smart grid are where the money will come from and in how much time. How can the process be accelerated? Shall the consumers be involved primarily? If yes, then how? This section describes a possible future of distribution system with extended applications of computational and communication capabilities and technologies with consumer centric business model as an enterprise.
5.1 A Possible Future: Consumer Centric Enterprises
Entrepreneurship is the theory behind the concept of “cellular” microgrids, where each microgrid operator will be an independent enterprise and
Future Business Model for Cellular Microgrids
211
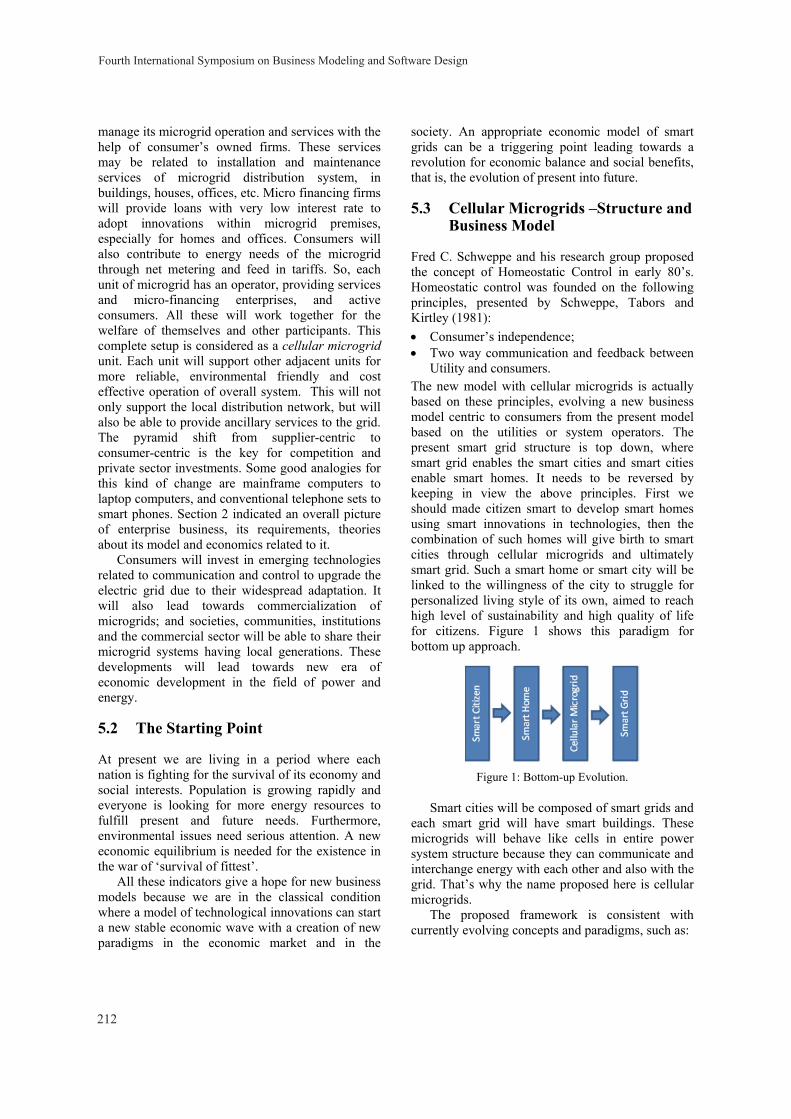
manage its microgrid operation and services with the help of consumer’s owned firms. These services may be related to installation and maintenance services of microgrid distribution system, in buildings, houses, offices, etc. Micro financing firms will provide loans with very low interest rate to adopt innovations within microgrid premises, especially for homes and offices. Consumers will also contribute to energy needs of the microgrid through net metering and feed in tariffs. So, each unit of microgrid has an operator, providing services and micro-financing enterprises, and active consumers. All these will work together for the welfare of themselves and other participants. This complete setup is considered as a cellular microgrid unit. Each unit will support other adjacent units for more reliable, environmental friendly and cost effective operation of overall system. This will not only support the local distribution network, but will also be able to provide ancillary services to the grid. The pyramid shift from supplier-centric to consumer-centric is the key for competition and private sector investments. Some good analogies for this kind of change are mainframe computers to laptop computers, and conventional telephone sets to smart phones. Section 2 indicated an overall picture of enterprise business, its requirements, theories about its model and economics related to it.
Consumers will invest in emerging technologies related to communication and control to upgrade the electric grid due to their widespread adaptation. It will also lead towards commercialization of microgrids; and societies, communities, institutions and the commercial sector will be able to share their microgrid systems having local generations. These developments will lead towards new era of economic development in the field of power and energy.
5.2 The Starting Point
At present we are living in a period where each nation is fighting for the survival of its economy and social interests. Population is growing rapidly and everyone is looking for more energy resources to fulfill present and future needs. Furthermore, environmental issues need serious attention. A new economic equilibrium is needed for the existence in the war of ‘survival of fittest’.
All these indicators give a hope for new business models because we are in the classical condition where a model of technological innovations can start a new stable economic wave with a creation of new paradigms in the economic market and in the
society. An appropriate economic model of smart grids can be a triggering point leading towards a revolution for economic balance and social benefits, that is, the evolution of present into future.
5.3 Cellular Microgrids –Structure and Business Model
Fred C. Schweppe and his research group proposed the concept of Homeostatic Control in early 80’s. Homeostatic control was founded on the following principles, presented by Schweppe, Tabors and Kirtley (1981): Consumer’s independence; Two way communication and feedback between
Utility and consumers. The new model with cellular microgrids is actually based on these principles, evolving a new business model centric to consumers from the present model based on the utilities or system operators. The present smart grid structure is top down, where smart grid enables the smart cities and smart cities enable smart homes. It needs to be reversed by keeping in view the above principles. First we should made citizen smart to develop smart homes using smart innovations in technologies, then the combination of such homes will give birth to smart cities through cellular microgrids and ultimately smart grid. Such a smart home or smart city will be linked to the willingness of the city to struggle for personalized living style of its own, aimed to reach high level of sustainability and high quality of life for citizens. Figure 1 shows this paradigm for bottom up approach.
Figure 1: Bottom-up Evolution.
Smart cities will be composed of smart grids and each smart grid will have smart buildings. These microgrids will behave like cells in entire power system structure because they can communicate and interchange energy with each other and also with the grid. That’s why the name proposed here is cellular microgrids.
The proposed framework is consistent with currently evolving concepts and paradigms, such as:
Fourth International Symposium on Business Modeling and Software Design
212
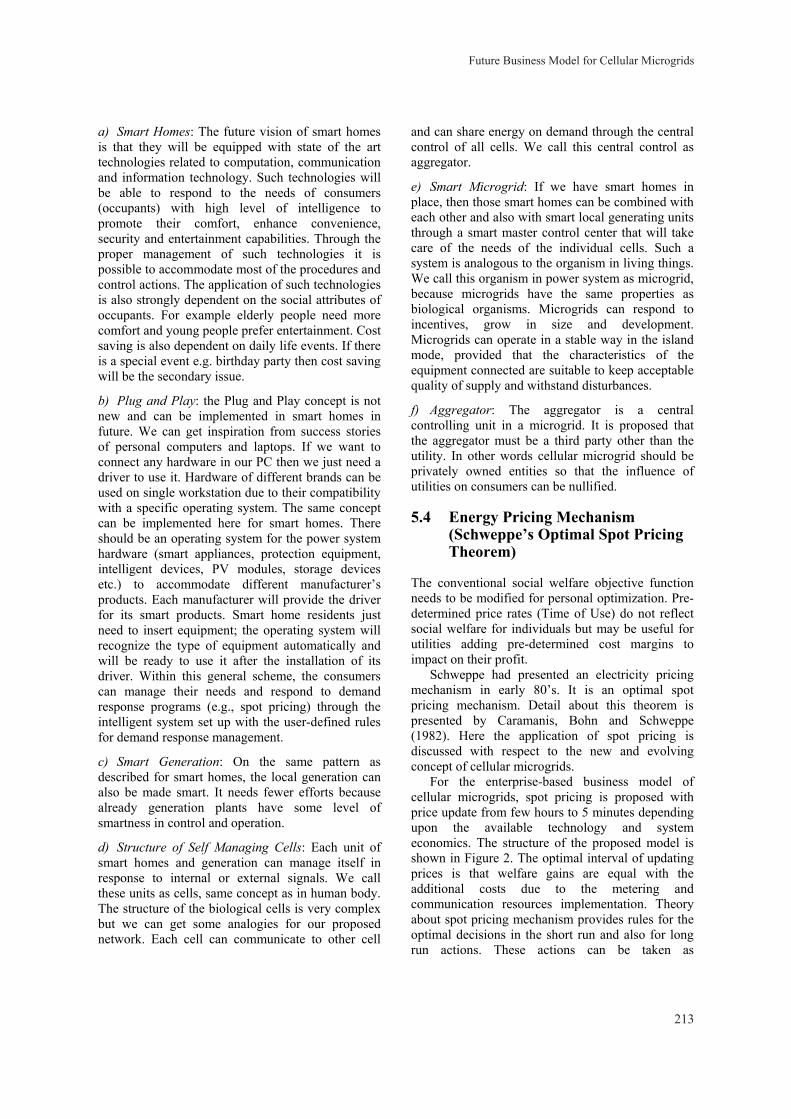
a) Smart Homes: The future vision of smart homes is that they will be equipped with state of the art technologies related to computation, communication and information technology. Such technologies will be able to respond to the needs of consumers (occupants) with high level of intelligence to promote their comfort, enhance convenience, security and entertainment capabilities. Through the proper management of such technologies it is possible to accommodate most of the procedures and control actions. The application of such technologies is also strongly dependent on the social attributes of occupants. For example elderly people need more comfort and young people prefer entertainment. Cost saving is also dependent on daily life events. If there is a special event e.g. birthday party then cost saving will be the secondary issue.
b) Plug and Play: the Plug and Play concept is not new and can be implemented in smart homes in future. We can get inspiration from success stories of personal computers and laptops. If we want to connect any hardware in our PC then we just need a driver to use it. Hardware of different brands can be used on single workstation due to their compatibility with a specific operating system. The same concept can be implemented here for smart homes. There should be an operating system for the power system hardware (smart appliances, protection equipment, intelligent devices, PV modules, storage devices etc.) to accommodate different manufacturer’s products. Each manufacturer will provide the driver for its smart products. Smart home residents just need to insert equipment; the operating system will recognize the type of equipment automatically and will be ready to use it after the installation of its driver. Within this general scheme, the consumers can manage their needs and respond to demand response programs (e.g., spot pricing) through the intelligent system set up with the user-defined rules for demand response management.
c) Smart Generation: On the same pattern as described for smart homes, the local generation can also be made smart. It needs fewer efforts because already generation plants have some level of smartness in control and operation.
d) Structure of Self Managing Cells: Each unit of smart homes and generation can manage itself in response to internal or external signals. We call these units as cells, same concept as in human body. The structure of the biological cells is very complex but we can get some analogies for our proposed network. Each cell can communicate to other cell
and can share energy on demand through the central control of all cells. We call this central control as aggregator.
e) Smart Microgrid: If we have smart homes in place, then those smart homes can be combined with each other and also with smart local generating units through a smart master control center that will take care of the needs of the individual cells. Such a system is analogous to the organism in living things. We call this organism in power system as microgrid, because microgrids have the same properties as biological organisms. Microgrids can respond to incentives, grow in size and development. Microgrids can operate in a stable way in the island mode, provided that the characteristics of the equipment connected are suitable to keep acceptable quality of supply and withstand disturbances.
f) Aggregator: The aggregator is a central controlling unit in a microgrid. It is proposed that the aggregator must be a third party other than the utility. In other words cellular microgrid should be privately owned entities so that the influence of utilities on consumers can be nullified.
5.4 Energy Pricing Mechanism (Schweppe’s Optimal Spot Pricing Theorem)
The conventional social welfare objective function needs to be modified for personal optimization. Pre-determined price rates (Time of Use) do not reflect social welfare for individuals but may be useful for utilities adding pre-determined cost margins to impact on their profit.
Schweppe had presented an electricity pricing mechanism in early 80’s. It is an optimal spot pricing mechanism. Detail about this theorem is presented by Caramanis, Bohn and Schweppe (1982). Here the application of spot pricing is discussed with respect to the new and evolving concept of cellular microgrids.
For the enterprise-based business model of cellular microgrids, spot pricing is proposed with price update from few hours to 5 minutes depending upon the available technology and system economics. The structure of the proposed model is shown in Figure 2. The optimal interval of updating prices is that welfare gains are equal with the additional costs due to the metering and communication resources implementation. Theory about spot pricing mechanism provides rules for the optimal decisions in the short run and also for long run actions. These actions can be taken as
Future Business Model for Cellular Microgrids
213
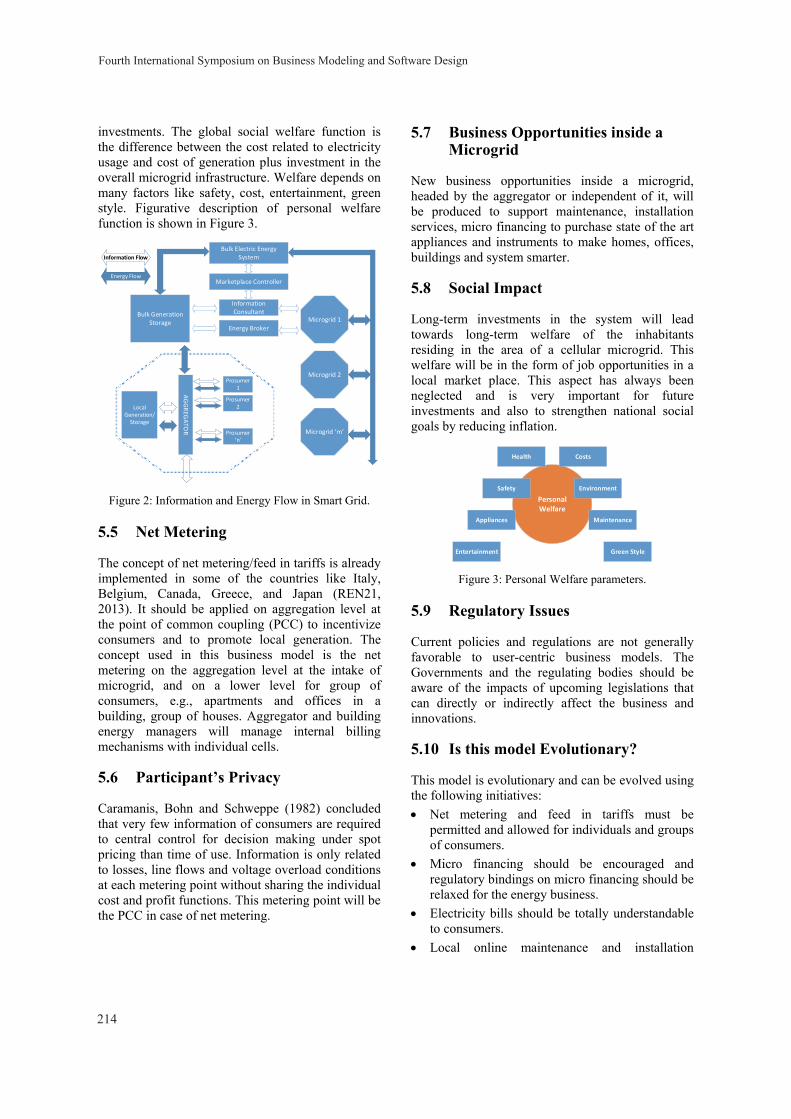
investments. The global social welfare function is the difference between the cost related to electricity usage and cost of generation plus investment in the overall microgrid infrastructure. Welfare depends on many factors like safety, cost, entertainment, green style. Figurative description of personal welfare function is shown in Figure 3.
Bulk Electric Energy System
Information Consultant
Energy Broker
Bulk Generation Storage Microgrid 1
Microgrid 2
Microgrid ‘m’
Local Generation/Storage
Prosumer 1
Prosumer ‘n’
Prosumer 2
AGGREG
ATO
R
Marketplace Controller
Information Flow
Energy Flow
Figure 2: Information and Energy Flow in Smart Grid.
5.5 Net Metering
The concept of net metering/feed in tariffs is already implemented in some of the countries like Italy, Belgium, Canada, Greece, and Japan (REN21, 2013). It should be applied on aggregation level at the point of common coupling (PCC) to incentivize consumers and to promote local generation. The concept used in this business model is the net metering on the aggregation level at the intake of microgrid, and on a lower level for group of consumers, e.g., apartments and offices in a building, group of houses. Aggregator and building energy managers will manage internal billing mechanisms with individual cells.
5.6 Participant’s Privacy
Caramanis, Bohn and Schweppe (1982) concluded that very few information of consumers are required to central control for decision making under spot pricing than time of use. Information is only related to losses, line flows and voltage overload conditions at each metering point without sharing the individual cost and profit functions. This metering point will be the PCC in case of net metering.
5.7 Business Opportunities inside a Microgrid
New business opportunities inside a microgrid, headed by the aggregator or independent of it, will be produced to support maintenance, installation services, micro financing to purchase state of the art appliances and instruments to make homes, offices, buildings and system smarter.
5.8 Social Impact
Long-term investments in the system will lead towards long-term welfare of the inhabitants residing in the area of a cellular microgrid. This welfare will be in the form of job opportunities in a local market place. This aspect has always been neglected and is very important for future investments and also to strengthen national social goals by reducing inflation.
Personal Welfare
Health
Safety
Appliances
Entertainment Green Style
Maintenance
Environment
Costs
Figure 3: Personal Welfare parameters.
5.9 Regulatory Issues
Current policies and regulations are not generally favorable to user-centric business models. The Governments and the regulating bodies should be aware of the impacts of upcoming legislations that can directly or indirectly affect the business and innovations.
5.10 Is this model Evolutionary?
This model is evolutionary and can be evolved using the following initiatives: Net metering and feed in tariffs must be
permitted and allowed for individuals and groups of consumers.
Micro financing should be encouraged and regulatory bindings on micro financing should be relaxed for the energy business.
Electricity bills should be totally understandable to consumers.
Local online maintenance and installation
Fourth International Symposium on Business Modeling and Software Design
214
services should be strengthened under the aggregator supervision.
Local skilled entities should be preferred for hiring for aggregation and other services.
Legislation must support private sector involvement in energy business on distribution level to support, manage, own and operate a suitable size of consumers.
Renewable energy based generation must be encouraged at the local level by incentives.
Spot pricing mechanism must be incorporated with suitable price update time and should be decreased with innovations available.
Distribution networks should be made more reliable by connecting consumers in meshed form, upgrading the present protection systems.
Consumer’s awareness should be enhanced through print and electronic media, and any other mean to adopt smartness.
6 CONCLUSIONS
A consumer-centric business model can be implemented using cellular microgrid structures with consumer’s involvement. Small enterprises will strengthen the business structure by enhancing consumers comfort in the competitive environment. This business will also generate local job opportunities. There are regulatory issues in the implementation of such a structure, so local investment should be allowed with all kinds of feed in tariffs. Some recommendations are given in previous section to make this model more evolving. An economic study will be carried out in future work to strengthen the point of view on the cellular business model for microgrids.
REFERENCES
Becker, B., 2013 (13 March). Microgrid Challenges: Moving Beyond Pilots. Microgrid World Forum, Irvine. CA.
Bork, P., Jensen, L.J., von Mering, C., Ramani, A.K., Lee, I., Marcotte, E.M., 2004. Protein interaction networks from yeast to human. Current Opinion in Structural Biology, 14(3), 292-294.
Caramanis, M.C., Bohn, R.E., Schweppe, F.C., 1982. Optimal Spot Pricing: Practice and Theory. IEEE Transactions on Power Apparatus and System, PAS-101(9), 3234-3245.
Center for Energy, Marine Transportation and Public
Policy at Columbia University and Hyams, M.A., 2010. Microgrids: An Assessment Of The Value, Opportunities And Barriers To Deployment In New York State. NYSERDA.
Enos, J.L., 1962. Petroleum Progress and Profits: A History of Process Innovation. MIT Press, Cambridge, MA.
Eppstein, D., Goodrich, M.T., Löffler, M., Strash, D., Trott, L., 2013. Category-based routing in social networks: Membership dimension and the small-world phenomenon. Theoret. Computer Science, 514, 96-104.
Franke, N., Shah, K.S., 2003. How communities support innovative activities: an exploration of assistance and sharing among end-users. Resear. Policy, 32, 157-178.
Franke, N., von Hippel, E., 2003. Satisfying Heterogeneous User Needs via Innovation Toolkits: The Case of Apache Security Software. Research Policy, 32(7), 1199-1215.
Freeman, C., 1968. Chemical Process Plant: Innovation and the World Market. National Institute Economic Review, 45, 29-51.
Galvin Electricity Initiative, What are some examples of smart microgrids. http://galvinpower.org/resources/ microgrid-hub/smart-microgrids-faq/examples, 20/01/2014.
GEA Writing Team, 2012. Global Energy Assessment: Toward a Sustainable Future. Cambridge Univ. Press.
Herstatt, C., von Hippel, E., 1992. From Experience: Developing New Product Concepts Via the Lead User Method: A Case Study in a “low tech” Field. Journal of Product Innovation Management, 9, 213-221.
Hidefum, S., 2013. Structuring Hierarchical Multi-Star Small-World Networks for Real-World Applications. Procedia Computer Science, 18, 2410–2419.
Kelly, J. F., Meiners, M., Rouse, G., 2007. IIT Perfect Power Prototype. Galvin Electricity Initiative, Illinois Institute of Technology.
King, D.E., 2006. Electric Power Micro-grids: Opportunities and Challenges for an Emerging Distributed Energy Architecture. PhD Thesis, Carnegie Mellon University, http://wpweb2.tepper.cmu.edu/ceic, (20/01/2014).
Lucas, R.E., 1988. On the mechanics of economic development. In Journal of Monetary Economics, 22(1), 3-42.
Luthje, C., Herstatt, C., von Hippel, E., 2002. The impact of use experience and knowledge on innovations: An empirical study of innovative activities among end-users. MIT Sloan School of Management.
Luthje, C., 2004. Characteristics of innovating users in a consumer goods field: An empirical study of sport-related product consumers. Technovation, 24(9), 683-695.
Morrison, P.D., Roberts, J.H., von Hippel, E., 2000. Determinants of User Innovation and Innovation Sharing in a Local Market. Management Science, 46(12), 1513-1527.
Pagani, G.A., Aiello, M., 2013. The Power Grid as a complex network: A survey. Physica A: Statistical
Future Business Model for Cellular Microgrids
215

Mechanics and its Applications, 392(11), 2688-2700. Renewable Policy Network for the 21st Century (REN21),
2013. RENEWABLES INTERACTIVE MAP. http://www.map.ren21.net/, (20/01/2014).
Renner, S., Albu, M., van Elburg, H., Heinesmann, c., Lazicki, A., Penttinen, L., Puente, F., Saele, H., Feb. 2011. European Smart Metering Landscape Report. Österreichische Energieagentur – Austrian Energy Agency (AEA), Vienna.
Romer, P.M., 1990. Human capital and growth: theory and evidence. Carnegie-Rochester Conference Series on Public Policy, 32, 251-286.
Romer, P., 1986. Increasing returns and long-run growth. In Journal of Political economy, 94(5), 1002-1037
Russell, M. D., Sagoo, B., 2013 (September). A Holistic Microgrid Energy Management System for Improved Energy Efficiency and Renewable Integration. Microgrid Symposium – Santiago, Chile.
Schweppe, F.C., Tabors, R.D. and Kirtley, J.L, 1981. Homeostatic Control: The Utility/Customer Marketplace for Electric Power. MIT Energy Lab. Report, MIT Press, MIT-EL 81-033.
Schumpeter, J.A., 1934. The theory of economic development: an inquiry into profits, capital, credit, interest, and the business cycle. Harvard University Press, Cambridge, MA.
Shane, S. A., 2003. A General Theory of Entrepreneurship: The individual-Opertunity Nexus. Edward Elgar Publishers.
Solow, R.M., 1957. Technical Change and the Aggregate Production Function. Review of Economics and Statistics, 39, 312-20.
Urban, G. L., von Hippel, E., 1988. Lead User Analyses for the Development of New Industrial Products. Management Science, 34(5), 569-582.
von Hippel, E., 2005. Democratizing Innovation. MIT Press, Cambridge MA.
Warshay, B., 2013 (14th March). Microgrids in Remote Applications: Data Centres, Developing Regions, and Military Installations: Innovative Approaches for Electrification in Developing Regions. Presentation. Microgrid World Forum, 2013, Irvine, CA.
Fourth International Symposium on Business Modeling and Software Design
216
Comparison of Data Management Strategies for Multi-Tenant DatabaseCluster
Evgeny Boytsov and Valery SokolovDepartment of Computer Science,Yaroslavl State University, Yaroslavl, Russia
{boytsovea, valery-sokolov}@yandex.ru
Keywords: Databases, SaaS, Multi-tenancy, Data Management Strategies.
Abstract: This paper discusses the problem of tenant data distribution in a multi-tenant database cluster - the conceptof reliable and easy to use data storage for high load cloud applications with thousands of customers, basedon ordinary relational database servers. The formal statements of the problem for cases with and without datareplication are given and a metric for evaluating the quality of data distribution is proposed. The proposedmetric is compared with ad-hoc data management strategies using an experiment at the imitation model of themulti-tenant database cluster and the result of the experiment is provided and summarized.
1 INTRODUCTION
One of recent main trends in the software develop-ment industry is the propagation of cloud technolo-gies and corresponding change of the main architec-tural paradigm in an enterprise segment of the market.This tendency leads to the increase of the softwarecomplexity, since a typical cloud application consistsof tens and even hundreds distributed web-servicesinteracting with each other. One of the most signif-icant aspects of software design is a data-storage sub-system. This subsystem should provide high perfor-mance, fault-tolerance and reliable tenants data isola-tion from each other. Modern software developmenttechniques tend to solve these tasks by designing anadditional layer of application logic at the level ofapplication servers. Such approaches are discussedin many specialized papers for application developersand other IT-specialists (Chong and G., 2006; Candanet al., 2009). This paper is devoted to an alternativeconcept of a multi-tenant database cluster which pro-poses the solution of the above problems at the levelof a data storage subsystem.
One of the main challenges when implementingsuch a system is to choose the most efficient data man-agement strategy which will provide the best distribu-tion of the query flow among database servers withinthe cluster. In this context, the word ”best” implies anumber of questions that can be answered in differ-ent ways. An optimization can be done by variouscriteria and we need to use some consumer character-istics to evaluate the observed quality of service. The
average cluster response time, the total amount of re-quired resources within the given service level agree-ments (SLA’s) or something else can be used as suchcharacteristics. Often These characteristics are oftendifficult to evaluate and sometimes they conflict witheach other. Besides, many of the above characteristicscan be evaluated only when the distribution of clientshas been already done. So far, an additional metric isrequired which has a direct correlation with the aboveconsumer characteristics and can be used to find theoptimal tenant distribution. This paper discusses oneapproach to choosing such a metric and compares itsresults with ad-hoc data management strategies.
2 BACKGROUND
The problem of providing a reliable and scalable datastorage for cloud applications was discussed in sev-eral works. Usually, NO-SQL databases are used ascluster nodes. In particular, the problem of tenant mi-gration in a multi-tenant environment was studied andthe protocol to implement such a migration was pro-posed in (Elmore et al., 2011). Other researches weredevoted to minimizing an owning cluster consisting ofNO-SQL in-memory databases in IaaS environment(Schaffner et al., 2013; Yang et al., 2008). The algo-rithm of tenant distribution for minimizing expenseswith respect to SLA’s was proposed in (Lang et al.,2012).
A multi-tenant database cluster (Boytsov, 2013)
217
discussed in this paper is a concept of a data storagesubsystem for cloud applications. It is an additionallayer of abstraction over ordinary relational databaseservers with a single entry point which is used to pro-vide the isolation of cloud application customers data,load-balancing, routing the queries among servers andfault-tolerance. The main idea is to provide an ap-plication interface which has most in common withthe interfaces of the traditional RDBMS (relationaldatabase management system).
A multi-tenant cluster consists of a set of ordinarydatabase servers and specific control and query rout-ing servers. The query routing server is a new elementin a chain of interaction between application serversand database servers. In fact, this component of thesystem is just a kind of a proxy server which hidesthe details of the cluster structure, and whose mainpurpose is to find an executor for a query and routethe query to him as fast as possible.
The data distribution and load balancing server isthe most important and complicated component of thesystem. Its main functions are:• initial distribution of tenants data among servers
of a cluster during the system deployment or ad-dition of new servers or tenants;
• management of tenant data distribution based onthe collected statistics including the creation ofadditional data copies and moving data to anotherserver;
• diagnosis of the system for the need of adding newcomputing nodes and storage devices;
• managing the replication.This component of the system has the highest value,since the performance of an application depends onthe success of its work.
The flow of incoming queries of the multi-tenant database cluster can be divided into N non-intersecting and independent sub-flows for each ten-ant λi, i ∈ 1, ..,N:
Λ =N
∑i=1
λi (1)
The study of statistics on existing multi-tenant cloudapplications shows that there is a significant depen-dency between the size of data, that the client storesin the cloud, and intensity of client query flow. Theanalysis of the statistics also shows that the abovetendency is not comprehensive and there are clientswithin the cluster having the intensity of the queryflow that does not match the size of the stored data.The client query flow can be divided into two sub-flows: read-only queries and data-modifying queries.
λi = λiread +λiwrite (2)
Another obvious characteristics of the query flowis an average duration µ of a query at the server. Thisvalue has a significant impact on the quality of load-balancing, since it affects the formation of the clus-ter total load. As we know from the queueing the-ory, if Λµ > B, where B is a bandwidth of the cluster,the cluster will fail to serve the incoming flow of re-quests. It is also known that intensities of incomingquery flows change during the lifetime of the applica-tion, that is λi = λ(t), i ∈ 1, ..,N.
3 THE LOAD-BALANCINGPROBLEM WITH CONSTANTFLOW OF QUERIES
In the work, we discuss the load-balancing of the clus-ter in a case when flows of incoming queries have aconstant intensity, i.e. λi = const, i ∈ 1, ..,N. The so-lution of this problem can be considered as a solutionof the general problem at the point.
3.1 Clusters without Replication
We start our discussion with clusters without datareplication (that is, such clusters do not provide fault-tolerance). For simplicity, we assume that µ = 1 (or,equivalently, the bandwidth of each server in the clus-ter is divided by µ). Let C be the multi-tenant databasecluster that consists of database servers (S1, ..,SM),for each of which we know the following values:
1. λi, i∈ 1, ..,M - the bandwidth of the i−th databaseserver;
2. vi, i ∈ 1, ..,M - the capacity of the i− th databaseserver.
There are also N clients, comprising the set T , foreach of which we also know two values:
1. λ j, j∈ 1, ..,N - the intensity of the j-th client queryflow;
2. v j, j ∈ 1, ..,N - the data size of the j-th client.
We call the M×N matrix D a distribution matrix (ofclients at the cluster), if D satisfies the following con-straints and conditions:
1. di, j = 1, when data of the j-th client are placed atthe i-th server, and xi, j = 0 otherwise;
2. ∀ j ∈ 1, ..,N ∃!i ∈ 1, ..,M : di, j = 1 - the data ofeach client are placed at a single server;
3. ∀i ∈ 1, ..,M ∑Nj=1 di, jv j ≤ vi - the total data size
at each server is less than or equal to the servercapacity;
Fourth International Symposium on Business Modeling and Software Design
218
4. ∀i ∈ 1, ..,M ∑Nj=1 di, jλ j ≤ λi - total query flow in-
tensity at each server is less than or equal to theserver bandwidth.
We call the matrix D the optimal matrix of distribu-tion of clients set T at the cluster C, if for a functionf (C,T,D) the following condition is met:
f (C,T, D)=min{ f (C,T,D) : D−distribution matrix}(3)
The function f in this definition is the measureof load-balancing efficiency among the servers ofthe cluster. The problem of effective cluster load-balancing in this formulation reduces to finding theoptimal distribution matrix for a given cluster C, a setof clients T and a measure of efficiency f .
3.2 Clusters with Replication
The usage of a master-slave replication allows to pro-vide fault-tolerance and gives a chance to achieve abetter query flow distribution. When discussing clus-ters with replication, we deal with multiple data in-stances of the same tenant. In this case, we have totake into account division of the tenants query flowinto read-only and data-modifying parts. Only theserver which hosts tenants master data-instance canserve data-modifying queries.
To precise this situation, we need to add severalnew features into our model. First of all, we need tointroduce the notion of a replication matrix. We calla M×N matrix R a matrix of replication (of tenantsdata instances at the cluster C) for the given matrix ofdistribution D, if the following conditions are met:
1. Ri, j = 1, if a replica of data of the j-th tenant isstored at the i-th server, and Ri, j = 0, otherwise
2. ∀i∈ 1, ..,M and j ∈ 1, ..,N : Di, j = 1 =⇒ Ri, j = 0- if i-th server has a master copy of the tenant data,it can not host a tenant data replica.
Obviously, clusters with replication have the sameservice level requirements as its counterparts with-out replication. The disk capacity restriction is trans-formed into:
∀i ∈ 1, ..,M :N
∑j=1
di, jv j +N
∑j=1
ri, jv j ≤ vi (4)
It is much difficult to formulate the second restrictionon incoming flow intensities, since we don’t know ex-actly the policy of query flow distribution among ten-ant data instances. All we can say is that all data-modifying queries are served at the master server.Read-only queries can be served either by the mas-ter server, or by slave servers, and the cluster controlsystem is free to choose any conformant strategy. It
can forward all read-only queries to the master server,using replicas just to provide fault-tolerance, it canroute all such queries to replicas, somehow dividingthe flow among them, or it can use an intermediateapproach. These considerations lead us to the need todefine an additional function:
shr : (C,T,D,R)→ S, (5)where S is a M×N matrix and Si, j ∈ [0,1]. This func-tion takes the set of servers C, the set of clients T ,and the distribution of tenants data instances amongservers within the cluster, which is described by ma-trices D and R and maps it to the matrix of the read-load share S. The read-load share matrix S has thefollowing requirements:1. ∀ j ∈ 1, ..,N ∑
Mi=1 si, j = 1 - the read-only flow
is completely distributed among tenant data in-stances
2. ∀i ∈ 1, ..,M, j ∈ 1, ..,N : Di, j = 0∧Ri, j = 0 =⇒Si, j = 0 - if the i-th server doesn’t host data in-stance of the j-th tenant its load-share is equal to0.
Having the matrix S introduced, we can formulate theflow-intensity constraint as the following:
N
∑j=1
(di, jλ jwrite +di, jλ jread si, j + ri, jλ jread si, j)≤ λi,
∀i ∈ 1, ..,M
(6)
If we introduce the shorthand load(i, j) asload(i, j) = di, jλ jwrite + di, jλ jread si, j + ri, jλ jread si, jthen we can rewrite (6) as
N
∑j=1
load(i, j)≤ λi,∀i ∈ 1, ..,M (7)
We call the combination of a distribution matrix Dand a replication matrix R sustainable to the fault ofk servers, if ∀i1, .., ik, il ∈ 1, ..,M the fault of serversi1, .., ik and redistribution of the query flow amongservers left will produce tenant distribution (D, R),where D still conforms to the definition of the dis-tribution matrix, and the combination (C,T, D, R) stillconforms to (7). In this paper, we omit the discussionon the term ”redistribution of the query flow”, since ingeneral case it implies the definition of another func-tion, which is responsible for election of a new masterdata instance, when the existing master data instanceis placed at a failed server.
So we can finally formulate the load-balancingproblem for clusters with replication and the require-ment of k-faults sustainability as finding a combina-tion of matrices (D, R), which, together with the givenstructure of the cluster C, the set of tenants T andthe read-load share function shr satisfies the follow-ing conditions:
Comparison of Data Management Strategies for Multi-Tenant Database Cluster
219
1. (D, R) corresponds to k-server faults sustainabledistribution of tenants data instances
2. f (C,T,shr, D, R) = min{ f (C,T,shr,D,R)} forsome metric f
This problem reduces to the problem of cluster load-balancing without replication when R = Θ. In thiscase, the function shr can be removed from the prob-lem, since there is no alternative for S = D, whichgives load(i, j) = di, jλ j as in (3).
4 SELECTION OF THEEFFICIENCY MEASURE
What is the best way to measure the efficiency ofload-balancing among servers? Uniformity of theload is a good criteria here; therefore, the target func-tion, which will measure this characteristics should besearched. The desired situation can be formulated inthe following way: the share of a total query flow ateach server should be as close as possible to the shareof this server in the total computational power of theentire cluster. So, the function f can be written asfollows:
f =M
∑i=1
(∑
Nj=1 load(i, j)
∑Nj=1 λ j
− λi
∑Mi=1 λi
)2
(8)
With the measure of efficiency (8), the load-balancing problem becomes a special case of thegeneralized quadratic assignment problem (GQAP),which in turn is a generalization of the quadratic as-signment problem (QAP), initially stated in 1957 byKoopmans and Beckmann(Beckman and Koopmans,1957) to model the problem of allocating a set of nfacilities to a set of n locations while minimizing thequadratic objective arising from the distance betweenthe locations in combination with the flow betweenthe facilities. The GQAP is a generalized problem ofthe QAP in which there is no restriction that one loca-tion can accommodate only a single equipment. Leeand Ma(Lee and Ma, 2004) proposed the first formu-lation of the GQAP. Their study involves a facility lo-cation problem in manufacturing where facilities mustbe located among fixed locations, with a space con-straint at each possible location. The objective is tominimize the total installation and interaction trans-portation cost.
The QAP is well known to be NP-hard(Sahni andGonzalez, 1976) and, in practice, problems of moder-ate sizes are still considered very hard. For surveyson QAP, see the articles Burkard(Burkard, 1990),and Rendl, Pardalos, Wolkowicz (Rendl et al., 1994).An annotated bibliography is given by Burkard and
Cela(Burkard and Cela, 1997). The QAP is a classicproblem that still defies all approaches for its solutionand where problems of dimension n = 16 can be con-sidered large scale. Since GQAP is a generalizationof QAP, it is also NP-hard and even more difficult tosolve.
The discussed multi-tenant database cluster load-balancing problem deals with tens and hundreds ofdatabase servers and tens and hundreds of thousandsof tenants. Due to NP-hardness of the GQAP, it isobvious that such a problem can not be solved ex-actly or approximately with high degree of exactnessby existing algorithm. So, we can conclude that tosolve the above load-balancing problem, we need tosuggest some heuristics that can provide acceptableperformance and measure its efficiency and positiveeffect in comparison with other load-balancing strate-gies.
5 MODELLING OFDATA-MANAGEMENTSTRATEGIES
The above measure of efficiency of cluster load-balancing is a heuristics which can be used to searchfor an efficient tenant distribution. But does it corre-late with consumer characteristics of the cluster andlead to the better results than ad-hoc solutions, thatcan be written by any programmer? To answer thesequestions and to test the target function (8), severalexperiments were conducted at the simulation modelof the cluster. The structure of the cluster with Mdatabase servers of different bandwidth (M is a pa-rameter of the experiment) was generated using themodelling environment. At the initial moment, thecluster had no clients. Each experiment within theseries consisted of 30 iterations with a selected com-bination of simulation parameters.
5.1 The Description of the Experiment
The experiment was conducted for clusters with andwithout replication. The model of the query flow wasconfigured in a way which provided progressive reg-istration of new clients at the cluster and therefore thecorresponding increase of query flow intensity. Sincethe computational power of the cluster is limited andthe total intensity of incoming query flow constantlyincreases, it is obvious that the cluster will stop serv-ing queries at some point of time. It is also obvi-ous that if one load-balancing strategy allows to placemore clients than another one within similar exter-
Fourth International Symposium on Business Modeling and Software Design
220
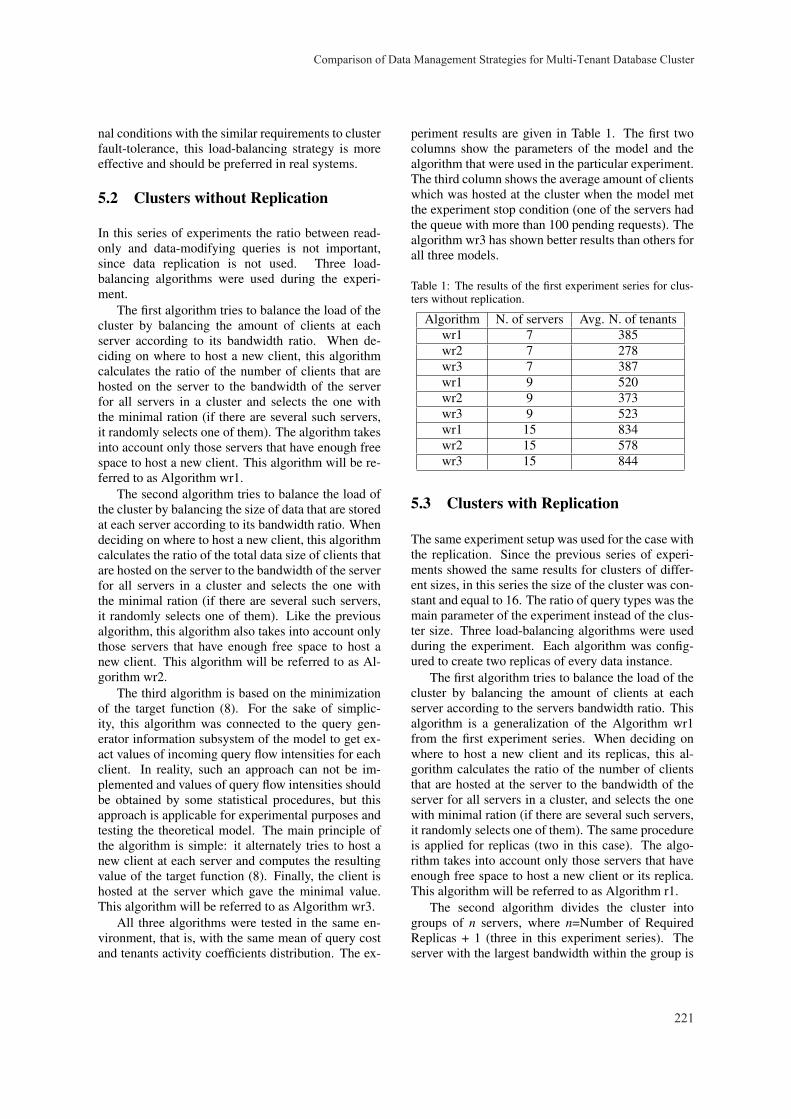
nal conditions with the similar requirements to clusterfault-tolerance, this load-balancing strategy is moreeffective and should be preferred in real systems.
5.2 Clusters without Replication
In this series of experiments the ratio between read-only and data-modifying queries is not important,since data replication is not used. Three load-balancing algorithms were used during the experi-ment.
The first algorithm tries to balance the load of thecluster by balancing the amount of clients at eachserver according to its bandwidth ratio. When de-ciding on where to host a new client, this algorithmcalculates the ratio of the number of clients that arehosted on the server to the bandwidth of the serverfor all servers in a cluster and selects the one withthe minimal ration (if there are several such servers,it randomly selects one of them). The algorithm takesinto account only those servers that have enough freespace to host a new client. This algorithm will be re-ferred to as Algorithm wr1.
The second algorithm tries to balance the load ofthe cluster by balancing the size of data that are storedat each server according to its bandwidth ratio. Whendeciding on where to host a new client, this algorithmcalculates the ratio of the total data size of clients thatare hosted on the server to the bandwidth of the serverfor all servers in a cluster and selects the one withthe minimal ration (if there are several such servers,it randomly selects one of them). Like the previousalgorithm, this algorithm also takes into account onlythose servers that have enough free space to host anew client. This algorithm will be referred to as Al-gorithm wr2.
The third algorithm is based on the minimizationof the target function (8). For the sake of simplic-ity, this algorithm was connected to the query gen-erator information subsystem of the model to get ex-act values of incoming query flow intensities for eachclient. In reality, such an approach can not be im-plemented and values of query flow intensities shouldbe obtained by some statistical procedures, but thisapproach is applicable for experimental purposes andtesting the theoretical model. The main principle ofthe algorithm is simple: it alternately tries to host anew client at each server and computes the resultingvalue of the target function (8). Finally, the client ishosted at the server which gave the minimal value.This algorithm will be referred to as Algorithm wr3.
All three algorithms were tested in the same en-vironment, that is, with the same mean of query costand tenants activity coefficients distribution. The ex-
periment results are given in Table 1. The first twocolumns show the parameters of the model and thealgorithm that were used in the particular experiment.The third column shows the average amount of clientswhich was hosted at the cluster when the model metthe experiment stop condition (one of the servers hadthe queue with more than 100 pending requests). Thealgorithm wr3 has shown better results than others forall three models.
Table 1: The results of the first experiment series for clus-ters without replication.
Algorithm N. of servers Avg. N. of tenantswr1 7 385wr2 7 278wr3 7 387wr1 9 520wr2 9 373wr3 9 523wr1 15 834wr2 15 578wr3 15 844
5.3 Clusters with Replication
The same experiment setup was used for the case withthe replication. Since the previous series of experi-ments showed the same results for clusters of differ-ent sizes, in this series the size of the cluster was con-stant and equal to 16. The ratio of query types was themain parameter of the experiment instead of the clus-ter size. Three load-balancing algorithms were usedduring the experiment. Each algorithm was config-ured to create two replicas of every data instance.
The first algorithm tries to balance the load of thecluster by balancing the amount of clients at eachserver according to the servers bandwidth ratio. Thisalgorithm is a generalization of the Algorithm wr1from the first experiment series. When deciding onwhere to host a new client and its replicas, this al-gorithm calculates the ratio of the number of clientsthat are hosted at the server to the bandwidth of theserver for all servers in a cluster, and selects the onewith minimal ration (if there are several such servers,it randomly selects one of them). The same procedureis applied for replicas (two in this case). The algo-rithm takes into account only those servers that haveenough free space to host a new client or its replica.This algorithm will be referred to as Algorithm r1.
The second algorithm divides the cluster intogroups of n servers, where n=Number of RequiredReplicas + 1 (three in this experiment series). Theserver with the largest bandwidth within the group is
Comparison of Data Management Strategies for Multi-Tenant Database Cluster
221
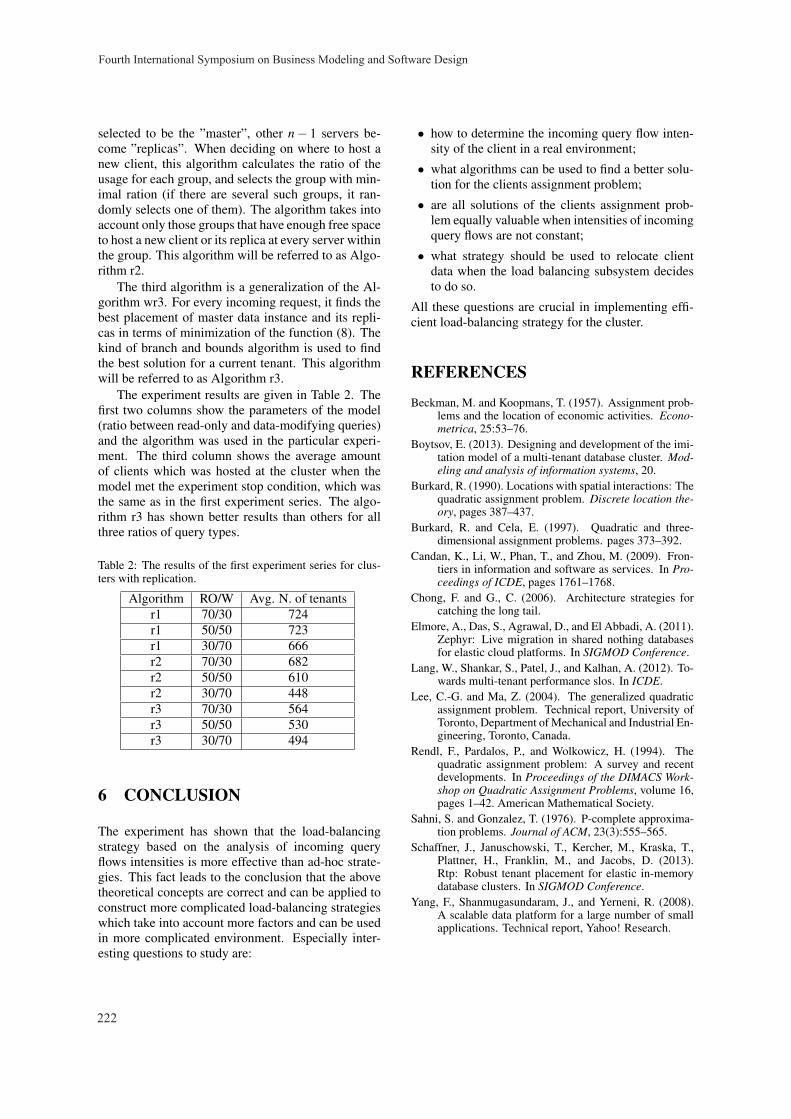
selected to be the ”master”, other n− 1 servers be-come ”replicas”. When deciding on where to host anew client, this algorithm calculates the ratio of theusage for each group, and selects the group with min-imal ration (if there are several such groups, it ran-domly selects one of them). The algorithm takes intoaccount only those groups that have enough free spaceto host a new client or its replica at every server withinthe group. This algorithm will be referred to as Algo-rithm r2.
The third algorithm is a generalization of the Al-gorithm wr3. For every incoming request, it finds thebest placement of master data instance and its repli-cas in terms of minimization of the function (8). Thekind of branch and bounds algorithm is used to findthe best solution for a current tenant. This algorithmwill be referred to as Algorithm r3.
The experiment results are given in Table 2. Thefirst two columns show the parameters of the model(ratio between read-only and data-modifying queries)and the algorithm was used in the particular experi-ment. The third column shows the average amountof clients which was hosted at the cluster when themodel met the experiment stop condition, which wasthe same as in the first experiment series. The algo-rithm r3 has shown better results than others for allthree ratios of query types.
Table 2: The results of the first experiment series for clus-ters with replication.
Algorithm RO/W Avg. N. of tenantsr1 70/30 724r1 50/50 723r1 30/70 666r2 70/30 682r2 50/50 610r2 30/70 448r3 70/30 564r3 50/50 530r3 30/70 494
6 CONCLUSION
The experiment has shown that the load-balancingstrategy based on the analysis of incoming queryflows intensities is more effective than ad-hoc strate-gies. This fact leads to the conclusion that the abovetheoretical concepts are correct and can be applied toconstruct more complicated load-balancing strategieswhich take into account more factors and can be usedin more complicated environment. Especially inter-esting questions to study are:
• how to determine the incoming query flow inten-sity of the client in a real environment;
• what algorithms can be used to find a better solu-tion for the clients assignment problem;
• are all solutions of the clients assignment prob-lem equally valuable when intensities of incomingquery flows are not constant;
• what strategy should be used to relocate clientdata when the load balancing subsystem decidesto do so.
All these questions are crucial in implementing effi-cient load-balancing strategy for the cluster.
REFERENCES
Beckman, M. and Koopmans, T. (1957). Assignment prob-lems and the location of economic activities. Econo-metrica, 25:53–76.
Boytsov, E. (2013). Designing and development of the imi-tation model of a multi-tenant database cluster. Mod-eling and analysis of information systems, 20.
Burkard, R. (1990). Locations with spatial interactions: Thequadratic assignment problem. Discrete location the-ory, pages 387–437.
Burkard, R. and Cela, E. (1997). Quadratic and three-dimensional assignment problems. pages 373–392.
Candan, K., Li, W., Phan, T., and Zhou, M. (2009). Fron-tiers in information and software as services. In Pro-ceedings of ICDE, pages 1761–1768.
Chong, F. and G., C. (2006). Architecture strategies forcatching the long tail.
Elmore, A., Das, S., Agrawal, D., and El Abbadi, A. (2011).Zephyr: Live migration in shared nothing databasesfor elastic cloud platforms. In SIGMOD Conference.
Lang, W., Shankar, S., Patel, J., and Kalhan, A. (2012). To-wards multi-tenant performance slos. In ICDE.
Lee, C.-G. and Ma, Z. (2004). The generalized quadraticassignment problem. Technical report, University ofToronto, Department of Mechanical and Industrial En-gineering, Toronto, Canada.
Rendl, F., Pardalos, P., and Wolkowicz, H. (1994). Thequadratic assignment problem: A survey and recentdevelopments. In Proceedings of the DIMACS Work-shop on Quadratic Assignment Problems, volume 16,pages 1–42. American Mathematical Society.
Sahni, S. and Gonzalez, T. (1976). P-complete approxima-tion problems. Journal of ACM, 23(3):555–565.
Schaffner, J., Januschowski, T., Kercher, M., Kraska, T.,Plattner, H., Franklin, M., and Jacobs, D. (2013).Rtp: Robust tenant placement for elastic in-memorydatabase clusters. In SIGMOD Conference.
Yang, F., Shanmugasundaram, J., and Yerneni, R. (2008).A scalable data platform for a large number of smallapplications. Technical report, Yahoo! Research.
Fourth International Symposium on Business Modeling and Software Design
222
Service Composition Based on Semantic Vocabulary
YuHui Ning, ShuXia Yu, YuYue Du and Wei Liu College of Information Science and Engineering, Shandong University of Science and Technology,
579 Qianwangang Road, Huangdao, China {ningyuhui, syuqd, yydu001,yanchunchun9896}@163.com
Keywords: Web Service, Service Composition, Semantic Vocabulary, Concept Replacement, Service Clustering.
Abstract: With the development of Web services, semantics is introduced into Web services, and the information recognition ability can be enhanced with the semantic description of Web services. Thus, the technology of service composition and binding can be improved. At present, the main method of service composition, discovery, binding and replacement is similarity computing based on an ontology tree. However, constructing the ontology tree and deploying the concepts in it are difficult, and the operability of service composition with similarity computing cannot meet user requirements. To solve the above problem, a new method of service composition is introduced based on semantic vocabulary. The constructing methods of the semantic vocabulary, concept replacement, service clustering, and service composition are given. Finally, the validity and correctness of proposed methods are illustrated by simulations and the comparative analysis of simulation results.
1 INTRODUCTION
With the development of information technology, Web services based on XML (Extensible Markup Language) have developed rapidly (Sun and Jiang, 2008). Web services can be used distributed on a cross-platform system. At present, the service providers keep releasing many services into Internet. Although there are many choices for users, the efficiency and precision of service discovery are decreased. In order to solve this problem, the concepts of service groups (Liu et al. 2007), service pools (Sheng et al. 2009), service clusters (Deng and Du, 2013, Gao et al. 2006) and service communities (Quan et al. 2009, Liu et al. 2009) have been introduced. Their main idea is that the services with the similar functions should be clustered before binding a particular service to a composite service (Hu and Du, 2013). Clustering services can minimize the cardinal number for service discovery. Thus, the service discovery can be sped up.
WSDL (Web services Definition Language) has some limitations (Deng and Du, 2013). The data of services described with WSDL cannot be recognized completely by the computers. Thus, the ability of service clustering is limited.
With the research of Web services, many scholars introduce the semantics into Web services
(Xiong et al. 2010). The information recognition ability can be enhanced with the semantic description of Web services. Thus, the service composition and binding would be improved. The current main method for service composition, discovery, binding and replacement is similarity computing based on an ontology tree (Wu et al. 2005). However, constructing an ontology tree and deploying the concepts in it remain a difficult task. The operability of service composition based on similarity computing (HAN et al. 2009, and Xie, 2011) is insufficient.
To solve the above problems, a method for composing Web services based on semantic vocabulary is introduced in this paper. The constructing methods of semantic vocabulary, concept replacement, service clustering, and service composition are given. At last, the validity and advantage of the proposed methods are illustrated by simulations.
The rest of this article is organized as follows. The overall design is introduced in Section 2. A semantic vocabulary is constructed in Section 3. The method of service clustering is given in Section 4. The service composition is introduced in Section 5. Simulations and comparative analysis are given in Section 6. Concluding remarks are made in Section 7.
223
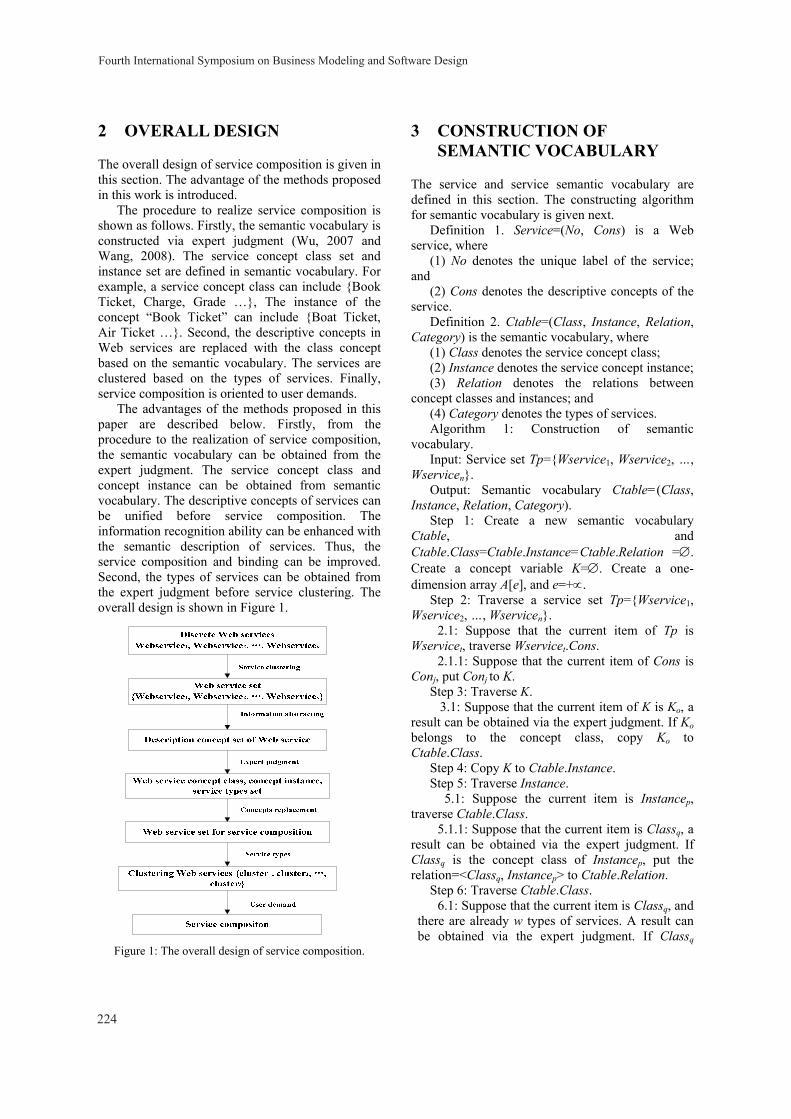
2 OVERALL DESIGN
The overall design of service composition is given in this section. The advantage of the methods proposed in this work is introduced.
The procedure to realize service composition is shown as follows. Firstly, the semantic vocabulary is constructed via expert judgment (Wu, 2007 and Wang, 2008). The service concept class set and instance set are defined in semantic vocabulary. For example, a service concept class can include {Book Ticket, Charge, Grade …}, The instance of the concept “Book Ticket” can include {Boat Ticket, Air Ticket …}. Second, the descriptive concepts in Web services are replaced with the class concept based on the semantic vocabulary. The services are clustered based on the types of services. Finally, service composition is oriented to user demands.
The advantages of the methods proposed in this paper are described below. Firstly, from the procedure to the realization of service composition, the semantic vocabulary can be obtained from the expert judgment. The service concept class and concept instance can be obtained from semantic vocabulary. The descriptive concepts of services can be unified before service composition. The information recognition ability can be enhanced with the semantic description of services. Thus, the service composition and binding can be improved. Second, the types of services can be obtained from the expert judgment before service clustering. The overall design is shown in Figure 1.
Figure 1: The overall design of service composition.
3 CONSTRUCTION OF SEMANTIC VOCABULARY
The service and service semantic vocabulary are defined in this section. The constructing algorithm for semantic vocabulary is given next.
Definition 1. Service=(No, Cons) is a Web service, where
(1) No denotes the unique label of the service; and
(2) Cons denotes the descriptive concepts of the service.
Definition 2. Ctable=(Class, Instance, Relation, Category) is the semantic vocabulary, where
(1) Class denotes the service concept class; (2) Instance denotes the service concept instance; (3) Relation denotes the relations between
concept classes and instances; and (4) Category denotes the types of services. Algorithm 1: Construction of semantic
vocabulary. Input: Service set Tp={Wservice1, Wservice2, …,
Wservicen}. Output: Semantic vocabulary Ctable=(Class,
Instance, Relation, Category). Step 1: Create a new semantic vocabulary
Ctable, and Ctable.Class=Ctable.Instance=Ctable.Relation =∅. Create a concept variable K=∅. Create a one-dimension array A[e], and e=+∝.
Step 2: Traverse a service set Tp={Wservice1, Wservice2, …, Wservicen}.
2.1: Suppose that the current item of Tp is Wservicet, traverse Wservicet.Cons.
2.1.1: Suppose that the current item of Cons is Conj, put Conj to K.
Step 3: Traverse K. 3.1: Suppose that the current item of K is Ko, a
result can be obtained via the expert judgment. If Ko belongs to the concept class, copy Ko to Ctable.Class.
Step 4: Copy K to Ctable.Instance. Step 5: Traverse Instance. 5.1: Suppose the current item is Instancep,
traverse Ctable.Class. 5.1.1: Suppose that the current item is Classq, a
result can be obtained via the expert judgment. If Classq is the concept class of Instancep, put the relation=<Classq, Instancep> to Ctable.Relation.
Step 6: Traverse Ctable.Class. 6.1: Suppose that the current item is Classq, and
there are already w types of services. A result can be obtained via the expert judgment. If Classq
Fourth International Symposium on Business Modeling and Software Design
224
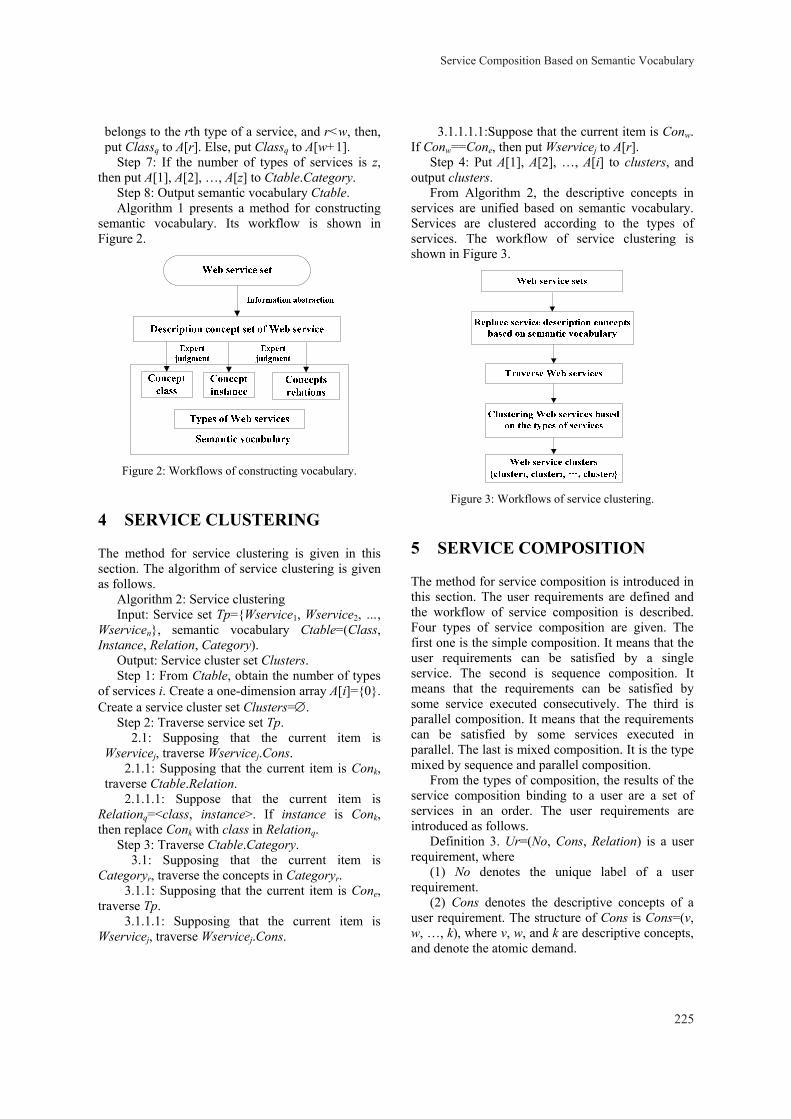
belongs to the rth type of a service, and r<w, then, put Classq to A[r]. Else, put Classq to A[w+1].
Step 7: If the number of types of services is z, then put A[1], A[2], …, A[z] to Ctable.Category.
Step 8: Output semantic vocabulary Ctable. Algorithm 1 presents a method for constructing
semantic vocabulary. Its workflow is shown in Figure 2.
Figure 2: Workflows of constructing vocabulary.
4 SERVICE CLUSTERING
The method for service clustering is given in this section. The algorithm of service clustering is given as follows.
Algorithm 2: Service clustering Input: Service set Tp={Wservice1, Wservice2, …,
Wservicen}, semantic vocabulary Ctable=(Class, Instance, Relation, Category).
Output: Service cluster set Clusters. Step 1: From Ctable, obtain the number of types
of services i. Create a one-dimension array A[i]={0}. Create a service cluster set Clusters=∅.
Step 2: Traverse service set Tp. 2.1: Supposing that the current item is
Wservicej, traverse Wservicej.Cons. 2.1.1: Supposing that the current item is Conk,
traverse Ctable.Relation. 2.1.1.1: Suppose that the current item is
Relationq=<class, instance>. If instance is Conk, then replace Conk with class in Relationq.
Step 3: Traverse Ctable.Category. 3.1: Supposing that the current item is
Categoryr, traverse the concepts in Categoryr. 3.1.1: Supposing that the current item is Cone,
traverse Tp. 3.1.1.1: Supposing that the current item is
Wservicej, traverse Wservicej.Cons.
3.1.1.1.1:Suppose that the current item is Conw. If Conw==Cone, then put Wservicej to A[r].
Step 4: Put A[1], A[2], …, A[i] to clusters, and output clusters.
From Algorithm 2, the descriptive concepts in services are unified based on semantic vocabulary. Services are clustered according to the types of services. The workflow of service clustering is shown in Figure 3.
Figure 3: Workflows of service clustering.
5 SERVICE COMPOSITION
The method for service composition is introduced in this section. The user requirements are defined and the workflow of service composition is described. Four types of service composition are given. The first one is the simple composition. It means that the user requirements can be satisfied by a single service. The second is sequence composition. It means that the requirements can be satisfied by some service executed consecutively. The third is parallel composition. It means that the requirements can be satisfied by some services executed in parallel. The last is mixed composition. It is the type mixed by sequence and parallel composition.
From the types of composition, the results of the service composition binding to a user are a set of services in an order. The user requirements are introduced as follows.
Definition 3. Ur=(No, Cons, Relation) is a user requirement, where
(1) No denotes the unique label of a user requirement.
(2) Cons denotes the descriptive concepts of a user requirement. The structure of Cons is Cons=(v, w, …, k), where v, w, and k are descriptive concepts, and denote the atomic demand.
Service Composition Based on Semantic Vocabulary
225
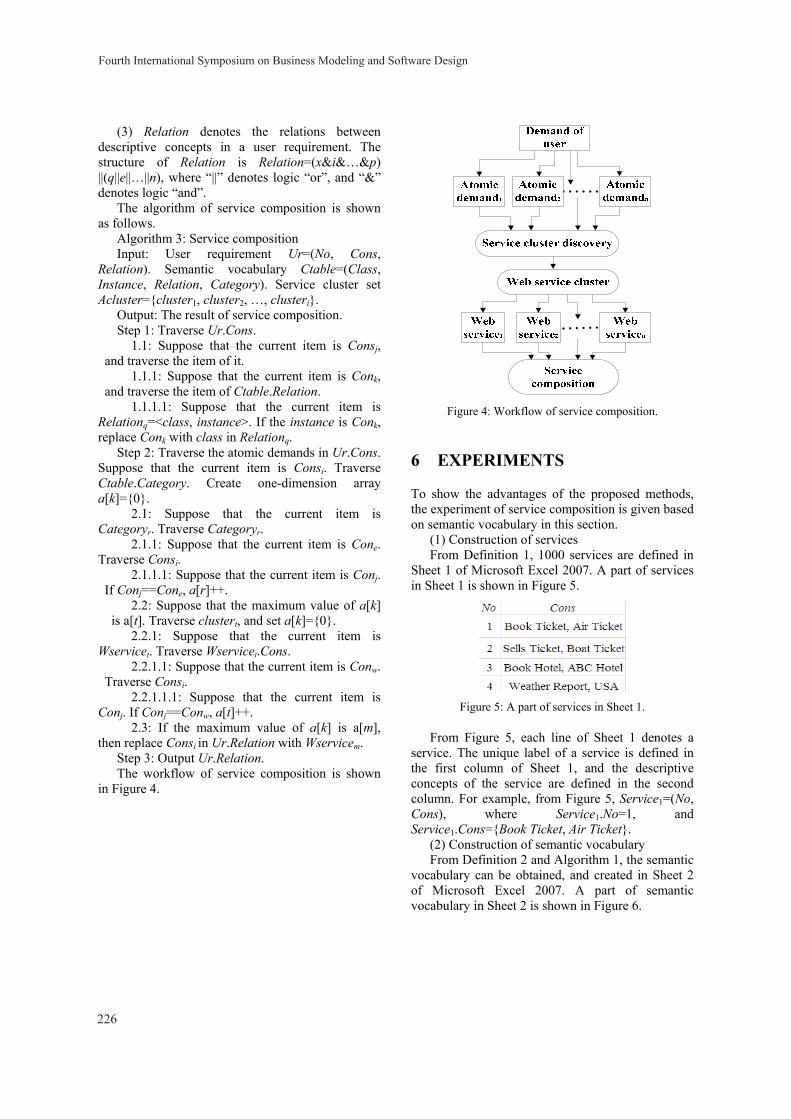
(3) Relation denotes the relations between descriptive concepts in a user requirement. The structure of Relation is Relation=(x&i&…&p) ||(q||e||…||n), where “||” denotes logic “or”, and “&” denotes logic “and”.
The algorithm of service composition is shown as follows.
Algorithm 3: Service composition Input: User requirement Ur=(No, Cons,
Relation). Semantic vocabulary Ctable=(Class, Instance, Relation, Category). Service cluster set Acluster={cluster1, cluster2, …, clusteri}.
Output: The result of service composition. Step 1: Traverse Ur.Cons.
1.1: Suppose that the current item is Consj, and traverse the item of it.
1.1.1: Suppose that the current item is Conk, and traverse the item of Ctable.Relation.
1.1.1.1: Suppose that the current item is Relationq=<class, instance>. If the instance is Conk, replace Conk with class in Relationq.
Step 2: Traverse the atomic demands in Ur.Cons. Suppose that the current item is Consi. Traverse Ctable.Category. Create one-dimension array a[k]={0}.
2.1: Suppose that the current item is Categoryr. Traverse Categoryr.
2.1.1: Suppose that the current item is Cone. Traverse Consi.
2.1.1.1: Suppose that the current item is Conj. If Conj==Cone, a[r]++.
2.2: Suppose that the maximum value of a[k] is a[t]. Traverse clustert, and set a[k]={0}.
2.2.1: Suppose that the current item is Wservicet. Traverse Wservicet.Cons.
2.2.1.1: Suppose that the current item is Conw. Traverse Consi.
2.2.1.1.1: Suppose that the current item is Conj. If Conj==Conw, a[t]++.
2.3: If the maximum value of a[k] is a[m], then replace Consi in Ur.Relation with Wservicem.
Step 3: Output Ur.Relation. The workflow of service composition is shown
in Figure 4.
Figure 4: Workflow of service composition.
6 EXPERIMENTS
To show the advantages of the proposed methods, the experiment of service composition is given based on semantic vocabulary in this section.
(1) Construction of services From Definition 1, 1000 services are defined in
Sheet 1 of Microsoft Excel 2007. A part of services in Sheet 1 is shown in Figure 5.
Figure 5: A part of services in Sheet 1.
From Figure 5, each line of Sheet 1 denotes a service. The unique label of a service is defined in the first column of Sheet 1, and the descriptive concepts of the service are defined in the second column. For example, from Figure 5, Service1=(No, Cons), where Service1.No=1, and Service1.Cons={Book Ticket, Air Ticket}.
(2) Construction of semantic vocabulary From Definition 2 and Algorithm 1, the semantic
vocabulary can be obtained, and created in Sheet 2 of Microsoft Excel 2007. A part of semantic vocabulary in Sheet 2 is shown in Figure 6.
Fourth International Symposium on Business Modeling and Software Design
226
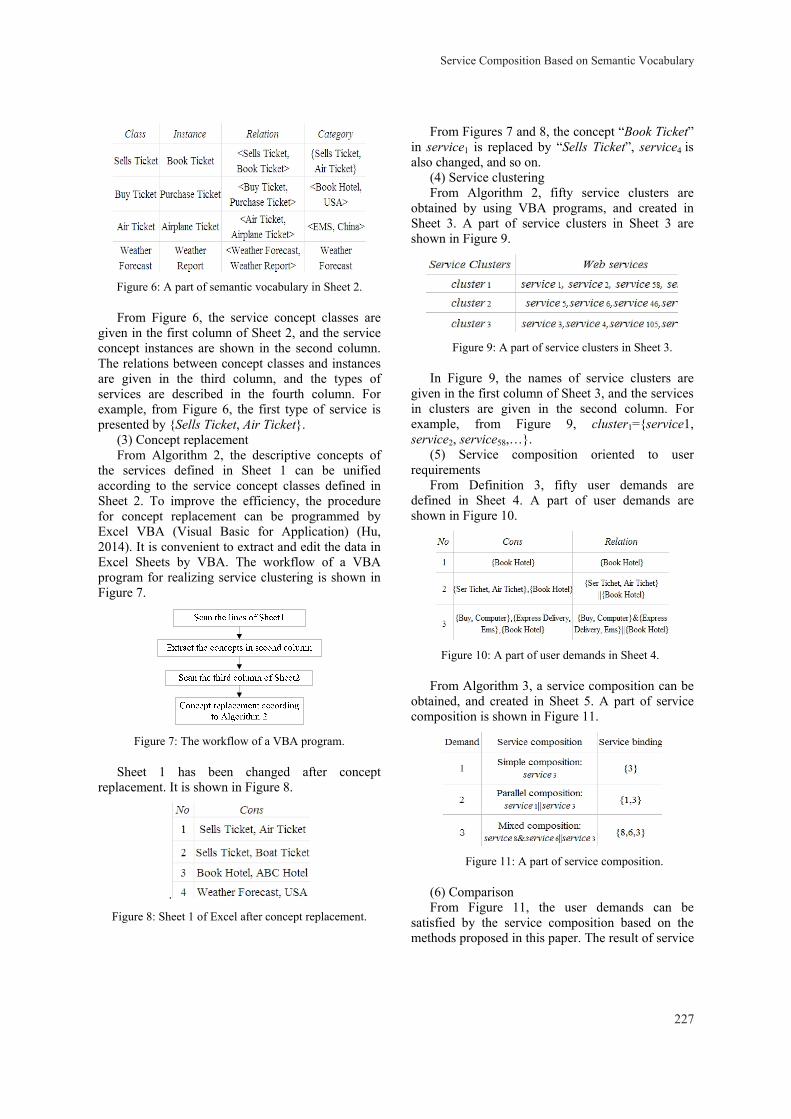
Figure 6: A part of semantic vocabulary in Sheet 2.
From Figure 6, the service concept classes are given in the first column of Sheet 2, and the service concept instances are shown in the second column. The relations between concept classes and instances are given in the third column, and the types of services are described in the fourth column. For example, from Figure 6, the first type of service is presented by {Sells Ticket, Air Ticket}.
(3) Concept replacement From Algorithm 2, the descriptive concepts of
the services defined in Sheet 1 can be unified according to the service concept classes defined in Sheet 2. To improve the efficiency, the procedure for concept replacement can be programmed by Excel VBA (Visual Basic for Application) (Hu, 2014). It is convenient to extract and edit the data in Excel Sheets by VBA. The workflow of a VBA program for realizing service clustering is shown in Figure 7.
Figure 7: The workflow of a VBA program.
Sheet 1 has been changed after concept replacement. It is shown in Figure 8.
.
Figure 8: Sheet 1 of Excel after concept replacement.
From Figures 7 and 8, the concept “Book Ticket” in service1 is replaced by “Sells Ticket”, service4 is also changed, and so on.
(4) Service clustering From Algorithm 2, fifty service clusters are
obtained by using VBA programs, and created in Sheet 3. A part of service clusters in Sheet 3 are shown in Figure 9.
Figure 9: A part of service clusters in Sheet 3.
In Figure 9, the names of service clusters are given in the first column of Sheet 3, and the services in clusters are given in the second column. For example, from Figure 9, cluster1={service1, service2, service58,…}.
(5) Service composition oriented to user requirements
From Definition 3, fifty user demands are defined in Sheet 4. A part of user demands are shown in Figure 10.
Figure 10: A part of user demands in Sheet 4.
From Algorithm 3, a service composition can be obtained, and created in Sheet 5. A part of service composition is shown in Figure 11.
Figure 11: A part of service composition.
(6) Comparison From Figure 11, the user demands can be
satisfied by the service composition based on the methods proposed in this paper. The result of service
Service Composition Based on Semantic Vocabulary
227
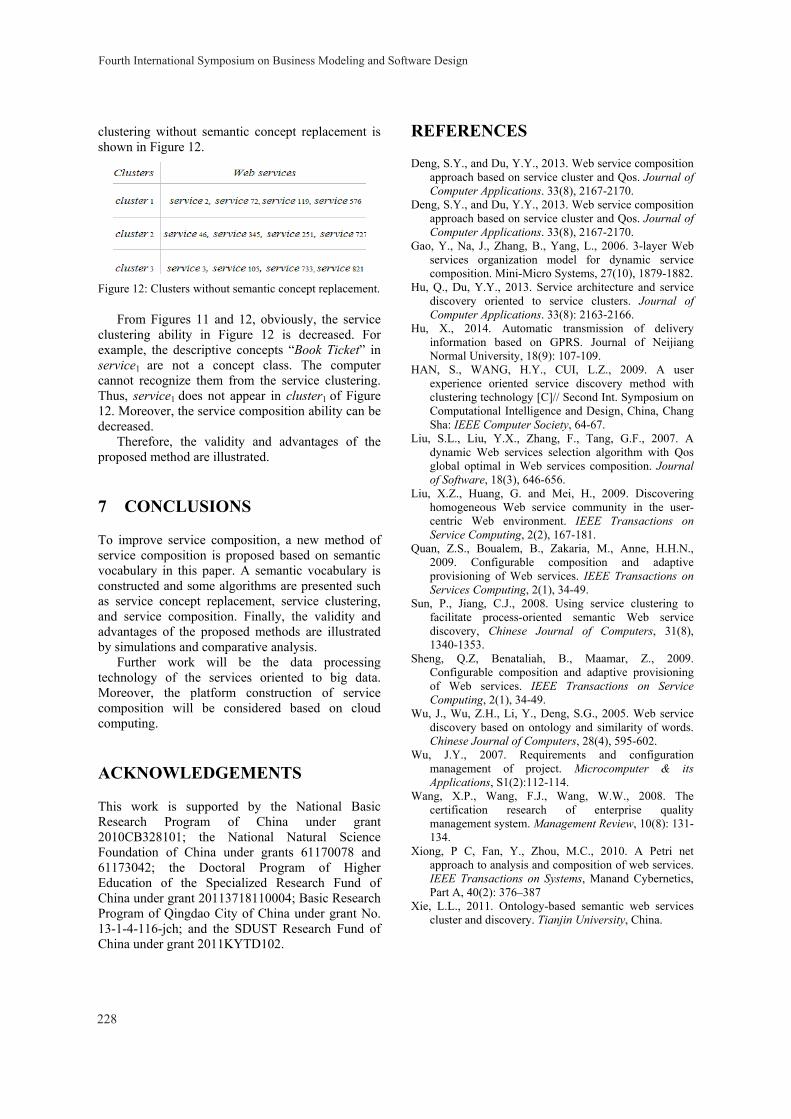
clustering without semantic concept replacement is shown in Figure 12.
Figure 12: Clusters without semantic concept replacement.
From Figures 11 and 12, obviously, the service clustering ability in Figure 12 is decreased. For example, the descriptive concepts “Book Ticket” in service1 are not a concept class. The computer cannot recognize them from the service clustering. Thus, service1 does not appear in cluster1 of Figure 12. Moreover, the service composition ability can be decreased.
Therefore, the validity and advantages of the proposed method are illustrated.
7 CONCLUSIONS
To improve service composition, a new method of service composition is proposed based on semantic vocabulary in this paper. A semantic vocabulary is constructed and some algorithms are presented such as service concept replacement, service clustering, and service composition. Finally, the validity and advantages of the proposed methods are illustrated by simulations and comparative analysis.
Further work will be the data processing technology of the services oriented to big data. Moreover, the platform construction of service composition will be considered based on cloud computing.
ACKNOWLEDGEMENTS
This work is supported by the National Basic Research Program of China under grant 2010CB328101; the National Natural Science Foundation of China under grants 61170078 and 61173042; the Doctoral Program of Higher Education of the Specialized Research Fund of China under grant 20113718110004; Basic Research Program of Qingdao City of China under grant No. 13-1-4-116-jch; and the SDUST Research Fund of China under grant 2011KYTD102.
REFERENCES
Deng, S.Y., and Du, Y.Y., 2013. Web service composition approach based on service cluster and Qos. Journal of Computer Applications. 33(8), 2167-2170.
Deng, S.Y., and Du, Y.Y., 2013. Web service composition approach based on service cluster and Qos. Journal of Computer Applications. 33(8), 2167-2170.
Gao, Y., Na, J., Zhang, B., Yang, L., 2006. 3-layer Web services organization model for dynamic service composition. Mini-Micro Systems, 27(10), 1879-1882.
Hu, Q., Du, Y.Y., 2013. Service architecture and service discovery oriented to service clusters. Journal of Computer Applications. 33(8): 2163-2166.
Hu, X., 2014. Automatic transmission of delivery information based on GPRS. Journal of Neijiang Normal University, 18(9): 107-109.
HAN, S., WANG, H.Y., CUI, L.Z., 2009. A user experience oriented service discovery method with clustering technology [C]// Second Int. Symposium on Computational Intelligence and Design, China, Chang Sha: IEEE Computer Society, 64-67.
Liu, S.L., Liu, Y.X., Zhang, F., Tang, G.F., 2007. A dynamic Web services selection algorithm with Qos global optimal in Web services composition. Journal of Software, 18(3), 646-656.
Liu, X.Z., Huang, G. and Mei, H., 2009. Discovering homogeneous Web service community in the user-centric Web environment. IEEE Transactions on Service Computing, 2(2), 167-181.
Quan, Z.S., Boualem, B., Zakaria, M., Anne, H.H.N., 2009. Configurable composition and adaptive provisioning of Web services. IEEE Transactions on Services Computing, 2(1), 34-49.
Sun, P., Jiang, C.J., 2008. Using service clustering to facilitate process-oriented semantic Web service discovery, Chinese Journal of Computers, 31(8), 1340-1353.
Sheng, Q.Z, Benataliah, B., Maamar, Z., 2009. Configurable composition and adaptive provisioning of Web services. IEEE Transactions on Service Computing, 2(1), 34-49.
Wu, J., Wu, Z.H., Li, Y., Deng, S.G., 2005. Web service discovery based on ontology and similarity of words. Chinese Journal of Computers, 28(4), 595-602.
Wu, J.Y., 2007. Requirements and configuration management of project. Microcomputer & its Applications, S1(2):112-114.
Wang, X.P., Wang, F.J., Wang, W.W., 2008. The certification research of enterprise quality management system. Management Review, 10(8): 131-134.
Xiong, P C, Fan, Y., Zhou, M.C., 2010. A Petri net approach to analysis and composition of web services. IEEE Transactions on Systems, Manand Cybernetics, Part A, 40(2): 376–387
Xie, L.L., 2011. Ontology-based semantic web services cluster and discovery. Tianjin University, China.
Fourth International Symposium on Business Modeling and Software Design
228
Reflecting on the Ambient Intelligence VisionA Cyber-Physical-Social Perspective
Olga Murdoch, Michael O’Grady, Rem Collier and Gregory M. P. O’HareCLARITY Centre for Sensor Web Technologies, University College Dublin, Belfield, Dublin 4, [email protected], [email protected], [email protected], [email protected]
Keywords: Ambient Intelligence, Cyber Physical Social Systems, Middleware, Web Technologies, Ubiquitous Comput-ing.
Abstract: By acquiring and reasoning about user and environmental context, Ambient Intelligence (AmI) systems enableintelligent and intuitive interactions between people and their physical environments. AmI traditionally seeksto build on ubiquitous sensing technologies and communications to acheive this aim. Over a decade later,people are frequently immersed in or engaged with alternative, software, environments, such as those providedas web applications or social networks. Now, to form more complete contextual representations of users, AmIsolutions require the context of multiple environments in which users may be immersed. This paper proposes amiddleware supported framework for cyber-physical-social AmI that relies on the combined efforts of modernweb technologies and ubiquitous computing as the enabling technologies.
1 INTRODUCTION
In a modern data-saturated world, knowledge andinference-driven systems integrate intelligence intoreal-time services and devices allowing for the pro-vision of diverse, self-adaptive, autonomous, person-alised and intelligent computing applications (Weiser,1991). This is the vision of ubiquitous computingresearch which aims to provide unobtrusive deploy-ments of technology enabling the provision of Ambi-ent Intelligent (AmI) solutions. AmI (Sadri, 2011) en-ables autonomous environments and, specifically, in-tuitive interaction through the provision of IntelligentUser Interfaces (IUIs) enabled by in-situ intelligenceand embedded decision making.
While Wireless Sensor Network (WSN) and asso-ciated middleware research focuses on enabling thisgoal, the World Wide Web (WWW) has become amodern day source of personal and informative, realtime and archival data. Through user participation insocial networks and use of personalised web services,the social web (Chi, 2008) has become an extensionof people’s everyday lives. Social and non-social websites provide real time reports of topical information,breaking news and environmental information such asweather reports and regional disaster alerts. Further-more, virtual and augmented reality research is be-ginning to enable real-time interactions with environ-ments that are very different to the physical world we
live in.Acknowledging these advances in technology re-
quires us to extend our understanding of context, envi-ronments and sensors. The enabling technologies forAmI must now accommodate modern environmentsand leverage advances in WWW research. Further,the implications of bridging the cyber-physical-socialdivide must be assessed so as not to limit user adop-tion of cyber-physical-social AmI solutions.
This paper summarises advances in UbiquitousComputing and the evolution of the World WideWeb (Section 2). We then reflect on the traditionalAmI vision (Section 3), offering a current perspec-tive on what we consider context, environments andsensors, and addressing the benefits and challengesof cyber-physical-social AmI. This analysis motivatesour proposed middleware-supported framework forcyber-physical-social AmI, which composes existingresearch efforts into a unified architecture (Section4). Conclusions and a research agenda are offered todeliver the foundations of cyber-physical-social AmI(Section 5).
2 THE WORLD WIDE WEB ANDUBIQUITOUS COMPUTING
The World Wide Web and Ubiquitous Computingare diverse yet converging areas of research, both of
229
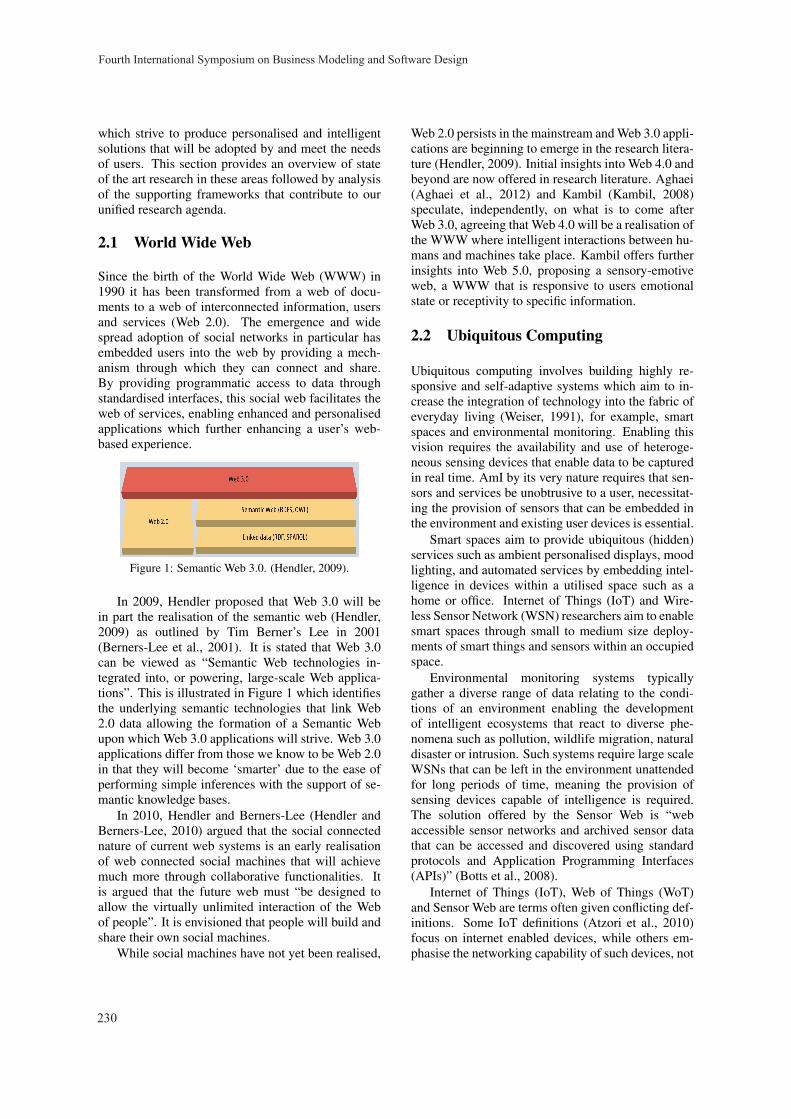
which strive to produce personalised and intelligentsolutions that will be adopted by and meet the needsof users. This section provides an overview of stateof the art research in these areas followed by analysisof the supporting frameworks that contribute to ourunified research agenda.
2.1 World Wide Web
Since the birth of the World Wide Web (WWW) in1990 it has been transformed from a web of docu-ments to a web of interconnected information, usersand services (Web 2.0). The emergence and widespread adoption of social networks in particular hasembedded users into the web by providing a mech-anism through which they can connect and share.By providing programmatic access to data throughstandardised interfaces, this social web facilitates theweb of services, enabling enhanced and personalisedapplications which further enhancing a user’s web-based experience.
Figure 1: Semantic Web 3.0. (Hendler, 2009).
In 2009, Hendler proposed that Web 3.0 will bein part the realisation of the semantic web (Hendler,2009) as outlined by Tim Berner’s Lee in 2001(Berners-Lee et al., 2001). It is stated that Web 3.0can be viewed as “Semantic Web technologies in-tegrated into, or powering, large-scale Web applica-tions”. This is illustrated in Figure 1 which identifiesthe underlying semantic technologies that link Web2.0 data allowing the formation of a Semantic Webupon which Web 3.0 applications will strive. Web 3.0applications differ from those we know to be Web 2.0in that they will become ‘smarter’ due to the ease ofperforming simple inferences with the support of se-mantic knowledge bases.
In 2010, Hendler and Berners-Lee (Hendler andBerners-Lee, 2010) argued that the social connectednature of current web systems is an early realisationof web connected social machines that will achievemuch more through collaborative functionalities. Itis argued that the future web must “be designed toallow the virtually unlimited interaction of the Webof people”. It is envisioned that people will build andshare their own social machines.
While social machines have not yet been realised,
Web 2.0 persists in the mainstream and Web 3.0 appli-cations are beginning to emerge in the research litera-ture (Hendler, 2009). Initial insights into Web 4.0 andbeyond are now offered in research literature. Aghaei(Aghaei et al., 2012) and Kambil (Kambil, 2008)speculate, independently, on what is to come afterWeb 3.0, agreeing that Web 4.0 will be a realisation ofthe WWW where intelligent interactions between hu-mans and machines take place. Kambil offers furtherinsights into Web 5.0, proposing a sensory-emotiveweb, a WWW that is responsive to users emotionalstate or receptivity to specific information.
2.2 Ubiquitous Computing
Ubiquitous computing involves building highly re-sponsive and self-adaptive systems which aim to in-crease the integration of technology into the fabric ofeveryday living (Weiser, 1991), for example, smartspaces and environmental monitoring. Enabling thisvision requires the availability and use of heteroge-neous sensing devices that enable data to be capturedin real time. AmI by its very nature requires that sen-sors and services be unobtrusive to a user, necessitat-ing the provision of sensors that can be embedded inthe environment and existing user devices is essential.
Smart spaces aim to provide ubiquitous (hidden)services such as ambient personalised displays, moodlighting, and automated services by embedding intel-ligence in devices within a utilised space such as ahome or office. Internet of Things (IoT) and Wire-less Sensor Network (WSN) researchers aim to enablesmart spaces through small to medium size deploy-ments of smart things and sensors within an occupiedspace.
Environmental monitoring systems typicallygather a diverse range of data relating to the condi-tions of an environment enabling the developmentof intelligent ecosystems that react to diverse phe-nomena such as pollution, wildlife migration, naturaldisaster or intrusion. Such systems require large scaleWSNs that can be left in the environment unattendedfor long periods of time, meaning the provision ofsensing devices capable of intelligence is required.The solution offered by the Sensor Web is “webaccessible sensor networks and archived sensor datathat can be accessed and discovered using standardprotocols and Application Programming Interfaces(APIs)” (Botts et al., 2008).
Internet of Things (IoT), Web of Things (WoT)and Sensor Web are terms often given conflicting def-initions. Some IoT definitions (Atzori et al., 2010)focus on internet enabled devices, while others em-phasise the networking capability of such devices, not
Fourth International Symposium on Business Modeling and Software Design
230
unlike the WSN’s that underpin Sensor Web research.This seems a natural progression from the IoT visionthat started in the RFID community where internetenabled devices are limited in computational capabil-ities. IoT researchers have since begun experiment-ing with more powerful devices or smart objects thatare capable of inter-device communication amongstother capabilities such as semantic reasoning and ac-tuation. Web of Things (WoT) research, which isseen as the next stage of the IoT, focusses on use ofemerging Web Standards to facilitate reuse of inter-net enabled devices. The Sensor Web (Delin, 2002)paradigm envisions connectivity of entities and usersin real and web-based environments through the adop-tion of large scale heterogeneous sensor-actuator net-works.
Such networks support intelligent sensing and ac-tuating sometimes through the embedding of agents(Tynan et al., 2005) sometimes even advocating Auto-nomic Wireless Sensor Networks (Marsh et al., 2004).They treat all entities as equal citizens regardless oftheir origin, form or nature (O’Hare et al., 2012).While IoT enabled applications described in researchtend to be ‘local’, such as smart spaces, Sensor Webresearchers strive to solve ‘global’ problems such asenvironmental monitoring and early warning systems.
2.3 Supporting Frameworks
Middleware and programming frameworks aim toease the process of developing and deploying systemsthat typically compete for resources and are depen-dent on complex underlying technologies. While thetwo terms are often used interchangably within re-search literature, here we provide a distinction. Mid-dleware frameworks ease and manage the deploymentof underlying technologies that enable data access andmanagement, and also facilitate application deploy-ment and access to resources. Programming frame-works enable rapid development of user-facing proto-types and applications through the provision of API’sthat enable abstracted access to the data managedby the middleware. An end-to-end support frame-work comprises both middleware and programmingtechnologies. Each of WWW, IoT, WSN, and Sen-sorWeb research domains employ such supportingframeworks to allow developers of user facing solu-tions to remain application domain experts, withoutconcern for the underlying infrastructure upon whichtheir application runs.
Given the nature of the current WWW, which canbe described as Web 2.0, a Social Web, and a Web ofServices, Service Oriented Architectures (SOA) havebecome widely adopted as the supporting framework
for Web application developers (Issarny et al., 2011).Service Oriented Middleware for the WWW usuallyfocuses on service discovery and composition (Mi-lanovic and Malek, 2004) while programming sup-port is typically provided through mashup tools thatallow developers use mutliple diverse services withina single application through an easy to use interface(Grammel and Storey, 2010). Cloud Computing in-frastructures have emerged as a powerful tool for sup-porting rapid deployment of services and applications(Armbrust et al., 2010).
Middleware and programming frameworks forubiquitous computing aim to ease the process of de-ploying, potentially large scale, WSNs, enabling de-velopers to build data-driven solutions without thelearning curve involved with network deploymentand programming. There is a wealth of middle-ware research in the broad ubiquitous computing andWSN domains (Raychoudhury et al., 2013) (Wanget al., 2008) (Hadim and Nader, 2006), much ofwhich provides solutions to distinct problems in spe-cific domains, or only supports the use of homoge-nous sensors. A generalised middleware for inher-ently heterogeneous environments was called for in2001 (Geihs, 2001); over a decade later, it has stillnot been realised. Due to the flexibility it offers interms of reusability, extensibility and interoperabil-ity of services, SOA is becomming a standard ap-proach for developing middleware solutions for theInternet of Things, WSN and Sensor Web research(Mohamed and Al-Jaroodi, 2011) (Chu and Buyya,2007). SOA partially overcomes the heterogeinityproblem bringing middleware researchers closer to re-alising a generic middleware solution for diverse sys-tems.
3 REFLECTING ON THE AmIVISION
Many of the developments described in the previoussections have occurred within the last decade. Inthe case of AmI, the question arises as to what arethe implications for paradigm itself and how or if itshould reinvent itself in light of these developments.While the challenges of WWW and ubiquitous com-puting research differ, research and developments intothe supporting frameworks for such systems are con-verging towards common, SOA, solutions and a sin-gle unifying framework is expected to emerge. Thedivide between WWW (cyber-social) and ubiquitouscomputing (physical-social) will be bridged, enablinga platform for cyber-physical-social AmI solutions.Bridging the cyber-physical-social divide is of benefit
Reflecting on the Ambient Intelligence Vision - A Cyber-Physical-Social Perspective
231
to the AmI paradigm. How it is accomplished must beaccommodating of the users that will adopt AmI tech-nologies and are core to the success of AmI research.Here we discuss cyber-physical-social context, envi-ronments and sensors and explore both the benefitsand challenges of bridging the cyber-physical-socialdivide within the context of AmI research.
3.1 Cyber-Physical-Social Context,Environments and Sensors
Context comprises any information that character-izes the situation of any person, place, or object thatis considered relevant to the interaction between auser and an application (Abowd et al., 1999). ForAmI, context is typically aquired through deploy-ments of ubiquitous sensing technologies monitoringusers, their immediate physical environment and thethings they interact with. In keeping with this defini-tion of context, cyber-physical-social AmI requires abroader understanding of environments and sensors.
An environment can be considered to be the geo-graphical location and immediate surroundings withinwhich a user or entity currently resides or equally thecyber (web-based/software) environment that a useror entity is engaged with or immersed in. ModernAmI users are increasingly likely to be immersed inenvironments alternative to the one they are physi-cally present in, such as social networks, games, e-commerce, and virtual/augmented reality. This mustbe accommodated by a sensing infrastructure en-abling cyber-physical-social AmI.
While sensors are typically defined by the featuresof the device that enable it to sense, here we refocuson the capabilities regardless of the form of the sen-sor. A cyber sensor is a software sensor that monitorsany programmatically accessible environment, user orentity (O’Grady et al., 2013). A sensor that is intel-ligent, as distinct from operating continuously in asense-transmit cycle, can monitor its own state andthat of connected sensors. It can also decide whenit is appropriate to report a phenomenon, reducingcommunication cost which can have a significant im-pact on the operational lifespan of a battery-poweredsensor, or reducing traffic to a server which is beingqueried by a cyber sensor. A supporting infrastructurefor cyber-physical-social AmI must treat cyber sen-sors and physical sensing devices as equal citizens.
3.2 Cyber-Physical-Social AmI:Challenges and Benefits
A core challenge for AmI has traditionally been useradoption of AmI solutions. The importance of intu-
itive interaction is as important now as it was whenWeiser proposed the original ubiquitous computingvision, yet remains a distant goal. In the case ofAmI, if the emphasis on the physical element, thatis ubiquitous computing, is augmented with a socialperspective, this may inform the behaviour of AmIsystems and make them more human-centric. Cyber-physical-social AmI solutions will be based on a morecomplete contextual foundation of its users than theknowledge base achievable through embedded sen-sors alone. Difficulties in assessing a user’s mood ormotivations will be addressed through the inclusionof a user’s real time social web presence within thesolution.
The traditional vision of calm computing encom-passes technologies that stay hidden and make deci-sions without any user input. Motivated by humanability to exploit their environments, Rogers (Rogers,2006) describes an alternative goal to Weiser’s calmcomputing that is engaging computing, shifting from‘proactive computing’ to supporting ‘proactive peo-ple’. It is also argued that we “simply don’t do ‘smart’well yet” (Greenfield, 2006), but perhaps that is be-cause we don’t have access to comprehensive histor-ical data for individual users such that a system maylearn to adapt appropriately. It is proposed here thatthe provision of engaging technologies is a necessarystep in the journey to ultimately providing calm com-puting. As users become more engaged with (andaccepting of) technology, they will learn to under-stand and trust in technological advances. Simulta-neously, researchers will learn what users are will-ing to accept from technology, both in terms of whattasks/decisions they are willing to hand over to auto-mated solutions and what level of control users de-mand over their own data. This intermediate stepbetween engaging and calm computing will facili-tate the organic growth of large user annotated datasets (aggregated through user interactions with tech-nology), providing a new historical knowledge baseupon which local, personalised, intelligent solutionscan become automated to suit AmI users.
While it is envisaged that middleware will bridgethe cyber-physical-social divide for AmI solutions, itmust be considered how that middleware will oper-ate. While services exist that facilitate the sharing ofWSN, or Internet of Things, data to the web, the pub-lication of private sensor data to an external data bro-ker will lead to concerns surrounding user privacy andownership of data. The idea that all user information,including that originating from sensors embedded inprivate environments, is managed by third party databrokers goes against modern social expectations andwill lead to resistance in terms of adopting these new
Fourth International Symposium on Business Modeling and Software Design
232
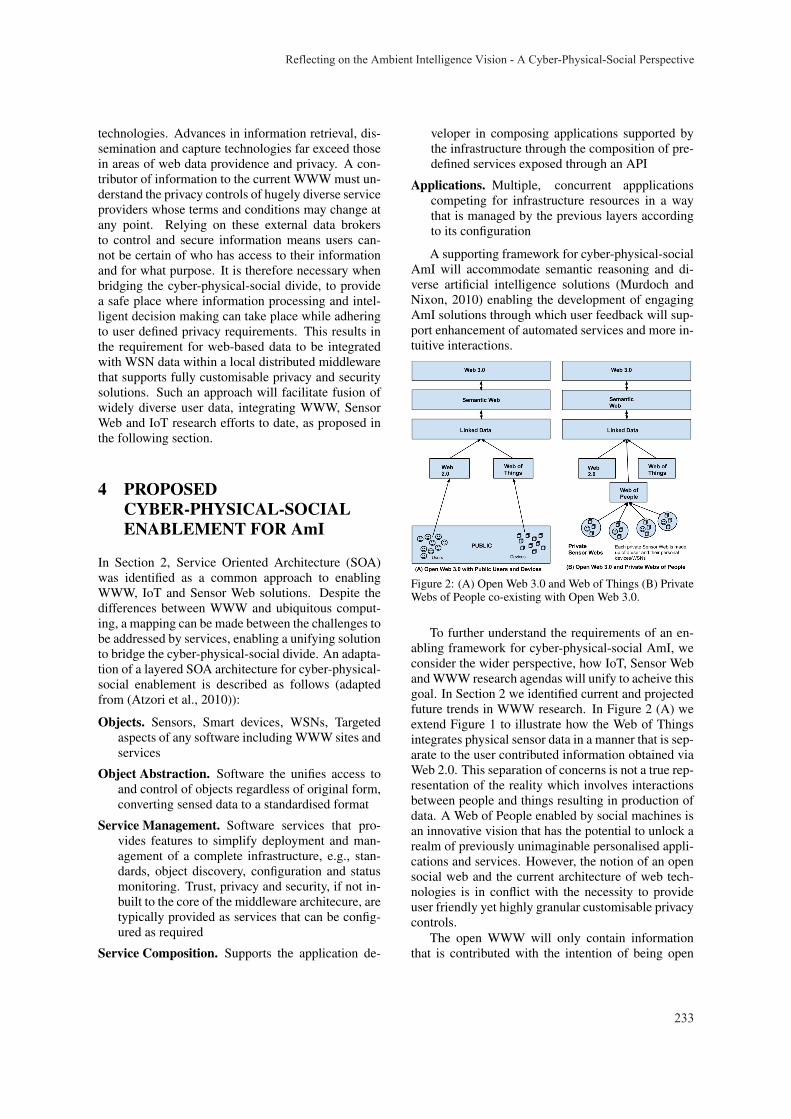
technologies. Advances in information retrieval, dis-semination and capture technologies far exceed thosein areas of web data providence and privacy. A con-tributor of information to the current WWW must un-derstand the privacy controls of hugely diverse serviceproviders whose terms and conditions may change atany point. Relying on these external data brokersto control and secure information means users can-not be certain of who has access to their informationand for what purpose. It is therefore necessary whenbridging the cyber-physical-social divide, to providea safe place where information processing and intel-ligent decision making can take place while adheringto user defined privacy requirements. This results inthe requirement for web-based data to be integratedwith WSN data within a local distributed middlewarethat supports fully customisable privacy and securitysolutions. Such an approach will facilitate fusion ofwidely diverse user data, integrating WWW, SensorWeb and IoT research efforts to date, as proposed inthe following section.
4 PROPOSEDCYBER-PHYSICAL-SOCIALENABLEMENT FOR AmI
In Section 2, Service Oriented Architecture (SOA)was identified as a common approach to enablingWWW, IoT and Sensor Web solutions. Despite thedifferences between WWW and ubiquitous comput-ing, a mapping can be made between the challenges tobe addressed by services, enabling a unifying solutionto bridge the cyber-physical-social divide. An adapta-tion of a layered SOA architecture for cyber-physical-social enablement is described as follows (adaptedfrom (Atzori et al., 2010)):
Objects. Sensors, Smart devices, WSNs, Targetedaspects of any software including WWW sites andservices
Object Abstraction. Software the unifies access toand control of objects regardless of original form,converting sensed data to a standardised format
Service Management. Software services that pro-vides features to simplify deployment and man-agement of a complete infrastructure, e.g., stan-dards, object discovery, configuration and statusmonitoring. Trust, privacy and security, if not in-built to the core of the middleware architecure, aretypically provided as services that can be config-ured as required
Service Composition. Supports the application de-
veloper in composing applications supported bythe infrastructure through the composition of pre-defined services exposed through an API
Applications. Multiple, concurrent appplicationscompeting for infrastructure resources in a waythat is managed by the previous layers accordingto its configuration
A supporting framework for cyber-physical-socialAmI will accommodate semantic reasoning and di-verse artificial intelligence solutions (Murdoch andNixon, 2010) enabling the development of engagingAmI solutions through which user feedback will sup-port enhancement of automated services and more in-tuitive interactions.
Figure 2: (A) Open Web 3.0 and Web of Things (B) PrivateWebs of People co-existing with Open Web 3.0.
To further understand the requirements of an en-abling framework for cyber-physical-social AmI, weconsider the wider perspective, how IoT, Sensor Weband WWW research agendas will unify to acheive thisgoal. In Section 2 we identified current and projectedfuture trends in WWW research. In Figure 2 (A) weextend Figure 1 to illustrate how the Web of Thingsintegrates physical sensor data in a manner that is sep-arate to the user contributed information obtained viaWeb 2.0. This separation of concerns is not a true rep-resentation of the reality which involves interactionsbetween people and things resulting in production ofdata. A Web of People enabled by social machines isan innovative vision that has the potential to unlock arealm of previously unimaginable personalised appli-cations and services. However, the notion of an opensocial web and the current architecture of web tech-nologies is in conflict with the necessity to provideuser friendly yet highly granular customisable privacycontrols.
The open WWW will only contain informationthat is contributed with the intention of being open
Reflecting on the Ambient Intelligence Vision - A Cyber-Physical-Social Perspective
233
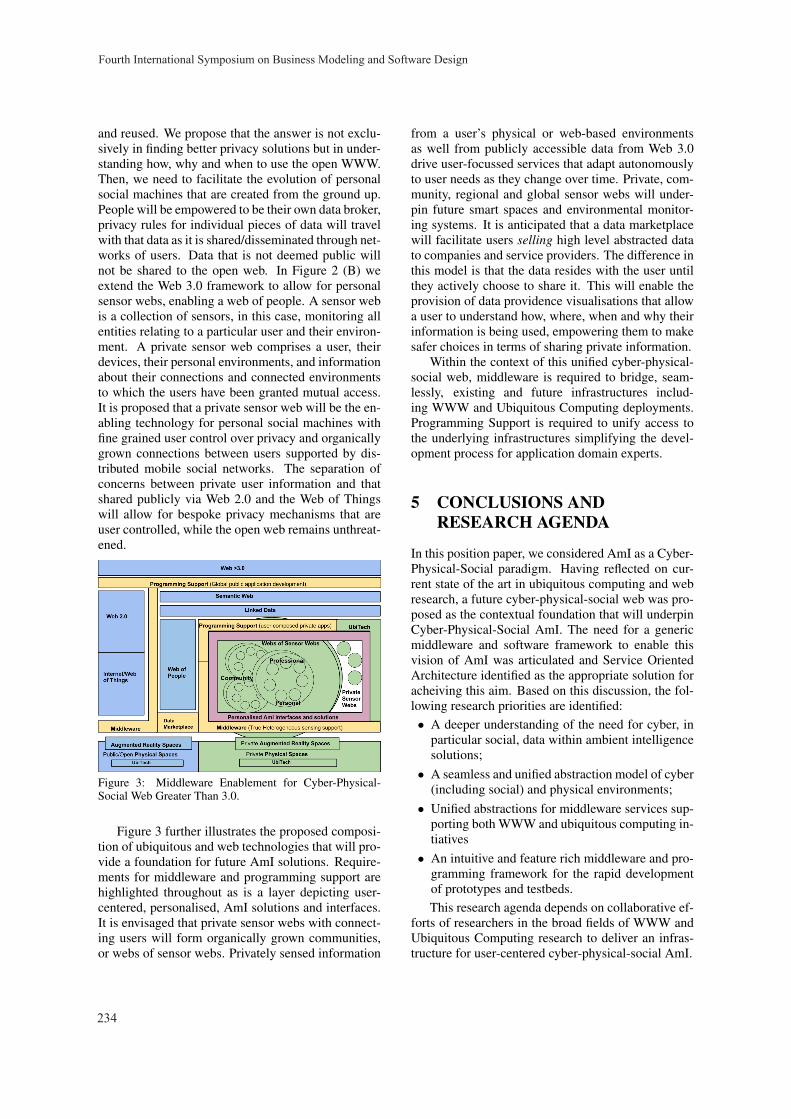
and reused. We propose that the answer is not exclu-sively in finding better privacy solutions but in under-standing how, why and when to use the open WWW.Then, we need to facilitate the evolution of personalsocial machines that are created from the ground up.People will be empowered to be their own data broker,privacy rules for individual pieces of data will travelwith that data as it is shared/disseminated through net-works of users. Data that is not deemed public willnot be shared to the open web. In Figure 2 (B) weextend the Web 3.0 framework to allow for personalsensor webs, enabling a web of people. A sensor webis a collection of sensors, in this case, monitoring allentities relating to a particular user and their environ-ment. A private sensor web comprises a user, theirdevices, their personal environments, and informationabout their connections and connected environmentsto which the users have been granted mutual access.It is proposed that a private sensor web will be the en-abling technology for personal social machines withfine grained user control over privacy and organicallygrown connections between users supported by dis-tributed mobile social networks. The separation ofconcerns between private user information and thatshared publicly via Web 2.0 and the Web of Thingswill allow for bespoke privacy mechanisms that areuser controlled, while the open web remains unthreat-ened.
Figure 3: Middleware Enablement for Cyber-Physical-Social Web Greater Than 3.0.
Figure 3 further illustrates the proposed composi-tion of ubiquitous and web technologies that will pro-vide a foundation for future AmI solutions. Require-ments for middleware and programming support arehighlighted throughout as is a layer depicting user-centered, personalised, AmI solutions and interfaces.It is envisaged that private sensor webs with connect-ing users will form organically grown communities,or webs of sensor webs. Privately sensed information
from a user’s physical or web-based environmentsas well from publicly accessible data from Web 3.0drive user-focussed services that adapt autonomouslyto user needs as they change over time. Private, com-munity, regional and global sensor webs will under-pin future smart spaces and environmental monitor-ing systems. It is anticipated that a data marketplacewill facilitate users selling high level abstracted datato companies and service providers. The difference inthis model is that the data resides with the user untilthey actively choose to share it. This will enable theprovision of data providence visualisations that allowa user to understand how, where, when and why theirinformation is being used, empowering them to makesafer choices in terms of sharing private information.
Within the context of this unified cyber-physical-social web, middleware is required to bridge, seam-lessly, existing and future infrastructures includ-ing WWW and Ubiquitous Computing deployments.Programming Support is required to unify access tothe underlying infrastructures simplifying the devel-opment process for application domain experts.
5 CONCLUSIONS ANDRESEARCH AGENDA
In this position paper, we considered AmI as a Cyber-Physical-Social paradigm. Having reflected on cur-rent state of the art in ubiquitous computing and webresearch, a future cyber-physical-social web was pro-posed as the contextual foundation that will underpinCyber-Physical-Social AmI. The need for a genericmiddleware and software framework to enable thisvision of AmI was articulated and Service OrientedArchitecture identified as the appropriate solution foracheiving this aim. Based on this discussion, the fol-lowing research priorities are identified:• A deeper understanding of the need for cyber, in
particular social, data within ambient intelligencesolutions;
• A seamless and unified abstraction model of cyber(including social) and physical environments;
• Unified abstractions for middleware services sup-porting both WWW and ubiquitous computing in-tiatives
• An intuitive and feature rich middleware and pro-gramming framework for the rapid developmentof prototypes and testbeds.This research agenda depends on collaborative ef-
forts of researchers in the broad fields of WWW andUbiquitous Computing research to deliver an infras-tructure for user-centered cyber-physical-social AmI.
Fourth International Symposium on Business Modeling and Software Design
234

ACKNOWLEDGEMENTS
This work is supported by Science Foundation Ireland(SFI) under grant 07/CE/11147 and the EU FP COB-WEB Project under grant no. 308513.
REFERENCES
Abowd, G. D., Dey, A. K., Brown, P. J., Davies, N., Smith,M., and Steggles, P. (1999). Towards a better under-standing of context and context-awareness. In Hand-held and ubiquitous computing. Springer.
Aghaei, S., Nematbakhsh, M. A., and Farsani, H. K. (2012).Evolution of the world wide web: From web 1.0 toweb 4.0. International Journal of Web & SemanticTechnology, 3(1).
Armbrust, M., Fox, A., Griffith, R., Joseph, A. D., Katz,R., Konwinski, A., Lee, G., Patterson, D., Rabkin, A.,Stoica, I., et al. (2010). A view of cloud computing.In Communications of the ACM. ACM.
Atzori, L., Iera, A., and Morabito, G. (2010). The internetof things: A survey. In Computer networks. Elsevier.
Berners-Lee, T., Hendler, J., and Lassila, O. (2001). Thesemantic web. Scientific American, 284(5):34–43.
Botts, M., Percivall, G., Reed, C., and Davidson, J. (2008).sensor web enablement: Overview and high level ar-chitecture. In GeoSensor networks. Springer.
Chi, E. H. (2008). The social web: Research and opportu-nities. IEEE Computer, 41(9):88–91.
Chu, X. and Buyya, R. (2007). Service oriented sensor web.In Sensor Networks and Configuration. Springer.
Delin, K. A. (2002). The sensor web: A macro-instrumentfor coordinated sensing. Sensors, 2(7):270–285.
Geihs, K. (2001). Middleware challenges ahead. IEEE com-puter, 34(6):24–31.
Grammel, L. and Storey, M.-A. (2010). A survey of mashupdevelopment environments. In The smart internet.Springer.
Greenfield, A. (2006). Everyware: The Dawning Age ofUbiquitous Computing. Peachpit Press.
Hadim, S. and Nader, M. (2006). Middleware: Middle-ware challenges and approaches for wireless sensornetworks. Distributed Systems Online, 7(3):1–1.
Hendler, J. (2009). Web 3.0 emerging. IEEE Computer,42(1):111–113.
Hendler, J. and Berners-Lee, T. (2010). From the semanticweb to social machines: A research challenge for aion the world wide web. Artif. Intell., 174(2):156–161.
Issarny, V., Georgantas, N., Hachem, S., and Zarras (2011).Service-oriented middleware for the future internet:state of the art and research directions. In Journal ofInternet Services and Applications. Springer.
Kambil, A. (2008). What is your web 5.0 strategy? InJournal of business strategy. Emerald Group Publish-ing Limited.
Marsh, D., Tynan, R., OKane, D., and P OHare,G. M. (2004). Autonomic wireless sensor networks.
Engineering Applications of Artificial Intelligence,17(7):741–748.
Milanovic, N. and Malek, M. (2004). Current solutions forweb service composition. In IEEE Internet Comput-ing. IEEE Educational Activities Department.
Mohamed, N. and Al-Jaroodi, J. (2011). A survey onservice-oriented middleware for wireless sensor net-works. Service Oriented Computing and Applications.
Murdoch, O. and Nixon, P. (2010). A unifying frameworkfor situation identification methodologies. MRC.
O’Grady, M. J., Murdoch, O., Kroon, B., Lillis, D., Carr, D.,Collier, R. W., and O’Hare, G. M. (2013). Pervasivesensing: Addressing the heterogeneity problem. InJournal of Physics: Conference Series, volume 450,page 012044. IOP Publishing.
O’Hare, G. M. P., Muldoon, C., O’Grady, M. J., Collier,R. W., Murdoch, O., and Carr, D. (2012). Sensor WebInteraction. International Journal on Artificial Intelli-gence Tools, 21(02):1240006.
Raychoudhury, V., Cao, J., Kumar, M., and Zhang, D.(2013). Middleware for pervasive computing: A sur-vey. Pervasive and Mobile Computing, 9(2):177–200.
Rogers, Y. (2006). Moving on from weiser’s vision of calmcomputing: Engaging ubicomp experiences. In Ubi-Comp 2006: Ubiquitous Computing, pages 404–421.Springer.
Sadri, F. (2011). Ambient intelligence: A survey. ACMComputing Surveys (CSUR), 43(4):36.
Tynan, R., Marsh, D., O’kane, D., and O’Hare, G. M.(2005). Intelligent agents for wireless sensor net-works. In Proceedings of the fourth international jointconference on Autonomous agents and multiagent sys-tems, pages 1179–1180. ACM.
Wang, M.-M., Cao, J.-N., Li, J., and Dasi, S. K. (2008).Middleware for wireless sensor networks: A sur-vey. Journal of computer science and technology,23(3):305–326.
Weiser, M. (1991). The computer for the 21st century. Sci-entific American, 265(3):94–104.
Reflecting on the Ambient Intelligence Vision - A Cyber-Physical-Social Perspective
235
Business Model Design An Evaluation of Paper-based and Computer-Aided Canvases
Boris Fritscher and Yves Pigneur Faculty of Business and Economics, University of Lausanne, 1015 Lausanne, Switzerland
[email protected], [email protected]
Keywords: Business Model Canvas, Computer-Aided Business Model Design, Guidelines.
Abstract: In recent years, Business Model Canvas design has evolved from being a paper-based activity to one that involves the use of dedicated computer-aided business model design tools. We propose a set of guidelines to help design more coherent business models. When combined with functionalities offered by CAD tools, they show great potential to improve business model design as an ongoing activity. However, in order to create complex solutions, it is necessary to compare basic business model design tasks, using a CAD system over its paper-based counterpart. To this end, we carried out an experiment to measure user perceptions of both solutions. Performance was evaluated by applying our guidelines to both solutions and then carrying out a comparison of business model designs. Although CAD did not outperform paper-based design, the results are very encouraging for the future of computer-aided business model design.
1 INTRODUCTION
In a fast-evolving business landscape, companies need to turn to new methods to help them rethink their business strategy. By using a Business Model Canvas (BMC), they can get a better picture of their current business model, as well as create new ones. These methods are gaining in popularity, leading to the creation of a range of tools to support them. Thus, BMC design has evolved from being a paper-based activity to being one that is supported by custom-built computer-aided business model design (CABMD) tools. Such tools provide functionalities that are similar to the paper experience, but offer additional options such as version handling and calculation. However, in order to give free rein to creativity, the tools tend to be open in nature, making them difficult to use in a structured environment in which software tools are used. This is especially the case if the application is expected to assist the model itself. Guidelines can help by capturing and encapsulating knowledge that has been collected from best practice. This knowledge can then be offered to users. Elaborating guidelines helps in the design of more coherent business models; in turn, this helps to improve the way in which CAD can support business model design. Nonetheless, all these advanced CAD tools, which are aimed at supporting the BMC, are worthless if
they hinder the creative-thinking process enabled by the paper version. However, if evaluation can show that a digital canvas is perceived and performs at least as well as a paper-based canvas, this promises great potential. For example, some features, such as automated guidelines validation, are only possible with digital tools.
The focus of this research can be summarized by the following questions:
Can guidelines help to produce a more coherent business model canvas?
How does using a computer-aided business model canvas design tool affect perception compared with using a paper-based version?
How does using a computer-aided business model canvas design tool affect performance compared with using a paper-based version?
In the next section we present any justificatory knowledge, followed by a short description of our methodology. We then present the guidelines themselves and the way in which they can be supported by CAD. Our evaluation also includes a business model case and an experiment aimed at comparing paper-based design with CAD. The results are presented, along with any lessons learned.
236
2 DESIGNING BUSINESS MODELS
According to Osterwalder and Pigneur (2013) there are three areas where IS research can contribute to strategic management. First, modelling at a strategic level requires a common language and representation. One business model visualization in particular is starting to be widely adopted by practitioners: the Business Model Canvas (BMC) (Osterwalder and Pigneur, 2010).
Second, the strategizing process should be seen as a design activity. Here, design means elicitation and testing; namely, the generation of ideas and their validation.
Third, they put forward the idea that CAD can “make tasks easier and quicker, while revealing as-yet-unseen opportunities” (Osterwalder and Pigneur, 2013).
For the purpose of our study, testing in business model terms represents two things: 1) coherence of the business model and 2) commercial viability of the business hypothesis. In this paper, we will focus on the former, since it can be addressed by CAD tools.
2.1 BMC Evaluation
The BMC design activity is usually a team effort that involves stakeholders across the company. A recent survey1 of 1,172 users confirmed that 74% of them carry out design in groups of 2 to 10 collaborators. Moreover, from research undertaken by Reinig (2003: 65), we know that “the satisfaction users have with the processes and outcomes of the teamwork itself often determines the ultimate adoption and sustained use of collaborative technologies”. Therefore, it is important to compare users’ perceptions of paper-based BMC with its computer-aided counterpart.
To date, few studies have sought to evaluate BMC design. However, Hoffmann et al. (2012) have shown that paper-based BMC design outperforms two other idea generation methods considerably. They noted that: “The ability to select the best idea was found to be much higher when groups worked with the business model canvas: 80 per cent of groups selected the best idea”. Their decision to limit their study to paper-based design was based on the extensive training and potentially expensive support systems required by electronic methods.
In their research, Lucassen et al. (2012) focused on how business model methods can be supported
1 Internal survey, Business Model Foundry GmbH 2012
by software. They came to the conclusion that, “BMC is the preferred method because it effectively models explicit information of both tangible and intangible aspects of the business and communicates this information in a highly accessible manner to parties unfamiliar with the modeling technique”. However, they did point out that there is still room for improvement, because of a lack of clarity in the modeling process. Furthermore, they pointed out that knowing when the model is sufficiently correct is not explicit. This sustains the relevance of providing better business model design guidelines.
3 A DESIGN SCIENCE APPROACH
In this study, we used the methodology put forward in design science research by Gregor and Hevner (2013). First, we explored how CAD can best support business modeling. This was carried out iteratively by building and evaluating prototypes. We also focused on the evaluation of the perception and performance of CAD business model design in comparison with paper-based design. We used existing artifacts such as the BMC and CABMD tools. Our evaluation has one particularity in that we chose to use a commercial instantiation of CABMD software. However, we did propose a new artifact in the form of guidelines, with the intention of making better use of them. The evaluation of this artifact is done by validity. Demonstrating that a coherent business model case can be created by following the guidelines.
4 TOOLS FOR BUSINESS MODEL DESIGN
To help in the design of a BMC we put forward guidelines, aimed at helping both the elicitation of new elements and the testing of coherence. These guidelines could then be transformed into actionable rules for use inside a CABMD tool.
4.1 BMC as a Paper-based Artifact
The BMC uses nine building blocks to represent a business model. These building blocks can be further grouped into four perspectives, as shown in table 1. The main perspective is the offer (what we do), which connects the client perspective (who we do it for) and the activity perspective (how we do it).
Business Model Design - An Evaluation of Paper-based and Computer-Aided Canvases
237
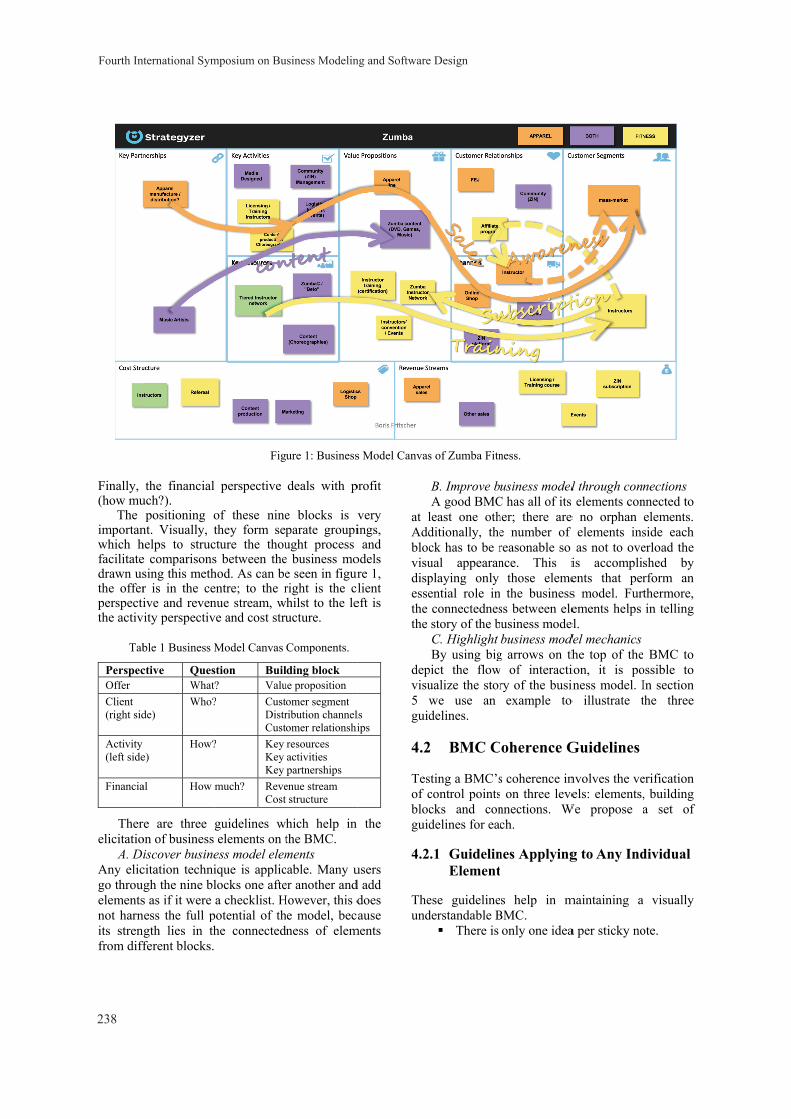
Finally, (how mu
The importanwhich hfacilitatedrawn usthe offerperspectithe activ
Tab
PerspecOffer Client (right sid
Activity (left side
Financia
Therelicitatio
A. DiAny elicgo throuelementsnot harnits strenfrom diff
the financialuch?). positioning o
nt. Visually, thelps to struce comparisonssing this methr is in the ceive and reven
vity perspectiv
ble 1 Business M
ctive QuesWhat
de) Who?
e) How?
al How
re are three on of business iscover businecitation techniugh the nine bls as if it were ness the full pngth lies in thfferent blocks.
Fig
perspective
of these ninethey form sep
cture the thous between thehod. As can beentre; to the rnue stream, wve and cost stru
Model Canvas
stion Buil? Valu? Cust
DistrCust
? Key Key Key
much? ReveCost
guidelines welements on t
ess model elemique is appliclocks one aftea checklist. H
potential of thhe connected
ure 1: Business
deals with p
e blocks is vparate groupiught process e business moe seen in figurright is the cl
whilst to the leucture.
Components.
lding block ue proposition omer segmentribution channelomer relationshiresources activities partnerships
enue stream structure
hich help in the BMC. ments cable. Many uer another andHowever, this dhe model, becaness of elem
s Model Canvas
profit
very ings, and
odels re 1, lient
eft is
ls ips
the
users d add does ause
ments
at lAddblocvisudispessethe the
depvisu5 wguid
4.2
Tesof cblocguid
4.2
Theund
s of Zumba Fitn
B. Improve bA good BMC
least one othditionally, theck has to be rual appearanplaying only ential role inconnectednesstory of the bC. Highlight By using big
pict the flowualize the storwe use an delines.
2 BMC C
sting a BMC’scontrol pointscks and condelines for eac
.1 GuidelinElement
ese guidelinederstandable B
There is
ness.
usiness modelC has all of its her; there are e number of reasonable so nce. This i
those elemethe business
ss between eleusiness modebusiness mod
g arrows on thw of interacti
ry of the businexample to
oherence G
s coherence in on three leve
nnections. Wch.
nes Applying
s help in mBMC.
only one idea
l through conns elements cone no orphan
elements insas not to ove
is accomplisents that pers model. Furtements helps
el. del mechanics he top of theion, it is poiness model. Io illustrate t
Guidelines
nvolves the veels: elements,
We propose a
g to Any Ind
maintaining a
a per sticky no
nections nnected to elements. side each erload the shed by rform an thermore, in telling
BMC to ossible to In section the three
erification , building a set of
dividual
visually
ote.
Fourth International Symposium on Business Modeling and Software Design
238

Ideas are written with keywords, or presented with a simple illustration.
The meaning of the element is understandable by all stakeholders.
The element is a key component in explaining the business model; indeed, without it the business model cannot be explained.
4.2.2 Guidelines Applying to Individual Building Blocks
These guidelines help to identify the right amount of detail for the BMC.
All nine building blocks of the model are used, or have at least been considered.
Elements that are too detailed have been grouped into a simpler element.
Elements that are too generic have been split into more detailed elements.
The detail level of the elements are adequate (there are not too many detailed elements, nor to few which are too generic).
4.2.3 Guidelines Applying to Connections between Elements in Different Building Blocks
These guidelines help with the coherence of the BMC.
Colors are used on elements to highlight their connections according to the BMC’s meta-model (Fritscher and Pigneur, 2010)
Each color is labeled and has a specific meaning.
Client perspective is valid: - Each customer segment is addressed by
one or more value proposition. - A channel supports a value proposition-
customer segment set. - If present, a customer relationship
targets a customer segment. - In case of multiple customer segments,
colors distinguish each business side. Activity perspective is valid:
- Each value proposition is produced/delivered by a key activity, a key partner or offers a key resource.
- Key resources or key partners support an activity.
Financial perspective is valid: - Revenue stream is generated from a
value proposition-customer segment set. (A revenue stream can also be “free”).
- Major fixed costs are listed. - Major variables costs are listed.
There are no orphan elements: all elements are connected to another element (in a different block to themselves).
4.3 BMC Computer-Aided Design
Multiple versions of BMC prototypes can be found, as well as commercial versions. Research prototypes emphasize advanced features; however, they lack finesse in user experience. In order to make the best comparison between a paper-based BMC and a digital implementation, we chose to use Strategyzer, a commercial version that is closest to the original paper-based BMC. This commercial software solution not only has a proven user-friendly interface, it has the added advantage of being inspired by the same original artifact ideas as our research prototypes. Another benefit is that it has calculation features which sit on top of the basic functionality features, showing that integration is possible without compromising the simplicity of the user interface.
When Computer Aided Design (CAD) is applied to the BMC, it can support elicitation by making it easier to move, duplicate and rename elements. Thanks to its digital properties, elements can also be hidden and shown selectively, allowing for multiple views of the same data. This enables the exploration of business model variants, thereby further aiding the elicitation process.
Beyond visual interactions, such software tools can be used to support business model design with features that are tailored to guarantee the coherence of the meta-model on which they are built. Guidelines can be transformed into rules, which can then be tested by the tool. In case of incoherence, a notification is shown on any invalid elements. Such visual flags can, in addition, contain hints on how to fix the problem or, at the very least, offer a reference as to which rule or guideline was violated. The computation is carried out automatically; thus, visual flags appear as soon as something changes.
Guidelines allow a coherence score to be attributed to each model; this score is based on the number of fulfilled conditions.
4.3.1 Example Guideline Transformed into Rules and Resolution Hints
Rule 1: There are not more than a specified number (given by a threshold) of customer segment elements with the same color.
Business Model Design - An Evaluation of Paper-based and Computer-Aided Canvases
239
Resolution Hint: Either merge elements that are too detailed (building block guideline) or change colors of element belonging to a different value proposition to distinguish the segments (connection guideline). Rule 2: A customer segment has to have a corresponding value proposition element with the same color as itself. Resolution Hint: Create missing elements or add right colors.
5 COMPARING COMPUTER-AIDED DESIGN WITH PAPER-BASED DESIGN
The focus of our evaluation is to compare a paper-based BMC with one created using a computer-aided design tool in terms of perception and performance. In this section, we first present how we created a business model for Zumba Fitness following our guidelines. We then go on to present the experimental setup, followed by the results and statistics.
5.1 Zumba Fitness Business Model
This case is used to illustrate how to apply our elicitation guidelines when designing the Zumba Fitness business model using publicly available information (as shown in figure 1). Zumba Fitness is a company that offers fitness training to instructors (yellow) and sells fitness apparel (orange) to the mass market. Separate colors were used for each type of offering. Elements that are affected by both value propositions are shown in violet.
A. Discover Business Model Elements The discovery of elements, which can be added to any of the building blocks, can come from internal knowledge, interview, observation or indeed any kind of research method. However, it is crucial to move from one idea to the next without limiting oneself to one block at a time. Our main source of information for this case study was a six-page report by Inc magazine2 and a video interview featuring one of the company’s founders.
As should be the case for any presentation of the BMC, we will first present the elements as a story, instead of going through the blocks one at a time.
2 http://www.inc.com/magazine/201212/leigh-buchanan/ zumba-fitness-company-of-the-year-2012.html
Zumba Fitness offers Instructor training to the instructors customer segment with the help of their online ZIN platform and gyms. Giving courses generates licensing/training revenues. A second revenue stream from instructors is a subscription to the ZIN network. This offer (value proposition) gives the instructors access to new Zumba content which they can use in their own Zumba classes. To provide the aforementioned value propositions, a number of key activities have to be performed, including training, ZIN community management and creation of new content (choreography).
Another customer segment is the mass market, namely, people who buy apparel from the online shop, thus generating sales revenue.
B. Improve Business Model through Connections With any BMC, it is important to check the connections between the elements. This helps to identify any missing elements. It can also lead us to question the validity of elements if no connection to other elements can be found.
Continuing with our example, although fitness apparel is sold, its source is missing. Therefore, for coherence, manufacturing & distribution partners had to be added, as well as a logistics and media design activity, and the cost structure of a logistics shop.
The content creation activity produces new choreographies, not only as a value proposition, but also as a new resource. However, to produce such choreographies, the company also needed music artists; these become a new partner element. The creation of content (content production) is also a major cost in the business model. An additional resource, which gives value to their content, is the Zumba brand name.
C. Highlight Business Model Mechanics Business Model mechanics help to visually illustrate major interactions between elements on the BMC. The flow of the interaction is depicted by large arrows, which connect the elements. Thinking about the mechanics and the story behind it will help reveal additional element interaction, which may not emerge when looking only at individual elements.
This case is particularly interesting, because a series of mechanics helps to reveal that instructors are also a channel. Zumba starts by training/certifying instructors; a major percentage of these instructors will then subscribe to the Zumba Instructor Network. A certified instructor goes on to give Zumba courses and naturally starts to promote
Fourth International Symposium on Business Modeling and Software Design
240
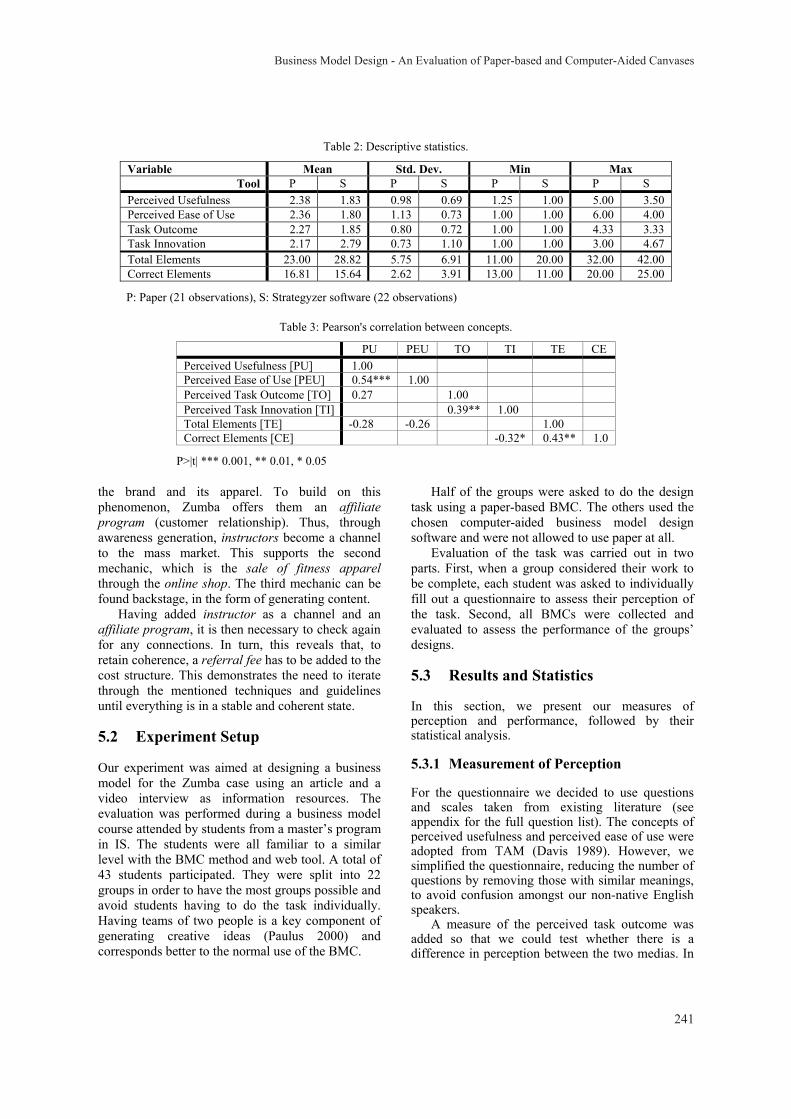
Table 2: Descriptive statistics.
Variable Mean Std. Dev. Min Max Tool P S P S P S P S
Perceived Usefulness 2.38 1.83 0.98 0.69 1.25 1.00 5.00 3.50 Perceived Ease of Use 2.36 1.80 1.13 0.73 1.00 1.00 6.00 4.00 Task Outcome 2.27 1.85 0.80 0.72 1.00 1.00 4.33 3.33 Task Innovation 2.17 2.79 0.73 1.10 1.00 1.00 3.00 4.67 Total Elements 23.00 28.82 5.75 6.91 11.00 20.00 32.00 42.00 Correct Elements 16.81 15.64 2.62 3.91 13.00 11.00 20.00 25.00
P: Paper (21 observations), S: Strategyzer software (22 observations)
Table 3: Pearson's correlation between concepts.
PU PEU TO TI TE CE Perceived Usefulness [PU] 1.00 Perceived Ease of Use [PEU] 0.54*** 1.00 Perceived Task Outcome [TO] 0.27 1.00 Perceived Task Innovation [TI] 0.39** 1.00 Total Elements [TE] -0.28 -0.26 1.00 Correct Elements [CE] -0.32* 0.43** 1.0
P>|t| *** 0.001, ** 0.01, * 0.05
the brand and its apparel. To build on this phenomenon, Zumba offers them an affiliate program (customer relationship). Thus, through awareness generation, instructors become a channel to the mass market. This supports the second mechanic, which is the sale of fitness apparel through the online shop. The third mechanic can be found backstage, in the form of generating content.
Having added instructor as a channel and an affiliate program, it is then necessary to check again for any connections. In turn, this reveals that, to retain coherence, a referral fee has to be added to the cost structure. This demonstrates the need to iterate through the mentioned techniques and guidelines until everything is in a stable and coherent state.
5.2 Experiment Setup
Our experiment was aimed at designing a business model for the Zumba case using an article and a video interview as information resources. The evaluation was performed during a business model course attended by students from a master’s program in IS. The students were all familiar to a similar level with the BMC method and web tool. A total of 43 students participated. They were split into 22 groups in order to have the most groups possible and avoid students having to do the task individually. Having teams of two people is a key component of generating creative ideas (Paulus 2000) and corresponds better to the normal use of the BMC.
Half of the groups were asked to do the design task using a paper-based BMC. The others used the chosen computer-aided business model design software and were not allowed to use paper at all.
Evaluation of the task was carried out in two parts. First, when a group considered their work to be complete, each student was asked to individually fill out a questionnaire to assess their perception of the task. Second, all BMCs were collected and evaluated to assess the performance of the groups’ designs.
5.3 Results and Statistics
In this section, we present our measures of perception and performance, followed by their statistical analysis.
5.3.1 Measurement of Perception
For the questionnaire we decided to use questions and scales taken from existing literature (see appendix for the full question list). The concepts of perceived usefulness and perceived ease of use were adopted from TAM (Davis 1989). However, we simplified the questionnaire, reducing the number of questions by removing those with similar meanings, to avoid confusion amongst our non-native English speakers.
A measure of the perceived task outcome was added so that we could test whether there is a difference in perception between the two medias. In
Business Model Design - An Evaluation of Paper-based and Computer-Aided Canvases
241
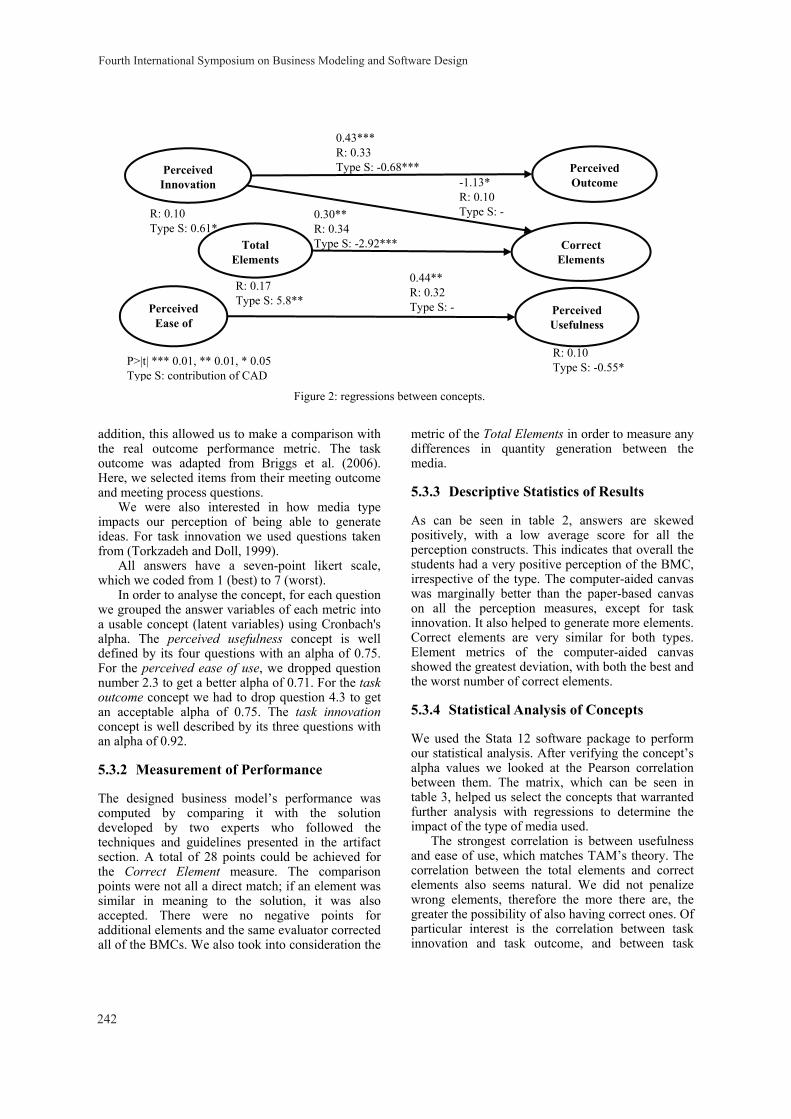
addition, this allowed us to make a comparison with the real outcome performance metric. The task outcome was adapted from Briggs et al. (2006). Here, we selected items from their meeting outcome and meeting process questions.
We were also interested in how media type impacts our perception of being able to generate ideas. For task innovation we used questions taken from (Torkzadeh and Doll, 1999).
All answers have a seven-point likert scale, which we coded from 1 (best) to 7 (worst).
In order to analyse the concept, for each question we grouped the answer variables of each metric into a usable concept (latent variables) using Cronbach's alpha. The perceived usefulness concept is well defined by its four questions with an alpha of 0.75. For the perceived ease of use, we dropped question number 2.3 to get a better alpha of 0.71. For the task outcome concept we had to drop question 4.3 to get an acceptable alpha of 0.75. The task innovation concept is well described by its three questions with an alpha of 0.92.
5.3.2 Measurement of Performance
The designed business model’s performance was computed by comparing it with the solution developed by two experts who followed the techniques and guidelines presented in the artifact section. A total of 28 points could be achieved for the Correct Element measure. The comparison points were not all a direct match; if an element was similar in meaning to the solution, it was also accepted. There were no negative points for additional elements and the same evaluator corrected all of the BMCs. We also took into consideration the
metric of the Total Elements in order to measure any differences in quantity generation between the media.
5.3.3 Descriptive Statistics of Results
As can be seen in table 2, answers are skewed positively, with a low average score for all the perception constructs. This indicates that overall the students had a very positive perception of the BMC, irrespective of the type. The computer-aided canvas was marginally better than the paper-based canvas on all the perception measures, except for task innovation. It also helped to generate more elements. Correct elements are very similar for both types. Element metrics of the computer-aided canvas showed the greatest deviation, with both the best and the worst number of correct elements.
5.3.4 Statistical Analysis of Concepts
We used the Stata 12 software package to perform our statistical analysis. After verifying the concept’s alpha values we looked at the Pearson correlation between them. The matrix, which can be seen in table 3, helped us select the concepts that warranted further analysis with regressions to determine the impact of the type of media used.
The strongest correlation is between usefulness and ease of use, which matches TAM’s theory. The correlation between the total elements and correct elements also seems natural. We did not penalize wrong elements, therefore the more there are, the greater the possibility of also having correct ones. Of particular interest is the correlation between task innovation and task outcome, and between task
Perceived Innovation
Perceived Ease of
Perceived Usefulness
Total Elements
Perceived Outcome
Correct Elements
P>|t| *** 0.01, ** 0.01, * 0.05 Type S: contribution of CAD
0.43*** R: 0.33 Type S: -0.68***
0.44** R: 0.32 Type S: -
0.30** R: 0.34 Type S: -2.92***
-1.13* R: 0.10 Type S: -
R: 0.10 Type S: -0.55*
R: 0.10 Type S: 0.61*
R: 0.17 Type S: 5.8**
Figure 2: regressions between concepts.
Fourth International Symposium on Business Modeling and Software Design
242
innovation and correct elements, which represents the real outcome. We explore these relations further in the discussion.
6 LESSONS FROM THE COMPARISON
A regression analysis was used on the variables for which correlations stood out. The results are shown in figure 2. Only links with significant regression results are shown. Type S is the contribution of using the computer-aided software BMC over the paper-based BMC. As already observed, with the mean values, perceived innovation is slightly better with the paper-based BMC, but the R-square value is only 0.10. On the other hand, perceived innovation strongly predicts perceived outcome. Users of the digital BMC perceived that it helped them do a better job more than did the users of the paper-based BMC. Perceived innovation slightly predicts real outcome (correct elements), without a difference between types.
On its own, perceived usefulness is seen as being better with the digital tool. This could be a bias of the population of IS students who are familiar with IT technology and might prefer a technical solution to one that uses paper.
There is no significant difference between the type that affected the influence of perceived ease of use over perceived usefulness. This can be seen as a positive result for the software tools, because it does not perform better or worse. Having at least the same ease of use as paper is a key result, which should be reflected upon when considering that the digital tool has the potential of offering additional features, providing usefulness that is not possible on paper.
The computer-aided BMC helps to generate more elements than a paper-based one; however, it also has a negative influence on the number of correct elements. It is easier to generate more elements, but also to generate more wrong elements.
Users who think that the digital tool helps them innovate, think they have performed better; however, in our small setup they obtained similar numbers of correct elements.
In addition to the statistical analysis, we also observed how the teams worked during the design task. One observation that is of particular interest relates to the process of eliciting elements. On the paper-based BMC, a discussion first occurs and then a sticky note element is created and positioned. On the computer-aided BMC, however, which also
supports collaboration, elements are added first by each member and then changed to reflect the consensus. This is interesting because recording the decision inside the tool means that it can be utilized to better support the ongoing business modeling collaboration process.
Three weeks after the first task, we carried out a trial experiment with the coherence guidelines using paper. The results were varied and inconclusive, although users did say it helped them improve their model. Problems arose when attempting to test them on paper. In this situation, users have to perform the checks manually; in some instances, they do not take the time to iteratively do it as soon as they change something. Therefore we posit that although we showed that guidelines can be used to create coherent models on paper, it is more appropriate for such guidelines to be implemented and tested inside a prototype tool. Here, they can be recomputed each time a change is detected.
In summary, in our experiment with our test group, the tested CAD tool was as effective as paper-based design for the creation of business models in terms of eliciting elements of the BMC. This indicates that with the help of rules, it might be better suited for testing the coherence of business models than paper-based design.
7 CONCLUSIONS
To assist BMC design using software tools, we proposed guidelines that help with elicitation and testing in order to produce coherent models. Before implementing such features in a digital tool we needed to confirm that perception and performance on a basic BMC design task are at least similar to those of a paper-based design. With our evaluation we found that the tested digital tools can be perceived as useful, and does not perform any worse than its paper-based alternative. Even if CABMD did not outperform paper-based design, it shows some promising results, because such tools can be extended to offer additional features, thus increasing their usefulness. Features that are much better suited for digital tools include the continuous reviewing of coherence rules to check their validity.
In this paper, we focused on modeling an existing “as-is”, business model. Further research is needed to explore options that may enable the exploration of future “to-be”, business models. For example, rules could be extended to simulate financial assumption or validate regulatory constraints.
Business Model Design - An Evaluation of Paper-based and Computer-Aided Canvases
243

REFERENCES
Briggs, R. O., Reinig, B. A., & de Vreede, G. J. (2006). Meeting Satisfaction for Technology-Supported Groups an Empirical Validation of a Goal-Attainment Model. Small Group Research, 37(6), 585-611.
Davis, F. D. (1989). Perceived usefulness, perceived ease of use, and user acceptance of information technology. MIS quarterly, 319-340.
Fritscher, B., & Pigneur, Y. (2010). Supporting Business Model Modelling: A Compromise between Creativity and Constraints. Task Models and Diagrams for User Interface, (LNCS 5963), 28–43.
Gregor, S., & Hevner, A. R. (2013). Positioning and Presenting Design Science Research for Maximum Impact. MIS Quarterly, 37(2).
Hoffmann, F., Eppler, M. J., & Bresciani, S. (2012). Business Model Ideation: An Experimental Approach for the Evaluation of Team-based Methods. 12th EURAM 2012 European School of Management
Lucassen, G., Brinkkemper, S., Jansen, S., & Handoyo, E. (2012). Comparison of visual business modeling techniques for software companies. In Software Business (pp. 79-93). Springer Berlin Heidelberg.
Osterwalder, A., & Pigneur, Y. (2010). Business model generation: a handbook for visionaries, game changers, and challengers. John Wiley & Sons.
Osterwalder, A., & Pigneur, Y. (2013). Designing Business Models and Similar Strategic Objects: The Contribution of IS. Journal of the Association for Information Systems, 14.
Paulus, P. (2000). Groups, Teams, and Creativity: The Creative Potential of Idea-generating Groups. Applied psychology, 49(2), 237-262.
Reinig, B. A. (2003). Toward an understanding of satisfaction with the process and outcomes of teamwork. Journal of Management Information Systems, 19(4), 65-84.
Torkzadeh, G., & Doll, W. J. (1999). The development of a tool for measuring the perceived impact of information technology on work. Omega, 27(3), 327-339.
APPENDIX
The following questionnaire was used for our survey, either using Strategyzer or the paper canvas as subject.
Based on your short experience with Strategyzer, how would you rate the following statements when thinking about using Strategyzer for future Business Model Design Tasks?
The following seven point Likert scale was used: extremely likely (1), quite likely (2), slightly likely (3), neither (4), slightly unlikely (5), quite unlikely (6) extremely unlikely (7)
1 Perceived Usefulness 1.1 Using Strategyzer to design business model
would enable me to accomplish the task more quickly.
1.2 Using Strategyzer would improve my performance in designing business models.
1.3 Using Strategyer would make it easier to design business models.
1.4 I would find Strategyzer useful fordesigning business models.
2 Perceived Ease of Use
2.1 Learning to operate Strategyzer to design business models would be easy for me.
2.2 I would find it easy to get Strategyzer to do what I want it to do.
2.3 It would be easy for me to become skillful at using Strategyzer to design business models.
The following seven point Likert scale was used
for the next two sections: strongly agree (1), agree somewhat (2), agree (3), neither (4), somewhat disagree (5), disagree (6), strongly disagree (7)
Now evaluate your business model design task. 3 Task Outcome
3.1 I feel satisfied with the designed business model.
3.2 I feel satisfied with the process used to design the business model.
3.3 With more time I could substantially improve the designed business model.
3.4 I had enough time to complete the task. 4 Task Innovation
4.1 Strategyzer helps me create new ideas.4.2 Strategyzer helps me come up with new
ideas.4.3 Strategyzer helps me try out innovative
ideas.
Fourth International Symposium on Business Modeling and Software Design
244
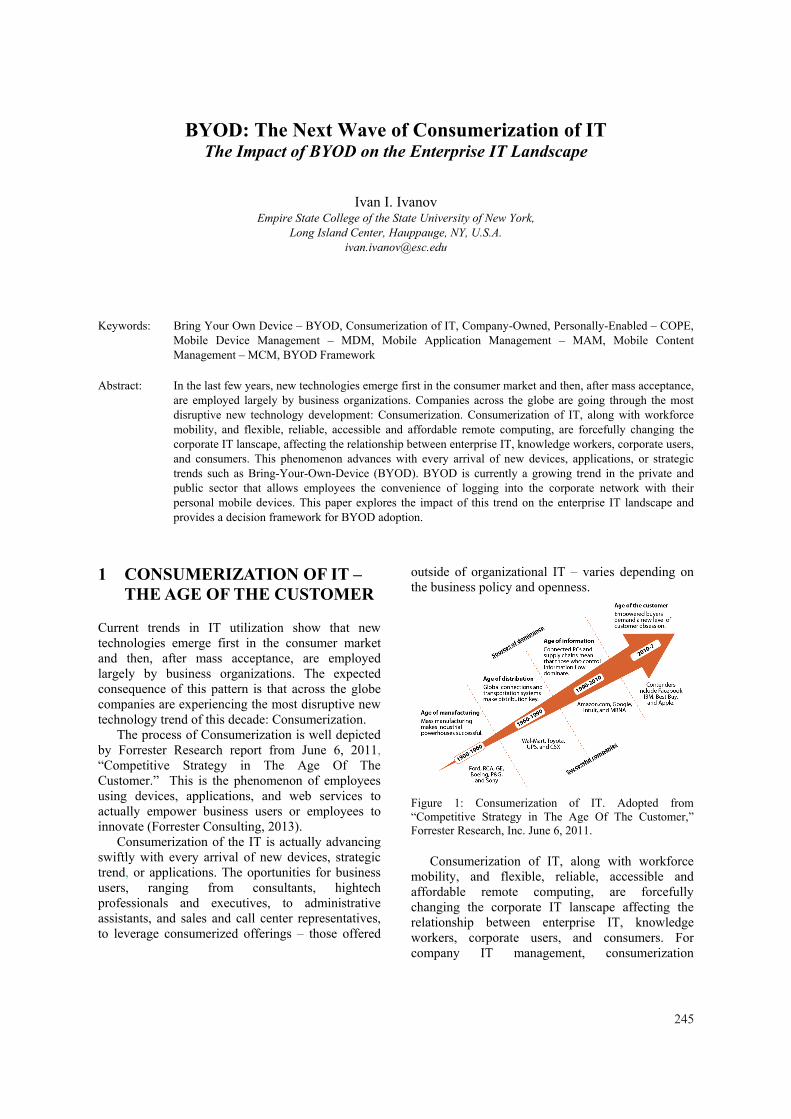
BYOD: The Next Wave of Consumerization of IT The Impact of BYOD on the Enterprise IT Landscape
Ivan I. Ivanov Empire State College of the State University of New York,
Long Island Center, Hauppauge, NY, U.S.A. [email protected]
Keywords: Bring Your Own Device – BYOD, Consumerization of IT, Company-Owned, Personally-Enabled – COPE, Mobile Device Management – MDM, Mobile Application Management – MAM, Mobile Content Management – MCM, BYOD Framework
Abstract: In the last few years, new technologies emerge first in the consumer market and then, after mass acceptance, are employed largely by business organizations. Companies across the globe are going through the most disruptive new technology development: Consumerization. Consumerization of IT, along with workforce mobility, and flexible, reliable, accessible and affordable remote computing, are forcefully changing the corporate IT lanscape, affecting the relationship between enterprise IT, knowledge workers, corporate users, and consumers. This phenomenon advances with every arrival of new devices, applications, or strategic trends such as Bring-Your-Own-Device (BYOD). BYOD is currently a growing trend in the private and public sector that allows employees the convenience of logging into the corporate network with their personal mobile devices. This paper explores the impact of this trend on the enterprise IT landscape and provides a decision framework for BYOD adoption.
1 CONSUMERIZATION OF IT – THE AGE OF THE CUSTOMER
Current trends in IT utilization show that new technologies emerge first in the consumer market and then, after mass acceptance, are employed largely by business organizations. The expected consequence of this pattern is that across the globe companies are experiencing the most disruptive new technology trend of this decade: Consumerization.
The process of Consumerization is well depicted by Forrester Research report from June 6, 2011, “Competitive Strategy in The Age Of The Customer.” This is the phenomenon of employees using devices, applications, and web services to actually empower business users or employees to innovate (Forrester Consulting, 2013).
Consumerization of the IT is actually advancing swiftly with every arrival of new devices, strategic trend, or applications. The oportunities for business users, ranging from consultants, hightech professionals and executives, to administrative assistants, and sales and call center representatives, to leverage consumerized offerings – those offered
outside of organizational IT – varies depending on the business policy and openness.
Figure 1: Consumerization of IT. Adopted from “Competitive Strategy in The Age Of The Customer,” Forrester Research, Inc. June 6, 2011.
Consumerization of IT, along with workforce mobility, and flexible, reliable, accessible and affordable remote computing, are forcefully changing the corporate IT lanscape affecting the relationship between enterprise IT, knowledge workers, corporate users, and consumers. For company IT management, consumerization
245
exemplifies the convergence of a demanding set of challenges such as information and infrastructure security, technology policy, data protection, and end-user technology. For corporate management, consumerization of IT signifies a new strategy which supports business models and process innovations, talent strategy and customers’ satisfaction, as well as corporate brand and identity.
Consumerization of IT blurs the line between personal and work life, especially for mobile workers. Mobile workers make up about 39% of the employees in Noth America, 25% in Europe, and 42% in Asia, with a growing tendency according to Forrester’s analysis (Forrester Consulting, 2013). Their cohort benefits the business immensely by increasing productivity, and advancing collaboration and business agility, thereby improving customer satisfaction and climbing the rate of talent retention. Consumerized employees spread the boundaries of the workday and workplace, and it is fair to name them “anytime, anywhere workers.”
2 BYOD – OPPORTUNITIES, CHALLENGES, GAINS
BYOD, or Bring-Your-Own-Device, is a growing trend in the private and public sector that allows employees the convenience of logging into the corporate network with their own personal devices. The rise of the mobile workforce to 1.2 billion in 2013, representing 35% of the worldwide workforce according to IDC Forecast, drives strongly the BYOD initiative as many of those workers will be using their own devices (International Data Corporation IDC, 2012).
The BYOD trend, as it is driven mostly by current Consumerization of IT in the enterpise, is forcing companies to redesign or create new policy and rules on how smart portable devices can be used for both corporate and private purposes, and how the related expenditures should be covered.
2.1 BYOD as Mobile Workforce Advancement
BYOD can be facilitated through applications that are native to the device, downloaded or installable applications, or even a mobile web browser. The BYOD boom originated via two converging trends: the need for employees to be responsive in a global, always-connected world, and the desire to save
money by not replicating a device that employees may already own.
BYOD eliminates time boundaries, allowing employees to be productive during and after working hours. It offers flexibility, allowing them the ability to be connected to the corporate network and do some work, for example, during a child’s baseball game in the afternoon as well as later in the evening. While BYOD offers flexibility and efficiencies, the initiative also brings a significant advantage to overall productivity through timely reactions and collaborative interactions. Mobility obviously brings significant improvement and added opportunities to the business environment, but as with many advantages, there are consecutive tradeoffs.
2.2 BYOD – Challenges and Concerns
A considerable challenge for an IT department is how it can effectively secure and manage the corporate network and information systems access for user-owned devices. For example, these devices cannot easily be identified, and therefore cannot be managed by the traditional IT department security settings. When employees bring in their own devices, IT loses significant control as it does not know where the device has been or what applications the user has downloaded, or what device has been introduced into the network.
Apart from legal and ethical issues, some of the noteworthy technical concerns of a BYOD program are as follows:
delivering secure, remote access for mobile devices, while continuing to enforce granular access controls on network resources,
securing corporate and personal data and mobile devices from malware, viruses and malicious applications, and
mitigating the risk of loss, theft or exploitation of corporate and personal data residing on mobile devices.
From an ethical and legal standpoint, BYOD issues include corporate guidelines of what is considered “acceptable use” for actions an employee can take on their own device. Several laws have already been released regarding BYOD which include having employees sign an acceptable use agreement stating that the device can be seized for an indeterminate amount of time if the data on it is part of a legal dispute. Employees may have a real issue with their employers dictating to them what they can and cannot do on their own personal devices. It is imperative that businesses, schools, and
Fourth International Symposium on Business Modeling and Software Design
246
other organizations establish a system of accountability if they allow a BYOD policy.
Privacy concerns are at the top of the list when it comes to legal issues regarding BYOD initiatives. Convergence of both personal and corporate data and applications presents a complex issue. Will the employer be permitted to access an employee’s own e-mails and text messages on a personal smartphone or tablet used by that employee at work? Other considerations include access to browser history and installed software. This is a multifaceted problem that companies have to strategize prior to the adoption of a BYOD policy. Along with an acceptable use policy, many companies also educate employees as to what constitutes acceptable use. Adherence to the policy is only effective if there has been proper education for employees and whoever else has access to corporate information.
Some companies, such as IBM, instituted policies that banned its 400,000 employees from using two popular consumer applications over concerns about data security. The company banned cloud storage service Dropbox, as well as Apple’s personal assistant for the iPhone, Siri. Siri listens to spoken requests and sends the queries to Apple’s servers where they are deciphered into text. Siri can also create text messages and emails on voice command, but some of these messages could contain sensitive, proprietary information.
2.3 The Business Sense of BYOD
While BYOD offers flexibility and efficiencies, the initiative brings a significant advantage to productivity. The quarterly Mobile Workforce Report from iPass Company found that many employees are working up to 20 additional hours unpaid as a result of the companies’ BYOD policy (ComputerworldUK, 2012).
The 2013 iPass/MobileIron Mobile Enterprise Report depicts the tendency of increasing usage of employee-owned smart devices from 42% in 2011 to 47% in 2012, while the percentage of smartphones provisioned by employers declined from 58% to 49% for the same period (Appcelerator, Inc., 2013). Executives actually stimulate the process of establishing corporate guidelines and policies to foster BYOD adoption. According to the same report, 56% of the IT managers in 2012 confirmed that their IT policies had become more responsive and flexible to employees’ demands of utilizing personal devices for dual corporate and private usage.
3 BYOD – STRATEGY AND GOVERNANCE
At this time, for many organizations, BYOD has remained an informal practice and an escalating IT complexity because of this mess-up exposes those institutions to risks from security and compliance gaps. BYOD policy can vary substantially for different organizations depending on their priorities, industry regulations, or operational models. A successful BYOD program would combine effective infrastructure and data security with easy personal use.
3.1 BYOD and Mobile Management Solutions
The IT department should provide users with secure access to corporate applications and data, while adding role-based access control and security settings of personally-owned devices to prevent the organization against data loss and non-compliant usage. The lack of standartization reflects the diversity of devices and operating systems that IT departments must grapple with days, and actually creates market opportunity for mobile management providers (iPass Inc., 2013).
3.1.1 Mobile Device Management
An important component in deploying a BYOD program is the ability to manage the mobile devices that would interface with the enterprise network. Mobile device management (MDM) is the software solution that allows a network administrator to manage and control mobile devices such as smartphones and tablets. Ideally, the MDM should be able to interface with all types of mobile devices, operating systems, and the apps they run. Another consideration is the MDM must be able to operate with a number of providers used by employees. Typically in a corporate landscape, business-owned devices will use only one wireless service provider, but in a BYOD environment, employee-owned devices each have their own wireless providers and as a result, the MDM system will have to work with dozens of service providers.
The main purpose of an MDM system is to optimize the functionality and capabilities of the workforce mobile device while keeping the business IT infrastructure and data secure. Network administration in an MDM includes the ability to interface with the enterprise’s current servers and systems so that it can manage and secure corporate-
BYOD: The Next Wave of Consumerization of IT - The Impact of BYOD on the Enterprise IT Landscape
247
owned data and applications; synchronize with the mobile devices for file sharing, sending out patches, and add and remove devices from the network, and all these tasks must be able to be done directly over carrier networks.
By controlling and protecting the data and configuration settings for all mobile devices in the network, MDM should be able to prevent network and system exposure from a variety of threats. One of the leading mobile device management solutions is the MobileIron MDM system. This MDM software is part of the MobileIron IT Platform which provides a “turnkey” ability to have the mobile device user to interface with the corporate backend just by downloading an app. Once the device is authenticated and activated in the network, the user has access to all resources and content they have permission to access. Like with IT networks, mobile device management is one layer of a secure BYOD program. Device management is just the beginning and is the foundation to mobile application management (MAM) and mobile content management (MCM) implementation – the two other services needed to support BYOD initiatives.
3.1.2 Mobile Application Management
As MDM focuses on the management of mobile devices, mobile application management (MAM) focuses on the management of the applications used by mobile workers. This tool allows system managers to monitor, provision, install and uninstall, update, and audit software programs and applications for mobile devices. MAM functions similarly to network system management tools used within a network environment, but it is designed specifically to work with the unique characteristics of a mobile device. Management of a variety mobile devices in a BYOD requires the ability to manage different operating systems and integrate with the wireless service providers used by the employee. Another issue unique to mobile devices application management is that apps typically are installed using the pull method initiated by the user and not the push method. Additionally, some apps require payment before installation.
MAM addresses these two issues by allowing managers to create a catalog or app storefront of internally developed business apps, as well as making available license files or tokens for approved public apps so there is no need for users to pre-pay prior to installation. For example, Mobile Application Distribution Library is a customizable app distribution tool offered by MobileIron. The
library makes public and private apps available to its end users to install on their mobile devices. In addition, internally developed apps can be made available to users without having to publish them in a storefront such as Apple App Store or Android Market (MobileIron, 2014).
Security is another function of the MAM. Mobile workers will access sensitive data and the backend systems using a variety of apps. It is imperative that the apps comply with organization policies and are properly validated and encrypted. As mobile device computing grows, the number of apps has increased and malicious apps have become as ubiquitous as the safe apps. The highest priority for MAM is to protect data that moves throughout mobile workflows as well as protect its backend system from these types of apps. Some of the approaches of MAM are to allow managers to configure application settings, profiles and credentials for enterprise authentication. MAMs also monitor application usage by observing traffic and application connections. These observations may generate reports and logs that can identify issues within the network and mobile device connections.
Mobile App Containerization is one of the most advanced MAM solutions offered by Good Technology that actually does not require a mobile device management system. Containerization protects data transfer through the use of strong separation of personal and business apps and data. Containerized apps ensure that the enterprise security protocols and encryption throughout the transmission remain constant and consistent until the employees have completed their task. In addition, this method allows the manager to wipe company-owned data and apps only from a lost or stolen device; personal data is not touched at all. This actually addresses a major BYOD issue of how to manage business work product without breaching private personal data and information.
3.1.3 Mobile Content Management
Mobile content management (MCM) is the third layer that is needed to manage a BYOD enterprise level environment. Content is where users are very much hands on. For corporate managers, it is important that the content users access is in an environment that is secure and accessible, while offering the ability to share and collaborate. Mobile workers not only want but need to access the most current business documents and content quickly, anytime and anywhere, without worrying about
Fourth International Symposium on Business Modeling and Software Design
248
security risks. This security employs a variety of authorization and access permissions. These may include user authentication by logging-in to the system as well as entering authentication codes for particular documents.
Since mobile workers are not necessarily located at a fixed site, content may be dynamic depending on the worker’s location through the use of a global positioning system (GPS) or navigation system. AirWatch’s MCM application is called AirWatch Secure Content Locker; this is a secure centralized storage for all business content, files, and documents with three storage options. The cloud storage option can integrate with the most popular repositories such as Google Drive, Office 365, SkyDrive, and Amazon EC2. The on-premise option can integrate with the host repositories as well as a secure access to SharePoint without a VPN connection (AirWatch, 2013). The third is the hybrid option of the cloud and on-premise. AirWatch’s MCM also facilitates two-way synchronization of content from users’ desktops to mobile devices. So individual, user-created content can be accessible to any device that user owns. This option is exactly what the mobile worker needs and expects when working within a mobile-first environment. Again, the expectation is that these documents are always available with any device that is used to call it.
3.2 BYOD – A Decision Framework
The serious challenges in developing a BYOD strategy and the consecutive framework for its implementation is the impact BYOD can have on individuals’ privacy, organizational security, and the liability of both entities. The Gartner analysts Andy and Nick Jones in their Checklist for Determining Enterprise Readiness to Support Employee-Owned Devices have analysed and defined a structured approach in seven phases on the road to this emerging trend (Rowsell-Jones, 2012).
For corporate IT structures embracing a BYOD framework, the following key steps should be considered:
Reasoning and deciding on a BYOD strategy – identify corporate mobile needs; define BYOD scope; shape sponsors’ and stakeholders’ commitments and responses to a BYOD program
Design BYOD program segmentation by roles/needs/functions in the organization – categorize internal and external support, the range and type of access, and create packages of Policies and Technologies for each group
Plan BYOD implementation by streamlining tools and technologies, network infrastructure and services, financing models, and exit options such as: classify and approve list of devices and
versions of mobile operating systems, applications, and providers;
design uniform policies, to enable scalable control and management of the user-owned mobile device utilizing Mobile Device Management (MDM), Mobile Applications Management (MAM), and Mobile Content/Document Management (MCM) solutions;
acceptable use policy with user’s responsibilities and organization’s rights against user’s possession;
reimbursement plan options, total cost of ownership, corporate/private ownership separation, and list of approved exit options.
Program setup and approval – complete internal policy, procedures, contracts, agreements, and training documents; educate stakeholders and ensure their sign-off; gain sponsors’ budget and program approval
Perform proof of concept by running a pilot over selected BYOD segmentations – modify procedure/policy/technologies based on the feedback and lessons learned from the pilot
Program execution and evolution – periodic review and update of the BYOD program with current software versions, devices, applications, and providers. Utilize and evolve a mobile systems’ features/limitations framework that supports the adopted corporate mobile management system(s).
The early BYOD adoptions have already experienced numerous concerns regarding losing personal data and privacy as corporations took full control over personal devices, applications, and information by utilizing mobile device management and device-level layer 3 VPNs. To address most of those critical anxieties, instead of a full control of the personal device, most corporations currently focus on adopting a set of tools to enable IT departments to wrap corporate applications in a security layer and to make sure that the enterprise control on the personally-owned device is limited only to the corporate data and applications. This actually shifts from MDM to MAM and from device-level VPNs to explicit application-specific VPNs involving technologies such as BIG-IP, APM, AppTunnels and encrypted connection to specific
BYOD: The Next Wave of Consumerization of IT - The Impact of BYOD on the Enterprise IT Landscape
249
service supported by Microsoft Exchange (Silva, 2012).
3.3 Assessing and Evolving BYOD
Based on the analysis and the framework outlined in the previous sections, a multidimensional approach for assessing the critical phases of BYOD policy implementation can be suggested:
Risk Analysis to validate the strength of the BYOD policy; the following four key factors should be considered: Social Experience – customers’ and
employees’ satisfaction Operational Efficiency – business process
continuity and evolution Financial Viability – forming business
metrics over the lifecycle of the BYOD program
Technical Practicality – risk avoidances and risk management: how to prevent mobile security threats, how to handle disastrous events.
Legal Issues and Privacy Concerns – several possible scenarios can be adopted to allow companies to benefit from being BYOD friendly while properly balancing the company’s data security and compliance needs with employee preferences and concerns. The most common choices can include: Mobile user utilizes personal smartphone
for personal and work purposes. The company uses written contracts and MDM solutions that offer employees device flexibility and optimal network access in exchange for giving up some control over their personal devices. The company owns the right to wipe out the corporate documents from the user’s device in case it is lost or hacked. The personal information should be guaranteed not to be erased or modified by the company’s reaction.
The company owns the devices and enables employees to use them for both work and personal purposes – this trend is known as COPE (company-owned, personally-enabled). All information on that device can be erased or modified any time according to corporate rules and regulations.
Limited network access and data storage abilities in order to improve data security
and employee privacy. This approach eliminates the need to utilize MDM; instead MAM or MCM would be recommended options to enable secure access to corporate data (Finneran and Brashear, 2014).
For any of the above cases, the BYOD program should apply concurring containerization, separate interfaces for corporate and personal data, special settings for data syncing and backup, and supplementing device-level encryption for enhancing corporate data security.
4 CONCLUSIONS
The current generation of mobile users demand a high quality wireless experience all of the time. Mobile workers depend on it and when it is not delivered as expected, productivity drops, ultimately costing company efficiency, profits, and brand reputation. Therefore, the paper discusses the needs, the decision framework, and the quality of user experience to be at the heart of any BYOD strategy. The adopted corporate framework has to provide a consistent, predictable, frequently updated, and secure experience for all users of the utilized mobile platforms, devices, and/or applications.
Further work is planned in two directions: how consumerization of IT is aligning to the current business strategies and operation models, and how carriers’ 3G and 4G infrastructures and vendor’s specific mobile platforms operationally and functionally impact the consumerization of IT at the enterprises.
REFERENCES
AirWatch, 2013. Mobile Content Management: Top 10 Considerations, Atlanta, GA, USA. Retrieved on 4/1/2014 from: http://www.air-watch.com/downloads/ resources/white-paper-mobile-content-management.pdf
Appcelerator, Inc., 2013 State of the Mobile Enterprise – Q1 2013 Mobile Enterprise Report, Retrieved on 02/1/2014 from: https://www.appcelerator.com/ enterprise/resource-center/research/q1-2013-mobile-enterprise-report/
ComputerworldUK, 2012. BYOD Makes Employees Work Extra 20 Hours Unpaid. Retrieved on July 1, 2013 from: http://www.computerworlduk.com/news/ mobile-wireless/3377143/byod-makes-employees-work-extra-20-hours-unpaid/
Fourth International Symposium on Business Modeling and Software Design
250

Finneran, M., Brashear, J., 2014. A Legal Perspective of BYOD: Building Awareness to Enable BYOD and Mitigate its Risk, ZixCorp. Retrieved on March 25, 2014 from: http://go.zixcorp.com/rs/zixcorp/images/ Zix%20Ebook_A%20Legal%20Perspective%20of%20BYOD.pdf
Forrester Consulting, 2013. Exploring Business and IT Friction: Myths and Realities, Cambridge, MA, USA
International Data Corporation IDC, 2012. Worldwide Mobile Worker Population 2009-2013 Forecast and Worldwide Mobile Enterprise Management Software 2012-2016 Forecast and Analysis and 2011 Vendor Shares, Retrieved on June 28, 2013 from: http:// www.gotomypc.com/remote_access/images/pdf/How_to_Equip_Your_Company_for_the_New_Mobile_Workforce.pdf
iPass Inc., 2013. The Enterprise Mobility Guide for IT Management and CIOs, The iPass/MobileIron Mobile Enterprise Report, Redwood Shores, CA, USA
MobileIron, 2014. Mobile Application Management. Retrieved on 3/29/2014 from: http:// www.mobileiron.com/en/solutions/mobile-application-management
Rowsell-Jones, Andy, Jones, Nick. 2012 Checklist for Determining Enterprise Readiness to Support Employee-Owned Devices, Gartner, June 18, 2012, ID: G000234127
Silva, Peter, 2012. BYOD 2.0: Moving Beyond MDM, F5 White Paper. Retrieved on 09/20/2013 from: http:// www.f5.com/pdf/white-papers/big-ip-apm-mobile-application-manager-white-paper.pdf
BYOD: The Next Wave of Consumerization of IT - The Impact of BYOD on the Enterprise IT Landscape
251


SPECIAL SESSION ON E-HEALTH SERVICES AND TECHNOLOGIES (EHST)

Responsive Universal Design with Universal User Profiles and CSS User Queries
Hao-Wen Yang and Hsing Mei Department of Computer Science and Information Engineering, Fu-Jen Catholic University, Taipei, Taiwan
[email protected], [email protected]
Keywords: Responsive Design, Responsive Universal Design, Cascading Style Sheet, CSS User Queries, Universal User Profile.
Abstract: Accompanying the rapid progressing of information and communication technology, the number of web-based mobile applications grows significantly. The web page design does bring different user experiences on various mobile devices. The Responsive Web Design (RWD) was the first trial to deal with this issue. RWD aimed at designing adaptive web interface for different mobile devices. However, RWD consider only the difference of devices, but not the users, especially the needs of elders. This paper proposes the Responsive Universal Design (RUD), an enhancement of RWD, to consider both the devices and users. A unique Universal User Profile (UUP) is maintained for each user on device. Based on UUP, CSS User Queries functions are used to adjust the user interface dynamically with the best experience. RUD can increase the flexibility of web design, and improve user experience. A JavaScript library is implemented for build/load UUP, to parse user queries, and to apply CSS styles. This paper reports a critical step to create a universal and user-oriented web environment.
1 INTRODUCTION
Accompany with the fast growth of network and mobile technologies, no matter when or where, we can find people using mobile phone or tablet devices for Internet access. However, most of the web sites are designed for desktop. Mobile web sites are costly to design. In 2010, Ethan Marcotte coined the term Responsive Web Design (RWD) in his article. Through the adoption of CSS Media Queries, the RWD based web page can response different views for different devices. However, RWD could meet the needs for each individual user. In the meantime, the aging society is approaching rapidly, and the number of elders (senior citizens) in physical and mental degradation is fast increasing. Small text font and complicated workflow are difficult to learn and use for elders. Neither traditional web design nor RWD-design can solve the above problem. In other words, RWD based web sites are still not friendly for elder and children. The specialized web sites for elders do not provide personalized solution for user. In this paper, we extend the RWD to a meta-level as Responsive Universal Design, and designed two tools to solve the problems.
This research designed and implemented a
Universal User Profiles (UUP) to save user’s experiences, behaviour, and preference. Accompany with the proposed CSS User Queries, which is an extension from the CSS3 Media Queries, web designer and/or developer can transform an ordinary desktop based web pages, to an adaptive page, we named the design process Responsive Universal Design (RUD). The design principals of RUD are: Universal design, Personalize optimization, and User Centered Design. The goal is to construct an Internet environment that allows the elder, the young, and the physical and spiritual disabled people to browse the web intuitively. The second section of this paper introduces the background of this research and current web environment. In the third section, we present the main idea of RUD’s design. The fourth section illustrates the CSS User Queries and Universal User Profiles (UUP). The following section is the experiment and result of this research. The final section is conclusion and future works.
2 BACKGROUNDS
This section introduces the two major background
255
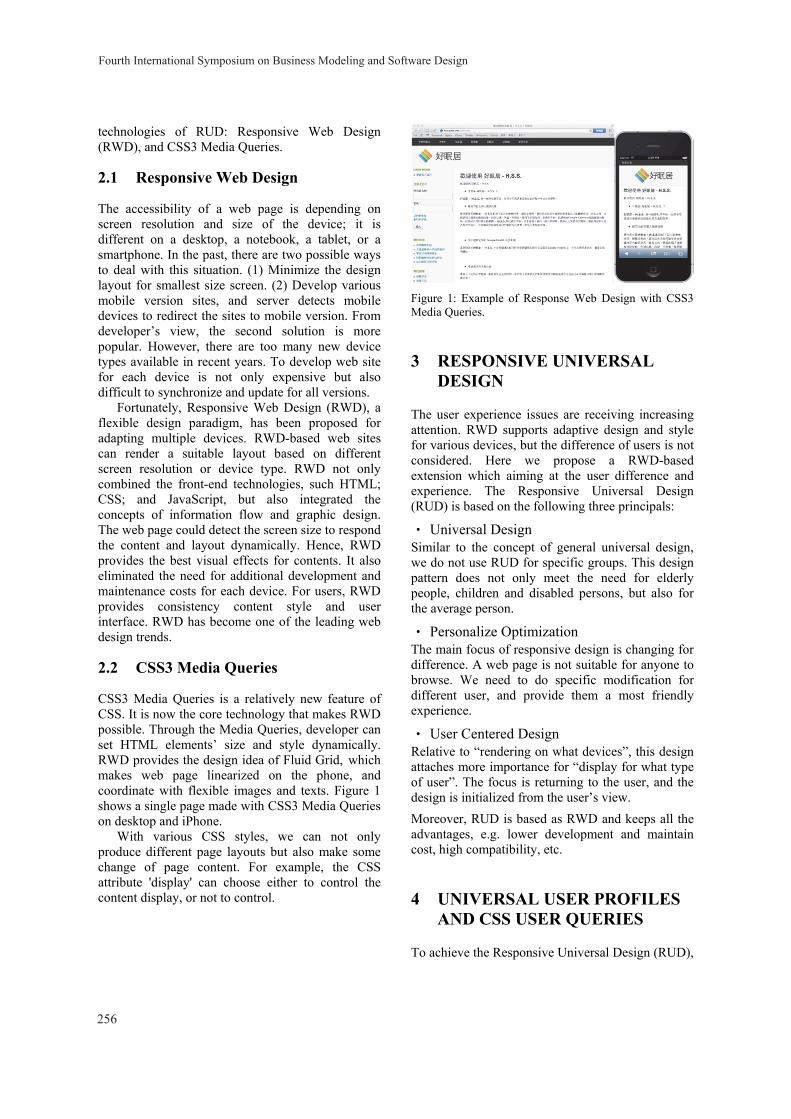
technologies of RUD: Responsive Web Design (RWD), and CSS3 Media Queries.
2.1 Responsive Web Design
The accessibility of a web page is depending on screen resolution and size of the device; it is different on a desktop, a notebook, a tablet, or a smartphone. In the past, there are two possible ways to deal with this situation. (1) Minimize the design layout for smallest size screen. (2) Develop various mobile version sites, and server detects mobile devices to redirect the sites to mobile version. From developer’s view, the second solution is more popular. However, there are too many new device types available in recent years. To develop web site for each device is not only expensive but also difficult to synchronize and update for all versions.
Fortunately, Responsive Web Design (RWD), a flexible design paradigm, has been proposed for adapting multiple devices. RWD-based web sites can render a suitable layout based on different screen resolution or device type. RWD not only combined the front-end technologies, such HTML; CSS; and JavaScript, but also integrated the concepts of information flow and graphic design. The web page could detect the screen size to respond the content and layout dynamically. Hence, RWD provides the best visual effects for contents. It also eliminated the need for additional development and maintenance costs for each device. For users, RWD provides consistency content style and user interface. RWD has become one of the leading web design trends.
2.2 CSS3 Media Queries
CSS3 Media Queries is a relatively new feature of CSS. It is now the core technology that makes RWD possible. Through the Media Queries, developer can set HTML elements’ size and style dynamically. RWD provides the design idea of Fluid Grid, which makes web page linearized on the phone, and coordinate with flexible images and texts. Figure 1 shows a single page made with CSS3 Media Queries on desktop and iPhone.
With various CSS styles, we can not only produce different page layouts but also make some change of page content. For example, the CSS attribute 'display' can choose either to control the content display, or not to control.
Figure 1: Example of Response Web Design with CSS3 Media Queries.
3 RESPONSIVE UNIVERSAL DESIGN
The user experience issues are receiving increasing attention. RWD supports adaptive design and style for various devices, but the difference of users is not considered. Here we propose a RWD-based extension which aiming at the user difference and experience. The Responsive Universal Design (RUD) is based on the following three principals:
• Universal Design Similar to the concept of general universal design, we do not use RUD for specific groups. This design pattern does not only meet the need for elderly people, children and disabled persons, but also for the average person.
• Personalize Optimization The main focus of responsive design is changing for difference. A web page is not suitable for anyone to browse. We need to do specific modification for different user, and provide them a most friendly experience.
• User Centered Design Relative to “rendering on what devices”, this design attaches more importance for “display for what type of user”. The focus is returning to the user, and the design is initialized from the user’s view.
Moreover, RUD is based as RWD and keeps all the advantages, e.g. lower development and maintain cost, high compatibility, etc.
4 UNIVERSAL USER PROFILES AND CSS USER QUERIES
To achieve the Responsive Universal Design (RUD),
Fourth International Symposium on Business Modeling and Software Design
256
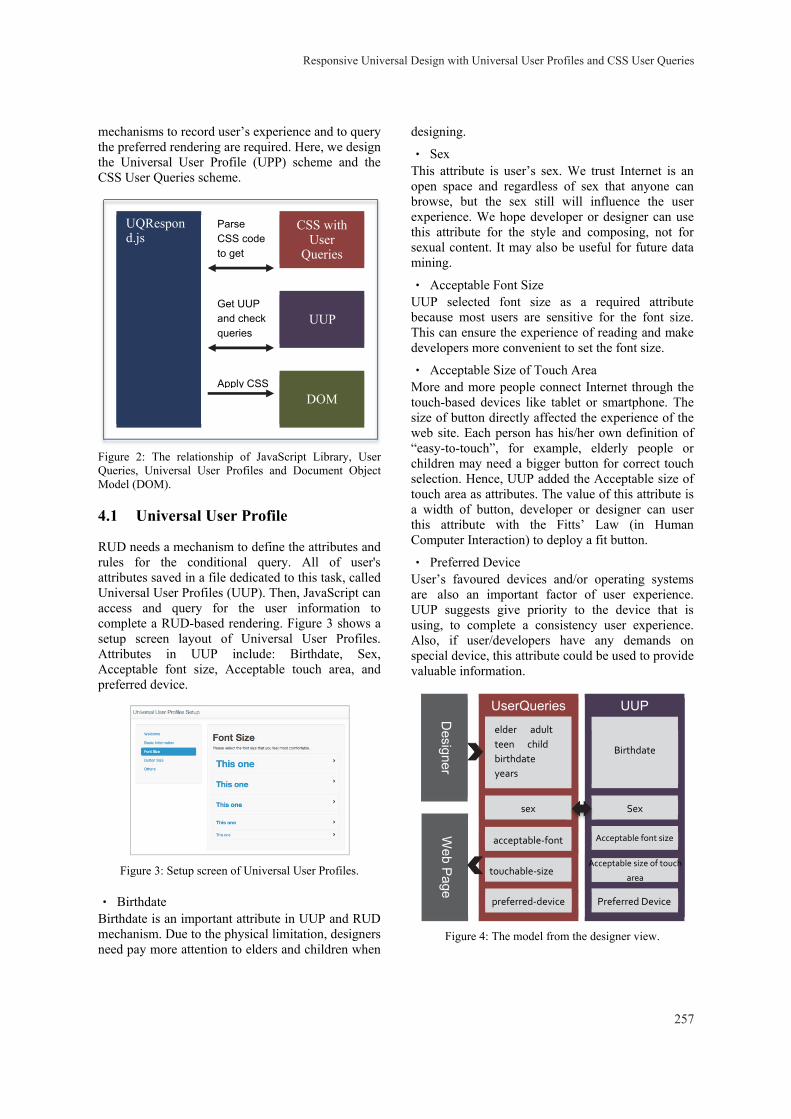
mechanisms to record user’s experience and to query the preferred rendering are required. Here, we design the Universal User Profile (UPP) scheme and the CSS User Queries scheme.
Figure 2: The relationship of JavaScript Library, User Queries, Universal User Profiles and Document Object Model (DOM).
4.1 Universal User Profile
RUD needs a mechanism to define the attributes and rules for the conditional query. All of user's attributes saved in a file dedicated to this task, called Universal User Profiles (UUP). Then, JavaScript can access and query for the user information to complete a RUD-based rendering. Figure 3 shows a setup screen layout of Universal User Profiles. Attributes in UUP include: Birthdate, Sex, Acceptable font size, Acceptable touch area, and preferred device.
Figure 3: Setup screen of Universal User Profiles.
• Birthdate Birthdate is an important attribute in UUP and RUD mechanism. Due to the physical limitation, designers need pay more attention to elders and children when
designing.
• Sex This attribute is user’s sex. We trust Internet is an open space and regardless of sex that anyone can browse, but the sex still will influence the user experience. We hope developer or designer can use this attribute for the style and composing, not for sexual content. It may also be useful for future data mining.
• Acceptable Font Size UUP selected font size as a required attribute because most users are sensitive for the font size. This can ensure the experience of reading and make developers more convenient to set the font size.
• Acceptable Size of Touch Area More and more people connect Internet through the touch-based devices like tablet or smartphone. The size of button directly affected the experience of the web site. Each person has his/her own definition of “easy-to-touch”, for example, elderly people or children may need a bigger button for correct touch selection. Hence, UUP added the Acceptable size of touch area as attributes. The value of this attribute is a width of button, developer or designer can user this attribute with the Fitts’ Law (in Human Computer Interaction) to deploy a fit button.
• Preferred Device User’s favoured devices and/or operating systems are also an important factor of user experience. UUP suggests give priority to the device that is using, to complete a consistency user experience. Also, if user/developers have any demands on special device, this attribute could be used to provide valuable information.
Figure 4: The model from the designer view.
UQRespond.js
CSS with User
Queries
UUP
DOM
Get UUP and check queries
Apply CSS
Parse CSS code to get
UserQueries UUP
Designer
Web P
age
elder adult
teen child
birthdate
years
sex
acceptable‐font
touchable‐size
preferred‐device
Birthdate
Sex
Acceptable font size
Acceptable size of touch
area
Preferred Device
Responsive Universal Design with Universal User Profiles and CSS User Queries
257
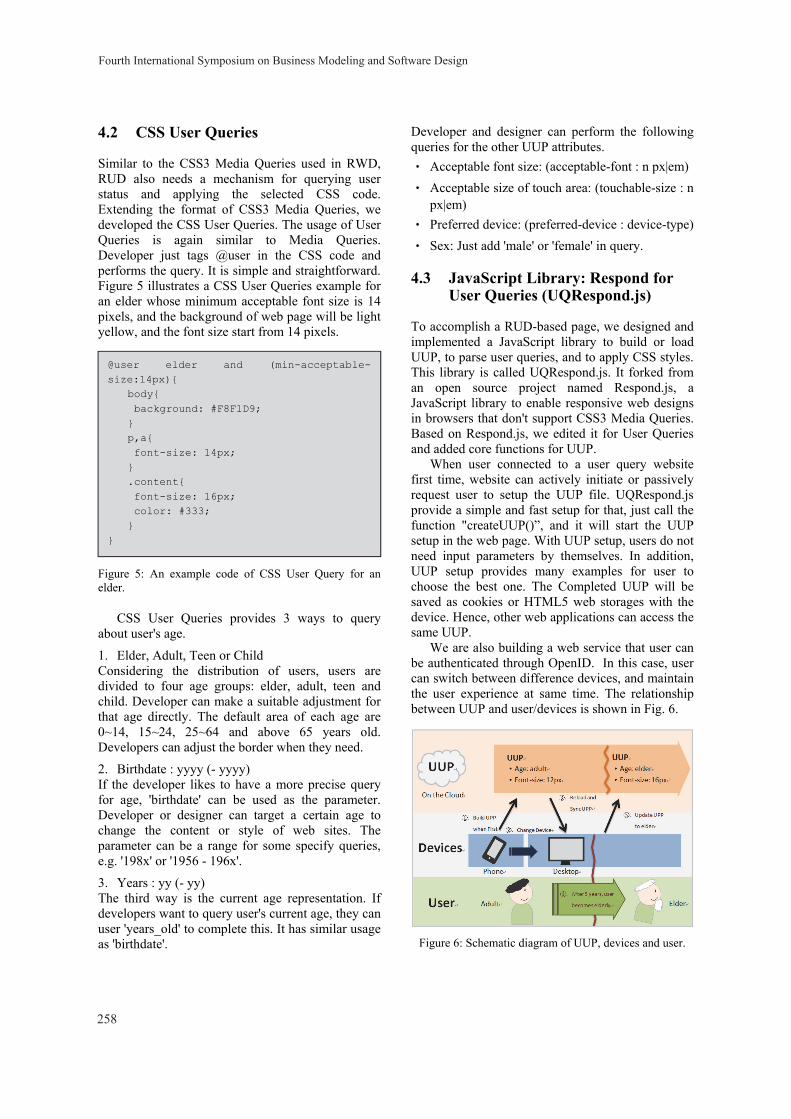
4.2 CSS User Queries
Similar to the CSS3 Media Queries used in RWD, RUD also needs a mechanism for querying user status and applying the selected CSS code. Extending the format of CSS3 Media Queries, we developed the CSS User Queries. The usage of User Queries is again similar to Media Queries. Developer just tags @user in the CSS code and performs the query. It is simple and straightforward. Figure 5 illustrates a CSS User Queries example for an elder whose minimum acceptable font size is 14 pixels, and the background of web page will be light yellow, and the font size start from 14 pixels.
Figure 5: An example code of CSS User Query for an elder.
CSS User Queries provides 3 ways to query about user's age.
1. Elder, Adult, Teen or Child Considering the distribution of users, users are divided to four age groups: elder, adult, teen and child. Developer can make a suitable adjustment for that age directly. The default area of each age are 0~14, 15~24, 25~64 and above 65 years old. Developers can adjust the border when they need.
2. Birthdate : yyyy (- yyyy) If the developer likes to have a more precise query for age, 'birthdate' can be used as the parameter. Developer or designer can target a certain age to change the content or style of web sites. The parameter can be a range for some specify queries, e.g. '198x' or '1956 - 196x'.
3. Years : yy (- yy) The third way is the current age representation. If developers want to query user's current age, they can user 'years_old' to complete this. It has similar usage as 'birthdate'.
Developer and designer can perform the following queries for the other UUP attributes. • Acceptable font size: (acceptable-font : n px|em) • Acceptable size of touch area: (touchable-size : n
px|em) • Preferred device: (preferred-device : device-type) • Sex: Just add 'male' or 'female' in query.
4.3 JavaScript Library: Respond for User Queries (UQRespond.js)
To accomplish a RUD-based page, we designed and implemented a JavaScript library to build or load UUP, to parse user queries, and to apply CSS styles. This library is called UQRespond.js. It forked from an open source project named Respond.js, a JavaScript library to enable responsive web designs in browsers that don't support CSS3 Media Queries. Based on Respond.js, we edited it for User Queries and added core functions for UUP.
When user connected to a user query website first time, website can actively initiate or passively request user to setup the UUP file. UQRespond.js provide a simple and fast setup for that, just call the function "createUUP()”, and it will start the UUP setup in the web page. With UUP setup, users do not need input parameters by themselves. In addition, UUP setup provides many examples for user to choose the best one. The Completed UUP will be saved as cookies or HTML5 web storages with the device. Hence, other web applications can access the same UUP.
We are also building a web service that user can be authenticated through OpenID. In this case, user can switch between difference devices, and maintain the user experience at same time. The relationship between UUP and user/devices is shown in Fig. 6.
Figure 6: Schematic diagram of UUP, devices and user.
@user elder and (min-acceptable-size:14px){
body{ background: #F8F1D9;
} p,a{ font-size: 14px; } .content{ font-size: 16px; color: #333; }
}
Fourth International Symposium on Business Modeling and Software Design
258
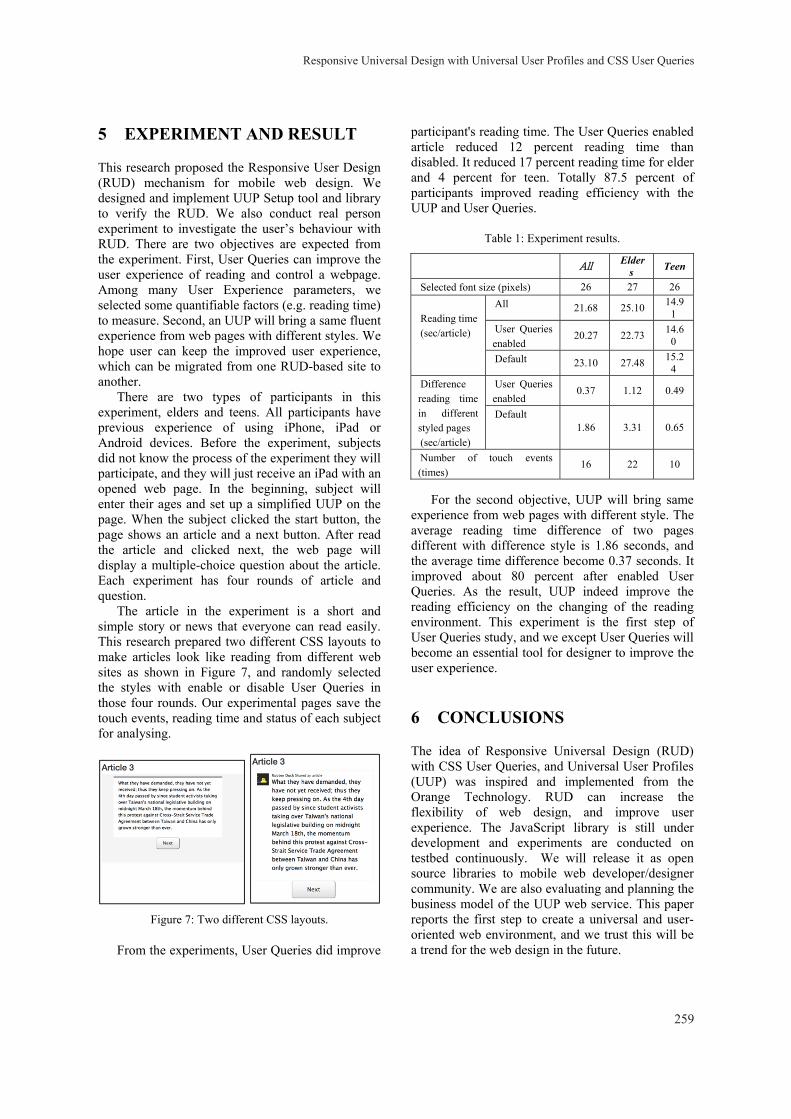
5 EXPERIMENT AND RESULT
This research proposed the Responsive User Design (RUD) mechanism for mobile web design. We designed and implement UUP Setup tool and library to verify the RUD. We also conduct real person experiment to investigate the user’s behaviour with RUD. There are two objectives are expected from the experiment. First, User Queries can improve the user experience of reading and control a webpage. Among many User Experience parameters, we selected some quantifiable factors (e.g. reading time) to measure. Second, an UUP will bring a same fluent experience from web pages with different styles. We hope user can keep the improved user experience, which can be migrated from one RUD-based site to another.
There are two types of participants in this experiment, elders and teens. All participants have previous experience of using iPhone, iPad or Android devices. Before the experiment, subjects did not know the process of the experiment they will participate, and they will just receive an iPad with an opened web page. In the beginning, subject will enter their ages and set up a simplified UUP on the page. When the subject clicked the start button, the page shows an article and a next button. After read the article and clicked next, the web page will display a multiple-choice question about the article. Each experiment has four rounds of article and question.
The article in the experiment is a short and simple story or news that everyone can read easily. This research prepared two different CSS layouts to make articles look like reading from different web sites as shown in Figure 7, and randomly selected the styles with enable or disable User Queries in those four rounds. Our experimental pages save the touch events, reading time and status of each subject for analysing.
Figure 7: Two different CSS layouts.
From the experiments, User Queries did improve
participant's reading time. The User Queries enabled article reduced 12 percent reading time than disabled. It reduced 17 percent reading time for elder and 4 percent for teen. Totally 87.5 percent of participants improved reading efficiency with the UUP and User Queries.
Table 1: Experiment results.
All Elders Teen
Selected font size (pixels) 26 27 26 Reading time (sec/article)
All 21.68 25.10 14.91
User Queries enabled
20.27 22.73 14.60
Default 23.10 27.48 15.24
Difference reading time in different styled pages (sec/article)
User Queries enabled
0.37 1.12 0.49
Default 1.86 3.31 0.65
Number of touch events (times)
16 22 10
For the second objective, UUP will bring same
experience from web pages with different style. The average reading time difference of two pages different with difference style is 1.86 seconds, and the average time difference become 0.37 seconds. It improved about 80 percent after enabled User Queries. As the result, UUP indeed improve the reading efficiency on the changing of the reading environment. This experiment is the first step of User Queries study, and we except User Queries will become an essential tool for designer to improve the user experience.
6 CONCLUSIONS
The idea of Responsive Universal Design (RUD) with CSS User Queries, and Universal User Profiles (UUP) was inspired and implemented from the Orange Technology. RUD can increase the flexibility of web design, and improve user experience. The JavaScript library is still under development and experiments are conducted on testbed continuously. We will release it as open source libraries to mobile web developer/designer community. We are also evaluating and planning the business model of the UUP web service. This paper reports the first step to create a universal and user-oriented web environment, and we trust this will be a trend for the web design in the future.
Responsive Universal Design with Universal User Profiles and CSS User Queries
259

REFERENCES
Ethan Marcotte. (2010). Responsive Web Design. Retrieved from: http://www.alistapart.com/articles/ responsive-web-design/
Hsing Mei, Vhien-Chang Hsu, and Wei-Ting Lai. (2008). Mashup a Reliable Virtual Health 2.0 Testbed Environment. Proceedings of the 4th Taiwan Conference on Software Engineering, 277-282.
Yan-Ting Lin, Chia-Hao Lin, Xiang-Lin Wen, Ching-Yang Hung and Hsing Mei. (2012). Joyful Health Space: An Age Friendly Testbed for Responsive Web Design. Orange Beneficence - International Design Conference of Smart Living for Elderly, 178-186.
F. Rivoal, H. Lie, T. Çelik, D. Glazman and A. van Kesteren. (2012). Media Queries, W3C Recommendation 19 June 2012. Retrieved form: http://www.w3.org/TR/css3-mediaqueries/
William Lidwell, Kritina Holden and Jill Butler. (2010). Universal Principles of Design, Revised and Updated: 125 Ways to Enhance Usability, Influence Perception, Increase Appeal, Make Better Design Decisions, and Teach through Design(2nd ed.). New York: Rockport Publishers.
Jesse James Garrett. (2010). The elements of user experience: user- centered design for the Web and beyond (2nd ed.). San Francisco: New Riders Press
Scott Jehl. (2011). Respond.js. Retrived from: https://github.com/scottjehl/Respond
Fourth International Symposium on Business Modeling and Software Design
260
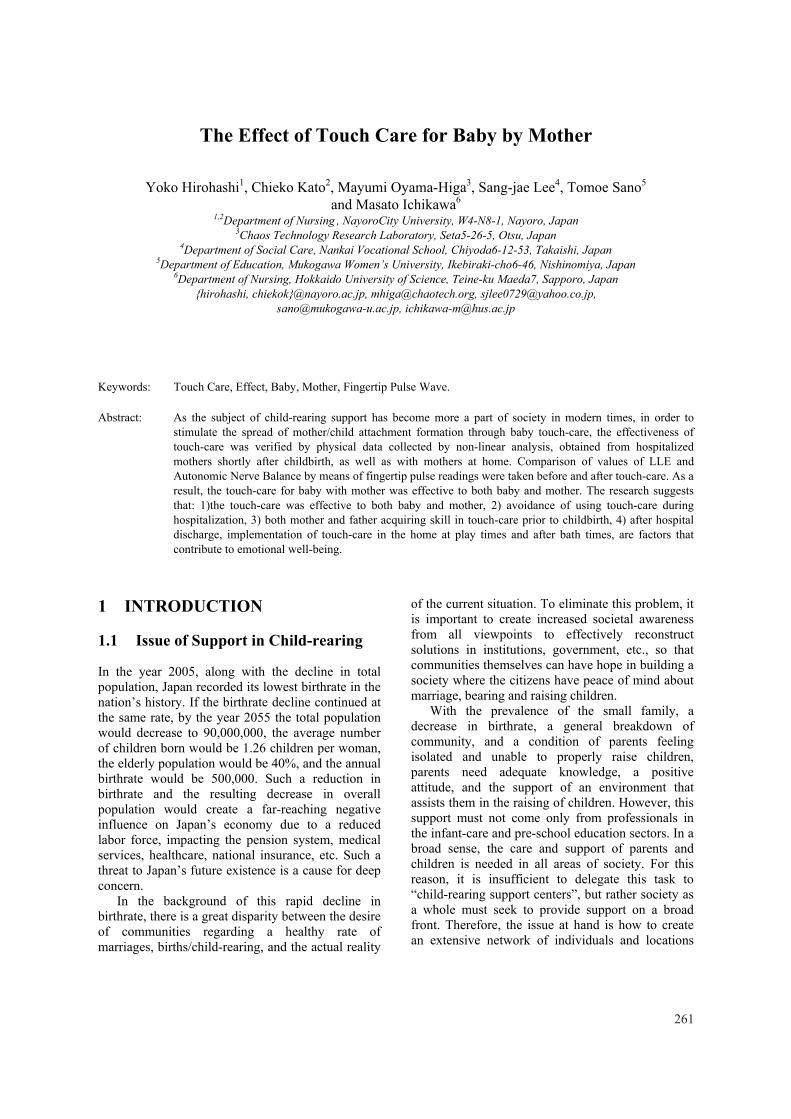
The Effect of Touch Care for Baby by Mother
Yoko Hirohashi1, Chieko Kato2, Mayumi Oyama-Higa3, Sang-jae Lee4, Tomoe Sano5 and Masato Ichikawa6
1,2Department of Nursing , NayoroCity University, W4-N8-1, Nayoro, Japan 3Chaos Technology Research Laboratory, Seta5-26-5, Otsu, Japan
4Department of Social Care, Nankai Vocational School, Chiyoda6-12-53, Takaishi, Japan 5Department of Education, Mukogawa Women’s University, Ikebiraki-cho6-46, Nishinomiya, Japan
6Department of Nursing, Hokkaido University of Science, Teine-ku Maeda7, Sapporo, Japan {hirohashi, chiekok}@nayoro.ac.jp, [email protected], [email protected],
[email protected], [email protected]
Keywords: Touch Care, Effect, Baby, Mother, Fingertip Pulse Wave.
Abstract: As the subject of child-rearing support has become more a part of society in modern times, in order to stimulate the spread of mother/child attachment formation through baby touch-care, the effectiveness of touch-care was verified by physical data collected by non-linear analysis, obtained from hospitalized mothers shortly after childbirth, as well as with mothers at home. Comparison of values of LLE and Autonomic Nerve Balance by means of fingertip pulse readings were taken before and after touch-care. As a result, the touch-care for baby with mother was effective to both baby and mother. The research suggests that: 1)the touch-care was effective to both baby and mother, 2) avoidance of using touch-care during hospitalization, 3) both mother and father acquiring skill in touch-care prior to childbirth, 4) after hospital discharge, implementation of touch-care in the home at play times and after bath times, are factors that contribute to emotional well-being.
1 INTRODUCTION
1.1 Issue of Support in Child-rearing
In the year 2005, along with the decline in total population, Japan recorded its lowest birthrate in the nation’s history. If the birthrate decline continued at the same rate, by the year 2055 the total population would decrease to 90,000,000, the average number of children born would be 1.26 children per woman, the elderly population would be 40%, and the annual birthrate would be 500,000. Such a reduction in birthrate and the resulting decrease in overall population would create a far-reaching negative influence on Japan’s economy due to a reduced labor force, impacting the pension system, medical services, healthcare, national insurance, etc. Such a threat to Japan’s future existence is a cause for deep concern.
In the background of this rapid decline in birthrate, there is a great disparity between the desire of communities regarding a healthy rate of marriages, births/child-rearing, and the actual reality
of the current situation. To eliminate this problem, it is important to create increased societal awareness from all viewpoints to effectively reconstruct solutions in institutions, government, etc., so that communities themselves can have hope in building a society where the citizens have peace of mind about marriage, bearing and raising children.
With the prevalence of the small family, a decrease in birthrate, a general breakdown of community, and a condition of parents feeling isolated and unable to properly raise children, parents need adequate knowledge, a positive attitude, and the support of an environment that assists them in the raising of children. However, this support must not come only from professionals in the infant-care and pre-school education sectors. In a broad sense, the care and support of parents and children is needed in all areas of society. For this reason, it is insufficient to delegate this task to “child-rearing support centers”, but rather society as a whole must seek to provide support on a broad front. Therefore, the issue at hand is how to create an extensive network of individuals and locations
261
throughout the country that will provide support for parents and children.
The goal is to aim for a society in which individuals in the community mutually benefit by sticking close in support of parents and their children. The desired goal is for society as a whole to do away with the solitary mindset where individuals think “I will raise my own child myself”, and to have citizens in each community mutually give support to parents, bringing about the trend of a child-rearing culture where “we will all work together to raise our children”.
1.2 Formation of a Parent/Child “Attachment” Relationship
During the time of a child’s infancy and preschool years, the development and acquisition of a “basic feeling of trust” is very important. This involves creation of an “attachment” between a young child and a specific adult in whom the child learns to trust and go to for answers. This trusting relationship becomes the basis through which the child gains a sense of ease and trust toward others throughout life.
According to John Bowlby (1907 - 1990), this “attachment” begins to form between a child and their caregiver (primarily the child’s mother) within the first 2 to 3 months after birth. In this relationship, the child begins to show a selective desire to be with the person caring for them, and the caregiver also experiences a greater awareness of affection for, and an intensified desire to nurture the child. Through the repetition of this mutual relationship, a bond of attachment is created and strengthened between the caregiver and the child. Because of this, in the development of the young child, for the sake of the child’s expression and vocalization of their own feelings, it is extremely important that the caregiver show an abundant measure of responsive affection through smiles, physical contact, etc.
1.3 Regarding Effectiveness of Touch-Care upon Newborns
During the early stage of a newborn’s life, it is said that a large number of necessary nerves in the brain develop through a remaining process (“Nerve Darwinism”). Therefore it is believed that through positive implementation of touch-care from the time shortly after birth, a heightened sensitivity and formation of a strong parent/child attachment is encouraged.
Research of touch-care for newborns was begun in the 1960’s, but these days is not limited to care of newborns only, but the practice of “Tactile Care ®” has also developed to involve people of every age, including the elderly, and is used as an effective means of aiding peace of mind as well as pain reduction. Also, touch-care is used to aid newborns (including premature newborns) in reduction of surplus levels of stress, and to stimulate proper child development. “Developmental Care” has been widely recognized as a means toward this goal, and through the specific means of “NIDCAP ® ” ( Neonatal Individualized Developmental Care Program), the usefulness of touch-care has been demonstrated in promoting child development and formation of parent/child attachment.
1.4 Objective of Main Research
In sections I - III, the need in society for support of childcare, formation of parent/child attachment, and effectiveness of touch-care begun shortly after birth, were reported. In so doing, our research team verified the usefulness of childcare support in each locality, and the effectiveness of touch-care for infants as one means of attachment formation. From prior research regarding the fluctuation of fingertip pulse wave readings, in living creatures fingertip pulse wave readings showing “chaos” data from the brain were examined by means of non-linear analysis, and the effects of touch-care were investigated.
When a numerical value of mental activity can be derived by means of Largest Lyupanov Exponent (LLE) readings obtained through non-linear analysis of fluctuations in fingertip pulse wave data, verification is already obtained. It is our consideration that the practice of touch-care in some way or another affects the mental activity in mothers and infants, and that this can be known by fingertip pulse wave readings.
Also, from fingertip pulse wave fluctuation data, autonomic nerve balance (ANB) between sympathetic nerve priority vs. parasympathetic nerve priority can be understood. The autonomic nervous system is an accurate indicator of brain activity, and how autonomic nerve activity changes through touch-care can be obtained.
The aim of the main research is to verify, through this data, the effectiveness of touch-care for infants, and the means of application.
Fourth International Symposium on Business Modeling and Software Design
262
2 METHOD
2.1 Research Subject
The subjects for this research consisted of mothers hospitalized for childbirth, during the first 3-4 days after delivery, as well as mothers participating in childcare classes in various cities/towns, as well as mothers and young children during the childcare process in their locality. The target age for children in this study was under 1 year.
2.2 Research Period
December 2013 - February 2014
2.3 Research Location
“City A” General Hospital, childcare classes in “Town B” and, and the home of a participant in “City A”.
2.4 Research Method
First, explanation of the research was given to the participants, and a form with each participant’s consent for research was obtained. Next, pulse rates of the mother and child were measured for the first session. The mother’s pulse wave was monitored measuring the pulse at the tip of the second finger on the left hand using a finger cuff, and the pulse wave was measured for 3 minutes. The child’s pulse wave was obtained using a pediatric monitor attached to the child’s earlobe for 1 minute. Because of the challenge in getting a small child to sit still for long periods, measurement was set for a shorter time.
A birthing assistant (midwife) that helped with the research demonstrated the baby massage technique for the mother, using an infant size doll. Then the mother was asked to perform the same massage technique on her child. At the end of the massage period, the 2nd pulse wave reading was taken.
Also, a questionnaire for the participating mothers was utilized, which asked the mother two kinds of questions regarding 1) her impressions after having given the baby massage, and 2) how it affected her feeling of “attachment”. Questions regarding the mother’s impressions were as follows: “Did you experience any new realization of ‘touch-care’?” “Do you feel that you would like to continue this with your child? If so, what kind of ‘setting’ (location) would you prefer to use?” “What kind of feelings did you experience while doing the baby
massage?” “Did you notice any place on your child where they seemed to enjoy the massage?” There were 26 questions regarding “attachment”, and response to these questions was divided into 4 categories: (nearly always, often, sometimes, and rarely).
2.5 Method of Analysis
For analysis of the mother’s responses, “Lyspect” measurement analysis computer software was used. For the analysis of the child’s responses, “BACS” measurement analysis software was used.
Data that was gathered comparing fluctuations in pulse wave rates before and after the experiment was examined by non-linear analysis using the computer software. The numerical values of the Largest Lyapunov Exponent (LLE) and Autonomic Nerve Balance (ANB) were examined for comparative study. It was judged that participants whose final readings, when compared to initial readings, showed a rise in LLE values indicated a rise in their mind’s sense of well-being. Also, it was judged that participants whose final readings showed a comparative decrease in ANB due to higher parasympathetic nerve activity indicated a mental reaction of relaxation.
Answers to questions regarding “attachment” were assigned a point value ranging from 4 to 1 for analysis purposes.
3 RESULT
3.1 Attributes of the Participants
In all, 25 mothers took part in the research. Among these, 15 were women tested during hospitalization, and the remaining 10 were women who were tested either at childcare classes or in their homes. The average age of the mothers was 28.8 ± 4.5 years. 7 mothers were tested 3 days after childbirth, 8 mothers were tested 4 days after childbirth, and 1 mother was tested 5 days after giving birth. 15 women were first-time mothers (primipara), and 10 women had previous births (multipara). All of the mothers had normal pregnancies lasting from 37 - 41 weeks, and none of the babies tested were underweight. Of the babies who were tested at home, ages were from 2 – 8 months old. In all, 10 babies were boys, and 15 were girls.
The Effect of Touch Care for Baby by Mother
263
3.2 Regarding Results of Touch Care
Results in measurement of the mothers’ fingertip pulse wave can be seen in the table 1.
After completion of the touch-care procedure, 16 of the 25 mothers showed a rise in Largest Lyapunov Exponent (LLE) and a drop in Autonomic Nerve Balance (hereafter referred to as ANB). In contrast, 9 mothers showed a drop in LLE and a rise in ANB. Within the model of increased LLE readings indicating a mental sense of well-being, and decreased ANB readings indicating a relaxed state, 64% of the mothers showed results suggesting that touch-care is effective.
Figure 1: Case3’s LLE. Figure 2: Case23’s LLE.
Figure 3: Case6’s ANB. Figure 4: Case20’s ANB.
Figure 1, 2, 3, 4: Cases where touch-care was effective.
Figure 5: Case7’s LLE and ANB.
Figure 6: Case21’s LLE and ANB.
Figure 5, 6: Cases effectiveness of touch-care could not be recognized.
Among mothers tested during hospitalization, 7 out of 15 women (46.7%) had results showing touch-care as “effective”, and among mothers at home, 9 out of 10 women (90%) showed the same “effective” results.
Table 1: Data of all case (LLE and ANB).
place LLE
①
LLE
②
AN
B①
AN
B②
1 HP 1.47 1.64 ↑ 4.4 5.6 ↑ ○
2 HP 1.35 2.47 ↑ 5.73 6.4 ↑ ○
3 home 2.13 2.62 ↑ 7.21 7.4 ↑ ○
4 home 2.4 4.69 ↑ 7.9 7 ↑ ○
5 home 2.37 2.2 ↓ 5.25 3.33 ↓ ○
6 HP 1.28 1.25 → 6.04 8.1 ↑ ×
7 HP 1.86 1.92 ↑ 3.78 4.67 ↑ ○
8 HP 2.05 1.09 ↓ 5.95 6.64 ↑ ×
9 HP 3.8 3.63 ↓ 7.43 7.83 ↑ ×
10 HP 1.55 1.77 ↑ 2.54 8.91 ↑ ○
11 HP 2.98 2.48 ↓ 4.34 6.3 ↑ ×
12 HP 2.44 2.31 ↓ 9.49 9.39 → ×
13 HP 0.91 0.63 ↓ 4.01 5.7 ↑ ×
14 HP 1.85 1.76 ↓ 6.3 5.59 ↓ ○
15 HP 2.37 3.17 ↑ 2.71 6.65 ↑ ○
16 HP 3.84 2.46 ↓ 6.96 7.68 ↑ ×
17 home 4.85 2.36 ↓ 3.6 6.46 ↑ ×
18 home 4.55 1.49 ↓ 3.6 1.97 ↓ ○
19 home 2.34 3.36 ↑ 5.79 6.41 ↑ ○
20 HP 2.46 1.88 ↓ 7.7 4.04 ↓ ○
21 HP 1.84 1.69 ↓ 5.6 8.8 ↑ ×
22 home 2.55 1.82 ↓ 5.57 4.81 ↓ ○
23 home 2.65 3.3 ↑ 5.35 7.4 ↑ ○
24 home 2.1 2.79 ↑ 5.35 7.04 ↑ ○
25 home 2.42 3.74 ↑ 9.49 8.82 ↓ ○
3.3 Regarding LLE and ANB Levels
In the 50 times that levels were measured, the average LLE level was a 2.38 reading. When looking at data from only mothers during hospitalization, the average LLE level was a 2.07 reading. Among mothers living at home, the average LLE level was a 2.84 reading.
In our previous research, 17 female students between the ages of 20 - 22 years old were tested, and when measurements were taken before and after food intake, the average LLE level was a 3.71 reading. Even when factoring in a decrease in levels immediately following food intake, these individuals had an LLE reading that was significantly higher than the average 2.07 LLE reading of mothers during hospitalization.
In all cases a trend was observed that immediately following the baby massage, ANB showed a gain in sympathetic nerve activity.
3.4 Attributes of Participants during Hospitalization Vs. at Home
Compared to participants during hospitalization,
Fourth International Symposium on Business Modeling and Software Design
264
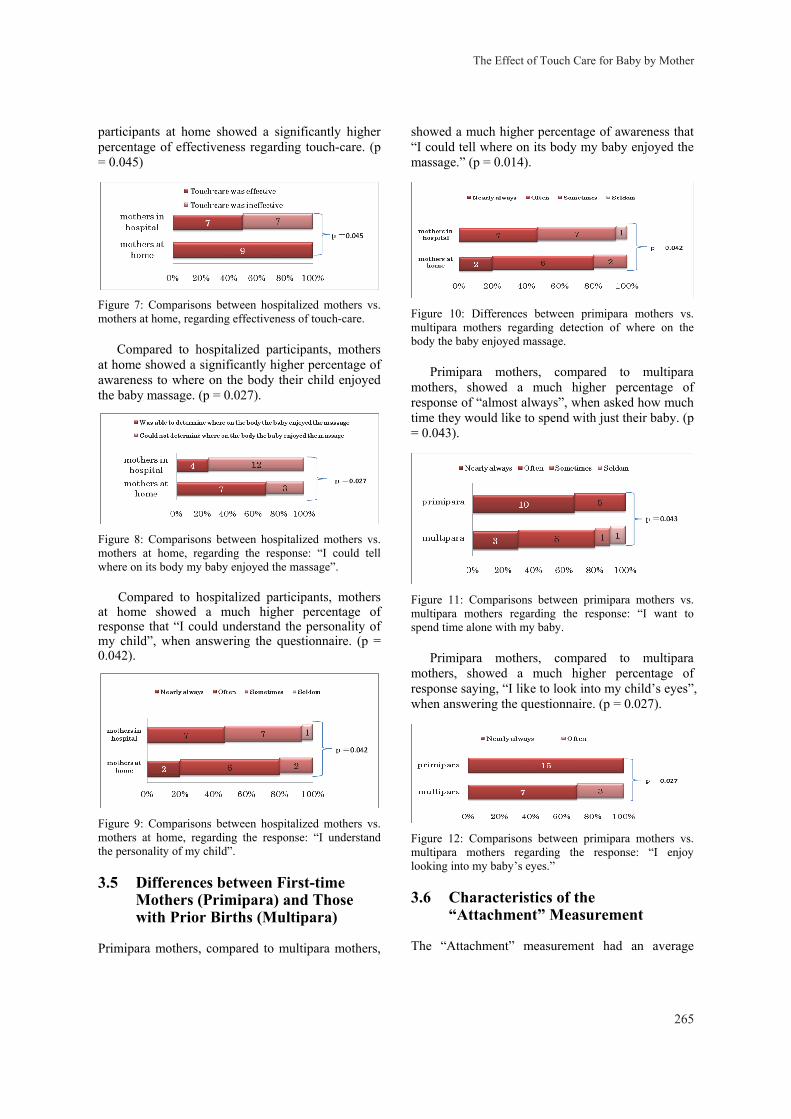
participants at home showed a significantly higher percentage of effectiveness regarding touch-care. (p = 0.045)
Figure 7: Comparisons between hospitalized mothers vs. mothers at home, regarding effectiveness of touch-care.
Compared to hospitalized participants, mothers at home showed a significantly higher percentage of awareness to where on the body their child enjoyed the baby massage. (p = 0.027).
Figure 8: Comparisons between hospitalized mothers vs. mothers at home, regarding the response: “I could tell where on its body my baby enjoyed the massage”.
Compared to hospitalized participants, mothers at home showed a much higher percentage of response that “I could understand the personality of my child”, when answering the questionnaire. (p = 0.042).
Figure 9: Comparisons between hospitalized mothers vs. mothers at home, regarding the response: “I understand the personality of my child”.
3.5 Differences between First-time Mothers (Primipara) and Those with Prior Births (Multipara)
Primipara mothers, compared to multipara mothers,
showed a much higher percentage of awareness that “I could tell where on its body my baby enjoyed the massage.” (p = 0.014).
Figure 10: Differences between primipara mothers vs. multipara mothers regarding detection of where on the body the baby enjoyed massage.
Primipara mothers, compared to multipara mothers, showed a much higher percentage of response of “almost always”, when asked how much time they would like to spend with just their baby. (p = 0.043).
Figure 11: Comparisons between primipara mothers vs. multipara mothers regarding the response: “I want to spend time alone with my baby.
Primipara mothers, compared to multipara mothers, showed a much higher percentage of response saying, “I like to look into my child’s eyes”, when answering the questionnaire. (p = 0.027).
Figure 12: Comparisons between primipara mothers vs. multipara mothers regarding the response: “I enjoy looking into my baby’s eyes.”
3.6 Characteristics of the “Attachment” Measurement
The “Attachment” measurement had an average
The Effect of Touch Care for Baby by Mother
265
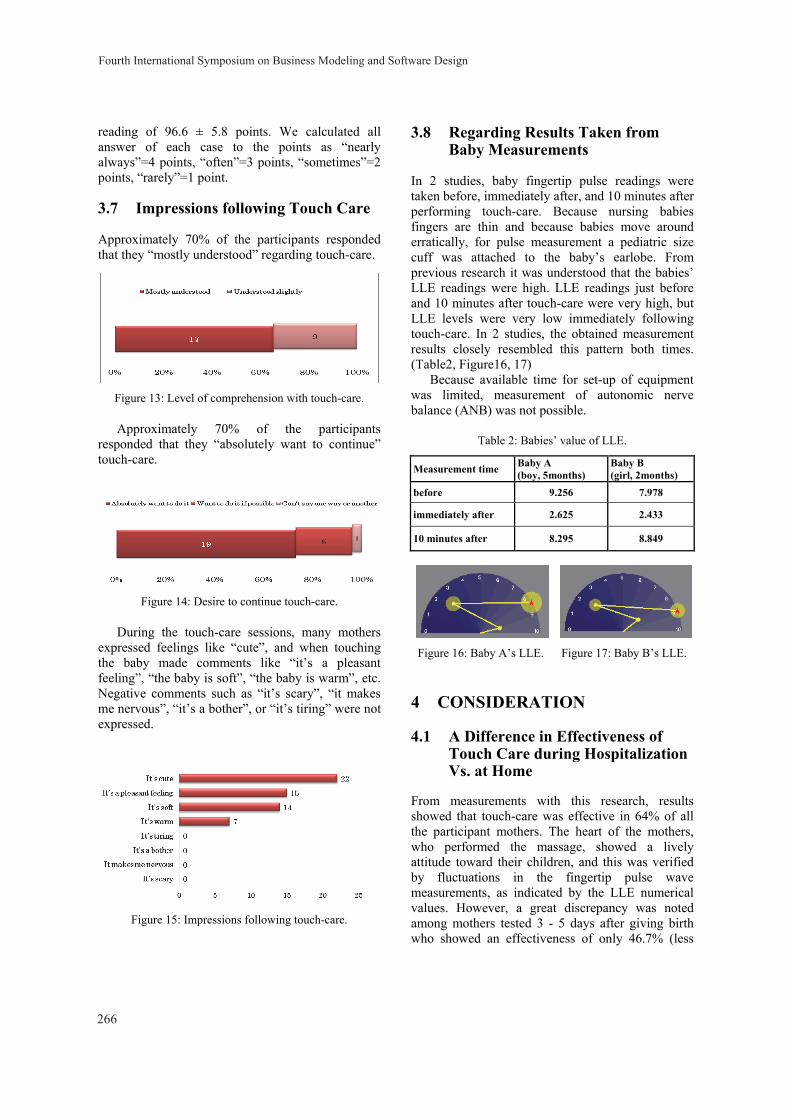
reading of 96.6 ± 5.8 points. We calculated all answer of each case to the points as “nearly always”=4 points, “often”=3 points, “sometimes”=2 points, “rarely”=1 point.
3.7 Impressions following Touch Care
Approximately 70% of the participants responded that they “mostly understood” regarding touch-care.
Figure 13: Level of comprehension with touch-care.
Approximately 70% of the participants responded that they “absolutely want to continue” touch-care.
Figure 14: Desire to continue touch-care.
During the touch-care sessions, many mothers expressed feelings like “cute”, and when touching the baby made comments like “it’s a pleasant feeling”, “the baby is soft”, “the baby is warm”, etc. Negative comments such as “it’s scary”, “it makes me nervous”, “it’s a bother”, or “it’s tiring” were not expressed.
Figure 15: Impressions following touch-care.
3.8 Regarding Results Taken from Baby Measurements
In 2 studies, baby fingertip pulse readings were taken before, immediately after, and 10 minutes after performing touch-care. Because nursing babies fingers are thin and because babies move around erratically, for pulse measurement a pediatric size cuff was attached to the baby’s earlobe. From previous research it was understood that the babies’ LLE readings were high. LLE readings just before and 10 minutes after touch-care were very high, but LLE levels were very low immediately following touch-care. In 2 studies, the obtained measurement results closely resembled this pattern both times. (Table2, Figure16, 17)
Because available time for set-up of equipment was limited, measurement of autonomic nerve balance (ANB) was not possible.
Table 2: Babies’ value of LLE.
Measurement time Baby A (boy, 5months)
Baby B (girl, 2months)
before 9.256 7.978
immediately after 2.625 2.433
10 minutes after 8.295 8.849
Figure 16: Baby A’s LLE. Figure 17: Baby B’s LLE.
4 CONSIDERATION
4.1 A Difference in Effectiveness of Touch Care during Hospitalization Vs. at Home
From measurements with this research, results showed that touch-care was effective in 64% of all the participant mothers. The heart of the mothers, who performed the massage, showed a lively attitude toward their children, and this was verified by fluctuations in the fingertip pulse wave measurements, as indicated by the LLE numerical values. However, a great discrepancy was noted among mothers tested 3 - 5 days after giving birth who showed an effectiveness of only 46.7% (less
Fourth International Symposium on Business Modeling and Software Design
266
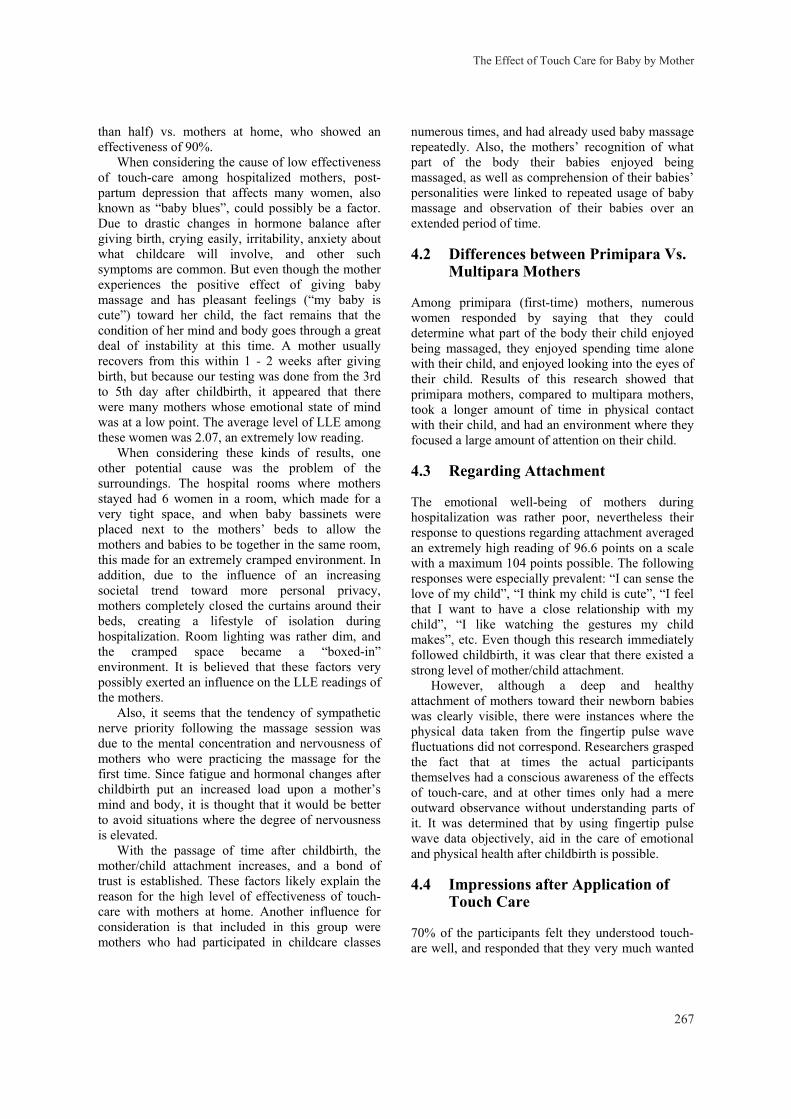
than half) vs. mothers at home, who showed an effectiveness of 90%.
When considering the cause of low effectiveness of touch-care among hospitalized mothers, post-partum depression that affects many women, also known as “baby blues”, could possibly be a factor. Due to drastic changes in hormone balance after giving birth, crying easily, irritability, anxiety about what childcare will involve, and other such symptoms are common. But even though the mother experiences the positive effect of giving baby massage and has pleasant feelings (“my baby is cute”) toward her child, the fact remains that the condition of her mind and body goes through a great deal of instability at this time. A mother usually recovers from this within 1 - 2 weeks after giving birth, but because our testing was done from the 3rd to 5th day after childbirth, it appeared that there were many mothers whose emotional state of mind was at a low point. The average level of LLE among these women was 2.07, an extremely low reading.
When considering these kinds of results, one other potential cause was the problem of the surroundings. The hospital rooms where mothers stayed had 6 women in a room, which made for a very tight space, and when baby bassinets were placed next to the mothers’ beds to allow the mothers and babies to be together in the same room, this made for an extremely cramped environment. In addition, due to the influence of an increasing societal trend toward more personal privacy, mothers completely closed the curtains around their beds, creating a lifestyle of isolation during hospitalization. Room lighting was rather dim, and the cramped space became a “boxed-in” environment. It is believed that these factors very possibly exerted an influence on the LLE readings of the mothers.
Also, it seems that the tendency of sympathetic nerve priority following the massage session was due to the mental concentration and nervousness of mothers who were practicing the massage for the first time. Since fatigue and hormonal changes after childbirth put an increased load upon a mother’s mind and body, it is thought that it would be better to avoid situations where the degree of nervousness is elevated.
With the passage of time after childbirth, the mother/child attachment increases, and a bond of trust is established. These factors likely explain the reason for the high level of effectiveness of touch-care with mothers at home. Another influence for consideration is that included in this group were mothers who had participated in childcare classes
numerous times, and had already used baby massage repeatedly. Also, the mothers’ recognition of what part of the body their babies enjoyed being massaged, as well as comprehension of their babies’ personalities were linked to repeated usage of baby massage and observation of their babies over an extended period of time.
4.2 Differences between Primipara Vs. Multipara Mothers
Among primipara (first-time) mothers, numerous women responded by saying that they could determine what part of the body their child enjoyed being massaged, they enjoyed spending time alone with their child, and enjoyed looking into the eyes of their child. Results of this research showed that primipara mothers, compared to multipara mothers, took a longer amount of time in physical contact with their child, and had an environment where they focused a large amount of attention on their child.
4.3 Regarding Attachment
The emotional well-being of mothers during hospitalization was rather poor, nevertheless their response to questions regarding attachment averaged an extremely high reading of 96.6 points on a scale with a maximum 104 points possible. The following responses were especially prevalent: “I can sense the love of my child”, “I think my child is cute”, “I feel that I want to have a close relationship with my child”, “I like watching the gestures my child makes”, etc. Even though this research immediately followed childbirth, it was clear that there existed a strong level of mother/child attachment.
However, although a deep and healthy attachment of mothers toward their newborn babies was clearly visible, there were instances where the physical data taken from the fingertip pulse wave fluctuations did not correspond. Researchers grasped the fact that at times the actual participants themselves had a conscious awareness of the effects of touch-care, and at other times only had a mere outward observance without understanding parts of it. It was determined that by using fingertip pulse wave data objectively, aid in the care of emotional and physical health after childbirth is possible.
4.4 Impressions after Application of Touch Care
70% of the participants felt they understood touch-are well, and responded that they very much wanted
The Effect of Touch Care for Baby by Mother
267
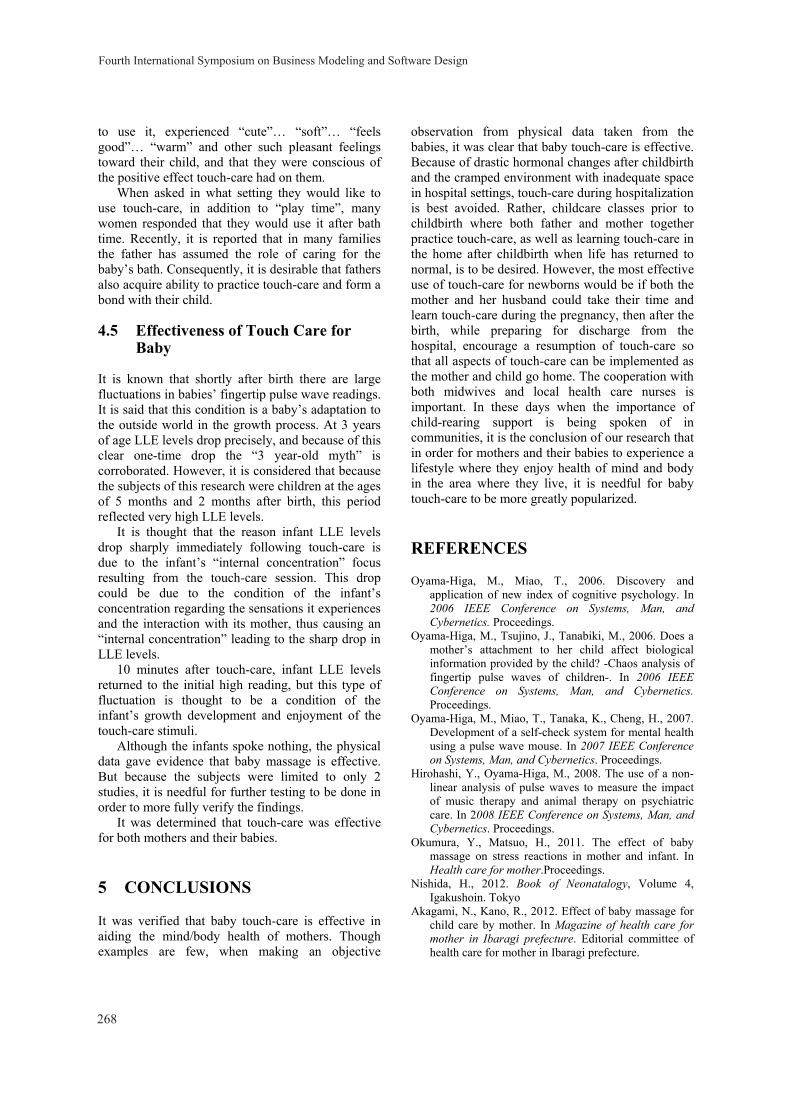
to use it, experienced “cute”… “soft”… “feels good”… “warm” and other such pleasant feelings toward their child, and that they were conscious of the positive effect touch-care had on them.
When asked in what setting they would like to use touch-care, in addition to “play time”, many women responded that they would use it after bath time. Recently, it is reported that in many families the father has assumed the role of caring for the baby’s bath. Consequently, it is desirable that fathers also acquire ability to practice touch-care and form a bond with their child.
4.5 Effectiveness of Touch Care for Baby
It is known that shortly after birth there are large fluctuations in babies’ fingertip pulse wave readings. It is said that this condition is a baby’s adaptation to the outside world in the growth process. At 3 years of age LLE levels drop precisely, and because of this clear one-time drop the “3 year-old myth” is corroborated. However, it is considered that because the subjects of this research were children at the ages of 5 months and 2 months after birth, this period reflected very high LLE levels.
It is thought that the reason infant LLE levels drop sharply immediately following touch-care is due to the infant’s “internal concentration” focus resulting from the touch-care session. This drop could be due to the condition of the infant’s concentration regarding the sensations it experiences and the interaction with its mother, thus causing an “internal concentration” leading to the sharp drop in LLE levels.
10 minutes after touch-care, infant LLE levels returned to the initial high reading, but this type of fluctuation is thought to be a condition of the infant’s growth development and enjoyment of the touch-care stimuli.
Although the infants spoke nothing, the physical data gave evidence that baby massage is effective. But because the subjects were limited to only 2 studies, it is needful for further testing to be done in order to more fully verify the findings.
It was determined that touch-care was effective for both mothers and their babies.
5 CONCLUSIONS
It was verified that baby touch-care is effective in aiding the mind/body health of mothers. Though examples are few, when making an objective
observation from physical data taken from the babies, it was clear that baby touch-care is effective. Because of drastic hormonal changes after childbirth and the cramped environment with inadequate space in hospital settings, touch-care during hospitalization is best avoided. Rather, childcare classes prior to childbirth where both father and mother together practice touch-care, as well as learning touch-care in the home after childbirth when life has returned to normal, is to be desired. However, the most effective use of touch-care for newborns would be if both the mother and her husband could take their time and learn touch-care during the pregnancy, then after the birth, while preparing for discharge from the hospital, encourage a resumption of touch-care so that all aspects of touch-care can be implemented as the mother and child go home. The cooperation with both midwives and local health care nurses is important. In these days when the importance of child-rearing support is being spoken of in communities, it is the conclusion of our research that in order for mothers and their babies to experience a lifestyle where they enjoy health of mind and body in the area where they live, it is needful for baby touch-care to be more greatly popularized.
REFERENCES
Oyama-Higa, M., Miao, T., 2006. Discovery and application of new index of cognitive psychology. In 2006 IEEE Conference on Systems, Man, and Cybernetics. Proceedings.
Oyama-Higa, M., Tsujino, J., Tanabiki, M., 2006. Does a mother’s attachment to her child affect biological information provided by the child? -Chaos analysis of fingertip pulse waves of children-. In 2006 IEEE Conference on Systems, Man, and Cybernetics. Proceedings.
Oyama-Higa, M., Miao, T., Tanaka, K., Cheng, H., 2007. Development of a self-check system for mental health using a pulse wave mouse. In 2007 IEEE Conference on Systems, Man, and Cybernetics. Proceedings.
Hirohashi, Y., Oyama-Higa, M., 2008. The use of a non- linear analysis of pulse waves to measure the impact of music therapy and animal therapy on psychiatric care. In 2008 IEEE Conference on Systems, Man, and Cybernetics. Proceedings.
Okumura, Y., Matsuo, H., 2011. The effect of baby massage on stress reactions in mother and infant. In Health care for mother.Proceedings.
Nishida, H., 2012. Book of Neonatalogy, Volume 4, Igakushoin. Tokyo
Akagami, N., Kano, R., 2012. Effect of baby massage for child care by mother. In Magazine of health care for mother in Ibaragi prefecture. Editorial committee of health care for mother in Ibaragi prefecture.
Fourth International Symposium on Business Modeling and Software Design
268

SPECIAL SESSION ON INTELLIGENT SYSTEMS AND
BUSINESS ANALYSIS

Uncertainty Modeling in the Process of SMEs Financial Mechanism Using Intuitionistic Fuzzy Estimations
George L. Shahpazov, Lyubka A. Doukovska and Vassia K. Atanassova Institute of Information and Communication Technologies, Bulgarian Academy of Sciences,
Acad. G. Bonchev str., bl. 2, 1113 Sofia, Bulgaria [email protected], [email protected], [email protected]
Keywords: SMEs Financial Mechanism, Credit Risk, Creditworthiness, Intuitionistic Fuzzy Sets, i-Fuzzification.
Abstract: In the present paper, we discuss the mechanism of bank support of small and medium-sized enterprises (SMEs). Analysis is made of the effectiveness of the bank’s internal financial structural unit and hierarchy, and it is shown how the concept of intuitionistic fuzzy sets can be applied to the process of evaluating creditworthiness of the SMEs applications for bank loans, from the bank’s perspective. The presented approach aims to yield estimations of the effectiveness of the process, taking consideration of the aspects of uncertainty, which is an inherent part of the processes of evaluation of applications for bank support and evaluation of the process itself.
1 INTRODUCTION
Supporting emerging and present legal entities as making a form of investment, such as financing SME sector involves substantial risk in general and particularly in emerging markets like Bulgaria. A significant portion of this risks results from the lack of business ethics in the market and a legislation, which doesn’t support in particular this kind of investments. Results published in paper (Shahpazov, Doukovska, 2012), shows that the timing for financial support in Bulgarian SMEs from the manufacturing sector is perfect. The actual result lays on deep analysis of the sector, which forecasted a faster growth in the sector than local GDP growth during a 5-8 year period spread.
Over the same period, the share of service sector output in GDP is expected to raise from 61.5% - 63.4%.
Local agriculture sector is experiencing a boost in the last few years, and falls under the program of rehabilitation and modernization of value creating industries, as the main focus is to overturn present trade situation where the country imports more goods than it exports. The overall aim is to utilize the EU accession and its supportive instruments, local Government programs assistance, and financial institution involvement into accelerating growth processes and SMEs further development.
The above mentioned facts allow us to look for new techniques for intelligent analysis of the process of SMEs financial mechanism.
In paper (Shahpazov, Doukovska, 2013), an application of the apparatus of generalized nets is proposed for modeling of the mechanism of financial support of the SMEs.
The present work traces the most important steps of the process of evaluation of a business project proposal, applying for bank financing. It is a conti-nuation of our previous research (Shahpazov, Doukovska, 2013). The research model is offered how the concept of intuitionistic fuzziness can be applied to the process of evaluating creditworthiness of the SMEs.
The evaluation follows a predefined hierarchy of the levels of the bank’s decision makers, and sophisticated policies and procedures.
For the needs of our discussion, we make a relatively simple model, which takes into account which levels of the bank hierarchy receive and process the business applications for bank loans, which levels make funding decisions, and in case of uncertainty, which upper levels of the hierarchy are these applications directed to, for taking a decision at the higher level. This model is schematically illustrated on Figure 1.
In this highly regulated process, for each level of the bank’s decision making hierarchy, we are interested to estimate and interpret in terms of
271
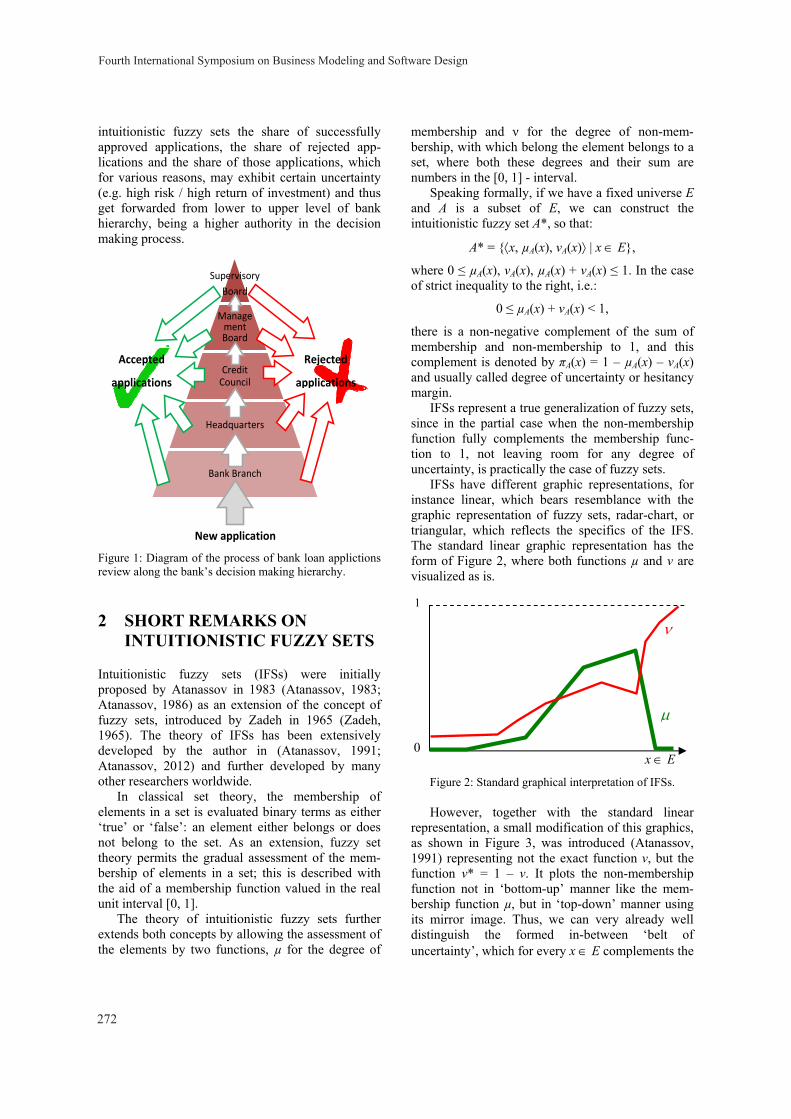
intuitionistic fuzzy sets the share of successfully approved applications, the share of rejected app-lications and the share of those applications, which for various reasons, may exhibit certain uncertainty (e.g. high risk / high return of investment) and thus get forwarded from lower to upper level of bank hierarchy, being a higher authority in the decision making process.
Management Board
CreditCouncil
Headquarters
Bank Branch
Supervisory Board
Accepted
applications
Rejected
applications
New application Figure 1: Diagram of the process of bank loan applictions review along the bank’s decision making hierarchy.
2 SHORT REMARKS ON INTUITIONISTIC FUZZY SETS
Intuitionistic fuzzy sets (IFSs) were initially proposed by Atanassov in 1983 (Atanassov, 1983; Atanassov, 1986) as an extension of the concept of fuzzy sets, introduced by Zadeh in 1965 (Zadeh, 1965). The theory of IFSs has been extensively developed by the author in (Atanassov, 1991; Atanassov, 2012) and further developed by many other researchers worldwide.
In classical set theory, the membership of elements in a set is evaluated binary terms as either ‘true’ or ‘false’: an element either belongs or does not belong to the set. As an extension, fuzzy set theory permits the gradual assessment of the mem-bership of elements in a set; this is described with the aid of a membership function valued in the real unit interval [0, 1].
The theory of intuitionistic fuzzy sets further extends both concepts by allowing the assessment of the elements by two functions, µ for the degree of
membership and ν for the degree of non-mem-bership, with which belong the element belongs to a set, where both these degrees and their sum are numbers in the [0, 1] - interval.
Speaking formally, if we have a fixed universe E and A is a subset of E, we can construct the intuitionistic fuzzy set A*, so that:
A* = {⟨x, µA(x), νA(x)⟩ | x ∈ E},
where 0 ≤ µA(x), νA(x), µA(x) + νA(x) ≤ 1. In the case of strict inequality to the right, i.e.:
0 ≤ µA(x) + νA(x) < 1,
there is a non-negative complement of the sum of membership and non-membership to 1, and this complement is denoted by πA(x) = 1 – µA(x) – νA(x) and usually called degree of uncertainty or hesitancy margin.
IFSs represent a true generalization of fuzzy sets, since in the partial case when the non-membership function fully complements the membership func-tion to 1, not leaving room for any degree of uncertainty, is practically the case of fuzzy sets.
IFSs have different graphic representations, for instance linear, which bears resemblance with the graphic representation of fuzzy sets, radar-chart, or triangular, which reflects the specifics of the IFS. The standard linear graphic representation has the form of Figure 2, where both functions µ and ν are visualized as is.
Figure 2: Standard graphical interpretation of IFSs.
However, together with the standard linear representation, a small modification of this graphics, as shown in Figure 3, was introduced (Atanassov, 1991) representing not the exact function ν, but the function ν* = 1 – ν. It plots the non-membership function not in ‘bottom-up’ manner like the mem-bership function µ, but in ‘top-down’ manner using its mirror image. Thus, we can very already well distinguish the formed in-between ‘belt of uncertainty’, which for every x ∈ E complements the
μ
ν
1
0x ∈ E
Fourth International Symposium on Business Modeling and Software Design
272
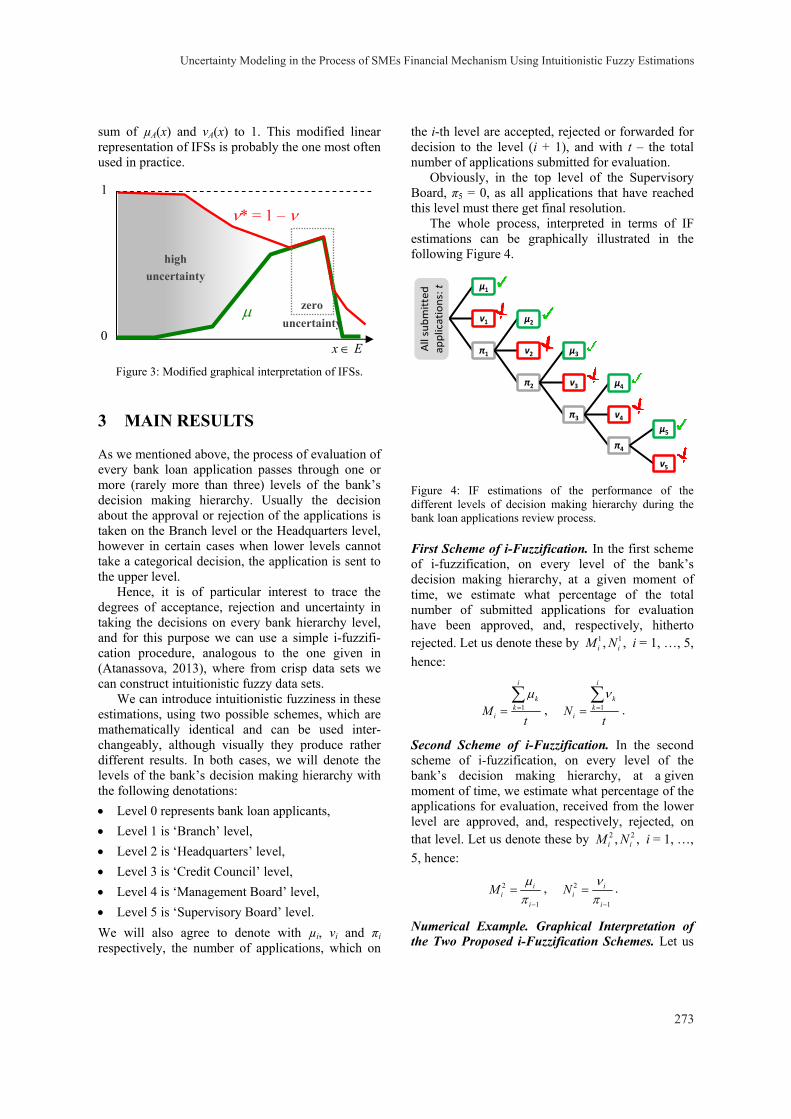
sum of µA(x) and νA(x) to 1. This modified linear representation of IFSs is probably the one most often used in practice.
Figure 3: Modified graphical interpretation of IFSs.
3 MAIN RESULTS
As we mentioned above, the process of evaluation of every bank loan application passes through one or more (rarely more than three) levels of the bank’s decision making hierarchy. Usually the decision about the approval or rejection of the applications is taken on the Branch level or the Headquarters level, however in certain cases when lower levels cannot take a categorical decision, the application is sent to the upper level.
Hence, it is of particular interest to trace the degrees of acceptance, rejection and uncertainty in taking the decisions on every bank hierarchy level, and for this purpose we can use a simple i-fuzzifi-cation procedure, analogous to the one given in (Atanassova, 2013), where from crisp data sets we can construct intuitionistic fuzzy data sets.
We can introduce intuitionistic fuzziness in these estimations, using two possible schemes, which are mathematically identical and can be used inter-changeably, although visually they produce rather different results. In both cases, we will denote the levels of the bank’s decision making hierarchy with the following denotations: • Level 0 represents bank loan applicants, • Level 1 is ‘Branch’ level, • Level 2 is ‘Headquarters’ level, • Level 3 is ‘Credit Council’ level, • Level 4 is ‘Management Board’ level, • Level 5 is ‘Supervisory Board’ level. We will also agree to denote with µi, νi and πi respectively, the number of applications, which on
the i-th level are accepted, rejected or forwarded for decision to the level (i + 1), and with t – the total number of applications submitted for evaluation.
Obviously, in the top level of the Supervisory Board, π5 = 0, as all applications that have reached this level must there get final resolution.
The whole process, interpreted in terms of IF estimations can be graphically illustrated in the following Figure 4.
µ1
ν1
π1
µ2
ν2
π2
µ3
ν3
π3
µ4
ν4
π4
µ5
ν5
All s
ubm
itted
ap
plic
atio
ns: t
Figure 4: IF estimations of the performance of the different levels of decision making hierarchy during the bank loan applications review process.
First Scheme of i-Fuzzification. In the first scheme of i-fuzzification, on every level of the bank’s decision making hierarchy, at a given moment of time, we estimate what percentage of the total number of submitted applications for evaluation have been approved, and, respectively, hitherto rejected. Let us denote these by 1 1, ,i iM N i = 1, …, 5, hence:
1
i
kk
iMt
μ==∑
, 1
i
kk
iNt
ν==∑
.
Second Scheme of i-Fuzzification. In the second scheme of i-fuzzification, on every level of the bank’s decision making hierarchy, at a given moment of time, we estimate what percentage of the applications for evaluation, received from the lower level are approved, and, respectively, rejected, on that level. Let us denote these by 2 2, ,i iM N i = 1, …, 5, hence:
2
1
ii
i
Mμπ −
= , 2
1
ii
i
Nνπ −
= .
Numerical Example. Graphical Interpretation of the Two Proposed i-Fuzzification Schemes. Let us
μ
ν* = 1 ‒ ν
1
0 x ∈ E
zero uncertainty
high uncertainty
Uncertainty Modeling in the Process of SMEs Financial Mechanism Using Intuitionistic Fuzzy Estimations
273
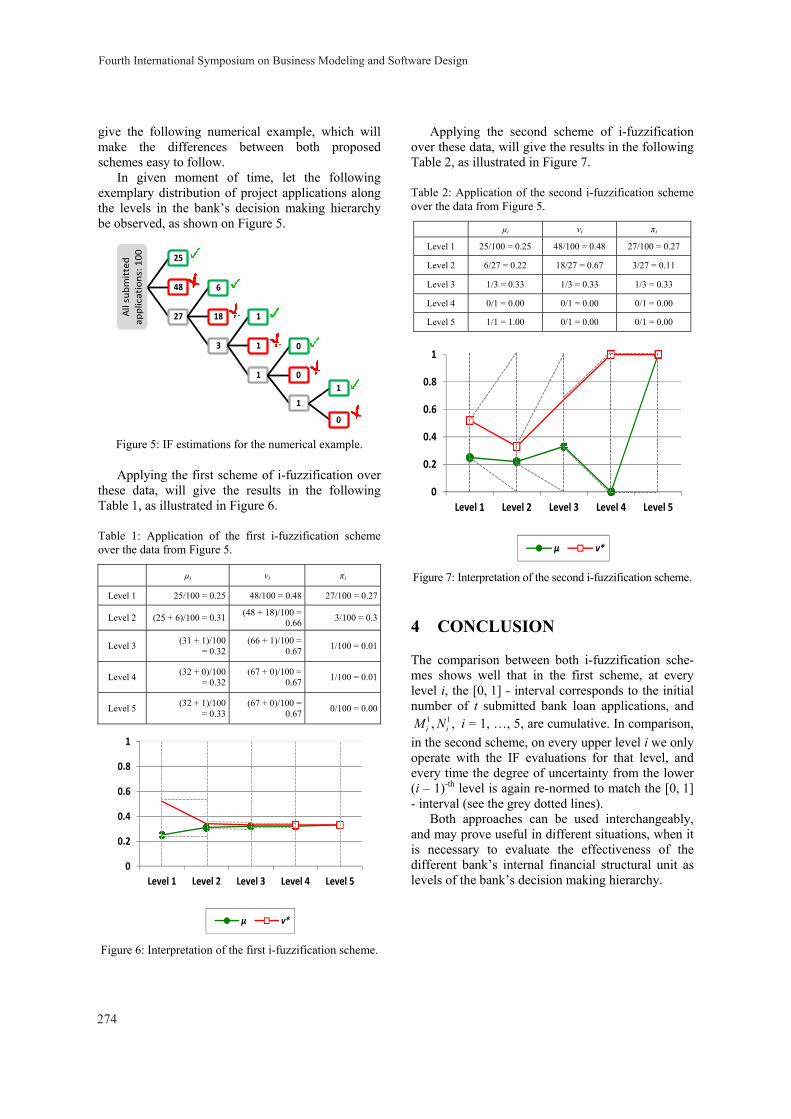
give the following numerical example, which will make the differences between both proposed schemes easy to follow.
In given moment of time, let the following exemplary distribution of project applications along the levels in the bank’s decision making hierarchy be observed, as shown on Figure 5.
25
48
27
6
18
3
1
1
1
0
0
1
1
0
All s
ubm
itted
ap
plic
atio
ns: 1
00
Figure 5: IF estimations for the numerical example.
Applying the first scheme of i-fuzzification over these data, will give the results in the following Table 1, as illustrated in Figure 6.
Table 1: Application of the first i-fuzzification scheme over the data from Figure 5.
µi νi πi
Level 1 25/100 = 0.25 48/100 = 0.48 27/100 = 0.27
Level 2 (25 + 6)/100 = 0.31 (48 + 18)/100 = 0.66 3/100 = 0.3
Level 3 (31 + 1)/100 = 0.32
(66 + 1)/100 = 0.67 1/100 = 0.01
Level 4 (32 + 0)/100 = 0.32
(67 + 0)/100 = 0.67 1/100 = 0.01
Level 5 (32 + 1)/100 = 0.33
(67 + 0)/100 = 0.67 0/100 = 0.00
0
0.2
0.4
0.6
0.8
1
Level 1 Level 2 Level 3 Level 4 Level 5
µ ν*
Figure 6: Interpretation of the first i-fuzzification scheme.
Applying the second scheme of i-fuzzification over these data, will give the results in the following Table 2, as illustrated in Figure 7.
Table 2: Application of the second i-fuzzification scheme over the data from Figure 5.
µi νi πi
Level 1 25/100 = 0.25 48/100 = 0.48 27/100 = 0.27
Level 2 6/27 = 0.22 18/27 = 0.67 3/27 = 0.11
Level 3 1/3 = 0.33 1/3 = 0.33 1/3 = 0.33
Level 4 0/1 = 0.00 0/1 = 0.00 0/1 = 0.00
Level 5 1/1 = 1.00 0/1 = 0.00 0/1 = 0.00
0
0.2
0.4
0.6
0.8
1
Level 1 Level 2 Level 3 Level 4 Level 5
µ ν*
Figure 7: Interpretation of the second i-fuzzification scheme.
4 CONCLUSION
The comparison between both i-fuzzification sche-mes shows well that in the first scheme, at every level i, the [0, 1] - interval corresponds to the initial number of t submitted bank loan applications, and
1 1, ,i iM N i = 1, …, 5, are cumulative. In comparison, in the second scheme, on every upper level i we only operate with the IF evaluations for that level, and every time the degree of uncertainty from the lower (i – 1)-th level is again re-normed to match the [0, 1] - interval (see the grey dotted lines).
Both approaches can be used interchangeably, and may prove useful in different situations, when it is necessary to evaluate the effectiveness of the different bank’s internal financial structural unit as levels of the bank’s decision making hierarchy.
Fourth International Symposium on Business Modeling and Software Design
274

ACKNOWLEDGEMENTS
The research work reported in the paper is partly supported by the project AComIn “Advanced Computing for Innovation”, grant 316087, funded by the FP7 Capacity Programme (Research Potential of Convergence Regions) and partially supported by the European Social Fund and Republic of Bulgaria, Operational Programme “Development of Human Resources” 2007-2013, Grant № BG051PO001-3.3.06-0048.
REFERENCES
Atanassov K. (1983) Intuitionistic fuzzy sets, VII ITKR's Session, Sofia, June 1983 (in Bulgarian).
Atanassov K. (1986) Intuitionistic fuzzy sets. Fuzzy Sets and Systems. Vol. 20 (1), pp. 87-96.
Atanassov K. (1999) Intuitionistic Fuzzy Sets: Theory and Applications. Physica-Verlag, Heidelberg.
Atanassov K. (2012) On Intuitionistic Fuzzy Sets Theory. Springer, Berlin.
Atanassova, V. (2013) From fuzzy to intuitionistic fuzzy: Easy and lazy. Notes on Intuitionistic Fuzzy Sets, Vol. 19, 2013, № 3, 51-55.
Shahpazov G., L. Doukovska (2012) Structuring of Growth Funds with the Purpose of SME’s Evolution under the JEREMIE Initiative, Proc. of the Second International Symposium on Business Modeling and Software Design - BMSD'12, Geneva, Switzerland, ISBN 978-989-8565-26-6, pp. 159-164.
Shahpazov G., L. Doukovska, K. Atanassov (2013) Generalized Net Model of the Methodology for Analysis of the Creditworthiness and Evaluation of Credit Risk in SMEs Financing, Proc. of the International Symposium on Business Modeling and Software Design – BMSD’13, Noordwijkerhout, The Netherlands, ISBN 978-989-8565-56-3, pp. 292-297.
Shahpazov, G., L. Doukovska (2013) Generalized net model of internal financial structural unit’s functionality with intuitionistic fuzzy estimations. Notes on Intuitionistic Fuzzy Sets, Vol. 19(3), 111-117.
Zadeh L.A. (1965) Fuzzy Sets. Information and Control Vol. 8, pp. 333-353.
Uncertainty Modeling in the Process of SMEs Financial Mechanism Using Intuitionistic Fuzzy Estimations
275
Significance of the Predictive Maintenance Strategies for SMEs
Mincho B. Hadjiski, Lyubka A. Doukovska, Stefan L. Kojnov, Vladimir V. Monov and Vassil G. Nikov
Institute of Information and Communication Technologies - Bulgarian Academy of Sciences, Acad. G. Bonchev str., bl. 2, 1113 Sofia, Bulgaria
[email protected], {doukovska, vmonov}@iit.bas.bg, [email protected], [email protected]
Keywords: Predictive Maintenance, Advanced Integrated Maintenance Management System (AIMMS), Total Productive Maintenance (TPM), Reliability Centred Maintenance (RCM).
Abstract: The predictive maintenance is key to long-term profitability of a company in the manufacturing sector it can have a big impact on the supply, quality and price. The main methods are Total Productive Maintenance (TPM) and Reliability Centered Maintenance (RCM) and they must satisfy the requirements of the various small and medium-sized enterprises (SMEs). The paper identifies the barriers to the implementation of TPM within SMEs. Based upon our analysis a methodology for an integrated management system for predictive maintenance or the Advanced Integrated Maintenance Management System (AIMMS) is presented. The results presented in this paper show that AIMMS supports strategic decisions for predictive maintenance and it helps increase the equipment effectiveness by prioritizing the criticality of the equipment focusing on specific resources, increasing profits based on the Return On Investment (ROI).
1 INTRODUCTION
The predictive maintenance includes four stages: predictive diagnosis, estimation of potential looses, decision making for device maintenance and maintenance schedule arrangement. Technological diagnosis as the basis for predictive maintenance is established field of scientific and applied invest-igations. Predictive maintenance based on diagnosis, prolongs the life of machines and aggregates, reducing downtime, maintain optimal level of prod-uction, ensure compliance with the precise timing of delivery of production (raw materials, energy), allows for effective management of maintenance of facilities.
According to the International Standardization Organization (ISO) “Prognostics is time for est-imation of damage and risk for one or several future damages”, (ISO, 13381-I, 2004). Thus technological diagnosis can be understood as a process of estimation of Remaining Useful Life (RUL) before damage occurs, which is estimated based on the current status of the facility and last operating mode.
In world practice is increasingly accepted that predictive maintenance can play a key role in the long-term profitability of a company in the
manufacturing sector with a major impact on timely delivery, product quality and its ultimate cost. The importance of maintenance increases in terms of increasing both the productivity and also the quality requirements which can only be achieved with a well-developed and organized maintenance strategy.
In this sense, according to recent advances in technology there have been developed and tested many methodologies, tools, techniques and strategies. The main methods are Total Productive Maintenance (TPM) and Reliability Centred Main-tenance (RCM); the developed options are designed to meet the specific requirements of individual users, which are usually small and medium-sized enterprises (SMEs) operating in a very dynamic business environment. This paper focuses on identifying difficulties for the implementation of TPM within SMEs.
In recent years there has been increasing interest in the operation and management of industrial main-tenance in a number of organizations. This is due to the increasing pressure on manufacturing organ-izations to meet customer and corporate require-ments; the available equipment and productivity are central to achieving this goal. According to the authors’ quote from a paper (Chan, 2005), “Recent trends show that on the whole many production
276

systems do not function as expected when it comes to cost effectiveness in terms of their operation and maintenance. Lots of companies often operate with reduced capacities and reduced productivity, while the prices of their products are high.” A number of modern maintenance practices for technical support are designed to allow organizations to target strategic resources to achieve the maintenance tasks that are considered crucial for the effective and efficient operation of the equipment such as the Total Productive Maintenance (TPM). A number of organizations announce improvements in existing equipment, reliability and reduction in the maintenance costs after the implementation of TPM; the presented results are published in (Blanchard, 1997; Cooke, 2000). The benefits of TPM are often defined as an increase in the quality of products, availability of equipment and reduction of operative costs, according to the authors of (Cholasuke, 2004; Bohoris, 1995; Al-Najjar, 1996). In (Nakajima, 1988) it is assumed that TPM is used primarily because it integrates the functions of production and maintenance, but more importantly is that it redef-ines the role of operators and support engineers.
The author of (Nakajima, 1988) Nakajima is often accepted as the founder of the Total Productive Maintenance, (TPM); he assumes that the goal of TPM is to increase the efficiency of the equipment as well as to maximize the volume of production from this equipment. This is the result of an effort to achieve and maintain optimal conditions for the equipment in order to prevent unexpected failures, the speed decrease and the qualitative defects during the manufacturing process according to (Bamber, 1999). Via the application of TPM it is also expected to be possible to raise the moral of employees and their satisfaction from the job, suggesting the integration of workers into every aspect of the applied TPM. The majority of generally accepted definitions in TPM, used in (Barnes, 2002; Baglee, 2003; Baglee, 2010), are based on five main pillars outlined by Nakajima.
2 INTEGRATED MANAGEMENT SYSTEMS
Since 1996, the management of industrial sites is aware of the need of implementing systems to support all business processes (Dochain, 2008; The ANSVISA 95 Enterprise, 2005). These systems are known as Enterprise Resource Planning (ERP). Systems of this type are rapidly moving in large
industrial complexes, but they remain almost completely cut off from existing DSC or SCADA. “Islands of automation” appear that are not at all related informationally and functionally to the general business management. Since the beginning of the 21st century this fragmentation begins to be overcome with the introduction of an intermediate layer of management – the Manufacturing Execution Systems (MES) (ISA the Instrumentation, Systems and Automation Society, 2005). These systems are a bridge between the technology management and the business management, so they perform a variety of roles for the operational management.
The purpose in (Staykov, 2013) is to make an analysis and assessment of the increasing need of using sophisticated software systems for managing business processes. The most important thing is the information and the success of every business depends on how fast and effective managers deal with information.
The structure of the integrated management systems primarily reflects the functions that must be implemented in a modern integrated management system of an industrial enterprise. It does not contain in itself a generalization of the methods and the tools for integration. This is essential, especially in the wide variety of engineering solutions that the world's leading providers offer. Therefore the accepted in 2005 standard ISA-95 is of great help to overcome internal fragmentation between control functions, built most often with different strategies, a specific vision and with a different magnitude. This is an international standard for the integration of business systems and control systems for the production processes shown in Figure 1.
This structure is operative and it includes next four hierarchical levels.
Level 1 and Level 2 are functionally grouped and comprise the management of individual devices and parameters. The generic name Process Control Systems (PCS) is accepted for them. The so formed block for Technological Management is treated as a generalized function in the specific problems (design, operation, adjustment) and it can be seen as composed of two levels. The timeline of the PCS-level are hours, minutes and seconds.
Level 3 comprises all tasks of operative manage-ment and it is accepted to be marked as MES. The main functions of this level are: Complete description of the production schedule; Management of production resources (people,
equipment, materials); Specific dispatching of production with an
Significance of the Predictive Maintenance Strategies for SMEs
277
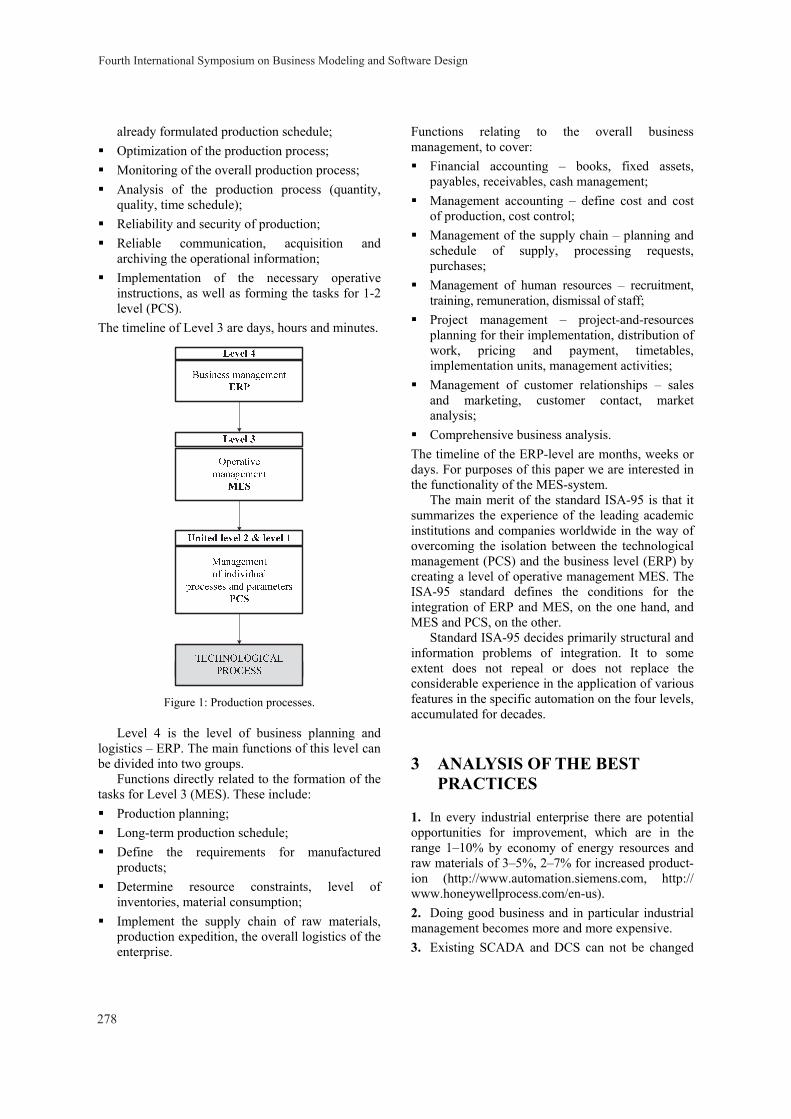
already formulated production schedule; Optimization of the production process; Monitoring of the overall production process; Analysis of the production process (quantity,
quality, time schedule); Reliability and security of production; Reliable communication, acquisition and
archiving the operational information; Implementation of the necessary operative
instructions, as well as forming the tasks for 1-2 level (PCS).
The timeline of Level 3 are days, hours and minutes.
Figure 1: Production processes.
Level 4 is the level of business planning and logistics – ERP. The main functions of this level can be divided into two groups.
Functions directly related to the formation of the tasks for Level 3 (MES). These include: Production planning; Long-term production schedule; Define the requirements for manufactured
products; Determine resource constraints, level of
inventories, material consumption; Implement the supply chain of raw materials,
production expedition, the overall logistics of the enterprise.
Functions relating to the overall business management, to cover: Financial accounting – books, fixed assets,
payables, receivables, cash management; Management accounting – define cost and cost
of production, cost control; Management of the supply chain – planning and
schedule of supply, processing requests, purchases;
Management of human resources – recruitment, training, remuneration, dismissal of staff;
Project management – project-and-resources planning for their implementation, distribution of work, pricing and payment, timetables, implementation units, management activities;
Management of customer relationships – sales and marketing, customer contact, market analysis;
Comprehensive business analysis. The timeline of the ERP-level are months, weeks or days. For purposes of this paper we are interested in the functionality of the MES-system.
The main merit of the standard ISA-95 is that it summarizes the experience of the leading academic institutions and companies worldwide in the way of overcoming the isolation between the technological management (PCS) and the business level (ERP) by creating a level of operative management MES. The ISA-95 standard defines the conditions for the integration of ERP and MES, on the one hand, and MES and PCS, on the other.
Standard ISA-95 decides primarily structural and information problems of integration. It to some extent does not repeal or does not replace the considerable experience in the application of various features in the specific automation on the four levels, accumulated for decades.
3 ANALYSIS OF THE BEST PRACTICES
1. In every industrial enterprise there are potential opportunities for improvement, which are in the range 1–10% by economy of energy resources and raw materials of 3–5%, 2–7% for increased product-ion (http://www.automation.siemens.com, http:// www.honeywellprocess.com/en-us). 2. Doing good business and in particular industrial management becomes more and more expensive. 3. Existing SCADA and DCS can not be changed
Fourth International Symposium on Business Modeling and Software Design
278
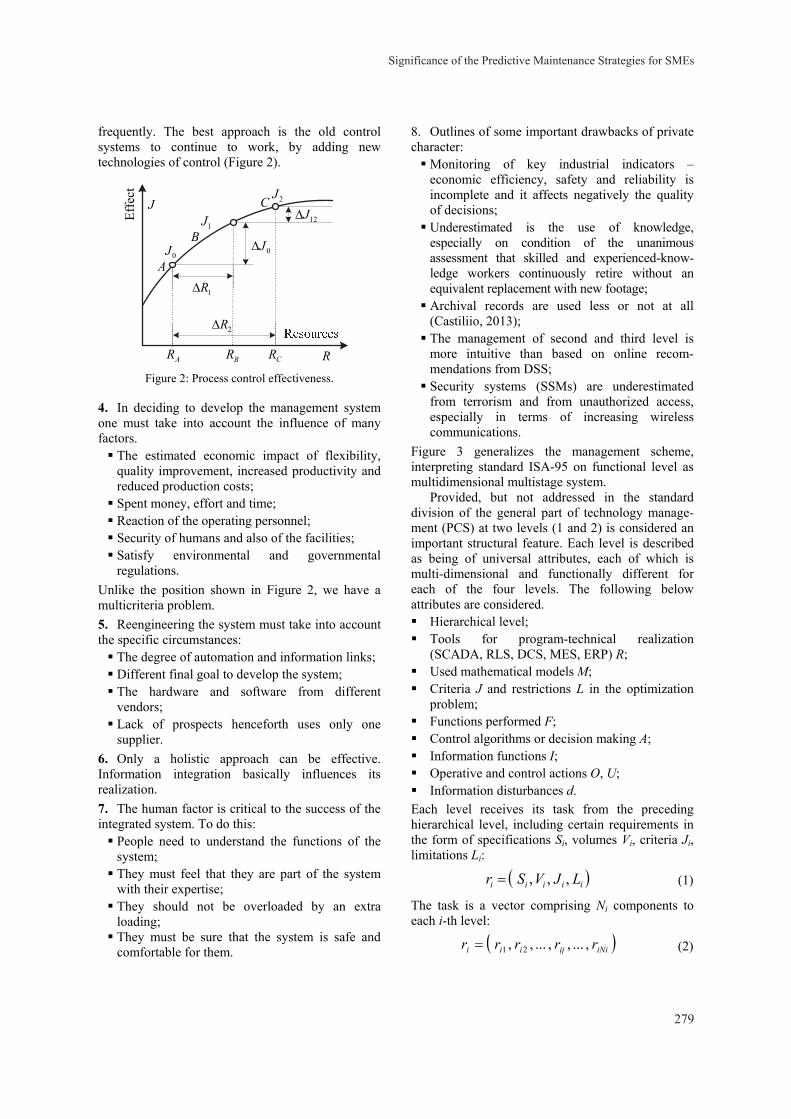
frequently. The best approach is the old control systems to continue to work, by adding new technologies of control (Figure 2).
A
B
C
Effe
ct
J
0J
1J
2J
1R
AR BR CR R
0J
12J
2R
Figure 2: Process control effectiveness.
4. In deciding to develop the management system one must take into account the influence of many factors. The estimated economic impact of flexibility,
quality improvement, increased productivity and reduced production costs; Spent money, effort and time; Reaction of the operating personnel; Security of humans and also of the facilities; Satisfy environmental and governmental
regulations. Unlike the position shown in Figure 2, we have a multicriteria problem. 5. Reengineering the system must take into account the specific circumstances: The degree of automation and information links; Different final goal to develop the system; The hardware and software from different
vendors; Lack of prospects henceforth uses only one
supplier. 6. Only a holistic approach can be effective. Information integration basically influences its realization. 7. The human factor is critical to the success of the integrated system. To do this: People need to understand the functions of the
system; They must feel that they are part of the system
with their expertise; They should not be overloaded by an extra
loading; They must be sure that the system is safe and
comfortable for them.
8. Outlines of some important drawbacks of private character: Monitoring of key industrial indicators –
economic efficiency, safety and reliability is incomplete and it affects negatively the quality of decisions; Underestimated is the use of knowledge,
especially on condition of the unanimous assessment that skilled and experienced-know-ledge workers continuously retire without an equivalent replacement with new footage; Archival records are used less or not at all
(Castiliio, 2013); The management of second and third level is
more intuitive than based on online recom-mendations from DSS; Security systems (SSMs) are underestimated
from terrorism and from unauthorized access, especially in terms of increasing wireless communications.
Figure 3 generalizes the management scheme, interpreting standard ISA-95 on functional level as multidimensional multistage system.
Provided, but not addressed in the standard division of the general part of technology manage-ment (PCS) at two levels (1 and 2) is considered an important structural feature. Each level is described as being of universal attributes, each of which is multi-dimensional and functionally different for each of the four levels. The following below attributes are considered. Hierarchical level; Tools for program-technical realization
(SCADA, RLS, DCS, MES, ERP) R; Used mathematical models М; Criteria J and restrictions L in the optimization
problem; Functions performed F; Control algorithms or decision making А; Information functions I; Operative and control actions О, U; Information disturbances d. Each level receives its task from the preceding hierarchical level, including certain requirements in the form of specifications Si, volumes Vi, criteria Ji, limitations Li:
iiiii LJVSr , , , (1)
The task is a vector comprising Ni components to each i-th level:
iNiijiii rrrrr , ... , , ... , , 21 (2)
Significance of the Predictive Maintenance Strategies for SMEs
279
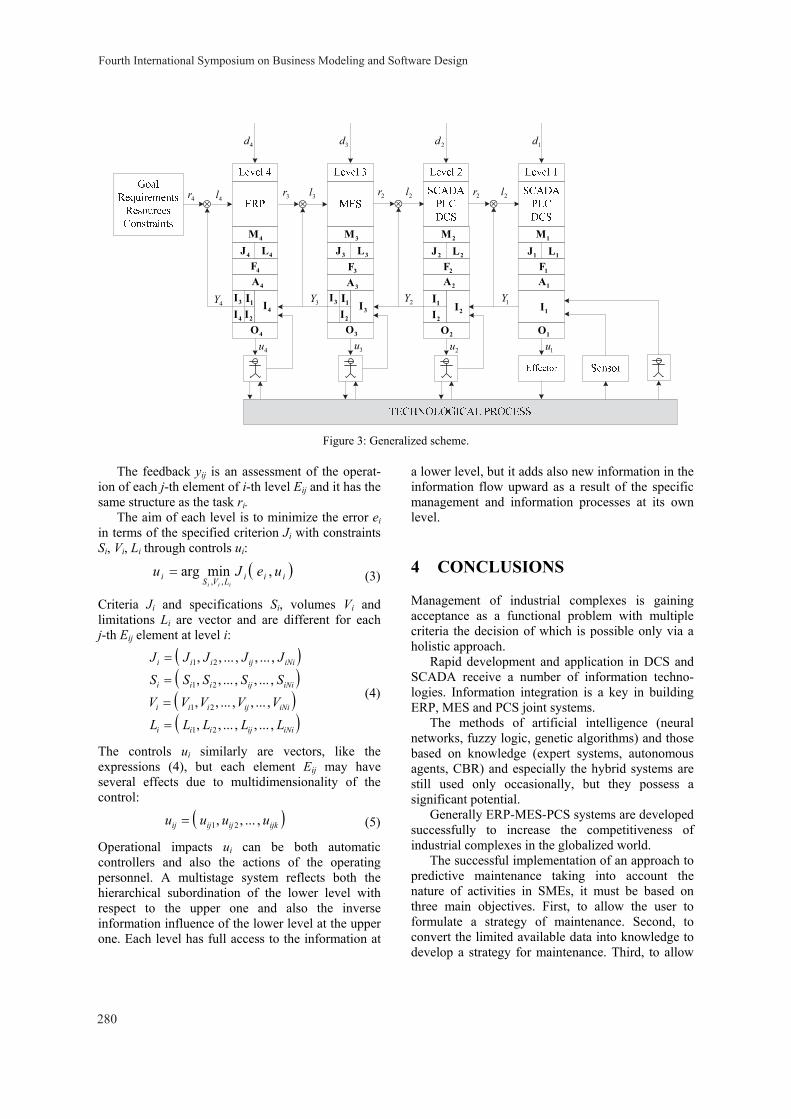
3M
3J 3L
3F
3r 3l
4M
3I 1I4I 2I 4I
4F
4O
4J 4L
3A4A
3O
3I 1I2I 3I
2M
2J 2L
2F2A
2O
1I2I 2I
2r 2l
1I
2r 2l
1M
1J 1L
1F1A
1O
1d2d3d4d
4r 4l
4Y 3Y 2Y 1Y
4u 3u 2u 1u
Figure 3: Generalized scheme.
The feedback yij is an assessment of the operat-ion of each j-th element of i-th level Eij and it has the same structure as the task ri.
The aim of each level is to minimize the error ei in terms of the specified criterion Ji with constraints Si, Vi, Li through controls ui:
iiiLVSi ueJuiii
, min arg,,
(3)
Criteria Ji and specifications Si, volumes Vi and limitations Li are vector and are different for each j-th Eij element at level i:
iNiijiii
iNiijiii
iNiijiii
iNiijiii
LLLLL
VVVVV
SSSSS
JJJJJ
, ... , , ... , ,
, ... , , ... , ,
, ... , , ... , ,
, ... , , ... , ,
21
21
21
21
(4)
The controls ui similarly are vectors, like the expressions (4), but each element Eij may have several effects due to multidimensionality of the control:
ijkijijij uuuu , ... , , 21 (5)
Operational impacts ui can be both automatic controllers and also the actions of the operating personnel. A multistage system reflects both the hierarchical subordination of the lower level with respect to the upper one and also the inverse information influence of the lower level at the upper one. Each level has full access to the information at
a lower level, but it adds also new information in the information flow upward as a result of the specific management and information processes at its own level.
4 CONCLUSIONS
Management of industrial complexes is gaining acceptance as a functional problem with multiple criteria the decision of which is possible only via a holistic approach.
Rapid development and application in DCS and SCADA receive a number of information techno-logies. Information integration is a key in building ERP, MES and PCS joint systems.
The methods of artificial intelligence (neural networks, fuzzy logic, genetic algorithms) and those based on knowledge (expert systems, autonomous agents, CBR) and especially the hybrid systems are still used only occasionally, but they possess a significant potential.
Generally ERP-MES-PCS systems are developed successfully to increase the competitiveness of industrial complexes in the globalized world.
The successful implementation of an approach to predictive maintenance taking into account the nature of activities in SMEs, it must be based on three main objectives. First, to allow the user to formulate a strategy of maintenance. Second, to convert the limited available data into knowledge to develop a strategy for maintenance. Third, to allow
Fourth International Symposium on Business Modeling and Software Design
280
the user to record and measure the effect of the new strategy for support, to ensure that future decisions are based on facts and accurate data. The successful implementation of the formed in this way model would lead to the possibility the structure and the elements of the model to create efficient and effective strategy to support SMEs.
The main problem in developing a maintenance strategy is bounded by the lack of appropriate documentation and the ineffective analysis of available data. The reasons for this may be the lack of time for an understanding of the existing technology, and human relations in general. In particular, the staff must record their deeds and actions that relate to the problem; besides there must be measured the quantifiable, measurable benefits, which in the short term is difficult to achieve. Progress is possible if you use a simple system for recording and analysis that can be easily accessed and updated. The present research shows that technology is able to solve emerging needs but it requires innovative adaptations to solve the existing problems.
ACKNOWLEDGEMENTS
The research work reported in the paper is partly supported by the project AComIn “Advanced Computing for Innovation”, grant 316087, funded by the FP7 Capacity Programme (Research Potential of Convergence Regions), partially supported by the European Social Fund and Republic of Bulgaria, Operational Programme “Development of Human Resources” 2007-2013, Grant № BG051PO001-3.3.06-0048 and partially supported under the Project № DVU-10-0267/10.
REFERENCES
http://www.automation.siemens.com http://www.honeywellprocess.com/en-us Al-Najjar B., 1996. Total Quality Maintenance. In Journal
of Quality in Maintenance Engineering 2 (3), 4–20. Baglee D., M. Knowles, 2010. Maintenance strategy
development within SMEs: the development of an integrated approach, In Journal Control and Cybernetics, 39 (1), 275–303.
Baglee D., R. Trimble, J. MacIntyre, 2003. An invest-igation into the perceived barriers to total Productive Maintenance in small and medium enterprises. In International Conference on Manufacturing Research, University of Strathclyde, Professional Engineering Publishing.
Bamber C. J., J. M. Sharp., M. T. Hides, 1999. Factors affecting successful implementation of TPM: A case study perspective. In Journal of Quality in Maintenance Engineering 5 (3), 162–181.
Barnes D., 2002. The complexities of the manufacturing strategy formation process in practice. In International Journal of Operations and Production Management 22 (10), 1090–1111.
Blanchard B., 1997. An enhanced approach for implementing TPM in the manufacturing environment, In Journal of Quality in Maintenance Engineering 3 (2), 69-80.
Bohoris G. A., C. Vamvalis, W. Trace, K. Ignatiadou, 1995. TPM implementation in Land-Rover with the assistance of a CMMS. In Journal of Quality in Maintenance Engineering, 1 (4), 3–16.
Castillio О., P. Melinand, J. Kasprzyk, (Eds), 2013. Recent Advantages on Hybrid Intelligent Systems, Springer.
Chan F., F. Lau, S. Chan, S. Kong, 2005. Implementation of Total Productive Maintenance: A case study. In International Journal of Production Economics 95(1), 71–94.
Cholasuke C. R., R. Bhardwa, A. Jiju, 2004. The status of maintenance management in UK manufacturing organisations: results from a pilot survey. In Journal of Quality in Maintenance Engineering 10 (1), 5–15.
Cooke F. L., 2000. Implementing TPM in plant maintenance: Some organizational barriers. In International Journal of Quality & Reliability Management 17 (9), 1003–1016.
Dochain D., W. Marquardt, S. Won, О. Malik, М. Kinnaert, J. Lunze, 2008. Monitoring and Control of Process and Power Systems: Adapting to Environmental Challenges, Increasing Competitivity and Changing Customer and Consumer Demands, In IFAC World Congress, Seoul, Korea, 7160–7171.
ISA the Instrumentation, Systems and Automation Society, 2005. The ANSVISA 95 Enterprise — Control System Integration, Research Triangle Park, NC, USA.
ISO 13381-I, 2004. Condition monitoring and diagnostics of machines-prognostics – Part: General guidelines. Int. Standard, ISO.
Nakajima S., 1988. Introduction to TPM: Total Productive Maintenance. London, Productivity Press.
Staykov B., T. Atanasova, V. Monov, L. Doukovska, 2013. The ERP Systems in Modern Business and Corporate Management, In Proceedings of the International Symposium on Business Modeling and Software Design – BMSD’13, Noordwijkerhout, The Netherlands, 281–285.
Significance of the Predictive Maintenance Strategies for SMEs
281

Artificial Intelligence Neural Networks Applications in Forecasting Financial Markets and Stock Prices
Veselin L. Shahpazov, Lyubka A. Doukovska and Dimitar N. Karastoyanov Institute of Information and Communication Technologies, Bulgarian Academy of Sciences,
Acad. G. Bonchev str., bl. 2, 1113 Sofia, Bulgaria [email protected], [email protected], [email protected]
Keywords: Artificial Neural Network, Business, Predicting Stock Prices, Review, Historic Development.
Abstract: The interest in using artificial neural networks (ANN’s) for forecasting has led to a tremendous surge in research activities over time. Artificial Neural Networks are flexible computing frameworks and universal approximators that can be applied to a wide range of time series forecasting problems with a high degree of accuracy. Forecasting problems arise in so many different disciplines and the literature on forecasting using ANN’s is scattered in so many diverse fields that it is hard for a researcher to be aware of all the work done to date in the area. There is an extensive literature in financial applications of ANN’s. Naturally forecasting stock price or financial markets has attracted considerable interest and it has been one of the biggest challenges. This paper reviews the history of the application of artificial neural networks for forecasting future stock prices. From the introduction of the back-propagation algorithm in 1980’s for training an MLP neural network by Werbos, who used this technique to train a neural network and claimed that neural networks are better than regression methods and Box-Jenkins model in prediction problems through the application of such technics to financial markets forecasting by pioneers in the field like White, Kimoto and Kamijo to the more recent studies of stocks prices in not only the biggest capital markets but also in some emerging and illiquid markets, we will look at the progress made in the past more than twenty five years of research.
1 INTRODUCTION
It is nowadays a common notion that vast amounts of capital are traded through the stock markets all around the world. National economies are strongly linked and heavily influenced from the performance of their stock markets. Moreover, recently the markets have become a more accessible investment tool, not only for strategic investors but for common people as well. Consequently they are not only related to macroeconomic parameters, but they influence everyday life in a more direct way. Therefore, they constitute a mechanism which has important and direct social impacts.
The characteristic that all stock markets have in common is the uncertainty, which is related with their short and long-term future state. This feature is undesirable for the investor but it is also unavoidable whenever the Stock Market is selected as the investment tool. The best that one can do is to try to reduce this uncertainty. The Stock Market prediction task divides researchers and academics into two
groups those who believe that we can devise mechanisms to predict the market and those who believe that the market is efficient and whenever new information comes up the market absorbs it by correcting itself, thus there is no space for prediction (EMH). Furthermore they believe that the Stock Market follows a Random Walk, which implies that the best prediction you can have about tomorrow’s value is today’s value.
In literature a number of different methods have been applied in order to predict Stock Market returns. These methods can be grouped in four major categories: 1) Technical Analysis Methods, 2) Fundamental Analysis Methods, 3) Traditional Time Series Forecasting and 4) Machine Learning Methods. Technical analysts, known as chartists, attempt to predict the market by tracing patterns that come from the study of charts which describe historic data of the market. Fundamental analysts study the intrinsic value of an stock and they invest on it if they estimate that its current value is lower that it’s intrinsic value. In Traditional Time Series
282
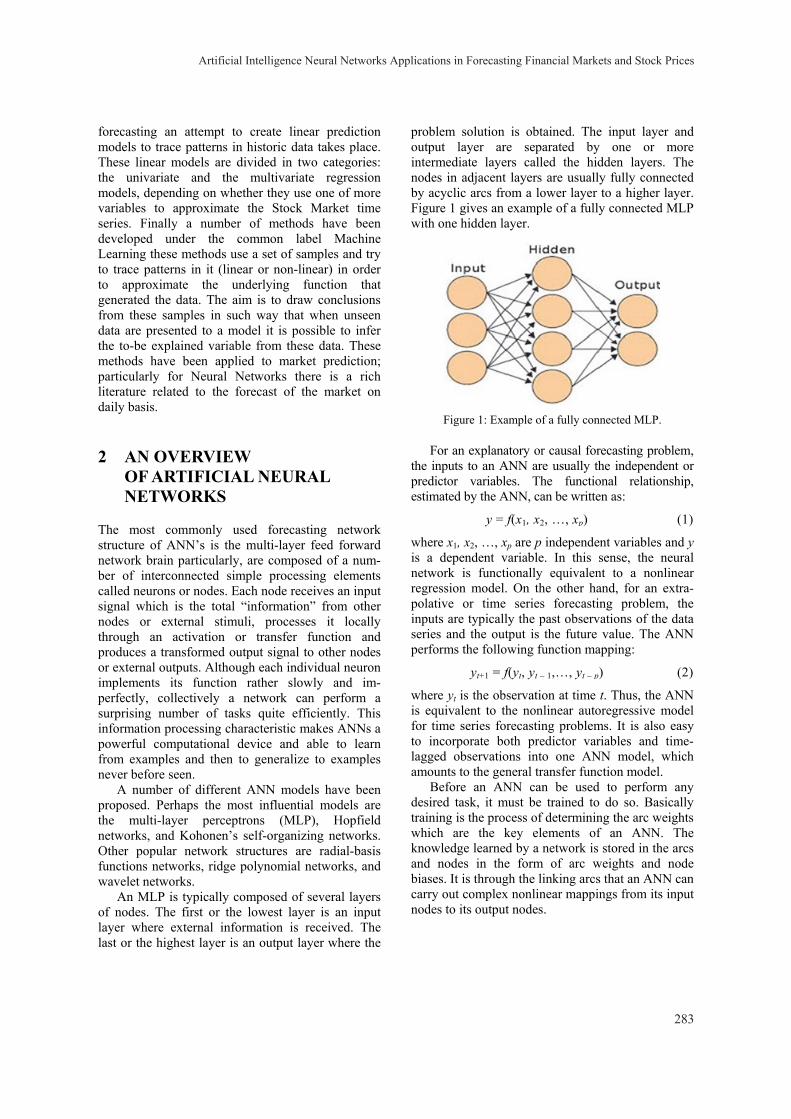
forecasting an attempt to create linear prediction models to trace patterns in historic data takes place. These linear models are divided in two categories: the univariate and the multivariate regression models, depending on whether they use one of more variables to approximate the Stock Market time series. Finally a number of methods have been developed under the common label Machine Learning these methods use a set of samples and try to trace patterns in it (linear or non-linear) in order to approximate the underlying function that generated the data. The aim is to draw conclusions from these samples in such way that when unseen data are presented to a model it is possible to infer the to-be explained variable from these data. These methods have been applied to market prediction; particularly for Neural Networks there is a rich literature related to the forecast of the market on daily basis.
2 AN OVERVIEW OF ARTIFICIAL NEURAL NETWORKS
The most commonly used forecasting network structure of ANN’s is the multi-layer feed forward network brain particularly, are composed of a num-ber of interconnected simple processing elements called neurons or nodes. Each node receives an input signal which is the total “information” from other nodes or external stimuli, processes it locally through an activation or transfer function and produces a transformed output signal to other nodes or external outputs. Although each individual neuron implements its function rather slowly and im-perfectly, collectively a network can perform a surprising number of tasks quite efficiently. This information processing characteristic makes ANNs a powerful computational device and able to learn from examples and then to generalize to examples never before seen.
A number of different ANN models have been proposed. Perhaps the most influential models are the multi-layer perceptrons (MLP), Hopfield networks, and Kohonen’s self-organizing networks. Other popular network structures are radial-basis functions networks, ridge polynomial networks, and wavelet networks.
An MLP is typically composed of several layers of nodes. The first or the lowest layer is an input layer where external information is received. The last or the highest layer is an output layer where the
problem solution is obtained. The input layer and output layer are separated by one or more intermediate layers called the hidden layers. The nodes in adjacent layers are usually fully connected by acyclic arcs from a lower layer to a higher layer. Figure 1 gives an example of a fully connected MLP with one hidden layer.
Figure 1: Example of a fully connected MLP.
For an explanatory or causal forecasting problem, the inputs to an ANN are usually the independent or predictor variables. The functional relationship, estimated by the ANN, can be written as:
y = f(x1, x2, …, xp) (1)
where x1, x2, …, xp are p independent variables and y is a dependent variable. In this sense, the neural network is functionally equivalent to a nonlinear regression model. On the other hand, for an extra-polative or time series forecasting problem, the inputs are typically the past observations of the data series and the output is the future value. The ANN performs the following function mapping:
yt+1 = f(yt, yt – 1,…, yt – p) (2)
where yt is the observation at time t. Thus, the ANN is equivalent to the nonlinear autoregressive model for time series forecasting problems. It is also easy to incorporate both predictor variables and time-lagged observations into one ANN model, which amounts to the general transfer function model.
Before an ANN can be used to perform any desired task, it must be trained to do so. Basically training is the process of determining the arc weights which are the key elements of an ANN. The knowledge learned by a network is stored in the arcs and nodes in the form of arc weights and node biases. It is through the linking arcs that an ANN can carry out complex nonlinear mappings from its input nodes to its output nodes.
Artificial Intelligence Neural Networks Applications in Forecasting Financial Markets and Stock Prices
283
3 ANN APPLICATIONS AS FORECASTING TOOLS
Forecasting problems arise in so many different disciplines and the literature on forecasting using ANNs is scattered in so many diverse fields that it is hard for a researcher to be aware of all the work done to date in the area. One of the first successful applications of ANNs in forecasting is reported by Lapedes and Farber. Using two deterministic chaotic time series generated by the logistic map and the Glass Mackey equation, they designed the feed-forward neural networks that can accurately mimic and predict such dynamic nonlinear systems. Their results show that ANNs can be used for modelling and forecasting nonlinear time series with very high accuracy. After that a number of papers were devoted to using ANNs to analyse and predict deterministic chaotic time series with and/or without noise. Chaotic time series occur mostly in engine-ering and physical science since most physical phenomena are generated by nonlinear chaotic systems. As a result, many authors in the chaotic time series modelling and forecasting are from the field of physics.
There is an extensive literature in financial applications of ANNs. ANNs have been used for forecasting bankruptcy and business failure, foreign exchange rate, stock prices off course. Another major application of neural network forecasting is in electric load consumption study.
Many other forecasting problems have been solved by ANNs. A short list includes airborne pollen commodity prices, environmental tempera-ture; helicopter component loads international airline passenger traffic macroeconomic indices, ozone level, personnel inventory, rainfall, river flow, stu-dent grade point averages, tool life, total industrial production, transportation, and wind pressure and wind pressure and many more.
4 ANN AND STOCK MARKET FORECASTING
The idea of using neural networks for predicting problems was first expressed in (Hu, 1964) which was used for weather forecasting. The absence of any learning method for multi-layer networks made it impossible to apply these networks to complex prediction problems. But in 1980’s the back-propagation algorithm was introduced for training an MLP neural network. Werbos used this technique to
train a neural network (Werbos, 1988) and claimed that neural networks are better than regression methods and Box-Jenkins model in prediction problems.
In recent years so many researches have been done on neural networks to predict the financial markets and the stock market changes in particular. Probably the first paper in the vast field, at least from today’s perspective of stock market prediction with ANN’s is (White, 1988), in which the main focus is to try to prove wrong the Efficient Market Hypothesis. In its simplest form, this hypothesis asserts that asset prices follow a random walk that is, the movement of an asset's price is completely unpredictable from publicly available information such as the price and volume history for the asset itself or that of any other asset.
One of the first efforts was by Kimoto and his colleagues in which they used neural networks to predict the index of Tokyo stock market (Kimoto et al., 1990). They used several neural networks trained to learn the relationships between past values of various technical and economic indices for obtaining the expected returns of the TOPIX. The TOPIX is a weighted average of all stocks listed on the Tokyo Stock Exchange. The used technical and economic indices are: the vector curve (an indicator of market momentum), turnover, interest rate, foreign exchange rate and the value of the DJIA (Dow Jones Industrial Average). The desired output of the networks is a weighted sum, few weeks, of the logarithm of the ratio of the TOPIX at the end of week t to the TOPIX value at the end of week (t – 1) and the desired output is a weighted sum of rt for some weeks. The future extraction is not explained in this paper, except for the fact that some irregul-arity is removed and logarithm function is used before normalization.
In (Kamijo, Tanigawa, 1990) is proposed the use of “Elman recurrent net” (recurrent neural network is class of neural network, where connections between units form a directed cycle. This creates an internal state of the network which allows it to exhibit dynamic temporal behaviour) for predicting the future stock prices using extracted features from past daily high, low and closing stock prices. Unlike feed-forward neural networks, RNNs can use their internal memory to process arbitrary sequences of inputs. The method used tries to extract triangle patterns in stock prices which are seen on the daily high, low and closing graph. A triangle is usually seen as a beginning of a sudden stock price rise after that the high and low prices appear and the price oscillates for a period of time before the lines
Fourth International Symposium on Business Modeling and Software Design
284
converge. The ANN is trained to recognize this pattern in the stock prices.
Matsuba uses a feed-forward NN with the last n stock index values as inputs and the next N – n values as the outputs (Matsuba, 1991). This is an N – n step ahead prediction. Thus, if the index for the n-th day is denoted by Xn then, the inputs are X1, X2, …, Xn and the outputs are Xn+1, Xn+2, …, XN. If such a network is trained, any correlation between the index values for n + 1 through N-th day will be neglected. To ensure that this does not happen, the network is trained with errors between the desired and actual outputs in addition to the n inputs. These errors will then be Xn – 1 – Yn+1, …, where Y is the output of the network. As the training proceeds this error will tend to zero and these additional inputs are not required in the testing phase.
In his work Freisleben used a simple feed-forward NN trained using past and present data to predict the value of the FAZ Index (Freisleben, 1992). Input data includes the moving average of past 5 and 10 weeks of the FAZ Index a first order difference of the FAZ Index and its moving average, the present bond market index and its first order difference and the Dollar-Mark exchange rate along with its first order difference. The value of the FAZ Index is predicted for the next week based on this data. The neural network is trained for the past M weeks and is then tested based on data for the next L weeks, where M is called the training window and L is called the testing window. For every successive prediction, the windows are shifted ahead and the network is retrained.
In (Azoff, 1994) is outlined that networks are computer program that can recognize patterns in data, learn from this and make forecasts of future patterns. At the time, there were just over 20 commercially available neural network programs designed for use on financial markets and there have been some notable reports of their successful application. However, like any other computer program, neural networks are only as good as the data they are given and the questions that are asked of them. Proper use of a neural network involves spending time understanding and cleaning the data: removing errors, pre-processing and post-pro-cessing. His book provides the knowledge that is required for the proper design and use of ANN’s in financial markets forecasting – with an emphasis on futures trading.
In (Kaastra, Boyd, 1995) is provided a practical, non-technical introduction to designing a neural network forecasting model using economic time series data (16). The procedure of designing a model
is divided into eight steps: 1) variable selection; 2) data collection; 3) data pre-processing; 4) training, testing and validation sets; 5) neural network paradigms; 6) evaluation criteria; 7) neural network training; and 8) implementation. Three major conclusions are made, the first being that researchers must have the time resources and patience to experiment mainly because of the nature financial markets. The second is that NN software must allow automated routines such as walk-forward testing, optimization of hidden neurons and testing of input variable combinations, either through direct programming or the use of batch or script files. And third the researcher must maintain a good set of records that list all parameters for each network tested since any parameter may turn out to cause a significant change in neural network performance.
In (Leung, Daouk, Chen, 2000) is conducted a research which focuses on estimating the level of return on stock market index. Given the notion that a prediction with little forecast error does not necessarily translate into capital gain, they evaluate the efficacy of several multivariate classification techniques relative to a group of level estimation approaches. Among the level estimation counter-parts, which forecast the level, are exponential smoothing are the multilayered feed-forward neural network and a probabilistic neural network.
With the introduction of electronic communic-ation networks (ECN) as electronic trading systems facilitating trading of stocks and other financial products in the world’s leading stock exchanges at first and later on other non-mainstream stock markets, and the constantly growing interest by both retail and institutional investors all around the world in stock’s investing, the research in this field exploded. The advancement in computational and communicational power allowed researchers to develop models using artificial neural networks that are fed with real time data and capable to produce real time buy and sell signals.
In (Pan, Tilakaratne, Yearwood, 2005) is presented a computational approach for predicting the Australian stock market index – AORD using multi-layer feed-forward neural networks from the time series data of AORD and various interrelated markets. This effort aims to discover an effective neural network or a set of adaptive neural networks for this prediction purpose, which can exploit or model various dynamical swings and inter-market influences discovered from professional technical analysis and quantitative analysis.
Kalyvas attempts to predict the daily excess returns of FTSE 500 and S&P 500 indices over the
Artificial Intelligence Neural Networks Applications in Forecasting Financial Markets and Stock Prices
285
respective Treasury Bill rate returns (Kalyvas, 2001). Then the author applies two different types of prediction models: Autoregressive (AR) and feed-forward Neural Networks (NN) to predict the excess returns time series using lagged values. For the NN models a Genetic Algorithm is constructed in order to choose the optimum topology. Data consists of 3275 daily observations of FTSE-100 index, UK T-Bill Rates and 3277 observations of S&P-500 index and US T-Bill Rates from 4 Jan 1988 until 12 Dec 2000. Finally he evaluates the prediction models on four different metrics and concludes that they do not manage to outperform significantly the prediction abilities of naive predictors.
In their study (Chen, Leung, Daouk, 2003) the authors attempt to model and predict the direction of market index of the Taiwan Stock Exchange, one of the fastest growing financial exchanges in the developing Asian countries (considered an emerging market). The probabilistic neural network (PNN) is used to forecast the direction of index return after it is trained by historical data. Statistical performance of the PNN forecasts are measured and compared with that of the generalized methods of moments (GMM) with Kalman filter. Moreover, the forecasts are applied to various index trading strategies, of which the performances are compared with those generated by the buy-and-hold strategy as well as the investment strategies guided by forecasts estimated by the random walk model and the parametric GMM models. They conclude that empirical results show that the PNN-based investment strategies obtain higher returns than other investment strategies examined in this study.
In (Kim, Lee, 2004) is compared a feature transformation method using genetic algorithm with two conventional methods for artificial neural networks. The genetic algorithm is incorporated to improve the learning and generalization abilities of ANN’s for stock market prediction. Daily predictions are conducted and their accuracy is measured. The authors use the proposed model to predict South Korea composite stock price index (KOSPI). The comparison of the results achieved by a feature transformation method using a genetic algorithm to other feature transformation methods shows that the proposed model performs better. Experimental results show that the proposed model reduces the dimensionality of the feature space and decreases irrelevant factors for stock market predictions.
In (Kim, 2006) is proposed a genetic algorithm approach to instance selection in artificial neural networks for financial data mining. He notes that
artificial neural networks have preeminent learning ability, but often exhibit inconsistent and unpredict-able performance for noisy data. In addition, it may not be possible to train ANN’s or the training task cannot be effectively carried out without data reduction when the amount of data is so large. The proposed model uses a genetic algorithm to optimize simultaneously the connection weights between layers and a selection task for relevant instances. The globally evolved weights mitigate the well-known limitations of gradient descent algorithm. In addition, genetically selected instances shorten the learning time and enhance prediction performance.
In (Madden, O’Connor, 2006) is evaluated the effectiveness of using external indicators, such as commodity prices and currency exchange rates, in predicting movements in the Dow Jones Industrial Average index. The performance of each technique is evaluated using different domain-specific metrics. A comprehensive evaluation procedure is described, involving the use of trading simulations to assess the practical value of predictive models, and comparison with simple benchmarks that respond to underlying market growth. In the experiments presented, basing trading decisions on a neural network trained on a range of external indicators resulted in a return on investment of 23.5% per annum, during a period when the DJIA index grew by 13.03% per annum.
In (Gosh, 2012) is presented a hybrid neural-evolutionary methodology to forecast time-series and prediction of the NASDAQ stock price in particular. The methodology is hybrid because an evolutionary computation-based optimization process is used to produce a complete design of a neural network. The produced neural network, as a model, is then used to forecast the time-series. The model identification process involves data manipulation and a highly experienced statistician to do the work. Compared to previous work, this paper approach is purely evolutionary, while others use mixed, mainly combined with back-propagation, which is known to get stuck in local optima. On the direction of model production, the evolutionary process automates the identification of input variables, allowing the user to avoid data pre-treatment and statistical analysis. The study proves the nimbleness of ANN as a predictive tool for Financial Time series Prediction. Furthermore, Conjugate Gradient Descent is proved to be an efficient Back-propagation algorithm that can be adopted to predict the average stock price of NASDAQ.
In (Chen, Du, 2013) are studied the interactions between social media and financial markets. The authors use a popular online Chinese stock forum
Fourth International Symposium on Business Modeling and Software Design
286
Guba.com.cn as well as traditional sentimental analysis methods, for each stock, they build a Social Behaviour Graph based on human’s online behaviour, calculate key characteristics of the graph, and find out the correlations between trading volume/price and those characteristics. They make use of a back-propagation neural network to predict the trading volume and price of stocks from the Shanghai/Shenzhen Stock Exchange in China. Their method has achieved better outcome compared to the traditional trading volume/price based time series models. A trading strategy based on this method achieved 56.28% benefits for a period of three month, during which the stock index increased by only 1.17%.
5 CONCLUSION
This paper surveyed the application of neural networks to financial systems. It demonstrated how neural networks have been used to test the Efficient Market Hypothesis and how they outperform statistical and regression techniques in forecasting share prices. Although neural networks are not perfect in their prediction, they outperform all other methods and provide hope that one day we can more fully understand dynamic, chaotic systems such as the stock market.
Nowadays the technical advancement in comput-ational power has served researchers to implement ANN’s and obtain results faster and easier.
The Efficient Market Hypothesis is being heavily criticized and rejected mainly because of the fact that not all market participants possess the same amount of information and speed of access to the market and so on. This fact is encourages even more researchers to look for ways to predict the stock markets using the machine learning methods and artificial neural networks in particular.
Great deal of work has been done in the field since the late 1980’s and progress has been substantial, putting ANN’s in the centre of sophisticated models for predicting stock markets all around the world, from mainstream market indexes like the Daw Jones IA and S&P 500 through the Emerging markets of the BRIC to the less liquid financial markets in Eastern Europe, Latin and South America and the Middle and Far East.
ACKNOWLEDGEMENTS
The research work presented in this paper is partially
supported by the FP7 grant AComIn №316087, funded by the European Commission in Capacity Programme in 2012-2016 and by the European Social Fund and Republic of Bulgaria, Operational Programme “Development of Human Resources” 2007-2013, Grant № BG051PO001-3.3.06-0048 from 04.10.2012.
REFERENCES
Azoff E. M., 1994. Neural Network Time Series Forecasting of Financial Markets. John Wiley&Sons.
Chen A. S., M. T. Leung, H. Daouk, 2003. Application of neural networks to an emerging financial market: Forecasting and trading the Taiwan Stock Index. Computers & Operations Research, Vol. 30, Issue 6, pp. 901–923.
Chen Z., X. Du, 2013. Study of Stock Prediction Based on Social Network, In: Proceedings of 2013 International Conference on Social Computing, September 8–14 Alexandria, VA, USA, pp. 913–916.
Freisleben B., 1992. Stock market prediction with back-propagation networks. In: Proceedings of 5th Intl. Conf. on the industrial and engineering application of artificial intelligence and expert systems, Germany, June 1992, pp. 451–460.
Gosh A., 2012. Comparative study of Financial Time Series Prediction by Artificial Neural Network with Gradient Descent Learning. Brain, Vol. 3 Issue 1, pp. 41–49.
Kaastra I., M. Boyd, 1995. Forecasting futures trading volume using neural networks Journal of Futures Markets, Vol. 15, Issue 8, pp. 953–970.
Kalyvas E., 2001. Using Neural Networks And Genetic Algorithms to Predict Stock Market Returns. Department of Computer Science, The University of Manchester, UK.
Kamijo K., T. Tanigawa, 1990. Stock market pattern recognition – A recurrent neural network approach Proc. IJCNN, San Diego, Vol. 1, pp. 215–221.
Kim K., 2006. Artificial neural networks with evolution-ary instance selection for financial forecasting. Expert Systems with Applications, Vol. 30, Issue 3, pp. 519–526.
Kim W., B. Lee, 2004. Stock Market Prediction using artificial neural networks with optimal feature transformation. Neural Comput & Applic, Vol. 13, pp. 255–260.
Kimoto T., K. Asakawa, M. Yoda, M. Takeoka, 1990. Stock market prediction system with modular neural network. Proceedings of the International Joint Conference on Neural Networks, pp. 1–6.
Leung M. T., H. Daouk, A.-S. Chen, 2000. Forecasting stock indices: A comparison of classification and level estimation models. Int. J of Forecasting, Vol. 16, pp. 173–190.
Madden M. G., N. O'Connor, 2006. Neural Network Approach to Predicting Stock Exchange Movements
Artificial Intelligence Neural Networks Applications in Forecasting Financial Markets and Stock Prices
287

using External Factors. In: Applications and Innovations in Intelligent Systems XIII, pp. 64–77.
Matsuba I., 1991. Neural sequential associator and its application to stock price prediction Proc. IECON 91, Japan, Vol. 2, pp. 1476–1479.
Pan H., I. Tilakaratne, J. Yearwood, 2005. Predicting Australian Stock Market Index Using Neural Net-works Exploiting Dynamical Swings and Intermarket Influences, Journal of Research and Practice in Information Technology, Vol. 37, No. 1, pp. 43–55.
Werbos P. J., 1988. Generalization of back-propagation with application to a recurrent gas market model, Neural Networks, Vol. 1, pp. 339–356.
White H., 1988. Economic prediction using Neural Networks: The case of IBM daily stock returns. In: Proc. of the IEEE International Conference on Neural Networks, pp. 451–458.
Fourth International Symposium on Business Modeling and Software Design
288
Intercriteria Decision Making Approach to EU Member States Competitiveness Analysis
Vassia K. Atanassova1, Lyubka A. Doukovska1, Krassimir T. Atanassov2,3 and Deyan G. Mavrov3 1Institute of Information and Communication Technologies, Bulgarian Academy of Sciences,
Acad. G. Bonchev str., bl. 2, 1113 Sofia, Bulgaria 2Institute of Biophysics and Biomedical Engineering, Bulgarian Academy of Sciences,
Acad. G. Bonchev str., bl. 105, 1113 Sofia, Bulgaria 3Prof. Dr. Asen Zlatarov University, 1 Prof. Yakimov Blvd., 8010 Burgas, Bulgaria
[email protected], [email protected], [email protected], [email protected]
Keywords: Global Competitiveness Index, Index Matrix, Intercriteria Decision Making, Intuitionistic Fuzzy Sets, Multicriteria Decision Making.
Abstract: In this paper, we present some interesting results derived from the application of our recently developed decision making approach to data from the World Economic Forum’s Global Competitiveness Reports for the years 2008–2009 to 2013–2014. The discussed approach, called ‘Intercriteria Decision Making’, employs the apparatus of index matrices and intuitionistic fuzzy sets to produce from an existing multiobject multicriteria evaluation table a new table that contains estimations of the pairwise correlations among the set of evaluating criteria, called ‘pillars of competitiveness’. Using the described approach over the data about WEF evaluations of the state of competitiveness of the 28 present EU Member States, certain dependences are discovered to connect the 12 ‘pillars’, termed a ‘positive’ and a ‘negative consonance’. The whole research and the conclusions derived are in line with WEF’s address to state policy makers to identify and strengthen the transformative forces that will drive future economic growth.
1 INTRODUCTION
The present work contains a novel analysis of the most recent Global Competitiveness Reports (GCRs) of the World Economic Forum (WEF), produced from 2008–2009 to 2013–2014, aiming at the discovery of some hidden patterns and trends in the present Member States of the European Union. We use a recently developed method, based on intuitionistic fuzzy sets and index matrices, two mathematical formalisms proposed and significantly researched by Atanassov in a series of publications from 1980s to present day.
The developed method for multicriteria decision making (Atanassov et al., 2013) is specifically applicable to situations where some of the criteria come at a higher cost than others, for instance are harder, more expensive and/or more time consuming to measure or evaluate. Such criteria are generally considered unfavourable, hence if the method identifies certain level of correlation between such unfavourable criteria and others that are easier, cheaper or quicker to measure or evaluate these
might be disregarded in the further decision making process. In particular, the approach has been so far applied to petrochemical industry, where the aim has been to reduce some of the most costly and time consuming checks of the probes of raw mineral oil, which have proven to correlate with other cheaper and quicker tests, thus reducing production costs and time needed for business decision making.
The present work is the first application of the developed approach in the field of economics. We have considered it appropriate to analyse our selection of data, in order to discover which of the twelve pillars (criteria) in the formation of the Global Competitiveness Index (GCI) tend to correlate. In comparison with related applications of the method, here, we do not conclude that any of the correlating criteria might be skipped, as in the petrochemical case study. We are interested however to discover dependences between the pillars, which could help policy makers, especially in the low performing EU Member States, to focus their efforts in fewer directions and reasonably expect on the basis of this analysis that improved country’s
289
performance against those pillars would positively affect the performance in the respective correlating pillars. Such correlation can be deemed reasonable to expect, as the twelve pillars are based on a multitude of indicators, some of which enter the GCI in two difference pillars each, as explained in the GCR’s Appendix “Computation and structure of the Global Competitiveness Index” (and to avoid double counting, half-weight is being assigned to each instance).
This attempt to identify the correlations between the different pillars of competitiveness reflects WEF addressing the countries’ policy makers with the advice to ‘identify and strengthen the transformative forces that will drive future economic growth’, as formulated in the Preface of the latest Global Competitiveness Report 2013–2014.
This paper is organized as follows. In Section 2 are briefly presented the two basic mathematical concepts that we use, namely, intuitionistic fuzzy sets and index matrices. On this basis, the proposed method is outlined. Section 3 contains our results from applying the method to analysis of a selection of data about the performance of the currently 28 Member States of the EU during the last six years against the twelve pillars of competitiveness. We report of the findings, produced by the algorithm and formulate our conclusions in the last Section 4.
2 BASIC CONCEPTS AND METHOD
The presented multicriteria decision making method is based on two fundamental concepts: intuitionistic fuzzy sets and index matrices. It bears the specific name ‘intercriteria decision making’.
Intuitionistic fuzzy sets defined by Atanassov (Atanassov, 1983; Atanassov, 1986; Atanassov, 1999; Atanassov, 2012) represent an extension of the concept of fuzzy sets, as defined by Zadeh (Zadeh, 1965), exhibiting function µA(x) defining the membership of an element x to the set A, evaluated in the [0; 1]-interval. The difference between fuzzy sets and intuitionistic fuzzy sets (IFSs) is in the presence of a second function νA(x) defining the non-membership of the element x to the set A, where:
0 ≤ µA(x) ≤ 1,
0 ≤ νA(x) ≤ 1,
0 ≤ µA(x) + νA(x) ≤ 1.
The IFS itself is formally denoted by:
A = {x, µA(x), νA(x) | x E}.
Comparison between elements of any two IFSs, say A and B, involves pairwise comparisons between their respective elements’ degrees of membership and non-membership to both sets.
The second concept on which the proposed method relies is the concept of index matrix, a mat-rix which features two index sets. The theory behind the index matrices is described in (Atanassov, 1991). Here we will start with the index matrix M with index sets with m rows {C1, …, Cm} and n columns {O1, …, On}:
1 1 1 1 1
1
1
1
1
1 , , , ,
, , , ,
, , , ,
, , , ,
,k l n
i i k i l i n
j j k j l j n
m m j m l m n
k l n
C O C O C O C O
i C O C O C O C O
j C O C O C O C O
m C O C O C O C O
O O O OM C a a a a
C a a a a
C a a a a
C a a a a
where for every p, q (1 ≤ p ≤ m, 1 ≤ q ≤ n), Cp is a criterion (in our case, one of the twelve pillars), Oq in an evaluated object (in our case, one of the 28 EU Member states), aCpOq is the evaluation of the q-th object against the p-th criterion, and it is defined as a real number or another object that is comparable according to relation R with all the rest elements of the index matrix M, so that for each i, j, k it holds the relation R(aCkOi, aCkOj). The relation R has dual re-lation R , which is true in the cases when relation R is false, and vice versa.
For the needs of our decision making method, pairwise comparisons between every two different criteria are made along all evaluated objects. During the comparison, it is maintained one counter of the number of times when the relation R holds, and another counter for the dual relation.
Let ,k lS be the number of cases in which the rel-ations R(aCkOi
, aCkOj) and R(aClOi
, aClOj) are simul-taneously satisfied. Let also ,k lS be the number of cases in which the relations R(aCkOi
, aCkOj) and its dual R (aClOi
, aClOj) are simultaneously satisfied. As the total number of pairwise comparisons between the object is n(n – 1)/2, it is seen that there hold the inequalities:
, ,( 1)0
2k l k ln nS S
.
Fourth International Symposium on Business Modeling and Software Design
290
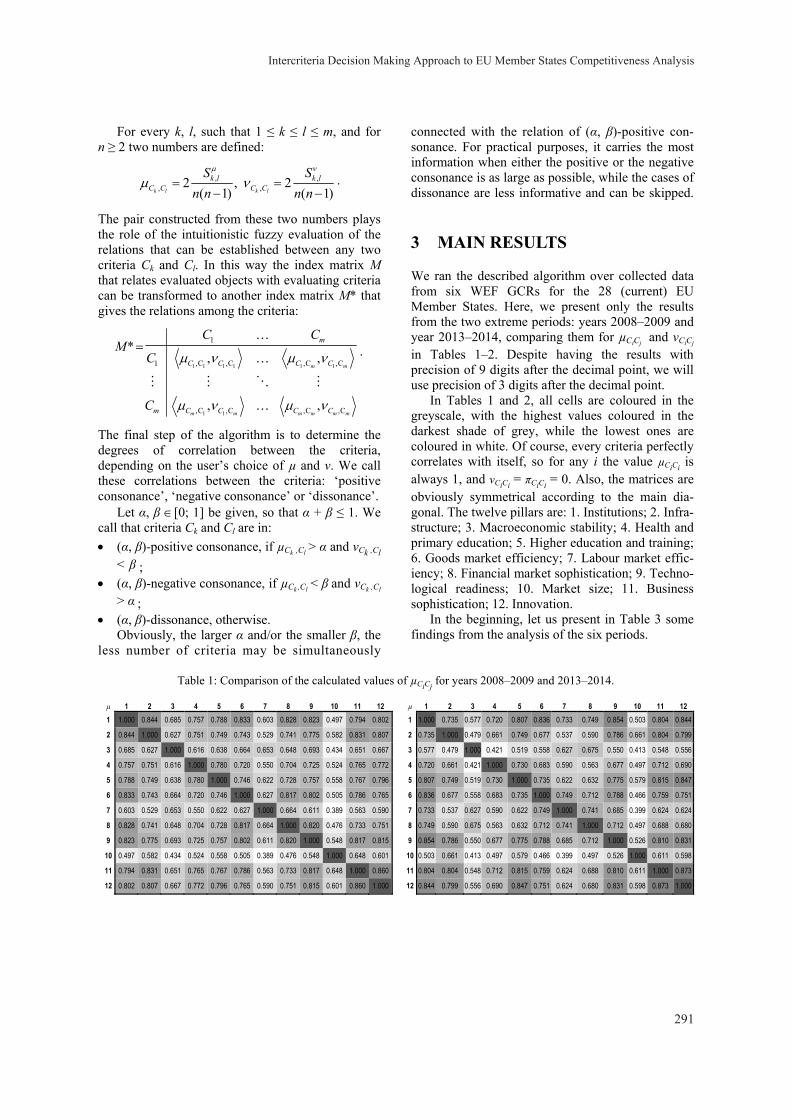
For every k, l, such that 1 ≤ k ≤ l ≤ m, and for n ≥ 2 two numbers are defined:
, ,, ,2 , 2
( 1) ( 1)k l k l
k l k lC C C C
S Sn n n n
.
The pair constructed from these two numbers plays the role of the intuitionistic fuzzy evaluation of the relations that can be established between any two criteria Ck and Cl. In this way the index matrix M that relates evaluated objects with evaluating criteria can be transformed to another index matrix M* that gives the relations among the criteria:
1 1 1 1 1 1
1 1
1
1 ,C ,C ,C ,C
,C ,C ,C ,C
* ., ,
, ,
m m
m m m m m m
m
C C C C
m C C C C
C CM
C
C
The final step of the algorithm is to determine the degrees of correlation between the criteria, depending on the user’s choice of µ and ν. We call these correlations between the criteria: ‘positive consonance’, ‘negative consonance’ or ‘dissonance’.
Let α, β [0; 1] be given, so that α + β ≤ 1. We call that criteria Ck and Cl are in: (α, β)-positive consonance, if µCk ,Cl > α and νCk ,Cl
< β ; (α, β)-negative consonance, if µCk ,Cl < β and νCk ,Cl
> α ; (α, β)-dissonance, otherwise.
Obviously, the larger α and/or the smaller β, the less number of criteria may be simultaneously
connected with the relation of (α, β)-positive con-sonance. For practical purposes, it carries the most information when either the positive or the negative consonance is as large as possible, while the cases of dissonance are less informative and can be skipped.
3 MAIN RESULTS
We ran the described algorithm over collected data from six WEF GCRs for the 28 (current) EU Member States. Here, we present only the results from the two extreme periods: years 2008–2009 and year 2013–2014, comparing them for µCiCj and νCiCj in Tables 1–2. Despite having the results with precision of 9 digits after the decimal point, we will use precision of 3 digits after the decimal point.
In Tables 1 and 2, all cells are coloured in the greyscale, with the highest values coloured in the darkest shade of grey, while the lowest ones are coloured in white. Of course, every criteria perfectly correlates with itself, so for any i the value µCiCi is always 1, and νCiCi = πCiCi = 0. Also, the matrices are obviously symmetrical according to the main dia-gonal. The twelve pillars are: 1. Institutions; 2. Infra-structure; 3. Macroeconomic stability; 4. Health and primary education; 5. Higher education and training; 6. Goods market efficiency; 7. Labour market effic-iency; 8. Financial market sophistication; 9. Techno-logical readiness; 10. Market size; 11. Business sophistication; 12. Innovation.
In the beginning, let us present in Table 3 some findings from the analysis of the six periods.
Table 1: Comparison of the calculated values of µCiCj for years 2008–2009 and 2013–2014.
µ 1 2 3 4 5 6 7 8 9 10 11 12
1 1.000 0.844 0.685 0.757 0.788 0.833 0.603 0.828 0.823 0.497 0.794 0.802
2 0.844 1.000 0.627 0.751 0.749 0.743 0.529 0.741 0.775 0.582 0.831 0.807
3 0.685 0.627 1.000 0.616 0.638 0.664 0.653 0.648 0.693 0.434 0.651 0.667
4 0.757 0.751 0.616 1.000 0.780 0.720 0.550 0.704 0.725 0.524 0.765 0.772
5 0.788 0.749 0.638 0.780 1.000 0.746 0.622 0.728 0.757 0.558 0.767 0.796
6 0.833 0.743 0.664 0.720 0.746 1.000 0.627 0.817 0.802 0.505 0.786 0.765
7 0.603 0.529 0.653 0.550 0.622 0.627 1.000 0.664 0.611 0.389 0.563 0.590
8 0.828 0.741 0.648 0.704 0.728 0.817 0.664 1.000 0.820 0.476 0.733 0.751
9 0.823 0.775 0.693 0.725 0.757 0.802 0.611 0.820 1.000 0.548 0.817 0.815
10 0.497 0.582 0.434 0.524 0.558 0.505 0.389 0.476 0.548 1.000 0.648 0.601
11 0.794 0.831 0.651 0.765 0.767 0.786 0.563 0.733 0.817 0.648 1.000 0.860
12 0.802 0.807 0.667 0.772 0.796 0.765 0.590 0.751 0.815 0.601 0.860 1.000
µ 1 2 3 4 5 6 7 8 9 10 11 12
1 1.000 0.735 0.577 0.720 0.807 0.836 0.733 0.749 0.854 0.503 0.804 0.844
2 0.735 1.000 0.479 0.661 0.749 0.677 0.537 0.590 0.786 0.661 0.804 0.799
3 0.577 0.479 1.000 0.421 0.519 0.558 0.627 0.675 0.550 0.413 0.548 0.556
4 0.720 0.661 0.421 1.000 0.730 0.683 0.590 0.563 0.677 0.497 0.712 0.690
5 0.807 0.749 0.519 0.730 1.000 0.735 0.622 0.632 0.775 0.579 0.815 0.847
6 0.836 0.677 0.558 0.683 0.735 1.000 0.749 0.712 0.788 0.466 0.759 0.751
7 0.733 0.537 0.627 0.590 0.622 0.749 1.000 0.741 0.685 0.399 0.624 0.624
8 0.749 0.590 0.675 0.563 0.632 0.712 0.741 1.000 0.712 0.497 0.688 0.680
9 0.854 0.786 0.550 0.677 0.775 0.788 0.685 0.712 1.000 0.526 0.810 0.831
10 0.503 0.661 0.413 0.497 0.579 0.466 0.399 0.497 0.526 1.000 0.611 0.598
11 0.804 0.804 0.548 0.712 0.815 0.759 0.624 0.688 0.810 0.611 1.000 0.873
12 0.844 0.799 0.556 0.690 0.847 0.751 0.624 0.680 0.831 0.598 0.873 1.000
Intercriteria Decision Making Approach to EU Member States Competitiveness Analysis
291
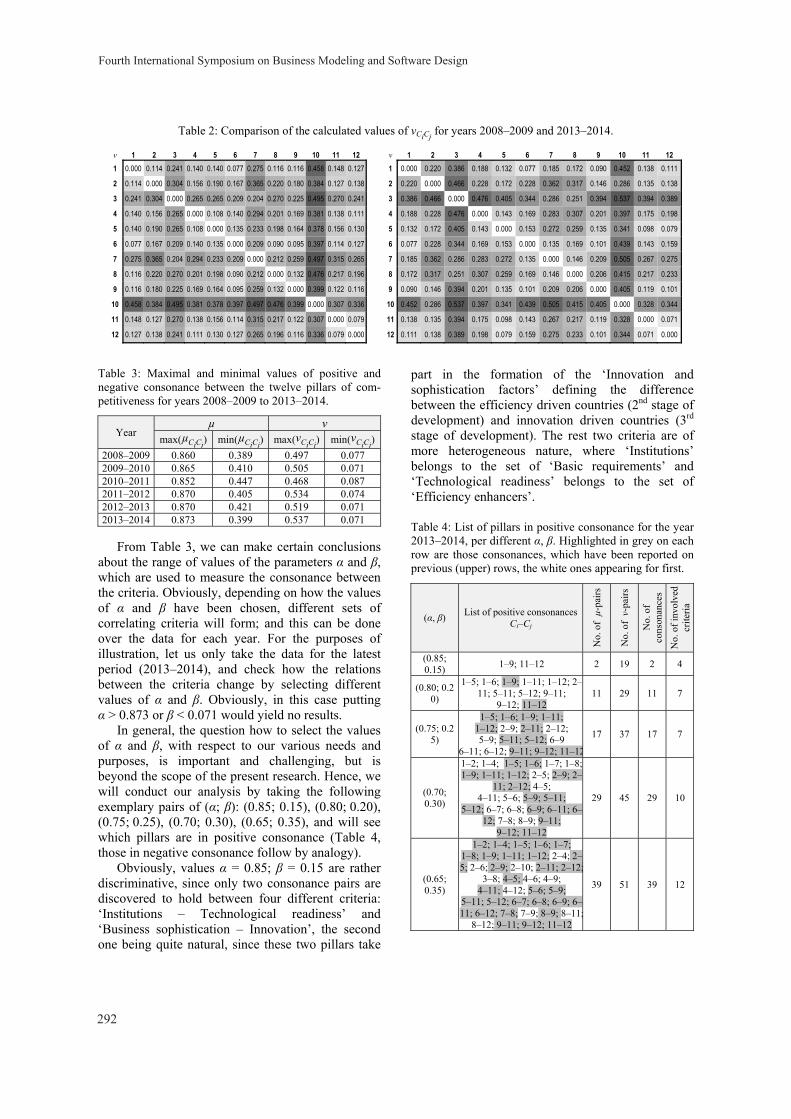
Table 2: Comparison of the calculated values of νCiCj for years 2008–2009 and 2013–2014.
ν 1 2 3 4 5 6 7 8 9 10 11 12
1 0.000 0.114 0.241 0.140 0.140 0.077 0.275 0.116 0.116 0.458 0.148 0.127
2 0.114 0.000 0.304 0.156 0.190 0.167 0.365 0.220 0.180 0.384 0.127 0.138
3 0.241 0.304 0.000 0.265 0.265 0.209 0.204 0.270 0.225 0.495 0.270 0.241
4 0.140 0.156 0.265 0.000 0.108 0.140 0.294 0.201 0.169 0.381 0.138 0.111
5 0.140 0.190 0.265 0.108 0.000 0.135 0.233 0.198 0.164 0.378 0.156 0.130
6 0.077 0.167 0.209 0.140 0.135 0.000 0.209 0.090 0.095 0.397 0.114 0.127
7 0.275 0.365 0.204 0.294 0.233 0.209 0.000 0.212 0.259 0.497 0.315 0.265
8 0.116 0.220 0.270 0.201 0.198 0.090 0.212 0.000 0.132 0.476 0.217 0.196
9 0.116 0.180 0.225 0.169 0.164 0.095 0.259 0.132 0.000 0.399 0.122 0.116
10 0.458 0.384 0.495 0.381 0.378 0.397 0.497 0.476 0.399 0.000 0.307 0.336
11 0.148 0.127 0.270 0.138 0.156 0.114 0.315 0.217 0.122 0.307 0.000 0.079
12 0.127 0.138 0.241 0.111 0.130 0.127 0.265 0.196 0.116 0.336 0.079 0.000
ν 1 2 3 4 5 6 7 8 9 10 11 12
1 0.000 0.220 0.386 0.188 0.132 0.077 0.185 0.172 0.090 0.452 0.138 0.111
2 0.220 0.000 0.466 0.228 0.172 0.228 0.362 0.317 0.146 0.286 0.135 0.138
3 0.386 0.466 0.000 0.476 0.405 0.344 0.286 0.251 0.394 0.537 0.394 0.389
4 0.188 0.228 0.476 0.000 0.143 0.169 0.283 0.307 0.201 0.397 0.175 0.198
5 0.132 0.172 0.405 0.143 0.000 0.153 0.272 0.259 0.135 0.341 0.098 0.079
6 0.077 0.228 0.344 0.169 0.153 0.000 0.135 0.169 0.101 0.439 0.143 0.159
7 0.185 0.362 0.286 0.283 0.272 0.135 0.000 0.146 0.209 0.505 0.267 0.275
8 0.172 0.317 0.251 0.307 0.259 0.169 0.146 0.000 0.206 0.415 0.217 0.233
9 0.090 0.146 0.394 0.201 0.135 0.101 0.209 0.206 0.000 0.405 0.119 0.101
10 0.452 0.286 0.537 0.397 0.341 0.439 0.505 0.415 0.405 0.000 0.328 0.344
11 0.138 0.135 0.394 0.175 0.098 0.143 0.267 0.217 0.119 0.328 0.000 0.071
12 0.111 0.138 0.389 0.198 0.079 0.159 0.275 0.233 0.101 0.344 0.071 0.000
Table 3: Maximal and minimal values of positive and negative consonance between the twelve pillars of com-petitiveness for years 2008–2009 to 2013–2014.
Year µ ν
max(µCiCj) min(µCiCj) max(νCiCj) min(νCiCj) 2008–2009 0.860 0.389 0.497 0.077 2009–2010 0.865 0.410 0.505 0.071 2010–2011 0.852 0.447 0.468 0.087 2011–2012 0.870 0.405 0.534 0.074 2012–2013 0.870 0.421 0.519 0.071 2013–2014 0.873 0.399 0.537 0.071
From Table 3, we can make certain conclusions
about the range of values of the parameters α and β, which are used to measure the consonance between the criteria. Obviously, depending on how the values of α and β have been chosen, different sets of correlating criteria will form; and this can be done over the data for each year. For the purposes of illustration, let us only take the data for the latest period (2013–2014), and check how the relations between the criteria change by selecting different values of α and β. Obviously, in this case putting α > 0.873 or β < 0.071 would yield no results.
In general, the question how to select the values of α and β, with respect to our various needs and purposes, is important and challenging, but is beyond the scope of the present research. Hence, we will conduct our analysis by taking the following exemplary pairs of (α; β): (0.85; 0.15), (0.80; 0.20), (0.75; 0.25), (0.70; 0.30), (0.65; 0.35), and will see which pillars are in positive consonance (Table 4, those in negative consonance follow by analogy).
Obviously, values α = 0.85; β = 0.15 are rather discriminative, since only two consonance pairs are discovered to hold between four different criteria: ‘Institutions – Technological readiness’ and ‘Business sophistication – Innovation’, the second one being quite natural, since these two pillars take
part in the formation of the ‘Innovation and sophistication factors’ defining the difference between the efficiency driven countries (2nd stage of development) and innovation driven countries (3rd
stage of development). The rest two criteria are of more heterogeneous nature, where ‘Institutions’ belongs to the set of ‘Basic requirements’ and ‘Technological readiness’ belongs to the set of ‘Efficiency enhancers’.
Table 4: List of pillars in positive consonance for the year 2013–2014, per different α, β. Highlighted in grey on each row are those consonances, which have been reported on previous (upper) rows, the white ones appearing for first.
(α, β) List of positive consonances Ci–Cj
No.
of
µ-pa
irs
No.
of ν-
pairs
No.
of
cons
onan
ces
No.
of i
nvol
ved
crite
ria
(0.85; 0.15) 1–9; 11–12 2 19 2 4
(0.80; 0.20)
1–5; 1–6; 1–9; 1–11; 1–12; 2–11; 5–11; 5–12; 9–11;
9–12; 11–12 11 29 11 7
(0.75; 0.25)
1–5; 1–6; 1–9; 1–11; 1–12; 2–9; 2–11; 2–12; 5–9; 5–11; 5–12; 6–9
6–11; 6–12; 9–11; 9–12; 11–12
17 37 17 7
(0.70; 0.30)
1–2; 1–4; 1–5; 1–6; 1–7; 1–8; 1–9; 1–11; 1–12; 2–5; 2–9; 2–
11; 2–12; 4–5; 4–11; 5–6; 5–9; 5–11;
5–12; 6–7; 6–8; 6–9; 6–11; 6–12; 7–8; 8–9; 9–11;
9–12; 11–12
29 45 29 10
(0.65; 0.35)
1–2; 1–4; 1–5; 1–6; 1–7; 1–8; 1–9; 1–11; 1–12; 2–4; 2–5; 2–6; 2–9; 2–10; 2–11; 2–12;
3–8; 4–5; 4–6; 4–9; 4–11; 4–12; 5–6; 5–9;
5–11; 5–12; 6–7; 6–8; 6–9; 6–11; 6–12; 7–8; 7–9; 8–9; 8–11;
8–12; 9–11; 9–12; 11–12
39 51 39 12
Fourth International Symposium on Business Modeling and Software Design
292
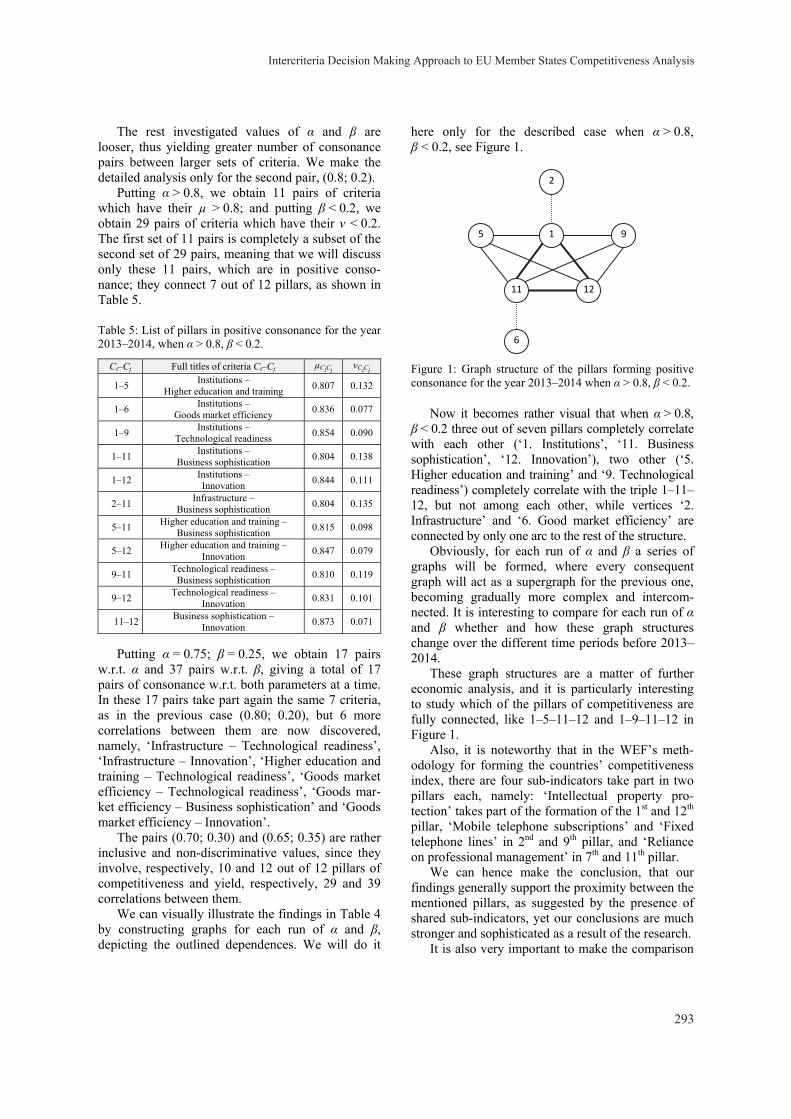
The rest investigated values of α and β are looser, thus yielding greater number of consonance pairs between larger sets of criteria. We make the detailed analysis only for the second pair, (0.8; 0.2).
Putting α > 0.8, we obtain 11 pairs of criteria which have their µ > 0.8; and putting β < 0.2, we obtain 29 pairs of criteria which have their ν < 0.2. The first set of 11 pairs is completely a subset of the second set of 29 pairs, meaning that we will discuss only these 11 pairs, which are in positive conso-nance; they connect 7 out of 12 pillars, as shown in Table 5.
Table 5: List of pillars in positive consonance for the year 2013–2014, when α > 0.8, β < 0.2.
Ci–Cj Full titles of criteria Ci–Cj µCiCj νCiCj
1–5 Institutions – Higher education and training 0.807 0.132
1–6 Institutions – Goods market efficiency 0.836 0.077
1–9 Institutions – Technological readiness 0.854 0.090
1–11 Institutions – Business sophistication 0.804 0.138
1–12 Institutions – Innovation 0.844 0.111
2–11 Infrastructure – Business sophistication 0.804 0.135
5–11 Higher education and training – Business sophistication 0.815 0.098
5–12 Higher education and training – Innovation 0.847 0.079
9–11 Technological readiness – Business sophistication 0.810 0.119
9–12 Technological readiness – Innovation 0.831 0.101
11–12 Business sophistication – Innovation 0.873 0.071
Putting α = 0.75; β = 0.25, we obtain 17 pairs
w.r.t. α and 37 pairs w.r.t. β, giving a total of 17 pairs of consonance w.r.t. both parameters at a time. In these 17 pairs take part again the same 7 criteria, as in the previous case (0.80; 0.20), but 6 more correlations between them are now discovered, namely, ‘Infrastructure – Technological readiness’, ‘Infrastructure – Innovation’, ‘Higher education and training – Technological readiness’, ‘Goods market efficiency – Technological readiness’, ‘Goods mar-ket efficiency – Business sophistication’ and ‘Goods market efficiency – Innovation’.
The pairs (0.70; 0.30) and (0.65; 0.35) are rather inclusive and non-discriminative values, since they involve, respectively, 10 and 12 out of 12 pillars of competitiveness and yield, respectively, 29 and 39 correlations between them.
We can visually illustrate the findings in Table 4 by constructing graphs for each run of α and β, depicting the outlined dependences. We will do it
here only for the described case when α > 0.8, β < 0.2, see Figure 1.
9
11
1
12
5
6
2
Figure 1: Graph structure of the pillars forming positive consonance for the year 2013–2014 when α > 0.8, β < 0.2.
Now it becomes rather visual that when α > 0.8, β < 0.2 three out of seven pillars completely correlate with each other (‘1. Institutions’, ‘11. Business sophistication’, ‘12. Innovation’), two other (‘5. Higher education and training’ and ‘9. Technological readiness’) completely correlate with the triple 1–11–12, but not among each other, while vertices ‘2. Infrastructure’ and ‘6. Good market efficiency’ are connected by only one arc to the rest of the structure.
Obviously, for each run of α and β a series of graphs will be formed, where every consequent graph will act as a supergraph for the previous one, becoming gradually more complex and intercom-nected. It is interesting to compare for each run of α and β whether and how these graph structures change over the different time periods before 2013–2014.
These graph structures are a matter of further economic analysis, and it is particularly interesting to study which of the pillars of competitiveness are fully connected, like 1–5–11–12 and 1–9–11–12 in Figure 1.
Also, it is noteworthy that in the WEF’s meth-odology for forming the countries’ competitiveness index, there are four sub-indicators take part in two pillars each, namely: ‘Intellectual property pro-tection’ takes part of the formation of the 1st and 12th pillar, ‘Mobile telephone subscriptions’ and ‘Fixed telephone lines’ in 2nd and 9th pillar, and ‘Reliance on professional management’ in 7th and 11th pillar.
We can hence make the conclusion, that our findings generally support the proximity between the mentioned pillars, as suggested by the presence of shared sub-indicators, yet our conclusions are much stronger and sophisticated as a result of the research.
It is also very important to make the comparison
Intercriteria Decision Making Approach to EU Member States Competitiveness Analysis
293
of the calculated values in Tables 1 and 2 between years 2008–2009 and 2013–2014. We can focus the reader’s attention to several particularly well outlined observations. Over the period 2008–2014, the pillars ‘5. Higher education and training’ and ‘7. Labour market efficiency’ have become gradually more correlated to all the rest pillars, while pillar ‘3. Macroeconomic stability’ has become gradually less correlated. However, in general, these comparisons are a matter of detailed analysis by economists.
4 CONCLUSION
The present research aimed at discovery of some hidden patterns in the data about EU Member States’ competitiveness in the period from 2008 to 2014. We conduct the analysis of the World Economic Forum’s Global Competitiveness Reports, using a recently developed multicriteria decision making method, based on index matrices and intuitionistic fuzzy sets.
Using index matrices with data about how the EU Member States have performed according to the outlined twelve ‘pillars of competitiveness’, we construct new matrices, giving us new knowledge about how these pillars correlate and interact with each other. Moreover, the application of the method has been traced over a six-year period of time and has revealed certain changes and trends in these correlations that may yield fruitful further analyses by interested economists. The results are illustrated with data tables and graphs of the strongest cor-relations between the criteria.
These conclusions may also be useful for the national policy and decision makers, to better identify and strengthen the transformative forces that will drive their future economic growth. The same approach can be equally applied to other selections of countries and time periods, and comparisons with the hitherto presented results will be challenging.
Besides the comparison of the twelve pillars of competitiveness, our research plans include also exploring the correlations between the most prob-lematic factors for doing business, as outlined in the WEF’s GCRs. Further investigation how the pillars of competitiveness correlate with these most problematic factors may also prove interesting and useful.
ACKNOWLEDGEMENTS
The research work reported in the paper is partly
supported by the project AComIn “Advanced Computing for Innovation”, grant 316087, funded by the FP7 Capacity Programme (Research Potential of Convergence Regions).
REFERENCES
Atanassov K. (1983) Intuitionistic fuzzy sets, VII ITKR's Session, Sofia, June 1983 (in Bulgarian).
Atanassov K. (1986) Intuitionistic fuzzy sets. Fuzzy Sets and Systems. Vol. 20 (1), pp. 87–96.
Atanassov K. (1991) Generalized Nets. World Scientific, Singapore.
Atanassov K. (1999) Intuitionistic Fuzzy Sets: Theory and Applications. Physica-Verlag, Heidelberg.
Atanassov K. (2012) On Intuitionistic Fuzzy Sets Theory. Springer, Berlin.
Atanassov K., D. Mavrov, V. Atanassova (2013). Inter-criteria decision making. A new approach for multi-criteria decision making, based on index matrices and intuitionistic fuzzy sets. Proc. of 12th International Workshop on Intuitionistic Fuzzy Sets and General-ized Nets, 11 Oct. 2013, Warsaw, Poland (in press).
World Economic Forum (2008, 2013). The Global Competitiveness Reports. http://www.weforum.org/ issues/global-competitiveness.
Zadeh L. A. (1965). Fuzzy Sets. Information and Control Vol. 8, pp. 333–353.
Fourth International Symposium on Business Modeling and Software Design
294

INDUSTRIAL TRACK

Value-driven Design and Implementation of Business Processes Transferring Strategy into Execution at Pace with Certainty
Mathias Kirchmer1,2 1BPM-D, 475 Timberline Trail, West Chester, PA 19382, U.S.A.
2Organizational Dynamics, University of Pennsylvania, Philadelphia, U.S.A. [email protected]
Keywords: ARIS, BPM, BPM-discipline, Execution, Innovation, Optimization, Modelling, Process Design, Process Implementation, Reference Models, Strategy, Value-Driven BPM.
Abstract: An organization only competes with approximately 20% of its business processes. 80% of the processes are commodity processes that can have an industry average performance. A value-driven process design and implementation considers this by focusing innovation and optimization initiatives as well as individual software development on the 20% high impact processes, while commodity processes are designed based on industry reference models and implemented as far as possible through standard software. The paper describes an approach to such a value-driven design and implementation of businesses – transferring strategy into execution, at pace with certainty.
1 INTRODUCTION
A key challenge of organizations in today’s volatile business environment is “leveraging people to build a customer-centric performance-based culture” (Mitchel, Ray, van Ark, 2014). Therefore it is not only important to have a good strategy, hence to know what to do. But in many organizations the key challenge is about how to do things in order to build such a customer and market-oriented organization. This can be achieved through a consequent process-orientation since processes deliver by definition a result of value for a client outside the process. However, this requires a structured value-driven design of processes focusing on realizing the business strategy of an organization (Rummler, Ramias, Rummler, 2010) (Burlton, 2010).
This paper presents such a value-driven process design and implementation approach that is both, focused on executing the strategy of an organization while being as resource efficient as possible. Result is a practical and effective approach to process design and implementation.
The approach has been developed based on practical experience in large and mid-size organizations, mainly in the USA and Europe. It has been combined with academic research regarding such value-driven design and implementation methodologies.
2 TARGETING VALUE
The overall goal of the approach is to target and focus on business value during the design and implementation of processes. Research has shown that organizations only compete with approximately 20% of their business processes (Franz, Kirchmer, 2012). This means that 80% of the business processes are commodity processes which can be carried out according to industry standards or common industry practices. An average industry performance is sufficient. Sophisticated improvement approaches targeting higher performance are not delivering real additional busienss value. Hence, process innovation and optimization initiatives have to focus on the 20% high impact processes while other business processes can be designed and implemented using existing industry common practices. Results are highly organization specific business processes where this really delivers competitive advantages and processes following industry common practices where this is sufficient.
Such an approach also enables organizations to use resources where they provide best value during design and implementation initiatives. People who are highly qualified in sophisticated process design and implementation methods, for example, focus on high value areas. They can systematically target
297
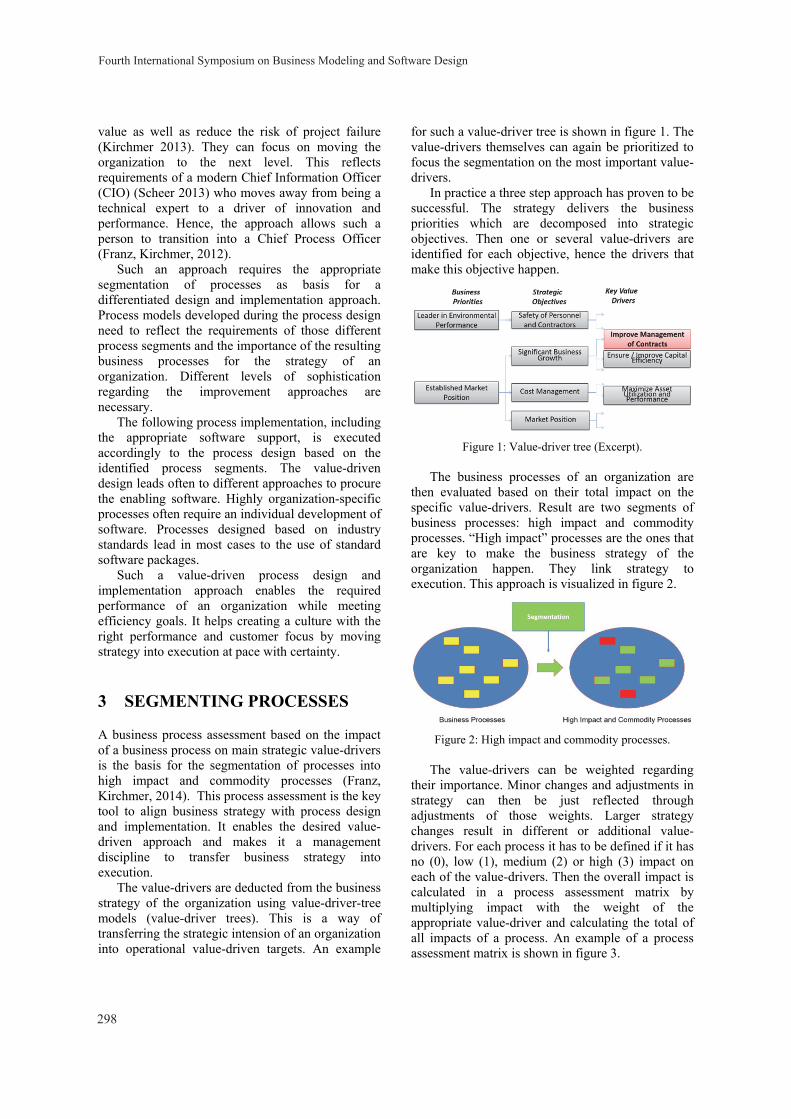
value as well as reduce the risk of project failure (Kirchmer 2013). They can focus on moving the organization to the next level. This reflects requirements of a modern Chief Information Officer (CIO) (Scheer 2013) who moves away from being a technical expert to a driver of innovation and performance. Hence, the approach allows such a person to transition into a Chief Process Officer (Franz, Kirchmer, 2012).
Such an approach requires the appropriate segmentation of processes as basis for a differentiated design and implementation approach. Process models developed during the process design need to reflect the requirements of those different process segments and the importance of the resulting business processes for the strategy of an organization. Different levels of sophistication regarding the improvement approaches are necessary.
The following process implementation, including the appropriate software support, is executed accordingly to the process design based on the identified process segments. The value-driven design leads often to different approaches to procure the enabling software. Highly organization-specific processes often require an individual development of software. Processes designed based on industry standards lead in most cases to the use of standard software packages.
Such a value-driven process design and implementation approach enables the required performance of an organization while meeting efficiency goals. It helps creating a culture with the right performance and customer focus by moving strategy into execution at pace with certainty.
3 SEGMENTING PROCESSES
A business process assessment based on the impact of a business process on main strategic value-drivers is the basis for the segmentation of processes into high impact and commodity processes (Franz, Kirchmer, 2014). This process assessment is the key tool to align business strategy with process design and implementation. It enables the desired value-driven approach and makes it a management discipline to transfer business strategy into execution.
The value-drivers are deducted from the business strategy of the organization using value-driver-tree models (value-driver trees). This is a way of transferring the strategic intension of an organization into operational value-driven targets. An example
for such a value-driver tree is shown in figure 1. The value-drivers themselves can again be prioritized to focus the segmentation on the most important value-drivers.
In practice a three step approach has proven to be successful. The strategy delivers the business priorities which are decomposed into strategic objectives. Then one or several value-drivers are identified for each objective, hence the drivers that make this objective happen.
Figure 1: Value-driver tree (Excerpt).
The business processes of an organization are then evaluated based on their total impact on the specific value-drivers. Result are two segments of business processes: high impact and commodity processes. “High impact” processes are the ones that are key to make the business strategy of the organization happen. They link strategy to execution. This approach is visualized in figure 2.
Figure 2: High impact and commodity processes.
The value-drivers can be weighted regarding their importance. Minor changes and adjustments in strategy can then be just reflected through adjustments of those weights. Larger strategy changes result in different or additional value-drivers. For each process it has to be defined if it has no (0), low (1), medium (2) or high (3) impact on each of the value-drivers. Then the overall impact is calculated in a process assessment matrix by multiplying impact with the weight of the appropriate value-driver and calculating the total of all impacts of a process. An example of a process assessment matrix is shown in figure 3.
Fourth International Symposium on Business Modeling and Software Design
298
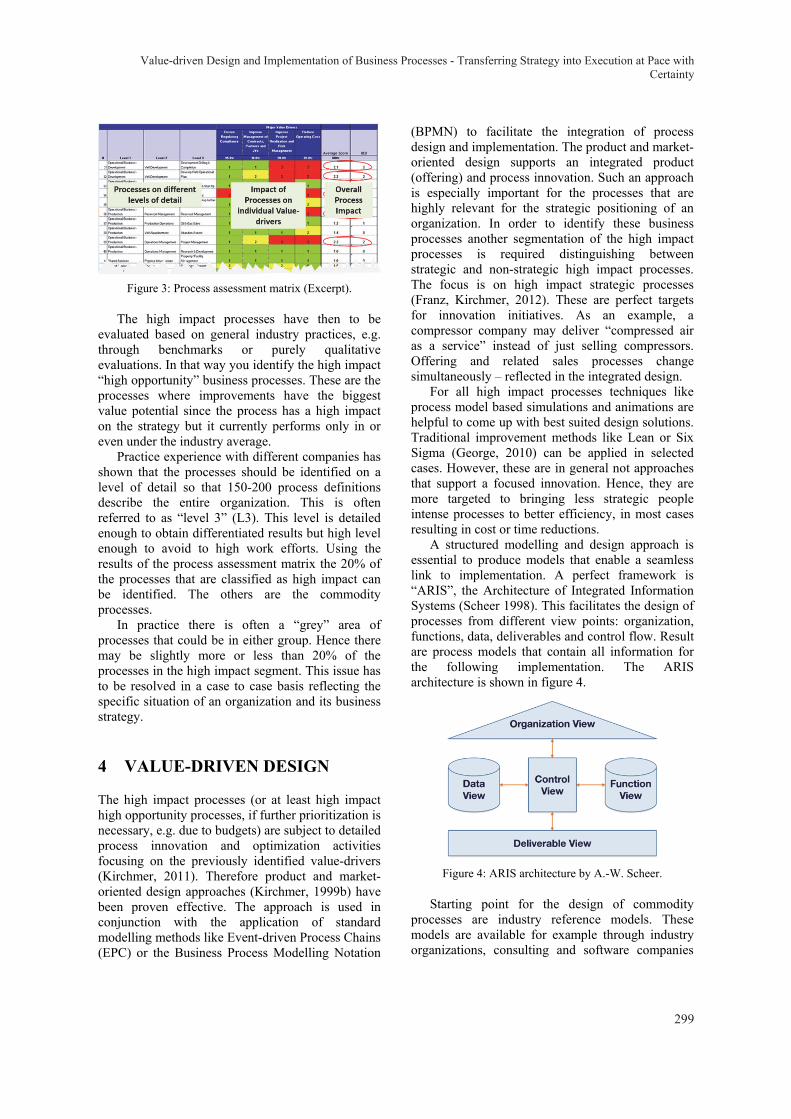
Figure 3: Process assessment matrix (Excerpt).
The high impact processes have then to be evaluated based on general industry practices, e.g. through benchmarks or purely qualitative evaluations. In that way you identify the high impact “high opportunity” business processes. These are the processes where improvements have the biggest value potential since the process has a high impact on the strategy but it currently performs only in or even under the industry average.
Practice experience with different companies has shown that the processes should be identified on a level of detail so that 150-200 process definitions describe the entire organization. This is often referred to as “level 3” (L3). This level is detailed enough to obtain differentiated results but high level enough to avoid to high work efforts. Using the results of the process assessment matrix the 20% of the processes that are classified as high impact can be identified. The others are the commodity processes.
In practice there is often a “grey” area of processes that could be in either group. Hence there may be slightly more or less than 20% of the processes in the high impact segment. This issue has to be resolved in a case to case basis reflecting the specific situation of an organization and its business strategy.
4 VALUE-DRIVEN DESIGN
The high impact processes (or at least high impact high opportunity processes, if further prioritization is necessary, e.g. due to budgets) are subject to detailed process innovation and optimization activities focusing on the previously identified value-drivers (Kirchmer, 2011). Therefore product and market-oriented design approaches (Kirchmer, 1999b) have been proven effective. The approach is used in conjunction with the application of standard modelling methods like Event-driven Process Chains (EPC) or the Business Process Modelling Notation
(BPMN) to facilitate the integration of process design and implementation. The product and market-oriented design supports an integrated product (offering) and process innovation. Such an approach is especially important for the processes that are highly relevant for the strategic positioning of an organization. In order to identify these business processes another segmentation of the high impact processes is required distinguishing between strategic and non-strategic high impact processes. The focus is on high impact strategic processes (Franz, Kirchmer, 2012). These are perfect targets for innovation initiatives. As an example, a compressor company may deliver “compressed air as a service” instead of just selling compressors. Offering and related sales processes change simultaneously – reflected in the integrated design.
For all high impact processes techniques like process model based simulations and animations are helpful to come up with best suited design solutions. Traditional improvement methods like Lean or Six Sigma (George, 2010) can be applied in selected cases. However, these are in general not approaches that support a focused innovation. Hence, they are more targeted to bringing less strategic people intense processes to better efficiency, in most cases resulting in cost or time reductions.
A structured modelling and design approach is essential to produce models that enable a seamless link to implementation. A perfect framework is “ARIS”, the Architecture of Integrated Information Systems (Scheer 1998). This facilitates the design of processes from different view points: organization, functions, data, deliverables and control flow. Result are process models that contain all information for the following implementation. The ARIS architecture is shown in figure 4.
Figure 4: ARIS architecture by A.-W. Scheer.
Starting point for the design of commodity processes are industry reference models. These models are available for example through industry organizations, consulting and software companies
Value-driven Design and Implementation of Business Processes - Transferring Strategy into Execution at Pace withCertainty
299
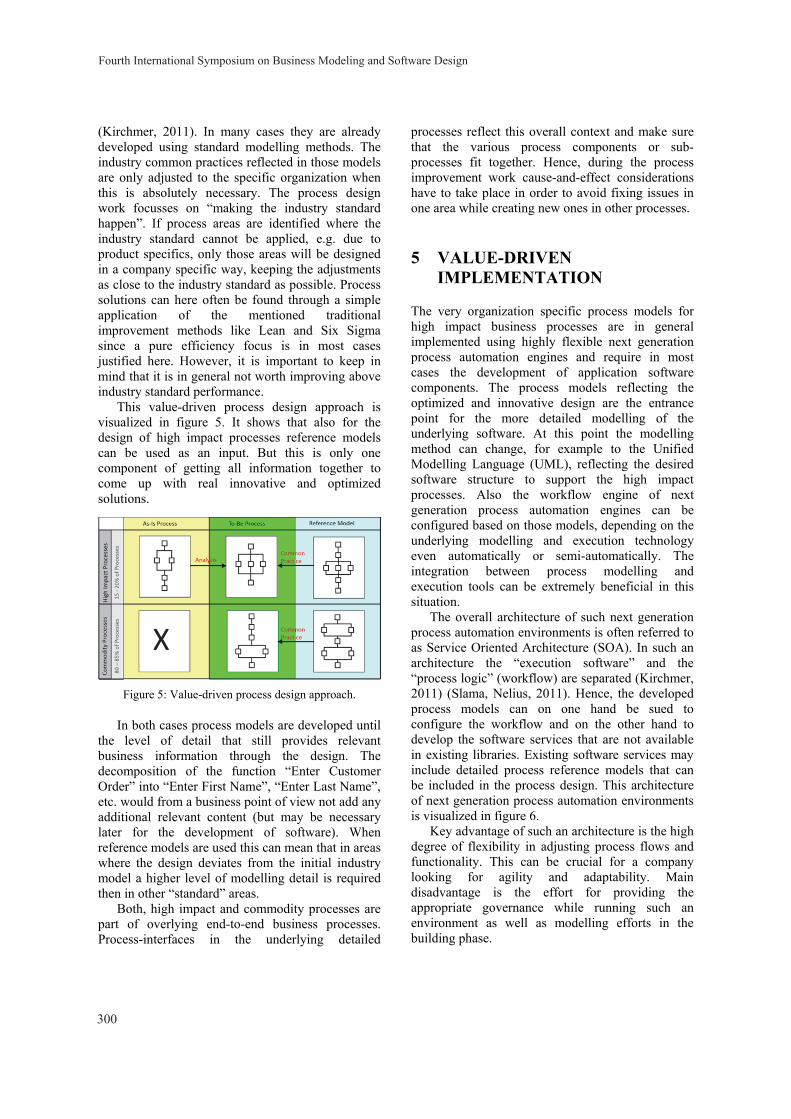
(Kirchmer, 2011). In many cases they are already developed using standard modelling methods. The industry common practices reflected in those models are only adjusted to the specific organization when this is absolutely necessary. The process design work focusses on “making the industry standard happen”. If process areas are identified where the industry standard cannot be applied, e.g. due to product specifics, only those areas will be designed in a company specific way, keeping the adjustments as close to the industry standard as possible. Process solutions can here often be found through a simple application of the mentioned traditional improvement methods like Lean and Six Sigma since a pure efficiency focus is in most cases justified here. However, it is important to keep in mind that it is in general not worth improving above industry standard performance.
This value-driven process design approach is visualized in figure 5. It shows that also for the design of high impact processes reference models can be used as an input. But this is only one component of getting all information together to come up with real innovative and optimized solutions.
Figure 5: Value-driven process design approach.
In both cases process models are developed until the level of detail that still provides relevant business information through the design. The decomposition of the function “Enter Customer Order” into “Enter First Name”, “Enter Last Name”, etc. would from a business point of view not add any additional relevant content (but may be necessary later for the development of software). When reference models are used this can mean that in areas where the design deviates from the initial industry model a higher level of modelling detail is required then in other “standard” areas.
Both, high impact and commodity processes are part of overlying end-to-end business processes. Process-interfaces in the underlying detailed
processes reflect this overall context and make sure that the various process components or sub-processes fit together. Hence, during the process improvement work cause-and-effect considerations have to take place in order to avoid fixing issues in one area while creating new ones in other processes.
5 VALUE-DRIVEN IMPLEMENTATION
The very organization specific process models for high impact business processes are in general implemented using highly flexible next generation process automation engines and require in most cases the development of application software components. The process models reflecting the optimized and innovative design are the entrance point for the more detailed modelling of the underlying software. At this point the modelling method can change, for example to the Unified Modelling Language (UML), reflecting the desired software structure to support the high impact processes. Also the workflow engine of next generation process automation engines can be configured based on those models, depending on the underlying modelling and execution technology even automatically or semi-automatically. The integration between process modelling and execution tools can be extremely beneficial in this situation.
The overall architecture of such next generation process automation environments is often referred to as Service Oriented Architecture (SOA). In such an architecture the “execution software” and the “process logic” (workflow) are separated (Kirchmer, 2011) (Slama, Nelius, 2011). Hence, the developed process models can on one hand be sued to configure the workflow and on the other hand to develop the software services that are not available in existing libraries. Existing software services may include detailed process reference models that can be included in the process design. This architecture of next generation process automation environments is visualized in figure 6.
Key advantage of such an architecture is the high degree of flexibility in adjusting process flows and functionality. This can be crucial for a company looking for agility and adaptability. Main disadvantage is the effort for providing the appropriate governance while running such an environment as well as modelling efforts in the building phase.
Fourth International Symposium on Business Modeling and Software Design
300
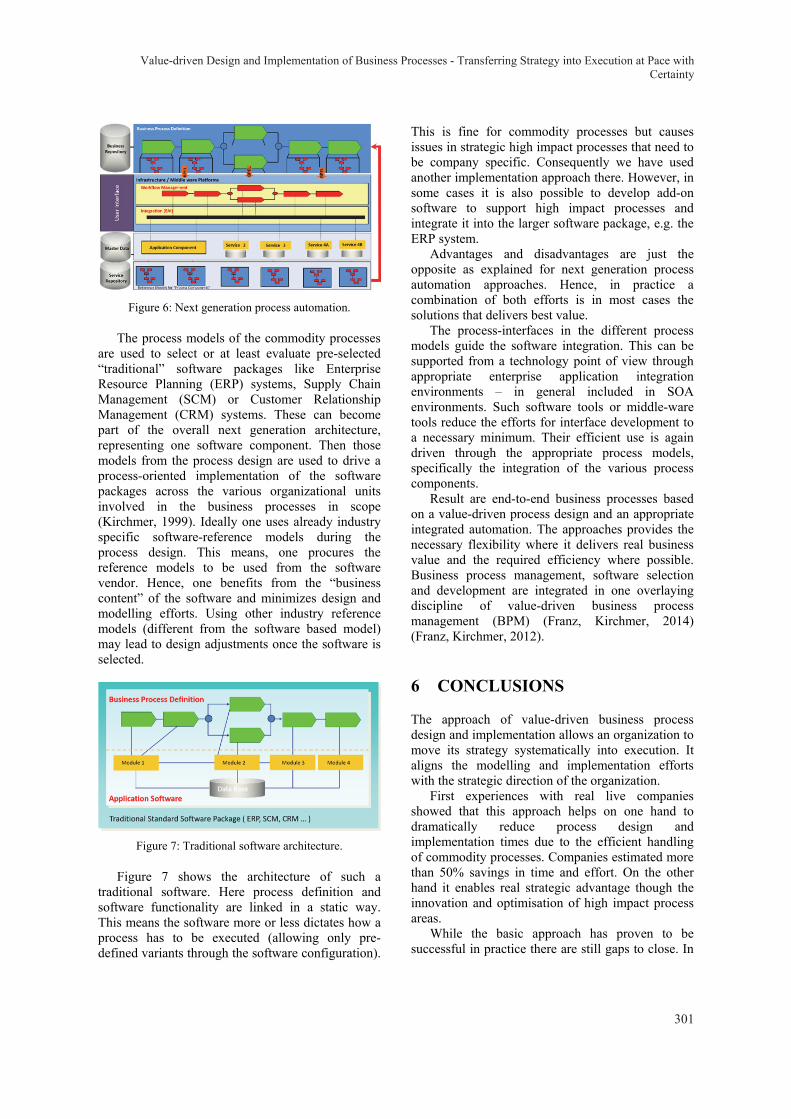
Figure 6: Next generation process automation.
The process models of the commodity processes are used to select or at least evaluate pre-selected “traditional” software packages like Enterprise Resource Planning (ERP) systems, Supply Chain Management (SCM) or Customer Relationship Management (CRM) systems. These can become part of the overall next generation architecture, representing one software component. Then those models from the process design are used to drive a process-oriented implementation of the software packages across the various organizational units involved in the business processes in scope (Kirchmer, 1999). Ideally one uses already industry specific software-reference models during the process design. This means, one procures the reference models to be used from the software vendor. Hence, one benefits from the “business content” of the software and minimizes design and modelling efforts. Using other industry reference models (different from the software based model) may lead to design adjustments once the software is selected.
Figure 7: Traditional software architecture.
Figure 7 shows the architecture of such a traditional software. Here process definition and software functionality are linked in a static way. This means the software more or less dictates how a process has to be executed (allowing only pre-defined variants through the software configuration).
This is fine for commodity processes but causes issues in strategic high impact processes that need to be company specific. Consequently we have used another implementation approach there. However, in some cases it is also possible to develop add-on software to support high impact processes and integrate it into the larger software package, e.g. the ERP system.
Advantages and disadvantages are just the opposite as explained for next generation process automation approaches. Hence, in practice a combination of both efforts is in most cases the solutions that delivers best value.
The process-interfaces in the different process models guide the software integration. This can be supported from a technology point of view through appropriate enterprise application integration environments – in general included in SOA environments. Such software tools or middle-ware tools reduce the efforts for interface development to a necessary minimum. Their efficient use is again driven through the appropriate process models, specifically the integration of the various process components.
Result are end-to-end business processes based on a value-driven process design and an appropriate integrated automation. The approaches provides the necessary flexibility where it delivers real business value and the required efficiency where possible. Business process management, software selection and development are integrated in one overlaying discipline of value-driven business process management (BPM) (Franz, Kirchmer, 2014) (Franz, Kirchmer, 2012).
6 CONCLUSIONS
The approach of value-driven business process design and implementation allows an organization to move its strategy systematically into execution. It aligns the modelling and implementation efforts with the strategic direction of the organization.
First experiences with real live companies showed that this approach helps on one hand to dramatically reduce process design and implementation times due to the efficient handling of commodity processes. Companies estimated more than 50% savings in time and effort. On the other hand it enables real strategic advantage though the innovation and optimisation of high impact process areas.
While the basic approach has proven to be successful in practice there are still gaps to close. In
Value-driven Design and Implementation of Business Processes - Transferring Strategy into Execution at Pace withCertainty
301

the design part the systematic achievement of appropriate process innovation is still a topic that needs further research. Considering the importance of process innovation, this is a real key topic. In the field of process implementation the integration of the process modelling and execution environments can still be improved. While there is quite a bit of progress on the software-side (Scheer 2013) (Stary 2012), there is still work to do on an integrating software and organizational governance solution.
REFERENCES
Burlton, 2013. Delivering Business Strategy through Process Management. In: Vom Brocke, J., Roemann, M.: Handbook on Busienss Process Management 2 – Strategic Aignment, Governance, People and Culture, Springer, Berline, New York, e.a.
Elzina, Gulledge, Lee, 1999. Business Engineering, Springer, Norwell.
Franz, Kirchmer, 2012. Value-driven business Process Management – The Value-Switch for Lasting Competitive Advantage, McGraw-Hill, New York, e.a.
Franz, Kirchmer, 2014. The BPM-Discipline – Enabling the Next Generation Enterprise. BPM-D Executive Training Documentation, London, Philadelphia.
George, 2010. The Lean Six Sigma Guide to Doing More with Less – Cut Costs, Reduce Waste, and Lower your Overhead. McGraw-Hill, New York, e.a.
Kirchmer, 2013. How to create successful IT Projects with Value-driven BPM, In: CIO Magazine Online, February 27th 2013.
Kirchmer, 2011. High Performance through Process Excellence – From Strategy to Execution with Business Process Management. Springer, 2nd edition, Berlin, e.a.
Kirchmer, 1999a. Business Process Oriented Implementation of Standard Software – How to achieve Competitive Advantage Efficiently and Effectively. Springer, 2nd edition, Berline, e.a.
Kirchmer, 1999b. Market- and Product-oriented Definition of Business Processes. In: Elzina, D.J., Gulledge, T.R., Lee, C.-Y (editors): Business Engineering, Springer, Norwell.
Mitchel, Ray., van Ark, 2014.: The Conference Board – CEO Challenge 2014: People and Performance, Reconnecting with the Customer and Reshaping the Culture of Work. The Conference Board Whitepaer, New York, e.a. 2014.
Rummler, Ramias, Rummler, 2010: White Space Revisited – Vreating Value thorugh Processes.Wiley, San Francisco.
Scheer, 2013. Tipps fuer den CIO: Vom Tekki zum Treiber neuer Business Modelle. In: IM+IO – Das Magazin fuer Innovation, Organisation und Management, Sonderausgabe, Dezember 2013.
Scheer, 1998. ARIS – Business Process Frameworks, Springer, 2nd edition, Berlin, e.g.
Slama, Nelius, 2011. Enterprise BPM – Erfolgsrezepte fuer unternehmensweites Prozessmanagement. dpunkt.verlag, Heidelberg.
Stary, 2012. S-BPM One – Scientific Research. 4th International Conference, S-BPM ONE 2012, Vienna, Austria, April 2012, Proceedings.
Fourth International Symposium on Business Modeling and Software Design
302

AUTHOR INDEX
Akzhalova, A. ......................................... 113 Atanassov, K. ......................................... 289 Atanassova, V. ................................ 271, 289 Bakhshandeh, M. .................................... 142 Barn, B. .................................................. 180 Bauer, B. ................................................... 47 Biziel, G. .................................................. 20 Boytsov, E. ............................................. 217 Caetano, A. ............................................. 142 Casier, K. ................................................ 172 Chicco, G. ............................................... 209 Clark, T. .................................................. 180 Coenen, T. .............................................. 172 Collier, R. ............................................... 229 Cordeiro, J. ............................................. 125 Doukovska, L. ................ 271, 276, 282, 289 Drobek, M. ............................................. 166 Du, Y. ..................................................... 223 Dürr, P. ..................................................... 29 Estañol, M. ............................................... 84 Frank, U. ..................................................... 9 Fritscher, B. ............................................ 236 Gaaloul, K. ............................................. 148 Ghezala, H. ............................................. 148 Gilani, W. ............................................... 166 Granjo, J. ................................................ 142 Groß, S. .................................................. 202 Guédria, W. ............................................ 196 Hadjiski, M. ............................................ 276 Hauder, M. ................................................ 38 Hirohashi, Y. .......................................... 261 Holler, J. ................................................. 202 Huemer, C. ............................................. 153 Ichikawa, M. ........................................... 261 Ivanov, I. ................................................ 245 Jabloun, M. ............................................. 148 Janssen, M. ............................................... 56 Kaloyanova, K. ....................................... 135 Kamun, R. .............................................. 186 Karastoyanov, D. .................................... 282 Kato, C. .................................................. 261 Kirchmer, M. .......................................... 297 Kojnov, S. ............................................... 276 Kulkarni, V. ............................................ 180 Langermeier, M. ....................................... 47
Lee, S.-j. .................................................. 261 Liu, W. .................................................... 223 Maciaszek, L. ............................................ 20 Maneva, N. ............................................. 135 Matthes, F. .......................................... 29, 38 Mavrov, D. .............................................. 289 Mei, H. .................................................... 255 Michell, V. ................................................ 74 Minning, T. ............................................. 159 Molka, T. ................................................ 166 Monov, V. ............................................... 276 Moog, Y. ................................................. 159 Murdoch, O. ............................................ 229 Napoli, R. ................................................ 209 Nikov, V. ................................................ 276 Ning, Y. .................................................. 223 O’Grady, M. ........................................... 229 O’Hare, G. .............................................. 229 Omarov, A. ............................................. 186 Oyama-Hyga, M. .................................... 261 Pigneur, Y. .............................................. 236 Pombinho, J. ........................................... 142 Proper, E. .................................................... 3 Queralt, A. ................................................ 84 Ranaivoson, H. ....................................... 172 Redlich, D. .............................................. 166 Reynders, C. ........................................... 172 Roth, S. ..................................................... 38 Roubtsov, S. ............................................ 103 Roubtsova, E. .................................... 74, 103 Saad, C. ..................................................... 47 Sajjad, I. .................................................. 209 Sancho, M.-R. ........................................... 84 Sano, T. ................................................... 261 Sayeb, Y. ................................................. 148 Schepers, R. ............................................ 159 Schneider, A. ............................................ 29 Schulz, C. .................................................. 38 Shahpazov, G. ......................................... 271 Shahpazov, V. ......................................... 282 Silva, M. ................................................. 142 Skalniak, T. ............................................... 20 Soban, D. ................................................ 166 Sokolov, V. ............................................. 217 Suurmond, C. ............................................ 94
303

Teniente, E. .............................................. 84 Timm, I. .................................................. 159 Umarov, T. ............................................. 186 Van der Wee, M. .................................... 172 Verbrugge, S. .......................................... 172 Wally, B. ................................................ 153
Wedemeijer, L. ......................................... 63 Wieringa, R. ................................................ 5 Yang, H.-W. ............................................ 255 Yu, S. ...................................................... 223 Zec, M. ...................................................... 29
Fourth International Symposium on Business Modeling and Software Design
304