PROCEEDINGS PROCEEDINGS THE 1
248
IFBE 2019 ISBN:978-602-53802-1-1 13-14, NOVEMBER 2019 BANJARMASIN, INDONESIA
-
Upload
khangminh22 -
Category
Documents
-
view
6 -
download
0
Transcript of PROCEEDINGS PROCEEDINGS THE 1
PROCEEDINGS
IFBE 2019
ISBN:978-602-53802-1-1
13-14, NOVEMBER 2019BANJARMASIN, INDONESIA
PROCEEDINGS
THE 1INTERNATIONAL FORUM ONBUSINESS AND ECONOMY
st
PROCEEDINGS The 1
st International Forum On Business And Economy – IFBE 2019
“Business and Economy in Disruptive Era”
Banjarmasin, 13-14 November 2019
Publisher :
Fakultas Ekonomi dan Bisnis
Universitas Lambung Mangkurat
The 1st International Forum Business and Economy (IFBE) 2019 Banjarmasin, 13-14 November 2019
ii
PROCEEDINGS The 1
st International Forum On Business And Economy – IFBE 2019
“Business and Economy in Disruptive Era”
Steering Committee
Dr. H. Atma Hayat, M.Si., Ak. CA.
Committee:
Chairman : Prof. M. Handry Imansyah, MAM, Ph.D
Vice Chairman : Syahrituah Siregar, SE, MA.
Secretary I : Dr. Dewi Rahayu, SE, MP
Secretary II : Enny Hardi, SE, MP
Secretary III : Irma Anggraeni, S.Ak
Treasurer : Dr. Hj. Ade Adriani, SE, M.Si., Ak., CA
IT and Website : Dheo Tegar Pratama, S.ST.
Adey Akhmad Hidayat.
Venue & Accomodation : Muslimin, SE, MM
Ahmad Nuryadi, A.Md
Wiliyanti, SE, MM
Erna Rusnani, SE, MM
Program : Dr.Hj. Muzdalifah, SE, M.Si.
Wawan Gustiawan, SE
Noor Elyn Basri, S.Sos
Liaison Officer : Dra. Rawintan Endas Binti, M.Com, MTQM (Hons) Ak, CA
Dr. Meiske Claudia, SE, MM
Reviewer :
1. Prof. Dr. Mansur Afifi, FEB Universitas Mataram
2. Prof. Dr. Eddy Suratman, SE, MA.,FEB Universitas Tanjungpura
3. Prof. M. Handry Imansyah, MAM, Ph.D.,FEB Univ. Lambung Mangkurat
4. Dr. H. M. Riza Firdaus, SE, MM, FEB Universitas Lambung Mangkurat
5. Dr. Hefrizal Handra, FEB Universitas Andalas
6. Dr. Hj. Ade Adriani, SE, M.Si., Ak., CA., FEB Univ. Lambung Mangkurat
7. Dr. Dewi Rahayu, SE, MP., FEB Universitas Lambung Mangkurat
8. Dr. Hj. Muzdalifah, SE, M.Si., FEB Universitas Lambung Mangkurat
9. Arief Budiman, SE, M.Mktg., Ph.D., FEB Universitas Lambung Mangkurat
10. Dr. Meiske Claudia, SE, MM., FEB Universitas Lambung Mangkurat
The 1st International Forum Business and Economy (IFBE) 2019 Banjarmasin, 13-14 November 2019
iii
Editor :
Hidayatullah Muttaqin, SE, MSI
Managing Editor
Sri Maulida, S.E.Sy., M.E.I.
Publisher :
Fakultas Ekonomi dan Bisnis Universitas Lambung Mangkurat
Address:
Fakultas Ekonomi Dan Bisnis ULM, Universitas Lambung Mangkurat, Jalan Brigjen Haji Hasan
Basri No.29, Pangeran, Banjarmasin Utara, Kota Banjarmasin, Kalimantan Selatan 70123
Email [email protected]
Telp./Fax (0511) 3305116 / 3306654
Hp. +62-811-518-848 (Muzdalifah)
The 1st International Forum Business and Economy (IFBE) 2019 Banjarmasin, 13-14 November 2019
iv
FOREWORD
The papers contained in this proceeding are taken from the “The 1st International
Forum On Business And Economy – IFBE 2019”. Keynote speakers and authors of selected
oral were invited to submit a manuscript for publication. The manuscripts were reviewed by the
blind reviewers, and members of the editorial boards. The papers fulfill acceptable standard of
scientific publication. The Steering Committee appreciates the contributions of all editors and
reviewers in improving the quality of this proceeding.
In particular, I wish to express my warmest appreciation to the following people: Our
distinguished keynote speaker, Dr. Arlyana Abubakar as Director, Bank of Indonesia. Prof. Dr.
Raja Rasiah (University of Malaya), Abdy Taminsyah (President of MonsoonSIM) and Prof. Dr.
M. Handry Imansyah, MAM (Regional Economist).
Banjarmasin, November 2019
Chairman,
Prof. Dr. M. Handry Imansyah, MAM
The 1st International Forum Business and Economy (IFBE) 2019 Banjarmasin, 13-14 November 2019
v
CONTENT
FOREWORD........................................................................................................................................ iv
CONTENT ............................................................................................................................................ v
THE RICE FIELD LAND PRODUCTIVITY IN FULFILLMENT OF RICE
POPULATION IN THE DISTRICT WONOSOBO, CENTRAL JAVA
Jamzani Sodik, Asih Sri Winarti, Eko Murdiyanto, and Wahyu Dwi Artaningtyas ........................................ 1
THE IMPLEMENTATION OF INVESTMENT DECISION IN CAPITAL MARKET TO
THE LABORATORY OF FINANCIAL AND THE STUDY PROGRAM MANAGEMENT
OF CAPITAL MARKET
Hasa Nurrohim KP, C. Ambar Pujiharjanto, Sri Isworo Ediningsih ............................................................. 1
THE CONTINGENCY BASED ON TOURISM VILLAGE MANAGERIAL: THE
PROPOSED DEVELOPMENT OF ECO-VILLAGE TOURISM IN BANTUL REGENCY Hadi Oetomo, Titik Kusmantini, Hendri Gusaptono, Yekti Utami ........................................................ 2
SCHOOL CHARACTERISTICS, SKILL COMPETENCY, SCHOOL IMAGES, AND
PARENTS’ SOCIAL CLASSES IN AFFECTING STUDENT’S DECISIONS TO
CHOOSE MIDDLE VOCATIONAL SCHOOLS IN PALANGKA RAYA, CENTRAL
KALIMANTAN Lelo Sintani ............................................................................................................................................ 2
INTELLECTUAL CAPITAL AND BUSINESS PERFORMANCE (STUDY IN
SASIRANGAN SME) Muhammad Ziyad, Mayasari Dewi, Redawati ...................................................................................... 3
THE DEVELOPMENT OF VILLAGE ECONOMIC POTENTIAL: VILLAGE
COOPERATIVE VERSUS VILLAGE BUSINESS UNIT (BUMDES)
Tri Mardiana, A.Y.N. Warsiki, Sucahyo Heriningsih ............................................................................ 3
THE EFFECT OF INFORMATION SHARING ON SUPPLY CHAIN PERFORMANCE
MEDIATED BY COMPANY RELATIONSHIP (STUDY AT BATIK SMES IN
YOGYAKARTA CITY)
Titik Kusmantini, Dika Setya Prayogi, Tri Wahyuningsih, Krisnandini Wahyu Putri .......................... 4
The 1st International Forum Business and Economy (IFBE) 2019 Banjarmasin, 13-14 November 2019
vi
ASSESSING READINESS TO DEVELOP HALAL TOURISM IN SOUTH
KALIMANTAN, INDONESIA
Mochammad Arif Budiman, Mutiara Sadewa, Lusiana Handayani ...................................................... 4
THE EFFECT OF INFLATION, BANK INDONESIA INTEREST RATE AND RUPIAH
EXCHANGE RATE ON MARGIN MURABAHAH REVENUE AT BNI SYARIAH
Siti Bulkis, Mochammad Arif Budiman .................................................................................................. 5
KALIMANTAN MAJOR AIRPORT FOOD & BEVERAGE OUTLETS: PROFIT-
DRIVEN OR PUBLIC SERVICE-DRIVEN?
Rawintan Endas Binti, Enny Hardi; M. Hudaya; Rifqi Novriyandana ................................................. 5
THE EFFECT OF PERCEIVED WORK VALUE, PERCEIVED WORK
ENVIRONMENT AND PAY SATISFACTION ON TURNOVER INTENTION (STUDY
AT MILLENNIALS GENERATION IN PT ADARO INDONESIA TANJUNG
TABALONG KALIMANTAN SELATAN )
Rochman Hidayat, Achmad Alim Bachri ............................................................................................... 6
THE EFFECT ORIGINAL LOCAL REVENUE (PAD) AND GENERAL ALLOCATION
FUND (DAU) ON LOCAL EXPENDITURE (BD) AND FLYPAPER EFFECT
PHENOMENON IN REGENCIES / CITIES IN SOUTH KALIMANTAN PROVINCE
Muzdalifah, Na'imatul Aufa, Fahrina .................................................................................................... 6
ANALYSIS OF SINGLE CURRENCY IMPLEMENTATION IN ASEAN+3
Moh. Ahlis Djirimu, Haerul Anam, Frilly Andrelia Utami.................................................................... 8
STUDENT ENTREPRENEURIAL INTEREST IN THE DEPARTMENT OF BUSINESS
ADMINISTRATION AS A RESULT OF MANAGEMENT AND ENTREPRENEURSHIP
LEARNING ACHIEVEMENT
Sri Imelda, Hikmayanti Huwaida, Rofi’i ............................................................................................... 19
PERCEIVED DESTINATION COMPETITIVENESS OF BANJARMASIN URBAN
TOURISM
Sari Hepi Maharani, Rudy Haryanto, Rahmatul Jannatin Na’imah ..................................................... 27
THE VALUATION OF “BEDAH MENOREH” RURAL TOURISM PROGRAM IN
SIDOHARJO VILLAGE, KULONPROGO, INDONESIA
Nurwiyanta, Erni Ummi Hasanah, Evi Gravitiani Nur Khasanah, Enny Mulyantari, Risdiyanto........ 34
The 1st International Forum Business and Economy (IFBE) 2019 Banjarmasin, 13-14 November 2019
vii
REINFORCEMENT OF DIGITAL-BASED RISK MANAGEMENT IN ISLAMIC BANK
FINANCING IN THE DISRUPTION ERA
Tri Hidayati, Muhammad Syarif ............................................................................................................ 41
SUSTAINABLE ECONOMIC DEVELOPMENT BASED ON AQUAPONIC
TECHNOLOGY IN PEAT AREA WITH ACIDIC WATER IN JEJANGKIT VILLAGE
Agus Pebrianto, Ahmad Rizani, Adi Pratomo ....................................................................................... 57
INTER-REGIONAL ECONOMIC DEVELOPMENT IN KALIMANTAN
Wita Karina Ramlan, Saipudin, Rusmin Nuryadin ................................................................................ 66
GREEN VILLAGE FOR A SUSTAINABLE TOURISM ON SRIMULYO VILLAGE,
PIYUNGAN, BANTUL
Danang Wahyudi, Erni Ummi Hasanah, Evi Gravitiani, Mochamad Syamsiro, Retno Lantarsih,
Hermawan Prasetyanto ......................................................................................................................... 79
THE EFFECT OF PERCEPTION ON EASE OF USE AND PERCEPTION OF
USABILITY ON THE IMPLEMENTATION OF FINANCIAL ACCOUNTING
STANDARDS FOR MICRO, SMALL, AND MEDIUM ENTERPRISES (SAK EMKM)
AT MSMES IN BANJARMASIN CITY
Nurul Qalbiah, Sandra Irawan .............................................................................................................. 86
THE FACTORS AFFECTING DECISIONS INVEST IN CAPITAL MARKETS
Hani Subagio, Shinta Heru Satoto, Sri Isworo Ediningsih .................................................................... 97
THE EFFECT OF KNOWLEDGE MANAGEMENT ON MARKETING
PERFORMANCE THROUGH COMPETITIVE ADVANTAGES OF MSMES FOOD
PROCESSING IN PURWOREJO REGENCY, CENTRAL JAVA
Hesti Respatiningsih, Nazief Nirwanto, Junianto Tjahjo Darsono........................................................ 105
THE INFLUENCE OF TRANSFORMATIONAL LEADERSHIP, POWER DISTANCE,
AND FOLLOWERSHIP ON THE CAPABILITY OF MAKING A FIRST DECISION IN
KOSTRAD
Burhanudin Amin, Hamidah, Kazan ...................................................................................................... 114
THE EFFECT OF CORPORATE REPUTATION AND CUSTOMER VALUE
CREATION ON CUSTOMER SATISFACTION OF INTERNET INDIHOME
PROVIDER IN CENTRAL JAVA
Bayu Kurniawan .................................................................................................................................... 124
The 1st International Forum Business and Economy (IFBE) 2019 Banjarmasin, 13-14 November 2019
viii
THE EFFECT OF SMOG FACT TOWARDS THE ECONOMIC REVENUE OF SMALL
TRADERS IN THE CITY OF PEKANBARU
Prama Hidaya, Heppi Syofya ................................................................................................................ 130
THE EFFECT OF FAIR VALUE ACCOUNTING, AUDITOR PROFESSIONAL
SKEPTICISM AND AUDIT FIRM SIZE TO AUDITOR-CLIENT NEGOTIATION
RESULTS
Fitria Husnatarina, Maria Yanida, San Petro ....................................................................................... 140
THE EFFECT OF BUDGET PLANNING, BUDGET CHANGE, AND PROCUREMENT
OF GOODS AND SERVICES TOWARDS THE APPLICATION OF BUDGET
Een Evytha Venoryca, Usup Riassy Christa, Fitria Husnatarina ......................................................... 162
THE EFFECT OF ASSET MANAGEMENT STAGE TOWARDS OPTIMIZATION OF
ASSETS
Ria Widiyanti, Abdul Djalil, Fitria Husnatarina ................................................................................... 176
ARE THERE CONTINGENT FACTORS THAT AFFECT AND NOT AFFECT
TOWARDS CORRUPTION LEVELS? (EVIDENCE FROM PROVINCES
GOVERNMENT IN INDONESIA)
Wardahayati, Syaiful Hifni, Sarwani, Atma Hayat, Lili Safrida, Akhmad Sayudi, Wahyudin Nor ....... 189
FIT AND PROPER TEST: A DETERMINANT OF GOOD CORPORATE
GOVERNANCE BANKING INDUSTRY IN INDONESIA
S Napitupulu, I Primiana, S R Nidar, N Effendi, M P Devy, DM Puspitasari....................................... 217
The 1st International Forum Business and Economy (IFBE) 2019 Banjarmasin, 13-14 November 2019
1
THE RICE FIELD LAND PRODUCTIVITY IN FULFILLMENT OF RICE POPULATION IN
THE DISTRICT WONOSOBO, CENTRAL JAVA
Jamzani Sodik, Asih Sri Winarti, Eko Murdiyanto, and Wahyu Dwi Artaningtyas
Faculty of Economics, UPN Veteran Yogyakarta
Email: [email protected]
Abstract: This study aims to determine the amount of rice production in Wonosobo Regency year
2010- 2017, and to find out the level of productivity of rice fields. The initial idea of this study is due
to the increasing population in Wonosobo District from 2010-2017 which led to the conversion of rice
fields to village. This issue will reduce the resources of agricultural land for rice production. This
study uses a descriptive method with a quantitative approach. Moreover, the data in this study is
secondary data which are obtained from BPS Wonosobo Regency. The data are analyzed by using
Microsoft Excel in a way of comparing the demand and the supply. To find out the level of
productivity of rice fields, this study uses the carrying capacity of agricultural land formula. Based on
the results of analysis, it is found that there are two things can be calculated. From side of demand, the
rice needs in 2017 can be calculated based on the population and physical consumption figures of
97939,61223 tons. Meanwhile, the results of calculations in terms of availability or production of rice
in the Wonosobo Regency in 2017 amounted to 11197.69707 tons. Therefore, if we compare the
needs with availability, Wonosobo Regency has a deficit which means that the number of rice needs
in the Wonosobo Regency in 2017 is below the demand or demand rate. Furthermore, from the
productivity level of rice fields in 2017 based on rice production or availability, it shows that
Wonosobo Regency has a deficit with availability of 0.014279007 tons. This figure is below the
minimum physical consumption figure of Wonosobo Regency population of 0.124 or equivalent to
342 gr/person/day. The productivity based on the carrying capacity of agricultural land also
experiences deficit. The indication value of 0.0000001458, less than 1 (a <1) which means that the
Wonosobo Regency is no longer capable of food self-sufficiency.
Keywords: Productivity, Rice Fields, Rice Production, Rice Needs
THE IMPLEMENTATION OF INVESTMENT DECISION IN CAPITAL MARKET TO THE
LABORATORY OF FINANCIAL AND THE STUDY PROGRAM MANAGEMENT OF
CAPITAL MARKET
Hasa Nurrohim KP, C. Ambar Pujiharjanto, Sri Isworo Ediningsih
Faculty of Economics and Business UPN "Veteran" Yogyakarta
Email: [email protected]
Abstract: This research is conducted to look back at investment decisions made by the academic
community includes lecturers, employees, and students within the Management Study Program UPN
"Veteran" Yogyakarta. The existence of the Financial and Capital Market Laboratory is expected to
make it easier for lecturers, employees and students to invest in the form of share ownership. The test
is conducted by multiple regression test. It was done by testing the factors of Neutral Information,
Accounting Information, Classic, Social Relevance, Advocate Recommendation, Personal Financial
Need.
Keyword: The Financial And Capital Market Laboratory, Conducted By Lecturers, Employees And
Students
The 1st International Forum Business and Economy (IFBE) 2019 Banjarmasin, 13-14 November 2019
2
THE CONTINGENCY BASED ON TOURISM VILLAGE MANAGERIAL: THE PROPOSED
DEVELOPMENT OF ECO-VILLAGE TOURISM IN BANTUL REGENCY
Hadi Oetomo, Titik Kusmantini, Hendri Gusaptono, Yekti Utami
UPN Veteran Yogyakarta Yogyakarta
Email: [email protected]
Abstract: This research aims to review the theoretical study of contingency theory and the concept of
entrepreneurship, in the context of submitting research prepositions about antecedent factors and the
consequences of management patterns of eco-village tourism. The observation is planned to be carried
out using a sample of 11 tourist villages in Bantul Regency. Moreover, the data collection is carried
out by in-depth interview techniques with 25 research participants including community leaders,
business people and government officials who manage Small and Medium Enterprises (SME). This
paper explores more detailed about the external and internal environmental factors which have
significant influence on the managerial pattern of eco-friendly tourism villages. The managerial
pattern dimensions include the intensity of innovation, pro-active behavior and business agility. These
dimensions are also predicted to determine the success of the management of environmentally friendly
tourism villages.
Keywords: Managerial Pattern, Eco-Village Tourism, External and internal environment, The
Success of eco-village tourism, Bantul Regency.
SCHOOL CHARACTERISTICS, SKILL COMPETENCY, SCHOOL IMAGES, AND
PARENTS’ SOCIAL CLASSES IN AFFECTING STUDENT’S DECISIONS TO CHOOSE
MIDDLE VOCATIONAL SCHOOLS IN PALANGKA RAYA, CENTRAL KALIMANTAN
Lelo Sintani
Faculty of Economics and Business University of Palangka Raya
Email: [email protected]
Abstract: This study aims to measure and analyze the effects of school characteristics, skill
competences, vocational school images, and parents’ sosial classes on the students’ preference in
selecting the Vocational Middle Schools in in Palangka Raya. This study uses a descriptive
quantitative method. The population of this study is the Tenth Graders of Vocational Middle Schools
in Palangka Raya, specifically in SMK Negeri 1 Palangka Raya, SMK Negeri 2 Palangka Raya, and
SMK Negeri 3 Palangka Raya. To determine the number of samples, Slovin Formula is applied. The
data collection methods are obtained by interviewing the entitled and authorized parties. These parties
provided the data in the way of giving and distributing the questioners to the respondents (acted as the
samples). The respondents are people who answered those questions. The documentation is conducted
by collecting and studying the data relating to this study. The data verify the assumptions, and that
data were analyzed with Descriptive Analysis, Factor Analysis, and Multiple Regression Analysis.
From the result of the Descriptive Analysis, it has been concluded that the variables of the school
characteristics, the vocational skills offered, the school image, and the parents’ social classes are the
important factors in students’ preference to continue their study in the vocational high school in
Palangka Raya, Central Kalimantan. Thus, based on analyzing the confirmatory factors, each question
indicator of variables is valid and reliable. Indicators of of each factor are accurate to measure those
variables. The Multiple Regression Analysis indicates that the school characteristics, the vocational
skills offered, the school images, and the parents’ social classes affect simultaneously on the students’
preference in selecting the Vocational High School. This result are taken from the F-test. Futhermore,
the value of the determination coefficient shows that about 54.50% of total variation of students’
preference can be accounted by four variables. Moreover, the t-test result indicates partially that the
variables of the school images and the vocational skills are significantly positive to influence the
The 1st International Forum Business and Economy (IFBE) 2019 Banjarmasin, 13-14 November 2019
3
students’ preference in selecting the vocational school. In this term, the variable of the school image is
more dominant. However, the school characteristics and the parents’s social classes do not
significantly affect on the students’ preference to select the vocational school in Palangka Raya,
Central Kalimantan.
Keywords: School Characteristics, Skill Competency, School Image, Parents’ Social Classes and
Students’ Preference
INTELLECTUAL CAPITAL AND BUSINESS PERFORMANCE (STUDY IN SASIRANGAN
SME)
Muhammad Ziyad, Mayasari Dewi, Redawati Faculty of Economics and Business , Lambung Mangkurat University
Email: [email protected]
Abstract: This study aims to analyze the effect of Intellectual Capital on business performance of
Sasirangan SME in Banjarmasin City. The Intellectual Capital in this study consists of Human
Capital, Structural Capital, and Customer Capital contained in a business company. This study is a
type of causal research that aims to get evidence about causal relationships. Also, this study is carried
out by using a quantitative approach. The population in this study is all Sasirangan SMEs in
Banjarmasin City. According to Roscoe (1975) in Uma Sekaran (2006) the minimum number of
samples in correlational research to obtain good results is between 30 to 500. Thus, the number of
samples which are used in this study are 40 Sasirangan SMEs in Banjarmasin. The sampling is done
based on purposive sampling with the criteria of Sasirangan SMEs which has been older than one
year. The result shows that Human Capital and Structural Capital have positive effect on the
performance of Sasirangan SMEs in Banjarmasin. On the other hand, Customer Capital does not have
effect on Sasirangan SMEs.
Keywords: Small and Medium Enterprises, Intellectual Capital, Human Capital, Structural Capital
and Customer Capital.
THE DEVELOPMENT OF VILLAGE ECONOMIC POTENTIAL:
VILLAGE COOPERATIVE VERSUS VILLAGE BUSINESS UNIT (BUMDES)
Tri Mardiana, A.Y.N. Warsiki, Sucahyo Heriningsih
UPN “Veteran” Yogyakarta
Email: [email protected]
Abstract: The independent village has become an ideal village for people living in the village. The
Village Law No.6 in 2014 has brought a breath of fresh air to the village. The development of an
independent village not only can be realized by using the budget from APBD, but also the budget
from Ministry of Village (APBN). Creating a good village governance is a must for villages to realize
autonomous, accountable and transparent management of village funds. The use of village funds is
realized by creating a village business unit in the form of a Village Cooperative (Koperasi) and
Village Business Unit (Bumdes). It aims to improve the welfare of the village community; thus, the
village independence can be achieved. The formation of village cooperatives and community service
units as business units are expected to increase the economic resources of the community in the
village. This research uses the method of literature study and discussion. These method were
conducted by describing the topic in a related way with Village Business Units (Village Cooperatives
and Bumdes). The results of this study indicate that village cooperatives have not maximized the
benefits for village development. It is because only the members of cooperatives who take benefit
from the existence of cooperative. To reduce the weaknesses of village cooperatives, there are
The 1st International Forum Business and Economy (IFBE) 2019 Banjarmasin, 13-14 November 2019
4
alternatives to establish Village Unit Business Entities (BUMDes) as a place for various business units
of villages. They are: diminishing business units, village markets, village tourism. Moreover, it is also
can be done by merging Village Cooperatives and BUMDes. However, the success of BUMDes
requires the participation of all village communities, so that the economy of the community in the
village can improve and become an independent village.
Keywords: village cooperatives (Koperasi), village unit business entities (BUMDes), independent
village
THE EFFECT OF INFORMATION SHARING ON SUPPLY CHAIN PERFORMANCE
MEDIATED BY COMPANY RELATIONSHIP (Study at Batik SMEs in Yogyakarta City)
Titik Kusmantini1, Dika Setya Prayogi
2, Tri Wahyuningsih
3, Krisnandini Wahyu Putri
4
1,3,4 Lecturer in the Faculty of Economics and Business, UPN Veteran Yogyakarta
2 Student of Faculty of Economic and Business UPN "Veteran" Yogyakarta
Email: [email protected]
Abstract: Entering the era of globalization, economic shifts and market trends are increasingly fast
and difficult to predict. The role of information as the main ingredient of decision making in
companies becomes important. This study aims to determine the effect of information sharing (IS) on
supply chain performance (SCP) which is mediated by the company relationship (CR). The survey
was conducted through distributing questionnaires to 48 samples of batik SMEs in Yogyakarta city
selected by simple random sampling method. Then, the data were analyzed using path analysis with
SPSS 15. The results of the study found a significant positive effect of IS on SCP indicated by the
correlation coefficient (R) of 0.374 and t count> t table at a significance level of 5% (4,976> 2,014).
The significant positive effect of IS on CR is shown by the value of the correlation coefficient (R) of
0.453 and the value of t count> t table at the significance level of 5% (4.540> 2.014). The significant
positive effect of CR on SCP is shown by the value of the correlation coefficient (R) of 0.360 and the
value of t count> t table at the significance level of 5% (3.896> 2.014). Finally, the significant positive
effect of IS on the SCP which is mediated by CR is shown by the sum of the coefficients of 0.537 then
tested using the sobel test and produces z count> t table at a significance level of 5% (3.078> 2.014).
This research contributes to the development and theoretical application, especially in the field of
operational management.
Keywords: Information Sharing, Supply Chain Performance, and Company relationship
ASSESSING READINESS TO DEVELOP HALAL TOURISM IN SOUTH KALIMANTAN,
INDONESIA
Mochammad Arif Budiman*, Manik Mutiara Sadewa, Lusiana Handayani
Prodi Akuntansi Lembaga Keuangan Syariah, Politeknik Negeri Banjarmasin
Email: *[email protected]
Abstract: The halal tourism industry has grown rapidly in recent years throughout the world. This
motivates many countries to develop their potential to attract as many tourists as possible. Being the
biggest Muslim country worldwide, Indonesia has great potential for this halal tourism industry.
Unfortunately, this potential has not been developed evenly in many provinces of the country.
Therefore, the purpose of this study is to assess readiness to develop the province of South
Kalimantan as a favorite halal tourism destination in Indonesia. The study was conducted with
qualitative and quantitative approaches using observation and survey methods. The findings show that
South Kalimantan has great potential and promising prospects for developing the halal tourism
industry and attracting domestic and foreign visitors. It is because South Kalimantan has Muslim
The 1st International Forum Business and Economy (IFBE) 2019 Banjarmasin, 13-14 November 2019
5
population, strong Islamic heritage and rich cultural traditions as well as beautiful natural panorama.
However, this province has several shortcomings in developing halal tourism mainly due to the
limited facilities and the infrastructure to support tourism and a lack of cleanliness, tourism
innovation, and promotion.
Keywords: halal tourism, readiness, tourist destination, Islamic heritage, visitor
THE EFFECT OF INFLATION, BANK INDONESIA INTEREST RATE AND RUPIAH
EXCHANGE RATE ON MARGIN MURABAHAH REVENUE AT BNI SYARIAH
Siti Bulkis (a*) and Mochammad Arif Budiman (b)
(a) Alumni of Prodi Akuntansi Lembaga Keuangan Syariah, Politeknik Negeri Banjarmasin
(b) Lecturer of Prodi Akuntansi Lembaga Keuangan Syariah, Politeknik Negeri Banjarmasin
Email: *[email protected]
Abstract: This study aims to explain the effect of inflation, Bank Indonesia interest rates and the
Rupiah exchange rate on murabahah margin income at BNI Syariah. The data used in this study are
secondary data which are accessed directly from the BNI Syariah official website, namely monthly
financial statements from the span of April 2015 to December 2018. The analysis technique used is
multiple linear regression analysis. Simultaneous test results show that inflation, Bank Indonesia
interest rates and the Rupiah exchange rate affect murabahah margin income. As for the partial test
results (T-Test), the inflation variable does not significantly influence murabahah margin income.
Meanwhile, Bank Indonesia interest rates and Rupiah exchange rates have significant effects on
murabahah margin income.
Keywords: inflation, Bank Indonesia interest rates, Rupiah exchange rates, murabahah margin
income, BNI Syariah
KALIMANTAN MAJOR AIRPORT FOOD & BEVERAGE OUTLETS: PROFIT-DRIVEN
OR PUBLIC SERVICE-DRIVEN?
Rawintan E. Binti; Enny Hardi; M. Hudaya; Rifqi Novriyandana
Faculty of economic & Business, Lambung Mangkurat University, Banjarmasin
Email: [email protected]
Abstract: This research embarks on the authors experience and public grievance on costly food and
beverage sold by Food and Beverage outlets in Kalimantan Major (KM) Airport. Even for urbanites,
price offered by the outlets is noticeably expensive than those sold in the down-town outlets.
Moreover, the price is more expensive for countryside people. The research aims to know and
understand the reason of rent cost determination as the main contributor which causes Food and
Beverage to become expensive. The qualitative approach is used to understand this case more clearly
with the strategy of case study research. On-site observation revealed that most tenants won the
bidding of food and beverage outlets are established entrepreneurs. They have strategic information
on business prospects in KM Airport, chain business entities who have nationally and internationally
network. Ordinary entrepreneurs who become the tenants of food and beverage outlets is rare because
of the high cost rent offered. It is not surprise that the tenants will give the high cost on customers.
These circumstances have caused KM Airport, owned by state, seems loses its direction to maintain
the equilibrium between the public-service entity and profit-oriented entity. For example, the absence
of drinking fountain has forced the airport users to buy water in the outlet which have double pricce.
KM Airport also does not set the structure or the percentage of the tenants, from categories: micro /
small, established, national chain and international chain entities. It is hardly to find a balanced model
The 1st International Forum Business and Economy (IFBE) 2019 Banjarmasin, 13-14 November 2019
6
of profit driven business without affirmative policy. Meanwhile, at the same time it has strong
commitment to serve its customers with public service standards and affordable prices of food and
beverage. The contribution of this study is to offer a balanced model of business in the context of
airports operated in developing countries where its users come from multiple strata.
Keywords: airport, public service, profit driven, balanced model
THE EFFECT OF PERCEIVED WORK VALUE, PERCEIVED WORK ENVIRONMENT
AND PAY SATISFACTION ON TURNOVER INTENTION (STUDY AT MILLENNIALS
GENERATION IN PT ADARO INDONESIA TANJUNG TABALONG KALIMANTAN
SELATAN)
Rochman Hidayat(a*), Achmad Alim Bachri (b)
Faculty of economic & Business, Lambung Mangkurat University, Banjarmasin
Email: *[email protected]
Abstract: This research aims to analyze the effect of perceived work value, perceived work
environment and pay satisfaction on turnover intention. The research can be considered as an
explanatory causality study. The population in this study is 328 permanent employees at the staff level
who were born in 1980-2000. The stratified random sampling is used as a sampling technique in this
research. The sample size is 180 employees which is distributed by proportional sampling. Descriptive
statistic and multiple regression are used as data analysis technique. T- Test is used to test the
hypothesis at 95% confidence level. This research concluds that there are negative significant partial
effects of perceived work value, perceived work environment and pay satisfaction on turnover
intention.
Keywords: perceived, work value, work environment, pay satisfaction, turnover intention
THE EFFECT ORIGINAL LOCAL REVENUE (PAD) AND GENERAL ALLOCATION
FUND (DAU) ON LOCAL EXPENDITURE (BD) AND FLYPAPER EFFECT PHENOMENON
IN REGENCIES / CITIES IN SOUTH KALIMANTAN PROVINCE.
Muzdalifah, Na'imatul Aufa, Fahrina
Faculty of Economic & Business, Lambung Mangkurat University, Banjarmasin
Email: [email protected]
Abstract: The background of this research is the implementation of fiscal decentralization by giving
authority to manage the regions and manage regional finances independently. This implementation
will make the regions be more independent to look for regional revenue resources and reduce
dependence on the allocation of funds from the center of government. There two objectives in this
research. First, to find out the effect of Original Local Revenue (PAD) and the General Allocation
Fund (DAU) on Local Expenditure (BD) which are obtained simultaneously or partially in the
Regency / City of South Kalimantan Province. Second objective is to test and analyze whether the
flypaper effect occurs in the Regencies / Cities of South Kalimantan Province. This study uses panel
data covering 13 districts / cities in South Kalimantan and the observation period of 2004 - 2017. The
data analysis techniques uses panel data regression. Meanwhile, the Chow test and Hausman test aim
to determine the best model. The result of this research shows that the best model is Random Effect
Model (REM). It is based on the Chow test and the Hausman test. The first hypothesis of REM model
states that the General Allocation Funds have effects on Local Expenditures.. Furthermore, partially
the Local Original Revenue and General Allocation Funds significantly influences Local Expenditures
can be received. The flypaper effect occurs in the Regency / City of South Kalimantan Province. It
can be seen from the magnitude of the coefficient of the General Allocation Fund which is compared

The 1st International Forum Business and Economy (IFBE) 2019 Banjarmasin, 13-14 November 2019
7
to the Original Local Revenue. Thus, it detects waste due to the fact that the General Allocation Fund
is sourced from the central allocation, which means the region is not independent.
Keywords: Original Local Revenue, General Allocation Funds, and Flypaper Effect
The 1st International Forum Business and Economy (IFBE) 2019 Banjarmasin, 13-14 November 2019
8
THE ANALYSIS OF SINGLE CURRENCY IMPLEMENTATION IN ASEAN+3
Moh. Ahlis Djirimu1, Haerul Anam, Frilly Andrelia Utami
2
Department of Economics and Development, Faculty of Economics & Business
Tadulako University, Central Sulawesi 1 [email protected]
Abstract: The objective of this research is to analyse the feasibility of implementing single currency
policy in ASEAN+3 countries based on annual data from 1993 to 2017. In this research, the panel
data is analysed using Pooled Least Square regression model. Moving Average forecasting method is
used to predict optimum currency area indices of ASEAN+3 in the period of 2018 to 2022. The result
shows that (1) ASEAN+3 region is not ready to implement single currency policy because of an
increasing trend of asymmetric shock, lack of business cycle synchronization, and differences in
production structure, trade relations, and economy size among ASEAN+3 countries. (2) There are
four converged country pairs which mean higher feasibility of forming optimum currency area for the
four country pairs; Brunei Darussalam and Singapore have the most symmetrical foreign exchange
volatility among the other country pairs.
Keywords: single currency, optimum currency area, ASEAN+3
(JEL: E00, F30, O53)
BACKGROUND
Optimum currency area is one last step towards regional economic integration in financial
sector, after the integration in both trade and labor. The formation of common union and free trade
area can help to strengthen and encourage countries in moving towards optimum currency area in the
future. This form of financial integration is the result of liberalization of both goods market and
capital market (Kusuma and Putranto, 2010).
Optimum currency area (OCA) was discussed for the first time by Mundell (1961) who
explained that crisis in balance of payment will increase the international economic system facilities
as long as the exchange rate, wages, and price level. They are all fixed to prevent the fulfillment of
Terms of Trade in the process of readjusting. In his research, Mundell stated that flexible exchange
rate is the correct regime to adopt in modern economies. It is because some aspects of modern
economy were developed based on flexible exchange rate regime such as price system, exchange rate,
speculation, creditor and debtor protection, and wages), but flexible exchange rate can only work in
regional currencies which are part of national sovereignty. It can be said that stability issues in regards
of labor movements and capital can only be solved with fixed exchange rate. Moreover, Rose (2000)
stated that countries which adopted fixed exchange rate regime are three times more likely to trade
with each other compared to the countries which adopted flexible exchange rate. Therefore, if
ASEAN satisfy the conditions to form a currency union, we can expect a growth in the economies of
all the member.
LITERATURE REVIEW
The formation of Optimum currency area has been done by several European countries which
are the members of European Union (EU). European Union initiated a monetary union called
European Monetary System (EMS) in 1979. It has become part of the highest monetary integration
within the members of the EU. Furthermore, the EU has successfully established European Economic
Community (EEC) in 1 January 1958, with 28 member countries. This step became an important step
towards establishing a currency area with Euro as the single currency, and European Central Bank
(ECB) as the common central bank for the member countries. Rose (2000) stated that a pair of
countries which are part of a currency union have one hundred percent higher trade flows compared to
the countries which are not members of the currency union. Therefore, the results of this study
The 1st International Forum Business and Economy (IFBE) 2019 Banjarmasin, 13-14 November 2019
9
support that the adoption of Euro can stimulate trade between currency union members. This triggered
the formation of other currency areas, such as East African Community, West African Monetary
Zone, Bolivarian Alliance for the American (Latin America), Cooperation Council for the Arab State
of the Gulf, SAFTA (South Asia), and ASEAN+3 (ASEAN and East Asia).
The 1997 exchange rate crisis and the Asian monetary crisis were the beginning of
strengthening and expanding cooperation in finance in ASEAN and East Asia. Then, it opens up the
greater desires and opportunities for Asia to carry out monetary integration in forming a currency area
to increase the stability of the regional exchange rate (Kusuma et al, 2013). Before the Asian crisis in
1997-1998, ASEAN economic performance was quite good. GDP growth of ASEAN countries
(Indonesia, Malaysia, the Philippines, Singapore, and Thailand) has been growing annually reaching
an average of 8 percent in a period of 10 years (Siswanto, 2007: 156). Economic growth in
ASEAN+3 countries has decreased and decelerated until the crisis occurred. Indonesia, Thailand and
Malaysia are the countries that experienced a decline: up to 13 percent for Indonesia, 10.51 percent
for Thailand, and 7.35 percent for Malaysia. Meanwhile, for developing countries such Singapore and
East Asia, they also experienced a decline. South Korea and Singapore experienced negative
economic growth, although it is not as big as Indonesia, Thailand and Malaysia.
The formation of OCA and the establishment of a single currency can be concluded as the next
step in completing the integration of ASEAN+3 economies. It is a form of strategic framework to
encourage economic growth in the ASEAN region and East Asia, so that it can face the challenges of
economic globalization and subsequent crises.
Therefore, the main objective of this research is to find out whether it is feasible to establish a
common currency in ASEAN+3 countries.
DATA AND METHOD
This study uses a quantitative approach by performing mathematical and econometric
calculations. The results of calculation will be be interpreted as explanation and support for the
conclusions of this study. The type of data used in this study is secondary data from ASEAN+3
member countries (Indonesia, Singapore, Malaysia, Thailand, Philippines, Myanmar, Laos,
Cambodia, Brunei Darussalam, Vietnam, China, South Korea, and Japan) with sample periods of the
Year 1993-2017.
The data were analyzed by using the optimum currency area index equation based on
Bayoumi and Eichengreen (1996) minus DISSIM variables. The equation can be seen as follows:
SD(e)ij = β0+β1SD(ΔYi – ΔYj)+β2TRADE+β3SIZE
SD(e)ij is the standard deviation of changes in the logarithm of the exchange rate between
country i and country j. This variable measures the volatility of the nominal bilateral exchange rate
between two pairs of countries.
SD(e)ij = SDlog etij
In calculating this variable, author faced several obstacles in obtaining bilateral exchange rate
data between several countries. To meet the data requirements for this research, the triangular
arbitrage technique is used. Triangular arbitrage technique is a technique that utilizes the opportunity
of arbitrage generated by the price difference between the three currencies in the exchange rate
market. The following formula is used in calculating triangular arbitrage:
Sa/$ = Sa/b Sb/$
Sa/$ is the exchange rate between the US dollar and the currency of country a.
Sa/b is the exchange rate between the currency of country a and the currency of country b.
The 1st International Forum Business and Economy (IFBE) 2019 Banjarmasin, 13-14 November 2019
10
Sb/$ is the exchange rate between the US dollar and the currency of country b.
SD(ΔYi - ΔYj) is the standard deviation of the difference between the real output logarithm
between state i and state j. This variable describes asymmetric shocks at the national level.
GDPt GDP
t
SD(Δyi-Δyj)=‖SDlog GDPt−i1 − SDlog GDPtj−
j1‖
TRADEij is the average of the ratio of bilateral exports to domestic GDP between country i and
country j. This variable is a proxy for the intensity of trade relations between two pairs of countries.
EXPtji+EXP
tjj
TRADEij = ( NGDPti
)
SIZEij is the average of the logarithm of the ratio of GDP between country i and country j
measured in US Dollars. This variable measures the size of the economy and assesses the utility of
maintaining the national currency.
GDPt
SIZEij = Average ( i )
GDPtj
The countries that experience high symmetric shocks or trade relations tend to have stable
exchange rates. In other words, the more OCA criteria are met among member countries, the lower the
exchange rate variability between these countries should be.
Then, data from the dependent variable in this study is projected by using Moving Average
forecasting techniques. This techniques has function to find out the possibility of convergence of
ASEAN+3 countries for the 2018-2022 time period.
RESULTS AND DISCUSSIONS
In this study, there are four OCA criterion proxy variables. They are SD (eij) which illustrates
the volatility of bilateral nominal exchange rates, SD( yi- yj) which describes asymmetric shocks at
the national level, TRADEij is a proxy of the intensity of trade relations between countries i and
country j, and SIZEij which describes the economic size of the two pairs of countries and measure the
states’ utility in maintaining their national currencies.
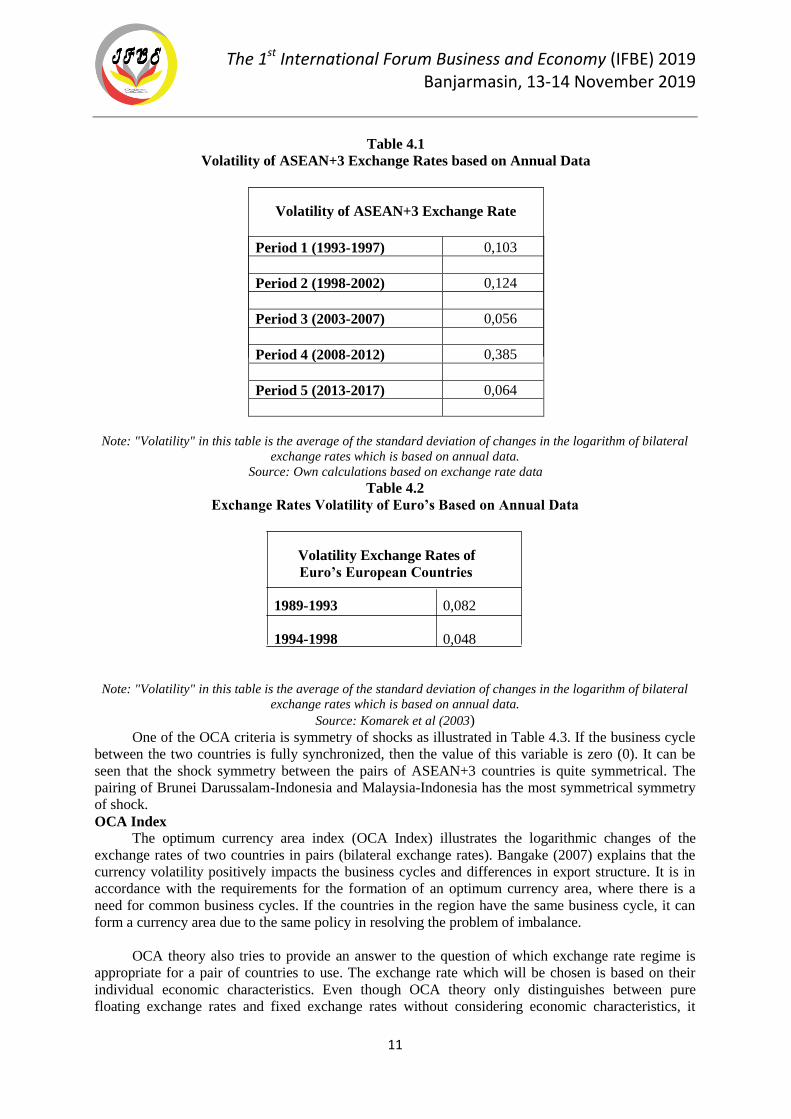
Table 4.1 illustrates the exchange rate volatility of ASEAN+3 member countries per 5-year
period. From the following table, it can be seen that the volatility of the ASEAN+3 exchange rates is
generally high, especially when it is compared to the volatility of the exchange rate in the eurozone.
This result can be seen in Table 4.2.
The volatility of ASEAN+3 exchange rates is 0.385 in Period 4 (2008-2012). It is particularly
high because of the impact of the 2007-2008 international monetary crisis. This crisis continued until
2012 and impacts the various countries experiencing recession. Although ASEAN+3 countries still
experienced GDP growth during this crisis period generally, the impact of the crisis can still be seen
in Asian countries, resulting in lower GDP growth, low equity prices in Asia, increased national debt
of Asian countries, and increased volatility in value exchange rates in the region (Filardo, 2011).
Moreover, there was a slight increase in the volatility of ASEAN+3 exchange rates in Period 2
(1998-2002) of 0,124 compared to the previous period (0,103). Similar to the increase in exchange
rate volatility in Period 4, the increase in Period 2 can also be explained by the 1997-1998 Asian crisis
phenomenon. According to Binhadi and Firmansyah (2007), the 1997-1998 crisis had a major impact
on the situation and stability of countries in Asia. It includes the weak exchange rates of ASEAN+3
countries against the US Dollar which subsequently resulted in changes in exchange rate regimes in
several ASEAN countries +3. Indonesia, Thailand, Singapore, the Philippines, and South Korea
changed their respective currency policy to floating exchange rate. Malaysia changed its currency to
be directly pegged with US Dollar, while others adopt independent or regulated currencies. It explains
the volatility of currencies in Period 2.
The 1st International Forum Business and Economy (IFBE) 2019 Banjarmasin, 13-14 November 2019
11
Table 4.1
Volatility of ASEAN+3 Exchange Rates based on Annual Data
Volatility of ASEAN+3 Exchange Rate
Period 1 (1993-1997) 0,103
Period 2 (1998-2002) 0,124
Period 3 (2003-2007) 0,056
Period 4 (2008-2012) 0,385
Period 5 (2013-2017) 0,064
Note: "Volatility" in this table is the average of the standard deviation of changes in the logarithm of bilateral
exchange rates which is based on annual data.
Source: Own calculations based on exchange rate data
Table 4.2
Exchange Rates Volatility of Euro’s Based on Annual Data
Volatility Exchange Rates of
Euro’s European Countries
1989-1993 0,082
1994-1998 0,048
Note: "Volatility" in this table is the average of the standard deviation of changes in the logarithm of bilateral
exchange rates which is based on annual data.
Source: Komarek et al (2003)
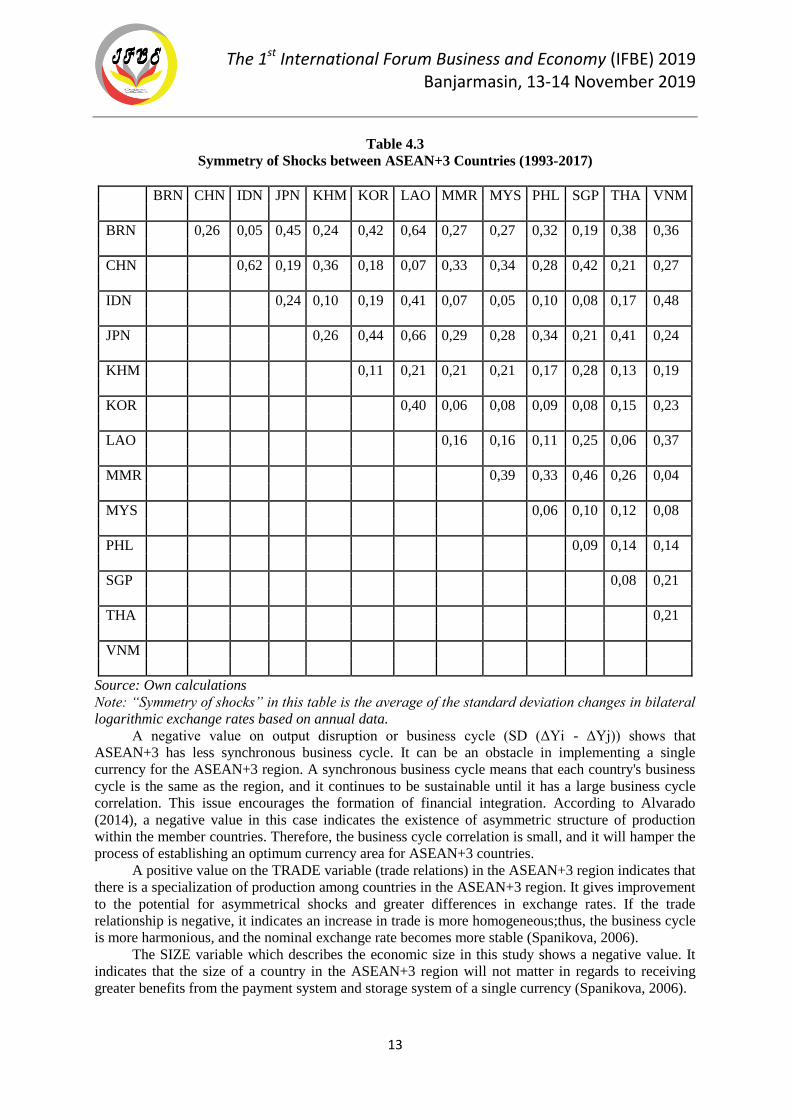
One of the OCA criteria is symmetry of shocks as illustrated in Table 4.3. If the business cycle
between the two countries is fully synchronized, then the value of this variable is zero (0). It can be
seen that the shock symmetry between the pairs of ASEAN+3 countries is quite symmetrical. The
pairing of Brunei Darussalam-Indonesia and Malaysia-Indonesia has the most symmetrical symmetry
of shock.
OCA Index
The optimum currency area index (OCA Index) illustrates the logarithmic changes of the
exchange rates of two countries in pairs (bilateral exchange rates). Bangake (2007) explains that the
currency volatility positively impacts the business cycles and differences in export structure. It is in
accordance with the requirements for the formation of an optimum currency area, where there is a
need for common business cycles. If the countries in the region have the same business cycle, it can
form a currency area due to the same policy in resolving the problem of imbalance.
OCA theory also tries to provide an answer to the question of which exchange rate regime is
appropriate for a pair of countries to use. The exchange rate which will be chosen is based on their
individual economic characteristics. Even though OCA theory only distinguishes between pure
floating exchange rates and fixed exchange rates without considering economic characteristics, it
The 1st International Forum Business and Economy (IFBE) 2019 Banjarmasin, 13-14 November 2019
12
looks like a country adopts something that is between the spectrum of the two exchange rate regimes.
It indicates that OCA theory does not actually have operational precision for short-term decision
making. It is more likely to be a theory for the long term. Goldberg (1999) argues that OCA theory is
not really suitable for use in analyzing countries with transition economies, due to factors of
stabilization and transition problems. In analyzing countries with transition economies, people need to
consider the specific characteristics of these countries.
However, OCA theory can be used to monitor the fulfillment of OCA criteria over time. It is
also used to understand how OCA criteria significantly influence exchange rate volatility. Here are the
results of the regression estimation using the Common Effect or Pooled Least Square OCA index
equation:
This study had total of 377 observations with R-squared model of 0.25, standard error of
regression of 0.32, and the probability of F test of 0.0000. The estimation results show that the OCA
Index model for ASEAN+3 can explain changes in the dependent variable by 25 percent. In this
study, there is only one of three independent variables which has significant effect on the dependent
variable, namely TRADE (the ratio of bilateral exports to GDP). The other two variables which do not
significantly affect the dependent variable are SD (ΔYi - ΔYj) and SIZE variables. This is in a line
with Goldberg's (1999) argument said that the OCA index is considered to be unsuitable for analyzing
countries with a transition economy. The insignificance of these two variables is caused by the
varying economic levels of ASEAN+3 countries. Some of them are developing (transition) countries,
and the others are developed countries (Japan, South Korea, Singapore). The large economic disparity
between ASEAN+3 countries has caused these two proxy variables to be insignificant.
A positive value of 0.254 in the regression result shows that asymmetric shocks in the
ASEAN+3 region are increasing. In the research of Bayoumi and Eichengreen (1996), it is explained
that integration must increase its symmetrical shocks to become a support the formation of a single
currency. This is an indication that increasing asymmetric shocks in the ASEAN+3 region could pose
a threat to the formation of a single currency in the region.
The 1st International Forum Business and Economy (IFBE) 2019 Banjarmasin, 13-14 November 2019
13
Table 4.3
Symmetry of Shocks between ASEAN+3 Countries (1993-2017)
BRN CHN IDN JPN KHM KOR LAO MMR MYS PHL SGP THA VNM
BRN 0,26 0,05 0,45 0,24 0,42 0,64 0,27 0,27 0,32 0,19 0,38 0,36
CHN 0,62 0,19 0,36 0,18 0,07 0,33 0,34 0,28 0,42 0,21 0,27
IDN 0,24 0,10 0,19 0,41 0,07 0,05 0,10 0,08 0,17 0,48
JPN 0,26 0,44 0,66 0,29 0,28 0,34 0,21 0,41 0,24
KHM 0,11 0,21 0,21 0,21 0,17 0,28 0,13 0,19
KOR 0,40 0,06 0,08 0,09 0,08 0,15 0,23
LAO 0,16 0,16 0,11 0,25 0,06 0,37
MMR 0,39 0,33 0,46 0,26 0,04
MYS 0,06 0,10 0,12 0,08
PHL 0,09 0,14 0,14
SGP 0,08 0,21
THA 0,21
VNM
Source: Own calculations
Note: “Symmetry of shocks” in this table is the average of the standard deviation changes in bilateral
logarithmic exchange rates based on annual data.
A negative value on output disruption or business cycle (SD (ΔYi - ΔYj)) shows that
ASEAN+3 has less synchronous business cycle. It can be an obstacle in implementing a single
currency for the ASEAN+3 region. A synchronous business cycle means that each country's business
cycle is the same as the region, and it continues to be sustainable until it has a large business cycle
correlation. This issue encourages the formation of financial integration. According to Alvarado
(2014), a negative value in this case indicates the existence of asymmetric structure of production
within the member countries. Therefore, the business cycle correlation is small, and it will hamper the
process of establishing an optimum currency area for ASEAN+3 countries.
A positive value on the TRADE variable (trade relations) in the ASEAN+3 region indicates that
there is a specialization of production among countries in the ASEAN+3 region. It gives improvement
to the potential for asymmetrical shocks and greater differences in exchange rates. If the trade
relationship is negative, it indicates an increase in trade is more homogeneous;thus, the business cycle
is more harmonious, and the nominal exchange rate becomes more stable (Spanikova, 2006).
The SIZE variable which describes the economic size in this study shows a negative value. It
indicates that the size of a country in the ASEAN+3 region will not matter in regards to receiving
greater benefits from the payment system and storage system of a single currency (Spanikova, 2006).
The 1st International Forum Business and Economy (IFBE) 2019 Banjarmasin, 13-14 November 2019
14
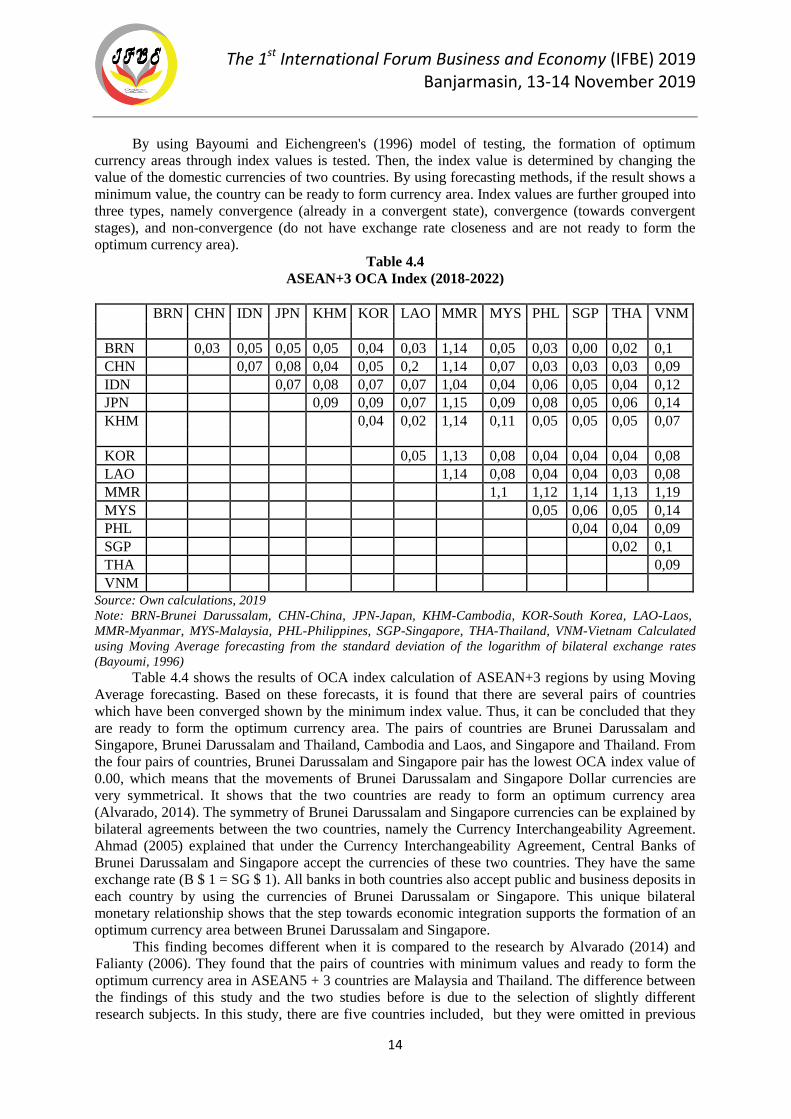
By using Bayoumi and Eichengreen's (1996) model of testing, the formation of optimum
currency areas through index values is tested. Then, the index value is determined by changing the
value of the domestic currencies of two countries. By using forecasting methods, if the result shows a
minimum value, the country can be ready to form currency area. Index values are further grouped into
three types, namely convergence (already in a convergent state), convergence (towards convergent
stages), and non-convergence (do not have exchange rate closeness and are not ready to form the
optimum currency area).
Table 4.4
ASEAN+3 OCA Index (2018-2022)
BRN CHN IDN JPN KHM KOR LAO MMR MYS PHL SGP THA VNM
BRN 0,03 0,05 0,05 0,05 0,04 0,03 1,14 0,05 0,03 0,00 0,02 0,1
CHN 0,07 0,08 0,04 0,05 0,2 1,14 0,07 0,03 0,03 0,03 0,09
IDN 0,07 0,08 0,07 0,07 1,04 0,04 0,06 0,05 0,04 0,12
JPN 0,09 0,09 0,07 1,15 0,09 0,08 0,05 0,06 0,14
KHM 0,04 0,02 1,14 0,11 0,05 0,05 0,05 0,07
KOR 0,05 1,13 0,08 0,04 0,04 0,04 0,08
LAO 1,14 0,08 0,04 0,04 0,03 0,08
MMR 1,1 1,12 1,14 1,13 1,19
MYS 0,05 0,06 0,05 0,14
PHL 0,04 0,04 0,09
SGP 0,02 0,1
THA 0,09
VNM
Source: Own calculations, 2019
Note: BRN-Brunei Darussalam, CHN-China, JPN-Japan, KHM-Cambodia, KOR-South Korea, LAO-Laos,
MMR-Myanmar, MYS-Malaysia, PHL-Philippines, SGP-Singapore, THA-Thailand, VNM-Vietnam Calculated
using Moving Average forecasting from the standard deviation of the logarithm of bilateral exchange rates
(Bayoumi, 1996)
Table 4.4 shows the results of OCA index calculation of ASEAN+3 regions by using Moving
Average forecasting. Based on these forecasts, it is found that there are several pairs of countries
which have been converged shown by the minimum index value. Thus, it can be concluded that they
are ready to form the optimum currency area. The pairs of countries are Brunei Darussalam and
Singapore, Brunei Darussalam and Thailand, Cambodia and Laos, and Singapore and Thailand. From
the four pairs of countries, Brunei Darussalam and Singapore pair has the lowest OCA index value of
0.00, which means that the movements of Brunei Darussalam and Singapore Dollar currencies are
very symmetrical. It shows that the two countries are ready to form an optimum currency area
(Alvarado, 2014). The symmetry of Brunei Darussalam and Singapore currencies can be explained by
bilateral agreements between the two countries, namely the Currency Interchangeability Agreement.
Ahmad (2005) explained that under the Currency Interchangeability Agreement, Central Banks of
Brunei Darussalam and Singapore accept the currencies of these two countries. They have the same
exchange rate (B $ 1 = SG $ 1). All banks in both countries also accept public and business deposits in
each country by using the currencies of Brunei Darussalam or Singapore. This unique bilateral
monetary relationship shows that the step towards economic integration supports the formation of an
optimum currency area between Brunei Darussalam and Singapore.
This finding becomes different when it is compared to the research by Alvarado (2014) and
Falianty (2006). They found that the pairs of countries with minimum values and ready to form the
optimum currency area in ASEAN5 + 3 countries are Malaysia and Thailand. The difference between
the findings of this study and the two studies before is due to the selection of slightly different
research subjects. In this study, there are five countries included, but they were omitted in previous
The 1st International Forum Business and Economy (IFBE) 2019 Banjarmasin, 13-14 November 2019
15
studies. In this study, although Indonesia does not have an OCA index value and it is not symmetrical
with any country, the value of Indonesian OCA index illustrates that Indonesia is heading towards
symmetrical currency movements with other ASEAN+3 member countries.
In this study, only 4 percent of partner countries are converged in ASEAN+3, 70.5 percent of
partner countries are converging, and 24.9 percent of partner countries are not converged. It means the
pairs of countries are not ready to form the optimum currency area, because they do not have
symmetrical currency movements. In the Alvarado study (2014), there is only 1 percent of converged
partner countries in ASEAN+3, 49 percent of convergent partner countries, and 50 percent of non-
convergent partner countries. The countries which are not converged are the Philippines, Vietnam,
Myanmar, China and Japan.
Although overall the ASEAN+3 region is not ready to form an optimum currency area, there
are some possibilities to establish policies which encourage the formation of OCA in some converged
ASEAN+3 countries. The formation of a partial single-currency region within the ASEAN+3 regions
can be done by following in the footsteps of the European Union in forming the eurozone. As it is
known that there are only some members of European Union which directly adopt the single-
currency Euro. This is an alternative for the ASEAN+3 regions to start steps towards establishing a
single currency.
CONCLUSION
This research is intended to find out whether the implementation of a single currency in
ASEAN+3 countries is possible. Based on the results of this study, it can be concluded that the
ASEAN+3 region is not ready to form a single regional currency. It is indicated by the presence and
increase of asymmetric shocks, lack of synchronization of the business cycle, and differences in
production structure, trade relations, and economic size. The benefits of establishing a single currency
for ASEAN+3 countries also do not have large impacts, despite of the economic size of big or small
country.
By using the optimum currency area index, it is seen the changes in bilateral exchange rates
between pairs of countries. There are four countries which are converged and have the possibility to
form an optimum currency area, namely Brunei Darussalam and Singapore, Brunei Darussalam and
Thailand, Cambodia and Laos, and Singapore and Thailand. The Brunei Darussalam and Singapore
Pairs have the most symmetrical currency movements among the other countries. It because of the
Currency Interchangeability Agreement adopted by the two Central Banks of Brunei Darussalam and
Singapore as first step in integrating the economy.
In general, Indonesia is not ready to form an optimum currency area with any ASEAN+3
member countries. It is indicated by Indonesian OCA index value which has not shown that Indonesia
is converged with any other countries. The movement of the Indonesian currency with other pair
countries is low enough. As a conclusin, Indonesia is still in the process of convergence.
SUGGESTIONS
Several suggestions in regards to this research:
1. In order to help monetary integration and regional economic integration which can implement a
single currency in ASEAN+3 countries, ASEAN+3 member countries need to look at the
example of the European Union. European Union began the formation of an optimum currency
area through politics, namely the alignment of monetary policy and fiscal policy). ASEAN+3
countries must strive to harmonize monetary and fiscal policies in order to create the same policy
in dealing with shocks to fulfill the criteria of an optimum currency area.
2. The researchers ommit one variable in the OCA criteria equation, namely the DISSIM variable.
It is because the data is difficult to obtain and process. The following studies are expected to be
able to include the DISSIM variable in the regression equation; thus, its application becomes
more effective, and it will provide more comprehensive picture for the case of the ASEAN+3
regions.
The 1st Internasional Forum Business and Economy (IFBE) 2019 Banjarmasin, 13-14 November 2019
16
REFERENCES
Appleyard, D. dan Field Jr., A. 2014. International Economics. Eighth Edition. USA: McGraw-Hill.
Arifin, S., Winantyo, R., dan Kurniati, Y. 2004. Integrasi Keuangan dan Moneter di Asia
Timur
Peluang dan Tantangan Bagi Indonesia. Jakarta: PT Elex Media Komputindo.
Balassa, Bela. 1961. The Theory of Economic Integration. Homewood, Illinois: RD Irwin.
Binhadi dan Firmansyah. 2007. Stabilitas Keuangan Internasional IMF dan Stabilitas Keuangan
Internasional Suatu Tinjauan Kritis. Jakarta: PT Elex Media Komputindo.
Dieter, H. 2000. Monetary Regionalism: Regional Integration without Financial Crises. Institute for
Development and Peace, Duisburg University, May 2000.
Emerson, M., Gros, D., Italianer, A., Pisani-Ferry, J., dan Reichenbach, H. 1992. One Market One
Money: An Evaluation of the Potential Benefits and Costs of Forming an Economic and
Monetary Union. New York: Oxford University Press.
Gujarati, D. dan Porter, D. 2005. Dasar-dasar Ekonometrika. Buku 2. Edisi 5. Raden Carlos
(Terjemah). Jakarta: Salemba Empat.
Gujarati, D. dan Dawn C.P. 2009. Basic Econometrics. Singapura: The McGraw-Hill Companies Inc.
Krugman, Paul R. & Obstfeld, Maurice, Melitz, Marc J. 2000. International Economics: Theory and
Policy. Nine Edition. USA: Pearson.
Mill, John S. 1848. Principles of Political Economy. London: John W. Parker.
Salvator D. 2014. International Economics Theory and Policy. USA. Wiley John and Sons.
Sugiyono. 2014. Metode Penelitian Kuantitatif, Kualitatif, dan R&D. Bandung: Penerbit Alfabeta.
Widarjono, A. 2013. Ekonometrika Pengantar dan Aplikasinya. UPP STIM YKPN.
Achsani, N. dan Prastiwi. 2010. Testing the Feasibility of ASEAN+3 Single Currency Comparing
Optimum Currency Area and Clustering Approach. International Research Journal of Finance
and Economics.
Ahmad, A. 2005. Brunei Darussalam: Towards Reform and Sustainable Progress. ISEAS-Yusof Ishak
Institute.
Ahn, Kim, dan Chang. 2005. Is East Asia Fit for an Optimum Currency Area? An Assessment of the
Economic Feasibility of a Higher Degree of Monetary Cooperation in East Asia. The
Developing Economies, XLIV-3, 288-305.
Alesina A. dan Barro R. 2002. Currency Unions. Quarterly Journal of Economics, 117: 409-436.
Alvarado, S. 2014. Analysis of Optimum Currency Area for ASEAN and ASEAN+3. Journal
of US-
China Public Administration, 11(12) 995-1004.
Ariefianto, M. dan Warjiyo, P. 2010. Pergerakan Bersama Mata Uang ASEAN 4 Periode 1997-2005:
Suatu Aplikasi Teori Optimum Currency Area dengan Menggunakan Model Vector Error
Correction. Buletin Ekonomi Moneter dan Perbankan.
The 1st Internasional Forum Business and Economy (IFBE) 2019 Banjarmasin, 13-14 November 2019
17
Baele, Lieven, Ferrando A., Hordahl P., Krylova E., dan Monnet C. 2004. Measuring Financial
Integration in the Euro Area. European Central Bank Occasional Paper Series No.
14/April/2004. European Central Bank.
Bagumhe, E.P. 2013. Feasibility and Implication of the East African Community Monetary Union: An
Application of Optimum Currency Area Index Methodology. Paper presented on The Fourth
International Conference on Development Policy.
Bangake, C. 2007. Exchange Rate Volatility and Optimum Currency Area Index: Evidence from
Africa. Document de Recherché Laboratoire d’Economie d’Orleans.
Bayoumi dan Eichengreen. 1996. Ever Closer to Heaven? An Optimum Currency Area Index for
European Countries. European Economic Review, 41, 761-770.
Falianty, T. 2006. Endogenitas dari Indikator Optimum Currency Area: Studi Empiris di Negara
ASEAN. Jurnal Ekonomi dan Pembangunan Indonesia, 6(2) 1-28.
Falianty, T. 2006. Optimum Currency Area: Case Study of ASEAN-5 Countries. Dissertation
published by Faculty of Economics & Business, University of Indonesia.
Filardo, A. 2011. The Impact of the International Financial Crisis on Asia and the Pacific:
Highlighting Monetary Policy Challenges from a Negative Asset Price Bubble Perspective.
Bank for International Settlements Working Papers No. 356.
Frankel, J dan Rose, Andrew, K. 1996. The Endogeneity of the Optimum Currency Area Criteria.
NBER Working Paper Series 5700.
Frankel, J dan Rose, Andrew, K. 1998. Is EMU More Justifiable Ex Post than Ex Ante? European
Economic Review, 41.
Goldberg, L. 1999. Is Optimum Currency Area Theory Irrelevant for Economies in Transition?
Westview Press.
Komárek, L., Čech, Z., dan Horváth, R. 2003. Optimum Currency Area Indices-How Close is the
Czech Republic to the Eurozone? Czech National Bank Working Papers.
Kundera, J. 2012. The Theory of An Optimum Currency Area. Worclaw Review of Law,
Administration and Economic, 2(2).
Kusuma, D. dan Putranto A. 2010. Penerapan Kriteria Optimum Currency Area dan Volatilitasnya:
Studi Kasus ASEAN-5+3. Buletin Ekonomi Moneter dan Perbankan, 10.
Laurenceson, J. 2003. Economic Integration between China and the ASEAN-5. ASEAN Economic
Bulletin.
McKinnon, R. 1963. Optimum Currency Areas. The American Economic Review, 53 (4).
Mohseni dan Azali. 2014. Monetary Integration and Optimum Currency Area in ASEAN+3: What
We Need for a New Framework?, 4 (2), 277-285.
Mongelli, F. 2002. “New” Views on the Optimum Currency Area Theory: What is EMU Telling Us?
European Central Bank.
The 1st Internasional Forum Business and Economy (IFBE) 2019 Banjarmasin, 13-14 November 2019
18
Morgan, P 2013. Monetary Policy Frameworks in Asia: Experience, Lesson, and Issues. Asian
Development Bank Institute Working Paper Series No. 435.
Mundell, R. 1961. A Theory of Optimum Currency Areas. The American Economic Review, 51 (4).
Ngian, K., dan Yuen H. 2002. Monetary Cooperation in East Asia: A Way Forward.
International
Seminar on Promoting Growth and Welfare: Structural Changes and the Role of Institution in Asia.
Santiago, Chile and Rio de Janeiro, Brazil.
Nguyen, T. 2007. East Asian Currency Area: A Bayesian Dynamic Factor Model Analysis. Economic
Research.
Rose, Andrew K. 2000. Is There a Case for an Asian Monetary Fund? Federal Reserve Bank of San
Fransisco (FRBSF) Economic Letter.
Shin, K. dan Wang, Y. 2003. Monetary Integration Ahead of Trade Integration in East Asia.
Discussion Paper, No. 572. The Institute of Social and Economic Research, Osaka University.
Siswanto, J. 2007. Pengalaman IMF dalam Menangani Krisis di Beberapa Negara. IMF dan Stabilitas
Keuangan Internasional Suatu Tinjauan Kritis. Jakarta: PT Elex Media Komputindo.
Spanikova, E. 2006. Is Slovakia making Headway towards Constituting an OCA with the EMU?
Faculty of International Relation, University of Economics Prague.
Warjiyo, P. 2004. Materi Kuliah Ekonomi Keuangan Internasional. Program Pasca Sarjana Ilmu
Ekonomi, Universitas Indonesia
The 1st Internasional Forum Business and Economy (IFBE) 2019 Banjarmasin, 13-14 November 2019
19
STUDENT ENTREPRENEURIAL INTEREST
IN THE BUSINESS ADMINISTRATION DEPARTMENT AS A RESULT OF
MANAGEMENT AND ENTREPRENEURSHIP LEARNING ACHIEVEMENT
Sri Imelda1, Hikmayanti Huwaida
2, Rofi’i
3
Lecture of Business Administration Program of Politeknik Negeri Banjarmasin [email protected]
Abstract: The purpose of this study is to determine the effect of Management Learning Achievement
(Introduction to Business, Basic of Marketing, Financial Management, Production Management,
Human Resources Management, Sales Management) and Entrepreneurship Learning Achievement on
the interests of entrepreneurial students in the Business Administration Department of Politeknik
Negeri Banjarmasin. This research is descriptive with a quantitative approach. The data analysis
techniques using multiple linear regression analysis. The result shows that Introduction to Business,
Basic of Marketing, Financial Management, Production Management, Human Resource Management,
Sales Management, and Entrepreneurship have significant influence on entrepreneurial interest by
41.9%; meanwhile, the remaining 58.1% is explained by other variables outside the research model.
Learning achievement in Management and Entrepreneurship partially does not significantly influence
the Students’ entrepreneurial interest.
Keywords: Learning Achievement, Management, Entrepreneurship, Student Entrepreneur Interests
BACKGROUND
The era of digital transformation resulting in changes of the labor market structure. These
changes will threaten low-skilled labor, encourage the emergence of new types of work, and eliminate
some of existing work. Moreover, the changes automatically lead to labor market demands which
require college graduates to be ready to work or to be able to create jobs in the era of disruption.
On the other hand, there are more graduates become job seekers than job creators. A solution is
needed to overcome this problem. Organizing management and entrepreneurship learning in college
are expected to be solutions to prepare students to be job creators.
To improve the students’ ability to create jobs after graduation, management and
entrepreneurship education is essential. Management and Entrepreneurship courses are intended to
broaden students' insights into the world of entrepreneurship. It also motivates them to be directly
involved in the world of entrepreneurship as strong young entrepreneurs. It is essential to have the
ability to solve complex problems, to think critically and creatively, to coordinate and manage people,
and to have good emotional intelligence.
Entrepreneurship can be initiated and developed from many factors, such as learning about
enterpreneurship. Through entrepreneurship learning, it is expected to be able to generate interest and
increase students' curiosity to entrepreneurs. So that they will form entrepreneurial attitudes in order
to create new entrepreneurs. (Christianingrum and Rosalina, 2017).
Emerging the entrepreneurial spirit of students is believed to be an alternative way to reduce the
unemployment rate. It is because the educated young entrepreneurs will be able to start their own
businesses. (Suharti and Sirine, 2011).
Students' interest in entrepreneurship needs to be acknowledged by the lecturers and students
considering this interest can lead students to make choices in determining their goals. The goals are
the embodiment of interest and the outreach relationship for students to plan and make choices about
their desired education, position or occupation in the future.
Interest in entrepreneurship is characterized by the presence of entrepreneurial attitudes and
insights. Students who are interested in entrepreneurship will be interested in the knowledge related to
The 1st Internasional Forum Business and Economy (IFBE) 2019 Banjarmasin, 13-14 November 2019
20
enterpreneurship. The greater the interest of students to be attracted to enterpreneurship, the greater
effort and desire of students to make it happen (Januardi and Zubaimari, 2018).
Based on the background above, the writers are interested to conduct the research on Student
Entrepreneurial Interest in the Business Administration Department as a Result of Management and
Entrepreneurship Learning Achievement.
Problem Identification
Problem identification of this research are:
1. Does the Management Learning Achievement (Introduction to Business, Basic of Marketing,
Financial Management, Production Management, Human Resource Management, and Sales
Management) have simultaneously effects on students’ entrepreneurial interest in Business
Administration Department?
2. Does the Management Learning Achievement (Introduction to Business, Basic of Marketing,
Financial Management, Production Management, Human Resource Management, and Sales
Management) and the entrepreneurship have effects partially on the interest of entrepreneurial
students in Business Administration Department?
3. Does Entrepreneurship Learning Achievements have effects on entrepreneurial student interest in
Business Administration Department?
Research Objectives
Research objective of this research are:
1. To know the Management Learning Achievement (Introduction to Business, Basic of Marketing,
Financial Management, Production Management, Human Resource Management and Sales
Management) effects simultaneously on the interest of entrepreneurial students in Business
Administration Department?
2. To know the Management Learning Achievement (Introduction to Business, Basic of Marketing,
Financial Management, Production Management, Human Resource Management, and Sales
Management) and entrepreneurship effect partially on the interest of entrepreneurial students in
the Business Administration Department?
3. To know Entrepreneurship Learning Achievements effects on entrepreneurial student interest in
the Business Administration Department
LITERATURE REVIEW
Management And Entrepreneurship Learning Achievement
Management in general is a series of activities including planning, directing, organizing and
controlling to achieve goals effectively and efficiently. In the curriculum of the Politeknik Negeri
Banjarmasin of Business Administration Department, a management course consists of: Introduction
to Business, Basic of Marketing, Financial Management, Production Management, Human Resource
Management, Sales Management. The following is the scope of material for each subject:
1. Business Introduction. Business introduction underlies the concept of strategy and formulation
in the determination of direction. This conceept is in the form of vision, mission, values and
goals of various business issues and the company's perspective.
2. Basics of Marketing. Some components included in the basics of marketing management are
extracting information from the market both potential and actual, designing marketing programs
and evaluating the company's marketing programs
3. Financial Management. Financial management is related to the process of good cashflows and
investments, production funds and other sources of funds
4. Production Management. Product is the output of a company or business which involves
customer satisfaction, both in the form of goods and services. Production management is
planned, managed and controlled based on the viewpoint of consumer desire and satisfaction
5. Human Resource Management. Human resources need to be planned and managed properly to
fulfill the quantity and quality of Human Resources. In a business or a company, there are three

The 1st Internasional Forum Business and Economy (IFBE) 2019 Banjarmasin, 13-14 November 2019
21
components which play roles in managing human resources, namely personnel, human resource
development (HRD) and human resource management (HRM).
6. Sales Management. Sales Management have function to achieve the results of planned business
development. It is conducted by motivating sales group members to carry out their duties to the
best of their ability.
According to Suryana (2013), entrepreneurship is the study of values, abilities, behavior of a
person in facing life's challenges. Also, enterpreneurship obtains opportunities with the various risks
which need to be faced. According to Soeharto Prawirokusumo in Suryana (2013: 2), he stated that
entrepreneurship is an independent scientific discipline which has been taught as a separate scientific
discipline. This discpline contains the field of knowledge which is intact and real; they are: theories,
concepts, and complete scientific methods.
According to Daryanto (2013:5), entrepreneurship is way of thinking and attitude which are
always actively trying to improve the results of work in the sense of increasing income. This is similar
to Basrowi’s opinion (2014:2), he stated that the humanitarian processes related to creativity and
innovation in understanding opportunities, organize the sources, and manage them; so that the
opportunity is realized into profit-driven business.
As conclusion from definition stated above, it can be said that entrepreneurial knowledge is all
information which is known by humans through their five senses and minds about an effort to build a
value with ability, courage, determination and creativity. Moreover, it is also a dare to take risks for
success opportunities by trying to do business in various opportunities. This courage should be known
by understanding the basic factors of success.
The roles of entrepreneurship science in entrepreneurship development (Ramadhani and Nurnida,
2017) includes:
1. Motivating someone to do business.
2. Directing someone to work systematically and focus in realizing dreams.
3. Inspiring everyone that every problem will gives opportunities to be developed.
4. Entrepreneurship will reduce unemployment.
According to Suryabrata (2006), and Asmadiyanto (2013), learning achievement is a value
which is the last formulation of the progress/student achievement during a certain period
According to Syah (2008), learning achievement is the whole domain of psychology changes as
result of students' learning experiences and processes. According Sukmadinata (2004), learning
achievement is the realization of a person's potential skills, in the form of mastery of knowledge,
thinking skills and motoric skills.
From the various meanings above, it is concluded that learning achievement is evidence of the
effort of students which has been achieved after participating in learning activities within a certain
time in the form of changes in behavior, skills and knowledge.
Entrepreneurial Interest
Slameto in Tisa and Anggadwita (2018:1862) stated that the interest is feeling of preferability
and sense of will in a thing or an activity, without anyone asking. Djamarah defines the interest as a
settled tendency to pay attention and remember some activities. According to Sadirman, the interest is
a condition of someone to see the characteristics or meanings of a situation which is associated with
their needs or desires. Furthermore, Mahesa and Rahardja also said that the interest in
entrepreneurship is the tendency in subject to be interested in creating a business; moreover, he/she
will organize, bear the risk and develop the business which is created by him/herself.
According to Yuliyaningsih in (Ruswati, 2014: 43), the interest in entrepreneurship is the
desire, interest, and willingness of person to work hard in fulfilling the needs without fear of risks.
According to Fu'adi (2009), the interest in entrepreneurship is the desire, interest, and
willingness to work hard or have a strong will to be independent or try to fulfill the needs without
feeling afraid of risks. Also, the interest is a strong will to learn from failure (Ramadhani and Nurnida,
2017).
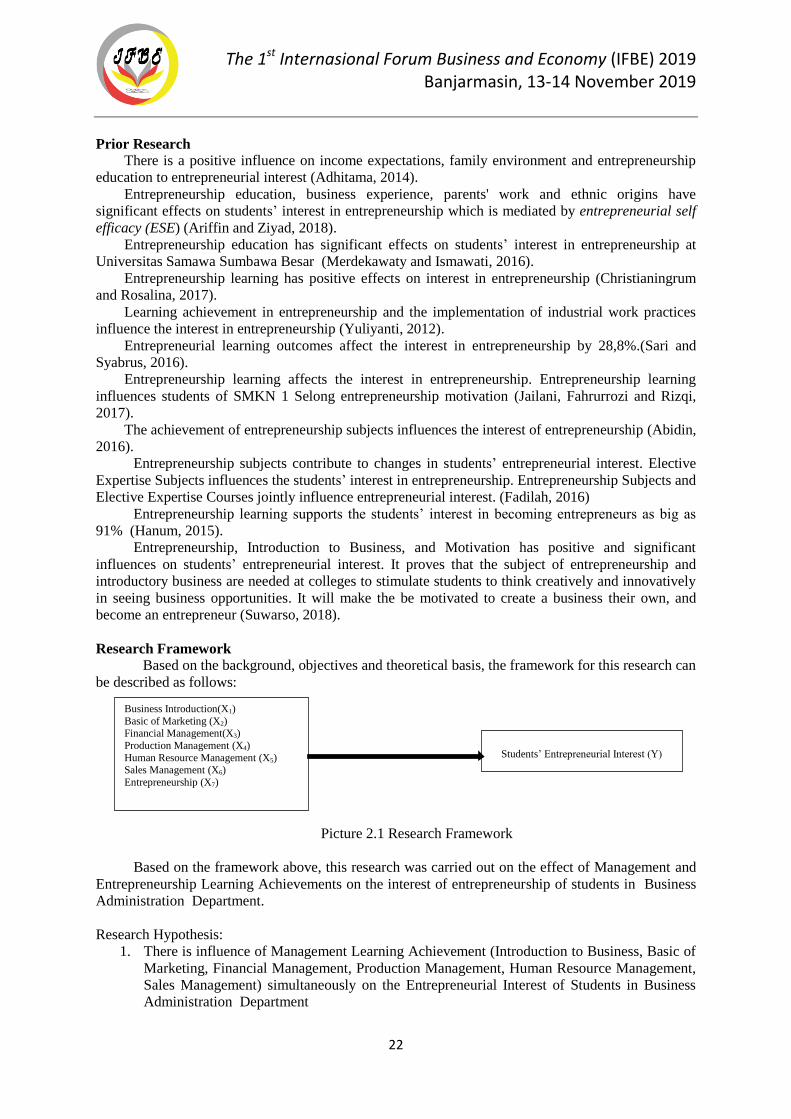
The 1st Internasional Forum Business and Economy (IFBE) 2019 Banjarmasin, 13-14 November 2019
22
Prior Research
There is a positive influence on income expectations, family environment and entrepreneurship
education to entrepreneurial interest (Adhitama, 2014).
Entrepreneurship education, business experience, parents' work and ethnic origins have
significant effects on students’ interest in entrepreneurship which is mediated by entrepreneurial self
efficacy (ESE) (Ariffin and Ziyad, 2018).
Entrepreneurship education has significant effects on students’ interest in entrepreneurship at
Universitas Samawa Sumbawa Besar (Merdekawaty and Ismawati, 2016).
Entrepreneurship learning has positive effects on interest in entrepreneurship (Christianingrum
and Rosalina, 2017).
Learning achievement in entrepreneurship and the implementation of industrial work practices
influence the interest in entrepreneurship (Yuliyanti, 2012).
Entrepreneurial learning outcomes affect the interest in entrepreneurship by 28,8%.(Sari and
Syabrus, 2016).
Entrepreneurship learning affects the interest in entrepreneurship. Entrepreneurship learning
influences students of SMKN 1 Selong entrepreneurship motivation (Jailani, Fahrurrozi and Rizqi,
2017).
The achievement of entrepreneurship subjects influences the interest of entrepreneurship (Abidin,
2016).
Entrepreneurship subjects contribute to changes in students’ entrepreneurial interest. Elective
Expertise Subjects influences the students’ interest in entrepreneurship. Entrepreneurship Subjects and
Elective Expertise Courses jointly influence entrepreneurial interest. (Fadilah, 2016)
Entrepreneurship learning supports the students’ interest in becoming entrepreneurs as big as
91% (Hanum, 2015).
Entrepreneurship, Introduction to Business, and Motivation has positive and significant
influences on students’ entrepreneurial interest. It proves that the subject of entrepreneurship and
introductory business are needed at colleges to stimulate students to think creatively and innovatively
in seeing business opportunities. It will make the be motivated to create a business their own, and
become an entrepreneur (Suwarso, 2018).
Research Framework
Based on the background, objectives and theoretical basis, the framework for this research can
be described as follows:
Picture 2.1 Research Framework
Based on the framework above, this research was carried out on the effect of Management and
Entrepreneurship Learning Achievements on the interest of entrepreneurship of students in Business
Administration Department.
Research Hypothesis:
1. There is influence of Management Learning Achievement (Introduction to Business, Basic of
Marketing, Financial Management, Production Management, Human Resource Management,
Sales Management) simultaneously on the Entrepreneurial Interest of Students in Business
Administration Department
Business Introduction(X1)
Basic of Marketing (X2) Financial Management(X3)
Production Management (X4)
Human Resource Management (X5) Sales Management (X6)
Entrepreneurship (X7)
Students’ Entrepreneurial Interest (Y)
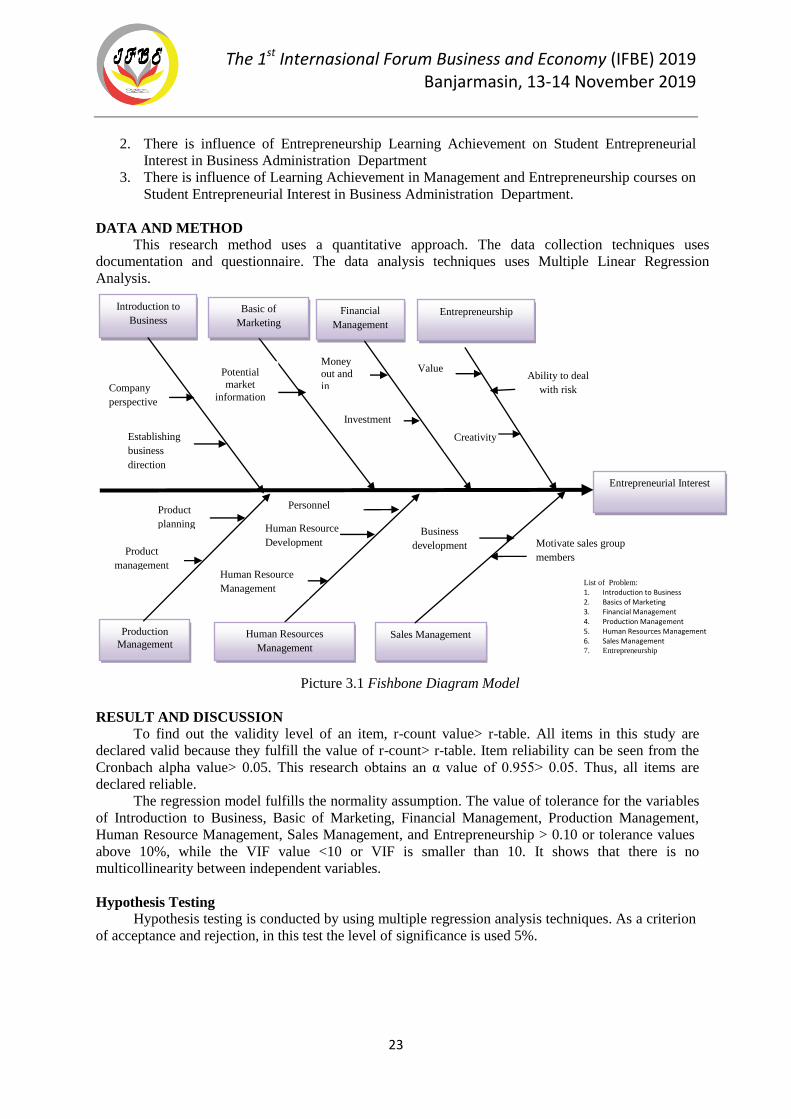
The 1st Internasional Forum Business and Economy (IFBE) 2019 Banjarmasin, 13-14 November 2019
23
2. There is influence of Entrepreneurship Learning Achievement on Student Entrepreneurial
Interest in Business Administration Department
3. There is influence of Learning Achievement in Management and Entrepreneurship courses on
Student Entrepreneurial Interest in Business Administration Department.
DATA AND METHOD
This research method uses a quantitative approach. The data collection techniques uses
documentation and questionnaire. The data analysis techniques uses Multiple Linear Regression
Analysis.
Picture 3.1 Fishbone Diagram Model
RESULT AND DISCUSSION
To find out the validity level of an item, r-count value> r-table. All items in this study are
declared valid because they fulfill the value of r-count> r-table. Item reliability can be seen from the
Cronbach alpha value> 0.05. This research obtains an α value of 0.955> 0.05. Thus, all items are
declared reliable.
The regression model fulfills the normality assumption. The value of tolerance for the variables
of Introduction to Business, Basic of Marketing, Financial Management, Production Management,
Human Resource Management, Sales Management, and Entrepreneurship > 0.10 or tolerance values
above 10%, while the VIF value <10 or VIF is smaller than 10. It shows that there is no
multicollinearity between independent variables.
Hypothesis Testing
Hypothesis testing is conducted by using multiple regression analysis techniques. As a criterion
of acceptance and rejection, in this test the level of significance is used 5%.
Basic of
Marketing
Human Resources
Management
Entrepreneurial Interest
Introduction to
Business
Sales Management Production
Management
Product
planning
Company
perspective
Establishing
business
direction
Personnel
Money
out and
in
Investment
Human Resource
Development
P
Human Resource
Management
Business
development Motivate sales group
members Product
management
List of Problem:
1. Introduction to Business 2. Basics of Marketing 3. Financial Management 4. Production Management 5. Human Resources Management 6. Sales Management 7. Entrepreneurship
Financial
Management Entrepreneurship
Potential
market
information
Value Ability to deal
with risk
Creativity
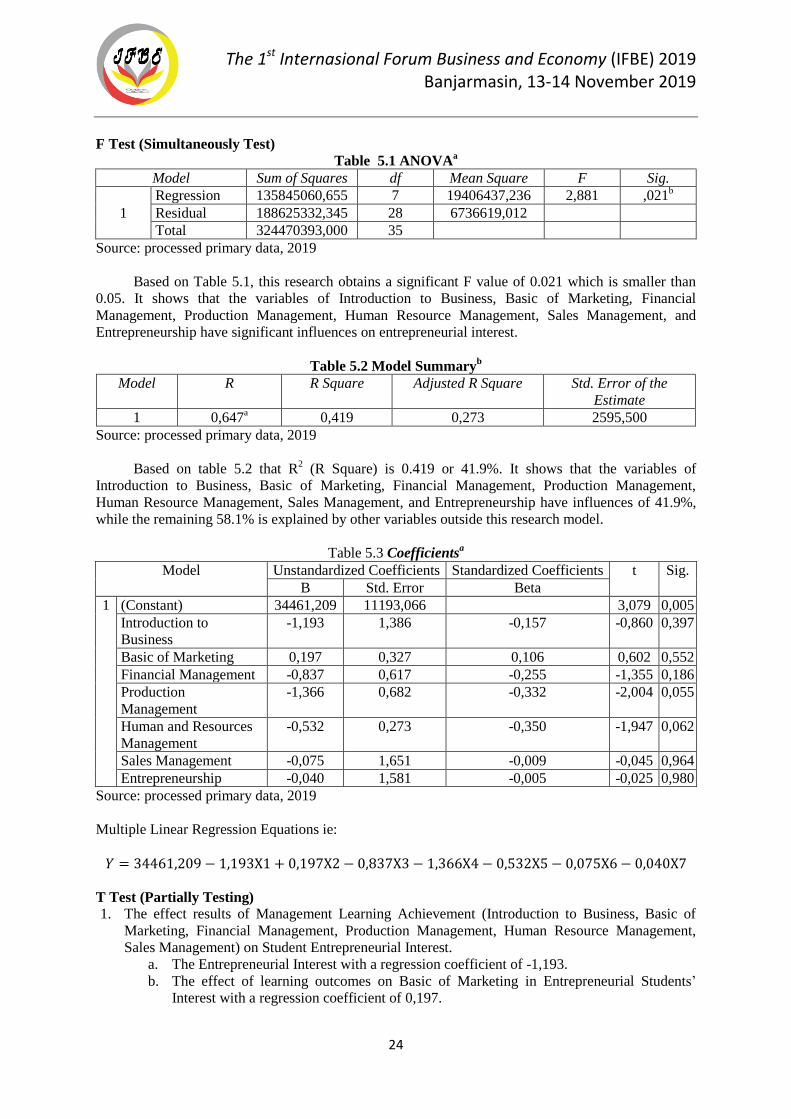
The 1st Internasional Forum Business and Economy (IFBE) 2019 Banjarmasin, 13-14 November 2019
24
F Test (Simultaneously Test)
Table 5.1 ANOVAa
Model Sum of Squares df Mean Square F Sig.
1
Regression 135845060,655 7 19406437,236 2,881 ,021b
Residual 188625332,345 28 6736619,012
Total 324470393,000 35
Source: processed primary data, 2019
Based on Table 5.1, this research obtains a significant F value of 0.021 which is smaller than
0.05. It shows that the variables of Introduction to Business, Basic of Marketing, Financial
Management, Production Management, Human Resource Management, Sales Management, and
Entrepreneurship have significant influences on entrepreneurial interest.
Table 5.2 Model Summaryb
Model R R Square Adjusted R Square Std. Error of the
Estimate
1 0,647a 0,419 0,273 2595,500
Source: processed primary data, 2019
Based on table 5.2 that R2 (R Square) is 0.419 or 41.9%. It shows that the variables of
Introduction to Business, Basic of Marketing, Financial Management, Production Management,
Human Resource Management, Sales Management, and Entrepreneurship have influences of 41.9%,
while the remaining 58.1% is explained by other variables outside this research model.
Table 5.3 Coefficientsa
Model Unstandardized Coefficients Standardized Coefficients t Sig.
B Std. Error Beta
1 (Constant) 34461,209 11193,066 3,079 0,005
Introduction to
Business
-1,193 1,386 -0,157 -0,860 0,397
Basic of Marketing 0,197 0,327 0,106 0,602 0,552
Financial Management -0,837 0,617 -0,255 -1,355 0,186
Production
Management
-1,366 0,682 -0,332 -2,004 0,055
Human and Resources
Management
-0,532 0,273 -0,350 -1,947 0,062
Sales Management -0,075 1,651 -0,009 -0,045 0,964
Entrepreneurship -0,040 1,581 -0,005 -0,025 0,980
Source: processed primary data, 2019
Multiple Linear Regression Equations ie:
T Test (Partially Testing)
1. The effect results of Management Learning Achievement (Introduction to Business, Basic of
Marketing, Financial Management, Production Management, Human Resource Management,
Sales Management) on Student Entrepreneurial Interest.
a. The Entrepreneurial Interest with a regression coefficient of -1,193.
b. The effect of learning outcomes on Basic of Marketing in Entrepreneurial Students’
Interest with a regression coefficient of 0,197.
The 1st Internasional Forum Business and Economy (IFBE) 2019 Banjarmasin, 13-14 November 2019
25
c. The effect of Financial Management Learning Achievements on the interest of
entrepreneurial students with a regression coefficient of -0,837.
d. The effect of Learning Achievement of Production Management on the Entrepreneurial
Students’ Interest with a regression coefficient of -1,366.
e. The influence of Learning Achievements of Human Resource Management on
Entrepreneurial Students’ Interest with a regression coefficient of -0,532.
f. The effect of Sales Management Learning Achievement on Entrepreneurial Students’
Interest with a regression coefficient of -0,075.
2. The Effect of Entrepreneurship Learning Achievement on Entrepreneurial Students’ Interest.
Entrepreneurship variable has negative effects on entrepreneurial interest with a regression
coefficient of -0,040.
CONCLUSION
Based on the previous discussion, the following conclusions can be drawn as follows:
1. Introduction to Business, Basic of Marketing, Financial Management, Production Management,
Human Resource Management, Sales Management, and Entrepreneurship have significant
influences on entrepreneurial interest. R Square is obtained at 0.419 (41.9%). It shows that the
variables of Introduction to Business, Basic of Marketing, Financial Management, Production
Management, Human Resource Management, Sales Management, and Entrepreneurship have
influences of 41.9%, while the remaining 58.1% is explained by other variables outside the
model.
Model of Multiple Linear Regression Equations:
2. The Influence of Management Learning Achievement on Students Entrepreneurial Interest.
a. The influence of Learning Achievement Introduction to Business on Students
Entrepreneurial Interest with a regression coefficient of -1,193.
b. The effect of learning outcomes on Basic of Marketing on Students Entrepreneurial
Interest with a regression coefficient of 0,197.
c. The effect of Financial Management Learning Achievements on student entrepreneurial
interest with a regression coefficient of -0,837.
d. The effect of Learning Achievement of Production Management on Student
Entrepreneurial Student with a regression coefficient of -1,366.
e. The influence of Learning Achievements of Human Resource Management on Student
Entrepreneurial Interest with a regression coefficient of -0,532.
f. The effect of Sales Management Learning Achievement on Student Entrepreneurial
Interest with a regression coefficient of -0,075.
3. The effect of Entrepreneurship Learning Achievement on Student Entrepreneurial Interest:
Entrepreneurship variable has negative effect on entrepreneurial interest with a regression
coefficient of -0,040.
Suggestions
Based on the conclusion, the following suggestions can be drawn as follow:
1. The further research needs to be carried out consisting other variables outside this research
model.
2. It is necessary to develop learning methods, so that they can create creative entrepreneurial
learning to attract students' interest in entrepreneurship.
REFERENCE
Abidin, M. Z. (2016). Pengaruh Prestasi Mata Pelajaran Kewirausahaan Terhadap Minat
The 1st Internasional Forum Business and Economy (IFBE) 2019 Banjarmasin, 13-14 November 2019
26
Berwirausaha Siswa Kelas Xi Jurusan Teknik Bangunan Di Smk Negeri 3 Yogyakarta
Tahun/Ajaran 2015/2016. Universitas Negeri Yogyakarta.
Adhitama, P. P. (2014). Faktor-Faktor Yang Mempengaruhi ( Studi Kasus Mahasiswa Fakultas
Ekonomika Dan Bisnis Undip, Semarang). Universitas Diponegoro Semarang.
Ariffin, Z. & Ziyad, M. (2018) ‘Pengaruh Pekerjaan Orang Tua, Pendidikan Kewirausahaan Dan
Asal Etnis Terhadap Minat Berwirausaha Mahasiswa Fakultas Ekonomi Dan Bisnis
Universitas Lambung Mangkurat’, Jurnal Sains Manajemen Dan Kewirausahaan, 2(1), Pp.
1–11.
Christianingrum & Rosalina, E. (2017) ‘Pengaruh Pembelajaran Kewirausahaan Terhadap Minat
Berwirausaha’, Integrated Journal Of Business And Economics (Ijbe), 1(1), Pp. 45–55.
Jailani, H., Fahrurrozi, M. And Rizqi, Y. A. (2017) ‘Pengaruh Pembelajaran Kewirausahaan
Terhadap Minat Dan Motivasi Berwirausaha Siswa Di Smk Negeri 1 Selong Tahun
Pembelajaran 2016 Huzain’, Jpek, 1(1), Pp. 49–56.
Merdekawaty, A. And Ismawati (2016) ‘Pengaruh Pendidikan Kewirausahaan Terhadap Minat
Berwirausaha Mahasiswa Universitas Samawa Sumbawa Besar’, In Prosiding Seminar
Nasional Pendidikan 2016 “Revitalisasi Budaya Lokal Dalam Menghadapi Tantangan
Pendidikan Pada Era Masyarakat Ekonomi Asean (Mea)” Pengaruh, Pp. 424–433.
Ruswati, I. (2014) ‘Faktor Eksternal Dan Faktor Internal Terhadap Pendidikan Islam Darussalam
Cerme Gresik’, Jre: Jurnal Riset Entrepreneurship, 1(2), Pp. 38–52.
Sari, R. O. And Syabrus, H. (2016) ‘Prakarya Dan Kewirausahaan Terhadap Minat Berwirausaha
Siswa Smk Negeri 1 Pekanbaru Prakarya Dan Kewirausahaan Terhadap Minat’, Pp. 1–7.
Suharti, L. & Sirine, H. (2011) ‘Faktor-Faktor Yang Berpengaruh Terhadap Niat Kewirausahaan
(Studi Terhadap Mahasiswa Universitas Kristen Satya Wacana, Salatiga)’, Jurnal
Manajemen Dan Kewirausahaan, 13(2), Pp. 124–134.
Tisa, A. & Anggadwita, G. (2018) ‘Influence Of Internal And External Towards Interest On
Entrepreneurship Of The Women Business Fashion Owners In’, In E-Proceeding Of
Management, Pp. 1860–1866.
Yuliyanti, L. (2012) Pengaruh Prestasi Belajar Kewirausahaan Dan Pelaksanaan Praktek Kerja
Industri Terhadap Minat Berwirausaha Pada Siswa Kelas Xi Program Keahlian Akuntansi
Smk Muhammadiyah 3 Gemolong Tahun Ajaran 2011/2012. Universitas Muhammadiyah
Surakarta.
The 1st Internasional Forum Business and Economy (IFBE) 2019 Banjarmasin, 13-14 November 2019
27
THE PERCEIVED DESTINATION COMPETITIVENESS OF BANJARMASIN URBAN
TOURISM
Sari Hepy Maharani¹ Rudy Haryanto Rahmatul Jannatin Na’imah
Department of Business Administration, Banjarmasin State Polytechnic, South Kalimantan-Indonesia
Abstract: A successful tourist destination must offer an integrated component of tourism system and
competitive destinations. Nowadays, the destination finally competes on the quality of tourist
experience which is offered to visitors. This study aims to measure the influence of experience and
involvement of tourists on the perceived competitiveness of destinations. The survey was conducted
to 200 tourists who visited Siring Banjarmasin on weekends. The results of analysis using Structural
Equation Modeling show that the stages in the quality of experience and tourism involvement do not
have significant effects on the perceived competitiveness of destinations. It is because most of Siring
Banjarmasin tourists are local people.
Keywords : Quality of Tourist Experienced, Perceived Destination Competitiveness, Involvement
BACKGROUND
Tourism has turned out to be a universal relaxation activity. It contributes complete growth and
development of a country: first, giving numerous economic value & benefits; and, second, helping in
building country's brand value, image & identity (Cucculelli & Goffi, 2016). Tourism industry goes
beyond attractive destinations, and be an important economic growth contributor (Armenski et al,
2017)
The main component of tourism program is tourist destination. The competitiveness has
increasingly been regarded as a vital influence on the quality of tourism destinations in tourism
market. There is a growing body of literature on the advertising, management and competitiveness of
tourism destinations. A good tourism destination needs to embrace an integrated approach to many
tourism system components (Ritchie & Crouch, 2003; Jones & Haven-Tang, 2005; Abreu-Novais,
2016). The major players in the tourism system— government, tourism firms, visitors, and local
communities — may have very different approaches to compete in term of tourism object. This time,
most studies have assessed the competitiveness of destinations from the perspective of industry
practitioners. Generally, it considered an approach to the terms of supply. The existing literature
rarely examined tourism destination's competitiveness from the terms of demand.
The purposes of this research are: to identify the factors which influence destination
competitiveness in Banjarmasin City from tourist perception, and to find out the relationship between
the quality of tourism experience and tourists’ perception of destination competitiveness with tourist
involvement as moderating variable
LITERATURE REVIEW
Quality of Tourism Experience
According to Mendes et al (2016), the process when the tourist experience, consume and
remember anything in visiting tourist destinations is very complex and diverse. It because there are
large number of actors involved in providing experiences. As a consequence, tourist’s experience in
tourism object comes from a piece of memory which divided by time and space, from the initial
experience of departure to the experience of returning home.
In this study, the quality of tourist experiences is seen from a chronological perspective and a
temporal perspective. It is defined as a multiphase phenomenon associated with the pre-trip planning
experience, en-route (travel to the destination and on the way home travel) experience, on-site
experience, and after-trip reflection (Jennings & Weiler, 2006; Vitterso et al., 2000; Clawson &
Knetsch, 1966; Killion, 1992; Laws, 1995; Arnould & Price, 1993; Craig-Smith & French, 1994; Hull
& Michael, 1995; Hull, Stewart, & Yi, 1992; Neal, 2000; Neal, Sirgy, & Uysal, 2004).
The 1st Internasional Forum Business and Economy (IFBE) 2019 Banjarmasin, 13-14 November 2019
28
Perceived Destination Competitiveness
Nowadays, in the competitive world tourism market, maintaining competitiveness is a major
challenge for many destinations. The competitiveness of tourist destinations has been claimed as the
"holy grail of tourism" (Ritchie & Crouch, 2000); however, research in this area is limited and has
only emerged since the 1990s.
According to Ritchie and Crouch (2003), the competitiveness of tourism destinations is
determined by five main components:
1. Main resources and attractors
Core resources and attractors are the main elements of the attractiveness of tourist destinations.
There are seven categories of main elements which include physiography and climate, culture and
history, market ties, a mix of activities, special events, and entertainment and the tourism
superstructure. By ommitting the market ties, these factors are consistent with studies of tourist
destination attractiveness (Kim, 1998).
2. Supporting factors and resources
This component includes factors of a successful tourism industry basics such as general
infrastructure of tourist destinations, companies, various resources facility in tourist destinations.
Moreover, it also includes the factors which affect the accessibility of tourist destinations
(Vengesayi, 2013; Prideaux & Cooper, 2002, Ridderstaat & Nijkamp, 2015)
3. Policies on tourist destinations, planning and development
It includes philosophy / values, vision, positioning / branding, development, competitive /
collaborative analysis, monitoring and evaluation, and auditing. All of these components must be
formulated as an integrated system. Thus, overall competitiveness and sustainability goals can be
achieved (Ritchie & Crouch, 2003).
4. Destination management
It includes activities which consist of: Implementing policies and planning frameworks to increase
the attractiveness of core and attracting resources, strengthening the quality and effectiveness of
supporting factors, and adapting to the constraints which are caused by "qualifying and amplifying
determinants". These include services, organization and maintenance of resources and the main
draw of tourism (Dwyer et al, 2009; Webster & Ivanov, 2014)
5. Qualifying and amplifying determinants
It includes factors such as location, overall costs, and safety, which are beyond the control of the
tourism sector. These components play a major role in destination competitiveness (Ritchie &
Crouch, 2003).
Involvement
Sherif and Cantril (1947) conducted preliminary research on consumer engagement and behavior.
Their research is followed by Brunswik (1956) and Sherif and Hovland (1961) who developed the
theory of social valuation.
Sherif and Cantril (1947) also explained that engagement is usually seen as a motivating variable.
It exists when social objects are related by person feelings as domain. Whereas, Havitz & Dimanche
(1990) explained that the involvement has potential effect on people's attitudes toward an activity or
product, how they respond to promotional stimuli, and their behavior.
Jang et al. (2000) used Laurent and Kapferer Consumer Involvement Profile / CIP (1985) and used it
to measure the level of consumer engagement involvement in the Black Hawk casino, Colorado. From
this research, there are three domains of involvement which can be identified in the context of casino
gamblers, namely: self-identity/self-expression, pleasure/interest, and centrality. The study shows that
the amount of participation in casinos is positively correlated with the three engagement domains.
Gursoy and Gavcar (2003) also used the CIP scale for international leisure tourists. This study shows
that there are three underlying dimensions of involvement which include pleasure / interest, risk
probability, and important risk.
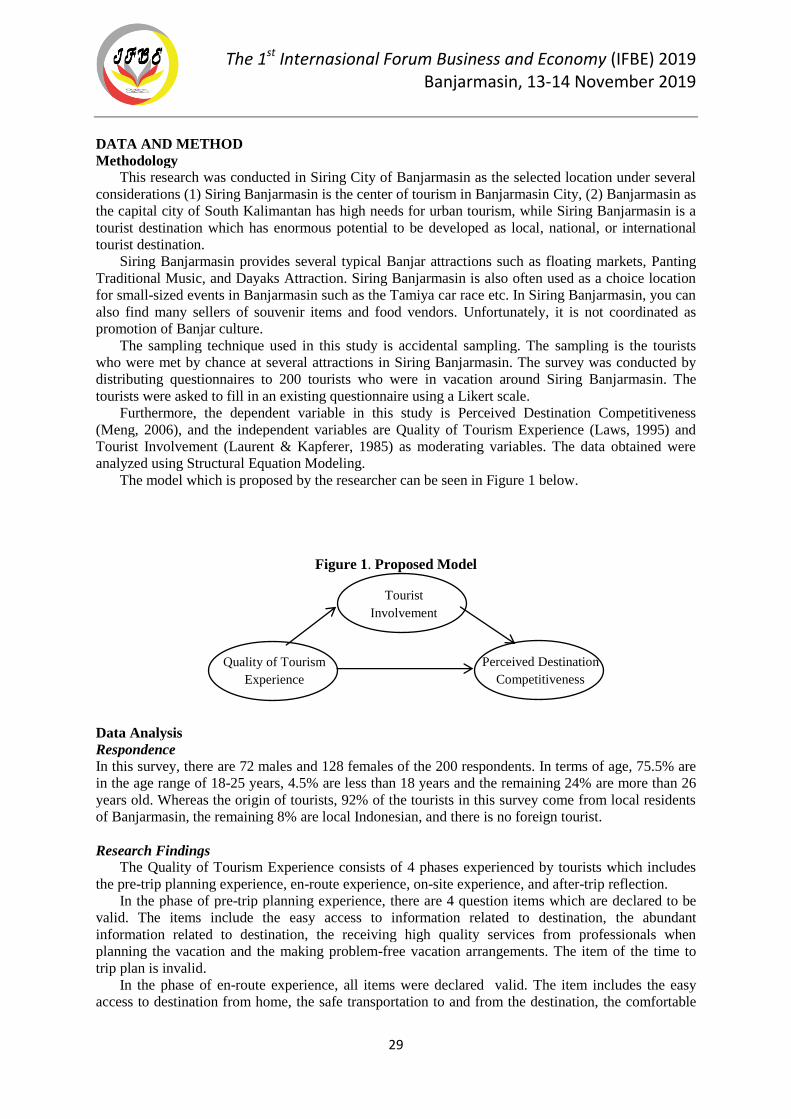
The 1st Internasional Forum Business and Economy (IFBE) 2019 Banjarmasin, 13-14 November 2019
29
DATA AND METHOD
Methodology
This research was conducted in Siring City of Banjarmasin as the selected location under several
considerations (1) Siring Banjarmasin is the center of tourism in Banjarmasin City, (2) Banjarmasin as
the capital city of South Kalimantan has high needs for urban tourism, while Siring Banjarmasin is a
tourist destination which has enormous potential to be developed as local, national, or international
tourist destination.
Siring Banjarmasin provides several typical Banjar attractions such as floating markets, Panting
Traditional Music, and Dayaks Attraction. Siring Banjarmasin is also often used as a choice location
for small-sized events in Banjarmasin such as the Tamiya car race etc. In Siring Banjarmasin, you can
also find many sellers of souvenir items and food vendors. Unfortunately, it is not coordinated as
promotion of Banjar culture.
The sampling technique used in this study is accidental sampling. The sampling is the tourists
who were met by chance at several attractions in Siring Banjarmasin. The survey was conducted by
distributing questionnaires to 200 tourists who were in vacation around Siring Banjarmasin. The
tourists were asked to fill in an existing questionnaire using a Likert scale.
Furthermore, the dependent variable in this study is Perceived Destination Competitiveness
(Meng, 2006), and the independent variables are Quality of Tourism Experience (Laws, 1995) and
Tourist Involvement (Laurent & Kapferer, 1985) as moderating variables. The data obtained were
analyzed using Structural Equation Modeling.
The model which is proposed by the researcher can be seen in Figure 1 below.
Figure 1. Proposed Model
Data Analysis
Respondence
In this survey, there are 72 males and 128 females of the 200 respondents. In terms of age, 75.5% are
in the age range of 18-25 years, 4.5% are less than 18 years and the remaining 24% are more than 26
years old. Whereas the origin of tourists, 92% of the tourists in this survey come from local residents
of Banjarmasin, the remaining 8% are local Indonesian, and there is no foreign tourist.
Research Findings
The Quality of Tourism Experience consists of 4 phases experienced by tourists which includes
the pre-trip planning experience, en-route experience, on-site experience, and after-trip reflection.
In the phase of pre-trip planning experience, there are 4 question items which are declared to be
valid. The items include the easy access to information related to destination, the abundant
information related to destination, the receiving high quality services from professionals when
planning the vacation and the making problem-free vacation arrangements. The item of the time to
trip plan is invalid.
In the phase of en-route experience, all items were declared valid. The item includes the easy
access to destination from home, the safe transportation to and from the destination, the comfortable
Quality of Tourism
Experience
Perceived Destination
Competitiveness
Tourist
Involvement
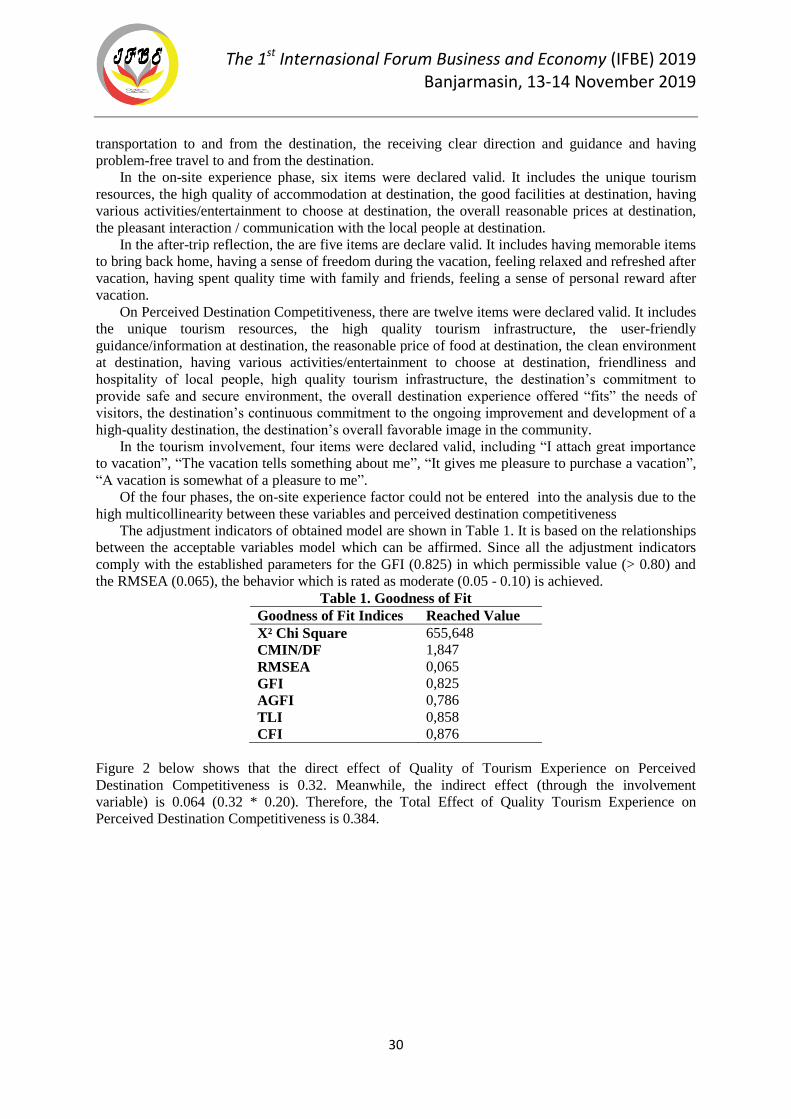
The 1st Internasional Forum Business and Economy (IFBE) 2019 Banjarmasin, 13-14 November 2019
30
transportation to and from the destination, the receiving clear direction and guidance and having
problem-free travel to and from the destination.
In the on-site experience phase, six items were declared valid. It includes the unique tourism
resources, the high quality of accommodation at destination, the good facilities at destination, having
various activities/entertainment to choose at destination, the overall reasonable prices at destination,
the pleasant interaction / communication with the local people at destination.
In the after-trip reflection, the are five items are declare valid. It includes having memorable items
to bring back home, having a sense of freedom during the vacation, feeling relaxed and refreshed after
vacation, having spent quality time with family and friends, feeling a sense of personal reward after
vacation.
On Perceived Destination Competitiveness, there are twelve items were declared valid. It includes
the unique tourism resources, the high quality tourism infrastructure, the user-friendly
guidance/information at destination, the reasonable price of food at destination, the clean environment
at destination, having various activities/entertainment to choose at destination, friendliness and
hospitality of local people, high quality tourism infrastructure, the destination’s commitment to
provide safe and secure environment, the overall destination experience offered “fits” the needs of
visitors, the destination’s continuous commitment to the ongoing improvement and development of a
high-quality destination, the destination’s overall favorable image in the community.
In the tourism involvement, four items were declared valid, including “I attach great importance
to vacation”, “The vacation tells something about me”, “It gives me pleasure to purchase a vacation”,
“A vacation is somewhat of a pleasure to me”.
Of the four phases, the on-site experience factor could not be entered into the analysis due to the
high multicollinearity between these variables and perceived destination competitiveness
The adjustment indicators of obtained model are shown in Table 1. It is based on the relationships
between the acceptable variables model which can be affirmed. Since all the adjustment indicators
comply with the established parameters for the GFI (0.825) in which permissible value (> 0.80) and
the RMSEA (0.065), the behavior which is rated as moderate (0.05 - 0.10) is achieved.
Table 1. Goodness of Fit
Goodness of Fit Indices Reached Value
X² Chi Square 655,648
CMIN/DF 1,847
RMSEA 0,065
GFI 0,825
AGFI 0,786
TLI 0,858
CFI 0,876
Figure 2 below shows that the direct effect of Quality of Tourism Experience on Perceived
Destination Competitiveness is 0.32. Meanwhile, the indirect effect (through the involvement
variable) is 0.064 (0.32 * 0.20). Therefore, the Total Effect of Quality Tourism Experience on
Perceived Destination Competitiveness is 0.384.
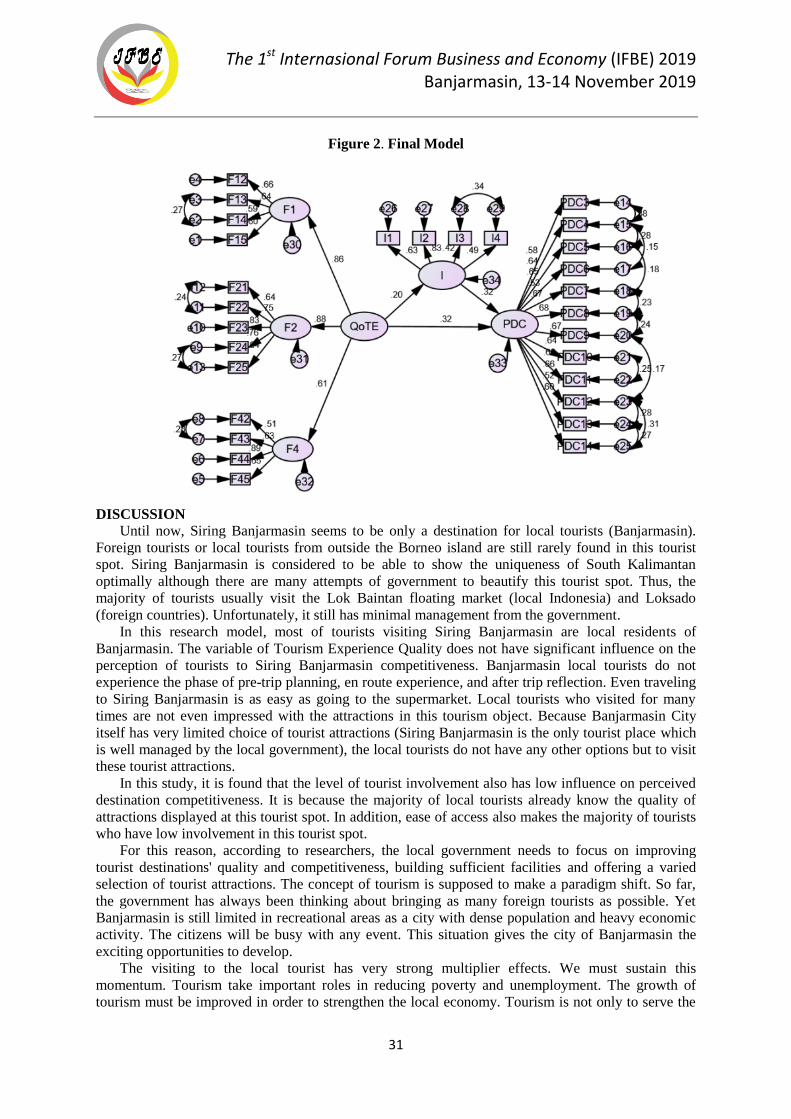
The 1st Internasional Forum Business and Economy (IFBE) 2019 Banjarmasin, 13-14 November 2019
31
Figure 2. Final Model
DISCUSSION
Until now, Siring Banjarmasin seems to be only a destination for local tourists (Banjarmasin).
Foreign tourists or local tourists from outside the Borneo island are still rarely found in this tourist
spot. Siring Banjarmasin is considered to be able to show the uniqueness of South Kalimantan
optimally although there are many attempts of government to beautify this tourist spot. Thus, the
majority of tourists usually visit the Lok Baintan floating market (local Indonesia) and Loksado
(foreign countries). Unfortunately, it still has minimal management from the government.
In this research model, most of tourists visiting Siring Banjarmasin are local residents of
Banjarmasin. The variable of Tourism Experience Quality does not have significant influence on the
perception of tourists to Siring Banjarmasin competitiveness. Banjarmasin local tourists do not
experience the phase of pre-trip planning, en route experience, and after trip reflection. Even traveling
to Siring Banjarmasin is as easy as going to the supermarket. Local tourists who visited for many
times are not even impressed with the attractions in this tourism object. Because Banjarmasin City
itself has very limited choice of tourist attractions (Siring Banjarmasin is the only tourist place which
is well managed by the local government), the local tourists do not have any other options but to visit
these tourist attractions.
In this study, it is found that the level of tourist involvement also has low influence on perceived
destination competitiveness. It is because the majority of local tourists already know the quality of
attractions displayed at this tourist spot. In addition, ease of access also makes the majority of tourists
who have low involvement in this tourist spot.
For this reason, according to researchers, the local government needs to focus on improving
tourist destinations' quality and competitiveness, building sufficient facilities and offering a varied
selection of tourist attractions. The concept of tourism is supposed to make a paradigm shift. So far,
the government has always been thinking about bringing as many foreign tourists as possible. Yet
Banjarmasin is still limited in recreational areas as a city with dense population and heavy economic
activity. The citizens will be busy with any event. This situation gives the city of Banjarmasin the
exciting opportunities to develop.
The visiting to the local tourist has very strong multiplier effects. We must sustain this
momentum. Tourism take important roles in reducing poverty and unemployment. The growth of
tourism must be improved in order to strengthen the local economy. Tourism is not only to serve the
The 1st Internasional Forum Business and Economy (IFBE) 2019 Banjarmasin, 13-14 November 2019
32
interests of global capital or to fulfill the desires of foreign tourists. It must also be built and oriented
towards people's welfare and engage in the conservation of environment.
Tourism sector provides employment for many local people, from working in hotels to selling
souvenirs. The developed countries will have greater unemployment problems without tourism
industry. Money from tourism industry can be used to improve regional infrastructure, such as roads,
airports and facilities. The infrastructure are intended to increase the number of tourists, and it can
give benefit to the local residents.
In addition, tourism indyustry also help to preserve the culture and wisdom of local community,
because they become tourist attractions. It is certainly the case with several Masai tribes in Kenya and
Maori in New Zealand. Their culture becomes tourist attraction for foreign tourists who learn their
lives.
CONCLUSION
The Quality of Tourism Experience and Involvement has significant influence on perceived
destination competitiveness. However, the impact magnitude of these two variables are low. It is
because the majority of tourists are local residents, and the limited choice of tourist destinations in
Banjarmasin city. The government needs to focus on managing local tourists by creating attractions
and providing an unforgettable experience for local tourists
REFERENCES
Abreu-Novais, M., Ruhanen, L., Arcodia, C., (2016). Destination competitiveness: what we know,
what we know but shouldn't and what we don't know but should. Curr. Issues Tourism 19 (6),
492e512.
Armenski, T., Dwyer, L., Pavlukovic, V., (2017). Destination competitiveness: public and private
sector tourism management in Serbia. J. Trav. Res. https://doi.org/ 10.1177/0047287517692445
Arnould, E., & Price, L. (1993). River magic: Extraordinary experiences and the extended service
encounter. Journal of Consumer Research, 20, 28-45.
Clawson, M., & Knetsch, J. L. (1966). Economics of Outdoor Recreation: Resources for the Future.
Baltimore: John Hopkins.
Craig-Smith, S., & French, C. (1994). Learning to live with tourism. Melbourne: Pitman.
Cucculelli, M., Goffi, G. (2016) Does sustainability enhance tourism destination competitiveness?
Evidence from Italian Destination of Exellence. J. Clean Prod. 111. 370-382
Dimanche, F., Havitz, M., & Howard, D. (1993). Segmenting recreationists and tourists using
involvement profiles. Journal of Travel and Tourism Marketing, 1(4), 33-52.
Dwyer, L. Edwards, D. Mistilis, N. Carolina, R & Scott, N (2009) Destination and Enterprise
Management for A Tourism Future. Journal Tourism Management 30 (2009) 63-74.
Gursoy, D., & Gavcar, E. (2003). International leisure tourist' involvement profile. Annals of Tourism
Research, 30(4), 906-926.
Havitz, M., Dimanche, F., & Howard, D. (1993). A two-sample comparison of the Personal
Involvement Inventory (PII) and Involvement Profile (IP) scales using selected recreation
activities. Journal of Applied Recreation Research, 17, 331-364.
Hull, R., & Michael, S. (1995). Nature-based recreation, mood change, and stress reduction. Leisure
Sciences, 17, 1-14.
Hull, R., Stewart, W., & Yi, Y. (1992). Experience patterns: Capturing the dynamic nature of a
recreation experience. Journal of Leisure Research, 24(3), 240-252.
Jang, H., Lee, B., Park, M., & Stokowski, P. A. (2000). Measuring underlying meanings of gambling
from the perspective of enduring involvement. Journal of Travel Research, 38(3), 230-238.
Jennings, G., & Weiler, B. (2006). Mediating meaning: perspectives on brokering quality tourist
experiences. In G. Jennings & N. P. Nickerson (Eds.), Quality Tourism Experience (pp. 57-78).
Burlington, MA: Elsevier Butterworth-Heinemann.
The 1st Internasional Forum Business and Economy (IFBE) 2019 Banjarmasin, 13-14 November 2019
33
Jones, E., & Haven-Tang, C. (2005). Tourism SMEs, service quality and destination competitiveness.
In E. Jones & C. Haven-Tang (Eds.), Tourism SMEs, Service Quality and Destination
Competitiveness (pp. 1-24). Cambridge, MA: CABI publishing.
Killion, G. L. (1992). Understanding Tourism. Rockhampton: Central Queensland University.
Kim, H. B. (1998). Perceived Attractiveness of Korean Destinations. Annals of Tourism Research,
25(2), 340-361.
Laurent, G., & Kapferer, J. N. (1985). Measuring consumer involvement profiles. Journal of
Marketing Research, 22, 41-53.
Laws, E. (1995). Tourist Destination Management: Issues, Analysis and Policies. London: Routledge.
Mendes, Julio; Guerreiro, Manuela & Matos, Nelson (2016). Monitoring The Quality of Tourism
Experience. Asia Tourism Forum 2016 –. The 12th Biennial Conference of Hospitality and
Tourism Industry in Asia. Bandung, Indonesia
Meng, F. (2006). An examination of destination competitiveness from the tourists' perspective: The
relationship between quality oftourism experience and perceived destination competitiveness Phd.
Virginia Polythecnic Institute and State University.
Neal, J. D. (2000). The Effects of Different Aspects of Tourism Services on Travelers' Quality of
Life: Model Validation, Refinement, and Extension. Virginia Polytechnic Institute and State
University, Blacksburg.
Neal, J. D., Sirgy, M. J., & Uysal, M. (2004). Measuring the effect of tourism services on travelers'
quality of life: Further validation. Social Indicators Research, 69, 243-277.
Prideaux, B & Cooper, C (2002). Marketing and Destination Growth : A Symbiotic Relationship,
Journal of Vacation Marketing , 9(1): 35-51
Ridderstaat, J., Croes, R., Nijkamp, P., (2015). A two-way causal chain between tourism development
and quality of life in a small island destination: an empirical analysis. J. Sustain. Tourism 24 (10),
1461e1479.
Ritchie, J. R. B., & Crouch, G. I. (1993). Competitiveness in international tourism: A framework for
understanding and analysis. Paper presented at the 43rd Congress of the International Association
of Scientific Experts in Tourism, San Carlos de Bariloche, Argentina, pp. 23-71.
Ritchie, J. R. B., & Crouch, G. I. (2000). Are destination stars born or made: must a competitive
destination have star genes? Paper presented at the 31st Annual Conference of Travel and
Tourism Research Association San Fernando Valley, CA.
Ritchie, J. R. B., & Crouch, G. I. (2003). The Competitive Destination: A Sustainable Tourism
Perspective. Cambridge: CABI Publishing.
Sherif, C. W., & Cantril, H. (1947). The Psychology of Ego-involvement: Social Attitudes and
Identifications. New York: Wiley.
Vengesayi, S. (2013). A conceptual model of tourism destination competitiveness and attractiveness,
ANZMAC Conference Proceedings, 637-647, Adelaide, University of South Australia, 1-3
December.
Vitterso, J., Vorkinn, M., Vistad, O. I., & Vaagland, J. (2000). Tourist experiences and attractions.
Annals of Tourism Research, 27(2), 432-450.
Webster, C., Ivanov, S., (2014). Transforming competitiveness into economic benefits: does tourism
stimulate economic growth in more competitive destinations? Tourism Manag. 40, 137e140.
The 1st Internasional Forum Business and Economy (IFBE) 2019 Banjarmasin, 13-14 November 2019
34
THE VALUATION OF 'BEDAH MENOREH' RURAL TOURISM PROGRAM IN
SIDOHARJO VILLAGE, KULON PROGO, INDONESIA
Nurwiyanta1, Nur Khasanah
1, Enny Mulyatari
2, Risdiyanto
1, Erni Ummi Hasanah*
1, Evi Gravitiani
3
1 LPPM Universitas Janabadra, Yogyakarta
2 Sekolah Tinggi Pariwisata AMPTA, Yogyakarta
3 Faculty of Economics and Business, Universitas Sebelas Maret, Surakarta
Abstract: Rural tourism is an important engine for rural development. On the other side, it brings
environmental problems. Bedah Menoreh program is one of rural tourism which has connectivity
between tourism destination on Menoreh hills. Sidoharjo and Gerbosari are two villages which are
projected as rural tourism. The economy aspect and sustainability are two aspects to be balanced and
critical in rural areas in developing countries.
This study aims to evaluate rural tourism in the village. We use the contingent valuation method
(CVM) to analyze the tourist's willingness to conserve the tourism area in two villages.
The result of the research is all tourists concern about the sustainability of rural tourism areas.
Keywords: rural tourism area, Bedah Menoreh Program, contingent valuation method,
sustainability, Kulonprogo-Indonesia.
BACKGROUND
In the Regional Medium-Term Development Plan (RPJMD) program of Kulon Progo district
in 2017-2022, there is vision and mission which are the second five-year translation of the vision and
mission of the Regional Long-Term Development Plan (RPJPD) of Kulon Progo district in 2005-
2025. To realize the dreams and ideals in the vision of people in Kulon Progo district, several
missions are formulated. One of the missions in the RPJMD is to realize regional economic
independence based on agriculture in a broad sense, industry, and tourism that are competitive,
sustainable and relying on community empowerment.
Kulon Progo local government plans to negotiate the independence of the regional economy
which is based on the tourism sector, namely the 'Bedah Menoreh' Program. The Bedah Menoreh
Program aims to unite connections between attractions in the hills. Besides, the program will also
target the optimization of the area on the north side of Kulon Progo district, which is mostly in the
form of hills. The targeted areas in Bedah Menoreh include four sub-districts such as Kalibawang,
Samigaluh, Girimulyo, and Kokap.
Samigaluh sub-district is one of the villages which is located in the Menoreh hill region. This
village is a Sidoharjo tourist village which is intensively developing several tourist destinations,
including Curug Sidoharjo, Madigondo coffee cuisine, the summit of Mount Kendil and Tanggulangsi
Park. The potential of Sidoharjo tourism village is based on the view of natural fortress and cultural
riches. It possesses such as karawitan music, hadroh, kethoprak, and jathilan. From year to year, the
development of tourist villages in the Sidoharjo region is increasingly encouraging. This condition is
shown by the increasing number of tourist arrivals in tourist village of Sidoharjo in 2017. In this year,
there were 16,563 domestic tourists and no foreign tourists. In 2018, domestic tourist arrivals
decreased to 10,246 people, but there will be an increase in foreign tourist visits by 68 tourists
(Statistik Kepariwisataan, 2018).
In line with the development of tourism village in Kulon Progo and several regions in
Indonesia, it is inseparable from the government's support for the development of rural areas. The fact
shows that villages in Indonesia have tremendous potential tourism based on natural, cultural and
social characteristics. It is undeniable. The efforts to develop rural tourism sector will have positive
and negative multiplier effect on the village community. The positive impacts of the development of
rural tourism include: the increasing economic growth in the village, the employment, the reducing
unemployment, and the increasing income as well as the welfare of rural communities. On the other
The 1st Internasional Forum Business and Economy (IFBE) 2019 Banjarmasin, 13-14 November 2019
35
hand, there are some negative impacts, especially on environmental aspects such as; to increase waste
and damage the surrounding environment. Therefore, this research will examine the sustainability of
village tourism development in the future and maintain a balance between improving economic
aspects and environmental conservation.
LITERATURE REVIEW 2.1. Rural Tourism
Rural tourism is defined as the movement of people from their residence to rural areas for a
minimum period of twenty-four hours to a maximum of six months, for the sole purpose of leisure
and pleasure. The concept of rural tourism is still have much interpretation. Fleischer and Pizam
associate the rural tourism with the 'country vacation'. In this place, the tourist spends the vast
proportion of his/her vacation period engaging in recreational activities on a farm, ranch, country
home, or the surrounding areas.
OECD defines the rural area as, " at the local level, a population density of 150 people per
square kilometer is the preferred criterion. At the regional level, geographic units are grouped by the
share of rural population into the following three types: predominantly rural (50%), significantly rural
(15-50%) and predominantly urbanized regions (15%).
The Council of Europe stated the term of 'rural area' will be described in the following characteristics:
A stretch of inland or coastal countryside, including small towns and villages, where the main part of
the area is used for:
1. Agriculture, forestry, aquaculture, and fisheries.
2. Economic and cultural activities of country-dwellers.
3. Non-urban recreation and leisure areas or nature reserves.
4. Other purposes such as housing.
According to Dernoi, rural tourism might be conceived as tourism activities in a 'non-urban
territory. In this area, people’s activities (land-related economic) are going on, primarily agriculture:
native inhabitants seems a qualifying requirement'.
The OECD stated rural tourism should be:
Located in rural areas.
Functionally rural, built upon the rural special features; small-scale enterprises, opened space,
contact with nature, heritage, traditional societies, and traditional practices.
Rural in scale – both in terms of building and settlements – and therefore, small scale.
Traditional in character, growing slowly, organically, and connected with local families.
Sustainable – in the sense that its development should help sustain the special rural character
of area and its use of resources.
Representing the complex pattern of the rural environment, economy, and history.
2.2. Environmental Conservation Anonymous (2018) Conservation works in two ways. It is meant to protect nature by
protecting vital resources. It is also a way of living which works against the irresponsible practices of
businesses and large corporations. Green living takes away the power from those who have no interest
in using their influence to promote the good of earth, and emerge the problem instead. The more
money we keep out of the pockets of nonenviromental-friendly business, the more we can do for the
earth.
The environmental conservation comes in many forms and reminds us to be mindful of daily
choices. No matter how busy your life, it remains easy to make small but necessary changes for the
good of Earth. If we all took little steps, we would make our way towards major progress. It can be
achieved by paying more attention to what we buy and not use unnecessary resources. We must also
remember to recycle and dispose of chemicals properly, so that the land and water are not poisoned.
Conservation is an attempt by humans to preserve or protect nature. Substantially,
conservation means preservation or protection (Christanto, 2014). Conservation also means maintain
or keep what we have but in a wise use. The concept of conservation is put by Theodore Roosevelt for
The 1st Internasional Forum Business and Economy (IFBE) 2019 Banjarmasin, 13-14 November 2019
36
the first time. Conservation in the current sense is often translated as the wise use of natural resources
(Fathurrohman, 2013).
2.3. Economics Valuation
Economics Valuation is a method to measure natural resources output quantitatively based on
market value and non-market value. The root of this valuation is The Neoclassical economic theory
that focuses on consumer utility. Based on neoclassical theory, individual measurement on goods and
services is equal to a willingness to pay (WTP), as supply cost (Samuelson and Nordhaus, 1990; in
Tazkia, 2012).
Willingness to pay is an economic concept to measure certain money which would be paid by
the consumer for the supply of goods and services. According to Altaf and Whittington (1992), the
benefit of consumer WTP is the ability to estimate future consumers and the amount of feasibility
cost. This is important in the WTP concept since we have to consider both utility and profit.
There are some factors which are estimated to affect WTP. Those factors are respondent
characteristic or family member, and their ability to pay (Altaf and Whittington, 1992 on Muhammad
Randy), characteristic of settlement, characteristic of facility and characteristic of facility offered.
This research uses works of a literature review from Saraswaty (2003), Veldhuizena (2011),
Lestari (2014), and Pramastiwi (2011). Saraswaty (2003) and Lestari (2014). This literature contains
about use willingness to pay on PDAM water supply and improvement on PDAM service.
Meanwhile, Veldhuizena (2011) uses it on drought mitigation management and Pramastiwi (2011) use
it on coffee farmers towards environmental improvement.
DATA AND METHOD
This research was conducted in the village of Sidoharjo in Samigaluh sub-district. This area is part of
the Bedah Menoreh Program in Kulon Progo. This research uses primary and secondary data. Primary
data is collected by conducting an interview with tourists. Secondary data is gathered from The
Tourism Department and The Statistical Bureau. The number of samples is determined randomly, by
100 respondents.
Multiple linear regression method is used to analyze determinant factors of tourist's willingness to pay
(WTP) for conservation. Systematically, the model could be written as follows:
Y = +
+ +
+ +
(1)
Where:
WTP = Tourists’ Willingness to Pay for conservation on rural tourism, the payment vehicle
is shown on the entrance ticket
X1 = Sex ( 1= Male; 2= Female)
X2 = Education (1= < Bachelor degree ; 2= postgraduate)
X3 = Age (1= < 29; 2 = > 30)
X4 = Income (1= until 2.000.000; 2 = > 2.000.000)
X5 = Facilities (accessibility, amenity), dummy variable 1=good quality, 0= others
X6 = Perception on rural tourism (scenery), dummy variable, 1=good quality,
0 = others
Another analysis which is used in this research is Willingness to Pay (WTP). This method
aims to measure the average amount which are able to be paid by respondents Walpole (in
Suprihatiningsih, 2014). Systematically, the model could be written as follows:
EWTP =
(2)
Where:
EWTP = Estimated average Willingness to Pay
Wi = Value of -i WTP
n = Total respondents
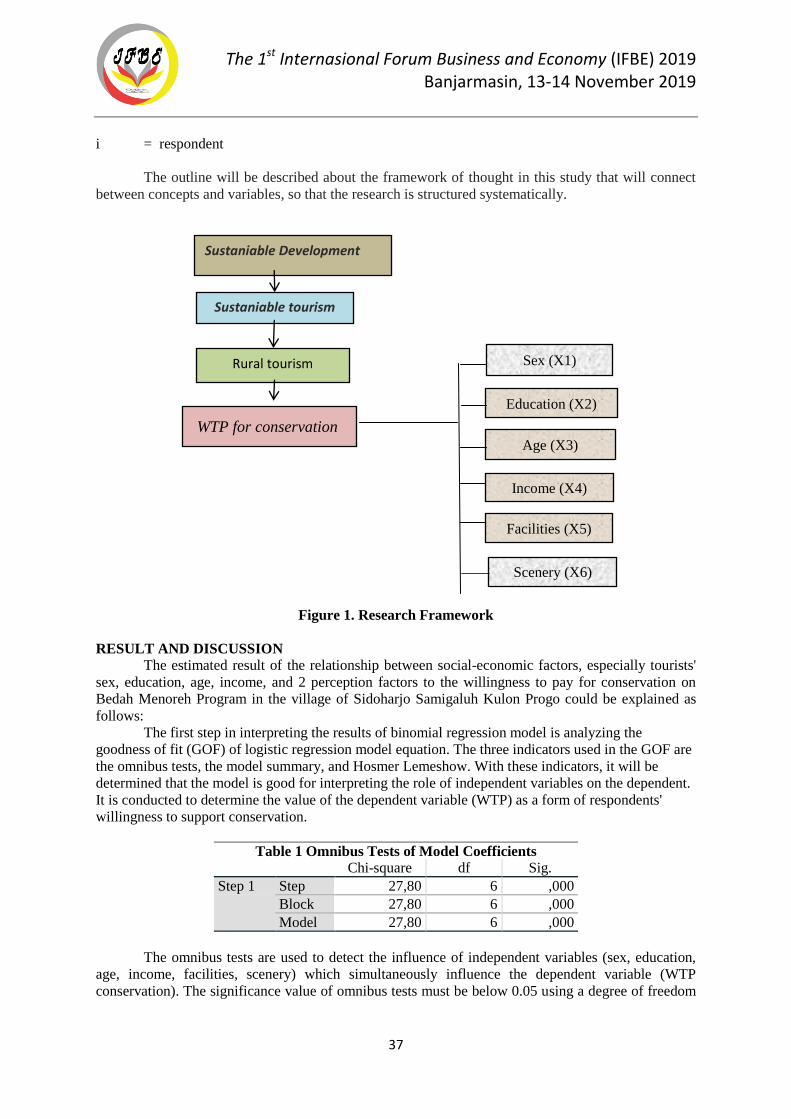
The 1st Internasional Forum Business and Economy (IFBE) 2019 Banjarmasin, 13-14 November 2019
37
i = respondent
The outline will be described about the framework of thought in this study that will connect
between concepts and variables, so that the research is structured systematically.
Figure 1. Research Framework
RESULT AND DISCUSSION The estimated result of the relationship between social-economic factors, especially tourists'
sex, education, age, income, and 2 perception factors to the willingness to pay for conservation on
Bedah Menoreh Program in the village of Sidoharjo Samigaluh Kulon Progo could be explained as
follows:
The first step in interpreting the results of binomial regression model is analyzing the
goodness of fit (GOF) of logistic regression model equation. The three indicators used in the GOF are
the omnibus tests, the model summary, and Hosmer Lemeshow. With these indicators, it will be
determined that the model is good for interpreting the role of independent variables on the dependent.
It is conducted to determine the value of the dependent variable (WTP) as a form of respondents'
willingness to support conservation.
Table 1 Omnibus Tests of Model Coefficients Chi-square df Sig.
Step 1 Step 27,80 6 ,000
Block 27,80 6 ,000
Model 27,80 6 ,000
The omnibus tests are used to detect the influence of independent variables (sex, education,
age, income, facilities, scenery) which simultaneously influence the dependent variable (WTP
conservation). The significance value of omnibus tests must be below 0.05 using a degree of freedom
Sustaniable Development
Sustaniable tourism
Development
Rural tourism
Sex (X1)
Education (X2)
Age (X3)
Income (X4)
Facilities (X5)
Scenery (X6)
WTP for conservation
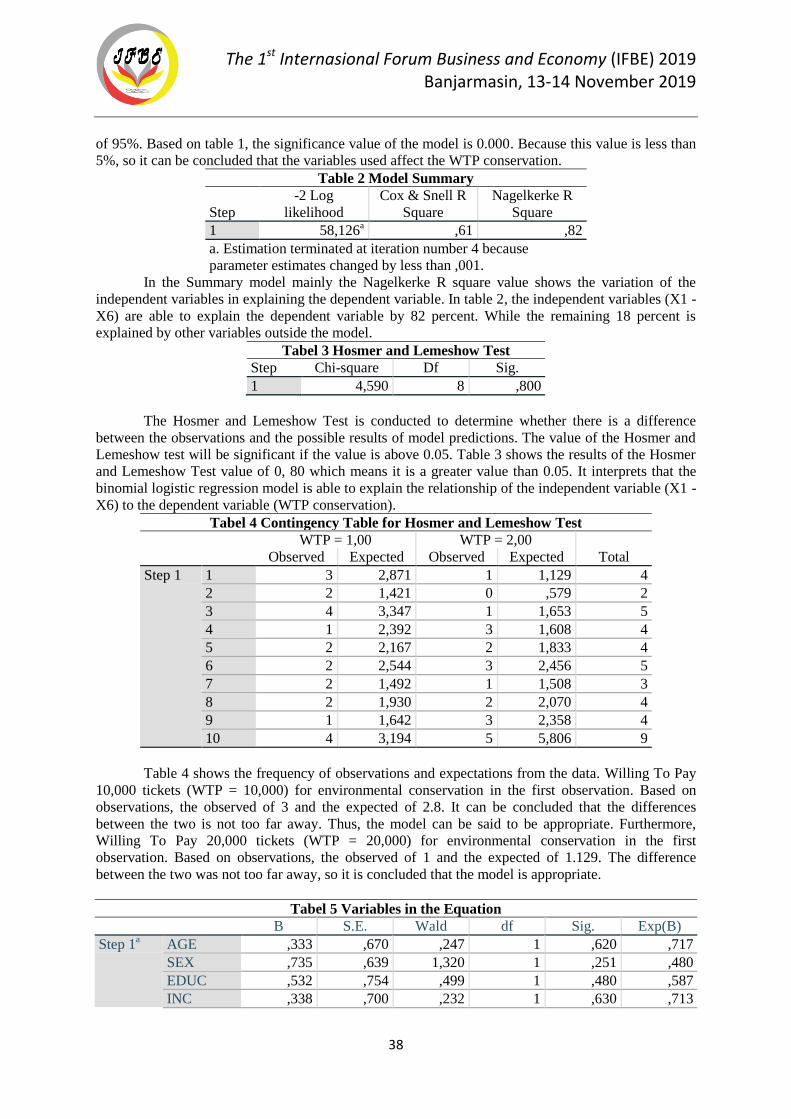
The 1st Internasional Forum Business and Economy (IFBE) 2019 Banjarmasin, 13-14 November 2019
38
of 95%. Based on table 1, the significance value of the model is 0.000. Because this value is less than
5%, so it can be concluded that the variables used affect the WTP conservation.
Table 2 Model Summary
Step
-2 Log
likelihood
Cox & Snell R
Square
Nagelkerke R
Square
1 58,126a ,61 ,82
a. Estimation terminated at iteration number 4 because
parameter estimates changed by less than ,001.
In the Summary model mainly the Nagelkerke R square value shows the variation of the
independent variables in explaining the dependent variable. In table 2, the independent variables (X1 -
X6) are able to explain the dependent variable by 82 percent. While the remaining 18 percent is
explained by other variables outside the model.
Tabel 3 Hosmer and Lemeshow Test
Step Chi-square Df Sig.
1 4,590 8 ,800
The Hosmer and Lemeshow Test is conducted to determine whether there is a difference
between the observations and the possible results of model predictions. The value of the Hosmer and
Lemeshow test will be significant if the value is above 0.05. Table 3 shows the results of the Hosmer
and Lemeshow Test value of 0, 80 which means it is a greater value than 0.05. It interprets that the
binomial logistic regression model is able to explain the relationship of the independent variable (X1 -
X6) to the dependent variable (WTP conservation).
Tabel 4 Contingency Table for Hosmer and Lemeshow Test
WTP = 1,00 WTP = 2,00
Total Observed Expected Observed Expected
Step 1 1 3 2,871 1 1,129 4
2 2 1,421 0 ,579 2
3 4 3,347 1 1,653 5
4 1 2,392 3 1,608 4
5 2 2,167 2 1,833 4
6 2 2,544 3 2,456 5
7 2 1,492 1 1,508 3
8 2 1,930 2 2,070 4
9 1 1,642 3 2,358 4
10 4 3,194 5 5,806 9
Table 4 shows the frequency of observations and expectations from the data. Willing To Pay
10,000 tickets (WTP = 10,000) for environmental conservation in the first observation. Based on
observations, the observed of 3 and the expected of 2.8. It can be concluded that the differences
between the two is not too far away. Thus, the model can be said to be appropriate. Furthermore,
Willing To Pay 20,000 tickets (WTP = 20,000) for environmental conservation in the first
observation. Based on observations, the observed of 1 and the expected of 1.129. The difference
between the two was not too far away, so it is concluded that the model is appropriate.
Tabel 5 Variables in the Equation
B S.E. Wald df Sig. Exp(B)
Step 1a AGE ,333 ,670 ,247 1 ,620 ,717
SEX ,735 ,639 1,320 1 ,251 ,480
EDUC ,532 ,754 ,499 1 ,480 ,587
INC ,338 ,700 ,232 1 ,630 ,713
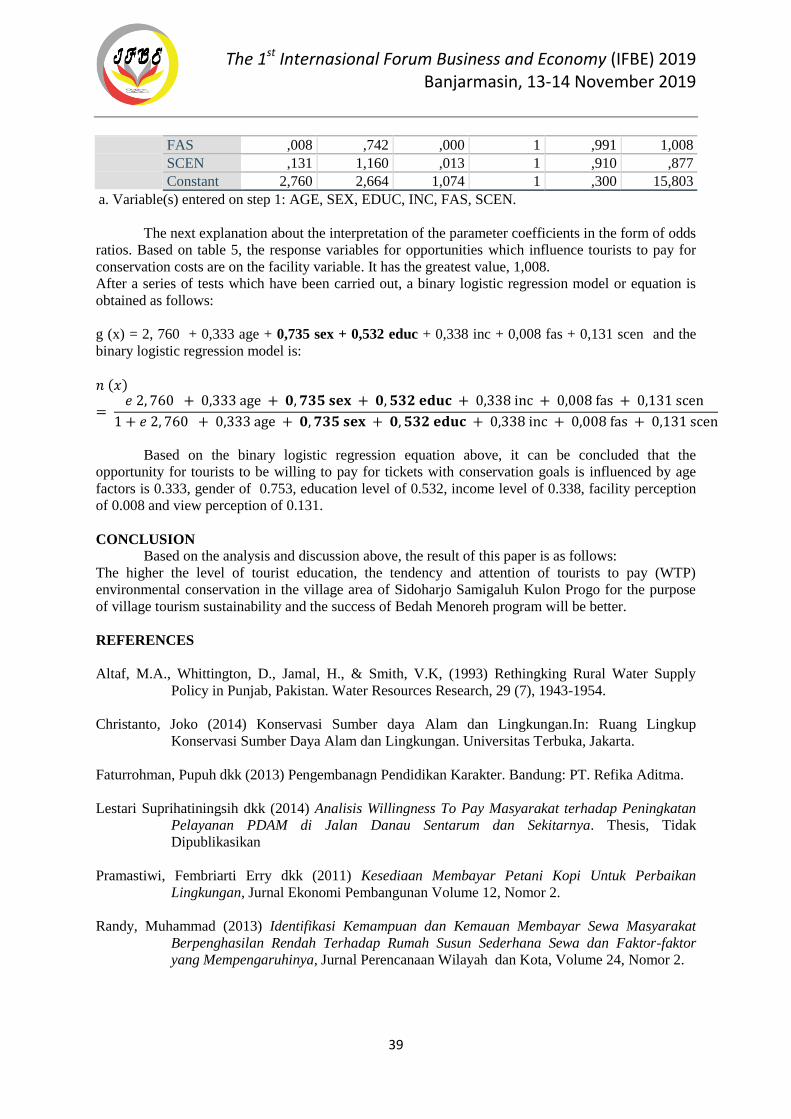
The 1st Internasional Forum Business and Economy (IFBE) 2019 Banjarmasin, 13-14 November 2019
39
FAS ,008 ,742 ,000 1 ,991 1,008
SCEN ,131 1,160 ,013 1 ,910 ,877
Constant 2,760 2,664 1,074 1 ,300 15,803
a. Variable(s) entered on step 1: AGE, SEX, EDUC, INC, FAS, SCEN.
The next explanation about the interpretation of the parameter coefficients in the form of odds
ratios. Based on table 5, the response variables for opportunities which influence tourists to pay for
conservation costs are on the facility variable. It has the greatest value, 1,008.
After a series of tests which have been carried out, a binary logistic regression model or equation is
obtained as follows:
g (x) = 2, 760 + 0,333 age + 0,735 sex + 0,532 educ + 0,338 inc + 0,008 fas + 0,131 scen and the
binary logistic regression model is:
Based on the binary logistic regression equation above, it can be concluded that the
opportunity for tourists to be willing to pay for tickets with conservation goals is influenced by age
factors is 0.333, gender of 0.753, education level of 0.532, income level of 0.338, facility perception
of 0.008 and view perception of 0.131.
CONCLUSION Based on the analysis and discussion above, the result of this paper is as follows:
The higher the level of tourist education, the tendency and attention of tourists to pay (WTP)
environmental conservation in the village area of Sidoharjo Samigaluh Kulon Progo for the purpose
of village tourism sustainability and the success of Bedah Menoreh program will be better.
REFERENCES
Altaf, M.A., Whittington, D., Jamal, H., & Smith, V.K, (1993) Rethingking Rural Water Supply
Policy in Punjab, Pakistan. Water Resources Research, 29 (7), 1943-1954.
Christanto, Joko (2014) Konservasi Sumber daya Alam dan Lingkungan.In: Ruang Lingkup
Konservasi Sumber Daya Alam dan Lingkungan. Universitas Terbuka, Jakarta.
Faturrohman, Pupuh dkk (2013) Pengembanagn Pendidikan Karakter. Bandung: PT. Refika Aditma.
Lestari Suprihatiningsih dkk (2014) Analisis Willingness To Pay Masyarakat terhadap Peningkatan
Pelayanan PDAM di Jalan Danau Sentarum dan Sekitarnya. Thesis, Tidak
Dipublikasikan
Pramastiwi, Fembriarti Erry dkk (2011) Kesediaan Membayar Petani Kopi Untuk Perbaikan
Lingkungan, Jurnal Ekonomi Pembangunan Volume 12, Nomor 2.
Randy, Muhammad (2013) Identifikasi Kemampuan dan Kemauan Membayar Sewa Masyarakat
Berpenghasilan Rendah Terhadap Rumah Susun Sederhana Sewa dan Faktor-faktor
yang Mempengaruhinya, Jurnal Perencanaan Wilayah dan Kota, Volume 24, Nomor 2.
The 1st Internasional Forum Business and Economy (IFBE) 2019 Banjarmasin, 13-14 November 2019
40
Saraswaty, Amrita Nugraheni (2013) Kesediaan Membayar Pelanggan Rumah Tangga Untuk
Pelayanan Air Bersih dari PDAM di Kabupaten Badung, E-Journal Ekonomi
Pembangunan Universitas Udayana, Volume 2.
Sevilla, Consuelo G (1993), Pengantar Metode Penelitian, Jakarta UI Press
Sugiyono. 2007. “Metode Penelitian Bisnis”. Bandung : CV Alfabeta
Suparmoko, dan Maria Suparmoko.2000.Ekonomika Lingkungan. Yogyakarta:BPFE
Statistik Pariwisata DIY, 2018. Statistik Kepariwisataan 2017. Mei. Dinas Pariwisata DIY.
Yogyakarta.
Tazkia, Fanita Osha and Banatul Hayati (2012) Analisis Permintaan Obyek Wisata Pemandian Air
Panas Kali anget, Kabupaten Wonosobo dengan Pendekatan Travel Cost Method. Thesis,
Tidak Dipublikasikan.
Veldhuizena, L.J.L,. Tapsuwanb, S., and Burtonc, M., (2011) Adapting to Climate Change: Are
people Willing to Pay or Change? In Conference Proceeding.
The 1st Internasional Forum Business and Economy (IFBE) 2019 Banjarmasin, 13-14 November 2019
41
THE REINFORCEMENT OF DIGITAL-BASED RISK MANAGEMENT IN ISLAMIC BANK
FINANCING IN THE DISRUPTION ERA
Tri Hidayati1 and Muhammad Syarif
2
1IAIN Palangkaraya, Central Kalimantan, Indonesia
Student of postgraduate doctoral of UIN Antasari Banjarmasin
2UIN Antasari Banjarmasin, South Kalimantan, Indonesia
Student of postgraduate doctoral of UIN Antasari Banjarmasin
Abstract: The existence of Islamic banks in the disruption era should be reinforced by accelerating
financing process through an easier, more efficient and more effective application of risk management
based on Islamic principles. This legal research aims to explore the regulation’s power of Islamic
bank financing risk management and its application in BNI Syariah. The data was qualitatively
analyzed using a systemic interpretation method. The results are; first, some regulations related to
digital-based risk management of Islamic bank financing haven’t regulated credit scoring system. In
addition, there is no fatwa from DSN-MUI concerning risk management guidelines of Islamic
financing. Second, BNI Syariah financing starts applying digital-based risk management by screening
process using Intranet LAN-based EFO (Electronic Financing Origination) application. By using this
application, the history data of customer transaction connected to Financial Information Service
System which (FISS/SLIK) managed by Financial Services Authority (FSA/OJK) will be easily
recognized. Once the financing is given, the risk mitigation is operated in BNI Syariah through
ICONS (Integrated and Centralized Online System) application using Intranet LAN for checking
customers’ funds and debt transactions. Financing submission services are provided in offline, while
the payment is provided in both offline and online (ATM, auto debit, mobile banking, and internet
banking).
Keywords: Risk management, Islamic bank financing, digital
BACKGROUND
The dominance of innovative digital-based facilities have massively occured in order to fulfill the
needs of modern humans who have high mobility. The mobility demands the efficiency of time,
energy, facilities, and costs, in which everything can be closely related to the financial. Many digital
services innovations independently evolve and openly compete each other to grab market share of all
industrial areas with the goal of “winning” or “beating” so-called disruption era.(Prawirasasra, 2018)
Islamic bank as an Islamic-based intermediative financial institution, in this case, is faced with
great threats and challenges to the presence of non-bank financial technology (fintech) industry.
Financial technology (fintech) is a financial services innovation by using technology, so that people
can easily access financial products and services as well as weaken the barrier to entry (Mlanga,
2019). Fintech provides digital-based financial services such as payment channel system (Au &
Kauffman, 2008), digital banking, online digital insurance, Peer to Peer (P2P) Lending (Hariyana,
2019; Hendriyani & Raharja, 2019), and crowdfunding (Chang, 2018; Ferrarini, 2017). Then, it
becomes a threat for Islamic banks when they are not able to transform into a digital-based bank like
fintech. In terms of financing, fintech serves Peer to Peer (P2P) Lending by providing the convenience
of efficient time and uncomplicated procedures for the application and disbursement of the loan. It is
just done through online access without going to the office (Indonesia’s Fintech Lending: Driving
Economic Growth through Financial Inclusion—Executive Summary, 2019; Yunus, 2019).
The opportunities and challenges show that fintech can be a bank partner. For example, in credit
distribution, especially to the sector of Micro and Small Medium Enterprises (MSME). Also, it can
improve the existence of Islamic banking in order to be more able to compete in financial markets
The 1st Internasional Forum Business and Economy (IFBE) 2019 Banjarmasin, 13-14 November 2019
42
either by accelerating the process of financing through an easier, more efficient and more effective
application with a wider access by customer and Islamic bank. The process of financing is expected to
be faster and more measurable by risk mitigation which can be initially done with fintech system.
The risks which require attention in the management of Islamic banking nowadays are in the
aspect of financing. Some research results conclude that the financing of Islamic banks have more
risks (Non Performing Financing/NPF) as compared with the credit of conventional banks (Non
Performing Loan/NPL).(Iqbal, 2017) The reason lies in approval process of financing in the bank's
internal or after the financing was granted by a different system between the NPF and the NPL.
Islamic banks do not focus their business on making profit of credits. However, on a social sense
which involves the NPL/NPF, Islamic banks tend to be higher than the conventional banks.(Ramlan et
al., 2018) The use of digitization of financing through fintech will probably encounter the risks with
the regulative supports of FSA and BI, and resources on Islamic bank itself as the reinforcer.(Yundi &
Sudarsono, 2018)
FSA's commitment to running a grand strategy for the financial markets development of Islamic
banking. It seeks to its new imaging which includes aspects of positioning, differentiation, and
branding. Differentiation aspect has competitive advantage with various, transparent products and
schemes, competent and ethical in finance, up-to-date and user friendly information technology, as
well as the experts of Islamic finance investment. Service quality improvement program is also done
by producing competent human resources and providing information technology to fulfill customers’
needs and satisfaction. This program also aims to communicate the products and services of Islamic
banks to them clearly and correctly while still fulfilling the Islamic principles (Tentang Syariah, n.d.).
Several regulations have been defined by the FSA and BI. However, the coverage should be examined
to the development of inclusive finance of Islamic banking in Indonesia, especially on the financing
aspect which is expected to have minimal risk and adhere to the Islamic principles.
One of Islamic banks which has already used digital instrument for its services is Bank Negara
Indonesia Syariah (BNI Syariah). This bank has won two awards from Infobank Award 2018 in the
category of the Best Bank Syariah for five consecutive years with the assets above IDR 25 trillion,
and the Best Bank Syariah with a very good performance in 2017 with the assets above IDR 25
trillion. Some indicators of the assessment are such on the aspects of asset quality, funding expansion,
financing expansion, and the ratio of bad financing or non-performing financing (NPF). BNI Syariah
is committed to improve the quality of financing, broadening customer-based transaction, and
cooperating with the stakeholders to keep conducting Islamic financial literacy and inclusion, and
developing technology through digital application (BNI Syariah Raih Bank Syariah Terbaik dari
Infobank | Republika Online, n.d.). In accordance with the effort to reinforce financing risk
management, BNI Syariah is interested to be the role model in the application and navigation areas of
regulation’s power in digital-based risk management of Islamic bank financing in Indonesia. It
becomes the focus of this study.
LITERATURE REVIEW
2.1. Risk Management for Islamic Banking
Islamic Banking as one part of the state’s economic system is expected to support economic
development through the collection and distribution functions of public funds. To create a strong
banking industry which has high competitiveness, it requires resilience in dealing with various
risks. The ebb and flow of banking industry in Indonesia mainly occur during the global crisis in
Asia in 1998, the impact of the crisis in America in 2008, and in the Europian region in 2011.
Those crises give very valuable lesson to improve and reinforce the banking industry either by
implementing the system of risk management (Ikatan Bankir Indonesia, 2018, p. 3-4).
The risk management, according to Arifin, is a series of procedures and methodologies used
to identify, measure, monitor, and control the risks arising from banking operations(Arifin, 2009,
p. 272). Risk management aims to: (1) provide information about the risks to the regulator; (2)
ensure that the bank does not experience unacceptable losses; (3) minimize the loss of various
The 1st Internasional Forum Business and Economy (IFBE) 2019 Banjarmasin, 13-14 November 2019
43
uncontrolled risks; (4) measure the risks exposure and concentration; (5) allocate the capital and
limit the risks (Karim, 2013, p. 255).
There are some regulations considered as the primary law and reference in the application of
risk management, especially in Islamic banking industry occuring today, they are:
a. Law Number 21 of 2008 concerning Islamic Banking in Article 38;
b. Regulation of the Financial Services Authority No. 31/POJK.05/2014 concerning the
Implementation of Islamic Financing Business; and
c. Regulation of the Financial Services Authority (POJK No. 65/POJK.03/2016) concerning
the Application of Risk Management for Islamic Commercial Banks (ICB/BUS) and Sharia
Business Unit (SBU/UUS).
Regulation of Islamic banking risk management in Indonesia adopts some rules contained in
international standards which is Basel Committee on Banking Supervision (Basel) and Islamic
Finance Services Board (IFSB).(Hidayati et al., 2018) Basel accord consists of Basel I (1988),
Basel II (2004), Basel 2,5 (2010), and Basel III (2011), in which everything is related to setting
standard of minimum capital which should be maintained by the bank. This efforts is done to
preserve people’s interest who keep their money in the bank (Ikatan Bankir Indonesia, 2018, p.
16-22). IFSB creates specific standards for Islamic financial industry in the world. The IFSB-1
has classified six risks to be managed by Islamic banking such as credit risk, investment risk,
market risk, liquidity risk, rate of return risk and operational risk(Handayani, 2016).
Risk management is a series of procedures and methodologies used to identify, measure,
monitor, and control the risks arising from overall banking operations (Article 1 Section (6)
POJK 65/POJK.03/2016). The term ‘risk’ means the loss potency resulting from a particular
case. The risk is uncertain, when there occurs an undesirable situation which can lead to a
mismatch of the expected results that potentially cause a loss. The risks to be anticipated by
Islamic banking either BUS or UUS as stated in the Article 5 of POJK include credit risk; market
risk; liquidity risk; operational risk; legal risk; reputation risk; strategic risk; compliance risk;
yield risk (rate of return risk); and investment risk (equity investment risk).
The scope of risk management of Islamic banking industry in Indonesia is conducted
internally and externally. Internally, the implementation of risk management for BUS is
conducted individually or by consolidation with its subsidiaries. UUS is conducted to all its
business activities which is an integral part of risk management implementation in Conventional
Banks (CB) (Article 2 Section (2) and (3)). For that, Islamic banks are required to establish
supervisory agencies, they are: Risk Management Committee and Risk Management Unit
(Article 18). Risk Management Committee of BUS consists of: 1. The majority of members of
Directors. One of them is the director who is in charge of the compliance function; and 2. the
corresponding executive officer, while UUS itself can establish the Risk Management Committee
at least consist of: 1. The Director of UUS; 2. The director who is in charge of the compliance
function of Conventional Banks (CB); and 3. the corresponding executive officer.
The external supervision is conducted by the Financial Services Authority since December
31, 2013. It was the duty of Bank Indonesia (BI) as the central national banking before the date.
The supervision is conducted to ensure that the banks are rightly and carefully managed in
accordance with the principles of risk management and good corporate governance (GCG), and
to comply with the legislation and regulations applied, including compliance with Islamic
principles. The supervision/inspection of a bank is focused on the inherent risks of the functional
activity of banks and KPMR. Inherent risk is the risk inherent in bank's business activities,
whether quantifiable or not and potentially affect financial position of the bank, including: 1)
Financing Risk; 2) Market Risk; 3) Liquidity Risk; 4) Operational Risk; 5) Legal Risk; 6)
Strategic Risk; 7) Compliance Risk; and 8) Reputational Risk. The risks are categorized into five
ranks, namely 1 (Low), 2 (Low to Moderate) 3 (Moderate), 4 (Moderate to High), and 5 (High).
By regarding to the risk, financing in Islamic banks is analyzed based on the quality of assets
with 5 (five) categories: 1) current, 2) special concern, 3) less current, 4) doubtful, and 5)
jammed.
The 1st Internasional Forum Business and Economy (IFBE) 2019 Banjarmasin, 13-14 November 2019
44
2.2. Characteristics of Disruption Era
Etymologically, the term ‘disrupsi’ is derived from an English word disruption. In
Indonesian language, it is basically defined as things being uprooted. Disruption is a term
popularized by Clayton Christensen as a continuation of the tradition of thinking "must compete"
aiming to win and beat others. In the dynamic and sustainable current development, we have
arrived and entered to the era of disruption. This era is characterized by the use of real objects
into the virtual object with the aid of technology such as computers, cell phones and robots. This
digitization process happens due to the evolution of technology which is based on
communication and information accompanying our daily life. Eventually, sooner or later, this
may change the life order and lifestyles of people. In fact, disruption era reaps different
responses; some companies regard it as a threat, but others see it as a great opportunity (2019, p.
9).
Disruption is when a fundamental or basic change happens. One of things that causes the
fundamental change is the changes in technology targeting a gap in human life. Digitization is
the result of technology changes that alters almost any order of life, including the order in doing
business. Disruption era occurs when a new innovation comes into the market and creates a
strong enough effect of disruption that changes the prior market structure. Disruption era gives
the birth of industrial revolution 4.0 that we currently feel it as a big change in various aspects
compared to the previous generation. Industrial revolution 4.0 is marked by the advancement of
connectivity, interaction, limitations between people, machines and other resources which are
increasingly being convergent through information and communication technologies (ICT). The
ICT should be optimally utilized not only for the production process, but also for the whole
industrial links; so that, it could generate a digital-based new model of business.
The phases of industrial revolution can be described as follows:
a. 1.0: the late 18th century, the mechanization of production with hydro and steam power;
b. 2.0: the late 19th and early 20th century with electrical technology; mass production through
assembly line;
c. 3.0: the early 1970s, the automation of production through information technology;
d. 4.0: in 2018, it’s marked by cyber-physical and virtual-connectivity, human, machine, and
E-society; smart data (internet of things)-genetic editing, artificial intelligence, big data
mining, and self-drive vehicles. By the industrial revolution 4.0 and E-Society, cyber
technology integration occurs for the reproduction of science and technology with the
internet of things; social skills are increasingly needed. (Azra, 2019)
There are two main characteristics of disruption. First, it is a very fundamental change
related to business model. In fact, market leader company continuously innovates, but the
innovation is more intended to maintain the growth and the market. Conversely, the new
companies offer a new business model different from the previous ones. Second, disruption
always begins at the lower market (low-end) by offering much cheaper prices. Since it initially
serves the lower market, the company is not detected by market leaders which get more focused
on the upper market (high-end). Sooner or later, when the company has a strong market
foundation, they will improve their quality and lead to the upper market. Here is when the theory
of disruption then predicts that a market leader company is going to lose (Christensen, 2006).
2.3. The Impact of Disruption for Banking
Deputy Commissioner of the Financial Services Authority (FSA/OJK) Institute, Sukarela
Batunanggar, addresses the issues faced by banks if they do not make any changes in the era of
technology disruption. Sooner or later, they will be affected if they just stay the same. Globally,
almost 60 percent of banking portfolios later will be at risk, that is likely to decline if they do not
consistently change. By digital transaction, digital business process will improve the efficiency.
By digital services, the banks become more efficient, the customers feel more comfortable, and
operating costs get (Ini Dampak Disrupsi Teknologi ke Industri Perbankan—Bisnis Tempo.co,
n.d.). Professor of Management at UI, Prof. Dr. Rhenald Kasali, acknowledges the rapid
The 1st Internasional Forum Business and Economy (IFBE) 2019 Banjarmasin, 13-14 November 2019
45
technology disruption which is currently felt will have an impact on the sector of banking. It is
because one of things mostly affected by industrial revolution 4.0 is the financial sector. The
banking industry, according to him, is expected to adapt the technological developments which
are now growing more rapidly (Dampak Disrupsi Teknologi, n.d.).
The flow of times which moves dynamically requires us not to deny the existence of
technological advancement. Nowadays, people either personal or collective compete to create
media that can simplify their jobs or can be used to ease what first looks difficult to do. Digital
economy is one of results of disruption era. Economy with internet as the medium for various
activities like communication, collaboration, and cooperation between companies or individuals
can bring benefits and advantages for the economy itself. It includes the sectors of modern
economy and financial institution which has been established among wide community
Digitization demands for all sectors to move dynamically for the global competition with the
high competitiveness of products and financial services. The competition between banks and
financial institutions has got into the new stage of application technology which is the
implication of banking business development in the era of digital economy.
In the era of digitization and automation, many office works can be more efficiently
produced at lower costs. Digitization can be seen as an opportunity to improve customer
relationship, business process, and to create and adapt new business models. In the financial
sector, digitization is a development of work methods, scope of work and work environment. The
advancement of information technology and computerization system which are developed into
digitization can make the jobs more efficient and faster. The general consensus is that due to
digitization, customers will become more independent and work environment turns into a more
digital environment which may change the entire environment of the organization.
Telecommuting and working remotely from the office will be more used as work methods of
today and future; so that, digital competence becomes more important and becomes the need of
peoplepowers.(Nurfalah & Rusydiana, 2019)
Islamic banking as one of the economic sectors which becomes a revolving wheel of funds
in a country should evolve and follow the market needs. Islamic banking should always be the
first choice of individuals in conducting the payments and other economic activities. To achieve
that kind of targets and objectives, bankings must endlessly innovate in accordance with the
needs, and make customers easier to carry out all their economic activities. Application
technology in a banking is called by digital banking. It is a banking service by utilizing digital
technology to meet customers’ needs in order to actualize the digital economy as aspired. Digital
bankings which have grown until today are like ATM, internet banking, mobile banking, video
banking, phone banking and SMS banking. Several banks have already launched branchless
financial services (branchless banking) which are mainly intended for people who have not the
access to banking (unbanked).(Dz, 2018)
The transformation of digitizing Islamic banking services is a necessity. The anticipation is a
legacy to survive. Business institutions may choose whether to be the player of the change or just
to be the spectator of it. If the choice falls on being the player of the changes, they must be ready
for mindset, role, and responsibility changes of a new job as well as to be ready to face new
competitions and sciences. The high intensity of socialization by the Islamic banking can affect
society in general. The functions contained get the attention and be able to attract new
prospective customers while maintaining public trust to the Islamic banking. Internet facilities
and various social media (Facebook, Twitter, Instagram, and others) can be utilized for the
benefits of education and socialization of Islamic economy, especially Islamic banks. As it is
known that Islamic bankc have different system and products from the conventional banks. In
today's digital era, the forms of media have already switched to the online format because it is
easily accessible by anyone who needs the information. People easily share informations about
their social account as well.(Dz, 2018)
In addition to revolutionizing the approach taken by banking industries, the rapid growth of
technology has also changed people’s lifestyle, especially in complying their financial needs.
The 1st Internasional Forum Business and Economy (IFBE) 2019 Banjarmasin, 13-14 November 2019
46
This results in the emergence of new businesses in the field of technology-based financial
services. These financial services companies are often well-known as fintech companies. BI
defines financial technology as the result of a combination between financial services and
technology, in which then it changes the conventional business model to be moderate. At first,
the customer should have a face-to-face transaction, but now it can be remotely done by making
a payment.
2.4. Inclusive Islamic Finance Through Banking Digitization
The Consultative Group to Assist the Poor (CGAP-GPFI) defines inclusive finance as a
condition in which all working age people are able to gain effective access to credit, savings,
payment systems and insurance from all financial services providers. The effective access also
includes the convenient and responsible services at an affordable price for the public and
sustainable for the provider. It is expected that in the end, people can take more advantages of
formal financial services than informal financial services (Nurfalah & Rusydiana, 2019) (anshori,
2016). Financial inclusion, based on the Presidential Decree (Perpres), is a condition in which
every society member has the access to many quality, timely, streamlined, and safe formal
financial services with an affordable price according to one’s needs and capabilities (Attachment
of Presidential Decree Number 82 of 2016 concerning the National Strategy for Inclusive
Finance). Concurrently, in FSA regulation, financial inclusion is defined as the availability of the
access to various institutions, financial products and services according to the needs and
capabilities of people in order to improve their prosperity (Article 1 Paragraph 7 of the Financial
Services Authority Regulation No. 76/POJK.07/2016 Concerning the Enhancement of Literacy
and Financial Inclusion in Financial Services Sector for Consumers and/or Community).
Basically, inclusive financial policy is a form of financial services deepening addressed to
the public “in the bottom of the pyramid” to take advantage of formal financial products and
services as a safe means of keeping money, transfers, savings or loans and insurance. It’s done
not only by supplying products in an appropriate manner but also combining it with various
aspects (Program Keuangan Inklusif—Bank Sentral Republik Indonesia, n.d.).
Inclusive finance is an important component in the process of social inclusion and economic
inclusion which contribute to foster economic growth, create the stability of financial system,
support the poverty reduction program, as well as to reduce the gap between individuals and
between regions. Inclusive financial system is actualized through people's access to financial
services that it can improve the economic capability and eventually pave the way to escape from
poverty and reduce economic disparities. Wider access to financial services is essential in the
effort to increase the participation of the whole society in economy.
The effort should be made to actualize and improve the inclusive Islamic financial by the
digitization of Islamic banking industry (Megargel et al., 2018). Most of banking industry players
have already switched to a digital strategy as a strategy implemented at the level of corporate
strategy in Indonesia. According to the data from BI, recorded growth of the number of
electronic money transaction nominal has increased by approximately 290% or 29 times since
2012 until the end of 2018. It happens unseparatedly from customers tendency who start enjoying
electronic-based banking services. It can be seen from the increasing number of electronic
transactions conducted by bank customers in Indonesia. According to the Price Water Cooper
Survey, 44% of respondents from banking industry say that digital strategy has an ultimate goal
to enrich customers and employees experience in doing a better process of banking. It is expected
that they can conduct banking activities more easily because of the vary rapid technological
development (Indira & Ertambang Nahartyo, 2018; Rapitasari, 2016) Digitization is based on big
data and data analysis technology. The big data is used to create (1) the efficiency of risk
management through credit scoring and the quality of decision; (2) protection of froud
(deviation), that may lead to cyber security attack, with a data driven which can read anomaly
patterns in a real time; (3) faster merchant assessment for the quality partners who are in need of
funds (Dicuonzo et al., 2019).
The 1st Internasional Forum Business and Economy (IFBE) 2019 Banjarmasin, 13-14 November 2019
47
2.5. Previous Studies
The previous studies closely related to this study are quite a lot and very helpful in mapping
out the headings of this research; thus, it certainly has a difference from studies as below:
The study entitled “Analisis SWOT Financial Technology (Fintech) Pembiayaan Perbankan
Syariah Di Indonesia (Studi Kasus 4 Bank Syariah Di Kota Medan)” is written by Ridwan
Muchlis in At-Tawassuth Journal, Vol. III, No. 2, 2018.(Muchlis, 2018). This study examined the
application development created by Islamic banking to take advantage of FinTech in efforts to
accelerate the financing process; thus, it could ease the service to customers. However, the
development of fintech application is proved to have some disadvantages. Such as, it needs an
internet network supporting for the efficiency of financing activities in Islamic banks. In
addition, they are cyber crime activities which reduce customers' interest to use the application.
Based on the research analysis, it is suggested to prepare the regulations related to the financing
of FinTech earlier. Therefore, the risks can be minimized, and customers can improve their
knowledge and understanding for the transactions comfort and safety in Islamic banking.
The study entitled “Analisis Perbandingan Risiko Kredit Antara Bank Syariah dan Bank
Konvensional” is written by Siti Ruwaida Ramlan, Silcyljeova Moniharapon, and Joy Elly in
EMBA Journal Vol. 6 No. 1 January 2018.(Ramlan et al., 2018). This study examined whether
there are differences in credit risk between Islamic banks and conventional banks. Based on the
conclusions drawn in the research, it is mentioned that there are significant difference between
the Conventional Banks and Islamic Banks, in which the value of NPL/NPF of Islamic Banks
have a greater average than Conventional Banks.
The study entitled “Risiko Kredit, Stabilitas, dan Kebijakan Pembiayaan Bank Syariah di
Indonesia” is written by Ahmad Syatiri and Yulia Hamdaini in the Journal of Management and
Business Sriwijaya Vol. 15 (3), 2017 (Syatiri & Hamdaini, 2017). This study examined the
relationship between credit risk, bank stability, and financing policy. The study found that the
stability variable has significant relationship with the financing variable to deposit ratio. External
variable in the form of inflation has significant relationship with stability, while BI Rate variable
has significant relationship with murabahah financing (MBAF). However, credit risk variable
have no significant relationship with all variables.
The study entitled “Perbankan Era Baru Digital” is written by Nurkholis in Economicus
Journal Vol. 9 No. 1 June 2018 (Kholis, 2018). This study aims to determine the continuation of
human resources who have been working in banking services such as customer service, teller and
others. If the function has been replaced by a digital application, and then how is the security of
customer transactions? In this transaction, services are done digitally without having the physical
presence of customer in the bank branch office involved. In adddition, if the function has been
replaced by digital application, how the regulations determined by Bank Indonesia and the FSA
toward digital banking services. Based on this research, it could be inferred that technological
development is unstoppable. The progress is directly proportional to human desires to get easy in
every activity. For instance, in financial activities which daily interact with banking services
directly. Conventional banking services do require a high cost, a substantial investment.
However, with the development of technology, everything can be trimmed with FinTech.
Initially, many perceived that FinTech will replace the position of bank in economic world.
Somehow, today, instead of replacing the position of bank, the presence of FinTech can even
walk side by side; so that, the progress of the economy can be done together. It is clear and
unequivocal regulation which is the Financial Services Authority Regulation No.
77/POJK.01/2016 concerning Information Technology-Based Loaning Money Services regulates
everything to protect community interests both as loaner or borrower. In addition, Bank
Indonesia issued Governor Board Member Regulation No. 19/14/PADG/2017 concerning
Financial Technology Regulatory Sandbox. In this regulation, the regulatory sandbox is defined
as a safe limited test room to examine Financial Technology Administrator along with the
products, services, technologies and/or its business model.
The 1st Internasional Forum Business and Economy (IFBE) 2019 Banjarmasin, 13-14 November 2019
48
The study entitled “Digitalisasi Keuangan Syariah Menuju Keuangan Inklusif: Kerangka
Maqashid Syariah” is written by Irfan Nurfalah and Aam Slamet Rusydiana in Expansion:
Journal of Economics, Finance, Banking and Accounting Vol. 11, No. 1 May, 2019 (Nurfalah &
Rusydiana, 2019). This study aimed to determine the solutions to improve the low levels of
literacy and Islamic financial inclusion in Indonesia, the solutions are in accordance with the
concept of maqashid syariah, and the implications toward Islamic finance. The study concluded:
(1) the author provided solutions of digital innovation to increase the level of literacy and Islamic
financial inclusion in Indonesia by creating the application "Connected, One Stop Solution". This
application facilitated people with 20 features including: saving (plain tubes, gold tubes and
Umrah Hajj tubes), investment (Islamic insurance, Islamic mutual funds and Islamic stocks) as
well as to fulfill the obligation and donate (Zakat, Infaq, Sadaqah and Waqf); (2) Suitability of
the 20 features of Connected with the concept of maqashid sharia (dharuriyyah, hajiyat dan
tahsiniyat). Maslahah dharuriyyah was divided into 5 categories: a) Religion, b) Soul, c)
Descendant, d) Mind, and e) Wealth. The features included in maslahah dharuriyyah were: a)
Religion: Zakat, Waqf and Umrah Hajj tubes, b) Soul: Health Insurance, c) Descendant: Future
Tubes, d) Mind: Educational Insurance and Future Tubes, and e) Wealth: Mutual, Stocks, Gold
Tubes, Vehicle Insurance, Accident Insurance and Property Insurance. The features including
maslahah hajiyat are Pay, Purchase, Cash WIthdrawal, Loan, Installment, Pawn, Resto, Travel,
Scan QR and NFC as well as features including maslahah tahsiniyat are Add Friends, Chat and
Rahma; (3) The implications of Connected application toward Islamic finance are to: a) Support
Increasing Islamic Financial Inclusion, b) Improve the Literacy of Finance with the Digitization
of Islamic Financial Services and Products, c) Improve Market Share of Islamic Finance, d)
Support Government Program “Non-cash National Movement” and e) support halal needs in
accordance with the Maqashid Syariah.
RESEARCH METHOD
This study was conducted in qualitative method by the form of empirical and normative juridical
approach. The primary data were obtained from the interviews and the documentation from BNI
Syariah. The secondary data were in the form of risk management regulation for Islamic banking and
other supporting data. Both types of data were analyzed qualitatively using a systemic interpretation
method.
RESULT
4.1. Regulatory Reinforcement of Digital-Based Risk Management of Islamic Bank Financing
Indonesia is a country with a large Muslim population with the composition of more than 85
percent of the whole population. Since the first time Islamic banking existed in Indonesia through
Bank Muamalat in 1991, the penetration of Islamic financial assets is still around 5,9 percent of
total national banking assets. Meanwhile, when it is combined with the non-bank Islamic
financial industry, the total Islamic assets only reached 8 percent. If the economic activities, trade
and people transactions which are rapidly growing has already been connected to the Islamic
values, the Islamic financial will also grow stronger. One of many reasons for the slow growth of
Islamic finance and economy is because of nonoptimal use of digital aspects. In the ecosystem of
Islamic digital, there are Islamic banking, Islamic investment institutions, Islamic financing
institutions, Islamic capital markets, Islamic insurance, E-Money, financial technology and any
other digital services as a separate ecosystem in Islamic finance.
This year, the government has launched Indonesian Islamic Economy Masterplan (MEKSI)
2019-2024 as a continuation of Indonesian Islamic Financial Architecture Masterplan (MAKSI)
by the Ministry of PPN/Bappenas starting from 2015. One of the points mentioned is about
digitization of the financial sector. MEKSI recommended four major steps and strategies. First,
strengthening the halal value chain by focusing on sectors which are considered potential and
high competitiveness. Second, strengthening Islamic financial sector with a master plan outlined
in previous Indonesian Islamic Financial Architecture Masterplan (MAKSI) and improving into
The 1st Internasional Forum Business and Economy (IFBE) 2019 Banjarmasin, 13-14 November 2019
49
this master plan. Then, the third sector is strengthening Micro and Small Medium Enterprises
(MSME) as the main driver of halal value chain. The fourth, the reinforcement in the field of
digital economy, mainly trade (e-commerce, market place) and finance (financial technology), so
that it can support and accelerate the achievement of other strategies. MEKSI 2019-2024 is
expected to boost the ranking of Indonesia in the Global Islamic Economy Index. Currently,
Indonesia is in the top 10. Indonesia is still below Malaysia, United Arab Emirates, Bahrain,
Saudi Arabia, Oman, Jordan, Qatar, Pakistan, and Kuwait (Kementerian Perencanaan
Pembangunan Nasional/ & Badan Perencanaan Pembangunan Nasional, 2018).
The encouragement for developing digital banking has always been strived by the regulator
involved. Besides the government through MEKSI 2019-2024, both Bank Indonesia (BI) as well
as the Financial Services Authority (FSA) are also working on it by setting up the guidelines and
policies to form a special task force. BI and the FSA also encourage and pursue the development
of digital banking in this country.
BI has an important role in commanding the stability of the digital-based banking industry
through fintech (Financial Technology—Bank Sentral Republik Indonesia, n.d.). Some effort has
been in terms of payment, investment and risk management. In keeping the traffic order of
payments related to FinTech settlement and clearing, BI ensures the protection of consumers,
particularly regarding the confidentiality of consumers’ data and information through cyber
security network. Bank Indonesia guarantees the security and the traffic order of payment by
acting as the facilitator, intelligent business analyst, assessment, coordinator, and communicator.
BI becomes a facilitator in terms of land provision for payment traffic. Through cooperation with
the authorities and international agencies, BI becomes an analyst for the businessmen related to
FinTech. BI provides insight and guidance on how to create a safe and orderly payment system.
BI also conducts monitoring and assessment toward any business activities involving FinTech
with technological payment system. It is as well as keeping in touch with the authorities to
continue supporting the existence of FinTech payment system in Indonesia. BI is also committed
to support entrepreneurs in Indonesia by regularly providing guidance about the FinTech. In
terms of investment and risk management, Bank Indonesia also requires every businessmen to
stick to the macroprudential regulation, deepening of the financial markets, payment systems to
support the cyber operations and security to keep consumers’ data and information.
Welcoming the disruption era with the industrial revolution 4.0, the FSA has issued several
policies and regulations concerning the digitization of banking sector, as in the following table:
Table 2.
Regulations Concerning Digital Banking-Based Risk Management in Indonesia
REGULATIONS ABOUT
POJK No. 65/POJK.03/2016 Implementation of Risk Management for Islamic Conventional
Banks and Islamic Business Unit
POJK No. 23/POJK.03/2018 Implementation of Risk Management for Islamic Rural Bank
POJK No. 38/POJK.03/2016 Implementation of Risk Management in the Use of Information
Technology by Commercial Banks
POJK No. 12/POJK.03/2018
Implementation of Digital Banking Services by Commercial
Banks
POJK No. 18/POJK.03/2017
Reporting and Requesting Debtor Information Through Financial
Information Services System
SE-OJK No. 50/SEOJK.03/2017
Reporting and Requesting Debtor Information Through Financial
Information Services System
SE-OJK No. 10/SEOJK.03/2019 Implementation of Risk Management for Islamic Rural Bank
The FSA understands the importance of digital banking for banks. To lead to the digital
banking services, banking does require not a slight investment. Banks also need to build
The 1st Internasional Forum Business and Economy (IFBE) 2019 Banjarmasin, 13-14 November 2019
50
relationships between banking and telecommunications industries as well as to provide
information security and harmonizing rules among regulators. The FSA formed a Task Force
Digital Banking Team in 2016. Task Force Digital Banking Team of FSA has synergy with the
institutions and state institutions, such as banks, the Ministry of Communication and Information,
Directorate General of Population and Civil Registration of the Ministry of Home Affairs, as well
as the Indonesian Financial Transaction Reports and Analysis Center (INTRAC). In addition,
Task Force Digital Banking Team is holding the Criminal Investigation Agency of Indonesian
National Police (Bareskrim POLRI), the Board of National Defense (Wantannas), Indonesian
Telecommunications Regulatory Body (BRTI), National Desk Information Defense and Security
Cyber (DK2ICN), Coordinating Minister for Political, Legal, and Security Affairs
(Menkopolhukam), as well as the representatives of telecommunications companies and
information security experts. From the results of the joint discussion, the FSA sees that some
things need to get more attention to develop the digital banking services such as the importance
of using single identity, which is electronic ID card (e-KTP) (Martowadjo, 2016, p.9).
According to the FSA, the use of e-ID card is important as customer’s data base. BI also
needs to prepare the reliable and capable infrastructure of information technology (IT),
implement good risk management (Annaswamy, 2018), and provide business models which suit
customers' needs in entering the digital banking businesses. On the other hand, banks also still
require standardization and increased discipline of telecommunication implementation.
Replacing the SIM card to support digital banking services, enhanced security, and adjustments
to a number of regulations which is done by customer should be a concern. (Annaswamy, 2018).
The process of financing in Islamic banks as well as in conventional banks applies the
process of screening. Screening in financing is done by customers feasibility analysis. This
analysis aims to assess the customers who are eligible to receive financing from banks and the
way of banks to minimize the occurrence of non-performing financing/financing problems which
will be detrimental for them. The financing customer feasibility analysis is divided into two types
by looking at what is being analyzed, they are qualitative analysis (willingness to pay) and
quantitative analysis (ability to pay). The analysis of financing as part of the screening process is
generally referred to the principle of 5 Cs, they are character, capacity, capital, condition, and
collateral.
Besides screening, credit scoring or credit assessment in the credit and financing is also
applied. It is a system or method used by banks or other financial institutions which is useful for
determining whether a loan applicant is feasible or not to get financing. It is also calculated by
using a specific formula (Yu & Cho, 2018). There are various factors which can damage a credit
score such as: the late payment of installments (primary and margins) as well as the lack of credit
references (Khusumawardani et al., 2016, p.49). Banks are encouraged to utilize the big data to
complete the credit scoring or credit value determination process which will be given to the
debtor. According to the Head of the Statistics Department of Bank Indonesia, Yati Kurniati,
some banks, especially state-owned bank have already implemented big data for credit scoring
and fraud detection by using the data and credit cards of the debtor. The utilization of big data to
support the process of credit scoring is a complementary. Calculation of credit scoring with big
data by banks uses the information such as the behavior of individuals who is not covered by
financial informasion service system (FISS/SLIK). SLIK relevant provisions are stipulated in
POJK No. 18/POJK.03/2017 and SEOJK No. 50/SEOJK.03/2017 Concerning Debtor Reporting
and Information Through the Financial Information Services System ((OJK), 2017).
Credit scoring is used for the needs of internal banks analysis to strengthen the risk
management on the behaviors of individual customers. The data in FISS are used to enter the
calculation of bank credit risk monitored by the banks and the regulators (FSA or BI). Therefore,
the data format of SLIK are arranged according to the needs of the regulators. From the side of
Bank Indonesia, big data of banking has been used all this time to identify the vulnerabilities in
financial system. It is done by monitoring the behavior of individual banks and analyzing
systemic risk potentials arising from the linkages of the interbank payment system. BI also uses
The 1st Internasional Forum Business and Economy (IFBE) 2019 Banjarmasin, 13-14 November 2019
51
the text mining algorithms by proceesing the news media to do prioritization of the major risks
source which can disrupt the financial system. The results of big data analysis are used to support
the process of policy making in BI.
The providers of financing, in general, such as Islamic banks, Islamic bank financing
institutions, Islamic pawnshops, Islamic micro financial institutions, credit unions and Islamic
financing (KSPPS) use credit scoring to evaluate the potential risks in the financing distribution
to their customers. It is done to minimize losses due to financing problems. Financing providers
use credit scoring to determine who is eligible to receive the financing and how long the tenors
are. The use of credit scoring before the approval and granting access to financing is a well-
guaranteed system implementation. This is a forward direction in the Risk-Based Management
system of Bank Indonesia. Financial credit management is the act of creating economic value to
the company by managing the risks faced, especially the financing risk. To implement this act, it
needs a recognition to the source of risks, measuring and handling it. The use of credit scoring is
not limited to the banking industry. Other organizations such as government agencies and the
private sector also conduct these techniques. Credit scoring has many similar methods with the
data mining, which basically also uses similar techniques. Either FISS, credit scoring, or 5Cs
principle in feasibility analysis of customers are the application forms of prudential banking
principle in Islamic banking.
In addition to FISS regulation as a form of digital-based financing risk management, there is
a POJK of digital-based risk management namely POJK No. 38/POJK.03/2016 concerning to
Implementation of Risk Management in the Use of Information Technology by Commercial
Banks. In this POJK, it is required for the banks to have policies, standards, and procedures of
use information technology and apply them consistently and continuously. There is also a
tolerance for the risk limit to ensure that all aspects of policies, standards, and procedures of
using technology run optimally. This POJK also requires the banks to have policies, standards,
and procedures on the process of information technology risk management. Besides, banks are
also required to conduct the risk management process related to the use of information
technology. If the bank uses the service providers of information technology, the banks should
ensure that they apply risk management as set out in the regulations of FSA. This POJK
mandates that banks effectively implement the internal control systems of all aspects of the use
of information technology. The control system is the supervision, the control culture,
identification and risk assessment, control activities and functions separation, information
systems, accounting and communication systems, monitoring activities and correction of
irregularities which are committed by the management, the operational unit, internal auditing unit
or any other parties.
Concerning the existing regulations, it seems necessary to formulate the regulation of the
FSA in the disruption era related to Credit Scoring System. The implementation might be done
internally or involves the third party which is the credit rating evaluation institutions from both
government and private institutions. Besides, there should be regulations governing the use of
integrated big data. By this regulations, the digital-based risk management will be ideally
implemented in juridical, economic and technical aspects.
If it is correlated with the existence of Islamic digital banking ecosystem, there should be a
different regulation from conventional banking. It includes in the digital-based financing risk
management which must be leaning on the fatwa of DSN MUI. As it is known that fatwa of DSN
MUI is ideological foundation in which transaction policies carried out are not contrary to the
Islamic principles. DSN-MUI has issued a Fatwa DSN NO: 116/DSN-MUI/IX/2017 concerning
Islamic electronic money, but it is still limited to the technical arrangements of financial
products. It has not loaded the digital-based risk management. Thus, it is necessary to have Fatwa
from DSN MUI related to the general guidelines of Islamic-based risk management and specific
provisions on the risks of digital financial products. This fatwa is needed in order to be the
fortress in maintaining a comprehensive Islamic financial ecosystem.
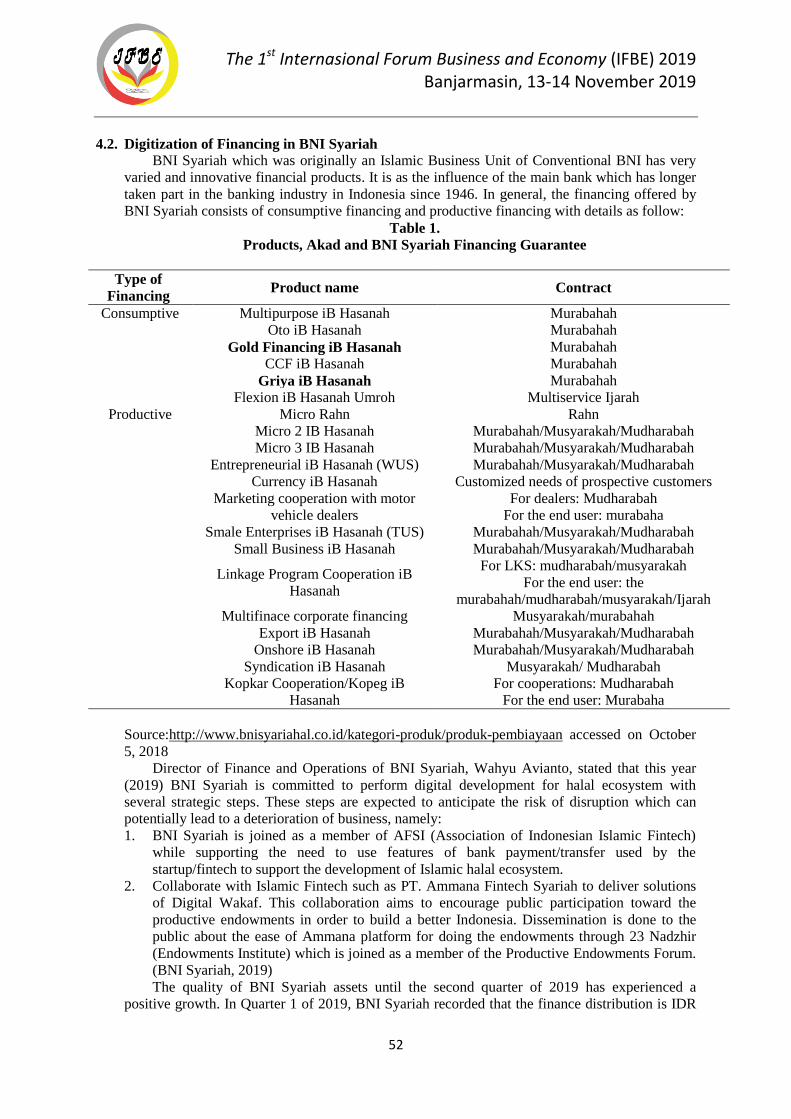
The 1st Internasional Forum Business and Economy (IFBE) 2019 Banjarmasin, 13-14 November 2019
52
4.2. Digitization of Financing in BNI Syariah BNI Syariah which was originally an Islamic Business Unit of Conventional BNI has very
varied and innovative financial products. It is as the influence of the main bank which has longer
taken part in the banking industry in Indonesia since 1946. In general, the financing offered by
BNI Syariah consists of consumptive financing and productive financing with details as follow:
Table 1.
Products, Akad and BNI Syariah Financing Guarantee
Type of
Financing Product name Contract
Consumptive Multipurpose iB Hasanah Murabahah
Oto iB Hasanah Murabahah
Gold Financing iB Hasanah Murabahah
CCF iB Hasanah Murabahah
Griya iB Hasanah Murabahah
Flexion iB Hasanah Umroh Multiservice Ijarah
Productive Micro Rahn Rahn
Micro 2 IB Hasanah Murabahah/Musyarakah/Mudharabah
Micro 3 IB Hasanah Murabahah/Musyarakah/Mudharabah
Entrepreneurial iB Hasanah (WUS) Murabahah/Musyarakah/Mudharabah
Currency iB Hasanah Customized needs of prospective customers
Marketing cooperation with motor
vehicle dealers
For dealers: Mudharabah
For the end user: murabaha
Smale Enterprises iB Hasanah (TUS) Murabahah/Musyarakah/Mudharabah
Small Business iB Hasanah Murabahah/Musyarakah/Mudharabah
Linkage Program Cooperation iB
Hasanah
For LKS: mudharabah/musyarakah
For the end user: the
murabahah/mudharabah/musyarakah/Ijarah
Multifinace corporate financing Musyarakah/murabahah
Export iB Hasanah Murabahah/Musyarakah/Mudharabah
Onshore iB Hasanah Murabahah/Musyarakah/Mudharabah
Syndication iB Hasanah Musyarakah/ Mudharabah
Kopkar Cooperation/Kopeg iB
Hasanah
For cooperations: Mudharabah
For the end user: Murabaha
Source:http://www.bnisyariahal.co.id/kategori-produk/produk-pembiayaan accessed on October
5, 2018
Director of Finance and Operations of BNI Syariah, Wahyu Avianto, stated that this year
(2019) BNI Syariah is committed to perform digital development for halal ecosystem with
several strategic steps. These steps are expected to anticipate the risk of disruption which can
potentially lead to a deterioration of business, namely:
1. BNI Syariah is joined as a member of AFSI (Association of Indonesian Islamic Fintech)
while supporting the need to use features of bank payment/transfer used by the
startup/fintech to support the development of Islamic halal ecosystem.
2. Collaborate with Islamic Fintech such as PT. Ammana Fintech Syariah to deliver solutions
of Digital Wakaf. This collaboration aims to encourage public participation toward the
productive endowments in order to build a better Indonesia. Dissemination is done to the
public about the ease of Ammana platform for doing the endowments through 23 Nadzhir
(Endowments Institute) which is joined as a member of the Productive Endowments Forum.
(BNI Syariah, 2019)
The quality of BNI Syariah assets until the second quarter of 2019 has experienced a
positive growth. In Quarter 1 of 2019, BNI Syariah recorded that the finance distribution is IDR
The 1st Internasional Forum Business and Economy (IFBE) 2019 Banjarmasin, 13-14 November 2019
53
29,4 trillion or has increased 23,9% compared to the same period in 2018 with IDR 23,7 trillion.
The increase reaches double digits in the realization of the non performing financing (NPF) gross
maintained in 2,9% or decreased from the same period in 2018 of 3,18%. The dominating
financial sector is commercial financing, followed by microfinance, SME, consumer and hasanah
card until March 2019 (Laba Bersih BNI Syariah Triwulan 1 2019 Naik 43,26% yoy, n.d.).
However, this is still a positive performance. In the second quarter, BNI Syariah recorded assets
amounting IDR 42,49 trillion, growing for 12,50% and the net income is IDR 315,27 billion,
growing for 55,32%. This is, according to the Director of BNI Syariah, Abdullah Firman
Wibowo, backed by a good financing expansion and optimal ratio of cheap funds. A commitment
to maintain the quality of financing is indicated by the ratio of Non Performing Financing (NPF)
of BNI Syariah until June 2019 amounted to 3,03 percent while maintaining the adequate level of
financing provisioning with Coverage Ratio at 91,39% (BNI Syariah Bukukan Kinerja Positif di
Triwulan II 2019, Laba Bersih Tumbuh 55,32%, n.d.).
Credit risk management applied in BNI Syariah is preceded by screening in the way of
customer feasibility analysis before financing was provided. It consists of an analysis toward the
capacity of potential recipients of financing individually (character) or based on the revenue and
its business (capacity, capital, condition), as well as the assessment of the collateral (if it’s
necessary, although basically guarantee/collateral is only as a complement to the financing
agreement). At this stage, BNI Syariah uses the application EFO (Electronic Financing
Origination) via intranet LAN connected throughout all BNI Syariah branch offices which is
accessible only internally for the manager of finance filing. EFO can know historical data of
customer transactions connected with Financial Information Services System (FISS) managed by
the FSA.
The feasibility assessment for financing receiver carried out by BNI Syariah is in
accordance with the mandate of Article 23 Section (1) of the Law concerning Islamic Banking.
In this mandate, Islamic Banks should have feasibility analysis of funds distribution prior to
provide the financing until they have the confidence in willingness and ability of potential
customers receiving the facility to repay all obligations on time. The data of debtors may be
requested to the FSA through FISS in accordance with the provision of POJK No.
18/POJK.03/2017 and SEOJK No. 50/SEOJK.03/2017 Concerning Reporting and Requesting
Debtor Information Through Financial Information Services System. In Article 15 Paragraph 4
POJK No. 18/POJK.03/2017, it is regulated that debtors information can be requested to the FSA
by online through FISS. The information should include the debtor’s identity; the owners and the
managers for the debtor of an enterprise; the facilities of funds provision received by the debtor;
collateral; guarantors; quality of the funds provision facilities; and other information (Article 14
Section (2)). The requests for debtors information should be in order to support the smooth
process of financing, implement risk management and/or identify the quality of the debtor to
fulfill the provisions of the FSA or other authorities.
Financing application process is still done by offline. It’s not yet available online services
like Feer to Feer Lending which is done by fintech industry. It is done because Islamic banks are
bound by the principle of prudence (prudential banking) which insists on the fulfillment of the 5
Cs principle, they are character, capacity, capital, condition, and collateral. Thus, by direct
meeting, Islamic banks will be convinced to provide financing to the customers (Interview with
Andri Saputra (BNI Syariah Branch Sales Officer in Banjarmasin) and Ahmad Syarifuddin
(Sales Asisstant of BNI Syariah Branch in Palangkaraya) on October 17, 2019).
Once financing is granted, risk mitigation is still being conducted in BNI Syariah through
ICONS (Integrated and Centralized Online System) application using Intranet LAN for checking
funds transactions and debt transactions of the customer. Customers can open an account by
online via "e-form hasanah online" in https://bro.bnisyariah.co.id/home as one of requirements of
the financing. Credit installment payments can be made by cash deposit through ATM or teller or
by being debited through customer account, and digital payments can be made via mobile
banking, ATM transfer, and internet banking. According to Syarifuddin, so far, the use of
The 1st Internasional Forum Business and Economy (IFBE) 2019 Banjarmasin, 13-14 November 2019
54
financing digitization in BNI Syariah run very smoothly and there is no significant obstacle, even
he stated that it gets very easier to manage financial risk.
Based on the description above, it can be concluded that BNI Syariah has used digital-based
financing system in order to mitigate the risks of financing; so that, it can significantly reduce the
NPF, and it keeps the quality of positive assets in the current position as well.
CONCLUSION Disruption era demands Islamic banking institutions, one of them is BNI Syariah, to
inclusively perform the digitization of financing which needs to be reinforced by the FSA
regulations regarding Syariah-based risk management leaning on fatwa from DSN-MUI. In this
case, fatwa from DSN-MUI needs to be formulated regarding general guidelines of digital-based
risk management within the frame of Syariah, especially with regarding to credit scoring. The
credit scoring needs to be applied through the product of the FSA regulations. The synergy
between the FSA, BI, and DSN-MUI needs to be done and maintained by involving other
stakeholders such as the National Committee for Islamic Finance (KNKS) as a board in charge to
actualize MEKSI 2019-2024, and also the organizations of Islamic economy drivers such as the
Islamic Economy Community (MES), the Indonesian Association of Islamic Economist (IAEI),
the Indonesian Association of Islamic Banks (Asbisindo), and any other Islamic economy
movement organizations for the advancement of inclusive Islamic banking in Indonesia.
REFERENCES
Chang, S. E. (2018). REGULATION OF CROWDFUNDING IN INDONESIA. Law Review, 0(1),
41–71.
Christensen, C. M. (2006). The Ongoing Process of Building a Theory of Disruption. Journal of
Product Innovation Management, 23(1), 39–55. https://doi.org/10.1111/j.1540-
5885.2005.00180.x
Dampak Disrupsi Teknologi. (n.d.). Retrieved October 16, 2019, from
http://neraca.co.id/article/109363/dampak-disrupsi-teknologi
Dicuonzo, G., Galeone, G., Zappimbulso, E., & Dell’Atti, V. (2019). Risk Management 4.0: The Role
of Big Data Analytics in the Bank Sector. International Journal of Economics and Financial
Issues, 9(6), 40–47.
Dz, A. S. (2018). Inklusi Keuangan Perbankan Syariah Berbasis Digital-Banking: Optimalisasi dan
Tantangan. Al-Amwal : Jurnal Ekonomi Dan Perbankan Syari’ah, 10(1), 63–80.
https://doi.org/10.24235/amwal.v10i1.2813
Ferrarini, G. (2017). Regulating FinTech: Crowdfunding and Beyond. European Economy, 2017.2,
22.
Financial Technology—Bank Sentral Republik Indonesia. (n.d.). Retrieved October 18, 2019, from
https://www.bi.go.id/id/edukasi-perlindungan-konsumen/edukasi/produk-dan-jasa-
sp/fintech/Pages/default.aspx
Gunawan. (2019). Mencari Peluang Revolusi Industri 4.0 untuk Melalui Era Disrupsi 4.0. Queency
Publisher.
Handayani, D. L. (2016). Perbandingan Regulasi Manajemen Risiko pada Perbankan Syariah di
Indonesia dan Malaysia [Masters, UIN Sunan Kalijaga Yogyakarta]. http://digilib.uin-
suka.ac.id/20724/
The 1st Internasional Forum Business and Economy (IFBE) 2019 Banjarmasin, 13-14 November 2019
55
Hariyana, T. D. (2019). Legal protection for Provider in Peer to Peer Lending: An Example from
Indonesian Regulation. Indonesian Journal of Law and Economics Review, 2(2).
https://doi.org/10.21070/ijler.v2i2.17
Hendriyani, C., & Raharja, S. un J. (2019). STRATEGI AGILITAS BISNIS PEER-TO-PEER
LENDING STARTUP FINTECH DI ERA KEUANGAN DIGITAL DI INDONESIA.
AdBispreneur, 4(1), 19–25. https://doi.org/10.24198/adbispreneur.v4i1.20595
Hidayati, T.-, Syarifuddin, S., Pelu, I. E. A., Syaikhu, S., Hussain, M. A., Nor, M. Z. M., & Azhar, A.
(2018). MEKANISME PENGGUNAAN JAMINAN KEBENDAAN (RAHN TASJILY)
DALAM PEMBIAYAN BANK SYARIAH DI INDONESIA DAN MALAYSIA. Nurani:
Jurnal Kajian Syari’ah Dan Masyarakat, 18(1), 163–182.
https://doi.org/10.19109/nurani.v18i1.2458
Ikatan Bankir Indonesia. (2018). Manajemen Risiko 2, Mengidentifikasi Risiko Likuiditas, Reputasi,
Hukum, Kepatuhan, dan Strategik Bank. PT. Gramedia Pustaka Utama.
Indira, S., & Ertambang Nahartyo, D. (2018). BNI DIGITAL BANKING: SOLUSI TRANSFORMASI
PERBANKAN BERBASIS DIGITAL.
http://etd.repository.ugm.ac.id/home/detail_pencarian/158222
Indonesia’s Fintech Lending: Driving Economic Growth through Financial Inclusion—Executive
Summary. (2019). 10.
Ini Dampak Disrupsi Teknologi ke Industri Perbankan—Bisnis Tempo.co. (n.d.). Retrieved January
22, 2020, from https://bisnis.tempo.co/read/1201419/ini-dampak-disrupsi-teknologi-ke-
industri-perbankan
Iqbal, M. (2017). Perbandingan Pengelolaan Risiko Kredit Perbankan Syariah dan Perbankan
Konvensional. Jurnal Keuangan Dan Perbankan, 21(3), 481–497.
https://doi.org/10.26905/jkdp.v21i3.1318
Karim, A. (2013). Bank Islam: Analisis fiqih dan keuangan. RajaGrafindo Persada.
Kementerian Perencanaan Pembangunan Nasional/, & Badan Perencanaan Pembangunan Nasional.
(2018). Masterplan Ekonomi Syariah Indonesia 2019-2024 (Cetakan Pertama). Kementerian
Perencanaan Pembangunan Nasional/ Badan Perencanaan Pembangunan Nasional.
Kholis, N. (2018). PERBANKAN DALAM ERA BARU DIGITAL. Economicus, 9(1), 80–88.
Khusumawardani, Y., Statiswaty, S., & Ramadhan, R. (2016). SISTEM PENDUKUNG
KEPUTUSAN PENILAIAN CALON DEBITUR PENERIMA KREDIT MODAL KERJA
BANK SULTRA MENGGUNAKAN CREDIT SCORING. SemanTIK, 2(2).
Laba Bersih BNI Syariah Triwulan 1 2019 Naik 43,26% yoy. (n.d.). BNI Syariah. Retrieved October
22, 2019, from http://www.bnisyariah.co.id/id-
id/beranda/berita/siaranpers/ArticleID/1719/Laba Bersih BNI Syariah Triwulan 1 2019 Naik
Martowadjo, A. (2016, Desember). Task Force Digital Banking. Majalah PROBANK, 125 of XXXIII.
Megargel, A., Shankararaman, V., & Ping-Ching, T. F. (2018). SOA maturity influence on digital
banking transformation. IDRBT Journal, 02, 1–27.
Mlanga, S. (2019). Implications of Financial Technology for Professionals in Financial Services in
Nigeria. 172, 8.
The 1st Internasional Forum Business and Economy (IFBE) 2019 Banjarmasin, 13-14 November 2019
56
Muchlis, R. (2018). Analisis SWOT Financial Technology (Fintech) Pembiayaan Perbankan Syariah
Di Indonesia (Studi Kasus 4 Bank Syariah Di Kota Medan). AT-TAWASSUTH: Jurnal
Ekonomi Islam, 1(1), 335–357.
Nurfalah, I., & Rusydiana, A. S. (2019). Digitalisasi Keuangan Syariah Menuju Keuangan Inklusif:
Kerangka Maqashid Syariah. Ekspansi: Jurnal Ekonomi, Keuangan, Perbankan dan
Akuntansi, 11(1), 55. https://doi.org/10.35313/ekspansi.v11i1.1205
(OJK), O. J. K. (2017). Pedoman Penyusunan Laporan Debitur Melalui Sistem layanan Informasi
Keuangan. Otoritas Jasa Keuangan.
https://www.ojk.go.id/id/kanal/perbankan/Documents/Pages/Sistem-Layanan-Informasi-
Keuangan/PEDOMAN%20PENYUSUNAN%20LAPORAN%20DEBITUR%20V6.1-
20170119.pdf
Prawirasasra, K. P. (2018). Financial technology in Indonesia: Disruptive or collaborative? Reports on
Economics and Finance, 4(2), 83–90. https://doi.org/10.12988/ref.2018.818
Program Keuangan Inklusif—Bank Sentral Republik Indonesia. (n.d.). Retrieved January 22, 2020,
from https://www.bi.go.id/id/perbankan/keuanganinklusif/program/Contents/default.aspx
Ramlan, S. R., Moniharapon, S., & Tulung, J. E. (2018). ANALISIS PERBANDINGAN RISIKO
KREDIT ANTARA BANK SYARIAH DAN BANK KONVENSIONAL. Jurnal EMBA:
Jurnal Riset Ekonomi, Manajemen, Bisnis dan Akuntansi, 6(1).
https://ejournal.unsrat.ac.id/index.php/emba/article/view/19019
Rapitasari, D. (2016). Digital Marketing Berbasis Aplikasi sebagai Srategi Meningkatkan Kepuasan
Pelanggan. Cakrawala, 10(2), 107–112. https://doi.org/10.32781/cakrawala.v10i2.36
Syatiri, A., & Hamdaini, Y. (2017). Risiko Kredit, Stabilitas, dan Kebijakan Pembiayaan Bank
Syariah di Indonesia. JURNAL MANAJEMEN DAN BISNIS SRIWIJAYA, 15(3), 146–155.
https://doi.org/10.29259/jmbs.v15i3.5715
Tentang Syariah. (n.d.). Retrieved October 22, 2019, from
https://www.ojk.go.id/id/kanal/syariah/tentang-syariah/Pages/Perbankan-Syariah.aspx
Yu, J.-M., & Cho, S.-B. (2018). Sustainable co-training of mixture-of-experts for credit scoring of
borrowers in social lending. IDRBT Journal, 02, 44–63.
Yundi, N. F., & Sudarsono, H. (2018). Pengaruh Kinerja Keuangan terhadap Return on Asset (ROA)
Bank Syariah di Indonesia. Al-Amwal : Jurnal Ekonomi Dan Perbankan Syari’ah, 10(1), 18–
31. https://doi.org/10.24235/amwal.v10i1.2759
Yunus, U. (2019). A Comparison Peer to Peer Lending Platforms in Singapore and Indonesia. Journal
of Physics: Conference Series, 1235, 012008. https://doi.org/10.1088/1742-
6596/1235/1/012008
The 1st Internasional Forum Business and Economy (IFBE) 2019 Banjarmasin, 13-14 November 2019
57
THE SUSTAINABLE ECONOMIC DEVELOPMENT BASED ON AQUAPONIC
TECHNOLOGY IN PEAT AREA WITH ACIDIC WATER IN JEJANGKIT TIMUR
Agus Pebrianto, Ahmad Rizani, Adi Pratomo
Politeknik Negeri Banjarmasin, Indonesia
Abstract: Jejangkit village in South Kalimantan is a peat land area which is mostly used for
agriculture. The community in the Jejangkit village has a desire to cultivating fish such as catfish. The
problem faced by the community in the local area is the area is very prone to flooding when it rains.
Another problem is the level of water acidity in the area. In this condition, the community feel
difficult to cultivate the fish.. Therefore, the solution offered to solve this problem is the use of an
aquaponics system with a combination of water filtering for the normalization of water PH; so that, in
addition the fish cultivation can run properly the agriculture activities can be run even though the area
is flooding. The application of aquaponics technology with a combination of water filtering,
aquaculture and plantations can be realized which can increase income for residents who want to
develop independent businesses both managed by the community and by individuals. Aquaponic
system, which is a combination of hydroponics and aquaculture systems that are mutually symbiotic
(Rakocy et al., 2006, Diver, 2006). Plantations using the aquaponics system can be done on both
narrow and wide land, plants do not need to be watered and fertilized, pool water does not need to be
replaced, environmentally friendly and can be done by all members of community. Based on these
advantages, the aquaponics system is a suitable solution for plantations and fisheries in swamp and
peat areas.
Keywords: aquaponic, peat land, acidic water
BACKGROUND
In line with the government program to accelerate the rural economy which focuses on
handling rural infrastructure, one solution is provided. This solution aims to strengthen through the
application of science and technology, policy models, and research-based social engineering. The
socio-economic development of the village will be faster with the construction of infrastructure and
opening access. Downstreaming of multidisciplinary research results will accelerate the quality and
quantity of village progress in all fields (social, economic, legal, health, culture, education,
agriculture, food security, maritime, new and renewable energy, etc.) without leaving superior value
or distinctive features owned by the village.
The Barito Kuala Regency area is flanked by two large rivers namely the Barito River and the
Kapuas River. It greatly influences the existing water system in this regency. This hydrological
situation is strongly influenced by rainfall, wherein the rainy season at high tide the Barito river can
flood most of this area and cause the soil surface to be flooded continuously. Tides also affect the
existing water system, which always moves up and down following the tidal fluctuations in the Barito
River and the Kapuas River. This tidal movement occurs twice in 24 hours and every day is 50
minutes late according to the circulation of the month. The difference in the height of the water level
at low tides can reach 2-3 M. This tidal motion is used by farmers to dig a trenches in the area which
will be used as rice fields, in general. This area is covered by swampy plants in coastal areas of
mangrove forests (Mangroves), and a few sea firs found. In this area, it is also found several species
of fauna which live there, including some types of land fish such as cork fish, papuyu, sepat, baung,
catfish, flat and others. The fish live in rivers and channels of swamps and rice fields.
Jejangkit District is included into the Barito Kuala area. The average rice planted is once a year,
where the harvest period is 8 months. The land in this area is mostly peat and swampland; so that, this
area is only suitable for rice cultivation. Based on the existing land contour, it is very rare for people
to garden because there are often river tides. When the tidal river water occurs, the flooding also
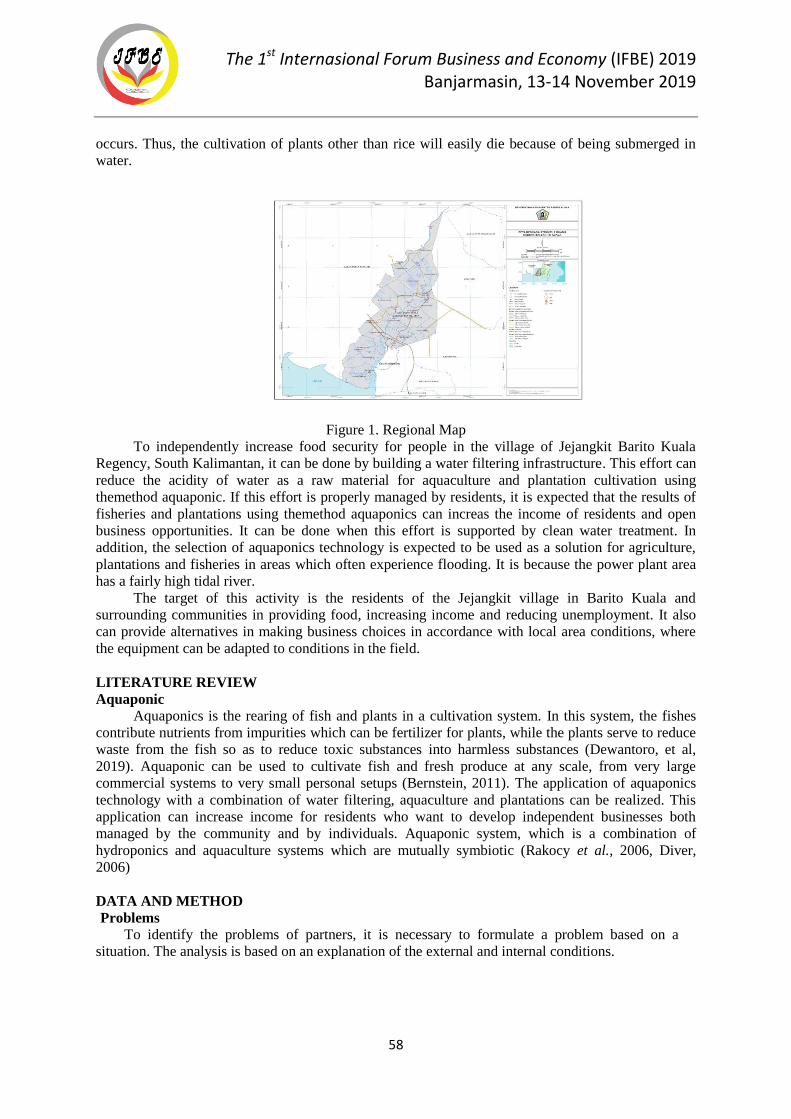
The 1st Internasional Forum Business and Economy (IFBE) 2019 Banjarmasin, 13-14 November 2019
58
occurs. Thus, the cultivation of plants other than rice will easily die because of being submerged in
water.
Figure 1. Regional Map
To independently increase food security for people in the village of Jejangkit Barito Kuala
Regency, South Kalimantan, it can be done by building a water filtering infrastructure. This effort can
reduce the acidity of water as a raw material for aquaculture and plantation cultivation using
themethod aquaponic. If this effort is properly managed by residents, it is expected that the results of
fisheries and plantations using themethod aquaponics can increas the income of residents and open
business opportunities. It can be done when this effort is supported by clean water treatment. In
addition, the selection of aquaponics technology is expected to be used as a solution for agriculture,
plantations and fisheries in areas which often experience flooding. It is because the power plant area
has a fairly high tidal river.
The target of this activity is the residents of the Jejangkit village in Barito Kuala and
surrounding communities in providing food, increasing income and reducing unemployment. It also
can provide alternatives in making business choices in accordance with local area conditions, where
the equipment can be adapted to conditions in the field.
LITERATURE REVIEW
Aquaponic
Aquaponics is the rearing of fish and plants in a cultivation system. In this system, the fishes
contribute nutrients from impurities which can be fertilizer for plants, while the plants serve to reduce
waste from the fish so as to reduce toxic substances into harmless substances (Dewantoro, et al,
2019). Aquaponic can be used to cultivate fish and fresh produce at any scale, from very large
commercial systems to very small personal setups (Bernstein, 2011). The application of aquaponics
technology with a combination of water filtering, aquaculture and plantations can be realized. This
application can increase income for residents who want to develop independent businesses both
managed by the community and by individuals. Aquaponic system, which is a combination of
hydroponics and aquaculture systems which are mutually symbiotic (Rakocy et al., 2006, Diver,
2006)
DATA AND METHOD
Problems
To identify the problems of partners, it is necessary to formulate a problem based on a
situation. The analysis is based on an explanation of the external and internal conditions.
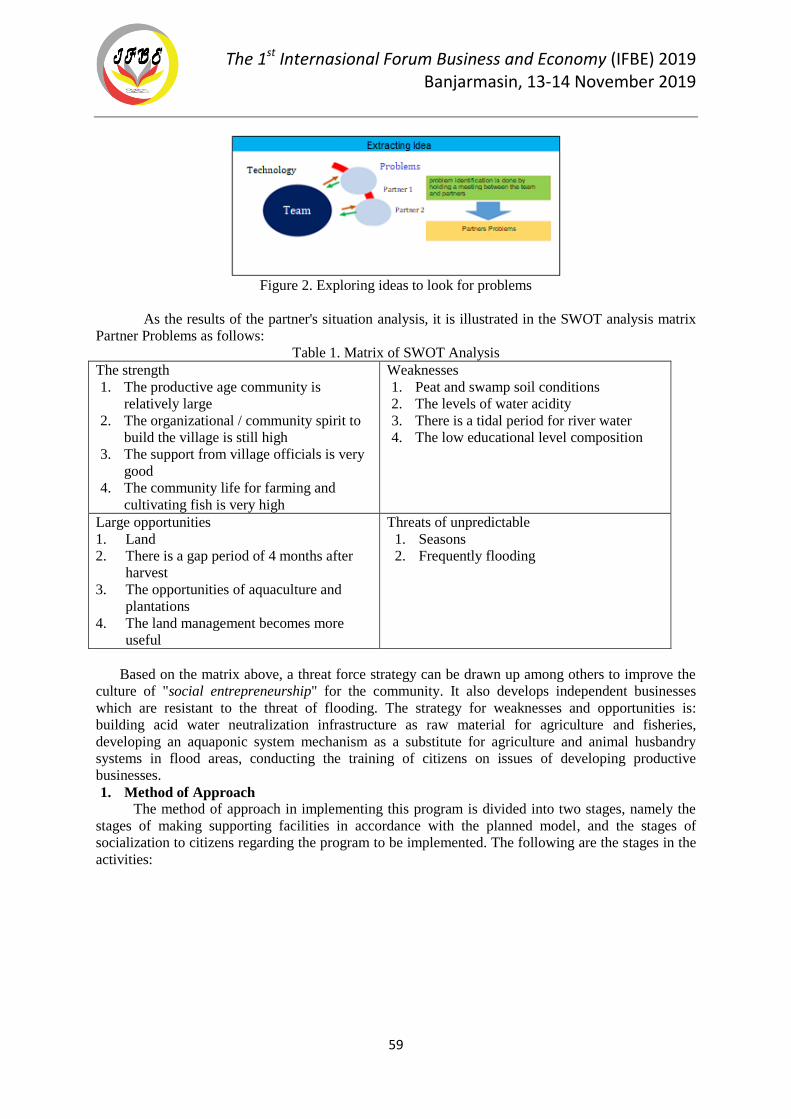
The 1st Internasional Forum Business and Economy (IFBE) 2019 Banjarmasin, 13-14 November 2019
59
Figure 2. Exploring ideas to look for problems
As the results of the partner's situation analysis, it is illustrated in the SWOT analysis matrix
Partner Problems as follows:
Table 1. Matrix of SWOT Analysis
The strength
1. The productive age community is
relatively large
2. The organizational / community spirit to
build the village is still high
3. The support from village officials is very
good
4. The community life for farming and
cultivating fish is very high
Weaknesses
1. Peat and swamp soil conditions
2. The levels of water acidity
3. There is a tidal period for river water
4. The low educational level composition
Large opportunities
1. Land
2. There is a gap period of 4 months after
harvest
3. The opportunities of aquaculture and
plantations
4. The land management becomes more
useful
Threats of unpredictable
1. Seasons
2. Frequently flooding
Based on the matrix above, a threat force strategy can be drawn up among others to improve the
culture of "social entrepreneurship" for the community. It also develops independent businesses
which are resistant to the threat of flooding. The strategy for weaknesses and opportunities is:
building acid water neutralization infrastructure as raw material for agriculture and fisheries,
developing an aquaponic system mechanism as a substitute for agriculture and animal husbandry
systems in flood areas, conducting the training of citizens on issues of developing productive
businesses.
1. Method of Approach
The method of approach in implementing this program is divided into two stages, namely the
stages of making supporting facilities in accordance with the planned model, and the stages of
socialization to citizens regarding the program to be implemented. The following are the stages in the
activities:
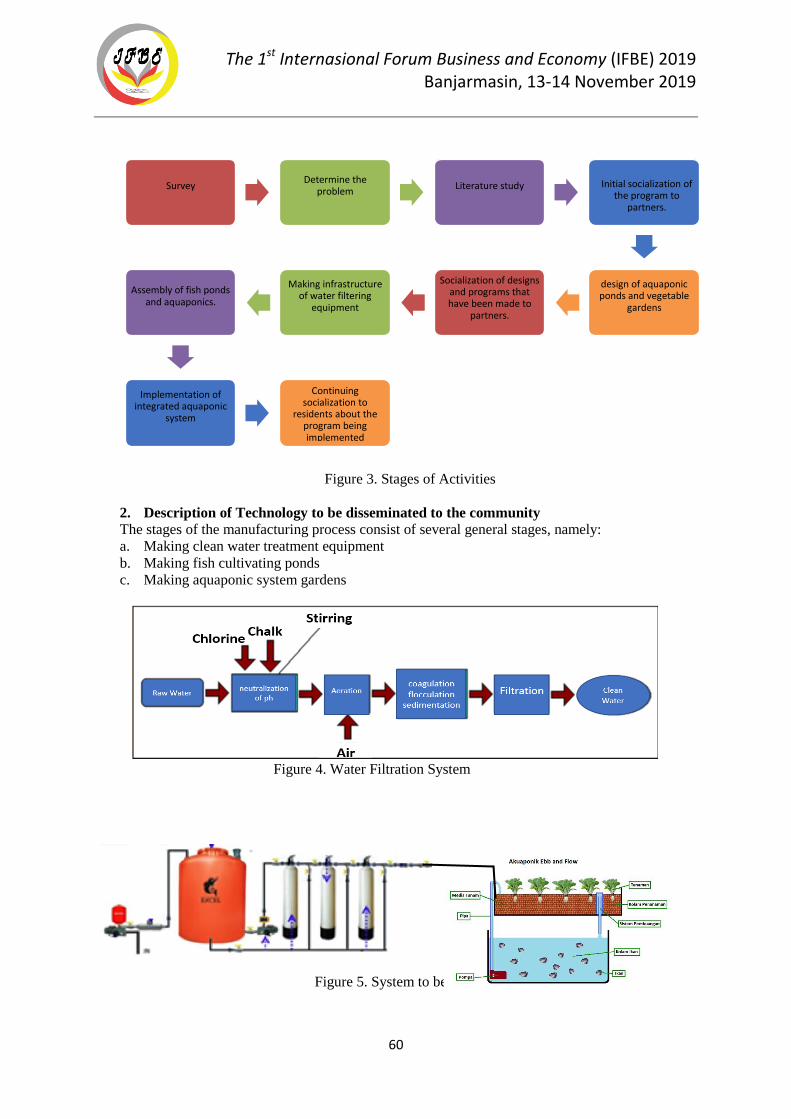
The 1st Internasional Forum Business and Economy (IFBE) 2019 Banjarmasin, 13-14 November 2019
60
Figure 3. Stages of Activities
2. Description of Technology to be disseminated to the community
The stages of the manufacturing process consist of several general stages, namely:
a. Making clean water treatment equipment
b. Making fish cultivating ponds
c. Making aquaponic system gardens
Figure 4. Water Filtration System
Figure 5. System to be built
Survey Determine the
problem Literature study
Initial socialization of the program to
partners.
design of aquaponic ponds and vegetable
gardens
Socialization of designs and programs that have been made to
partners.
Making infrastructure of water filtering
equipment Assembly of fish ponds
and aquaponics.
Implementation of
integrated aquaponic system
Continuing
socialization to residents about the
program being implemented
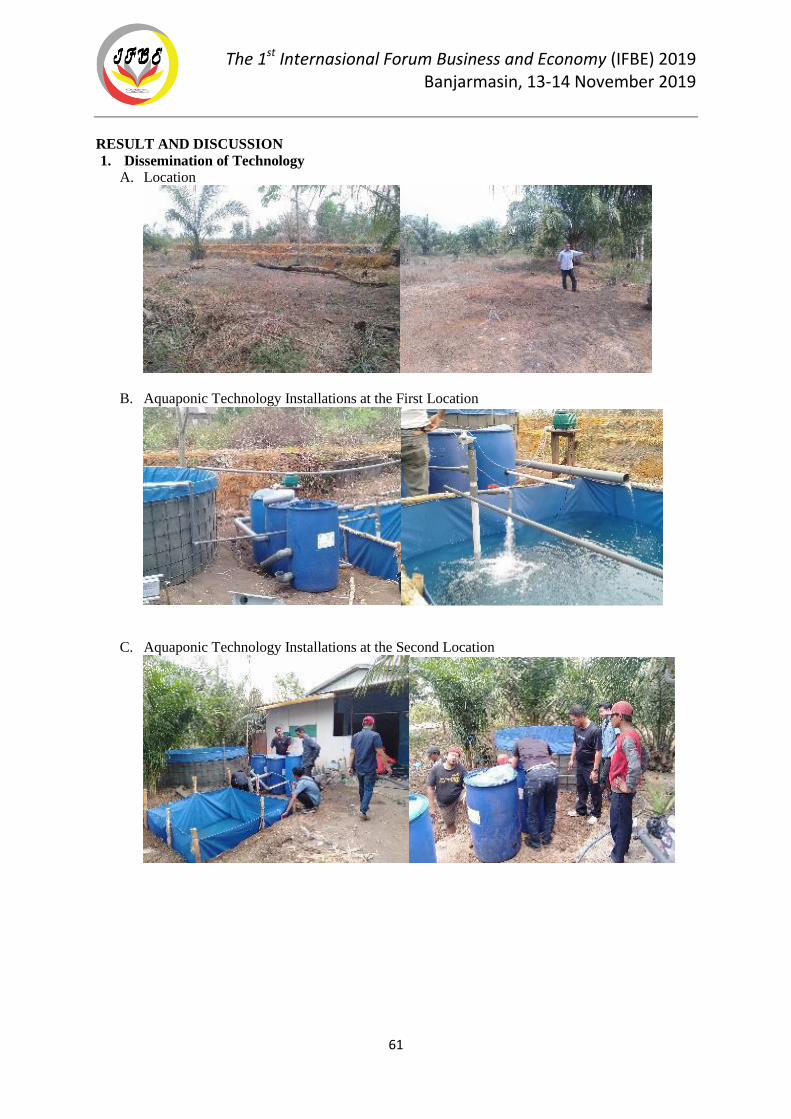
The 1st Internasional Forum Business and Economy (IFBE) 2019 Banjarmasin, 13-14 November 2019
61
RESULT AND DISCUSSION
1. Dissemination of Technology
A. Location
B. Aquaponic Technology Installations at the First Location
C. Aquaponic Technology Installations at the Second Location
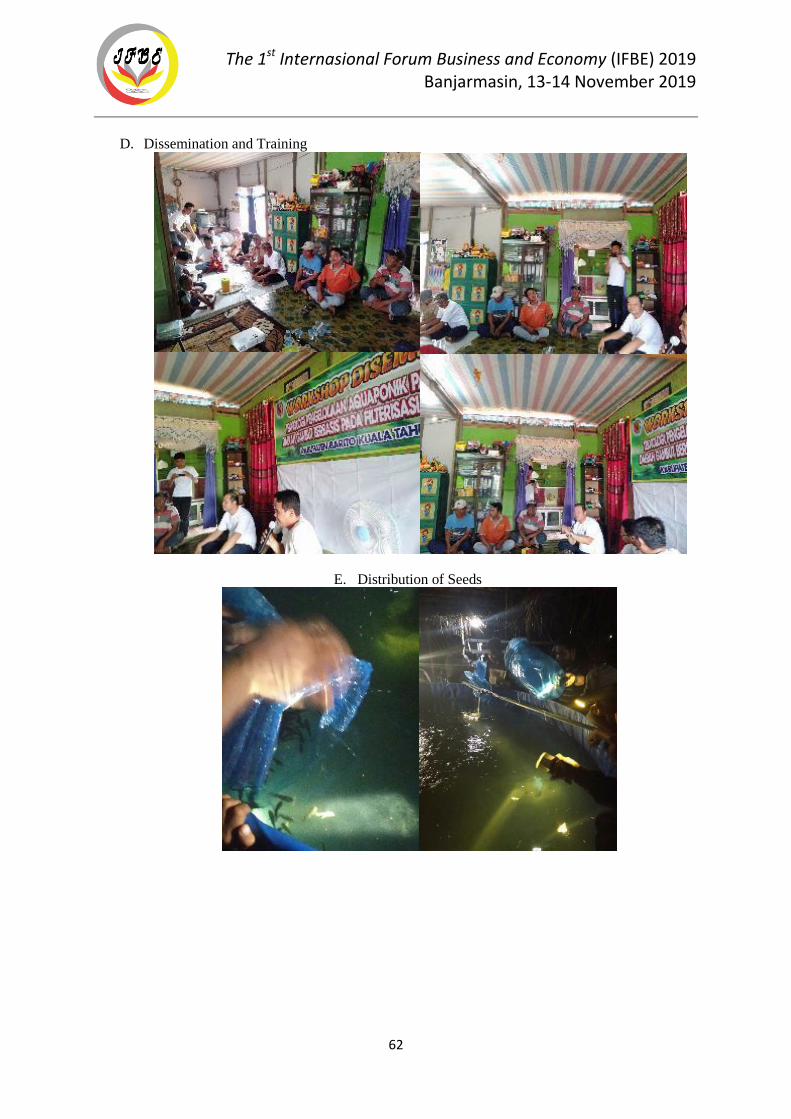
The 1st Internasional Forum Business and Economy (IFBE) 2019 Banjarmasin, 13-14 November 2019
62
D. Dissemination and Training
E. Distribution of Seeds
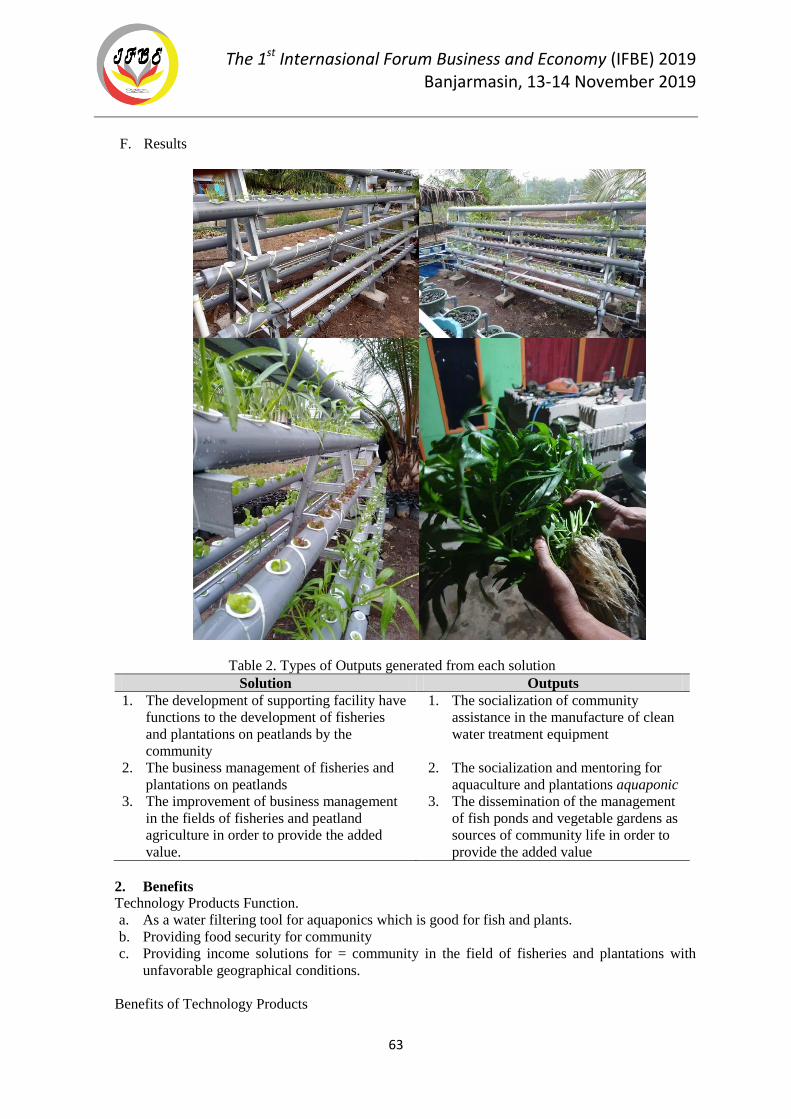
The 1st Internasional Forum Business and Economy (IFBE) 2019 Banjarmasin, 13-14 November 2019
63
F. Results
Table 2. Types of Outputs generated from each solution
Solution Outputs
1. The development of supporting facility have
functions to the development of fisheries
and plantations on peatlands by the
community
1. The socialization of community
assistance in the manufacture of clean
water treatment equipment
2. The business management of fisheries and
plantations on peatlands
2. The socialization and mentoring for
aquaculture and plantations aquaponic
3. The improvement of business management
in the fields of fisheries and peatland
agriculture in order to provide the added
value.
3. The dissemination of the management
of fish ponds and vegetable gardens as
sources of community life in order to
provide the added value
2. Benefits
Technology Products Function.
a. As a water filtering tool for aquaponics which is good for fish and plants.
b. Providing food security for community
c. Providing income solutions for = community in the field of fisheries and plantations with
unfavorable geographical conditions.
Benefits of Technology Products
The 1st Internasional Forum Business and Economy (IFBE) 2019 Banjarmasin, 13-14 November 2019
64
a. Teaching the community to develop fisheries and plantation technology which can be applied
to unsupportive geographical conditions.
b. As the application of science and technology which can be felt by the community directly.
c. Facilitating the community to make technology choices in accordance with local water source
conditions. It is in the form of ponds and aquaponic gardens which can be used as a source of
income for the local community. The equipment can be adapted to conditions in the field.
3. Economic and Social Impact.
a. Enhancing the culture of "Social entrepreneurship" for the community through the
development of BUMDES by managing ponds and aquaponic gardens.
b. As a means of initial venture capital for the development of economic activities related to
fisheries and plantations.
c. Improving community welfare through a healthy lifestyle by utilizing hygienic fisheries and
plantation products.
4. Contributions to Other Sectors
a. For the livestock sector, it can help improve the quality and quantity of livestock products by
helping supply animal feed from unused crops.
b. For the public health sector, it can help improve health by consuming hygienic fisheries and
plantation products.
5. Constraints / Obstacles
The obstacles faced in the implementation of Dissemination activities are:
a. The low level of community education; therefore, the intensive training is needed.
b. The geographical position of the village with the level of rising tides can cause flooding in
the village area, as well as water drought in certain seasons.
6. Follow-up
The follow-up which can be done after the program activities of applying appropriate technology
to the community in the Jejangkit village, including:
a. Conducting an evaluation of the final results of the activity,
b. Utilizing the number of ponds and aquaponic gardens to realize the theme of the Papuyu fish
village.
c. Mapping the area in a tractor or surrounding village which requires the application of similar
technology.
d. Mapping the potential opportunities for activities or businesses which can be applied in the
area of Jejangkit Village, South Kalimantan.
CONCLUSION
Based on the results of community service activities in Jejangkit village of South Kalimantan, it
can be concluded that Jejangkit is a village which has difficulties in obtaining clean water. The water
in the Jejangkit village has a high odor and acidity. In certain seasons, Jejangkit village experiences
drought and floods; thus, it becomes an obstacle in carrying out fisheries and plantation activities.
Through the application of aquaponics technology, the community in the village of Jejangkit has
alternative technology solutions in the field of fisheries and plantations. The results of these activities
can support government programs as well as the Banjarmasin State Polytechnic strategic plan
program. This program prepares the technology which can help the community in the field of food
security.
REFERENCES
Bernstein, S. (2011). Aquaponic gardening: a step-by-step guide to raising vegetables and fish
together. New society publishers.
The 1st Internasional Forum Business and Economy (IFBE) 2019 Banjarmasin, 13-14 November 2019
65
Dewantoro, E., & Prasetio, E. (2019). Penerapan Budidaya Ikan Secara Akuaponik Dalam Bak Terpal
di lahan Pasang Surut.
Diver, S., & Rinehart, L. (2006). Aquaponics-Integration of hydroponics with aquaculture. Attra.
Graber, A., & Junge, R. (2009). Aquaponic Systems: Nutrient recycling from fish wastewater by
vegetable production. Desalination, 246(1-3), 147-156.
Kloas, W., Groß, R., Baganz, D., Graupner, J., Monsees, H., Schmidt, U., ... & Wuertz, S. (2015). A
new concept for aquaponic systems to improve sustainability, increase productivity, and reduce
environmental impacts. Aquaculture Environment Interactions, 7(2), 179-192.
Rakocy, J. E., Masser, M. P., & Losordo, T. M. (2006). Recirculating aquaculture tank production
systems: aquaponics—integrating fish and plant culture. Southern Regional Aquaculture Center,
publication no. 454.
Sagita, A., Wicaksana, S. N., Primasaputri, N. R., Prakoso, K., Afifah, F. N., Nugraha, A., & Hastuti,
D. S. (2014). Pengembangan Teknologi Akuakultur Biofilter-Akuaponik (Integrating Fish And
Plant Culture) sebagai Upaya Mewujudkan Rumah Tangga Tahan Pangan. Prosiding Hasil-Hasil
Penelitian dan Kelautan tahun ke IV. Universitas Diponegoro.
Tyson, R. V., Treadwell, D. D., & Simonne, E. H. (2011). Opportunities and challenges to
sustainability in aquaponic systems. HortTechnology, 21(1), 6-13.
Pebrianto, A., Rizani, A., Haryanto, R., & Pratomo, A. (2017, December). MODEL PENYULINGAN
AIR BERSIH DI DESA RANGGA SURYA KECAMATAN BELAWANG KABUPATEN
BARITO KUALA. In Proceeding of National Conference on Asbis (Vol. 2, No. 1, pp. 553-564).
Winda, A., & Fatimatuzzahroh, N. Pemberdayaan Masyarakat dalam Penerapan Teknologi
Aquaponik untuk Meningkatkan Kualitas Kesehatan Ibu, Anak, dan Balita di Kecamatan
Bangsalsari.
The 1st Internasional Forum Business and Economy (IFBE) 2019 Banjarmasin, 13-14 November 2019
66
INTER-REGIONAL ECONOMIC DEVELOPMENT IN KALIMANTAN
Wita Karina Ramlan, Saipudin, Rusmin Nuryadin
Faculty of Economics and Business of Lambung Mangkurat University, Banjarmasin Kalimantan
Selatan, Indonesia
Abstract: This study aims to determine the leading sectors, shifts in economic structure, regional
grouping based on growth structures, and the abundance paradox that exists in the Kalimantan
Region. This study uses secondary data in the form of: Gross Domestic Product, Gross Regional
Domestic Product, economic growth, population growth, income per capita, number of poor people
and HDI. The analysis tools used in this study are Location Quotient (LQ) analysis, Dynamic
Location Quotient (DLQ) analysis, Shift-Share analysis, and Klassen Typology analysis. The results
showed that from 17 business sectors from 2013 to 2017, the agriculture, forestry and fisheries
sectors; mining and quarrying sector; construction sector; transportation and warehousing sector;
government administration, defense and compulsory social security sectors; education service sector;
and the health service sector and social activities are the leading sectors in the Kalimantan Region,
both now and in the future. During the period 2013-2017 several regions in the Kalimantan Region
experienced a shift in economic structure. The area that is classified as advanced is North Kalimantan
Province, while the area that is classified as relatively underdeveloped is South Kalimantan Province.
Some regions indicated by the paradox of abundance are South Kalimantan and West Kalimantan.
Keywords: Location Quotient, Shift-Share, Tipology Klassen, and Abundance Paradoxes
BACKGROUND
Kalimantan Island is the largest island in Indonesia. This region has abundant resources,
especially natural resources which makes this region to be one of the country's biggest foreign
exchange earners. Its population has only 5.6% of the total population of Indonesia, but this region
has a significant contribution to the national GDP when compared to other regions, which is 9.3%
generated from natural resources in Kalimantan. But in terms of investment, the portion of
Kalimantan is only able to reach 0.6% of the total national investment, very much different from the
amount of investment embedded in Java which reaches 72.3% of the total national investment. This
indicates that Kalimantan is an economically undeveloped region because this region's income is more
brought to Java than to develop its own region (Sosilawati, 2017).
Kalimantan Island has five provinces which consist of West Kalimantan Province where this
province has abundant agricultural and plantation potential. Central Kalimantan Province, where the
area is dominated by forests up to 80%. South Kalimantan Province, which has various potential
sectors that can absorb a lot of labor, one of which is the agricultural sector. East Kalimantan
Province, where the economy of the region is supported by mining products such as oil, natural gas
and coal. The last province is North Kalimantan Province which was only formed in 2013 as a result
of the division of East Kalimantan Province which also has natural resource potential similar to East
Kalimantan Province. In terms of quantity within the scope of the Kalimantan Region, East
Kalimantan Province is the highest producer of GRDP. This value far exceeds the GDP than other
regions. The trend of the East Kalimantan Province's GRDP figure is relatively stagnant, even though
the increase or decrease is not too significant. The highest GDP of East Kalimantan Province occurred
in 2017, where from the previous year which was only around IDR 439.08 trillion in 2016, but in the
following year it increased to IDR 452.84 trillion. Among the 17 GRDP contributors sectors, the
mining and quarrying sector was the highest producer of GRDP values of up to Rp 232.66 trillion in
2013 and continued to decline until 2017 to Rp 215.21 trillion.
The previous research only focused in one region, such as districts, provinces, and even
countries. Although using the same analysis tools, this study conducted to find out how the regional
The 1st Internasional Forum Business and Economy (IFBE) 2019 Banjarmasin, 13-14 November 2019
67
economic development in one region in Indonesia, namely the island of Borneo. In contrast to
previous research only focused on research in one district area on the island of Sumatra, Maluku, and
other regions. This research will discuss and present how economic development among regions in
the Kalimantan Region during the period 2013-2017.
Formulation of the problem
The sectors are the base / superior sectors that exist in the Provinces in the Kalimantan Region.
During the period of 2013 to 2017, there was a shift in the economic structure of the provinces in the
Kalimantan Region. A description of regional group based on the structure of growth, and an
indication of the occurrence of abundance paradoxes in each region.
Research purposes
Based on the background and the formulation above, the purpose of this study is to identify
which sectors are superior or becoming the basis of the economy, the occurrence of a shift in the
economic structure, the grouping of regions based on growth structures and indications of a paradox
of abundance in the Kalimantan Region.
Benefits of research
The benefits of this research are thoughtful input to parties who have an interest in the matter of
regional economic developmen. Besides, as a reference for further research in a similar field, as well
as for the development of science and literature as well as experience for researchers.
LITERATURE REVIEW
Development Planning
Conyer & Hills (in Arsyad, 1999) defines development planning as a continuous process that
includes decisions or choices as an alternative to the use of resources to achieve certain goals in the
future.
Gross Regional Domestic Product
According to the Central Statistics Agency (2017) Gross Regional Domestic Product is the
gross value added of all economic activities in a region (Provincial and Regency / City level) or a
region within a certain period.
Location Quotient and Dynamic Location Quotient
According to Hood (in Tonang, 2013) Location Quotient (LQ) is an economic development
tool used to identify leading sectors in an area. This technique is a general approach and a first step in
understanding the leading sector or activity sector which is the engine driving the regional economy.
DLQ analysis according to Hidayat and Supriharjo (2014) is used to analyze the prospects in the
future regarding the state of the sector or sub-sectors in the future which are carried out in the form of
time series / trends.
Shift-Share
According to Nurhab (2019), a change in economic structure is a process of changing
traditional economic activities towards more modern economic activities. Therefore, to analyze
changes in the economic activities of a region used Shift-Share Analysis. Shift-Share Analysis is an
analysis that aims to analyze the process of economic growth in a region which is related to the
economy of the reference region. It is a larger area that can be regional or national in scope.
KlassenTypology
According to Sjafrizal (2008) Klassen Typology is an analytical tool used to determine the
grouping of regions (districts / cities or provinces) based on their growth structure. This analysis uses
the Klassen Matrix, in which 4 regional groupings are made based on growth rates and per capita
income as indicators.
Economic Growth and Regional Economic Growth
According to Boediono (1992) economic growth is a process of increasing per capita output in
the long run. There are two sides to consider in economic growth, including output or GDP and
population. According to Sjafrizal (2008, p. 85) the main objective of the analysis of regional
The 1st Internasional Forum Business and Economy (IFBE) 2019 Banjarmasin, 13-14 November 2019
68
economic growth is to explain how an area is able to grow quickly and some are growing slowly. In
contrast to the theory of growth in Macroeconomics, the Regional Economic Growth Theory is to
include some elements including location and region explicitly so that the conclusions produced are
also different.
Previous Research
Srivani (2018) in his research conducted in Lima Puluh Kota District revealed, there are three
sectors that are the basis and have an important role in the economy of Lima Puluh Kota based on the
results of LQ analysis including agriculture, forestry and fisheries; mining and excavation; and health
services and social activities. Sectors that have a very large contribution to GRDP and development in
Lima Puluh Kota Regency based on the Shif-Share analysis are the mining and quarrying sector as
well as the health service sector and social activities. Based on the results of Klassen's Tipology
analysis, the agriculture, forestry and fisheries sector, the mining and quarrying sector, as well as the
health service sector and social activities are sectors that will continue to experience growth.
In contrast to Nurhab's research (2019) conducted in Bengkulu City, where based on LQ
analysis there were 9 sectors that became leading sectors including the electricity and gas
procurement sector, water supply sector, wholesale and retail trade sector, car and motorcycle repair,
transportation and warehousing, the provision of accommodation and food and drink, the information
and communication sector, the financial services sector, the real estate sector, the corporate services
sector, the education service sector, as well as the health services sector and social activities. During
the period of 2011-2015 there was a trend of shifting roles from the agricultural sector to the sector of
providing accommodation food and drink, the information and communication sector and the real
estate sector based on the results of the Shift-Share analysis. Nurlina (2019) also conducted a similar
study using LQ and Shift-Share analysis in Eastern Aceh. The agriculture, forestry and fisheries sector
as well as the mining and quarrying sector are the leading sectors in East Aceh Regency. In addition
to be a leading sector, the agriculture, forestry and fisheries sectors are also the highest contributors to
the increase in the GRDP of East Aceh and Aceh Tamiang districts.
Kharisma (2018), also examined similar things in Maluku Province, the difference is only using
LQ analysis, Growth Ratio and Overlay Models. The results of his research show that there are 8
leading sectors that support the economy of Maluku Province, with the mining and quarrying sectors
having the highest average regional growth rates among the 8 other sectors. Sumayow (2018) only
examined the base and non-base sectors in East Boolang Mongondow Regency using LQ and DLQ
analysis. The results of his research show that there are 4 sectors which are the basis in East Boolang
Mongondow Regency including the electricity and gas procurement sector, the construction sector,
the information and communication sector, and other service sectors where the electricity and gas
supply sector and the construction sector will also become sectors that will remain become a base
sector in the future. Goschin (2014) researched the development patterns in Romania in two time
intervals, namely 2007-2008 (economic growth) and 2009-2011 (economic crisis). From the results of
the analysis using Shift-Share it was found that the driving effect of national employment growth
during 2007-2008 there was a relationship that tended to be negative, both sectorally and regionally.
Sectorally, the positive impact only applies to the Bucharest-Ilflov region, which is indicated by the
existence of a mutually beneficial sectoral employment mix, while the positive impacts from the
region for the Bucharest-Ilfov region and the Southwest region count as high competitiveness areas.
So that it can be said that these two regions are as good as the Southeast region where at the same
time experienced growth in employment while the other region actually experienced a decline as a
result of the negative impact of shifting employment by sector to employment by region. The highest
employment growth was recorded in the Bucharest-Ilfov region in the financial, real estate and other
services sectors followed by the trade sector.
DATA AND METHOD
The scope of research
This research was conducted to find out how the inter-regional economic development in the
Regional Kalimantan. Based on calculations using Location Quotient, it can be seen what are the
The 1st Internasional Forum Business and Economy (IFBE) 2019 Banjarmasin, 13-14 November 2019
69
leading sectors in the Kalimantan Regional region. Besides looking at how the economic structure
shifts between regions in the Kalimantan Region by using the Shift-Share method and grouping each
region based on the Klassen Tipology analysis.
Types of research
This type of research conducted in this research is descriptive research with a quantitative
approach. Where quantitative research is research that produces findings or results that can be
obtained using statistical procedures or other means of quantification (measurement).
Place / Location of Research
This research was conducted in the Regional Region of Kalimantan which consists of five provinces
including West Kalimantan Province, Central Kalimantan Province, South Kalimantan Province, East
Kalimantan Province and North Kalimantan Province.
Unit of Analysis
The Unit of Analysis in this study is the GRDP according to the business field based on
constant prices among regions in the Kalimantan Region, namely the Provinces of West Kalimantan,
Central Kalimantan, South Kalimantan, East Kalimantan, North Kalimantan.
Variables and Operational Definitions of Variables
Variables and operational definitions of variables in this study are as follows:
a. Economic growth is growth that occurred at the national level and in each region of the
Kalimantan Region at the provincial level in the period 2013-2017 was measured in percent
(%).
b. GDP according to business at constant prices
c. GRDP according to business sector (sectoral) based on constant prices is all the results of the
production of goods and services which are valued at prices in a certain time period selected
as a base year (now using the base year 2010) in units (Rp). In this study, GDP according to
business fields based on constant prices for the 2013-2017 period for each region (West
Kalimantan, Central Kalimantan, South Kalimantan, East Kalimantan and North Kalimantan),
and GDP according to business based on constant prices for the 2013- 2013 period 2017 as
the reference area.
d. Per capita income is regional income divided by the number of residents living in the area and
is measured in units (Rp).
e. Population Growth is an increase in the number of residents in a certain period of time in units
(souls).
Data collection technique
Data collection technique used in this study is documentation, where researchers collect data
through publications conducted by parties or related agencies such as the Central Statistics Agency in
the form of written or electronic documents.
Data analysis technique
Location Quotient (LQ) and Dynamic Location Quotient (DLQ)
According to Hood (in Tonang (2013)) Location Quotient (LQ) is an economic development
tool used to identify leading sectors in an area. The Location Qoutient Analysis (LQ) method is used
to identify the base / superior and non-base / non-superior sectors using the GDP of Kalimantan
Province (West, Central, South, East and North) on the basis of Constant Prices by Business Field as
of 2013-2017 and GDP data National Based on Constant Prices by Field of Business 2013-2017. The
similarities in the employment approach are as follows:
Vi / Vt
LQ =
Yi / Yt
Information:
Vi = Total GDP of a Province / Regional Sector i (West Kalimantan,
Central Kalimantan, South Kalimantan, East Kalimantan and North Kalimantan)
The 1st Internasional Forum Business and Economy (IFBE) 2019 Banjarmasin, 13-14 November 2019
70
Vt = Total Provincial / Regional GRDP (West Kalimantan, Central Kalimantan, South Kalimantan,
East Kalimantan and North Kalimantan)
Yi = Total GDP of sector i at National
Yt = Total National Sector GDP
If:
1) LQ value> 1, then sector i is the base sector in the area.
2) LQ value <1, then sector i is the non-base sector in the area.
3) the value of LQ = 1, then the sector is said to be self-sufficiency
Research conducted by Hidayat and Supriharjo (2014) regarding the superior sub-sectors in the
Districts in Central Lombok Regency also used the Dynamic Location Quotient method. DLQ
analysis is used to analyze prospects in the future regarding the state of the sector or sub-sector in the
future which is done in the form of time series / trends. Like LQ analysis, DLQ analysis also has the
same criteria, including:
1. If DLQ> 1, then sector i has the potential to become a superior sector
2. If DLQ <1 sector i does not have the potential to become a superior sector
The formulation used in the calculation using the DLQ method is as follows:
1 + gij / 1 + gj
DLQ = ^ t
1 + Gin / 1 + Mt.
Information:
Gij : is the average growth in the value of sector i in j
gj : represents the growth of the total value of the sector in j
Gin : is the average growth of sector i in the reference area n
Gn : represents the average growth of the total sectors in the reference area n
t : Difference between beginning and end years
Shift-Share
According to Soepono (in Assagaf, 2017) Shift-Share analysis is an analytical tool used to identify
changes and shifts in a structure in the economy. This analysis shows how the performance of the
sectors in the region when compared to the national economy. More clearly, Soepono explains the
calculation method using Shift-Share analysis as follows:
Dij = Yij.rn + Yij (rin - rn) + Yij (rij - rn)
rij = (Yij, t - Yij) / Yij
rin = (Yin, t - Yin) / Yin
rn = (Yn, t - Yn) / Yn
Where :
Dij is the change in sector i GRDP in the regions / provinces (West Kalimantan, Central
Kalimantan, South Kalimantan, East Kalimantan and North Kalimantan) in units (Rp).
Yij is a regional sector GRDP (West Kalimantan, Central Kalimantan, South Kalimantan, East
Kalimantan and North Kalimantan) in the initial year in units (Rp).
Yin is the national sector i GDP in the initial year in units (Rp).
Yn is the total national GDP in the initial year in units (Rp).
Yij, t is regional sector GRDP (West Kalimantan, Central Kalimantan, South Kalimantan, East
Kalimantan and North Kalimantan) in the final year in units (Rp).
Yin, t is the national sector i GDP in the final year in units (Rp).
Yn, t is the National Total GDP in the final year in units (Rp).
Klassen Typology
According to Sjafrizal (2008) Klassen Typology is an analytical tool used to determine the grouping
of regions (districts / cities or provinces) based on their growth structure. This analysis uses the
Klassen Matrix, in which 4 regional groupings are made based on growth rates and per capita income
as indicators.
Tabel 1
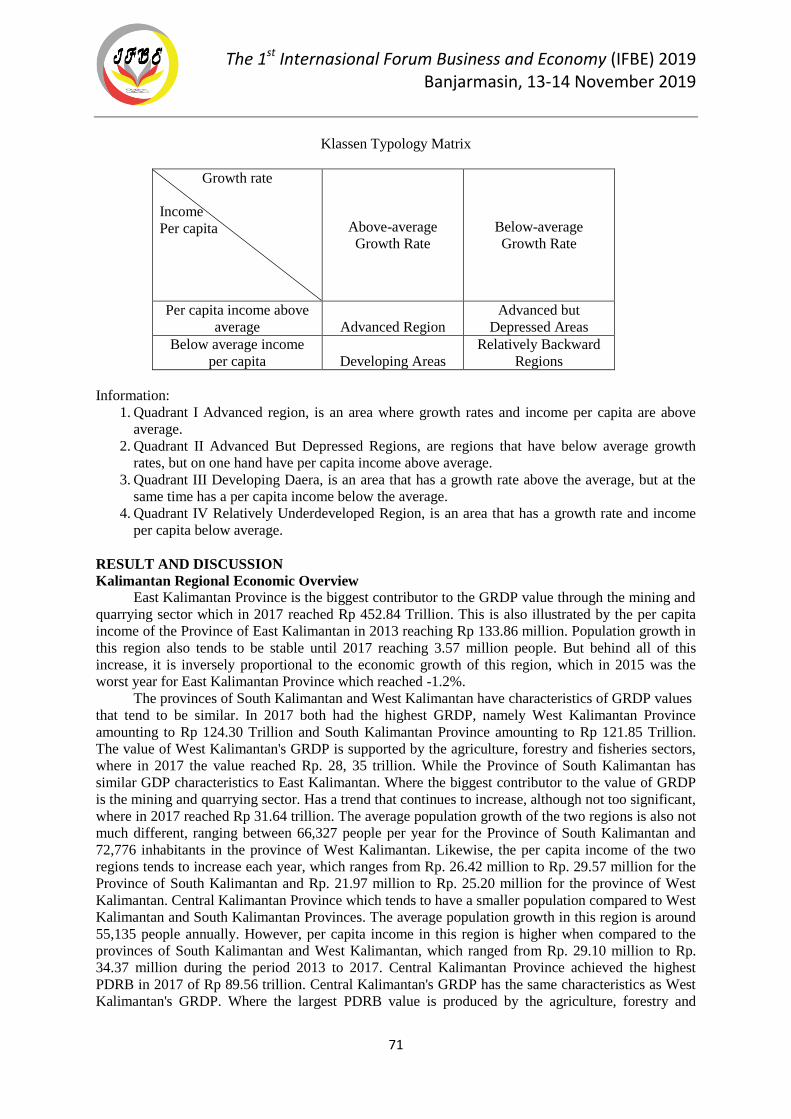
The 1st Internasional Forum Business and Economy (IFBE) 2019 Banjarmasin, 13-14 November 2019
71
Klassen Typology Matrix
Growth rate
Income
Per capita Above-average
Growth Rate
Below-average
Growth Rate
Per capita income above
average Advanced Region
Advanced but
Depressed Areas
Below average income
per capita Developing Areas
Relatively Backward
Regions
Information:
1. Quadrant I Advanced region, is an area where growth rates and income per capita are above
average.
2. Quadrant II Advanced But Depressed Regions, are regions that have below average growth
rates, but on one hand have per capita income above average.
3. Quadrant III Developing Daera, is an area that has a growth rate above the average, but at the
same time has a per capita income below the average.
4. Quadrant IV Relatively Underdeveloped Region, is an area that has a growth rate and income
per capita below average.
RESULT AND DISCUSSION
Kalimantan Regional Economic Overview
East Kalimantan Province is the biggest contributor to the GRDP value through the mining and
quarrying sector which in 2017 reached Rp 452.84 Trillion. This is also illustrated by the per capita
income of the Province of East Kalimantan in 2013 reaching Rp 133.86 million. Population growth in
this region also tends to be stable until 2017 reaching 3.57 million people. But behind all of this
increase, it is inversely proportional to the economic growth of this region, which in 2015 was the
worst year for East Kalimantan Province which reached -1.2%.
The provinces of South Kalimantan and West Kalimantan have characteristics of GRDP values
that tend to be similar. In 2017 both had the highest GRDP, namely West Kalimantan Province
amounting to Rp 124.30 Trillion and South Kalimantan Province amounting to Rp 121.85 Trillion.
The value of West Kalimantan's GRDP is supported by the agriculture, forestry and fisheries sectors,
where in 2017 the value reached Rp. 28, 35 trillion. While the Province of South Kalimantan has
similar GDP characteristics to East Kalimantan. Where the biggest contributor to the value of GRDP
is the mining and quarrying sector. Has a trend that continues to increase, although not too significant,
where in 2017 reached Rp 31.64 trillion. The average population growth of the two regions is also not
much different, ranging between 66,327 people per year for the Province of South Kalimantan and
72,776 inhabitants in the province of West Kalimantan. Likewise, the per capita income of the two
regions tends to increase each year, which ranges from Rp. 26.42 million to Rp. 29.57 million for the
Province of South Kalimantan and Rp. 21.97 million to Rp. 25.20 million for the province of West
Kalimantan. Central Kalimantan Province which tends to have a smaller population compared to West
Kalimantan and South Kalimantan Provinces. The average population growth in this region is around
55,135 people annually. However, per capita income in this region is higher when compared to the
provinces of South Kalimantan and West Kalimantan, which ranged from Rp. 29.10 million to Rp.
34.37 million during the period 2013 to 2017. Central Kalimantan Province achieved the highest
PDRB in 2017 of Rp 89.56 trillion. Central Kalimantan's GRDP has the same characteristics as West
Kalimantan's GRDP. Where the largest PDRB value is produced by the agriculture, forestry and
The 1st Internasional Forum Business and Economy (IFBE) 2019 Banjarmasin, 13-14 November 2019
72
fisheries sectors. North Kalimantan Province has similar characteristics to East Kalimantan's GRDP
and South Kalimantan. Where the largest PDRB value is produced by the mining and quarrying
sector. Where the largest value generated in 2017 is Rp 15.44 trillion. This province is classified as a
newly formed province from last 2012, so that the total population recorded is still relatively small.
The average population growth in North Kalimantan Province is 24,021 people per year. Even though
the population is still relatively small, the second largest per capita income after East Kalimantan
Province, which ranges from Rp. 74.10 million to Rp. 78.91 million during the 2013-2017 period.
Location Quotient (LQ) and Dynamic Location Quotient (DLQ)
To find out the leading sectors that are supporting the economy between regions, a calculation
is done through the Location Quotient and Dynamic Location Quotient analysis to determine which
sectors are still potential to be the leading sectors in sustaining the economy of each region in the
Regional Kalimantan. This analysis uses GRDP according to the business field at the constant price of
each region and the National GDP according to the business field at the constant price. Based on the
results of calculations using the LQ and DLQ methods it can be seen that there are 7 sectors that have
the potential to become leading sectors both now and in the future. These sectors include agriculture,
forestry and fisheries with LQ> 1 and DLQ> 1. Provinces that have LQ and DLQ values> 1 for this
sector include South Kalimantan Province (LQ = 1.08; DLQ = 1,004 ), West Kalimantan Province
(LQ = 1.72; DLQ = 1.02) and North Kalimantan Province (LQ = 1.28; DLQ = 1.03). Sectors that also
have the potential to become leading sectors in the present and in the future are the mining and
quarrying sector. There are 3 provinces where the mining and quarrying sector has the potential to
become a leading sector both now and in the future. Among them are East Kalimantan Province as the
largest contributor to the country's foreign exchange value through the mining and quarrying sector,
especially oil and coal products (LQ = 5.59; DLQ = 9.37), Central Kalimantan Province where coal
and lignite are the largest contributors to the formation of sector values mining and excavation in the
GRDP (LQ = 1.87; DLQ = 1.37), and South Kalimantan Province which is also famous for its coal
mines (LQ = 3.06; DLQ = 1.13).
Another sector that also has the potential to become a leading sector in the present and the
future is the construction sector. West Kalimantan Province is a province with sectors that have this
potential, because each has a LQ value and DLQ> 1 respectively (LQ = 1.10; DLQ = 1.03). The
transportation and warehousing sector also has the potential to become a leading sector in the present
and future in the Kalimantan Region, but only in the Province of South Kalimantan because it has LQ
and DLQ values> 1 (LQ = 1.42; DLQ = 1.002). The government administration, defense and social
security sectors also have the potential to become leading sectors in the present and in the future in the
4 Provinces in Kalimantan Region because they have LQ and DLQ values> 1. These provinces are
South Kalimantan Province ( LQ = 1.49; DLQ = 1.09), Central Kalimantan Province (LQ = 1.65;
DLQ = 1.11), West Kalimantan Province (LQ = 1.36; DLQ = 1.03) and North Kalimantan Province
(LQ = 1.40; DLQ = 1.10). In addition, the education service sector also has the potential to become a
leading sector in the present and future, which is only in the Province of South Kalimantan, because it
has a value of LQ and DLQ> 1 (LQ = 1.29; DLQ = 1.07). Other sectors that also have the potential to
become leading sectors in the present and in the future are the health service sector and social
activities because they have LQ and DLQ values> 1. South Kalimantan Province has potential in this
sector, because the value of LQ and DLQ of this sector> 1, namely (LQ = 1.54; DLQ = 1.04).
Overall, South Kalimantan Province dominates the number of sectors which have the potential
to become leading sectors in the present and the future. During the period 2013-2017 there were three
main sectors that contributed the greatest value to the formation of the South Kalimantan Province
GRDP. The highest sectors are mainly the mining and quarrying sector. The most dominant sub-
sectors are coal mining and lignite. The second sector that has the second largest contribution value
after the mining and quarrying sector is the agriculture, forestry and fisheries sectors. The
development of this sector is also quite good, which every year during the 2013-2017 period
continues to increase. The manufacturing industry sector is the third largest contributor to the GRDP
of South Kalimantan Province. The biggest sub-sector that contributed to the formation value for the
manufacturing industry sector is the food and beverage industry sub-sector. The development of its
The 1st Internasional Forum Business and Economy (IFBE) 2019 Banjarmasin, 13-14 November 2019
73
value throughout 2013 to 2017 continues to increase. Even though it was hit by a drop in international
commodity prices and a weakening rupiah exchange rate in 2014 and 2015, it did not affect the
development of this sub-sector or manufacturing industry sector.
Shift-Share
Shifts in economic structure between each region in the Kalimantan Region are measured using
Shift-Share analysis. This analysis is used to determine whether there is a shift in the structure of the
economy between each region which was initially still struggling or supported by the primary sector
shifted to the secondary sector or even to the tertiary sector. Based on the results of the Shift-Share
calculation the Province of West Kalimantan did not experience a shift in the economic structure.
Because from 2013 to 2017 the support of this regional economy is still dominated by the tertiary
sector. Although there was a phenomenon of coal reference prices that had declined and had an
impact on the economies of several regions in the Kalimantan Region, but this did not affect the
economy of West Kalimantan Province directly. Since 2013 the value of changes in the contribution
of the West Kalimantan Province's GRDP has reached Rp 2.66 Trillion and continues to increase to
Rp 2.83 Trillion in 2017. In addition, among the three sector groups, the tertiary sector group indeed
has an upward trend throughout the 2013-2017 period based on the GDP figure West Kalimantan
Province. The biggest change in contribution was generated by the wholesale and retail trade sector,
vehicle and car repairs during the period 2013 to 2016, in 2017 the information and communication
sector as a contributor to the change in the GDP contribution. Unlike the Province of Central
Kalimantan which experienced a shift in economic structure. In 2013, the primary sector dominated
changes in contributions and contributed positively to the GRDP, with a total value of change of Rp
2.25 trillion. The sectors that have the highest value change in contributions in the primary sector and
contribute positively to GRDP are the mining and quarrying sector. from 2014 to 2017 there began to
be a shift in the structure of the economy towards the tertiary sector. Although the value of changes in
its contribution fluctuated throughout 2014 to 2017 (Rp 1.83 Trillion to Rp 2.57 Trillion), the tertiary
sector group still dominates the economy of Central Kalimantan Province with wholesale and retail
trade sectors, vehicle and car repairs as contributors to changes in value the biggest contribution.
In line with the Province of West Kalimantan, South Kalimantan Province also did not
experience a shift in economic structure throughout 2013-2017. Tertiary sector groups dominate the
change in the value of contributions to the formation of the GRDP of South Kalimantan Province.
Although from 2013 to 2017 the value of changes in the contribution of the tertiary sector experienced
fluctuations from Rp 2.61 Trillion to Rp 2.80 Trillion, but the movement was not too significant
although it had been affected by the decline in coal reference prices in 2014 to 2016. Sectors with the
largest contribution in the tertiary sector group is the wholesale and retail trade sector, vehicle and car
repair. In 2016, it was the largest contribution value for this sector, because it increased to Rp 695.05
billion or around 14.24% of the total proportion of GRDP. The sector that had the largest contribution
change in the primary sector in East Kalimantan Province was produced by the mining and quarrying
sector. this sector contributed positively, with the value of the change in contribution of around Rp
4.21 trillion or around 43.67% of the total change in the GRDP. The shift in the economic structure of
East Kalimantan Province was strongly influenced by the decline in the world coal reference price
that occurred from 2014 to 2016. So, which was initially supported by the primary sector in 2013 until
the change in the value of its PDRB contribution reached Rp 5.76 trillion, began to experience a shift
towards the sector tertiary in 2014 (Rp. 4.43 trillion) to 2015 (Rp. 2.67 trillion), although the figure in
2015 decreased due to the world coal reference price which is currently experiencing a decline. The
wholesale and retail trade sector, vehicle and car repair, and the education service sector are the
sectors with the largest contribution in the tertiary sector group. Entering 2016 towards 2017, a shift
in economic structure towards the secondary sector has occurred with a change in contribution value
of Rp 3.83 trillion and Rp. 5 , 46 Trillion. The manufacturing industry sector is a sector with the
largest contribution to the change in value of the contribution to the GRDP in the tertiary sector group
with the change in contribution from this sector reaching Rp. 3.24 trillion or around 23.61%.
Similar to the Province of East Kalimantan, the shift in the economic structure of the Province
of North Kalimantan was also influenced by the decline in the world coal reference price especially in
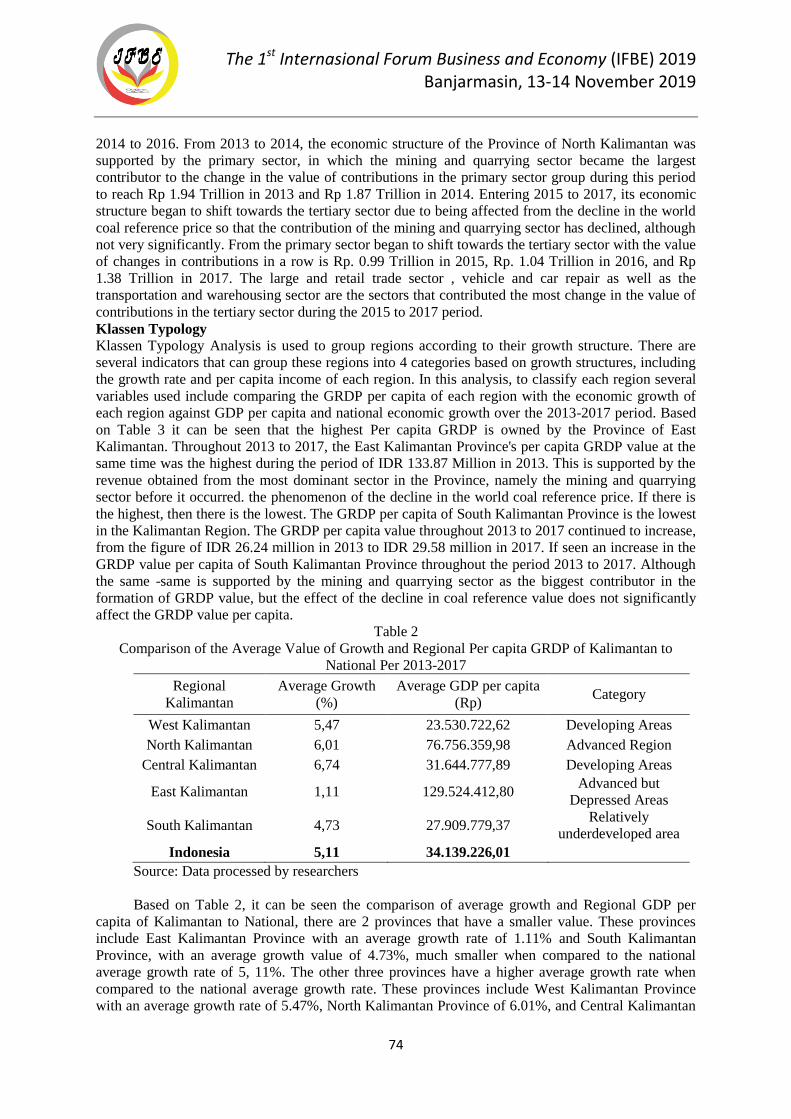
The 1st Internasional Forum Business and Economy (IFBE) 2019 Banjarmasin, 13-14 November 2019
74
2014 to 2016. From 2013 to 2014, the economic structure of the Province of North Kalimantan was
supported by the primary sector, in which the mining and quarrying sector became the largest
contributor to the change in the value of contributions in the primary sector group during this period
to reach Rp 1.94 Trillion in 2013 and Rp 1.87 Trillion in 2014. Entering 2015 to 2017, its economic
structure began to shift towards the tertiary sector due to being affected from the decline in the world
coal reference price so that the contribution of the mining and quarrying sector has declined, although
not very significantly. From the primary sector began to shift towards the tertiary sector with the value
of changes in contributions in a row is Rp. 0.99 Trillion in 2015, Rp. 1.04 Trillion in 2016, and Rp
1.38 Trillion in 2017. The large and retail trade sector , vehicle and car repair as well as the
transportation and warehousing sector are the sectors that contributed the most change in the value of
contributions in the tertiary sector during the 2015 to 2017 period.
Klassen Typology
Klassen Typology Analysis is used to group regions according to their growth structure. There are
several indicators that can group these regions into 4 categories based on growth structures, including
the growth rate and per capita income of each region. In this analysis, to classify each region several
variables used include comparing the GRDP per capita of each region with the economic growth of
each region against GDP per capita and national economic growth over the 2013-2017 period. Based
on Table 3 it can be seen that the highest Per capita GRDP is owned by the Province of East
Kalimantan. Throughout 2013 to 2017, the East Kalimantan Province's per capita GRDP value at the
same time was the highest during the period of IDR 133.87 Million in 2013. This is supported by the
revenue obtained from the most dominant sector in the Province, namely the mining and quarrying
sector before it occurred. the phenomenon of the decline in the world coal reference price. If there is
the highest, then there is the lowest. The GRDP per capita of South Kalimantan Province is the lowest
in the Kalimantan Region. The GRDP per capita value throughout 2013 to 2017 continued to increase,
from the figure of IDR 26.24 million in 2013 to IDR 29.58 million in 2017. If seen an increase in the
GRDP value per capita of South Kalimantan Province throughout the period 2013 to 2017. Although
the same -same is supported by the mining and quarrying sector as the biggest contributor in the
formation of GRDP value, but the effect of the decline in coal reference value does not significantly
affect the GRDP value per capita.
Table 2
Comparison of the Average Value of Growth and Regional Per capita GRDP of Kalimantan to
National Per 2013-2017
Regional
Kalimantan
Average Growth
(%)
Average GDP per capita
(Rp) Category
West Kalimantan 5,47 23.530.722,62 Developing Areas
North Kalimantan 6,01 76.756.359,98 Advanced Region
Central Kalimantan 6,74 31.644.777,89 Developing Areas
East Kalimantan 1,11 129.524.412,80 Advanced but
Depressed Areas
South Kalimantan 4,73 27.909.779,37 Relatively
underdeveloped area
Indonesia 5,11 34.139.226,01
Source: Data processed by researchers
Based on Table 2, it can be seen the comparison of average growth and Regional GDP per
capita of Kalimantan to National, there are 2 provinces that have a smaller value. These provinces
include East Kalimantan Province with an average growth rate of 1.11% and South Kalimantan
Province, with an average growth value of 4.73%, much smaller when compared to the national
average growth rate of 5, 11%. The other three provinces have a higher average growth rate when
compared to the national average growth rate. These provinces include West Kalimantan Province
with an average growth rate of 5.47%, North Kalimantan Province of 6.01%, and Central Kalimantan
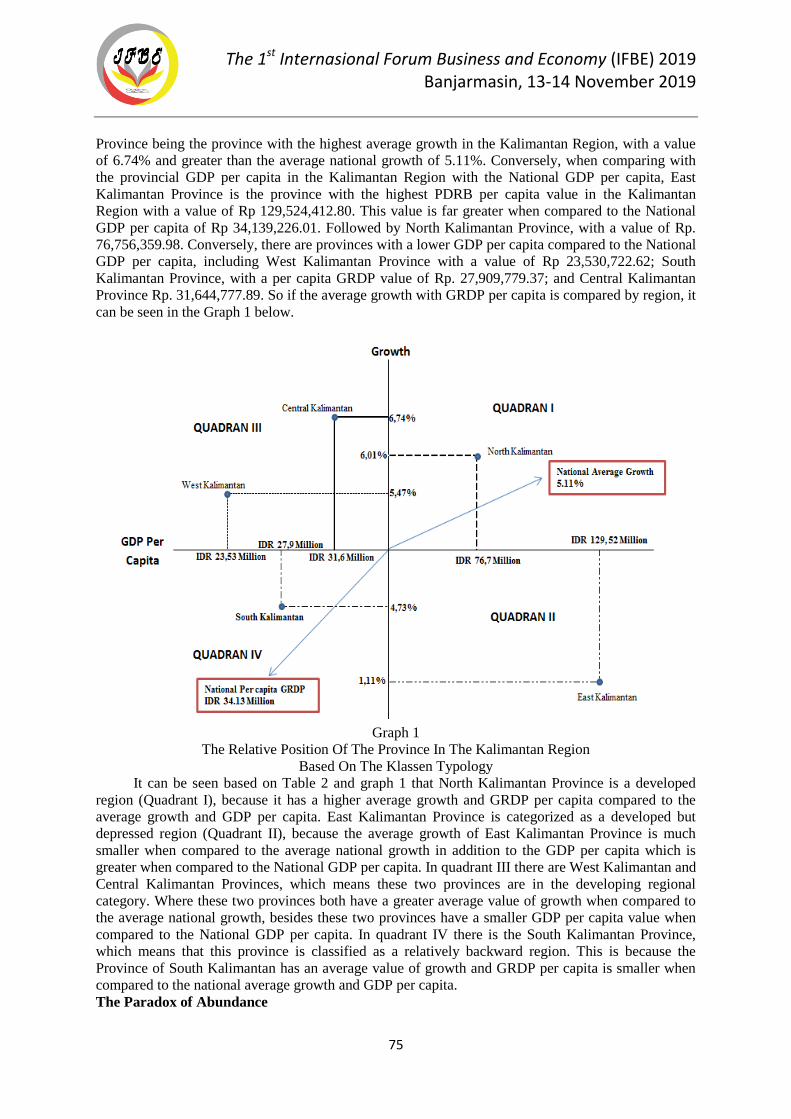
The 1st Internasional Forum Business and Economy (IFBE) 2019 Banjarmasin, 13-14 November 2019
75
Province being the province with the highest average growth in the Kalimantan Region, with a value
of 6.74% and greater than the average national growth of 5.11%. Conversely, when comparing with
the provincial GDP per capita in the Kalimantan Region with the National GDP per capita, East
Kalimantan Province is the province with the highest PDRB per capita value in the Kalimantan
Region with a value of Rp 129,524,412.80. This value is far greater when compared to the National
GDP per capita of Rp 34,139,226.01. Followed by North Kalimantan Province, with a value of Rp.
76,756,359.98. Conversely, there are provinces with a lower GDP per capita compared to the National
GDP per capita, including West Kalimantan Province with a value of Rp 23,530,722.62; South
Kalimantan Province, with a per capita GRDP value of Rp. 27,909,779.37; and Central Kalimantan
Province Rp. 31,644,777.89. So if the average growth with GRDP per capita is compared by region, it
can be seen in the Graph 1 below.
Graph 1
The Relative Position Of The Province In The Kalimantan Region
Based On The Klassen Typology
It can be seen based on Table 2 and graph 1 that North Kalimantan Province is a developed
region (Quadrant I), because it has a higher average growth and GRDP per capita compared to the
average growth and GDP per capita. East Kalimantan Province is categorized as a developed but
depressed region (Quadrant II), because the average growth of East Kalimantan Province is much
smaller when compared to the average national growth in addition to the GDP per capita which is
greater when compared to the National GDP per capita. In quadrant III there are West Kalimantan and
Central Kalimantan Provinces, which means these two provinces are in the developing regional
category. Where these two provinces both have a greater average value of growth when compared to
the average national growth, besides these two provinces have a smaller GDP per capita value when
compared to the National GDP per capita. In quadrant IV there is the South Kalimantan Province,
which means that this province is classified as a relatively backward region. This is because the
Province of South Kalimantan has an average value of growth and GRDP per capita is smaller when
compared to the national average growth and GDP per capita.
The Paradox of Abundance
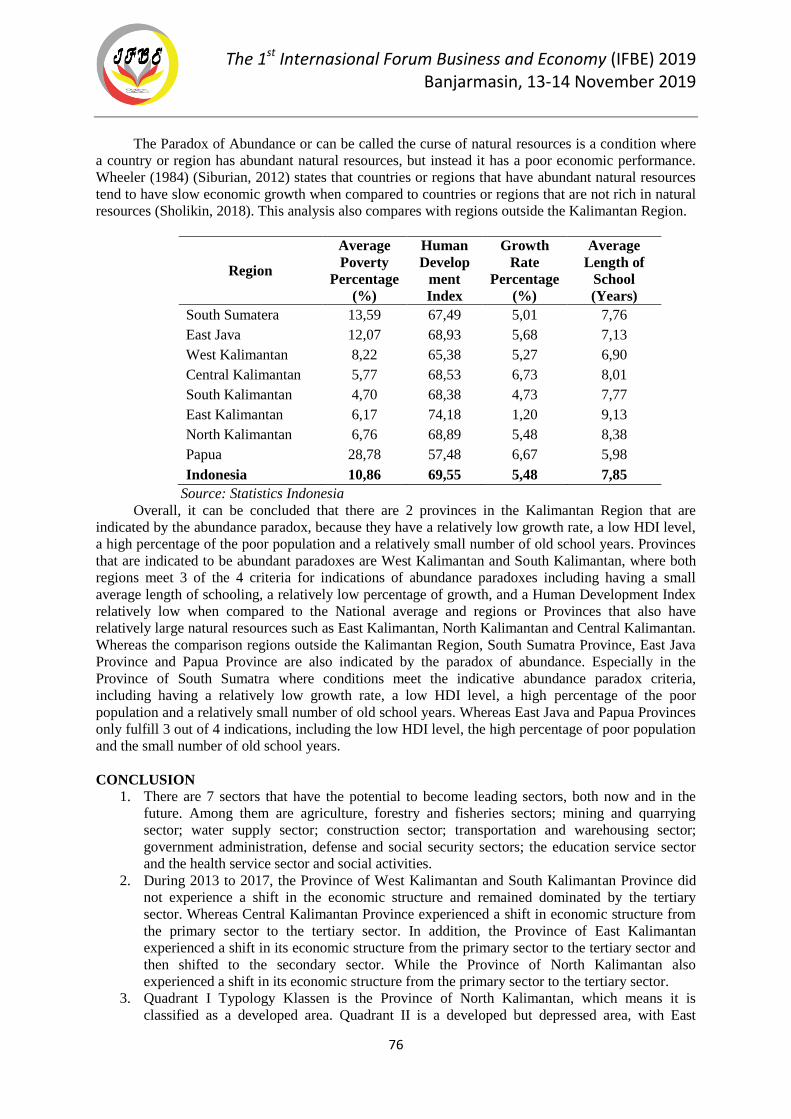
The 1st Internasional Forum Business and Economy (IFBE) 2019 Banjarmasin, 13-14 November 2019
76
The Paradox of Abundance or can be called the curse of natural resources is a condition where
a country or region has abundant natural resources, but instead it has a poor economic performance.
Wheeler (1984) (Siburian, 2012) states that countries or regions that have abundant natural resources
tend to have slow economic growth when compared to countries or regions that are not rich in natural
resources (Sholikin, 2018). This analysis also compares with regions outside the Kalimantan Region.
Region
Average
Poverty
Percentage
(%)
Human
Develop
ment
Index
Growth
Rate
Percentage
(%)
Average
Length of
School
(Years)
South Sumatera 13,59 67,49 5,01 7,76
East Java 12,07 68,93 5,68 7,13
West Kalimantan 8,22 65,38 5,27 6,90
Central Kalimantan 5,77 68,53 6,73 8,01
South Kalimantan 4,70 68,38 4,73 7,77
East Kalimantan 6,17 74,18 1,20 9,13
North Kalimantan 6,76 68,89 5,48 8,38
Papua 28,78 57,48 6,67 5,98
Indonesia 10,86 69,55 5,48 7,85
Source: Statistics Indonesia
Overall, it can be concluded that there are 2 provinces in the Kalimantan Region that are
indicated by the abundance paradox, because they have a relatively low growth rate, a low HDI level,
a high percentage of the poor population and a relatively small number of old school years. Provinces
that are indicated to be abundant paradoxes are West Kalimantan and South Kalimantan, where both
regions meet 3 of the 4 criteria for indications of abundance paradoxes including having a small
average length of schooling, a relatively low percentage of growth, and a Human Development Index
relatively low when compared to the National average and regions or Provinces that also have
relatively large natural resources such as East Kalimantan, North Kalimantan and Central Kalimantan.
Whereas the comparison regions outside the Kalimantan Region, South Sumatra Province, East Java
Province and Papua Province are also indicated by the paradox of abundance. Especially in the
Province of South Sumatra where conditions meet the indicative abundance paradox criteria,
including having a relatively low growth rate, a low HDI level, a high percentage of the poor
population and a relatively small number of old school years. Whereas East Java and Papua Provinces
only fulfill 3 out of 4 indications, including the low HDI level, the high percentage of poor population
and the small number of old school years.
CONCLUSION
1. There are 7 sectors that have the potential to become leading sectors, both now and in the
future. Among them are agriculture, forestry and fisheries sectors; mining and quarrying
sector; water supply sector; construction sector; transportation and warehousing sector;
government administration, defense and social security sectors; the education service sector
and the health service sector and social activities.
2. During 2013 to 2017, the Province of West Kalimantan and South Kalimantan Province did
not experience a shift in the economic structure and remained dominated by the tertiary
sector. Whereas Central Kalimantan Province experienced a shift in economic structure from
the primary sector to the tertiary sector. In addition, the Province of East Kalimantan
experienced a shift in its economic structure from the primary sector to the tertiary sector and
then shifted to the secondary sector. While the Province of North Kalimantan also
experienced a shift in its economic structure from the primary sector to the tertiary sector.
3. Quadrant I Typology Klassen is the Province of North Kalimantan, which means it is
classified as a developed area. Quadrant II is a developed but depressed area, with East
The 1st Internasional Forum Business and Economy (IFBE) 2019 Banjarmasin, 13-14 November 2019
77
Kalimantan Province. Quadrant III is a developing area, where the Province of West
Kalimantan and Central Kalimantan Province Quadrant IV is a relatively backward area,
where there is the Province of Kalimantan.
4. There are 3 Provinces that are indicated by the abundance paradox including the Province of
West Kalimantan and South Kalimantan Province. Three comparative provinces outside the
Kalimantan region are also indicated by the paradox of abundance, namely East Java, South
Sumatra and Papua.
Suggestion
1. Downstreaming the raw material product industry in areas that are still dependent on the
primary sector as a whole needs to be optimized, so that it can create an added value for the
product itself, especially for the primary sector. With the occurrence of industrial
downstreaming, a lot of new jobs will be opened so as to be able to increase regional income
and the welfare of the people in the area. Overall, in the Kalimantan region, Kalimantan is in
dire need of optimization of regional policies regarding the downstreaming of primary sector
products in general, and not limited to the mining sector. This is due to the fact that the
primary sector is still a leading sector in the Kalimantan Region, especially in Provinces
where the value of the mining sector still dominates the formation of the GRDP, such as East
Kalimantan, North Kalimantan and South Kalimantan. Moreover, East Kalimantan Province
which is a developed area but is depressed because it has a low growth rate and South
Kalimantan Province which is classified as a region that is relatively underdeveloped because
it has a low level of income per capita and growth.
2. Optimizing regional development policies towards productive services in addition to
improving the quality of existing human resources. Especially for areas such as Central
Kalimantan Province, East Kalimantan Province, and North Kalimantan Province. Although
succeeded in carrying out structural economic transformation towards the secondary and
tertiary sectors, in the period of 2013-2017 the shift occurred not because of an increase in the
sector, but rather the occurrence of the phenomenon of coal reference prices which declined
so that the impact on the decline in the value of changes in contributions to the primary sector
.
3. Especially for regions that are classified as developing to underdeveloped regions such as
West Kalimantan Province, Central Kalimantan Province and South Kalimantan Province, the
need to optimally develop the tourism sector which is classified as productive services. The
tourism sector is very cheap and environmentally friendly in its development, so the
government needs to focus on developing this sector to increase income and economic growth
in this area, especially for South Kalimantan Province which has low income and economic
growth.
REFERENCES
Assagaf, N. 2017. Analisis Struktur Perekonomian, Sektor Unggulan Dan Pengembangan Wilayah Di
Kota Ternate Tahun 2011-2015 Muhammadiyah Malang University.
Boediono 1992. Teori Pertumbuhan Ekonomi, Yogyakarta, Pbfe.
Goschin, Z. 2014. Regional Growth In Romania After Its Accession To Eu: A Shiftshareanalysis
Approach. Procedia Economics And Finance.
Hidayat, S. 2014. Identifikasi Sektor Unggulan Kecamatan Di Kabupaten Lombok Tengah. Teknik
Pomits, 3, 16-19.
Kharisma, F. H. 2018. Penentuan Potensi Sektor Unggulan Dan Potensial Provinsi Maluku. Jurnal
Ekonomi & Studi Pembangunan, 19.
The 1st Internasional Forum Business and Economy (IFBE) 2019 Banjarmasin, 13-14 November 2019
78
Nurhab 2019a. Pergeseran Kontribusi Sektor Pertanian Di Kota Bengkulu Dengan Menggunakan Alat
Analisa Shift-Share Esteban-Marquillas
Nurlina, P. A., Maulia Sari 2019. Analisis Sektor Unggulan Aceh Bagian Timur. Jurnal Samudra
Ekonomi Dan Bisnis, 10.
Sholikin, A. 2018. Kutukan Sumber Daya Alam (Resource Curse). Academia.Edu, 1-10.
Siburian, R. 2012. Pertambangan Bart Bara: Antra Mendulang Rupiah Dan Menebar Potensi Konflik.
Lembaga Ilmu Pengetahuan Indonesia, 38, 69-92.
Sjafrizal 2008. Ekonomi Regional Teori Dan Aplikasi, Padang, Baduose Media.
Sosilawati, E. A. 2017. Sinkronisasi Pemograman Pembiyaan Pembangunan Jangka Pendek 2018-
2020 Keterpaduan Pengembangan Kawasan Dengan Infrastruktur Pupr Pulau Kalimantan.
Jakarta: Pusat Pemograman Dan Evaluasi Keterpaduan Infrastruktur Pupr, Badan
Pengembangan Infrastruktur Wilayah Kementerian Pekerjaan Umum Dan Perumahan Rakyat.
Srivani, W., Lukman, Erizal, Zumaila Utami, Fini Fibriani 2018. Analisis Potensi Ekonomi Dalam
Strategi Pembangunan Dan Pengembangan Wilayah Kabupaten Lima Puluh Kota Ekonomi
Pembangunan, 7.
Statistik, B. P. 2017. Tinjauan Pdrb Kabupaten/Kota Se-Kalimantan Selatan 2017. In: Selatan, B. P.
S. K. (Ed.). Kalimantan Selatan: Badan Pusat Statistik Provinsi Kalimantan Selatan.
Sumayow, P. A. P., & Ellen G. T 2018. Analisis Sektor Basis Dan Non Basis Di Kabupaten Bolaang
Mongondow Timur. Agri-Sosioekonomi Unsrat, 14.
Tonang, A. 2013. Analisis Sektor Basis (Location Quotient) [Online].
Www.Academia.Edu:Www.Academia.Edu. Available:
Https://Www.Academia.Edu/5247698/Analisis_Sektor_Basis_Location_Quotient_ [Accessed
19 Februari 2019 2019].
The 1st Internasional Forum Business and Economy (IFBE) 2019 Banjarmasin, 13-14 November 2019
79
GREEN VILLAGE FOR A SUSTAINABLE TOURISM ON SRIMULYO VILLAGE,
PIYUNGAN, BANTUL
DanangWahyudi1, Erni Ummi Hasanah
1, Evi Gravitiani
3Mochamad Syamsiro
1,
RetnoLantarsih1, Hermawan Prasetyanto
2
1 LPPM Universitas Janabadra, Yogyakarta
2 Sekolah Tinggi Pariwisata AMPTA, Yogyakarta
3 Faculty of Economics and Business, Universitas Sebelas Maret, Surakarta
Abstract: Green tourism is one form of ecotourism, emphasis on the national park or protected area
as a tourism destination. Green tourism can be a part of a green lifestyle as a green mind. The aim of
this study is the implementation of Green Village management in Srimulyo, Piyungan, Bantul,
Yogyakarta and reform Srimulyo to be one of the tourism destinations.
Based on a process of action research, this paper explores the economic and social attitudes,
perceptions towards sustainability and how they influenced the people's engagement. We demonstrate
that the partnership was effective in enabling the villagers engaged in the project to take control of the
process. Behavior changes were reported by the villagers actively engaged with the initiative. The
Green Village did not "snowball" to the entire community; however, many of those who chose not to
engage associated with the word "Green" with traits that they did not identify with.
Keywords: green village, sustainable tourism, Srimulyo Village, Bantul
BACKGROUND The village development paradigm has undergone a shift after the issuance of Village Law No.
6 of 2014. In the previous era, villages did not receive serious attention, but instead, they were only
underestimated and as objects of development. As a result, the development of rural areas did not
experience significant progress, which was even known as a backward village. However, when
President Joko Widodo took over the role of the government, the village became the prima donna and
development priority so that the implementation of development adopted a bottom-up model that
positioned the village as the subject of development (Widarto, 2018). The massive form of attention
from the central government is also reflected in increasing funding support for the development of
rural areas sourced from the state budget. Even cumulatively, funding support for villages is getting
bigger every year.
In line with the increasing support of the central government for the development of rural areas,
the community and village-level government are also enthusiastic to welcome it. One form of the
excitement of the government and village communities is the increasingly widespread development of
the rural tourism sector. It is undeniable that villages throughout Indonesia have tremendous village
tourism potential for this type of tourism based on natural, cultural and social characteristics. Efforts
to develop the rural tourism sector will have a broad multiplier effect on rural communities. Some
positive impacts including contributions to the economic growth of the village, employment,
reduction of the unemployment rate, increased income as well as the welfare of the village
community.
The stretching of rural-based development will also be related to the concept of sustainable
development. At present, the concept has become a global agenda in every development process.
Therefore, all stakeholders including the government in various development sectors must apply the
principles of sustainable development in every policy and development plan that will be implemented
(Mutaqin, 2017). The development of tourism in rural areas is one of the implementations of the
concept of sustainable development which can realize sustainable tourism development in the future.
Conceptually, the development of tourism village is to make the village as a tourism destination
by combining natural and cultural tourism attractions, public tourism service facilities, adequate
accessibility, as well as the procedures and traditions of village community life. The main principle in
The 1st Internasional Forum Business and Economy (IFBE) 2019 Banjarmasin, 13-14 November 2019
80
the tourism village is a development village, which focuses on empowering the community to be able
to build their village independently. The development of a tourism village is the government's mission
to improve the welfare of the community through the development of productive businesses in the
tourism sector by following local potential and resources.
Srimulyo Village is one part of the Bantul district which is currently very aggressively
developing its village tourism potential. Of the 22 hamlets in Srimulyo village, there are 17 growing
destinations. The growth categories of each tourism village are varied. Some tourist village
destinations are well established and well developed. But on the other hand, several tourist
destinations are still categorized as for beginners (embryos). Related to this research, the destination
used as a sample is combination between an established destination and an embryo (initial). The
concept developed by the tourism village in Srimulyo is community-based tourism, where tourists can
enjoy the natural beauty of the countryside, the rich culture of the village, explore the hills and rivers,
but on the other hand also to continue to seek conservation including environmental conservation and
the community as a the main controller is in its development (Tanaya, 2014). Using a qualitative and
quantitative approach, this study was conducted to formulate the management/tourism village
management (green village) with the full involvement of the community as managers so that it would
increase employment opportunities and income of the village community.
LITERATURE REVIEW The term perception is a process of someone's activity in giving impression, judgment, opinion,
feeling and interpreting something based on information displayed from other sources (perceived).
Through perception we can recognize the world around us, that is, the whole world consisting of
matter and man with all its events (Meider, 1958). Humans as social creatures as well as individual
creatures have differences between individuals with one another (Wolberg, 1967). The existence of
these differences among others causes why someone likes an object, while others are not happy even
hating the object. It depends on how the individual responds to the object with his perception. Most
attitudes, behavior, and adjustments are determined by their perception. According to Young (1956),
perception is an activity of sense, integrating and providing an assessment of physical objects and
social objects, and sense depends on physical stimuli and social stimuli in the environment.
Sensations from the environment will be processed together with things that have been learned before
in the form of expectations, values, attitudes, memories, and others. Perception as a result of human
interaction understands and values the environment by capturing objects through the sense organs,
such as vision, hearing, smell, and taste. It starts because there is a stimulus, then the individual
experiences the sensing process and coordinates it in the higher nerve center (brain) so that humans
can assess and provide these responses (Sarwono, 1992). Furthermore, this opinion was developed
into a theory of perception "SOR" (Stimulate – Organism – Response). According to this theory, the
effect that occurs on the recipient is a certain reaction from a certain stimulus.
Attitude In general, the notion of attitude (attitude) is the feelings, thoughts, and tendencies of
someone who is more or less permanent in knowing certain aspects of their environment. La Pierre (in
Azwar, 2013) defines attitude as a pattern of behavior, tendency or anticipatory readiness,
predisposition to adjust to social situations, or simply, attitude is a response to social stimuli that have
been conditioned. According to Fishbein & Ajzen, attitude as a predisposition is learned to respond
consistently in certain ways regarding certain objects. Sherif & Sherif stated that attitude determines
the singularity and peculiarities of a person's behavior about to with to human stimuli or certain
events. Attitude is a condition that allows an action or behavior to emerge (Dayakisni & Hudaniah,
2012).
Rahayuningsih (2008) argues that the attitude is:
1. Response-oriented: an attitude is a form of feeling, which is a feeling of support or partiality
(favorable) or a feeling of not supporting (unfavorable) on an object.
2. Oriented to the readiness of response: attitude is the readiness to react to an object in certain ways
when faced with a stimulus that requires a response or a pattern of behavior, tendencies or readiness
to adapt to social conditions that have been conditioned.
The 1st Internasional Forum Business and Economy (IFBE) 2019 Banjarmasin, 13-14 November 2019
81
Factors That Affect Attitudes
According to Azwar (2013), 6 things that affect a person's attitude, namely:
1. Personal experience
Personal experiences can be the basis for forming attitudes if they leave a strong impression.
Attitudes will be more easily formed if personal experiences occur in situations involving emotional
factors.
2. The influence of others who are considered importantly
Individuals generally tend to have a conformist attitude or in line with the attitude of someone
who is considered importantly. This tendency is motivated, among others, by the desire to be
affiliated and to avoid conflicts with people who are considered importantly.
3. Cultural influences
Culture can provide features of individual experiences of the community in which they care. As
a result, culture unwittingly implements a line of influence on our attitudes toward various problems.
4. Mass media
In the news coverage of newspapers and radio or other communication media, news that should
be factually delivered objectively influences the attitudes of consumers.
5. Educational institutions and religious institutions
The moral concepts and teachings of educational institutions and religious institutions largely
determine the belief system. It is not surprising if in turn, the concept influences attitude.
6. Emotional factors
Sometimes, a form of attitude is a statement based on emotion that functions as a sort of
channeling of frustration or the transfer of a form of ego defense mechanism.
Tourism
According to Law Number 10 of 2009 concerning tourism, what is meant by tourism is a travel
activity carried out by a person or group of people by visiting a particular place for recreational
purposes, personal development, or learning the uniqueness of the tourist attraction visited in a
temporary period. As for tourism, it is described as a tourism activity and is supported by various
facilities and services provided by the community, entrepreneurs, government, and local government.
Tourist attraction
Tourist attractions are a place of recreation or tourism. This can be in the form of natural
attractions such as mountains, lakes, rivers, beaches, sea, or in the form of buildings such as
museums, fortresses, historical heritage sites, and others (Pendit, 2002). The argument of Damanik
and Weber (2006) tourism is a phenomenon of the movement of people, goods and services, which is
very complex. It is closely related to organizations, institutional and individual relations, service
needs, service provision needs, and so on.
DATA AND METHOD This research was conducted descriptively quantitative using survey methods as a way of
systematically gathering information carried out on respondents with the intent to understand and or
predict some aspects observed from respondents (Rangkuti, 2007). Survey methods pay more
attention to sampling, questionnaire design, administering questionnaires and data analysis.
The research variables consist of the environment aspects (SEA), economic attitudes (ECOA)
and social attitudes (SOCA), and unit of measurement indicators with a Likert scale. This research
will be conducted from September to October 2019 in the village of Srimulyo, Piyungan, Bantul
Regency as a research location with the consideration that there are 17 growing destinations in
Srimulyo village. This research will be conducted from September to October 2019 in the village of
Srimulyo, Piyungan, Bantul Regency as a research location with the consideration that there are 17
growing destinations in Srimulyo village. But on the other hand, several tourist destinations are still
categorized beginners (embryos).
Related to this research, the destination used as a sample is a combination of an established
destination and still an (initial) embryo. The concept developed by the tourism village in Srimulyo is

The 1st Internasional Forum Business and Economy (IFBE) 2019 Banjarmasin, 13-14 November 2019
82
community-based ecotourism, that the tourists can enjoy the natural beauty of the countryside, the
rich culture of the village, explore the hills and explore rivers but on the other hand continue to seek
conservation including environmental conservation and the community as the main controller in its
development (Tanaya, 2014).
The sampling technique is done purposively. The population in this study was distributed to the
number of visitors and residents of The Srimulyo village community. To obtain the data needed in this
study, the authors used several data collection methods as follows:
Questionnaire (e-questionnaire), the method of collecting data by distributing (online) a list of
structured questions addressed to tourists visiting tourist destinations in the village of Srimulyo and
the community of Srimulyo.
Besides that, interviews are also conducted, namely the method carried out by conducting
interviews or questions and answers directly to the community and tourists who are in the village area
of Srimulyo.
Observation, the method of collecting data is done by direct observation of tourist destinations
and activities that exist in the tourist destination area in Srimulyo Village.
Literature Review, the process of collecting data is done by using scientific references or
references that are relevant to the object of research as secondary data.
RESULT AND DISCUSSION
Results The results of the study will be systematically described based on a general description of the
research location, description of the respondent's characteristics, variables, and the results of statistical
calculations as follows:
Identity of Respondents
Respondents in this study were residents of the village of Srimulyo and the general public who
had visited several tourist destinations in the village of Srimulyo. Based on the recapitulation and
tabulation of the questionnaire, 80 questionnaires can be declared as eligible for analysis in this study.
Referring to gender, 42 respondents or 52.5% were male and 38 respondents or 47.5% were
female. From the aspect of age, 71.3% or 57 respondents aged 17 years to 25 years, 11.3% aged
between 46 years to 55 years, 8.8% aged between 36 years to 45 years. And 6.3% aged between 26
years to 35 years. This condition indicates that 97.7% or 78 respondents who visited the Srimulyo
tourist village were of productive age.
Based on the level of education 47.5% or 38 respondents had a high school education, then
33.8% or 27 respondents had a college education (S1), and 11.3% had postgraduate education. This
fact shows that the destination of Srimulyo tourism village is a favorite destination for millennial
youth, in which approximately 92.6% of respondents are dominated by high school and bachelor
degree graduates.
Based on the level of income, the respondents in the study mostly earned between Rp.
1,100,000 up to Rp. 2,000,000, which is 30%, then 26.3% of respondents earn Rp. 2,100,000 up to
Rp. 4,000,000 and 21.3% or 17 respondents earning more than Rp. 4,000,000.
Based on information sources, the majority of respondents obtained information about
Srimulyo tourism villages from social media (Instagram, Twitter, and Facebook), which amounted to
52.5% or 42 respondents, then 17.5% or 14 respondents know the existence of Srimulyo village as an
ecotourism village sourced from word of mouth information. Print media (newspapers and so on) is
the smallest source of information on the existence of Srimulyo village as a tourist village, which is
3.8%.
Respondents Attitude
1) Respondents' attitudes and support towards the Srimulyo ecotourism village environment
Respondents express their support for the establishment of a community-based tourism village
environment. This is evident from the respondents' answers related to environmental aspects. 83.7%
of respondents stated strongly agree and 16.3% agreed to the statement that the diversity of nature in
the Srimulyo tourist village must be protected and valued. Furthermore, related to the statement that
The 1st Internasional Forum Business and Economy (IFBE) 2019 Banjarmasin, 13-14 November 2019
83
the environment of the residents of the Srimulyo tourism village community must always be
maintained, 97.5% of respondents agreed and strongly agreed.
On the question that the village of Srimulyo became a community-based ecotourism village, the
majority of respondents stated their agreement, with 51.3% of respondents agreement and strongly
agreement.
2) Respondents' attitudes toward economic activities in the Srimulyo ecotourism village
In connection with economic activities to support the making of Srimulyo village as a destination for
community-based ecotourism objects, the majority of 63.8% of respondents agreed with their
statement to visit the Srimulyo ecotourism village area should be levied. Besides, the respondent also
stated his agreement of 68.8%, to the statement that each visitor must contribute to the conservation of
plant and plant habitats in the Srimulyo ecotourism village. Contributions to conservation, in this case,
can be in the form of actions that do not damage nature in ecotourism destinations or participating in
planting plant seeds needed in the ecotourism village of Srimulyo, and also help maintain the
cleanliness of river that crosses Srimulyo village.
3) Respondents' attitudes towards social activities in the Srimulyo ecotourism village
Regarding the respondent's attitude towards social activities, to support Srimulyo village as an
ecotourism-based tourism village, 65.1% of respondents agreed and strongly agreed with the
statement that it is needed to control over tourism development in the Srimulyo village area. Besides,
90% of respondents agreed and strongly agreed to the holding of various regulations aimed at
reducing the negative impact of tourism in the village of Srimulyo.
Discussion From the results of multiple linear regression analysis, the following results are obtained:
a. Regression equation
The multiple regression equation in this study is as follows:
The general form of the regression model is:
SEA = 0 + 1 ECOA + 2 SOCA + (1)
Specifically the model in this study can be expressed in the following equation;
SEA = 4,550 + 0,302 ECOA + 0,248 SOCA (2)
Where:
SEA = support for environmental aspects
ECOA = economic activity
SOCA = social activities
Based on the regression equation, it can be interpreted that the variables of economic activity and
social activity have a positive effect on supporting the environmental aspects. Of the two variables,
economic activity is more dominantly affecting the support of environmental aspects, compared to
social activities.
b. F test results
F test results show that the variable economic aspects and social aspects simultaneously have a
significant effect on environmental aspects. The evidence is based on the results of the probability
significance value (Sig.) in the ANOVA table of 0.004, where the value of Sig = 0.004 <0.05.
c.T-Test result
T-test result shows that both variables (economic activities and social activities) partially have a
significant effect on environmental aspects. The evidence is shown on the probability significance
value each independent variable less than 5%. The Probability value Sig on economic aspects 0,013 <
0,05 and probability value sig on social aspects 0,016 < 0,0.
CONCLUSION 1. Conclusions
Based on the discussion, it can be concluded:
a. Simultaneously, economic and social aspects have a positive and significant impact on
environmental support for ecotourism destinations in Srimulyo Village
The 1st Internasional Forum Business and Economy (IFBE) 2019 Banjarmasin, 13-14 November 2019
84
b. Partially, economic and social aspects have a positive and significant impact on environmental
support for ecotourism destinations in Srimulyo Village
2. Suggestions
In the further studies, it is necessary to add other variables that influence the environment of a
community-based tourist area, because from the results of this study, economic and social aspects
only contribute to the extent of 11.3% (less than 50%) to the environmental aspects of Srimulyo
ecotourism village.
REFERENCES
A.Z. MUTAQIN, 2017.Pengembangan Desa Wisata dan Pembangunan Pariwisata
Berkelanjutanhttps://wisatahalimun.co.id. Di Unduh tanggal 14 Oktober 2019.
Azwar, Saifudin. 2013. Sikap Manusia: Teori dan Pengukurannya, Edisi 2. Yogyakarta: Pustaka
Pelajar.
B. Sunaryo, 2013. Kebijakan Pembangunan Destinasi Pariwisata Konsep dan Aplikasinya di
Indonesia. Yogyakarta:GavaMedia
D.A. Tanaya, I. Rudianto, 2014. Potensi Pengembangan Ekowisata Berbasis Masyarakat, di Kawasan
Rawa Pening Kabupaten Semarang, Jurnal Teknik PWK Volime 3 Nomor 1
Dayakisni, T dan Hudaniah, 2012. Psikologi Sosial. Malang: UMM PRESS.
Hardi, Rosida, S. Bachri, 2017. Pengaruh Sosial Ekonomi, Sarana dan Prasarama Terhadap Perilaku
Masyarakat Dalam Pengelolaan Sampah di Kecamatan Ampana Kota. Kabupaten Tojo
Una-Una, Jurnal Katalogis, Vol.5 No. 9 September.
Meider, 1958. The Effect of an Informational Opion on The Fundamental Atribution Error.
Personality and Social Psychology Bulletin.
Rahayuningsih, S.U,. 2008. Sikap (Attitude) (online) http://www.Attitude.blogspot.com. Diakses, 18
Oktober 2010.
Rahayu, U. Dewi, K.N. Fitriana, 2015. Pengembangan Pariwisata Berbasis Masyarakat (Community
Based ourism) di Kabupaten Kulon Progo, Daerah Istimewa Yogyakarta,
www.eprints.uny.ac.id di download pada tanggal 30 Oktober 2019.
Rangkuti, F. 2007. Manajemen Persediaan:Aplikasi di Bidang Bisnis. Edisi 2 Jakarta: PT. Raja
Grafindo Pustaka.
Sarwono, J. 2007. Analisis Jalur Untuk Riset dan Bisnis dengan SPSS, Yogyakarta: Andi Offset.
Suwantoro, Gamal. (2004).“Dasar-Dasar Pariwisata”,Yogyakarta: Andi
Suansri, P. (2003).Comunity Based TourismHandbook.Bangkok,Thailand: Responsible Ecological
Social Tours (REST)Project.
T. Lopez, G. S. Sanches, V. Pavon, Community Based Tourism in Developing Countries: A case
Study, www.Researchgate.net, Diunduh tanggal 21 Oktober 2019
Undang-UndangNo. 32tahun 2004 tentangOtonomiDaerah

The 1st Internasional Forum Business and Economy (IFBE) 2019 Banjarmasin, 13-14 November 2019
85
T. W. Widarto, Strategi Menuju Desa Wisata Berkelanjutan, Dinduh October 16, 2018
http://padi.averroes.or.id
Yoeti, Oka. A. (2008). “Manajemen Pariwisata”,Jakarta: Pradnya Paramita
V. Nair, A. Hamzah (2015), Successful Community Based Tourism Approaches for Rural
Destinations.www.emeraldinsight.com, Diunduh tanggal 30 Oktober 2019.
Wolberg. 1967. Handbook of Psychology.
Young, K. 1956. Social Psychology. New York:McGraw-Hill Publisher.
The 1st Internasional Forum Business and Economy (IFBE) 2019 Banjarmasin, 13-14 November 2019
86
THE EFFECT OF THE EASE OF USE PERCEPTION AND PERCEPTION OF USE ON THE
IMPLEMENTATION OF FINANCIAL ACCOUNTING STANDARDS OF MEDIUM SMALL
MEDIUM ENTITIES ( SAK EMKM) IN UMKM IN BANJARMASIN CITY
Nurul Qalbiah1, Sandra Iriawan
2
Politeknik Negeri Banjarmasin [email protected]
Abstract: This study examines the effect of the easa of use perception and perception of use on the
implementation of SAK EMKM at MSMEs in Banjarmasin City. The sample of this study is
employees of accounting and MSMEs leaders who have to make financial reports but they have never
made financial reports before based on SAK EMKM. They are 50 respondents in total.
The research method which is used by the researchers in this study is a case study. The analysis in this
study uses multiple linear regression analysis. The hypothesis test indicates that the ease of use
perception and Perception of use have positive effects on the Implementation of Accounting
Standards for Micro, Small and Medium Enterprises (SAK EMKM).
Keywords: Ease of use perception, Perception of Use, SAK EMKM
BACKGROUND
MSMEs have very important roles in helping the government to overcome poverty by
providing new jobs. It also becomes a source of government revenue through tax
payments. According to the Ministry of MSMEs (2012) Most of number of MSMEs in Indonesia are
dominated by businesses in the micro sector, which is 98.77% of the total number of MSMEs. It
shows that the sizeable contribution is given by micro entities, especially in the absorption of labor.
In its development, MSMEs have several obstacles. One of them is financial statements which
are not in accordance with accounting standards in Indonesia. Previously, DSAK IAI has issued SAK
ETAP for the guidance of MSMEs financial statements. However, a lot of research on the application
of SAK ETAP in MSMEs has given results that the majority of MSMEs in Indonesia have not
implemented SAK ETAP. It is because some SAK ETAP MSMEs are considered complicated. SAK
EMKM is designed as a simple accounting standard which can be used for small and medium micro
entities, so that MSEs can prepare financial statements for accountability and decision making
purposes. The financial statements can also be used by entities to obtain funding from other parties as
well as tax reporting attachments. Then DSAK IAI issued SAK EMKM on December 8, 2016 with a
simpler concept compared to SAK ETAP. It intends for use by entities which have not been able to
fulfill the accounting requirements. This requirements were set out in SAK ETAP and issued to help
MSMEs; thus, MSMEs could fulfill their financial reporting needs which took effects on January 1,
2018.
SAK EMKM is a new system which is applied to small and medium-sized businesses to
optimize the performance of MSMEs. A new system will usually be considered as complicated way.
Moreover, it will not often be used by its users even though the benchmark of system acceptance is
rated by its use. A system which is often used shows that the system is better known, easier to use and
operate. (Pradipta and Supadmi, 2015).
The main problem which is the focus of the development of MSMEs is the management of
financial statements. The special SAK needs for SMEs is given that the majority of businesses in
Indonesia are still in the scale of Small Enterprises of MSMEs. Many MSMEs assume that financial
management is easy and simple. In reality, the financial management at MSMEs requires good
accounting skills by MSMEs businesses. Benjamin (1990) in Pradipta and Supadmi (2015) argued
that the weaknesses of MSMEs in preparing financial statements are partly due to the lack of
education and the lack of understanding of Financial Accounting Standards (SAK).
The 1st Internasional Forum Business and Economy (IFBE) 2019 Banjarmasin, 13-14 November 2019
87
In accordance with the development of MSMEs in reporting their financial statements, after
the issuance of Financial Standards for Micro, Small and Medium Enterprises (SAK EMKM), it is
expected to provide an overview of the performance of MSMEs management in the past and future
prospects. Hence, the financial statements which are produced can be trusted and relied upon by the
management, the members of the MSMEs, and the external parties who have other interests
associated with MSMEs. Since the enactment of SAK EMKM, the perceptions from various parties
emerged in response to the level of effectiveness, efficiency, level of ease and usefulness of the new
standard. Basically, when a system change is able to provide usefulness to its users, the system
will be well received and vice versa. But when the system is not useful or difficult to be used, it will
be abandoned by the user (Robbins, 2002). Wibowo (2006) said that the perception of ease of use of a
technology is defined as a measure. This measurement proves that people believes an information can
be easily understood and used.
Fitakurokhmah (2013) in her research stated that the perception of use and perception of ease
of use have positive effects on the use of SAK ETAP by BPR in Malang Raya. In the research of
Kusumawati (2014), the results shows that the perception of ease of use does not have significant
effect on the application of Financial Accounting Standards for Entities
without Public Accountability (SAK ETAP), and the perception of use to the application of Financial
Accounting Standards for Entities Without Public Accountability (SAK ETAP) is Significantly
applied to the Rural Bank (BPR) in Sleman. The result of the reserach whis is conducted by Pradipta
and Supadmi (2015) shows that there is positive and significant influence on the Perception of Ease of
Use and Use in the Implementation of SAK ETAP.
The research results of Anggraeni (2016) shows that the perception of ease of use has positive
and significant effect on intention to use; meanwhile, the preception of use has positive and
significant effect on intention to use. Ermawati, and Pomegranate (2016) research shows that the
variables of the perception of the use have significant positive effect on the use of E-banking. The
variable of use perception has significant positive effect on the use of E-
banking. Oktabriantono, et.all (2017) research shows that the variable of use perception has
significant positive effect on the use of E-banking, and the perception of ease of use has significant
positive effect on the use of E-banking,
Because SAK EMKM is effective on January 1, 2018, there are still not many researches
related to the perception of use and the perception of ease of use in the use of SAK EMKM. Thus, the
researchers use similar research journals as a theoretical basis as the background of this research.
The Research Problem Formulation The number of MSMEs is very large and spread in each region, according to the Ministry of
MSMEs (2012). It is mostly dominated by businesses in the micro sector which amounted to 98.77%
of the total number of MSMEs. In its development, MSMEs have several obstacles, one of them is the
financial statements which are not in accordance with accounting standards in Indonesia. Previously,
DSAK IAI had issued SAK ETAP for the guidance of MSMEs financial statements. However, a lot of
research on the application of SAK ETAP in MSMEs has given results. The results show that the
majority of MSMEs in Indonesia have not implemented SAK ETAP. It is because some SAK ETAP
MSMEs are considered to be complicated. From the results of previous studies, it indicates that the
perception of use and the perception of ease of use have influence in implementing financial statement
standards.
The research problems are formulated as follows:
1. Does the perception of ease of use affects the implementation of SAK EMKM?
2. Does the perception of use affects the implementation of SAK EMKM?
The Research purposes The research objectives to be achieved are as follows:
1. To determine the effect of the perception of ease of use on the implementation of SAK EMKM.
2. To determine the effect of the perception of use on the implementation of SAK EMKM.
The 1st Internasional Forum Business and Economy (IFBE) 2019 Banjarmasin, 13-14 November 2019
88
The Research Urgency As far as researchers' observations are concerned, the empirical studies which discuss
the implementation of SAK EMKM are still inadequate. It is because this system has just been
implemented in January 1, 2018 . This research is directed to be able to contribute both theoretically,
practically. The formulation of policies as described below:
1. The contribution to theoretical aspects, it is expected to be useful for the development of
knowledge related to Financial Accounting Standards for Micro, Small and Medium
Enterprises (SAK EMKM).
2. The contributions to practical aspects, it is expected to be a reference for the business owner /
entities who apply IFRSs EMKM in recording financial statements .
LITERATURE REVIEW
Understanding EMKM
In determining in which entities are included in the MSMEs definition and criteria, they can
apply SAK EMKM. According to IAI in SAK EMKM (2016: 1) Micro, Small and Medium
Enterprises (MSMEs) are entities without significant public accountability, which fulfill the
definitions and criteria of micro, small and medium businesses as stipulated in the legislation in force
in Indonesia, for at least two years in a row. On July 4, 2008 Law No. 20 of 2008 concerning Micro,
Small and Medium Enterprises.
According to MSMEs regulations in Indonesia, the definition of Micro Business is productive
business owned by individuals and/or individual business entities which fulfill the criteria for Micro
Business. Small Business is a productive economic business which stand-alone,a dn it is carried out
by individuals. This kind of business is not carried out by business entities which are subsidiaries or a
branch of the company or a part either directly or indirectly of medium businesses or large
businesses. Medium Business is a stand-alone productive economic business which is carried out by
individuals. This kind of business are not subsidiaries or branch companies of Small Business or large
business with a net worth or annual sales proceeds as regulated in this Law.
In general, the characteristics of MSMEs are stand-alone management, self-provided capital,
local marketing areas, small company assets, and limited number of employees. The principles
of MSMEs implementation are togetherness, a democratic economy, independence, balance of
progress, sustainability, efficiency of justice, and national economic unity. The MSMEs asset and
turnover value limits according to MSMEs regulations are as follows: Micro Businesses have
maximum net worth of IDR 50,000,000.00 , excluding the land and the buildings for business
premises; or have annual sales results of at most Rp. 300,000,000.00. Whereas the limitation for
Small Business is having a net asset of more than Rp 50,000,000.00 up to a maximum of Rp
500,000,000.00 excluding the land and the business premises or having annual sales of more than Rp
300,000,000.00 to with a maximum of Rp 2,500,000,000.00. (Law No. 20, 2008) .
Definition of Perception According to Kamus Besar Bahasa Indonesia (2008: 674), the perception is interpreted as a
response (acceptance) directly from something. It is a process of someone knows several things
through the five senses. According to Ikhsan and Ishak (2005: 57), the perception is how people see or
interpret events, objects, and humans. In fact, each person has his/her own perception of an event
which is different from one another. The formal definition of perception is the process in which a
person chooses, tries, and interprets stimuli into an integrated and meaningful picture. Every
individual's perception of an object or event is very dependent on different time and space
frameworks. The difference is caused by two factors, namely factors within oneself (cognitive
aspects) and external factors (aspects of visual stimulus) (Robins, 2002).
Understanding Ease Perception The perception of ease is the level where someone believes that technology is easy to
understand (Davis, 1989: 320). The definition is also supported by Wibowo (2006) which stated that
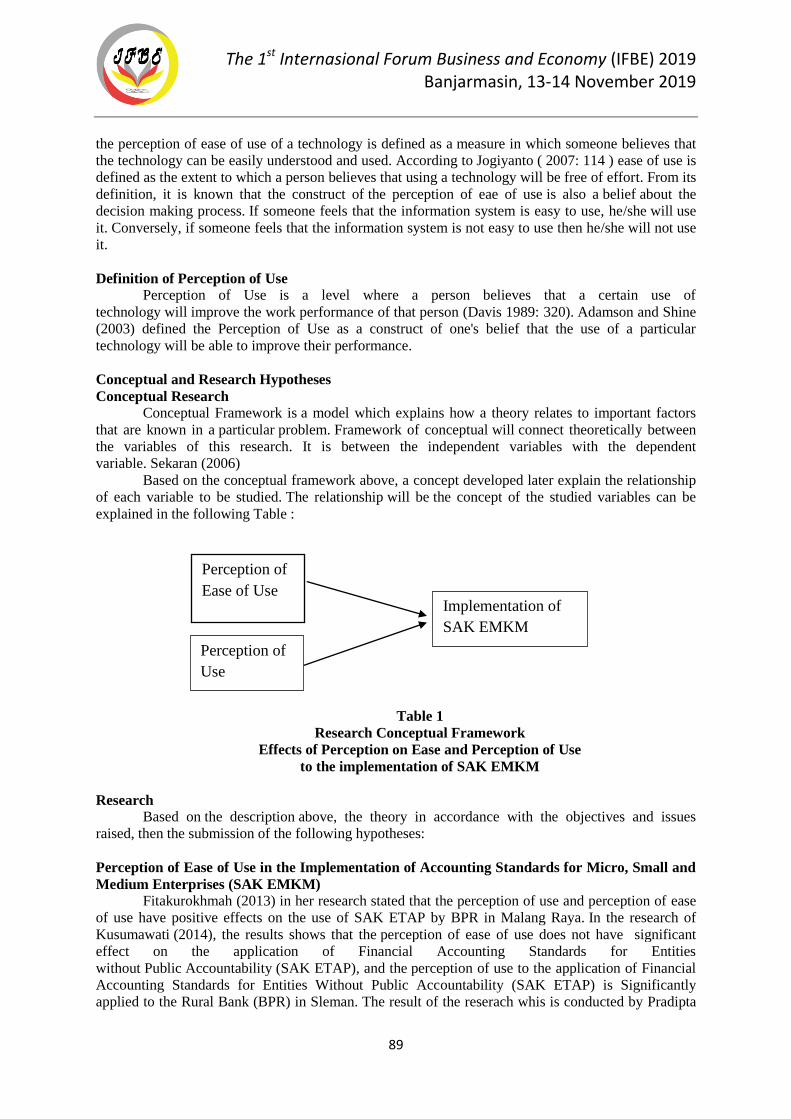
The 1st Internasional Forum Business and Economy (IFBE) 2019 Banjarmasin, 13-14 November 2019
89
the perception of ease of use of a technology is defined as a measure in which someone believes that
the technology can be easily understood and used. According to Jogiyanto ( 2007: 114 ) ease of use is
defined as the extent to which a person believes that using a technology will be free of effort. From its
definition, it is known that the construct of the perception of eae of use is also a belief about the
decision making process. If someone feels that the information system is easy to use, he/she will use
it. Conversely, if someone feels that the information system is not easy to use then he/she will not use
it.
Definition of Perception of Use Perception of Use is a level where a person believes that a certain use of
technology will improve the work performance of that person (Davis 1989: 320). Adamson and Shine
(2003) defined the Perception of Use as a construct of one's belief that the use of a particular
technology will be able to improve their performance.
Conceptual and Research Hypotheses
Conceptual Research Conceptual Framework is a model which explains how a theory relates to important factors
that are known in a particular problem. Framework of conceptual will connect theoretically between
the variables of this research. It is between the independent variables with the dependent
variable. Sekaran (2006)
Based on the conceptual framework above, a concept developed later explain the relationship
of each variable to be studied. The relationship will be the concept of the studied variables can be
explained in the following Table :
Table 1
Research Conceptual Framework
Effects of Perception on Ease and Perception of Use
to the implementation of SAK EMKM
Research Based on the description above, the theory in accordance with the objectives and issues
raised, then the submission of the following hypotheses:
Perception of Ease of Use in the Implementation of Accounting Standards for Micro, Small and
Medium Enterprises (SAK EMKM) Fitakurokhmah (2013) in her research stated that the perception of use and perception of ease
of use have positive effects on the use of SAK ETAP by BPR in Malang Raya. In the research of
Kusumawati (2014), the results shows that the perception of ease of use does not have significant
effect on the application of Financial Accounting Standards for Entities
without Public Accountability (SAK ETAP), and the perception of use to the application of Financial
Accounting Standards for Entities Without Public Accountability (SAK ETAP) is Significantly
applied to the Rural Bank (BPR) in Sleman. The result of the reserach whis is conducted by Pradipta
Perception of
Ease of Use
Perception of
Use
Implementation of
SAK EMKM
The 1st Internasional Forum Business and Economy (IFBE) 2019 Banjarmasin, 13-14 November 2019
90
and Supadmi (2015) shows that there is positive and significant influence on the Perception of Ease of
Use and Use in the Implementation of SAK ETAP.
Anggraeni (2016) in her research concluded that the perception of ease of use has significant
positive to the intention of use. Ermawati and Pomegranate (2016) research showed that the variables
of the perception of ease of use has positive effect significantly to the use of E-banking. The variable
of use perception has significant positive effect on the use of E-banking. Oktabriantono, et.all (2017)
research shows that the variable of use perception has significant positive effect on the use of E-
banking, and the perception of ease of use has significant positive effect on the use of E-banking.
Based on the theoretical basis, it can be concluded that MSMEs measure that SAK EMKM
can be used easily and can affect the implementation of accounting standards for small and medium
micro entities (SAK EMKM) at MSMEs in Banjarmasin. The hypothesis proposed in this study is as
follows:
H1: The perception of ease of use has positive effect on implementation to
small and medium micro entity accounting standards (SAK EMKM).
The Perception of Use in Implementing Accounting Standards for Small and Medium
Enterprises (SAK EMKM) Fitakurokhmah (2013) in her research stated that the perception of use and perception of ease
of use have positive effects on the use of SAK ETAP by BPR in Malang Raya. In the research of
Kusumawati (2014), the results shows that the perception of ease of use does not have significant
effect on the application of Financial Accounting Standards for Entities
without Public Accountability (SAK ETAP), and the perception of use to the application of Financial
Accounting Standards for Entities Without Public Accountability (SAK ETAP) is Significantly
applied to the Rural Bank (BPR) in Sleman. The result of the reserach whis is conducted by Pradipta
and Supadmi (2015) shows that there is positive and significant influence on the Perception of Ease of
Use and Use in the Implementation of SAK ETAP.
Anggraeni (2016) in her research concluded that the perception of ease of use has significant
positive to the intention of use. Ermawati and Pomegranate (2016) research showed that the variables
of the perception of ease of use has positive effect significantly to the use of E-banking. The variable
of use perception has significant positive effect on the use of E-banking. Oktabriantono, et.all (2017)
research shows that the variable of use perception has significant positive effect on the use of E-
banking, and the perception of ease of use has significant positive effect on the use of E-banking.
Based on the theoretical basis, it can be concluded that MSMEs measure that SAK EMKM
has many uses, and it influences the MSMEs to implement accounting standards for micro small and
medium entities (SAK EMKM). The researchers propose the following hypothesis:
H2: The perception of use has positive effect on the use of standards
accounting for small and medium micro entities (SAK EMKM) .
DATA AND METHOD
Types and Sources of Data This research uses a quantitative approach. This approach emphasizes the test of theories or
concepts through measurement variables as a metric or number, and performs the data analysis
procedures with equipment statistics to test the hypotheses (Indriantono and Supomo, 2002). Based on
the type, this research is classified as explanatory research (explanatory research). Explanation
research is used to analyze the relationships between one variable with another variable or how a
variable affects other variables through hypothesis test (Sugiyono, 2009). The respondents in this
study are the employees of accounting department and the leaders/owners of MSMEs in the city
of Banjarmasin. The data in this type of research are primary and secondary data. Primary data is
obtained from respondents' answers to questionnaires which are submitted by the
researchers. Secondary data in this study includes books, articles, data from internet search results,
archives and relevant supporting material.
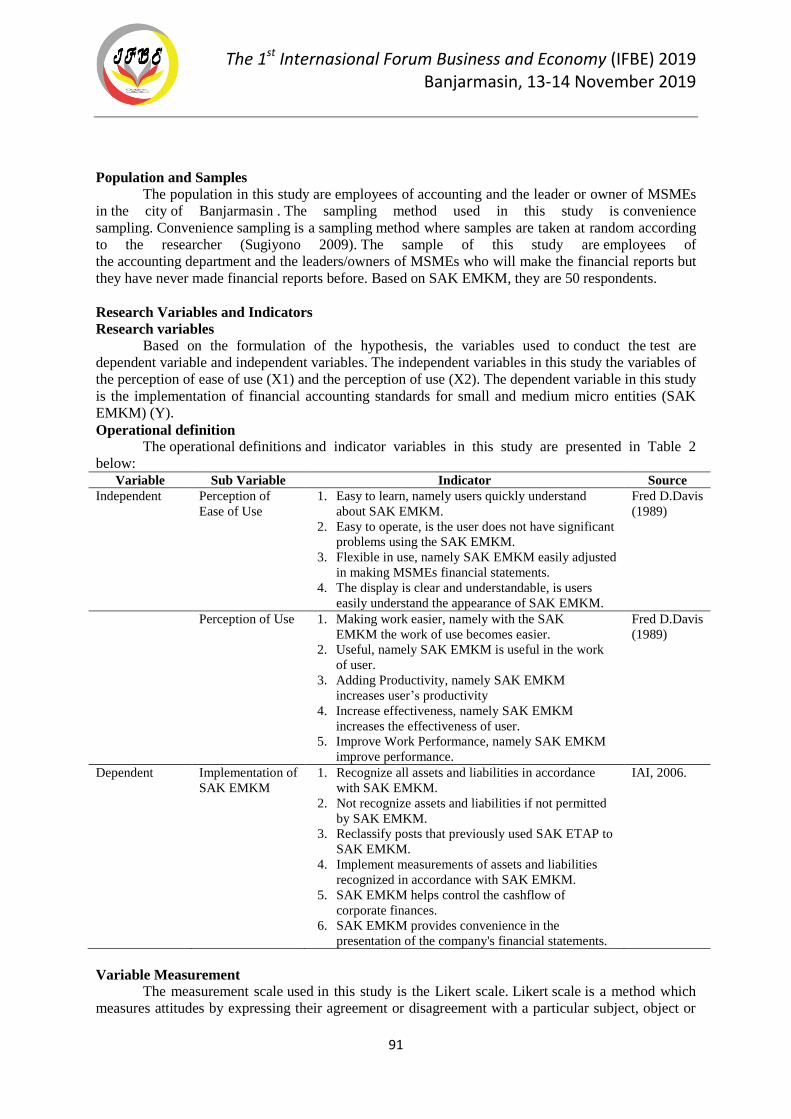
The 1st Internasional Forum Business and Economy (IFBE) 2019 Banjarmasin, 13-14 November 2019
91
Population and Samples The population in this study are employees of accounting and the leader or owner of MSMEs
in the city of Banjarmasin . The sampling method used in this study is convenience
sampling. Convenience sampling is a sampling method where samples are taken at random according
to the researcher (Sugiyono 2009). The sample of this study are employees of
the accounting department and the leaders/owners of MSMEs who will make the financial reports but
they have never made financial reports before. Based on SAK EMKM, they are 50 respondents.
Research Variables and Indicators
Research variables Based on the formulation of the hypothesis, the variables used to conduct the test are
dependent variable and independent variables. The independent variables in this study the variables of
the perception of ease of use (X1) and the perception of use (X2). The dependent variable in this study
is the implementation of financial accounting standards for small and medium micro entities (SAK
EMKM) (Y).
Operational definition The operational definitions and indicator variables in this study are presented in Table 2
below: Variable Sub Variable Indicator Source
Independent Perception of
Ease of Use
1. Easy to learn, namely users quickly understand
about SAK EMKM.
2. Easy to operate, is the user does not have significant
problems using the SAK EMKM.
3. Flexible in use, namely SAK EMKM easily adjusted
in making MSMEs financial statements.
4. The display is clear and understandable, is users
easily understand the appearance of SAK EMKM.
Fred D.Davis
(1989)
Perception of Use 1. Making work easier, namely with the SAK
EMKM the work of use becomes easier.
2. Useful, namely SAK EMKM is useful in the work
of user.
3. Adding Productivity, namely SAK EMKM
increases user’s productivity
4. Increase effectiveness, namely SAK EMKM
increases the effectiveness of user.
5. Improve Work Performance, namely SAK EMKM
improve performance.
Fred D.Davis
(1989)
Dependent Implementation of
SAK EMKM
1. Recognize all assets and liabilities in accordance
with SAK EMKM.
2. Not recognize assets and liabilities if not permitted
by SAK EMKM.
3. Reclassify posts that previously used SAK ETAP to
SAK EMKM.
4. Implement measurements of assets and liabilities
recognized in accordance with SAK EMKM.
5. SAK EMKM helps control the cashflow of
corporate finances.
6. SAK EMKM provides convenience in the
presentation of the company's financial statements.
IAI, 2006.
Variable Measurement The measurement scale used in this study is the Likert scale. Likert scale is a method which
measures attitudes by expressing their agreement or disagreement with a particular subject, object or
The 1st Internasional Forum Business and Economy (IFBE) 2019 Banjarmasin, 13-14 November 2019
92
event (Indriantoro and Supomo, 2002). Measurement criteria based on Likert scale as follows: SD
(Strongly disagree) weighted 1, D (Disagree) weighted 2, DO (Doubtful) weighted 3, A (Agreed)
weighted 4, and SA (Strongly Agree) weighted 5.
Research Data Analysis Methods and Methods The research method which is used by researchers in this research is a case study. The
technique is used by distributing questionnaires to the respondents, then the respondents will read and
answer the questions. The questionnaires which are used in this study are delivered directly by the
researchers to respondents. Also, the researchers entrusted several parties to be distributed to
respondents who fulfille the research criteria. The data analysis in this study uses multiple linear
regression to determine the effect of each variable. The models used in this study are:
M odel: I = a - β1X1 + β 1X2 + e
Note: I = Implementation of SAK EMKM
a = Constant
b1 = Regression Coefficient
X1 = Presence Then of Use
X2 = Perception of Use
E = confounding variable
Instrument Testing and Test Feasibility of Research Models. The research instruments test which are used in this study are the validity test and the
reliability test. The validity test is used to measure the validity of a questionnaire. The questionnaire is
said to be valid if the questions on the questionnaire are able to reveal something that will
be measured by the questionnaire. The reliability test is used to measure whether the data collected
through research instruments shows adequate internal consistency(Ghazali, 2016). The validity test in
this study uses the product moment correlation formula, and the reliability test uses Alpha
Cronbach formula to measure the level of reliability of respondents' answers.
The determination test is performed to test the Goodness-Fit of the regression model. The
feasibility test in this reseach is needed to see whether the regression equation will be used to test the
" fit " hypothesis or is feasible to use. To find the fit or absence of a regression equation, it can be seen
from the value of the F test, t test value, and the test of the coefficient of determination (R2).
RESULT AND DISCUSSION
Reliability Test and Validity Test The reliability test is intended to determine the minimum level of confidence which can be
given to the sincerity of the answers received. This test is carried out by looking at the consistency of
the Cronbach Alpha coefficient for all variables. The reliability test results can be seen in table 3. It
shows that a Cronbach Alpha value is greater than 0.6. It means that the research instrument is
declared reliable. It also means the consistency of respondents in answering questions can be trusted
for the value of the Cronbach Alpha .
The validity test is done by testing the correlation between the score of the question items
with the total score (Pearson Correlation). Each question item must be positively correlated to the
total score at the 5% significance level. The test results show the value of the correlation
coefficient between the questions items statistically. It is at a significant when the value is less than
0.05. The value is 0,000, and it shows the instrument is valid. These results are presented in table 3.
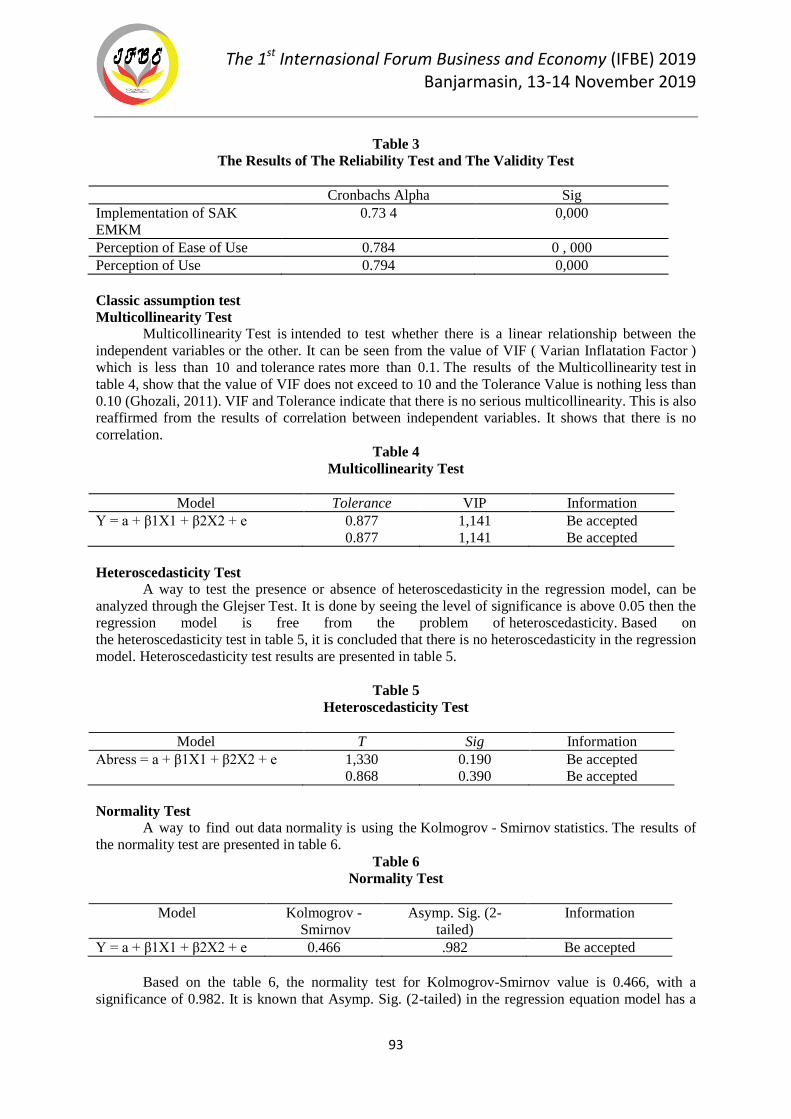
The 1st Internasional Forum Business and Economy (IFBE) 2019 Banjarmasin, 13-14 November 2019
93
Table 3
The Results of The Reliability Test and The Validity Test
Cronbachs Alpha Sig
Implementation of SAK
EMKM
0.73 4 0,000
Perception of Ease of Use 0.784 0 , 000
Perception of Use 0.794 0,000
Classic assumption test
Multicollinearity Test Multicollinearity Test is intended to test whether there is a linear relationship between the
independent variables or the other. It can be seen from the value of VIF ( Varian Inflatation Factor )
which is less than 10 and tolerance rates more than 0.1. The results of the Multicollinearity test in
table 4, show that the value of VIF does not exceed to 10 and the Tolerance Value is nothing less than
0.10 (Ghozali, 2011). VIF and Tolerance indicate that there is no serious multicollinearity. This is also
reaffirmed from the results of correlation between independent variables. It shows that there is no
correlation.
Table 4
Multicollinearity Test
Model Tolerance VIP Information
Y = a + β1X1 + β2X2 + e 0.877
0.877
1,141
1,141
Be accepted
Be accepted
Heteroscedasticity Test A way to test the presence or absence of heteroscedasticity in the regression model, can be
analyzed through the Glejser Test. It is done by seeing the level of significance is above 0.05 then the
regression model is free from the problem of heteroscedasticity. Based on
the heteroscedasticity test in table 5, it is concluded that there is no heteroscedasticity in the regression
model. Heteroscedasticity test results are presented in table 5.
Table 5
Heteroscedasticity Test
Model T Sig Information
Abress = a + β1X1 + β2X2 + e 1,330
0.868
0.190
0.390
Be accepted
Be accepted
Normality Test A way to find out data normality is using the Kolmogrov - Smirnov statistics. The results of
the normality test are presented in table 6.
Table 6
Normality Test
Model Kolmogrov -
Smirnov
Asymp. Sig. (2-
tailed)
Information
Y = a + β1X1 + β2X2 + e 0.466 .982 Be accepted
Based on the table 6, the normality test for Kolmogrov-Smirnov value is 0.466, with a
significance of 0.982. It is known that Asymp. Sig. (2-tailed) in the regression equation model has a
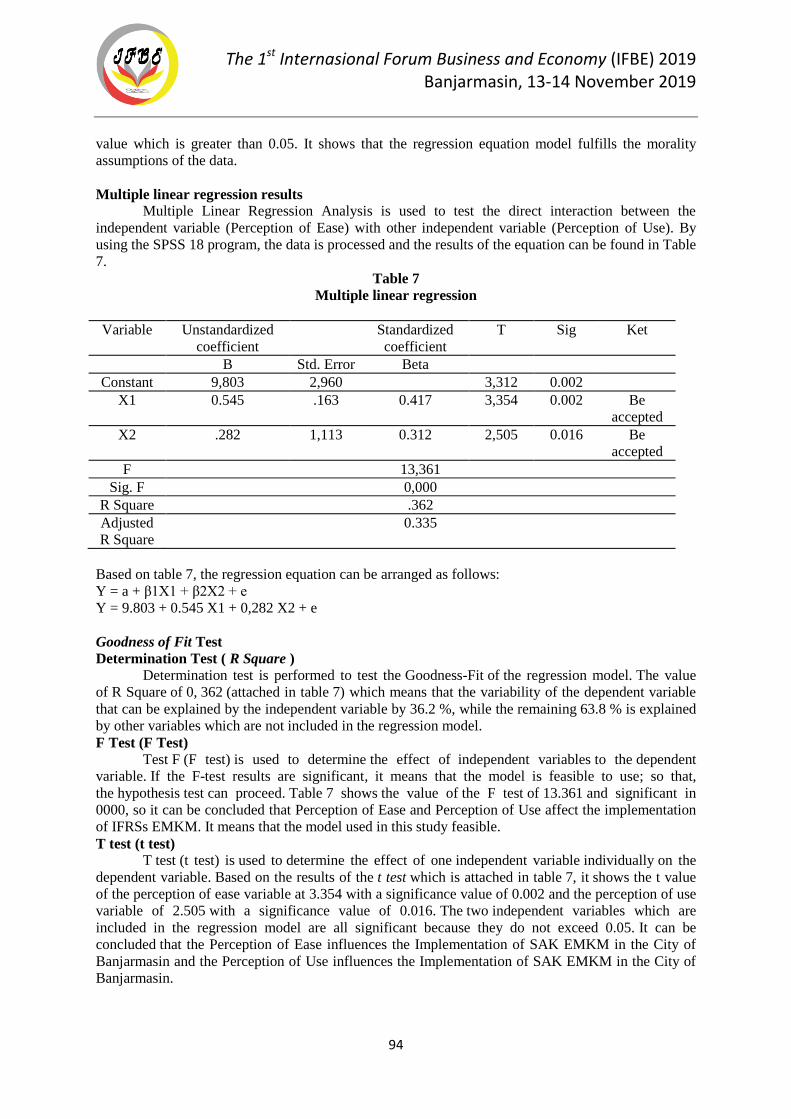
The 1st Internasional Forum Business and Economy (IFBE) 2019 Banjarmasin, 13-14 November 2019
94
value which is greater than 0.05. It shows that the regression equation model fulfills the morality
assumptions of the data.
Multiple linear regression results Multiple Linear Regression Analysis is used to test the direct interaction between the
independent variable (Perception of Ease) with other independent variable (Perception of Use). By
using the SPSS 18 program, the data is processed and the results of the equation can be found in Table
7.
Table 7
Multiple linear regression
Variable Unstandardized
coefficient
Standardized
coefficient
T Sig Ket
B Std. Error Beta
Constant 9,803 2,960 3,312 0.002
X1 0.545 .163 0.417 3,354 0.002 Be
accepted
X2 .282 1,113 0.312 2,505 0.016 Be
accepted
F 13,361
Sig. F 0,000
R Square .362
Adjusted
R Square
0.335
Based on table 7, the regression equation can be arranged as follows:
Y = a + β1X1 + β2X2 + e
Y = 9.803 + 0.545 X1 + 0,282 X2 + e
Goodness of Fit Test
Determination Test ( R Square ) Determination test is performed to test the Goodness-Fit of the regression model. The value
of R Square of 0, 362 (attached in table 7) which means that the variability of the dependent variable
that can be explained by the independent variable by 36.2 %, while the remaining 63.8 % is explained
by other variables which are not included in the regression model.
F Test (F Test) Test F (F test) is used to determine the effect of independent variables to the dependent
variable. If the F-test results are significant, it means that the model is feasible to use; so that,
the hypothesis test can proceed. Table 7 shows the value of the F test of 13.361 and significant in
0000, so it can be concluded that Perception of Ease and Perception of Use affect the implementation
of IFRSs EMKM. It means that the model used in this study feasible.
T test (t test) T test (t test) is used to determine the effect of one independent variable individually on the
dependent variable. Based on the results of the t test which is attached in table 7, it shows the t value
of the perception of ease variable at 3.354 with a significance value of 0.002 and the perception of use
variable of 2.505 with a significance value of 0.016. The two independent variables which are
included in the regression model are all significant because they do not exceed 0.05. It can be
concluded that the Perception of Ease influences the Implementation of SAK EMKM in the City of
Banjarmasin and the Perception of Use influences the Implementation of SAK EMKM in the City of
Banjarmasin.

The 1st Internasional Forum Business and Economy (IFBE) 2019 Banjarmasin, 13-14 November 2019
95
Hypothesis Test Results
The Effect of Perception of Ease on the Implementation of SAK EMKM The first hypothesis (H1) which states Perception of Ease of Use has positive effect on the
Implementation of Accounting Standards for Micro, Small and Medium Enterprises (SAK EMKM).
The result shows that H1 is accepted. Based on the results of the t-test significance of the perception
of ease of use variable has significance of 0.002. The empirical evidence shows that the perception of
ease of use has positive effect on the Implementation of Accounting Standards for Micro, Small and
Medium Enterprises (SAK EMKM). It is viewed from the direction of the regression coefficient of
3.354. So, it can be concluded that this study successfully tested the effect of perception of ease of use
on the Implementation of Accounting Standards for Micro, Small and Medium Enterprises (SAK
EMKM) at SMEs in Banjarmasin.
The results of this study are in line with the research on the researches about the perception
ease of use which are examined by Fitakurokhmah (2013), Setijawan and Permatasari (2014),
Pradipta and Supadmi (2015), Anggraeni (2016), Ermawati and Delima (2016), and Oktabriantono,
et.all (2014). 2017). The results of this study conclude that MSMEs which assume that SAK EMKM
can be used easily can affect the implementation of accounting standards for small and medium micro
entities (SAK EMKM) at MSMEs in Banjarmasin. MSMEs will prefer to use or implement it if it is
easy to use. However, if it gives a difficult effect to its users, then these users will tend to be reluctant
to implement SAK EMKM.
The Influence of The Perception of Use on the Implementation of SAK EMKM The second hypothesis (H2) stating Perception of Use has positive effect on the
Implementation of Accounting Standards for Micro, Small and Medium Enterprises (SAK EMKM).
The result shows that H2 is accepted. Based on the result of the t-test the significance of the
perception of use variable is 0.016, and the empirical evidence shows that the perception of use has
positive effect on the Implementation of Accounting Standards for Micro, Small and Medium
Enterprises (SAK EMKM). It is viewed from the direction of the regression coefficient of 2.505.
Thus, it can be concluded that this study successfully tested the effect of Perception of Use on the
Implementation of Accounting Standards for Micro, Small and Medium Enterprises (SAK EMKM) at
SMEs in Banjarmasin.
The results are consistent with researcha about the perception of use which is studied
by Fitakurokhmah (2013), Setijawan and Permatasari (2014), Pradipta and Supadmi
(2015), Anggraeni (2016), Ermawati and Pomegranate (2016), and Oktabriantono, et. all (2017). The
results of this study concluded that MSMEs assume that the SAK EMKM is very great usability. It
affects the MSMEs for implementing the entity's accounting standards micro small to medium (SAK
EMKM). So that, the perception of use affect the interest of MSMEs in using or implementing SAK
EMKM. The MSMEs feel helped by the existence of SAK EMKM .
CONCLUSION
The main objective of this study was to examine the effect of ethe perception of ease and the
perception of use on the implementation of SAK EMKM at MSMEs in Banjarmasin city. The
hypothesis test results indicate that the perception of ease of use and the perception of use have
positive effect on the Implementation of Accounting Standards for Micro, Small and Medium
Enterprises (SAK EMKM). The determination Test (R Square) shows the value of the dependent
variable which can be explained by the independent variable is 36.2%, while the remaining 63.8% is
explained by other variables. Hence, it is suggested in further research to add to the other variables.
REFERENCE
Adamson, I., & Shine, J. (2003). Extending the New Technology Acceptance Model to Measure the
End User Information Systems Satisfaction in a Mandatory Environment: A Bank’s Treasury.
Technolgy Analysis & Strategic Management, 15(4), 441–455.
Anggraeni, R. (2015). Pengaruh Persepsi Kemudahan Penggunaan dan Persepsi Kegunaan Terhadap
Niat Untuk Menggunakan dan Penggunaan Aktual Layanan Jejaring Sosial Berbasis Lokasi
The 1st Internasional Forum Business and Economy (IFBE) 2019 Banjarmasin, 13-14 November 2019
96
(Studi pada Mahasiswa Fakultas Ekonomi dan Bisnis Universitas Brawijaya Malang), 44–52.
Davis, F. D., & Davis, B. F. D. (1989). Perceived Usefulness , Perceived Ease of Use , and User
Acceptance of lnformation Technology, 13(3), 319–340.
Ermawati, N., & Delima, Z. M. (2016). Pengaruh Presepsi Kemudahan Penggunaan, Presepsi
Kegunaan, dan Pengalaman Terhadap Minat Wajib Pajak Menggunakan Sistem E-Filing, 5(2),
163–174.
Fitakhurrokhmah. (2013). Pengaruh Presepsi Kemudahan Penggunaan dan Presepsi kegunaan
Terhadap Penerapan Standar Akuntansi Keuangan Entitas Tanpa Akuntabilitas Publik ( studi
Empiris Terhadap Bank Perkreditan Rakyat di Sleman), 14.
Ghozali Imam. (2016). Aplikasi Analisis Multivariate Dengan Program SPSS (5th ed.). Semarang:
Universitas Diponegoro.
IAI. (2006). Standar Akuntansi Keuangan Entitas Mikro, Kecil, dan Menengah. Jakarta.
Ikhsan, A., & Ishak, M. (2005). Akuntansi Keperilakuan. Jakarta: Salemba Empat.
Indriantoro, N., & Supomo. (2002). Metodologi Penelitian Bisnis Untuk Akuntansi dan Manajemen
(Pertama). Yogyakarta: BPFE.
Jogianto. (2007). Sistem Informasi Keperilakuan (Revisi). Yogyakarta: Andi Offset.
KBBI. (2008). Kamus Besar Bahasa IndonesiA.
Kusumawati, I. (2014). Pengaruh Persepsi Kemudahan Penggunaan dan Persepsi Kegunaan
Terhadap Penerapan Standar Akuntansi Keuangan Entitas Tanpa Akuntabilitas Publik (Studi
Empiris Terhadap Bank Perkreditan Rakyat Di Sleman).
Oktabrianto, A. P. (2017). Pengaruh persepsi kebermanfaatan, persepsi kemudahan penggunaan,
keamanan, dan persepsi risiko terhadap penggunaan e-banking pada mahasiswa s1 fakultas
ekonomi universitas pendidikan ganesha, 8(2), 10.
Pradiptan, I. G. P. N. A., & Supadmi, N. L. (2015). ISSN : 2303-1018 E-Jurnal Akuntansi Universitas
Udayana KEGUNAAN PADA IMPLEMENTASI SAK ETAP ( STUDI EMPIRIS PADA UKM
DI DENPASAR UTARA ) Fakultas Ekonomi dan Bisnis Universitas Udayana ( Unud ), Bali ,
Indonesia Fakultas Ekonomi dan Bisnis Universitas Uda, 13, 857–887.
Robbins, S. P. (2002). Prinsip-prinsip Prilaku Keorganisasian. Jakarta: Erlangga.
Sekaran. (2006). Metodologi Penelitian Untuk Bisnis. Jakarta: Salemba Empat.
Setijawan;, I., & Permatasari, R. (2014). Analisis Persepsi Kemudahan dan Kegunaan Standar
Akuntansi Keuangan Entitas Tanpa Akuntabilitas Publik(SAK ETAP) pada Koperasi di
Semarang. Jurnal Bisnis Dan Ekonomi, 21(2), 163–175.
Sugiyono. (2009). Metode Penelitian Kuantitatif dan Kualitatif. Bandung: Alfabeta.
UU, R. I. (2008). Tentang Usaha Mikro, Kecil, dan Menengah.
Wibowo, A. (2006). Kajian Tentang Perilaku Pengguna Sistem Informasi Dengan Pendekatan
Technology Acceptance Mode (TAM), 8.
The 1st Internasional Forum Business and Economy (IFBE) 2019 Banjarmasin, 13-14 November 2019
97
FACTORS AFFECTING DECISIONS INVEST IN CAPITAL MARKETS
Hani Subagio1,
Shinta Heru Satoto2,
Sri Isworo Ediningsih3
Fakultas Ekonomi dan Bisnis UPN “Veteran” Yogyakarta [email protected]
Abstract: This study aims to review the theory of financial behavior and the concept of
behavioral motivation in the form of research propositions regarding the factors that influence
investment decisions in the capital market. Observations are planned for students who are
actively engaged in capital market activities or students who have conducted transactions in
the capital market. This study in detail seeks to determine the effect of knowledge and
learning factors in the process of selecting economic factors and behavioral motivations that
will influence the investment decision-making process. Economic factors include neutral
information, accounting information and classic. Whereas, behavior motivation includes Self
Image / Firm Image Coincidence, Social Relevance, Advocate Recommendation, and
Personal Financial Need.
Keyword: the theory of financial behavior and the concept of behavioral motivation,
economic factors and behavioral motivations
BACKGROUND
Investment is a form of capital investment which is made by investors to get profits. In
general, investors make the investments with the aim of improving the quality and welfare of life
through the benefits obtained. During its development, the public interest to investment in Indonesia
is still very low, especially to invest in the capital market. As of the end of March 2016, 64% of the
proportion of share ownership in Indonesia capital market is still dominated by the foreign investors
(PT Kustidian Sentral Efek Indonesia, 2016). The lack of interest from domestic investors can be
caused by the low understanding and knowledge of the public regarding the investment in Indonesia
capital market.
The basic understanding about investment is very important for investors, especially for
novice investors. The sufficient understading of investment will prevent the investors from the risk of
loss. It also can avoid irrational investment practices; thus the purpose of investment in the capital
market will be achieved. The investors will also be able to analyze which securities will be purchased
by adequate understanding of investment;so that, the securities are in accordance with the expected
returns of investors.
To increase the investor’s interest in investing in the capital market, the government through
Indonesia Stock Exchange conducts various programs to attract new investors, including the "Let's
Save Stock" campaign program. This campaign aims to motivate, educate and develop the capital
market industry, as well as adding new investors which lead to young generation groups such as
students and young employees (Rizki, 2017). The Indonesia Stock Exchange also increase the
cooperation with universities by establishing an Investment Gallery at the University. It is expected to
make it easier for students and young investors in general to get to know and conduct transactions in
the capital market.
The students have considerable potential to become new investors in the capital
market. Although they do not have their own income, the interest of students to invest in the capital
market is quite high. To support this thing, Indonesia Stock Exchange also issued a regulation which
the public can open a stock account with a minimum deposit of Rp 100,000.00 at a securities
company. It can be done by registering at the Investment Gallery. The investors can obtain 1 lot of
shares at a price of Rp. 1,000 per sheet with Rp 100,000.00 funds. The investment offered is in the
The 1st Internasional Forum Business and Economy (IFBE) 2019 Banjarmasin, 13-14 November 2019
98
form of shares and mutual funds. In this way, it is hoped that the students can more easily invest, and
they will have the perception that investment in the capital market does not require large capital.
The encouragement for students to get involved as investors in the capital market, is basically
supported by the University. The students get a lot of education (learning) which is provided in lecture
activities. In addition to compulsory courses in Investment Management and Financial Management
for students majoring in Management, the various activities are also held in collaboration with the
securities companies and Indonesia Stock Exchange. It includes the establishment of an exchange
corner as a learning medium, various investment motivational seminars, as well as investment classes
for students. However, the various obstacles still often arise which make students less motivated in
investing in the capital market even though they have adequate basic knowledge about the capital
market.
This study seeks to determine the factors which influence student investment decisions in the
capital market. This aims to further explore what factors are the basis of student investment decisions.
As it is explaine before that the sufficient knowledge and education for students often do not provide
the motivation for students to become investors in the capital market.
LITERATURE REVIEW
Investment and Investment Decisions
Investment is an activity of placing a number of funds in one or more assets during a certain
period in the hope of earning income or increasing the value of investment in a future period. The
purpose of investors is to obtain a profit or rate of return. Return of shares can be either capital
gains (the difference between the selling price and the purchase price) and the dividend yield. The
return is an indicator of the success or failure of an investment, if it is successful, it will increase the
welfare of investors. Therefore, investors need to set the expected returns by considerating various
information for investment decision making.
Investment decision is an important factor in the financial function, that the value of the
company is solely determined by investment decision. The statement implies that the investment
decision is important. Related to the importance of investment, the decision making of investment
must be managed; so that, it produces optimal investment decisions. An optimal investment decision
can be reached if the investor makes the right decision. The right decision is a decision which is in
accordance with the effect of events on the company's value. One of components which shapes a
company's value (reflected in its share price) is investor sentiment. It is an investor confidence in the
company's cash flow in the future which is not supported by accounting information (fundamental).
Financial Knowledge
Financial knowledge or often referred to financial literacy is a process or activity to
enhance the knowledge, trust and skills of consumers and the wider community; so that, they are
able to manage their finances better (Otoritas Jasa Keuangan, 2013). According to Kim (2001),
financial literacy is the basic knowledge which is needed by a person. It includes knowledge and
understanding of the principles of savings and investment. Lusardi and Mitchell (2007) describe
that the financial literacy as the knowledge about financial instruments, including one's knowledge
of savings, insurance, investment, and other financial instruments. In this case, financial literacy
can be interpreted as financial knowledge with the aim of achieving prosperity.
Hypothesis 1: Financial knowledge has positive effect on investment decisions
Investment Benefits
In investing, someone will be very concerned about the benefits of
investment. Investment can provide benefits such as the fixed income, the value which exceeds
inflation and the potential to provide long-term income. In addition, in investing, there are many
choices which can be made in accordance with the funds, and it is adjusted for changing
needs. (Umar, 2019)
The 1st Internasional Forum Business and Economy (IFBE) 2019 Banjarmasin, 13-14 November 2019
99
Riyadi's research (2016) found that the investment benefits affect the investment
interests of students in the capital market. It is because the students know the importance of
investment for life in the future with data, such as the pension, the need for urgent funds, and the
reduced inflationary pressures on the wealth of investment returns. The invested assets will
increase in value if the investment returns received.
Hypothesis 2 : The benefits of investment have positive effect on investment decisions
Minimum Investment Capital
Investment capital is one of the factors which is highly considered by someone before
investing. The less funds needed, the more attractive it is for someone to invest. The latest
regulations issued by Indonesia Stock Exchange (BEI) as capital market managers in Indonesia
in Decree Number: Kep-00071 / BEI / 11-2013 concerning the changes in trading units and price
fractions, are intended to attract the interest of new investors who have limited capital. The
decree changed the stock trading unit where previously 1 lot consisted of 500 shares to 1 lot =
100 shares with a minimum share price traded at Rp 50 per share to 100 with a minimum price of
shares traded on the IDX.
In addition, the minimum capital which must be deposited to open an account is only
IDR 100,000. This capital does not have to be spent entirely. After the account opening process,
the capital can be transferred again, and only a few number will be invested (Rizal, 2017). It is
expected that with this regulation the interest to invest will be even greater.
Riyadi's research (2016) proves that minimal investment capital influences the
investment interest of students in the capital market. For students, this minimal capital is quite
affordable to start an investment. While Crhystianti and Ariany (2011) found that the investors in
the age range of 25-29 years and 50-54 years thought of many factors before making
investments, including personal financial needs. The minimum investment capital will be an
important consideration before making investment decision.
Hypothesis 3 : The Minimum Investment Capital positively influences investment decision
Return on Investment
According to Brigham, et al. (1999), the rate of return of shares is an instrument to
measure the financial performance of companies which is based on the company's
shares. According to Corrado and Jordan (2000), the rate of return of shares is the profit gained
by investors from investment in shares and securities. These benefits can be in the form of
dividends or profits in the form of capital gains /losses.
According Jogiyanto (2010), the rate of return of shares can be divided into two
categories, namely the rate of return requested ( realized return ) and the expected rate of return
( expected return ). The requested rate of return is the rate of return which has already been
calculated using the historical data. This rate of return is very useful as a basis for
determining the rate of return which is expected in the future.
The expected rate of return is the rate of return which has not yet occurred, and it is
expected to occur in the future. This rate of return is used as a decision making tool. Raditya's
research (2013) shows that the perceptions of returns and risks have significant positive effects
on investment decision making.
Hypothesis 4 : Return has positive effect on investment decision making
Education (Learning)
Investment decision making by individual investors is often based on personal factors
such as education (learning). Education is one of the factors which is considered in investment
decision making (Lubis, et al., 2013). Individual investors have different levels of education, so
they have different levels of understanding in investment decision. The higher the level of
The 1st Internasional Forum Business and Economy (IFBE) 2019 Banjarmasin, 13-14 November 2019
100
education of a person, this investor will have better understandings in choosing stocks of
investment which will produce optimal returns and avoid risk. The higher the level of education
of a person, the more tolerant this investor will be to the risk of investment decision (Schooley
and Wooden, 1999)
Hypothesis 5 : Investment education (learning) has positive effect on investment decision
making
RESEARCH METHODS
Population and Sample The population in this study are all students who have invested in the capital market. The
sample in this study is a portion of the population that fulfills the criteria for students who have
invested, and who are still actively investing through Investment Gallery of various universities
in Yogyakarta
Research variable 1. Dependent Variable
The dependent variable in this study is the Investment Decision. Investment measurement is
done by measuring the reasons of students to make investments in the capital market
2. Independent Variable
a. Knowledge
Investment knowledge is the basic knowledge which possessed by an investor related to
investment. This variable is measured by how much knowledge a person has about investments, such
as an understanding of investment products, company profile, and economic conditions which need to
be considered
b. Education (learning)
Education is any planned effort to influence other people either individuals, groups, or
community; so that, they do what is expected by the actors of education (Notoadmojo,
2003). Investment education or learning is basic knowledge in investing. Education is measured by
looking at students' perceptions about various activities which can provide learning related to
investment in the capital market
c. Investment Benefits
Investment benefits are the benefits to be obtained by an investor when making
investments. Investment benefits are measured by using indicators of welfare benefits, economic
development benefits, future benefits, and fixed income benefits
d. Minimum Investment Capital
Minimum investment capital is capital for opening initial accounts before investing in the
capital market (Raditya, 2014). The measurements is done by looking at students' perceptions of the
nominal set in making investments
e. Return
Return is the expected rate of return of an investment. Returns are measured by using indicators
of student’s perceptions regarding the benefits to be gained from investment
Analysis Method To test the factors which influence the student investment decisions, the following regression
equation is used:
Kep_Invest = α 0 + α 1 Knowledge + α 2 Education + α 3 Benefits + α 4 Minimum Capital + α 5 Return +
ε
To prove hypotheses 1, 2, 3, 4, and 5 it is expected that the regression coefficients α 1, α 2, α 3, α 4 and
α 5 are significant at the specified significance level (1%, 5%, or 10%).
RESEARCH RESULT
Characteristics of Respondents
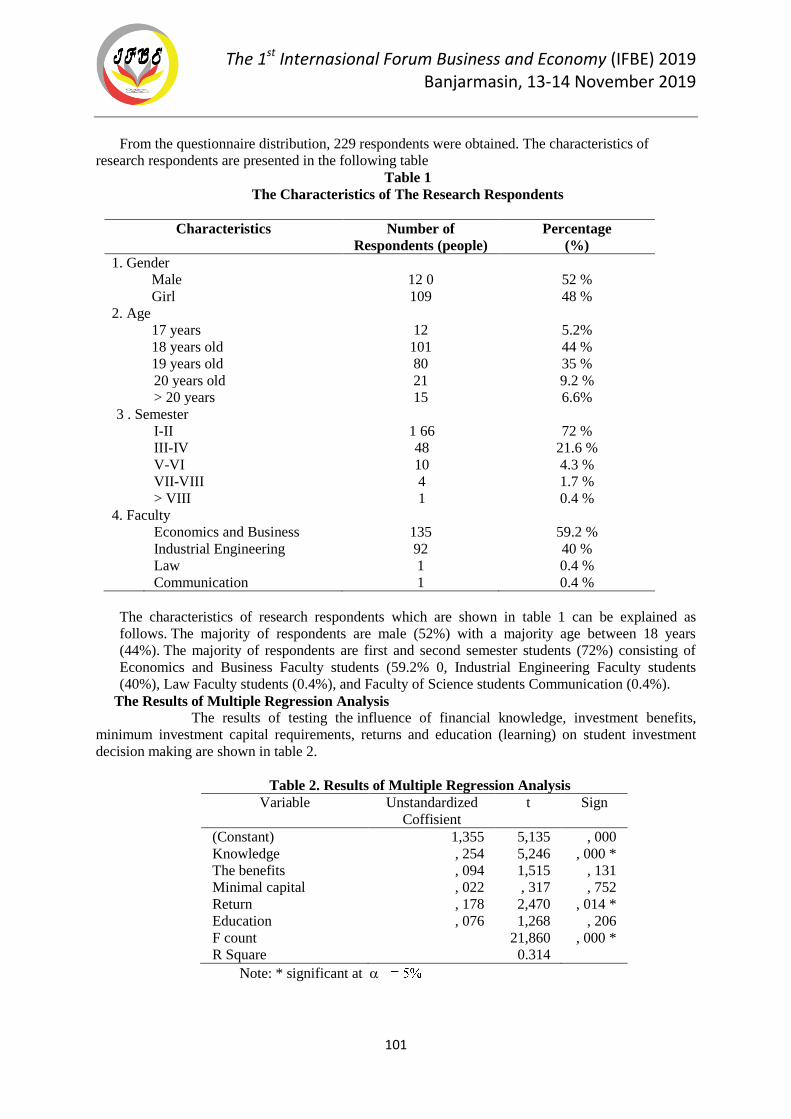
The 1st Internasional Forum Business and Economy (IFBE) 2019 Banjarmasin, 13-14 November 2019
101
From the questionnaire distribution, 229 respondents were obtained. The characteristics of
research respondents are presented in the following table
Table 1
The Characteristics of The Research Respondents
Characteristics Number of
Respondents (people)
Percentage
(%)
1. Gender
Male 12 0 52 %
Girl 109 48 %
2. Age
17 years 12 5.2%
18 years old 101 44 %
19 years old 80 35 %
20 years old 21 9.2 %
> 20 years 15 6.6%
3 . Semester
I-II 1 66 72 %
III-IV 48 21.6 %
V-VI 10 4.3 %
VII-VIII 4 1.7 %
> VIII 1 0.4 %
4. Faculty
Economics and Business 135 59.2 %
Industrial Engineering 92 40 %
Law 1 0.4 %
Communication 1 0.4 %
The characteristics of research respondents which are shown in table 1 can be explained as
follows. The majority of respondents are male (52%) with a majority age between 18 years
(44%). The majority of respondents are first and second semester students (72%) consisting of
Economics and Business Faculty students (59.2% 0, Industrial Engineering Faculty students
(40%), Law Faculty students (0.4%), and Faculty of Science students Communication (0.4%).
The Results of Multiple Regression Analysis The results of testing the influence of financial knowledge, investment benefits,
minimum investment capital requirements, returns and education (learning) on student investment
decision making are shown in table 2.
Table 2. Results of Multiple Regression Analysis
Variable Unstandardized
Coffisient
t Sign
(Constant) 1,355 5,135 , 000
Knowledge , 254 5,246 , 000 *
The benefits , 094 1,515 , 131
Minimal capital , 022 , 317 , 752
Return , 178 2,470 , 014 *
Education , 076 1,268 , 206
F count 21,860 , 000 *
R Square 0.314
Note: * significant at
The 1st Internasional Forum Business and Economy (IFBE) 2019 Banjarmasin, 13-14 November 2019
102
The test results show that the investment knowledge variable has a regression
coefficient of 0.254 (sign = 0,000 ), and the return variable has a regression coefficient of
0.178 (sign = 0.014 ) and has a significance level <0.05. It shows that investment knowledge
and return have positive influences on student investment decisions in the capital
market. Meanwhile, the variable of investment benefits has regression coefficient of 0.094
(sign = 0.131 ), the variable of minimum capital has a coefficient of regression of 0.022
(sign = 0.752 ), and the variable of education (learning) with a regression coefficient of 0.076
(sign = 0.206) has significance level > 0.05. These mean that the of variable investment
benefits, minimum investment capital and education (learning) do not affect student
investment decision. Therefore, it can be concluded that hypotheses 1 and 4 are supported.
DISCUSSION The testing to the influence of financial knowledge on investment decisions shows the positive
influence of financial knowledge on student investment decisions. It shows that the better one's
financial knowledge, the better investment decisions will be taken. Someone who has sufficient
financial knowledge will better understand the possible risks will be faced in making an investment.
The losses which have been experienced by them will be a valuable lessons which will affect them in
making further investment decisions. Someone who has enough financial knowledge will make an
investor inclined to be more confident in making an investment. According to Graham (2009), when
investors tend to feel confident, investors will more often conduct stock transactions.
Financial knowledge provides stock to investors regarding the availability of financial
information which is needed in considering an investment decision. The availability of financial
information including the company's financial statements, general information about price
movements, company reputation, the status of the company in the capital market, the company's
previous stock performance, and company performance which is expected to be achieved in the future
become important parts in making investment decision (Chong and Lal) , 2011). .
Almenberg and Widmark's research (2011) found that financial knowledge has a strong
relationship with stock investment decision. Mahfudh (2014) found that a person's financial
knowledge is a good indicator in diversifying his/her portfolio. Muller and Weber (2010) found a
positive influence between financial knowledge and investment decisions on low-cost
investment. Likewise, the research shows the positive influence of financial knowledge on investment
decisions. It indicates that the higher one's financial knowledge will greatly affect one's ability to
make an investment decision.
Testing the effect of return on investment decisions shows the positive influence of returns on
student investment decisions. Return (return rate) is the profit received by investors from investment
in shares and securities. In making an investment, investors have the expectation that the investment
made can provide benefits in the future. In this case, the return becomes an important part which is
taken into consideration in making investment decisions. However, the higher the return obtained, the
greater the risk which may be faced.
According to Hoffmann, Eije, and Jager (2006), in meeting the need for financial satisfaction,
an investor will make maximum efforts to be able to fulfill his/her needs. Therefore, an investor will
view profit as something important from an investment. According to Khan et.al (2015) the
investment returns are used by investors as an important criterion in choosing stocks and other
investment instruments. The expected return is the basis for investors to choose investment
instruments which suit their needs and desires. Investors will seriously consider options regarding past
returns or options which meet the expected return to make the best investment decisions.
Testing the effect of investment benefits, minimum investment capital and education (learning)
on investment decisions shows that these variables do not have effect on student investment decision
making. The result which shows that education (learning) do not affect student investment decisions is
in line with research by Kiran and Rao (2004) and Christanti and Mahastanti (2011).
The 1st Internasional Forum Business and Economy (IFBE) 2019 Banjarmasin, 13-14 November 2019
103
CONCLUSION In making investment decision, the students are influenced by financial knowledge and return
factors. It shows that financial knowledge which is obtained by students in college also plays a role in
student decision making for investment. In addition, the return (expected rate of return) is also taken
into consideration for students in making investment decisions. Basically, in making an investment, a
person must expect the benefits obtained in the future which can guarantee the welfare of his/her life.
While the benefits of investment, minimum investment capital and education (learning) do
not effect in student investment decision making. In this case, the students still rely on financial
knowledge obtained in college in making investment decisions. They do not try to join the training or
seminars in making investment decisions. Regarding the minimum investment capital which is
determined by the IDX, for students whose finances are still dependent on parents, the minimum
capital amount is still too high. It is because there are still other needs of students which must be
prioritized.
REFERENCES
Al Tamimi, Hussein A. Hassan, 2004, Factors Influencing Individual Investor Behavior: An
Emperical Study of the UAE Financial Markets, Associate Professor of the Department of
Business Administration, College of Business and Management , United Arab Emirates:
University of Sharjah, pp. 1 - 24.
Almenberg, J., and A. Dreber. 2011. Gender, financial literacy and stock market
participation. Working Paper , Stockholm School of Economics.
Chong, TP , and Lal, M. , M. , 2011 , An Empirical Evidence of Factors in Equity Selection Process
in Malaysia , African Journal of Business Management , 5 (15), 6221-6232.
Christanti, Natalia and Mahastanti, Linda Ariany, 2011, Factors Investors Considered in
Investing, Theory and Applied Management Journal, Year 4, No. 3
Evans, O. , 2019, Financial Literacy and Investment Decisions Among the Traders in the Techiman
Municipality, Research Journal of Finance and Accounting School of Business, Ghana, Vol.
10, No.6
Graham, J., Harvey, C., Huang, H., 2009, Investor Competence, Frequency Trading, and Home
Bias. NBER Working Paper . PP 1094 -1106
Hoffmann, AOI, Eije, von. JH, & Jager, W., 2006, Individual Investors' Needs and Conformity
Behavior: An Empirical Investigation in The Netherlands.
Kiran D., Rao US, 2004, Identifying Investor Group Segments Based on Demographic and
Psychographic Characteristics, MBA Project Report , Sri Sathya Sai Institute of Higher
Learning.
Khan, Fatima, Farhana A., and Mirza, AR, 2015, Factors Influencing Investor's decisions in
Stock Market Investment in Bangladesh: A Study on Khulna City, Journal of Finance and
Accounting 3: 198-204 .
Kumawati, 2011, The Effect of Motivation on Interest in Investing in the Capital Market with
Understanding of Investment and Age as Moderate Variables, Journal of Economics and
Accounting Information (Jenius), Vol.1, No.2, May
Müller S. and Weber, M. , 2010 , Financial Literacy and Mutual Fund Investments: Who Buys
Actively Managed Funds? , Schmalenbach Business Review , 62 (2), 126-153.

The 1st Internasional Forum Business and Economy (IFBE) 2019 Banjarmasin, 13-14 November 2019
104
Nagy, Robert A and Obenberger, Robert W, 1994, Factors Influencing Individual Investor
Behavior, Financial Analysts Journal , pp. 63-68 .
Puspitaningtyas, Zarah, 2013, Investor Behavior in Making Investment Decisions in the Capital
Market, Proceedings of the 5th National Seminar & Call for Paper Indonesian Management
Forum: "Strengthening The Strategy of Local Products in The Border Region: Opportunity and
Chalengges of The ASEAN Economic Community 2015 " , Faculty of Economics, Tanjungpura
University, Pontianak, 23-24 October 2013
The 1st Internasional Forum Business and Economy (IFBE) 2019 Banjarmasin, 13-14 November 2019
105
THE EFFECT OF KNOWLEDGE MANAGEMENT ON MARKETING PERFORMANCE
THROUGH COMPETITIVE ADVANTAGES OF MSMES FOOD PROCESSING
IN PURWOREJO REGENCY, CENTRAL JAVA
Hesti Respatiningsih1*
, Nazief Nirwanto2, Junianto Tjahjo Darsono
3
1) Program Studi Manajemen, Sekolah Tinggi Ilmu Ekonomi Rajawali
2 &3) Program Pascasarjana Program Doktor Ilmu Ekonomi, Universitas Merdeka Malang
Abstract: When MSMEs is confronted with a global market with a high level of competition, the
MSMEs problem becomes even more complicated. Consumer behavior is increasingly critical to
demand any business has an advantage in market competition. The era of the industrial revolution 4.0,
there are three main challenges that must be understood by MSMEs, namely technology, automation,
and disruption. Application of marketing strategies through the use of digital technology is one of the
efforts to scale up for MSMEs to have competitive value. This study aims to determine the effect of
knowledge management on marketing performance through the competitive advantage of food
processing SMEs in Purworejo Regency. This study uses data from a questionnaire distributed to 100
Micro, Small and Medium Enterprises (MSMEs) entrepreneurs engaged in food processing. Data
were analyzed by qualitative research methods with the type of exploratory research. The results
showed that knowledge management had a significant effect on marketing performance through the
competitive advantage of food processing MSMEs in Purworejo Regency.
Keywords: Knowledge Management, Competitive advantage, Marketing Performance, MSMEs
BACKGROUND
Micro, Small and Medium Enterprises (MSMEs) is one of the drivers of economic progress in
Indonesia. Data from the Coordinating Ministry for Economic Affairs shows that 93.4% of MSMEs,
5.1 are middle class businesses, and 1% is corporations. Therefore, MSMEs actors must be able to
scale up the managed businesses. The application of marketing strategies through the use of digital
technology is one of the efforts to scale up for MSMEs. However, one of the obstacles for MSMEs to
develop in this digitalization era is that only 9% of MSMEs managers understand digital issues (PWC
Indonesia; 2019)
In this competitive environment, marketing effectiveness and efficiency are needed to achieve
business objectives, namely market expansion and profit growth. Marketing activities undertaken can
be known to be effective and efficient when performance evaluations are carried out. Performance is a
measure of success or achievement achieved by a company. Organizational performance in general
can be measured by one or more measurements including: 1) the success of new products, 2)
profitability, 3) market share growth, 4) Return On Assets (Wei et al, 2014), 5) sales growth (davis et
al , 2010; Wei et al, 2014), 5) Effectiveness, 6) Efficiency, 7) adaptability (Bargava et al., 1994).
Performance can be measured using financial terms or using non-financial criteria. Marketing
performance is a non-financial performance measure that can be used to measure organizational
performance. An important element of general company performance is marketing performance
because marketing performance can show the company's performance so far. Marketing performance
is a concept to measure a company's marketing achievements. Every company has an interest to know
its achievements as a mirror of the success of its business in market competition. The company's
success in market competition is reflected in its achievements in market competition which is the
implementation of the strategy. Multidimensia in performance can be evaluated in various ways or
using other means, there is no unique measure of performance. Effectiveness, efficiency and
adaptability operate the term performance according to Bargava et al. (1994).
The competitive advantage according to Song & Perry (1997) is the company's ability to create
more effective competition in the market. Ehmke (2008) defines competitive advantage as an
The 1st Internasional Forum Business and Economy (IFBE) 2019 Banjarmasin, 13-14 November 2019
106
advantage gained over competitors by offering customers greater value or lower prices. This variable
is measured by three indicators namely product uniqueness, product quality and competitive prices.
First, the uniqueness of the product is the uniqueness of the company's products so that they can
distinguish them from competing products or general products on the market. Second is product
quality, namely the quality of products that have been successfully created by the company. And
third, competitive prices, namely the ability of companies to produce products at prices that are able
to compete in the market. (Song and Parry, 1997). Product excellence is the variables that are believed
to be able to improve marketing performance, especially for micro small and medium enterprises
(MSMEs). Yuniarti et al., (2018) resulted in the finding that MSMEs competitive advantage has a
positive value and a significant influence on marketing performance. According to Ejrami et al (2015)
there are three benchmarks to find out whether a company has a competitive advantage.
Knowledge management is needed since the creation of knowledge and then shared with
others. The empirical evidence presented in Syed & Lin's (2013) research is knowledge sharing,
building consistent processes and managing core competencies that is the most important knowledge
management practice. Research Syed & Lin (2013) found that knowledge management has a
significant impact on company performance. Whereas Nuryanti, et al (2017) produced findings that
knowledge management affects competitive advantage. This means that the better Knowledge
Management, the competitive advantage will increase.
If it is reviewed from previous research, there is a research gap in knowledge management on
competitive advantage and business performance. As research conducted byDjodjobo & Tawas
(2017); Indarto & Ariefiantoro (2015) that knowledge management does not show a significant
relationship to competitive advantage and business performance. Previous research as presented by
Gatignonand Robertson (1993); and Carneiro (2000) who produced findings that Knowledge
management provided efficient support for innovation and the company's competitive advantage,
while Byukusenge and Munene (2011); Nawab, Nasir, Zahid, Fawad (2015) that good knowledge
management will improve innovation and organizational performance, while this research innovation
and knowledge management become exogenous variables that will influence competitive advantage
and marketing performance.
When MSMEs is confronted with a global market in a high level of competition, the MSMEs
problem becomes even more complicated. Consumer behavior is increasingly critical to demand any
business which has an advantage in market competition. MSMEs still face fundamental difficulties,
for example capital, low managerial ability followed by low product quality, and underdeveloped
information and technology. On the other hand, the free trade system influences not only large-scale
businesses, but also MSMEs products. Therefore, it is necessary to prepare for the strengthening of
MSMEs nationally followed by more concrete and integrated action measures, so that MSMEs can
have adequate competitiveness. The purpose of this study is to examine the effect of knowledge
management on competitive advantage and business marketing performance
LITERATURE REVIEW
Relationship of Knowledge Management to Competitive Advantage
Drucker (1995) produces findings that knowledge is the most vital economic source for
achieving competitive advantage. According to Rahimli (2012), knowledge is a strategic asset which
is a capability and resource that is very difficult to copy and commercialize because they are scarce.
This research supports the research of Ling Tan (2011) which produced Knowledge Management
(KM) findings, which are seen as a source of sustainable competitive advantage, which has attracted
the attention of various companies throughout the business world, including Small and Medium
Enterprises (SMEs) in Malaysia. With the establishment of KM, systematic management of
organizational knowledge - strategic corporate assets cannot be taken lightly; can thus be created,
transferred, shared, and used, in encouraging greater organizational competitiveness, innovation and
productivity.
Research by Nuryanti et al (2017) produced findings that knowledge management influences
competitive advantage. This means that the better Knowledge Management, the competitive
The 1st Internasional Forum Business and Economy (IFBE) 2019 Banjarmasin, 13-14 November 2019
107
advantage will increase. This means that knowledge of goods and disseminating them to others such
as employees and responding to any development of knowledge will increase competitive advantage
for the company. Business performance is influenced by competitive advantage. It means that the
better the performance, the better the competitiveness of SMEs.
H1: Knowledge management influences competitive advantage
Relationship between Knowledge Management and Marketing Performance
Muchtar et al's research (2018) produced findings that entrepreneurial orientation, knowledge
management, competitive advantage had a positive and significant effect on business performance.
According to Daud & Wan Yusuf (2008) that the Knowledge Management process has a significant
relationship with organizational performance, where knowledge acquisition is the main process that
contributes to organizational performance. Knowledge acquisition consists of gathering, creating,
obtaining, producing, capturing and collaborating new knowledge activities. Because of their small
size, SMEs have the opportunity to gain direct and faster knowledge about the actions of competitors,
market trends and other developments. In research Syed & Lin (2013) said that knowledge
management is needed from the start of knowledge created and then shared. The empirical evidence
presented here shows that sharing knowledge, building consistent processes and managing core
competencies are the most important knowledge management practices, in this research, knowledge
management has a significant impact on company performance. Companies that facilitate good
knowledge management and promote effective knowledge practices will have competitive advantages
in the future, thereby increasing company performance.
H2: Knowledge management influences marketing performance
The Relationship between Competitive Advantage and Marketing Performance
Findings from the research of Zou et al. (2008) show that if a company considers its customers
as valuing services, the company is more likely to adopt a customer and competitor orientation; if the
company thinks that its customers are more price sensitive, then the company carries out competitor-
oriented development efforts. In addition, the greater customer orientation of the company, the more
companies are able to develop competitive advantage based on innovation and market differentiation.
Conversely, a competitor's orientation has a negative effect on the superiority of a company's market
differentiation. Finally, innovation and market differentiation of excellence lead to greater market
performance (for example, perceived quality, customer satisfaction) and in turn, higher financial
performance (for example, profits, market share). The results of research conducted by Li (2000; 313)
managed to find a positive influence between competitive advantage and performance as measured
through sales volume, profitability, market share, and return on investment. Competitive advantage
can be obtained from the company's ability to process and utilize its resources and capital.
Research Ejrami et al. (2015) explained that marketing potential affects the competitive
advantage of importing companies and at the same time marketing capabilities have an impact on the
performance of imported companies while competitive advantage can affect the performance of
imported companies. Other research that support is according to Yuniarti et al. (2018) which results in
the finding that positive market orientation and significant influence on competitive advantage,
internationalization and marketing performance. Competitive advantage has a positive value and a
significant influence on internationalization and marketing performance. Competitive advantage can
mediate the influence of market orientation on internationalization and marketing performance.
Studies conducted by several figures produce findings that performance is influenced by Knowledge
management. Research results from Nuryanti et al. (2017) shows that knowledge management
influences business performance which means better knowledge management in a company, then
business performance will increase. Research from Pardi et al (2014) reinforces the finding that
competitive advantage significantly influences marketing performance. This means that competitive
advantage has a significant positive effect on marketing performance in Batik UKM. Products making
customers interested are the company's strength to be able to compete with other companies.
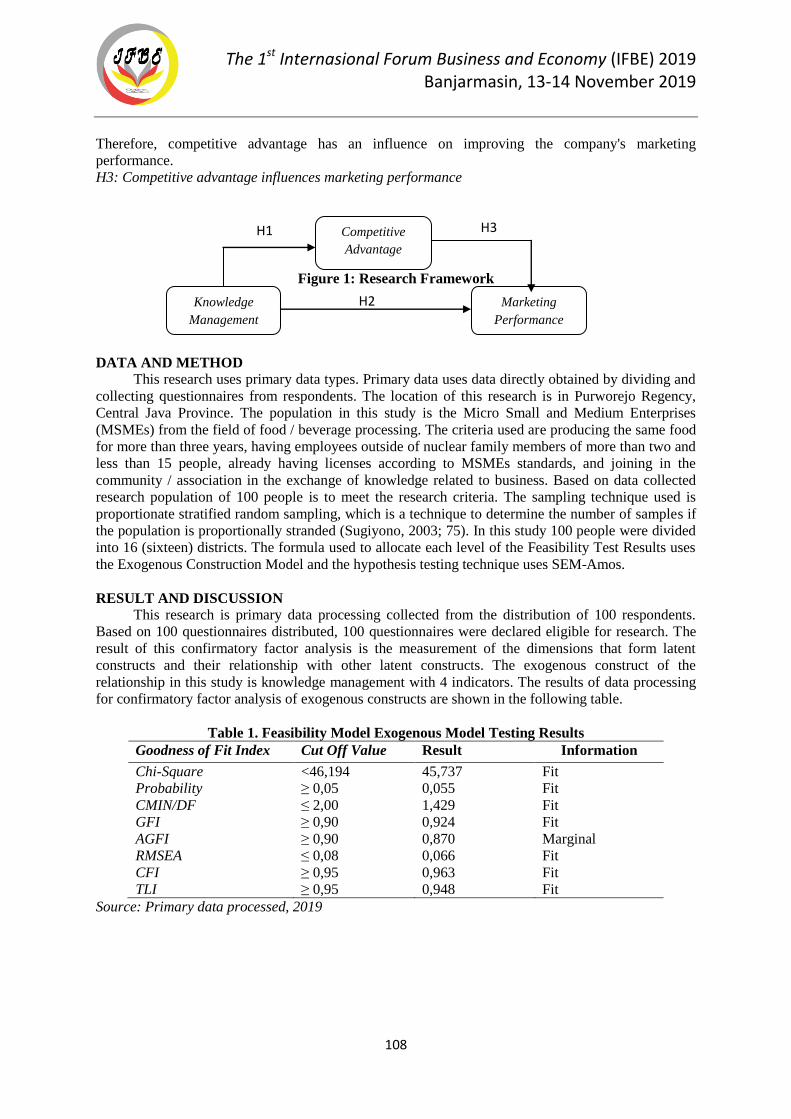
The 1st Internasional Forum Business and Economy (IFBE) 2019 Banjarmasin, 13-14 November 2019
108
H1
H2
H3
Therefore, competitive advantage has an influence on improving the company's marketing
performance.
H3: Competitive advantage influences marketing performance
Figure 1: Research Framework
DATA AND METHOD
This research uses primary data types. Primary data uses data directly obtained by dividing and
collecting questionnaires from respondents. The location of this research is in Purworejo Regency,
Central Java Province. The population in this study is the Micro Small and Medium Enterprises
(MSMEs) from the field of food / beverage processing. The criteria used are producing the same food
for more than three years, having employees outside of nuclear family members of more than two and
less than 15 people, already having licenses according to MSMEs standards, and joining in the
community / association in the exchange of knowledge related to business. Based on data collected
research population of 100 people is to meet the research criteria. The sampling technique used is
proportionate stratified random sampling, which is a technique to determine the number of samples if
the population is proportionally stranded (Sugiyono, 2003; 75). In this study 100 people were divided
into 16 (sixteen) districts. The formula used to allocate each level of the Feasibility Test Results uses
the Exogenous Construction Model and the hypothesis testing technique uses SEM-Amos.
RESULT AND DISCUSSION
This research is primary data processing collected from the distribution of 100 respondents.
Based on 100 questionnaires distributed, 100 questionnaires were declared eligible for research. The
result of this confirmatory factor analysis is the measurement of the dimensions that form latent
constructs and their relationship with other latent constructs. The exogenous construct of the
relationship in this study is knowledge management with 4 indicators. The results of data processing
for confirmatory factor analysis of exogenous constructs are shown in the following table.
Table 1. Feasibility Model Exogenous Model Testing Results
Goodness of Fit Index Cut Off Value Result Information
Chi-Square <46,194 45,737 Fit
Probability ≥ 0,05 0,055 Fit
CMIN/DF ≤ 2,00 1,429 Fit
GFI ≥ 0,90 0,924 Fit
AGFI ≥ 0,90 0,870 Marginal
RMSEA ≤ 0,08 0,066 Fit
CFI ≥ 0,95 0,963 Fit
TLI ≥ 0,95 0,948 Fit
Source: Primary data processed, 2019
Knowledge
Management
Competitive
Advantage
Marketing
Performance
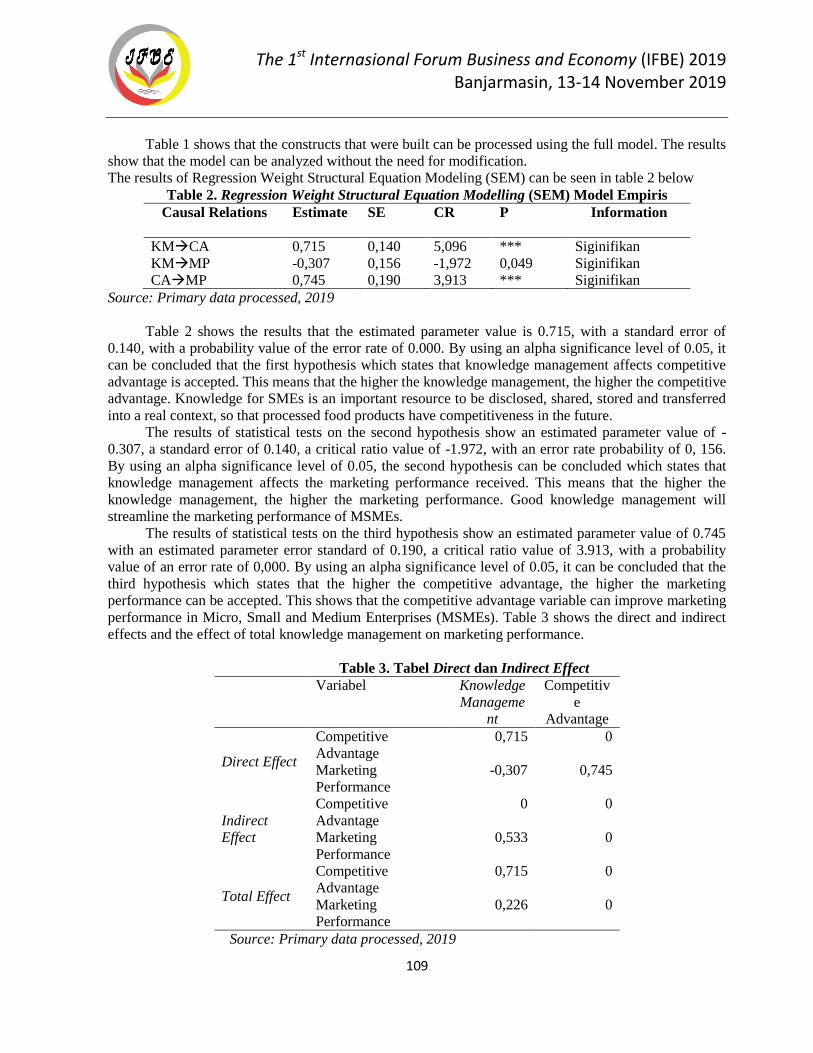
The 1st Internasional Forum Business and Economy (IFBE) 2019 Banjarmasin, 13-14 November 2019
109
Table 1 shows that the constructs that were built can be processed using the full model. The results
show that the model can be analyzed without the need for modification.
The results of Regression Weight Structural Equation Modeling (SEM) can be seen in table 2 below
Table 2. Regression Weight Structural Equation Modelling (SEM) Model Empiris
Causal Relations
Estimate SE CR P Information
KMCA 0,715 0,140 5,096 *** Siginifikan
KMMP -0,307 0,156 -1,972 0,049 Siginifikan
CAMP 0,745 0,190 3,913 *** Siginifikan
Source: Primary data processed, 2019
Table 2 shows the results that the estimated parameter value is 0.715, with a standard error of
0.140, with a probability value of the error rate of 0.000. By using an alpha significance level of 0.05, it
can be concluded that the first hypothesis which states that knowledge management affects competitive
advantage is accepted. This means that the higher the knowledge management, the higher the competitive
advantage. Knowledge for SMEs is an important resource to be disclosed, shared, stored and transferred
into a real context, so that processed food products have competitiveness in the future.
The results of statistical tests on the second hypothesis show an estimated parameter value of -
0.307, a standard error of 0.140, a critical ratio value of -1.972, with an error rate probability of 0, 156.
By using an alpha significance level of 0.05, the second hypothesis can be concluded which states that
knowledge management affects the marketing performance received. This means that the higher the
knowledge management, the higher the marketing performance. Good knowledge management will
streamline the marketing performance of MSMEs.
The results of statistical tests on the third hypothesis show an estimated parameter value of 0.745
with an estimated parameter error standard of 0.190, a critical ratio value of 3.913, with a probability
value of an error rate of 0,000. By using an alpha significance level of 0.05, it can be concluded that the
third hypothesis which states that the higher the competitive advantage, the higher the marketing
performance can be accepted. This shows that the competitive advantage variable can improve marketing
performance in Micro, Small and Medium Enterprises (MSMEs). Table 3 shows the direct and indirect
effects and the effect of total knowledge management on marketing performance.
Table 3. Tabel Direct dan Indirect Effect
Variabel Knowledge
Manageme
nt
Competitiv
e
Advantage
Direct Effect
Competitive
Advantage
0,715 0
Marketing
Performance
-0,307 0,745
Indirect
Effect
Competitive
Advantage
0 0
Marketing
Performance
0,533 0
Total Effect
Competitive
Advantage
0,715 0
Marketing
Performance
0,226 0
Source: Primary data processed, 2019
The 1st Internasional Forum Business and Economy (IFBE) 2019 Banjarmasin, 13-14 November 2019
110
Based on table 3 it can be seen that the magnitude of the total direct effect of each variable is
greater when compared to the magnitude of the direct effect between each variable. Therefore this study
produces findings that there is an influence between knowledge management variables on marketing
performance through the competitive advantage of MSMEs in Purworejo Regency, then the fourth
hypothesis is accepted. This condition actually shows that MSME managers in Purworejo district
especially MSMEs engaged in food processing need to improve knowledge management to be ready to
join the competition. MSMEs readiness shows that MSMEs marketing performance is getting better.
This research resulted in the finding that knowledge management carried out by SMEs engaged in
food processing has a significant effect on marketing performance through competitive advantage. This
shows that processed food products produced by MSMEs in Purworejo Regency from the results of
increasing the capacity of MSME entrepreneurs are able to improve their marketing performance through
competitive advantage. The product has an advantage with a unique, good quality product at a
competitive price on the market. The results of this study empirically prove that MSMEs engaged in food
processing in Purworejo Regency already have quality knowledge and human resources. Most
respondents have a high school education. In the context of increasing competitiveness, mastery of
knowledge is an important factor to boost competitiveness. This is where the excellence of food
processing SMEs. SMEs have the awareness that improving the quality of human resources is needed
especially in the areas of HR competencies such as knowledge, skills and abilities and attitude in
entrepreneurship. HR development must be carried out not only for MSMEs as business owners, but also
their workers. The spirit of entrepreneurship and increased productivity supported by technology
development becomes important in the focus of strengthening human resources.
The results of this study support the research of Carneiro (2000) which results in the finding that
Knowledge management provides efficient support for innovation and competitive advantage of
companies. According to Ling Tan (2011); Nuryanti, et al (2017) Syed & Lin (2013) produce findings
that knowledge management has a significant effect on competitive advantage. In addition this study
strengthens the results of research from Muchtar et al (2018) ;; Gatignonand Robertson (1993); while
Byukusenge and Munene (2011); Nawab, Nasir, Zahid, Fawad (2015) that good knowledge management
will improve innovation and organizational performance.
However, the results of this study do not support the research of Arshad et al (2014), Valdez-
juárez et al. (2016), Arend & Wisner (2005), Djodjobo & Tawas (2017), Chuang (2004) and Indarto &
Ariefiantoro (2015), that knowledge management does not show a significant relationship to competitive
advantage and business performance.
CONCLUSION
This study produces findings that competitive advantage mediates the effect of knowledge
management on marketing performance. This condition actually shows that MSMEs managers need to
improve knowledge management to be ready to join the competition. MSMEs readiness shows that
MSMEs marketing performance is getting better. Therefore, to improve competitive advantage and
marketing performance, Micro, Small and Medium Enterprises need to make efforts including: actively
participating in training the capacity building of MSMEs, especially in the field of information
technology; MSMEs must be disciplined in recording every business activity including financial
administration as an effort to protect knowledge; a culture of exchanging ideas and good coordination
needs to be improved between owners and employees, so that to minimize difficulties and obstacles in
the business; In addition, MSMEs should periodically conduct market surveys so that the price set is
truly in accordance with the quality of the product, in accordance with the purchasing power of the
community and more affordable than the prices of competitors
The 1st Internasional Forum Business and Economy (IFBE) 2019 Banjarmasin, 13-14 November 2019
111
REFERENCES
Bahram Meihami1, Hussein Meihami. (2013). Knowledge Management a way to gain a competitive
advantage in firms (evidence of manufacturing companies) International Letters of Social and
Humanistic Sciences Online: 2013-10-29 ISSN: 2300-2697, Vol. 14, pp 80-91.
doi:10.18052/www.scipress.com/ILSHS.14.80
BPS Kabupaten Purworejo.https://purworejokab.bps.go.id
Buuren Van Rick. (2005). Knowledge Management as Competitive Advantage. Bachelor Thesis
Economie & Informatica. Tilburg University.
Buuren, M.W. van, (2006). Competent decision-making. Managing multiple knowledge for spatial
development processes (in Dutch). Ph.D.Thesis. Den Haag: Lemma (PDF) Knowledge for
Governance, Governance of Knowledge: Inclusive Knowledge Management in Collaborative
Governance Processes. Available from:
https://www.researchgate.net/publication/230557477_Knowledge_for_Governance_Governance_o
f_Knowledge_Inclusive_Knowledge_Management_in_Collaborative_Governance_Processes
[accessed Dec 18 2018].
Byukusenge. Eugenie, and John C. Munene. (2017) Knowledge management and business performance:
Does innovation matter?.Cogent Business & Management, 4: 1368434.
https://doi.org/10.1080/23311975.2017.1368434.
Carneiro, A. (2000). How does knowledge management influence innovation and competitiveness?
Jounal of knowledge management. 4(2), 87-98
Djojobo, Cynthіa V. dan Hendra N. Tawas. 2014. Pengaruh OrіentasіKewіrausahaan, ІnovasіProduk,
dan Keunggulan Bersaіng Terhadap Kіnerja Pemasaran Usaha NasіKunіng dіKota Manado.
Jurnal EMBA. Vol.2 No.3. ІSSN 2303-1174
Drucker, Peter F. 1996. Inovasi dan Kewiraswastaan yang diterjemahkan oleh Rusjdi Naib. Jakarta:
Erlangga
Ehmke, Cole, (2008), Strategies for Competitive Advantage. Paper of Agricultural and Applied
Economics Department, University of Wyoming, Amerika
Ejrame Mohsen, Nader Salehi, Sahar Ahmadian. (2015). The effect of Marketing Capabilities on
Competitive Advantage and Performance with Moderating Role of Risk Management in
Importation Companies. 1st International Conference On Applied Economics And Business,
ICAEB 2015. Procedia Economics and Finance 30 (2016) 22-28
Ferdinand, Augusty, (2000a). “Manajemen Pemasaran: Sebuah Pendekatan Strategy”. Research Paper
Series. No. 01 Program Magister ManajemenUniversitas Diponegoro (Maret).
Ferdinand, Augusty, (2000b). “Structural Equation Modeling Dalam Penelitian Manajemen”. Seri
Pustaka Kunci No. 02 Semarang: Program Magister Manajemen Universitas Diponegoro
(Agustus).
The 1st Internasional Forum Business and Economy (IFBE) 2019 Banjarmasin, 13-14 November 2019
112
Ferdinand, Augusty., (2003). “Sustainable Competitive Advantage: Sebuah Eksplorasi Model
konseptual”. Fakultas Ekonomi Universitas Diponegoro. Semarang.
Gao, Y. (2010). Measuring Marketing Performance: a Review and a Framework. The Marketing Review.
Vol.10, No.1.
Gatignon, H. & Robertson, T. S., 1989. Technology Diffusion: An Empirical Test of Competitive
Effects. Journal of Marketing, Issue 53, pp. 35-49
Ghozali, Imam. (2014). Structural Equation Modeling: Metode Alternatif Dengan Partial Least Squares
(PLS). Semarang: Badan Penerbit UNDIP
Hartantyi, I. T, Ratnawati. A. (2013). Peningkatan kinerja pemasaran melalui Optimalisasi keunggulan
bersaing. EKOBIS. Vol.14, No.2, Januari 2013.
Indarto, & Ariefiantoro, T. (2015). Peran Inovasi dan Kemitraan dalam Meningkatkan Keunggulan
Bersaing UMKM Batik Semarangan. The 2nd University Research Coloquium, (2005), 172–179
Kamya, dkk. (2010). Knowledge Management and Competitive Advantage: The Interaction Effect of
Market Orientation. Journal of Business Management. Vol. 4 No.14: 2971-2980
Khan, R.A. (2012). Knowledge Management: A Framework for Competitive Advantage. Global Journal
for Information Technology and Computer Science, vol. 1 (1).
Ling Tan, Christine Nya. 2011. Knowledge Management Acceptence: Success Factors Amongst Small
And Medium-Size Entreprises. American journal Of Economics and Business Administration 3
(1); P.73-80. ISSN: 1945-5488.
Meihami, B., & Meihami, H. (2014). Knowledge Management a way to gain a competitive advantag e in
fir ms (evidence of manufacturing companies). International Letters of Social and Humanistic
Sciences (03), 80-91.
Mills, A., & Smith T.. (2010). Knowledge management and organizational performance: a decomposed
view. Journal of Knowledge Management, 2011, vol. 15(1): 156-171
Muchtar, Muliasari Kurniati. Miyasto, Edy Rahardja. 2018. Pengaruh Orientasi Kewirausahaan,
Knowledge Management, Dan Strategi Kemitraan Terhadap Keunggulan Bersaing Serta
Implikasinya Pada Kinerja Perusahaan (Studi Pada UMKM Kerajinan Logam Kecamatan Cepogo
Kabupaten Boyolali). Jurnal Bisnis Strategi . Vol. 27 No. 2 Desember 2018. P. 137 - 149 . P-
ISSN: : 1410-1246, E-ISSN : 2580-1171
Nawab Samina, Tahira Nazir, Muhammad Mohsin Zahid, and Syed Muhammad Fawad. 2015.
Knowledge Management, Innovation and Organizational PerformanceInternational Journal of
Knowledge Engineering, Vol. 1, No. 1, June 2015. P.42-47
Nuryanti, Samsir, Prima Andreas. (2017). The Influence Of Knowledge Management On Business
Performance And Competitive Advantage In Riau Food Products On Small And Medium
Enterprises In Pekan Baru. International Journal Of Scientific & Technology Research Volume 6,
Issue 10, October 2017 ISSN 2277-8616
The 1st Internasional Forum Business and Economy (IFBE) 2019 Banjarmasin, 13-14 November 2019
113
Pardi,Suharyono, Suyadi Imam, Arifin Zainul. (2014). The Effect of Market Orientation and
Entrepreneurial Orientation toward Learning Orientation, Innovation, Competitive Advantages and
Marketing Performance. European Journal of Business and Management. www.iiste.org. ISSN
2222-1905 (Paper) ISSN 2222-2839 (Online) Vol.6, No.21, 2014.
Rahimli, Ailar. (2012). Knowledge Management and Competitive Advantage. Information and
Knowledge Management, 2(7), 37-43. Diambil dari database www.iiste.org.
Song X. Michael and Parry M.E. (1997),The Determinants of Japanese NewProduct Successes.
Sugiyono. (2013). Metode Penelitian Manajemen: Pendekatan Kuantitatif, Kualitatif, Kombinasi,
Penelitian Tindakan, Penelitian Evaluasi. Bandung: Alfabeta.
Syed, N., & Lin, X. (2013). The linkage between knowledge management practices and company
performance: Empirical evidence, 6(1 LISS 2012), 1–7
Yuniari, Wayan , Ni Nyoman Kerti Yasa, I. G. A. Kt. Giantari. (2018). The Role Of Competitive
Advantage In Mediating The Influence Of Market Orientation On Internationalization And
Marketing Performance: A Study On Silver Craft Smes In Celuk Village, Bali Province. European
Journal Of Business And Social Sciences, Vol. 6, No. 10, January 2018. P.P. 55 – 71. Url:
Http://Www.Ejbss.Com/Recent.Aspx-/Issn: 2235 -767x
Zaied, A.N.H., Hussein, G.S., & Hassan, M.M.. (2012). The Role of Knowledge Management in
Enhancing Organizational Performance. International Journal Information Engineering and
Electronic Business, 2012, vol. 5, 27-35.
Zheng, Zhou Kevin. James R. Brown. Chekitan S. Dev Kevin Zheng Zhou.James R. Brown, Chekitan S.
Dev. 2008. Market orientation, competitive advantage, and performance: A demand-based
perspective. Journal of Business Research 62 (2009) 1063–1070.
The 1st Internasional Forum Business and Economy (IFBE) 2019 Banjarmasin, 13-14 November 2019
114
THE INFLUENCE OF TRANSFORMATIONAL LEADERSHIP, POWER DISTANCE, AND
FOLLOWERSHIP ON THE CAPABILITY OF MAKING A FIRST DECISION IN KOSTRAD
Burhanudin Amin1, Hamidah2, Kazan3
Master of Management/ Human Resource Management
Postgraduate Program at Jakarta State University [email protected]
Abstract : The purpose of the study is to analyze the influences of Transformational Leadership, Power
Distance and Followership on the Capability of Officers' Decision Making in Kostrad. The research
method used is the survey method which is taken from 293 respondents and associative research
explanations using the quantitative research. The writer uses path analysis as the data analysis
techniques. The results of the study shows that (1) Transformational Leadership has a direct positive
effect in Decision Making Capabilities, (2) Power Distance has a direct positive effect in Decision
Making Capabilities, (3) Followership has a direct positive effect in Decision Making Capabilities,
(4) Transformational leadership has a direct positive in Followership, (5) Power Distance has a direct
positive effect in Followership, (6) Transformational leadership has a direct positive effect in Decision
Making Capabilities that has a direct positive effect in Power Distance, (7) Transformational leadership
is influential not through the Power Distance mediation variable, (8) Transformational leadership has a
positive indirect effect in Decision Making Capabilities through mediation in Followership variables.
(9) Power Distance has an indirect positive effect in Decision Making Capabilities through mediation in
Followership variables.
Keywords : Transformational Leadership, Power Distance, Followership, Decision Making Ability of
Kostrad Officers.
INTRODUCTION
In accordance to Law No. 34 of 2004 concerning about the Indonesian Armed Forces which
explains that the TNI plays an important role and as an instrument of the state in the field of defense by
carrying out tasks based on state policy and political decisions. Therefore, the main task of the TNI is to
uphold the national sovereignty, maintain the territorial integrity of the Unitary State of the Republic of
Indonesia based on Pancasila and the 1945 Constitution, and protect the entire nation to all of Indonesia's
blood spills from threats and disturbances to the integrity of the state and nation. Furthermore, the TNI as
a national defense functions such as: (1) an antidote to any form of military threat and armed threats from
outside and within the country against sovereignty, territorial integrity, and national security, (2) an
action against any form of threat and (3) the recovery of state security conditions that are disturbed by
turmoil security.
The 1st Internasional Forum Business and Economy (IFBE) 2019 Banjarmasin, 13-14 November 2019
115
The Army Strategic Command (Kostrad), which is part of the Army, has the main task of
organizing the OMP and or OMSP in order to support the basic tasks of the Indonesian Army.
Management is the science associated with an organization, especially in achieving organizational goals
under the certain conditions. For achieving that goal, the organization must behave as effectively and
efficiently as possible by carrying out the functions of planning, organization, implementation and
supervision. The implementation of management in the country defense is called the defense
management. According to Supriyatno, it is explained that defense management is a process of
managing national resources into the potential resources, fostering strength / ability to use them
effectively and efficiently to enhance national defense, (Supriyatno, 2014).
A leader in a national defense organization is indeed very necessary. According to Yukl, it is a
process to influence followers (Montgomery, 2011). Leaders have various types of leadership based on
the type of leader who carries out an organization. One of them is transformational leadership, in which
the perspective is continually being expanded. Transformational leadership is a picture of charismatic and
inspirational leaders. The leader intellectually stimulates all followers thereby promoting rationality and
problem solving skills. The leader also provides individual consideration to followers and expects to
attend and provide the growth and development of an organization. There are a number of theoretical
statements that show that transformational leadership increases the influence of organizational behavior
created by these leaders to followers.
At this time, when the Indonesian Armed Forces (TNI) leaders are in a confronted condition
which is not fighting, the current conditions of providing organizational change demands to continue to
keep up with the changing times. The organizational change requires a leader to be able to transform, but
a leader who has a decision making must have a distance power, it is a Power Distribution meaning
according to Kirkman et al. , Chen, Farh, Chen, & Lowe, 2009). According to Lee, leaders usually
understand the right to allocate the resources, rewards and give punishment. With this condition,
subordinates must be more sensitive. The mismatches power must be careful when leaders interact with
superiors, (Lee Choong Y, 2012). According to Bochner and Hesketh, leaders with high power distance
orientation are more task-oriented and less people-oriented than leaders with lower power orientation,
(Bochner & Hesketh, 1994). Thus, according to Madlock, the superior-subordinate relationship is
limited to their daily work, which is caused a lack of outside communication. So, leaders with a low
power orientation can emphasize shared equality, but ignore the power differences, which is good for
active supervisor-subordinate communication and have good relations. As a result, subordinates will not
worry about the potential negative effects derived from seeking help from their superiors, (Madlock,
2012). In addition to a leader who has a distance power, the condition of the organization in the TNI
that does not have a battle has an impact on leadership style that can affect to Followership.
THEORETICAL REVIEW
The meaning of ability according to Robbins and Judge means that the capacity of the individual
to perform various tasks in a job, (Robbins & Judge, 2008a). While the meaning of ability according to
Kreitner and Kinicki is the broad characteristics and stable
The 1st Internasional Forum Business and Economy (IFBE) 2019 Banjarmasin, 13-14 November 2019
116
characteristics of responsibility at the maximum level of achievement which is contrary with the
ability to physically and mentally work (Kreitner & Kinicki, 2014).
Decision making is always related to a problem or difficulty. Through a decision and its
application, people expect that something will be achieved to resolve the problem or the conflict.
Literally, decision making meaning according to Terry is "cutting” (deciding or practically reaching a
conclusion). Then, formally the meaning of decision making can be defined as follows: "Decision
making is the selection based on criteria from two or more possible alternatives" ("as a choice based on
certain criteria regarding to certain behavioral alternatives rather than two or more alternatives”) (Terry,
2006a).
Terry explains the basics of decision making that can be applied as follows: (1) Intuition is a
decision made based on intuition or feelings that are more subjective, which means it is easily subjected
to suggestion, outside influences, and other mental factors. (2) Experience, in this case, experience can be
indeed used as a guide in solving problems. (3) Facts, decisions based on a number of facts, data or
information that is sufficient and indeed a good and solid decision. (4) Authority, decisions based on
more authority which will lead to routine nature. (5) Rational, rational decisions relating to usability,
(Terry, 2006a). Thus, the basics needed in decision making are Intuition, Experience, Facts, Authority
and Rational.
According to Robbins and Judge transformational leadership is leadership that inspires followers
to put aside their personal interests and has an extraordinary ability to influence (Robbins & Judge,
2008b). Thus, transformational leadership can inspire members or followers. Furthermore, the
characteristics of transformational leadership according to Bass in Robbins and Judge are: (1) The ideal
influence: giving vision and mission, instilling pride, and gaining respect and trust, (2) Inspirational
motivation: high expectations communication, such as using symbols to focus efforts and stating
important goals simply.
(3) Intellectual stimulation: increasing intelligence, rationality and careful problem solving and (4)
Individualized consideration: giving personal attention, such as treating each employee individually,
training and giving advice, (Bass, 2008).
Transformational leadership has exceptional and impressive advantages with high productivity
and greater employee’s satisfaction and service. According to Bass's formulation in Yukl, said that the
characteristics of transformational leadership are, (1) Ideal Influence (Charisma), such as giving vision
and mission, instilling pride, gaining trust, (2) Inspiration, such as communicating high expectations
using symbols and focus to efforts, expressing important purposes in simple ways, (3) Intellectual
stimulation, such as promoting intelligence, rationality and careful problem solving, (4) Individual
considerations, such as giving personal attention, treating each employee individually, training and
advising (Bass, 2007). Based on the expert opinion above, it can be concluded that transformational
leadership is leadership that can inspire followers in achieving goals. Transformational leader
characteristics include that ideal influence, such as inspirational motivation, intellectual stimulation and
individualized consideration.
Furthermore, the meaning of power distance according to Hofstede et.al (2010) is the level of
acceptance of less powerful institutional members and organizations in a country for expecting and
receiving power to be distributed unevenly. One dimension of national culture (from small to large).
Thus, power distance can be defined as the level of existence of institutions and organizations members
that are less strong in a country by expecting and receiving unevenly power distribution. Institutions are
basic elements of society, such
The 1st Internasional Forum Business and Economy (IFBE) 2019 Banjarmasin, 13-14 November 2019
117
as families, schools and communities. Organization is a place where people work. (Hofstede,
Hostede., & Michael Minkov, 2010).
The cultural dimension according to Hofstede which supports the low power distance (Small
Power Distance) expects and accepts the consultative or democratic power relations. People relate to
each other regardless of their formality position. Subordinates feel more comfortable and demand the
right to contribute the decision making. Such as in countries with large power distances, they tend to
use power relations that are more autocratic and paternalistic. Subordinates recognize the power of
others only based on which they are in a formal structure or a certain hierarchical position. Thus, the
power distance index which is defined by Hofstede does not reflect to objective differences in power
distribution, but rather to the way people perceive difference power. (Hofstede, 2010)
Based on the description above, it can be concluded that power distance is the level of members
who can be able to receive unequal power distribution in an organization with dimensions, which means
(1) that support the low power distance (Small Power Distance) for expecting and accepting power
relations more consultatively or democratically and (2) by high power distances which tend to use more
autocratic power relations.
Although Gardner and others have recognized the importance of leaders and followers who are
working together in order to realize the vision, the literature usually pays little attention to the concept of
followership, and there is no "theory" of followership. One of the initial discussions of followership was
delivered by (Pittman, Rosenbach, Potter), which outlined four types, namely:
a. Subordinates: Similar like "sheep", do what they told, but they are not actively involved.
b. Contributors: "Yes" people, supportive, engaging, doing good work, but they do not have a
willing to challenge ideas from leaders.
c. Politicians: Willing to give honest and supportive feedback to leaders, but they may neglect
work and have poor performance levels.
d. Partners: High level involved, performed at a high level, promoted positive relationships in
groups, seen as 'leaders in waiting,' (Gardner, 2007).
So, the types of followership among them are subordinates, contributors, politicians and partners.
Based on the description above, it can be concluded that followership is an act of someone who has a
subordinate role and cooperates with the leader in supporting organizational goals which have several
types of followers including such as subordinates, contributors, politicians and partners.
RESEARCH METHOD
The applied research method uses is a survey method from 293 respondents combined with the
associative research explanations through the quantitative research. The collecting data technique is
using the questionnaires the primary data and observational studies and documentation from the Kostrad
as the secondary data. First, the writer conducts the direct observations research in the Kostrad
environment in Java. Second, the writer interviews the informants who are related to the research
variables. Third, the writer spread the research questionnaire to respondents to obtain results.
Furthermore, the writer uses the path analysis as the data analysis technique. Based on the description
and constellation research scheme model above, the hypothesis research proposed, namely: H1:
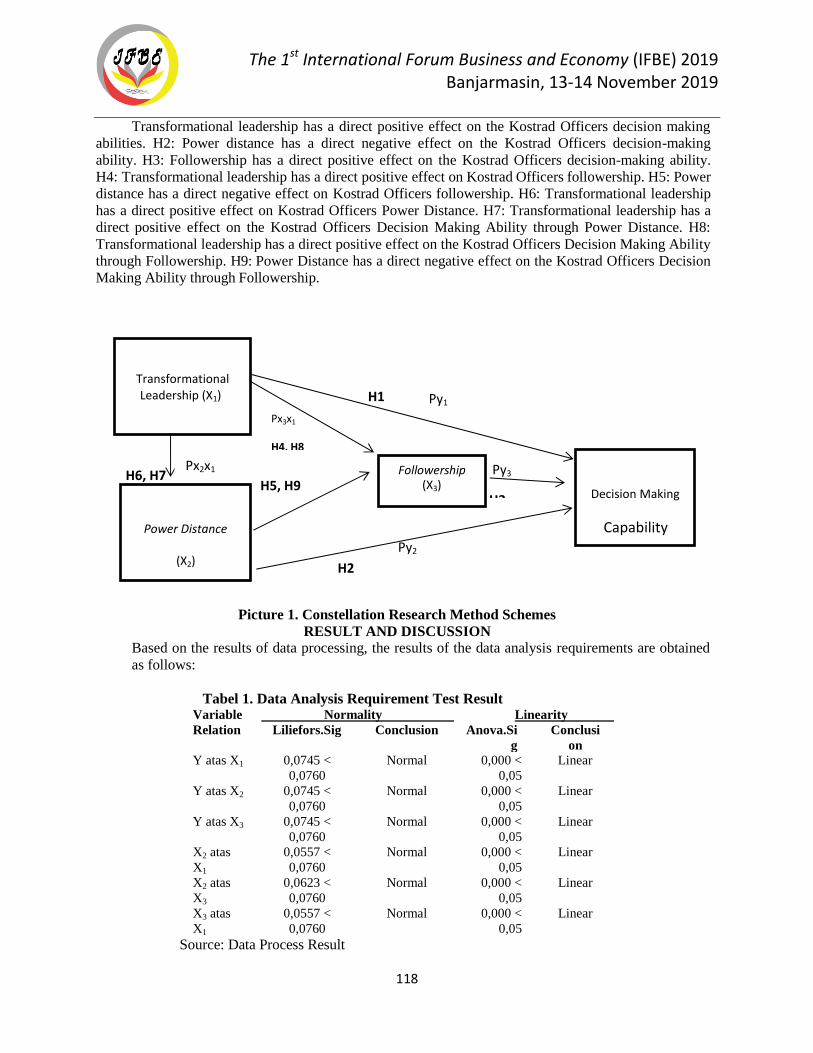
The 1st International Forum Business and Economy (IFBE) 2019 Banjarmasin, 13-14 November 2019
118
H1 Py1
Px3x1
H4, H8
H6, H7 Px2x1
H5, H9
Px3x2
Followership(X3)
Py3
H3
Py2
H2
Power Distance
(X2)
Decision Making
Capability
(Y)
Transformational Leadership (X1)
Transformational leadership has a direct positive effect on the Kostrad Officers decision making
abilities. H2: Power distance has a direct negative effect on the Kostrad Officers decision-making
ability. H3: Followership has a direct positive effect on the Kostrad Officers decision-making ability.
H4: Transformational leadership has a direct positive effect on Kostrad Officers followership. H5: Power
distance has a direct negative effect on Kostrad Officers followership. H6: Transformational leadership
has a direct positive effect on Kostrad Officers Power Distance. H7: Transformational leadership has a
direct positive effect on the Kostrad Officers Decision Making Ability through Power Distance. H8:
Transformational leadership has a direct positive effect on the Kostrad Officers Decision Making Ability
through Followership. H9: Power Distance has a direct negative effect on the Kostrad Officers Decision
Making Ability through Followership.
Picture 1. Constellation Research Method Schemes
RESULT AND DISCUSSION
Based on the results of data processing, the results of the data analysis requirements are obtained
as follows:
Tabel 1. Data Analysis Requirement Test Result Variable
Relation
Normality Linearity
Liliefors.Sig Conclusion Anova.Si
g
Conclusi
on
Y atas X1 0,0745 <
0,0760
Normal 0,000 <
0,05
Linear
Y atas X2 0,0745 <
0,0760
Normal 0,000 <
0,05
Linear
Y atas X3 0,0745 <
0,0760
Normal 0,000 <
0,05
Linear
X2 atas
X1
0,0557 <
0,0760
Normal 0,000 <
0,05
Linear
X2 atas
X3
0,0623 <
0,0760
Normal 0,000 <
0,05
Linear
X3 atas
X1
0,0557 <
0,0760
Normal 0,000 <
0,05
Linear
Source: Data Process Result
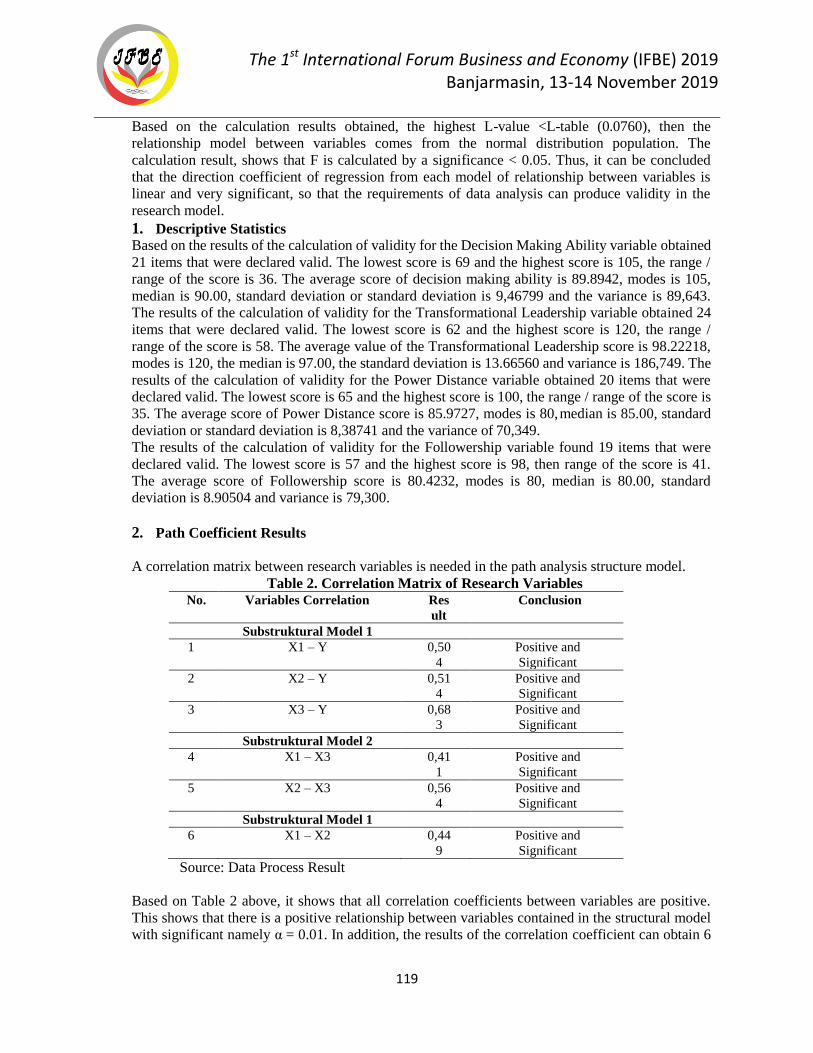
The 1st International Forum Business and Economy (IFBE) 2019 Banjarmasin, 13-14 November 2019
119
Based on the calculation results obtained, the highest L-value <L-table (0.0760), then the
relationship model between variables comes from the normal distribution population. The
calculation result, shows that F is calculated by a significance < 0.05. Thus, it can be concluded
that the direction coefficient of regression from each model of relationship between variables is
linear and very significant, so that the requirements of data analysis can produce validity in the
research model.
1. Descriptive Statistics
Based on the results of the calculation of validity for the Decision Making Ability variable obtained
21 items that were declared valid. The lowest score is 69 and the highest score is 105, the range /
range of the score is 36. The average score of decision making ability is 89.8942, modes is 105,
median is 90.00, standard deviation or standard deviation is 9,46799 and the variance is 89,643.
The results of the calculation of validity for the Transformational Leadership variable obtained 24
items that were declared valid. The lowest score is 62 and the highest score is 120, the range /
range of the score is 58. The average value of the Transformational Leadership score is 98.22218,
modes is 120, the median is 97.00, the standard deviation is 13.66560 and variance is 186,749. The
results of the calculation of validity for the Power Distance variable obtained 20 items that were
declared valid. The lowest score is 65 and the highest score is 100, the range / range of the score is
35. The average score of Power Distance score is 85.9727, modes is 80, median is 85.00, standard
deviation or standard deviation is 8,38741 and the variance of 70,349.
The results of the calculation of validity for the Followership variable found 19 items that were
declared valid. The lowest score is 57 and the highest score is 98, then range of the score is 41.
The average score of Followership score is 80.4232, modes is 80, median is 80.00, standard
deviation is 8.90504 and variance is 79,300.
2. Path Coefficient Results
A correlation matrix between research variables is needed in the path analysis structure model.
Table 2. Correlation Matrix of Research Variables No. Variables Correlation Res
ult
Conclusion
Substruktural Model 1
1 X1 – Y 0,50
4
Positive and
Significant
2 X2 – Y 0,51
4
Positive and
Significant
3 X3 – Y 0,68
3
Positive and
Significant
Substruktural Model 2
4 X1 – X3 0,41
1
Positive and
Significant
5 X2 – X3 0,56
4
Positive and
Significant
Substruktural Model 1
6 X1 – X2 0,44
9
Positive and
Significant
Source: Data Process Result
Based on Table 2 above, it shows that all correlation coefficients between variables are positive.
This shows that there is a positive relationship between variables contained in the structural model
with significant namely α = 0.01. In addition, the results of the correlation coefficient can obtain 6
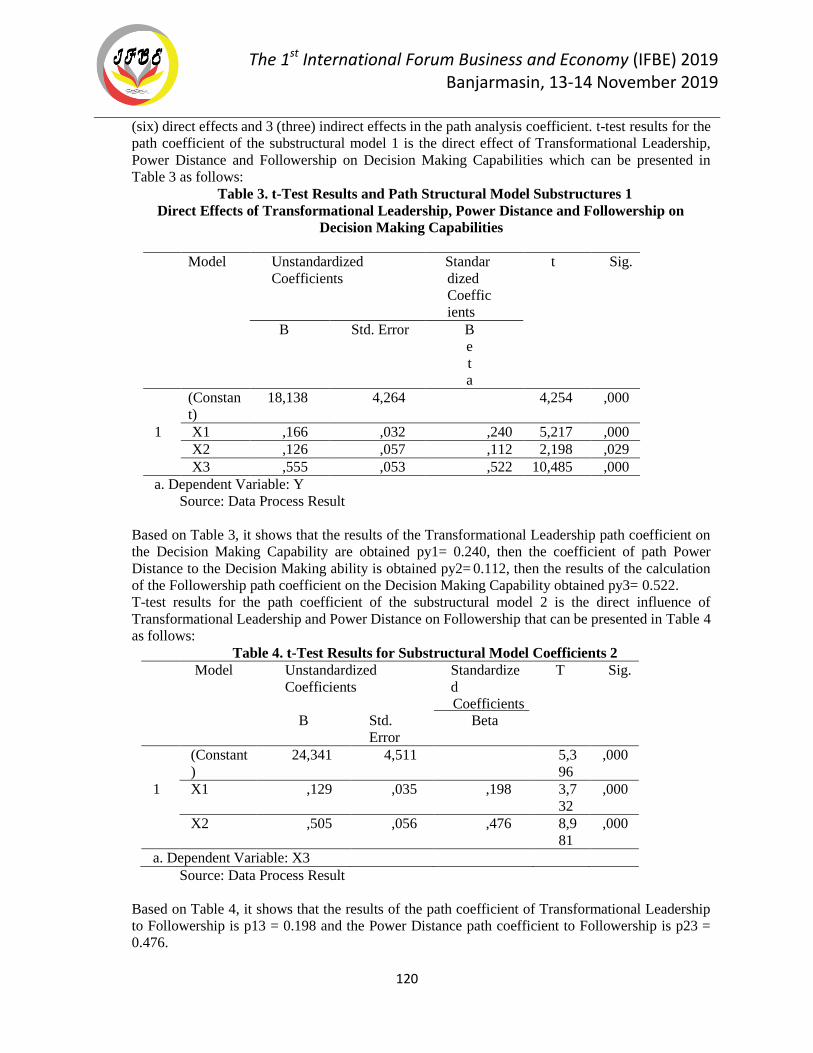
The 1st International Forum Business and Economy (IFBE) 2019 Banjarmasin, 13-14 November 2019
120
(six) direct effects and 3 (three) indirect effects in the path analysis coefficient. t-test results for the
path coefficient of the substructural model 1 is the direct effect of Transformational Leadership,
Power Distance and Followership on Decision Making Capabilities which can be presented in
Table 3 as follows:
Table 3. t-Test Results and Path Structural Model Substructures 1
Direct Effects of Transformational Leadership, Power Distance and Followership on
Decision Making Capabilities
Model Unstandardized
Coefficients
Standar
dized
Coeffic
ients
t Sig.
B Std. Error B
e
t
a
(Constan
t)
18,138 4,264 4,254 ,000
1 X1 ,166 ,032 ,240 5,217 ,000
X2 ,126 ,057 ,112 2,198 ,029
X3 ,555 ,053 ,522 10,485 ,000
a. Dependent Variable: Y
Source: Data Process Result
Based on Table 3, it shows that the results of the Transformational Leadership path coefficient on
the Decision Making Capability are obtained py1= 0.240, then the coefficient of path Power
Distance to the Decision Making ability is obtained py2= 0.112, then the results of the calculation
of the Followership path coefficient on the Decision Making Capability obtained py3= 0.522.
T-test results for the path coefficient of the substructural model 2 is the direct influence of
Transformational Leadership and Power Distance on Followership that can be presented in Table 4
as follows:
Table 4. t-Test Results for Substructural Model Coefficients 2
Model Unstandardized
Coefficients
Standardize
d
Coefficients
T Sig.
B Std.
Error
Beta
(Constant
)
24,341 4,511 5,3
96
,000
1 X1 ,129 ,035 ,198 3,7
32
,000
X2 ,505 ,056 ,476 8,9
81
,000
a. Dependent Variable: X3
Source: Data Process Result
Based on Table 4, it shows that the results of the path coefficient of Transformational Leadership
to Followership is p13 = 0.198 and the Power Distance path coefficient to Followership is p23 =
0.476.
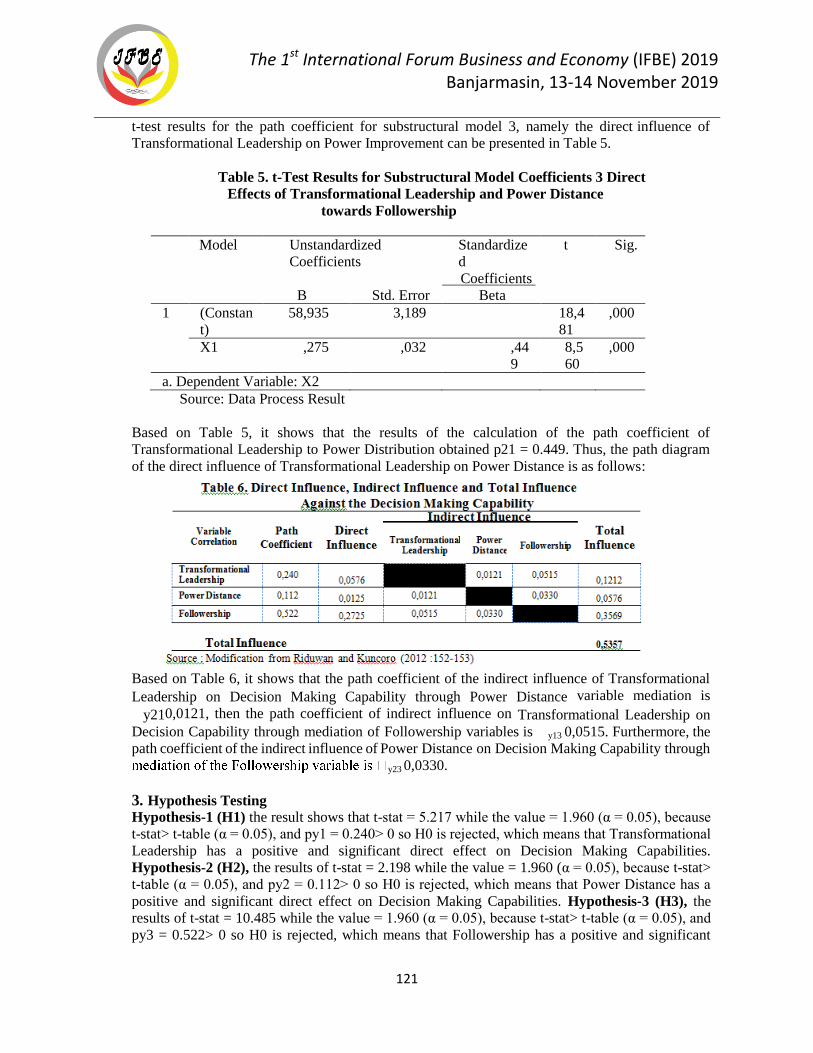
The 1st International Forum Business and Economy (IFBE) 2019 Banjarmasin, 13-14 November 2019
121
t-test results for the path coefficient for substructural model 3, namely the direct influence of
Transformational Leadership on Power Improvement can be presented in Table 5.
Table 5. t-Test Results for Substructural Model Coefficients 3 Direct
Effects of Transformational Leadership and Power Distance
towards Followership
Model Unstandardized
Coefficients
Standardize
d
Coefficients
t Sig.
B Std. Error Beta
1 (Constan
t)
58,935 3,189 18,4
81
,000
X1 ,275 ,032 ,44
9
8,5
60
,000
a. Dependent Variable: X2
Source: Data Process Result
Based on Table 5, it shows that the results of the calculation of the path coefficient of
Transformational Leadership to Power Distribution obtained p21 = 0.449. Thus, the path diagram
of the direct influence of Transformational Leadership on Power Distance is as follows:
Based on Table 6, it shows that the path coefficient of the indirect influence of Transformational
Leadership on Decision Making Capability through Power Distance variable mediation is
y210,0121, then the path coefficient of indirect influence on Transformational Leadership on
Decision Capability through mediation of Followership variables is y13 0,0515. Furthermore, the
path coefficient of the indirect influence of Power Distance on Decision Making Capability through
y23 0,0330.
3. Hypothesis Testing
Hypothesis-1 (H1) the result shows that t-stat = 5.217 while the value = 1.960 (α = 0.05), because
t-stat> t-table (α = 0.05), and py1 = 0.240> 0 so H0 is rejected, which means that Transformational
Leadership has a positive and significant direct effect on Decision Making Capabilities.
Hypothesis-2 (H2), the results of t-stat = 2.198 while the value = 1.960 (α = 0.05), because t-stat>
t-table (α = 0.05), and py2 = 0.112> 0 so H0 is rejected, which means that Power Distance has a
positive and significant direct effect on Decision Making Capabilities. Hypothesis-3 (H3), the
results of t-stat = 10.485 while the value = 1.960 (α = 0.05), because t-stat> t-table (α = 0.05), and
py3 = 0.522> 0 so H0 is rejected, which means that Followership has a positive and significant
The 1st International Forum Business and Economy (IFBE) 2019 Banjarmasin, 13-14 November 2019
122
direct effect on Decision Making Capability. Hypothesis-4 (H4), that t-stat = 3,732 while value =
1,960 (α = 0.05), because t-stat> t-table (α = 0.05), and p13 = 0.198> 0 so H0 is rejected, which
means that Transformational Leadership has a positive and significant direct effect on
Followership. Hypothesis-5 (H5), Based on result shows that t-stat = 8.981 while value = 1.960 (α
= 0.05), because t-stat> t-table (α = 0.05), and p23 = 0.476> 0 so H0 is rejected, which means that
Power Distance has a positive and significant direct effect towards Followership. Hypothesis-6
(H6), the result shows that t-stat = 8.560 while value = 1.960 (α = 0.05), because t-stat> t-table (α
= 0.05), and p21 = 0.321> 0 so H0 is rejected, which means that Transformational Leadership has
a positive and significant direct effect against Power Distance. Hypothesis-7 (H7), Based on the
result analysis which is used the Sobel Test for the hypothesis of indirect effect using the value of z
The value of z = 2.140> 1.96, then H0 is rejected, thus it can be concluded that Transformational
leadership has a direct
positive effect on the Kostrad Officers Decision Making Ability through Power Distance.
Hipotesis-8 (H8), Based on result analysis which is using the Sobel Test, The value of z = 3.476>
1.96, then H0 is rejected, thus it can be concluded that Transformational Leadership has an indirect,
positive and significant effect on Decision Making Capability through Followership. Hipotesis-9
(H9), Based on result analysis which is using the Sobel Test, The value of z = 6.833> 1.96, then
H0 is rejected, thus it can be concluded that Power Distance has an indirect and positive
significant effect on Decision Making Capability through Followership.
CONCLUSION
Based on the results of the research and discussion above, we can conclude that (1) Transformational
Leadership has a direct positive effect on Decision Making Capability. It means that effective
transformational leadership will lead to an increase in Kostrad Officer decision-making abilities. (2)
Power Distance has a direct positive effect on Decision Making Capability. This means that high Power
Distance will lead to an increase of Kostrad Officers decision-making ability. (3) Followership has a
direct positive effect on Decision Making Capability. It means that high Followership will lead to an
increase of the Kostrad Officers decision-making ability. (4) Transformational leadership has a direct
positive effect on Followership. It means that effective transformational leadership will lead to an
increase of Kostrad Officer Followership. (5) Power Distance has a direct positive effect on
Followership. It means that high Power Distance will cause an increase of Kostrad Officer Followership.
(6) Transformational leadership has a direct positive effect on Power Distance. It means that effective
transformational leadership will lead to an increase of Power Distance. (7) Transformational leadership
has a positive indirect effect on Decision Making Capability through the mediation of Power Distance
variables. It means that effective Transformational Leadership will lead to an increase on Decision
Making Capability through the mediation of Kostrad Officers Power Distance. (8) Transformational
leadership has a positive indirect effect on Decision Making Capability through mediation of
Followership variables. It means that effective Transformational Leadership will lead to an increase in
Decision Making Capability through mediation of the Kostrad Officer Followership and (9) Power
Distance has an indirect positive effect on Decision Making Capability through mediation of
Followership variables. It means that high Power Distance will lead to an increase in Decision Making
Capability through mediation by the Kostrad Officer Followership.
REFERENCES
Bass, B. M. (2007). Kepemimpinan. In G. Yukl (Ed.), Kepemimpinan dalam Organisasi
(hal. 305). Jakarta: PT Indeks.
The 1st International Forum Business and Economy (IFBE) 2019 Banjarmasin, 13-14 November 2019
123
Bass, B. M. (2008). From Transactional to Transformasional Leadership: Learning to Share The Vision”,
Organizational Dynamics. In S. P. Robbins & T. Judge (Ed.), Perilaku Organisasi (hal. 91).
Jakarta: Penerbit Salemba Empat.
Bass, B. M. (2017). Transformational Leadership: Industrial, Military and Educational Impact. In R. L.
Taylor., W. E. Rosenbach., & E. B. Rosenbach (Ed.), Military Leadership : In Pursuit of
Excellence. Lieutenant General Gregory S. Newbold (USMC Ret).
Bochner, S., & Hesketh, B. (1994). Power Distance, Individualism/Collectivism, and Job- Related
Attitudes in a Culturally Diverse Work. Journal of Cross Cultural Pyschology, 1(1).
Gardner, J. (2007). On leadership. In R. P. Pittman, D. W. S. Whitebead, & T. R (Ed.),
Essentials of Nursing Leadership and Management (5 ed.). F.A. Davis Company.
Hofstede, G. (2010). Attitudes, Values and Organizational Culture : Disentangling the Concepts
Organization Studies.
Hofstede, G., Hostede., G. J., & Michael Minkov. (2010). Cultural and Organization.
USA.
Kirkman, B. L., Chen, G., Farh, J. L., Chen, Z. X., & Lowe, K. B. (2009). Individual power distance
orientation and follower reactions to transformational leaders: A cross-level, cross-cultural
examination. Academy of Management Journal, 52, 744–764.
Kostrad. (2016). Profil Kostrad. Jakarta: Kostrad.
Kreitner, R., & Kinicki, A. (2014). Perilaku Organisasi (E. Suandy, Ed.). Jakarta: Penerbit Salemba
Empat.
Lee Choong Y. (2012). Korean Culture And Its Influence on Business Practice in South Korea. Journal of
International Management Studies, 7(2), 184.
Madlock, P. E. (2012). The Link Between Leadership Style, Communicator Competence, and Employee
Satisfaction. Journal Business Communication, 45(1), 61–78.
Montgomery, V. W. (2011). Dyamics of Leadership in Public Service (Second Edi; ME Sharpa Armonh,
Ed.). New York.
Robbins, S. P., & Judge, T. (2008a). Perilaku Organisasi. Organizational Behavior (12 ed.; D. Angelica,
Ed.). Jakarta: Penerbit Salemba Empat.
Robbins, S. P., & Judge, T. (2008b). Perilaku Organisasi (2 ed.; A. Diana, Ed.). Jakarta: Penerbit
Salemba Empat.
Supriyatno, M. (2014). Tentang Ilmu Pertahanan. Jakarta: Yayasan Pustaka Obor Indonesia.
Terry, G. R. (2006a). Asas-Asas Manajemen (Winardi, Ed.). Bandung: Penerbit PT. Alumni.
Yukl, G. (2007). Kepemimpinan dalam Organisasi. Jakarta: PT Indeks.
The 1st International Forum Business and Economy (IFBE) 2019 Banjarmasin, 13-14 November 2019
124
THE EFFECT OF CORPORATE REPUTATION AND CUSTOMER VALUE CREATION ON
CUSTOMER SATISFACTION PROVIDER INTERNET INDI HOME IN CENTRAL JAVA
Bayu Kurniawan1, Nazief Nirwanto
2, Achmad Firdiansjah
3
Sekolah Tinggi Ilmu Ekonomi AKA1
Universitas Merdeka Malang2,3
[email protected] [email protected]
Abstract: The purpose of this study is to determine the effect of company reputation and customer value
creation on indihome customer satisfaction in central java. The sample is taken in this study is 100
respondents. The analyzing method of this research is regression analysis. The conclusion finding in this
study is the corporate reputation and customer value creation have positive and significant influence on
customer satisfaction.
Keywords: corporate reputation, customer value, customer satisfaction
BACKGROUND
Facing the Industrial Revolution era 4.0 The Indonesian government seeks to encourage various
sectors to improve Indonesia's competitiveness position in the world, among others, which are recorded in
the Global Competitiveness Report. To achieve this goal, one solution which is being pushed by the
government is to spur domestic industries to continue to innovate in the face of the industrial revolution
4.0 era. Innovations and changes to business models are demanded to be more efficient and effective,
such innovations include the application of Information Communication Technology (ICT). The progress
of Information Communication Technology (ICT) also penetrated the Indonesian telecommunications
industry. Seeing the fact that Indonesia is the sixths largest internet user in the world, it looks lame
compared to the speed of the internet in Indonesia, which is ranked 106th in the world. The Penetration of
internet users in Indonesia is 54.7 percent, equivalent to 143.26 million people out of a total population of
262 million. According to the customer satisfaction survey by Telkom Indihome (2018), it was found that
86.7% of customers felt satisfaction. This result led to reviewing factors or things which cause
satisfaction. Customer satisfaction has attracted the interest of academic researchers and practitioners to
study. Kotler (2012) argued that customer satisfaction is a feeling of pleasure or disappointment which
appears after comparing the performance of the results of products or services received with the expected
results of consumers. Asimova's research (2013), describes the results of research that the corporate
reputation acts as a critical predictor of customer satisfaction. There are three components of consumer
value (functional, emotional, symbolic) which are found to be critical and consistent predictors of
customer satisfaction. Helm research (2009) about corporate reputation affects customer satisfaction, by
conducting two experiments, showing significant effects of customer satisfaction on corporate reputation
as perceived by consumers. However, there is no significant impact for the coorporate in customer
satisfaction. In another study, it is found that customer satisfaction influences the corporate reputation and
service innovation in telecommunications companies of India (Ganesan, 2016). Following the aspect of
customer value, the quality of the internet in Indonesia is still minimum. It is indicated by the order of the
speed Indonesia's internet which is compared to neighboring countries such as Singapore, Korea,
Malaysia. Indonesia ranks 106th in the entire world with an average speed of 9.73 Mbps. Therefore,
internet providers in Indonesia must improve the quality of speed, so that they are not left behind from
other countries. From the customer's perspective, customer value is what consumers get to what is
sacrificed (Zeithaml, 1988). The are several things which occur in the phenomenon of the
telecommunications business, especially the internet, include new providers, data tarif wars between
The 1st International Forum Business and Economy (IFBE) 2019 Banjarmasin, 13-14 November 2019
125
providers, the challenges of digital transformation in the telecommunications industry, the development of
e-commerce, start-up and financial technology (fintech). The importance of paying attention to the factors
which build customer satisfaction in a company that is through customer value creation and corporate
reputation. So far, the research on customer satisfaction is still limited. This study aims to fill the existing
research gaps, namely discussing customer satisfaction. This study covers the factors which influence
customer satisfaction through corporate and customer value creation.
LITERATURE REVIEW
Customer Satisfaction
Every businessman is responsible for customer or customer satisfaction. The companies must strive
to satisfy customer needs. If customers are satisfied, it is impact to corporate business in the future.
Therefore, the customers will be loyal, the income will increase, the business continuity guaranteed, and
the company will be high quality in the midst of competition when measuring satisfaction. The customers
will compare between what they receive and what they expect when using business products or services.
Of course, it is not easy to satisfy every customer, because the subjectivity of each person's assessment is
different. Customers will be satisfied if the product they use is a high quality. They will ask to provide
quality products based on the sacrifices they have done to get the products. For this reason, the companies
must continually improve the quality of their products or services. Some customers feel emotionally
satisfied after using a product or service. The customers feel that other people will feel amazed at them.
This satisfaction related to social values which make the customers proud and satisfied with a particular
brand. According to Kotler et al. (2004) customer satisfaction is feeling happy or disappointed which
appears after comparing perceptions or impressions of performance of products and services. When the
products or services are below their expectations, the will not be satisfied and dissapointed. However, if
performanceof products or service exceeds their expectations, they will be very satisfied and happy.
Nguyen (2001) observed that customer satisfaction can be predicted better by corporate reputation
through the service production process.
Corporate Reputation
Corporate reputation is valuable asset to the company. Besides, being able to influence the trust of
stakeholders, the public, consumers, and customers, the reputation can be used as an investment for
companies to deal with unexpected crises. The corporate reputation is often described as an image and
pride. It is an award obtained because of the advantages possessed by the company. In addition to, a good
reputation can affect customer satisfaction with the company and give pride to customers. According to
Fombrun (1996), corporate reputation is a manifestation of someone's experience with the product or the
service which they get. Good reputation will increase credibility, and it makes consumers believe that
they will get what they have promised. Reputation is a guarantee that the consumers will get the products
beyond their expectations. A good reputation will increase the profits because it attracts consumers'
attention to the products which are produced by companies. It also attracts the investors to invest to the
companies, and the job seekers who need job in these companies. The corporate reputation affects
consumers in choosing products and services which will be bought by consumers. The public certainly
prefers to do business with someone who has a good reputation in the eyes of customers. According to
Chun (2005), another way to measure corporate reputation is the method of America's Most Admired
Company (AMAC). This method is conducted by Fortune magazine since 1983. Periodically, it has
measured the corporate reputation through the evaluation of eight variables: Innovation, Quality
management, the corporate long-term investment value, the corporate responsibility to the community and
the environment, the corporate ability to manage employees well, the quality of products or services, the
financial stabilizing of the company, the utilization of company assets.
Customer Value Creation
The relationship between customer value and customer satisfaction has been supported by various
studies (Jones and Sasser, 1995; Woodruff and Gardial, 1996; Woodruff, 1997; Parasuraman, 1997;
The 1st International Forum Business and Economy (IFBE) 2019 Banjarmasin, 13-14 November 2019
126
Brand, Cronin and Routledge, 1997; Sinha and DeSarbo, 1998). Good reputation will increase the profits
because it attracts consumers' attention to the products which are produced by companies. It also attracts
the investors to invest to the companies, and the job seekers who need job in these companies. The
corporate reputation affects consumers in choosing products and services which will be bought by
consumers. The public certainly prefers to do business with someone who has a good reputation in the
eyes of customers. According to Woodruff (1997), customer value is perceptual preference and customer
evaluation of product attributes, performance attributes, and consequences of product usage, which
facilitates or inhibits the achievement of customer goals and objectives. Holbrook defined that customer
value can be identified into three meanings, namely: (1) value is a low price, (2) value is what someone
wants in a product, (3) value is the quality which is received by consumers from the company gives.
according to Rambat Lupiyoadi, customer value is the difference between the total benefits perceived by
customers (Total Customer Value) and the total cost (Total Customer Cost) which must be spent by
customers to buy products. This value will produce a measure of profit or loss that will be received by the
customer or company. The basis of marketing is creating the customer value which is greater than the
value created by competitors. Customer satisfaction occurs when marketing performance has fulfilled
customer expectations. Customers will be disappointed if the marketing performance below expectations
or the value which is given by a company to customers is very low. Customers will be happy if their
marketing performance exceeds expectations or provides more value than the competitors.
Literature Review
Based on Pool (2016), he said that corporate reputation can increase customer satisfaction, and
perceived value can increase customer satisfaction. Tsai (2012) stated that Service Innovation and
customer value have positive influences on customer satisfaction simultaneously. Mahmoud (2017) said
that service innovation can increase customer value creation, and customer value creation can improve
customer satisfaction. Therefore, it can be concluded that service innovation can improve customer
satisfaction. Ganesan (2016) described that corporate reputation and service innovation can increase
customer satisfaction. Thus, innovation and reputation can improve financial performance. Weng (2015)
also stated that Service innovation and customer value can improve customer satisfaction. The reseach
shows that service innovation has significant intervening influence on the relationship between customer
value and customer satisfaction.
Hypothesis
H1 Corporate reputation has positive effect on customer satisfaction of Indihome Provider.
H2. Customer value creation has positive effect on customer satisfaction of Indihome Provider.
Conceptual Framework
DATA AND METHOD
The technique sample uses simple random method. The data collected through the questionnaires, with
the criteria of subscribing to Indihome providers for at least 2 years, and located in the Central Java
region. The items used in sampling are based on considerations about the company's reputation, customer
Corporate
Reputation
Customer Value
Customer
Satisfaction
H1
H2
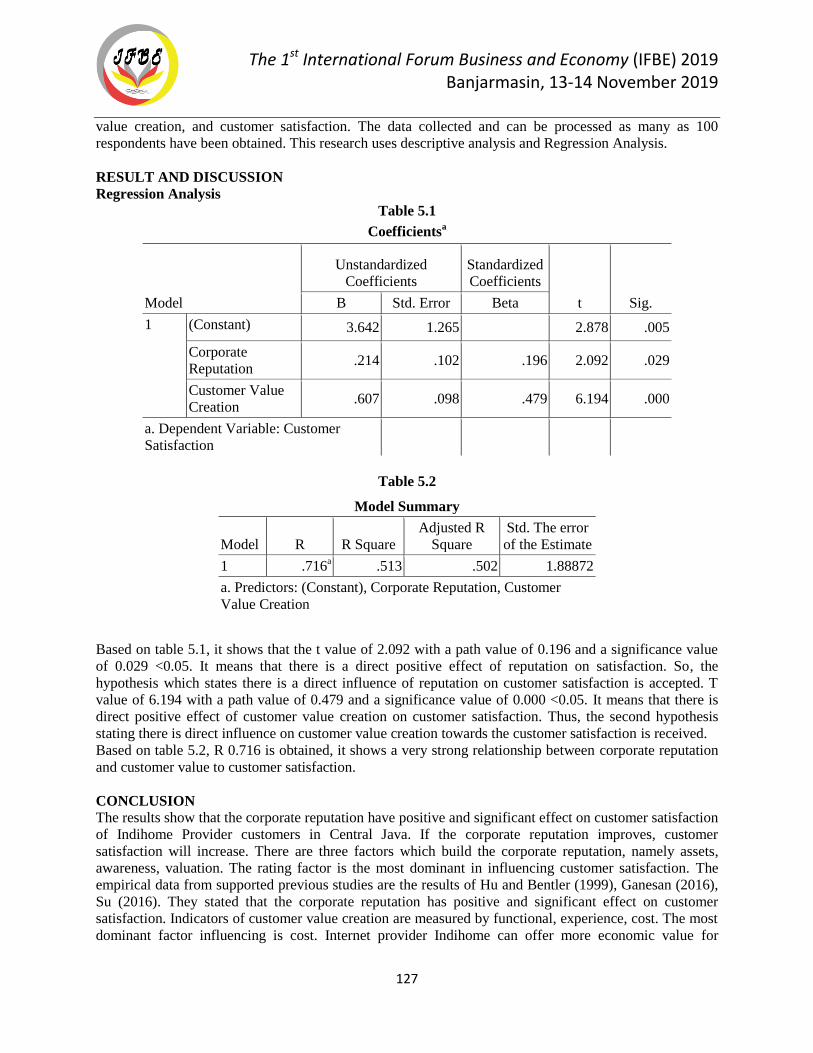
The 1st International Forum Business and Economy (IFBE) 2019 Banjarmasin, 13-14 November 2019
127
value creation, and customer satisfaction. The data collected and can be processed as many as 100
respondents have been obtained. This research uses descriptive analysis and Regression Analysis.
RESULT AND DISCUSSION
Regression Analysis
Table 5.1
Coefficientsa
Model
Unstandardized
Coefficients
Standardized
Coefficients
t Sig. B Std. Error Beta
1 (Constant) 3.642 1.265 2.878 .005
Corporate
Reputation .214 .102 .196 2.092 .029
Customer Value
Creation .607 .098 .479 6.194 .000
a. Dependent Variable: Customer
Satisfaction
Table 5.2
Based on table 5.1, it shows that the t value of 2.092 with a path value of 0.196 and a significance value
of 0.029 <0.05. It means that there is a direct positive effect of reputation on satisfaction. So, the
hypothesis which states there is a direct influence of reputation on customer satisfaction is accepted. T
value of 6.194 with a path value of 0.479 and a significance value of 0.000 <0.05. It means that there is
direct positive effect of customer value creation on customer satisfaction. Thus, the second hypothesis
stating there is direct influence on customer value creation towards the customer satisfaction is received.
Based on table 5.2, R 0.716 is obtained, it shows a very strong relationship between corporate reputation
and customer value to customer satisfaction.
CONCLUSION
The results show that the corporate reputation have positive and significant effect on customer satisfaction
of Indihome Provider customers in Central Java. If the corporate reputation improves, customer
satisfaction will increase. There are three factors which build the corporate reputation, namely assets,
awareness, valuation. The rating factor is the most dominant in influencing customer satisfaction. The
empirical data from supported previous studies are the results of Hu and Bentler (1999), Ganesan (2016),
Su (2016). They stated that the corporate reputation has positive and significant effect on customer
satisfaction. Indicators of customer value creation are measured by functional, experience, cost. The most
dominant factor influencing is cost. Internet provider Indihome can offer more economic value for
Model Summary
Model R R Square
Adjusted R
Square
Std. The error
of the Estimate
1 .716a .513 .502 1.88872
a. Predictors: (Constant), Corporate Reputation, Customer
Value Creation
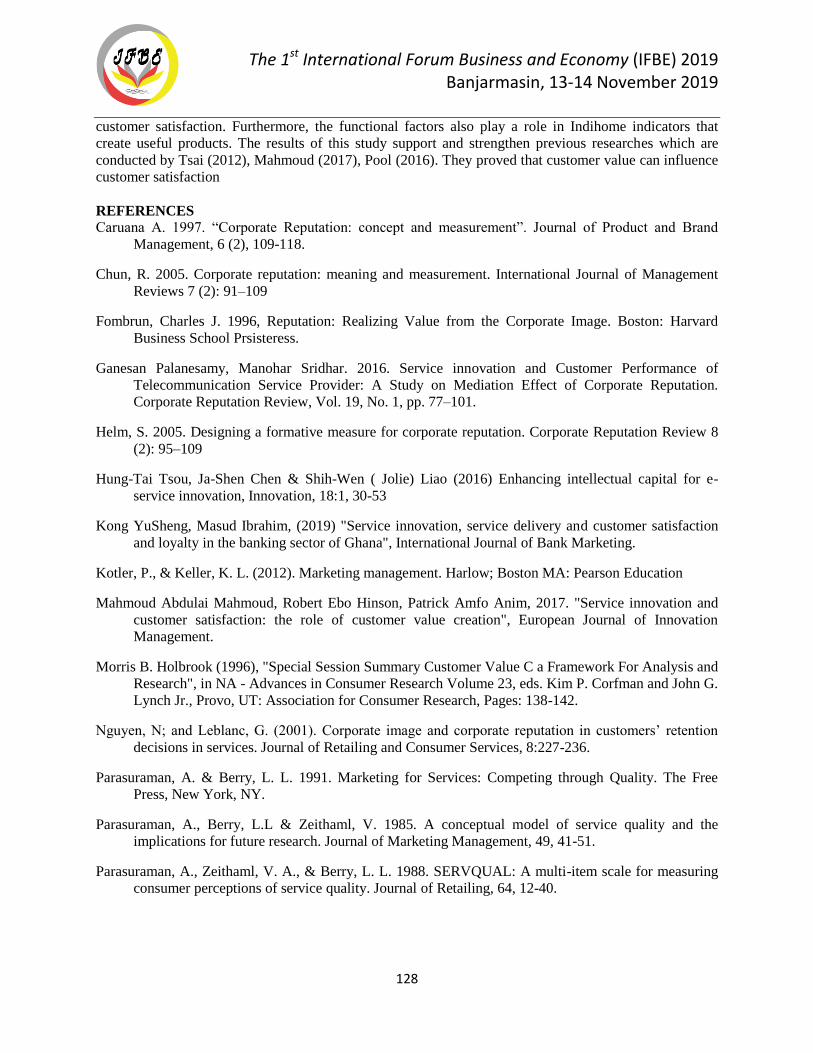
The 1st International Forum Business and Economy (IFBE) 2019 Banjarmasin, 13-14 November 2019
128
customer satisfaction. Furthermore, the functional factors also play a role in Indihome indicators that
create useful products. The results of this study support and strengthen previous researches which are
conducted by Tsai (2012), Mahmoud (2017), Pool (2016). They proved that customer value can influence
customer satisfaction
REFERENCES
Caruana A. 1997. “Corporate Reputation: concept and measurement”. Journal of Product and Brand
Management, 6 (2), 109-118.
Chun, R. 2005. Corporate reputation: meaning and measurement. International Journal of Management
Reviews 7 (2): 91–109
Fombrun, Charles J. 1996, Reputation: Realizing Value from the Corporate Image. Boston: Harvard
Business School Prsisteress.
Ganesan Palanesamy, Manohar Sridhar. 2016. Service innovation and Customer Performance of
Telecommunication Service Provider: A Study on Mediation Effect of Corporate Reputation.
Corporate Reputation Review, Vol. 19, No. 1, pp. 77–101.
Helm, S. 2005. Designing a formative measure for corporate reputation. Corporate Reputation Review 8
(2): 95–109
Hung-Tai Tsou, Ja-Shen Chen & Shih-Wen ( Jolie) Liao (2016) Enhancing intellectual capital for e-
service innovation, Innovation, 18:1, 30-53
Kong YuSheng, Masud Ibrahim, (2019) "Service innovation, service delivery and customer satisfaction
and loyalty in the banking sector of Ghana", International Journal of Bank Marketing.
Kotler, P., & Keller, K. L. (2012). Marketing management. Harlow; Boston MA: Pearson Education
Mahmoud Abdulai Mahmoud, Robert Ebo Hinson, Patrick Amfo Anim, 2017. "Service innovation and
customer satisfaction: the role of customer value creation", European Journal of Innovation
Management.
Morris B. Holbrook (1996), "Special Session Summary Customer Value C a Framework For Analysis and
Research", in NA - Advances in Consumer Research Volume 23, eds. Kim P. Corfman and John G.
Lynch Jr., Provo, UT: Association for Consumer Research, Pages: 138-142.
Nguyen, N; and Leblanc, G. (2001). Corporate image and corporate reputation in customers’ retention
decisions in services. Journal of Retailing and Consumer Services, 8:227-236.
Parasuraman, A. & Berry, L. L. 1991. Marketing for Services: Competing through Quality. The Free
Press, New York, NY.
Parasuraman, A., Berry, L.L & Zeithaml, V. 1985. A conceptual model of service quality and the
implications for future research. Journal of Marketing Management, 49, 41-51.
Parasuraman, A., Zeithaml, V. A., & Berry, L. L. 1988. SERVQUAL: A multi-item scale for measuring
consumer perceptions of service quality. Journal of Retailing, 64, 12-40.
The 1st International Forum Business and Economy (IFBE) 2019 Banjarmasin, 13-14 November 2019
129
Sabrina Helm, Ina Garnefeld, dan Julia Tolsdorf .2009. Perceived corporate reputation and consumer
satisfaction – An experimental exploration of causal relationships. Australasian Marketing Journal.
69-74.
Walsh G. et al. 2006. How do corporate reputation and customer satisfaction impact customer defection?
A study of private energy customers in Germany. Journal of Service Marketing, 20 (6), 412-420.
Woodruff, R.B. (1997), “Customer value: the next source for competitive advantage”, Journal of the
Academy of Marketing Science, Vol. 25 No. 2, pp. 139-153.
Zeithaml, Valarie A., Parasuraman, A., & Berry, L.L. 1990. Delivering quality service: balancing
customer perceptions and expectations. New York, The Free Press.
The 1st International Forum Business and Economy (IFBE) 2019 Banjarmasin, 13-14 November 2019
130
THE EFFECT OF SMOG FACT TOWARDS THE ECONOMIC REVENUE OF SMALL
TRADERS IN THE CITY OF PEKANBARU
Prama Widayat1, Heppi Syofya
2
1Faculty Economic in Lancang Kuning University
2Sekolah Tinggi Ilmu Ekonomi Sakti Alam Kerinci
Abstrack: The smog that occurred in Riau Province has seriously disrupted the activities of residents,
especially in the fields of education, transportation and economy. One of them is the city of Pekanbaru
which is quite severe experiencing smog so that it also disrupts the economic income of small traders who
rely on life from selling. For this reason, it is necessary to see how big the impact of decreasing income
experienced by small traders and how the solution to overcome them. This research uses descriptive
method by taking 100 samples of small traders in the city of Pekanbaru. Of the 100 traders sampled, not
all traders experience a decrease in income, about 70 percent of the sample has decreased income while
another 30 percent has no income decrease. For those who experience a decline in opinion ranging from
10 percent to 15 percent in one night because of the weakness they have that is dependence on the
weather, lack of flexibility and minimal creation in the business. As for those who did not experience
serious impacts in their business when the smog occurred, they were already using online applications
such as go-food and grab-food in running their businesses.
Keywords: income, small traders, applications
INTRODUCTION The smog disaster occurred in Riau Province since the beginning of September 2019 because the
existing land was burned or burned by irresponsible parties. The most severe smog occurred from
September 13 to 23, 2019 which was at a dangerous level that disrupted educational activities,
transportation and also the community's economy
In education, it disrupts teaching and learning activities so that school students ranging from
elementary to high school level must be closed for two weeks. Including teaching and learning activities
in universities are also closed because the smog is getting thicker and dangerous for students so it must be
closed more or less in two weeks.
For the transportation sector, it also experienced interference, visibility is increasingly limited
between fifty meters to one hundred meters, making vehicles on the highway must be careful to reduce
vehicle speed to avoid accidents. Including the persistence of transportation in transporting the economic
needs of the community from West Sumatra to Riau Province, as it is known that most of the needs of the
people of Riau come from West Sumatra (Widayat, 2017) such as Rice, Chillies, Onions and Vegetables
are also affected by the smog this.
In addition, for the economic sector, it is also felt by people who are engaged in the lower
economic sectors such as foot vendors, food and beverage traders who sell from afternoon to night. These
traders number in the hundreds in the city of Pekanbaru scattered in several points such as Sudirman
street, HR Soebrantas Panam street, Rumbai area, Marpoyan area, Pasir Putih and Arifin Ahmad.
Most of consumers come from adolescents and young people and some consumers who are
married. Pekanbaru city people really like the culinary presented by the traders in some of these regions,
it's no wonder we encounter such a lively atmosphere at night by gathering at favorite places. Various
communities also have favorite places to gather such as motorcycle communities, four-wheeled vehicle
communities, hobby communities, professional communities and others.
Not surprisingly, the economic life at night in the city of Pekanbaru brings a fortune for traders
who support their families from the business that is run (Widayat and Pahlawan, 2018: 491 - 498). But
The 1st International Forum Business and Economy (IFBE) 2019 Banjarmasin, 13-14 November 2019
131
since the occurrence of the most severe smog disaster than in 2015 ago, where air quality that is at a
dangerous level makes people reduce activities outside the home. Activities outside the home are mostly
done for those who go to work and go home in the afternoon, while those who come out at night to just
look for food and then wrapped to take home, the gathering places alongside the road also look more
quiet when compared to the conditions in August 2019.
The people who used to trade alongside in Sudirman street, Marpoyan, Panam, Rumbai also
seemed to be less enthusiastic because the lack of visitors and even some traders chose not to sell for a
few days because of smog that disturb their health and also not too much trade. Cafes that are usually
crowded as young people's gathering places are also not too crowded, visitors are indeed not drastically
reduced but still experience a decline so that it also impacts on the income earned.
LITERATURE REVIEW
Partomo (2004: 20-21) where MSMEs have an important role in Indonesia, especially for people
with low education, with strength from below, MSMEs are stronger in dealing with crises as evidenced in
1998 when many large businessmen diverted their funds abroad due to the crisis. It is different from
Micro, Small and Medium Enterprises (MSMEs) which remain strong despite the crisis so that it can
sustain the Indonesian economy.
1. The use of technology
According to Widayat (2019: 85) technology can not be separated in the business world, especially
now the digital era where trade transaction movements are only minutes or seconds, the use of technology
in supporting business growth absolutely must be followed, we see Alibaba companies originating from
China at first also a small company and now transformed into a business giant that controls the market in
China which has even penetrated almost all countries in the world. The country's small businesses are
plagued by technological problems for several reasons:
1. Rapid technological progress
Not all small businesses are able to keep up with technological developments, especially in the
digital world, because they are just grateful to be able to survive, not to mention the cost of
implementing technology is also quite high
2. Poor mastery due to lack of learning opportunities
Never mind the limited ability to meet technological needs, plus also the lack of learning
opportunities. Sometimes technical guidance in the area of technology mastery also does not
reach small businesses because it is indeed hampered by data collection on the number of
businesses that are in an area.
An entrepreneur is able to innovate (Muhammad, 1992: 166-168) by looking at the situation,
especially in the current technological era, all are completely open so that to demand to be creative, the
products we make today will not necessarily be able to survive in the market for a long time because new
products will emerge . Do not always say that to try it must have big capital because to start a business
can be with small capital (Adicipta, 2006: 63-73).
2. Small and Medium Enterprises (SMEs)
According to the Ministry of Cooperatives and SMEs that what is said to be Small Business (UK)
including Micro Business (UMI) is a business entity that has a net worth of up to Rp. 200 Million,
excluding land and building businesses and has annual sales of at most Rp. 1 billion. While medium-sized
businesses (UM) owned by Indonesian citizens who have a net worth of between Rp 200 million to Rp 10
billion, excluding land and buildings, with a maximum turnover of Rp 50 billion per year.
Meanwhile, according to the Ministry of Finance, small businesses are individual businesses or
business entities that have carried out business activities having a maximum sales / turnover of Rp. 600
The 1st International Forum Business and Economy (IFBE) 2019 Banjarmasin, 13-14 November 2019
132
million per year, with assets of a maximum of Rp. 600 million outside of land and buildings, consisting of
(1) Fa Business Entity, CV, PT and Cooperatives. (2) Individuals (craftsmen, home industries, farmers,
breeders, fishermen, traders and services). This includes traders / sellers of fried rice, grilled meatballs,
martabak, satay and the like which are categorized as small businesses.
According to the MSME world bank, it can be grouped into 3 (three) types of businesses, as
follows:
1. Micro Business with a maximum number of employees of 10 people.
2. Small Business with a maximum number of employees of 30 people.
3. Medium-sized businesses with a maximum number of employees of 300 people.
Sumodiningrat (2015: 93-106) states that if each individual wants to try, working with the
maximum to get benefits in a way that is reasonable can save and invest. Then this condition will
contribute to improve people’s economy and national economy.
3. Weaknesses of SMEs
Low quality of human resources
Most MSMEs in Indonesian society still have poor human resources quality, MSMEs sometimes
stand on the initiative of someone who has never received adequate training and education. Like hawkers,
street vendors start a business with only desperate capital and the most important thing is that they can
survive by selling. The low quality of human resources is sometimes influenced by several factors,
namely:
1. Not knowing the purpose of the business because the important thing is to survive.
2. Lack of motivation because they sell only to make ends meet and there are no plans to develop a
business.
3. Lack of education because the average is still educated high school down and even if there are
college graduates, they are only a small part, in addition it also lacks of training because of
laziness.
4. The environment is not supportive because it considers civil servants an established job and looks
down on those who are entrepreneurs.
5. Not appropriate expertise because of the low wage in the MSME environment.
Feel enough if the business continues
In general, this MSME is an individual business with a small capital, because of the low ability of
human resources, it makes MSME feel enough when the business is running. So the innovations made are
also rarely seen as in the city of Pekanbaru when the Thai Tea business was booming, so the company
opened the Thai Tea business, when there was a booming shake-up then a shake-up business appeared in
almost every corner of Pekanbaru because they only saw the business of people running and then they
opened the same business. This condition occurs because:
1. Wrong resigned attitude
2. Lack of correct knowledge about business
3. Family labor is often not counted
4. Do not calculate the financing and profit appropriately
5. Lack of motivation to move forward
Weak management
It is very rare to find MSMEs that make business records or neat records of their business, whether
it's daily capital, daily expenses, daily profits neatly recorded so that their financial records can be seen
The 1st International Forum Business and Economy (IFBE) 2019 Banjarmasin, 13-14 November 2019
133
weekly or monthly and up to a year. Even household and business expenses are often mixed, weak
management is caused by:
1. Lack of adequate training
2. Laziness of HR to change for the better
In addition, management is also related to the culture or character inherent in a small business,
cannot be equated with a large business (Yew, 2004: 44-61) because by having their own identity, they
will have their own management characteristics that distinguish them from others .
In this case fostering an entrepreneurial spirit must be started early, arouse their enthusiasm to dare
to be entrepreneurs (Saroni, 2012: 94-96) so that they will grow into creative personalities that ultimately
produce a simple product. Giving appreciation for what they produce and then direct and train until they
get used to it.
Lack of marketing
Today's business competition has relied on networks, both starting from raw materials to product
distribution networks, the weaknesses of MSMEs are in the network because they are caused by:
1. Lack of promotion tools,
It's very rare to find MSME products in the promotion of print and electronic media because
indeed the cost of advertising is very expensive, so the promotion of your mouth is your choice.
2. There is no exhibition access,
Not all MSMEs have access to international exhibitions or local exhibitions. MSMEs that
participate in exhibitions are those who have attractive packaged products and have completed all
permits, even though only a small number of MSMEs have standard and licensed packaging,
most of them still packaged simply and does not meet the standards or have not had a complete
permit such as BPOM, Halal from the MUI, the Health Office, PIRT and others.
Small businesses are less able to market their products, which means they are spoiled wanting to be
helped continuously because it costs a lot to promote print and electronic media, while they are limited in
terms of capital. So this is where the role of the government helps to promote (Kleinknecht, 2000: 169-
186), so that it fosters economic growth, job creation and ecological sustainability.
MATERIAL AND ANALYSIS METHOD This research is a qualitative study describing and understanding the meaning behind the data that
appear. The type of data used is primary data by collecting directly through field interviews with business
actors, where the data collection techniques used in this study are field research techniques (Field
Research) to obtain data related to this research.
The population in this study are traders in the city of Pekanbaru where they are spread on Jendral
Sudirman Street, HR Soebrantas Panam Street, Rumbai Area, Marpoyan Area, Pasir Putih, Arifin Ahmad
and others. With a random sampling method on 100 respondents. This research used descriptive method
to see how much the decrease in income experienced by traders due to smog. The questionnaires and
interviews were done with traders.
RESULT AND DISCUSSION
Result From the results of the research to 100 traders in the city of Pekanbaru, the result could be seen in
the following:
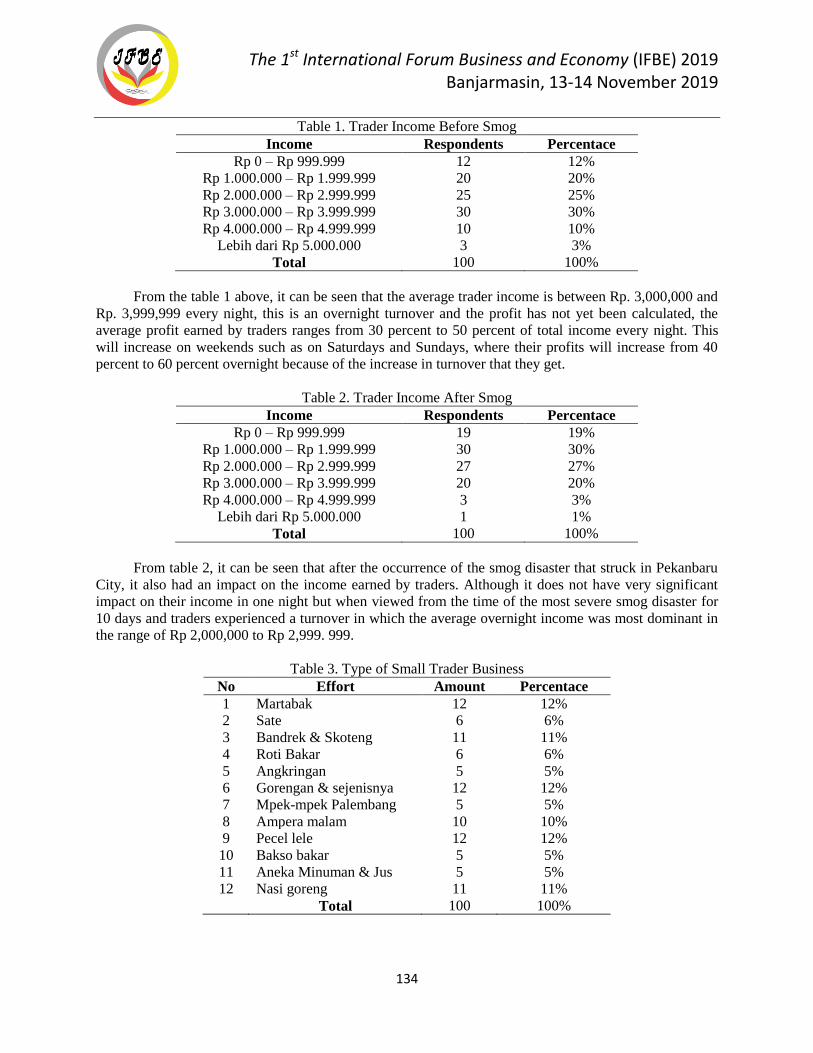
The 1st International Forum Business and Economy (IFBE) 2019 Banjarmasin, 13-14 November 2019
134
Table 1. Trader Income Before Smog
Income Respondents Percentace
Rp 0 – Rp 999.999 12 12%
Rp 1.000.000 – Rp 1.999.999 20 20%
Rp 2.000.000 – Rp 2.999.999 25 25%
Rp 3.000.000 – Rp 3.999.999 30 30%
Rp 4.000.000 – Rp 4.999.999 10 10%
Lebih dari Rp 5.000.000 3 3%
Total 100 100%
From the table 1 above, it can be seen that the average trader income is between Rp. 3,000,000 and
Rp. 3,999,999 every night, this is an overnight turnover and the profit has not yet been calculated, the
average profit earned by traders ranges from 30 percent to 50 percent of total income every night. This
will increase on weekends such as on Saturdays and Sundays, where their profits will increase from 40
percent to 60 percent overnight because of the increase in turnover that they get.
Table 2. Trader Income After Smog
Income Respondents Percentace
Rp 0 – Rp 999.999 19 19%
Rp 1.000.000 – Rp 1.999.999 30 30%
Rp 2.000.000 – Rp 2.999.999 27 27%
Rp 3.000.000 – Rp 3.999.999 20 20%
Rp 4.000.000 – Rp 4.999.999 3 3%
Lebih dari Rp 5.000.000 1 1%
Total 100 100%
From table 2, it can be seen that after the occurrence of the smog disaster that struck in Pekanbaru
City, it also had an impact on the income earned by traders. Although it does not have very significant
impact on their income in one night but when viewed from the time of the most severe smog disaster for
10 days and traders experienced a turnover in which the average overnight income was most dominant in
the range of Rp 2,000,000 to Rp 2,999. 999.
Table 3. Type of Small Trader Business
No Effort Amount Percentace
1 Martabak 12 12%
2 Sate 6 6%
3 Bandrek & Skoteng 11 11%
4 Roti Bakar 6 6%
5 Angkringan 5 5%
6 Gorengan & sejenisnya 12 12%
7 Mpek-mpek Palembang 5 5%
8 Ampera malam 10 10%
9 Pecel lele 12 12%
10 Bakso bakar 5 5%
11 Aneka Minuman & Jus 5 5%
12 Nasi goreng 11 11%
Total 100 100%
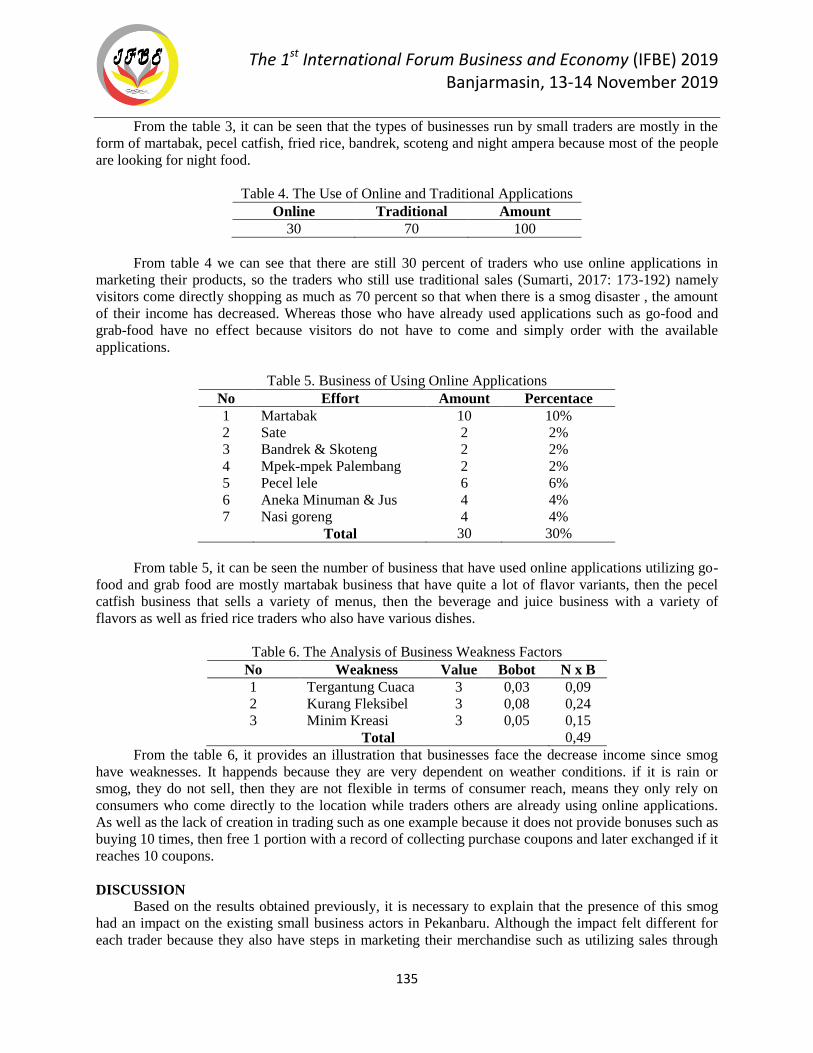
The 1st International Forum Business and Economy (IFBE) 2019 Banjarmasin, 13-14 November 2019
135
From the table 3, it can be seen that the types of businesses run by small traders are mostly in the
form of martabak, pecel catfish, fried rice, bandrek, scoteng and night ampera because most of the people
are looking for night food.
Table 4. The Use of Online and Traditional Applications
Online Traditional Amount
30 70 100
From table 4 we can see that there are still 30 percent of traders who use online applications in
marketing their products, so the traders who still use traditional sales (Sumarti, 2017: 173-192) namely
visitors come directly shopping as much as 70 percent so that when there is a smog disaster , the amount
of their income has decreased. Whereas those who have already used applications such as go-food and
grab-food have no effect because visitors do not have to come and simply order with the available
applications.
Table 5. Business of Using Online Applications
No Effort Amount Percentace
1 Martabak 10 10%
2 Sate 2 2%
3 Bandrek & Skoteng 2 2%
4 Mpek-mpek Palembang 2 2%
5 Pecel lele 6 6%
6 Aneka Minuman & Jus 4 4%
7 Nasi goreng 4 4%
Total 30 30%
From table 5, it can be seen the number of business that have used online applications utilizing go-
food and grab food are mostly martabak business that have quite a lot of flavor variants, then the pecel
catfish business that sells a variety of menus, then the beverage and juice business with a variety of
flavors as well as fried rice traders who also have various dishes.
Table 6. The Analysis of Business Weakness Factors
No Weakness Value Bobot N x B
1 Tergantung Cuaca 3 0,03 0,09
2 Kurang Fleksibel 3 0,08 0,24
3 Minim Kreasi 3 0,05 0,15
Total 0,49
From the table 6, it provides an illustration that businesses face the decrease income since smog
have weaknesses. It happends because they are very dependent on weather conditions. if it is rain or
smog, they do not sell, then they are not flexible in terms of consumer reach, means they only rely on
consumers who come directly to the location while traders others are already using online applications.
As well as the lack of creation in trading such as one example because it does not provide bonuses such as
buying 10 times, then free 1 portion with a record of collecting purchase coupons and later exchanged if it
reaches 10 coupons.
DISCUSSION Based on the results obtained previously, it is necessary to explain that the presence of this smog
had an impact on the existing small business actors in Pekanbaru. Although the impact felt different for
each trader because they also have steps in marketing their merchandise such as utilizing sales through
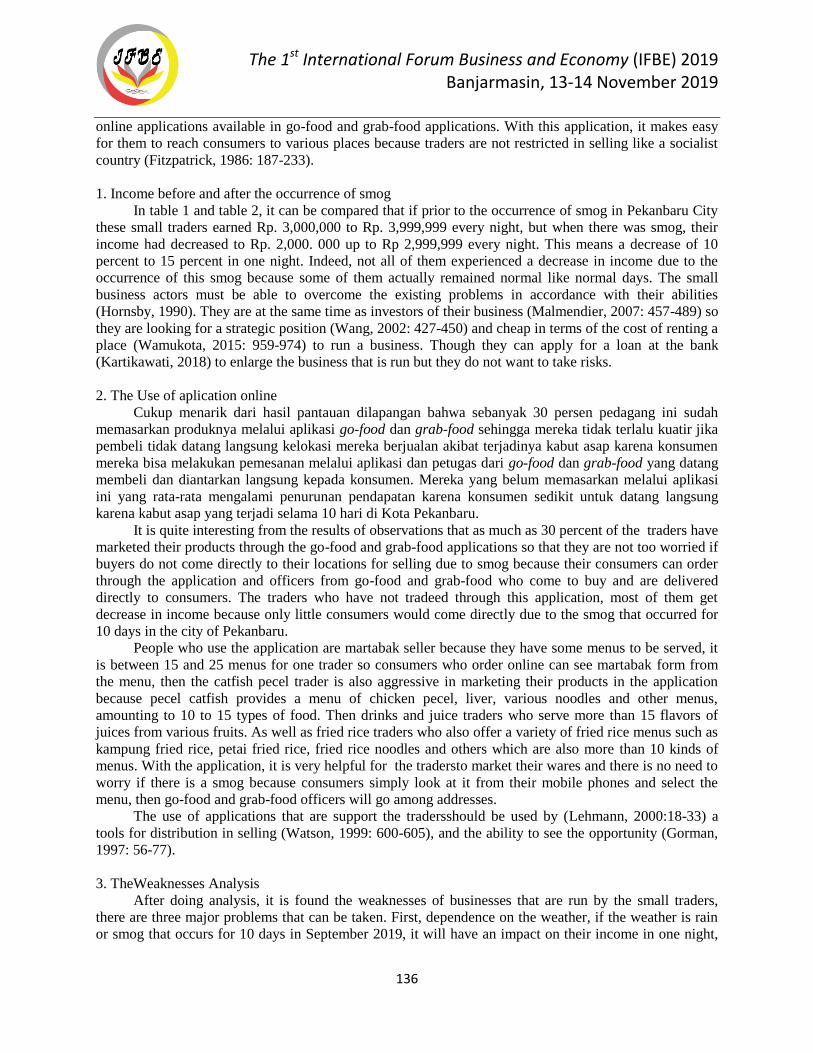
The 1st International Forum Business and Economy (IFBE) 2019 Banjarmasin, 13-14 November 2019
136
online applications available in go-food and grab-food applications. With this application, it makes easy
for them to reach consumers to various places because traders are not restricted in selling like a socialist
country (Fitzpatrick, 1986: 187-233).
1. Income before and after the occurrence of smog
In table 1 and table 2, it can be compared that if prior to the occurrence of smog in Pekanbaru City
these small traders earned Rp. 3,000,000 to Rp. 3,999,999 every night, but when there was smog, their
income had decreased to Rp. 2,000. 000 up to Rp 2,999,999 every night. This means a decrease of 10
percent to 15 percent in one night. Indeed, not all of them experienced a decrease in income due to the
occurrence of this smog because some of them actually remained normal like normal days. The small
business actors must be able to overcome the existing problems in accordance with their abilities
(Hornsby, 1990). They are at the same time as investors of their business (Malmendier, 2007: 457-489) so
they are looking for a strategic position (Wang, 2002: 427-450) and cheap in terms of the cost of renting a
place (Wamukota, 2015: 959-974) to run a business. Though they can apply for a loan at the bank
(Kartikawati, 2018) to enlarge the business that is run but they do not want to take risks.
2. The Use of aplication online
Cukup menarik dari hasil pantauan dilapangan bahwa sebanyak 30 persen pedagang ini sudah
memasarkan produknya melalui aplikasi go-food dan grab-food sehingga mereka tidak terlalu kuatir jika
pembeli tidak datang langsung kelokasi mereka berjualan akibat terjadinya kabut asap karena konsumen
mereka bisa melakukan pemesanan melalui aplikasi dan petugas dari go-food dan grab-food yang datang
membeli dan diantarkan langsung kepada konsumen. Mereka yang belum memasarkan melalui aplikasi
ini yang rata-rata mengalami penurunan pendapatan karena konsumen sedikit untuk datang langsung
karena kabut asap yang terjadi selama 10 hari di Kota Pekanbaru.
It is quite interesting from the results of observations that as much as 30 percent of the traders have
marketed their products through the go-food and grab-food applications so that they are not too worried if
buyers do not come directly to their locations for selling due to smog because their consumers can order
through the application and officers from go-food and grab-food who come to buy and are delivered
directly to consumers. The traders who have not tradeed through this application, most of them get
decrease in income because only little consumers would come directly due to the smog that occurred for
10 days in the city of Pekanbaru.
People who use the application are martabak seller because they have some menus to be served, it
is between 15 and 25 menus for one trader so consumers who order online can see martabak form from
the menu, then the catfish pecel trader is also aggressive in marketing their products in the application
because pecel catfish provides a menu of chicken pecel, liver, various noodles and other menus,
amounting to 10 to 15 types of food. Then drinks and juice traders who serve more than 15 flavors of
juices from various fruits. As well as fried rice traders who also offer a variety of fried rice menus such as
kampung fried rice, petai fried rice, fried rice noodles and others which are also more than 10 kinds of
menus. With the application, it is very helpful for the tradersto market their wares and there is no need to
worry if there is a smog because consumers simply look at it from their mobile phones and select the
menu, then go-food and grab-food officers will go among addresses.
The use of applications that are support the tradersshould be used by (Lehmann, 2000:18-33) a
tools for distribution in selling (Watson, 1999: 600-605), and the ability to see the opportunity (Gorman,
1997: 56-77).
3. TheWeaknesses Analysis
After doing analysis, it is found the weaknesses of businesses that are run by the small traders,
there are three major problems that can be taken. First, dependence on the weather, if the weather is rain
or smog that occurs for 10 days in September 2019, it will have an impact on their income in one night,
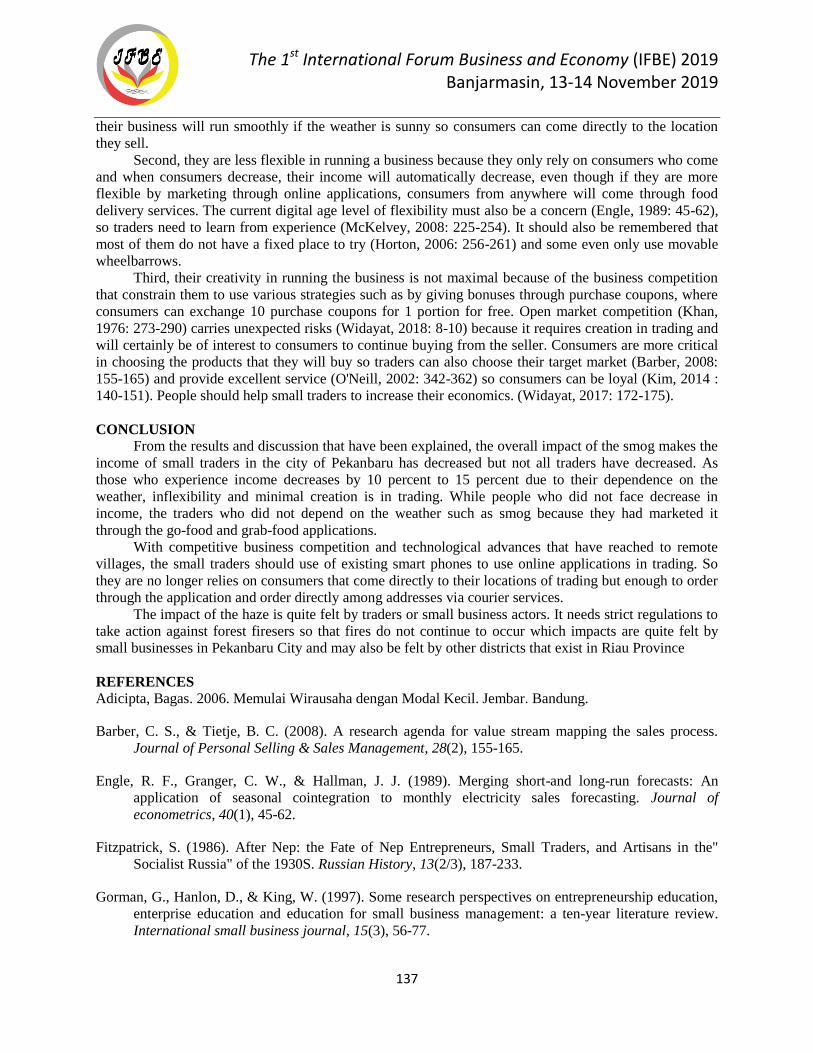
The 1st International Forum Business and Economy (IFBE) 2019 Banjarmasin, 13-14 November 2019
137
their business will run smoothly if the weather is sunny so consumers can come directly to the location
they sell.
Second, they are less flexible in running a business because they only rely on consumers who come
and when consumers decrease, their income will automatically decrease, even though if they are more
flexible by marketing through online applications, consumers from anywhere will come through food
delivery services. The current digital age level of flexibility must also be a concern (Engle, 1989: 45-62),
so traders need to learn from experience (McKelvey, 2008: 225-254). It should also be remembered that
most of them do not have a fixed place to try (Horton, 2006: 256-261) and some even only use movable
wheelbarrows.
Third, their creativity in running the business is not maximal because of the business competition
that constrain them to use various strategies such as by giving bonuses through purchase coupons, where
consumers can exchange 10 purchase coupons for 1 portion for free. Open market competition (Khan,
1976: 273-290) carries unexpected risks (Widayat, 2018: 8-10) because it requires creation in trading and
will certainly be of interest to consumers to continue buying from the seller. Consumers are more critical
in choosing the products that they will buy so traders can also choose their target market (Barber, 2008:
155-165) and provide excellent service (O'Neill, 2002: 342-362) so consumers can be loyal (Kim, 2014 :
140-151). People should help small traders to increase their economics. (Widayat, 2017: 172-175).
CONCLUSION From the results and discussion that have been explained, the overall impact of the smog makes the
income of small traders in the city of Pekanbaru has decreased but not all traders have decreased. As
those who experience income decreases by 10 percent to 15 percent due to their dependence on the
weather, inflexibility and minimal creation is in trading. While people who did not face decrease in
income, the traders who did not depend on the weather such as smog because they had marketed it
through the go-food and grab-food applications.
With competitive business competition and technological advances that have reached to remote
villages, the small traders should use of existing smart phones to use online applications in trading. So
they are no longer relies on consumers that come directly to their locations of trading but enough to order
through the application and order directly among addresses via courier services.
The impact of the haze is quite felt by traders or small business actors. It needs strict regulations to
take action against forest firesers so that fires do not continue to occur which impacts are quite felt by
small businesses in Pekanbaru City and may also be felt by other districts that exist in Riau Province
REFERENCES
Adicipta, Bagas. 2006. Memulai Wirausaha dengan Modal Kecil. Jembar. Bandung.
Barber, C. S., & Tietje, B. C. (2008). A research agenda for value stream mapping the sales process.
Journal of Personal Selling & Sales Management, 28(2), 155-165.
Engle, R. F., Granger, C. W., & Hallman, J. J. (1989). Merging short-and long-run forecasts: An
application of seasonal cointegration to monthly electricity sales forecasting. Journal of
econometrics, 40(1), 45-62.
Fitzpatrick, S. (1986). After Nep: the Fate of Nep Entrepreneurs, Small Traders, and Artisans in the"
Socialist Russia" of the 1930S. Russian History, 13(2/3), 187-233.
Gorman, G., Hanlon, D., & King, W. (1997). Some research perspectives on entrepreneurship education,
enterprise education and education for small business management: a ten-year literature review.
International small business journal, 15(3), 56-77.
The 1st International Forum Business and Economy (IFBE) 2019 Banjarmasin, 13-14 November 2019
138
Hornsby, J. S., & Kuratko, D. F. (1990). Human resource management in small business: Critical issues
for the 1990's. Journal of small business management, 28(3), 9.
Horton, A. V. M. (2006). Mary Somers Heidhues, Golddiggers, Farmers, and Traders in the" Chinese
Districts" of West Kalimantan, Indonesia. Borneo Research Bulletin, 37, 256-261.
Kartikawati, R. (2018, July). Draft of Loan Transactional Paper between Vegetables Traders and “Bank
Plecit” in a Traditional Market of Purwokerto. In 2018 3rd International Conference on Education,
Sports, Arts and Management Engineering (ICESAME 2018). Atlantis Press.
Khan, M. A. (1976). Oligopoly in markets with a continuum of traders: an asymptotic interpretation.
Journal of Economic Theory, 12(2), 273-297.
Kim, K. P., Kim, Y. O., Lee, M. K., & Myoung-Kil, Y. (2014). The effects of co-brand marketing mix
strategies on customer satisfaction, trust and loyality for medium and small traders and
manufactures.
Kleinknecht, A. (2000). Indicators of manufacturing and service innovation: their strengths and
weaknesses. In Innovation systems in the service economy (pp. 169-186). Springer, Boston, MA.
Lehmann, D. R., & Weinberg, C. B. (2000). Sales through sequential distribution channels: An
application to movies and videos. Journal of Marketing, 64(3), 18-33.
Malmendier, U., & Shanthikumar, D. (2007). Are small investors naive about incentives?. Journal of
Financial Economics, 85(2), 457-489.
McKelvey, S., & Southall, R. M. (2008). Teaching sport sponsorship sales through experiential learning.
International Journal of Sport Management and Marketing, 4(2-3), 225-254.
Muhammad, Fadel. 1992. Industrialisasi dan Wiraswasta Masyarakat Industri Belah Ketupat. PT.
Gramedia Pustaka Utama. Jakarta.
O’Neill, M., Palmer, A., & Charters, S. (2002). Wine production as a service experience–the effects of
service quality on wine sales. Journal of Services Marketing, 16(4), 342-362.
Partomo., Tiktik Sartika, Abd Rachman Soejoedono. 2004. Ekonomi Skala Kecil/Menengah dan
Koperasi. Cetakan kedua. Ghalia Indonesi. Bogor.
Saroni, Mohammad. Mendidik dan Melatih Enterprenuer Muda, Membuka Kesadaran atas Pentingnya
Kewirausahaan Bagi Anak Didik. 2012. Ar-Ruzz Media. Jogjakarta.
Sumarti, N., & Marendri, A. D. (2017). A Mathematical Model Of Profit-Loss Sharing Scheme Of Small
Investment For Traditional Market Traders Using The Semi-Fuzzy Logic Approach. Journal of
Islamic Monetary Economics and Finance, 2(2), 173-192.
Sumodiningrat, Gunawan., Ari Wulandari. Menuju Ekonomi Berdikari, pemberdayaan UMKM dengan
Konsep OPOP-OVOP-OVOC. Pressindo. Yogyakarta.
The 1st International Forum Business and Economy (IFBE) 2019 Banjarmasin, 13-14 November 2019
139
Wamukota, A. W., Crona, B., Osuka, K., & Daw, T. M. (2015). The importance of selected individual
characteristics in determining market prices for fishers and traders in Kenyan small-scale fisheries.
Society & natural resources, 28(9), 959-974.
Wang, C. (2002). The effect of net positions by type of trader on volatility in foreign currency futures
markets. Journal of Futures Markets: Futures, Options, and Other Derivative Products, 22(5), 427-
450.
Watson, I., & Gardingen, D. (1999, July). A distributed case-based reasoning application for engineering
sales support. In IJCAI (pp. 600-605).
Widayat, Prama. 2017. Perekonomian Indonesia. CV Karya Nofa. Pekanbaru.
Widayat, P. (2017). Pemberdayaan Ekonomi Umat dengan Pengembangan Usaha “Kita Mart” Yang
Berbasis Jamaah. Jurnal Diklat Review, 1(3), 172-175.
Widayat, Prama. 2018. Manajemen Risiko dan Asuransi Dalam Praktek edisi revisi. Hanum Publisher.
Semarang.
Widayat, P., & Pahlawan, R. (2018, July). Household Expenses after An Increased in Basic Tariff of
Electricity in Pekanbaru. In First Padang International Conference On Economics Education,
Economics, Business and Management, Accounting and Entrepreneurship (PICEEBA 2018).
Atlantis Press.
Widayat, Prama. 2019. Manajemen Koperasi dan UMKM Era Digital. Unilak Press. Pekanbaru.
Yew Wong, K., & Aspinwall, E. (2004). Characterizing knowledge management in the small business
environment. Journal of Knowledge management, 8(3), 44-61.
The 1st International Forum Business and Economy (IFBE) 2019 Banjarmasin, 13-14 November 2019
140
EFFECT OF FAIR VALUE ACCOUNTING, AUDITOR PROFESSIONAL SKEPTICISM AND
AUDIT FIRM SIZE TO AUDITOR – CLIENT NEGOTIATION RESULTS
Fitria Husnatarina1, Maria Yanida
2, San Petro
1Accounting Department, Economic and Business Faculty, University of Palangka Raya
2STIE YBPK Palangka Raya
Abstract: This research motivated by the current auditing standards changes caused by adopted fair value
in financial reporting standards. This study aims to provide an empirical illustration of the fair value
effect, the auditor's professional skepticism, as well as the accounting firm size in auditor-client
negotiation. This study used an internet based (website) experimental method that apply asset impairment
case. Experimental program designed to accommodate clients as a virtual client that acts consistently. 151
partners and managers auditor are from Big 4 and non-Big 4 in Indonesia as a participant in the
experiment. The results showed that all hypothesis supported statistically. The statical analysis describes
that the auditor that accept financial statements valuation at fair value will give lower away value from
client preferences. The auditor will give a conservative value in auditor-client negotiation than auditor
that have financial statements with the historical value case, as hypotheses one.Similarly to the hypothesis
two and three showed that the there difference in the final value of auditor-client negotiations between
auditor with higher skepticism than auditors with low skepticism. The same also applies to auditors
coming from Big 4. This study is expected to provide insight for the next research regarding adoption fair
value in the context of the auditor-client negotiation. Using an experimental design that can accommodate
dyad negotiation or by using the other fair value cases.
Keywords: valuation of financial statements, fair value, historical value, asset impairment, auditor's
professional skepticism, auditor-client negotiation.
BACKGROUND
The fair value estimated in financial reporting has a great influence on the changes in auditing standards
(PCAOB 2011). Auditing standards change with the financial reporting standards that accommodate the
estimated fair value assessment (Christensen et al. 2012). This problem is a challenge for auditors when
audit financial reports under IFRS. Where the main problems in financial reporting under IFRS is the
subjectivity of determining the estimated fair value (Christensen et al. 2012; PCAOB 2007b, 2011; SEC
2008). Unavailability of actual market prices led to estimated fair value used the "mark of model" that is
an estimate based on certain models. For example using the model "replacement value" that can
accommodate assumptions of the management (Georgiou and Lisa, 2011). The entry of the assumptions
of management in the process of assessing opportunities bias describes the use of more aggressive
assumptions by management (Kolev 2009). The aggressive management actions motivated by economic
conditions, and competition. This cases put pressure on management to achieve certain financial targets,
which ultimately triggered the management to enter their subjectivity assumptions in the financial
statements (PCAOB 2012; IAASB2008b).
Griffith et al. (2014) conducted interviews with auditors partners, which shows that they sometimes
fail to understand the risks of a model chosen by the client. The auditor failure due to lack of knowledge
about the method used. The auditor eventually will misinterpret the crucial assumption underlying the
model, in particular, when the market value is not available or not dynamic (Humphrey et al. 2009; SEC
2011).A study conducted by the PCAOB (2008, 2009, 2012) showed that often occurs irregularities
auditing practices in fair value associated with the ability of the auditor undertakes a review of the
The 1st International Forum Business and Economy (IFBE) 2019 Banjarmasin, 13-14 November 2019
141
assumptions used by management. This deviation occurs which caused by the low professional
skepticism auditors (PCAOB, 2012).
The importance of professional skepticism has become part of the audit profession (Johnstone et al.
2001). Professional skepticism auditor will direct the auditor to inquire every cue that indicates the
possibility of fraud (Louwers et al. 2005). Previous research showed that the auditors with high
professional skepticism described as an auditor who can withstand the pressures of management. So that
the audit work, the auditors become more conservative (Brown-Liburd et al., 2012).
Previous research also indicates that auditors can withstand the pressure of client and more
conservative in giving value to the financial statements. they is derived from the auditor of a large public
accounting firm or a public accounting firm that is affiliated with the Big 5 (Chen et al. 2005). Previous
DeAngelo (1981) states that the size of the public accounting firm positively related to audit quality.
Shockley (1981) also showed that a large public accounting firms is seen as more independent than the
public accounting firms smaller. Gul (1991) found that public accounting firms were greater perceived
than conflict can be solved about the audit of the company's position. This argument implies that a larger
public accounting firm, more resistant to client pressure compared with the public accounting firm that is
smaller in negotiations auditor- client issues related to the financial statements.
Negotiations auditor- client is a major issue in the field of auditing, because the audited financial
statements is a joint product between auditor and client management (Wang and Tuttle, 2009).
Negotiations itself is a process when a joint decision made by two or more parties with different
preferences that results have affected the welfare of both sides (Murnighan and Bazerman 1990). Previous
studies have shown that the process of preparation of financial statements related to the mechanism of
negotiation between the auditor and the client. The negotiation occurs when the method ambiguity of the
financial statement items or the absence of a clear standard guidelines (Sanchez et al., 2007; Hatfield et al.
2008; Gibbins et al. 2001; Beattie et al. 2004). Issues in Accounting solved by negotiation between the
auditor and the client. Gibbins et al. (2001) found that 67% of Partner (auditor) indicated that they were
negotiating with most of their clients. The results of these negotiations affect not only the financial
statements, but also the continuation of the relationship between auditors and clients (Geltland and
Christakopoulou 1999).
Previous studies show that issues related to the negotiation of the auditor- client arise from
thepractical phenomenon. Reveals that in the process of auditing the financial statements, the auditor and
the client almost always faced with a situation of negotiating (Trotman et al. 2011). It is possible to
happen due to a conflict of interest between the auditor and the client. Auditor portrayed to be in the
interests of compliance with standards, while at the other side the client obtain economically pressure to
increase the company value (Chen et al., 2012; Sanchez et al., 2007; Hatfield et al., 2008).This study was
conducted to test the auditor- clients negotiations based on a theoretical model. The model integrates all
aspects of bargaining in the negotiations. The model broadly includes input negotiations (assessment of
the financial statements and the estimated fair value, the auditor's professional skepticism and the
size).The negotiation process and the outcome of negotiations (agreement on the value of ratings of
financial statements).
The purpose of this study was to test the final value preferences in negotiation auditor-client about
the use of fair value accounting estimates, the auditor's professional skepticism and size of public
accounting firms. Specifically, there are three issues raised in this study. First, the influence of the
financial statements using the estimated fair value of the results of negotiations auditor- clients. Second,
the auditor's professional skepticism influence the outcome of negotiations auditor- clients. Third, the
influence of the size of public accounting firm based on the results of negotiations auditor- clients.
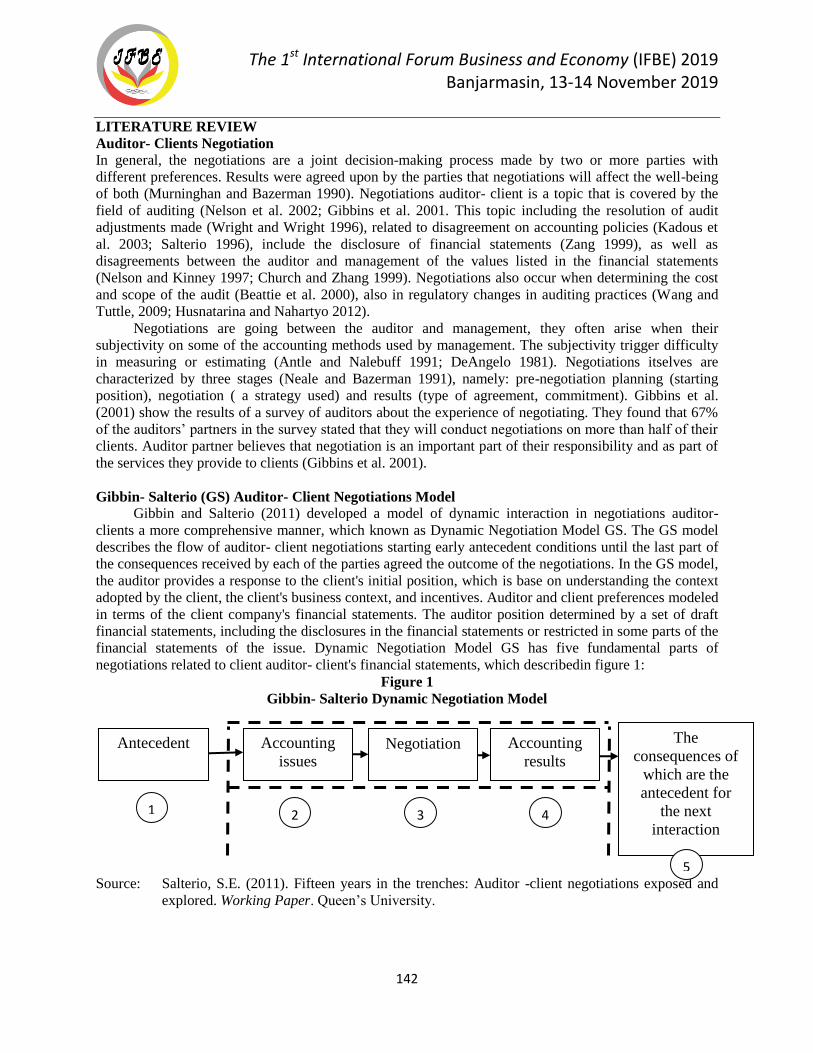
The 1st International Forum Business and Economy (IFBE) 2019 Banjarmasin, 13-14 November 2019
142
LITERATURE REVIEW
Auditor- Clients Negotiation
In general, the negotiations are a joint decision-making process made by two or more parties with
different preferences. Results were agreed upon by the parties that negotiations will affect the well-being
of both (Murninghan and Bazerman 1990). Negotiations auditor- client is a topic that is covered by the
field of auditing (Nelson et al. 2002; Gibbins et al. 2001. This topic including the resolution of audit
adjustments made (Wright and Wright 1996), related to disagreement on accounting policies (Kadous et
al. 2003; Salterio 1996), include the disclosure of financial statements (Zang 1999), as well as
disagreements between the auditor and management of the values listed in the financial statements
(Nelson and Kinney 1997; Church and Zhang 1999). Negotiations also occur when determining the cost
and scope of the audit (Beattie et al. 2000), also in regulatory changes in auditing practices (Wang and
Tuttle, 2009; Husnatarina and Nahartyo 2012).
Negotiations are going between the auditor and management, they often arise when their
subjectivity on some of the accounting methods used by management. The subjectivity trigger difficulty
in measuring or estimating (Antle and Nalebuff 1991; DeAngelo 1981). Negotiations itselves are
characterized by three stages (Neale and Bazerman 1991), namely: pre-negotiation planning (starting
position), negotiation ( a strategy used) and results (type of agreement, commitment). Gibbins et al.
(2001) show the results of a survey of auditors about the experience of negotiating. They found that 67%
of the auditors’ partners in the survey stated that they will conduct negotiations on more than half of their
clients. Auditor partner believes that negotiation is an important part of their responsibility and as part of
the services they provide to clients (Gibbins et al. 2001).
Gibbin- Salterio (GS) Auditor- Client Negotiations Model Gibbin and Salterio (2011) developed a model of dynamic interaction in negotiations auditor-
clients a more comprehensive manner, which known as Dynamic Negotiation Model GS. The GS model
describes the flow of auditor- client negotiations starting early antecedent conditions until the last part of
the consequences received by each of the parties agreed the outcome of the negotiations. In the GS model,
the auditor provides a response to the client's initial position, which is base on understanding the context
adopted by the client, the client's business context, and incentives. Auditor and client preferences modeled
in terms of the client company's financial statements. The auditor position determined by a set of draft
financial statements, including the disclosures in the financial statements or restricted in some parts of the
financial statements of the issue. Dynamic Negotiation Model GS has five fundamental parts of
negotiations related to client auditor- client's financial statements, which describedin figure 1:
Figure 1
Gibbin- Salterio Dynamic Negotiation Model
Source: Salterio, S.E. (2011). Fifteen years in the trenches: Auditor -client negotiations exposed and
explored. Working Paper. Queen’s University.
The
consequences of
which are the
antecedent for
the next
interaction
Antecedent
Accounting
results
Negotiation Accounting
issues
4 3 2 1
5
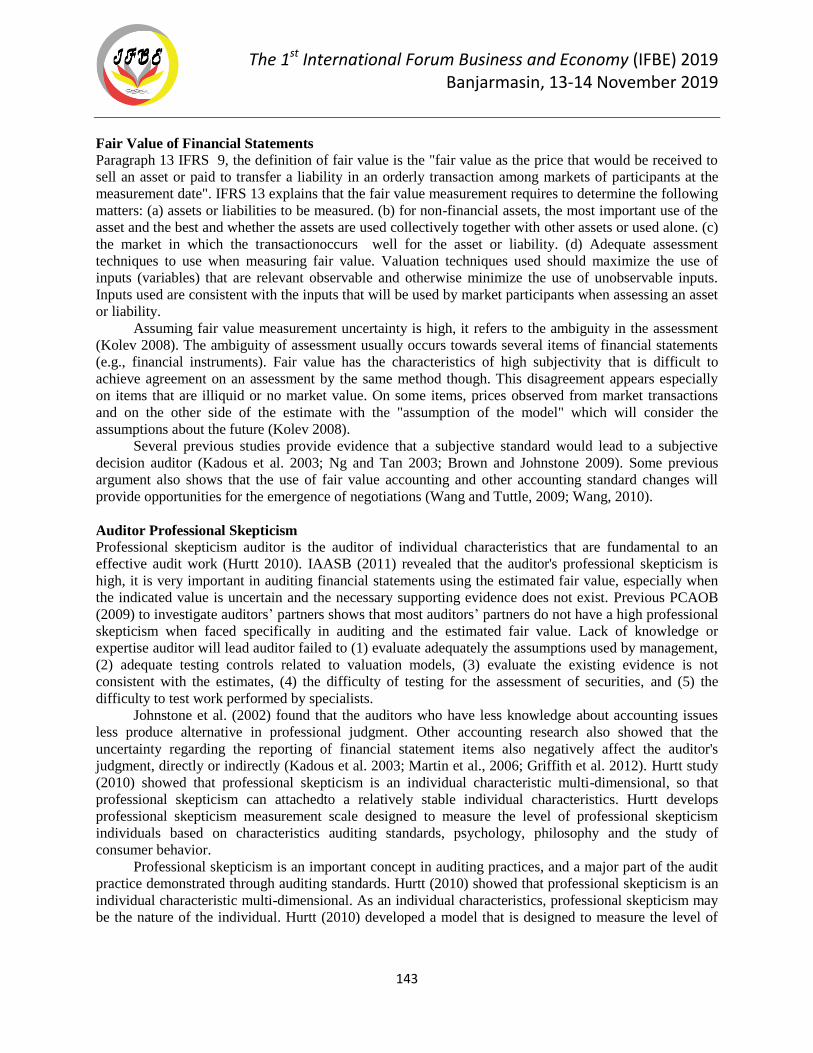
The 1st International Forum Business and Economy (IFBE) 2019 Banjarmasin, 13-14 November 2019
143
Fair Value of Financial Statements
Paragraph 13 IFRS 9, the definition of fair value is the "fair value as the price that would be received to
sell an asset or paid to transfer a liability in an orderly transaction among markets of participants at the
measurement date". IFRS 13 explains that the fair value measurement requires to determine the following
matters: (a) assets or liabilities to be measured. (b) for non-financial assets, the most important use of the
asset and the best and whether the assets are used collectively together with other assets or used alone. (c)
the market in which the transactionoccurs well for the asset or liability. (d) Adequate assessment
techniques to use when measuring fair value. Valuation techniques used should maximize the use of
inputs (variables) that are relevant observable and otherwise minimize the use of unobservable inputs.
Inputs used are consistent with the inputs that will be used by market participants when assessing an asset
or liability.
Assuming fair value measurement uncertainty is high, it refers to the ambiguity in the assessment
(Kolev 2008). The ambiguity of assessment usually occurs towards several items of financial statements
(e.g., financial instruments). Fair value has the characteristics of high subjectivity that is difficult to
achieve agreement on an assessment by the same method though. This disagreement appears especially
on items that are illiquid or no market value. On some items, prices observed from market transactions
and on the other side of the estimate with the "assumption of the model" which will consider the
assumptions about the future (Kolev 2008).
Several previous studies provide evidence that a subjective standard would lead to a subjective
decision auditor (Kadous et al. 2003; Ng and Tan 2003; Brown and Johnstone 2009). Some previous
argument also shows that the use of fair value accounting and other accounting standard changes will
provide opportunities for the emergence of negotiations (Wang and Tuttle, 2009; Wang, 2010).
Auditor Professional Skepticism
Professional skepticism auditor is the auditor of individual characteristics that are fundamental to an
effective audit work (Hurtt 2010). IAASB (2011) revealed that the auditor's professional skepticism is
high, it is very important in auditing financial statements using the estimated fair value, especially when
the indicated value is uncertain and the necessary supporting evidence does not exist. Previous PCAOB
(2009) to investigate auditors’ partners shows that most auditors’ partners do not have a high professional
skepticism when faced specifically in auditing and the estimated fair value. Lack of knowledge or
expertise auditor will lead auditor failed to (1) evaluate adequately the assumptions used by management,
(2) adequate testing controls related to valuation models, (3) evaluate the existing evidence is not
consistent with the estimates, (4) the difficulty of testing for the assessment of securities, and (5) the
difficulty to test work performed by specialists.
Johnstone et al. (2002) found that the auditors who have less knowledge about accounting issues
less produce alternative in professional judgment. Other accounting research also showed that the
uncertainty regarding the reporting of financial statement items also negatively affect the auditor's
judgment, directly or indirectly (Kadous et al. 2003; Martin et al., 2006; Griffith et al. 2012). Hurtt study
(2010) showed that professional skepticism is an individual characteristic multi-dimensional, so that
professional skepticism can attachedto a relatively stable individual characteristics. Hurtt develops
professional skepticism measurement scale designed to measure the level of professional skepticism
individuals based on characteristics auditing standards, psychology, philosophy and the study of
consumer behavior.
Professional skepticism is an important concept in auditing practices, and a major part of the audit
practice demonstrated through auditing standards. Hurtt (2010) showed that professional skepticism is an
individual characteristic multi-dimensional. As an individual characteristics, professional skepticism may
be the nature of the individual. Hurtt (2010) developed a model that is designed to measure the level of
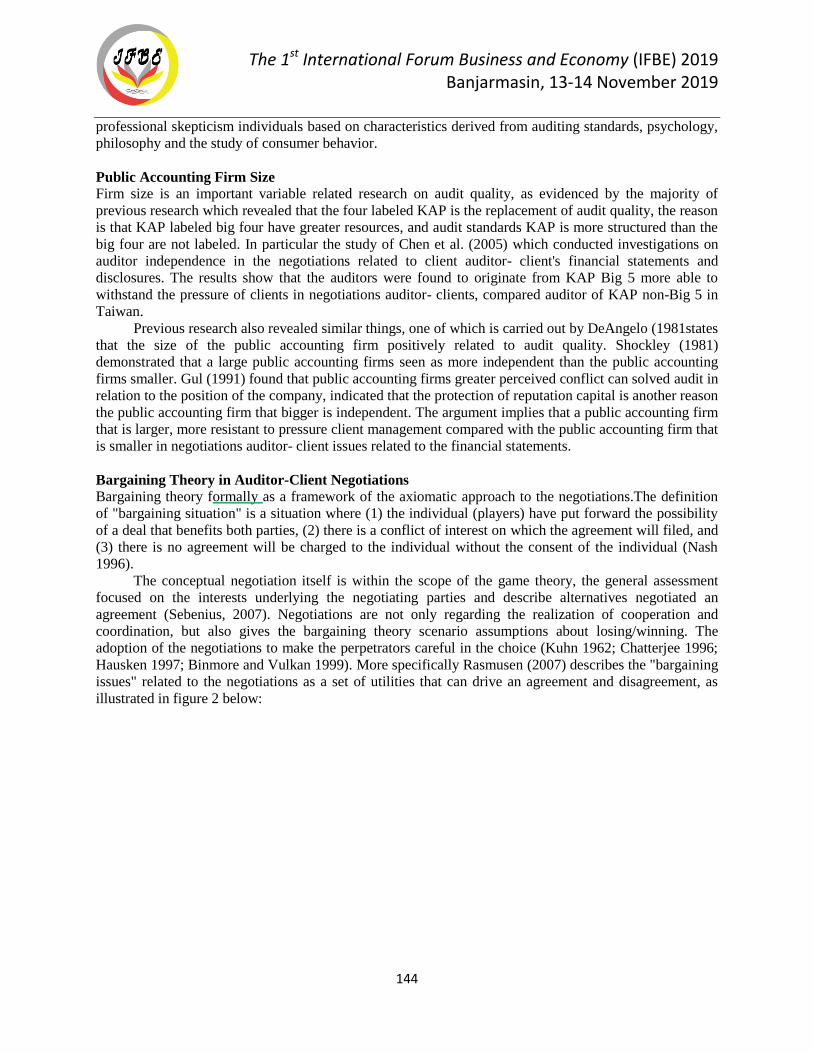
The 1st International Forum Business and Economy (IFBE) 2019 Banjarmasin, 13-14 November 2019
144
professional skepticism individuals based on characteristics derived from auditing standards, psychology,
philosophy and the study of consumer behavior.
Public Accounting Firm Size
Firm size is an important variable related research on audit quality, as evidenced by the majority of
previous research which revealed that the four labeled KAP is the replacement of audit quality, the reason
is that KAP labeled big four have greater resources, and audit standards KAP is more structured than the
big four are not labeled. In particular the study of Chen et al. (2005) which conducted investigations on
auditor independence in the negotiations related to client auditor- client's financial statements and
disclosures. The results show that the auditors were found to originate from KAP Big 5 more able to
withstand the pressure of clients in negotiations auditor- clients, compared auditor of KAP non-Big 5 in
Taiwan.
Previous research also revealed similar things, one of which is carried out by DeAngelo (1981states
that the size of the public accounting firm positively related to audit quality. Shockley (1981)
demonstrated that a large public accounting firms seen as more independent than the public accounting
firms smaller. Gul (1991) found that public accounting firms greater perceived conflict can solved audit in
relation to the position of the company, indicated that the protection of reputation capital is another reason
the public accounting firm that bigger is independent. The argument implies that a public accounting firm
that is larger, more resistant to pressure client management compared with the public accounting firm that
is smaller in negotiations auditor- client issues related to the financial statements.
Bargaining Theory in Auditor-Client Negotiations Bargaining theory formally as a framework of the axiomatic approach to the negotiations.The definition
of "bargaining situation" is a situation where (1) the individual (players) have put forward the possibility
of a deal that benefits both parties, (2) there is a conflict of interest on which the agreement will filed, and
(3) there is no agreement will be charged to the individual without the consent of the individual (Nash
1996).
The conceptual negotiation itself is within the scope of the game theory, the general assessment
focused on the interests underlying the negotiating parties and describe alternatives negotiated an
agreement (Sebenius, 2007). Negotiations are not only regarding the realization of cooperation and
coordination, but also gives the bargaining theory scenario assumptions about losing/winning. The
adoption of the negotiations to make the perpetrators careful in the choice (Kuhn 1962; Chatterjee 1996;
Hausken 1997; Binmore and Vulkan 1999). More specifically Rasmusen (2007) describes the "bargaining
issues" related to the negotiations as a set of utilities that can drive an agreement and disagreement, as
illustrated in figure 2 below:
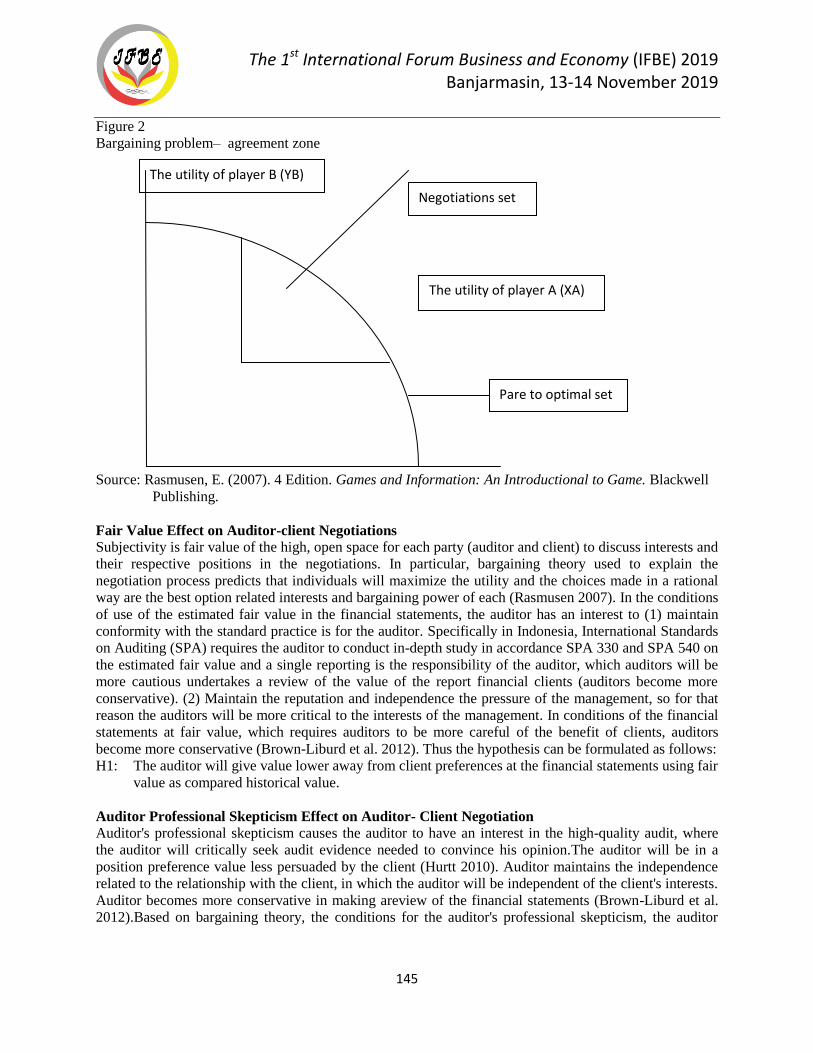
The 1st International Forum Business and Economy (IFBE) 2019 Banjarmasin, 13-14 November 2019
145
Figure 2
Bargaining problem– agreement zone
Source: Rasmusen, E. (2007). 4 Edition. Games and Information: An Introductional to Game. Blackwell
Publishing.
Fair Value Effect on Auditor-client Negotiations
Subjectivity is fair value of the high, open space for each party (auditor and client) to discuss interests and
their respective positions in the negotiations. In particular, bargaining theory used to explain the
negotiation process predicts that individuals will maximize the utility and the choices made in a rational
way are the best option related interests and bargaining power of each (Rasmusen 2007). In the conditions
of use of the estimated fair value in the financial statements, the auditor has an interest to (1) maintain
conformity with the standard practice is for the auditor. Specifically in Indonesia, International Standards
on Auditing (SPA) requires the auditor to conduct in-depth study in accordance SPA 330 and SPA 540 on
the estimated fair value and a single reporting is the responsibility of the auditor, which auditors will be
more cautious undertakes a review of the value of the report financial clients (auditors become more
conservative). (2) Maintain the reputation and independence the pressure of the management, so for that
reason the auditors will be more critical to the interests of the management. In conditions of the financial
statements at fair value, which requires auditors to be more careful of the benefit of clients, auditors
become more conservative (Brown-Liburd et al. 2012). Thus the hypothesis can be formulated as follows:
H1: The auditor will give value lower away from client preferences at the financial statements using fair
value as compared historical value.
Auditor Professional Skepticism Effect on Auditor- Client Negotiation
Auditor's professional skepticism causes the auditor to have an interest in the high-quality audit, where
the auditor will critically seek audit evidence needed to convince his opinion.The auditor will be in a
position preference value less persuaded by the client (Hurtt 2010). Auditor maintains the independence
related to the relationship with the client, in which the auditor will be independent of the client's interests.
Auditor becomes more conservative in making areview of the financial statements (Brown-Liburd et al.
2012).Based on bargaining theory, the conditions for the auditor's professional skepticism, the auditor
The utility of player B (YB)
Negotiations set
Pare to optimal set
The utility of player A (XA)
The 1st International Forum Business and Economy (IFBE) 2019 Banjarmasin, 13-14 November 2019
146
utility will be maximum at the position maintaining high independence and more away from the client
interests. Thus can be formulated the hypothesis two as follows:
H2: Auditor who showed a high professional skepticism give negotiation result lower away from client
preferences compare to the low professional skepticism auditors.
Public Accounting Firm Size Effect on Auditor- Client Negotiation
Based on the bargaining theory, the auditor comes from public accounting firms labeled big four have an
interest to maximize the utility related to (1) maintain their reputation, because reputation of a KAP will
be strongly related to the trust clients to provide audits (Simunic and Stein 1987), (2 ) maintaining audit
quality and maintain standards that have been structured audit of the firm where they work (DeAngelo
1981), (3) maintain the independence to avoid litigation costs, because large KAP will face penalty
concluded that the auditor utility derived from big four would maximize at a position more away from the
interests of the client. That the three hypotheses can formulate as follows:
H3: Auditor derived from big four give negotiation results lower away from client preferences compare
the auditor non-Big four.
DATA AND METHOD
Data Collection
This study uses a virtual experiment using the experimental program based websites, where the client
conditioned as a virtual client. This study did not examine the process of negotiating a two-way, the client
is part of the experimental program designed consistently use competitive negotiation strategy (Brown-
Liburd et al. 2012). This study used an experimental procedure that involves participants auditors at the
level of partner and manager at KAP labeled four large and four unlabeled large in Indonesia. Participants
act as auditor to audit the financial statements of the client company (PT. LINTAS JAYA Tbk) which the
financial statements used the fair value assessment and the assessment of financial statements used the
historical value. This study research design as follow:
Table 1
Research Design
Financial Statements Valuation
Fair Value Historical Value
Big 4 non-Big 4 Big 4 non-Big 4
Skepticism
High
Cell 1
Cell 2
Cell 5
Cell 6
Low
Cell 3
Cell 4
Cell 7
Cell 8
Experiments Design
This research used experimental design with three independent variables. Each of these independent
variables was categorized into two categories, the financial statements (fair value vs. historical value),
auditor skepticism (high skepticism vs low skepticism), the audit firm size (big four vs. not big four).
Financial statements of valuation variable were given treatment while two other variables, in this study,
measured. The auditor's professional skepticism was measured using a skepticism scale by Hurtt (2010),
with 30 items of questions. While the variable size of the firm was measured by stuffing items in the
demographics of the respondents whether it came from the four large KAP labeled or not labeled KAP.
The 1st International Forum Business and Economy (IFBE) 2019 Banjarmasin, 13-14 November 2019
147
Participants were randomized to receive cases of financial statements at fair value and financial
statements with historical value.
Experiment Instruments
This research experiment instrument includes a list of questions questionnaire skepticism auditors,
company information, financial statements, checking the manipulation and measurement of the dependent
variable. Overall instrument material used in this study through several processes, through interviews
with practitioners (partnerauditor) with individual discussions, focus group discussions as well as through
pilot test.
The first step of the respondents was asked to access the website http://fitriahusna.com, where the
experiments conducted. Respondents received an introductory statement in conducting experiments and
filled the demographic data. Furthermore, respondents were given 30 questions that measured the auditor
skepticism. Choice answers were given to these questionson a scale of 1 (strongly disagree) to 6 scales
(strongly agree), then on average. If respondents had an average score of 120 upwards (> 120), the
respondents identified as high skepticism, on the contrary, if the respondent had an average score of 120,
down (<120) respondents identified low skepticism.
The next stage, respondents were given information PT. LINTAS JAYA Tbk. PT. LINTAS JAYA
Tbk that is a large bus rental companies and excels in Indonesia. The company has operated since 1985
with operations spread across Indonesia and has had a fleet of buses that much. Company information as
well as the financial information, PT. LINTAS JAYA Tbk will be used as a basis for the respondent to get
an overview of the business and financial condition of the client. After receiving information about the
company and the financial PT. LINTAS JAYA Tbk, respondents would receive a check question
manipulation to ensure respondents understand that the client company was already using the financial
statements at fair value or using the historical financial statements. Selection of respondents' answers to
these questions was "Yes" and "No".
Statistical Analysis
To test the hypothesis of this study used analysis Independent- Samples t-Test. Independent samples t-test
was used to test differences (comparative test) to see the difference in mean treatment group and the
control group (Spatz and Kardas 2008), which modeled as follows:
=
d =
SD =
= N – 1
RESULT AND DISCUSSION
Characteristics of Participants
This study used 151 partner and manager auditoras respondentsas shown in Table 2 below:
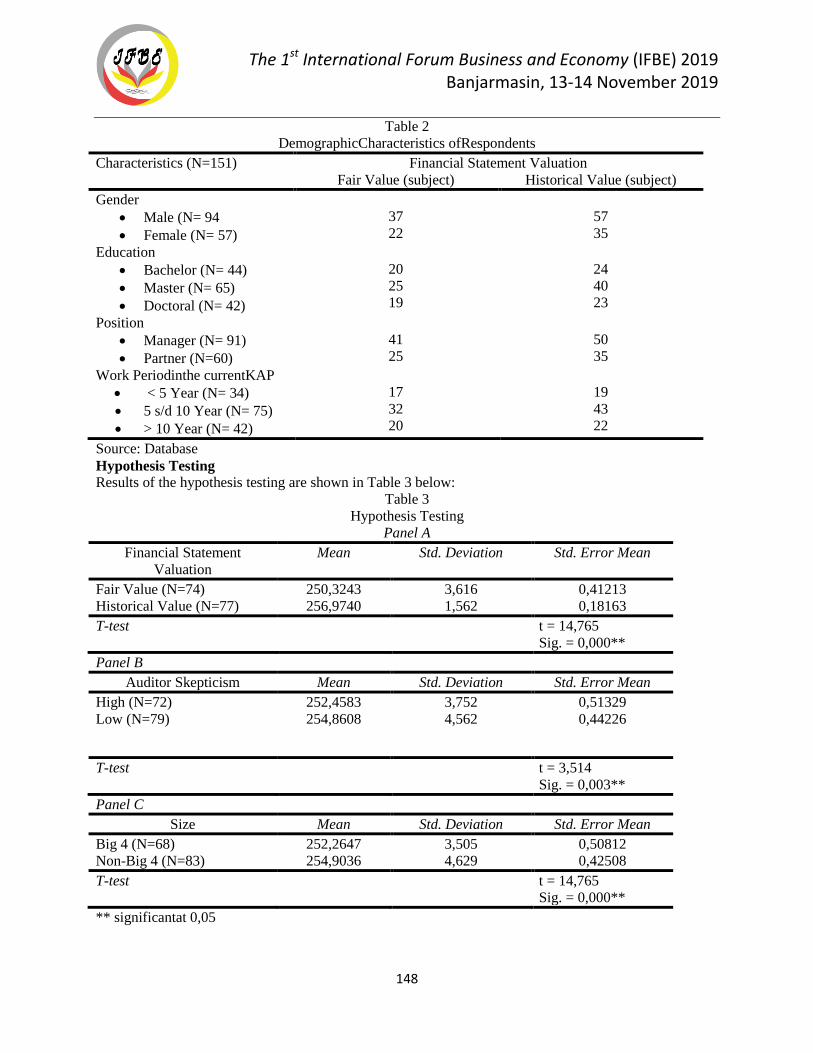
The 1st International Forum Business and Economy (IFBE) 2019 Banjarmasin, 13-14 November 2019
148
Table 2
DemographicCharacteristics ofRespondents
Characteristics (N=151) Financial Statement Valuation
Fair Value (subject) Historical Value (subject)
Gender
Male (N= 94
Female (N= 57)
37
22
57
35
Education
Bachelor (N= 44)
Master (N= 65)
Doctoral (N= 42)
20
25
19
24
40
23
Position
Manager (N= 91)
Partner (N=60)
41
25
50
35
Work Periodinthe currentKAP
< 5 Year (N= 34)
5 s/d 10 Year (N= 75)
> 10 Year (N= 42)
17
32
20
19
43
22
Source: Database
Hypothesis Testing
Results of the hypothesis testing are shown in Table 3 below:
Table 3
Hypothesis Testing
Panel A
Financial Statement
Valuation
Mean Std. Deviation Std. Error Mean
Fair Value (N=74) 250,3243 3,616 0,41213
Historical Value (N=77) 256,9740 1,562 0,18163
T-test t = 14,765
Sig. = 0,000**
Panel B
Auditor Skepticism Mean Std. Deviation Std. Error Mean
High (N=72) 252,4583 3,752 0,51329
Low (N=79) 254,8608 4,562 0,44226
T-test t = 3,514
Sig. = 0,003**
Panel C
Size Mean Std. Deviation Std. Error Mean
Big 4 (N=68) 252,2647 3,505 0,50812
Non-Big 4 (N=83) 254,9036 4,629 0,42508
T-test t = 14,765
Sig. = 0,000**
** significantat 0,05
The 1st International Forum Business and Economy (IFBE) 2019 Banjarmasin, 13-14 November 2019
149
Results of hypothesis one in Panel A showed that the significance level of 0.000 (p<0.05) and with
t value = 14.765. The result showed that there was a difference in the value of negotiation between
respondents who received case assessment of financial statements at fair value and respondents who
received case assessment of financial statements with historical value. The testing also showed that mean
value of the respondents with the valuation at fair value (250.3243) lower away from the client preference
(260) compared with financial statements with historical value (256.9740). According the hypothesized
that the auditors who received ratings of financial statements at fair value would give the value of the
lower away from the client preference than the auditor who received an assessment of financial
statements with historical value. It can conclude that the hypothesis is supported.
Results of hypothesis two in Panel B showed the significance 0.003 <p value (0.05) and with t =
3.514. These results indicated that there was a difference of negotiations between the auditors who had
skepticism higher than the auditors with skepticism low. The statistical results also showed that there
were differences in the mean value of the negotiation group of respondents auditors with high skepticism
(252.4583) which was away from the value of client preferences (260) compared with the group of
auditors with skepticism low (254.8608). This is consistent with the hypothesis of two hypothesized that
auditors with high skepticism would give a lower end of the negotiations away from the preferences of
clients compared to auditors with skepticism low, so it can conclude that the hypothesis of two is
supported.
Results of hypothesis testing three in Panel C showed that the significance of the 0,000 with p-
value = 0.05 which means that 0,000 <p value. The test results also showed that the value of t = 3.887,
which means that there were differences between respondents auditor negotiation value derived from four
major labeled KAP and respondents coming from KAP auditors were not labeled four. Statistical results
also showed that the mean value of the respondents negotiations auditor coming from the big four labeled
KAP (252.2647) was lower than the auditor from the value of the clients who came from the four large
unlabeled KAP (254.9036) thus consistent with the hypothesis that the three auditors derived from four
major labeled KAP would give a lower end of the negotiations away from the client preference than the
auditor who came from non-Big 4.
Results of hypothesis testing one in Panel A showed that the significance level of 0.000 (p <0.05)
and with a value of t = 14.765, which means that there was a difference in the value of negotiation
between respondents who received case assessment of financial statements at fair value and respondents
who received case assessment of financial statements with historical value. The testing also showed that
the mean value of the respondents auditor negotiations with the assessment of financial statements at fair
value (250.3243) lower away from the preference value clients (260) compared with the group mean
ratings of financial statements with historical value (256.9740). According as it is hypothesized that the
auditors who received ratings of financial statements at fair value would give the value of the lower end
of the negotiations away from the client preference than the auditor who received assessment of financial
statements with historical value. It can conclude that the hypothesis is supported.
Results of hypothesis testing two in Panel B showed the significance 0.003 <p value (0.05) and
with t = 3.514. These results indicated that there was a difference of negotiations between the group of
auditors who had skepticism was higher than the group of auditors with skepticism low. The statistical
results also showed that there were differences in the mean value of the negotiation group of respondents
auditors with high skepticism (252.4583) which was away from the value of client preferences (260)
compared with the group of auditors with skepticism low (254.8608). This is consistent with the
hypothesis of two hypothesized that auditors with high skepticism would give a lower end of the
negotiations away from the preferences of clients compared to auditors with skepticism low, so it can
conclude that the hypothesis of two is supported.
Results of hypothesis testing three in Panel C showed that the significance of the 0,000 with p-
value = 0.05 which means that 0,000 <p value. The test results also showed that the value of t = 3.887,
which means that there were differences between respondents auditor negotiation value derived from Big
The 1st International Forum Business and Economy (IFBE) 2019 Banjarmasin, 13-14 November 2019
150
4 and respondents coming from non-Big 4. Statistical results also showed that the mean value of the
respondents negotiations auditor coming from the big four labeled KAP (252.2647) was lower than the
auditor from the value of the clients who came from non-Big 4 (254.9036) thus consistent with the
hypothesis three that auditors derived from Big 4 would give a lower away from the client preference than
the auditor who came from non-Big 4.
CONCLUSION
Results of the study provide empirical evidence that the auditor will give a lower value of the negotiations
on the conditions of the fair value assessment compared with historical financial statements. Auditors that
were an informed assessment of financial statements using a fair value would more act more
conservatively. The auditor will give recommendations to the appraisal value of the financial statements
using a fair value more than the auditor's client preferences away from the receiving ratings of financial
statements with historical value. The argument for this result is that the auditor acted more carefully; this
is because these conditions require the auditor to feel a lot more information to understand the client's
condition.
Results of this study also suggest that the auditor skepticism influential in the auditor-client
negotiation. An auditor who has high skepticism will be more careful in giving recommendations related
to the value of the client's financial statements. Auditors who have high professional skepticism require
more evidence, both in quantity and quality to provide confidence to the client's financial statements.
Results of this study also argue that the auditors derived from four major labeled KAP can
withstand the pressure of clients in cases related to negotiated client's financial statements. The result
evidenced by the recommendations given by the auditor from the Big 4 was lower away from client
preference compared to the auditor that came from non-Big 4. This result is consistent with previous
research. The auditor is derived from Big 4 better maintain independence and quality in the audit
assignment (Chen et al. 2005; Bugeja, 2013; Mo et al. 2015).
First, future research may be done when the auditors are not in the busy season. The research
period in which the auditor is very busy periods will allow the response received from the auditors
become more numerous.Second, further research is important to be driven using other methods.
Observation of qualitative methods to ensure the involvement of the respondents, as well as patterns of
actual interaction of auditor- client.Third, future research on negotiations related to the fair value can use
other instruments, as well as the manipulation of various attributes of information and knowledge and
experience of the auditor and the client. There should auditing decisions also be given more collective
decisions or group, and then the next study might consider the use of the group as a subject who makes
the decision. Fourth, the case material used in this experiment did not include broadly "the world's wealth
of auditing" specific but related to asset impairment. It is, therefore, necessary to consider using a material
other cases, such as earnings management. Negotiations auditor -client a complex context in which the
actual arrangement is not as simple as what done in the case of the experiment. Future studies should look
at how the perception of management (client) as factors that affect the negotiations with the auditor. It is
also important to conduct this research in the form of dyad negotiations.
REFERENCES
American Institute of Certified Public Accountants (AICPA). 2003. Auditing fair value measurements
and disclosures. Statement on Auditing Standards No. 101. New York, NY: AICPA.
------------., 2006. Audit risk and materiality in conducting an audit. Statement on Auditing Standards No.
107. (August 12). New York, NY: AICPA, 2006.
------------., 2011. Auditing accounting estimates, including fair value accounting estimates and related
disclosures. AU-C Section 540. New York, NY: AICPA.
The 1st International Forum Business and Economy (IFBE) 2019 Banjarmasin, 13-14 November 2019
151
------------., 2013. Code of professional conduct. available at:
http://www.aicpa.org/Research/Standards/CodeofConduct/Pages/et_100.aspx
Angela. L. M., dan F. Husnatarina. 2015. Effect of auditor and client negotiation experience on audit
results: a the experimental test. Int. J. Monetary Economics and Finance (Forthcoming).
Antle, R., dan B. Nalebuff. 1991. Conservatism and auditor–client negotiations. Journal of Accounting
Research,vol. 29(supplement), pp. 31–54.
Aboody, D., M. E. Barth., dan R. Kasznik. 1999. Revaluations of fixed assets and future firm
performance: Evidence from the UK. Journal of Accounting and Economics, vol. 26 (1–3), pp.
149–178
Badan Pengawas Pasar Modal (BAPEPAM). 2002. Siaran Pers Badan Pengawas Pasar Modal.
http://www.bapepam.go.id/old/old/news/Des2002/PR_27_12_2002.PDF
Bame-Aldred, C.W., dan T. Kida. 2007. A comparison of auditor and client initial negotiation positions
and tactics. Accounting, Organizations and Society, vol. 32, pp. 497–511.
Barac, Z. A., dan S. Sodan. 2011. Motives for asset revaluation policy choice in croatia. Croatian
Operational Research Review, vol. 2 (1), pp. 60-70.
Barlev, B., D. Fried., J. R. Haddad., dan J. Livnat. 2007. Reevaluation of revaluations: A cross-country
examination of the motives and effects on future performance. Journal of Business Finance &
Accounting, vol. 34 (7-8), pp. 1025-1050.
Barth, M. E. 2006. Including estimates of the future in today’s financial statements.Accounting Horizons,
vol. 20 (3), pp. 271-285.
Beattie, V. A., R. Brandt., dan S. Fearnley. 2000. A grounded theory model of auditor-client negotiation..
International Journal of Auditing, vol. 8, pp. 1–19.
-----------., Fearnley, dan R. T. Brandt. 2004. Behind the audit report: A descriptive study of the
discussion and negotiation between auditors and directors. International Journal of Auditing,
vol. 4, pp. 177–202.
Benson, M. 2002. California pension fund vows to help prevent audit schemes. Wall Street Journal,
(February).
Bernardi, R.A. 1994. Fraud detection: The effect of client integrity and competence and auditor cognitive
style. Journal of Practice and Theory, vol. 13, pp. 68-84.
Binmore, K., dan N. Vulkan. 1999. Applying game theory to automated negotiation. Netnomics, vol. 1
(1), pp. 1-9.
Bonner, C., dan B. R. Newell. 2010. In conflict with ourselves? An investigation of heuristic and analytic
processes in decision making. Memory & Cognition, vol. 38 (2), pp. 186 – 196.
Bougen, P. D., dan J. Y. Joni. 2012. Fair value accounting: Simulacra and simulation. Critical
Perspective on Accounting, vol.23, pp. 390-402.
The 1st International Forum Business and Economy (IFBE) 2019 Banjarmasin, 13-14 November 2019
152
Bowlin, K., J. Hales., dan S. J. Kachelmeier. 2006. Experimental evidence of how prior experience as an
auditor Influences managers' strategic reporting Decisions. Working Paper
------------., J. L. Hobson., dan M. D. Piercey. 2012. The effects of auditor rotation, professional
skepticism, and interactions with managers on audit quality. Working Paper.
Bratten, B., L. M. Gaynor., L. S.McDaniel., N. R. Montague., dan G. E. Sierra. 2013. The audit of fair
values and other estimates: The effects of underlying environmental, task, and auditor-specific
factors.Auditing: A Journal of Practice & Theory, vol. 32 (supplement1), pp. 7-44.
Brody, R. G., D. J. Lowe., dan K. Pany. 2003. Could $51 million be immaterial when Enron reports
income of $105 million? Accounting Horizons,vol. 17 (2),pp. 153–160
Brown, H., dan K. M. Johnstone. 2009. Resolving disputed financial reporting issues: Effects of auditor
negotiation experience and engagement risk on thenegotiation process and outcome. Auditing: A
Journal of Practice & Theory, vol. 28 (2), pp. 65–92.
Brown-Liburd, H. L dan A. Wright. 2008. An examination of auditor negotiation strategies. Working
Paper. Northeastern University.
-----------. 2011. The effect of past client relationship and strength of audit committee on auditor
negotiations. Auditing: A Journal of Practice & Theory(Forthcoming).
-----------.,J. Cohen., dan G. Trompeter. 2013. Effects of earning forecast and heightened professional
skepticism on the outcome of client-auditor negotiation. Journal Bussines Ethics,vol. 116, pp.
311-325.
Bugeja, M. 2011, Takeover premiumsand the perception of auditor independence and reputation.The
British Accounting Review, vol. 43, pp. 278-293.
Cannon, N. H., dan J. C. Bedard. 2014. Auditing challenging fair value measurements: Evidence from the
field. Working paper, Texas State University.
Carpenter, T dan C. Durtschi. 2008. The Incremental benefits of a forensic accounting course on
skepticism and fraud-related judgments. Working Paper.
----------., dan J. L. Reimers. 2013. Professional skepticism: The effects of a partner’s influence and the
level of fraud indicators on auditor’s fraud judgments and actions. Behavioral Research in
Accountin,gvol. 25 (2), pp. 45-69.
Chand, P., P. Chris., danP. Arvind. 2010. Interpretation and application of “new” and “complex”
international financial reporting standards in Fiji: Implications for convergence of accounting
standards. Advances in Accounting, incorporating Advances in International Accounting,
vol.26, pp. 280-289.
Chatterjee, K. 1996. Game theory and the practice of bargaining. Group Decision and Negotiation, vol. 5,
pp. 355-369.
Chen, K. Y., R. J. Elder dan J. L. Liu. 2005. Auditor independence, audit quality and auditor-client
negotiation outcomes: some evidence from taiwan. Journal of Contemporary Accounting and
Economics, vol. 1, pp. 119-146.
The 1st International Forum Business and Economy (IFBE) 2019 Banjarmasin, 13-14 November 2019
153
Chen, Q., K. Khim., dan E. S. Steve. 2012. Do changes in audit actions and attitudes consistent with
increased auditor scepticism deter aggressive earning management? An experimental
investigation. Accounting, Organization and Society,vol. 37, pp. 95-115.
Christensen, B. E., S. M. Glover., dan D. A. Wood. 2012. Extreme estimation uncertainty in fair value
estimates: Implications for audit assurance. Auditing: A Journal of Practice & Theory, vol. 31
(1), pp. 127-146.
Church, B. K., dan P. Zhang. 1999. Bargaining behavior and payoff uncertainty: Experimental evidence.
Journal of Economic Psycholog,yvol. 20, pp.407-429.
Cross, J. G. 1965. A theory of the bargaining process. The American Ecconomic Review 55, 67-94.
Cunningham, L. A. 2006. Too Big to fail: Moral hazard in auditing and the need to restructure the
industry before it unravels. Columbia Law Review. vol. 106 (7), pp. 1698-1748.
Daniels, B. W., dan Q. Booker. 2006. The effects of audit firm rotation on perceived external auditor
independence and audit quality. Auditing section of the American accounting association mid-
year meeting, Los Angeles, CA.
Davis, D., dan C. Holt. 1993. Experimental economics. Princeton, NJ: Princeton University Press.
DeAngelo, L. E. 1981. Auditor size and audit quality. Journal of Accounting and Economics pp. 183-199.
Dechow, P., L. Myers, dan C. Shakespeare. 2010. Fair value accounting and gains from asset
securitizations: A convenient earnings management tool with compensation side-benefits.
Journal of Accounting & Economics,vol. 49(1), pp. 2-25.
Defond, M. L., dan J. Jiambalvo. 1993. Factors related to auditor–client disagreements over income-
increasing accounting methods. Contemporary Accounting Research, vol. 9, pp. 415–431.
Demski, J., dan H. Frimor. 1999. Performance measure garbling under renegotiation in multi-period
agencies. Journal of Accounting Research, vol. 37(Supplement), pp. 187–221.
Dewan Standar Akuntasi Keuangan - Ikatan Akuntan Indonesia (DSAK-IAI). (2013). PSAK 48 revisi
2009: Penurunan Nilai Aset.
Dhaliwal, D. S. 1980.The Effect ofthe Firm’s Capital Structure on the Choice of Accounting Methods.
The Accounting Review, vol. 55 (1), pp. 78—84.
Dopuch, N. R., dan D. Simunic. 1982. The competition in auditing:an assessment. Fourth Symposium on
Auditing Research, pp. 401-405.
-----------., R. King., dan R. Schwartz. 2001. An experimental investigation of retention and rotation
requirements. Journal of Accounting Research, vol. 39, pp. 93–117.
Dye, R. 1993. Auditing standards, legal liability and auditor wealth. Journal of political Economy, vol.
101, pp. 887-914.
Farmer, T. A., L. E. Rittenberg., dan G. M. Trompeter. 1987. An investigation of the impact of economic
and organizational factors on auditor independence. Auditing: A Journal of Practice and
Theory,vol. 7, pp. 1–14.
The 1st International Forum Business and Economy (IFBE) 2019 Banjarmasin, 13-14 November 2019
154
Financial Accounting Standards Board (FASB). Fair Value Measurements. Statement of Financial
Accounting Standards No. 157. Norwalk, CT: FASB, 2006.
Fisher, J., J. R. Frederickson., danS. A. Peffer. 2006. Budget negotiations in multiperiod settings.
Accounting, Organizations and Society, vol. 31, pp. 511–528.
Francis, J. R., E. Maydew, dan C. Sparks. 1999. The role of Big 6 auditor in the credible reporting of
accruals. Auditing: Journal of Practice & Theory,vol. 18 (2), pp. 17-34.
------------., dan B. Ke. 2006. Disclosure of fees paid to auditors and the market valuation of earnings
surprises. Review of Accounting Studies, vol. 11(4), pp. 495–523.
------------.,dan D. Wang. 2008. The joint effect of investor protection and Big 4 audits on earning quality
around the world. Contemporary Accounting Research,vol. 25 (1), pp. 157-191.
-------------.,dan M. Yu. 2009. Big 4 office size and audit quality. The Accounting Reviewvol. 84 (1), pp.
1521-1552.
Galin. A., M. Gross., dan G. Gosalker. 2007. E-negotiation versus face-to-face negotiation what has
Changde – if anything?. Computer in Human Behavior, vol. 23, pp. 787-797.
Geiger, A., dan D. Rama. 2003. Audit fees, non-audit fees and auditor reporting on stressed companies.
Auditing: A Journal of Practice and Theory, vol. 22(2), pp. 53–69.
Georgiou, O., dan J. Lisa. 2011. In pursuit of legitimacy: A history behind fair value accounting. The
British Accounting Review,vol. 43, pp. 311-323.
Ghosh, A., S. Kallapur., dan D. Moon. 2009. Auditor and non-audit fees and capital market perceptions of
auditor independence. Journal of Accounting and Public Policy, vol. 28(5), pp. 369–385.
Gibbins, M., dan S. Salterio. 2011. Fifteen years in the trenches: Auditor -client negotiations exposed and
explored. Working Paper. Queen’s University.
------------., M. C. Susan., dan E. S. Steve. 2010. The auditor’s strategy selection for negotiation with
management: Flexibility of initial accounting position and nature of the relationship. Accounting
Organizations and Society,vol. 35, pp. 579 – 595.
------------------------------------------------------------. 2005. The auditor–client relationship in financial
reporting negotiation: Focusing on the dyad. Auditing: A Journal of Practice and Theory, vol.
24(Supplement), pp. 171–193.
--------------., S. Salterio., dan A. Webb. 2001. Evidence about auditor–client management negotiation
concerning client’s financial reporting. Journal of Accounting Research, vol. 39, pp. 535–563.
Goodwin, J. 2002. Auditor’s conflict management styles: An exploratory study. Abacus,vol. 38 (3), pp.
378–405.
Griffith, E., J. Hammersley, dan K. Kadous. 2014. Audits of complex estimates as verification of
management numbers: How institutional pressures shape practice. Contemporary Accounting
Research (forthcoming).
---------------------------------------------------------------.,dan D. Young. 2014. Auditor mindsets and audits of
complex estimates. Journal of Accounting Research (forthcoming).
The 1st International Forum Business and Economy (IFBE) 2019 Banjarmasin, 13-14 November 2019
155
Gudono. 2011. Analisis Data Multivariat. Edisi 1. BPFE Yogyakarta.
Gul, F. A. 1991. Size of audit fees and perceptions of auditors’ ability to resist management pressure in
audit conflicts situations. Abacus,vol. 27 (2), pp. 162-173.
Gwilliam, D., dan H. G. J. Richard. 2008. Fair value in financial reporting: Problem and pitfalls in
practice A Case study analysis of the use of fair valuation at Enron. Accounting Forum,vol. 32,
pp. 240-259.
Hatfield, R. C., C. P. Agoglia., dan M. H. Sanchez. 2005. The effect of client characteristics on the
negotiation tactics of auditors. In 2005 Annual meeting of the American accounting association,
San Francisco, CA.
-------------., S. B. Jackson., dan S. D. Vandevelde. 2006. The effects of auditor rotation and client
pressure on proposed audit adjustments. Working Paper, The University of Alabama.
-----------., C. Agoglia.,danM. Sanchez. 2008. Client Characteristic and The Negotiation Tactic of
Auditor: Implication for Financial Reporting. Journal of Accounting Research, vol. 46, pp.
1183-1207.
Hausken, K. 1997. Game – theortic and behavioral negotiation theory. Group Decision and Negotiation,
vol. 6, pp. 511-528.
Hurtt, K., M. M. Eining dan D. Plumlee. 2008. An experimental examination of professional skepticism.
Working Paper.
Hurtt, K.2010. Development of a scale to measure professional skepticism. Auditing: A Journal of
Practice and Theory,vol. 29 (1), pp. 149-171.
-----------., H. Brown-Liburd., E. E. Christine. dan G. Krishnamoorthy. 2013. Research on auditor
professional skepticism: Literature synthesis and opportunities for future research. Auditing: A
Journal of Practice & Theory, vol. 32 (Supplement 1), pp. 45-97.
Husnatarina,F., dan E, Nahartyo. 2012. The effect of mandatory auditor rotation and retention on auditor
– client negotiations Strategies. Review of Integrative Business & Economic Research, 1 (1),
260 – 276.
Humphrey,C., A. Loft., dan M. Woods. 2009.
Theglobalauditprofessionandtheinternationalfinancialarchitecture:Understandingregulatoryrelati
onshipsatatimeoffinancial crisis. Accounting, Organizations and Society, vol. 3, (6-7), pp. 810-
825.
Ikatan Akuntan Indonesia (IAI). 2001.Standar Profesi Akuntan Publik (SPAP). Salemba Empat, Jakarta.
Imhoff, E. A. Jr. 2003. Accounting quality, auditing, and corporate governance. Accounting Horizons,
vol. 17(Supplement), pp. 117–128.
International Accounting Standards Board (IASB). 2012. International Accounting Standard (IAS) 16:
Property, Plant and Equipment.
------------.,2013. International Financial Reporting Standards (IFRS) 13: Fair Value Measurement.
The 1st International Forum Business and Economy (IFBE) 2019 Banjarmasin, 13-14 November 2019
156
International Auditing and Assurance Standards Board (IAAS). 2009. International Standard on Auditing
(IAS) 540: Auditing Accounting Estimates, Including Fair Value Accounting Estimates, and
Related Disclosures.
International Auditing and Assurance Standards Board (IAASB). 2008.Auditing Accounting Estimates,
Including Fair Value Accounting Estimates, and Related Disclosures. International Standard on
Auditing 540. (February). New York, NY: International Federation of Accountants, 2008.
IAASB. 2014a. Handbook of International Quality Control, Auditing, Review, Other Assurance, and
Related Services Pronouncements. New York, NY: International Federation of Accountants
(IFAC).
Johnson, W. B., dan R. Ramanen. 1988. Discretionary accounting changes from succesfull effort to full
cost methods: 1970-1976. The Accounting Review. vol. LXIII (1), pp. 96—110.
Joshi, P. L., A. A. Jasim., dan G. B. Wayne. 2009. A Study of auditor-client relationships and problems in
the Bahraini audit environtment. Advances in Accounting, incorpoprating Advances in
International Accounting,vol. 25, pp. 266-277.
Kamus Besar Bahasa Indonesia (KBBI). 2015. http://kbbi.web.id/negosiasi
------------. 2015. http://kbbi.web.id/tawar
Kadous, K., J. Kennedy., dan M. Peecher. 2003. The effect of quality assessment and directional goal
commitment on auditors' acceptance of client-preferred accounting methods. The Accounting
Review (Forthcoming).
Kagel, J. H., dan A. E. Roth. 1995. The Handbook of experimental economics. Princeton, NJ: Princeton
University Press.
Kaplan, S. E., dan E. G. Mauldin. 2008. Auditor rotation and the appearance and independence: Evidence
from non-professional investors. The Journal of Accounting and Public Policy, vol. 27(2), pp.
177–192.
Kee, H.W., dan R.E. Knox. 1970. Conceptual and methodological considerations in the study of trust and
suspicion. Journal of Conflict Resolution , vol. 14, pp. 357-366.
Keputusan Menteri Keuangan Republik Indonesia. (2002). Nomor 423/KMK.06/2002 tentang Jasa
Akuntan Publik.
Keputusan Menteri Keuangan Republik Indonesia. (2003). Nomor 359/KMK.06/2003 tentang Perubahan
atas Keputusan Menteri Keuangan Republik Indonesia Nomor 423/KMK.06/2002 tentang Jasa
Akuntan Publik.
Kerr. D. S., dan U. S. Murthy. 2009. Beyond brainstorming: The effectiveness of computer-mediated
Communications for convergence and negotiation tasks. International Journal of Accounting
Information Systems, vol. 10, pp. 245-262.
Kim, J., R. Chung, dan M. Firth. 2003. Auditor conservatism, asymetric monitoring, and earning
management. Contemporary Accounting Research,vol. 20 (2), pp. 353-359.
Kolev, K. 2009. Do investors perceive marking-to-model as marking-to-myth? early evidence from FAS
157 disclosure. Working paper. New York University.
The 1st International Forum Business and Economy (IFBE) 2019 Banjarmasin, 13-14 November 2019
157
Kuhn, H. W. 1962. Game theory and models of negotiation. The Journal of Conflict Resolution, vol. 6(1),
pp. 1-4.
Landsman, W. R. 2007. Is fair value accounting information relevant and reliable? Evidence from capital
market research. Accounting and Business Research, vol. 37 (sup1ement), pp. 19-30.
Lee, C., dan S. P. Myung. 2013. Subjectivity in fair-value estimates, audit quality, and informativeness of
other comprehensive income. Advance in Accountingin corporating Advances in International
Accounting.
------------., R. Welker., dan T.W.Wang. 2013. An experimental investigation of professional skepticism
in audit interviews. International Journal of Auditing,vol. 17(2), pp. 213-226.
Lee, P., D. Stokes., S. Taylor., dan T. Walter. 2003. The association between audit quality, accounting
disclosures and firm-specific risk: evidence from initialpublic offerings. Journal of Accounting
and Public Policy, vol. 22(5), pp. 377–400.
Lennox, C. S. 1999. Audit quality and auditor size: An evaluation of reputation and deep pockets
hypotheses. Journal of Business Finance & Accounting, vol. 26, (7-8), pp. 779-805.
Libby, R., dan J. Luft. 1993. Determinants of judgment performance in accounting settings: Ability,
knowledge, motivation, and environment. Accounting, Organizations and Society, vol. 18 (5),
pp. 425-450.
Lim, C., dan H. Tan. 2008. Non-audit service fees and audit quality: the impact of auditor specialization.
Journal of Accounting Research, vol. 46(1), pp. 199–246.
Loebbecke, M.M., J. Einning, dan J. Willingham. 1989. Auditors’ Experience with material irregularities:
Frequency, nature and detectability auditing. A Journal of Practice & Theory, vol. 9, pp. 1–28.
Louwers, T. J., R. J. Ramsay., D. H. Sinason., dan J. R. Strawser. 2005. Auditing and Assurance Service.
New York: Me Graw Hill.
Martinov-Bennie, N., dan G. Pflugrath. 2009. The strength of an accounting firm’s ethical environment
and the quality of auditors’ judgments. Journal of Business Ethics,vol. 87, pp. 237-253.
Mautz R. K., dan H. A. Sharaf. 1961. The Philosophy of Auditing. American Accounting Association.
McCracken, S., E. S. Steve., dan G. Michael. 2008. Auditor-client management relationship and roles in
negotiating financial reporting. Accounting, Organization and Society,vol. 33, pp. 362-383.
------------.,S. E. Salterio., dan R. N. Schmidt. 2011. Do managers intend to use the same negotiation
strategies as partners? Behavioral Research in Accounting,vol. 23 (1), pp. 131–160.
Misconier- Piera, F. 2007. Motives for fixed asset revaluation: An empirical analysis with swiss data. The
International Journal of Accounting, vol. 42 (2), pp. 186-205.
Mo, P, L., L. Rui., dan X. Wu. 2015. Auditor’s going concern reporting in the pre- and post-bankruptcy
law eras: Chinese affiliates of big 4 versus local auditor. The International Journal of
Accounting, vol 50, pp. 1-30.
Murnighan, J. K., dan M. H. Bazerman. 1990. A perspective on negotiation research in accounting and
auditing. The Accounting Review, vol. 65 (3), pp. 642-657.
The 1st International Forum Business and Economy (IFBE) 2019 Banjarmasin, 13-14 November 2019
158
Nahartyo, E. 2012. Desain dan Implementasi Riset Eksperimen. Edisi 1. UPP STIM YKPN.
Nash, J.F. Jr. 1950. The bargaining problem. Econometrica,vol. 18, pp. 155-162
Neal, M. A., dan M. H. Bazerman. 1991. Cognition and rationality in negotiation. The Free Press, New
York.
Nelson, M., dan W. Kinney. 1997. The effect of ambiguity on auditors’ loss contingency reporting
judgments. The Accounting Review,vol. (April), pp. 257-274.
------------., J. Elliott., dan R. Tarpley. 2002. Evidence from auditors about manager’s and auditors’
earnings management decisions. The Accounting Review, vol. 77(Supplement), pp. 175–202.
------------.2009. A model and literature review of professional skepticism in auditing. Auditing: A Journal
of Practice & Theory,vol. 28 (2), pp. 1-34.
Ng, T. B., dan H. T. Tan. 2003. Effects of authoritative guidance availability and audit committee
effectiveness on auditors’judgments in an auditor–client negotiation context. The Accounting
Review, vol. 78, pp. 801–818.
Nolder, C., dan K. Kadous. 2014. The way forward on professional skepticism: Conceptualizing
professional skepticism as an attitude. Working paper, Suffolk University.
Palmrose, Z. 1988. An analysis of auditor litigation and audit service quality. The Accounting Review,
vol. 63(1), pp. 55–73.
Payne, J. W., J. R. Bettman., dan E. J. Johnson. 1993. The adaptive decision Maker. Cambridge:
Cambridge University Press.
Peecher, M. E., dan M. D. Piercey. 2008. Judging audit quality in light of adverse outcomes: evidence of
outcome bias and reverse outcome bias. Contemporary Accounting Research 25 (1): 243-272.
Perreault S., dan K. Thomas. 2011 The relative effectiveness of persuasion tactics in auditor-client
negotiations. Accounting Organizations and Sociaty 36, 534 – 547.
Piercey, M.D. 2009. Motivated reasoning and verbal vs. Numerical probability assessment: evidence from
an accounting context. Organizational behavior and human decision processes 108 (2): 330-
341.
Pruitt, D. G., dan P. J. Carnevale. 1993. Negotiation in social conflict. Pacific Grove, CA: Brooks/Cole
Publishing Company.
Pruitt, D. G., dan J. Z Rubin. 1986. Social conflict: Escalation, stalemate, and settlement. New York:
Random House.
Public Company Accounting Oversight Board (PCAOB). 2003a. Auditing Accounting Estimates.
-----------., 2003b. Auditing Fair Value Measurements and Disclosures. PCAOB Interim Auditing
Standards AU Section 328. Washington, D.C.: PCAOB.
-----------., 2007a. Auditing Accounting Estimates and Fair Value Measurements. Standing Advisory
Group Meeting. June 21. Washington, D.C.: PCAOB.
The 1st International Forum Business and Economy (IFBE) 2019 Banjarmasin, 13-14 November 2019
159
-----------., 2007b. Matters Related to Auditing Fair Value Measurements of Financial Instruments and
the Use of Specialists. Staff Audit Practice Alert No. 2. December 10, 2007. Washington, D.C.:
PCAOB.
-----------., 2009. Auditing Fair Value Measurements and Using the Work of a Specialist. Standing
Advisory Group Meeting. October 14-15. Washington, D.C.: PCAOB.
-----------., 2010d. PCAOB Release No. 2010-004. Auditing Standards Related to the Auditor’s
Assessment of and Response to Risk and Related Amendments to PCAOB Standards. Auditing
Standard No. 14. Washington, D.C.: PCAOB.
-----------., 2012. Staff Audit Practice Alert No. 10. Maintaining and applying professional skepticism in
audits. Washington, D.C.: PCAOB.
-----------., 2014. Staff Consultation Paper Auditing Accounting Estimates and Fair Value Measurements.
August 19. Washington, DC.: PCAOB.
Peecher, M. E., dan M. D. Piercey. 2008. Judging audit quality in light of adverse outcomes: evidence of
outcome bias and reverse outcome bias.Contemporary Accounting Research,vol. 25 (1), pp.
243-272.
Piercey, M. D. 2009. Motivated reasoning and verbal vs. numerical probability assessment: evidence from
an accounting context.Organizational Behavior andHuman Decision Processes, vol. 108 (2),
pp. 330-341.
Quadackers, L., T. Groot., dan A, Wright. 2009. Auditors' skeptical characteristics and their relationship
to skeptical judgments and decisions. WorkingPaper. VU University Amsterdam.
-----------.,T. Groot, dan A. Wright. 2014. Auditors’ professional skepticism: Neutrality versus
presumptive doubt. Contemporary Accounting Research,vol. 31, pp. 639-657.
Ramanna, K. 2008. The implications of unverifiable fair-value accounting: Evidence from the political
economy of goodwill accounting. Journal of Accounting and Economics,vol. 45, pp. 253-281.
Rasmusen, E. 2007. Edisi 4. Games and Information: An introductional to game theory.Blackwell
Publishing.
Rayman, R. A. 2007. Fair value accounting and the present value fallacy: The need for an alternative
conceptual framework. The British Accounting Review,vol. 39, pp. 211-225.
Rennie, M.D., L. S. Kopp., dan W. M. Lemon. 2010. Exploring trust and the auditor-client relationship:
factors influencing the auditor’s trust of a client representative. Auditing: A Journal of Practice
& Theory, vol. 29 (1), pp. 279-293.
Riyanto L.S. 2011. An empirical assessment of factors affecting professional commitment among
auditors and managers in Indonesia. The Indonesian Journal of Accounting Research, vol 14
(3), pp. 205-219.
Robbins, S.P., T. Judge., dan T. A. Judge. 2008. Organizational behavior. Pearson Prentice Hall.
Rusmin, R. 2010. Auditor quality and earnings management: Singaporean evidence. Managerial Auditing
Journal,vol. 25 (7), pp. 618-638.
The 1st International Forum Business and Economy (IFBE) 2019 Banjarmasin, 13-14 November 2019
160
Gibbin dan S. E. Salterio. 2011. Fifteen years in the trenches: Auditor -client negotiations exposed and
explored. Working Paper. Queen’s University.
Sanchez, M. H., C. P. Agoglia., dan R. C. Hatfield. 2007. The role of auditor strategy in auditor-client
negotiations over proposed financial statement adjustments: The rule of reciprocation. The
Accounting Review, vol. 82 (1), pp. 241-263.
Savage, G. T., J. D. Blair., dan R. L. Sorensen. 1989. Consider both relationships and substance when
negotiating strategically. Academy of Management Executive, vol. 3, pp. 37–48.
Sebenius, J. K. 2007. Negotiation analysis: Between decision and games. In advances in decision
analysis. Edited by W. Edwards, R. Miles, dan D. Von Winterfeldt. Cambridge UK: Cambridge
University Press, pp. 469-488.
Shaub M. K., dan J. E. Lawrence. 1996. Ethics, experience and professional skepticism: A situational
analysis. Behavioral Research in Accounting,vol. 8 (Supplement), pp. 124-157.
Shockley, R.A. (1981). Perception of Auditors’ Independence: An Empirical Analysis. The Accounting
Review, vol. 56 (4), pp. 785-800.
Simunic, D. A. dan M. Stein. 1987. Product differentiation in auditing : a study of a uditor choice in the
market for unseasoned new issues. Canadian Certified General Accountants’ Research
Foundation.
Smith, M. J. 2007. Accounting conservatism and real options. Journal of Accounting, Auditing and
Finance,Forthcoming.
Spatz, C. dan E. Kardas. 2008. Research Methods: Ideas, Techniques, & Reports. New York: McGraw-
Hill.
Standar Perikatan Audit (SPA) 330. 2013. Respon Auditor Terhadap Risiko yang Telah Dinilai. Institut
Akuntan Publik Indonesia.
------------------------------------------. 540. 2013. Audit Atas Estimasi Akuntansi, Termasuk Estimasi Nilai
Wajar, dan Pengungkapan yang Bersangkutan. Institut Akuntan Publik Indonesia.
Thomson, W. 2010. Bargaining and The Theory of Cooperative Games: Jhon Nash and Beyond. An
Elgar Research Collection. Cheltenham, UK. Northampton, MA, USA.
Trompeter, G., dan A. Wright. 2010. The world has changed—have analytical procedure practices?.
Contemporary Accounting Research,vol. 27 (2), pp. 669–700.
Trotman, K., A. Wright., dan S. Wright. 2005. Auditor negotiations: An examination of the efficacy of
intervention methods. The Accounting Review,vol. 80, pp. 349–367.
Wang, K. J., dan B. M. Tuttle. 2009. The impact of auditor rotation on auditor-client negotiation.
Accounting, Organizations and Society,vol. 34, pp. 222–243.
Wang, K. J. 2010 Negotiating a fair value under accounting uncertainty: A laboratory experiment.
Behavioral Research in Accounting, vol. 22 (1), pp. 109-134.
Watts, R. L. dan J. L. Zimmerman. 1986. The Positive Accounting Theory. Prentice Hall International, Inc
The 1st International Forum Business and Economy (IFBE) 2019 Banjarmasin, 13-14 November 2019
161
Windsor, C. A., dan N. M. Ashkanasy. 1995. The effect of client management bargaining power, moral
reasoning development, and belief in a just world on auditor independence. Accounting,
Organizations and Society, vol. 20 (7-8), pp. 701-720.
Wolf, F. R., J. A. Tackett., dan G. A. Claypool. 1999. Auditor disaster futures: Antidotes for the
expectations gap? Managerial Accounting Journal, vol. 14(9), pp. 468–478.
Zhang, P. 1999. A bargaining model of auditor reporting. Contemporary Accounting Research, vol. 16,
pp. 167–184.
The 1st International Forum Business and Economy (IFBE) 2019 Banjarmasin, 13-14 November 2019
162
THE EFFECT OF BUDGET PLANNING, BUDGET CHANGE, AND PROCUREMENT OF
GOODS AND SERVICES TO THE APPLICATION OF BUDGET
Een Evytha Venoryca, Usup Riassy Christa, Fitria Husnatarina
Economic and Business Faculty, University of Palangka Raya
Abstract: The objectives of this study are: 1). measuring and analyzing the effect of Budget Planning on
Budget Absorption; 2). measuring and analyzing the effect of Budget Changes on Budget Absorption; 3).
measuring and analyzing the effect of Procurement on Budget Absorption; 4) measuring and analyzing
the Effects of Budget Planning, Budget Changes, and Procurement simultaneously on Budget Absorption.
The population in this study is all employees who occupy positions in sections related to budget, namely
the Budget User (PA), PPK (Financial Administration Officer), PPTK (Technical Implementation
Activities Officer) and Expenditure Treasurer at 36 SKPD in the City Government of Palangka Raya with
research samples as many as 99 respondents. Primary and secondary data are utilized as sources. The data
collection methods use documentation and questionnaires. The analytical tool which is used in this study
is Smart PLS (Partial Least Square) version 3. The results of this study indicate that: 1). Budget Planning
has positive and significant effects on Budget Absorption; 2). Budget Changes has negative and
insignificant effect on Budget Absorption; 3). Procurement has positive and significant effect on Budget
Absorption; 4) Budget Planning, Budget Changes, and Procurement simultaneously have significant
effects on Budget Absorption.
Keywords: budget planning, budget changes, procurement, budget absorption.
BACKGROUND
The economic crisis and trust that hit Indonesia have both positive and negative impacts on efforts
to improve the welfare of all Indonesian people. On one hand, the crisis has had a tremendous impact on
poverty levels, but on the other hand, the crisis can also provide a "blessing in disguise" for efforts to
improve the living standards of people throughout Indonesia in the future. It is because the economic
crisis and the experienced trust have paved the way for the emergence of total reform in Indonesian
people aspects of life. One element of the total reforms is the demand for broad autonomy to be given to
regencies and cities. Such demands are reasonable, with at least two reasons. First, the intervention of the
Central Government which was too large in the past has caused the problem of the low capability and
effectiveness of regional governments in encouraging the process of development and democratic life in
the region (Mardiasmo, 1999). The directives and statutory requirements which are too large from the
central government cause local initiatives tend to die. Thus, the regional governments often make the
fulfillment of regulations as a goal, and not as a tool to improve services to the community (Mardiasmo,
2002). The central government still directs the regional goverments because of two main reasons. First,
the central goverment has task to ensure national stability. Second, the conditions of regional human
resources are still relatively weak.
According to the Law Number 32 Year 2004 article 1 paragraph 5, Regional Autonomy is the right,
the authority and the obligation of autonomous regions to regulate and manage their own government
affairs and the interests of local communities in accordance with statutory regulations. Based on this
matter, the Regional Government is given the authority to regulate and manage its own government
affairs according to the principle of autonomy. Moreover, the supporting duties which are be regulated by
the regional goverment are in accordance with Law Number 23 of 2014 concerning Regional Government
in lieu of Law Number 32 of 2004 and Law Number 33 of 2004 concerning Financial Balance between
the Central and Regional Governments in lieu of Law Number 25 of 1999.
The 1st International Forum Business and Economy (IFBE) 2019 Banjarmasin, 13-14 November 2019
163
The implementation of regional autonomy is essentially an effort to improve the welfare of
community by carrying out the development activities in accordance with the wishes and interests of the
community.
Theoretically, this decentralization is expected to produce tangible benefits. First, it encourages
increased participation, initiatives and creativity of community in development. It also encourages the
distribution of development outcomes (justice) in all regions by utilizing the resources and potential
available in each region. Second, it improves the allocation of productive resources through shifting the
role of public decision making to the lowest level of government which has the most complete
information (Mardiasmo, 2002).
Indirectly, the implementation of regional autonomy has forced the regions to make important and
fundamental changes in an effort to accommodate the various demands and aspirations which develop in
society. One of the changes in regional financial management is the issue of budgeting (Law No. 33 of
2004).
The autonomy granted to the regency and city regions is carried out by giving proportional, broad
and real authority to the regional government. It means that the transfer of responsibility will be followed
by equitable distribution arrangements, and utilization the national resources, as well as central and
regional financial balances.
LITERATURE REVIEW
Budget Planning
In an effort to empower the regional government, the perspective of the desired changes in regional
financial management and budget is as follows:
1. Regional financial management must rely on public interests (public oriented).
2. Clarity regarding the mission of regional financial management in general and the regional budget
in particular.
3. Decentralized financial management and clarity of the roles of the participants involved in budget
management, such as the DPRD, KDH, Regional Secretary and other regional apparatus.
4. Legal and administrative framework for financing, investment, and regional money management
based on the rules of the market mechanism, value of money, transparency and accountability.
5. Clarity about the financial position of the DPRD, KDH, and Regional Civil Servants, both the ratio
and the basis for consideration.
6. Provisions regarding the form of budget structure, performance budget and multi-annual budget.
7. The principle of procurement and management of the more professional regional goods.
8. Local government accounting principles, financial reports, the role of DPRD, and public
accountants in monitoring, providing opinions and rating performance of the budget, and
transparency of budget information to the public.
9. The aspects of coaching and supervision include the limits of coaching, the role of associations, and
the role of community members for the professional development of local government officials.
10. Development of regional financial information systems to provide accurate budget information and
develop regional commitment to the dissemination of information so as to facilitate reporting and
control, as well as facilitate obtaining information.
The Regional Government in the management of regional finances need to make a financial plan
annually. It is contained in the Regional Revenue and Expenditure Budget (APBD) which has been
approved by the Regional Representative Council (DPRD). According to Government Regulation of the
Republic of Indonesia Number 12 of 2019 concerning Regional Financial Management, the Regional
Revenue and Expenditure Budget (APBD) is an annual financial plan which is stipulated by a Regional
Regulation. APBD fiscal year covers a period of 1 (one) year, starting from January 1 to December 31.
Thus, the management, the control, and the supervision of regional finances can be carried out based on
this time frame (Regulation of the Minister of Home Affairs Number 13 of 2006).
The 1st International Forum Business and Economy (IFBE) 2019 Banjarmasin, 13-14 November 2019
164
Another aspect of budget reform is the change in the regional budget paradigm. It needs to be done
to produce local budgets which truly reflect the interests and expectations of the local community towards
economic, efficient and effective management of regional finances. The regional budget paradigm is
needed for the following:
1. The regional budget must rely on the public interest,
2. The regional budget must be managed with good results and low costs (work better and cost less),
3. The regional budget must be able to provide transparency and accountability nationally for the
entire budget cycle,
4. The regional budget must be managed with a performance approach (performance oriented) for all
types of expenditure and revenue,
5. Local budgets must be able to foster professionalism in all related organizations,
6. The regional budget must be able to foster flexibility for the implementers to maximize the
management of their funds by taking into account the principle of value for money.
According to the Law Number 17 of 2003 concerning State Finances, the process flow scheme and
schedule for preparing the Regional Revenue and Expenditure Budget (APBD) starts from the Head of
the Regional Apparatus Unit (SKPD) as the user of the budget who compile a work plan and SKPD
budget based on Renja ( Work Plan) SKPD. The budget of work plan and SKPD of work plan are
submitted to the DPRD as consideration material for the preparation of the APBD Draft (RAPBD) to be
approved as the APBD. The approved budget is expected to be absorbed by the Regional Government.
It cannot be denied that the budget absorption is one indicator which can show the success of
programs or policies implemented by regional governments. The low level of budget absorption will pose
a risk of the economic growth target which is not achieved in the area. The low absorption of the budget
at the beginning of the year will lead to a tendency to accumulate budget absorption at the end of the year.
According to Kuswoyo (2011), economic growth is hampered because it is not balanced with maximum
budget absorption.
Budget Absorption
The tendency of budget absorption which accumulates at the end of the year is a problem. This
problem always arises in almost every region in Indonesia. The budget absorption at the beginning of the
year is low, but it experiences significant increase at the end of the year. It certainly has an impact on the
realization of the programs and activities implementation of government. The realization of the programs
is very slow. This phenomenon also occurs in Palangka Raya.
The maximum budget absorption in several Palangkaraya City SKPDs is done simultaneously. It is
because the budget planning which is made by the SKPD is still inadequate, so it does not suit to the
needs. It can be seen when the implementation of programs and activities is delayed because the Budget
Implementation Document (DPA) has been revised. The revision in this term is that the shift in activities
from the original plan has another cause.
According to Hasni (2015) in addition to budget planning, budget absorption is also influenced by
the procurement of goods and services. But, with the procurement of goods and services, the government
can more easily do public services.
Based on this description, the authors are interested in conducting research by taking the title "The Effect
of Budget Planning, Budget Changes and Procurement of Goods and Services Against the Absorption of
the SKPD Budget in Palangkaraya City Government".
DATA AND METHOD
Research Scope
The scope is the limit to make a research and observation more targeted, in terms of variables studied,
population or subject of research, and the location of the study. In other words, the scope is a limitation
which makes it easier for research to be more effective and efficient in separating certain aspects of an
The 1st International Forum Business and Economy (IFBE) 2019 Banjarmasin, 13-14 November 2019
165
object. This scope will greatly help the effectiveness of running a study. Without a clear scope of
research, the research will not run properly and risk bias. The scope of this study is the employees who
occupy positions in the fields related to the budget in the Regional Work Unit (SKPD) of of Palangka
Raya City Government.
Population
Population is a generalization area consisting of objects or subjects which have certain qualities and
characteristics. It is determined by the researchers to be studied and to be drawn the conclusions
(Sugiyono. 2005). In accordance with the Regional Regulation of Palangka Raya City Number 11 of 2016
concerning the Formation and Composition of the Palangka Raya Regional Apparatus, for the
Organization of the Palangka Raya Regional Apparatus consists of 2 Secretariats, 20 Offices, 7 Agencies,
1 Inspectorate and 1 Unit, and 5 Districts. The population in this study are all employees who occupy
positions in the field related to the budget, namely the Budget User (PA), PPK (Financial Administration
Officer), PPTK (Technical Implementation Activities Officer) and the Treasurer of Expenditures in each
SKPD.
Research Samples
The sample is a part to be taken from the whole object studied and is considered to represent the
entire population (Soekidjo. 2005: 79). The sample is a portion of the population whose characteristics are
to be studied (Djarwanto, 1994). Determination of the number of respondent samples according to Hair et
al (1995 in Kiswati 2010) dependes on the number of indicators multiplied by 5 to 10. Hair.et al (2006)
said that the research to be processed uses multiple regressions with a minimum sample size of 50
respondents, and more than 100 respondents are recommended for most studies. In this study, the sample
is a maximum of 99 respondents because it uses a SMART PLS 3.0 analysis tool.
Operational Definition and Variable Measurement
Based on the conceptual framework of research and prior theory mapping, the variable indicators
can be produced. The variable indicators are adopted from previous studies, as well as some
modifications to these indicators; so that, operational variables can be defined as follows:
1. Budget planning (X1)
Budget planning is the process of determining the main programs to be carried out by an
organization in the context of strategic implementation and estimating, activities or projects. Budget
planning is carried out by an organization, and determining the amount of allocation of resources in
budget planning will be needed. Budget planning variables can be measured through indicators including:
a. Preparation of budget planning documents includes the planning of work programs and activities
which are integrated with the budget planning. Hence, the planned program activities are in
accordance with the available financial capabilities.
b. Commitment from SKPD is a form of agreement made by parties within an organization or agency
to jointly carry out their duties and functions properly. It is done in order to realize the vision,
mission, goals and objectives of the organization.
c. Work unit performance shows the level achieved from the implementation of activities and
programs to realize the vision, mission, goals and objectives of public sector organizations.
2. Changes to the budget (X2)
Budget change is a revision process which is carried out by the government in renewing its budget
in the fiscal year of its implementation; thus, it has a major effect on expenditure allocation. Indicators on
the variable budget changes are the budget adjustments and the program implementation.
3. Procurement of goods and services (X3)
Procurement of goods and services is an activity which is carried out by the government to provide
goods and services as a form of providing services to the public. The variables of goods and services
procurement can be measured through indicators as follows:
a. Procurement document
The 1st International Forum Business and Economy (IFBE) 2019 Banjarmasin, 13-14 November 2019
166
Procurement documents are the documents which are established by Procurement Service Units
(ULP) / Procurement Officers. They make information and provisions which must be obeyed by the
parties in the procurement process of goods and services. This document is the main guideline used
during the tender process, which regulates starting from the procedure for selecting service providers,
instructions to bidders, procedures for making bid documents, auction schedule up to the draft contract
form to be signed by the winner.
b. The auction process
The process of conducting auctions is a series of activities to provide goods and services which
fulfill the requirements based on certain methods and procedures. These procedures have been determined
and followed by relevant parties, so that the best provider is selected. That provider has competence in its
fields.
c. Procurement officers
Procurement officers are personnel who have certificates of expertise in the procurement of goods
and services. They are appointed to carry out the procurement of goods and services.
4. Budget absorption (Y)
Budget absorption is the ability of each SKPD to absorb the projected regional revenue and
expenditure budget from the budget realization of each SKPD.
Indicators for measuring budget absorption are:
a. Participation of all elements
Participation of all elements is the involvement and participation of all elements in the process of
identifying problems and the potential which exists in certain situations. Participation of all elements also
includes voting and decision-making about alternative solutions to deal with problems, implementing
efforts to overcome problems. In this participation, the process of evaluating changes occurs specifically
in the level of budget absorption.
b. On time
On time here is the process of carrying out activities/work programs that are directed, integrated,
and systematic; so that, the activities carried out in accordance with the agreed time.
c. Budget realization achievements
Achievement of budget realization is the level of achievement of targets which has been planned
for all budget execution activities. It includes analysis and evaluation of budget implementation activities
to provide feedback and follow up. Therefore, it can run better in subsequent periods.
Research Instruments
The instrument in research is very important and must be considered. It is because the instrument
serves as a tool to collect the necessary data. The research instrument is a tool used to collect data or
information which is useful to answer research problems.
The various forms in research instruments are: a). Questionnaire, this questionnaire study is identical to
quantitative research. It is because the data given to informants is data of opened and closed answers. The
types of questions in the questionnaire are the types of questions needed in the research report. B).
Documentation, another way which can be used to obtain data and respondents information is using
documentation. With documentation, researchers obtain information and various sources.
Data Analysis Techniques
This research uses a quantitative descriptive design. The type of data in this study is quantitative
data in the form of data on the number of respondents who answer the questionnaire. The answers of
respondents to questionnaire are measured using the Smart PLS (Partial Least Squares) method. Smart
PLS is a powerful analysis method because it can be applied at all data scales. It does not require a lot of
assumptions, and the sample size does not have to be large.
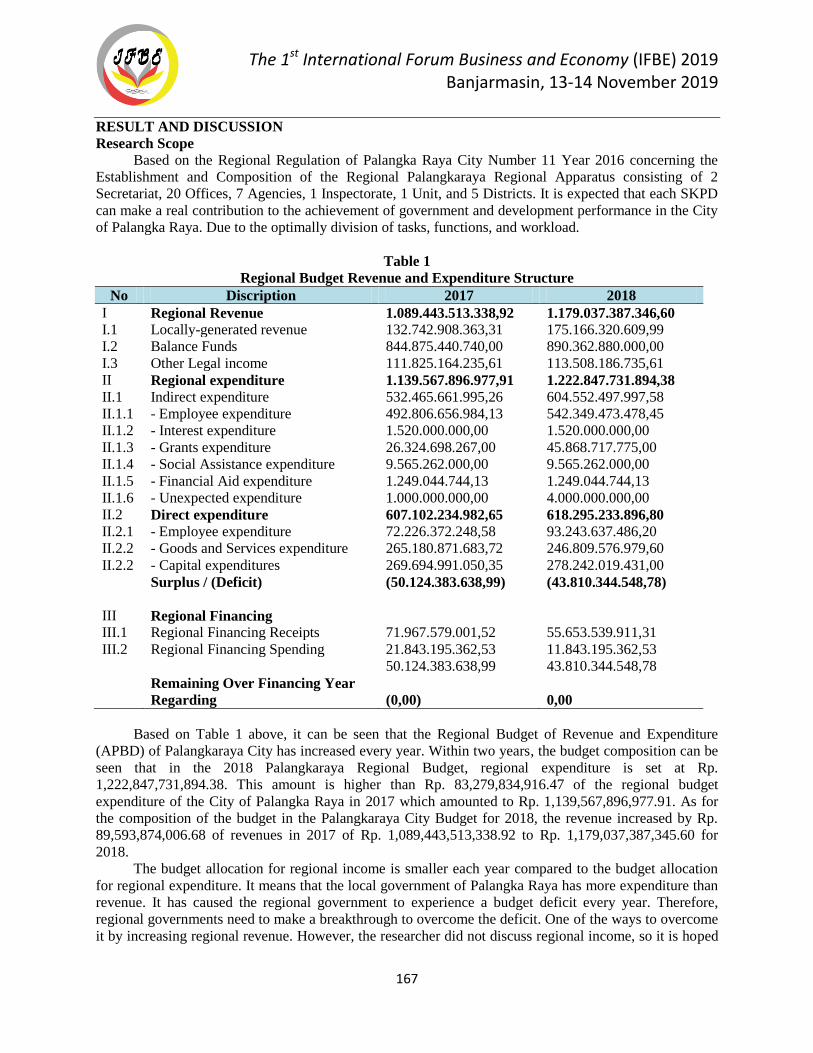
The 1st International Forum Business and Economy (IFBE) 2019 Banjarmasin, 13-14 November 2019
167
RESULT AND DISCUSSION
Research Scope
Based on the Regional Regulation of Palangka Raya City Number 11 Year 2016 concerning the
Establishment and Composition of the Regional Palangkaraya Regional Apparatus consisting of 2
Secretariat, 20 Offices, 7 Agencies, 1 Inspectorate, 1 Unit, and 5 Districts. It is expected that each SKPD
can make a real contribution to the achievement of government and development performance in the City
of Palangka Raya. Due to the optimally division of tasks, functions, and workload.
Table 1
Regional Budget Revenue and Expenditure Structure
No Discription 2017 2018
I Regional Revenue 1.089.443.513.338,92 1.179.037.387.346,60
I.1 Locally-generated revenue 132.742.908.363,31 175.166.320.609,99
I.2 Balance Funds 844.875.440.740,00 890.362.880.000,00
I.3 Other Legal income 111.825.164.235,61 113.508.186.735,61
II Regional expenditure 1.139.567.896.977,91 1.222.847.731.894,38
II.1 Indirect expenditure 532.465.661.995,26 604.552.497.997,58
II.1.1 - Employee expenditure 492.806.656.984,13 542.349.473.478,45
II.1.2 - Interest expenditure 1.520.000.000,00 1.520.000.000,00
II.1.3 - Grants expenditure 26.324.698.267,00 45.868.717.775,00
II.1.4 - Social Assistance expenditure 9.565.262.000,00 9.565.262.000,00
II.1.5 - Financial Aid expenditure 1.249.044.744,13 1.249.044.744,13
II.1.6 - Unexpected expenditure 1.000.000.000,00 4.000.000.000,00
II.2 Direct expenditure 607.102.234.982,65 618.295.233.896,80
II.2.1 - Employee expenditure 72.226.372.248,58 93.243.637.486,20
II.2.2 - Goods and Services expenditure 265.180.871.683,72 246.809.576.979,60
II.2.2 - Capital expenditures 269.694.991.050,35 278.242.019.431,00
Surplus / (Deficit) (50.124.383.638,99) (43.810.344.548,78)
III Regional Financing
III.1 Regional Financing Receipts 71.967.579.001,52 55.653.539.911,31
III.2 Regional Financing Spending 21.843.195.362,53 11.843.195.362,53
50.124.383.638,99 43.810.344.548,78
Remaining Over Financing Year
Regarding (0,00) 0,00
Based on Table 1 above, it can be seen that the Regional Budget of Revenue and Expenditure
(APBD) of Palangkaraya City has increased every year. Within two years, the budget composition can be
seen that in the 2018 Palangkaraya Regional Budget, regional expenditure is set at Rp.
1,222,847,731,894.38. This amount is higher than Rp. 83,279,834,916.47 of the regional budget
expenditure of the City of Palangka Raya in 2017 which amounted to Rp. 1,139,567,896,977.91. As for
the composition of the budget in the Palangkaraya City Budget for 2018, the revenue increased by Rp.
89,593,874,006.68 of revenues in 2017 of Rp. 1,089,443,513,338.92 to Rp. 1,179,037,387,345.60 for
2018.
The budget allocation for regional income is smaller each year compared to the budget allocation
for regional expenditure. It means that the local government of Palangka Raya has more expenditure than
revenue. It has caused the regional government to experience a budget deficit every year. Therefore,
regional governments need to make a breakthrough to overcome the deficit. One of the ways to overcome
it by increasing regional revenue. However, the researcher did not discuss regional income, so it is hoped
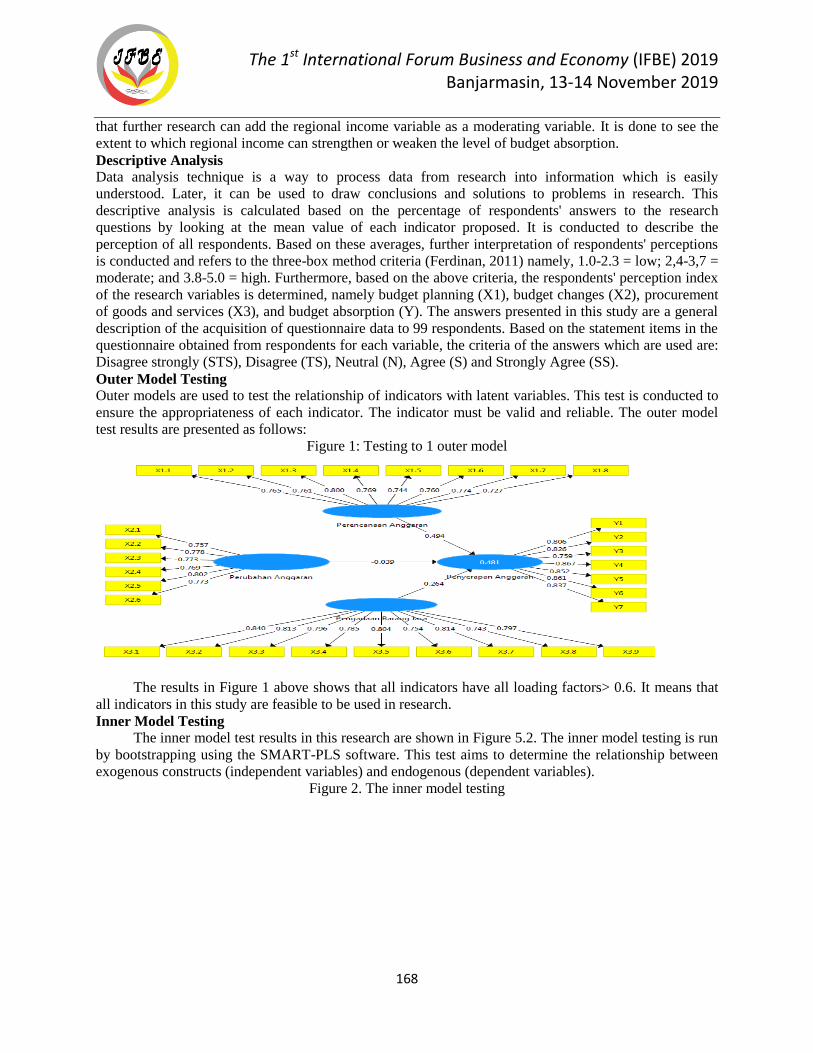
The 1st International Forum Business and Economy (IFBE) 2019 Banjarmasin, 13-14 November 2019
168
that further research can add the regional income variable as a moderating variable. It is done to see the
extent to which regional income can strengthen or weaken the level of budget absorption.
Descriptive Analysis
Data analysis technique is a way to process data from research into information which is easily
understood. Later, it can be used to draw conclusions and solutions to problems in research. This
descriptive analysis is calculated based on the percentage of respondents' answers to the research
questions by looking at the mean value of each indicator proposed. It is conducted to describe the
perception of all respondents. Based on these averages, further interpretation of respondents' perceptions
is conducted and refers to the three-box method criteria (Ferdinan, 2011) namely, 1.0-2.3 = low; 2,4-3,7 =
moderate; and 3.8-5.0 = high. Furthermore, based on the above criteria, the respondents' perception index
of the research variables is determined, namely budget planning (X1), budget changes (X2), procurement
of goods and services (X3), and budget absorption (Y). The answers presented in this study are a general
description of the acquisition of questionnaire data to 99 respondents. Based on the statement items in the
questionnaire obtained from respondents for each variable, the criteria of the answers which are used are:
Disagree strongly (STS), Disagree (TS), Neutral (N), Agree (S) and Strongly Agree (SS).
Outer Model Testing
Outer models are used to test the relationship of indicators with latent variables. This test is conducted to
ensure the appropriateness of each indicator. The indicator must be valid and reliable. The outer model
test results are presented as follows:
Figure 1: Testing to 1 outer model
The results in Figure 1 above shows that all indicators have all loading factors> 0.6. It means that
all indicators in this study are feasible to be used in research.
Inner Model Testing
The inner model test results in this research are shown in Figure 5.2. The inner model testing is run
by bootstrapping using the SMART-PLS software. This test aims to determine the relationship between
exogenous constructs (independent variables) and endogenous (dependent variables).
Figure 2. The inner model testing
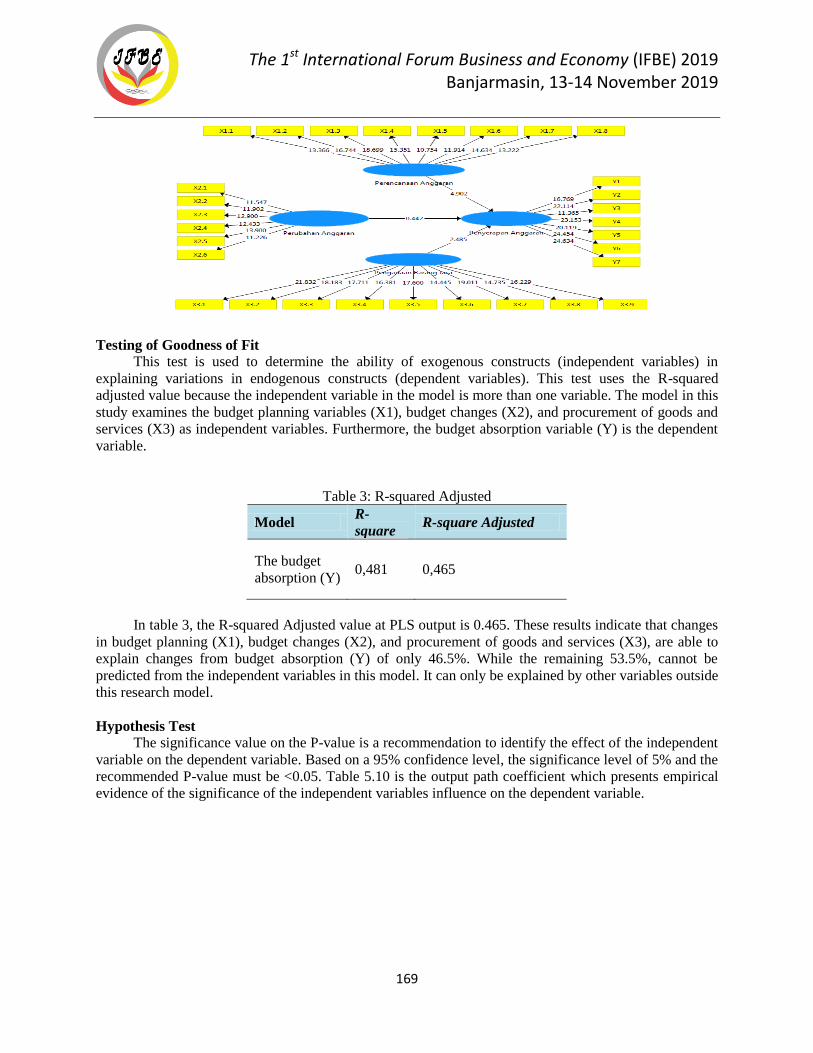
The 1st International Forum Business and Economy (IFBE) 2019 Banjarmasin, 13-14 November 2019
169
Testing of Goodness of Fit
This test is used to determine the ability of exogenous constructs (independent variables) in
explaining variations in endogenous constructs (dependent variables). This test uses the R-squared
adjusted value because the independent variable in the model is more than one variable. The model in this
study examines the budget planning variables (X1), budget changes (X2), and procurement of goods and
services (X3) as independent variables. Furthermore, the budget absorption variable (Y) is the dependent
variable.
Table 3: R-squared Adjusted
Model R-
square R-square Adjusted
The budget
absorption (Y) 0,481 0,465
In table 3, the R-squared Adjusted value at PLS output is 0.465. These results indicate that changes
in budget planning (X1), budget changes (X2), and procurement of goods and services (X3), are able to
explain changes from budget absorption (Y) of only 46.5%. While the remaining 53.5%, cannot be
predicted from the independent variables in this model. It can only be explained by other variables outside
this research model.
Hypothesis Test
The significance value on the P-value is a recommendation to identify the effect of the independent
variable on the dependent variable. Based on a 95% confidence level, the significance level of 5% and the
recommended P-value must be <0.05. Table 5.10 is the output path coefficient which presents empirical
evidence of the significance of the independent variables influence on the dependent variable.
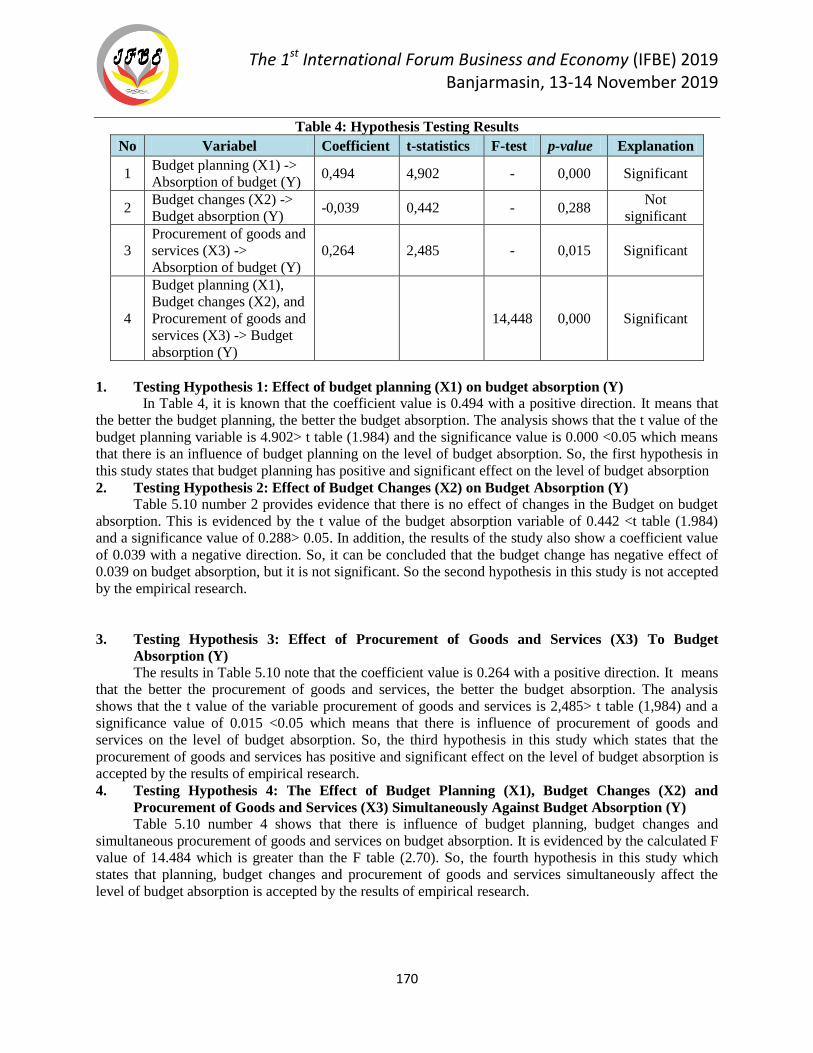
The 1st International Forum Business and Economy (IFBE) 2019 Banjarmasin, 13-14 November 2019
170
Table 4: Hypothesis Testing Results
No Variabel Coefficient t-statistics F-test p-value Explanation
1 Budget planning (X1) ->
Absorption of budget (Y) 0,494 4,902 - 0,000 Significant
2 Budget changes (X2) ->
Budget absorption (Y) -0,039 0,442 - 0,288
Not
significant
3
Procurement of goods and
services (X3) ->
Absorption of budget (Y)
0,264 2,485 - 0,015 Significant
4
Budget planning (X1),
Budget changes (X2), and
Procurement of goods and
services (X3) -> Budget
absorption (Y)
14,448 0,000 Significant
1. Testing Hypothesis 1: Effect of budget planning (X1) on budget absorption (Y)
In Table 4, it is known that the coefficient value is 0.494 with a positive direction. It means that
the better the budget planning, the better the budget absorption. The analysis shows that the t value of the
budget planning variable is 4.902> t table (1.984) and the significance value is 0.000 <0.05 which means
that there is an influence of budget planning on the level of budget absorption. So, the first hypothesis in
this study states that budget planning has positive and significant effect on the level of budget absorption
2. Testing Hypothesis 2: Effect of Budget Changes (X2) on Budget Absorption (Y)
Table 5.10 number 2 provides evidence that there is no effect of changes in the Budget on budget
absorption. This is evidenced by the t value of the budget absorption variable of 0.442 <t table (1.984)
and a significance value of 0.288> 0.05. In addition, the results of the study also show a coefficient value
of 0.039 with a negative direction. So, it can be concluded that the budget change has negative effect of
0.039 on budget absorption, but it is not significant. So the second hypothesis in this study is not accepted
by the empirical research.
3. Testing Hypothesis 3: Effect of Procurement of Goods and Services (X3) To Budget
Absorption (Y)
The results in Table 5.10 note that the coefficient value is 0.264 with a positive direction. It means
that the better the procurement of goods and services, the better the budget absorption. The analysis
shows that the t value of the variable procurement of goods and services is 2,485> t table (1,984) and a
significance value of 0.015 <0.05 which means that there is influence of procurement of goods and
services on the level of budget absorption. So, the third hypothesis in this study which states that the
procurement of goods and services has positive and significant effect on the level of budget absorption is
accepted by the results of empirical research.
4. Testing Hypothesis 4: The Effect of Budget Planning (X1), Budget Changes (X2) and
Procurement of Goods and Services (X3) Simultaneously Against Budget Absorption (Y)
Table 5.10 number 4 shows that there is influence of budget planning, budget changes and
simultaneous procurement of goods and services on budget absorption. It is evidenced by the calculated F
value of 14.484 which is greater than the F table (2.70). So, the fourth hypothesis in this study which
states that planning, budget changes and procurement of goods and services simultaneously affect the
level of budget absorption is accepted by the results of empirical research.
The 1st International Forum Business and Economy (IFBE) 2019 Banjarmasin, 13-14 November 2019
171
DISCUSSION
Based on the results of research and testing of hypotheses, a discussion of each variable is based on the
causal relationship of each latent variable. The discussion is carried out by considering various theoretical
studies and empirical research. The following are presented in a table to explain and compare the results
of outer loading and the average answers of respondents. It is intended to describe each indicator which
makes significant contribution as forming variables. The average value reflects the respondents'
perceptions of the research indicators, while the outer loading illustrates the contribution of the indicators
to the forming variables.
1. The Effect of budget planning on budget absorption
The analysis shows that the determination of DPA in the institution is on November; so that, the
available funds to conduct the program / activity have the highest score in all SKPDs in the City
Government of Palangka Raya, with an outer loading value of 0.800 (X1.3). this condition shows that the
DPA on that time shows good budget planning statistically. The results of hypothesis testing indicate that
budget planning has positive and significant effect on budget absorption. This result proves that the
Budget Planning which is reflected with the budget planning document, the commitment of the SKPD,
and the performance of the work unit influences the budget absorption. Budget planning is the process of
determining the main programs to be carried out by an organization in the context of strategic
implementation and estimating, activities or projects. It is also the process of determining the amount of
allocation of resources which will be needed. Good planning is needed; so that, the implementation of the
program activities which have been prepared do not encounter obstacles. Thus, the budget absorption will
run on time.
The results of this study are in line with the research by Malayati (2015), Zarinah (2017), and
Ramdhani (2017) which show that the budget planning influences budget absorption. For the public
sector such as the government, the budget is not only an annual plan but also an accountability for the
management of public funds. A budget is a statement of the estimated performance which an organization
will achieve in a certain period, and it is expressed in monetary terms. In public sector organizations, the
budget is an instrument of accountability for the management of public funds, and the implementation of
programs financed with public funds.
2. The Effect of Budget Changes on Budget Absorption
The analysis results in Table 5.11 show that the shifts between organizational units, between
activities carried out when budget changes have the highest score in reflecting budget changes. It is stated
by the high outer loading value of 0.802 (X2.5) with an average value of 4.32. Statistically, this condition
states that if there is a shift in activities, the budget changes will result in budget absorption. However,
this reason is not strong enough. Based on hypothesis test shows that Budget Changes have no effect on
budget absorption. Judging from the coefficient value of budget change, a negative effect of 0.039 on
budget absorption. Thus, changes in the regional budget are made for the purpose of adjusting the current
budget to the latest changes. It is the efforts of the regional government to adjust its financial plan to the
development of the situation and conditions. The changes of the regional budget cannot explain the
variation of budget absorption (Y) with a significance value of 0.288> 0.05. It shows that the average
respondent felt that the budget changes which implemented by each SKPD will not interfere with the
program. In other words, the budget changes are indeed necessary. Because of the little remaining time
since the DPA was approved by the DPRD, there was still less optimal for influencing budget changes.
The results of this study contrast with the previous researches which are conducted by Kiranda
(2016), Putri (2015), Kaban (2016). Those researches prove that variable changes in the budget can affect
changes in budget absorption. Changes in the regional budget are made for the purpose of adjusting the
current budget to the latest changes, including changes in the legislation and policies of the Central
Government. APBD changes can be interpreted as an effort by regional governments to adjust their
financial plans with the development of the situation and conditions. The development of these situations
and conditions can have implications for increased revenue and expenditure budgets, or vice versa.
The 1st International Forum Business and Economy (IFBE) 2019 Banjarmasin, 13-14 November 2019
172
However, it can also accommodate the shifts in SKPD. So, the revised APBD does not always mean
adding to the budget (Permendagri No. 13 of 2006).
If you look at the data in Table 5.1 for 2 (two) consecutive years, the Government of Palangka
Raya City has budget deficit. For 2018, the Regional Revenue will be Rp. 1,179,037,387,346.60 while the
Regional Expenditure of Rp. 1,222,847,731,894.38. It means that there was a budget deficit of Rp.
43,810,344,547.78. Which also resulted in changes in the APBD PAGU from Quarter III amounting to
Rp. 1,251,086,991,590.38 down to Rp. 1,172,278,567,358.63 in Quarter IV. The decrease in the APBD
PAGU resulted in increased budget absorption in the Palangkaraya City Government. Related to
Hypothesis 2, it is stated that budget changes have negative and not significant effect on budget
absorption. It is because the budget changes due to budget deficits. So, it can be concluded that if there is
a decrease in the budget, it will result in an increase in budget absorption.
3. The Effect of Procurement of Goods and Services on Budget Absorption
The results of the analysis from the Table in Table 5.11 stated that the agency where I worked so
far had no difficulty in determining the HPS. It has the highest value in reflecting the procurement of
goods and services, with an outer loading value of 0.840 (X3.1). It can be said that with no difficulties in
determining HPS, the process of procurement of goods and services can take place properly.
Hypothesis test results prove that the procurement of goods and services has positive and
significant effect on budget absorption in the Palangkaraya City Government, with a significance level of
0.015 <0.05. This finding identifies that budget absorption can clearly be encouraged through indicators
of procurement documents, procurement processes and procurement officials. Procurement of goods and
services is an activity which is carried out by the government to provide goods and services as a form of
providing services to the public.
This empirical evidence is in line with the findings of Widianingrum (2017), Anfujatin (2016) and
Dian Juliani, et al (2014) which show that the procurement of goods and services has an effect on budget
absorption. Budget absorption, especially barriers and services, has significant influence in driving
economic growth. For this reason, each government agency must regulate every expenditure; so that, it
runs smoothly and can support the successful achievement of national development goals. Government
regulations of the procurement of goods and services need to be revised with the aim of accelerating the
absorption of the budget. It can be done by simplifying the implementation of the procurement of goods
and services.
During 2018, the implementation of the tender packages exist through the Service / Procurement
Service Unit (ULP) of the Palangka Raya City Regional Secretariat. There are 178 packages which have
finished the auction of 181 packages proposed by the SKPD, and there are still 3 packages which have
canceled the auction. One of them has canceled the auction because there are no tender participants who
registered. It resulted that in the absorption of the budget in the City Government of Palangka Raya is also
less than the maximum.
4. The Effect of Budget Planning, Budget Changes and Procurement of Goods and Services
Simultaneously Against Budget Absorption
The results show that budget planning, budget changes, and the simultaneous procurement of goods
and services have an effect on budget absorption in the Palangkaraya City Government, with a
contribution of 46.5% while the remaining 53.5% is influenced by other factors. Budget absorption is one
indicator which can show the success of programs or policies implemented by the government. According
to Noviwijaya and Rohman (2013) the absorption of work unit budget is the proportion of work unit
budget which has been disbursed or realized in one fiscal year. The absorption of an accountable budget
which meets the principle of value of money is one of the applications of good governance practices. It is
also a measure of government performance.
The results of this study support the previous research which is conducted by Widianingrum,
Desika (2017). In her research, she stated that "Planning and procurement of goods / services affects
budget absorption". Absorption of the budget has an important meaning in the achievement of national
The 1st International Forum Business and Economy (IFBE) 2019 Banjarmasin, 13-14 November 2019
173
objectives, namely the improvement and maintenance of people's welfare. Kuncoro (2013) stated that
budget absorption is one of the stages of the budget cycle. It starts from budget planning, budgeting and
endorsement of the budget by the House of Representatives (DPR) where the absorption phase of the
budget begins when the Budget Act of the State Revenue and Expenditure (Law) APBN) endorsed by the
DPR.
The researchers also admit that in this study there are still many shortcomings. If you look at Table
5.9 where the R-square Adjusted value is only able to explain the remaining 46.5% 53.5% can not be
predicted from the independent variable. So, the researchers hope that the next researcher who is
interested in researching budget absorption can develop this research. Thus, 53.5% of other variables can
be answered. Likewise for the budget change variable, the second hypothesis proposed cannot be
generalized to other regions. It only applies to Palangkaraya City, bearing in mind that this hypothesis is
proposed because Palangkaraya City experienced a budget deficit.
CONCLUSION
Based on the empirical evidence of statistical testing and discussion, several conclusions from this study
can be drawn as follows: Hypothesis testing shows that budget planning (X1) has positive and significant
effect on budget absorption (Y). This is evidenced by the t value of the calculated budget planning
variable of 4.902> t table (1.984) and a significance value of 0.000 <0.05 and a coefficient of 0.494 with a
positive direction. Budget planning is a determinant of the activity programs which will be carried out by
an organization in the context of strategic implementation and estimating, activities or projects. It also
determines the amount of allocation of resources which will be needed. The results of the study prove that
Budget Changes (X2) have a negative and not significant effect on Budget Absorption (Y). This is
evidenced by the t value of the budget absorption variable of 0.442 <t table (1.984) and a significance
value of 0.288> 0.05 and a coefficient of 0.039 with a negative direction. The trigger was due to changes
in the budget of the City Government of Palangka Raya during the period of 2 years namely 2017 and
2018 experiencing a budget deficit. For 2018, the budget change made is reducing the value of the APBD
Ceiling from Rp. 1,251,086,991,590.38 in Quarter III decreased to Rp. 1,172,278,567,358.63 in Quarter
IV. Of course, this budget reduction affects budget absorption. So that, the conclusions can be drawn: if
the budget reduction is made at the time of the APBD Amendment, then the budget absorption will be
increased. But this cannot be generalized to all regions, and this research is limited to the City
Government of Palangka Raya. The results of the study prove that the Procurement of Badang and
Services (X3) has a positive and significant impact on Budget Absorption (Y). This is evidenced by the t
value of the variable procurement of goods and services of 2.485> t table (1.984) and a significance value
of 0.015 <0.05 and a coefficient of 0.264 with a positive direction. Each procurement of goods and
services is able to explain the changes in budget absorption in each SKPD. So, the more timely the
process of implementing the procurement of goods and services carried out by the work unit, the more it
will increase the absorption of the work unit's budget. The results of the study prove that the Budget
Planning, Budget Changes and Procurement of Goods and Services simultaneously influence the
absorption of the budget. This is evidenced by the calculated F value of 14.484 which is greater than the F
table (2.70)
REFERENCES
Abdullah, Syukri. 2015. Faktor-Faktor Yang Mempengaruhi Serapan Anggaran Pemerintah Daerah (Studi
Pada Pemerintah Kabupaten/Kota di Aceh).
Bungin, Burhan. 2005. Metodologi Penelitian Kuantitatif (Komunikasi, Ekonomi dan Kebijakan Publik
Serta Ilmu-Ilmu Sosial Lainnya). Edisi Kedua. Kencana Prenadamedia Group. Jakarta.
Darise, N. 2008. Akuntansi Keuangan Daerah (Akuntansi Sektor Publik). Indeks, Yogyakarta.
The 1st International Forum Business and Economy (IFBE) 2019 Banjarmasin, 13-14 November 2019
174
Ghozali, Iman dan Latan, H. 2014. Konsep, Metode dan Aplikasi Menggunakan Program WarpPLS 5.0.
Badan Penerbit Universitas Diponegoro, Semarang.
Haryanto. 2008. Perencanaan dan Penganggaran Daerah Pendekatan Kinerja. Badan Penerbit Universitas
Diponegoro.
Herriyanto, H. 2012. Faktor-faktor Yang Mempengaruhi Keterlambatan Penyerapan Anggaran Belanja
Pada Satuan Kerja Kementerian/Lembaga di Wilayah Jakarta. Tesis. FE Universitas Indonesia.
Jakarta.
Kirnanda, Agus. 2016. Faktor-Faktor Yang Mempengaruhi Penyerapan Anggaran Satuan Kerja Perangkat
Daerah di Kota Binjai Dengan Perubahan Anggaran Sebagai Variabel Moderating. Tesis.
Universitas Sumatera Utara. Medan.
Kuswoyo. 2012. Analisis atas Faktor-Faktor Yang Mempengaruhi Penyerapan Anggaran Belanja Di
Akhir Tahun Anggaran (Studi Pada Satuan Kerja Di Wilayah KPPN Kediri).
Mahsun, M. Sulistiyowati. F., dan H.A. Purwanugraha, 2013. Akuntansi Sektor Publik. Edisi Ketiga.
BPFE, Yogyakarta.
Malahayati dan Isahuddin. 2015. Pengaruh Kapasitas Sumber Daya Manusia, Perencanaan Anggaran dan
Pelaksanaan Anggaran Terhadap Serapan Anggaran Satuan Kerja Perangkat Daerah (SKPD) Pada
Pemerintah Kota Banda Aceh. Jurnal Magister Akuntansi. Pasca Sarjana Universitas Syiah Kuala.
Munandar, M. 2001. Budgeting (Pedoman Lengkap Langkah-Langkah Penganggaran). BPFE,
Yogyakarta.
Mardiasmo. 2002. Otonomi Manajemen Keuangan Daerah. Andi Yogyakarta.
Mardiasmo. 2009. Akuntansi Sektor Publik. Andi, Yogyakarta.
Mia Ranisa dan Adi Yuniarta. 2017. Pengaruh Perencanaan Anggaran, Kualitas Sumber Daya Manusia
Dan Komitmen Organisasi Terhadap Penyerapan Anggaran (Survei Pada SKPD di Wilayah
Pemerintah Daerah Provinsi Bali). E-Journal S1 Akuntansi. Universitas Pendidikan Ganeha. Bali.
Mulyadi. 2001. Akuntansi Manajemen (Konsep, Manfaat dan Rekayasa). Salemba Empat. Jakarta.
Peraturan Pemerintah Nomor 12 Tahun 2019 Tentang Pengelolaan Keuangan Daerah.
Peraturan Presiden Nomor 16 Tahun 2018 Tentang Pengadaan Barang/Jasa Pemerintah.
Peraturan Presiden Republik Indonesia Nomor 54 Tahun 2010 Tentang Pengadaan Barang/Jasa
Pemerintah.
Peraturan Menteri Dalam Negeri Nomor 13 Tahun 2006 Tentang Pedoman Pengelolaan Keuangan
Daerah.
Peraturan Daerah Kota Palangka Raya Nomor 11 Tahun 2016 tentang Pembentukan dan Susunan
Perangkat Daerah Kota Palangka Raya.
Priatno, Khusaini. 2013. Analisis Faktor-Faktor Yang Mempengaruhi Penyerapan Anggaran Pada Satuan
Kerja Lingkup Pembayaran KPPN Blitar.
The 1st International Forum Business and Economy (IFBE) 2019 Banjarmasin, 13-14 November 2019
175
Pusdiklatwas BPKP. 2013. Pedoman Pelaksanaan Anggaran II.
Undang-Undang Nomor 23 Tahun 2014 Tentang Pemerintahan Daerah.
Undang-Undang Nomor 9 Tahun 2015 Tentang Perubahan Kedua Atas Undang-Undang Nomor 23 Tahun
2014 Tentang Pemerintahan Daerah.
Undang-Undang Nomor 25 Tahun 2004 Tentang Sistem Perencanaan Pembangunan Nasional.
Undang-Undang Nomor 17 Tahun 2003 tentang Keuangan Negara.
Shim, J.K., dan Siegel, J.G. 2000. Budgeting (Pedoman Lengkap Langkah-Langkah Penganggaran),
Erlangga, Jakarta
Soleh, C. dan Rochmansjah, H. 2010. Pengelolaan Keuangan dan Aset Daerah. Fokus Media, Bandung.
Sujarweni,V.W. 2015. Akuntansi Sektor Publik, Teori, Konsep dan Aplikasi. Pustaka Baru Press,
Yogyakarta.
Wansyah, H.D., dan Bakar, Usman. 2012. Pengaruh Kapasitas Sumber Daya Manusia, Pemanfaatan
Teknologi Informasi dan Kegiatan Pengendalian Terhadap Nilai Informasi dan Kegiatan
Pengendalian Terhadap Nilai Informasi Pelaporan Keuangan SKPD pada Provinsi Aceh. Jurnal
Akuntansi Pascasarjana Universitas Syiah Kuala, Banda Aceh.
Widianingrum, Desika. 2017. Faktor-Faktor Yang Mempengaruhi Penyerapan Anggaran Satuan Kerja
Kerja Perangkat Daerah Di Pemerintah Kabupaten Situbondo. Bisma Jurnal Bisnis.
Website :
Info Anggaran. Pedoman Pengelolaan Keuangan Daerah, diakses pada tanggal 4 Maret 2018 dari
https://info-anggaran.com/ensiklopedia/pedoman-pengelolaan-keuangan-daerah/
Kementerian Keuangan. Direktorat Jenderal Perimbangan Keuangan. Perencanaan dan Penggangaran
Keuangan Daerah, diakses pada tanggal 4 Maret 2018 dari
http://www.djpk.kemenkeu.go.id/?p=5747
Ratriani Cahya Pradani. Perkembangan Strategi dan Perencanaan Pembangunan Ekonomi Indonesia
diakses 16 Februari 2017 dari https://ratrianicp.wordpress.com/2013/05/06/perkembangan-strategi-
dan-perencanaan-pembangunan-ekonomi-indonesia/
Wahyu Nur Hidayat. Jenis-jenis Metode Penelitian Beserta Contohnya diakses pada tanggal 02 Januari
2017 dari http://penjual- mimpi.blogspot.co.id/2014/09/jenis-jenis-metode-penelitian-beserta.html
The 1st International Forum Business and Economy (IFBE) 2019 Banjarmasin, 13-14 November 2019
176
THE EFFECTS OF ASSET MANAGEMENT STAGE TOWARDS OPTIMIZATION OF ASSETS
Ria Widiyanti, Abdul Djalil, Fitria Husnatarina
Economic and Business Faculty, University of Palangka Raya
Abstract: The provision of facilities and infrastructures (assets) that is often carried out by LPMP in
Central Kalimantan Province. In supporting the main tasks and functions as quality assurance institutions
for primary and secondary education makes the value of its assets quite significant. For this reason, good
asset managements and standards are needed. This research is conducted in order to obtain empirical
evidence related to the effect of asset management consisting of aspects of inventory, legal audit,
valuation, and supervision and control of assets towards the optimization of assets in the Central
Kalimantan Provincial Education Quality Assurance Institute (LPMP). The population of this research is
all authorized parties and involved in asset management. In this case, it consists of the State Property User
Authority, namely the Head of the LPMP, the Head of the General Subdivision as an official who has the
task and function in managing assets in the LPMP, and all employees of the General Subdivision, totaling
55 people. The entire population becomes the sample of the study. The analytical tool in this study is the
SEM (Structure Equation Model) based on PLS (Partial Least Square) with the help of the computer
software SmartPLS v.3.2.8 2019. The results of this study indicate that the Inventory, Legal Audit and
Valuation variables have positive and significant for Asset Optimization, while the Asset Oversight and
Control variable has a positive but not significant effect on Asset Optimization.
Keywords: assets management, assets optimalization, legal audit, inventory.
BACKGROUND
Reformations in the financial sector are marked by the issuance of Law Number 17 of 2003
concerning State Finance, with the enactment of these laws the demands on the management of state
finances in an orderly, efficient, economical, effective, transparant and responsible manner with due
regard for a sense of fairness and propriety in the implementation. This is no exception in managing
assets, in accordance with article 1 of the law it is explained that state finances are all rights and
obligations of the state that can be valued in money, as well as everything in the form of money or in the
form of goods that can be made the property of the state in connection with the implementation these
rights and obligations. From this explanation, it is clear that assets as goods belonging to the state. Assets
also known as an inseparable part of state finances, so that responsibility for the management of state
assets is also included in the scope of accountability of state finances through the value of assets
considered sufficiently material in the government balance sheet.
Educational Quality Assurance Institution (LPMP) of Central Kalimantan Province is a Central
Technical Implementation Unit (UPT) located in the area under the Directorate General of Primary and
Secondary Education (Ditjen Dikdasmen) Ministry of Education and Culture of the Republic of
Indonesia. LPMP has the task of "carrying out quality assurance basic and secondary education in the
province based on the policy of the Minister of Education and Culture ".
Bearing in mind above heavy task of carrying out quality assurance, the Central Kalimantan
Province LPMP needs to make new innovations in order to improve services in the education field quality
assurance for stakeholders consisting of educators (teachers), education staff (School Supervisors, School
Principals, School Administration, etc.) and other educational organizations. In carring out this quality
task, LPMP needs to be supported by adequate facilities and infrastructures. Facilities and infrastructures
are assets (assets) owned by LPMP in Central Kalimantan Province are classified in the form of: land;
equipment and machinery; buildings and buildings; roads, irrigation and networks; other fixed assets;
construction in progress; intangible assets; and other assets.
The 1st International Forum Business and Economy (IFBE) 2019 Banjarmasin, 13-14 November 2019
177
The asset inventory in Central Kalimantan LPMP has been carried out regularly. Especially for
fixed assets are generally good, but what is difficult is movable assets / objects such as cars, laptops,
cameras, projectors and other items that are easy to carry anywhere. The problem that often occurs is that
the goods are damaged or lost. And then, it is difficult to find out the evidence of goods damaging
because there is no report to the manager of the goods. Meanwhile, the person concerned is not willing to
replace damaged or missing items.
In addition of the inventory process, legal audit is one of the steps taken to optimize the using of
assets. The legal audit process that has been carried out by LPMP in Central Kalimantan is to conduct an
asset ownership document in the form of a land asset certificate that was previously in the Central
Kalimantan Provincial Education Office. Arrangement of Proof of Ownership of Motorized Vehicles
(BPKB) for assets of machine tools especially four-wheeled motor vehicles has also been carried out.
While the management of Building Permit (IMB) for building assets has not been done. For BMN in the
form of buildings, the BMN User Status Determination (PSP) has been arranged. Legal audits are carried
out to solve various legal problems related to control or transfer of assets (Siregar, 2018).
LPMP's BMN assessment has been carried out, such as for the preparation of the Central
Kalimantan LPMP BMN balance sheet, the elimination of BMN and the use of BMN in the form of BMN
rental rates. The assessment was conducted by the Palangka Raya State Assets and Auction Service
Office (KPKNL) which is a vertical office under the Regional Office of the Directorate General of State
Assets of South and Central Kalimantan Ministry of Finance of the Republic of Indonesia.
Supervision and control assets are the next stage of asset management undertaken to optimize
assets. According to Siregar (2018) one of the effective means to improve the performance of the aspects
of supervision and 'controlling assets of Local Governments is to develop SIMA (Asset Management
Information System). Through SIMA, work transparency in asset management is guaranteed without the
need for fears of weak supervision and control.
The development of the Management and Accounting Information System for State Property
(SIMAK-BMN) carried out by the central government is an effort to facilitate reporting on the
implementation of the APBN in the form of a balance sheet on government agencies, including LPMP.
SIMAK-BMN aims to support the preparation of the accountability reports of the State Ministries /
Institutions, provide various information in the framework of BMN management, also provides benefits
to Property Users and Property User Authorities in their managerial tasks, including the task of
monitoring and controlling BMN. In the reality of Central Kalimantan LPMP, it has been reported on the
results of the SIMAK-BMN which has not been maximally utilized in the management of BMN (assets),
especially in the supervision and control of BMN that should be carried out by the Property User
Authority as the leader of the Institution.
The positive side of the large number of assets owned by LPMP in Central Kalimantan is that
LPMP has great potential to become one of the "money making machines" for sources of state revenue,
namely by optimally utilizing assets by leasing them to third parties. LPMP has several teacher training
building assets that can be rented outside the training schedule. The main task and function of LPMP
which has a building with lodging facilities, halls, classrooms and computer laboratories along with its
facilities all of which have the potential to be commercialized so that they can contribute and increase
state income. It can be also used to cover operational costs and maintenance of these assets, because so far
the state budget for that is very large.
Based on the description above, the writers are interested in conducting further research related to
the effect of the asset management stages on asset optimization, in this case the work stages of the asset
management studied include: asset inventory, asset audit, asset valuation, asset supervision and control,
and optimization assets in the Central Kalimantan Province Educational Quality Assurance Institute
(LPMP). The existing problems arise research questions that are limited as follows: whether there is an
effect of inventory, legal audit, assessment, and supervision and control of the optimization of assets in
the LPMP of Central Kalimantan Province.
The 1st International Forum Business and Economy (IFBE) 2019 Banjarmasin, 13-14 November 2019
178
LITERATURE REVIEW
In connection with the enactment of Government Regulation No. 38/2008 concerning Management
of State / Regional Property which has been amended by Government Regulation No. 27/2014,
management of state assets is not merely administrative, but is more advanced thinking in handling state
assets, how to improve efficiency, effectiveness and creating added value in managing assets. Therefore,
the scope of the management of state assets includes the planning of needs and budgeting, procurement,
use, utilization, security and maintenance, assessment, deletion, transfer, administration, guidance,
supervision and control.
According to Siregar (2018: 179) states that Assets are part of state assets or state assets (HKN)
consisting of movable or immovable property owned, controlled by government agencies, which are
partially or wholly purchased at the expense of the State Budget. (APBN) as well as from legal
acquisition, not including separated state assets (managed by BUMN) and Regional Government Assets.
Briefly referred to as "state property / state property".
Based on PSAP No. 07 Government Regulation No. 71 of 2010, the definition of assets in the
government sector is economic resources that are controlled and / or owned by the government as a result
of past events and from which future economic and / or social benefits are expected to be obtained, both
by the government and the community, and can be measured in monetary terms, including non-financial
resources needed to provide services to the general public and resources maintained for historical and
cultural reasons. Whereas fixed assets are defined as tangible assets that have a useful life of more than 12
(twelve) months to be used, or intended to be used, in government activities or utilized by the general
public.
There are some of the main reasons why governments must pay attention to the management of
their country's assets. First, because it fixed assets have a long life. Second, fixed assets have a material
value to government resources. Third, because fixed assets are noncurrent. In addition, because assets
remain vulnerable to rapid depreciation if not well maintained during their life cycle, and maintenance
operations of fixed assets throughout their life cycle spend a much larger amount of funds than the initial
expenditure for ownership of these fixed assets (Lu, 2011) .
Siregar (2018) states that asset management itself can be divided into five stages of work, namely
asset inventory, legal audit, asset valuation, asset optimization and development of Asset Management
Information Systems (SIMA). Asset inventory consists of two aspects, namely physical and legal / legal
inventory. Physical aspects consist of shape, area, location, volume or number, type, address and others.
Juridical / legal aspects are the status of mastery, legal problems that are owned, the deadline of mastery
and others. The work process undertaken is data collection, codification / labeling, grouping, and
accounting / administration in accordance with the objectives of asset management.
Based on Government Regulation No. 27 of 2014 concerning Management of State / Regional
Property (BMN / D) states that inventory is an activity to collect data, record and report the results of
BMN data collection. The purpose of the inventory is to find out the number and value and the actual
condition of BMN, both those in the possession of the Property User and those in the administration of
the Property Manager. What is meant by Property User is an official holding the authority to Use State /
Regional Property. While the Property Manager is the official who is authorized and responsible for
setting policies and guidelines as well as managing State / Regional Property.
Siregar (2018: 519) states that legal audit is an asset management scope of work in the form of an
inventory of the status of asset control, systems and procedures for controlling or transferring assets,
identifying and finding solutions to legal problems related to control or transfer of assets. Legal problems
are often encountered include weak tenure rights, assets controlled by other parties, transfer of assets that
are not monitored, and others.
Based on Government Regulation No. 27 of 2014 concerning Management of State / Regional
Property, a legal audit is also an act of security or control, control in an effort to administer state / regional
The 1st International Forum Business and Economy (IFBE) 2019 Banjarmasin, 13-14 November 2019
179
property physically, administratively and legal actions. These safeguards are physically, administratively
and legally carried out so that BMN / D can be used / utilized optimally and can avoid seizure,
expropriation or claims from other parties. Physical security of fixed assets (land and buildings) can be
done by fencing, installing signboards of ownership and guarding. Administrative safeguards can be
carried out by means of settlement of proof of ownership such as certificates, IMB, minutes of handover,
agreement letters, sale and purchase certificates and other supporting documents.
Asset valuation is a work proces of evaluating assets held / owned. Usually, it is done by an
independent appraisal consultant. The results of these values will be used to determine the value of wealth
and information for the determination of assets to be sold (Siregar, 2018: 519).
Based on the Regulation of the Minister of Finance of the Republic of Indonesia Number 111 /
PMK.06 / 2017 concerning the Assessment of State Property. The definition of BMN assessment is the
process of activities to provide an opinion value on an object of valuation in the form of State Property at
a certain time. BMN assessment is carried out for: (1) central government balance sheet preparation; (2)
utilization; (3) alienation; or (4) implementation of other activities in accordance with the provisions of
the legislation, including State Sharia Securities.
Siregar (2018: 519) states that supervision and control of asset utilization is an issue that is often
blasphemous to the current Regional Government. One effective means to improve the performance
aspects of the supervision and control of regional government assets is the development of SIMA (Asset
Management Information System). Through SIMA, it is expected that work transparency in asset
management is guaranteed without the need for fears of weak supervision and control. In this SIMA all
four aspects of asset management (asset inventory, legal audit, asset valuation and asset optimization) are
accommodated in the system by adding aspects of supervision and control. Every handling of a monitored
asset is clear starting from the scope of handling up to who is responsible for handling the asset, this is
expected to minimize KKN (collusion, corruption and nepotism) within the Regional Government.
Siregar (2018: 519) explains that asset optimization is a work process in asset management that
aims to optimize the physical, location, value, amount / volume, legal and economic potential of the asset.
In this stage, assets controlled by the Regional Government are identified and classified on assets that
have potential and do not have potential. Assets that have the potential can be classified according to the
leading sectors that are the foundation of the national economic development strategy, both in the short,
medium and long term. The criteria for determining the leading sectors must be measurable and
transparent. Assets that cannot be optimized must be searched for, whether factors are legal, physical, low
economic value or other factors. Local governments usually have assets that are under control. However,
there are quite a lot of assets that have not been optimized in order to increase the revenue of the Regional
Government.
State / Regional Government Property or assets of the Central / Regional Government that have not
been utilized need to be utilized optimally so that it will not burden the State / Regional Expenditure
Budget, especially maintenance costs and the possibility of seizure from irresponsible third parties.
Optimal use of goods / assets belonging to the state / region will create a source of State Revenue /
Regional Original Revenue. Based on the Minister of Finance Regulation No. 78 / PMK.06 / 2014
concerning Procedures for the Use of State Property, utilization is the utilization of BMN that is not used
to carry out the duties and functions of Ministries / Institutions and / or optimization of BMN by not
changing ownership status.
Based on the literature review described above, the hypothesis of this study are:
H1: Asset Inventory has a positive and significant effect on asset optimization.
H2: Asset Legal Audit has a positive and significant effect on asset optimization.
H3: Asset Valuation has a positive and significant effect on asset optimization.
H4: Asset Monitoring and Control has a positive and significant effect on asset optimization.
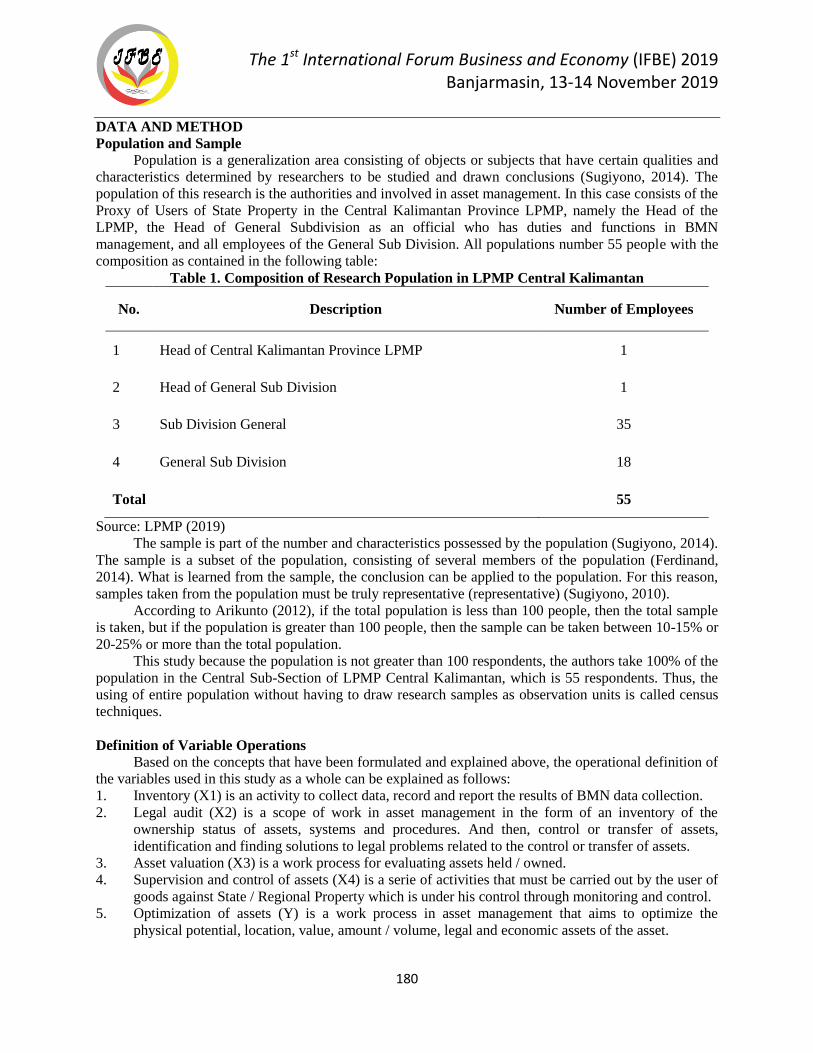
The 1st International Forum Business and Economy (IFBE) 2019 Banjarmasin, 13-14 November 2019
180
DATA AND METHOD
Population and Sample
Population is a generalization area consisting of objects or subjects that have certain qualities and
characteristics determined by researchers to be studied and drawn conclusions (Sugiyono, 2014). The
population of this research is the authorities and involved in asset management. In this case consists of the
Proxy of Users of State Property in the Central Kalimantan Province LPMP, namely the Head of the
LPMP, the Head of General Subdivision as an official who has duties and functions in BMN
management, and all employees of the General Sub Division. All populations number 55 people with the
composition as contained in the following table:
Table 1. Composition of Research Population in LPMP Central Kalimantan
No. Description Number of Employees
1 Head of Central Kalimantan Province LPMP 1
2 Head of General Sub Division 1
3 Sub Division General 35
4 General Sub Division 18
Total 55
Source: LPMP (2019)
The sample is part of the number and characteristics possessed by the population (Sugiyono, 2014).
The sample is a subset of the population, consisting of several members of the population (Ferdinand,
2014). What is learned from the sample, the conclusion can be applied to the population. For this reason,
samples taken from the population must be truly representative (representative) (Sugiyono, 2010).
According to Arikunto (2012), if the total population is less than 100 people, then the total sample
is taken, but if the population is greater than 100 people, then the sample can be taken between 10-15% or
20-25% or more than the total population.
This study because the population is not greater than 100 respondents, the authors take 100% of the
population in the Central Sub-Section of LPMP Central Kalimantan, which is 55 respondents. Thus, the
using of entire population without having to draw research samples as observation units is called census
techniques.
Definition of Variable Operations
Based on the concepts that have been formulated and explained above, the operational definition of
the variables used in this study as a whole can be explained as follows:
1. Inventory (X1) is an activity to collect data, record and report the results of BMN data collection.
2. Legal audit (X2) is a scope of work in asset management in the form of an inventory of the
ownership status of assets, systems and procedures. And then, control or transfer of assets,
identification and finding solutions to legal problems related to the control or transfer of assets.
3. Asset valuation (X3) is a work process for evaluating assets held / owned.
4. Supervision and control of assets (X4) is a serie of activities that must be carried out by the user of
goods against State / Regional Property which is under his control through monitoring and control.
5. Optimization of assets (Y) is a work process in asset management that aims to optimize the
physical potential, location, value, amount / volume, legal and economic assets of the asset.
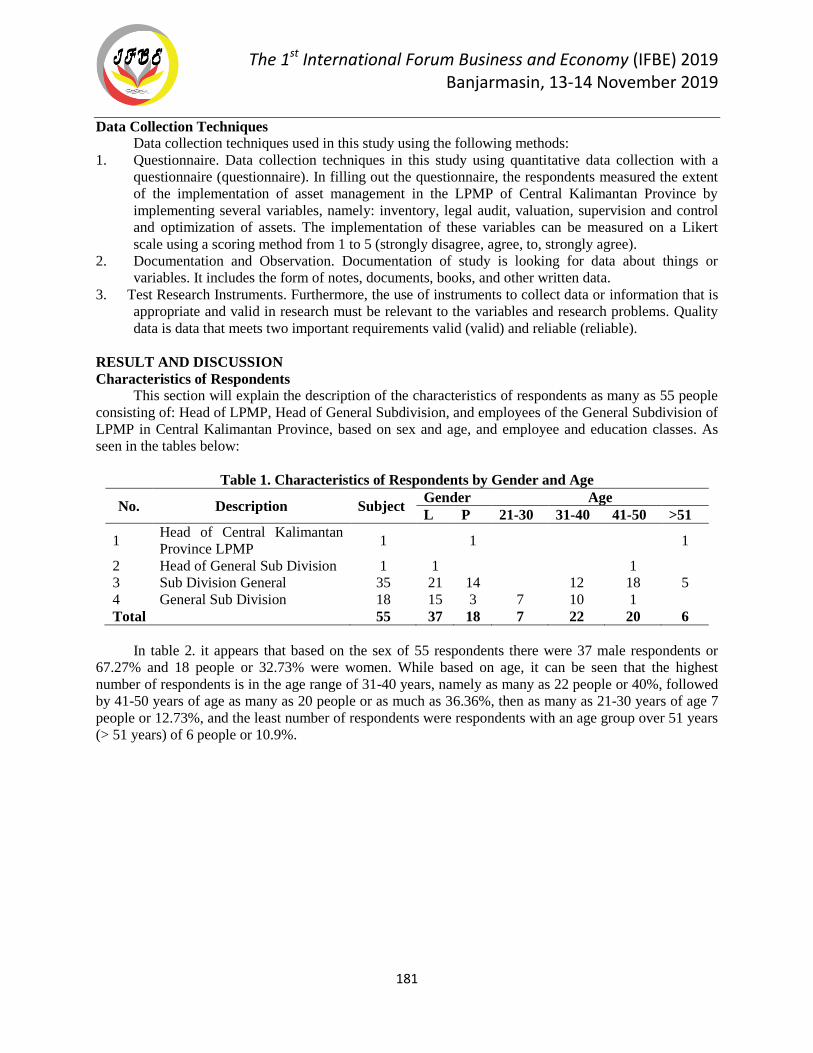
The 1st International Forum Business and Economy (IFBE) 2019 Banjarmasin, 13-14 November 2019
181
Data Collection Techniques
Data collection techniques used in this study using the following methods:
1. Questionnaire. Data collection techniques in this study using quantitative data collection with a
questionnaire (questionnaire). In filling out the questionnaire, the respondents measured the extent
of the implementation of asset management in the LPMP of Central Kalimantan Province by
implementing several variables, namely: inventory, legal audit, valuation, supervision and control
and optimization of assets. The implementation of these variables can be measured on a Likert
scale using a scoring method from 1 to 5 (strongly disagree, agree, to, strongly agree).
2. Documentation and Observation. Documentation of study is looking for data about things or
variables. It includes the form of notes, documents, books, and other written data.
3. Test Research Instruments. Furthermore, the use of instruments to collect data or information that is
appropriate and valid in research must be relevant to the variables and research problems. Quality
data is data that meets two important requirements valid (valid) and reliable (reliable).
RESULT AND DISCUSSION
Characteristics of Respondents
This section will explain the description of the characteristics of respondents as many as 55 people
consisting of: Head of LPMP, Head of General Subdivision, and employees of the General Subdivision of
LPMP in Central Kalimantan Province, based on sex and age, and employee and education classes. As
seen in the tables below:
Table 1. Characteristics of Respondents by Gender and Age
No. Description Subject Gender Age
L P 21-30 31-40 41-50 >51
1 Head of Central Kalimantan
Province LPMP 1 1 1
2 Head of General Sub Division 1 1 1
3 Sub Division General 35 21 14 12 18 5
4 General Sub Division 18 15 3 7 10 1
Total 55 37 18 7 22 20 6
In table 2. it appears that based on the sex of 55 respondents there were 37 male respondents or
67.27% and 18 people or 32.73% were women. While based on age, it can be seen that the highest
number of respondents is in the age range of 31-40 years, namely as many as 22 people or 40%, followed
by 41-50 years of age as many as 20 people or as much as 36.36%, then as many as 21-30 years of age 7
people or 12.73%, and the least number of respondents were respondents with an age group over 51 years
(> 51 years) of 6 people or 10.9%.
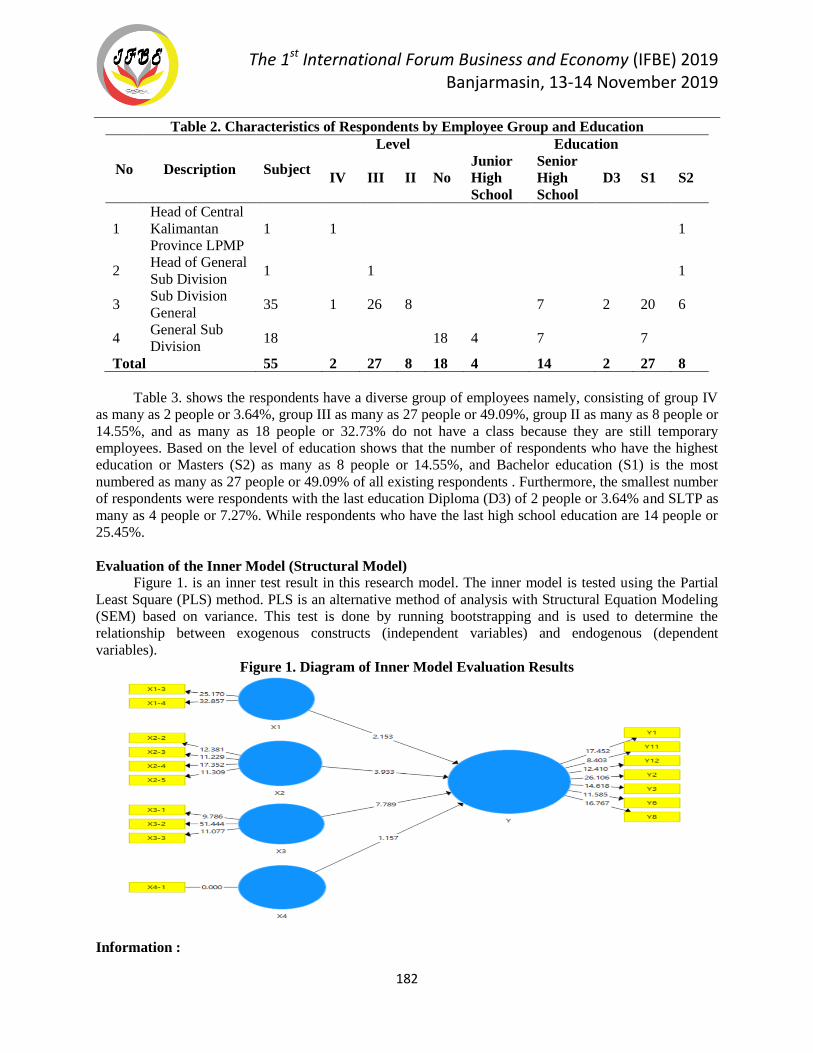
The 1st International Forum Business and Economy (IFBE) 2019 Banjarmasin, 13-14 November 2019
182
Table 2. Characteristics of Respondents by Employee Group and Education
No Description Subject
Level Education
IV III II No
Junior
High
School
Senior
High
School
D3 S1 S2
1
Head of Central
Kalimantan
Province LPMP
1 1 1
2 Head of General
Sub Division 1 1 1
3 Sub Division
General 35 1 26 8 7 2 20 6
4 General Sub
Division 18 18 4 7 7
Total 55 2 27 8 18 4 14 2 27 8
Table 3. shows the respondents have a diverse group of employees namely, consisting of group IV
as many as 2 people or 3.64%, group III as many as 27 people or 49.09%, group II as many as 8 people or
14.55%, and as many as 18 people or 32.73% do not have a class because they are still temporary
employees. Based on the level of education shows that the number of respondents who have the highest
education or Masters (S2) as many as 8 people or 14.55%, and Bachelor education (S1) is the most
numbered as many as 27 people or 49.09% of all existing respondents . Furthermore, the smallest number
of respondents were respondents with the last education Diploma (D3) of 2 people or 3.64% and SLTP as
many as 4 people or 7.27%. While respondents who have the last high school education are 14 people or
25.45%.
Evaluation of the Inner Model (Structural Model)
Figure 1. is an inner test result in this research model. The inner model is tested using the Partial
Least Square (PLS) method. PLS is an alternative method of analysis with Structural Equation Modeling
(SEM) based on variance. This test is done by running bootstrapping and is used to determine the
relationship between exogenous constructs (independent variables) and endogenous (dependent
variables).
Figure 1. Diagram of Inner Model Evaluation Results
Information :
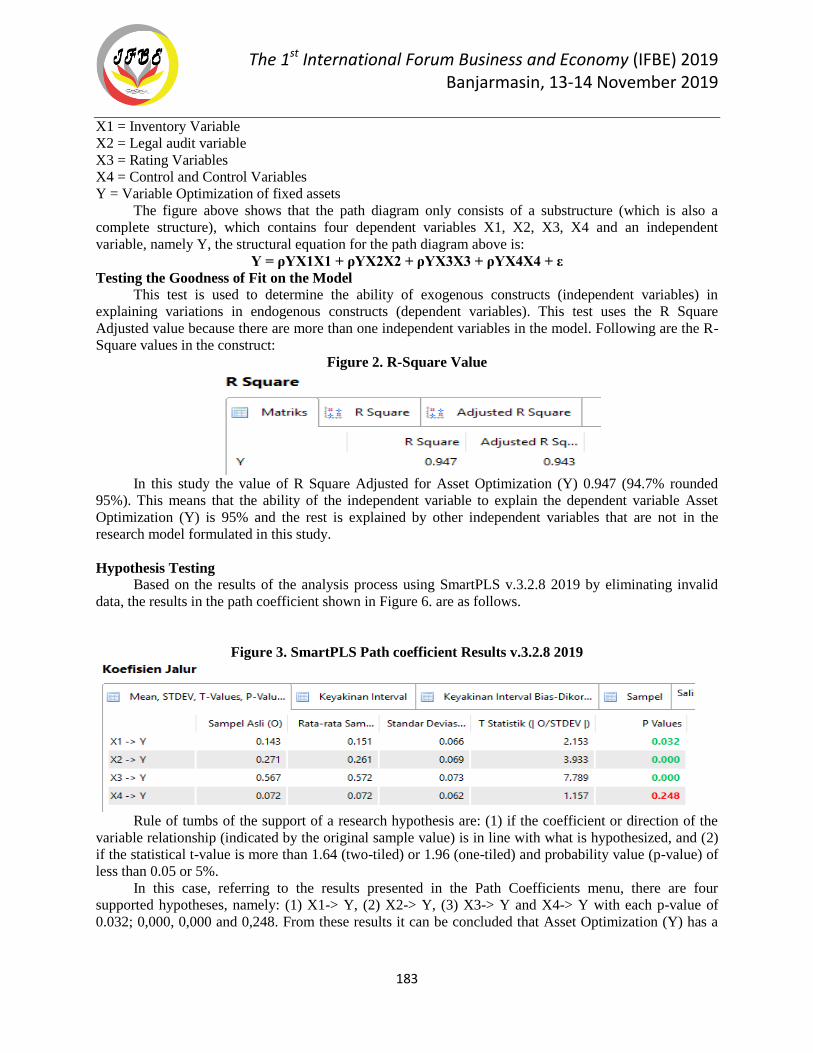
The 1st International Forum Business and Economy (IFBE) 2019 Banjarmasin, 13-14 November 2019
183
X1 = Inventory Variable
X2 = Legal audit variable
X3 = Rating Variables
X4 = Control and Control Variables
Y = Variable Optimization of fixed assets
The figure above shows that the path diagram only consists of a substructure (which is also a
complete structure), which contains four dependent variables X1, X2, X3, X4 and an independent
variable, namely Y, the structural equation for the path diagram above is:
Y = ρYX1X1 + ρYX2X2 + ρYX3X3 + ρYX4X4 + ε
Testing the Goodness of Fit on the Model
This test is used to determine the ability of exogenous constructs (independent variables) in
explaining variations in endogenous constructs (dependent variables). This test uses the R Square
Adjusted value because there are more than one independent variables in the model. Following are the R-
Square values in the construct:
Figure 2. R-Square Value
In this study the value of R Square Adjusted for Asset Optimization (Y) 0.947 (94.7% rounded
95%). This means that the ability of the independent variable to explain the dependent variable Asset
Optimization (Y) is 95% and the rest is explained by other independent variables that are not in the
research model formulated in this study.
Hypothesis Testing
Based on the results of the analysis process using SmartPLS v.3.2.8 2019 by eliminating invalid
data, the results in the path coefficient shown in Figure 6. are as follows.
Figure 3. SmartPLS Path coefficient Results v.3.2.8 2019
Rule of tumbs of the support of a research hypothesis are: (1) if the coefficient or direction of the
variable relationship (indicated by the original sample value) is in line with what is hypothesized, and (2)
if the statistical t-value is more than 1.64 (two-tiled) or 1.96 (one-tiled) and probability value (p-value) of
less than 0.05 or 5%.
In this case, referring to the results presented in the Path Coefficients menu, there are four
supported hypotheses, namely: (1) X1-> Y, (2) X2-> Y, (3) X3-> Y and X4-> Y with each p-value of
0.032; 0,000, 0,000 and 0,248. From these results it can be concluded that Asset Optimization (Y) has a
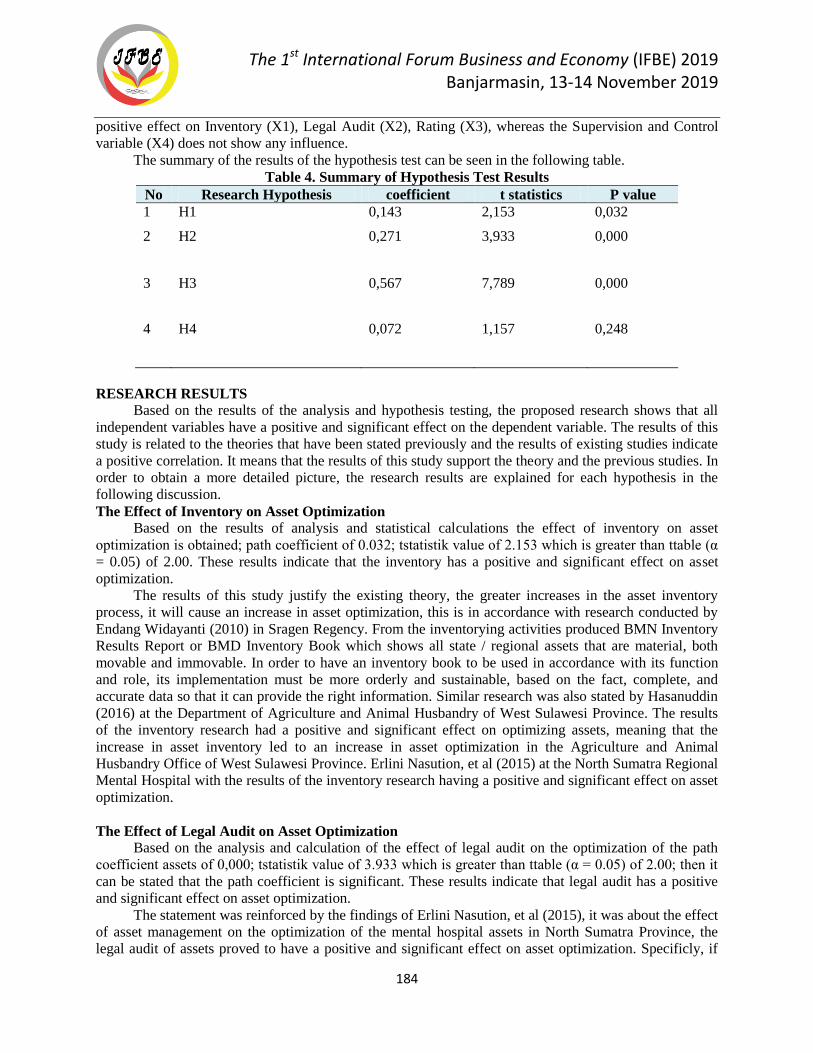
The 1st International Forum Business and Economy (IFBE) 2019 Banjarmasin, 13-14 November 2019
184
positive effect on Inventory (X1), Legal Audit (X2), Rating (X3), whereas the Supervision and Control
variable (X4) does not show any influence.
The summary of the results of the hypothesis test can be seen in the following table.
Table 4. Summary of Hypothesis Test Results
No Research Hypothesis coefficient t statistics P value
1 H1 0,143 2,153 0,032
2 H2 0,271 3,933 0,000
3 H3 0,567 7,789 0,000
4 H4 0,072 1,157 0,248
RESEARCH RESULTS
Based on the results of the analysis and hypothesis testing, the proposed research shows that all
independent variables have a positive and significant effect on the dependent variable. The results of this
study is related to the theories that have been stated previously and the results of existing studies indicate
a positive correlation. It means that the results of this study support the theory and the previous studies. In
order to obtain a more detailed picture, the research results are explained for each hypothesis in the
following discussion.
The Effect of Inventory on Asset Optimization
Based on the results of analysis and statistical calculations the effect of inventory on asset
optimization is obtained; path coefficient of 0.032; tstatistik value of 2.153 which is greater than ttable (α
= 0.05) of 2.00. These results indicate that the inventory has a positive and significant effect on asset
optimization.
The results of this study justify the existing theory, the greater increases in the asset inventory
process, it will cause an increase in asset optimization, this is in accordance with research conducted by
Endang Widayanti (2010) in Sragen Regency. From the inventorying activities produced BMN Inventory
Results Report or BMD Inventory Book which shows all state / regional assets that are material, both
movable and immovable. In order to have an inventory book to be used in accordance with its function
and role, its implementation must be more orderly and sustainable, based on the fact, complete, and
accurate data so that it can provide the right information. Similar research was also stated by Hasanuddin
(2016) at the Department of Agriculture and Animal Husbandry of West Sulawesi Province. The results
of the inventory research had a positive and significant effect on optimizing assets, meaning that the
increase in asset inventory led to an increase in asset optimization in the Agriculture and Animal
Husbandry Office of West Sulawesi Province. Erlini Nasution, et al (2015) at the North Sumatra Regional
Mental Hospital with the results of the inventory research having a positive and significant effect on asset
optimization.
The Effect of Legal Audit on Asset Optimization
Based on the analysis and calculation of the effect of legal audit on the optimization of the path
coefficient assets of 0,000; tstatistik value of 3.933 which is greater than ttable (α = 0.05) of 2.00; then it
can be stated that the path coefficient is significant. These results indicate that legal audit has a positive
and significant effect on asset optimization.
The statement was reinforced by the findings of Erlini Nasution, et al (2015), it was about the effect
of asset management on the optimization of the mental hospital assets in North Sumatra Province, the
legal audit of assets proved to have a positive and significant effect on asset optimization. Specificly, if
The 1st International Forum Business and Economy (IFBE) 2019 Banjarmasin, 13-14 November 2019
185
legal audit factors were better then optimization health equipment in the North Sumatra Regional Mental
Hospital will also be better. Furthermore Agustina Ester Antoh's research (2017) in Paniai Regency, the
results of the analysis conducted prove that the existence of a good legal audit will provide a prediction of
a good asset optimization, legal audit activities that include systems and procedures for the control or
transfer of assets, identification of solutions to problems or security measures, control, control and legal
actions that are getting better will strengthen the position of the asset legally and will certainly support the
implementation of asset optimization. The same thing was also found by Pamfilia Ferdinanda M., et al
(2016) at the Boven Digoel District Financial and Asset Management Agency (BPKAD) showing that
legal audit has a positive effect on optimizing the management and utilization of fixed assets, it means
that if legal audit increases or the better the level of optimization of management and utilization of fixed
assets in the Boven Digoel Regency will also be better. Muhammad Rizky P. and Bill Pangayow (2016)
conducted research on the Jayapura City Government. The results of the study showed that the application
of a good legal audit can guarantee the optimization of asset management in the Local Government
sector, it happens because the Jayapura City Government has implemented a system related to control and
use of assets. In line with research conducted by Hasanuddin (2016) at the Department of Agriculture and
Animal Husbandry of West Sulawesi Province, where the results of his study said that legal audit has a
positive and significant effect on optimizing fixed assets.
The Effect of Rating on Asset Optimization
Based on the results of the analysis and calculation of the effect of valuation on the optimization of
assets above, it obtains a path coefficient of 0,000; tstatistik value of 7.789 which is greater than ttable (α
= 0.05) of 2.00, it can be stated that the path coefficient is significant. These results indicate that valuation
has a positive and significant effect on asset optimization.
This was reinforced in the research conducted by Endang Widayanti (2010), regarding the effect of
asset management on optimizing the fixed assets of the Sragen Regency Government, the asset valuation
has proven to have an effect on optimizing the assets of the Sragen Regency Government. In another
similar study, it also carried out by Erlini Nasution, et al (2015) at a mental hospital in North Sumatra
Province, proves that asset valuation has a significant effect on asset optimization, meaning that if the
asset valuation factor is better, the optimization of health equipment in the Sumatran mental hospital
North will also be better. Another study conducted by Moses Demetouw, et al (2017) that with a good
assessment in this case conducted by an independent appraiser (who is certified) by including the value of
these assets in rupiah units, will provide predictions of a good level of asset optimality. The same study
conducted by Jamaludin (2017) at the Regional Government of the NTB Province, showed that the
Regional Government of the NTB Province with a good asset valuation will provide predictions of
optimizing management and good asset management. Research on the effect of asset valuation on asset
optimization was also carried out by Hasanuddin (2016) at the Agriculture and Animal Husbandry Office
of West Sulawesi Province, Pamfilia Ferdinanda M., et al (2016) at the Regional Financial and Asset
Management Agency (BPKAD) of Boven Digoel Regency, and Sherly Pauweni , et al (2017) in the
Regional Government of Bone Bolango District, all of whom show the results of the analysis that the
valuation has a positive and significant effect on the optimization of assets. In other word, if the valuation
of assets increases or gets better, the level of optimization of management and utilization of assets will
also get better or the impetus for improvement asset valuation will also increase the level of optimization
of management and utilization of assets.
The Effect of Supervision and Control of Asset Optimization
Based on the results of analysis and statistical calculations, the effect of supervision and control on
asset optimization obtained path coefficient of 0.248; tstatistik value of 1.157 which is smaller than ttable
(α = 0.05) of 2.00. These results indicate that supervision and control have a positive, but there is no
significance effect on asset optimization.
The 1st International Forum Business and Economy (IFBE) 2019 Banjarmasin, 13-14 November 2019
186
This research does not prove the significance and positive influence of control and supervision. It
does not prove the existing theory. There are several factors that cause unsupported control and
supervision. Then, the method of control and supervision at this time has become more careful and no
longer easy, partly due to the using of computers in data processing. The researcher realizes that overly
strict control and supervision will be detrimental to both the institution and the individuals within the
institution. Control and supervision that forces the agency's employees to immerse in official procedures
or to limit too much behavior will turn off motivation, impede creativity and ultimately damage the
performance of tasks in the organization. It can affect control and supervision by finding an adequate
balance between effective institution control, supervision and individual freedom. A lot of control and
supervision will make the institution as a workplace becomes oppressive, impedes, and which cannot
influence the optimization of assets. Controls and oversights are too loose, the institution becomes
chaotic, inefficient, and ineffective in achieving its objectives in optimizing assets.
CONCLUSION
Based on the results of data analysis, the research conclusions can be conveyed as follows:
1. Inventory has a positive and significant effect on asset optimization in the LPMP of Central
Kalimantan Province. It means that the level of optimization of assets is influenced by the level of
inventory. The higher level of inventory will also increase the optimization of assets. Conversely, if
asset inventory is low, so the optimization of assets will be low too.
2. Legal audit has a positive and significant effect on asset optimization in LPMP Central Kalimantan
Province. It means that the level of optimization of assets will be influenced by legal audit. The
higher level of legal audit will also increase the optimization of assets. Therfore, with a low legal
audit, the optimization of assets will be low as well.
3. The assessment has a positive and significant effect on the optimization of assets in the Central
Kalimantan Province LPMP. It means that the level of asset optimization will be influenced by the
level of asset valuation. The higher level of asset valuation will also increase the optimization of
assets. When asset valuation is low so the optimization of assets will be low too.
4. Supervision and control does not have a positive and significant effect on the optimization of assets
in the Central Kalimantan Province LPMP. It means that supervision and control do not improve
asset optimization.
REFERENCES
Ansharidan Syofyan, Efrizal, 2016, Pengaruh Pengelolaan Barang Milik Daerah terhadap Kualitas
Laporan Keuangan Pemerintah Kota Padang, Jurnal Riset Manajemen Bisnis dan Publik, Vol. 4
No. 1, halaman 1-18.
Antoh, Agustina E., 2017, Pengaruh Manajemen Aset dalam Optimalisasi Aset Tetap (Tanah dan
Bangunan) Pemerintah Daerah (Studi di Kabupaten Paniai), Jurnal Manajemen dan Bisnis, Vol. 1
No. 2, Juli, halaman 37-47.
Arikunto, S., 2010, Manajemen Penelitian, Rineka Cipta, Jakarta.
Demetouw, Moses; Salle, Agustinus; Asnawi Meinarni, 2017, Pengaruh Manajemen Aset terhadap
Optimalisasi Aset Tetap Pemerintah Kabupaten Jayapura, Jurnal Kajian Ekonomi dan Keuangan
Daerah, Vol 2 No. 3, halaman 1-12.
Direktorat Jenderal Pendidikan Dasar dan Menengah Kementerian Pendidikan dan Kebudayaan, 2016,
Pedoman Penatausahaan Barang Milik Negara.
Ferdinand, A., 2014, Metode Penelitian Manajemen, Edisi Kelima, Universitas Diponegoro, Semarang.

The 1st International Forum Business and Economy (IFBE) 2019 Banjarmasin, 13-14 November 2019
187
Ghozali, Imam, dan Latan, 2012, Partial Least Square: Konsep, Teknik dan Aplikasi SmartPLS 2.0 M3,
Badan Penerbit Universitas Diponegoro, Semarang.
Hartono dan Abdillah, 2011, Partial Least Squares (PLS), Alternatif Structural Equation Modeling
(SEM) dalam Penelitian Bisnis (Buku), Andi Yogyakarta.
Husein, Ananda Sabil, 2015, Penelitian Bisnis dan Manajemen Menggunakan Partial Least Squares
(PLS) dengan smartPLS 3.0, Universitas Brawijaya: Modul Ajar.
Jamaludin, 2017, Pengaruh Inventarisasi Aset, Legal Audit Aset, dan Penilaian Aset terhadap
Optimalisasi Pemanfaatan Aset Tetap (Tanah dan Bangunan) Milik Pemerintah Provinsi NTB,
Jurnal Sekuritas, Vol. 1 No. 1, September, halaman 34-58.
Kantor Jasa Penilai Publik (KJPP) Sumertadana, Haridhira dan Rekan, 2019, Konsep Nilai Properti,
https://penilaianaset.com/konsep-nilai-properti/. Diakses 8 Januari 2019.
Lu, Yaotai. 2011. Public Asset Management: Empirical Evidence from the State Governments in the
United State, Disertasi. Florida: Florida Atlantic University.
Mahsun, Mohammad, 2003, Analisis Efektifitas Manajemen Aset Properti Riil Pemerintah Daerah (Studi
Kasus pada Pemerintah Kota Yogyakarta Tahun Anggaran 2001/2002), Jurnal Akuntansi dan
Keuangan Sektor Publik, Vol 4 No. 2, 1-9.
Montayop, Pamfilia F., Ratang, W., Kambu, A., 2016, Faktor-Faktor yang Memepengaruhi Optimalisasi
Pemanfaatan Aset Tetap, Jurnal Kajian Ekonomi dan Keuangan Daerah, Vol. 1 No. 2, halaman
83-109.
Nasution, Erlini, Nasution H., dan Absah, Y., 2015, Pengaruh Manajemen Aset Terhadap Optimalisasi
Aset Rumah Sakit Jiwa Daerah Provinsi Sumatera Utara, Jurnal Ekonomi, Vol. 18 No. 1, Januari,
halaman 10-18.
Pauweni, Sherly, Karamoy, H., dan Gamaliel, H., 2017, Pengaruh Inventarisasi, Legal Audit, Penilaian
dan Kondisi Aset terhadap Optimalisasi Pemanfaatan Aset pada Pemerintah Daerah Kabupaten
Bone Bolango, Jurnal Riset Akuntansi dan Auditing “Goodwill”, Vol. 8 No. 2, halaman 50-61.
Pratama, Muhammad R. dan Pangayow, Bill, 2016, Pengaruh Manajemen Aset terhadap Optimalisasi
Pengelolaan Aset Daerah Studi pada Pemerintah Kota Jayapura, Jurnal Akuntansi dan Keuangan
Daerah, Vol. 11 No. 2, November, halaman 33–51
-----------------------, Peraturan Pemerintah Republik Indonesia Nomor 27 Tahun 2014 tentang
Pengelolaan Barang Milik Negara/Daerah.
----------------------, Peraturan Pemerintah Republik Indonesia Nomor 71 Tahun 2010 tentang Standar
Akuntansi Pemerintahan.
-----------------------, Peraturan Menteri Keuangan Republik Indonesia Nomor 181/PMK.06/2016 tentang
Penatausahaan Barang Milik Negara.
----------------------, Peraturan Menteri Keuangan Republik Indonesia Nomor 111/PMK.06/2017 tentang
Penilaian Barang Milik Negara.
----------------------, Peraturan Menteri Keuangan Republik Indonesia Nomor 78/PMK.06/2014 tentang
Tata Cara Pelaksanaan Pemanfaatan Barang Milik Negara.
The 1st International Forum Business and Economy (IFBE) 2019 Banjarmasin, 13-14 November 2019
188
----------------------, Peraturan Menteri Pendidikan dan Kebudayaan Nomor 14 Tahun 2015 tentang
Organisasi dan Tata Kerja Lembaga Penjaminan Mutu Pendidikan.
Salisbury, W.D., Chin, W.W., Gopal, A., & Newsted, P.R., 2002, “Research Report: Better Theory
through measurment-developing a scale to capture consensus on appropiation”. Information
System Research.
Siregar, Doli. D, 2018, Management Aset Strategi Penataan Konsep Pembangunan Berkelanjutan secara
Nasional dalam Konteks Kepala Daerah sebagai CEO’s pada Era Globalisasi dan Otonomi
Daerah, PT Gramedia Pustaka Utama, Jakarta.
Solimun, 2014, Penguatan Metodologi Penelitian, General Structural Component Analysis-GSCA,
Program Studi Statistika Fakultas MIPA Universitas Brawijaya.
Sugiyono, 2014, Metode Penelitian Manajemen, Cetakan ke-3, CV. Alfa Beta, Bandung.
Sugiyono, 2010, Metode Penelitian Kuantitatif Kualitatif dan R&D, Cetakan ke-9, CV. Alfa Beta,
Bandung.
Sulistiowati, Firma, 2003, Pengelolaan Aset Tetap: Tinjauan terhadap Aset Tetap Pelimpahan dari
Kandep ke Pemerintah Kota Yogyakarta Tahun 2001, Jurnal Akuntansi dan Keuangan Sektor
Publik, Vol 04, No. 02, Agustus, halaman 20-29.
---------------, Undang-Undang Nomor 1 Tahun 2004 tentang Perbendaharaan Negara.
Widayanti, Endang, 2010, Pengaruh Manajemen Aset terhadap Optimalisasasi Pemanfaatan Aset Tetap
Pemerintah Daerah (Studi Kasus di Kabupaten Sragen), Tesis S2 Program Pascasarjana
Universitas Sebelas Maret, Surakarta.
The 1st International Forum Business and Economy (IFBE) 2019 Banjarmasin, 13-14 November 2019
189
ARE THERE CONTINGENT FACTORS THAT AFFECT AND NOT AFFECT TOWARDS
CORRUPTION LEVELS ? (EVIDENCE FROM THE INDONESIAN PROVINCE
GOVERNMENT)
Wardahayati 1) ; Syaiful Hifni
2); Sarwani
4); Atma Hayat
5);
Lili Safrida 6); Akhmad Sayudi
7); Wahyudin Nor
8)
1 Graduate of Master of Accounting Study Programme, Faculty of Economic and Business, University of
Lambung Mangkurat, Banjarmasin, Indonesia, 234567
Faculty of Economic and Business, University of Lambung Mangkurat, Banjarmasin, Indonesia, [email protected]
Abstract: This research was conducted to know the effect of contingent factors, such: audit opinion, audit
findings, follow-up on audit, and the rank of Local Government Implementation Report ( LGIR) towards
the level of corruption of the provincial government in Indonesia. The population of this research is local
governments who have mandate to enhance good governance. Population target of this research is 34
Provinces in Indonesia, data that can be used for research are 30 Provinces witih 60 sampel. This
research is an associative quantitative study to explain the effect of contingent factors of 4 (four) variables
independent on dependent variable by using a statistical test the regression model. The results of this
study indicate that audit opinion, audit findings, and follow-up on audit results do not affect towards the
level of corruption in Provincial governments in Indonesia. Meanwhile, empirical fact, rank of the Local
Government Implementation Report (LGIR), shows that it has a positive effect on the level of corruption
in the provincial government in Indonesia. This proves that the Provincial government which obtained the
Unqualified Opinion with audit findings and follow-up on audits by the Supreme Audit Board (BPK) did
not contribute to the level of corruption of the provincial government in Indonesia. This is identified even
though the formal performance of the provincial government is good but it does not mean that the level of
corruption is decreasing. As additional finding, because corruption is a form of human failure type, it
violates the rules, as part of fraud that can be identified, and can be identified as culture. Therefore, it
requires combating corruption that is not only based on compliance for regulations, but it needs with fulfil
ethical intelligence (reactive intelligence with values). As human development manner for the
controlling of Individuals in organization from influence environment, implementation that more
remain certain for accountability culture. It depends on contingent factors, such as, culture (power
distance and individualism for ethical intelligence link with organizational intelligence) as trigger
corruption (appear as artifact-culture). These aspects as contingent seem to be more decisive than the
reserach variables that have been discussed.
Keywords: Corruption level, audit opinion, audit findings, follow-up on audit results, Local Government
Implementation Report.
INTRODUCTION
Corruption is a world wide problem that disproportionately affects those with the fewest personal
and economic resources. Hence, proposition is stated that human development with moral development
(see McLeod, 2013) restricts corruption (Minkova, 2018) and the magnitude such an effect is contingent
The 1st International Forum Business and Economy (IFBE) 2019 Banjarmasin, 13-14 November 2019
190
upon the condition of national culture (Segon, 2010; Sims, et al, 2011). Refers to Corruption
Perceptions Index (CPI) 2018, it showed the index of list 180 countries and territories by their perceived
levels of public sector corruption according to experts and business people by using a scale of 0 to 100,
where 0 is highly corrupt and 100 is very clean. Described, that, more than two-thirds, of countries score
below 50 on this year’s CPI, with an average score of just 43. Therefore, It reveals that the continued
failure of most countries to significantly control corruption is contributing to a crisis in democracy the
whole world. As described Rubio (2018) that “Corruption is much more likely to flourish where
democratic foundations are weak and as we have seen in many countries, where undemocratic and
populist politicians can use it to their advantage ( TI, 2018). In recent years, when we refer for
Transparency International which releases a Corruption Perceptions Index (CPI). As in 2018, showing
Indonesia is in the 89th position with a score of 38. This results are up seven levels compared to year of
2017 which is in the 96th position out of 180 countries with a score of 37. Although there are exceptions,
the data show some progress, but most countries are failing to make serious fight against corruption.
This phenomenon is very important to watch for, because the high level of corruption will suppress good
governance, such also for Indonesia (see TI, 2018).
The phenomenon of corruption in governmental sector occurs because there are opportunities from the
government apparatus. Along with the journey of Local autonomy, the links between decentralization and
corruption is still complex. Meanwhile, the role of decentralized governance in combating corruption
remains uncertain. A country that isn’t able to control and eliminate this problem suffers important losses
of economic and social wellness (see Ulman, 2014). Moreover, although differing among countries, a
common factor has underpinned much of the outpouring of outrage for corruption and financial
mismanagement by governments. Corruption cases are often carried out by apparatus that managing all
sectors of government (see Kelly, 2017; TI, 2019). Although efforts to prevent and crack down with
punishment for corruptors continue to be institutionalized, such with the role of the "Corruption
Eradication Commission", as well as the support of anti-corruption activists. Until this time being still
appear "human failure types" in behavioral in form corruption, and continues to grow.
Corruption as one form of fraud (Kelly, 2017) can be explained by the theoretical framework of
the fraud triangle or its in development as GONE theory (see Wolfe and Hermanson, 2004). In the context
of governance, fraud practices often occur as misuse of interests, bribery, illegal acceptance and
corruption (see Bologna, Lindquist, & Wells, 1993; Tuanakotta, 2010). Corruption occurs because it
meets the elements of violating laws and regulations. Acts of corruption that occur in the central
government or Localgovernment is a failure of government management assessed by the community and
has entered the category of prosecution in court. There is a fact that corruption grows because the
influence of opportunity, and exposure aspects, in relations with the organization as a result of the impact
of general factors (Priantara, 2013). It is related to the low moral individual (see Lokanan, 2015) which is
in financial crimes due to greed (greed) associated with actions that have been repeatedly so it is
considered normal and not an act that is wrong on the basis of human needs. It was stated that there are
many organizations that are considered negligent in providing investing the time and resources to get in
front of the risk of fraud (Priantra, 2013; Moritz, 2016).
The theoretical framework of the diamond fraud model and GONE theory with its constituent
elements can be a reference in explaining contingent theory ( Chenhall, 2003;2007; Berry, et al, 2009)
and behavioral factors (see Hofstede, & Hofstede, 2005; Ismail, 2010), such as contextual factors,
culture, that may affect the organization's structure, and with ethical intelligence towards the route to
managing fraud and corruption risks (see Belohlavek, 2007; Schein, 2004; Moritz, 2016). Necessary
explanatory and for controlling directions and predictions according to the theoretical function in the
prevention of corruption. Therefore, it is needed role of behavioral aspect, such as individual and
organizational ethical intelligence, within human with moral development (Belohlavek, 2007; Sims,
2011; McLeod, 2013), to change level accountability formally (Jeppesen, 2018) to cultural
accountability substantially (see Khan, 2006, Kelly, 2017). Accountability Culture as effort to prevent in
The 1st International Forum Business and Economy (IFBE) 2019 Banjarmasin, 13-14 November 2019
191
increasing of level of corruption significantly because individu has been supported by organizational
development in terms of administrative, technical, strategic, and social ( Albrecht, 1983; 2002; Sims, et
al, 2011). Therefore, through by level of accountability in term of the overall public sector audit process
would increase transparency and accountability and help prevent corruption due to the method and
behavioral perspective (see Bologna, and Lindquist 1995; Bologna and Shaw, 1996; Albrecht, et al, 2004;
Ramamoorti, 2008; Dwiputrianti, 2008; Albrecht, et al, 2012; Musa, et al, 2012).
In general, although administratively, technically, social relationship with strategically manner,
such as through the activities of various types of auditing to guarantee on the fairness of presentation of
financial statements in describing the actual economic activity (Albrecht, 1983, 2002; Sparberg, 2000;
Khan, 2006; Vovchenko et al, 2017). Also, with helpful to regulators considering the more explicit role
of external auditors in fraud risk- corruption risk assessment, which based the prior research on political
corruption, and the client risk management strategies which are used by external auditor to enhance role
of auditing as level of accountability (see Mihret, 2014; Jeppesen, 2018). Even, with last manner, such
with monitoring performance as prevention manner and various methods an approach others which has
been applied to reduce corruption, has included with the law enforcement manner to avoid fraud
practices related to the corruption, in fact, all these efforts does not really give yet deterrent effect, where
the level corruption is still high (see Minkova, 2016; Kelly, 2017; Isgiyata, et al, 2018; AFA, 2018;
Jeppesen, 2018). In fact, existing indicators shows the size of losses caused by this fraud that has
increased. Described, that organizations lose 5 percent of their income each year due to fraud. The
association also estimates a global economic loss of US $ 3.5 trillion. In addition, the level of dishonesty
in society tends to increase (KPMG, 2010; Wilson, 2013; Mihret, 2014).
A number of previous studies related to the contingency factors of the role of financial audits and
the role of auditors at the level of accountability. They show the results that have not been concluded. A
number of studies have shown aspects of accountability such as audit opinions, audit findings and follow-
up on audits. They does not have effect in reducing the level of corruption (Heriningsih and
Rusherlistyani, 2013, Heriningsih and Mahrita, 2013, Husna, et al (2015); Azhar and Setyaningrum
(2015). Din, et al, (2017), describes, that follow-up of financial investigation reduces the level of financial
losses, thereby increasing the accountability of local government financial reporting. Meanwhile, other
research shows a positive relationship of audit opinion that can exert an influence on the level of
corruption. Related to facts, they show that irregularities found by BPKP fraud audits affect the level of
corruption in the Indonesian provinces (Rosyadi and Budding, 2017). Also, research by Utomo, et al
(2018) shows a significant audit opinion on the level of corruption. The results of this study indicate that
an "unqualified opinion" represents the good governance of an organization. Referring to various previous
studies, it can be stated, for conditions that cannot be concluded from some research intended, that is an
unqualified opinion, does not necessarily guarantee that the institution is free from potential corruption.
The reason is that the "Supreme Audit Body" audit was not designed to detect corruption, but rather to
determine "the fairness" of the information presented in the financial statements. The results of
quantitative testing conducted during the study also confirm the results of qualitative testing, and thus it
can be affirmed that an unqualified opinion is not significantly related to the level of corruption
(Tehupuring, 2018). Other empirical fact shows positive effect between auditor quality and follow-up of
audit recommendation. This indicates that high quality auditor is able to produce appropriate
recommendations, that can be easily followed up by the auditee (Setyaningrum, et al, 2013).
various studies have been carried out with various variables as level of accountability towards the
level of corruption in Indonesia, we continue this scientific tradition. First, our scientific tradition in this
study contrast to some studies, such as the GONE theory directly as an explanatory tool for Fraud events
(Isgiyata, et al, 2018). This study uses GONE theory only as grand theory, while for application theory
uses contingent factors from role of auditing as level of accountability ( Bastian, 2009; 2014; Jeppesen,
2018 ) with culture accountabilty (Khan, 2006) in behavioral perspective. Different from the study of
Tehupuring (2018) that examines specifically for the relationship between audit opinion and level of
The 1st International Forum Business and Economy (IFBE) 2019 Banjarmasin, 13-14 November 2019
192
corruption in Indonesia that measured as total corruption cases in Local Gov. X 100%. as total population
(10,000) . Also, different with Masyitoh et al (2015), that uses 3 (three) contingent variables. Further,
this study was approached by continuing to asses the contingent factors that have an un-concluded, or
still as research gap, namely audit opinion, audit findings, follow-up the audit findings, but with adding
variable for rank of Local Government Implementation Report (LGIR). For dependent variable level
of corruption, this reasearch uses number of handling cases of corruption in the Indonesian Attorney
General's Office as level of corruption.
This research uses contingent factors in context of accountability culture, with ethical intelligence,
human development-moral development approach, within organizational development manner for
strategic, socio, technic, and administrative (Albrecht, 1983; 2002; Chenhall, 2003; 2008; Hofstede and
Hofstede, 2005; Khan, 2006; Belohlavek, 2007; Schein, 2014; Lokanan, 2015; Kelly, 2017). Through this
research, we distinguish the substance of existing studies previously by adding contingent variables , and
then, it uses the results to build academic ideas by modeling the formal side of accountability into the
behavioral model (from the level of accountability to the culture of accountability ).
Therefore, based on the background of research, we have stated the aims of research are:
(1) To measure contingent factors of ccountability culture in accounting and auditing facet, namely,
audit opinon, audit findings, follow-up on audit, and rank of Local Government Implementation
Report towards the levels of corruption in Indonesian Province Government;
(2) To describe contingent factors from accountability culture, ethical intelligence, human-moral
development and organizational development to strengthen the model of prevention for corruption
with behavioral approach.
LITERATURE REVIEW
Fraud Triangle and GONE Theory
Fraud phenomena and corruption that are one form of fraud was explained through "fraud
triangle" with background of actions , namely, pressure (motivation or incentive to commit fraud),
opportunity (the knowledge and ability to carry out fraud), and rationalization (justification of dishonest
actions). Such GONE theory is developed from the previous model, as the triangle fraud theory. Fraud
Triangle explains the three factors that are present in every situation of fraud which include Pressure,
Opportunity, Rationalization. Elemen GONE can be corresponded with perspective how the corruption as
a world wide problem that disproportionately affects those with the fewest personal, and economic
resources appear. Refer to the theoritical perspective, that the fraud triangle is considered inadequate to
explain the fraudulent behavior occur. Fraud is a multifaceted phenomenon, whose contextual factors may
not fit into a particular framework. Therefore, the fraud triangle should not be seen as a sufficiently
reliable model for antifraud's professionals (Lokanan, 2015). Further perspective extends the fraud
Triangle concept to GONE theory. Hence, for the fraud diamond model has been added with aspect
"capability" as the fourth element to complement the existing three elements, namely, pressure,
opportunity, and rationalization ( Wolfe and Hermanson, 2004; Albrecht, et al, 2012). Fraud diamond
model as explanatory model also has been developed (see Bologna, 1993) with GONE theory. In
accordance with this theory, the elements that cause fraud are stated, consits of, Greed, Opportunities,
Needs and Exposure (GONE)..
Human – Organizational Development: Ethical Intelligence
Human development to limit its corruption, and where the magnitude of such an effect of
corruption that appear is determined by contingent factors upon the conditions of national culture (see
Chenhall, 2004; Hofstede and Hofstede, 2005; Sims, et al, 2011; McLeod, 2013). Human development
and organizational development with ethical intelligence as coherence of concepts refers to post-
conventional level as Kohlberg’s stages moral development model (McLeod, 2013). This level consists of
first, as stages 5 of model, namely “social-contract orientation” since the world is viewed as holding
different opinions, rights, and values. This perspectives should be mutually respected as uniqueness and
The 1st International Forum Business and Economy (IFBE) 2019 Banjarmasin, 13-14 November 2019
193
harmony to each person, or with community, in line with organizational development with strategic,
technic, socio, and administrative (Albrecht, 1983;2002). Therefore, Laws are regarded as social contracts
rather than rigid edicts. Second, as stages 6, “universal ethical principal orientation”, which moral
reasoning is based on abstract reasoning using universal ethical principles. Generally, the chosen
principles are abstract rather than concrete and focus on ideas such as equality, dignity, or respect. Laws
are valid only insofar as they are grounded in justice, and a commitment to justice carries with it an
obligation to disobey unjust laws. People choose the ethical principles that they want to follow, and if
they violate those principles, they feel guilty (see Belohlavek, 2007; McLeod, 2013). This level as the
ultimate of complex stages of moral development. Based on stages of post-conventional individuals,
would elevate their own moral evaluation of a situation over social conventions, their behavior,
especially at stage universal ethical principal orientation. Although, some theorists have speculated that
many people may never reach this level of abstract moral reasoning. The theoretical framework approach
can be put forward through human development with ethical intelligence (Belohlavek, 2007; McLeod,
2013), in the context of organizational development (Albrecht, 1983; 2002). This is also in accordance
with the culture of accountability in building anti fraud, corruption policy and contingency plans of
organization (see Kelly, 2017).
Relation between human development and corruption is moderated by power distance
and individualism (Sims, et al, 2012). Hence, implication for policy making to reduce corruption can use
ethics as an intelligence that supports the capacity to adapt to the environment. As the research of human
evolution made by The Unicist Research Institute ( Belohlavek, 2007), this concept describes, for the
results that can be applied to future, to forecast in the individual, institutional and social fields. Ethical
intelligence is the basis for Individuals influence on the environment. As Human development with
intelligence levels, intelligence works, showed the use of 3 (three) layers to support human adaptive
behavior. These three layers can be described as: 1) Reactive Intelligence which has direct contact with
the environment. 2) Active Intelligence which sustains reactive intelligence when there is a need for a
planning process. 3) Ontointelligence which sustains active intelligence when the “apprehension” of the
essence of a certain reality is required (see Belohlavek, 2007). Such of types of ethical intelligence that is
used to enhance the integrity plans and integrity management systems in implement corruption prevention
(see Minkova, 2018). The role of individual ethical intelligence and organizational ethical intelligence can
be linked to prevent levels of corruption, be stated, consists of (i) individual ethical intelligence which is
formed by key attributes, such: social intelligence, emotional intelligence, cognitive intelligence, and
ethical maturity, and, (ii) organizational ethical intelligence is formed by attributes, such as:
organizational infrastructure, Human Resources Management, strategy, policies and procedures, ethical
climate (O’Donohue and Wickham, 2010, Weinstein, 2011). All of concept in ethical intelligence
perspective can be used as responsible of individual as member of organization for preventing, and
compliance of policies and to avoid fraud in form corruption (see AFA, 2018).
Perspective of Accountability Culture According to Ismail (2010), this aspect is related to contextual factors with external environment,
and culture, that may affect personal and organizational effort to implement corruption prevention an
local levels (Minkova, 2018). Human development to restricts corruption, hence, can be explained
through by the level of culture (Schein, 2014). The magnitude of such an effect is contingent upon the
underlying assumption. It can be justified within relationships between ultimate senses, of values and
action, and espoused beliefs and values, to create socio-technical control artefacts as financial control
structures and process to produce finanancial reports. Transform, from accountability level (Jeppesen,
2018) headed for culture accountability (see Khan, 2006 ) is needed to prevent condition of corruption
behavior that appear, and which impressed to have become culture refers the organization in national
culture (see Berry, 2009; Sims, et al, 2011; Schein, 2014).
The 1st International Forum Business and Economy (IFBE) 2019 Banjarmasin, 13-14 November 2019
194
We can theorize and view that different countries and different organisations will cause
different cultural characteristics. Culture can be grouped either as national or organisational culture.
Therefore, through this research we use contingency theory basic assumption that there is no universally
appropriate system applying equally to all organisations in all circumstances. Different cultural values
may influence the choice of system in organisations. Therefore, for taking the best manner to manage
fraud and corruption risks for country (Moritz, 2016), there is a need to examine the effectiveness of these
practices in different countries, including Indonesia and develop accountability culture (see Sousa and
Voss, 2008). As described, Hofstede and Hofstede (2005), the defined of culture as “the collective
programming of the mind which distinguishes the members of one category of people to those of
another”. Culture is classified into four categories, namely: power distance, individualism, masculinity,
and uncertainty avoidance. It was in line with proposition of levels of culture, as Schein (2014) has
described within relationships between underlying assumption, unconscious taken for granted beliefs,
perceptions, thoughts and feelings with level of espoused beliefs and values towards artifacts, as
something that visible in appearance but hard to be deciphed. Therefore, culture has meaning for
context of contingent, that if we can not enhancement for level of accountability headed for the culture
for accountability, it possible, that corruption as phenomenon would be appear to become the culture
strongly. Further, that culture represent as artifacts which can be viewed, and be argued. Finally, it can
help to explain some of the more seemingly incomprehensible and irrational aspects of what goes in
groups and organizations (Schein, 2014; Moritz, 2016; Kelly, 2017). Hence, as theoritical view, culture is
in line with ethical intelligence (Belohlavek, 2007) for human being context which has relation with
moral development (McLeod, 2013), refers to anti fraud and corruption policy, culture were formed
based on espoused values (Schein, 2014; ) that refer in fundamental public service values, which include,
accountability, integrity, efficiency, impartiality, honesty, loyalty, equity and delivering values (see
Kelly, 2017).
Contingent Theory: Level of Accountability Headed to Culture Accountability
Proposition of "level accountability" with financial reporting and financial audit as mechanism for
public sectors (see Mahsun, 2006; Bourn, 2007, Bastian, 2009; 2014; Jeppesen, 2018) headed to form
accountability culture (see Khan, 2006; Kelly, 2017), can be explained through by the agency theory
(Jensen and Meckling, 1976). It means that local government as agent has responsibilty to communicate a
mandate that is managed to stakeholders as the principals which are more than only compliance for laws
and regulations. This relationship explains the main thoughts related to "agency relationships". This
theory confirms the social contractual, universal ethics in moral development (Mc Leod, 2013) in
relationship between agent and principals, conflicts within the organization, and information of economic
value. This concept describes the attitude tendencies of behavior in specific actions to meet their own
interests such as Managerial opportunism (see GONE theory, with opportunity) which hinders the
prosperity of society on the main goals to be achieved by the organization.
Theoretical implications are used through the needs of organizations in implementing
reforms from upstream to downstream which includes reforms in the fields of planning and budgeting,
budget execution, treasury, revenue and payment systems, cash management, receivables, state property,
government obligations, accounting, reporting and accountability, inspection and control systems (Manao,
2009). Local government implementation report realizing refers to the accounting regulations (GAS,
2010) directed, which requires to achieve the level of usefulness of information in the decisions of users
(users) and reduce the imbalance of information or information asymmetry, conflicts in the form of moral
hazard and adverse selection, maintaining management and principal alignment, and a good governance
approach (Smith and Bushman, 2001; Scott, 2006; Bastian, 2009; Linda and Nuraini, 2011).
A level of accountability towards a culture of accountability is needed to meet the
objectives of good governance, such socio technical control artifact (Berry, et al, 2009). Also for the
development of human being in line within the organizational development, which they will deal with
The 1st International Forum Business and Economy (IFBE) 2019 Banjarmasin, 13-14 November 2019
195
stages of different levels of moral development (McLeod, 2013). It can be interpreted, with contingency
theory (Chenhall, 2003; 2008), that ethical intelligence (Belohlavek, 2007) and implementation
contingent factors, upon the contextual factors, such as human development with moral development
stages (McLeod, 2013), is to built pattern of organizational culture (Schein, 2014), and national culture
(see Sims , 2011), that will explain the accountability culture, and if this manner does not appear, it
would be related to tend corruption (seeSvensson, 2005; Kelly, 2017). Hence, contingent factors can be
linked with behavioral aspects to the affect of level of corruption which may well be accepted at the
adoption stage as antecedent, but they are not guaranteed to be relevant as explaining tool at the
implementation stage (Minkova, 2018). Furthermore, if applying only contingency theory, it may not be
adequate to fulfil explaination tool. This is because the implementation stage to enhance good
government governance with implement corruption prevention manner is more affected by organizational
factors rather than contextual factors. Moreover, in the current competitive environment, the relationships
between organizational culture and organizational and individual behavior are more complicated than
assumed by contingency theory. For review the theorizing of contingencies (Chenhall, 2008) in research,
as stated, there has been relatively little research on control and risk or upon control and culture. The
Contingency theory perspective explains how phenomena, such complexity of state financial control
structure and proccess are present at different times and places (see Chenhall, 2003; 2008;Berry, et al,
2009). Therefore, the nature of universality is needed present in line with the perspective of this theory.
Like a culture of accountability, with human and organizational development, with ethical intelligence,
which it depends on situational and conditional, at least for a country's culture (Segon, 2010; Sims,
2011). As Chenhall (2003;2007) asserted that there is no such "contingency theory", but 'rather a variety
of theories may be used to explain and predict the conditions', in which a particular system or technique
may increase the performance of the organization. Based on theories, this design of research model is
designed to fulfil requirement of contingent theories or of other existing theories with accountability
culture, although it is not to fulfil of all of the elements for the application for level of accountability.
Framework to Thought Process and Research Model Based on the description in the introduction and review of the literature which consists of a review
of theories and references to previous research, the framework for thought process is proposed. The
framework for thought process is as a theoretical and empirical review and its synthesis determine
variables of research and the basis developing hypotheses and analyze the discussion of research results.
Framework for thought process (see Imenda, 2014) which links theory with phenomena and uses
application theories, as contingent factors to fulfill design and implement corruption prevention model
for Indonesia Provinces Government, is presented in the following figure.
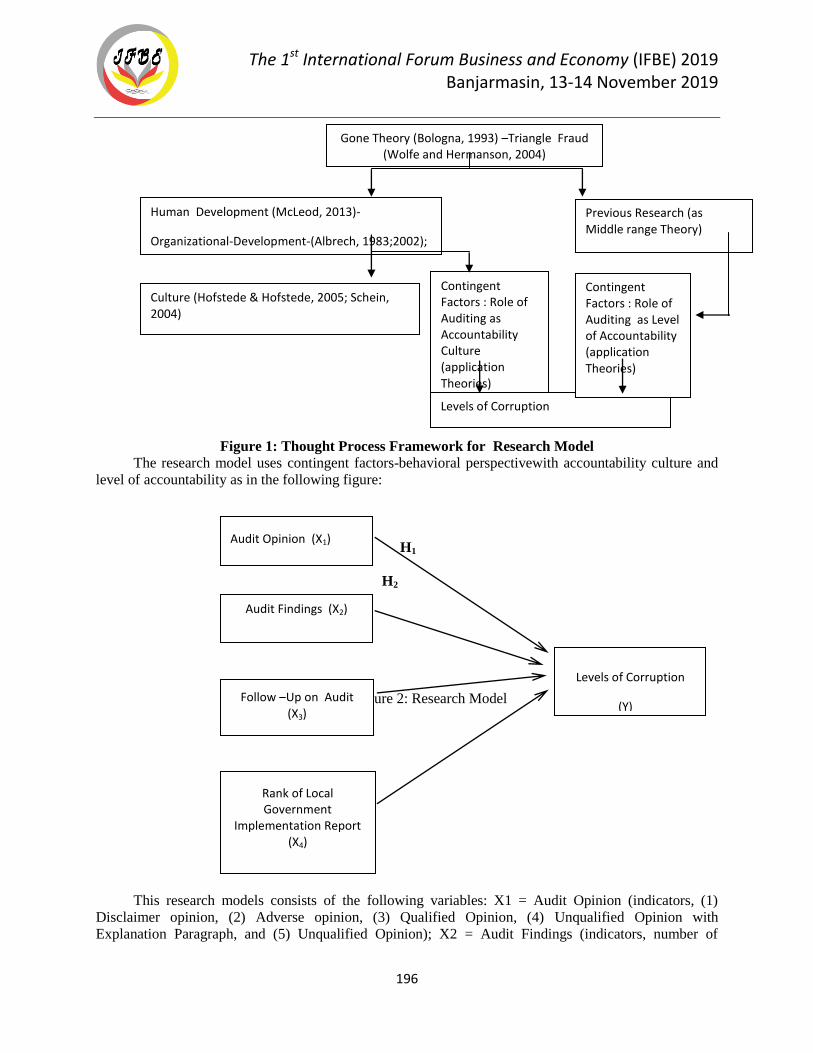
The 1st International Forum Business and Economy (IFBE) 2019 Banjarmasin, 13-14 November 2019
196
Figure 1: Thought Process Framework for Research Model
The research model uses contingent factors-behavioral perspectivewith accountability culture and
level of accountability as in the following figure:
H1
H2
H3
H4
Figure 2: Research Model
This research models consists of the following variables: X1 = Audit Opinion (indicators, (1)
Disclaimer opinion, (2) Adverse opinion, (3) Qualified Opinion, (4) Unqualified Opinion with
Explanation Paragraph, and (5) Unqualified Opinion); X2 = Audit Findings (indicators, number of
Gone Theory (Bologna, 1993) –Triangle Fraud (Wolfe and Hermanson, 2004)
Previous Research (as Middle range Theory)
Human Development (McLeod, 2013)-
Organizational-Development-(Albrech, 1983;2002); Ethical-Intelligence (Belohlavek, 2007)
Culture (Hofstede & Hofstede, 2005; Schein, 2004)
Contingent Factors : Role of Auditing as Accountability Culture (application Theories)
Levels of Corruption
Audit Opinion (X1)
Audit Findings (X2)
Levels of Corruption
(Y) Follow –Up on Audit
(X3)
Rank of Local Government
Implementation Report (X4)
Contingent Factors : Role of Auditing as Level of Accountability (application Theories)
The 1st International Forum Business and Economy (IFBE) 2019 Banjarmasin, 13-14 November 2019
197
findings on SPI weaknesses and non-compliance with regulations and by law), X3 = Follow-up on Audit
(indicators, Number of recommendations that have been followed up in accordance with
recommendations / total number of recommendations); X4 = Local Government Implementation Report
(indicators, Ranking of Local Government Implementation Reports for Provincial governments); Y =
Level of Corruption, the research hypothesis is proposed (indicators, Number of handling cases of
corruption in the Indonesian Attorney General).
Hypothesis Development Based on the theoretical view, the though process framework <IR> and research model, supported
by previous related studies, the following hypotheses (Ho 1- Ho 4) are presented, as follows:
An audit opinion on the level of corruption in local government
Research Rini &Liska (2017) examination of financial statements conducted to provide an
opinion opinion / opinion on the fairness of financial information presented in the financial statements.
Research by Masyitoh, et al (2015), Husna, et al (2017) shows that audit opinion has a negative effect on
the perception of corruption. The better the audit opinion obtained shows the lower the potential for
corruption in the local government environment (Rai, 2010). Empirical fact that the audit opinion variable
negatively influences the perception of corruption (Afif, 2014; Tehupuring, 2018). In contrast to previous
research by Utomo, et al (2018), that partially audit opinion variables have a positive effect on the level of
corruption that occurs in institutions / ministries in Indonesia.Therefore, the hypothesis in this study was
formulated as follows:H01: Audit opinion has no affect towards the level of corruption.
Audit findings on the level of corruption in local government
Audit findings are important (material) problems that were discovered during the audit and these
issues are appropriate to be raised and communicated with the entity being audited because they have an
impact on the improvement and improvement of work-economy, efficiency, and effectiveness of the
audited entity (Rai, 2010). Some previous research which has coherence with hypothesis (H02), such as:
Masyitoh, et al, (2015); Rini and Liska (2017), give empirical fatcs, that audit findings do not affect the
level of corruption. Meanwhile, empirical fact (Rosyadi and Budding, 2017) that shows irregularities
found by BPKP fraud audit influences the level of corruption in the Indonesia Provinces. Therefore, the
hypothesis in this study was formulated as follows:
H02: Audit findings do not have affect towards the level of corruption
Follow-up on audit of the level of corruption in local government
The importance of the follow-up to the audit is mentioned in articles 20 and 21 of Law Number 15
Year 2015 concerning the Audit of State Financial Management and Responsibility. Both articles regulate
penalties and fines for parties who do not follow up on the auditor's recommendation. Follow-up audit is
the step that must be taken by the auditor after the audit report submitted by the auditee. Audit follow-up
is an activity to identify and document the progress of the auditee in implementing audit
recommendations (Rai, 2010). The previous research which has coherence with hypothesis (H3), such as
empiric fact that the next action for the result of audit influences negative to the level of corruption
(Masyitoh, et al, 2015; Rini and Liska,2017). Therefore, the hypothesis in this study was formulated as
follows:H03: Follow-up on audits do not have affect to the level of corruption.
Rank of Local Government Implementation Report on the level of corruption in local
government
Previous research Heriningsih (2015) assessed that the high IKK index indicates the effective and
efficient performance of local government (LPPD) which associated with corruption. If the IKK index
results are good, the level of corruption will be low. The evaluation of LPPD is in the form of score, rank
and performance status. Therefore, the hypothesis in this study is formulated as follows:
The 1st International Forum Business and Economy (IFBE) 2019 Banjarmasin, 13-14 November 2019
198
H04: Rank of Local Government Implementation Report does not have influences towards levels
of corruption.
METHOD
Research Design
This research is a quantitative research, as Quantitative Approach to Social Research (Neuman,
2014). Contingent factors are derived from the behavior approach, as measurers by cross sectional of the
phenomenon for the levels of corruption, by using multiple linear regression model to analyze the
measurement data, with secondary data to analyze the effect of audit opinion, audit findings, follow-up
on audits, and rank of local government implementation report towards the level of corruption in
Indonesia for the 2014 and 2015 as observation periods. The research also used qualitative approaches,
and amethodical manner with interpretation results of research in using logic intervention of behavioral
aspects to develop the role model of behavior approaches in preventing corruption.
Unit of analysis
The unit of analysis used in this study is the Summary of Semester Examination Results (IHPS)
from the Indonesian Supreme Audit Board and list of the recapitulation of provincial government
corruption cases in Indonesia by the Attorney General's Office of the Republic of Indonesia nationally for
2014 and 2015.
Population and Sample
Population of Provincial governments in Indonesia for the period of 2014 and 2015 with a total of
34 provinces is 60 samples because 4 provinces are still new that they have not been able to report
opinions and assessments. The population in this study is based on the number of provinces according to
observations. Sampling refers to Masyitoh, et al (2015), namely purposive sampling with sample
selection criteria, as follows:a. Provincial governments that received opinions from BPK RI in 2014 and
2015; b. The provincial government which has audit findings data in the form of weaknesses in the
internal control system and non-compliance with regulations in 2014 and 2015; c. Provincial governments
that have “inspection Reports” are follow-up reports on audit results in the form of auditor
recommendations in 2014 and 2015; d. The provincial government is included in the list of ratings /
scores of regional government implementation determined by the Ministry of Home Affairs in 2014 and
2015; e. Provincial governments included in the ranking list of recapitulation of corruption cases by the
Indonesian Attorney General's Office in 2014 and 2015.
Table 1.
Sampling Criteria
No Description Amount
1 Amount of Provincial Governments in Indonesia 34
2 Multiplied by number of years ( 2) 68
3 Provincial Governments that cannot obtain for LGIR (2
Years) 8
4 Number of cases to be sampled 60
Source: Data processed (2019)
Samples that have data completeness criteria used in this study are 34 provinces with research data
in 2014 and 2015. Because there are 4 (four) provinces that do not get opinions from BPK and new
provinces that have not been recorded in 2014 and 2015. Samples will be grouped into the part of the
province that receives Unqualified opinions, Qualified opinions, Disclaimer, and Adverse opinions.
Then they are added to the sample level of corruption in the province in the form of the number of cases
that occur.
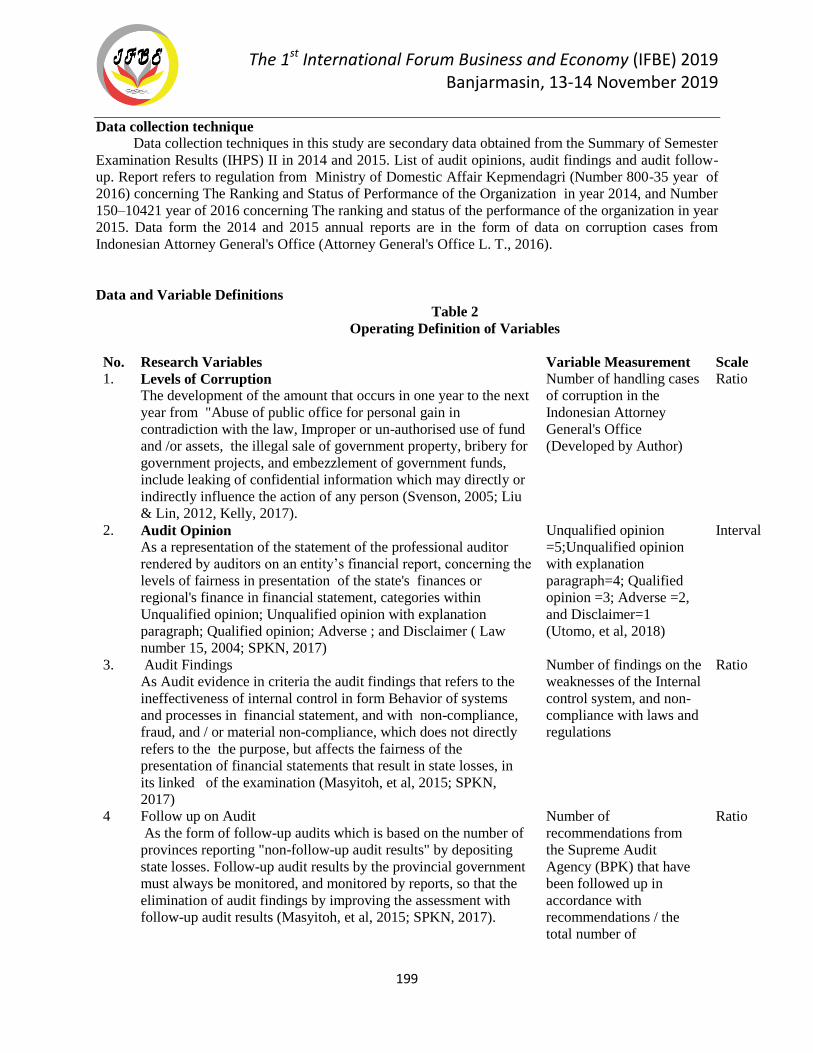
The 1st International Forum Business and Economy (IFBE) 2019 Banjarmasin, 13-14 November 2019
199
Data collection technique Data collection techniques in this study are secondary data obtained from the Summary of Semester
Examination Results (IHPS) II in 2014 and 2015. List of audit opinions, audit findings and audit follow-
up. Report refers to regulation from Ministry of Domestic Affair Kepmendagri (Number 800-35 year of
2016) concerning The Ranking and Status of Performance of the Organization in year 2014, and Number
150–10421 year of 2016 concerning The ranking and status of the performance of the organization in year
2015. Data form the 2014 and 2015 annual reports are in the form of data on corruption cases from
Indonesian Attorney General's Office (Attorney General's Office L. T., 2016).
Data and Variable Definitions
Table 2
Operating Definition of Variables
No. Research Variables Variable Measurement Scale 1. Levels of Corruption
The development of the amount that occurs in one year to the next
year from "Abuse of public office for personal gain in
contradiction with the law, Improper or un-authorised use of fund
and /or assets, the illegal sale of government property, bribery for
government projects, and embezzlement of government funds,
include leaking of confidential information which may directly or
indirectly influence the action of any person (Svenson, 2005; Liu
& Lin, 2012, Kelly, 2017).
Number of handling cases
of corruption in the
Indonesian Attorney
General's Office
(Developed by Author)
Ratio
2. Audit Opinion
As a representation of the statement of the professional auditor
rendered by auditors on an entity’s financial report, concerning the
levels of fairness in presentation of the state's finances or
regional's finance in financial statement, categories within
Unqualified opinion; Unqualified opinion with explanation
paragraph; Qualified opinion; Adverse ; and Disclaimer ( Law
number 15, 2004; SPKN, 2017)
Unqualified opinion
=5;Unqualified opinion
with explanation
paragraph=4; Qualified
opinion =3; Adverse =2,
and Disclaimer=1
(Utomo, et al, 2018)
Interval
3. Audit Findings
As Audit evidence in criteria the audit findings that refers to the
ineffectiveness of internal control in form Behavior of systems
and processes in financial statement, and with non-compliance,
fraud, and / or material non-compliance, which does not directly
refers to the the purpose, but affects the fairness of the
presentation of financial statements that result in state losses, in
its linked of the examination (Masyitoh, et al, 2015; SPKN,
2017)
Number of findings on the
weaknesses of the Internal
control system, and non-
compliance with laws and
regulations
Ratio
4 Follow up on Audit
As the form of follow-up audits which is based on the number of
provinces reporting "non-follow-up audit results" by depositing
state losses. Follow-up audit results by the provincial government
must always be monitored, and monitored by reports, so that the
elimination of audit findings by improving the assessment with
follow-up audit results (Masyitoh, et al, 2015; SPKN, 2017).
Number of
recommendations from
the Supreme Audit
Agency (BPK) that have
been followed up in
accordance with
recommendations / the
total number of
Ratio
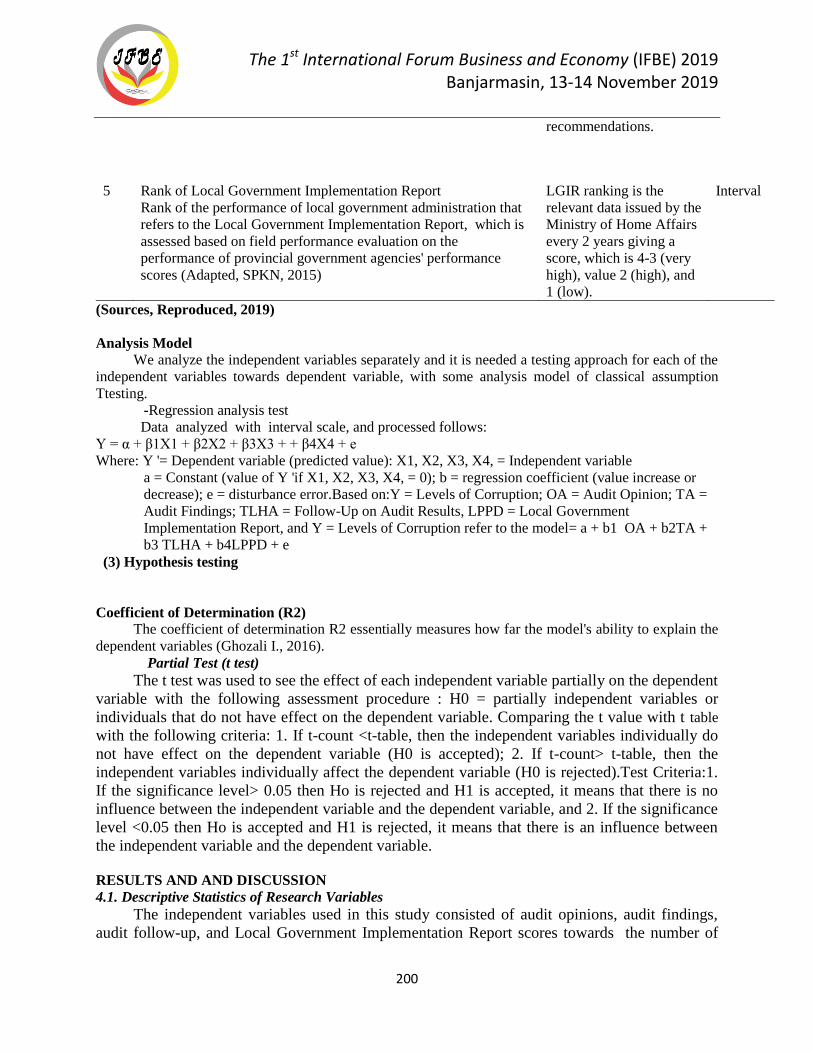
The 1st International Forum Business and Economy (IFBE) 2019 Banjarmasin, 13-14 November 2019
200
recommendations.
5 Rank of Local Government Implementation Report
Rank of the performance of local government administration that
refers to the Local Government Implementation Report, which is
assessed based on field performance evaluation on the
performance of provincial government agencies' performance
scores (Adapted, SPKN, 2015)
LGIR ranking is the
relevant data issued by the
Ministry of Home Affairs
every 2 years giving a
score, which is 4-3 (very
high), value 2 (high), and
1 (low).
Interval
(Sources, Reproduced, 2019)
Analysis Model
We analyze the independent variables separately and it is needed a testing approach for each of the
independent variables towards dependent variable, with some analysis model of classical assumption
Ttesting.
-Regression analysis test
Data analyzed with interval scale, and processed follows:
Y = α + β1X1 + β2X2 + β3X3 + + β4X4 + e
Where: Y '= Dependent variable (predicted value): X1, X2, X3, X4, = Independent variable
a = Constant (value of Y 'if X1, X2, X3, X4, = 0); b = regression coefficient (value increase or
decrease); e = disturbance error.Based on:Y = Levels of Corruption; OA = Audit Opinion; TA =
Audit Findings; TLHA = Follow-Up on Audit Results, LPPD = Local Government
Implementation Report, and Y = Levels of Corruption refer to the model= a + b1 OA + b2TA +
b3 TLHA + b4LPPD + e
(3) Hypothesis testing
Coefficient of Determination (R2)
The coefficient of determination R2 essentially measures how far the model's ability to explain the
dependent variables (Ghozali I., 2016).
Partial Test (t test)
The t test was used to see the effect of each independent variable partially on the dependent
variable with the following assessment procedure : H0 = partially independent variables or
individuals that do not have effect on the dependent variable. Comparing the t value with t table
with the following criteria: 1. If t-count <t-table, then the independent variables individually do
not have effect on the dependent variable (H0 is accepted); 2. If t-count> t-table, then the
independent variables individually affect the dependent variable (H0 is rejected).Test Criteria:1.
If the significance level> 0.05 then Ho is rejected and H1 is accepted, it means that there is no
influence between the independent variable and the dependent variable, and 2. If the significance
level <0.05 then Ho is accepted and H1 is rejected, it means that there is an influence between
the independent variable and the dependent variable.
RESULTS AND AND DISCUSSION
4.1. Descriptive Statistics of Research Variables
The independent variables used in this study consisted of audit opinions, audit findings,
audit follow-up, and Local Government Implementation Report scores towards the number of
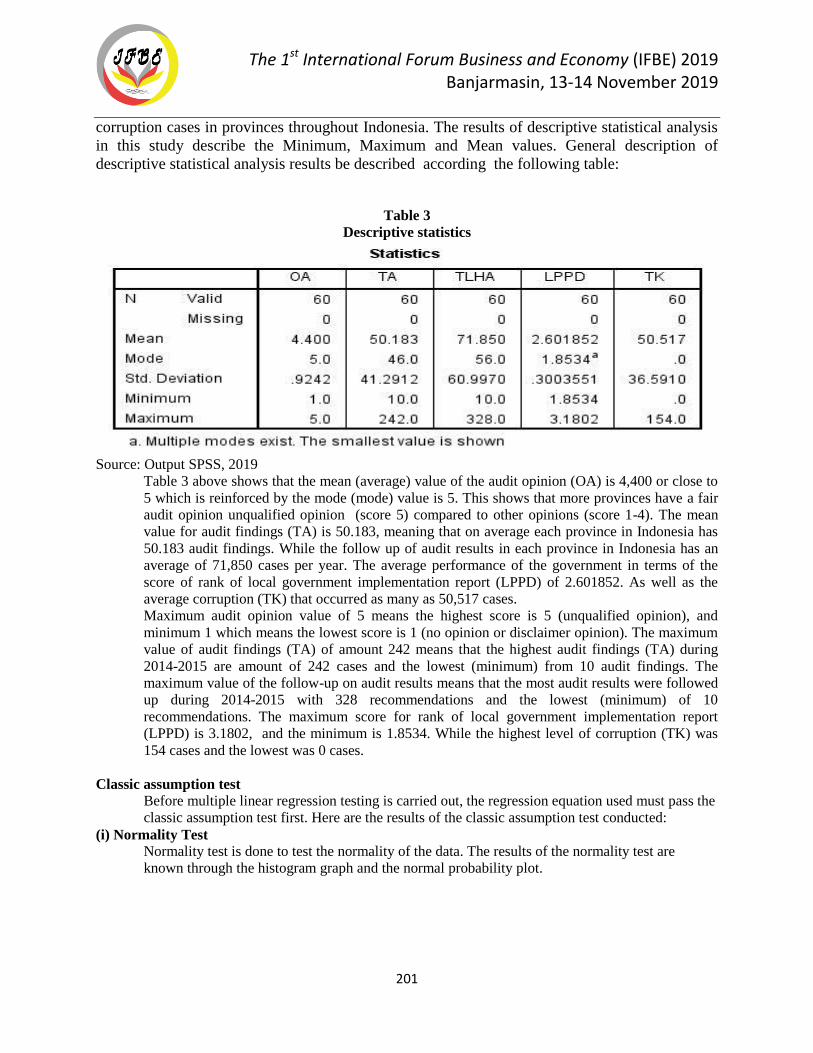
The 1st International Forum Business and Economy (IFBE) 2019 Banjarmasin, 13-14 November 2019
201
corruption cases in provinces throughout Indonesia. The results of descriptive statistical analysis
in this study describe the Minimum, Maximum and Mean values. General description of
descriptive statistical analysis results be described according the following table:
Table 3
Descriptive statistics
Source: Output SPSS, 2019
Table 3 above shows that the mean (average) value of the audit opinion (OA) is 4,400 or close to
5 which is reinforced by the mode (mode) value is 5. This shows that more provinces have a fair
audit opinion unqualified opinion (score 5) compared to other opinions (score 1-4). The mean
value for audit findings (TA) is 50.183, meaning that on average each province in Indonesia has
50.183 audit findings. While the follow up of audit results in each province in Indonesia has an
average of 71,850 cases per year. The average performance of the government in terms of the
score of rank of local government implementation report (LPPD) of 2.601852. As well as the
average corruption (TK) that occurred as many as 50,517 cases.
Maximum audit opinion value of 5 means the highest score is 5 (unqualified opinion), and
minimum 1 which means the lowest score is 1 (no opinion or disclaimer opinion). The maximum
value of audit findings (TA) of amount 242 means that the highest audit findings (TA) during
2014-2015 are amount of 242 cases and the lowest (minimum) from 10 audit findings. The
maximum value of the follow-up on audit results means that the most audit results were followed
up during 2014-2015 with 328 recommendations and the lowest (minimum) of 10
recommendations. The maximum score for rank of local government implementation report
(LPPD) is 3.1802, and the minimum is 1.8534. While the highest level of corruption (TK) was
154 cases and the lowest was 0 cases.
Classic assumption test
Before multiple linear regression testing is carried out, the regression equation used must pass the
classic assumption test first. Here are the results of the classic assumption test conducted:
(i) Normality Test
Normality test is done to test the normality of the data. The results of the normality test are
known through the histogram graph and the normal probability plot.
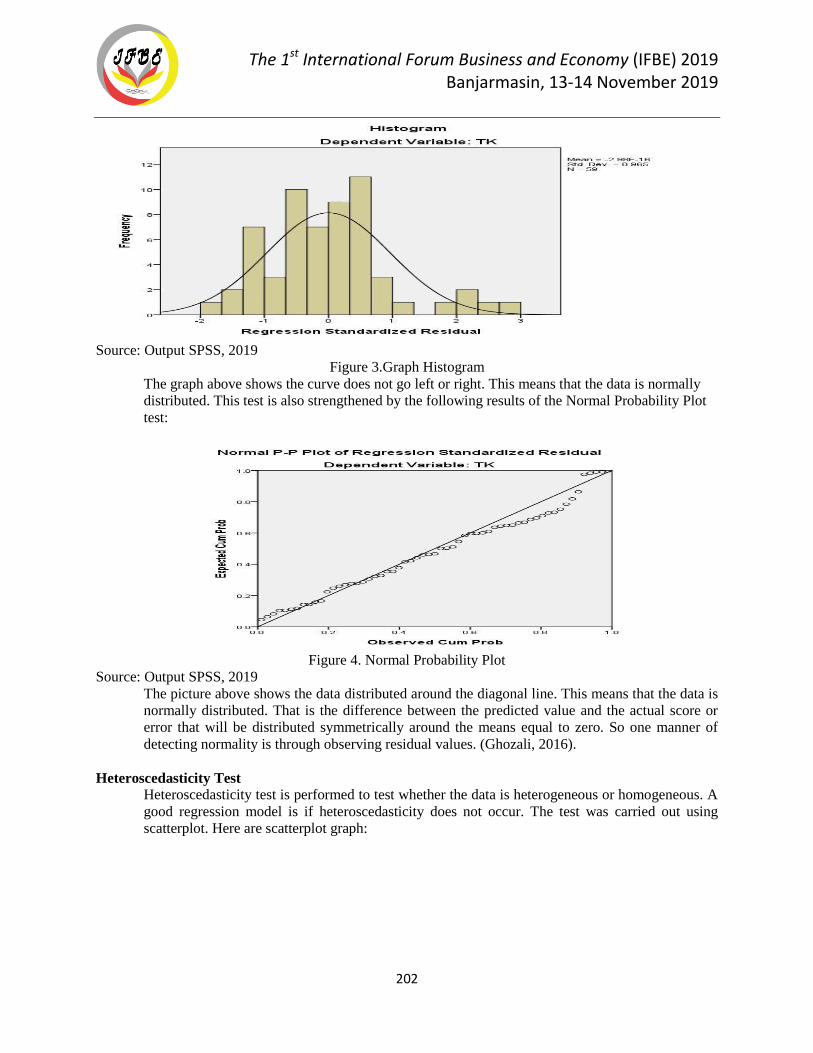
The 1st International Forum Business and Economy (IFBE) 2019 Banjarmasin, 13-14 November 2019
202
Source: Output SPSS, 2019
Figure 3.Graph Histogram
The graph above shows the curve does not go left or right. This means that the data is normally
distributed. This test is also strengthened by the following results of the Normal Probability Plot
test:
Figure 4. Normal Probability Plot
Source: Output SPSS, 2019
The picture above shows the data distributed around the diagonal line. This means that the data is
normally distributed. That is the difference between the predicted value and the actual score or
error that will be distributed symmetrically around the means equal to zero. So one manner of
detecting normality is through observing residual values. (Ghozali, 2016).
Heteroscedasticity Test
Heteroscedasticity test is performed to test whether the data is heterogeneous or homogeneous. A
good regression model is if heteroscedasticity does not occur. The test was carried out using
scatterplot. Here are scatterplot graph:
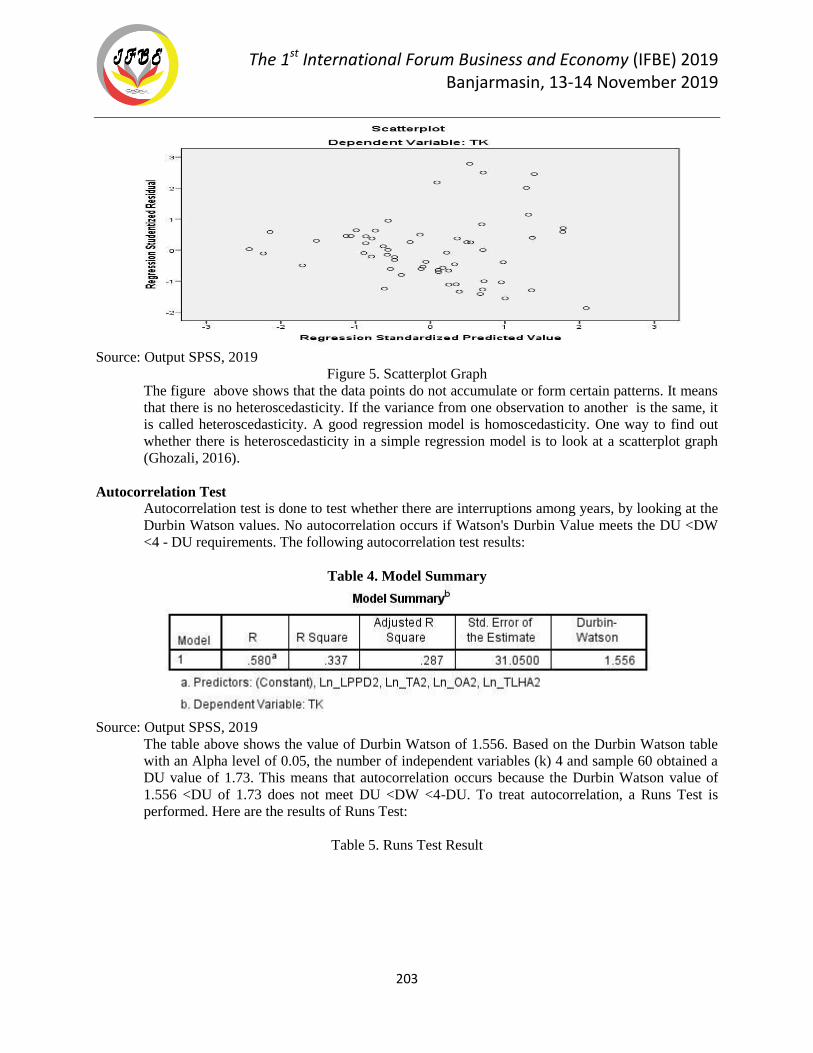
The 1st International Forum Business and Economy (IFBE) 2019 Banjarmasin, 13-14 November 2019
203
Source: Output SPSS, 2019
Figure 5. Scatterplot Graph
The figure above shows that the data points do not accumulate or form certain patterns. It means
that there is no heteroscedasticity. If the variance from one observation to another is the same, it
is called heteroscedasticity. A good regression model is homoscedasticity. One way to find out
whether there is heteroscedasticity in a simple regression model is to look at a scatterplot graph
(Ghozali, 2016).
Autocorrelation Test
Autocorrelation test is done to test whether there are interruptions among years, by looking at the
Durbin Watson values. No autocorrelation occurs if Watson's Durbin Value meets the DU <DW
<4 - DU requirements. The following autocorrelation test results:
Table 4. Model Summary
Source: Output SPSS, 2019
The table above shows the value of Durbin Watson of 1.556. Based on the Durbin Watson table
with an Alpha level of 0.05, the number of independent variables (k) 4 and sample 60 obtained a
DU value of 1.73. This means that autocorrelation occurs because the Durbin Watson value of
1.556 <DU of 1.73 does not meet DU <DW <4-DU. To treat autocorrelation, a Runs Test is
performed. Here are the results of Runs Test:
Table 5. Runs Test Result
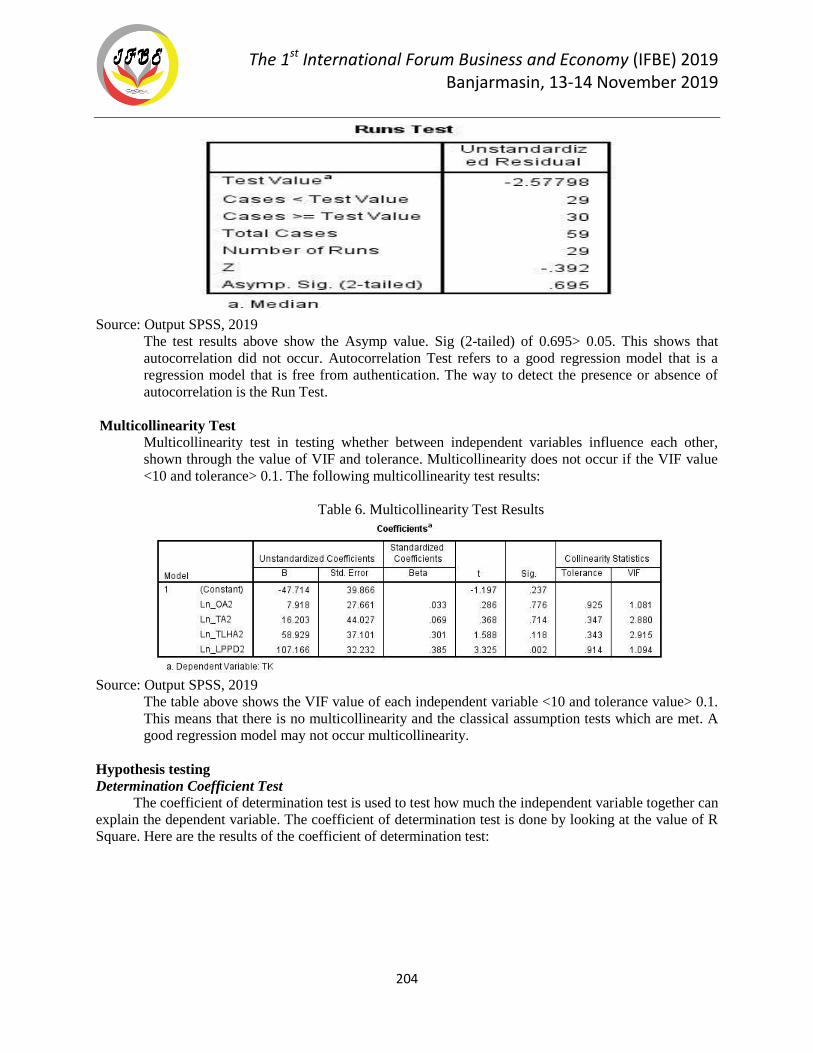
The 1st International Forum Business and Economy (IFBE) 2019 Banjarmasin, 13-14 November 2019
204
Source: Output SPSS, 2019
The test results above show the Asymp value. Sig (2-tailed) of 0.695> 0.05. This shows that
autocorrelation did not occur. Autocorrelation Test refers to a good regression model that is a
regression model that is free from authentication. The way to detect the presence or absence of
autocorrelation is the Run Test.
Multicollinearity Test
Multicollinearity test in testing whether between independent variables influence each other,
shown through the value of VIF and tolerance. Multicollinearity does not occur if the VIF value
<10 and tolerance> 0.1. The following multicollinearity test results:
Table 6. Multicollinearity Test Results
Source: Output SPSS, 2019
The table above shows the VIF value of each independent variable <10 and tolerance value> 0.1.
This means that there is no multicollinearity and the classical assumption tests which are met. A
good regression model may not occur multicollinearity.
Hypothesis testing
Determination Coefficient Test
The coefficient of determination test is used to test how much the independent variable together can
explain the dependent variable. The coefficient of determination test is done by looking at the value of R
Square. Here are the results of the coefficient of determination test:
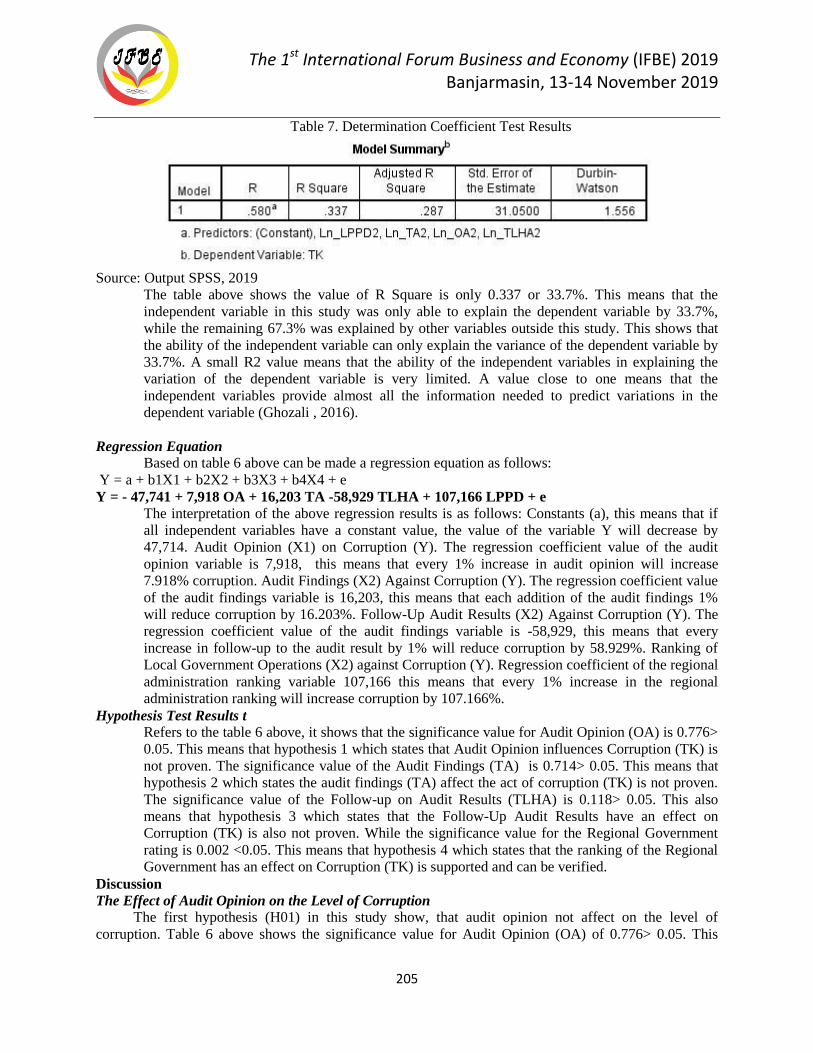
The 1st International Forum Business and Economy (IFBE) 2019 Banjarmasin, 13-14 November 2019
205
Table 7. Determination Coefficient Test Results
Source: Output SPSS, 2019
The table above shows the value of R Square is only 0.337 or 33.7%. This means that the
independent variable in this study was only able to explain the dependent variable by 33.7%,
while the remaining 67.3% was explained by other variables outside this study. This shows that
the ability of the independent variable can only explain the variance of the dependent variable by
33.7%. A small R2 value means that the ability of the independent variables in explaining the
variation of the dependent variable is very limited. A value close to one means that the
independent variables provide almost all the information needed to predict variations in the
dependent variable (Ghozali , 2016).
Regression Equation
Based on table 6 above can be made a regression equation as follows:
Y = a + b1X1 + b2X2 + b3X3 + b4X4 + e
Y = - 47,741 + 7,918 OA + 16,203 TA -58,929 TLHA + 107,166 LPPD + e
The interpretation of the above regression results is as follows: Constants (a), this means that if
all independent variables have a constant value, the value of the variable Y will decrease by
47,714. Audit Opinion (X1) on Corruption (Y). The regression coefficient value of the audit
opinion variable is 7,918, this means that every 1% increase in audit opinion will increase
7.918% corruption. Audit Findings (X2) Against Corruption (Y). The regression coefficient value
of the audit findings variable is 16,203, this means that each addition of the audit findings 1%
will reduce corruption by 16.203%. Follow-Up Audit Results (X2) Against Corruption (Y). The
regression coefficient value of the audit findings variable is -58,929, this means that every
increase in follow-up to the audit result by 1% will reduce corruption by 58.929%. Ranking of
Local Government Operations (X2) against Corruption (Y). Regression coefficient of the regional
administration ranking variable 107,166 this means that every 1% increase in the regional
administration ranking will increase corruption by 107.166%.
Hypothesis Test Results t
Refers to the table 6 above, it shows that the significance value for Audit Opinion (OA) is 0.776>
0.05. This means that hypothesis 1 which states that Audit Opinion influences Corruption (TK) is
not proven. The significance value of the Audit Findings (TA) is 0.714> 0.05. This means that
hypothesis 2 which states the audit findings (TA) affect the act of corruption (TK) is not proven.
The significance value of the Follow-up on Audit Results (TLHA) is 0.118> 0.05. This also
means that hypothesis 3 which states that the Follow-Up Audit Results have an effect on
Corruption (TK) is also not proven. While the significance value for the Regional Government
rating is 0.002 <0.05. This means that hypothesis 4 which states that the ranking of the Regional
Government has an effect on Corruption (TK) is supported and can be verified.
Discussion
The Effect of Audit Opinion on the Level of Corruption
The first hypothesis (H01) in this study show, that audit opinion not affect on the level of
corruption. Table 6 above shows the significance value for Audit Opinion (OA) of 0.776> 0.05. This
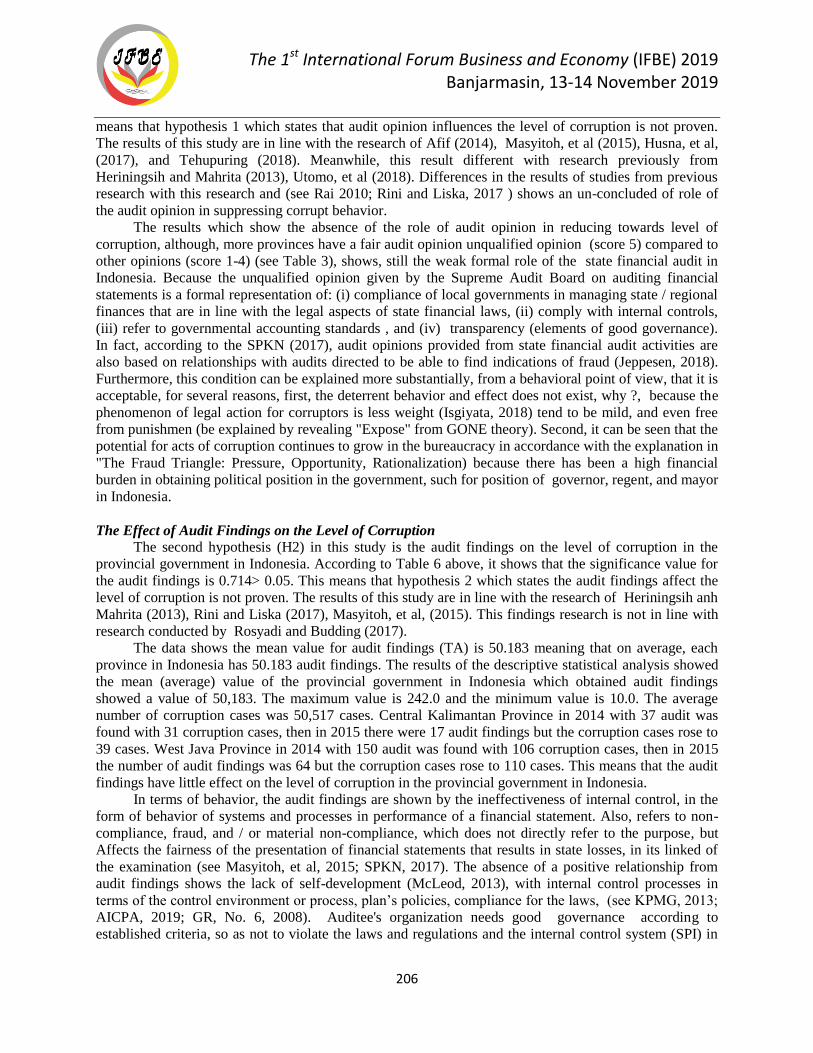
The 1st International Forum Business and Economy (IFBE) 2019 Banjarmasin, 13-14 November 2019
206
means that hypothesis 1 which states that audit opinion influences the level of corruption is not proven.
The results of this study are in line with the research of Afif (2014), Masyitoh, et al (2015), Husna, et al,
(2017), and Tehupuring (2018). Meanwhile, this result different with research previously from
Heriningsih and Mahrita (2013), Utomo, et al (2018). Differences in the results of studies from previous
research with this research and (see Rai 2010; Rini and Liska, 2017 ) shows an un-concluded of role of
the audit opinion in suppressing corrupt behavior.
The results which show the absence of the role of audit opinion in reducing towards level of
corruption, although, more provinces have a fair audit opinion unqualified opinion (score 5) compared to
other opinions (score 1-4) (see Table 3), shows, still the weak formal role of the state financial audit in
Indonesia. Because the unqualified opinion given by the Supreme Audit Board on auditing financial
statements is a formal representation of: (i) compliance of local governments in managing state / regional
finances that are in line with the legal aspects of state financial laws, (ii) comply with internal controls,
(iii) refer to governmental accounting standards , and (iv) transparency (elements of good governance).
In fact, according to the SPKN (2017), audit opinions provided from state financial audit activities are
also based on relationships with audits directed to be able to find indications of fraud (Jeppesen, 2018).
Furthermore, this condition can be explained more substantially, from a behavioral point of view, that it is
acceptable, for several reasons, first, the deterrent behavior and effect does not exist, why ?, because the
phenomenon of legal action for corruptors is less weight (Isgiyata, 2018) tend to be mild, and even free
from punishmen (be explained by revealing "Expose" from GONE theory). Second, it can be seen that the
potential for acts of corruption continues to grow in the bureaucracy in accordance with the explanation in
"The Fraud Triangle: Pressure, Opportunity, Rationalization) because there has been a high financial
burden in obtaining political position in the government, such for position of governor, regent, and mayor
in Indonesia.
The Effect of Audit Findings on the Level of Corruption
The second hypothesis (H2) in this study is the audit findings on the level of corruption in the
provincial government in Indonesia. According to Table 6 above, it shows that the significance value for
the audit findings is 0.714> 0.05. This means that hypothesis 2 which states the audit findings affect the
level of corruption is not proven. The results of this study are in line with the research of Heriningsih anh
Mahrita (2013), Rini and Liska (2017), Masyitoh, et al, (2015). This findings research is not in line with
research conducted by Rosyadi and Budding (2017).
The data shows the mean value for audit findings (TA) is 50.183 meaning that on average, each
province in Indonesia has 50.183 audit findings. The results of the descriptive statistical analysis showed
the mean (average) value of the provincial government in Indonesia which obtained audit findings
showed a value of 50,183. The maximum value is 242.0 and the minimum value is 10.0. The average
number of corruption cases was 50,517 cases. Central Kalimantan Province in 2014 with 37 audit was
found with 31 corruption cases, then in 2015 there were 17 audit findings but the corruption cases rose to
39 cases. West Java Province in 2014 with 150 audit was found with 106 corruption cases, then in 2015
the number of audit findings was 64 but the corruption cases rose to 110 cases. This means that the audit
findings have little effect on the level of corruption in the provincial government in Indonesia.
In terms of behavior, the audit findings are shown by the ineffectiveness of internal control, in the
form of behavior of systems and processes in performance of a financial statement. Also, refers to non-
compliance, fraud, and / or material non-compliance, which does not directly refer to the purpose, but
Affects the fairness of the presentation of financial statements that results in state losses, in its linked of
the examination (see Masyitoh, et al, 2015; SPKN, 2017). The absence of a positive relationship from
audit findings shows the lack of self-development (McLeod, 2013), with internal control processes in
terms of the control environment or process, plan’s policies, compliance for the laws, (see KPMG, 2013;
AICPA, 2019; GR, No. 6, 2008). Auditee's organization needs good governance according to
established criteria, so as not to violate the laws and regulations and the internal control system (SPI) in
The 1st International Forum Business and Economy (IFBE) 2019 Banjarmasin, 13-14 November 2019
207
matter the audit findings (see Masyitoh, et al, 2015). The audit findings must be followed up by the
auditee in accordance with the identification recommended by the auditor (SPKN, 2017). Further, these
findings can be classified as fraud in corruption as intended, when there has been caused for violating
state financial laws. Although corruption and audit Evidence (Khan, 2006) can be described, the auditors
should remain aware of the limitations of their professional work with financial audit.
Audit findings refers to the problem characteristics refers to internal control systems in
accounting, and with non-compliance for laws and regulations that affect the fairness of the presentation
of financial statements that result in state losses (SPKN,2017; Masyitoh, et al, 2015). It was appeared due
to the behavior, in moral development of human with systems and processes, such in internal control or
information technology systems or entities in reporting systems (see Musa, et al, 2012; McLeod, 2013).
The value of government organizations with bureaucratic control has a typical managerial control in
organizations, with characteristics referring to the formal level, standards, khirarki, and legitimate
authority (Hifni, 2017). Hence, It needs to fulfil works best manner where tasks are certain for human that
are independent with social contract, universal ethics as accountability culture (Khan, 2006; McLeod,
2013).
Effect of Follow-Up on Audit Results Against the Level of Corruption
The third hypothesis (H3) in this study is the follow up on audit findings on the level of corruption
in the provincial government in Indonesia. Table 6 above shows that the significance value for the follow-
up of audit results is 0.118> 0.05. This means that hypothesis 3 which states that the follow-up of audit
results has an effect on the level of corruption is not proven. The results of this study are in line with
research by Masyitoh, et al (2015), but they are not in line with research conducted by Heriningsih &
Mahrita (2013) and Utomo, et al (2018). The importance of the follow-up to the audit is mentioned in
articles 20 and 21 of Law Number 15 Year 2015 concerning the Audit of State Financial Management
and Responsibility. Both articles regulate penalties and fines for parties who do not follow up on the
auditor's recommendation. Follow-up on audit is the steps that must be taken by the auditor after the audit
report submitted by the auditee. Audit follow-up is an activity to identify and document the progress of
the auditee in implementing audit recommendations (Rai, 2010). Audit follow-up is the steps that must be
taken by the auditor after the audit report is submitted to the auditee with the aim of improving planning
and evaluating performance. The communication of audit findings serves as a medium between the
auditor and the auditee, namely the agency the government in updating information and explanations to
auditors (Rai, 2010).Masyitoh, et al (2015) in implementing the auditor's recommendations. The
provincial government has tried to correct mistakes in the accountability of state administration to create
public financial accountability.
Refers to the results of the descriptive statistical analysis showed the mean (average) of the
provincial government in Indonesia that followed up on the audit results showing a value of 71,850. The
maximum value is 328.0 and the minimum value is 10.0. The average number of corruption cases was
50,517 cases. In 2014, DKI Jakarta Province followed up with 326 recommended with 34 cases of
corruption, then in 2015 there were 317 followed up but 34 cases of corruption remained. In the province
of West Nusa Tenggara in 2014, there were 112 follow-up cases that were recommended with 25 cases of
corruption, then in 2015 there were 62 follow-up cases, but the corruption cases rose to 36 cases. This
means that even though the audit follow-up has little effect on the level of corruption in the provincial
government in Indonesia, it is needed to view Behavioral aspects that are applied in explaining the
phenomenon of follow-up on audit findings. First, the form of follow-up audits is based on the number of
provinces reporting "non-follow-up audit results" by depositing state losses. Follow-up audit results by
the provincial government must always be monitored and monitored by reports, so that the elimination of
audit findings is improving the assessment with follow-up audit results (Masyitoh, et al, 2015; SPKN,
2017). Second, for the manager of organizational reporting, it requires a perspective of self-development
through post conventional morality to internalize behavior driven by the mind of social order and
individual right and to fulfill the values of universal ethics in the form of behavior driven by internal
The 1st International Forum Business and Economy (IFBE) 2019 Banjarmasin, 13-14 November 2019
208
moral principles (see Belohlavek, 2007; McLeod, 2013). This will provide (in theory) an effort to
suppress the Number of recommendations from the Supreme Audit Agency (BPK) that has been followed
up in accordance with recommendations / the total number of recommendations.
Effect of Ranking of Local Government Operations on the Level of Corruption
The fourth hypothesis (H4) in this study is Rank of Local Government implementation report
(LGIR) on the level of corruption in the Indonesian provincial government. Table 6 above shows that the
significance value for the regional administration ranking is 0.002 <0.05. This means that hypothesis 4
which states the ranking of the administration of local government that influences the level of corruption
is supported. The results of this study are not in line with research conducted by Heriningsih & Mahrita
(2013).
The results of the descriptive statistical analysis showed the mean (average) of the provincial
government in Indonesia that got the LGIR score indicating a value of 2.601852. The maximum value is
3.1802 and the minimum value is 1.8534. The average number of corruption cases was 50,517 cases. The
performance evaluation of the implementation of local government which received a very high predicate
by LGIR. The average occurrence of corruption cases was also high, for example Central Java Province
obtained a score in 2014 of 2.9359 with a Very High Performance Score (ST) of corruption cases with 92
cases, and in 2015 a performance score of 3.0539 with a very high performance score (ST) of corruption
cases with a total of 154 cases. East Java Province in 2014 with a value of 3.0478 and a very high
performance score (ST) got the number of corruption cases 138 and in 2015 with a value of 3.1802 with a
very high performance score (ST) a number of corruption cases 113. East Kalimantan Province in 2014
with a value of 2.9055 with very high performance score (ST) the number of corruption cases 34 and in
2015 with a value of 3.1496 with a very high performance score (ST) the number of corruption cases 60.
The Local Government Implementation Report (LGIR) has a positive effect on the level of
corruption because the ranking score is measured not only by financial ratios and internal control
systems, but also by the number of public services performed by local governments. Consequently, the
more public services, the higher the LGIR score and the greater the opportunity for corruption. LGIR is a
step taken by the government in assessing the success of the management performance of government
administration in the hope of preventing corruption cases as being one of the targets, alhtough we know,
the corruption cases that appear do not provide reasons for be linked with a good performance. Based on
financial audit, substantially, performance audit also can be carried out by the BPK (SPKN, 2017) with
the aim of achieving a structurally significant growth target for local government development.
In the context of good governance, indirectly the implementation of local government organization
reporting with local government implementation reports is directed to achieve performance, and also
public accountability. This is as the fulfillment and elaboration of agency theory fulfillment (see Jensen
and Meckling, 1976). Also, it shows the organizational development from the administrative, social,
technical, and strategic aspects, with moral development towards a culture of accountability (Albrecht,
1983; 2002; McLeod, 2013). Organizational ethical reactions (Belohlavek, 2007) and moral development
are important as organizational culture in an effort to meet the accountability and performance of
organizational reporting.
CONCLUSION
The conclusion that can be stated in the context of this study is how alternative approaches are
taken to enable (in terms of theory) to re-building completeness of method, with enhancement
accountability culture in government to prevent against corruption. Therefore, need re-building the role
of contingent factors, first, to strengthen the level of accountability of the role of the State financial audit,
which its factors (audit opinion, audit findings, follow up on audit), has not been able to influence the
level of corruption of the provincial government in Indonesia. Second, it presents the implications of the
study to design the level of accountability in the accountability culture model supported by organizational
The 1st International Forum Business and Economy (IFBE) 2019 Banjarmasin, 13-14 November 2019
209
reporting starting with local government implementation report, with performance ranking achievement
of local government.
The approach requires strengthening the State's financial audit system with strengthening through
by the auditor's side, namely sthrengthen the function of the State financial audit formally that should
include the implementation of audit evidence collection and audit reporting within reports of potential
fraud or indications of corruption (see Jeppesen, 2018). in other word, in case local government receive
unqualified opinion from financial audit, it should guarantee individual in organization that do not do
fraud in form corruption. This requires development of the contingent conditions refers more than
existing ex ante regulation and ex post for the regulations's factor. Therefore, Formally institutional,
organizational development is needed in terms of implementation of the law related to strengthening
prevention (AFA, 2018; Kelly, 2017) and the significant penalty action against corruption in Indonesia,
which requires the fulfillment of optimal regulation (Atlan, 2013).
Optimal regulation is choosing the manner of governmental intervention best suited for realizing
the goal of preventing corruption based on the principle of justice, namely: Clear objective (such to
regulate for statement for audit standard, covering, statement for audi method/programme for assessment
fraud and its reporting/Detective control ( AICPA, 2019) - Balance between advantages and
disadvantages - Calculation of the indirect impact - Effective implementation. Also, external behavior is
needed, in adaptation, competence and professionalism (Hifni, 2017), such as for the role of the
Corruption Eradication Commission which needs to adopt a coercive-authoritarian style in specific
conditions, as an 'coercive' approach utilizing the authority it possesses. This is related to the role of
judicial legal institutions that still requires an increased role for justice in terms of law for corruptors.
From the auditee side, the need to implement a culture of accountability is formed to meet the
harmony of organizational intelligence ethics with individual intelligence ethics (Belohlavek, 2007).
Supporting the fulfillment of correspondence between aspects of audit opinion, audit findings, and
follow-up on audit findings, which requires strengthening social contract, and with internalize the
universal value of ethics as a member of the organization as achievement, in stages of the post-
conventional morality (McLeod, 2013). This (in theory), indicates that the organization provides a place
of ethical good governance, meanwhile, individuals become parties who can choose on the role of ethical
or unethical. Also, this requires reinforcement, with benchmark organizational that has the relevance of
an internal control strategy that is strengthened by the relations of internal supervision and external
supervision (Hifni, 2017). Therefore, from academics side, the fundamental development direction is
needed in moving from a formal level of organizational accountability to a culture of individual
accountability.
A thinking as an idea in this conclusion, at least it can be considered to be identified contents and
manner from a role model with contingent factors from accountability culture, ethical intelligence,
human-moral development and organizational development to strengthen the model of prevention for
corruption with behavioral approach. This is as a need for this nation, as Lokanan's (2015) describes
that it is needed to present a model that urges authorities to consider persuasive and self-regulatory
alternatives to criminal law and deterrence to address financial crimes (such as, the phenomenon of
corruption in the Indonesian Provincial Government).
REFERENCES
----------------, 2007, Theorizing Contingencies in Management Control Reseach; in Chapman CS,
Hopwood A, Shields M.D (Eds), Handbook of Management Accounting Research, Elsevier,
Oxford, pp 163-206
--------------------, 2014,Audit Sektor Publik edisi 3. Jakarta: Salemba Empat (in bahasa)
The 1st International Forum Business and Economy (IFBE) 2019 Banjarmasin, 13-14 November 2019
210
---------------------, 2015, Financial Crime Persecution in the UK: Time for an Alternative Approach,
Proceedings of International Academic Conferences 2604426, International Institute of Social
Economic; https://ideas.repec.org/p/sek/iacpro/2604426.html
Afif, M, 2014, Pengaruh opini audit,temuan audit,dan tindak lanjut terhadap persepsi korupsi pada
Dispenda Kabupaten Jember. (in Bahasa)
Agence Francaise Anticorruption (AFA), 2018, Survey on the Prevention of Local Government
Corruption, www.agence-francaise-anticorruption.gouv.fr
AICPA, 2019, AU-C Section 940, An Audit of Internal Control Over Financial Reporting That Is
Integrated With Audit of Financial Statements, (SAS No 130),
https://www.aicpa.org/content/dam/aicpa/research/standards/auditattest/
AICPA, EBPAQC, 2014, The Importance of Internal Control on Financial Report and safeguarding Plan
Assets, Plan Advisory, https://www.aicpa.org/content/dam/aicpa/interestareas/employeebenefitp/
Albrecht W. Steve;Albrecht C. O., Albrecht C. Conan; , Zimbelman F. Mark; 2012; Fraud
Examination,5th Edition, In Cengage Learning.South-Western.ISBN-13:978-1305079144, ISBN-
10:1305079140
Albrecht, Karl, 1983, Organization development: a total systems approach to positive change in any
business organization: A Total System Approach In Positive Change In Any Business
Organization, Englewood Cliffs, N.J. : Prentice-Hall, ISBN: 0136416969, 9780136416968:
Albrecht, Karl, 2002, Organizational Intelligence & Knowledge Management: Thinking Outside the Silos,
The Executive Perspective, Executive White Paper, © Karl Albrecht. All rights
reserved,http://www.KarlAlbrecht.com
Albrecht, W. S., Albrecht, C. C., & Albrecht, C. O, 2004, Fraud and corporate executives: Agency,
stewardship and broken trust. Journal of Forensic Accounting, 5(1), 109-130.
Association of Certified Fraud Examiners (ACFE), 2002; Report to the Nation : Occupational Fraud and
Abuse
Atlan, M. Atty, 2013, Regulatory Impact Assessment (RIA), Governmental Handbook, In accordance
with Government Resolution No. 4027 of December25,2011,Version1.0;November,2013, http://
www.pmo.gov.il / policy planning / mimshal / Pages / regulation.aspx
Azhar, K., & Setyaningrum, D, 2015, The Effect of Audit Findings and Follow up of Audit
Recomendation on Corruption of Ministries/Institution in Indonesia. The 16th Annual Conference
Asian Academic Accounting Association . Bandung: Asian Academic Accounting Association
Bastian, Indra , 2009, Akuntansi Sektor Publik Di Indonesia, Penerbit BPFE UGM, Yogyakarta, (in
bahasa)
Belohlavek, Peter, 2007, The Unicist Ontology of Ethical Intelligence, 1 st Ed, Blue Eagle Group, E
Book, ISBN 978-987-651-006-6
Berry, A.J; Coad A.F; Harris E.P; Otley, D.T and Stringer C, 2009; Emerging Themes in Management
Control: A review of recent literature, The British Accounting Review; 41 pp 2-20; Elsivier,
www.elsivier.com/locate/bar
The 1st International Forum Business and Economy (IFBE) 2019 Banjarmasin, 13-14 November 2019
211
Bologna G. Jack, and Shaw Paul, 1996; Corporate Crime Investigations, Butterworth-Heinemann,; ISBN
9780750696593 –ISBN 9780080503202,
Bologna, G. Jack, and Lindquist J. Robert, 1995; Fraud Auditing and Forensic Accounting: new Tools
and Techniques, Wiley, 2nd
Edition, ISBN-13:978-0471106463 - ISBN-10:0471106461
Bologna, Jack, 1993,Handbook on corporate fraud: Prevention, detection, and investigation:
Butterworth-Heinemann.
Bologna, Jack., Lindquist, R. J., & Wells, J. T, 1993,The Accountant's Handbook of Fraud and
Commercial Crime: Wiley New York
Bourn, S. J, 2007,Public sector auditing: is it value for money?. West Sussex: John Wiley and Sons Ltd.
BPK RI, I. I, 2016, Ikhtisar Hasil Pemriksaan Semester II BPK RI Tahun 2015,www.bpk.go.id. (in
bahasa)
BPK RI, I. I, 2015,Ikhtisar Hasil Pemeriksaan Semester II BPK RI Tahun 2014,http://www.bpk.go.id/. (in
bahasa)
BPK RI, I. I, 2016,Ikhtisar Hasil Pemriksaan Semester II BPK RI Tahun 2016. Diambil kembali dari
www.bpk.go.id. (in bahasa)
BPK RI,2018, Badan Pemeriksa Keuangan
RI.http://www.bpk.go.id/assets/files/ihps/2015/II/ihps_ii_2015_1488344101.pdf (in bahasa)
Chenhall, R.H, 2003, Management Control Systems Within Its Organizational Context: Findings from
Contingency-Based Research and Directions for Future, Accounting Organizations and Society,
Vol 28, pp 127-168
Din, Muhammad; Munawarah; Ghozali, Imam; Achmad, Tarmiji; 2017; The Follow up of Auditing
Results, Accountability of Financial Reporting and Mediating Effect of Financial Loss Rate: An
Empirical Study in Indonesian Local Governments, European Research Studies Journal, Volume
XX, Issue 4A, pp 443-459
Dwiputrianti, S., 2008, Efektifitas Laporan Hasil Temuan Pemeriksaan Dalam Mewujudkan Reformasi
Trasparansi Fiskal Dan Akuntabilitas Sektor Publik (2001-2008) Di Indonesia. Jurnal Ilmu
Administrasi , 338-355.(in Bahasa)
Emerson, P. M, 2006, Corruption, Competition and Democracy. Journal of Development Economic 81,
81(pp), 193-212. doi:10.1016/j.jdeveco.2005.04.005
Ghozali, Imam, 2016,Aplikasi analisis multivariete dengan program IBM SPSS 23. Semarang:
Universitas Diponegoro (in bahasa).
Giroux, G, 1989, Political interests and governmental accounting disclosure. Journal of Accounting and
Public Policy, 8, 199-217. doi:https://doi.org/10.1016/0278-4254(89)90004-5
Golemen, Daniel, 2006, Emotional Intelligence: Issues in Paradigm Building From the book The
Emotionally Intelligent Workplace, Chapter Two, Edited by: Cary Cherniss and Daniel Goleman,
Amazon.com, Consortium for Research on Emotional Intelligence in Organizations,
www.eiconsortium.org
The 1st International Forum Business and Economy (IFBE) 2019 Banjarmasin, 13-14 November 2019
212
Heriningsih, S dan Mahrita, 2013, Pengaruh Opini Audit, dan Kinerja Keuangan Daerah terhadap tingkat
Korupsi Pemerintah Daerah (Studi Pada Pemerintah Kabupaten di Pulau Jawa), Buletin Ekonomi, 1
(1), pp 1-12 (in bahasa)
Heriningsih, S dan Rusherlistyani, 2013, faktor-Faktor yang Mempengaruhi Tingkat Pengungkapan
laporan Keuangan Pemerintah daerah, Jurnal Ekonomi dan Bisnis, Vol 13, Nomor 2, ISSN: 1693-
0908 (in Bahasa)
Heriningsih, Sucahyo, 2015, Analisis Kinerja Penyelenggara Pemerintah Daerah dan Opini Audit
terhadap Tingkat Korupsi di daerah. University Research Colloquium 2015. Surakarta: LPPM UMS
(in Bahasa).
Hifni, Syaiful, 2017, Adaptasi Kompetensi dan Profesionalisme KPK Sebagai Antisipasi Keniscayaan
Perubahan Lingkungan, Birokrat Menulis, kategori, Refleksi Birokrasi,
http://birokratmenulis.org/author/syaifulhifni/ (0n line, 13 November 2017 (in bahasa)
Hifni, Syaiful, 2017, Pengembangan Organisasi Birokrasi: Pengendalian Manajemen Dalam Relasi
Pengawasan Internal dan Pengawasan Eksternal, Birokrat Menulis, kategori, Birokrasi Efektif-
Efisien, http://birokratmenulis.org/author/syaifulhifni/ (0n line, 16 January 2017(in bahasa))
Hofstede, G., & Hofstede, G. J,2005,Cultures and organizations: Software of the mind (Revised and
expanded 2nd edition ed.). New York: McGraw-Hill.
Husna, Nurul,Rahayu.Sri, Triyanto.DN, 2017, Pengaruh opini audit dan temuan audit terhadap tingkat
korupsi. e-Proceeding of Management : Vol.4, No.2 , 1637 (in bahasa)
Imenda, Sitwala, 2014, Is There a Conceptual Difference between Theoretical and Conceptual
Frameworks?, Journal of Social Sciences, ISSN: 0971-8923 (Print) (Online) Journal homepage:
http://www.tandfonline.com/loi/rjss20, 38:2, 185-195, DOI: 10.1080/09718923.2014.11893249
Isgiyata, Jaka; Indayani, dan Budiyoni, Eko, 2018, Studi Tentang Teori GONE dan Pengaruhnya
Terhadap Fraud dengan Idealisme Pimpinan Sebagai variabel Moderasi: Studi pada Pengadaan
Barang/jasa di Pemerintahan, Jurnal Dinamika Akuntansi dan Bisnis (JDAB), Vol. 5 (1), pp 31-42,
http://journal.unsyiah.ac.id/JDAB/index (in bahasa)
Ismail, Kamisah; Zainuddin Suria, and Sapiei N Sharoja, 2010, The Use of Contingency Theory in
Management and Accounting Research, Journal of Accountinmg Perspectives, Volume 3, pp 22-
37, ISSN 1985-7136
Jensen, M. C., & H.Meckling, W, 1976, Theory of The Firm: Managerial Behavior, Agency Cost and
Owner Structure. Journal of Financial Economics, 305-306(4), 305-360.
Jeppesen Kim, K, 2018, The Role of Auditing in the Fight against Corruption, The British Accounting
Review, DOI: 10.1016/j.bar.2018.06.001; , Elsevier, https://doi.org/10.1016/j.bar.2018.06.001Get
rights and content
Kejaksaan Republik Indonesia. (2017). Laporan Tahunan Kejaksaan Republik Indonesia 2016. Jakarta:
Kejaksaan RI (in bahasa).
Kejaksaan RI, 2016,Kajaksaan Republik Indonesia; https://www.kejaksaan.go.id/:
https://www.kejaksaan.go.id/home_kinerja.php (in bahasa)
The 1st International Forum Business and Economy (IFBE) 2019 Banjarmasin, 13-14 November 2019
213
Kejaksaan RI, L. T. (2015). Kajaksaan RI.;https://www.kejaksaan.go.id/home_kinerja.php.(in bahasa)
Kelly, A Martha, 2017, RCC, Anti Fraud and Corruption Policy and Contingency Plan, Version Update,
http://www.roscommoncoco.ie/en/download-it/finance-publications/annual_financial_statement/
Kemendagri RI. (2018, Nov 27). Tata Cara Pelaksanaan Evaluasi Kinerja Penyelenggaraan Pemerintah
Daerah. ;https://www.kemendagri.go.id:https://www.kemendagri.go.id/blog/28721-Mekanisme-
Pelaksanaan-Evaluasi-Otonomi-Daerah-Oleh-Kemendagri (in bahasa)
Kementerian Riset, Teknologi, dan Pendidikan Tinggi, 2011,Pendidikan Anti Korupsi. Jakarta: Biro Kerja
Sama dan Komunikasi Publik, Kementerian Riset, Teknologi, dan Pendidikan Tinggi, ISBN 978-
602-9290-15-8; web site: http//dikti.kemdiknas.go.id (in bahasa)
Khan A Muhammad, 2006, Role of Audit in Fighting Corruption, Paper for Ad Hoc Group Meeting on :
Ethics, Integrity, and Accountability in the Public Sector: Re-building Public Trust in Government
Through the Implementation of the UN Convention Against Corruption, 26-27 September, St.
Petersburg, Russia
KPMG, 2010; Fraud and Misconduct Survey 2010, Australia and New Zealand. KPMG, Sydney.
KPMG, LLP, 2013; COSO Internal Control, Integrated Framework (2013)
Linda, Maryasih L, dan Nuraini, 2011, Komite Audit dan Kinerja Perusahaan: Agency Theory Atau
Stewardship Theory ?, SNA XIV, BandaAceh (in bahasa)
Liu, J., & Lin, B, 2012;Government auditing and corruption control: evidence from China’s provincial
panel data. China Journal of Accounting Research, 5(2), 163-186. doi: 10.1016/j.cjar.2012.01.002.
Lokanan, Mark E, 2015, Challenges to The Fraud Triangle: Questions on Its Usefulness, Accounting
Forum, 39, DOI: 10.1016/j.accfor.2015.05.002
Mahsun, M. (2016). Pengukuran Kinerja Sektor Publik. Yogyakarta: BPFE Universitas Gajah Mada (in
Bahasa)
Manao, Hekinus. Kilas Balik UU Bidang Keuangan Negara dan Agenda ReformasiManajemen Keuangan
Pemerintah, 2008, Seminar Nasional Menapak Perjalanan Lima Tahun Implementasi Paket
Undang-Undang Keuangan Negara (in Bahasa)
Masyitoh R.D, Ratna W & Diyah S, 2015, Pengaruh Opini Audit, Temuan audit,Tindak lanjut audit
terhadap persepsi korupsi pada pemerintah daerah Tk.II. Tahun 2008-2010, SNA XVIII, Medan
www.reserchgate.net/publication304466627.(in bahasa)
McLeod, Saul, 2013, Simply Psychology, Kohlberg’s Stages of Moral Development,
www.siplypsychology.org/kohlberg.html
Mihret D Getie, 2014, National Culture and Fraud Risk: Exploratory Evidence, Journal of Financial
Reporting and Accounting, 12 (2) pp 161-176
Minkova, Milena, 2018, Guide To Corruption-Free Local Government, Practical Ways, To Design &
Implement Corruption Prevention at Local Levels, UNDP
The 1st International Forum Business and Economy (IFBE) 2019 Banjarmasin, 13-14 November 2019
214
Moritz, Scott, 2016, Taking The Best Route To Managing Fraud and Corruption Risks, Protiviti, Risk &
Bussines Consulting, Internal Audit, UTICA, Collgece;
https://www.tandfonline.com/action/showCitFormats?doi=10.1080%2F07366981.2016.1148997
Musa, N., Othman, R. M., Ibrahim, D. A., &Din, I, 2012; E-Government Services: The formal, Technical
and Informal Components of e-Fraud Prevention for Government Agency. International Journal of
Research in Management & Technology, 2(2), pp 213-219.
Neuman W Lamwrwnce, 2014, Social Research Methods: Qualitative and Quantitative Approaches,
Seventh Edition, Perason New International Edition, Pearson Education Limited, Essex CM202JE,
www.pearsoned.co.uk
O’Donohue W., and Wickham M. 2010, The role of ethical intelligence and organizational
infrastructure in organizational decision-making,School of Management, University of Tasmania,
Hobart, Australia, British Academy of Management Conference: Track – Corporate social
responsibility;
Priantara, D. (2013). Fraud Auditing & Investigation. Jakarta: Mitra Wacana Media.(in Bahasa)
Rai, Agung, I, 2010,Audit Kinerja pada Sektor Publik. Jakarta: Salemba Empat (in bahasa)
Ramamoorti, S. (2008). The psychology and sociology of fraud: Integrating the behavioral sciences
component into fraud and forensic accounting curricula. Issues in Accounting Education, 23(4),
521-533.
Rini, R., &Liska, Damiati, 2017, Analisis hasil audit pemerintahan dan tingkat korupsi di Indonesia.
Jurnal Dinamika Akuntansi dan Bisnis.(in bahasa)
Rosyadi F Chekat and Budding Tjerk, 2017, The Effectiveness of BPKP Fraud Audit Finding on
Determining the Level of Corruption in Indonesia Provinces, Journal of Society and Governance,
Vol 1, No 2, http://journal.unhas.ac.id/index.php/jsg
Schein H Edgar, 2004, Organizational Culture and Leadership, Third Edition, Jossey-Bass, A Wiley
Imprint, www.josseybass.com
Scott, R. William, 2006. Financial Accounting Theory, Fourth Edition, Pearson Prentice Hall, Toronto
Segon, M,. 2010, Corruption as part of national culture: The disconnect between values, ethics and
etiquette. International Review of Business Research Papers, 6(6), 259-275.
Setyaningrum Dyah; Gani Lindawati; Martani Dwi, and Kuntadi Cris, 2013; The Effect of Auditor
Quality on the Follow-up of Audit Recommendation, International Research Journal of Business
Studies, Vol 6. No. 2, pp 89-104, ISSN : 2089-6271 (in bahasa)
Sims L. Randi; Gong, Baiyun; Ruppel P. Cynthia, 2012, A Contingency Theory of Corruption:
The Effect of Human Development and National Culture, The Social Science Journal (49) 90-97,
Elsivier, www.elsivier.com/locate/soscij
Smith J Abbie, & Bushman, M, Robert, 2001, Financial Accounting Information and Corporate
Governance, Journal of Accounting & Economics, Chicago, USA
Sparberg, Detlev, 2000, “Fighting Corruption and Fraud”, International Journal of Government
Auditing, Washington: (27:3), July 2000, pp.10-12.
The 1st International Forum Business and Economy (IFBE) 2019 Banjarmasin, 13-14 November 2019
215
Survei Transparency International Indonesia, 2019, : Peringkat Indeks Korupsi Indonesia Naik ,
https://kabar24.bisnis.com/read/20190129/15/883613/survei-transparency-international-indonesia-
peringkat-indeks-korupsi-indonesia-naik-(in bahasa)
Svensson, J, 2005; Eight question about corruption, Journal of Economic Perspective, 19 (3), pp 19-42
Tehupuring, Ronald, 2018, Unqualified Opinion and Level of Corruption: The Triangulation Approach,
Jurnal Tata Kelola & Akuntabilitas Keuangan Negara, e-ISSN 2549-452X ; p –ISSN 2460- 3937;
Tranparency International (TI), The Global Coaliation Against Corruption, 2018,Corruption Perceptions
Index, 2018, https://www.transparency.org/cpi2018
Transparency International (TI), 2019, Will Rampant Corruption Spark on Arab Autumn ?, Politics and
Government,
https://www.transparency.org/news/feature/will_rampant_corruption_spark_an_arab_autumn
Tuanakotta, T. M. (2010). Audit forensik dan audit investigatif: Jakarta: Salemba Empat.(in bahasa)
Ulman R Simona, 2014, Different Levels of Corruption Influence on The Main Components of The
Macroeconomics Environment, Procedia, Economics and Finance, No.16, pp 438-447, Elsevier,
www.elsevier.com/locate/procedia
Utomo, W P; Diana, Nur; Afifudin. (2018). Pengaruh Opini Auditor Badan Pemeriksa Keuangan
TerhadapTingkat Korupsi (Studi Pada Kementerian/Lembaga Di Indonesia. E-JRA Vol. 07 No.05
(in bahasa)
Vovchenko, G.N., Holina, G.M., Orobinskiy, S.A., Sichev, A.R. 2017. Ensuring Financial Stability of
Companies on the Basis of International Experience in Construction of Risks Maps, International
Control and Audit,European Research Studies Journal, 20(1), Special Issue "Russia and EU:
Development and Horizons", 350-368.
Weinstein, Bruce, The Ethics Guy, 2011, Ethical Intelliggence, Five Principles for Untangling Your
Toughest Problems at Work and Beyond,Ethical Intelligence- Text.indd 9, New World Library
Novato, California 94949(Viewed on 15th August 2017)
Wilson, F. M. (2013). Organizational behaviour and work: a critical introduction: Oxford University
Press.
Wolfe T. David and Hermanson R. Dana (2004). The Fraud Diamond: Considering the Four Elements of
Fraud. CPA Journal, 74.12: 38-42.
Regulations: (in Language):
Not all of the following regulatory references are followed directly in the paper, but they are part of the
substantive regulatory references:
RI Law Number 17 of 2003 concerning State Finances,
RI Law Number 1 of 2004 concerning State Treasury,
RI Law No. 15 of 2004 concerning the Audit of Management and Responsibility of State Finances.
The 1st International Forum Business and Economy (IFBE) 2019 Banjarmasin, 13-14 November 2019
216
Law Number 19 of 2019 concerning Amendments to the Second Amendment to Law Number 30 of 2002
concerning the Corruption Eradication Commission
Government Regulation (GR), No. 24 of 2005, About Government Accounting Standards
Government Regulation (GR), No.71 of 2010, About Government Accounting Standards
Government Regulation (GR) No. 58 of 2005, About Regional Financial Management,
GR, Number 8 of 2006, About Financial Reporting and Performance of Government Agencies,
GR, Number 56 Year 2005, About Regional Financial Information Systems (SIKD)
GR, Number 06 Year 2008 About, Guidelines for Evaluating Local Government Operations.
GR, Number 71 of 2010, Regarding Government Accounting Standards
GR, Number 13 Year 2019, About Reports and Evaluations of Local Government Operations
Presidential Regulation Number 54 Year 2018, Concerning National Corruption Prevention Strategy
Presidential Instruction No. 9 of 2011, About the Corruption Prevention and Eradication Action Plan
(http://www.kpk.go.id)
Regulation of the Minister of Finance,No. 46 of 2006, About Submission of Regional Financial
Information
Regulation of the Minister of Home Affairs, No. 13 of 2006, About Guidelines for Regional Financial
Management
Ministry of Domestic Affairs, Regulation No. 59 of 2007 concerning Guidelines for Regional Financial
Management
Ministry of Domestic Affair, Regulation of The Ranking and Status of Performance of the Organization
in year
2014,2015
Regulation of the Minister of Finance, No. 46 / PMK.02 / 2006, About Procedures for Submitting
Regional Financial
Information
Regulation of the Minister of Home Affairs, No. 4 of 2008, About Guidelines for Implementation of
Review of
Financial Reports of Regional Governments;
Reguation of the Supreme Audit Board (SAB) of the Republic of Indonesia, Number 1 Year 2017,About,
Auditing Standards of Financial State (SPKN), Attachment I: Inspection Conceptual Framework;
II: PSP 100: General Standar; III: PSP 200: Standard of Examination Implementation, and IV: PSP
300 :Standard of Reporting of Investigation (State Gazette of the Republic of Indonesia Year 2007
Number 42, Supplement to the State Gazette of the Republic of Indonesia Number 4707).
The 1st International Forum Business and Economy (IFBE) 2019 Banjarmasin, 13-14 November 2019
217
FIT AND PROPER TEST: A DETERMINANT OF GOOD CORPORATE GOVERNANCE
BANKING INDUSTRY IN INDONESIA
S Napitupulu1, I Primiana
2, S R Nidar
3, N Effendi
4, M P Devy
5, DM Puspitasari
6
1 Student of Doctoral Program Faculty of Economy and Business Padjadjaran University/ Director
of Indonesian Financial Services Authority 2 3 4 6
Lecturer of Faculty of Economy and Business Padjadjaran University 5 Lecturer of Faculty of Business and Management Widyatama University
Abstract: The implementation of good corporate governance (GCG) in banking sector is very essential to
build the trust of society and international world as an absolute requirement to ensure the health of the
financial institutions. Our study aims to identify the determinants and effectiveness of good corporate
governance (GCG) practices in Indonesia banks. In this research, we used verification method based on
some theories. The analysis technique used the presentation of descriptive statistics and the Structural
Equation Model (SEM) for factor analysis and calculation. Our result shows that there were some
weaknesses in the enforcement of good corporate governance (GCG) principles in Indonesia banks
related with the leadership and business area aspects. Therefore, we suggested the using of fit and proper
test as a moderate variable and determinant in enhancement the implementation of good corporate
governance (GCG) for Indonesia banking industry.
Keywords: Good Corporate Governance (GCG), verified theories, Structural Equation
Model (SEM), fit and proper test
BACKGROUND
The financial crisis that hit the United States and Europe in 2008 led to the emergence of legal or
bankruptcy issues for several large and well-known financial institutions in America (Lehman Brothers,
Bear Stearns, Citigroup, Merrill Lynch) and in Europe (Royal Bank of Scotland, HBOS, Continent Hypo
Real Estate, The German State Bank, Dexia, Fortis, and UBS). This condition was caused by some heavy
cases like fraud, accounting scandals, and business failures occurring all over the world (Djokic, D., &
Duh, M., 2016). Besides that, it showed that there were some weaknesses in the current global system and
corporate governance in contributing with sustainable business in the sustainable economy (Lenssen,
Nikolay & Roger, 2014).
After the crisis passed, the issue of good corporate governance (GCG) became a major concern in
all sectors. Moreover, there were a lot of countries in the world that had been followed the steps of United
States and Europe in applying the program of good corporate governance (GCG) in the state level through
National Code on Corporate Governance. The forms of practicing of that program could be seen in some
countries such as: the Netherland Corporate Governance Report (1997), the Code of Best Practice of
Korean Corporate Governance (1999), the Guidance of Corporate Governance for Philippines Banking
(2001), and the Guidance of Indonesia Corporate Governance (1999 & 2001). Since then, the practice of
good corporate governance (GCG) also applied in banking sector at international level through creating
the standards of corporate governance in a country.
In Indonesia, the formation of good corporate governance (GCG) was triggered by the monetary
crisis during 1997-1998 whereas also affected the political condition. As additional information, the
Asian Corporate Governance Association survey (2016) showed that Indonesia was placed on the last
position in the implementing of good corporate governance (GCG). After two years crisis, the issue of
good corporate governance (GCG) in banking sector became an important focus for the government.
Therefore, that government tried to protect the stakeholders and to improve the compliance with law and
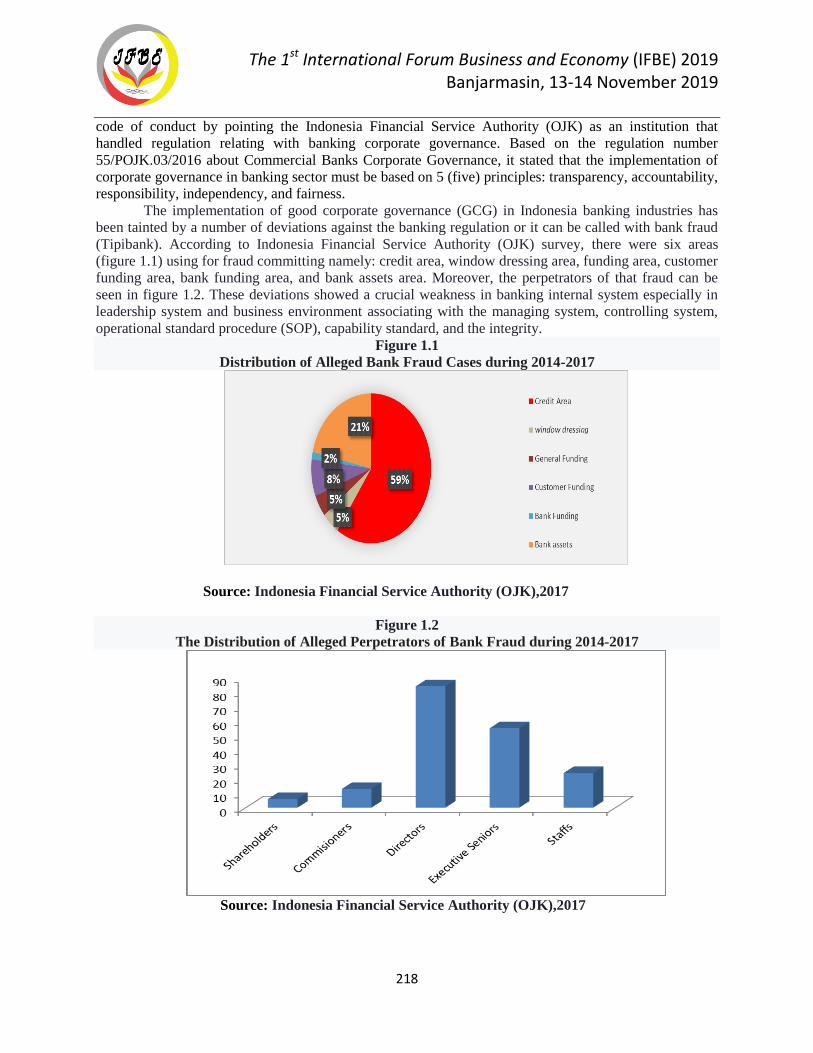
The 1st International Forum Business and Economy (IFBE) 2019 Banjarmasin, 13-14 November 2019
218
code of conduct by pointing the Indonesia Financial Service Authority (OJK) as an institution that
handled regulation relating with banking corporate governance. Based on the regulation number
55/POJK.03/2016 about Commercial Banks Corporate Governance, it stated that the implementation of
corporate governance in banking sector must be based on 5 (five) principles: transparency, accountability,
responsibility, independency, and fairness.
The implementation of good corporate governance (GCG) in Indonesia banking industries has
been tainted by a number of deviations against the banking regulation or it can be called with bank fraud
(Tipibank). According to Indonesia Financial Service Authority (OJK) survey, there were six areas
(figure 1.1) using for fraud committing namely: credit area, window dressing area, funding area, customer
funding area, bank funding area, and bank assets area. Moreover, the perpetrators of that fraud can be
seen in figure 1.2. These deviations showed a crucial weakness in banking internal system especially in
leadership system and business environment associating with the managing system, controlling system,
operational standard procedure (SOP), capability standard, and the integrity.
Figure 1.1
Distribution of Alleged Bank Fraud Cases during 2014-2017
Source: Indonesia Financial Service Authority (OJK),2017
Figure 1.2
The Distribution of Alleged Perpetrators of Bank Fraud during 2014-2017
Source: Indonesia Financial Service Authority (OJK),2017
The 1st International Forum Business and Economy (IFBE) 2019 Banjarmasin, 13-14 November 2019
219
In dealing with the banking fraud (Tipibank) problem, the study about the effectiveness
determinants of the good corporate governance (GCG) practice in banking sector is much needed.
Besides that, the regulation of Indonesia Financial Service Authority Number 27/POJK.03/2016
(July 25th, 2016) has been arranged the fit and proper test as a tool to measure the ability and
feasibility level of every staffs. Therefore, the more in-depth research about fit and proper test as
a determinant of good corporate governance in Indonesia banking industries will be discussed in
this research.
Research Limitation
The variables used in our current research is only limited to the determining variables that were
applied in previous researches. In addition, these will be used as a determinant of the good corporate
governance (GCG) quality in banking sector.
LITERATURE REVIEW
Previous Research
In supporting our current research, we used some previous researches both from local and
international journals to learn what variables determine the quality of good corporate governance (GCG)
for banking sector in Indonesia. At the beginning, Anggiriawan, MG Wirakusuma. (2015) stated that
leadership and organizational culture have been considered as determinant variables of good corporate
governance (GCG). Second, ElKelish, & Hassan. (2015) declared that the voluntary disclosure of
corporate governance greatly affected for the accuracy of stock prices. Third, Karmani, Ajina, &
Boussaada. (2015) indicated that every company that has good corporate governance (GCG) in providing
the financial transparency will be possible to have the liquid market value. Fourth, Nazliatul et al. (2015)
showed that the good implementation of corporate governance will affect the adoption of sustainability
risk management program (based on Enron case). Fifth, Shukla et al. (2015) explained that the good
corporate governance (GCG) will give a positive impact for the board effectiveness. Sixth, Widjayanti et
al. (2015) analyzed that the leadership system will influence the assessment of corporate governance.
Seventh, Duh et al. (2016) stated that the quality of good corporate governance (GCG) in Slovenia was
affected by formal and informal regulation, recommendation, ethical code, corporate governance
standard, and the corporate governance quality. Eighth, Tisna et al. (2016) pointed that good corporate
governance (GCG) and company size gave a partial and simultaneous impact for corporate financial
performance. Ninth, Triyono et al. (2016) described that institutional ownership gave a positive effect for
the quality of good corporate governance, but managerial ownership gave a bad effect. At the end, Segara
(2017) stated that morality and reliability can realize good corporate governance (GCG) in creating the
clean government motto.
The General Concept of Good Corporate Governance (GCG)
Good corporate governance (GCG) described a mechanism of economic and social resources
through the involvement of (Widodo,2001). He also stated that there were 9 (nine) characteristics of good
corporate governance (GCG), namely: participation, rule of law, transparency, responsiveness, consensus
orientation, equity, effectiveness and efficiency, accountability, and strategic vision. Besides that, the
assessment of good corporate governance (GCG) will be evaluated from 4 (four) aspects (Wheelen et
al.,2015) : ownership structure and influence, financial stakeholder right and relations, financial
transparency and information disclosure, and board structure and process. Furthermore, companies or
banks can choose the 5 (five) qualities of good corporate governance (GCG) practice,i.e: a) cost
leadership, b) differentiation, c) focused cost leadership, d) focused differentiation, and e) integration cost
leadership or differentiation.
The 1st International Forum Business and Economy (IFBE) 2019 Banjarmasin, 13-14 November 2019
220
The Banking Good Corporate Governance (GCG)
Linunga et al. (2014) argued that good corporate governance (GCG) must be applied in banking
sector because of 4 (four) reasons: 1) bank has a dominant position in the state financial system and an
important function as a machine for the economical growth, 2) bank become a primary financial source in
developing countries for almost all companies, 3) bank is recognized as a primary saving area for
economy saving, and 4) there is a lot of developing countries applying liberalization system in order to
privatize or disinvestment and to decrease the role of economy regulation. He also measures the banking
corporate governance through 3 (three) dimensions: ownership structures, financial transparency and
information disclosure, and management process and structures.
The Managing of Good Corporate Governance (GCG) in Indonesia Banking
The managing system of good corporate governance (GCG) in Indonesia banking sector is handled
by the Financial Authority Service (OJK). Based on the regulation of this institution number
55/POJK.03/2016, it stated that the good corporate governance (GCG) in all public and conventional
banking has been regulated. Moreover, Indonesia Bank has been published the regulation number
11/33/PBI/2009 about the practice of good corporate governance (GCG) in Syariah Commercial Bank
and General Unit. On March 17th,2017, the Financial Authority Service (OJK) issued the letter of the
good corporate governance (GCG) guidance for public banks. This letter explained the 5 (five) detailed
principles which are known as TARIF i.e.: 1) Transparency (information disclosure), 2) Accountability
(the clarity of functions and implementation of responsibilities), 3) Responsibility (the compliance of
bank with applicable laws and regulations), 4) Independency (the professionalism of Bank management),
and 5) Fairness (the justice and equality in fulfillment of shareholder rights and interest).
The Dimensions of Good Corporate Governance (GCG)
There are 8 (eight) dimensions using in the implementation of good corporate governance (GCG)
as follows:
1. Company resource dimension
This dimension focuses on the company resource such as tangible assets, intangible assets, human
resources, and organization capability (Omerzel et al,2011; Wheelen et al.,2012; Pearce et
al.,2015; and Hitt et al.2015).
2. Leadership dimension
This dimension lifts up leadership system especially transformational system in order to reach the
mission and vision of company. Based on some literatures, this system assess the leaders based on
their vision and quality, charismatic, inspiration, decision taking, intellectual stimulation,
contingency award, behavior, speaking and language style, and ability to manage a company
(Selznick,1984; Bass et al.,1995; Plowman et al.,2007; and Stahl et al.2018).
3. Unique capability dimension
The pressure of this dimension is a superior and specific ability in optimizing the company
resources in producing the best products in winning the market competition. Some researchers
stated that this capability can be seen in some factors such as assets, company or organization
capability, human resources, characteristic, innovation, location and competencies (Collins et
al.,2005; Hit et al.,2007; Simonceska,2010; Wheelen et al.,2015; and Pearce et al.,2015)
4. Organization culture dimension
The aim of this dimension is directing all human resources to work based on company values,
ethical code, and corporate governance. The previous researches showed that there were several
things using such as norms, organizational situation, organizational values, philosophy,
regulation, trust, behavior, piety, integrity, and knowledge (Lutham, 1998; Triguno,2000;
Avicenna et al.,2012; and Pendke, 2013)
5. Business environment dimension
The 1st International Forum Business and Economy (IFBE) 2019 Banjarmasin, 13-14 November 2019
221
This dimension will give impacts for company. Some researchers stated that there were two types
of environment, i.e.: external and internal environment (Kusmayadi, 2008; Hitt et al.2007;
Wheelen et al., 2012; and Killeen, 2012)
6. Business partnership dimension
The main point of this dimension is the cooperation system and procedure with other companies
which have same vision in creating the high quality of products and services. Based on the
adopted literatures, the primary factors of cooperation consisted of: collaboration, competency,
coordination, dependency, trust, competitive advantage, capacity, and capability (Doll et al.,
1987; Mohr et al., 1994; Liedtka, 1996; and Sulistiyani, 2014)
7. Dynamic capabilities dimension
This dimension emphasizes on the environment characteristic transformation and the ability of
company in adapting, integrating, and reconfiguring the internal and external resources for
fighting with the dynamic environment. Adopted from previous researches, this capability used
for solving problem, constructing, integrating, reconfiguring, learning, coordinating, acquiring the
knowledge, creating a knowledge, combining all knowledge, marketing, management altering,
innovating, founding, and protecting the resources (Teece,2007; Pavlou et al.,2011; Wang et
al.,2011; Zheng et al.,2011; Lin et al.,2012; Mauludin et al.,2013)
8. Fit and proper test dimension
The fit and proper test dimension is an assessment process of the integrity and ability for all
management in accordance with the applicable provision. Inside of this test, a company can apply
some component based on the previous literatures such as material test, vision test, response test,
banking regulation test, the philosophy test of healthy banking, corporate governance test, and
integrity and competency test (Barnard et al., 1986; Khalid et al., 2014; Pawana, 2014)
RESEARCH METHODOLOGY
Our current research uses verification research method based on some theories and it will be
developed into the hypotheses or temporary answer of our main research questions. That questions are: 1)
what factors are contribute in creating the quality of good corporate governance (GCG) for Indonesia
banking sector and 2) what type of good corporate governance (GCG) is the most ideal for describing the
determinant factors of good corporate governance (GCG) practice in Indonesia public banks. Therefore,
we applied some steps to make a conclusion at the end of our research as follows:
1. Determining the operational variables
This first step consists of 9 (nine) variables: seven variables are latent exogen (resources,
leadership, unique capability, organization culture, business environment, business partnership,
dynamic capability), one variabel is moderate variable (fit and proper test) and one another is as
latent endogen (the quality of good corporate governance (GCG) practice)
2. Determining the source and method of data
The source of data used in current research derived from primary and secondary data. Our
primary data is taken from the questionnaire distribution through email, face to face, and online
form while the secondary data is taken from public banks in Indonesia and The Indonesia Finance
Authority Service (OJK) performance indicator reports. Moreover, the research object is all
public bank operating in Indonesia.
3. Data Collecting technique
The techniques used in our current research are questionnaires distribution and interviews. Then,
the population is all public banks operating in Indonesia and the respondents are every bank
coordinators (115 people in total).
4. Designing of analysis and hypotheses test
In this current research, we applied Likert scale in valuing the questionnaires. Every
questionnaire was given 6 (six) choices of answers according to the voter’s judgment i.e.: 1 ->
The 1st International Forum Business and Economy (IFBE) 2019 Banjarmasin, 13-14 November 2019
222
strongly disagree, 2 -> disagree, 3 -> not agree, 4 -> quite agree, 5 -> agree, 6-> strongly agree.
Besides that, all question faced all indicators based on 8 (eight) dimensions of good corporate
governance (GCG). Therefore, the indicators average calculation result of each dimensions will
be classified into 3 (three) scales i.e.: not good (1-2.67), good enough (2.67 – 4.33), and good
(4.33 – 6.00). Then, the design of analysis and hypotheses can be explained as follows:
1. Data analysis method
The method using in data analysis is descriptive analysis in order to get the image of voters
characteristic.
2. Structural Equation Model (SEM) analysis
According to hypothesis formulation, we measured the inferential statistic data analysis
through using Lisrel 8.80 Software. Moreover, we made a complete model through some
steps such as: theoretical model development, path diagram development, the conversion of
path diagram into the mathematical equation, the selection of input matrix and model
estimation, the identification of structural method, the model compatibility testing, and the
evaluation of goodness-of-fit criteria.
3. Structural Method
This method will explain the relationship between variables and dimensions of good
corporate governance.
4. The validity test of questionnaire
This test will be used as a basis to avoid the data which cannot be proceed because of
misunderstanding questions, central tendency answers, and no answers at all questions.
5. Reliability test
This test will be used to measure the consistency and the accuracy of questions inside of the
questionnaire.
6. Moderation effect test
This test will classify the moderation variables into 4 (four) types i.e.: pure moderation,
pseudo moderation, potential moderation, and predictor moderation.
7. Hypothesis test
This test will be applied in answering all hypotheses related with the 8 (eight) dimensions of
good corporate governance (GCG). Then, these hypotheses will be used to design the
problem solving.
Based on the result of research and aim of research referring to the problem identification, there
are some stages used in designing the problem solving as follows:
a. The formulation of research purpose
b. The strategy mapping
c. The operationalization strategy
d. The action plan
e. The evaluation and controlling plan
RESULT AND DISCUSSION
The Analysis of Current Good Corporate Governance (GCG) Implementation in Indonesia Public
Banks
Based on the survey process through questionnaire distributing, the overall implementation of good
corporate governance (GCG) in Indonesia public banks at all book bank types has been running well. This
valuation has been derived from the measurement of each operational variable (table 4.1) which earns the
total average index in determining the criteria score.
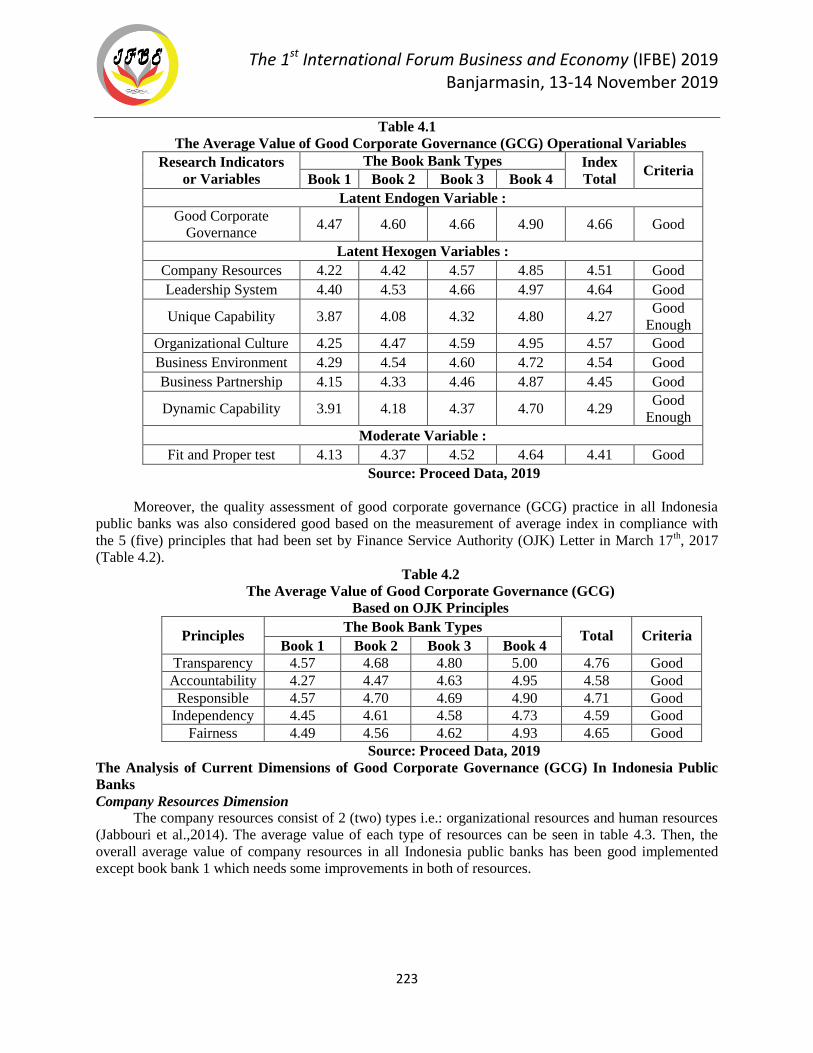
The 1st International Forum Business and Economy (IFBE) 2019 Banjarmasin, 13-14 November 2019
223
Table 4.1
The Average Value of Good Corporate Governance (GCG) Operational Variables
Research Indicators
or Variables
The Book Bank Types Index
Total Criteria
Book 1 Book 2 Book 3 Book 4
Latent Endogen Variable :
Good Corporate
Governance 4.47 4.60 4.66 4.90 4.66 Good
Latent Hexogen Variables :
Company Resources 4.22 4.42 4.57 4.85 4.51 Good
Leadership System 4.40 4.53 4.66 4.97 4.64 Good
Unique Capability 3.87 4.08 4.32 4.80 4.27 Good
Enough
Organizational Culture 4.25 4.47 4.59 4.95 4.57 Good
Business Environment 4.29 4.54 4.60 4.72 4.54 Good
Business Partnership 4.15 4.33 4.46 4.87 4.45 Good
Dynamic Capability 3.91 4.18 4.37 4.70 4.29 Good
Enough
Moderate Variable :
Fit and Proper test 4.13 4.37 4.52 4.64 4.41 Good
Source: Proceed Data, 2019
Moreover, the quality assessment of good corporate governance (GCG) practice in all Indonesia
public banks was also considered good based on the measurement of average index in compliance with
the 5 (five) principles that had been set by Finance Service Authority (OJK) Letter in March 17th, 2017
(Table 4.2).
Table 4.2
The Average Value of Good Corporate Governance (GCG)
Based on OJK Principles
Principles The Book Bank Types
Total Criteria Book 1 Book 2 Book 3 Book 4
Transparency 4.57 4.68 4.80 5.00 4.76 Good
Accountability 4.27 4.47 4.63 4.95 4.58 Good
Responsible 4.57 4.70 4.69 4.90 4.71 Good
Independency 4.45 4.61 4.58 4.73 4.59 Good
Fairness 4.49 4.56 4.62 4.93 4.65 Good
Source: Proceed Data, 2019
The Analysis of Current Dimensions of Good Corporate Governance (GCG) In Indonesia Public
Banks
Company Resources Dimension
The company resources consist of 2 (two) types i.e.: organizational resources and human resources
(Jabbouri et al.,2014). The average value of each type of resources can be seen in table 4.3. Then, the
overall average value of company resources in all Indonesia public banks has been good implemented
except book bank 1 which needs some improvements in both of resources.
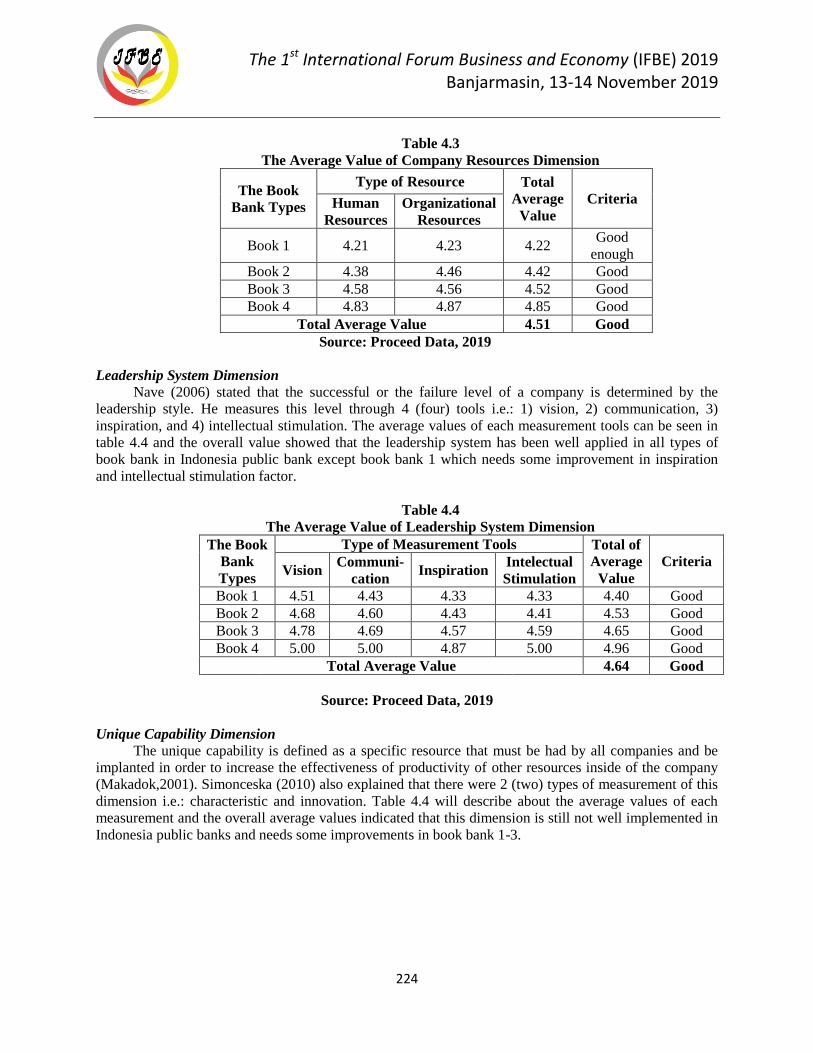
The 1st International Forum Business and Economy (IFBE) 2019 Banjarmasin, 13-14 November 2019
224
Table 4.3
The Average Value of Company Resources Dimension
The Book
Bank Types
Type of Resource Total
Average
Value
Criteria Human
Resources
Organizational
Resources
Book 1 4.21 4.23 4.22 Good
enough
Book 2 4.38 4.46 4.42 Good
Book 3 4.58 4.56 4.52 Good
Book 4 4.83 4.87 4.85 Good
Total Average Value 4.51 Good
Source: Proceed Data, 2019
Leadership System Dimension
Nave (2006) stated that the successful or the failure level of a company is determined by the
leadership style. He measures this level through 4 (four) tools i.e.: 1) vision, 2) communication, 3)
inspiration, and 4) intellectual stimulation. The average values of each measurement tools can be seen in
table 4.4 and the overall value showed that the leadership system has been well applied in all types of
book bank in Indonesia public bank except book bank 1 which needs some improvement in inspiration
and intellectual stimulation factor.
Table 4.4
The Average Value of Leadership System Dimension
The Book
Bank
Types
Type of Measurement Tools Total of
Average
Value
Criteria Vision
Communi-
cation Inspiration
Intelectual
Stimulation
Book 1 4.51 4.43 4.33 4.33 4.40 Good
Book 2 4.68 4.60 4.43 4.41 4.53 Good
Book 3 4.78 4.69 4.57 4.59 4.65 Good
Book 4 5.00 5.00 4.87 5.00 4.96 Good
Total Average Value 4.64 Good
Source: Proceed Data, 2019
Unique Capability Dimension
The unique capability is defined as a specific resource that must be had by all companies and be
implanted in order to increase the effectiveness of productivity of other resources inside of the company
(Makadok,2001). Simonceska (2010) also explained that there were 2 (two) types of measurement of this
dimension i.e.: characteristic and innovation. Table 4.4 will describe about the average values of each
measurement and the overall average values indicated that this dimension is still not well implemented in
Indonesia public banks and needs some improvements in book bank 1-3.
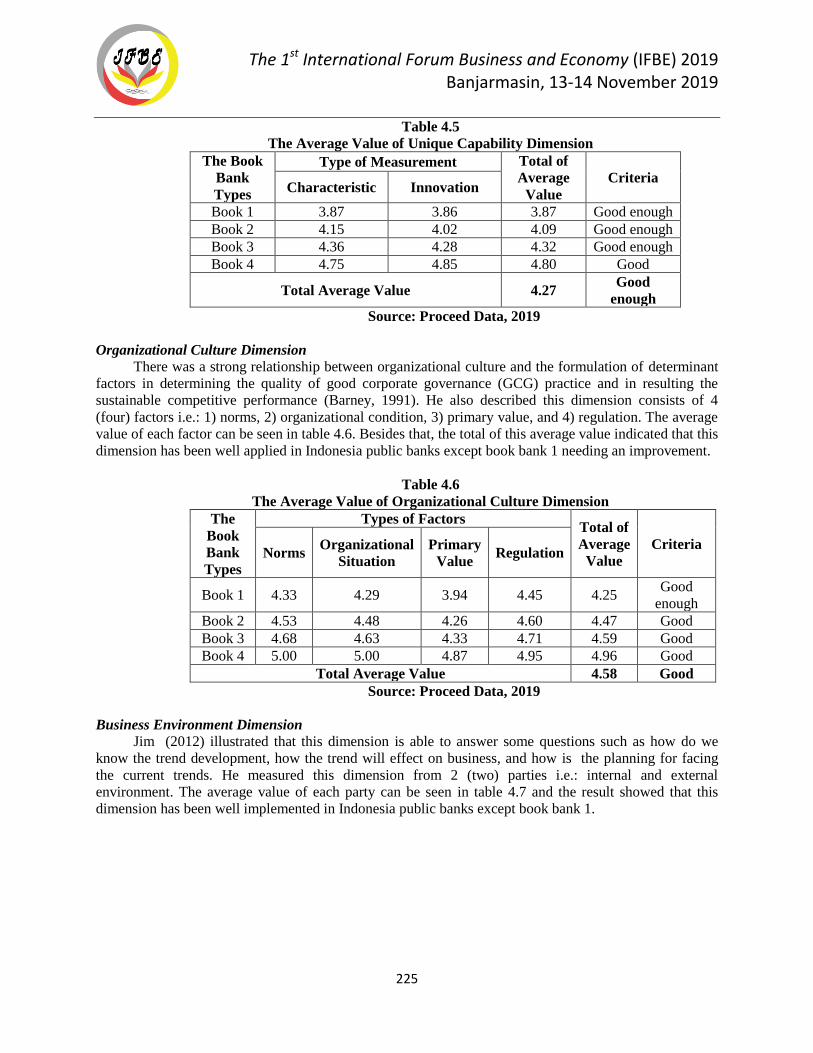
The 1st International Forum Business and Economy (IFBE) 2019 Banjarmasin, 13-14 November 2019
225
Table 4.5
The Average Value of Unique Capability Dimension
The Book
Bank
Types
Type of Measurement Total of
Average
Value
Criteria Characteristic Innovation
Book 1 3.87 3.86 3.87 Good enough
Book 2 4.15 4.02 4.09 Good enough
Book 3 4.36 4.28 4.32 Good enough
Book 4 4.75 4.85 4.80 Good
Total Average Value 4.27 Good
enough
Source: Proceed Data, 2019
Organizational Culture Dimension
There was a strong relationship between organizational culture and the formulation of determinant
factors in determining the quality of good corporate governance (GCG) practice and in resulting the
sustainable competitive performance (Barney, 1991). He also described this dimension consists of 4
(four) factors i.e.: 1) norms, 2) organizational condition, 3) primary value, and 4) regulation. The average
value of each factor can be seen in table 4.6. Besides that, the total of this average value indicated that this
dimension has been well applied in Indonesia public banks except book bank 1 needing an improvement.
Table 4.6
The Average Value of Organizational Culture Dimension
The
Book
Bank
Types
Types of Factors Total of
Average
Value
Criteria Norms
Organizational
Situation
Primary
Value Regulation
Book 1 4.33 4.29 3.94 4.45 4.25 Good
enough
Book 2 4.53 4.48 4.26 4.60 4.47 Good
Book 3 4.68 4.63 4.33 4.71 4.59 Good
Book 4 5.00 5.00 4.87 4.95 4.96 Good
Total Average Value 4.58 Good
Source: Proceed Data, 2019
Business Environment Dimension
Jim (2012) illustrated that this dimension is able to answer some questions such as how do we
know the trend development, how the trend will effect on business, and how is the planning for facing
the current trends. He measured this dimension from 2 (two) parties i.e.: internal and external
environment. The average value of each party can be seen in table 4.7 and the result showed that this
dimension has been well implemented in Indonesia public banks except book bank 1.
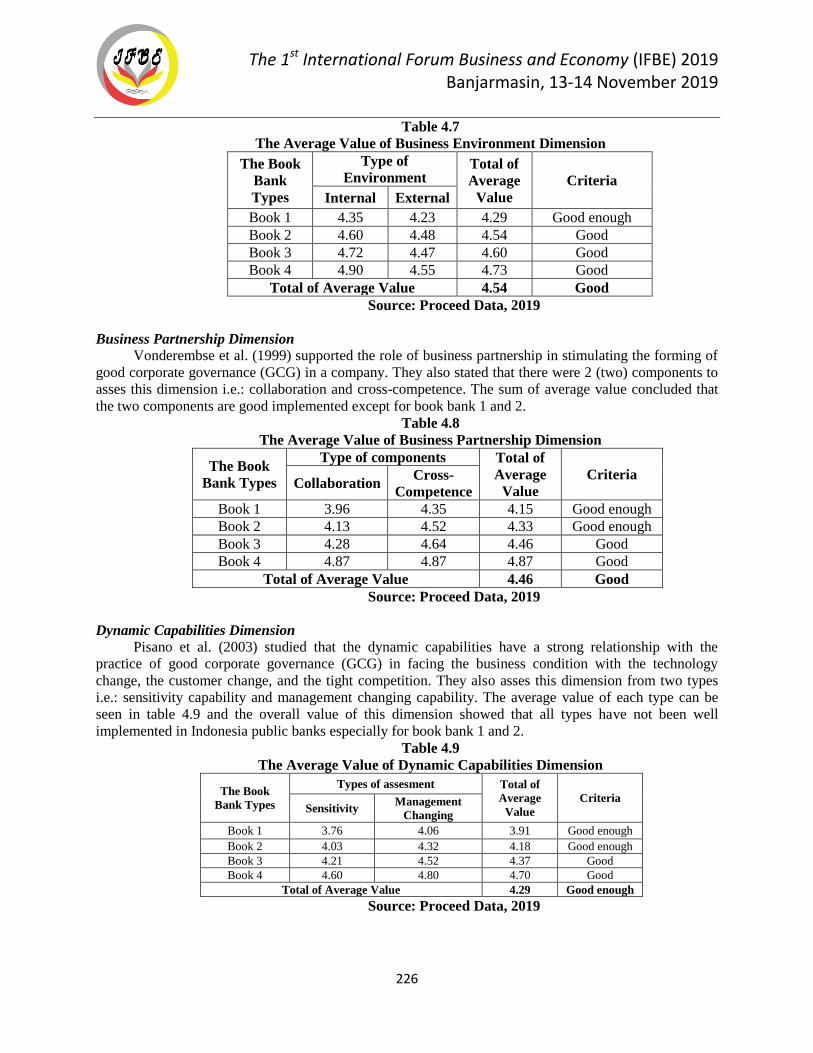
The 1st International Forum Business and Economy (IFBE) 2019 Banjarmasin, 13-14 November 2019
226
Table 4.7
The Average Value of Business Environment Dimension
The Book
Bank
Types
Type of
Environment Total of
Average
Value
Criteria
Internal External
Book 1 4.35 4.23 4.29 Good enough
Book 2 4.60 4.48 4.54 Good
Book 3 4.72 4.47 4.60 Good
Book 4 4.90 4.55 4.73 Good
Total of Average Value 4.54 Good
Source: Proceed Data, 2019
Business Partnership Dimension
Vonderembse et al. (1999) supported the role of business partnership in stimulating the forming of
good corporate governance (GCG) in a company. They also stated that there were 2 (two) components to
asses this dimension i.e.: collaboration and cross-competence. The sum of average value concluded that
the two components are good implemented except for book bank 1 and 2.
Table 4.8
The Average Value of Business Partnership Dimension
The Book
Bank Types
Type of components Total of
Average
Value
Criteria Collaboration
Cross-
Competence
Book 1 3.96 4.35 4.15 Good enough
Book 2 4.13 4.52 4.33 Good enough
Book 3 4.28 4.64 4.46 Good
Book 4 4.87 4.87 4.87 Good
Total of Average Value 4.46 Good
Source: Proceed Data, 2019
Dynamic Capabilities Dimension
Pisano et al. (2003) studied that the dynamic capabilities have a strong relationship with the
practice of good corporate governance (GCG) in facing the business condition with the technology
change, the customer change, and the tight competition. They also asses this dimension from two types
i.e.: sensitivity capability and management changing capability. The average value of each type can be
seen in table 4.9 and the overall value of this dimension showed that all types have not been well
implemented in Indonesia public banks especially for book bank 1 and 2.
Table 4.9
The Average Value of Dynamic Capabilities Dimension
The Book
Bank Types
Types of assesment Total of
Average
Value
Criteria Sensitivity
Management
Changing
Book 1 3.76 4.06 3.91 Good enough
Book 2 4.03 4.32 4.18 Good enough
Book 3 4.21 4.52 4.37 Good
Book 4 4.60 4.80 4.70 Good
Total of Average Value 4.29 Good enough
Source: Proceed Data, 2019
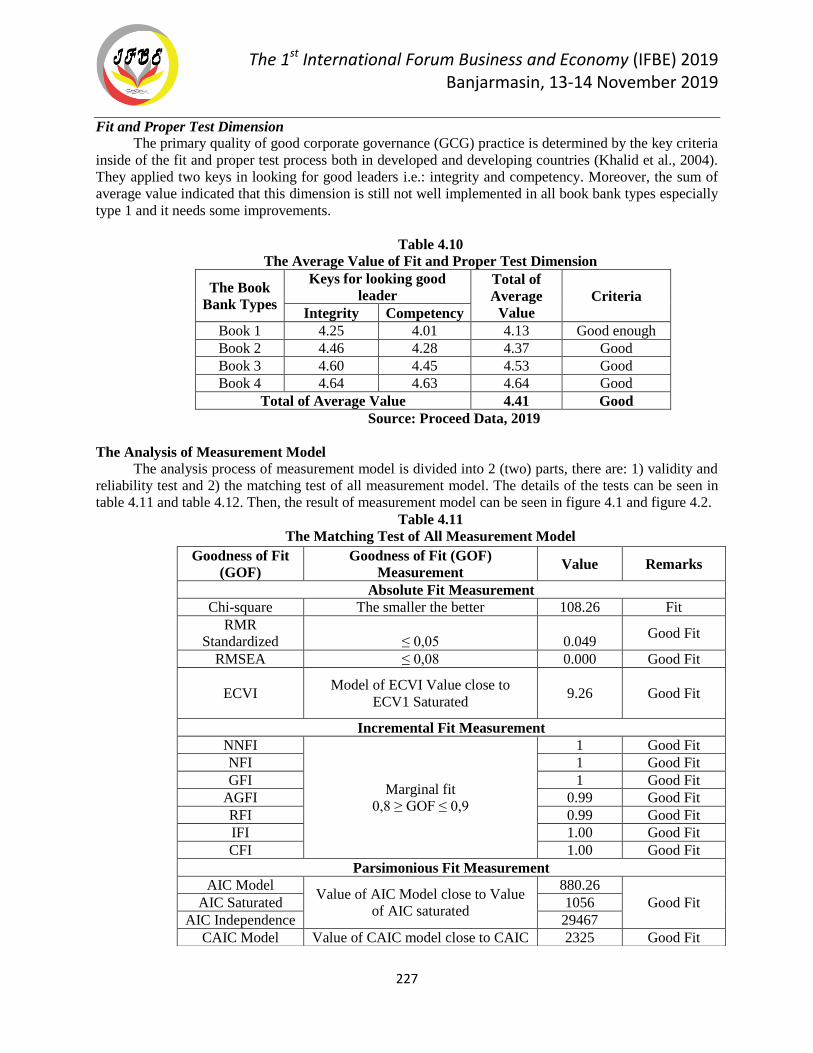
The 1st International Forum Business and Economy (IFBE) 2019 Banjarmasin, 13-14 November 2019
227
Fit and Proper Test Dimension
The primary quality of good corporate governance (GCG) practice is determined by the key criteria
inside of the fit and proper test process both in developed and developing countries (Khalid et al., 2004).
They applied two keys in looking for good leaders i.e.: integrity and competency. Moreover, the sum of
average value indicated that this dimension is still not well implemented in all book bank types especially
type 1 and it needs some improvements.
Table 4.10
The Average Value of Fit and Proper Test Dimension
The Book
Bank Types
Keys for looking good
leader Total of
Average
Value
Criteria
Integrity Competency
Book 1 4.25 4.01 4.13 Good enough
Book 2 4.46 4.28 4.37 Good
Book 3 4.60 4.45 4.53 Good
Book 4 4.64 4.63 4.64 Good
Total of Average Value 4.41 Good
Source: Proceed Data, 2019
The Analysis of Measurement Model
The analysis process of measurement model is divided into 2 (two) parts, there are: 1) validity and
reliability test and 2) the matching test of all measurement model. The details of the tests can be seen in
table 4.11 and table 4.12. Then, the result of measurement model can be seen in figure 4.1 and figure 4.2.
Table 4.11
The Matching Test of All Measurement Model
Goodness of Fit
(GOF)
Goodness of Fit (GOF)
Measurement Value Remarks
Absolute Fit Measurement
Chi-square The smaller the better 108.26 Fit
RMR
Standardized ≤ 0,05 0.049 Good Fit
RMSEA ≤ 0,08 0.000 Good Fit
ECVI
Model of ECVI Value close to
ECV1 Saturated 9.26
Good Fit
Incremental Fit Measurement
NNFI
Marginal fit
0,8 ≥ GOF ≤ 0,9
1 Good Fit
NFI 1 Good Fit
GFI 1 Good Fit
AGFI 0.99 Good Fit
RFI 0.99 Good Fit
IFI 1.00 Good Fit
CFI 1.00 Good Fit
Parsimonious Fit Measurement
AIC Model Value of AIC Model close to Value
of AIC saturated
880.26
Good Fit AIC Saturated 1056
AIC Independence 29467
CAIC Model Value of CAIC model close to CAIC 2325 Good Fit
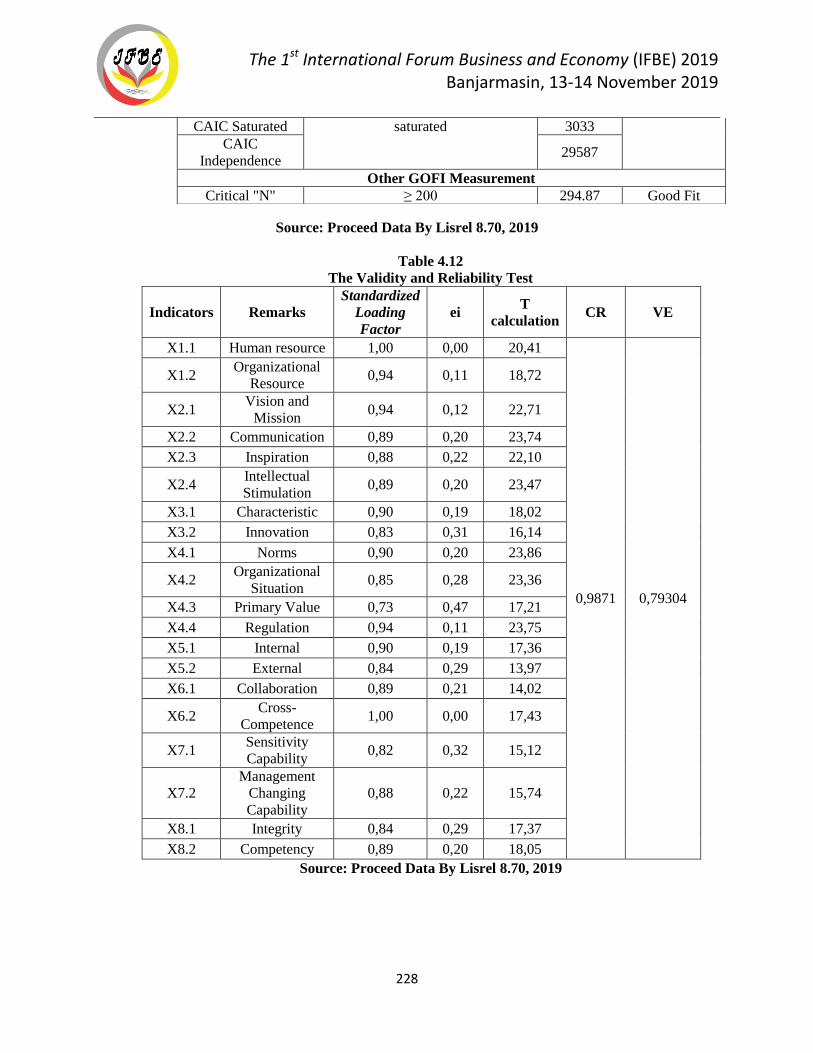
The 1st International Forum Business and Economy (IFBE) 2019 Banjarmasin, 13-14 November 2019
228
Source: Proceed Data By Lisrel 8.70, 2019
Table 4.12
The Validity and Reliability Test
Indicators Remarks
Standardized
Loading
Factor
ei T
calculation CR VE
X1.1 Human resource 1,00 0,00 20,41
0,9871 0,79304
X1.2 Organizational
Resource 0,94 0,11 18,72
X2.1 Vision and
Mission 0,94 0,12 22,71
X2.2 Communication 0,89 0,20 23,74
X2.3 Inspiration 0,88 0,22 22,10
X2.4 Intellectual
Stimulation 0,89 0,20 23,47
X3.1 Characteristic 0,90 0,19 18,02
X3.2 Innovation 0,83 0,31 16,14
X4.1 Norms 0,90 0,20 23,86
X4.2 Organizational
Situation 0,85 0,28 23,36
X4.3 Primary Value 0,73 0,47 17,21
X4.4 Regulation 0,94 0,11 23,75
X5.1 Internal 0,90 0,19 17,36
X5.2 External 0,84 0,29 13,97
X6.1 Collaboration 0,89 0,21 14,02
X6.2 Cross-
Competence 1,00 0,00 17,43
X7.1 Sensitivity
Capability 0,82 0,32 15,12
X7.2
Management
Changing
Capability
0,88 0,22 15,74
X8.1 Integrity 0,84 0,29 17,37
X8.2 Competency 0,89 0,20 18,05
Source: Proceed Data By Lisrel 8.70, 2019
CAIC Saturated saturated 3033
CAIC
Independence 29587
Other GOFI Measurement
Critical "N" ≥ 200 294.87 Good Fit
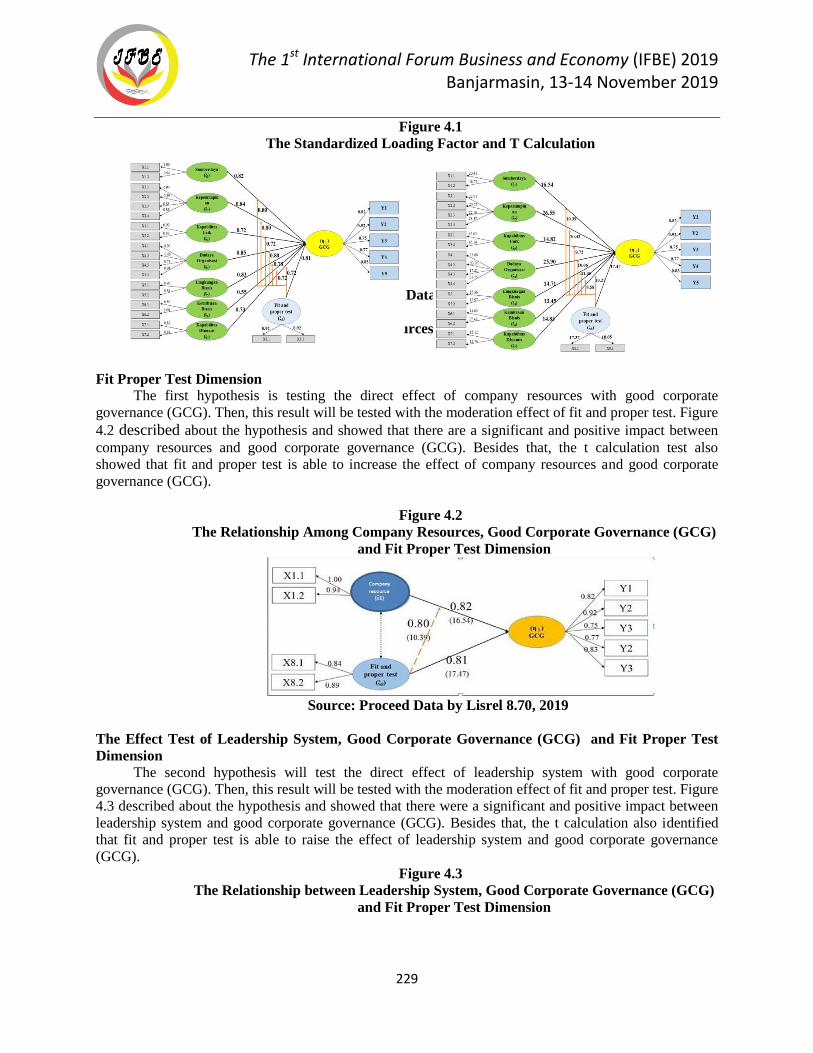
The 1st International Forum Business and Economy (IFBE) 2019 Banjarmasin, 13-14 November 2019
229
Figure 4.1
The Standardized Loading Factor and T Calculation
Source: Proceed Data by Lisrel 8.70, 2019
1.1.1 The Effect Test of Company Resources, Good Corporate Governance (GCG) and
Fit Proper Test Dimension
The first hypothesis is testing the direct effect of company resources with good corporate
governance (GCG). Then, this result will be tested with the moderation effect of fit and proper test. Figure
4.2 described about the hypothesis and showed that there are a significant and positive impact between
company resources and good corporate governance (GCG). Besides that, the t calculation test also
showed that fit and proper test is able to increase the effect of company resources and good corporate
governance (GCG).
Figure 4.2
The Relationship Among Company Resources, Good Corporate Governance (GCG)
and Fit Proper Test Dimension
Source: Proceed Data by Lisrel 8.70, 2019
The Effect Test of Leadership System, Good Corporate Governance (GCG) and Fit Proper Test
Dimension
The second hypothesis will test the direct effect of leadership system with good corporate
governance (GCG). Then, this result will be tested with the moderation effect of fit and proper test. Figure
4.3 described about the hypothesis and showed that there were a significant and positive impact between
leadership system and good corporate governance (GCG). Besides that, the t calculation also identified
that fit and proper test is able to raise the effect of leadership system and good corporate governance
(GCG).
Figure 4.3
The Relationship between Leadership System, Good Corporate Governance (GCG)
and Fit Proper Test Dimension
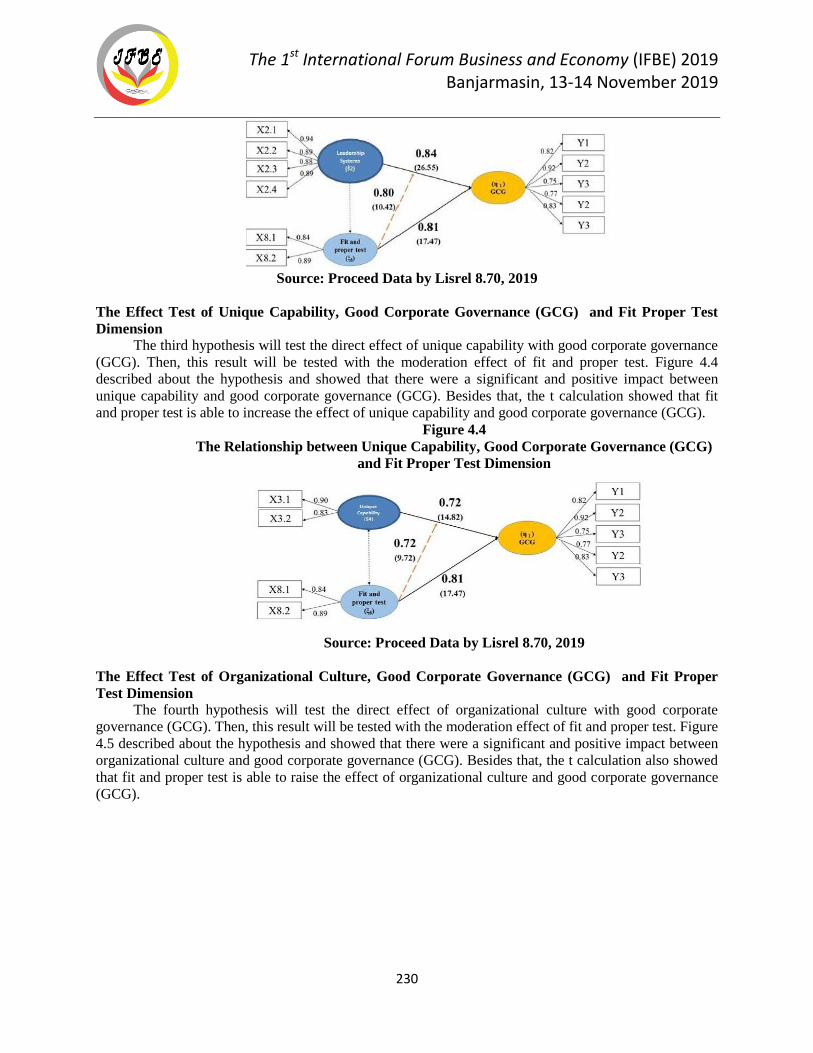
The 1st International Forum Business and Economy (IFBE) 2019 Banjarmasin, 13-14 November 2019
230
Source: Proceed Data by Lisrel 8.70, 2019
The Effect Test of Unique Capability, Good Corporate Governance (GCG) and Fit Proper Test
Dimension
The third hypothesis will test the direct effect of unique capability with good corporate governance
(GCG). Then, this result will be tested with the moderation effect of fit and proper test. Figure 4.4
described about the hypothesis and showed that there were a significant and positive impact between
unique capability and good corporate governance (GCG). Besides that, the t calculation showed that fit
and proper test is able to increase the effect of unique capability and good corporate governance (GCG).
Figure 4.4
The Relationship between Unique Capability, Good Corporate Governance (GCG)
and Fit Proper Test Dimension
Source: Proceed Data by Lisrel 8.70, 2019
The Effect Test of Organizational Culture, Good Corporate Governance (GCG) and Fit Proper
Test Dimension
The fourth hypothesis will test the direct effect of organizational culture with good corporate
governance (GCG). Then, this result will be tested with the moderation effect of fit and proper test. Figure
4.5 described about the hypothesis and showed that there were a significant and positive impact between
organizational culture and good corporate governance (GCG). Besides that, the t calculation also showed
that fit and proper test is able to raise the effect of organizational culture and good corporate governance
(GCG).
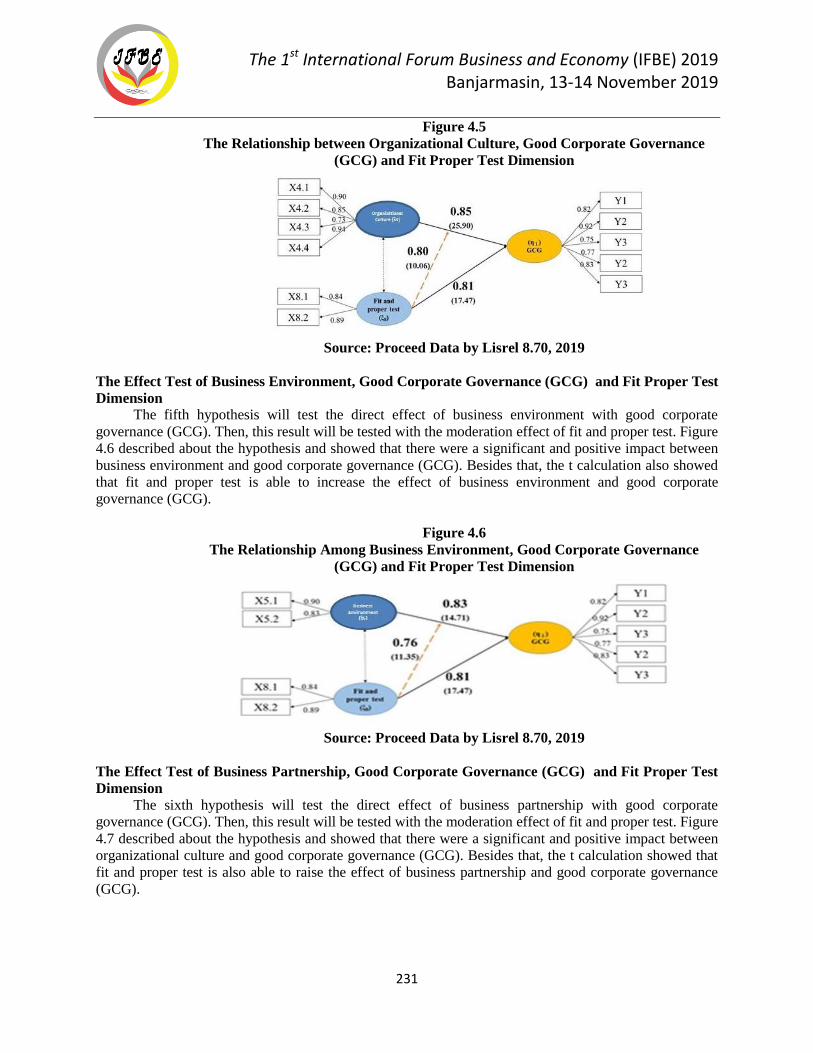
The 1st International Forum Business and Economy (IFBE) 2019 Banjarmasin, 13-14 November 2019
231
Figure 4.5
The Relationship between Organizational Culture, Good Corporate Governance
(GCG) and Fit Proper Test Dimension
Source: Proceed Data by Lisrel 8.70, 2019
The Effect Test of Business Environment, Good Corporate Governance (GCG) and Fit Proper Test
Dimension
The fifth hypothesis will test the direct effect of business environment with good corporate
governance (GCG). Then, this result will be tested with the moderation effect of fit and proper test. Figure
4.6 described about the hypothesis and showed that there were a significant and positive impact between
business environment and good corporate governance (GCG). Besides that, the t calculation also showed
that fit and proper test is able to increase the effect of business environment and good corporate
governance (GCG).
Figure 4.6
The Relationship Among Business Environment, Good Corporate Governance
(GCG) and Fit Proper Test Dimension
Source: Proceed Data by Lisrel 8.70, 2019
The Effect Test of Business Partnership, Good Corporate Governance (GCG) and Fit Proper Test
Dimension
The sixth hypothesis will test the direct effect of business partnership with good corporate
governance (GCG). Then, this result will be tested with the moderation effect of fit and proper test. Figure
4.7 described about the hypothesis and showed that there were a significant and positive impact between
organizational culture and good corporate governance (GCG). Besides that, the t calculation showed that
fit and proper test is also able to raise the effect of business partnership and good corporate governance
(GCG).
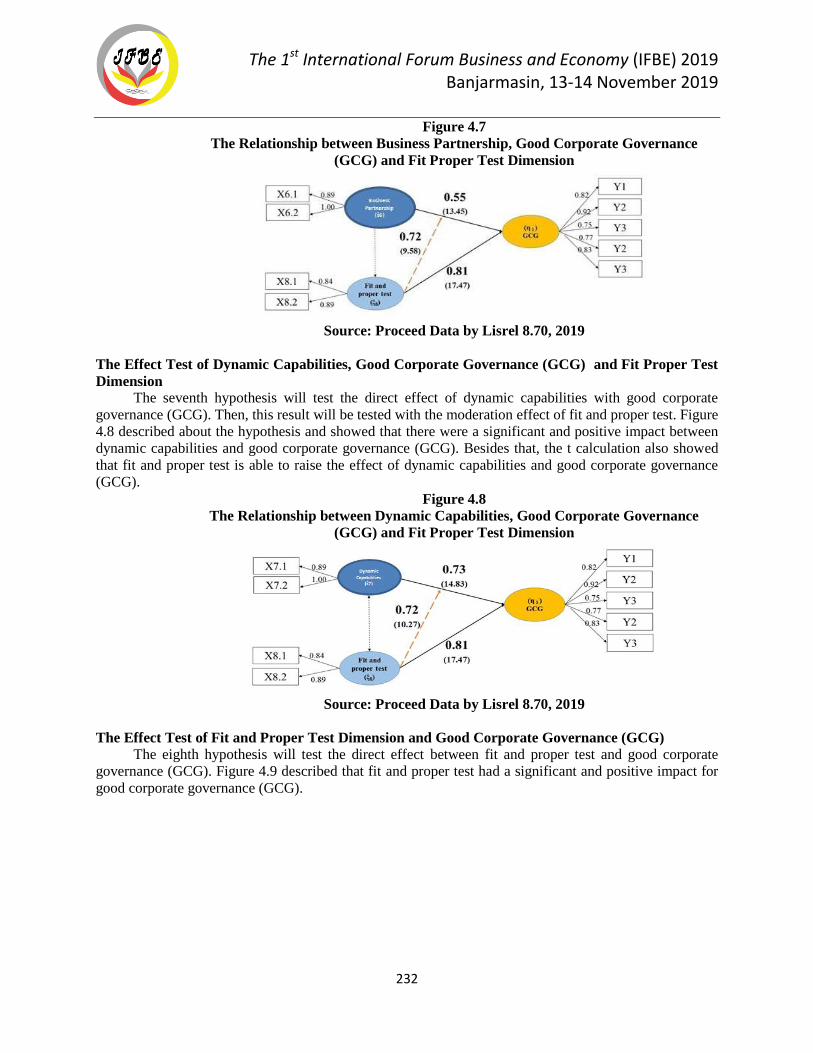
The 1st International Forum Business and Economy (IFBE) 2019 Banjarmasin, 13-14 November 2019
232
Figure 4.7
The Relationship between Business Partnership, Good Corporate Governance
(GCG) and Fit Proper Test Dimension
Source: Proceed Data by Lisrel 8.70, 2019
The Effect Test of Dynamic Capabilities, Good Corporate Governance (GCG) and Fit Proper Test
Dimension
The seventh hypothesis will test the direct effect of dynamic capabilities with good corporate
governance (GCG). Then, this result will be tested with the moderation effect of fit and proper test. Figure
4.8 described about the hypothesis and showed that there were a significant and positive impact between
dynamic capabilities and good corporate governance (GCG). Besides that, the t calculation also showed
that fit and proper test is able to raise the effect of dynamic capabilities and good corporate governance
(GCG).
Figure 4.8
The Relationship between Dynamic Capabilities, Good Corporate Governance
(GCG) and Fit Proper Test Dimension
Source: Proceed Data by Lisrel 8.70, 2019
The Effect Test of Fit and Proper Test Dimension and Good Corporate Governance (GCG)
The eighth hypothesis will test the direct effect between fit and proper test and good corporate
governance (GCG). Figure 4.9 described that fit and proper test had a significant and positive impact for
good corporate governance (GCG).
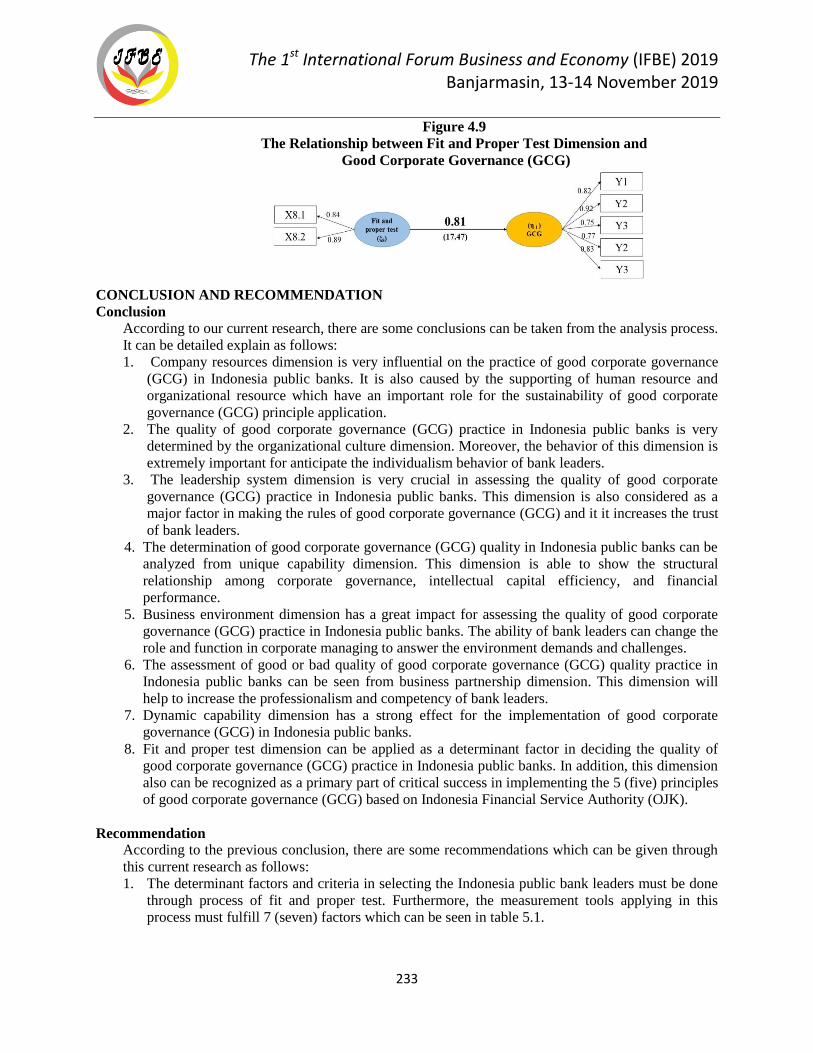
The 1st International Forum Business and Economy (IFBE) 2019 Banjarmasin, 13-14 November 2019
233
Figure 4.9
The Relationship between Fit and Proper Test Dimension and
Good Corporate Governance (GCG)
Source: Proceed Data by Lisrel 8.70, 2019
CONCLUSION AND RECOMMENDATION
Conclusion According to our current research, there are some conclusions can be taken from the analysis process.
It can be detailed explain as follows:
1. Company resources dimension is very influential on the practice of good corporate governance
(GCG) in Indonesia public banks. It is also caused by the supporting of human resource and
organizational resource which have an important role for the sustainability of good corporate
governance (GCG) principle application.
2. The quality of good corporate governance (GCG) practice in Indonesia public banks is very
determined by the organizational culture dimension. Moreover, the behavior of this dimension is
extremely important for anticipate the individualism behavior of bank leaders.
3. The leadership system dimension is very crucial in assessing the quality of good corporate
governance (GCG) practice in Indonesia public banks. This dimension is also considered as a
major factor in making the rules of good corporate governance (GCG) and it it increases the trust
of bank leaders.
4. The determination of good corporate governance (GCG) quality in Indonesia public banks can be
analyzed from unique capability dimension. This dimension is able to show the structural
relationship among corporate governance, intellectual capital efficiency, and financial
performance.
5. Business environment dimension has a great impact for assessing the quality of good corporate
governance (GCG) practice in Indonesia public banks. The ability of bank leaders can change the
role and function in corporate managing to answer the environment demands and challenges.
6. The assessment of good or bad quality of good corporate governance (GCG) quality practice in
Indonesia public banks can be seen from business partnership dimension. This dimension will
help to increase the professionalism and competency of bank leaders.
7. Dynamic capability dimension has a strong effect for the implementation of good corporate
governance (GCG) in Indonesia public banks.
8. Fit and proper test dimension can be applied as a determinant factor in deciding the quality of
good corporate governance (GCG) practice in Indonesia public banks. In addition, this dimension
also can be recognized as a primary part of critical success in implementing the 5 (five) principles
of good corporate governance (GCG) based on Indonesia Financial Service Authority (OJK).
Recommendation
According to the previous conclusion, there are some recommendations which can be given through
this current research as follows:
1. The determinant factors and criteria in selecting the Indonesia public bank leaders must be done
through process of fit and proper test. Furthermore, the measurement tools applying in this
process must fulfill 7 (seven) factors which can be seen in table 5.1.
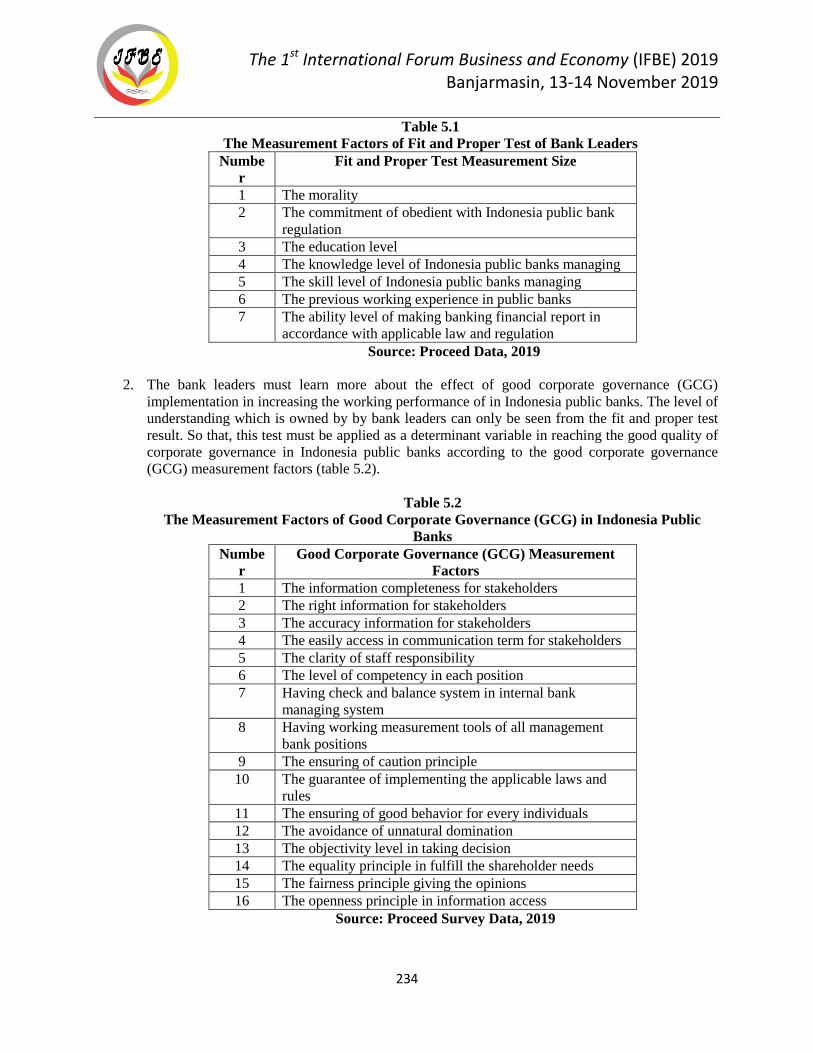
The 1st International Forum Business and Economy (IFBE) 2019 Banjarmasin, 13-14 November 2019
234
Table 5.1
The Measurement Factors of Fit and Proper Test of Bank Leaders
Numbe
r
Fit and Proper Test Measurement Size
1 The morality
2 The commitment of obedient with Indonesia public bank
regulation
3 The education level
4 The knowledge level of Indonesia public banks managing
5 The skill level of Indonesia public banks managing
6 The previous working experience in public banks
7 The ability level of making banking financial report in
accordance with applicable law and regulation
Source: Proceed Data, 2019
2. The bank leaders must learn more about the effect of good corporate governance (GCG)
implementation in increasing the working performance of in Indonesia public banks. The level of
understanding which is owned by by bank leaders can only be seen from the fit and proper test
result. So that, this test must be applied as a determinant variable in reaching the good quality of
corporate governance in Indonesia public banks according to the good corporate governance
(GCG) measurement factors (table 5.2).
Table 5.2
The Measurement Factors of Good Corporate Governance (GCG) in Indonesia Public
Banks
Numbe
r
Good Corporate Governance (GCG) Measurement
Factors
1 The information completeness for stakeholders
2 The right information for stakeholders
3 The accuracy information for stakeholders
4 The easily access in communication term for stakeholders
5 The clarity of staff responsibility
6 The level of competency in each position
7 Having check and balance system in internal bank
managing system
8 Having working measurement tools of all management
bank positions
9 The ensuring of caution principle
10 The guarantee of implementing the applicable laws and
rules
11 The ensuring of good behavior for every individuals
12 The avoidance of unnatural domination
13 The objectivity level in taking decision
14 The equality principle in fulfill the shareholder needs
15 The fairness principle giving the opinions
16 The openness principle in information access
Source: Proceed Survey Data, 2019
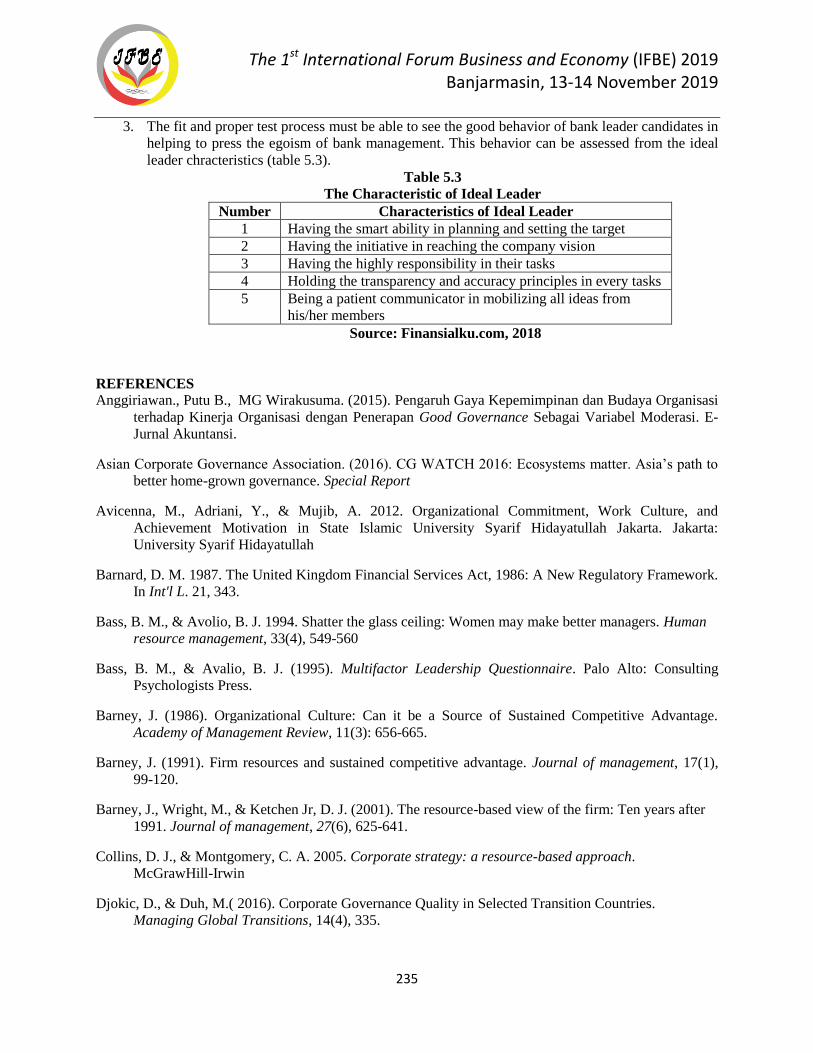
The 1st International Forum Business and Economy (IFBE) 2019 Banjarmasin, 13-14 November 2019
235
3. The fit and proper test process must be able to see the good behavior of bank leader candidates in
helping to press the egoism of bank management. This behavior can be assessed from the ideal
leader chracteristics (table 5.3).
Table 5.3
The Characteristic of Ideal Leader
Number Characteristics of Ideal Leader
1 Having the smart ability in planning and setting the target
2 Having the initiative in reaching the company vision
3 Having the highly responsibility in their tasks
4 Holding the transparency and accuracy principles in every tasks
5 Being a patient communicator in mobilizing all ideas from
his/her members
Source: Finansialku.com, 2018
REFERENCES
Anggiriawan., Putu B., MG Wirakusuma. (2015). Pengaruh Gaya Kepemimpinan dan Budaya Organisasi
terhadap Kinerja Organisasi dengan Penerapan Good Governance Sebagai Variabel Moderasi. E-
Jurnal Akuntansi.
Asian Corporate Governance Association. (2016). CG WATCH 2016: Ecosystems matter. Asia’s path to
better home-grown governance. Special Report
Avicenna, M., Adriani, Y., & Mujib, A. 2012. Organizational Commitment, Work Culture, and
Achievement Motivation in State Islamic University Syarif Hidayatullah Jakarta. Jakarta:
University Syarif Hidayatullah
Barnard, D. M. 1987. The United Kingdom Financial Services Act, 1986: A New Regulatory Framework.
In Int'l L. 21, 343.
Bass, B. M., & Avolio, B. J. 1994. Shatter the glass ceiling: Women may make better managers. Human
resource management, 33(4), 549-560
Bass, B. M., & Avalio, B. J. (1995). Multifactor Leadership Questionnaire. Palo Alto: Consulting
Psychologists Press.
Barney, J. (1986). Organizational Culture: Can it be a Source of Sustained Competitive Advantage.
Academy of Management Review, 11(3): 656-665.
Barney, J. (1991). Firm resources and sustained competitive advantage. Journal of management, 17(1),
99-120.
Barney, J., Wright, M., & Ketchen Jr, D. J. (2001). The resource-based view of the firm: Ten years after
1991. Journal of management, 27(6), 625-641.
Collins, D. J., & Montgomery, C. A. 2005. Corporate strategy: a resource-based approach.
McGrawHill-Irwin
Djokic, D., & Duh, M.( 2016). Corporate Governance Quality in Selected Transition Countries.
Managing Global Transitions, 14(4), 335.
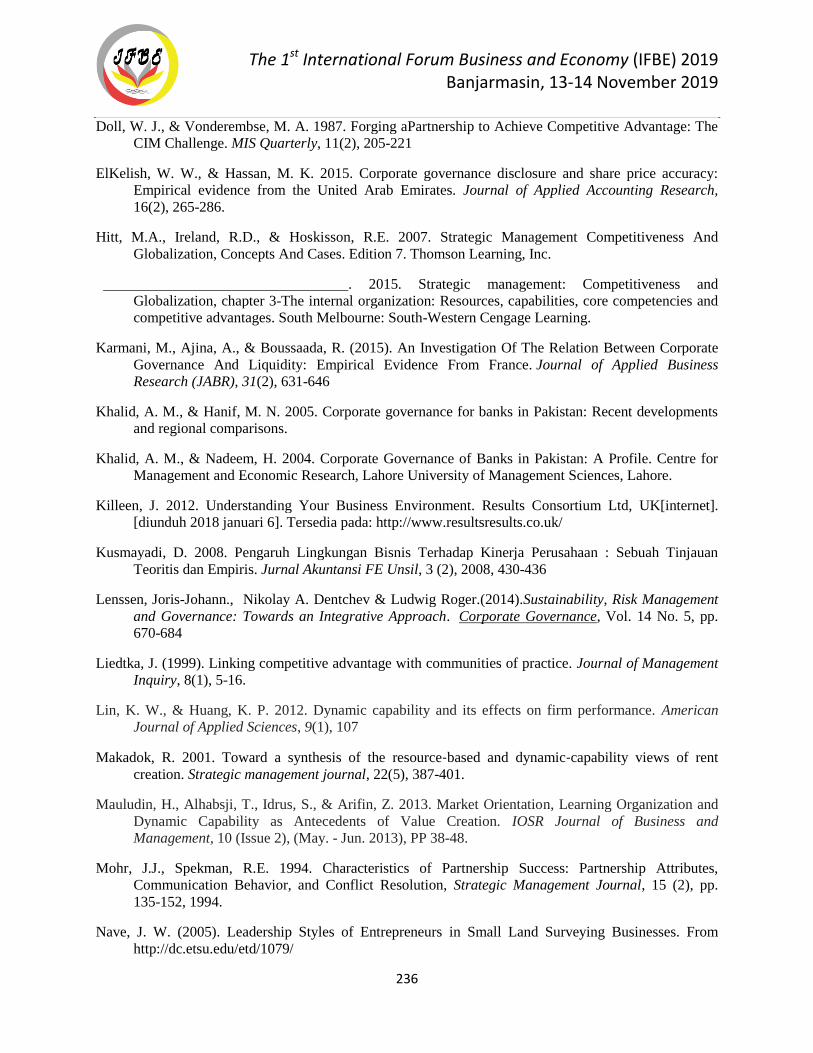
The 1st International Forum Business and Economy (IFBE) 2019 Banjarmasin, 13-14 November 2019
236
Doll, W. J., & Vonderembse, M. A. 1987. Forging aPartnership to Achieve Competitive Advantage: The
CIM Challenge. MIS Quarterly, 11(2), 205-221
ElKelish, W. W., & Hassan, M. K. 2015. Corporate governance disclosure and share price accuracy:
Empirical evidence from the United Arab Emirates. Journal of Applied Accounting Research,
16(2), 265-286.
Hitt, M.A., Ireland, R.D., & Hoskisson, R.E. 2007. Strategic Management Competitiveness And
Globalization, Concepts And Cases. Edition 7. Thomson Learning, Inc.
. 2015. Strategic management: Competitiveness and
Globalization, chapter 3-The internal organization: Resources, capabilities, core competencies and
competitive advantages. South Melbourne: South-Western Cengage Learning.
Karmani, M., Ajina, A., & Boussaada, R. (2015). An Investigation Of The Relation Between Corporate
Governance And Liquidity: Empirical Evidence From France. Journal of Applied Business
Research (JABR), 31(2), 631-646
Khalid, A. M., & Hanif, M. N. 2005. Corporate governance for banks in Pakistan: Recent developments
and regional comparisons.
Khalid, A. M., & Nadeem, H. 2004. Corporate Governance of Banks in Pakistan: A Profile. Centre for
Management and Economic Research, Lahore University of Management Sciences, Lahore.
Killeen, J. 2012. Understanding Your Business Environment. Results Consortium Ltd, UK[internet].
[diunduh 2018 januari 6]. Tersedia pada: http://www.resultsresults.co.uk/
Kusmayadi, D. 2008. Pengaruh Lingkungan Bisnis Terhadap Kinerja Perusahaan : Sebuah Tinjauan
Teoritis dan Empiris. Jurnal Akuntansi FE Unsil, 3 (2), 2008, 430-436
Lenssen, Joris-Johann., Nikolay A. Dentchev & Ludwig Roger.(2014).Sustainability, Risk Management
and Governance: Towards an Integrative Approach. Corporate Governance, Vol. 14 No. 5, pp.
670-684
Liedtka, J. (1999). Linking competitive advantage with communities of practice. Journal of Management
Inquiry, 8(1), 5-16.
Lin, K. W., & Huang, K. P. 2012. Dynamic capability and its effects on firm performance. American
Journal of Applied Sciences, 9(1), 107
Makadok, R. 2001. Toward a synthesis of the resource‐based and dynamic‐capability views of rent
creation. Strategic management journal, 22(5), 387-401.
Mauludin, H., Alhabsji, T., Idrus, S., & Arifin, Z. 2013. Market Orientation, Learning Organization and
Dynamic Capability as Antecedents of Value Creation. IOSR Journal of Business and
Management, 10 (Issue 2), (May. - Jun. 2013), PP 38-48.
Mohr, J.J., Spekman, R.E. 1994. Characteristics of Partnership Success: Partnership Attributes,
Communication Behavior, and Conflict Resolution, Strategic Management Journal, 15 (2), pp.
135-152, 1994.
Nave, J. W. (2005). Leadership Styles of Entrepreneurs in Small Land Surveying Businesses. From
http://dc.etsu.edu/etd/1079/
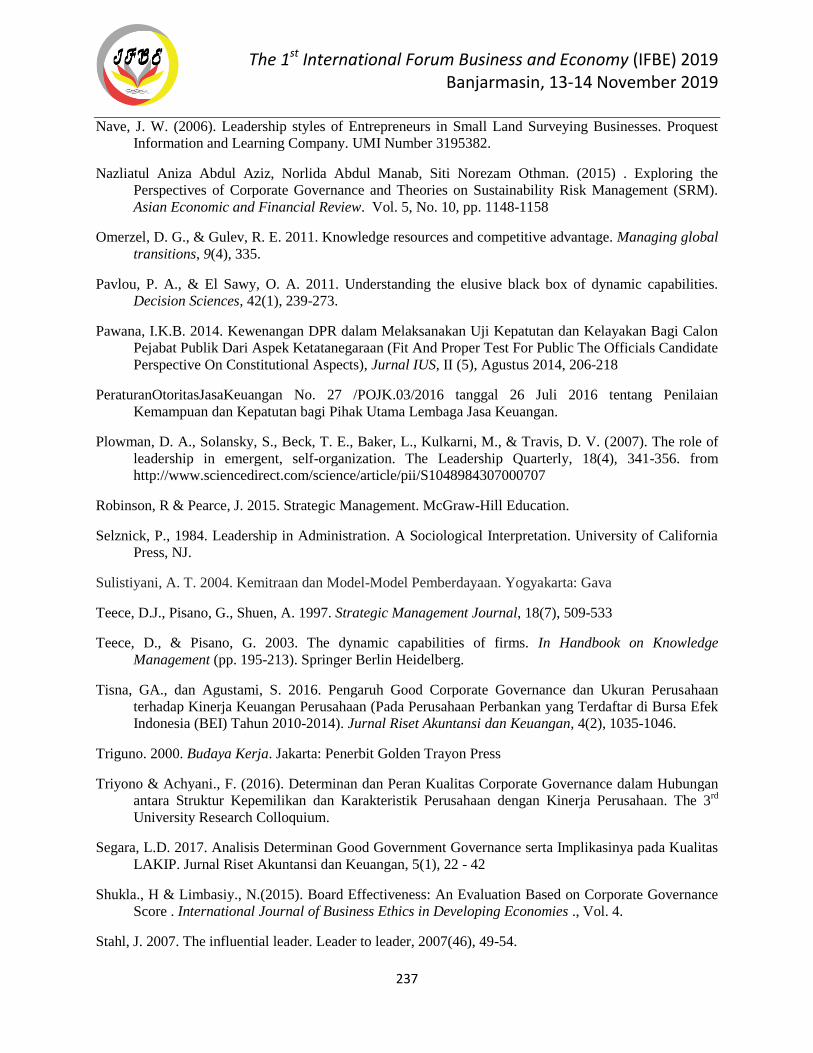
The 1st International Forum Business and Economy (IFBE) 2019 Banjarmasin, 13-14 November 2019
237
Nave, J. W. (2006). Leadership styles of Entrepreneurs in Small Land Surveying Businesses. Proquest
Information and Learning Company. UMI Number 3195382.
Nazliatul Aniza Abdul Aziz, Norlida Abdul Manab, Siti Norezam Othman. (2015) . Exploring the
Perspectives of Corporate Governance and Theories on Sustainability Risk Management (SRM).
Asian Economic and Financial Review. Vol. 5, No. 10, pp. 1148-1158
Omerzel, D. G., & Gulev, R. E. 2011. Knowledge resources and competitive advantage. Managing global
transitions, 9(4), 335.
Pavlou, P. A., & El Sawy, O. A. 2011. Understanding the elusive black box of dynamic capabilities.
Decision Sciences, 42(1), 239-273.
Pawana, I.K.B. 2014. Kewenangan DPR dalam Melaksanakan Uji Kepatutan dan Kelayakan Bagi Calon
Pejabat Publik Dari Aspek Ketatanegaraan (Fit And Proper Test For Public The Officials Candidate
Perspective On Constitutional Aspects), Jurnal IUS, II (5), Agustus 2014, 206-218
PeraturanOtoritasJasaKeuangan No. 27 /POJK.03/2016 tanggal 26 Juli 2016 tentang Penilaian
Kemampuan dan Kepatutan bagi Pihak Utama Lembaga Jasa Keuangan.
Plowman, D. A., Solansky, S., Beck, T. E., Baker, L., Kulkarni, M., & Travis, D. V. (2007). The role of
leadership in emergent, self-organization. The Leadership Quarterly, 18(4), 341-356. from
http://www.sciencedirect.com/science/article/pii/S1048984307000707
Robinson, R & Pearce, J. 2015. Strategic Management. McGraw-Hill Education.
Selznick, P., 1984. Leadership in Administration. A Sociological Interpretation. University of California
Press, NJ.
Sulistiyani, A. T. 2004. Kemitraan dan Model-Model Pemberdayaan. Yogyakarta: Gava
Teece, D.J., Pisano, G., Shuen, A. 1997. Strategic Management Journal, 18(7), 509-533
Teece, D., & Pisano, G. 2003. The dynamic capabilities of firms. In Handbook on Knowledge
Management (pp. 195-213). Springer Berlin Heidelberg.
Tisna, GA., dan Agustami, S. 2016. Pengaruh Good Corporate Governance dan Ukuran Perusahaan
terhadap Kinerja Keuangan Perusahaan (Pada Perusahaan Perbankan yang Terdaftar di Bursa Efek
Indonesia (BEI) Tahun 2010-2014). Jurnal Riset Akuntansi dan Keuangan, 4(2), 1035-1046.
Triguno. 2000. Budaya Kerja. Jakarta: Penerbit Golden Trayon Press
Triyono & Achyani., F. (2016). Determinan dan Peran Kualitas Corporate Governance dalam Hubungan
antara Struktur Kepemilikan dan Karakteristik Perusahaan dengan Kinerja Perusahaan. The 3rd
University Research Colloquium.
Segara, L.D. 2017. Analisis Determinan Good Government Governance serta Implikasinya pada Kualitas
LAKIP. Jurnal Riset Akuntansi dan Keuangan, 5(1), 22 - 42
Shukla., H & Limbasiy., N.(2015). Board Effectiveness: An Evaluation Based on Corporate Governance
Score . International Journal of Business Ethics in Developing Economies ., Vol. 4.
Stahl, J. 2007. The influential leader. Leader to leader, 2007(46), 49-54.
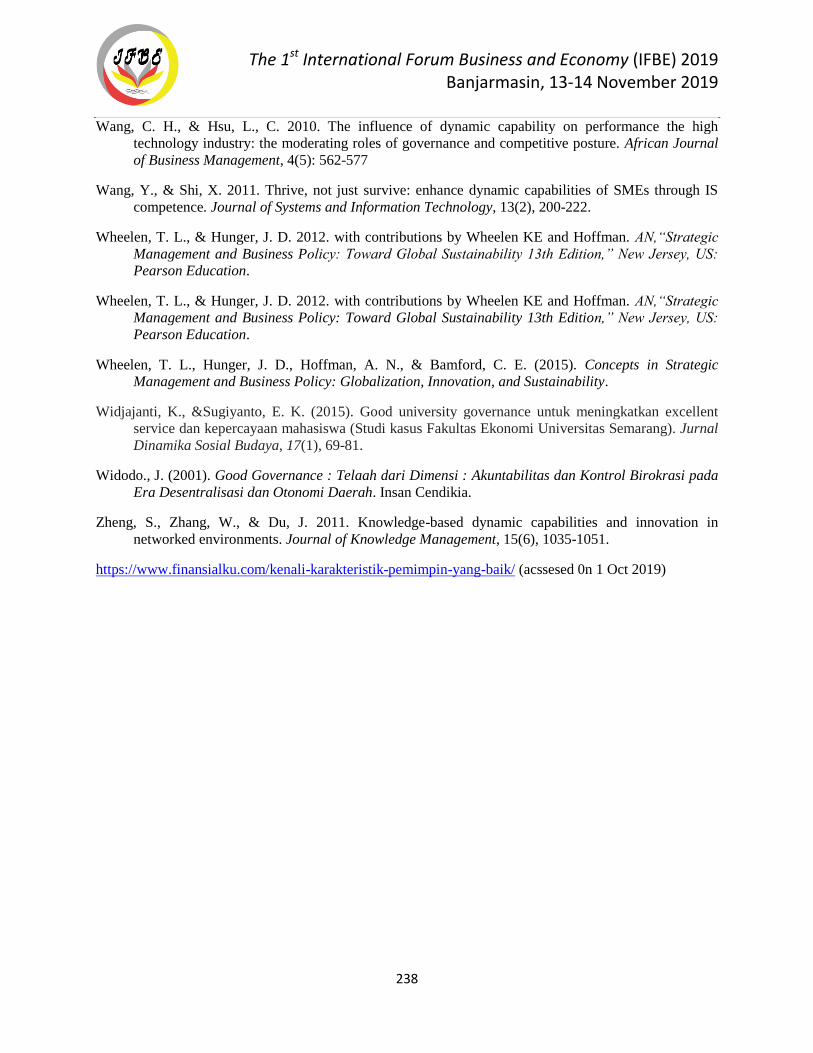
The 1st International Forum Business and Economy (IFBE) 2019 Banjarmasin, 13-14 November 2019
238
Wang, C. H., & Hsu, L., C. 2010. The influence of dynamic capability on performance the high
technology industry: the moderating roles of governance and competitive posture. African Journal
of Business Management, 4(5): 562-577
Wang, Y., & Shi, X. 2011. Thrive, not just survive: enhance dynamic capabilities of SMEs through IS
competence. Journal of Systems and Information Technology, 13(2), 200-222.
Wheelen, T. L., & Hunger, J. D. 2012. with contributions by Wheelen KE and Hoffman. AN,“Strategic
Management and Business Policy: Toward Global Sustainability 13th Edition,” New Jersey, US:
Pearson Education.
Wheelen, T. L., & Hunger, J. D. 2012. with contributions by Wheelen KE and Hoffman. AN,“Strategic
Management and Business Policy: Toward Global Sustainability 13th Edition,” New Jersey, US:
Pearson Education.
Wheelen, T. L., Hunger, J. D., Hoffman, A. N., & Bamford, C. E. (2015). Concepts in Strategic
Management and Business Policy: Globalization, Innovation, and Sustainability.
Widjajanti, K., &Sugiyanto, E. K. (2015). Good university governance untuk meningkatkan excellent
service dan kepercayaan mahasiswa (Studi kasus Fakultas Ekonomi Universitas Semarang). Jurnal
Dinamika Sosial Budaya, 17(1), 69-81.
Widodo., J. (2001). Good Governance : Telaah dari Dimensi : Akuntabilitas dan Kontrol Birokrasi pada
Era Desentralisasi dan Otonomi Daerah. Insan Cendikia.
Zheng, S., Zhang, W., & Du, J. 2011. Knowledge-based dynamic capabilities and innovation in
networked environments. Journal of Knowledge Management, 15(6), 1035-1051.
https://www.finansialku.com/kenali-karakteristik-pemimpin-yang-baik/ (acssesed 0n 1 Oct 2019)
IFBE 2019
FACULTY OF ECONOMICS AND BUSINESSLAMBUNG MANGKURAT UNIVERSITY
PUBLISHED BY:
https://ifbe.ulm.ac.id/