The Proceedings of the 2012 Equine Chapter Meeting at the ...
Upload
khangminh22Category
view
0download
0
IOBC / WPRS
Working Group „Integrated Control in Cereal Crops“
OILB / SROP
Groupe de Travail „Lutte Intégrée en Céréales“
Proceedings of the meeting
at
Gödöllö, Hungary
9 - 12 September, 1999
editors:
Christian Borgemeister & Hans-Michael Poehling
IOBC wprs Bulletin Bulletin OILB srop Vol. 24 (4) 2001
The IOBC/WPRS Bulletin is published by the International Organization for Biological and Integrated Control of Noxious Animals and Plants, West Palearctic Regional Section (IOBC/WPRS) Le Bulletin OILB/SROP est publié par l‘Organisation Internationale de Lutte Biologique et Intégrée contre les Animaux et les Plantes Nuisibles, section Regionale Ouest Paléarctique (OILB/SROP) Copyright: IOBC/WPRS 2001
The Publication Commission of the IOBC/WPRS: Horst Bathon Federal Biological Research Center for Agriculture and Forestry (BBA) Institute for Biological Control Heinrichstr. 243 D-64287 Darmstadt (Germany) Tel +49 6151 407-225, Fax +49 6151 407-290 e-mail: [email protected]
Luc Tirry University of Gent Laboratory of Agrozoology Department of Crop Protection Coupure Links 653 B-9000 Gent (Belgium) Tel +32-9-2646152, Fax +32-9-2646239 e-mail: [email protected]
Address General Secretariat: INRA – Centre de Recherches de Dijon Laboratoire de recherches sur la Flore Pathogène dans le Sol 17, Rue Sully, BV 1540 F-21034 DIJON CEDEX France ISBN 92-9067-135-8
i
Preface This bulletin contains most of the papers presented on the last biennial meeting of the IOBC/WPRS working group “Integrated Control in Cereal Crops”. The meeting took place at Gödöllö University of Agricultural Sciences, Faculty of Agricultural Sciences, Department of Plant Protection, Hungary, from 09 to 12 September 1999. The meeting was hosted by Prof. Dr. Jozef Kiss. First of all on the behalf of our group I want to express my deepest gratitude to Jozef Kiss and his staff who organised an excellent meeting and a very pleasant stay for us in Gödöllö. Also thanks to the supporting organisations, i.e. IOBC, Gödöllö University of Agricultural Sciences, The Ministry of Agriculture & Regional Development of Hungary and OMFB (National Committee for Technological Development of Hungary). More than 30 participants attended the meeting and spent fruitful days to present papers, discuss scientific progress and establish new contacts. Particularly the increasing number of participants from eastern and southern European countries was stimulating. However, quite obviously integrated control of cereal pests is no longer a major research topic in many middle and northern European countries that previously dominated our working group. This situation needs to be critically discussed on the next meeting to assure a new orientation of the working group. Finally I am extremely thankful to Christian Borgemeister for his tremendous effort in compiling these proceedings. Hans-Michael Poehling, Convenor Hannover University
ii
List of the Participants AFONINA, V.M. Moscow State University Faculty of Biology, Dept. Entomology Moscow 119899, RUSSIA
ALBAJES, R. Centre UdL-IRTA. Area de Protecció de Conreus Rovira Roure, 177 E-25198 Lleida, SPAIN
BASKY, Z. Plant Protection Institute Hungarian Academy of Sciences P.O.Box 102 H-1525 Budapest, HUNGARY
BERECS-BAHDI, G. Plant Health and Soil Conservation Station H-2100 Gödöllő, HUNGARY
FIEBIG, M. Institut für Pflanzenkrankheiten und Pflanzenschutz Universität Hannover Herrenhäuser Str. 2 D-30419 Hannover, GERMANY
FREIER, B. BBA - Institut für integrierten Pflanzenschutz Stahnsdorfer Damm 81 D-14532 Kleinmachnow, GERMANY
GALLER, M. Institut für Pflanzenkrankheiten und Pflanzenschutz Universität Hannover Herrenhäuser Str. 2 D-30419 Hannover, GERMANY
GOSSELKE, U. BBA - Institut für integrierten Pflanzenschutz Stahnsdorfer Damm 81 D-14532 Kleinmachnow, GERMANY
GUEORGUIEVA, T. Agricultural University, Dept. of Entomology 12 Mendeleev St. 4000 - Plovdiv, BULGARIA
GOTLIN CULIAK, T. Faculty of Agriculture Dept. of Zoology Svetosimunska 25 10000 Zagreb, CROATIA
iii
HATVANI, A. University of Horticulture Erdei F. tér 1-3 H-6000 Kecskemét, HUNGARY
HULLÉ, M. INRA, Laboratoire de Zoologie Domaine de la Motte-au-Vicomte, BP 29 F-356530 Le Rheu Cedex, FRANCE
HUUSELA-VEISTOLA, E. Agricultural Research Centre of Finland Plant Protection Research FIN-31600 Jokioinen, FINLAND
IGRC-BARČIĆ, J. Faculty of Agriculture Dept. of Zoology Svetosimunska 25 10000 Zagreb, CROATIA
KISS, J. Szent István University Páter K u. 1 H-2100 Gödöllő, HUNGARY
KOZMA, E. University of Agricultural Sciences Dept. of Plant Protection Pater U u. 1 H-2100 Gödöllő, HUNGARY
KROMP, B. L. Boltzmann Institut für biologische Landwirtschaft Rinnboeckstr. 15 A-1110 Wien, AUSTRIA
LHALOUI, S. INRA-CRPA-Settat P.O. Box 589 Settat, MOROCCO
LUCZA, Z. Plant Health and Soil Conservation Station Sapitol H-1119 Budapest, HUNGARY
MAKKÓ, V. University of Horticulture, Dept. of Entomology Mènes. ut 44
H-1118 Budapest, HUNGARY
MATEEVA-RADEVA, A. Agricultural University, Dept. of Entomology 12 Mendeleev St. 4000 - Plovdiv, BULGARIA
MEINDL, P. L. Boltzmann Institut für biologische Landwirtschaft Rinnboeckstr. 15 A-1110 Wien, AUSTRIA
MIHÁLY, B. Institute for Nature Conservation of the Institute for Environmental Management Költő u. 21 H-1121 Budapest, HUNGARY
PAPP, E. Plant Health and Soil Conservation Station H-1119 Budapest, HUNGARY
iv
POEHLING, H.-M. Institut für Pflanzenkrankheiten und Pflanzenschutz Universität Hannover Herrenhäuser Str. 2 D-30419 Hannover, GERMANY
PONS, X. Centre UdL-IRTA Area de Protecció de Conreus Rovira Roure, 177 E-25198 Lleida, SPAIN
SAMU, F. Hungarian Academy of Sciences Dept. of Plant Protection PO Box 102 H-1525 Budapest, HUNGARY
SZAKÀL, M. Plant Health and Soil Conservation Station Kòtlán ε u. 3
H-2100 Gödöllő, HUNGARY
SZENTKIRÁLYI, F. Institute of Plant Protection H.A.S. Dept. of Zoology P.O. Box 102 H-1525 Budapest, HUNGARY
TÓKÉS, G. Plant Health and Soil Conservation Station Budaörsi út 141 H-1118 Budapest, HUNGARY
TÓTH, F. Szent István University Páter K u. 1 H-2100 Gödöllő, HUNGARY
TRILTSCH, H. BBA - Institut für integrierten Pflanzenschutz Stahnsdorfer Damm 81 D-14532 Kleinmachnow, GERMANY
TSHERNYSHEV, W. Moscow State University Faculty of Biology, Dept. Entomology Moscow 119899, RUSSIA
VÖRÖS, G. Tolna County Plant Health and Soil Conservation Station, SZEKSZARD
WINKLER, I. Plant Health and Soil Conservation Station Kòtlán ε u. 3 H-2100 Gödöllő, HUNGARY
v
Contents Variability in the timing of sexual morph production in the aphid Rhopalosiphum padi
Hullé, M., D. Maurice, V. Stevoux, J. Bonhomme, C. Rispe & J.-Chr. Simon ................. 1
Biotypic variation of Diuraphis noxia (Homoptera: Aphididae) between South Africa and Hungary Basky, Z. & J. Jordaan ...................................................................................................... 9
Impact of barley yellow dwarf virus infection on physiological conditions of wheat and the consequences for cereal aphids attack Fiebig, M. & H.-M. Poehling .......................................................................................... 25
The Russian wheat aphid on barley in Morocco: survey and identification of new sources of resistance Lhaloui, S., M. El Bouhssini, S. Ceccarelli, S. Grando & A. Amri ................................. 33
Effects of induced tolerance and induced resistance against aphids in wheat Galler, M. & H.-M. Poehling .......................................................................................... 39
How does a ladybird respond to aphids? Triltsch, H., G. Hechenthaler, U. Gosselke & B. Freier ................................................. 49
Computer simulations on the efficiency of cereal aphid predators in winter wheat Gosselke, U., D. Roßberg, H. Triltsch & B. Freier ......................................................... 59
Potentials and limitations of long-term field data to identify numerical and functional responses of predators to aphid density in wheat Freier, B., Triltsch, H. & U. Gosselke ............................................................................. 65
Density of epigeal predators on maize plants untreated and treated with imidacloprid Pons, X. & R. Albajes ...................................................................................................... 73
Arthropod natural enemies of the cereal leaf beetle (Oulema melanopus L.) in organic winter wheat fields in Vienna, Eastern Austria Meindl, P., B. Kromp, B. Bartl & E. Ioannidou .............................................................. 79
Habitat preference of carabids (Coleoptera: Carabidae) in Central Hungary in winter wheat field and in adjacent habitats Hatvani, A., F. Kádár, J. Kiss & G. Péter ....................................................................... 87
Role of field margin in the winter phenophase of Carabid beetles (Coleoptera: Carabidae) in winter wheat field Péter, G., F. Kádár, J. Kiss & F. Tóth............................................................................. 91
Insect pests of cereals in Croatia Igrc-Barčić, J. & T. Gotlin Culjak................................................................................... 95
The Hessian fly in Morocco: Surveys, loss assessment, and genetic resistance in bread wheat Lhaloui, S., M. El Bouhssini & A. Amri......................................................................... 101
vi
Ecological Pest Management (EPM): General Problems Tshernyshev, W.B........................................................................................................... 109
Hessian fly (Mayetiola destructor Say) damage in relay intercropping of cereals in Finland Huusela-Veistola, E., A. Vasarainen & J. Grahn .......................................................... 113
Results of a nation-wide survey of spider assemblages in Hungarian cereal fields Samu, F., F. Tóth, C. Szinetár, G. Vörös & E. Botos .................................................... 119
Agrobiological and biocenological study of winter oats (A. sativa L.) Gueorguieva, T. & A. Mateeva ...................................................................................... 129
Side effects of some pesticides on aphid specific predators in winter wheat Mateeva, A., M. Vassileva & T. Gueorguieva ............................................................... 139
Influence of the stubble burning on some pests and earth-worms density Mateeva, A., D. Svetleva, D. Andonov & St. Stratieva .................................................. 143
A study of aphid predation by Coccinella septempunctata L. (Coleoptera: Coccinellidae) using gut dissection Triltsch, H. ..................................................................................................................... 147
Arthropod complex of winter wheat crops and its seasonal dynamics Afonina, V.M., W.B. Tshernyshev, I.I. Soboleva-Dokuchaeva, A.V. Timokhov, O.V. Timokhova & R.R. Seifulina .................................................................................. 153
Studies of the pests of Canary-grass (Phalaris canariensis L.) Kozma, E., G. Gólya & Z. Záhorszki .............................................................................. 165
Integrated Control in Cereal Crops IOBC wprs Bulletin 24 (6) 2001
pp. 1 - 7
1
Variability in the timing of sexual morph production in the aphid Rhopalosiphum padi
Maurice Hullé, Damien Maurice, Véronique Stevoux, Joel Bonhomme, Claude Rispe and Jean-Christophe Simon INRA, Laboratoire de Zoologie, 35653 Le Rheu Cedex, France
Summary In host-alternating aphid species, the latest a clone switches to sexual production the highest is its rate of increase because the parthenogenetic phase is longer. Nevertheless clones are constrained to lay eggs before leaf fall of the primary host. In this paper, we have studied the variation in sexual morph production of several cyclical parthenogenetic clones of the aphid Rhopalosiphum padi which alternate between cereals and Prunus padus, the bird cherry. Ten clones of this species differing by their geographic origin (five from western and five from eastern France) were placed in two laboratory-simulated environments, mimicking the changes of photo-period and thermo-period occurring naturally from the end of summer and during the autumn in oceanic and continental conditions. The analysis of clonal responses in both climatic conditions showed (i) no geographic adaptation among clones, (ii) an earlier production of sexuals in continental conditions and (iii) a higher production of males in oceanic conditions. Furthermore, we have compared the dates of first appearance of sexuals in our experiments with those occurring in the field based on suction trap database. Sexuals were observed in nature at least four weeks earlier than in the lab. Placed in semi-natural conditions, the responses of the clones were similar to those observed under field conditions. These results underline the need for a better understanding of the influence of the whole array of environmental factors, inducing the transition from parthenogenetic to sexual reproduction in aphids.
Key words: Rhopalosiphum padi, geographic clones, overwintering, reproductive strategy, thermo-
period, photo-period
Introduction In cyclical parthenogenetic populations of many host-alternating species, the parthenogenetic phase occurs during the spring and summer on herbaceous plants (the secondary hosts), and sexual reproduction occurs on a woody plant (the primary host). At the end of summer and the beginning of autumn, two morphs are involved in the return flight to the primary host: gynoparae and males. Gynoparae are winged parthenogenetic females, giving birth on the primary host to oviparous sexual females. The timing of the switch to the sexual phase is important for a clone to maximise its fitness. The later cyclical parthenogenetic clones switch to sexual reproduction to increase their fitness, because the growth season is longer. Nevertheless, these clones are constrained to switch to the sexual phase before the leaf fall of the primary host on which eggs are laid. All individuals involved in sexual reproduction have to be produced synchronously between clones to ensure the mating rendezvous. Together, short day-lengths and low temperatures induce the development of both gynoparae and males in species like Rhopalosiphum padi (L.) (Dixon & Glen, 1971), Myzus persicae (Sulzer) (Blackman, 1975), Dysaphis plantaginea (Passerini) (Bonnemaison, 1970). Aphids may, however, show a variability in their responses to these environmental cues.
Rhopalosiphum padi, which is a major vector of BYDV on winter cereals (Dedryver & Gelé, 1982; Leather et al. 1989) alternates between Poaceae (secondary hosts) and the bird
2
cherry, Prunus padus (primary host). In the autumn, the date of gynoparae and males production may influence the date of departure from the secondary hosts and therefore the risk of BYDV transmission. Regional variation in the timing of the first males of R. padi caught in suction traps were reported in Great Britain and were related to photoperiodic differences among sites. Males were recorded earlier in the north of the UK (Tatchell, 1988), and these observations were confirmed experimentally. Clones from northern UK switch to sexual reproduction earlier than clones from southern regions (Austin et al., 1996). Results from these authors suggested also that the effect of photo-period was modulated by temperature.
Concerning R. padi, several questions remain open. When should a clone switch to sexual reproduction in the field? Is there any clonal variability in the responses to conditions inducing the production of sexuals? Is there any geographic adaptation of the responses to these inducing conditions? In order to answer these questions, several clones of R. padi, differing by their geographic origin, were placed in two laboratory environments, mimicking the change of photo-period and thermo-period, occurring naturally from the end of summer in oceanic and continental conditions, respectively. Experimental results concerning the timing of sexual morph production of clones were compared with field observations and semi-natural experiment. Materials and methods Aphid clones Two groups of five cyclical parthenogenetic clones of R. padi were tested. These clones were collected on the primary host, and before the spring migration in two regions of France differing in winter climate. The first five clones were collected in a continental region (Colmar, eastern France), and the last five in an oceanic region (Rennes, western France). These two regions were 800 km apart.
After collection and before the experiments, the 20 clones were maintained at 20°C and a light regime of L:D 16:8 on wheat seedlings (cv. Arminda) to ensure continuous parthenogenetic reproduction (Simon et al., 1991).
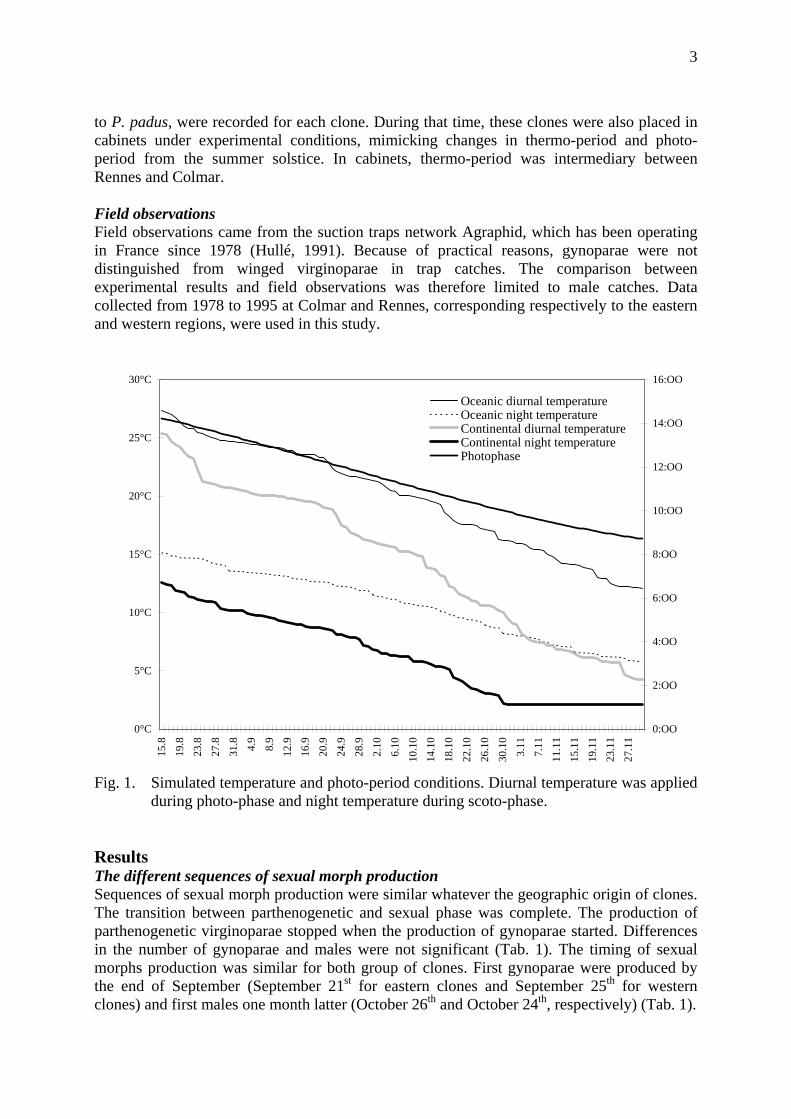
Experiments In a first experiment and in order to mimic changes in photo-period and thermo-period at the end of summer and during autumn, light and temperature daily regime recorded for a mild season at Rennes (oceanic condition) and a cold season at Colmar (continental condition) were simulated in two programmable cabinets from August 15th (before the beginning of sexuals production) to November 30th (after the end of sexuals production) (Fig. 1). The simulated photo-periodic decrease corresponded to the latitude of Rennes and Colmar (48°07' North). Diurnal and nocturnal temperatures were applied during photo-phase and scoto-phase respectively.
Both experiments, simulating oceanic and continental conditions, were started with ten fourth instar alatiform larvae of each of the 10 clones. Aphids were placed in Perspex boxes and reared on wheat seedlings (cv. Arminda). Twice a week, all mature winged aphids were removed from Perspex boxes with a fine brush, and identified as winged virginoparae, males or gynoparae. Gynoparae and virginoparae were distinguished with the squash blot test (Lowles, 1995).
In a second experiment, and in order to monitor the timing of sexual morphs under natural conditions, the same clones were placed outdoor from the summer solstice, each in a cage containing wheat and a P. padus sapling. First gynoparae and males, which typically fly
3
to P. padus, were recorded for each clone. During that time, these clones were also placed in cabinets under experimental conditions, mimicking changes in thermo-period and photo-period from the summer solstice. In cabinets, thermo-period was intermediary between Rennes and Colmar. Field observations Field observations came from the suction traps network Agraphid, which has been operating in France since 1978 (Hullé, 1991). Because of practical reasons, gynoparae were not distinguished from winged virginoparae in trap catches. The comparison between experimental results and field observations was therefore limited to male catches. Data collected from 1978 to 1995 at Colmar and Rennes, corresponding respectively to the eastern and western regions, were used in this study.
Fig. 1. Simulated temperature and photo-period conditions. Diurnal temperature was applied
during photo-phase and night temperature during scoto-phase. Results The different sequences of sexual morph production Sequences of sexual morph production were similar whatever the geographic origin of clones. The transition between parthenogenetic and sexual phase was complete. The production of parthenogenetic virginoparae stopped when the production of gynoparae started. Differences in the number of gynoparae and males were not significant (Tab. 1). The timing of sexual morphs production was similar for both group of clones. First gynoparae were produced by the end of September (September 21st for eastern clones and September 25th for western clones) and first males one month latter (October 26th and October 24th, respectively) (Tab. 1).
0°C
5°C
10°C
15°C
20°C
25°C
30°C
15.8
19.8
23.8
27.8
31.8 4.9
8.9
12.9
16.9
20.9
24.9
28.9
2.10
6.10
10.1
014
.10
18.1
0
22.1
026
.10
30.1
03.
117.
1111
.11
15.1
119
.11
23.1
127
.11
0:OO
2:OO
4:OO
6:OO
8:OO
10:OO
12:OO
14:OO
16:OO
Oceanic diurnal temperatureOceanic night temperatureContinental diurnal temperatureContinental night temperaturePhotophase
4
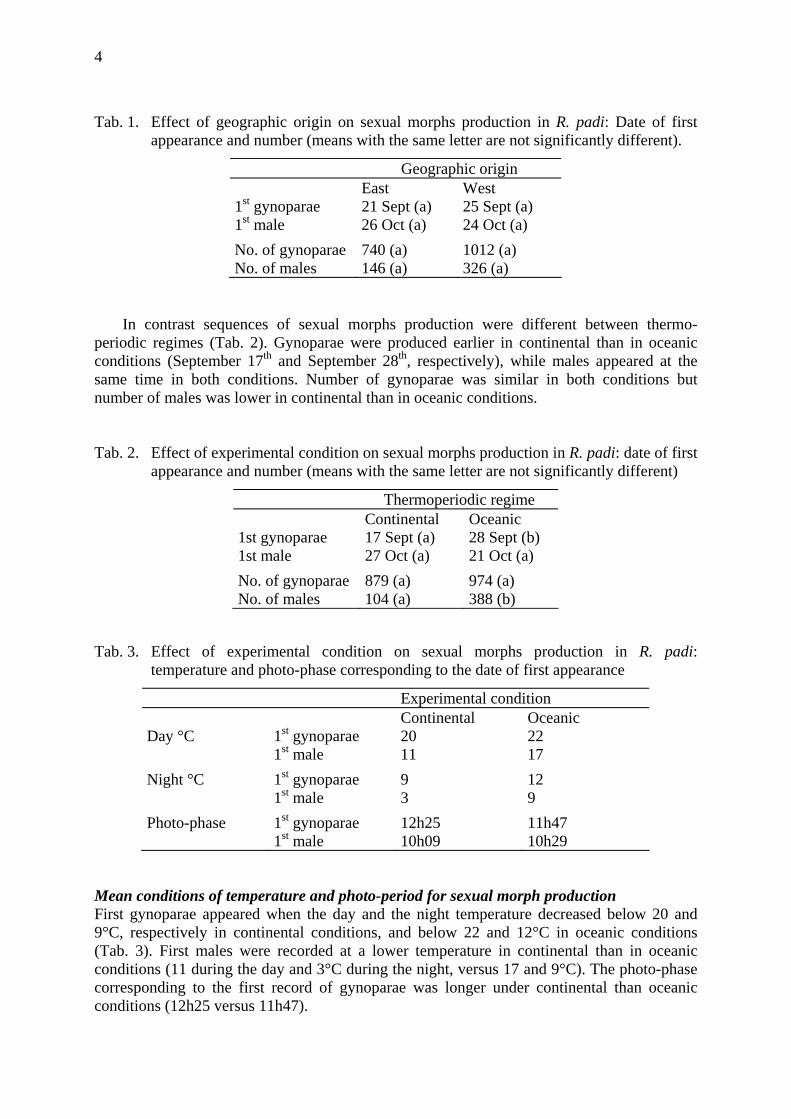
Tab. 1. Effect of geographic origin on sexual morphs production in R. padi: Date of first appearance and number (means with the same letter are not significantly different).
Geographic origin East West 1st gynoparae 21 Sept (a) 25 Sept (a) 1st male 26 Oct (a) 24 Oct (a) No. of gynoparae 740 (a) 1012 (a) No. of males 146 (a) 326 (a)
In contrast sequences of sexual morphs production were different between thermo-periodic regimes (Tab. 2). Gynoparae were produced earlier in continental than in oceanic conditions (September 17th and September 28th, respectively), while males appeared at the same time in both conditions. Number of gynoparae was similar in both conditions but number of males was lower in continental than in oceanic conditions. Tab. 2. Effect of experimental condition on sexual morphs production in R. padi: date of first
appearance and number (means with the same letter are not significantly different)
Tab. 3. Effect of experimental condition on sexual morphs production in R. padi:
temperature and photo-phase corresponding to the date of first appearance
Experimental condition Continental Oceanic Day °C 1st gynoparae 20 22 1st male 11 17 Night °C 1st gynoparae 9 12 1st male 3 9 Photo-phase 1st gynoparae 12h25 11h47 1st male 10h09 10h29
Mean conditions of temperature and photo-period for sexual morph production First gynoparae appeared when the day and the night temperature decreased below 20 and 9°C, respectively in continental conditions, and below 22 and 12°C in oceanic conditions (Tab. 3). First males were recorded at a lower temperature in continental than in oceanic conditions (11 during the day and 3°C during the night, versus 17 and 9°C). The photo-phase corresponding to the first record of gynoparae was longer under continental than oceanic conditions (12h25 versus 11h47).
Thermoperiodic regime Continental Oceanic 1st gynoparae 17 Sept (a) 28 Sept (b) 1st male 27 Oct (a) 21 Oct (a) No. of gynoparae 879 (a) 974 (a) No. of males 104 (a) 388 (b)
5
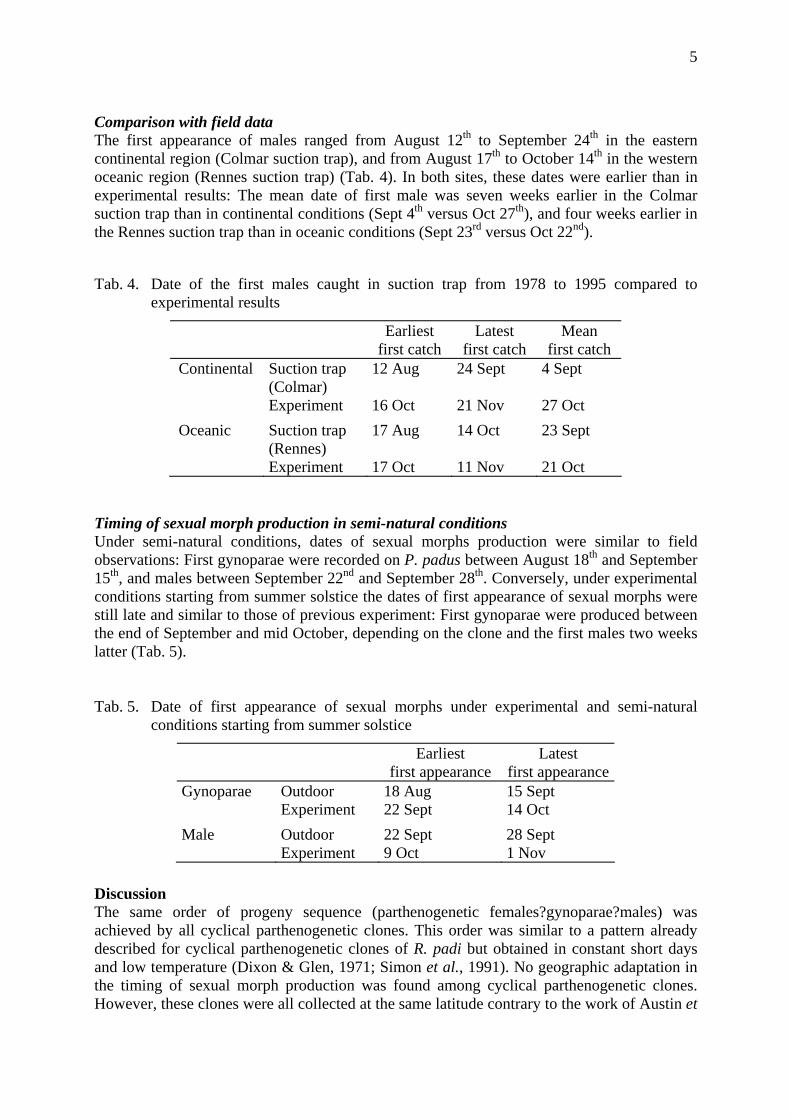
Comparison with field data The first appearance of males ranged from August 12th to September 24th in the eastern continental region (Colmar suction trap), and from August 17th to October 14th in the western oceanic region (Rennes suction trap) (Tab. 4). In both sites, these dates were earlier than in experimental results: The mean date of first male was seven weeks earlier in the Colmar suction trap than in continental conditions (Sept 4th versus Oct 27th), and four weeks earlier in the Rennes suction trap than in oceanic conditions (Sept 23rd versus Oct 22nd).
Tab. 4. Date of the first males caught in suction trap from 1978 to 1995 compared to experimental results
Earliest first catch
Latest first catch
Mean first catch
Continental Suction trap (Colmar)
12 Aug 24 Sept 4 Sept
Experiment 16 Oct 21 Nov 27 Oct Oceanic Suction trap
(Rennes) 17 Aug 14 Oct 23 Sept
Experiment 17 Oct 11 Nov 21 Oct
Timing of sexual morph production in semi-natural conditions Under semi-natural conditions, dates of sexual morphs production were similar to field observations: First gynoparae were recorded on P. padus between August 18th and September 15th, and males between September 22nd and September 28th. Conversely, under experimental conditions starting from summer solstice the dates of first appearance of sexual morphs were still late and similar to those of previous experiment: First gynoparae were produced between the end of September and mid October, depending on the clone and the first males two weeks latter (Tab. 5).
Tab. 5. Date of first appearance of sexual morphs under experimental and semi-natural conditions starting from summer solstice
Earliest first appearance
Latest first appearance
Gynoparae Outdoor 18 Aug 15 Sept Experiment 22 Sept 14 Oct Male Outdoor 22 Sept 28 Sept Experiment 9 Oct 1 Nov
Discussion The same order of progeny sequence (parthenogenetic females?gynoparae?males) was achieved by all cyclical parthenogenetic clones. This order was similar to a pattern already described for cyclical parthenogenetic clones of R. padi but obtained in constant short days and low temperature (Dixon & Glen, 1971; Simon et al., 1991). No geographic adaptation in the timing of sexual morph production was found among cyclical parthenogenetic clones. However, these clones were all collected at the same latitude contrary to the work of Austin et
6
al. (1996) showing an effect of latitude on the progeny sequences of R. padi clones from different sites in Great Britain, and the experiments of Lushai et al. (1996), which showed an effect of latitude on photo-periodic responses for sexual morph production.
In our experiments, the simulated photo-phase decrease was the same in both oceanic and continental conditions. There was only a difference in temperature which was lower and decreased more rapidly in continental than in oceanic conditions. Gynoparae were produced earlier in continental conditions at a mean day temperature of 14.5°C, and a photo-phase of 12h25 and later in oceanic conditions at a mean day temperature of 16.9°C, and a photo-phase of 11h47. These results suggest, that sexuals production depends on a combination of both factors which varies with geographic location. In this way and as long as temperature is high enough, aphids should sustain parthenogenetic reproduction. This strategy represents a selective advantage because it increases the fitness of clones. The reasoning was here applied to production date of gynoparae, as they should precede males to maximise the success of mating (Ward & Wellings, 1994). It could be applied just as well to the males and probably to previous generations because parents are sensitive to photo-period during the beginning of their nymphal life (Dixon & Dewar, 1974).
The number of males produced in continental conditions seemed very low. Since males are produced after gynoparae, the unexpected earlier mortality of parents may explain a deficit in males. This might have been the case in our experiment, because the daily temperatures were 7°C lower in continental than in oceanic conditions, suggesting that complete sequences could not be achieved in a colder climate.
The time lag of nearly 4 weeks observed between the first sexual morphs in experimental conditions and in field or semi-natural observations underline the need for a better understanding of the influence of the whole array of environmental factors inducing the transition from parthenogenetic to sexual reproduction, especially with the aim of predicting the timing of autumnal migration of virus vectors. References Austin, A.B., Tatchell, G.M., Harrington, R. & Bale, J.S., 1996: Adaptative significance of
changes in morph production during the transition from parthenogenetic to sexual reproduction in the aphid Rhopalosiphum padi (Homoptera: Aphididae). Bulletin of Entomological Research 86: 93-99.
Blackman, R.L., 1975: Photoperiodic determination of the male and female sexual morphs of Myzus persicae. Journal of Insect Physiology 21: 435-453.
Bonnemaison, L., 1970: Action de la photopériode sur la production des gynopares ailées de Dysaphis plantaginea Pass. Ann. Zool. Ecol. Anim. 2: 523-554.
Dedryver, C.A. & Gelé, A., 1982: Biologie des pucerons des céréales dans l'Ouest de la France IV. - Etude de l'hivernation de populations anholocycliques Rhopalosiphum padi L., Metopolophium dirhodum Wlk. et Sitobion avenae F. sur repousses de céréales, dans trois stations de Bretagne et du Bassin parisien. Acta Oecologica Oecologia Applicata 3: 321-342.
Dixon, A.F. & Dewar, A.M., 1974: The time of determination of gynoparae and males in the bird cherry-oat aphid, Rhopalosiphum padi. Annals of Applied Biology 78: 1-6.
Dixon, A.F. & Glen, D.M., 1971: Morph determination in the bird cherry-oat aphid, Rhopalosiphum padi L. Annals of Applied Biology 68: 11-21.
Hullé, M., 1991: Agraphid, un réseau de surveillance des populations de pucerons : base de données associée et domaines d'application. Annales ANPP 2: 103-113.
7
Leather, S.R., Walters, K.F. & Dixon, A.F., 1989: Factors determining the pest status of the bird cherry-oat aphid, Rhopalosiphum padi (L.) (Hemiptera: Aphididae), in Europe: a study and a review. Bulletin of Entomological Research 79: 345-360.
Lowles, A., 1995: A quick method for distinguishing between the two autumn winged female morphs of the aphid Rhopalosiphum padi. Entomologia Experimentalis et Applicata 74: 95-99.
Lushai, G., Hardie, J. & Harrington, R., 1996: Diapause termination and egg hatch in the bird cherry aphid, Rhopalosiphum padi. Entomologia Experimentalis et Applicata 81: 113-115.
Simon, J.C., Blackman, R.L. & Le Gallic, J.F., 1991: Local variability in the life cycle of the bird cherry-oat aphid, Rhopalosiphum padi (Homoptera: Aphididae) in western France. Bulletin of Entomological Research 81: 315-322.
Tatchell, G.M., 1988: Regional adaptations in the phenology of a migrant aphid Rhopalosiphum padi (Homoptera: Aphididae) (Abstract). Proceeding of the 18th International Congress of Entomology, 182.

8
Integrated Control in Cereal Crops IOBC wprs Bulletin 24 (6) 2001
pp. 9 - 23
9
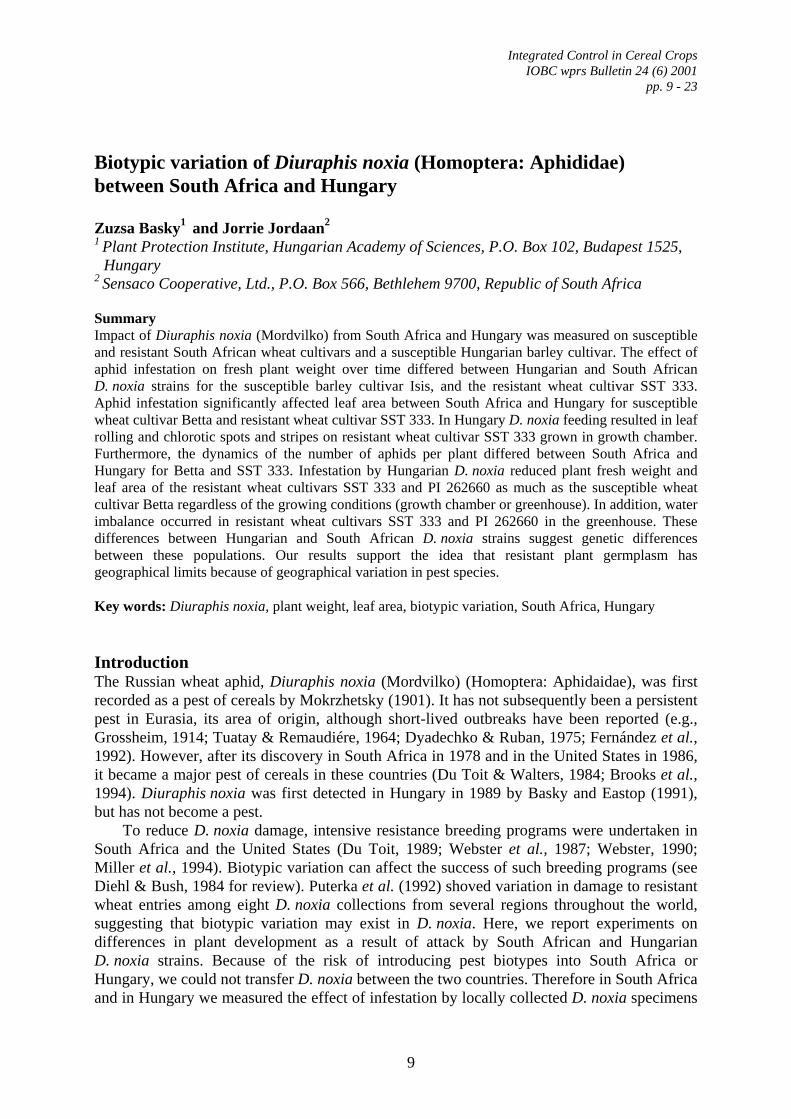
Biotypic variation of Diuraphis noxia (Homoptera: Aphididae) between South Africa and Hungary Zuzsa Basky1 and Jorrie Jordaan2 1 Plant Protection Institute, Hungarian Academy of Sciences, P.O. Box 102, Budapest 1525,
Hungary 2 Sensaco Cooperative, Ltd., P.O. Box 566, Bethlehem 9700, Republic of South Africa Summary Impact of Diuraphis noxia (Mordvilko) from South Africa and Hungary was measured on susceptible and resistant South African wheat cultivars and a susceptible Hungarian barley cultivar. The effect of aphid infestation on fresh plant weight over time differed between Hungarian and South African D. noxia strains for the susceptible barley cultivar Isis, and the resistant wheat cultivar SST 333. Aphid infestation significantly affected leaf area between South Africa and Hungary for susceptible wheat cultivar Betta and resistant wheat cultivar SST 333. In Hungary D. noxia feeding resulted in leaf rolling and chlorotic spots and stripes on resistant wheat cultivar SST 333 grown in growth chamber. Furthermore, the dynamics of the number of aphids per plant differed between South Africa and Hungary for Betta and SST 333. Infestation by Hungarian D. noxia reduced plant fresh weight and leaf area of the resistant wheat cultivars SST 333 and PI 262660 as much as the susceptible wheat cultivar Betta regardless of the growing conditions (growth chamber or greenhouse). In addition, water imbalance occurred in resistant wheat cultivars SST 333 and PI 262660 in the greenhouse. These differences between Hungarian and South African D. noxia strains suggest genetic differences between these populations. Our results support the idea that resistant plant germplasm has geographical limits because of geographical variation in pest species.
Key words: Diuraphis noxia, plant weight, leaf area, biotypic variation, South Africa, Hungary Introduction The Russian wheat aphid, Diuraphis noxia (Mordvilko) (Homoptera: Aphidaidae), was first recorded as a pest of cereals by Mokrzhetsky (1901). It has not subsequently been a persistent pest in Eurasia, its area of origin, although short-lived outbreaks have been reported (e.g., Grossheim, 1914; Tuatay & Remaudiére, 1964; Dyadechko & Ruban, 1975; Fernández et al., 1992). However, after its discovery in South Africa in 1978 and in the United States in 1986, it became a major pest of cereals in these countries (Du Toit & Walters, 1984; Brooks et al., 1994). Diuraphis noxia was first detected in Hungary in 1989 by Basky and Eastop (1991), but has not become a pest.
To reduce D. noxia damage, intensive resistance breeding programs were undertaken in South Africa and the United States (Du Toit, 1989; Webster et al., 1987; Webster, 1990; Miller et al., 1994). Biotypic variation can affect the success of such breeding programs (see Diehl & Bush, 1984 for review). Puterka et al. (1992) shoved variation in damage to resistant wheat entries among eight D. noxia collections from several regions throughout the world, suggesting that biotypic variation may exist in D. noxia. Here, we report experiments on differences in plant development as a result of attack by South African and Hungarian D. noxia strains. Because of the risk of introducing pest biotypes into South Africa or Hungary, we could not transfer D. noxia between the two countries. Therefore in South Africa and in Hungary we measured the effect of infestation by locally collected D. noxia specimens
10
on fresh plant weight and leaf area of South African wheat cultivars, susceptible and resistant to D. noxia, and a Hungarian barley cultivar susceptible to D. noxia. The experimental conditions were as close as possible in the two countries.
Materials and methods Sources of aphids In South Africa, D. noxia viviparous apterae and nymphs were collected at the beginning of November from wheat at Zadoks growth stage 65-69 (anthesis half way, anthesis complete) (Tottman & Broad, 1987) in the main South African wheat growing area near Bethlehem, Orange Free State. Before our experiments, the aphids were reared for 3 wks on seedlings of wheat variety Betta at 20°C and photo-period ~14:10 (L:D) h at 5.000-15.000 light intensity at the Sensaco Cooperative Breeding Station.
In Hungary, D. noxia fundatrices were collected in the middle of April from wheat at growth stage 30-35 (stem elongation) near Szolnok, which is at the centre of the main wheat growing area in Hungary. Before our experiments, the aphids were reared for about 3 months on wheat variety Bezoshtaja in an environmental growth chamber at 20°C and photo-period 14:10 (L:D) h at 7.500-8.500 light intensity.
Treatments To test differences between South African and Hungarian D. noxia strains, experiments were done in each country with the South African winter wheat cultivars Betta, which is susceptible to D. noxia, and SST 333, which is resistant to D. noxia, and the Hungarian spring barley variety Isis, which is susceptible to D. noxia.
Because D. noxia feeding resulted the occurrence of classic leaf rolling and streaks on the resistant South African wheat cultivar SST 333 in environmental growth chamber in Hungary, an additional experiment was done in Hungary to compare effects of Hungarian D. noxia on Betta, SST 333, and on another D. noxia resistant wheat line PI 262660. PI 262660, in which resistance originates from the single dominant gene Dn2 (Du Toit, 1989), was the source of resistance on SST 333.
In each experiment, sixteen seeds were sown in each of eight pots (17 cm diameter in Bethlehem and 15 cm in Hungary) for each variety. After emergence, seedlings were thinned to 12 seedlings per pot. Six days after emergence, i.e. at growth stage 11, the plants in half of the pots were infested with one D. noxia apterae (7 day-old) each. In South Africa, insects and plants were kept in a controlled-temperature greenhouse at 20-14°C (day-night) with a photo-period of ~ 14:10 (L:D) h. In South Africa eight pots were placed into one box, the front and sides of the boxes was glass, the top and the back of the boxes was fine mesh material. The infested and non-infested plants were placed into separate boxes, but within the boxes pots of different cultivars were randomly designed. The plants were irrigated by an automated system with 40 ml water per pot three times per day. In Hungary in the first experiment, insects and plants were kept in a growth chamber at 20-14°C (day-night) with a photo-period of 14:10 (L:D) h. The light intensity in the growth chamber varied between 7.500-8.500 lux. The plants were irrigated manually with 90-100 ml water per pot once per day. To avoid the possible confounding effect of greenhouse vs. growth chamber, the trial was repeated in Hungary in the greenhouse and in an environmental growth chamber. The growing conditions in the Hungarian greenhouse were the following: photoperiod ~14:10 (L:D) h ~20-14 oC. The temperature regime actually varied between 13-24°C because the greenhouse was not temperature-controlled, we tried to maintain the desired temperature with manual ventilation. The light intensity varied between 5.000 and 15.000 lux. The plants were watered twice a day with 60-70 ml water each time. The higher water requirement of the plants was due to the
11
higher temperature in the greenhouse. In Hungary, both the infested and non-infested pots were covered with 20 cm high transparent cages. The ventilation holes and the top of the cages were covered with fine mesh organsa material. In in the environmental growth chamber and in the greenhouse plants were randomly arranged.
Measurements In each experiment, four plants were destructively sampled from each plot at 7, 10 and 14 d after infestation. Thus, for each variety, infestation level, and sample date, four plants from each of the four pots were cut at soil surface. For infested plants, the numbers of D. noxia per plant were counted and thereafter the aphids were removed. Cut plants were weighted, and placed flat between two transparent sheets for photocopying. The areas of the photocopied plants were measured with a computer, using the Vidas Processing System (Kontron Image Analysis Division, Neufahrn, Germany). Although the visual scale of leaf rolling proposed by Webster et al. (1991) is widely used, leaf area was measured instead in order to avoid subjectivity (Webster et al., 1987), and to distinguish differences more precisely, and to allow detection of stunting.
Data analyses For analysis, data from the experiment in South Africa and the first experiment in Hungary was combined. Repeated measures analysis of variance (ANOVA) was used to test the effects of country, infestation with D. noxia, sample date, and their interactions on plant weight and leaf area of each cultivar (Statistica Stat Soft). The same type of analysis was used to test the effects of country, sample date, and their interactions on number of aphids per plant for each cultivar. Because the objective was to compare damage between countries and not between plant cultivars or species, separate analyses were done for each cultivar. Pots were the smallest experimental units; the four plants sampled from each pot on each date were sub-samples. Therefore mean plant weight, leaf area, and number of aphids for the four plants sampled from a pot on a date were the observations for analysis. Comparison of means of plant weight and leaf area between infested and non-infested plants for each country and within each of these categories between countries for the third sample date (14 days after infestation) was done by using t-test.
For analysis of the second experiment in Hungary, data from the experiment in environmental growth chamber and greenhouse was combined. Repeated measures ANOVA was used to test the effects of growing conditions (greenhouse, growth chamber), infestation with D. noxia, sample date, and their interactions on plant weight and leaf area of each cultivar. The same type of analysis was used to test the effects of growing conditions, sample date, and their interactions on number of aphids per plant for each cultivar.
Means of plant weight and leaf area between infested and non-infested plants for growing conditions and within each of these categories between environmental growth chamber and greenhouse for the third sample date (14 days after infestation) were compared by using t-test (Statistica Stat Soft).
Results Hungary versus South Africa Plant damage. The effect of aphid infestation on fresh plant weight over time differed between Hungary and South Africa for resistant wheat cultivar SST 333, and susceptible barley cultivar Isis, while leaf area differed between South Africa and Hungary for susceptible wheat cultivar Betta, and for resistant wheat cultivar SST 333 (Tab. 1).
12
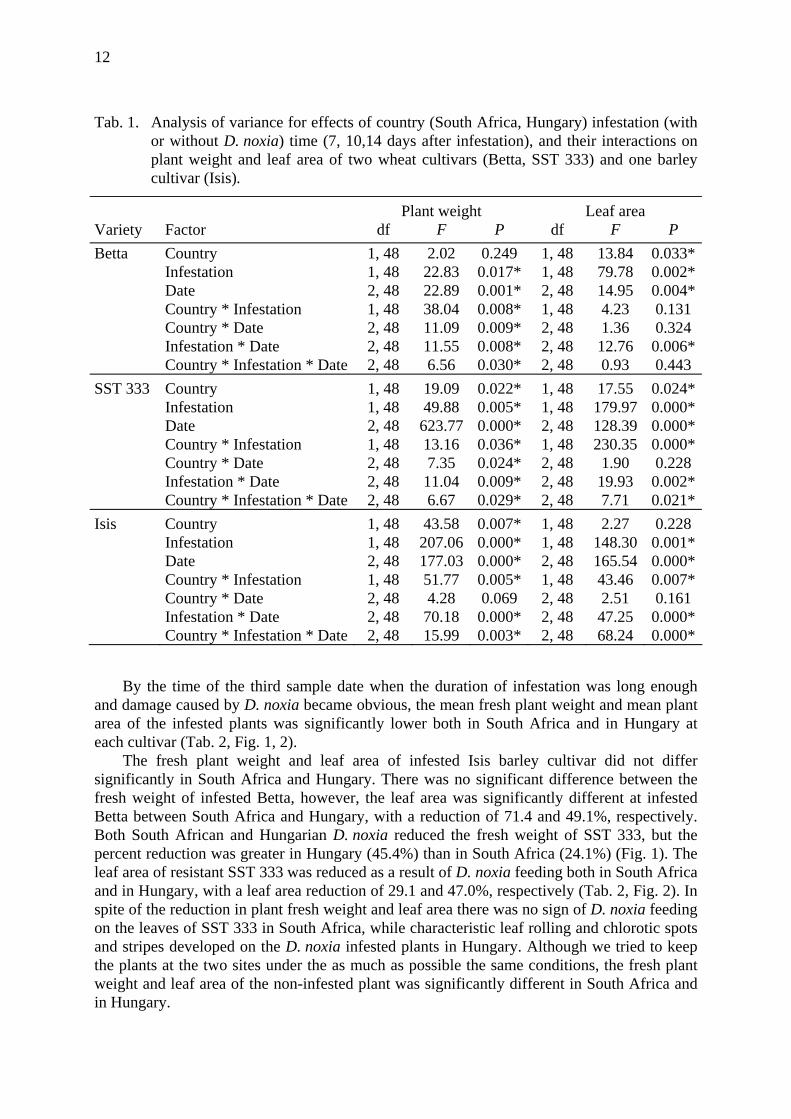
Tab. 1. Analysis of variance for effects of country (South Africa, Hungary) infestation (with or without D. noxia) time (7, 10,14 days after infestation), and their interactions on plant weight and leaf area of two wheat cultivars (Betta, SST 333) and one barley cultivar (Isis).
Plant weight Leaf area Variety Factor df F P df F P Betta Country 1, 48 2.02 0.249 1, 48 13.84 0.033*
Infestation 1, 48 22.83 0.017* 1, 48 79.78 0.002* Date 2, 48 22.89 0.001* 2, 48 14.95 0.004* Country * Infestation 1, 48 38.04 0.008* 1, 48 4.23 0.131 Country * Date 2, 48 11.09 0.009* 2, 48 1.36 0.324 Infestation * Date 2, 48 11.55 0.008* 2, 48 12.76 0.006* Country * Infestation * Date 2, 48 6.56 0.030* 2, 48 0.93 0.443
SST 333 Country 1, 48 19.09 0.022* 1, 48 17.55 0.024* Infestation 1, 48 49.88 0.005* 1, 48 179.97 0.000* Date 2, 48 623.77 0.000* 2, 48 128.39 0.000* Country * Infestation 1, 48 13.16 0.036* 1, 48 230.35 0.000* Country * Date 2, 48 7.35 0.024* 2, 48 1.90 0.228 Infestation * Date 2, 48 11.04 0.009* 2, 48 19.93 0.002* Country * Infestation * Date 2, 48 6.67 0.029* 2, 48 7.71 0.021*
Isis Country 1, 48 43.58 0.007* 1, 48 2.27 0.228 Infestation 1, 48 207.06 0.000* 1, 48 148.30 0.001* Date 2, 48 177.03 0.000* 2, 48 165.54 0.000* Country * Infestation 1, 48 51.77 0.005* 1, 48 43.46 0.007* Country * Date 2, 48 4.28 0.069 2, 48 2.51 0.161 Infestation * Date 2, 48 70.18 0.000* 2, 48 47.25 0.000* Country * Infestation * Date 2, 48 15.99 0.003* 2, 48 68.24 0.000*
By the time of the third sample date when the duration of infestation was long enough
and damage caused by D. noxia became obvious, the mean fresh plant weight and mean plant area of the infested plants was significantly lower both in South Africa and in Hungary at each cultivar (Tab. 2, Fig. 1, 2).
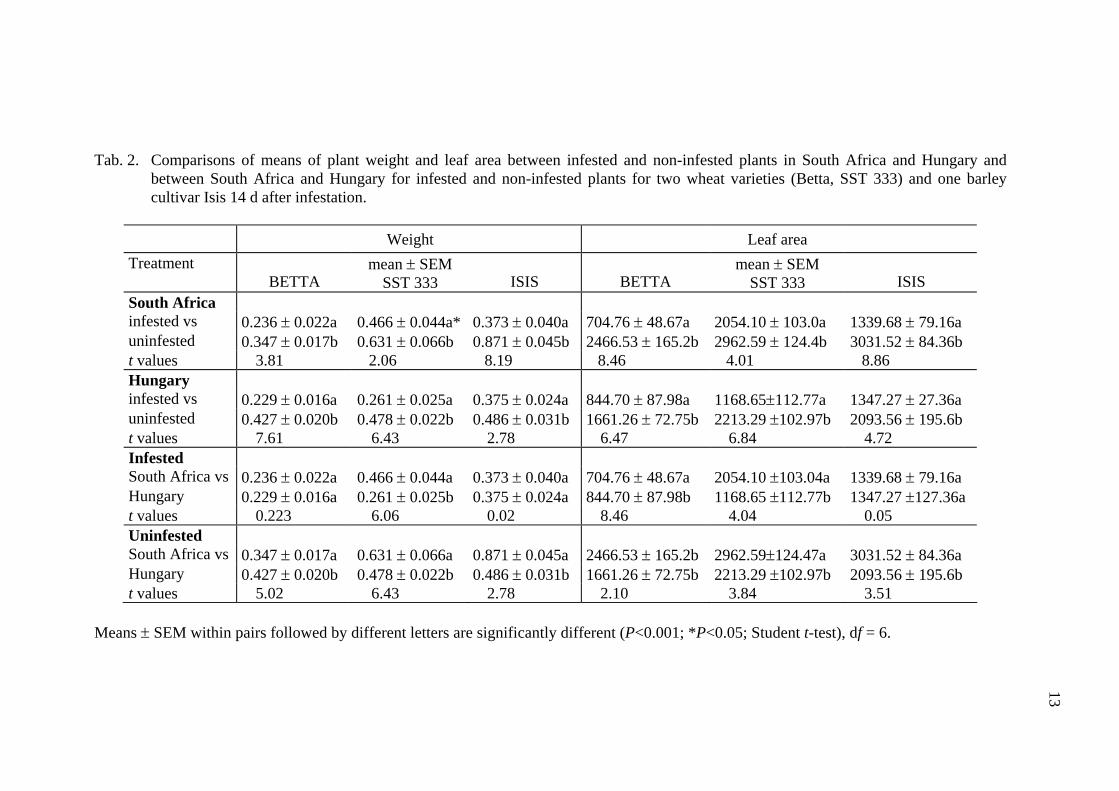
The fresh plant weight and leaf area of infested Isis barley cultivar did not differ significantly in South Africa and Hungary. There was no significant difference between the fresh weight of infested Betta, however, the leaf area was significantly different at infested Betta between South Africa and Hungary, with a reduction of 71.4 and 49.1%, respectively. Both South African and Hungarian D. noxia reduced the fresh weight of SST 333, but the percent reduction was greater in Hungary (45.4%) than in South Africa (24.1%) (Fig. 1). The leaf area of resistant SST 333 was reduced as a result of D. noxia feeding both in South Africa and in Hungary, with a leaf area reduction of 29.1 and 47.0%, respectively (Tab. 2, Fig. 2). In spite of the reduction in plant fresh weight and leaf area there was no sign of D. noxia feeding on the leaves of SST 333 in South Africa, while characteristic leaf rolling and chlorotic spots and stripes developed on the D. noxia infested plants in Hungary. Although we tried to keep the plants at the two sites under the as much as possible the same conditions, the fresh plant weight and leaf area of the non-infested plant was significantly different in South Africa and in Hungary.
13
Tab. 2. Comparisons of means of plant weight and leaf area between infested and non-infested plants in South Africa and Hungary and
between South Africa and Hungary for infested and non-infested plants for two wheat varieties (Betta, SST 333) and one barley cultivar Isis 14 d after infestation.
Weight Leaf area Treatment
BETTA mean ± SEM
SST 333
ISIS
BETTA mean ± SEM
SST 333
ISIS South Africa infested vs 0.236 ± 0.022a 0.466 ± 0.044a* 0.373 ± 0.040a 704.76 ± 48.67a 2054.10 ± 103.0a 1339.68 ± 79.16a uninfested 0.347 ± 0.017b 0.631 ± 0.066b 0.871 ± 0.045b 2466.53 ± 165.2b 2962.59 ± 124.4b 3031.52 ± 84.36b t values 3.81 2.06 8.19 8.46 4.01 8.86 Hungary infested vs 0.229 ± 0.016a 0.261 ± 0.025a 0.375 ± 0.024a 844.70 ± 87.98a 1168.65±112.77a 1347.27 ± 27.36a uninfested 0.427 ± 0.020b 0.478 ± 0.022b 0.486 ± 0.031b 1661.26 ± 72.75b 2213.29 ±102.97b 2093.56 ± 195.6b t values 7.61 6.43 2.78 6.47 6.84 4.72 Infested South Africa vs 0.236 ± 0.022a 0.466 ± 0.044a 0.373 ± 0.040a 704.76 ± 48.67a 2054.10 ±103.04a 1339.68 ± 79.16a Hungary 0.229 ± 0.016a 0.261 ± 0.025b 0.375 ± 0.024a 844.70 ± 87.98b 1168.65 ±112.77b 1347.27 ±127.36a t values 0.223 6.06 0.02 8.46 4.04 0.05 Uninfested South Africa vs 0.347 ± 0.017a 0.631 ± 0.066a 0.871 ± 0.045a 2466.53 ± 165.2b 2962.59±124.47a 3031.52 ± 84.36a Hungary 0.427 ± 0.020b 0.478 ± 0.022b 0.486 ± 0.031b 1661.26 ± 72.75b 2213.29 ±102.97b 2093.56 ± 195.6b t values 5.02 6.43 2.78 2.10 3.84 3.51
Means ± SEM within pairs followed by different letters are significantly different (P<0.001; *P<0.05; Student t-test), df = 6.
13
14
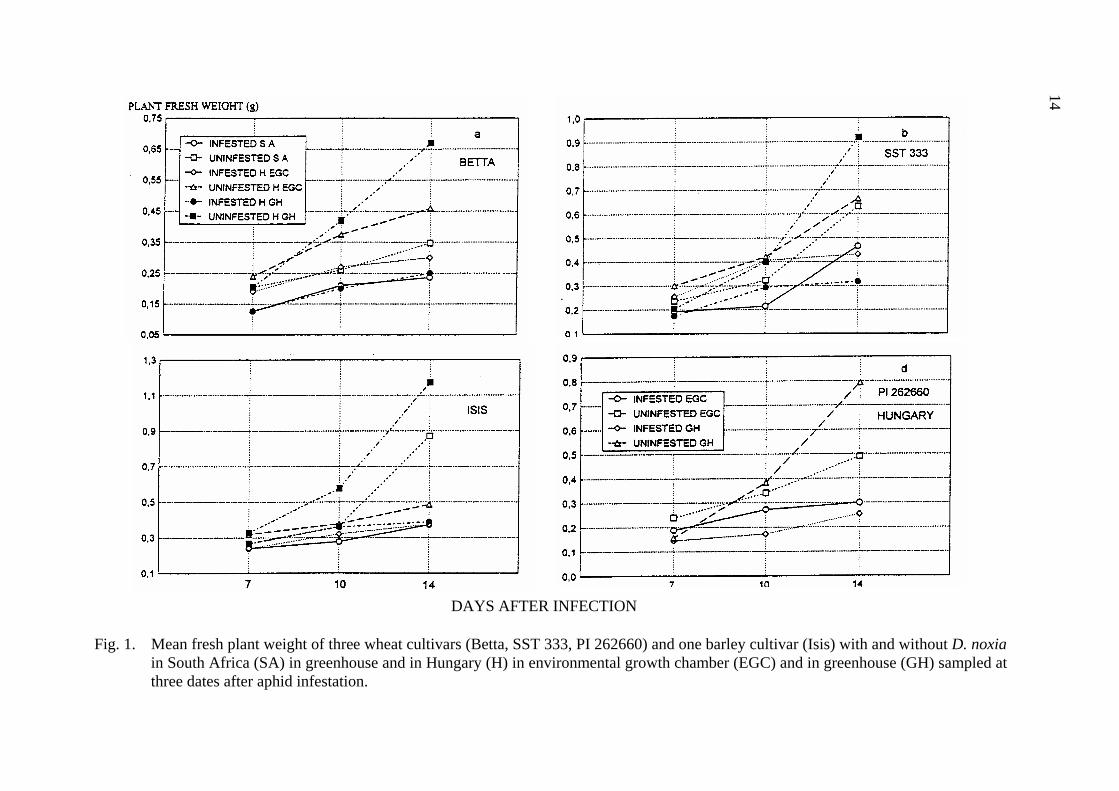
Fig. 1. Mean fresh plant weight of three wheat cultivars (Betta, SST 333, PI 262660) and one barley cultivar (Isis) with and without D. noxia
in South Africa (SA) in greenhouse and in Hungary (H) in environmental growth chamber (EGC) and in greenhouse (GH) sampled at three dates after aphid infestation.
14
DAYS AFTER INFECTION
15
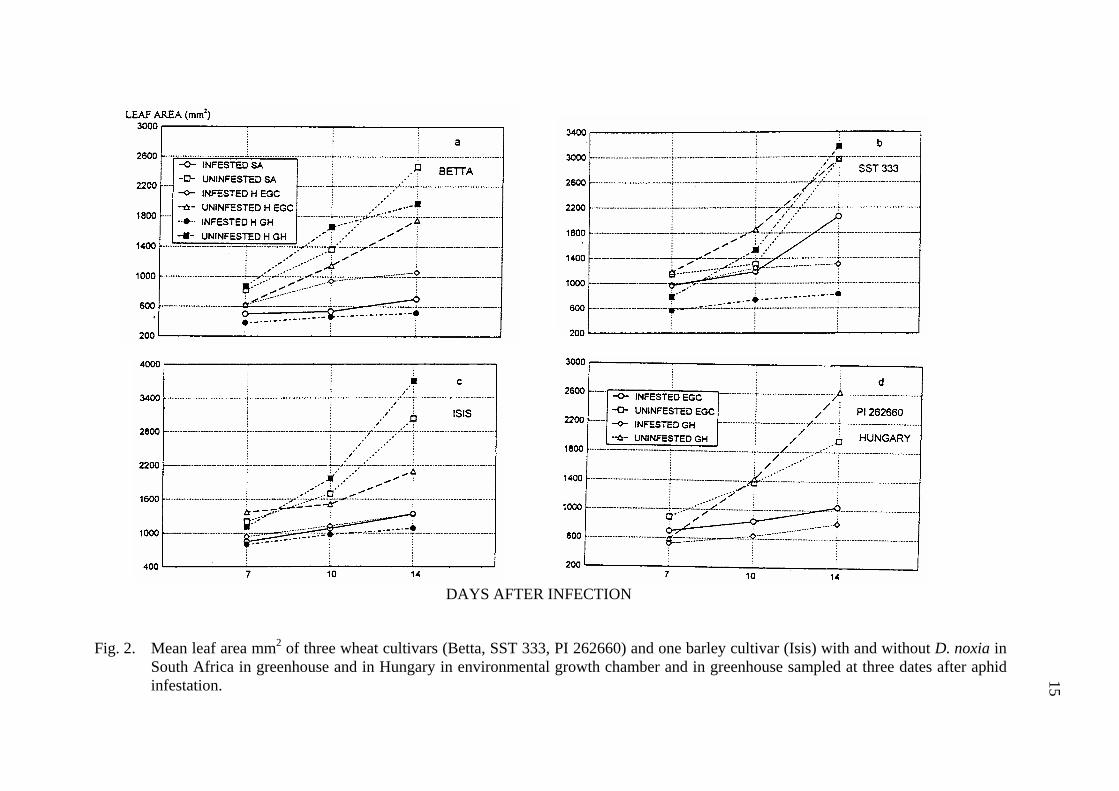
Fig. 2. Mean leaf area mm2 of three wheat cultivars (Betta, SST 333, PI 262660) and one barley cultivar (Isis) with and without D. noxia in South Africa in greenhouse and in Hungary in environmental growth chamber and in greenhouse sampled at three dates after aphid infestation. 15
DAYS AFTER INFECTION
16
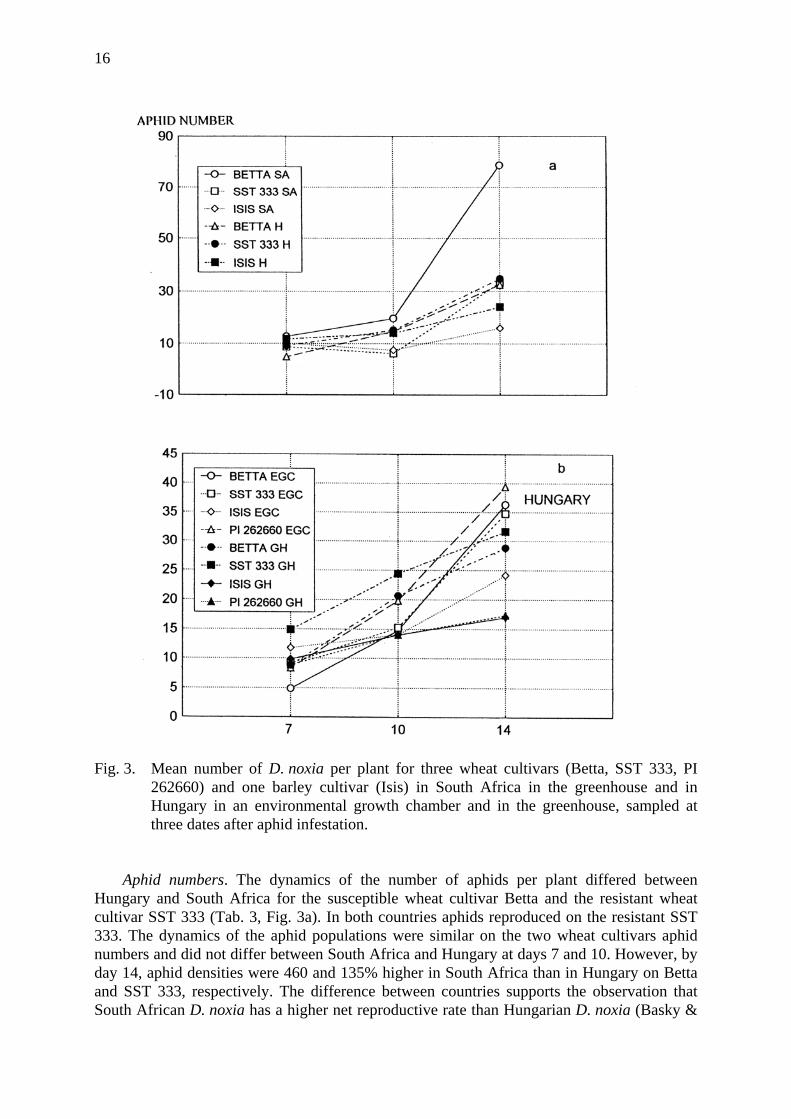
Fig. 3. Mean number of D. noxia per plant for three wheat cultivars (Betta, SST 333, PI 262660) and one barley cultivar (Isis) in South Africa in the greenhouse and in Hungary in an environmental growth chamber and in the greenhouse, sampled at three dates after aphid infestation.
Aphid numbers. The dynamics of the number of aphids per plant differed between
Hungary and South Africa for the susceptible wheat cultivar Betta and the resistant wheat cultivar SST 333 (Tab. 3, Fig. 3a). In both countries aphids reproduced on the resistant SST 333. The dynamics of the aphid populations were similar on the two wheat cultivars aphid numbers and did not differ between South Africa and Hungary at days 7 and 10. However, by day 14, aphid densities were 460 and 135% higher in South Africa than in Hungary on Betta and SST 333, respectively. The difference between countries supports the observation that South African D. noxia has a higher net reproductive rate than Hungarian D. noxia (Basky &
17
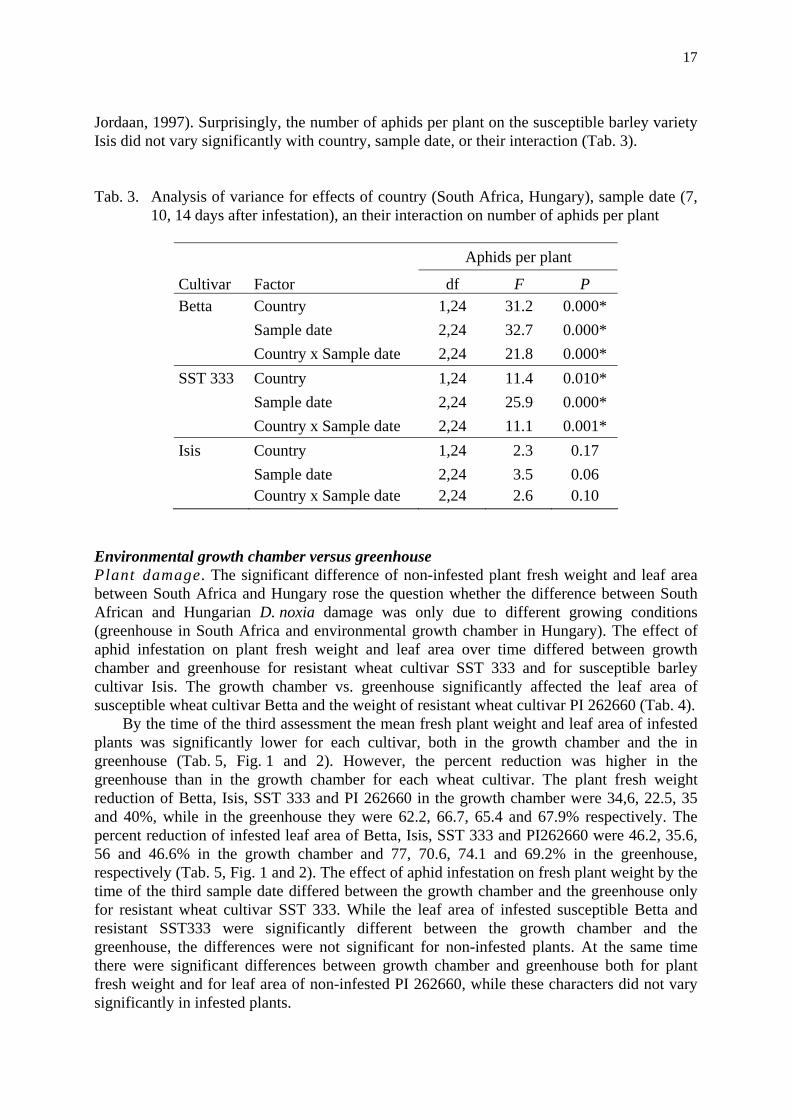
Jordaan, 1997). Surprisingly, the number of aphids per plant on the susceptible barley variety Isis did not vary significantly with country, sample date, or their interaction (Tab. 3).
Tab. 3. Analysis of variance for effects of country (South Africa, Hungary), sample date (7, 10, 14 days after infestation), an their interaction on number of aphids per plant
Aphids per plant
Cultivar Factor df F P Betta Country 1,24 31.2 0.000* Sample date 2,24 32.7 0.000* Country x Sample date 2,24 21.8 0.000* SST 333 Country 1,24 11.4 0.010* Sample date 2,24 25.9 0.000* Country x Sample date 2,24 11.1 0.001* Isis Country 1,24 2.3 0.17 Sample date 2,24 3.5 0.06 Country x Sample date 2,24 2.6 0.10
Environmental growth chamber versus greenhouse Plant damage. The significant difference of non-infested plant fresh weight and leaf area between South Africa and Hungary rose the question whether the difference between South African and Hungarian D. noxia damage was only due to different growing conditions (greenhouse in South Africa and environmental growth chamber in Hungary). The effect of aphid infestation on plant fresh weight and leaf area over time differed between growth chamber and greenhouse for resistant wheat cultivar SST 333 and for susceptible barley cultivar Isis. The growth chamber vs. greenhouse significantly affected the leaf area of susceptible wheat cultivar Betta and the weight of resistant wheat cultivar PI 262660 (Tab. 4).
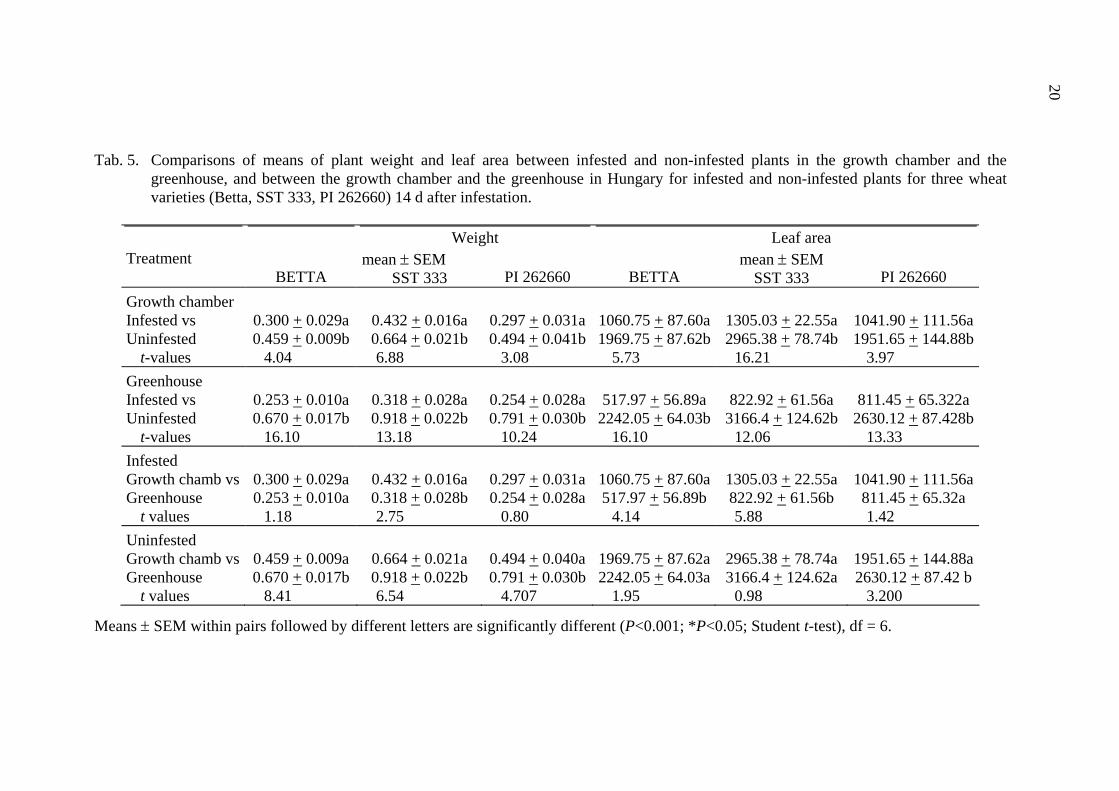
By the time of the third assessment the mean fresh plant weight and leaf area of infested plants was significantly lower for each cultivar, both in the growth chamber and the in greenhouse (Tab. 5, Fig. 1 and 2). However, the percent reduction was higher in the greenhouse than in the growth chamber for each wheat cultivar. The plant fresh weight reduction of Betta, Isis, SST 333 and PI 262660 in the growth chamber were 34,6, 22.5, 35 and 40%, while in the greenhouse they were 62.2, 66.7, 65.4 and 67.9% respectively. The percent reduction of infested leaf area of Betta, Isis, SST 333 and PI262660 were 46.2, 35.6, 56 and 46.6% in the growth chamber and 77, 70.6, 74.1 and 69.2% in the greenhouse, respectively (Tab. 5, Fig. 1 and 2). The effect of aphid infestation on fresh plant weight by the time of the third sample date differed between the growth chamber and the greenhouse only for resistant wheat cultivar SST 333. While the leaf area of infested susceptible Betta and resistant SST333 were significantly different between the growth chamber and the greenhouse, the differences were not significant for non-infested plants. At the same time there were significant differences between growth chamber and greenhouse both for plant fresh weight and for leaf area of non-infested PI 262660, while these characters did not vary significantly in infested plants.
18
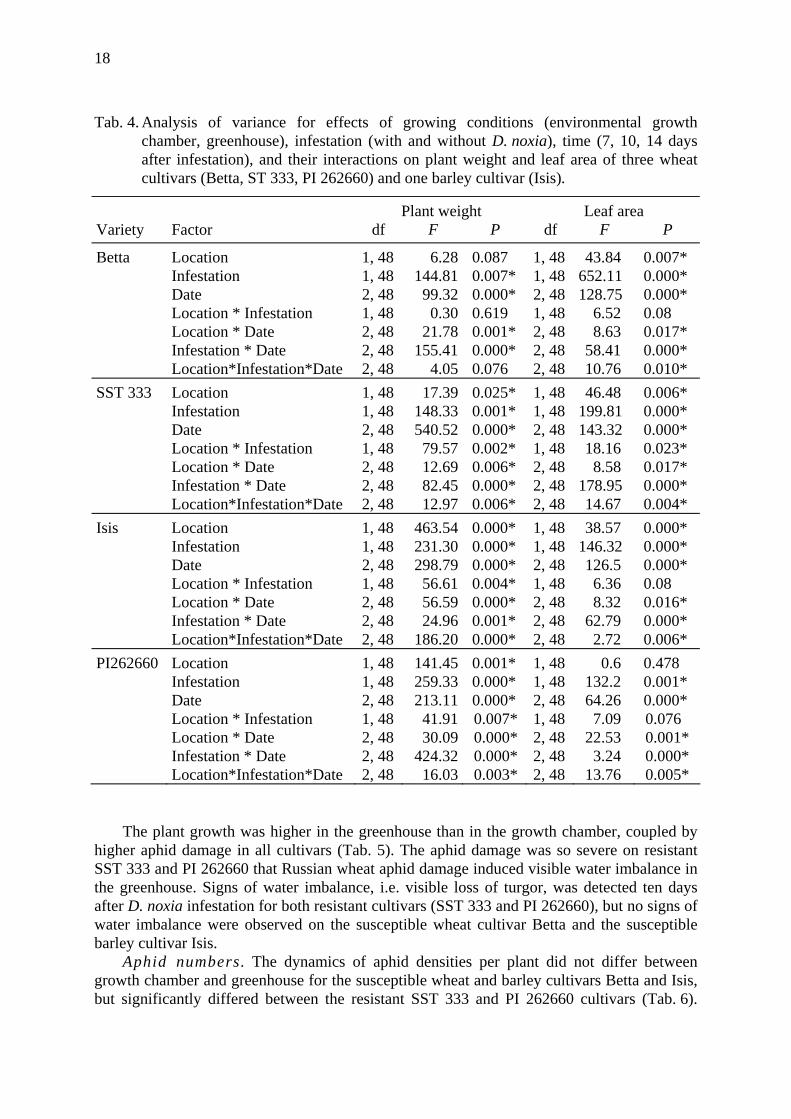
Tab. 4. Analysis of variance for effects of growing conditions (environmental growth chamber, greenhouse), infestation (with and without D. noxia), time (7, 10, 14 days after infestation), and their interactions on plant weight and leaf area of three wheat cultivars (Betta, ST 333, PI 262660) and one barley cultivar (Isis).
Plant weight Leaf area Variety Factor df F P df F P
Betta Location 1, 48 6.28 0.087 1, 48 43.84 0.007* Infestation 1, 48 144.81 0.007* 1, 48 652.11 0.000* Date 2, 48 99.32 0.000* 2, 48 128.75 0.000* Location * Infestation 1, 48 0.30 0.619 1, 48 6.52 0.08 Location * Date 2, 48 21.78 0.001* 2, 48 8.63 0.017* Infestation * Date 2, 48 155.41 0.000* 2, 48 58.41 0.000* Location*Infestation*Date 2, 48 4.05 0.076 2, 48 10.76 0.010* SST 333 Location 1, 48 17.39 0.025* 1, 48 46.48 0.006* Infestation 1, 48 148.33 0.001* 1, 48 199.81 0.000* Date 2, 48 540.52 0.000* 2, 48 143.32 0.000* Location * Infestation 1, 48 79.57 0.002* 1, 48 18.16 0.023* Location * Date 2, 48 12.69 0.006* 2, 48 8.58 0.017* Infestation * Date 2, 48 82.45 0.000* 2, 48 178.95 0.000* Location*Infestation*Date 2, 48 12.97 0.006* 2, 48 14.67 0.004* Isis Location 1, 48 463.54 0.000* 1, 48 38.57 0.000* Infestation 1, 48 231.30 0.000* 1, 48 146.32 0.000* Date 2, 48 298.79 0.000* 2, 48 126.5 0.000* Location * Infestation 1, 48 56.61 0.004* 1, 48 6.36 0.08 Location * Date 2, 48 56.59 0.000* 2, 48 8.32 0.016* Infestation * Date 2, 48 24.96 0.001* 2, 48 62.79 0.000* Location*Infestation*Date 2, 48 186.20 0.000* 2, 48 2.72 0.006* PI262660 Location 1, 48 141.45 0.001* 1, 48 0.6 0.478 Infestation 1, 48 259.33 0.000* 1, 48 132.2 0.001* Date 2, 48 213.11 0.000* 2, 48 64.26 0.000* Location * Infestation 1, 48 41.91 0.007* 1, 48 7.09 0.076 Location * Date 2, 48 30.09 0.000* 2, 48 22.53 0.001* Infestation * Date 2, 48 424.32 0.000* 2, 48 3.24 0.000* Location*Infestation*Date 2, 48 16.03 0.003* 2, 48 13.76 0.005*
The plant growth was higher in the greenhouse than in the growth chamber, coupled by higher aphid damage in all cultivars (Tab. 5). The aphid damage was so severe on resistant SST 333 and PI 262660 that Russian wheat aphid damage induced visible water imbalance in the greenhouse. Signs of water imbalance, i.e. visible loss of turgor, was detected ten days after D. noxia infestation for both resistant cultivars (SST 333 and PI 262660), but no signs of water imbalance were observed on the susceptible wheat cultivar Betta and the susceptible barley cultivar Isis.
Aphid numbers. The dynamics of aphid densities per plant did not differ between growth chamber and greenhouse for the susceptible wheat and barley cultivars Betta and Isis, but significantly differed between the resistant SST 333 and PI 262660 cultivars (Tab. 6).
19
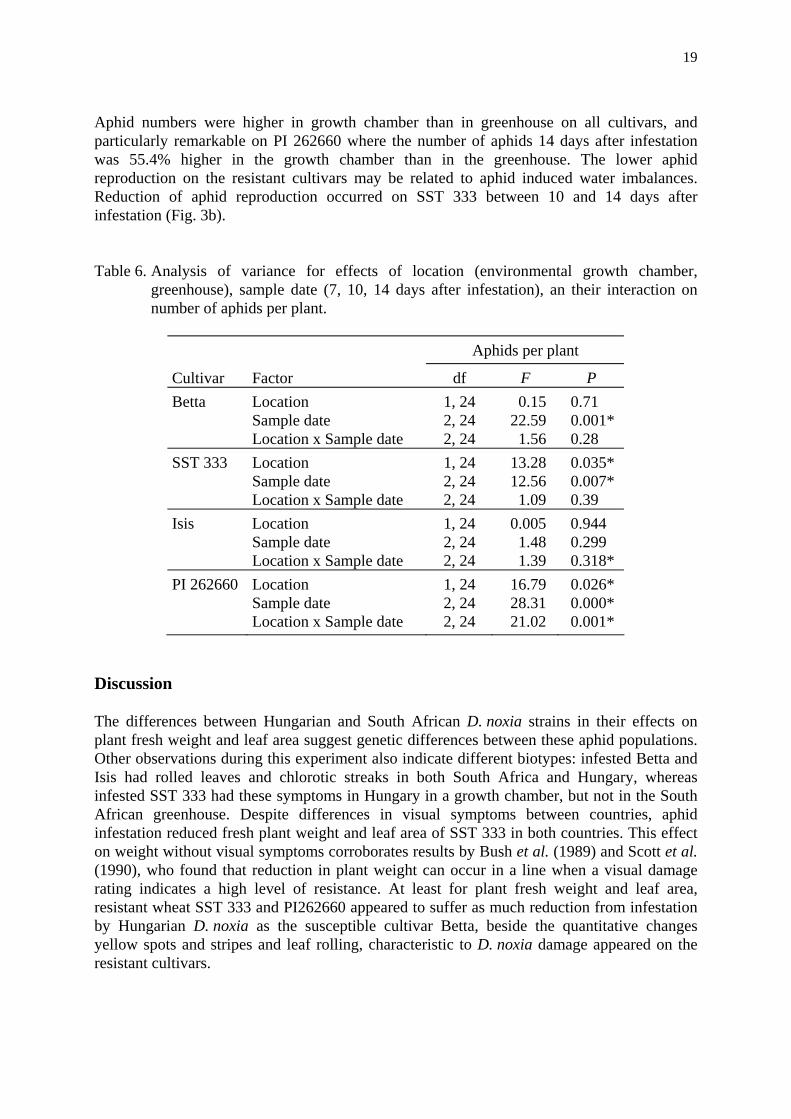
Aphid numbers were higher in growth chamber than in greenhouse on all cultivars, and particularly remarkable on PI 262660 where the number of aphids 14 days after infestation was 55.4% higher in the growth chamber than in the greenhouse. The lower aphid reproduction on the resistant cultivars may be related to aphid induced water imbalances. Reduction of aphid reproduction occurred on SST 333 between 10 and 14 days after infestation (Fig. 3b).
Table 6. Analysis of variance for effects of location (environmental growth chamber, greenhouse), sample date (7, 10, 14 days after infestation), an their interaction on number of aphids per plant.
Aphids per plant
Cultivar Factor df F P Betta Location 1, 24 0.15 0.71 Sample date 2, 24 22.59 0.001* Location x Sample date 2, 24 1.56 0.28 SST 333 Location 1, 24 13.28 0.035* Sample date 2, 24 12.56 0.007* Location x Sample date 2, 24 1.09 0.39 Isis Location 1, 24 0.005 0.944 Sample date 2, 24 1.48 0.299 Location x Sample date 2, 24 1.39 0.318* PI 262660 Location 1, 24 16.79 0.026* Sample date 2, 24 28.31 0.000* Location x Sample date 2, 24 21.02 0.001*
Discussion The differences between Hungarian and South African D. noxia strains in their effects on plant fresh weight and leaf area suggest genetic differences between these aphid populations. Other observations during this experiment also indicate different biotypes: infested Betta and Isis had rolled leaves and chlorotic streaks in both South Africa and Hungary, whereas infested SST 333 had these symptoms in Hungary in a growth chamber, but not in the South African greenhouse. Despite differences in visual symptoms between countries, aphid infestation reduced fresh plant weight and leaf area of SST 333 in both countries. This effect on weight without visual symptoms corroborates results by Bush et al. (1989) and Scott et al. (1990), who found that reduction in plant weight can occur in a line when a visual damage rating indicates a high level of resistance. At least for plant fresh weight and leaf area, resistant wheat SST 333 and PI262660 appeared to suffer as much reduction from infestation by Hungarian D. noxia as the susceptible cultivar Betta, beside the quantitative changes yellow spots and stripes and leaf rolling, characteristic to D. noxia damage appeared on the resistant cultivars.
20
Tab. 5. Comparisons of means of plant weight and leaf area between infested and non-infested plants in the growth chamber and the
greenhouse, and between the growth chamber and the greenhouse in Hungary for infested and non-infested plants for three wheat varieties (Betta, SST 333, PI 262660) 14 d after infestation.
Weight Leaf area
Treatment BETTA
mean ± SEM SST 333
PI 262660
BETTA
mean ± SEM SST 333
PI 262660
Growth chamber Infested vs 0.300 + 0.029a 0.432 + 0.016a 0.297 + 0.031a 1060.75 + 87.60a 1305.03 + 22.55a 1041.90 + 111.56aUninfested 0.459 + 0.009b 0.664 + 0.021b 0.494 + 0.041b 1969.75 + 87.62b 2965.38 + 78.74b 1951.65 + 144.88b
t-values 4.04 6.88 3.08 5.73 16.21 3.97 Greenhouse Infested vs 0.253 + 0.010a 0.318 + 0.028a 0.254 + 0.028a 517.97 + 56.89a 822.92 + 61.56a 811.45 + 65.322a Uninfested 0.670 + 0.017b 0.918 + 0.022b 0.791 + 0.030b 2242.05 + 64.03b 3166.4 + 124.62b 2630.12 + 87.428b
t-values 16.10 13.18 10.24 16.10 12.06 13.33 Infested Growth chamb vs 0.300 + 0.029a 0.432 + 0.016a 0.297 + 0.031a 1060.75 + 87.60a 1305.03 + 22.55a 1041.90 + 111.56aGreenhouse 0.253 + 0.010a 0.318 + 0.028b 0.254 + 0.028a 517.97 + 56.89b 822.92 + 61.56b 811.45 + 65.32a
t values 1.18 2.75 0.80 4.14 5.88 1.42 Uninfested Growth chamb vs 0.459 + 0.009a 0.664 + 0.021a 0.494 + 0.040a 1969.75 + 87.62a 2965.38 + 78.74a 1951.65 + 144.88aGreenhouse 0.670 + 0.017b 0.918 + 0.022b 0.791 + 0.030b 2242.05 + 64.03a 3166.4 + 124.62a 2630.12 + 87.42 b
t values 8.41 6.54 4.707 1.95 0.98 3.200
Means ± SEM within pairs followed by different letters are significantly different (P<0.001; *P<0.05; Student t-test), df = 6.
20
21
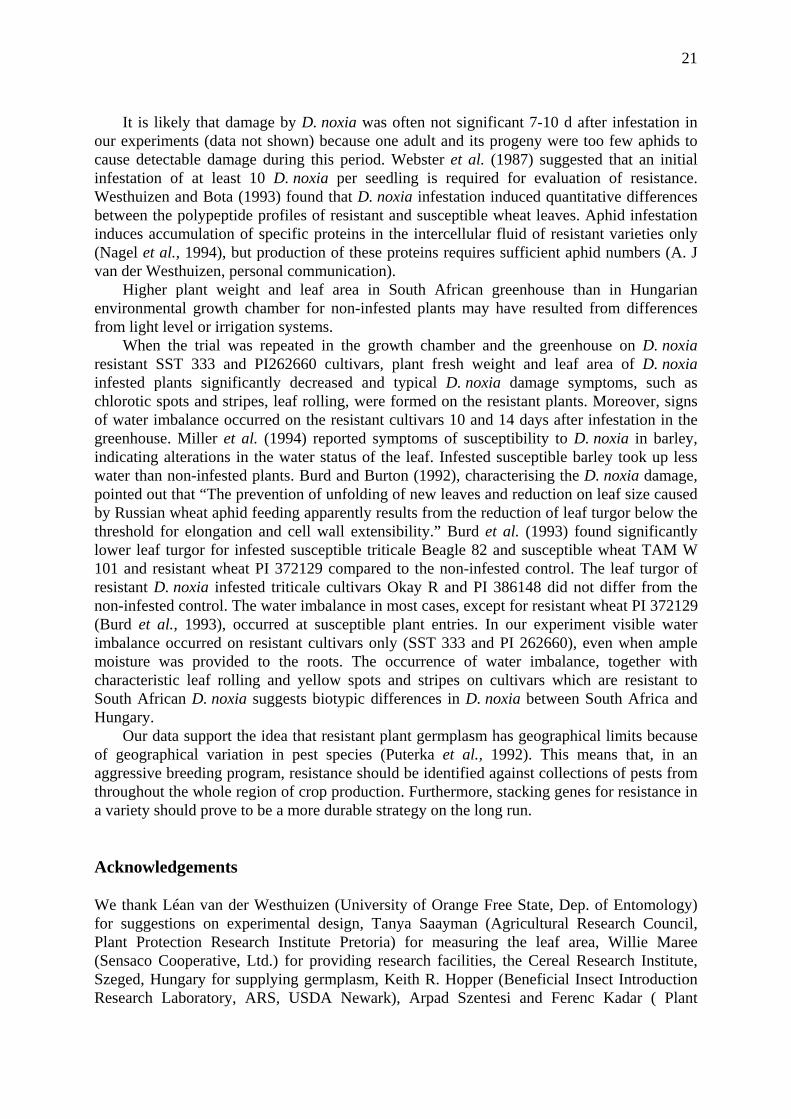
It is likely that damage by D. noxia was often not significant 7-10 d after infestation in our experiments (data not shown) because one adult and its progeny were too few aphids to cause detectable damage during this period. Webster et al. (1987) suggested that an initial infestation of at least 10 D. noxia per seedling is required for evaluation of resistance. Westhuizen and Bota (1993) found that D. noxia infestation induced quantitative differences between the polypeptide profiles of resistant and susceptible wheat leaves. Aphid infestation induces accumulation of specific proteins in the intercellular fluid of resistant varieties only (Nagel et al., 1994), but production of these proteins requires sufficient aphid numbers (A. J van der Westhuizen, personal communication).
Higher plant weight and leaf area in South African greenhouse than in Hungarian environmental growth chamber for non-infested plants may have resulted from differences from light level or irrigation systems.
When the trial was repeated in the growth chamber and the greenhouse on D. noxia resistant SST 333 and PI262660 cultivars, plant fresh weight and leaf area of D. noxia infested plants significantly decreased and typical D. noxia damage symptoms, such as chlorotic spots and stripes, leaf rolling, were formed on the resistant plants. Moreover, signs of water imbalance occurred on the resistant cultivars 10 and 14 days after infestation in the greenhouse. Miller et al. (1994) reported symptoms of susceptibility to D. noxia in barley, indicating alterations in the water status of the leaf. Infested susceptible barley took up less water than non-infested plants. Burd and Burton (1992), characterising the D. noxia damage, pointed out that “The prevention of unfolding of new leaves and reduction on leaf size caused by Russian wheat aphid feeding apparently results from the reduction of leaf turgor below the threshold for elongation and cell wall extensibility.” Burd et al. (1993) found significantly lower leaf turgor for infested susceptible triticale Beagle 82 and susceptible wheat TAM W 101 and resistant wheat PI 372129 compared to the non-infested control. The leaf turgor of resistant D. noxia infested triticale cultivars Okay R and PI 386148 did not differ from the non-infested control. The water imbalance in most cases, except for resistant wheat PI 372129 (Burd et al., 1993), occurred at susceptible plant entries. In our experiment visible water imbalance occurred on resistant cultivars only (SST 333 and PI 262660), even when ample moisture was provided to the roots. The occurrence of water imbalance, together with characteristic leaf rolling and yellow spots and stripes on cultivars which are resistant to South African D. noxia suggests biotypic differences in D. noxia between South Africa and Hungary.
Our data support the idea that resistant plant germplasm has geographical limits because of geographical variation in pest species (Puterka et al., 1992). This means that, in an aggressive breeding program, resistance should be identified against collections of pests from throughout the whole region of crop production. Furthermore, stacking genes for resistance in a variety should prove to be a more durable strategy on the long run.
Acknowledgements We thank Léan van der Westhuizen (University of Orange Free State, Dep. of Entomology) for suggestions on experimental design, Tanya Saayman (Agricultural Research Council, Plant Protection Research Institute Pretoria) for measuring the leaf area, Willie Maree (Sensaco Cooperative, Ltd.) for providing research facilities, the Cereal Research Institute, Szeged, Hungary for supplying germplasm, Keith R. Hopper (Beneficial Insect Introduction Research Laboratory, ARS, USDA Newark), Arpad Szentesi and Ferenc Kadar ( Plant
22
Protection Institute of Hungarian Academy of Sciences) for suggestions on the statistical analyses. This research was funded by Sensaco Cooperative, Ltd.
References Basky, Z. & Eastop, V.F., 1991: Diuraphis noxia in Hungary. Newslett. Barley Yellow Dwarf
4: 34. Basky, Z. & Jordaan, J., 1997: Comparison of the development and fecundity of Russian
wheat aphid (Homoptera: Aphididae) in South Africa and in Hungary. J. Econ. Entomol. 90: 623-627.
Brooks, L., Hein, G., Johnson, G., Legg, D., Massey, B., Morrison, P., Weiss M. & Peairs, F., 1994: Economic impact of the Russian wheat aphid in the western United States. 1991 -1992. Great Plains Agric. Council Pub. No. 147: 250-268, In: Proceedings 6th Russian Wheat Aphid Workshop, 23-25 January 1994 Fort Collins Colorado.
Bush, L., Slosser, J. E., & Worall, W.D., 1989: Variations in damage to wheat caused by Russian wheat aphid (Homoptera: Aphididae) in Texas. J. Econ. Entomol. 82: 466-471.
Burd, J.D. & Burton, R.L., 1992: Characterization of plant damage caused by Russian wheat aphid (Homoptera: Aphididae. J. Econ. Entomol. 85: 2017-2022.
Burd, J.D., Burton, R.L. & Webster, J.A., 1993: Evaluation of Russian wheat aphid (Homo-ptera: Aphididae) damage on resistant and susceptible hosts with comparisons of damage ratings to quantitatve plant measurements. J. Econ. Entomol. 86: 974-980.
Diehl, S.R. & Bush, G.L., 1984: An evolutionary and applied perspective of insect biotypes. Ann. Rev. Entomol. 29: 1251-1253.
Du Toit, F. 1989: Inheritance of resistance in two Triticum aestivum lines to Russian wheat aphid (Homoptera: Aphididae). J. Econ. Entomol. 82: 1251-1253.
Du Toit, F. & Walters, M.C., 1984: Damage assessment and economic threshold values for the chemical control of the Russian wheat aphid, Diuraphis noxia (Mordvilko) on winter wheat. Technical Communication of the Department of Agriculture, Republic of South Africa 191: 58-62.
Dyadechko, N.P. & Ruban, M.B., 1975: The harmfulness of cereal aphid. Zashch. Rast. (Mosc.) 12: 17-18.
Fernandez, V.N., Perez, E.N., Santero, E.D.& Nafria, J.M.N., 1992: Situacion en el norte de espana del pulgon ruso del trigo, Diuraphis noxia (Mordvilko) (Homoptera, Aphididae). Georgica 1: 9-24.
Grossheim, N.A. 1914: The barley aphid, Brachycolus noxius Mordwilko. Mem. Nat. Hist. Mus. Zemstwo Province Tavria 3: 35-78. (In Russian; English translation by Poprawski, T.J., Wraight, S.P. & Peresypkina, S. In: Morrison, W.P. (ed.), Proc. 5th Russian Wheat Aphid Conference, 26-28 January 1992. Great Plains Agricultural Council Publication 142: 34-55.).
Miller, H., Porter, D.R., Burd, J.D., Mornhinweg, D.W. & Burton, R.L., 1994: Physiological effects of Russian wheat aphid (Homoptera: Aphididae) on resistant and susceptible barley. J. Econ. Entomol. 87: 493-499.
Mokrzhetsky, K.A., 1901: (Animal and Plant Pests of Crimea in 1900.) Simferopol; cited in Kovalev, O.V., Poprawski, T.J., Stekolshchikov, A.V., Vereshchagina, A.B. & Gandrabur, S.A. 1991: Diuraphis Aizenberg (Hom., Aphididae) key to apterous females, and review of Russian language literature on the natural history of Diuraphis noxia (Kurdjumov, 1913 ) J. Appl. Entomol. 112: 425-436.
23
Nagel, M.A., Pretorius, C.Z., Botha, A.M. & van der Westhuizen, A.J., 1994: Russian wheat aphid resistance markers in wheat. Abstracts of papers and posters presented at the Twentieth Annual Congress of the South African Association of Botanists. Witwaters-rand 10-14 January 1994: 69.
Puterka, G.J., Burd, J.D. & Burton, R.L., 1992: Biotypic variation in a worldwide collection of Russian wheat aphid (Homoptera: Aphididae) J. Econ. Entomol. 85: 1497-1506.
Scott, R.A., Worrall, W.D. & Frank, W.A., 1990: Comparison of three techniques for measuring antibiosis to Russian wheat aphid. Southwestern Entomologist. 15: 439-446.
Statistica. 1994: Statistica for the WindowsTM StatSoft, Inc., Tulsa, OK. Tottman, D.R. & Broad, H., 1987: Decimal code for the Growth Stage of cereals. Ann. Appl.
Biol. 110: 683-687. Tuatay, N., & Remaudiére, G., 1964: Premiere contribution an catalogue des Aphididae
(Hom.) de la Turquie. Rev. Pathol. Veg. Entomol. Agronom. Rf. 43: 237-278. Vidas Processing System, 1993: (Kontron Image Analysis Division) Neufahrn, Germany Webster, J.A. 1990: Resistance in Triticale to the Russian wheat aphid (Homoptera:
Aphididae) J. Econ. Entomol. 83: 1091-1095. Webster, J.A., Starks, K.J. & Burton, R.L., 1987: Plant resistance studies with Diuraphis
noxia (Homoptera Aphididae), a new United States wheat pest. J. Econ. Entomol 80: 944-949.
Webster, J.A., Baker, C.A. & Porter, D.R., 1991: Detection and mechanisms of Russian wheat aphid (Homoptera: Aphididae) resistance in barley. J. Econ. Entomol. 84: 669-673.
van der Westhuizen, A.J. & Botha, F.C., 1993: Effect of the Russian Wheat Aphid on the composition and synthesis of water soluble proteins in resistant and susceptible wheat. J. Agronomy & Crop Science 170: 322-326.

24
Integrated Control in Cereal Crops IOBC wprs Bulletin 24 (6) 2001
pp. 25 - 31
25
Impact of barley yellow dwarf virus infection on physiological conditions of wheat and the consequences for cereal aphids attack
M. Fiebig and H.-M. Poehling Institut für Pflanzenkrankheiten und Pflanzenschutz, Universität Hannover, Herrenhäuser Str. 2, D-30419 Hannover, Germany
Background and introduction The BYDV (Barley Yellow Dwarf Virus) pathosysthem has three biotic elements: the luteoviruses, that form the BYDV complex, the different aphid species, which are virus vectors and the grass and other plant species, which are hosts of both, the virus and their vectors.
As plants may harbour virus without contributing to its further spreading, vectors are responsible for the virus spread. A vector must move the virus from the reservoir to other hosts. Therefore the spread of the vectors is important for the epidemiology of BYDV and influences spatial and temporal pattern of infection in the field.
BYDV causes physiological and biochemical changes in host plants (Fereres et al., 1990; Jensen & Sambeek, 1972; Jensen, 1968; 1970; Orlob & Arny, 1961). Often the development of the plants is retarded after a BYDV infection.
It is supposed that luteoviruses do not replicate in their vectors and do not directly influence aphid performance (Montllor & Gildow, 1986); therefore effects of BYDV on its vectors reflect more induced changes in the host plant physiology. Particularly the development of phloem feeding aphids depends on the quality of the phloem sap (Douglas, 1993). Weibull (1987) found a close relation between performance and population growth of cereal aphids to the nutritional status of the host plant and the turgescence of the plant tissues. Aphids use carbohydrates derived from the phloem as their predominant energy resource and amino acids, e.g. for their protein metabolism (Rhodes et al., 1996). In preceding experiments we found that infection of the summer wheat cultivar Tinos with BYD-MAV and BYD-PAV–isolates caused changes in host selection behaviour, feeding intensity and growth rate of Sitobion avenae F. (Homoptera: Aphididae). For that reason we hypothesise that BYDV infection changes host suitability by altering concentrations of these compounds within the phloem sap to influence aphid development and behaviour which may favour secondary spread. The following questions have arisen: - Does a BYDV infection change food quality of the host? - Are there changes in food utilisation by S. avenae?
Measurements of sugar and amino acid contents in the phloem sap of infected and non-infected wheat plants were used to document BYDV-induced changes of main nutrients in the phloem sap, which may be responsible for effects on aphid feeding behaviour and development. Quantifying the honeydew composition of sugar and amino acids and the amount of secretion, possible changes in food utilisation by S. avenae should be recorded, particularly the amount of ingested phloem sap and the efficiency of resorption of different components from the phloem sap. The summer wheat cultivar Tinos, BYD-PAV and MAV virus isolate and a synchronised culture of a virus-free green clone of S. avenae, which was also reared on the wheat cultivar Tinos before, were used for the experiments.
26
Methods For phloem sap collection stylectomy was performed with a high frequency microcautery unit (type CA-50, 48 MHz, circa 25 Watt, Syntech). A 0.2 mm tungsten wire prepared as needle lead the amputation of aphids stylets, when they showed the phloem sap ingestion pattern E2 by the electronic monitoring system (EPG, Tjallingii, 1988).
For honeydew collection specific cages (6 cm x 4 cm x 2 cm) were prepared allowing the aphids to settle above a glass object slide, where the honey drops could be collected. The sugar analysis was performed according to a modified method of Fretz (1970), Juvik et al. (1982) and Nikolov and Reilly (1983) with a Hewlett Packard gas chromatograph and the amino acid analysis with the amino-DABS method (Sykam) in a high pressure liquid chromatograph.
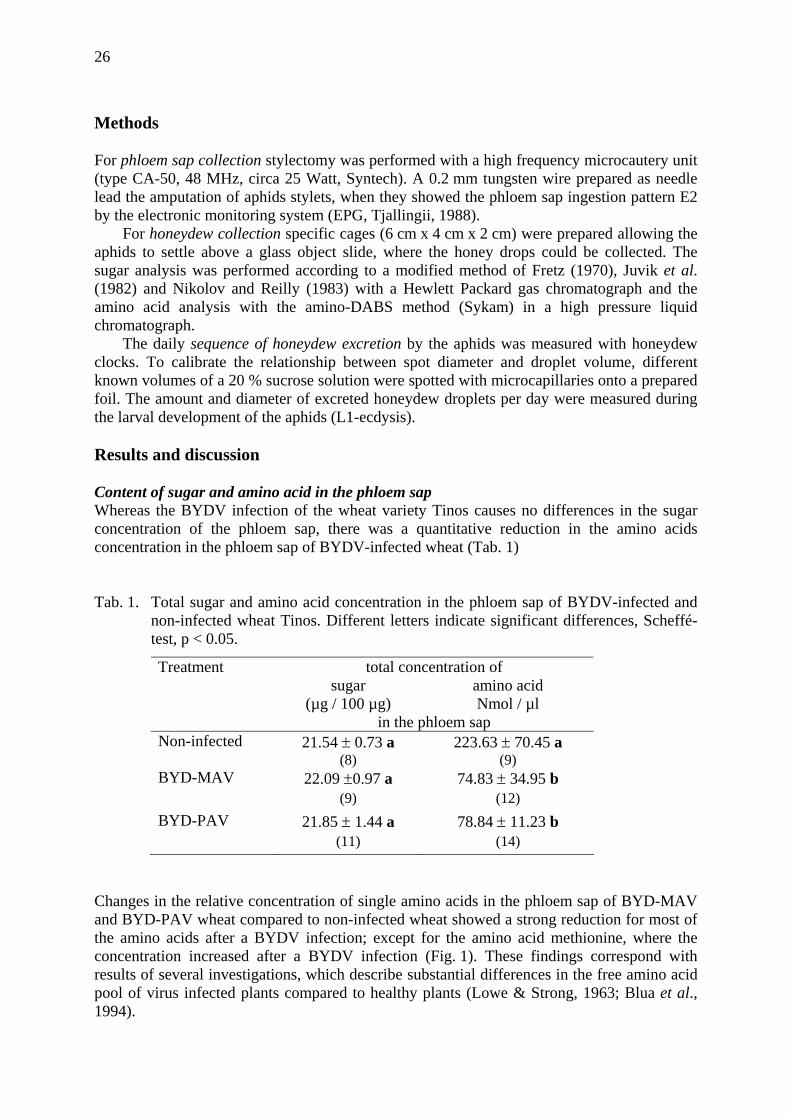
The daily sequence of honeydew excretion by the aphids was measured with honeydew clocks. To calibrate the relationship between spot diameter and droplet volume, different known volumes of a 20 % sucrose solution were spotted with microcapillaries onto a prepared foil. The amount and diameter of excreted honeydew droplets per day were measured during the larval development of the aphids (L1-ecdysis). Results and discussion Content of sugar and amino acid in the phloem sap Whereas the BYDV infection of the wheat variety Tinos causes no differences in the sugar concentration of the phloem sap, there was a quantitative reduction in the amino acids concentration in the phloem sap of BYDV-infected wheat (Tab. 1)
Tab. 1. Total sugar and amino acid concentration in the phloem sap of BYDV-infected and
non-infected wheat Tinos. Different letters indicate significant differences, Scheffé-test, p < 0.05.
Treatment total concentration of sugar
(µg / 100 µg) amino acid Nmol / µl
in the phloem sap Non-infected 21.54 ± 0.73 a 223.63 ± 70.45 a (8) (9) BYD-MAV 22.09 ±0.97 a 74.83 ± 34.95 b (9) (12) BYD-PAV 21.85 ± 1.44 a 78.84 ± 11.23 b (11) (14)
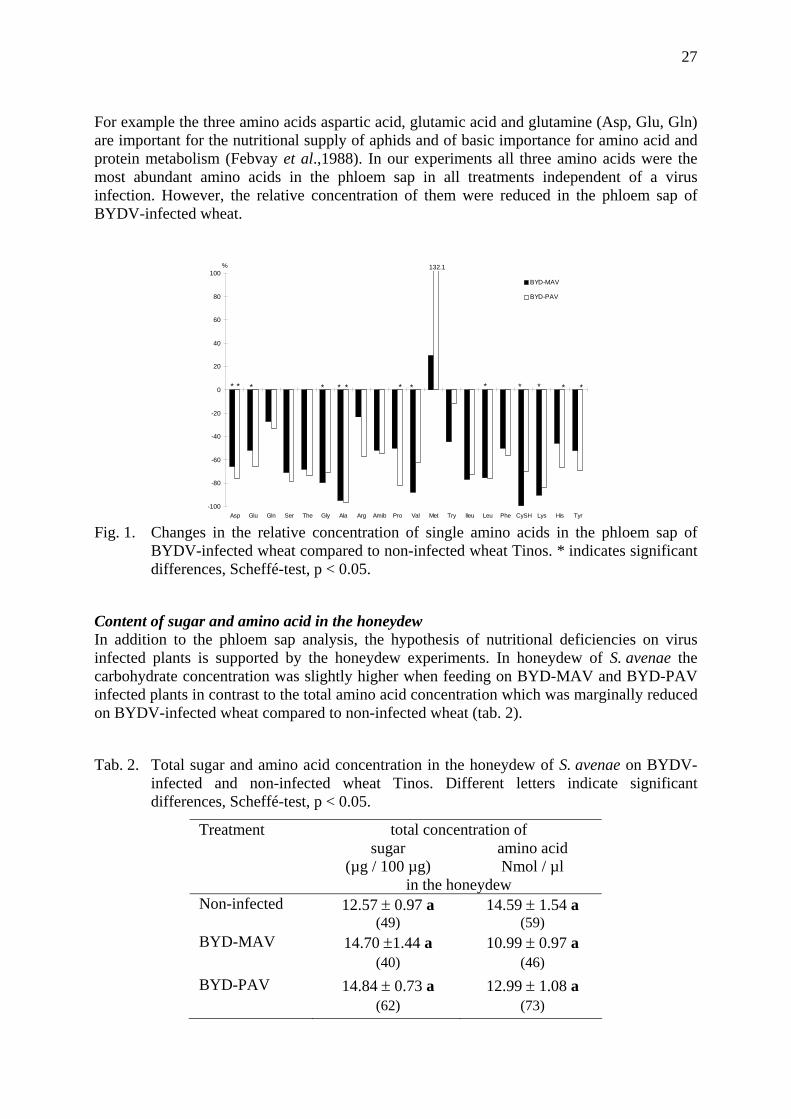
Changes in the relative concentration of single amino acids in the phloem sap of BYD-MAV and BYD-PAV wheat compared to non-infected wheat showed a strong reduction for most of the amino acids after a BYDV infection; except for the amino acid methionine, where the concentration increased after a BYDV infection (Fig. 1). These findings correspond with results of several investigations, which describe substantial differences in the free amino acid pool of virus infected plants compared to healthy plants (Lowe & Strong, 1963; Blua et al., 1994).
27
For example the three amino acids aspartic acid, glutamic acid and glutamine (Asp, Glu, Gln) are important for the nutritional supply of aphids and of basic importance for amino acid and protein metabolism (Febvay et al.,1988). In our experiments all three amino acids were the most abundant amino acids in the phloem sap in all treatments independent of a virus infection. However, the relative concentration of them were reduced in the phloem sap of BYDV-infected wheat.
-100
-80
-60
-40
-20
0
20
40
60
80
100
Asp Glu Gln Ser The Gly Ala Arg Amib Pro Val Met Try Ileu Leu Phe CySH Lys His Tyr
BYD-MAV
BYD-PAV
* ********* ** *
% 132.1
Fig. 1. Changes in the relative concentration of single amino acids in the phloem sap of
BYDV-infected wheat compared to non-infected wheat Tinos. * indicates significant differences, Scheffé-test, p < 0.05.
Content of sugar and amino acid in the honeydew In addition to the phloem sap analysis, the hypothesis of nutritional deficiencies on virus infected plants is supported by the honeydew experiments. In honeydew of S. avenae the carbohydrate concentration was slightly higher when feeding on BYD-MAV and BYD-PAV infected plants in contrast to the total amino acid concentration which was marginally reduced on BYDV-infected wheat compared to non-infected wheat (tab. 2).
Tab. 2. Total sugar and amino acid concentration in the honeydew of S. avenae on BYDV-
infected and non-infected wheat Tinos. Different letters indicate significant differences, Scheffé-test, p < 0.05.
Treatment total concentration of sugar
(µg / 100 µg) amino acid Nmol / µl
in the honeydew Non-infected 12.57 ± 0.97 a 14.59 ± 1.54 a (49) (59) BYD-MAV 14.70 ±1.44 a 10.99 ± 0.97 a (40) (46) BYD-PAV 14.84 ± 0.73 a 12.99 ± 1.08 a (62) (73)
28
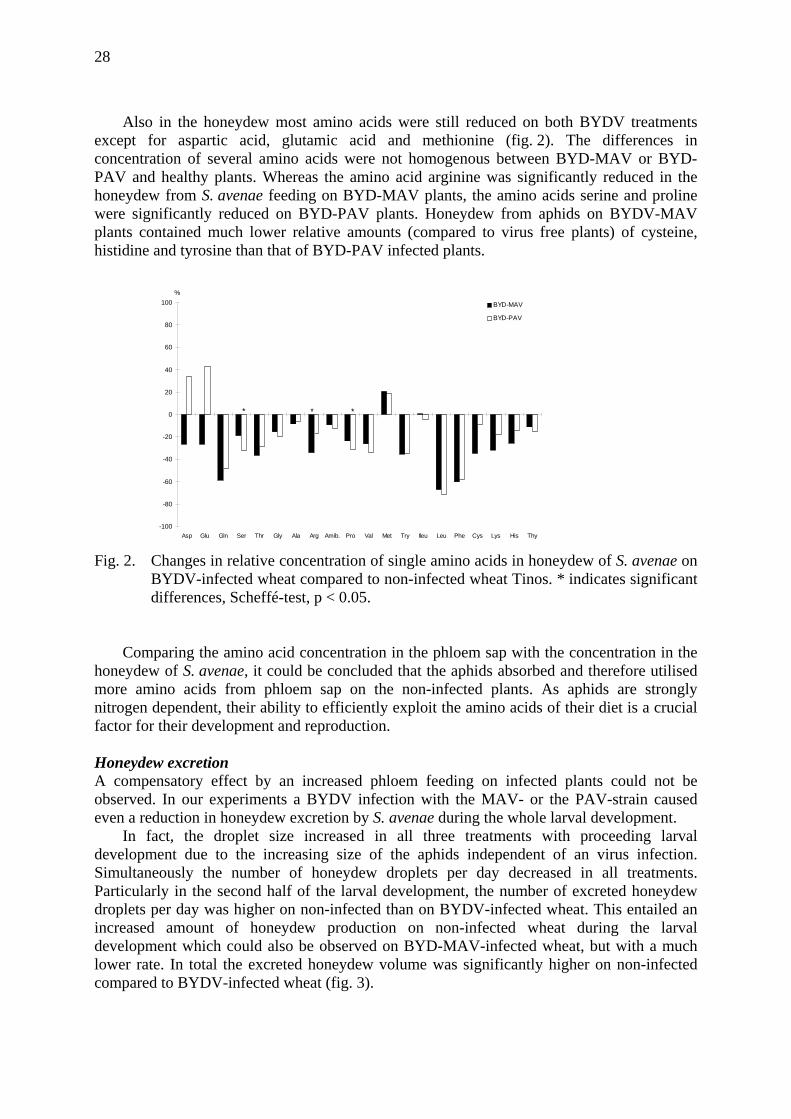
Also in the honeydew most amino acids were still reduced on both BYDV treatments except for aspartic acid, glutamic acid and methionine (fig. 2). The differences in concentration of several amino acids were not homogenous between BYD-MAV or BYD-PAV and healthy plants. Whereas the amino acid arginine was significantly reduced in the honeydew from S. avenae feeding on BYD-MAV plants, the amino acids serine and proline were significantly reduced on BYD-PAV plants. Honeydew from aphids on BYDV-MAV plants contained much lower relative amounts (compared to virus free plants) of cysteine, histidine and tyrosine than that of BYD-PAV infected plants.
-100
-80
-60
-40
-20
0
20
40
60
80
100
Asp Glu Gln Ser Thr Gly Ala Arg Amib. Pro Val Met Try Ileu Leu Phe Cys Lys His Thy
BYD-MAV
BYD-PAV
***
%
Fig. 2. Changes in relative concentration of single amino acids in honeydew of S. avenae on
BYDV-infected wheat compared to non-infected wheat Tinos. * indicates significant differences, Scheffé-test, p < 0.05.
Comparing the amino acid concentration in the phloem sap with the concentration in the honeydew of S. avenae, it could be concluded that the aphids absorbed and therefore utilised more amino acids from phloem sap on the non-infected plants. As aphids are strongly nitrogen dependent, their ability to efficiently exploit the amino acids of their diet is a crucial factor for their development and reproduction.
Honeydew excretion A compensatory effect by an increased phloem feeding on infected plants could not be observed. In our experiments a BYDV infection with the MAV- or the PAV-strain caused even a reduction in honeydew excretion by S. avenae during the whole larval development.
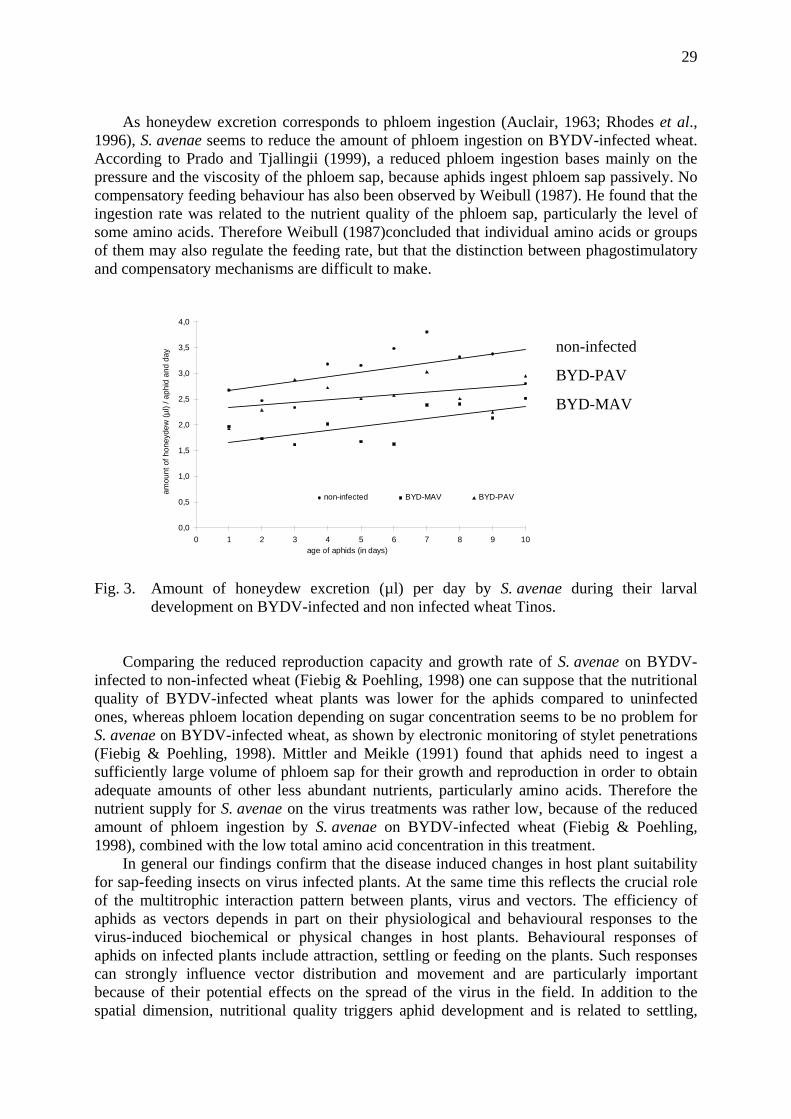
In fact, the droplet size increased in all three treatments with proceeding larval development due to the increasing size of the aphids independent of an virus infection. Simultaneously the number of honeydew droplets per day decreased in all treatments. Particularly in the second half of the larval development, the number of excreted honeydew droplets per day was higher on non-infected than on BYDV-infected wheat. This entailed an increased amount of honeydew production on non-infected wheat during the larval development which could also be observed on BYD-MAV-infected wheat, but with a much lower rate. In total the excreted honeydew volume was significantly higher on non-infected compared to BYDV-infected wheat (fig. 3).
29
As honeydew excretion corresponds to phloem ingestion (Auclair, 1963; Rhodes et al., 1996), S. avenae seems to reduce the amount of phloem ingestion on BYDV-infected wheat. According to Prado and Tjallingii (1999), a reduced phloem ingestion bases mainly on the pressure and the viscosity of the phloem sap, because aphids ingest phloem sap passively. No compensatory feeding behaviour has also been observed by Weibull (1987). He found that the ingestion rate was related to the nutrient quality of the phloem sap, particularly the level of some amino acids. Therefore Weibull (1987)concluded that individual amino acids or groups of them may also regulate the feeding rate, but that the distinction between phagostimulatory and compensatory mechanisms are difficult to make.
0,0
0,5
1,0
1,5
2,0
2,5
3,0
3,5
4,0
0 1 2 3 4 5 6 7 8 9 10age of aphids (in days)
non-infected BYD-MAV BYD-PAVamou
nt o
f hon
eyde
w (µ
l) / a
phid
and
day
Fig. 3. Amount of honeydew excretion (µl) per day by S. avenae during their larval
development on BYDV-infected and non infected wheat Tinos. Comparing the reduced reproduction capacity and growth rate of S. avenae on BYDV-
infected to non-infected wheat (Fiebig & Poehling, 1998) one can suppose that the nutritional quality of BYDV-infected wheat plants was lower for the aphids compared to uninfected ones, whereas phloem location depending on sugar concentration seems to be no problem for S. avenae on BYDV-infected wheat, as shown by electronic monitoring of stylet penetrations (Fiebig & Poehling, 1998). Mittler and Meikle (1991) found that aphids need to ingest a sufficiently large volume of phloem sap for their growth and reproduction in order to obtain adequate amounts of other less abundant nutrients, particularly amino acids. Therefore the nutrient supply for S. avenae on the virus treatments was rather low, because of the reduced amount of phloem ingestion by S. avenae on BYDV-infected wheat (Fiebig & Poehling, 1998), combined with the low total amino acid concentration in this treatment.
In general our findings confirm that the disease induced changes in host plant suitability for sap-feeding insects on virus infected plants. At the same time this reflects the crucial role of the multitrophic interaction pattern between plants, virus and vectors. The efficiency of aphids as vectors depends in part on their physiological and behavioural responses to the virus-induced biochemical or physical changes in host plants. Behavioural responses of aphids on infected plants include attraction, settling or feeding on the plants. Such responses can strongly influence vector distribution and movement and are particularly important because of their potential effects on the spread of the virus in the field. In addition to the spatial dimension, nutritional quality triggers aphid development and is related to settling,
non-infected
BYD-PAV
BYD-MAV
30
wing polymorphism and fitness. In our experiments BYD-MAV or BYD-PAV infection not only reduced host suitability and induced spread of wingless morphs, but additionally promoted the production of alatae progeny as shown by Fiebig and Poehling (1998). Hence, both factors could be favourable for the mutualistic effects leading to virus-induced vector spread.
References Auclair, J.L., 1963: Aphid feeding and nutrition. Ann. Rev. Entomol. 8: 439-490. Blua, M.J., Perring, P.A. & Madore, M.A., 1994: Plant virus-induced changes in aphid
population development and temporal fluctuations in plant nutrients. J. Chem. Ecol. 20(3): 691-707.
Douglas, A.E., 1993: The nutritional quality of phloem sap utilised by natural aphid populations. Ecol. Entomol. 18: 31-38.
Fiebig, M. & Poehling, H.-M., 1998: Host-plant selection and population dynamics of the grain aphid Sitobion avenae (F.) on wheat infected with Barley Yellow Dwarf Virus. Integrated control in cereal crops. IOBC/wprs Bull. 21(8): 51-62.
Febvay, G., Bonnin, J., Rabhé, Y., Bournoville, R., Dolret, S. & Bonnemain, J.L., 1988: Resistance of different lucerne cultivars to the pea aphid Acyrthosiphon pisum: influences of phloem composition on aphid fecundity. Entomol. Exp. Appl. 48: 127-134.
Fereres, A., Araya, J.E., Housley, T.L. & Foster, J.E., 1990: Carbohydrate composition of wheat infected with barley yellow dwarf virus. Z. Pflanzenkrankh. Pflanzenschutz 97(3): 600-608.
Fretz, T.A., Dunham, C.W. & Woodmansee, C.W., 1970: A gas chromatographic procedure for determining soluble carbohydrates extracted from leaf tissue of Ilex opaca Ait. Cv. ´Miss Helen`. J. Amer. Soc. Hort. Sci. 95(1): 99-102.
Jensen, S.G., 1968: Photosynthesis, respiration and other physiological relationships in barley infected with barley yellow dwarf virus. Phytopathology 58: 204-208.
Jensen, S.G., 1970: Metabolism and carbohydrate composition in barley yellow dwarf virus-infected wheat. Phytopathology 62: 587-592.
Jensen, S.G. & van Sambeek, J.W., 1972: Differential effects of barley yellow dwarf virus on the physiology of tissues of hard red spring wheat. Phytopathology 62: 290-293.
Juvik, J.A., Stevens, M.A., Rick, C.M., 1982: Survey of the genus Lycopersicon for variability in α-tomatin content. Hort. Science 17(5): 764-766.
Lowe, S. & Strong, F.E., 1963: The unsuitability of some viruliferous plants as hosts for the green peach aphid, Myzus persicae. J. Econ. Entomol. 56(3): 307-309.
Mittler, T.E. & Meikle, T., 1991: Effects of dietary sucrose concentration on aphid honeydew carbohydrate level and rate of excretion. Entomol. Exp. Appl. 59: 1-7.
Montllor, C.B., Gildow, F.E., 1986: Feeding responses of two grain aphids to barley yellow dwarf virus-infected oats. Entomol. Exp. Appl. 42: 63-69.
Nikolov, Z.L. & Reilly, P.J., 1983: Isothermal Capillary Column Gas Chromatography of trimethylsilyl disaccharides. J. Chromatography 254: 157-162.
Orlob, G.B. & Arny, D.C., 1961: Some metabolic changes accompanying infection by barley yellow dwarf virus. Phytopathology 51: 768-775.
Prado, E. & Tjallingii, W.F., 1999: Effects of experimental stress factors on probing behaviour by aphids. Entomol. Exp. Appl. 90: 289-300.
Rhodes, J.D., Croghan, P.C. & Dixon, A.F.G., 1996: Uptake, excretion and respiration of sucrose and amino acids by the pea aphid Acyrthosiphon pisum. J. Exp. Biol. 199: 1269-1276.
31
Tjallingii, F., 1988: Electrical recording of stylet penetration activities. In: Minks, A.K. & Harrewijn, P. (eds.): Aphids: Their Biology, Natural Enemies and Control. Vol. B., Elsevier, Amsterdam, the Netherlands: 95-107
Weibull, J., 1987: Seasonal changes in the free amino acids of oat and barley phloem sap in relation two plant growth stage and growth of Rhopalosiphum padi. Ann. Appl. Biol. 111: 729-737.

32
Integrated Control in Cereal Crops IOBC wprs Bulletin 24 (6) 2001
pp. 33 - 37
33
The Russian wheat aphid on barley in Morocco: survey and identification of new sources of resistance
Lhaloui, S. 1, M. El Bouhssini 2, S. Ceccarelli 2, S. Grando 2 and A. Amri 2 1 Institut National de la Recherche Agronomique, Centre Aridoculture, P.O. Box 589, Settat,
Morocco 2 International Center for Agricultural Research in the Dry Areas, P.O. Box 5466, Aleppo,
Syria
Summary Recently the Russian wheat aphid (Diuraphis noxia Mordvilko) has become a serious problem for production of cereals in Morocco. The damage has first been limited to high altitude regions, but lately, the pest has spread to all the cereal growing areas of the country. The heaviest populations are still found in the mountain regions where our surveys of 1996 and 1997 showed that 100% of the barley fields were infested, with a mean of 46% of plants showing feeding symptoms of the pest. As part of a pest management package, large collections of barley lines were screened for resistance to the pest. Six plant introductions were identified with very high levels of tolerance (PI366447, PI366449, PI366450, PI366453, Ciho1412, and Ciho9897). Recently, the screening of an ICARDA Barley nursery, both in the field and under controlled environmental conditions, showed that 17 entries were highly resistant (100%), 2 others had 95% of their plants resistant, and a third one had an 85% resistance. These lines, as well as the selected plant introductions, have been incorporated into the Moroccan barley breeding program in order to transfer this resistance into adapted cultivars.
Key words: Russian wheat aphid, survey, incidence, barley, plant resistance.
Introduction The Russian wheat aphid (RWA), Diuraphis noxia (Mordvilko), a pest of wheat and barley, is native to Russia and its neighbouring countries, but has now spread to most of the cereal growing regions of the world, including Africa (Hewitt et al., 1988) and America (Gilchrist et al., 1986).
In Morocco, damage due to this pest has first been noticed during the 80’s, mainly in high altitude regions, but recently, the pest has become more serious, and spread to all the cereal growing areas of the country. The heaviest populations are still found in the mountain regions where our surveys of 1996 and 1997 (Tab. 1) showed that 100% of the barley fields were infested, with a mean of 46% of the plants showing aphid-feeding symptoms (Lhaloui et al., 1998).
Damage caused by this pest presents very typical symptoms, i.e. long longitudinal chlorotic white to yellow streaks on the leaves, frequently associated with leaf rolling. This damage results in severe dry matter and grain yield loss when infestations are heavy.
The best and most efficient way of controlling this pest in Morocco will be by genetic resistance through the development of improved resistant cultivars. Resistance is environ-mentally safe, compatible with other biological control agents, does not involve any extra cost for the farmer (same cost as for non-resistant seed, and no extra cost as compared to buying pesticides), and does not require any sophisticated equipment for its application in the field. The first screening for resistance to this pest in Morocco were conducted by Boulemane
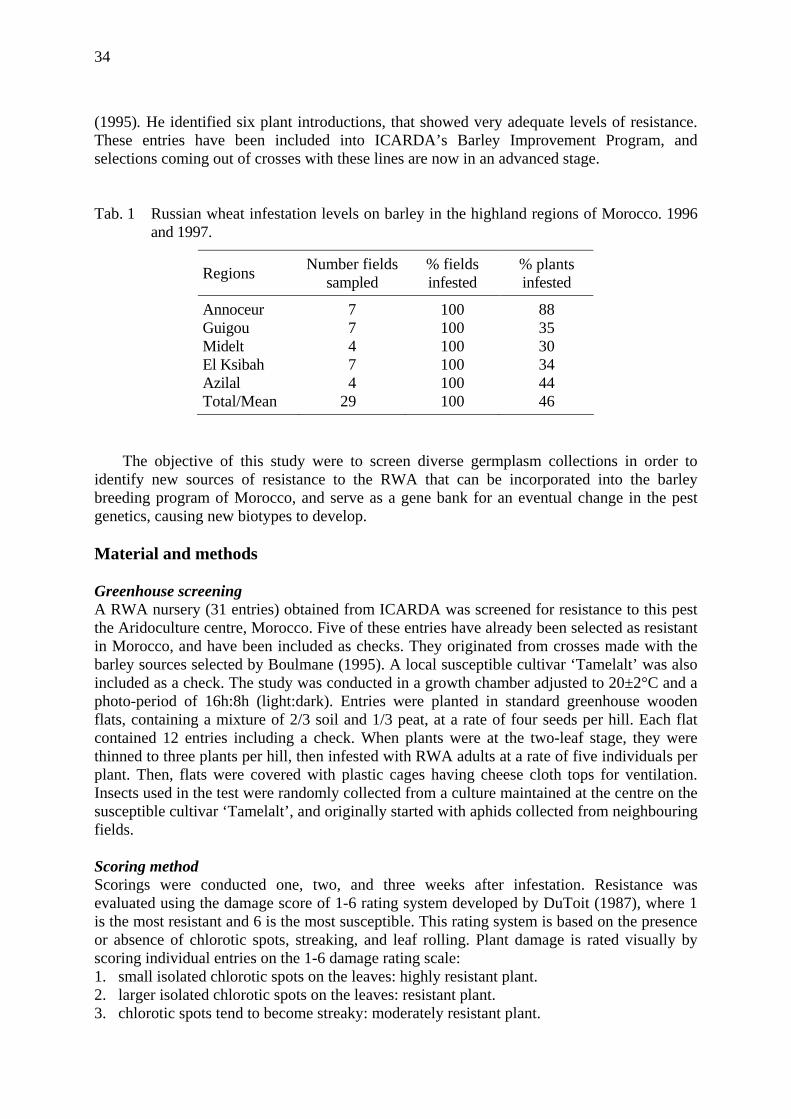
34
(1995). He identified six plant introductions, that showed very adequate levels of resistance. These entries have been included into ICARDA’s Barley Improvement Program, and selections coming out of crosses with these lines are now in an advanced stage. Tab. 1 Russian wheat infestation levels on barley in the highland regions of Morocco. 1996
and 1997.
Regions Number fields sampled
% fields infested
% plants infested
Annoceur 7 100 88 Guigou 7 100 35 Midelt 4 100 30 El Ksibah 7 100 34 Azilal 4 100 44 Total/Mean 29 100 46
The objective of this study were to screen diverse germplasm collections in order to
identify new sources of resistance to the RWA that can be incorporated into the barley breeding program of Morocco, and serve as a gene bank for an eventual change in the pest genetics, causing new biotypes to develop.
Material and methods Greenhouse screening A RWA nursery (31 entries) obtained from ICARDA was screened for resistance to this pest the Aridoculture centre, Morocco. Five of these entries have already been selected as resistant in Morocco, and have been included as checks. They originated from crosses made with the barley sources selected by Boulmane (1995). A local susceptible cultivar ‘Tamelalt’ was also included as a check. The study was conducted in a growth chamber adjusted to 20±2°C and a photo-period of 16h:8h (light:dark). Entries were planted in standard greenhouse wooden flats, containing a mixture of 2/3 soil and 1/3 peat, at a rate of four seeds per hill. Each flat contained 12 entries including a check. When plants were at the two-leaf stage, they were thinned to three plants per hill, then infested with RWA adults at a rate of five individuals per plant. Then, flats were covered with plastic cages having cheese cloth tops for ventilation. Insects used in the test were randomly collected from a culture maintained at the centre on the susceptible cultivar ‘Tamelalt’, and originally started with aphids collected from neighbouring fields.
Scoring method Scorings were conducted one, two, and three weeks after infestation. Resistance was evaluated using the damage score of 1-6 rating system developed by DuToit (1987), where 1 is the most resistant and 6 is the most susceptible. This rating system is based on the presence or absence of chlorotic spots, streaking, and leaf rolling. Plant damage is rated visually by scoring individual entries on the 1-6 damage rating scale: 1. small isolated chlorotic spots on the leaves: highly resistant plant. 2. larger isolated chlorotic spots on the leaves: resistant plant. 3. chlorotic spots tend to become streaky: moderately resistant plant.
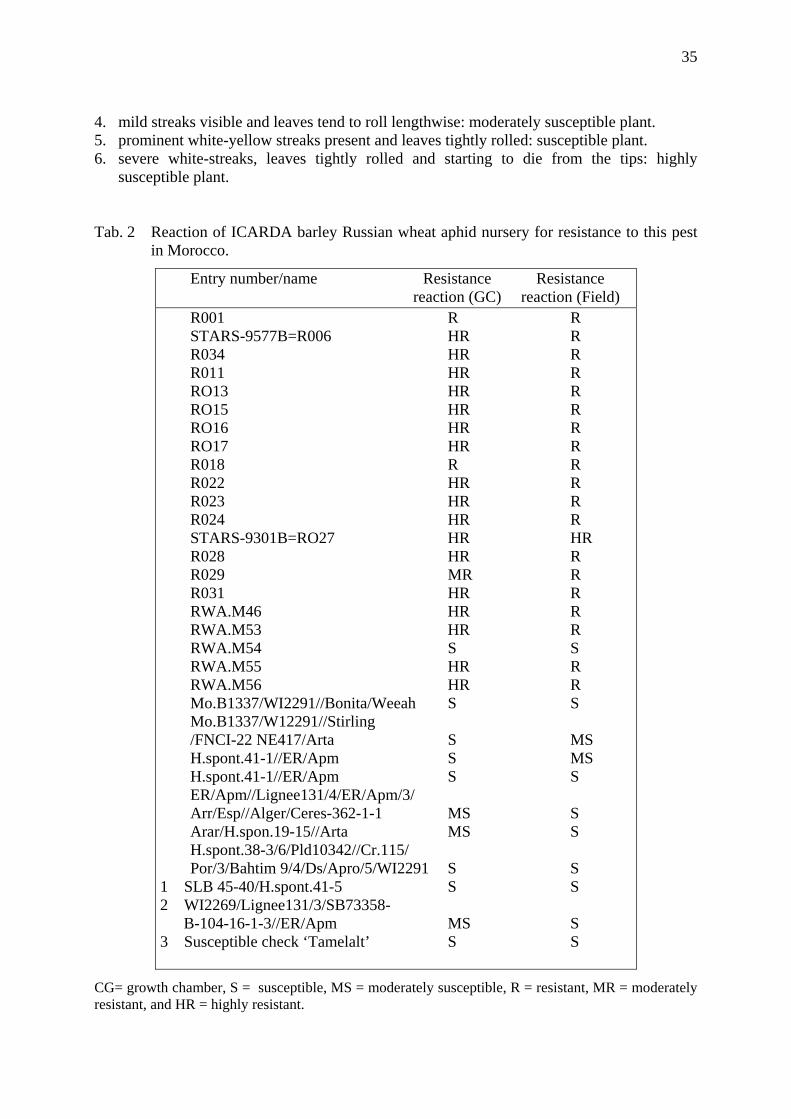
35
4. mild streaks visible and leaves tend to roll lengthwise: moderately susceptible plant. 5. prominent white-yellow streaks present and leaves tightly rolled: susceptible plant. 6. severe white-streaks, leaves tightly rolled and starting to die from the tips: highly
susceptible plant.
Tab. 2 Reaction of ICARDA barley Russian wheat aphid nursery for resistance to this pest in Morocco.
Entry number/name Resistance Resistance reaction (GC) reaction (Field)
R001 R R STARS-9577B=R006 HR R R034 HR R R011 HR R RO13 HR R RO15 HR R RO16 HR R RO17 HR R R018 R R R022 HR R R023 HR R R024 HR R STARS-9301B=RO27 HR HR R028 HR R R029 MR R R031 HR R RWA.M46 HR R RWA.M53 HR R RWA.M54 S S RWA.M55 HR R RWA.M56 HR R Mo.B1337/WI2291//Bonita/Weeah S S Mo.B1337/W12291//Stirling /FNCI-22 NE417/Arta S MS H.spont.41-1//ER/Apm S MS H.spont.41-1//ER/Apm S S ER/Apm//Lignee131/4/ER/Apm/3/ Arr/Esp//Alger/Ceres-362-1-1 MS S Arar/H.spon.19-15//Arta MS S H.spont.38-3/6/Pld10342//Cr.115/ Por/3/Bahtim 9/4/Ds/Apro/5/WI2291 S S
1 SLB 45-40/H.spont.41-5 S S 2 WI2269/Lignee131/3/SB73358-
B-104-16-1-3//ER/Apm MS S 3 Susceptible check ‘Tamelalt’ S S
CG= growth chamber, S = susceptible, MS = moderately susceptible, R = resistant, MR = moderately resistant, and HR = highly resistant.
36
Field screening To confirm the results of the screening under controlled environmental conditions, the same nursery was seeded at Annoceur Experimental Station, situated in a high elevation region where RWA population levels are very high. Entries were seeded in one-meter long lines and replicated four times. A susceptible check was included in each replication. Also, a Moroccan barley land race collection of 759 entries, obtained from ICARDA, was screened for resistance to RWA at this same location. Entries were also seeded in one-meter long lines, but not replicated. For both collections, the damage scoring was done when symptoms became clearly visible on the susceptible lines.
Results and discussion The RWA population levels were very high in the field during late spring, and allowed for excellent infestations of the field screened material. The Moroccan barley land race collection did not exhibit any significant levels of resistance to the RWA in the field. All entries were severely damaged, with ratings going from susceptible to highly susceptible plants. Thus, this collection is considered as not carrying any sources of resistance to this pest, therefore no further controlled screening will be carried on it. Inversely, the results of the RWA nursery screening were very striking; both field and greenhouse results showed the presence of excellent sources of resistance to this pest. The growth chamber results showed that 17 entries were highly resistant, with almost no feeding symptoms on the leaves, and two others were resistant. Of the remaining entries, one was moderately resistant, three were moderately susceptible, and 8 were susceptible (Table 2). The results of the field test confirmed those obtained in the laboratory. All the lines that were resistant in the growth chamber were also resistant in the field. A very slight difference in reaction was however noticed for line number 15, which scored moderately resistant in the laboratory, but resistant in the field; and for lines 23, 24, and 25 which scored susceptible in the laboratory, but moderately susceptible in the field, and lines 27, 28, and 31 which scored moderately susceptible in the laboratory but susceptible in the field (Table 2). These differences may be due to the plants having a better tolerance in the field and/or to the presence of some genetic variability between the populations of the aphid reared in the laboratory and that of the field.
Further research will be carried out to characterise the resistance in the selected lines (antibiosis, antixenosis, or tolerance), and to study the eventual genetic variability within and among the RWA populations of different regions of Morocco.
Conclusion These results indicate that more than 50% of the tested lines carry very good levels of resistance, and because they have good agronomic criteria, they can readily be incorporated into the breeding program to transfer this resistance into Moroccan adapted cultivars.
References Boulemane, H., 1995: Evaluation de materiel végétal de blé, orge, et triticale pour la
résistance au puceron russe au Maroc. Memoire de fin d’etude pour l’obtention du diplôme d’ingenieur d’état de l’école d’agriculture de Meknes, Maroc.
Dutoit, F., 1987: Resistance in wheat (Triticum aestivum L.) to Diuraphis noxia (Homoptera: Aphididae). Cereal Res. Commun. 15:175-178.
37
Hewitt, P.H., 1988: The south African experience with the Russian wheat aphid. P.1-3. In: Peairs, F.B. & Pilcher, S.D. (eds.): Proc. 2nd Russian wheat aphid Workshop, Denver, Co. 11-12 Oct. 1988. Colorado State Univ. Ft. Collins, Co, USA.
Lhaloui, S., El Bouhssini, M. & Amri, A., 1998: Survey of the Russian wheat aphid populations in the Highland regions of Morocco. INRA-CRRA Settat annual research Report.

38
Integrated Control in Cereal Crops IOBC wprs Bulletin 24 (6) 2001
pp. 39 - 47
39
Effects of induced tolerance and induced resistance against aphids in wheat
Martina Galler and Hans-Michael Poehling Institut für Pflanzenkrankheiten und Pflanzenschutz, Universität Hannover, Herrenhäuser Str. 2, D-30419 Hannover, Germany
Summary In field- and greenhouse experiments resistance and tolerance in wheat induced by application of the microbial inducer B50 and the synthetic inducer Bion® against the grain aphid Sitobion avenae were examined. B50 induced both tolerance as well as resistance to S. avenae. Resistance was thereby based on the mechanism of antibiosis. A tolerance effect of Bion® could only be estimated on yield parameters in the field, but no tolerance effect of this inducer could be measured on wheat seedlings with a tolerance index. Further, no significant systemic resistance effects could be observed after a Bion® treatment. First results of honeydew excretion of S. avenae indicated that the application of B50 changed the nutritional quality of the plant for the aphids.
Key words: S. avenae, wheat, induced tolerance, induced resistance
Introduction The terms “induced tolerance” and “induced resistance” are used in the literature with different meanings and assumptions. Karban and Baldwin (1997) defined “induced resistance” as regarded from the herbivore’s point of view and “induced tolerance” as regarded from the plant’s point of view. Many insect-induced plant responses against herbivores have been shown (Brody & Karban, 1989; Wool & Hales, 1996; Agrawal, 1998), and some of the underlying mechanism have already been described (McCloud & Baldwin, 1997; Trewhella et al., 1997; Agrawal et al., 1999). In addition, resistance and/or tolerance reactions in plants can also be triggered by chemical substances, so called defence-inducers, that can be of natural or synthetic origin. Effects of these substances on pathogens are well documented (Steiner, 1989; Schneider & Ullrich; 1994; Kogel et al., 1995; Görlach et al., 1996). However, in only few experiments effects on foliage feeding or sucking insects have so far been studied (Wittmann & Schönbeck, 1996; Stout et al., 1999). In the present study we investigated two chemical inducers, the microbial inducer B50 and the synthetic inducer Bion® for their potential to induce resistance and/or tolerance to S. avenae in wheat.
Material and methods Induction Plants were treated with the microbial inducer B50, metabolites of Bacillus subtilis, (Schönbeck et al., 1980), or the synthetical inducer Bion® (BTH; benzo(1,2,3)thiadiazole-7-carbothioic acid S-methyl ester), a commercial product from Novartis. Both inducers were sprayed on the plants. Control plants were treated with water.
Field experiments The field trials were conducted in 1997 and 1998 with summer wheat Triticum aestivum L.(cv. Remus) on the campus of the Faculty of Horticulture at Hannover University. A 6 × 6 Latin square design was used with a plot size of 17.5 m2. The plants were fertilised with
40
120 kg N/ha (‘Nitrophoska’; N:P:K:Mg = 12:12:17:2). In addition, all plots were treated with the herbicide ‘Pointer’ (Tribenuron) at EC22 and the fungicide ‘Opus top’ (a.i. Epoxiconazol/Fenpropimorph) at EC65. The inducers were applied with a portable compression sprayer, B50 was sprayed twice at EC32 and EC61 (500 l/ha; 1:5 dilution of its normal concentration) and Bion® once at EC32 (60g/ha). In each plot, 10 tillers of first order were marked and the population densities of S. avenae were monitored weekly by counting the number of individuals per ear from May to July. Since natural infestation was low, at EC69 five adult aphids from a laboratory culture were added to each marked ear. At EC71, the insecticide ‘Pirimor’ (a.i. Pirimicarb) was applied to three plots of each treatment to achieve aphid free plants. After ripening, each marked ear was harvested separately to determine the direct yield parameters. For quantification of tolerance effects aphid infestation was expressed as aphid index, which considers the number of aphids and the time of infestation (Wratten & Lee, 1979).
Greenhouse experiments Experiments in the greenhouse were carried out to clarify whether tolerance could also be measured in young plants. Furthermore, the potential of the inducers to evoke antibiosis and antixenosis effects was investigated.
Plant rearing, cultivation and inducer application Summer wheat Triticum aestivum L cv. Remus was used in the experiments. The plants were grown in a greenhouse chamber at 20 ± 4 °C, 50-80 % relative humidity and 16:18h photoperiod (L:D). They were sown in commercial soil (Fruhstorfer Einheitserde) in pots of 11 cm diameter and watered sufficiently. In the host preference experiment, plants were grown in soil in Petri dishes of 12 cm diameter. The inducer solutions (B50 1:3 dilution of culture filtrate, 0,1 g/l Bion®) were applied using a laboratory spraying device.
1. Determination of tolerance in young plants In these experiments the effects of the inducer B50 and Bion® were tested separately. They were sprayed on the plants at EC12 and the control plants were treated with water. Four days after the application, half of the plants were infested with five synchronised adults of S. avenae, which were attached in clip-cages to the second leaf of the plant. Hence, there were four treatments: control plants, B50 or Bion® treated plants, with and without aphids. One experimental unit consisted of six replicates of each treatment, a total of nine units were investigated. Seven days after infestation, half of the plants were harvested and weighed and the whole trial was terminated 14 days after infestation. According to Reese et al. (1994), the regression between the weight of non-infested and infested plants was used as tolerance index. To investigate potential effects of the inducers on aphid biomass, the aphids on each plant were counted, dried and weighed.
2. Determination of resistance Antixenosis. The host preference experiment was carried out in cylinders (inner diameter: 58 cm, 100 cm high) as a free-choice test. A total of 16 cylinders were used. Ten plants were sown in one Petri dish at a time and fertilised twice with 0.8 % ‘Nitrophoska’ solution. Induction took place at EC11. Three days after inducer application, four Petri dishes of each treatment were placed in a random order in one cylinder and 100 winged aphids from the laboratory culture were added. Thus, the aphids were allowed to choose between control plants, B50 and Bion® treated plants. Six days later, aphid preference and colonisation were assessed, by determining the proportion of infested plants of each treatment and the number of aphids per plant.
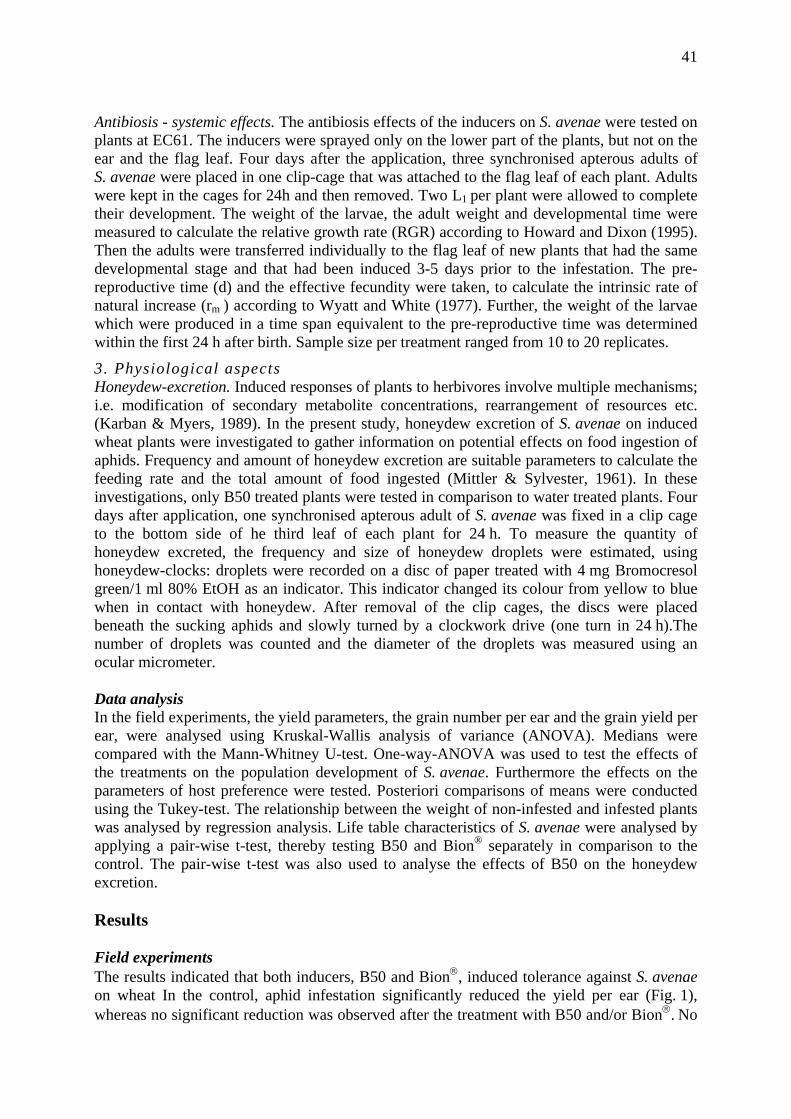
41
Antibiosis - systemic effects. The antibiosis effects of the inducers on S. avenae were tested on plants at EC61. The inducers were sprayed only on the lower part of the plants, but not on the ear and the flag leaf. Four days after the application, three synchronised apterous adults of S. avenae were placed in one clip-cage that was attached to the flag leaf of each plant. Adults were kept in the cages for 24h and then removed. Two L1 per plant were allowed to complete their development. The weight of the larvae, the adult weight and developmental time were measured to calculate the relative growth rate (RGR) according to Howard and Dixon (1995). Then the adults were transferred individually to the flag leaf of new plants that had the same developmental stage and that had been induced 3-5 days prior to the infestation. The pre-reproductive time (d) and the effective fecundity were taken, to calculate the intrinsic rate of natural increase (rm ) according to Wyatt and White (1977). Further, the weight of the larvae which were produced in a time span equivalent to the pre-reproductive time was determined within the first 24 h after birth. Sample size per treatment ranged from 10 to 20 replicates.
3. Physiological aspects Honeydew-excretion. Induced responses of plants to herbivores involve multiple mechanisms; i.e. modification of secondary metabolite concentrations, rearrangement of resources etc. (Karban & Myers, 1989). In the present study, honeydew excretion of S. avenae on induced wheat plants were investigated to gather information on potential effects on food ingestion of aphids. Frequency and amount of honeydew excretion are suitable parameters to calculate the feeding rate and the total amount of food ingested (Mittler & Sylvester, 1961). In these investigations, only B50 treated plants were tested in comparison to water treated plants. Four days after application, one synchronised apterous adult of S. avenae was fixed in a clip cage to the bottom side of he third leaf of each plant for 24 h. To measure the quantity of honeydew excreted, the frequency and size of honeydew droplets were estimated, using honeydew-clocks: droplets were recorded on a disc of paper treated with 4 mg Bromocresol green/1 ml 80% EtOH as an indicator. This indicator changed its colour from yellow to blue when in contact with honeydew. After removal of the clip cages, the discs were placed beneath the sucking aphids and slowly turned by a clockwork drive (one turn in 24 h).The number of droplets was counted and the diameter of the droplets was measured using an ocular micrometer.
Data analysis In the field experiments, the yield parameters, the grain number per ear and the grain yield per ear, were analysed using Kruskal-Wallis analysis of variance (ANOVA). Medians were compared with the Mann-Whitney U-test. One-way-ANOVA was used to test the effects of the treatments on the population development of S. avenae. Furthermore the effects on the parameters of host preference were tested. Posteriori comparisons of means were conducted using the Tukey-test. The relationship between the weight of non-infested and infested plants was analysed by regression analysis. Life table characteristics of S. avenae were analysed by applying a pair-wise t-test, thereby testing B50 and Bion® separately in comparison to the control. The pair-wise t-test was also used to analyse the effects of B50 on the honeydew excretion.
Results Field experiments The results indicated that both inducers, B50 and Bion®, induced tolerance against S. avenae on wheat In the control, aphid infestation significantly reduced the yield per ear (Fig. 1), whereas no significant reduction was observed after the treatment with B50 and/or Bion®. No
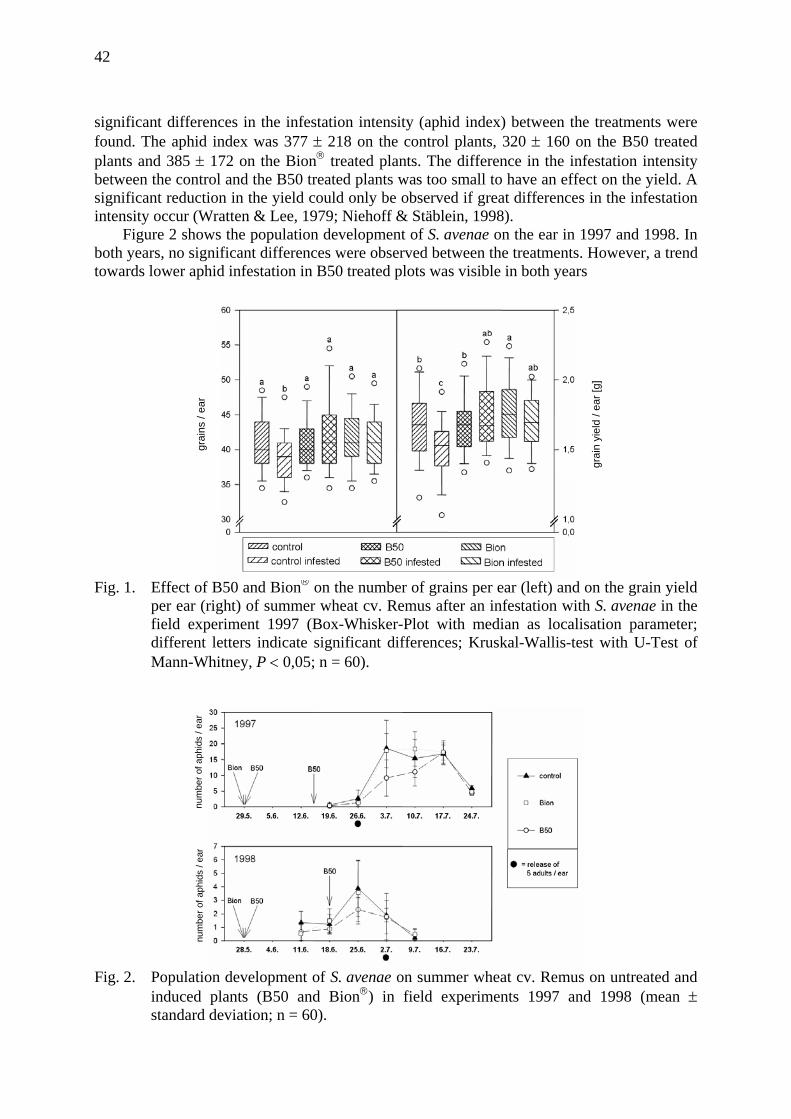
42
significant differences in the infestation intensity (aphid index) between the treatments were found. The aphid index was 377 ± 218 on the control plants, 320 ± 160 on the B50 treated plants and 385 ± 172 on the Bion® treated plants. The difference in the infestation intensity between the control and the B50 treated plants was too small to have an effect on the yield. A significant reduction in the yield could only be observed if great differences in the infestation intensity occur (Wratten & Lee, 1979; Niehoff & Stäblein, 1998).
Figure 2 shows the population development of S. avenae on the ear in 1997 and 1998. In both years, no significant differences were observed between the treatments. However, a trend towards lower aphid infestation in B50 treated plots was visible in both years
Fig. 1. Effect of B50 and Bion® on the number of grains per ear (left) and on the grain yield per ear (right) of summer wheat cv. Remus after an infestation with S. avenae in the field experiment 1997 (Box-Whisker-Plot with median as localisation parameter; different letters indicate significant differences; Kruskal-Wallis-test with U-Test of Mann-Whitney, P < 0,05; n = 60).
Fig. 2. Population development of S. avenae on summer wheat cv. Remus on untreated and induced plants (B50 and Bion®) in field experiments 1997 and 1998 (mean ± standard deviation; n = 60).
grai
ns /
ear
grai
n yi
eld
/ ear
[g]
num
ber o
f aph
ids
/ ear
nu
mbe
r of a
phid
s / e
ar
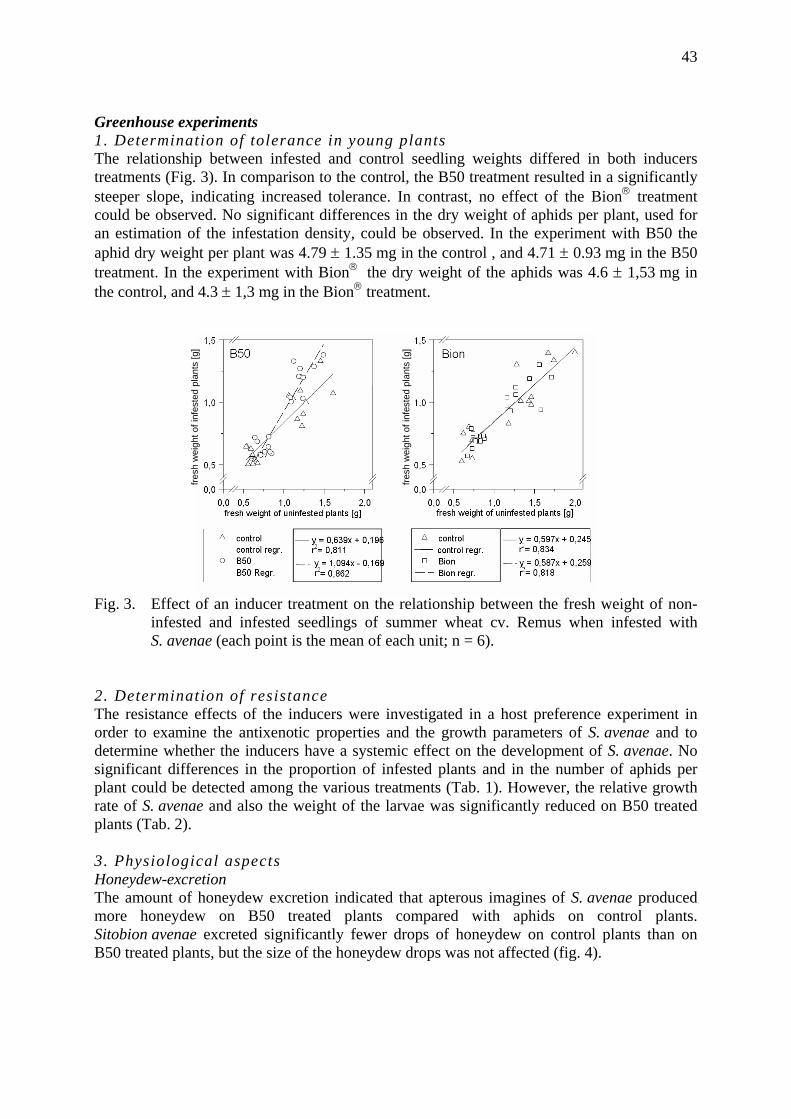
43
Greenhouse experiments 1. Determination of tolerance in young plants The relationship between infested and control seedling weights differed in both inducers treatments (Fig. 3). In comparison to the control, the B50 treatment resulted in a significantly steeper slope, indicating increased tolerance. In contrast, no effect of the Bion® treatment could be observed. No significant differences in the dry weight of aphids per plant, used for an estimation of the infestation density, could be observed. In the experiment with B50 the aphid dry weight per plant was 4.79 ± 1.35 mg in the control , and 4.71 ± 0.93 mg in the B50 treatment. In the experiment with Bion® the dry weight of the aphids was 4.6 ± 1,53 mg in the control, and 4.3 ± 1,3 mg in the Bion® treatment.
Fig. 3. Effect of an inducer treatment on the relationship between the fresh weight of non-infested and infested seedlings of summer wheat cv. Remus when infested with S. avenae (each point is the mean of each unit; n = 6).
2. Determination of resistance The resistance effects of the inducers were investigated in a host preference experiment in order to examine the antixenotic properties and the growth parameters of S. avenae and to determine whether the inducers have a systemic effect on the development of S. avenae. No significant differences in the proportion of infested plants and in the number of aphids per plant could be detected among the various treatments (Tab. 1). However, the relative growth rate of S. avenae and also the weight of the larvae was significantly reduced on B50 treated plants (Tab. 2).
3. Physiological aspects Honeydew-excretion The amount of honeydew excretion indicated that apterous imagines of S. avenae produced more honeydew on B50 treated plants compared with aphids on control plants. Sitobion avenae excreted significantly fewer drops of honeydew on control plants than on B50 treated plants, but the size of the honeydew drops was not affected (fig. 4).
fresh
wei
ght o
f inf
este
d pl
ants
[g]
fresh
wei
ght o
f inf
este
d pl
ants
[g]
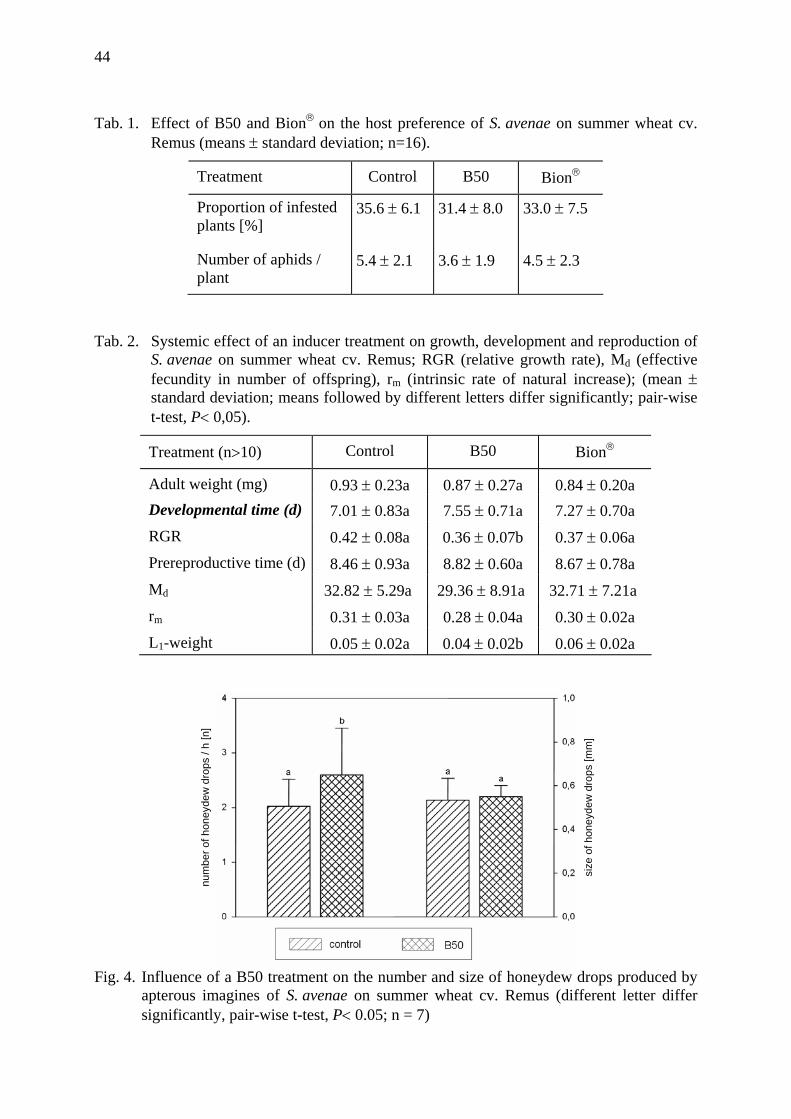
44
Tab. 1. Effect of B50 and Bion® on the host preference of S. avenae on summer wheat cv. Remus (means ± standard deviation; n=16).
Treatment
Control
B50
Bion®
Proportion of infested plants [%]
35.6 ± 6.1 31.4 ± 8.0 33.0 ± 7.5
Number of aphids / plant
5.4 ± 2.1 3.6 ± 1.9 4.5 ± 2.3
Tab. 2. Systemic effect of an inducer treatment on growth, development and reproduction of S. avenae on summer wheat cv. Remus; RGR (relative growth rate), Md (effective fecundity in number of offspring), rm (intrinsic rate of natural increase); (mean ± standard deviation; means followed by different letters differ significantly; pair-wise t-test, P< 0,05).
Treatment (n>10) Control
B50
Bion®
Adult weight (mg)
0.93 ± 0.23a
0.87 ± 0.27a
0.84 ± 0.20a
Developmental time (d)
7.01 ± 0.83a
7.55 ± 0.71a
7.27 ± 0.70a RGR
0.42 ± 0.08a
0.36 ± 0.07b
0.37 ± 0.06a
Prereproductive time (d)
8.46 ± 0.93a
8.82 ± 0.60a
8.67 ± 0.78a Md
32.82 ± 5.29a
29.36 ± 8.91a
32.71 ± 7.21a
rm
0.31 ± 0.03a
0.28 ± 0.04a
0.30 ± 0.02a L1-weight
0.05 ± 0.02a
0.04 ± 0.02b
0.06 ± 0.02a
Fig. 4. Influence of a B50 treatment on the number and size of honeydew drops produced by apterous imagines of S. avenae on summer wheat cv. Remus (different letter differ significantly, pair-wise t-test, P< 0.05; n = 7)
num
ber o
f hon
eyde
w d
rops
/ h
[n]
size
of h
oney
dew
dro
ps [m
m]
45
Discussion The experiments showed that the microbial inducer B50 and the synthetic inducer Bion®, both developed to control plant diseases like powdery mildew on cereals, can have also affect plant-aphid (S. avenae) interactions. B50 mainly induces resistance and/or tolerance in cereal plants to obligate biotrophic pathogens (Oerke et al., 1989; Kehlenbeck & Schönbeck, 1995). Bion®, a commercial product, is characterised as a resistance inducer with a broader spectrum of disease control (Friedrich et al., 1996; Sticher et al., 1997). In the present study, both B50 and Bion® induced tolerance to S. avenae in the field. A similar tolerance induction by B50 to the bird cherry aphid Rhopalosiphum padi (L.) was already described by Wittmann (1996), indicating that this effect is not strictly species specific. As determination of tolerance in terms of yield in field experiments is time consuming, we investigated whether it is possible to already asses the effect with young plants. Commonly, to separate tolerance and antibiosis components, the reduction in seedling weight in relation to aphid units is used as a tolerance index (Dixon et al., 1990; Robinson et al., 1991; Lamb & MacKay, 1995). Reese (1994) proposed to use the slope of the regression between the weight of non-infested and infested plants for measuring tolerance effects. By this method, the problem of quantifying tolerance when only small differences in weight between infested and non-infested plants were measured could be overcome. For this reason, in the present study the index of Reese (1994) was used. Using this laboratory based test system tolerance could only be demonstrated for B50. The reasons for the different results with young and old plants remain unclear because knowledge on the mechanisms of induced tolerance is still limited. Tolerance induction after a B50 treatment has been shown to be associated with changes in the sink-source-relationship of wheat plants infested by R. padi or powdery mildew (Wittmann, 1996). Further, Gernns (1999) demonstrated that tolerance induction had an effect on the fructan reserve pools of powdery mildew infected barley plants, and hence on the quality and quantity of the grain.
A resistance effect of B50 was shown in the field by reduction of population development of S. avenae. In greenhouse experiments we examined whether resistance was caused by antibiosis or antixenosis effects. Sitobion avenae showed no preference for any of the treated plants, suggesting that resistance was mainly caused by antibiosis effects. In addition, the results of the antibiosis experiments indicated a systemic effect of the B50 treatment on the growth parameters of the aphids, whereas Bion® had no significant influence. This corroborates earlier reports which already showed local resistance induction with B50 against S. avenae (Galler & Poehling, 1998). Systemic effects of B50 on pathogens were already described by Kraska (1996). Similar effects on pathogens and insect pest are not the rule: for instance, Stout et al. (1999) demonstrated induced systemic resistance on tomatoes to a bacterial pathogen, Pseudomonas syringae pv. tomato by benzothiadiazole, while at the same time suitability of leaflets for larvae of the chewing caterpillar, Helicoverpa zea was improved. This indicates that the induced response is inducer specific and depends on the interacting organisms.
Concerning mechanisms of resistance, antibiosis could be due to the absence or differences in concentrations of nutritional components and/or stimulants, as well as due to the presence of deterrents and/or toxic metabolites (Niraz et al., 1985). Brody and Karban (1989) suggested that induced mite resistance in cotton was caused by the degradation of the nutritional quality of the plant.
First attempts to clarify the underlying mechanisms centred on induced differences in nutritional components that are important for aphid development. Honeydew analysis is a convenient tool to quantify the amount of phloem sap taken up, as well as to describe diet substances ingested by the aphids. The first results of honeydew excretion of S. avenae
46
showed an increase in honeydew production on B50 treated plants. This may indicate that the B50 treatment reduced the nutritional value of the phloem sap which the aphids tried to compensate by increased feeding activity. Further work is in progress to analyse more in detail the effects of inducer treatments on concentration and composition of carbohydrates and amino acids in the phloem sap and honeydew of S. avenae.
References Agrawal, A.A., 1998: Induced responses to herbivory and increased plant performance.
Science 279: 1201-1202. Agrawal, A.A., Tuzun, S. & Bent, E., 1999: Induced plant defenses against pathogens and
herbivores. American Phytopathological Society Press, Minnesota. Brody, A.K. & Karban, R., 1989: Demographic analysis of induced resistance against spider
mites (Acari: Tetranychidae) in cotton. J. Econ. Entomol. 82: 462-465. Dixon, A.G.O., Bramel-Cox, P.J., Reese, J.C. & Harvey, T.L., 1990: Mechanisms of
resistance and their interactions in twelve sources of resistance to biotype E greenbug (Homoptera: Aphididae) in sorghum. J. Econ. Entomol. 83: 234-240.
Friedrich, L., Lawton, K., Ruess, W., Masner, P., Specker, N., Gut Rella, M., Meier, B., Dincher, S., Staub, T., Uknes, S., Métraux, J.-P., Kessmann, H. & Ryals, J., 1996: A benzothiadiazole derivate induces systemic acquired resistance in tobacco. The Plant Journal 10: 61-70.
Galler, M. & Poehling, H.-M., 1998: Induced tolerance and induced resistance against biotrophic pathogens and cereal aphids in wheat. IOBC/WPRS Bull. 21(8): 193-199.
Gernns, H. 1999: Mechanismen der induzierten Kompensationsfähigkeit von Pflanzen gegenüber Schäden durch den obligat biotrophen Pilz Erysiphe graminis DC. f.sp. hordei Ém. Marchal. Ph.D. thesis, Hannover University, Germany.
Görlach, J., Volrath, S., Knauf-Beiter, G., Hengy, G, Beckhove, U., Kogel, K.-H., Oostendorp, M., Staub, T., Ward, E., Kessmann, H. & Ryals, J., 1996: Benzothiadiazole, a novel class of inducers of systemic acquired resistance, activates gene expression and disease resistance in wheat. Plant Cell 8: 629-643.
Howard, M.T. & Dixon, A.F.G., 1995: Factor determining the pest status of the rose-grain aphid, Metopolophium dirhodum (Walker), on winter barley in the United Kingdom. Ann. appl. Biol. 127: 1-10.
Karban, R. & Myers, J.H., 1989: Induced plant responses to herbivory. Annual Review of Ecology and Systematics 20: 331-348.
Karban, R. & Baldwin, I.T., 1997: Induced responses to herbivory. Univ. of Chicago Press, Chicago.
Kehlenbeck, H. & Schönbeck, F., 1995: Effects of induced resistance on disease severity/yield relations in mildewed barley. J. Phytopath. 143: 561-567.
Kogel, K.H., Ortel, B., Jarosch, B., Atzorn, R., Schiffer, R. & Wasternack, K., 1995: Resistance in barley against the powdery mildew fungus (Erysiphe graminis f.sp. hordei) is not associated with enhanced levels of endogenous jasmonates. J. Plant Pathol. 101: 319-332.
Kraska, T., 1996: Vergleichende Untersuchungen von Resistenzinduktoren, deren Wirkungs-weise und dem Einfluß auf die DNA-Methylierung. Ph.D. thesis, Hannover University, Germany.
Lamb, R.J. & MacKay, P.A., 1995: Tolerance of antibiotic and susceptible cereal seedlings to the aphids Metopolophium dirhodum and Rhopalosiphum padi. Ann. Appl. Biol. 127: 573-583.
47
McCloud, E.S. & Baldwin, I.T., 1997: Herbivory and caterpillar regurgitants amplify the wound-induced increases in jasmonic acid but not nicotine in Nicotiana sylvestris. Planta 203: 430-435.
Mittler, T.E. & Sylvester, E.S., 1961: A comparison of the injury to alfalfa by the aphids Therioaphis maculata and Macrosiphon pisi. J. Econ. Entomol. 54: 615-622.
Niehoff, B. & Stäblein, J., 1998: Vergleichende Untersuchungen zum Schadpotential der Getreideblattlausarten Metopolophium dirhodum (Wlk.) und Sitobion avenae (F.) in Winterweizen. J. Appl. Ent. 122: 223-229.
Niraz, S., Leszczynski, B., Ciepiela, A. & Urbanska, A., 1985: Biochemical aspects of winter wheat resistance to aphids. Insect Sci. Applic. 6: 253-257.
Oerke, E.-C., Steiner, U. & Schönbeck, F., 1989: Zur Wirksamkeit der induzierten Resistenz unter praktischen Anbaubedingungen. V. Mehltaubefall und Ertrag von Winter- und Sommergerste in Abhängigkeit von der Stickstoffdüngung. J. Plant Dis. Prot. 96: 140-153.
Reese, J.C., Schwenke, J.R., Lamont, P.S. & Zehr, D.D., 1994: Importance and quantification of plant tolerance in crop pest management programs for aphids: Greenbug resistance in sorghum. Journal of Agricultural Entomology 11: 255-270.
Robinson, J., Vivar, H.E., Burnett, P.A., Calhoun, D.S., 1991: Resistance to Russian wheat aphid (Homoptera: Aphididae) in barley genotypes. J. Econ. Entomol. 84: 674-679.
Schneider, S. & Ullrich, W.R., 1994: Differential induction of resistance and enhanced enzyme activities in cucumber and tobacco caused by treatment with various abiotic and biotic inducers. Physiol. Mol. Plant Pathol., 45: 291-304.
Schönbeck, F., Dehne, H.-W. & Beicht, W., 1980: Untersuchungen zur Aktivierung unspe-zifischer Resistenzmechanismen in Pflanzen. J. Plant Dis. Prot. 87: 654-666.
Steiner, U., 1989: Zum Einfluß induzierter Resistenz auf den Wirt-Parasit-Komplex Gerste Echter Mehltau: Sortenabhängige Resistenzreaktionen und Befalls-Verlust-Relationen. Ph.D. thesis, Hannover University, Germany.
Sticher, L., Mauch-Mani, B. & Métraux, J.P., 1997: Systemic acquired resistance. Ann. Rev. Phytopathol. 35: 235-270.
Stout, M.J., Fidantsef, A.L., Duffey, S.S. & Bostock, R.M., 1999: Signal interactions in pathogen and insect attack: systemic plant-mediated interactions between pathogens and herbivores of the tomato, Lycopersicon esculentum. Physiological and Molecular Plant Pathology 54: 115-130.
Trewhella, K.E., Leather, S.R. & Day, K.R., 1997: Insect induced resistance in Lodgepole pine: effects on two pine feeding insects. J. Appl. Ent. 121: 129-136.
Wittmann, J. & Schönbeck, F., 1996: Studies of tolerance induction in wheat infested with powdery mildew or aphids. J. Plant Dis. Prot. 103: 300-309.
Wool, D. & Hales, D.F., 1996: Previous infestation affects recolonization of cotton by Aphis gossypii: Induced resistance or plant damage? Phytoparasitica 24: 39-48.
Wratten, S.D. & Lee, G., 1979: Duration of cereal aphid populations and the effects on wheat yield and quality. Proc. BCPC - Pests and Diseases, 1-8.
Wyatt, I.J. & White, P.F., 1977: Simple estimation of intrinsic rates for aphids and tetranychid mites. Appl. Ecol. 14: 757-766.

48
Integrated Control in Cereal Crops IOBC wprs Bulletin 24 (6) 2001
pp. 49 - 58
49
How does a ladybird respond to aphids?
Holger Triltsch, Gunnar Hechenthaler, Uwe Gosselke and Bernd Freier BBA, Institute for Integrated Plant Protection, Stahnsdorfer Damm 81, D-14532 Kleinmachnow, Germany
Summary Three different experimental designs were used to investigate prey searching behaviour of adult Coccinella septempunctata and Propylea quatuordecimpunctata under laboratory conditions: 1. Y-tube-airflow-olfactometer, 2. static 4-chamber olfactometer, and 3. semi-field bioassay-arena. Y-olfactometer bioassays were performed with both ladybird species. No significant attraction to odours of aphids or aphids on host plants was observed in olfactometer bioassays. The spatial distribution of ten C. septempunctata females was examined in a 2.65m² semi-field bioassay-arena which was subdivided into 64 panels. Different coloured panels or Petri dishes containing aphids were used to simulate prey and non-prey patches. Ladybird females did not respond to aphid occurrence but accumulated in panels of high brightness. Although different experimental designs were used it was not possible to detect any response to olfactory cues under laboratory conditions. Field data on the spatial distribution of aphids and ladybirds in an agricultural area of 4 km² were obtained by sweep netting at two locations from March to July in 1998 and in 1999. The spatial distribution of C. septempunctata was correlated only at certain time periods with aphid occurrence. Moreover, it was observed that C. septempunctata adults tend to migrate into fields with relatively low aphid densities. They promptly disappeared at higher aphid densities and abundant occurrence of conspecific larvae. These observations indicate a behaviour in accordance with the optimal foraging theory of ladybirds. In P. quatuordecimpunctata distribution was generally not related to aphid density.
Key words: ladybird, Coccinella septempunctata, Propylea quatuordecimpunctata, prey searching,
bioassay, dispersal, numerical response, optimal foraging theory
Introduction Ladybirds are considered to be important antagonists, regulating aphid population dynamics in cereals (Sunderland et al., 1983; Poehling, 1988; Freier et al., 1998). Two ecological terms describe the efficiency of a predator: 1. numerical response and 2. functional response (e.g. Gutierrez et al., 1984; Wellings & Dixon, 1987). An efficient predator should be able to aggregate in prey patches and should increase its predation rate with increasing prey density.
However, in a number of field investigations it was shown that ladybird occurrence was not at all related to aphid density or only in certain crops or years (Honek, 1985; Hemptinne et al., 1994; Triltsch & Freier, 1998). Moreover, the mechanisms a ladybird uses to locate aphid infested patches are still unknown. Several authors have reported that ladybirds search randomly and discover their prey only by physical contact (Hodek, 1970; Frazer & Gilbert, 1976). Recent findings, however, indicate that coccinellids recognise aphids visually and respond to aphid odours (Nakamuta, 1984a & b; Sengonca & Liu, 1994), but the perception distance of ladybirds was found to be very small and these findings cannot explain why ladybirds decide to enter or leave certain fields.
The key stimuli ladybirds use during their movement within an agricultural area, as well as their aphid consumption rate under natural conditions are still a field of speculation.
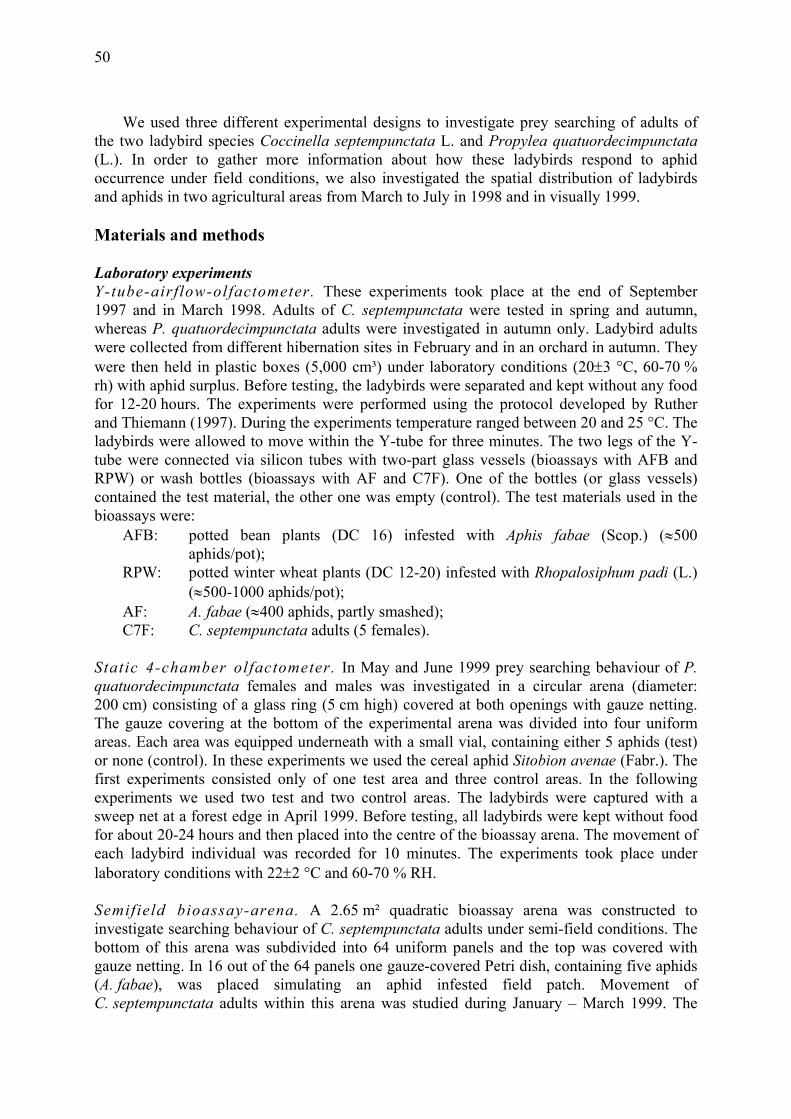
50
We used three different experimental designs to investigate prey searching of adults of the two ladybird species Coccinella septempunctata L. and Propylea quatuordecimpunctata (L.). In order to gather more information about how these ladybirds respond to aphid occurrence under field conditions, we also investigated the spatial distribution of ladybirds and aphids in two agricultural areas from March to July in 1998 and in visually 1999. Materials and methods Laboratory experiments Y-tube-airflow-olfactometer. These experiments took place at the end of September 1997 and in March 1998. Adults of C. septempunctata were tested in spring and autumn, whereas P. quatuordecimpunctata adults were investigated in autumn only. Ladybird adults were collected from different hibernation sites in February and in an orchard in autumn. They were then held in plastic boxes (5,000 cm³) under laboratory conditions (20±3 °C, 60-70 % rh) with aphid surplus. Before testing, the ladybirds were separated and kept without any food for 12-20 hours. The experiments were performed using the protocol developed by Ruther and Thiemann (1997). During the experiments temperature ranged between 20 and 25 °C. The ladybirds were allowed to move within the Y-tube for three minutes. The two legs of the Y-tube were connected via silicon tubes with two-part glass vessels (bioassays with AFB and RPW) or wash bottles (bioassays with AF and C7F). One of the bottles (or glass vessels) contained the test material, the other one was empty (control). The test materials used in the bioassays were:
AFB: potted bean plants (DC 16) infested with Aphis fabae (Scop.) (≈500 aphids/pot);
RPW: potted winter wheat plants (DC 12-20) infested with Rhopalosiphum padi (L.) (≈500-1000 aphids/pot);
AF: A. fabae (≈400 aphids, partly smashed); C7F: C. septempunctata adults (5 females).
Static 4-chamber olfactometer. In May and June 1999 prey searching behaviour of P. quatuordecimpunctata females and males was investigated in a circular arena (diameter: 200 cm) consisting of a glass ring (5 cm high) covered at both openings with gauze netting. The gauze covering at the bottom of the experimental arena was divided into four uniform areas. Each area was equipped underneath with a small vial, containing either 5 aphids (test) or none (control). In these experiments we used the cereal aphid Sitobion avenae (Fabr.). The first experiments consisted only of one test area and three control areas. In the following experiments we used two test and two control areas. The ladybirds were captured with a sweep net at a forest edge in April 1999. Before testing, all ladybirds were kept without food for about 20-24 hours and then placed into the centre of the bioassay arena. The movement of each ladybird individual was recorded for 10 minutes. The experiments took place under laboratory conditions with 22±2 °C and 60-70 % RH. Semifield bioassay-arena. A 2.65 m² quadratic bioassay arena was constructed to investigate searching behaviour of C. septempunctata adults under semi-field conditions. The bottom of this arena was subdivided into 64 uniform panels and the top was covered with gauze netting. In 16 out of the 64 panels one gauze-covered Petri dish, containing five aphids (A. fabae), was placed simulating an aphid infested field patch. Movement of C. septempunctata adults within this arena was studied during January – March 1999. The
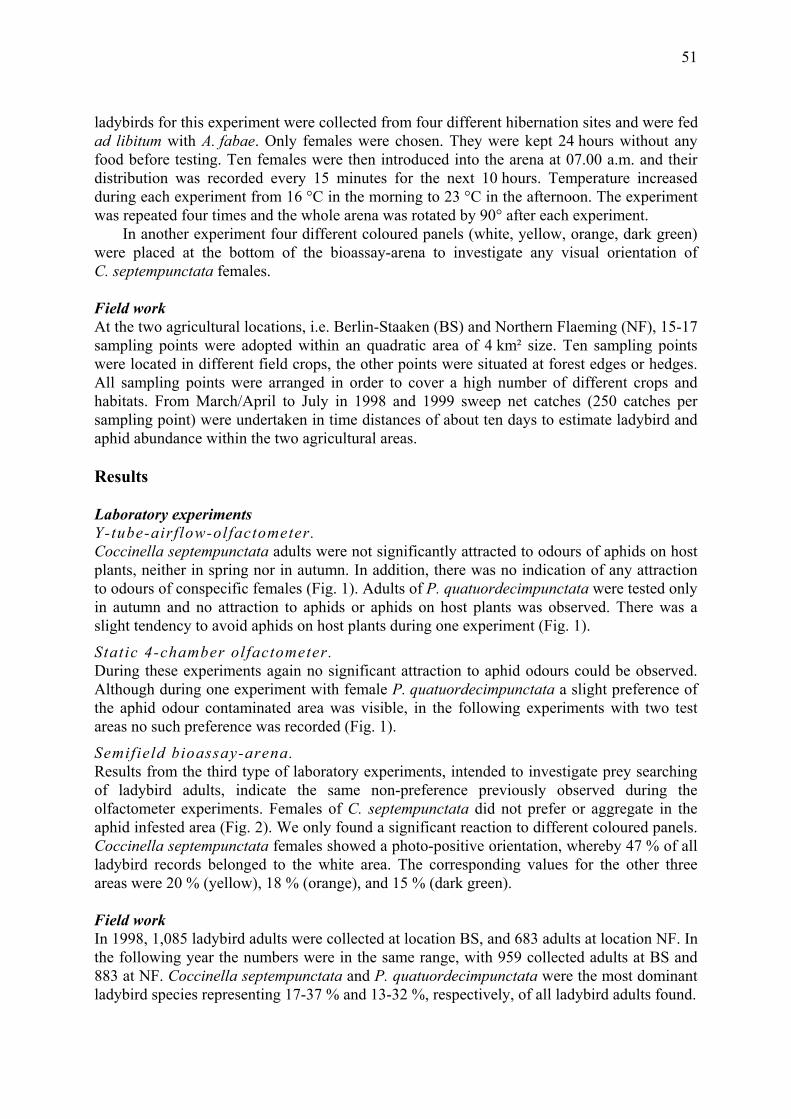
51
ladybirds for this experiment were collected from four different hibernation sites and were fed ad libitum with A. fabae. Only females were chosen. They were kept 24 hours without any food before testing. Ten females were then introduced into the arena at 07.00 a.m. and their distribution was recorded every 15 minutes for the next 10 hours. Temperature increased during each experiment from 16 °C in the morning to 23 °C in the afternoon. The experiment was repeated four times and the whole arena was rotated by 90° after each experiment.
In another experiment four different coloured panels (white, yellow, orange, dark green) were placed at the bottom of the bioassay-arena to investigate any visual orientation of C. septempunctata females.
Field work At the two agricultural locations, i.e. Berlin-Staaken (BS) and Northern Flaeming (NF), 15-17 sampling points were adopted within an quadratic area of 4 km² size. Ten sampling points were located in different field crops, the other points were situated at forest edges or hedges. All sampling points were arranged in order to cover a high number of different crops and habitats. From March/April to July in 1998 and 1999 sweep net catches (250 catches per sampling point) were undertaken in time distances of about ten days to estimate ladybird and aphid abundance within the two agricultural areas.
Results Laboratory experiments Y-tube-airflow-olfactometer. Coccinella septempunctata adults were not significantly attracted to odours of aphids on host plants, neither in spring nor in autumn. In addition, there was no indication of any attraction to odours of conspecific females (Fig. 1). Adults of P. quatuordecimpunctata were tested only in autumn and no attraction to aphids or aphids on host plants was observed. There was a slight tendency to avoid aphids on host plants during one experiment (Fig. 1).
Static 4-chamber olfactometer. During these experiments again no significant attraction to aphid odours could be observed. Although during one experiment with female P. quatuordecimpunctata a slight preference of the aphid odour contaminated area was visible, in the following experiments with two test areas no such preference was recorded (Fig. 1).
Semifield bioassay-arena. Results from the third type of laboratory experiments, intended to investigate prey searching of ladybird adults, indicate the same non-preference previously observed during the olfactometer experiments. Females of C. septempunctata did not prefer or aggregate in the aphid infested area (Fig. 2). We only found a significant reaction to different coloured panels. Coccinella septempunctata females showed a photo-positive orientation, whereby 47 % of all ladybird records belonged to the white area. The corresponding values for the other three areas were 20 % (yellow), 18 % (orange), and 15 % (dark green).
Field work In 1998, 1,085 ladybird adults were collected at location BS, and 683 adults at location NF. In the following year the numbers were in the same range, with 959 collected adults at BS and 883 at NF. Coccinella septempunctata and P. quatuordecimpunctata were the most dominant ladybird species representing 17-37 % and 13-32 %, respectively, of all ladybird adults found.
52
Aphid occurrence differed between locations and years. At location BS winter rye, oats, spring wheat, and winter barley were heavily infested with aphids in 1998. Aphid densities higher than 500 aphids per sample first occurred in winter rye (beginning of May), later in spring cereals (end of May) and then in winter barley (June). At location NF aphids were abundant in winter rye, oats, peas, winter wheat and hedges in 1998. In contrast to location BS, aphid numbers of the different crops/habitats at NF were highest in mid June. In 1999 aphids were not as frequent as in the preceding year and built up their populations relatively late in June and July. Higher aphid densities, i.e. >500 aphids/sample, were only observed in oats (BS, NF) and pea (NF). At location BS it was again evident that aphid population first peaked in winter rye (beginning of June) and later in oats (end of June) and in winter wheat (July).
autumn
n. sign.n = 44
n. sign.n = 43
0%
20%
40%
60%
80%
100%
spring
n. sign.n = 60
n. sign.n = 39
C. 7punctata - females
A. fabae/ bean
C. 7punctata - females
autumn
P<0.001n = 61
n. sign.n = 51
n. sign.n = 75
R. padi/ oats
A. fabaeA. fabae/ bean
A. fabae/ bean
test control
0%
20%
40%
60%
80%
100%
females
0%
20%
40%
60%
80%
100%
a b ab b
S. avenae
n = 24 n. sign.
females
n = 24
Y-tube airflow-olfactometer
Static 4-chamber olfactometer
S. avenaeS. avenae
spring spring
Fig. 1. Results of olfactometer experiments with adults of Coccinella septempunctata and Propylea quatuordecimpunctata.
53
1-5 6 - 10 11 - 20 21 - 40
30% 26%
24% 20%
A. fabae
2.65m2 semifield bioassay-arena
Fig. 2. Mean distribution of ten Coccinella septempunctata females in a semi-field bioassay-arena with aphid infested and non-infested patches.
To a certain extend the described cycle in occurrence of aphids at different crops was also observable in C. septempunctata but not in P. quatuordecimpunctata. At the beginning of the observation period adults of C. septempunctata were found only at forest edges and in hedges. At the end of April and the beginning of May the ladybirds were most frequently found in fallow lands or in early cereal crops, e.g. winter rye and winter barley. At the same time the first aphid colonies appeared there. In the second half of May ladybird distribution changed remarkably. Despite of an increased aphid density in those early crops adults of C. septempunctata disappeared and were subsequently very frequently found in oats and spring wheat. At this time, only few initial aphid colonies were present in spring cereal fields. In the first half of June the ladybird adults preferred other crops, e.g. peas and winter wheat. Now aphids occurred in higher numbers in nearly all crops but most attractively to the adults of C. septempunctata were fields with only few conspecific larvae. An example of such an aggregation of ladybird adults in a winter barley field, which was previously not used as breeding site and was therefore occupied only by few ladybird larvae, is shown in Figure 3.
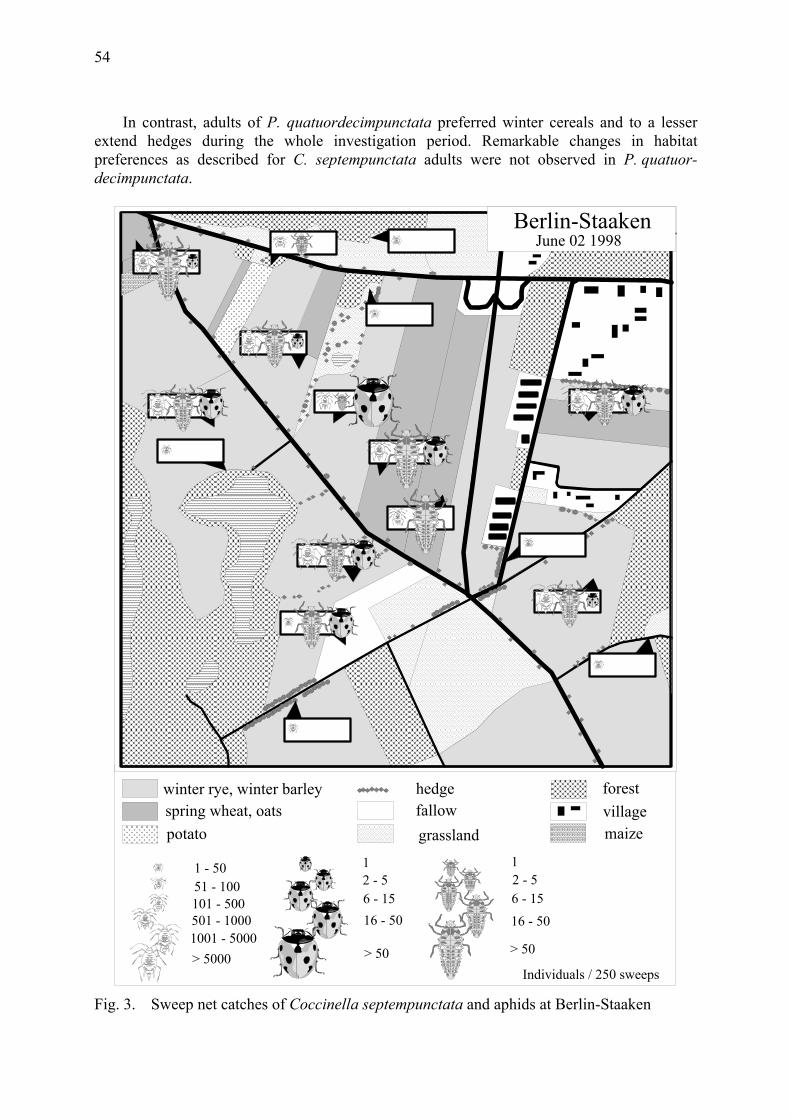
54
In contrast, adults of P. quatuordecimpunctata preferred winter cereals and to a lesser extend hedges during the whole investigation period. Remarkable changes in habitat preferences as described for C. septempunctata adults were not observed in P. quatuor-decimpunctata.
hedgewinter rye, winter barleyspring wheat, oats
forest
grasslandvillage
potatofallow
1 - 50
1001 - 5000
51 - 100101 - 500501 - 1000
> 5000
12 - 56 - 1516 - 50
> 50
maize
Berlin-Staaken
Individuals / 250 sweeps
12 - 56 - 1516 - 50
> 50
June 02 1998
Fig. 3. Sweep net catches of Coccinella septempunctata and aphids at Berlin-Staaken
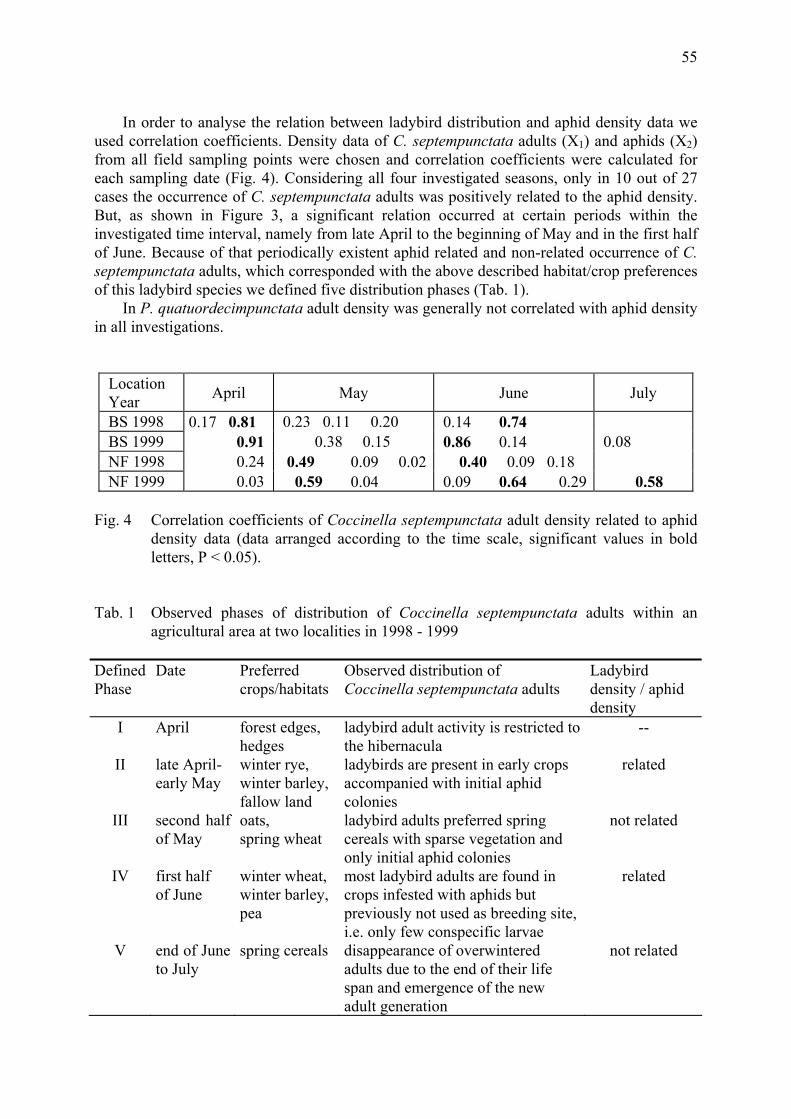
55
In order to analyse the relation between ladybird distribution and aphid density data we used correlation coefficients. Density data of C. septempunctata adults (X1) and aphids (X2) from all field sampling points were chosen and correlation coefficients were calculated for each sampling date (Fig. 4). Considering all four investigated seasons, only in 10 out of 27 cases the occurrence of C. septempunctata adults was positively related to the aphid density. But, as shown in Figure 3, a significant relation occurred at certain periods within the investigated time interval, namely from late April to the beginning of May and in the first half of June. Because of that periodically existent aphid related and non-related occurrence of C. septempunctata adults, which corresponded with the above described habitat/crop preferences of this ladybird species we defined five distribution phases (Tab. 1).
In P. quatuordecimpunctata adult density was generally not correlated with aphid density in all investigations.
Location Year April May June July
BS 1998 0.17 0.81 0.23 0.11 0.20 0.14 0.74 BS 1999 0.91 0.38 0.15 0.86 0.14 0.08 NF 1998 0.24 0.49 0.09 0.02 0.40 0.09 0.18 NF 1999 0.03 0.59 0.04 0.09 0.64 0.29 0.58
Fig. 4 Correlation coefficients of Coccinella septempunctata adult density related to aphid
density data (data arranged according to the time scale, significant values in bold letters, P < 0.05).
Tab. 1 Observed phases of distribution of Coccinella septempunctata adults within an agricultural area at two localities in 1998 - 1999
Defined Phase
Date Preferred crops/habitats
Observed distribution of Coccinella septempunctata adults
Ladybird density / aphid density
I April forest edges, hedges
ladybird adult activity is restricted to the hibernacula
--
II late April- early May
winter rye, winter barley, fallow land
ladybirds are present in early crops accompanied with initial aphid colonies
related
III second half of May
oats, spring wheat
ladybird adults preferred spring cereals with sparse vegetation and only initial aphid colonies
not related
IV first half of June
winter wheat, winter barley, pea
most ladybird adults are found in crops infested with aphids but previously not used as breeding site, i.e. only few conspecific larvae
related
V end of June to July
spring cereals disappearance of overwintered adults due to the end of their life span and emergence of the new adult generation
not related
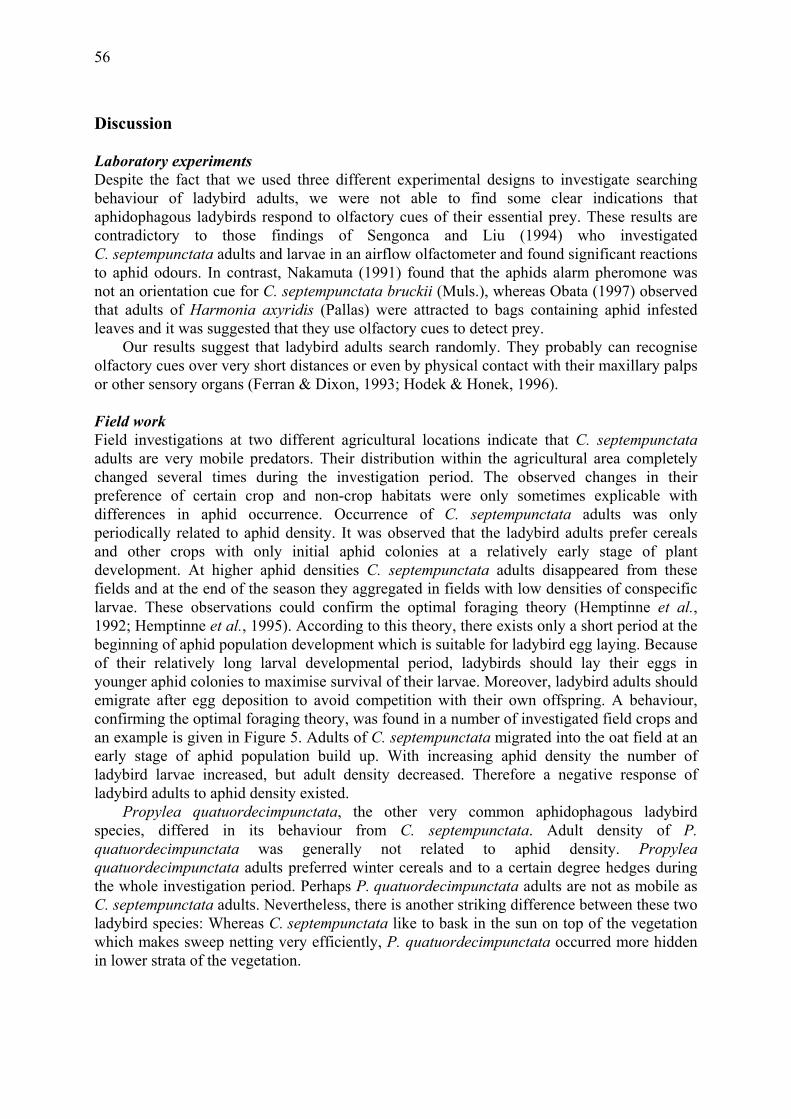
56
Discussion Laboratory experiments Despite the fact that we used three different experimental designs to investigate searching behaviour of ladybird adults, we were not able to find some clear indications that aphidophagous ladybirds respond to olfactory cues of their essential prey. These results are contradictory to those findings of Sengonca and Liu (1994) who investigated C. septempunctata adults and larvae in an airflow olfactometer and found significant reactions to aphid odours. In contrast, Nakamuta (1991) found that the aphids alarm pheromone was not an orientation cue for C. septempunctata bruckii (Muls.), whereas Obata (1997) observed that adults of Harmonia axyridis (Pallas) were attracted to bags containing aphid infested leaves and it was suggested that they use olfactory cues to detect prey.
Our results suggest that ladybird adults search randomly. They probably can recognise olfactory cues over very short distances or even by physical contact with their maxillary palps or other sensory organs (Ferran & Dixon, 1993; Hodek & Honek, 1996).
Field work Field investigations at two different agricultural locations indicate that C. septempunctata adults are very mobile predators. Their distribution within the agricultural area completely changed several times during the investigation period. The observed changes in their preference of certain crop and non-crop habitats were only sometimes explicable with differences in aphid occurrence. Occurrence of C. septempunctata adults was only periodically related to aphid density. It was observed that the ladybird adults prefer cereals and other crops with only initial aphid colonies at a relatively early stage of plant development. At higher aphid densities C. septempunctata adults disappeared from these fields and at the end of the season they aggregated in fields with low densities of conspecific larvae. These observations could confirm the optimal foraging theory (Hemptinne et al., 1992; Hemptinne et al., 1995). According to this theory, there exists only a short period at the beginning of aphid population development which is suitable for ladybird egg laying. Because of their relatively long larval developmental period, ladybirds should lay their eggs in younger aphid colonies to maximise survival of their larvae. Moreover, ladybird adults should emigrate after egg deposition to avoid competition with their own offspring. A behaviour, confirming the optimal foraging theory, was found in a number of investigated field crops and an example is given in Figure 5. Adults of C. septempunctata migrated into the oat field at an early stage of aphid population build up. With increasing aphid density the number of ladybird larvae increased, but adult density decreased. Therefore a negative response of ladybird adults to aphid density existed.
Propylea quatuordecimpunctata, the other very common aphidophagous ladybird species, differed in its behaviour from C. septempunctata. Adult density of P. quatuordecimpunctata was generally not related to aphid density. Propylea quatuordecimpunctata adults preferred winter cereals and to a certain degree hedges during the whole investigation period. Perhaps P. quatuordecimpunctata adults are not as mobile as C. septempunctata adults. Nevertheless, there is another striking difference between these two ladybird species: Whereas C. septempunctata like to bask in the sun on top of the vegetation which makes sweep netting very efficiently, P. quatuordecimpunctata occurred more hidden in lower strata of the vegetation.
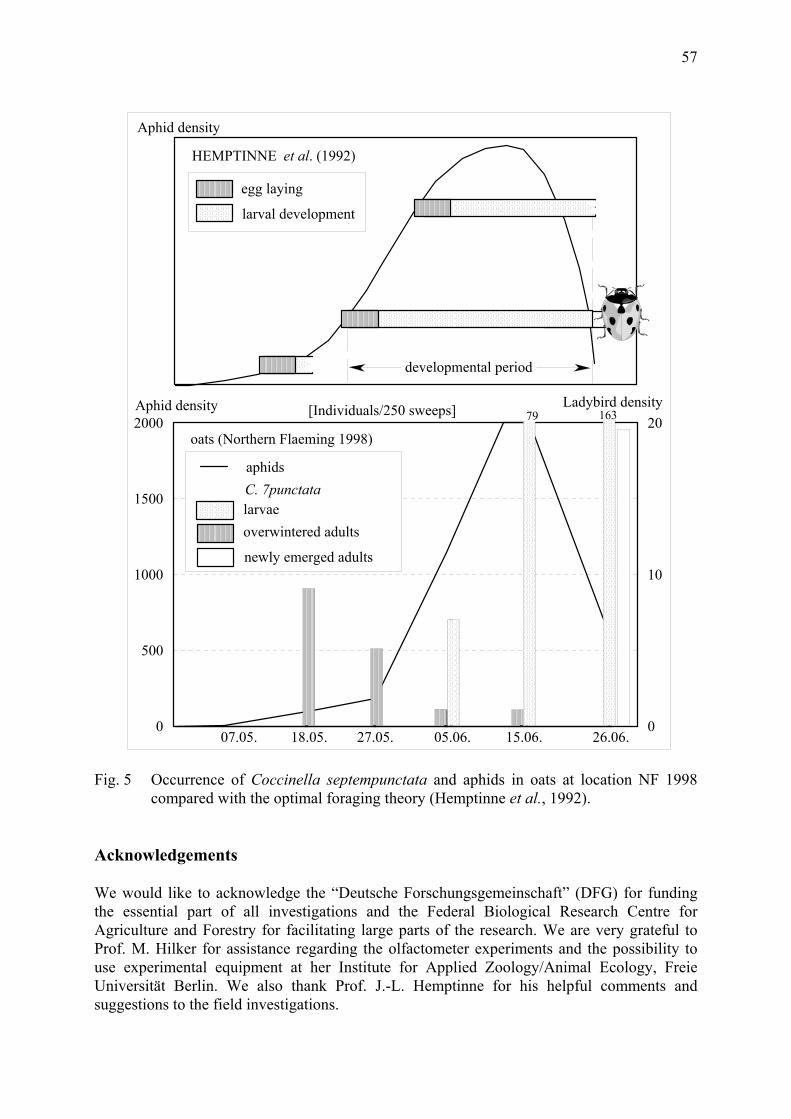
57
Aphid density
0
500
1000
1500
2000
0
10
2079 163Ladybird density[Individuals/250 sweeps]
18.05.07.05. 27.05. 05.06. 15.06. 26.06.
oats (Northern Flaeming 1998)
aphidsC. 7punctata
overwintered adults
newly emerged adults
larvae
developmental period
egg laying
larval development
HEMPTINNE et al. (1992)
Aphid density
Fig. 5 Occurrence of Coccinella septempunctata and aphids in oats at location NF 1998 compared with the optimal foraging theory (Hemptinne et al., 1992).
Acknowledgements We would like to acknowledge the “Deutsche Forschungsgemeinschaft” (DFG) for funding the essential part of all investigations and the Federal Biological Research Centre for Agriculture and Forestry for facilitating large parts of the research. We are very grateful to Prof. M. Hilker for assistance regarding the olfactometer experiments and the possibility to use experimental equipment at her Institute for Applied Zoology/Animal Ecology, Freie Universität Berlin. We also thank Prof. J.-L. Hemptinne for his helpful comments and suggestions to the field investigations.
58
References Ferran, A. & Dixon, A.F.G., 1993: Foraging behaviour of ladybird larvae (Coleoptera:
Coccinellidae). Eur. J. Entomol. 90: 383-402. Frazer, B.D. & Gilbert, N., 1976: Coccinellids and aphids: A quantitative study of the impact
of adult ladybirds (Col., Coccinellidae) preying on field populations of pea aphids (Hom., Aphididae). J. Entomol. Soc. Br. Columbia 73: 33-56.
Freier, B., Möwes, M. & Triltsch, H., 1998: Beneficial thresholds for Coccinella 7-punctata L. (Col., Coccinellidae) as a predator of cereal aphids in winter wheat – results of population investigations and computer simulations. J. Appl. Entomol. 122: 213-217.
Gutierrez, A.P., Baumgartner, J.U. & Summers, C.G., 1984: Multitrophic models of predator-prey energetics. Can. Entomologist 116: 923-963.
Hemptinne, J.-L., Dixon, A.F.G. & Coffin, J., 1992: Attack strategy of ladybird beetles (Coccinellidae): factors shaping their numerical response. Oecologia 90: 238-245.
Hemptinne, J.-L., Doucet, J.-L. & Gaspar, C., 1994: How do ladybirds and syrphids respond to aphids in the field? IOBC/wprs Bull. 17(4): 101-111.
Hemptinne, J.-L., Doumbia, M. & Gaspar, C., 1995: The reproductive strategy of predators is a major constraint to the implementation of biological control in the field. Med. Fac. Landb. Toegep. Biol. Wetensch. Univ. Gent 60: 735-741.
Hodek, I., 1970: Coccinellids and modern pest management. Bioscience 20: 543-552. Hodek, I. & Honek, A., 1996: Ecology of coccinellidae. Kluwer Academic Publ., Dordrecht:
464 pp. Honek, A., 1985: Habitat preferences of aphidophagous coccinellids (Coleoptera). Entomo-
phaga 30: 253-264. Nakamuta, K., 1984a: Visual orientation of a ladybeetle, Coccinella septempunctata L. (Col.,
Coccinellidae), toward its prey. Appl. Entomol. Zool. 19: 82-86. Nakamuta, K., 1984b: Aphid body fluid stimulates feeding of a predatory ladybeetle
Coccinella septempunctata L. (Col., Coccinellidae). Appl. Entomol. Zool. 19: 123-125. Nakamuta, K., 1991: Aphid alarm pheromone component (E)-Beta-farnesene and local search
by a predatory lady beetle Coccinella septempunctata bruckii Mulsant (Col., Coccinell-idae). Appl. Entomol. Zool. 26: 1-17.
Obata, S., 1997: The influence of aphids on the behaviour of adults of the ladybird beetle, Harmonia axyridis (Col.: Coccinellidae). Entomophaga 42: 103-106.
Poehling, H.-M., 1988: Zum Auftreten von Syrphiden- und Coccinellidenlarven in Winter-weizen von 1984-1987 in Relation zur Abundanz von Getreideblattläusen. Mitt. Dtsch. Ges. allg. ang. Entomol. 6: 248-254.
Ruther, J. & Thiemann, K., 1997: Response of the pollen beetle Meligethes aeneus to volatiles emitted by intact plants and conspecifics. Entomol. Exp. Appl. 84: 183-188.
Sengonca, C. & Liu, B., 1994: Response of the different instar predator, Coccinella septem-punctata L. (Col., Coccinellidae), to the kairomones produced by the prey and non-prey as well as the predator itself. Z. Pflanzenkrankh. Pflanzenschutz 101: 173-177.
Sunderland, K.D., Chambers, R.J., Stacey, D.L. & Wyatt, I.J., 1983: Predators prevent aphid outbreaks. AFRC News 1983: 12.
Triltsch, H. & Freier, B., 1998: Investigations on differences between ladybird populations (Coleoptera, Coccinellidae) at three localities. IOBC/wprs Bull. 21(8): 113-124.
Wellings, P.W. & Dixon, A.F.G., 1987: The role of weather and natural enemies in determining aphid outbreaks. In: Barbosa, P. & Schultz, J.C. (eds.): Insect Outbreaks. Academic Press, London: 313-346.
Integrated Control in Cereal Crops IOBC wprs Bulletin 24 (6) 2001
pp. 59 - 64
59
Computer simulations on the efficiency of cereal aphid predators in winter wheat
Uwe Gosselke1, Dietmar Roßberg2, Holger Triltsch3 and Bernd Freier3 1 Humboldt-University, Institute for Phytomedicine/Applied Entomology, Berlin, Germany 2 BBA, Institute for Technology Assessment in Plant Protection, Kleinmachnow, Germany 3 BBA, Institute for Integrated Plant Protection, Stahnsdorfer Damm 81, D-14532
Kleinmachnow
Summary Efficiency of predators in the tritrophic system winter wheat- cereal aphids – antagonists was investigated with computer simulations in combination with real field data. In scenario runs with the model GTLAUS99 real conditions, based on field data of population dynamics of aphids and their antagonists were simulated. Simulated data did not differ from field data by more than 20%. The corresponding model run without any predators was calculated afterwards, and the difference in aphid infestation was interpreted as a predator effect. Our study indicates that without antagonists aphid infestation would cause economically important yield loss in about 2/3 of all cases. The economic value per single predator unit seemed to be small, but the entire predator community was responsible for a notable benefit up to 100 DM per ha.
Key words: computer simulations, aphid predators, cereal aphids, winter wheat, predator efficiency, economic predator effect
Introduction Within the concept of integrated plant protection in arable farming the consideration of ecological self-control mechanisms like natural enemies is an important goal. Therefore, several attempts were made to get a realistic picture about the effect of beneficial arthropods. In many cases the tritrophic interactions cereals – aphids – predators was used as a model system. A large number of feeding experiments with predatory arthropods were performed, providing data about their feeding capacity under laboratory conditions (e.g. Sundby, 1966; Hämäläinen et al., 1975; Chiverton, 1988; Winder et al., 1994). Because of the well known difficulties of transferring such data to complex natural conditions, many investigations concentrate on field work. Certain predator-prey constellations were studied in experiments with field cages (e.g. Rautapää, 1975; Ghanim, 1981; Wetzel et al., 1981). In other experiments field barriers were introduced into the field to study population dynamics of aphids with and without the impact of predatory ground dwelling arthropods (Chiverton, 1987). Nevertheless, in many field investigations data obtained from detailed field counts were used for different calculations of the efficiency of natural enemies (e.g. Wratten, 1987; Freier et al., 1999). Because of mainly methodical problems investigating the complex nature of predator-prey interactions under natural conditions such an approach is not likely to provide quantitative data on the efficiency of natural enemies. Hence, economic calculations of the effect of predators are still rare (Sterling et al., 1992).
In recent years simulation models became useful tools for studies on the population dynamics of aphids and antagonists, their trophic interactions and dependency on driving forces (Freier et al., 1996; Skirvin et al., 1997). These models could offer the chance to investigate agro-ecosystems in a more complex way.
60
The aim of the present study was to quantify the efficiency of the most important cereal aphid predators within the tritrophic interactions of winter wheat – aphids – antagonists. A combination of detailed field counts with computer simulations was used and the quantification should then allow to calculate the economical benefit of the antagonists.
Material and methods We used the following methodological approach in this study: Field data on aphid and antagonist densities were utilised as database for computer simulations. Model runs started with initial values observed in the field. Simulated aphid density was then compared with field data and the run was termed “successful” if simulated values differed from field values by less then 20%. Then the corresponding model run without any predators was calculated, and the difference in aphid infestation was interpreted as predator effect. Aphid infestation was measured as number of individuals per m², and aphid days per tiller (aphid index). The entire predator community was measured by calculating predator units, which allows to add the different predator fractions according to their potential food uptake at 20°C (Freier et al., 1997, 1998). Simulation model In our study we used the model GTLAUS 99 which is a deterministic, discrete simulation model written in Borland-Pascal 7.0. GTLAUS 99 contains submodels for winter wheat, cereal aphids (Sitobion avenae, Rhopalosiphum padi, Metopolophium dirhodum), and aphid predators (Coccinella septempunctata, Propylea quatuordecimpunctata, syrphids). The impact of other aphid antagonists, i.e. chrysopids, carabids, staphylinids, spiders, parasitoids and entomopathogenic fungi, was considered using special regression functions. GTLAUS was previously validated with field data and already used in different investigations, e.g. about climate change and predator-prey interaction (Freier & Triltsch, 1996; Triltsch & Roßberg, 1997) or beneficial thresholds (Freier et al., 1998). A detailed description of the current model is provided in Gosselke et al. (2001).
The GTLAUS model has a compartment structure and each compartment contains different age classes. Each model run begins with a range of starting values of density, structure and immigration type of the aphid population and their antagonists at a specific date during wheat flowering. Then daily density values of cereal aphids and antagonists were calculated by the model. Field counts Investigations were carried out in unsprayed winter wheat fields at two different localities, Flaeming (F) and Magdeburger Boerde (M) from 1993 to 1999. During eight weeks field counts were performed weekly between wheat growth stages (BBCH) 49 and 87 (Meier, 1997). Densities of aphids and antagonists were recorded at 2x5 counting points at distances of 20, 40, 60, 80, and 100 m, respectively, from one field margin. At every point wheat tillers were examined for 3 m along a row.
Results Population dynamics of aphids and their antagonists were simulated, using initial density values according to field data. In figure 1 a comparison between simulated aphid infestation and aphid density data observed during field counts is shown. In all 14 cases, e.g.
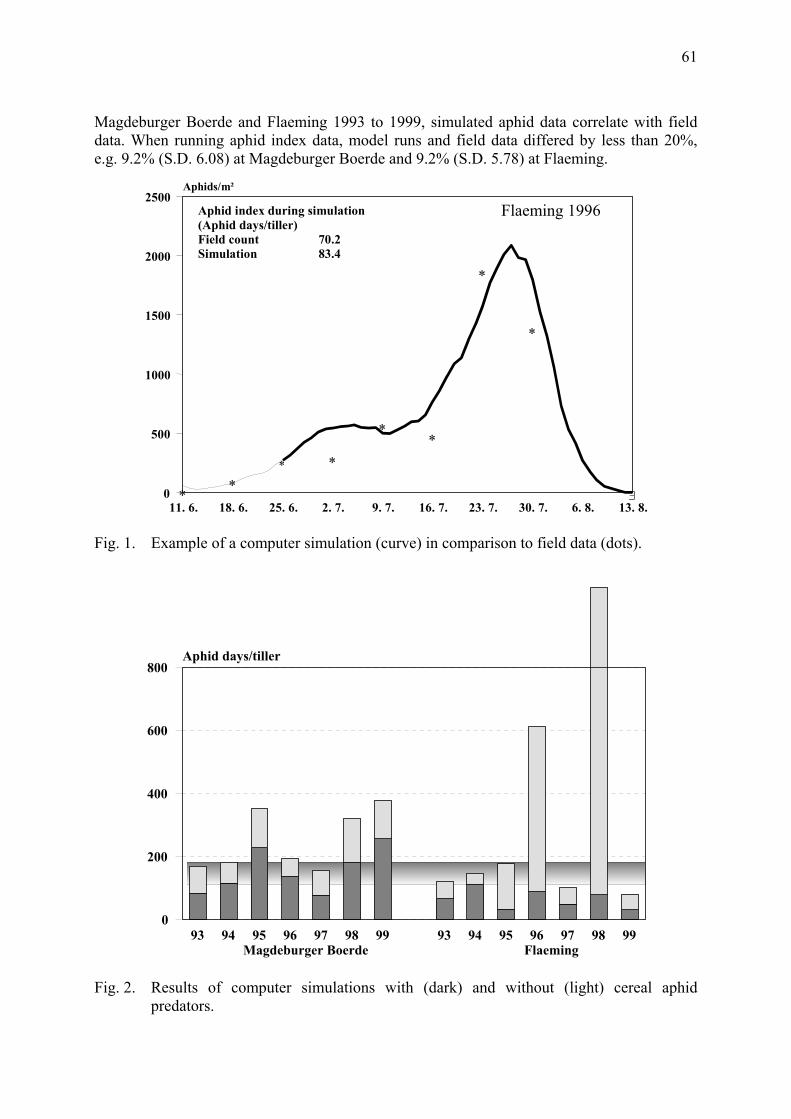
61
Magdeburger Boerde and Flaeming 1993 to 1999, simulated aphid data correlate with field data. When running aphid index data, model runs and field data differed by less than 20%, e.g. 9.2% (S.D. 6.08) at Magdeburger Boerde and 9.2% (S.D. 5.78) at Flaeming.
Fig. 1. Example of a computer simulation (curve) in comparison to field data (dots).
Fig. 2. Results of computer simulations with (dark) and without (light) cereal aphid
predators.
93 94 95 96 97 98 99 93 94 95 96 97 98 990
200
400
600
800Aphid days/tiller
FlaemingMagdeburger Boerde
∗ ∃∗
∗ ∗
∗∗
∗
∗
11. 6. 18. 6. 25. 6. 2. 7. 9. 7. 16. 7. 23. 7. 30. 7. 6. 8. 13. 8.0
500
1000
1500
2000
2500Aphids/m²
Flaeming 1996Aphid index during simulation(Aphid days/tiller)Field count 70.2Simulation 83.4
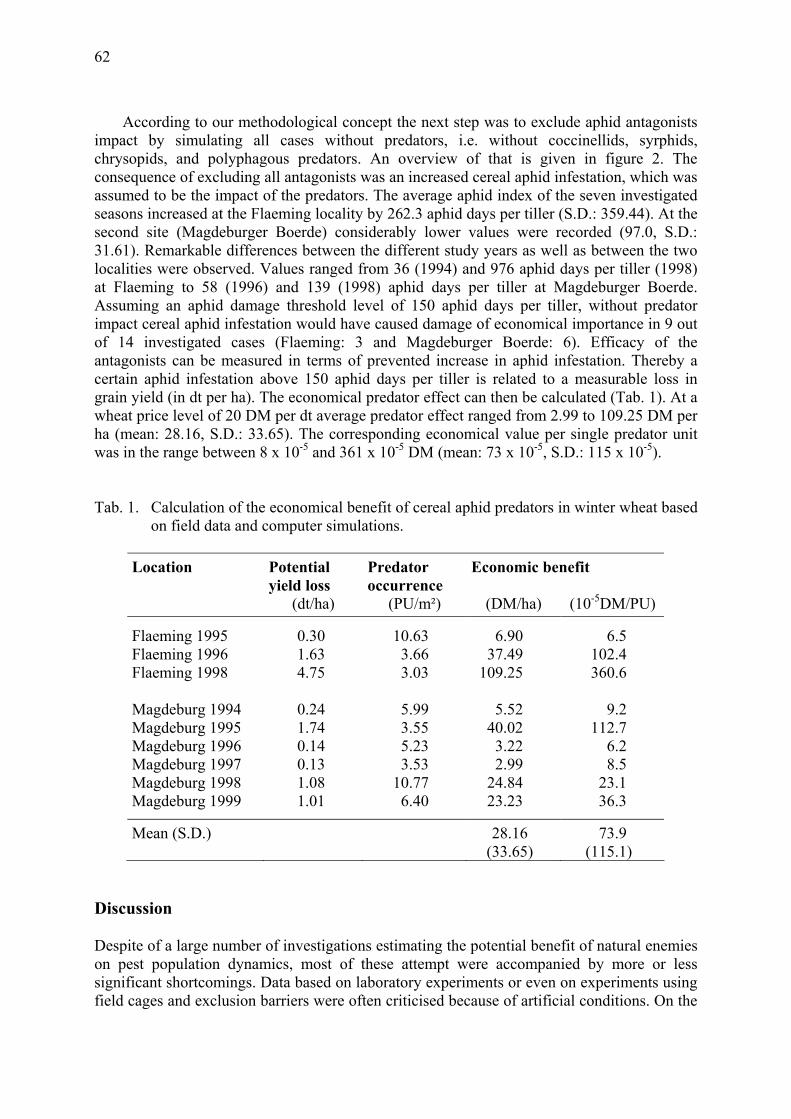
62
According to our methodological concept the next step was to exclude aphid antagonists impact by simulating all cases without predators, i.e. without coccinellids, syrphids, chrysopids, and polyphagous predators. An overview of that is given in figure 2. The consequence of excluding all antagonists was an increased cereal aphid infestation, which was assumed to be the impact of the predators. The average aphid index of the seven investigated seasons increased at the Flaeming locality by 262.3 aphid days per tiller (S.D.: 359.44). At the second site (Magdeburger Boerde) considerably lower values were recorded (97.0, S.D.: 31.61). Remarkable differences between the different study years as well as between the two localities were observed. Values ranged from 36 (1994) and 976 aphid days per tiller (1998) at Flaeming to 58 (1996) and 139 (1998) aphid days per tiller at Magdeburger Boerde. Assuming an aphid damage threshold level of 150 aphid days per tiller, without predator impact cereal aphid infestation would have caused damage of economical importance in 9 out of 14 investigated cases (Flaeming: 3 and Magdeburger Boerde: 6). Efficacy of the antagonists can be measured in terms of prevented increase in aphid infestation. Thereby a certain aphid infestation above 150 aphid days per tiller is related to a measurable loss in grain yield (in dt per ha). The economical predator effect can then be calculated (Tab. 1). At a wheat price level of 20 DM per dt average predator effect ranged from 2.99 to 109.25 DM per ha (mean: 28.16, S.D.: 33.65). The corresponding economical value per single predator unit was in the range between 8 x 10⁻⁵ and 361 x 10-5 DM (mean: 73 x 10-5, S.D.: 115 x 10-5).
Tab. 1. Calculation of the economical benefit of cereal aphid predators in winter wheat based
on field data and computer simulations. Location Potential
yield loss Predator occurrence
Economic benefit
(dt/ha) (PU/m²) (DM/ha) (10-5DM/PU)
Flaeming 1995 0.30 10.63 6.90 6.5 Flaeming 1996 1.63 3.66 37.49 102.4 Flaeming 1998 4.75 3.03 109.25 360.6 Magdeburg 1994 0.24 5.99 5.52 9.2 Magdeburg 1995 1.74 3.55 40.02 112.7 Magdeburg 1996 0.14 5.23 3.22 6.2 Magdeburg 1997 0.13 3.53 2.99 8.5 Magdeburg 1998 1.08 10.77 24.84 23.1 Magdeburg 1999 1.01 6.40 23.23 36.3
Mean (S.D.) 28.16 73.9 (33.65) (115.1)
Discussion Despite of a large number of investigations estimating the potential benefit of natural enemies on pest population dynamics, most of these attempt were accompanied by more or less significant shortcomings. Data based on laboratory experiments or even on experiments using field cages and exclusion barriers were often criticised because of artificial conditions. On the
63
other hand calculations on the efficiency of certain predators based on detailed field counts are not applicable without any assumptions. However, assumptions and simplifications are also necessary when using computer simulation models. The model GTLAUS, used in this study, dates back 15 years now, and has been several times revised, improved and validated with new field data. Though during its last validation with long term field data from four different locations with 35 investigated fields in two cases the model failed to generate a realistic simulation. The advantage of simulation models is the possibility to take systematically into account large volumes of published data as well as field data and to simulate many different situations within a short time (Freier et al., 1996).
Exclusion of aphid predators resulted in a remarkable increase in aphid infestation. The aphid index was up to 17 times higher in simulations without predators. Our study indicates that without antagonists aphid infestation would cause economically important yield losses in about 2/3 of all cases. Although the economic value per single predator unit seems to be rather small, the entire predator community was responsible for a notable benefit of up to 100 DM per ha. We found remarkable differences between different locations and years with regard to aphid infestation pattern and effects of predators. Aphid population dynamics do not only depend on the influence of antagonists, but also on a number of other environmental and aphid population inherent factors (Freier et al., 1999). Additionally, the effectiveness of aphid antagonists is very variable, e.g. depending strongly on temperature (Triltsch et al., 1996), predator-prey-ratio (Rautapää, 1975) and synchronisation between predator and prey (Hemptinne et al., 1995).
Acknowledgement We would like to acknowledge the Federal Ministry for Agriculture and Forestry for partly funding the research.
References Chiverton, P.A., 1987: Effects of exclusion barriers and inclusion trenches on polyphagous
and aphid specific predators in spring barley. J. Appl Ent. 103: 193-203. Chiverton, P.A., 1988: Searching behaviour and cereal aphid consumption by Bembidion
lampros and Pterostichus cupreus, in relation to temperature and prey density. Ent. Exp. Appl. 47: 137-182.
Freier, B. & Triltsch, H., 1996: Climate chamber experiments and computer simulations on the influence of increasing temperature on wheat-aphid-predator interaction. Asp. Appl. Biol. 45: 293-298.
Freier, B., Triltsch, H. & Roßberg, D., 1996: GTLAUS – A model of wheat-cereal aphid- predator interaction and its use in complex agroecological studies. Z. Pflanzenkrankh. Pflanzenschutz 103: 543-554.
Freier, B., Triltsch, H., Möwes, M. & Rappaport, V., 1997: Der relative Wert von Prädatoren bei der natürlichen Kontrolle von Getreideblattläusen und die Verwendung von Prädator-einheiten. Nachrichtenbl. Deut. Pflanzenschutzd. 49: 215-222.
Freier, B., Möwes, M. & Triltsch, H., 1998: Beneficial threshold for Coccinella 7-punctata L. as predator of cereal aphids in winter wheat – results of population investigations and computer simulations. J. Appl. Ent. 121: 213-217.
Freier, B., Triltsch, H. & Gosselke, U., 1999: Die Dimension der natürlichen Kontrolle von Getreideblattläusen durch Prädatoren. Gesunde Pflanzen 51: 65-71.
64
Ghanim, A., 1981: Untersuchungen über den Einfluss von Parasiten und Prädatoren auf die Entstehung von Gradationen der Getreideblattläuse. PhD Thesis, Martin-Luther-Universität Halle, 136 pp.
Gosselke, U., Roßberg, D., Freier, B. & Triltsch, H., 2001: GTLAUS99 – the latest version of a model for simulation of wheat-aphid-predator interaction. Ecol. Modelling 99: in press.
Hämäläinen, M., Markkula, M. & Raij, T., 1975: Fecundity and larval voracity of four ladybird species (Col., Coccinellidae). Ann. Ent. Fenn. 41: 124-127.
Hemptinne, J.-L., Doumbia, M. & Gaspar, C., 1995: The reproductive strategy of predators in a major constraint to the implementation of biological control in the field. Med. Fac. Landb. Toeg. Biol. Wetensch. 60: 735-741.
Meier, U., 1997: Growth stages of mono- and dicotyledonous plants. BBCH-Monograph. Berlin, Wien: Blackwell, 622 pp.
Rautapää, J., 1975: Control of Rhopalosiphum padi (L.) (Hom., Aphididae) with Coccinella septempunctata L. (Col., Coccinellidae) in cages, and effect of late aphid infestation on barley yield. Ann. Agric. Fenniae 14: 231-239.
Skirvin, D.J., Perry, J.N. & Harrington, R., 1997: A model describing the population dynamics of Sitobion avenae and Coccinella septempunctata. Ecol. Modelling 96: 29-39.
Sundby, R.A., 1966: A comparative study of the efficiency of three predatory insects, Coccinella septempunctata L. (Col., Coccinellidae), Chrysopa carnea St. (Neuropt., Chrysopidae) and Syrphus ribesii (Dipt., Syrphidae) at two different temperatures. Entomophaga 11: 395-404.
Sterling, W.L., Dean, A. & Abd el Salam, N.M., 1992: Economic benefits of spiders (Araneae) and insects (Hemiptera: Miridae) predators of cotton leafhoppers. J. Econ. Ent. 85: 52-57.
Triltsch, H., Freier, B. & Roßberg, D., 1996: Temperatur – Schlüsselfaktor für Nützlings-leistungen im Winterweizen? Mitt. Biol. Bundesanstalt 321: 447.
Triltsch, H. & Roßberg, D., 1997: Cereal aphid predation by the ladybird Coccinella septem-punctata L. (Col.: Coccinellidae) – Including its simulation in the model GTLAUS. Acta Jutlandica 72: 259-270.
Wetzel, T., Ghanim, A. & Freier, B., 1981: Zur Bedeutung von Prädatoren und Parasiten für die Überwachung und Bekämpfung von Blattläusen in Getreidebeständen. Nachrichtenbl. Pflanzenschutz DDR 35: 239-244.
Winder, L.D., Hirst, J., Carter, N., Wratten, S. D. & Sopp, P.I., 1994: Estimating predation of the grain aphid Sitobion avenae by polyphagous predators. J. Appl. Ecol. 31: 1-12.
Wratten, S.D., 1987: The effectiveness of native natural enemies. In: Integrated Pest Management, Academic Press: 89-112.
Integrated Control in Cereal Crops IOBC wprs Bulletin 24 (6) 2001
pp. 65 - 71
65
Potentials and limitations of long-term field data to identify numerical and functional responses of predators to aphid density in wheat
Freier 1, B., Triltsch 1, H. and U. Gosselke 2
1 Federal Biological Research Centre for Agriculture and Forestry, Institute of Integrated Plant Protection, D-14532 Kleinmachnow, Germany
2 Humboldt University, Institute of Horticultural Sciences, FG Phytomedicine/Applied Entomology, D-14195 Berlin, Germany
Summary Long-term field studies on population dynamics of aphids and the community of predators have been performed in wheat fields at two extremely different sites since 1993 to investigate the dimension, stability and variance of natural control. To identify density feed backs of the predators, regression analyses of the 7-year data were performed and the equation with the highest significance (P<0.05) and best correlation coefficient (r²) was chosen. The number of aphids (x) was compared with the number of predators (y) per m² at any given sampling date (di) and with the predator occurrence at the next sampling date (di+1). Weakly significant positive numerical relationships were established for the total number of predators, predator units, and guild of specialised aphid predators. While the density reactions of coccinellids were unexpectedly weak, the syrphids showed a clear response. Despite different fundamental conditions and predator community structures, only a few clear differences between the two locations have been found. Functional responses in egg production and larvae occurrence of syrphids were shown indirectly. The possibilities to identify density feedbacks in long-term studies are limited. The phenomenon of density responses is overlapped and counteracted by infestation reducing effects of predators. Also, the different level of additional parasitoid and fungal attacks in aphid populations can modify the results extremely.
Introduction The variance and stability of aphid predator community in unsprayed wheat crops are investigated within long-term field studies. The main objective of the surveys were to identify infestation reducing effects of aphid predators in combination with computer model simulations, and to demonstrate any other numerical relationships within the population dynamics of the aphid-predator interaction. The phenomenon of numerical responses as density reactions and functional responses as a change in attack rate of an individual predator on changing prey density was described by Solomon (1949). These feed backs work as a complex system and are important regulatory mechanisms in all arthropod predator-prey ecosystems (Hassell, 1978).
The aim of the present investigation was to identify numerical or even functional responses by examining 7-year field data from two sites using regression analyses.
Material and Methods From 1993 to 1999 investigations were performed in unsprayed wheat fields at two different locations, Flaeming (F), a low-input site, and Magdeburger Boerde (M), a high-input site. The investigations included eight weekly surveys where data on aphid and predator, aphid mummies and moulded aphids on plants and surrounding soil surface occurrence between
66
BBCH 49 and 87 (growth stages according to Meier 1997) were recorded. To get a sufficient sample, each survey included 2 x 5 counting on an approximately 3 m drilling row within a 2 ha patch of one side of the test field. The total area studied per sampling date was 4 m², that is 2,400 tillers. The average densities of aphids and beneficials per m² were used for statistical analyses.
The computer calculations included the analysis of the following data: – Data pairs of aphid and predator densities obtained on the same sampling date (both sites
together and separately); symbols in Table 1: FM, F and M. – Data pairs of aphid density observed at a given sampling date and predator density one
week later (di+1) as an indicator of delayed responses (both sites together and separately); symbols in Table 1: FM (di+1), F (di+1) and M (di+1).
– Data pairs for seasonal average densities of aphids and predators to estimate fundamental responses (both sites together and separately); symbols in Table 1: FM (season), F (season) and M (season). Furthermore, numerical interactions between fractions within the predator community
were also investigated. Special analyses of functional responses were made, especially the influence of the aphid infestation level on the larvae-egg abundance ratio for coccinellids, syrphids and chrysopids at a given date. The occurrence of individuals in the overall predator community were considered by calculating predator units (PU) derived from surplus feeding rates of each predator fraction at 20°C (Freier et al., 1998).
Results and discussion Table 1 documents all results of the statistical analyses, starting with the reaction of the whole predator community and including aphid specific predators and all important fractions of predators up to the chrysopid larvae.
The results indicate varying close relationships between population densities of cereal aphids and predators, although the significance of tendencies was rather weak. However, prior to any evaluation some methodological problems need to be considered. Firstly, counts do not represent the real densities of the predators. For instance the abundance of polyphagous arthropods is nearly always underestimated (Möwes et al,. 1997). Moreover, other antagonists, such as parasitoids and entomopathogenic fungi, and other factors, such as the weather and wheat plant acting as the aphid host, cause variable multiple effects and thus cause additional problems. When aphid and predator occurrence under field conditions exceeds a specific level, the infestation-reducing effects of the predators overlap and counteract with their numerical and functional responses. However, the present 7-year investigation on the occurrence of aphids and predators, defined as the number of individuals per m², document a general lack of high-density data for both, aphids and predators. Predator community, aphid specific predators The working hypothesis was that rising aphid numbers lead to an increasing predator potential. This could be confirmed in our analyses. The responses of the overall predator community and aphid-specific predator potential to increasing levels of aphid infestation were significant, though rather weak. They also did not become stronger when delayed reactions were taken into consideration. The clearer tendencies were always observed at the high-input site in Magdeburg (M). The season averages did not exhibit any corresponding tendencies, that is, aphid years did not necessarily correspond to predator years or vice versa. By using predator units to summarise different predator fractions according to their aphid consumption, the significance of relationships was higher than a simple addition of individual numbers.
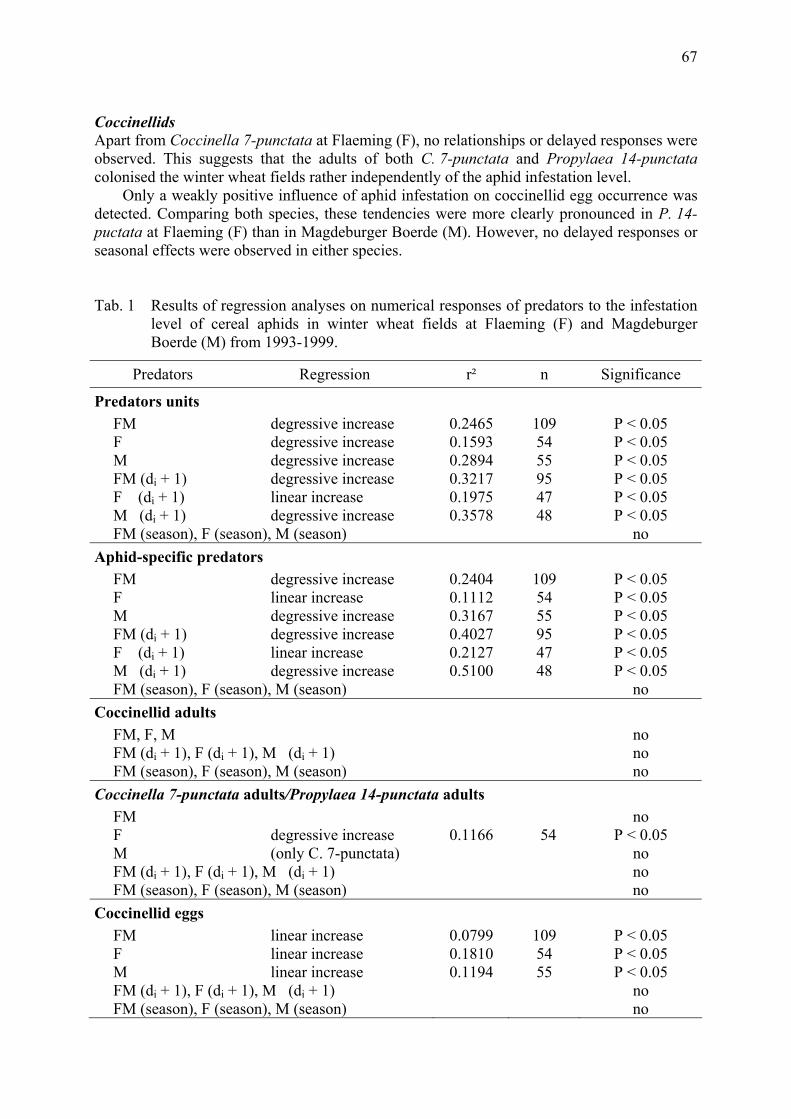
67
Coccinellids Apart from Coccinella 7-punctata at Flaeming (F), no relationships or delayed responses were observed. This suggests that the adults of both C. 7-punctata and Propylaea 14-punctata colonised the winter wheat fields rather independently of the aphid infestation level.
Only a weakly positive influence of aphid infestation on coccinellid egg occurrence was detected. Comparing both species, these tendencies were more clearly pronounced in P. 14-puctata at Flaeming (F) than in Magdeburger Boerde (M). However, no delayed responses or seasonal effects were observed in either species.
Tab. 1 Results of regression analyses on numerical responses of predators to the infestation level of cereal aphids in winter wheat fields at Flaeming (F) and Magdeburger Boerde (M) from 1993-1999.
Predators Regression r² n Significance
Predators units FM degressive increase 0.2465 109 P < 0.05 F degressive increase 0.1593 54 P < 0.05 M degressive increase 0.2894 55 P < 0.05 FM (di + 1) degressive increase 0.3217 95 P < 0.05 F (di + 1) linear increase 0.1975 47 P < 0.05 M (di + 1) degressive increase 0.3578 48 P < 0.05 FM (season), F (season), M (season) no
Aphid-specific predators FM degressive increase 0.2404 109 P < 0.05 F linear increase 0.1112 54 P < 0.05 M degressive increase 0.3167 55 P < 0.05 FM (di + 1) degressive increase 0.4027 95 P < 0.05 F (di + 1) linear increase 0.2127 47 P < 0.05 M (di + 1) degressive increase 0.5100 48 P < 0.05 FM (season), F (season), M (season) no
Coccinellid adults FM, F, M no FM (di + 1), F (di + 1), M (di + 1) no FM (season), F (season), M (season) no
Coccinella 7-punctata adults/Propylaea 14-punctata adults FM no F degressive increase 0.1166 54 P < 0.05 M (only C. 7-punctata) no FM (di + 1), F (di + 1), M (di + 1) no FM (season), F (season), M (season) no
Coccinellid eggs FM linear increase 0.0799 109 P < 0.05 F linear increase 0.1810 54 P < 0.05 M linear increase 0.1194 55 P < 0.05 FM (di + 1), F (di + 1), M (di + 1) no FM (season), F (season), M (season) no
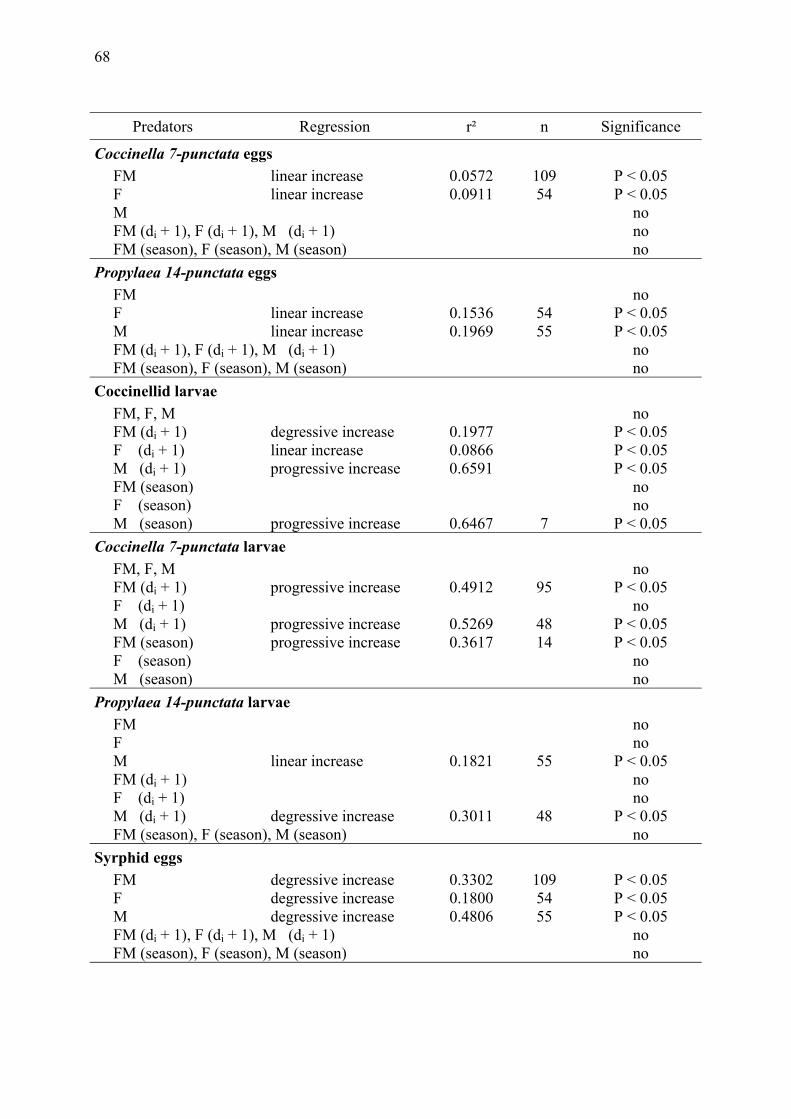
68
Predators Regression r² n Significance
Coccinella 7-punctata eggs FM linear increase 0.0572 109 P < 0.05 F linear increase 0.0911 54 P < 0.05 M no FM (di + 1), F (di + 1), M (di + 1) no FM (season), F (season), M (season) no
Propylaea 14-punctata eggs FM no F linear increase 0.1536 54 P < 0.05 M linear increase 0.1969 55 P < 0.05 FM (di + 1), F (di + 1), M (di + 1) no FM (season), F (season), M (season) no
Coccinellid larvae FM, F, M no FM (di + 1) degressive increase 0.1977 P < 0.05 F (di + 1) linear increase 0.0866 P < 0.05 M (di + 1) progressive increase 0.6591 P < 0.05 FM (season) no F (season) no M (season) progressive increase 0.6467 7 P < 0.05
Coccinella 7-punctata larvae FM, F, M no FM (di + 1) progressive increase 0.4912 95 P < 0.05 F (di + 1) no M (di + 1) progressive increase 0.5269 48 P < 0.05 FM (season) progressive increase 0.3617 14 P < 0.05 F (season) no M (season) no
Propylaea 14-punctata larvae FM no F no M linear increase 0.1821 55 P < 0.05 FM (di + 1) no F (di + 1) no M (di + 1) degressive increase 0.3011 48 P < 0.05 FM (season), F (season), M (season) no
Syrphid eggs FM degressive increase 0.3302 109 P < 0.05 F degressive increase 0.1800 54 P < 0.05 M degressive increase 0.4806 55 P < 0.05 FM (di + 1), F (di + 1), M (di + 1) no FM (season), F (season), M (season) no
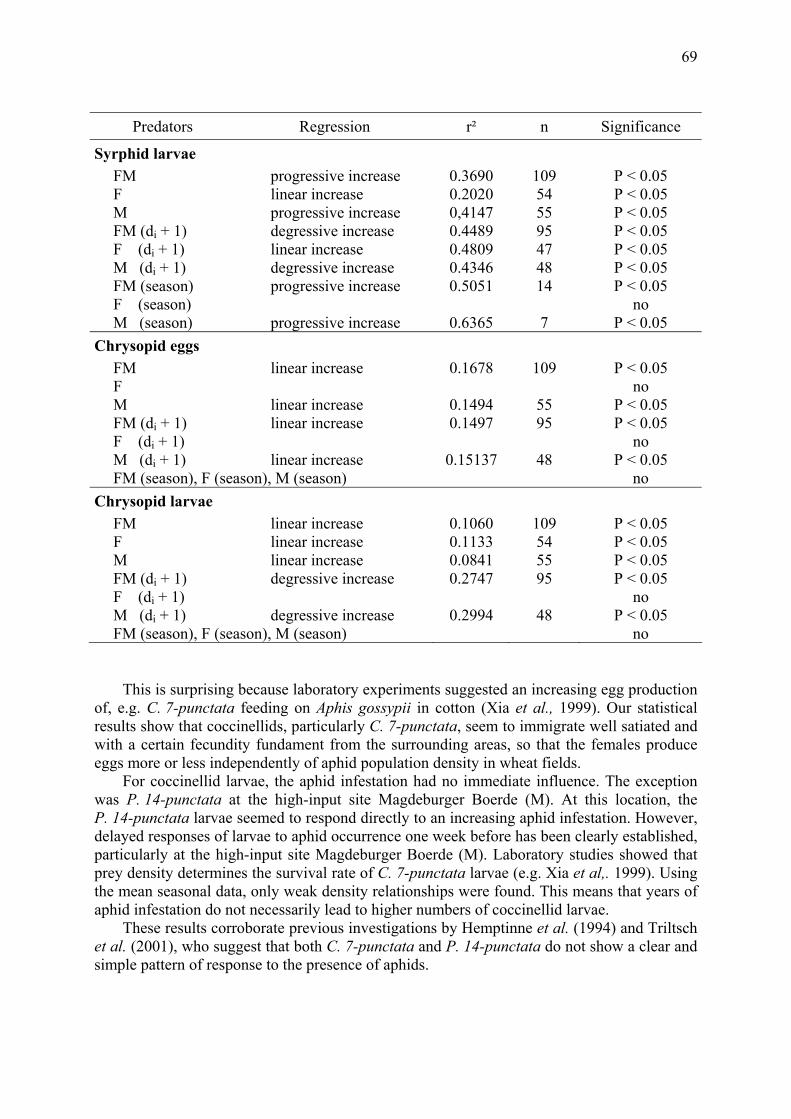
69
Predators Regression r² n Significance
Syrphid larvae FM progressive increase 0.3690 109 P < 0.05 F linear increase 0.2020 54 P < 0.05 M progressive increase 0,4147 55 P < 0.05 FM (di + 1) degressive increase 0.4489 95 P < 0.05 F (di + 1) linear increase 0.4809 47 P < 0.05 M (di + 1) degressive increase 0.4346 48 P < 0.05 FM (season) progressive increase 0.5051 14 P < 0.05 F (season) no M (season) progressive increase 0.6365 7 P < 0.05
Chrysopid eggs FM linear increase 0.1678 109 P < 0.05 F no M linear increase 0.1494 55 P < 0.05 FM (di + 1) linear increase 0.1497 95 P < 0.05 F (di + 1) no M (di + 1) linear increase 0.15137 48 P < 0.05 FM (season), F (season), M (season) no
Chrysopid larvae FM linear increase 0.1060 109 P < 0.05 F linear increase 0.1133 54 P < 0.05 M linear increase 0.0841 55 P < 0.05 FM (di + 1) degressive increase 0.2747 95 P < 0.05 F (di + 1) no M (di + 1) degressive increase 0.2994 48 P < 0.05 FM (season), F (season), M (season) no
This is surprising because laboratory experiments suggested an increasing egg production
of, e.g. C. 7-punctata feeding on Aphis gossypii in cotton (Xia et al., 1999). Our statistical results show that coccinellids, particularly C. 7-punctata, seem to immigrate well satiated and with a certain fecundity fundament from the surrounding areas, so that the females produce eggs more or less independently of aphid population density in wheat fields.
For coccinellid larvae, the aphid infestation had no immediate influence. The exception was P. 14-punctata at the high-input site Magdeburger Boerde (M). At this location, the P. 14-punctata larvae seemed to respond directly to an increasing aphid infestation. However, delayed responses of larvae to aphid occurrence one week before has been clearly established, particularly at the high-input site Magdeburger Boerde (M). Laboratory studies showed that prey density determines the survival rate of C. 7-punctata larvae (e.g. Xia et al,. 1999). Using the mean seasonal data, only weak density relationships were found. This means that years of aphid infestation do not necessarily lead to higher numbers of coccinellid larvae.
These results corroborate previous investigations by Hemptinne et al. (1994) and Triltsch et al. (2001), who suggest that both C. 7-punctata and P. 14-punctata do not show a clear and simple pattern of response to the presence of aphids.
70
Syrphids The results in table 1 show a clear positive influence of aphid infestation on syrphid egg occurrence at both locations, particularly at the high-input site Magdeburger Boerde (M). The response in egg production was immediate, and delayed density responses of egg abundance were not observed. Surprisingly the data analyses did not reveal a relationship between aphids and syrphid eggs upon seasonal analysis. The mechanisms of synchronisation of aphid occurrence and syrphid egg laying has been investigated in different studies in winter wheat crops (Poehling & Borgemeister, 1989; Krause, 1997) and in bean fields (Hemptinne et al., 1994).
Also, a clear density feedback on aphid infestation was observed in syrphid larvae at both locations. In contrast to the eggs, clear delayed effects and seasonal reactions were established in the case of syrphid larvae.
Chrysopids The aphid infestation seemed to cause a certain immediate and delayed positive influence on chrysopid egg and larvae occurrence, particularly at the high-input site Magdeburger Boerde (M). However, when evaluated according to seasonal averages, no clear tendency was observed.
The evidence of additional relationships between the occurrence of the specialised aphid predator coccinellids and syrphid larvae was an interesting finding. Despite intra-guild competition, both predator groups seem to profit by increasing aphid infestation at the same level.
The ability to identify density feedbacks in long-term studies is quite limited. We know that counteractive infestation-reducing effects of the predators clearly overlap the phenomenon of density responses. Also, the different level of additional parasitoid and fungal attacks in aphid populations can modify the results extremely.
In contrast to numerical responses, the functional responses (change in attack rate of an individual) could not be identified directly from the field counts, but indirectly by the assumption that increasing feeding rates lead to rising egg production (coccinellids) and increasing survival rates of larvae (coccinellids, syrphids, chrysopids). Such relationships were identified only in coccinellid larvae and syrphid eggs and larvae.
The effect of aphid infestation level on the larvae-egg abundance ratio for coccinellids, syrphids and chrysopids has not yet been established, although it must be assumed that a high ratio reflects a good survival and is therefore an indicator of increasing food uptake.
Acknowledgements We are grateful to Mrs. B. Schlage for the joint performance of all field investigations, computer documentation, and statistical analysis of field data. Furthermore, we thank the farmers J. Grabo (Pflügkuff, site Flaeming) and U. Hartmann (Ochtmersleben, site Magdeburger Boerde) who made their unsprayed wheat fields available for field counts throughout all the years of the study. Our special thanks to Mrs. S. Wandrey, who had the kindness to edit the English manuscript with enduring patience.
References Freier, B.; Möwes, M., Triltsch, H. & Rapperport, V., 1998: Predator units - an approach to
evaluate coccinellids within the aphid predator community in winter wheat, IOBC/WPRS Bull. 21 (8): 103-111.
71
Hassell, M.P., 1978: The dynamics of arthropod predator prey systems. Monographs in Population Biology 13, Princeton Univ. Press.
Hemptinne, J.-L., Doucet, J.-L. & Gaspar, C., 1994: How do ladybirds and syrphids respond to aphids in the field? IOBC/WPRS Bull: 17(4): 101-111.
Krause, U., 1997: Populationsdynamik und Überwinterung von Schwebfliegen (Diptera, Syrphidae) in zwei unterschiedlich strukturierten Agrarlandschaften Norddeutschlands. Agrarökologie 22: 1-150.
Möwes, M., Freier, B., Kreuter, Th. & Triltsch, H., 1997: Halmzählung oder Parzellentotalernte - wie genau sind Prädatorbonituren im Winterweizen? Anz. Schädlingskunde Pflanzenschutz Umweltschutz 70: 121-126
Poehling, H.M. & Borgemeister, C., 1989: Abundance of coccinellids and syrphids in relation to cereal aphid density in winter wheat fields in northern Germany. IOBC/wprs Bull. 12(1): 99-107.
Solomon, M.E., 1949: The natural control of animal populations. J. Animal Ecology 18, 1-35. Triltsch, H., Hechenthaler, G., Gosselke, U. & Freier, B., 2001: How does a ladybird respond
to aphids? IOBC/wprs Bull. 24(6): 49-58. Xia, J.Y, van der Werf, W. & Rabbinge, R., 1999: Temperature and prey density on
bionomics of Coccinella septempunctata (Coleoptera: Coccinellidae) feeding on Aphis gossypii (Homoptera: Aphididae) on cotton. Environ. Ent. 28: 307-314.

72
Integrated Control in Cereal Crops IOBC wprs Bulletin 24 (6) 2001
pp. 73 - 78
73
Density of epigeal predators on maize plants untreated and treated with imidacloprid
Xavier Pons and Ramon Albajes Universitat de Lleida, Centre UdL-IRTA, Rovira Roure 177, 25198 Lleida, Spain
Summary In 1997 and 1998, densities of aphids and predators on maize plants were monitored weekly in commercial plots treated or not treated with imidacloprid from plant emergence to flowering. The insecticide significantly reduced the aphid density during the whole sampling period. Orius spp., Nabis provencallis, Coccinella septempunctata, Adonia variegata, Demetrias atricapillus, Tachyporus spp., earwigs and spiders were the main predators found. Densities of Syrphidae and Chrysopidae were very low. Numbers of individuals per plant of Orius spp. were significantly higher in untreated plots than in plots treated with imidacloprid in both years, whereas density of arachnida and D. atricapillus were lower in treated plots only in 1998.
Key words: aphids, polyphagous predators, maize, imidacloprid
Introduction Maize is the main summer cereal grown in Catalonia, and it covers nearly 45,000 ha, more than 50% of which is in the Lleida Basin. Pests attacking maize crops in the region can be divided into: soil pests (wireworms and cutworms), corn borers (Mediterranean Sesamia and European corn borers), sap sucking insects (aphids and leafhoppers), leaf and grain feeders and mites (Piqué et al., 1998).
Aphids have a high damaging potential in Catalonia, especially in the first half of the crop season when they cause direct damage and transmit viruses. The most frequent and abundant species are Rhopalosiphum padi (L.), Sitobion avenae (Fabricius) and Metopolophium dirhodum (Walker) (Pons et al., 1994).
Methylcarbamates, applied at sowing, have been one of the most common type of insecticides used to prevent aphid damages. However, they are being replaced by imidacloprid applied as a seed treatment.
In 1997 we began a three-year research program to study the effects of imidacloprid on aphid populations and on natural enemies present in maize ecosystems. Here we present the results of 1997 and 1998 on aphid populations and epigeal predators.
Materials and methods The study was carried out on a commercial farm located 35 km to the west of Lleida. A complete randomised block design with four replications was used. Each block consisted of two plots, one treated with imidacloprid and the other untreated. Seeds were treated with imidacloprid (Gaucho 35 FS ®, Bayer) at 490 g a.i. per 100 kg seed.
Plot size varied from 0.25 to 1 ha. Maize was cultivated under conventional tillage and was sown on 9 and 13 May in 1997 1998, respectively. Two days after sowing, plots were sprayed with a mixture of 35 % alachlor + 25 % atrazine (Primdal ®, Agrodan) at 6 l/ha.
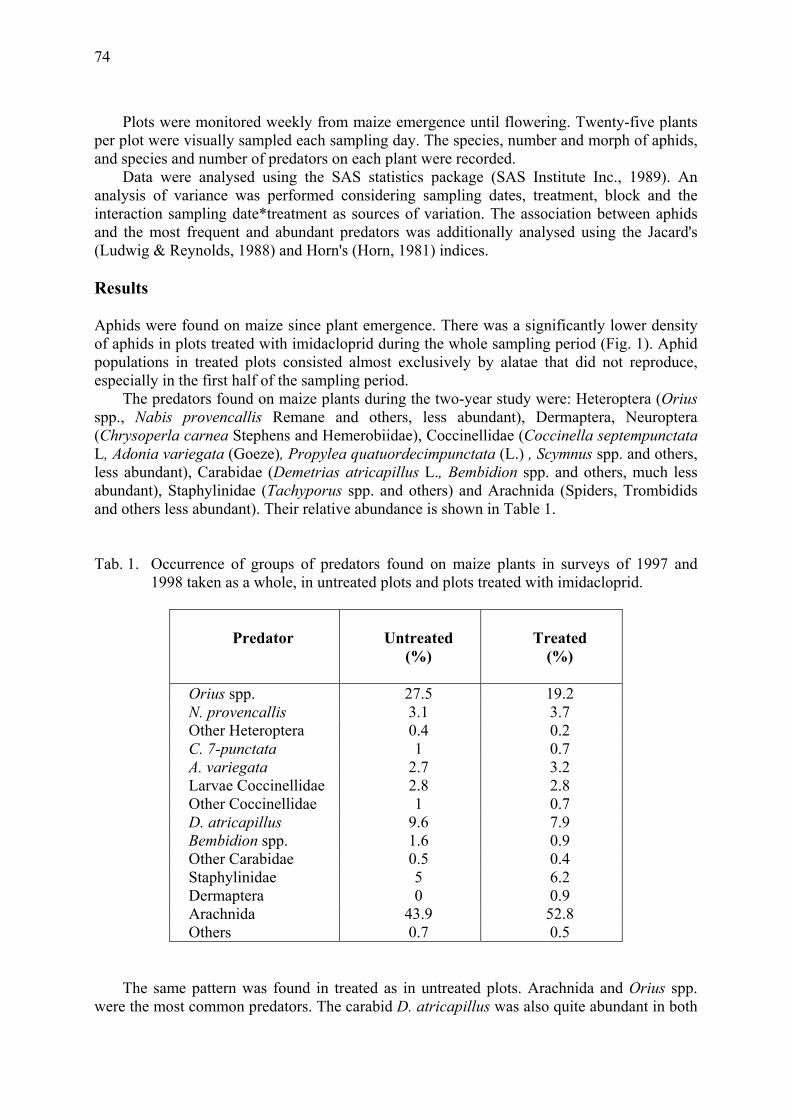
74
Plots were monitored weekly from maize emergence until flowering. Twenty-five plants per plot were visually sampled each sampling day. The species, number and morph of aphids, and species and number of predators on each plant were recorded.
Data were analysed using the SAS statistics package (SAS Institute Inc., 1989). An analysis of variance was performed considering sampling dates, treatment, block and the interaction sampling date*treatment as sources of variation. The association between aphids and the most frequent and abundant predators was additionally analysed using the Jacard's (Ludwig & Reynolds, 1988) and Horn's (Horn, 1981) indices.
Results Aphids were found on maize since plant emergence. There was a significantly lower density of aphids in plots treated with imidacloprid during the whole sampling period (Fig. 1). Aphid populations in treated plots consisted almost exclusively by alatae that did not reproduce, especially in the first half of the sampling period.
The predators found on maize plants during the two-year study were: Heteroptera (Orius spp., Nabis provencallis Remane and others, less abundant), Dermaptera, Neuroptera (Chrysoperla carnea Stephens and Hemerobiidae), Coccinellidae (Coccinella septempunctata L, Adonia variegata (Goeze), Propylea quatuordecimpunctata (L.) , Scymnus spp. and others, less abundant), Carabidae (Demetrias atricapillus L., Bembidion spp. and others, much less abundant), Staphylinidae (Tachyporus spp. and others) and Arachnida (Spiders, Trombidids and others less abundant). Their relative abundance is shown in Table 1.
Tab. 1. Occurrence of groups of predators found on maize plants in surveys of 1997 and 1998 taken as a whole, in untreated plots and plots treated with imidacloprid.
Predator
Untreated (%)
Treated
(%)
Orius spp. 27.5 19.2 N. provencallis 3.1 3.7 Other Heteroptera 0.4 0.2 C. 7-punctata 1 0.7 A. variegata 2.7 3.2 Larvae Coccinellidae 2.8 2.8 Other Coccinellidae 1 0.7 D. atricapillus 9.6 7.9 Bembidion spp. 1.6 0.9 Other Carabidae 0.5 0.4 Staphylinidae 5 6.2 Dermaptera 0 0.9 Arachnida 43.9 52.8 Others 0.7 0.5
The same pattern was found in treated as in untreated plots. Arachnida and Orius spp.
were the most common predators. The carabid D. atricapillus was also quite abundant in both
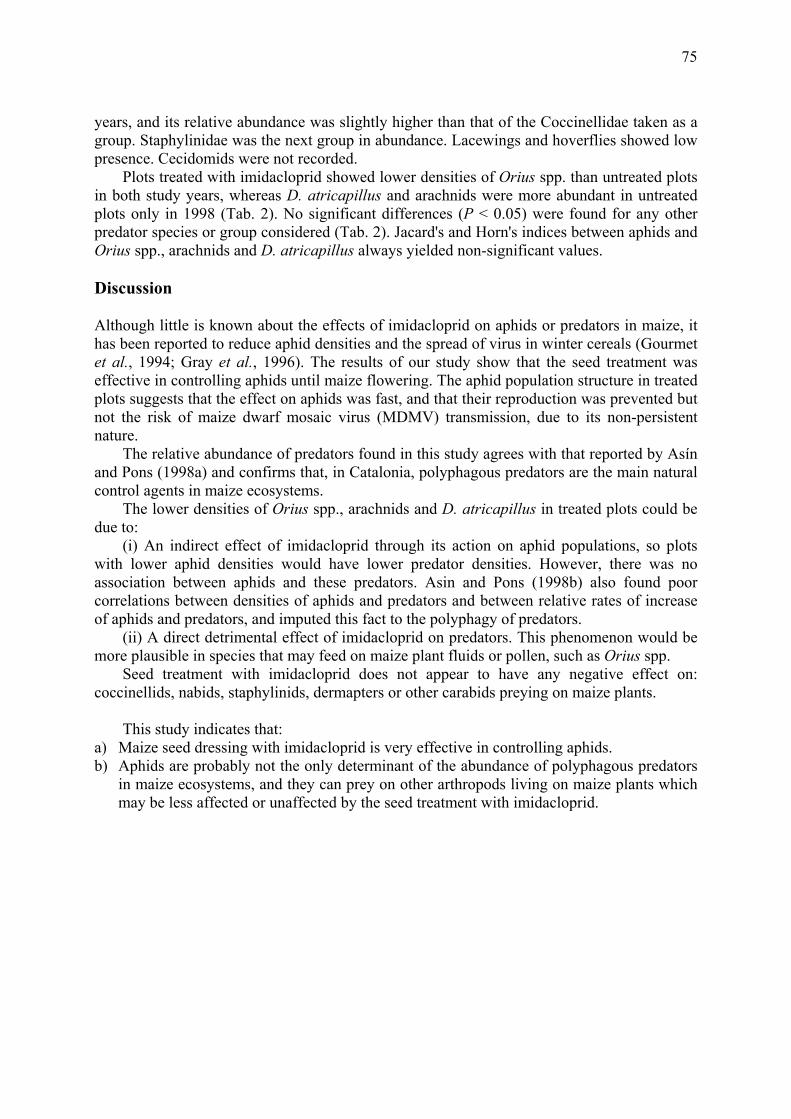
75
years, and its relative abundance was slightly higher than that of the Coccinellidae taken as a group. Staphylinidae was the next group in abundance. Lacewings and hoverflies showed low presence. Cecidomids were not recorded.
Plots treated with imidacloprid showed lower densities of Orius spp. than untreated plots in both study years, whereas D. atricapillus and arachnids were more abundant in untreated plots only in 1998 (Tab. 2). No significant differences (P < 0.05) were found for any other predator species or group considered (Tab. 2). Jacard's and Horn's indices between aphids and Orius spp., arachnids and D. atricapillus always yielded non-significant values.
Discussion Although little is known about the effects of imidacloprid on aphids or predators in maize, it has been reported to reduce aphid densities and the spread of virus in winter cereals (Gourmet et al., 1994; Gray et al., 1996). The results of our study show that the seed treatment was effective in controlling aphids until maize flowering. The aphid population structure in treated plots suggests that the effect on aphids was fast, and that their reproduction was prevented but not the risk of maize dwarf mosaic virus (MDMV) transmission, due to its non-persistent nature.
The relative abundance of predators found in this study agrees with that reported by Asín and Pons (1998a) and confirms that, in Catalonia, polyphagous predators are the main natural control agents in maize ecosystems.
The lower densities of Orius spp., arachnids and D. atricapillus in treated plots could be due to:
(i) An indirect effect of imidacloprid through its action on aphid populations, so plots with lower aphid densities would have lower predator densities. However, there was no association between aphids and these predators. Asin and Pons (1998b) also found poor correlations between densities of aphids and predators and between relative rates of increase of aphids and predators, and imputed this fact to the polyphagy of predators.
(ii) A direct detrimental effect of imidacloprid on predators. This phenomenon would be more plausible in species that may feed on maize plant fluids or pollen, such as Orius spp.
Seed treatment with imidacloprid does not appear to have any negative effect on: coccinellids, nabids, staphylinids, dermapters or other carabids preying on maize plants.
This study indicates that:
a) Maize seed dressing with imidacloprid is very effective in controlling aphids. b) Aphids are probably not the only determinant of the abundance of polyphagous predators
in maize ecosystems, and they can prey on other arthropods living on maize plants which may be less affected or unaffected by the seed treatment with imidacloprid.
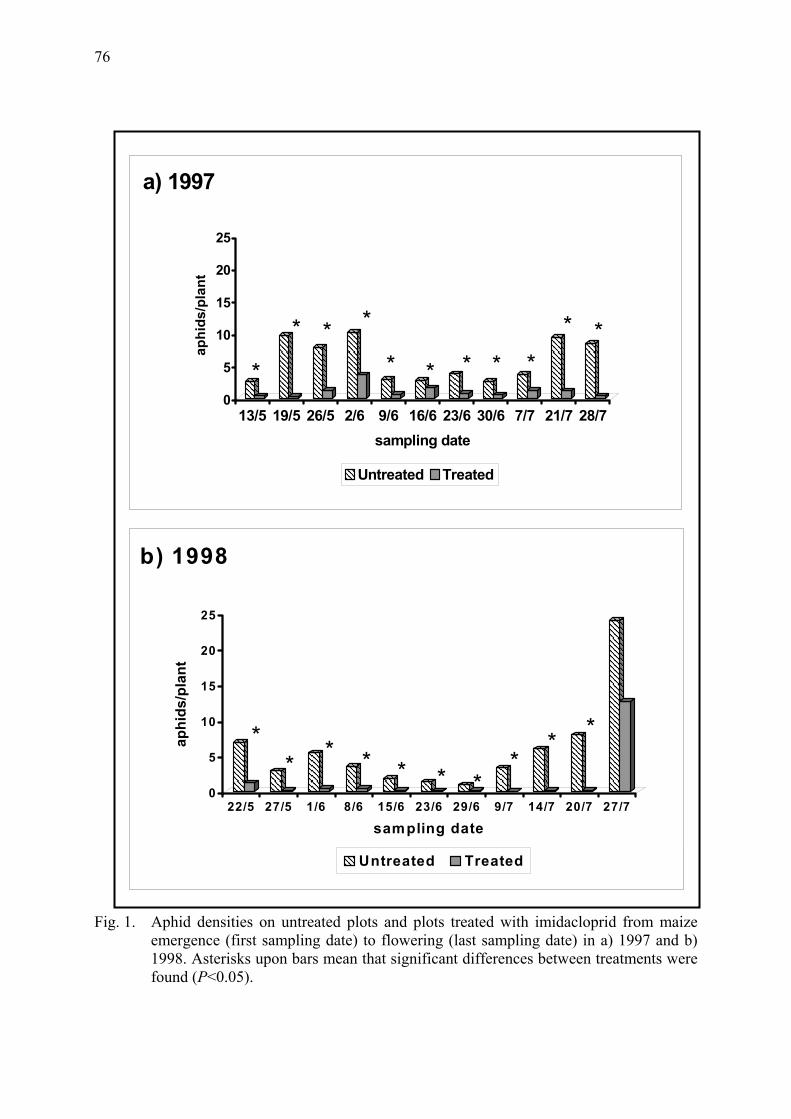
76
Fig. 1. Aphid densities on untreated plots and plots treated with imidacloprid from maize
emergence (first sampling date) to flowering (last sampling date) in a) 1997 and b) 1998. Asterisks upon bars mean that significant differences between treatments were found (P<0.05).
0
5
10
15
20
25
aphi
ds/p
lant
13/5 19/5 26/5 2/6 9/6 16/6 23/6 30/6 7/7 21/7 28/7sampling date
a) 1997
Untreated Treated
*
* * *
* * * * ** *
0
5
10
15
20
25
aphi
ds/p
lant
22/5 27/5 1/6 8/6 15/6 23/6 29/6 9/7 14/7 20/7 27/7
sampling date
b) 1998
Untreated Treated
** * * * * *
** *
77
Ta
b. 2
. M
ean
seas
onal
den
sitie
s of
diff
eren
t gro
ups
of p
reda
tors
in m
aize
plo
ts u
ntre
ated
and
trea
ted
with
imid
aclo
prid
. (N
S: n
on s
igni
fican
t di
ffer
ence
s bet
wee
n pl
ots;
**:
P<0
.05)
.
19
97
1998
Indi
vidu
als /
pla
nt
In
divi
dual
s / p
lant
Pred
ator
U
ntre
ated
T
reat
ed
F P
U
ntre
ated
Tre
ated
F P
Ori
us sp
p.
0.
28
0.13
43
.2
**
0.47
0.
24
54.6
**
N. p
rove
ncal
lis
0.
04
0.03
0.
11
NS
0.05
0.
03
3.4
NS
C. 7
-pun
ctat
a
0.02
0.
01
1,93
N
S 0.
01
0.00
3 2.
4 N
S
A. v
arie
gata
0.03
0.
01
3.89
N
S 0.
05
0.05
0.
0 N
S
D. a
tric
apill
us
0.
03
0.03
0.
0 N
S 0.
23
0.12
20
.8
**
Bem
bidi
on sp
p.
0.
03
0.02
3.
96
NS
0.02
0.
01
3.98
N
S
Stap
hylin
idae
0.04
0.
03
0.54
N
S 0.
10
0.09
0.
74
NS
Der
map
tera
0.00
6 0.
01
1.66
N
S 0.
003
0.00
7 2.
28
NS
Ara
chni
da
0.
40
0.37
0.
54
NS
0.86
0.
68
7.98
**
77
78
Acknowledgements This research was funded by the Spanish Inter-Ministry of Science and Technology Committee (Comisión Interministerial de Ciencia y Tecnología - CICYT), project AGF96-0482.
References Asín, L. & Pons, X. 1998 a: Aphid predators in maize fields. IOBC/WPRS Bull. 21 (8): 163-
170. Asín, L. & Pons, X. 1998 b: Role of predators on maize aphid populations. In Aphids in
natural and managed ecosystems (Nieto Nafría, J.M. & Dixon, A.F.G. (eds.). Universidad de León (Secretariado de Publicaciones). León (Spain). pp: 505-511.
Gourmet, C., Hewings, A.D., Kolb, F.L. & Smyth, C.A. 1994: Effect of imidacloprid on nonflight movement of Rhopalosiphum padi and the subsequent spread of barley yellow dwarf virus. Plant. Dis. 78: 1098-1101.
Gray, S.M., Bergstrom, G.C., Vaughan, R., Smith, D.M. & Kalb, D.W. 1996: Insecticidal control of cereal aphids and its impact on the epidemiology of the barley yellow dwarf luteoviruses. Crop Prot. 15: 687-697.
Horn, D.J. 1981: Effect of weedy backgrounds on colonization of collards by green peach aphid, Myzus persicae, and its major predators. Environ. Entomol. 10: 285-289.
Ludwig, J.A. & Reynolds, J.F. 1988: Statistical Ecology. A primer on methods and computing. John Wiley & Sons. New York. 337 pp.
Piqué, J., Eizaguirre, M. & Pons, X. 1998: Soil insecticide treatments against maize soil pests and corn borers in Catalonia under traditional crop conditions. Crop Prot. 17: 557-561.
Pons, X., Asín, L., Comas, J. & Albajes, R. 1994: Las especies de pulgones del maíz. Inv. Agr. Prod. Prot. Veg. Fuera de Serie 2: 125-129.
Integrated Control in Cereal Crops IOBC wprs Bulletin 24 (6) 2001
pp. 79 - 86
79
Arthropod natural enemies of the cereal leaf beetle (Oulema melanopus L.) in organic winter wheat fields in Vienna, Eastern Austria
Peter Meindl, Bernhard Kromp, Barbara Bartl and Eleni Ioannidou L.-Boltzmann-Institute for Biological Agriculture and Applied Ecology, Rinnboeckstr. 15, A-1110 Vienna, Austria
Summary In organic winter wheat fields in Vienna the species composition and rates of parasitism of the cereal leaf beetle (CLB) (Oulema melanopus) by egg- and larval parasitoids were investigated. Up to 95.7% of the eggs were parasitised by Anaphes flavipes (Hymenoptera, Mymaridae), averaging 67.3%. These rates were apparently not well synchronised with CLB egg density dynamics.
Diaparsis carinifer (Hymenoptera, Ichneumonidae) was the dominant larval parasitoid, with rates of parasitism averaging 28%.
In a laboratory feeding experiment we tested 28 different arthropod species from 12 families (e.g. Carabidae, Staphylinidae, Coccinellidae, Miridae, Nabidae, Araneae), sampled from the fields for their readiness to consume CLB eggs and larvae; the majority accepted CLB developmental stages as a food source.
In an outdoor cage experiment, the impact of three predatory beetle species (Poecilus cupreus, Philonthus cognatus, Coccinella septempunctata) on mortality of CLB eggs was investigated.
Key words: Oulema melanopus, cereal leaf beetle, parasitoids, predators
Introduction Cereal leaf beetles (CLB) (Oulema ssp.) are pests of small grains and may cause economically important yield losses by larval feeding on the flag leaves, mainly in Central and South-eastern Europe. In the United States, CLB threatened grain production as an introduced pest in the 1960s, spreading rapidly due to the absence of natural antagonists (Haynes & Gage, 1981).
An increase in CLB population density accompanied by an increase in damage and yield losses has recently been reported from several European countries (Heyer & Wetzel, 1990; Kaniuczak, 1994; Jossi & Bigler, 1996). For Eastern Austria, CLB is also recorded as a harmful pest (Stangelberger, 1995), although no quantifiable long-term data on importance and population increase of Oulema spp. are available. Nevertheless, based on extension services and farmers, CLB is considered the most important cereal pest in Austria, mainly in oats and winter wheat.
Since pesticides are largely banned in organic agriculture (see EC-Regulation 2092/91, Appendix II B), pest control there mainly depends on preventive measures. Unfortunately, little information on the applicability and efficacy of preventive, indirect control measures is available (Kromp et al., 1999).
From 1996 until 1998, we conducted a research project on non-chemical control measures against CLB. One of the objectives was to estimate the potential of naturally occurring antagonists of CLB in organic cereal fields. In this paper, the species composition and rates of parasitism of CLB eggs and the impact of larval parasitoids are reported, along with the results of a screening of predatory arthropods for their readiness to feed on CLB
80
developmental stages. Finally, data from an outdoor cage experiment, estimating the impact of three predatory coleopteran species on CLB egg mortality is presented. Material and methods Egg parasitoids To determine rates of parasitism of CLB eggs, eggs were sampled in two winter wheat cultivars (cv. Capo and Spartacus). The eggs were transferred directly from the leaves onto a sticky tape. The tapes were placed in Petri dishes and stored in the laboratory (23° C, 70-80% relative humidity). On each sampling date (May 16, 23, June 2, 11, 1997), 37-110 eggs were collected in each cultivar. The eggs were controlled daily under a dissecting microscope. Hatched parasitoids or larvae, stuck to the tape beside the egg in which they had developed, were recorded. The emerged egg parasitoids were removed from the tape and later determined by the mymarid specialist J. Huber, Ontario, Canada.
Larval parasitoids Species composition and rates of parasitism by larval parasitoids were determined by collecting 264 CLB 4th instar larvae in a winter wheat and in an oat field on June 9 and 12, 1997, respectively. In the laboratory, the larvae were placed in plastic dishes filled with sand. Cereal leaves were put in a test-tube accompanied with moistened filter paper and sealed with adhesive tape, in order to supply food for the larvae if they were not yet ready to pupate in the sand. After hatching of the CLB adults, the sand was sieved and the remaining cocoons were dissected in order to obtain parasitoids. Parasitoid larvae were determined according to the keys by Montgomery and Dewitt (1975) and Haeselbarth (1989).
Laboratory feeding experiment In addition, 28 different predatory arthropods were screened for their acceptance of CLB eggs and larvae as prey (for a complete list, see results section). The predatory arthropods had been previously collected from wheat fields by pitfall trapping and sweep netting, were then transferred to the laboratory and kept individually in Petri dishes. One CLB larva or three eggs were added to each Petri dish. In case eggs and larvae were consumed by the predators, fresh ones were introduced. The experiments were replicated three to six times.
Outdoor cage experiment The possible impact of three predatory beetle species (Philonthus cognatus [Staphylinidae]; Coccinella septempunctata [Coccinellidae]; P. cupreus [Carabidae]) on egg mortality in the field, gauze cages (40 cm in diameter, mesh width 1 mm) were placed over five stems of winter wheat and buried 20 cm deep into the ground around the stems. After removing all arthropods from inside the cage, a few CLB adults were introduced into the cage for egg laying. Thereafter the CLB adults were removed, the total number of eggs and their position recorded and two predators per cage inserted. The experiment was replicated 6-fold. The eggs were individually controlled by means of a portable dissecting microscope. Results and discussion Egg parasitism The most important egg parasitoid of Oulema spp. is Anaphes flavipes (Hymenoptera, Mymaridae), which is only 0.6 mm in size (Huber, 1992). The biology of A. flavipes and its significance as a natural control agent of CLB has been reported during the attempts to establish the mymarid in the United States in the 1960s (Anderson & Paschke, 1968; Maltby et al., 1971). For Austria, first data on rates of parasitism of Oulema spp. eggs by A. flavipes
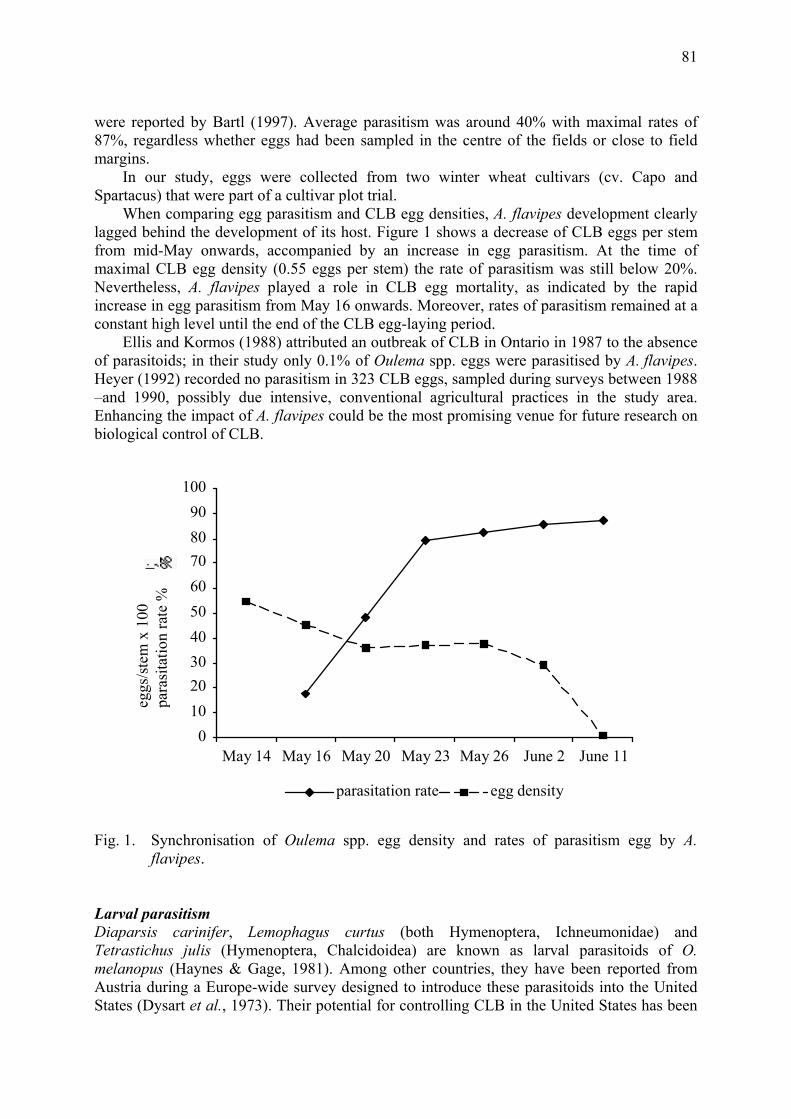
81
were reported by Bartl (1997). Average parasitism was around 40% with maximal rates of 87%, regardless whether eggs had been sampled in the centre of the fields or close to field margins.
In our study, eggs were collected from two winter wheat cultivars (cv. Capo and Spartacus) that were part of a cultivar plot trial.
When comparing egg parasitism and CLB egg densities, A. flavipes development clearly lagged behind the development of its host. Figure 1 shows a decrease of CLB eggs per stem from mid-May onwards, accompanied by an increase in egg parasitism. At the time of maximal CLB egg density (0.55 eggs per stem) the rate of parasitism was still below 20%. Nevertheless, A. flavipes played a role in CLB egg mortality, as indicated by the rapid increase in egg parasitism from May 16 onwards. Moreover, rates of parasitism remained at a constant high level until the end of the CLB egg-laying period.
Ellis and Kormos (1988) attributed an outbreak of CLB in Ontario in 1987 to the absence of parasitoids; in their study only 0.1% of Oulema spp. eggs were parasitised by A. flavipes. Heyer (1992) recorded no parasitism in 323 CLB eggs, sampled during surveys between 1988 –and 1990, possibly due intensive, conventional agricultural practices in the study area. Enhancing the impact of A. flavipes could be the most promising venue for future research on biological control of CLB.
0102030405060708090
100
May 14 May 16 May 20 May 23 May 26 June 2 June 11
parasitation rate egg density
eggs
/ste
m x
100
para
sita
tion
rate
%
Fig. 1. Synchronisation of Oulema spp. egg density and rates of parasitism egg by A. flavipes.
Larval parasitism Diaparsis carinifer, Lemophagus curtus (both Hymenoptera, Ichneumonidae) and Tetrastichus julis (Hymenoptera, Chalcidoidea) are known as larval parasitoids of O. melanopus (Haynes & Gage, 1981). Among other countries, they have been reported from Austria during a Europe-wide survey designed to introduce these parasitoids into the United States (Dysart et al., 1973). Their potential for controlling CLB in the United States has been
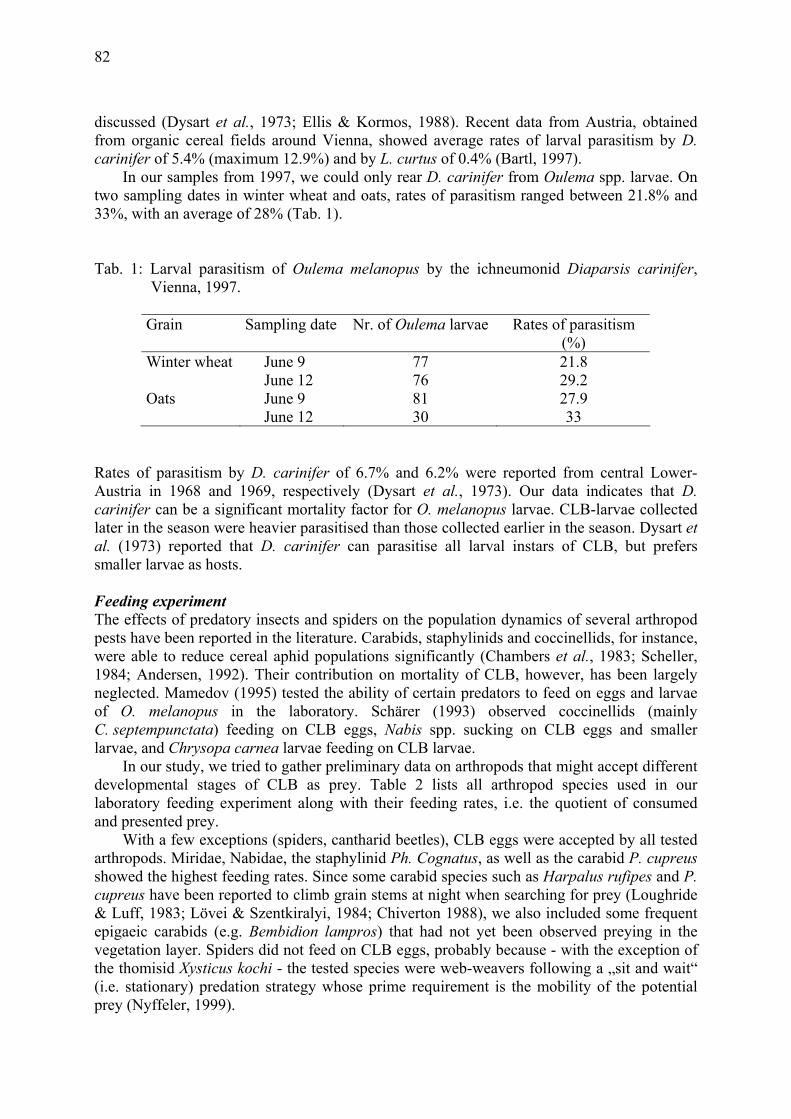
82
discussed (Dysart et al., 1973; Ellis & Kormos, 1988). Recent data from Austria, obtained from organic cereal fields around Vienna, showed average rates of larval parasitism by D. carinifer of 5.4% (maximum 12.9%) and by L. curtus of 0.4% (Bartl, 1997).
In our samples from 1997, we could only rear D. carinifer from Oulema spp. larvae. On two sampling dates in winter wheat and oats, rates of parasitism ranged between 21.8% and 33%, with an average of 28% (Tab. 1).
Tab. 1: Larval parasitism of Oulema melanopus by the ichneumonid Diaparsis carinifer, Vienna, 1997.
Grain Sampling date Nr. of Oulema larvae Rates of parasitism
(%) Winter wheat June 9 77 21.8 June 12 76 29.2 Oats June 9 81 27.9 June 12 30 33
Rates of parasitism by D. carinifer of 6.7% and 6.2% were reported from central Lower-Austria in 1968 and 1969, respectively (Dysart et al., 1973). Our data indicates that D. carinifer can be a significant mortality factor for O. melanopus larvae. CLB-larvae collected later in the season were heavier parasitised than those collected earlier in the season. Dysart et al. (1973) reported that D. carinifer can parasitise all larval instars of CLB, but prefers smaller larvae as hosts. Feeding experiment The effects of predatory insects and spiders on the population dynamics of several arthropod pests have been reported in the literature. Carabids, staphylinids and coccinellids, for instance, were able to reduce cereal aphid populations significantly (Chambers et al., 1983; Scheller, 1984; Andersen, 1992). Their contribution on mortality of CLB, however, has been largely neglected. Mamedov (1995) tested the ability of certain predators to feed on eggs and larvae of O. melanopus in the laboratory. Schärer (1993) observed coccinellids (mainly C. septempunctata) feeding on CLB eggs, Nabis spp. sucking on CLB eggs and smaller larvae, and Chrysopa carnea larvae feeding on CLB larvae.
In our study, we tried to gather preliminary data on arthropods that might accept different developmental stages of CLB as prey. Table 2 lists all arthropod species used in our laboratory feeding experiment along with their feeding rates, i.e. the quotient of consumed and presented prey.
With a few exceptions (spiders, cantharid beetles), CLB eggs were accepted by all tested arthropods. Miridae, Nabidae, the staphylinid Ph. Cognatus, as well as the carabid P. cupreus showed the highest feeding rates. Since some carabid species such as Harpalus rufipes and P. cupreus have been reported to climb grain stems at night when searching for prey (Loughride & Luff, 1983; Lövei & Szentkiralyi, 1984; Chiverton 1988), we also included some frequent epigaeic carabids (e.g. Bembidion lampros) that had not yet been observed preying in the vegetation layer. Spiders did not feed on CLB eggs, probably because - with the exception of the thomisid Xysticus kochi - the tested species were web-weavers following a „sit and wait“ (i.e. stationary) predation strategy whose prime requirement is the mobility of the potential prey (Nyffeler, 1999).
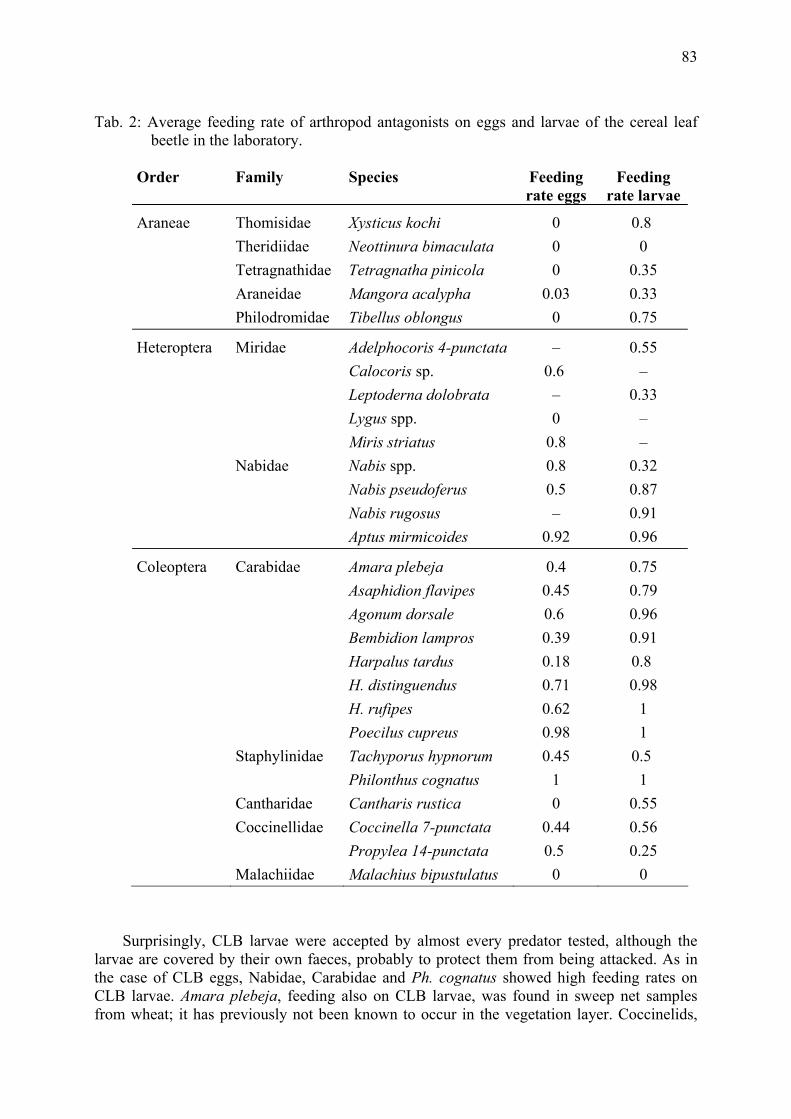
83
Tab. 2: Average feeding rate of arthropod antagonists on eggs and larvae of the cereal leaf beetle in the laboratory.
Order Family Species Feeding
rate eggs Feeding
rate larvae
Araneae Thomisidae Xysticus kochi 0 0.8 Theridiidae Neottinura bimaculata 0 0 Tetragnathidae Tetragnatha pinicola 0 0.35 Araneidae Mangora acalypha 0.03 0.33 Philodromidae Tibellus oblongus 0 0.75
Heteroptera Miridae Adelphocoris 4-punctata – 0.55 Calocoris sp. 0.6 – Leptoderna dolobrata – 0.33 Lygus spp. 0 – Miris striatus 0.8 – Nabidae Nabis spp. 0.8 0.32 Nabis pseudoferus 0.5 0.87 Nabis rugosus – 0.91 Aptus mirmicoides 0.92 0.96
Coleoptera Carabidae Amara plebeja 0.4 0.75 Asaphidion flavipes 0.45 0.79 Agonum dorsale 0.6 0.96 Bembidion lampros 0.39 0.91 Harpalus tardus 0.18 0.8 H. distinguendus 0.71 0.98 H. rufipes 0.62 1 Poecilus cupreus 0.98 1 Staphylinidae Tachyporus hypnorum 0.45 0.5 Philonthus cognatus 1 1 Cantharidae Cantharis rustica 0 0.55 Coccinellidae Coccinella 7-punctata 0.44 0.56 Propylea 14-punctata 0.5 0.25 Malachiidae Malachius bipustulatus 0 0
Surprisingly, CLB larvae were accepted by almost every predator tested, although the larvae are covered by their own faeces, probably to protect them from being attacked. As in the case of CLB eggs, Nabidae, Carabidae and Ph. cognatus showed high feeding rates on CLB larvae. Amara plebeja, feeding also on CLB larvae, was found in sweep net samples from wheat; it has previously not been known to occur in the vegetation layer. Coccinelids,
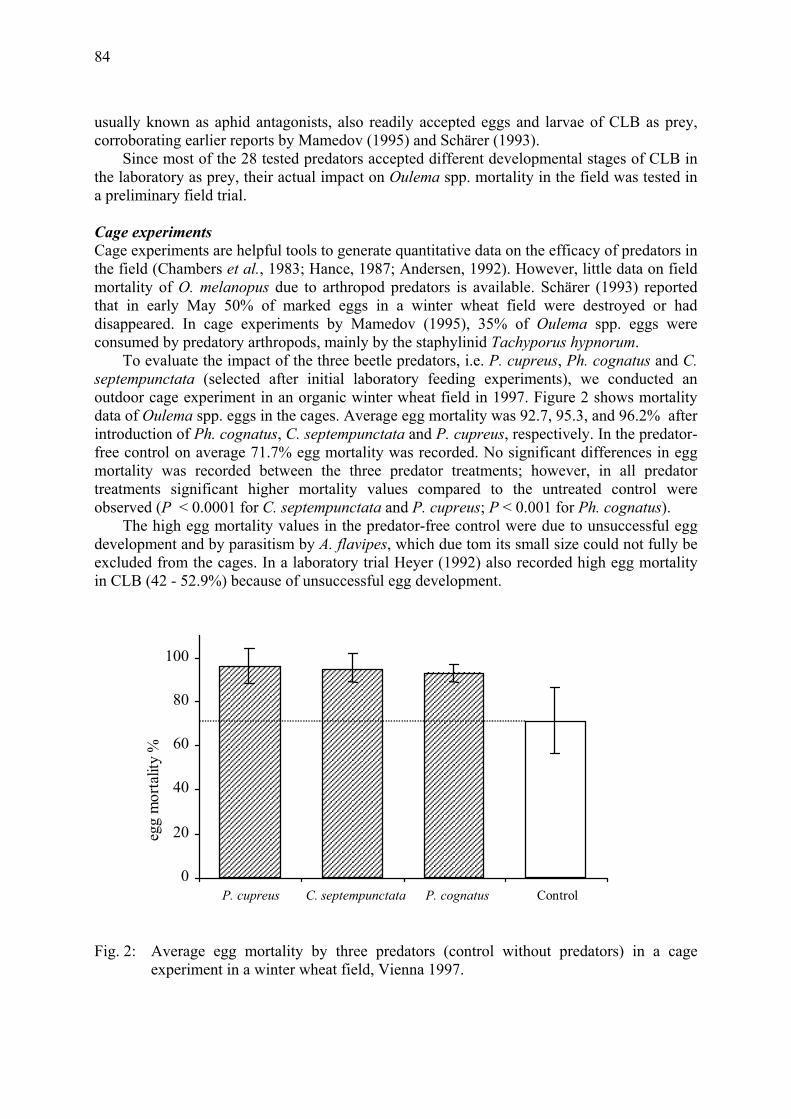
84
usually known as aphid antagonists, also readily accepted eggs and larvae of CLB as prey, corroborating earlier reports by Mamedov (1995) and Schärer (1993).
Since most of the 28 tested predators accepted different developmental stages of CLB in the laboratory as prey, their actual impact on Oulema spp. mortality in the field was tested in a preliminary field trial. Cage experiments Cage experiments are helpful tools to generate quantitative data on the efficacy of predators in the field (Chambers et al., 1983; Hance, 1987; Andersen, 1992). However, little data on field mortality of O. melanopus due to arthropod predators is available. Schärer (1993) reported that in early May 50% of marked eggs in a winter wheat field were destroyed or had disappeared. In cage experiments by Mamedov (1995), 35% of Oulema spp. eggs were consumed by predatory arthropods, mainly by the staphylinid Tachyporus hypnorum.
To evaluate the impact of the three beetle predators, i.e. P. cupreus, Ph. cognatus and C. septempunctata (selected after initial laboratory feeding experiments), we conducted an outdoor cage experiment in an organic winter wheat field in 1997. Figure 2 shows mortality data of Oulema spp. eggs in the cages. Average egg mortality was 92.7, 95.3, and 96.2% after introduction of Ph. cognatus, C. septempunctata and P. cupreus, respectively. In the predator-free control on average 71.7% egg mortality was recorded. No significant differences in egg mortality was recorded between the three predator treatments; however, in all predator treatments significant higher mortality values compared to the untreated control were observed (P < 0.0001 for C. septempunctata and P. cupreus; P < 0.001 for Ph. cognatus).
The high egg mortality values in the predator-free control were due to unsuccessful egg development and by parasitism by A. flavipes, which due tom its small size could not fully be excluded from the cages. In a laboratory trial Heyer (1992) also recorded high egg mortality in CLB (42 - 52.9%) because of unsuccessful egg development.
0
20
40
60
80
100
P. cupreus C. septempunctata P. cognatus Control
egg
mor
talit
y %
Fig. 2: Average egg mortality by three predators (control without predators) in a cage experiment in a winter wheat field, Vienna 1997.
85
Conclusions Research on non-chemical control strategies for the cereal leaf beetle in organic grain indicates some potential of both choice of cultivar and reduced seeding rates for preventing the establishment of high CLB population densities in the early phase of population build-up (Meindl & Kromp, 1999). In addition, CLB populations might be effectively controlled by arthropod antagonists provided that they occur in sufficiently high numbers in the field. Our study showed high parasitism by the egg parasitoid A. flavipes. As the egg parasitoid is an important factor of CLB, in future research the habitat requirements of the mymarid should elucidated with aiming at suitable habitat management strategies (for a review see Pickett & Bugg, 1998). The same is true for larval parasitoids of CLB. Moreover, the potential of polyphagous predatory arthropods as CLB control agents needs to be evaluated for their efficacy in controlling CLB larvae both in the vegetation and on the surface of the soil. Acknowledgements These investigations were part of a research project funded by the Austrian Ministry of Agriculture and Forestry and the Research Fund of the Austrian National Bank. We thank M. Stachowitsch for the linguistic revision.
References Andersen, A., 1992: Predation by selected carabid and staphylinid species on the aphid
Rhopalosiphum padi in laboratory and semifield experiments. Norwegian Journal of Agricultural Sciences 6: 265-273.
Anderson, R.C. & Paschke, J.D., 1968: The biology and ecology of Anaphes flavipes (Hymenoptera, Mymaridae), an exotic egg parasite of the cereal leaf beetle. Ann. Entomol. Soc. Amer. 61: 1-5.
Bartl, B., 1997: Zum Antagonistenkomplex (Parasitoide und Prädatoren) der Eier und Larven der Getreidehähnchen Oulema sp. (Coleoptera, Chrysomelidae) auf biologisch bewirt-schafteten Feldern in der Oberen Lobau, Wien. Diploma thesis, University of Vienna.
Chambers, R.J., Sunderland, K.D., Wyatt, K.D., Vickermann, G.P., 1983: The effect of predator exclusion and caging on cereal aphids in winter wheat. Journal of Applied Ecology 20: 209-224.
Chiverton, P.A., 1988: Searching behaviour and cereal aphid consumption by Bembidion lampros and Pterostichus cupreus, in relation to temperature and prey density. Ent. Exp. Appl. 47: 173-182.
Dysart, R.J., Maltby, H.L., Brunson, M.H., 1973: Larval parasites of Oulema melanopus in Europe and their colonization in the United States. Entomophaga 18: 133-167.
Ellis, C.R. & Kormos, B., 1988: Absence of parasitism in an outbreak of the cereal leaf beetle, Oulema melanopus (Coleoptera, Chrysomelidae), in the central tobacco growing area of Ontario. Proceedings of the Entomol. Soc. of Ontario 119: 43-46.
Haeselbarth, E., 1989: Über einige Schlupfwespen (Hymenoptera) als Parasiten des Weizen-hähnchens Oulema lichenis (Voet) (Coleoptera: Chrysomelidae) in Südbayern. J. Appl. Ent. 107: 493-507.
Hance, T., 1987: Predation impact of carabids at different population densities of Aphis fabae development in sugar beet. Pedobiologia 30: 251-262.
Haynes, D.L. & Gage, S.H., 1981: The cereal leaf beetle in North America. Ann. Rev. Ent. 26: 259-287.
86
Heyer, W. & Wetzel, T., 1990: Zum Auftreten des Getreidehähnchen (Oulema melanopus L. und O. lichenis Voet) und zur Aktualisierung des Bekämpfungsrichtwertes. Nachr.-Bl. Pflanzenschutzdienst DDR. 44: 226-230.
Heyer, W., 1992: Zur Parasitierung der Getreidehähnchen Oulema spp. im Gebiet von Halle. Mitt. Dtsch. Ges. allg. angew. Ent. 8: 87-89.
Huber, J.T., 1992: The subgenera, species groups and synonyms of Anaphes (Hymenoptera, Mymaridae) with a review of the described nearctic species of the fuscipennis group of Anaphes s.s. and the described species of Anaphes (Yungaburra). Proc. Ent. Soc. Ont. 123: 23-110.
Jossi, W. & Bigler, F., 1996: Getreidehähnchen: Befall und Resistenz bei Winterweizen (Schweiz). Agrarforschung (Switzerland) 3(3): 117-119.
Kaniucziak, Z., 1994: Injuriousness of Oulema in winter wheat. Ochrana-Roslin.38(7): 3-4. Kromp, B., Meindl, P. & Harris, P.J.C. (eds.), 1999: Entomological research in organic
agriculture. A B Academic Publishers, England. Loughridge, A.H. & Luff, M.L., 1983: Aphid predation by Harpalus rufipes (Degeer) (Col.,
Carab.) in the laboratory and field. J. Appl. Ecol. 20: 451-462. Lövei, G. & Szentkiralyi, F., 1984: Carabids climbing maize plants. Z. Angew. Ent. 97: 107-
110. Maltby, H.L., Stehr, F.W., Anderson, R.C., Moorehead, G.E., Barton, L.C., Paschke, J.D.,
1971: Establishment in the United States of Anaphes flavipes, an egg parasite of the cereal leaf beetle. J. Econom. Entomol. 64: 693-697.
Mamedov, A.A., 1995: On quantitative estimation of the effectiveness of natural enemies of Oulema melanopus L. (Coleoptera, Chrysomelidae) on winter wheat. Entomological Review 74 (2): 1-9.
Meindl, P. & Kromp, B., 1999: Vorbeugende Maßnahmen zur Kontrolle des Getreidehähnchens Oulema melanopus L. im ökologischen Anbau. In: Beiträge zur 5. Wissenschaftstagung zum Ökologischen Landbau „Vom Rand zur Mitte“. Hoffmann, H. & Müller, S. (eds.), Verlag Dr. Köster, Berlin: 521-524.
Montgomery, V.E. & Dewitt, P.R., 1975: Morphological differences among immature stages of three genera of exotic larval parasitoids attacking the cereal leaf beetle in United States. Ann. Entomol. Soc. Amer. 68 (3): 574-578.
Nyffeler, M., 1999: Prey selection of spiders in the field. The Journal of Arachnology 27: 317-324.
Pickett, C.h.H. & Bugg, R.L. (eds.), 1998: Enhancing Biological Control. Habitat Management to Promote Natural Enemies of Agricultural Pests. University of California Press, 422 pp.
Schärer, P., 1993: Analyse dichtebeeinflussender Faktoren beim Getreidehähnchen (Oulema sp., Coleoptera, Chrysomelidae). PhD thesis, University Bern, Switzerland.
Scheller, H.V., 1984: The role of groundbeetles (Carabidae) as predators on early populations of cereal aphids in spring barley. Z. Angew. Ent. 97: 451-463.
Stangelberger, J., 1995: Bericht über Witterungsverlauf und bemerkenswertes Schadauftreten an Kulturpflanzen in Österreich im Jahr 1994. Pflanzenschutzberichte 55(2): 108-128.
Integrated Control in Cereal Crops IOBC wprs Bulletin 24 (6) 2001
pp. 87 - 90
87
Habitat preference of carabids (Coleoptera: Carabidae) in Central Hungary in winter wheat field and in adjacent habitats
A. Hatvani 1, F. Kádár 2, J. Kiss 3 and G. Péter 3 1 Horticult. High School, 6000 Kecskemét, Erdei F. tér 1-3, Hungary 2 Plant Protect. Inst., Hung. Acad. Sci., 1525 Budapest, P.O. Box 102, Hungary 3 Dept. of Plant Protect, Szent István University Gödöllő, 2100 Gödöllő, Hungary
Summary A pitfall trap study was carried out in three habitats (winter wheat field, its margin and in nearby tree rows), in 1995, in Central Hungary. A total of 1,586 individuals of 61 carabid species were collected in the three habitats. The most frequent species was Amara tricuspidata. Amara tricuspidata, Bembidion properans, Calathus ambiguus preferred the wheat field, whereas Amara anthobia, Calathus fuscipes and Harpalus tardus preferred the tree rows, and Harpalus serripes the field margin. The field margin was favourable also for C. fuscipes and H. tardus, while Amara aenea, Harpalus distinguendus, Microlestes minutulus, Poecilus cupreus, P. punctulatus, P. sericeus favoured fields. Harpalus rufipes was found in the wheat field and in the margin but showed a preference for the margin.
Key words: carabid beetles, habitat preference, Hungary
Introduction Carabids are potentially important natural pest control agents (Kromp, 1999), thus are focal points of many research related to IPM in Hungary. Investigations on species composition, abundance, habitats and swarming phenology of carabid beetles have been a part of the IPM activities in winter wheat in Hungary (see Kiss et al., 1993). In the present study we present data of the surveys conducted on the Great Plain of Central Hungary, an area which was not investigated in our previous studies (Kiss et al., 1994, 1998). Our objectives were to collect large numbers of adult ground beetles and study their biology, and especially their habitat preferences.
Material and methods Surveys were carried out on the Great Plain in Central Hungary (near the town Nagykőrös) in a large scale winter wheat field (133 ha), in its field margins (4 m wide), and in tree rows (25 m wide), next to the field margins. The soil was a sandy one. The plant cover of the study sites could be described as follows:
Field margin Agropyron repens, Cynodon dactylon, Artemisia vulgaris, Melandrium album, Polygonum aviculare, Arctium lappa, Taraxacum officinale, Medicago sativa, Cannabis sativa, Amaranthus retroflexus, Apera spica-venti, Echinochloa crus-galli, Tragopogon sp., Amorpha fruticosa.
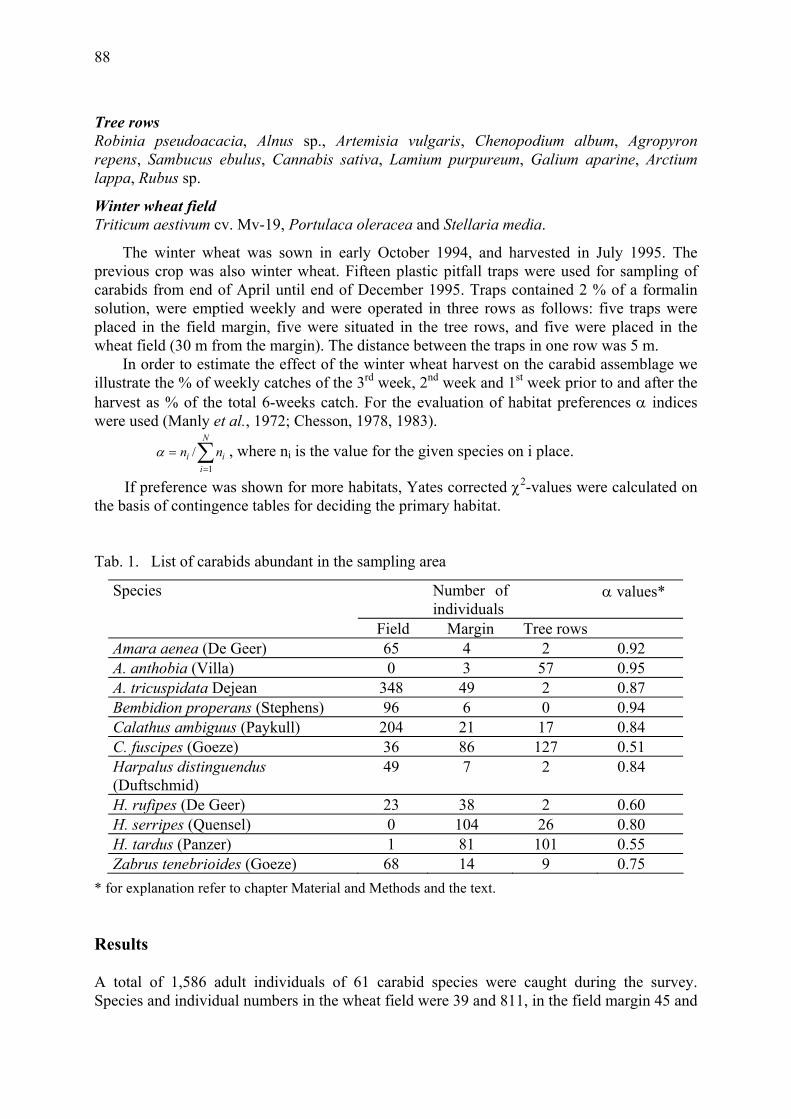
88
Tree rows Robinia pseudoacacia, Alnus sp., Artemisia vulgaris, Chenopodium album, Agropyron repens, Sambucus ebulus, Cannabis sativa, Lamium purpureum, Galium aparine, Arctium lappa, Rubus sp.
Winter wheat field Triticum aestivum cv. Mv-19, Portulaca oleracea and Stellaria media.
The winter wheat was sown in early October 1994, and harvested in July 1995. The previous crop was also winter wheat. Fifteen plastic pitfall traps were used for sampling of carabids from end of April until end of December 1995. Traps contained 2 % of a formalin solution, were emptied weekly and were operated in three rows as follows: five traps were placed in the field margin, five were situated in the tree rows, and five were placed in the wheat field (30 m from the margin). The distance between the traps in one row was 5 m.
In order to estimate the effect of the winter wheat harvest on the carabid assemblage we illustrate the % of weekly catches of the 3rd week, 2nd week and 1st week prior to and after the harvest as % of the total 6-weeks catch. For the evaluation of habitat preferences α indices were used (Manly et al., 1972; Chesson, 1978, 1983).
∑=
=N
iii nn
1
/α , where ni is the value for the given species on i place.
If preference was shown for more habitats, Yates corrected χ2-values were calculated on the basis of contingence tables for deciding the primary habitat.
Tab. 1. List of carabids abundant in the sampling area
Species Number of individuals
α values*
Field Margin Tree rows Amara aenea (De Geer) 65 4 2 0.92 A. anthobia (Villa) 0 3 57 0.95 A. tricuspidata Dejean 348 49 2 0.87 Bembidion properans (Stephens) 96 6 0 0.94 Calathus ambiguus (Paykull) 204 21 17 0.84 C. fuscipes (Goeze) 36 86 127 0.51 Harpalus distinguendus (Duftschmid)
49 7 2 0.84
H. rufipes (De Geer) 23 38 2 0.60 H. serripes (Quensel) 0 104 26 0.80 H. tardus (Panzer) 1 81 101 0.55 Zabrus tenebrioides (Goeze) 68 14 9 0.75
* for explanation refer to chapter Material and Methods and the text.
Results A total of 1,586 adult individuals of 61 carabid species were caught during the survey. Species and individual numbers in the wheat field were 39 and 811, in the field margin 45 and
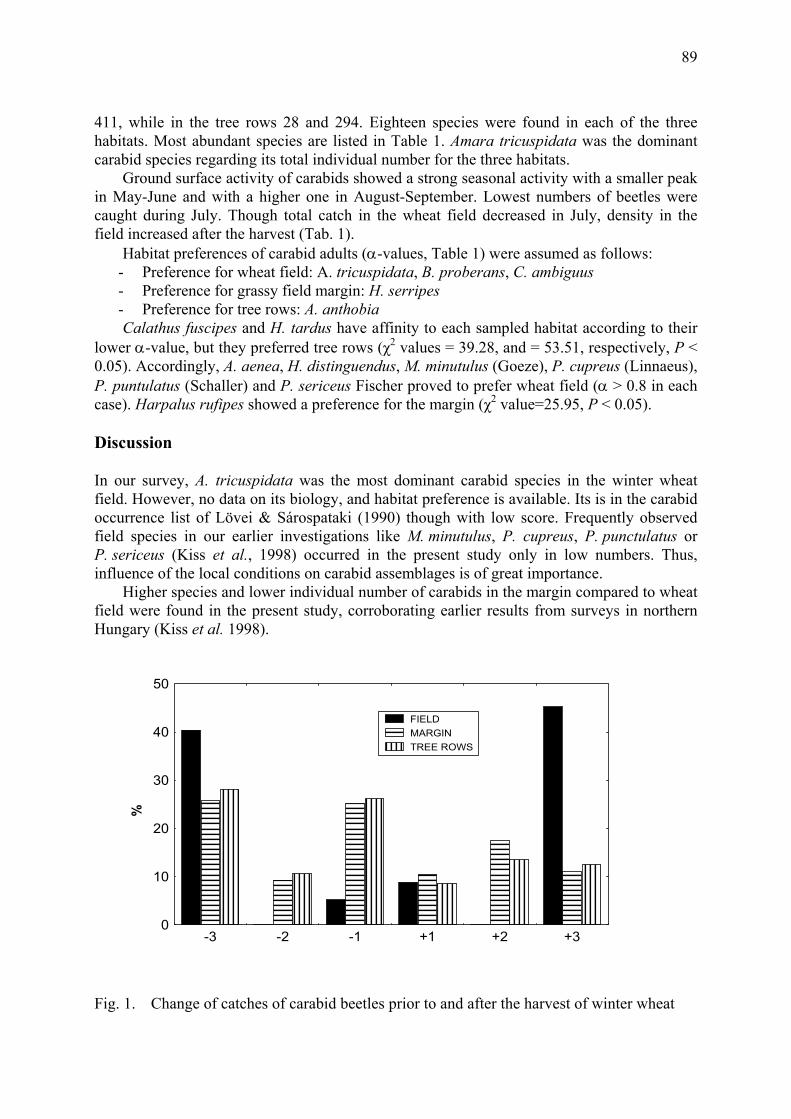
89
411, while in the tree rows 28 and 294. Eighteen species were found in each of the three habitats. Most abundant species are listed in Table 1. Amara tricuspidata was the dominant carabid species regarding its total individual number for the three habitats.
Ground surface activity of carabids showed a strong seasonal activity with a smaller peak in May-June and with a higher one in August-September. Lowest numbers of beetles were caught during July. Though total catch in the wheat field decreased in July, density in the field increased after the harvest (Tab. 1).
Habitat preferences of carabid adults (α-values, Table 1) were assumed as follows: - Preference for wheat field: A. tricuspidata, B. proberans, C. ambiguus - Preference for grassy field margin: H. serripes - Preference for tree rows: A. anthobia Calathus fuscipes and H. tardus have affinity to each sampled habitat according to their
lower α-value, but they preferred tree rows (χ2 values = 39.28, and = 53.51, respectively, P < 0.05). Accordingly, A. aenea, H. distinguendus, M. minutulus (Goeze), P. cupreus (Linnaeus), P. puntulatus (Schaller) and P. sericeus Fischer proved to prefer wheat field (α > 0.8 in each case). Harpalus rufipes showed a preference for the margin (χ2 value=25.95, P < 0.05).
Discussion In our survey, A. tricuspidata was the most dominant carabid species in the winter wheat field. However, no data on its biology, and habitat preference is available. Its is in the carabid occurrence list of Lövei & Sárospataki (1990) though with low score. Frequently observed field species in our earlier investigations like M. minutulus, P. cupreus, P. punctulatus or P. sericeus (Kiss et al., 1998) occurred in the present study only in low numbers. Thus, influence of the local conditions on carabid assemblages is of great importance.
Higher species and lower individual number of carabids in the margin compared to wheat field were found in the present study, corroborating earlier results from surveys in northern Hungary (Kiss et al. 1998).
%
0
10
20
30
40
50
-3 -2 -1 +1 +2 +3
FIELDMARGINTREE ROWS
Fig. 1. Change of catches of carabid beetles prior to and after the harvest of winter wheat
90
Decreasing individual number of carabids at harvest time is a consequence of their reproduction cycle and not caused by the harvest itself. The explanation for this is that individual number was higher during the first week after the harvest than before harvest (Tab. 1). On the other hand two peaks of dominant species (like A. tricuspidata) prior and after the harvest consist of adults of two different generations with low catches at harvest time.
Though carabid species in our study clearly belonged to one of the preference groups (field or margin species), the α values indicate their shift to habitats other than the preferred one. Many of the carabid species in agricultural landscape are moving between cultivated fields and their margins (Desender et al., 1981; Sotherton, 1985; Wallin, 1985). From the species in Table 1 data of C. fuscipes, H. tardus, H. rufipes and Zabrus tenebriodes indicate such dispersion pattern. Strong affinity of the three Poecilus species for winter wheat has been demonstrated in our study, confirming results of earlier studies (Szél et al., 1997; Kiss et al., 1998). Thus habitat preferences of carabid species in various regions in Hungary are very similar, though the influence of crop type to the activity and distribution of carabid species were demonstrated in other studies Cárcamo & Spence (1994).
References Cárcamao, H.A. & Spence, J.R. 1994: Crop type effects on the activity and distribution of
ground beetles (Coleoptera: Carabidae). Environ. Entomol. 23: 684-692. Chesson, J. 1978: Measuring preference in selective predation. Ecology 59: 211-215. Chesson, J. 1983: The estimation and analysis of preference and its relationship to foraging
models. Ecology 64: 1297-1304. Desender, K., Maelfait, P.-P., D’Hulster, M. & VanHercke, L. 1981: Ecological and faunal
studies on Coleoptera in agricultural land. I. Seasonal occurrence of Carabidae in the grassy edge of a pasture. Pedobiologia 22: 379-384.
Kiss, J., Kádár, F., Kozma, E. & Tóth, I. 1993: Importance of various habitats in agricultural landscape related to integrated pest management: a preliminary study. Landscape and Urban Planning 27: 191-198.
Kiss, J., Kádár, F., Tóth, I., Kozma, E. & Tóth, F. 1994: Occurrence of predatory arthropods in winter wheat field and in the field edge. Écologie 25: 127-132.
Kiss, J., Kádár, F., Tóth, F., Barth, R. & Hatvani, A. 1998: Predatory arthropods sampled in pitfall traps in winter wheat in northern Hungary. IOBC Bull. 21: 81-90.
Kromp, B. 1999: Carabid beetles in sustainable agriculture: a review on pest control efficacy, cultivation impacts and enhancement. Agriculture, Ecosystems and Environment 74: 187-228.
Lövei, G.L. & Sárospataki, M. 1990: Carabid beetles in agricultural fields in eastern Europe. In: The Role of Ground Beetles in Ecological and Environmental Studies, Intercept Ltd. Andover, ed. Stork: 87-93.
Manly, B.F.J., Miller, P. & Cook, L.M. 1972: Analysis of selective predation experiments. Amer. Nat. 106: 719-736.
Sotherton, N.W. 1985: The distribution and abundance of predatory Coleoptera overwintering in field boundaries. Ann. Appl. Biol. 106: 17-21.
Szél, Gy., Kádár, F. & Faragó, S. 1997: Abundance and habitat preference of some adult-overwintering ground beetle species in crops in western Hungary (Coleoptera: Carabidae). Acta Phytopath. Entom. Hung. 32: 369-376.
Wallin, H. 1985: Spatial and temporal distribution of some abundant carabid beetles (Coleo-ptera: Carabidae) in cereal fields and adjacent habitats. Pedobiologia 28: 19-34.
Integrated Control in Cereal Crops IOBC wprs Bulletin 24 (6) 2001
pp. 91 - 94
91
Role of field margin in the winter phenophase of Carabid beetles (Coleoptera: Carabidae) in winter wheat field G. Péter 1, F. Kádár 2, J. Kiss 1 and F. Tóth 1 1 Department of Plant Protection, Szent István University, Gödöllő, H-2100 Gödöllő, Hungary 2 Plant Protection Research Institute of the Hungarian Academy of Sciences, Budapest,
Hungary Summary Earlier studies on the ecological background of integrated pest management of winter wheat performed by the Department of Plant Protection at Szent István University, have identified the most important Carabid and spider species and revealed the potential importance of field margins as their habitat in Hungary. However, no evidence was available for the overwintering of Carabids in the wheat field and in the field margins. Soil samples were taken on József-major farm, near Kartal village, northern Hungary in December 1997 and 1998. Ten soil samples were taken from the field margin, 5-5 samples were dig in the wheat field at 1 m and 20 m distance from the margin. Soil was gathered from an area of 31,5 x 31,5 cm per sample. In 1997 soil was removed to a depth of 25 cm. In 1998, excavation depth was decreased to 15 cm. Arthropods and organic matter was removed from the soil by floating the soil samples in water. Majority of Carabid beetles in our samples occurred in the field margin both winters. In the wheat field, 1 m from the margin substantially lower numbers of individuals and species were observed than in the field margin. No Carabids were found in samples taken 20 m from the margin. Thus, field margins serve as overwintering habitats for Carabids, which colonise the fields from there.
Key words: Carabid beetles, winter wheat, winter phenophase, field margin
Introduction Winter wheat is one of Hungary’s major crop plants, covering about 25% of the country’s arable land (app. 1,1 million ha). This cereal growing area represents a wide spread artificial habitat that has its own characteristics on the basis of the arthropod community (Kiss et al., 1994). Integrated farming (as phrased by IOBC guidelines) and integrated pest control relies substantially on natural enemies, of which Carabid beetles represent a major group. Therefore, protection of predators by means of creating and maintaining appropriate habitats plays a key role in integrated pest management (IPM). Establishment of regional IPM guidelines needs regional data that will support the adaptation of WPRS guidelines in Hungary.
Earlier studies on the ecological background of IPM of winter wheat carried out by the Department of Plant Protection of Szent István University, have identified the most important Carabid and spider species and revealed the important role of field margins in Hungary (Kiss et al., 1994). However, to date, no evidence is available for the role of field margins in the winter phenophase of predator populations. In our two-year survey we were focusing on the winter phenophase of Carabid beetles in winter wheat fields and the adjacent field margins.
92
Material and methods The sampling area was located near Kartal village, about 40 km east of Budapest, Hungary, on the experimental farm of the Szent István University. The winter wheat fields sampled in December 1997 and January 1999 both occupied an area of 60 ha. The field margins were 3-5 m wide, with dense herbaceous undergrowth coverage and sporadic Robinia trees, showing a typical view of field margins in the region. Dominant weed species of the margins were Galium aperine, Hordeum vulgare and Calamagrostis epigeios. Both fields were treated with Logran 75 WG herbicide (9 g triasulfuron ai/ha) in early spring and Bion 50 WG fungicide (30 g bendicar ai/ha) in late spring. No insecticides were applied to the winter wheat fields.
Each winter 10 soil samples were taken from the field margins, 5-5 samples were dig in the wheat field at 1 m and 20 m distance from the margin. Soil was gathered from an area of 31,5 x 31,5 cm per sample. Thus, total sampled area was 1 square meter both in the margin and in the field. In 1997 soil was removed to a depth of 25 cm. In 1998, building on experiences of the previous year, excavation depth was decreased to 15 cm. Arthropods and organic matter was removed from the soil by floating the soil samples in water. Later arthropods were separated manually from the debris.
Tab. 1. Carabid species and their individual number in soil samples in winter, 1997/1998
List of species and their individual number
Margin 1 m infield 20 m infield
Pterostichus sericeus (Fischer von Waldheim)
38 2 0
Pterostichus cupreus L. 21 1 0 Agonum dorsale
Pontoppidan 21 0 0
Microlestes minutulus (Goeze)
8 0 0
Calosoma auropunctatum (Herbst)
2 0 0
Harpalus distinguendus Duftschmidt
8 0 0
Harpalus tardus (Panzer) 3 0 0 Harpalus azureus (Fab.) 2 0 0 Brachinus explodens
Duftschmidt 6 0 0
Amara similata (Gyllenhal) 4 1 0 Total 113 4 0
Results and discussion Winter of 1997/1998 A total number of 117 specimens of Carabid beetles were found in the soil samples in the winter of 1997/1998, which were distributed among 10 species (Tab. 1). Pterostichus sericeus (Fischer von Waldheim) proved to be superdominant (33.6 % in total number of specimens),
93
Pterostichus cupreus L. and Agonum dorsale Pontoppidan appeared to be dominant (both 18.6 % in total number of specimens).
The number of sampled species and specimens was substantially lower in the infield samples than those of the field margin. No Carabid beetles were found in any of the 20 m samples. No species was present exclusively in the winter wheat field.
In 1997 one soil sample from all three sets were taken in a way that the upper 15 cm and the lower 10 cm layers could be investigated separately. Since no Carabid beetles were found in the lower 10 cm of the soil samples, they are not presented in Tab. 1. During the next winter sampled soil was removed from sampling areas to a depth of 15 cm only.
Tab. 2. Carabid species and their individual number in soil samples in winter, 1998/1999
List of species and their individual number
Margin 1 m infield 20 m infield
Pterostichus sericeus (Fischer von Waldheim)
25 1 0
Pterostichus cupreus L. 14 0 0 Agonum dorsale Pontoppidan
12 0 0
Microlestes minutulus (Goeze)
6 0 0
Calosoma auropunctatum (Herbst)
1 0 0
Brachynus explodens Duftschmidt
1 0 0
Harpalus rufipalpis Sturm 10 2 0 Microlestes maurus (Sturm) 3 0 0 Harpalus rufipes (De Geer) 2 0 0 Total 74 3 0
Winter of 1998/1999 A total number of 77 specimens of Carabid beetles were sampled in the winter of 1998/1999, which were distributed among nine species (Tab. 2).
Pterostichus sericeus proved to be superdominant again (33.8 % in total number of specimens), P. cupreus and A. dorsale appeared to be dominant (18.9 and 16.2 % respectively, in total number of specimens). No species was present exclusively in the winter wheat field. The number of collected species and specimens was substantially lower in the infield samples than those of the field margin. No Carabid beetles were found in any of the 20 m samples.
The majority of Carabid species and specimens were found in the field margin in both winter periods (Tab. 1 and Tab. 2). In the winter of 1997/1998 96.6 %, in 1998/1999 96.1 % of total specimens were sampled in the field margin. Given this overwhelming rate of Carabids’ presence it can be concluded that field margins play a key role in the overwintering period of ground beetles. This finding, which correlate with that of Welling’s (1994), can be best explained by that larvae and adults developing after the winter wheat harvest at early summer find suitable food in the field margins. Weed coverage of the field margins and
94
grassy lanes also provide shelter and rest-places for Carabids (Kiss et al., 1993). Later in the year, as temperatures decrease considerably, ground beetles tend to move to field margins for overwintering. According to the investigations of Sotherton (1984), Carabids can stay in the field in the winter phenophase. This phenomenon was not observed during our investigations. Winter wheat, planted in early October, is not tall enough to provide sufficient shelter for Carabids.
According to our results in the winter of 1997/1998 3.4 %, and in the winter of 1998/1999 3.9 % of total specimens were found 1 m infield from the margin. Possibly some Carabid species are still active in late autumn and early winter, and some - for example P. cupreus, a dominant species in the samples - show activity even in December (Kiss, pers. com.). Therefore, some individuals can be found overwintering in the field, close to the margin. No Carabids were collected 20 m infield during both winters, probably because soil and plant structure are not suitable for late autumn feeding and overwintering. The substantial difference between the number of collected individuals of the two sampling period is an outcome of 1998 being a year with higher than average precipitation, which caused severe frost in the upper layer of the soil both infield and in the margin.
Other investigations showed that a number of Carabid species overwinter in the field margins and invade cultivated lands in spring, corroborating earlier reports of Desender (1982) and Sotherton (1984). Agonum dorsale, a dominant species in our samples is listed among these Carabids.
References Desender, K. 1982: Ecological and faunal studies on Coleoptera in agricultural land, II.
Hibernation of Carabidae in agroecosystems. Pedobiologia 23: 295-303. Desender, K. et al. 1989: Field edges and their importance for polyphagous predatory
arthropods. Med. Fac. Landbouww. Rijksuniv. Gent 54(3a): 823-833. Horvatovich, S. & Szarukán, I. 1986: Faunal investigations of ground beetles (Carabidae) in
the arable soils of Hungary. Acta Agronomica Hung. 35: 107-123. Kiss, J. et al. 1993: Importance of various habitats in agricultural landscape related to
integrated pest management: a preliminary study. Landscape and urban planning 27: 191-198.
Kiss, J. et al. 1994: Occurrence of predatory arthropods in winter wheat and in the field edge. Ecologie 25(2): 127-132.
Sotherton, N.W. 1984: The distribution and abundance of predatory arthropods overwintering on farmland. Ann. Appl. Biol. 105: 423-429.
Wallin, H. 1985: Spatial and temporal distribution of some abundant carabid beetles (Coleoptera: Carabidae) in cereal fields and adjacent habitats. Pedobiologia 28: 19-34.
Welling, M. 1990: Dispersal of ground beetles (Coleoptera: Carabidae) in arable land. Med. Fac. Landbouww. Rijksuniv. Gent 55(2b): 483-491.
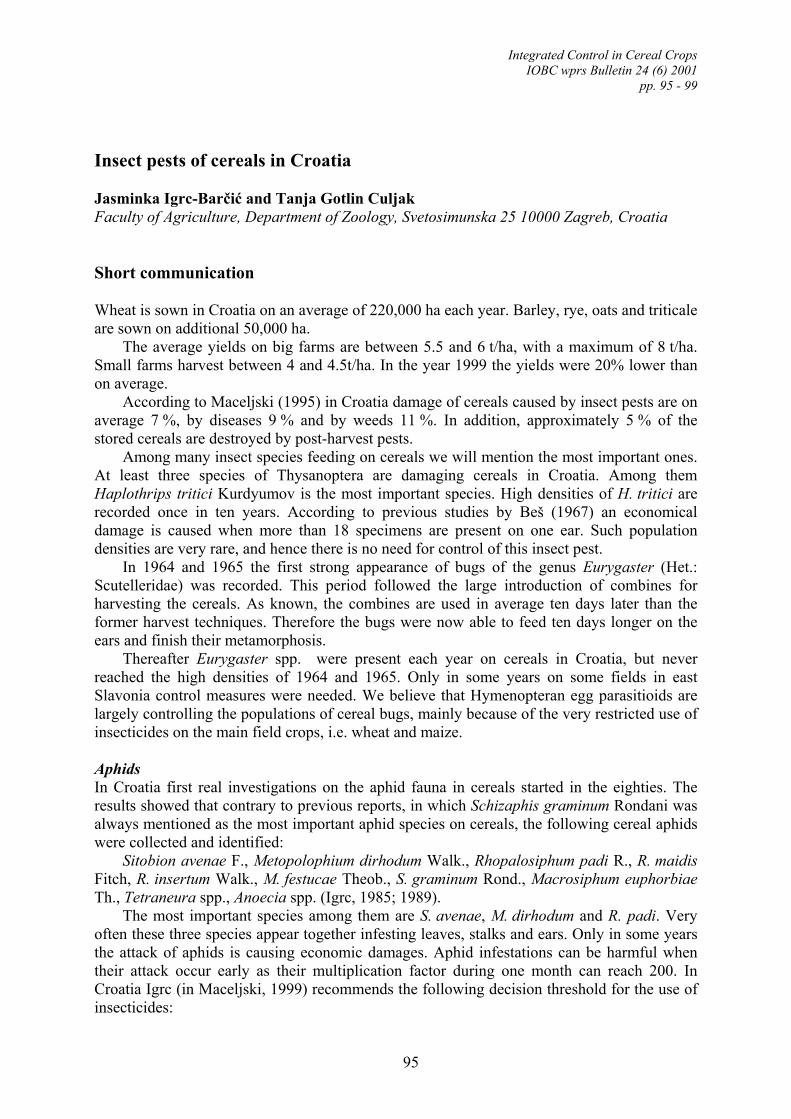
Integrated Control in Cereal Crops IOBC wprs Bulletin 24 (6) 2001
pp. 95 - 99
95
Insect pests of cereals in Croatia
Jasminka Igrc-Barčić and Tanja Gotlin Culjak Faculty of Agriculture, Department of Zoology, Svetosimunska 25 10000 Zagreb, Croatia
Short communication Wheat is sown in Croatia on an average of 220,000 ha each year. Barley, rye, oats and triticale are sown on additional 50,000 ha.
The average yields on big farms are between 5.5 and 6 t/ha, with a maximum of 8 t/ha. Small farms harvest between 4 and 4.5t/ha. In the year 1999 the yields were 20% lower than on average.
According to Maceljski (1995) in Croatia damage of cereals caused by insect pests are on average 7 %, by diseases 9 % and by weeds 11 %. In addition, approximately 5 % of the stored cereals are destroyed by post-harvest pests.
Among many insect species feeding on cereals we will mention the most important ones. At least three species of Thysanoptera are damaging cereals in Croatia. Among them Haplothrips tritici Kurdyumov is the most important species. High densities of H. tritici are recorded once in ten years. According to previous studies by Beš (1967) an economical damage is caused when more than 18 specimens are present on one ear. Such population densities are very rare, and hence there is no need for control of this insect pest.
In 1964 and 1965 the first strong appearance of bugs of the genus Eurygaster (Het.: Scutelleridae) was recorded. This period followed the large introduction of combines for harvesting the cereals. As known, the combines are used in average ten days later than the former harvest techniques. Therefore the bugs were now able to feed ten days longer on the ears and finish their metamorphosis.
Thereafter Eurygaster spp. were present each year on cereals in Croatia, but never reached the high densities of 1964 and 1965. Only in some years on some fields in east Slavonia control measures were needed. We believe that Hymenopteran egg parasitioids are largely controlling the populations of cereal bugs, mainly because of the very restricted use of insecticides on the main field crops, i.e. wheat and maize.
Aphids In Croatia first real investigations on the aphid fauna in cereals started in the eighties. The results showed that contrary to previous reports, in which Schizaphis graminum Rondani was always mentioned as the most important aphid species on cereals, the following cereal aphids were collected and identified:
Sitobion avenae F., Metopolophium dirhodum Walk., Rhopalosiphum padi R., R. maidis Fitch, R. insertum Walk., M. festucae Theob., S. graminum Rond., Macrosiphum euphorbiae Th., Tetraneura spp., Anoecia spp. (Igrc, 1985; 1989).
The most important species among them are S. avenae, M. dirhodum and R. padi. Very often these three species appear together infesting leaves, stalks and ears. Only in some years the attack of aphids is causing economic damages. Aphid infestations can be harmful when their attack occur early as their multiplication factor during one month can reach 200. In Croatia Igrc (in Maceljski, 1999) recommends the following decision threshold for the use of insecticides:
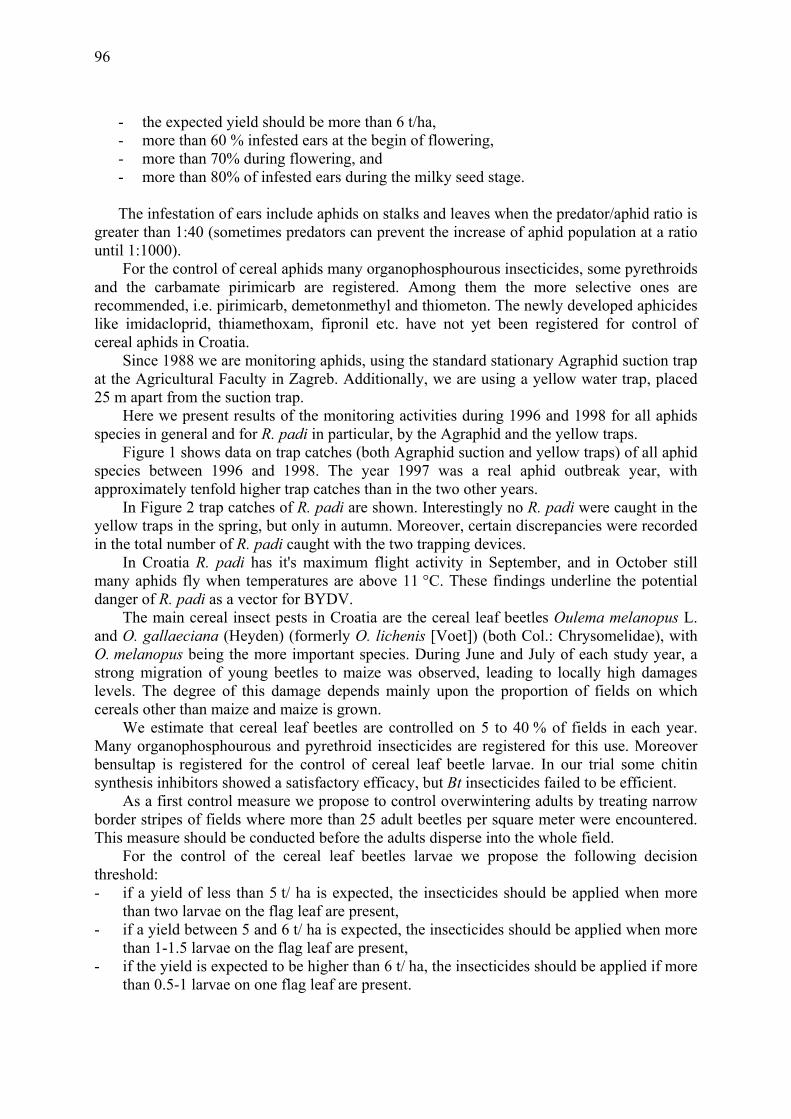
96
- the expected yield should be more than 6 t/ha, - more than 60 % infested ears at the begin of flowering, - more than 70% during flowering, and - more than 80% of infested ears during the milky seed stage. The infestation of ears include aphids on stalks and leaves when the predator/aphid ratio is
greater than 1:40 (sometimes predators can prevent the increase of aphid population at a ratio until 1:1000).
For the control of cereal aphids many organophosphourous insecticides, some pyrethroids and the carbamate pirimicarb are registered. Among them the more selective ones are recommended, i.e. pirimicarb, demetonmethyl and thiometon. The newly developed aphicides like imidacloprid, thiamethoxam, fipronil etc. have not yet been registered for control of cereal aphids in Croatia.
Since 1988 we are monitoring aphids, using the standard stationary Agraphid suction trap at the Agricultural Faculty in Zagreb. Additionally, we are using a yellow water trap, placed 25 m apart from the suction trap.
Here we present results of the monitoring activities during 1996 and 1998 for all aphids species in general and for R. padi in particular, by the Agraphid and the yellow traps.
Figure 1 shows data on trap catches (both Agraphid suction and yellow traps) of all aphid species between 1996 and 1998. The year 1997 was a real aphid outbreak year, with approximately tenfold higher trap catches than in the two other years.
In Figure 2 trap catches of R. padi are shown. Interestingly no R. padi were caught in the yellow traps in the spring, but only in autumn. Moreover, certain discrepancies were recorded in the total number of R. padi caught with the two trapping devices.
In Croatia R. padi has it's maximum flight activity in September, and in October still many aphids fly when temperatures are above 11 °C. These findings underline the potential danger of R. padi as a vector for BYDV.
The main cereal insect pests in Croatia are the cereal leaf beetles Oulema melanopus L. and O. gallaeciana (Heyden) (formerly O. lichenis [Voet]) (both Col.: Chrysomelidae), with O. melanopus being the more important species. During June and July of each study year, a strong migration of young beetles to maize was observed, leading to locally high damages levels. The degree of this damage depends mainly upon the proportion of fields on which cereals other than maize and maize is grown.
We estimate that cereal leaf beetles are controlled on 5 to 40 % of fields in each year. Many organophosphourous and pyrethroid insecticides are registered for this use. Moreover bensultap is registered for the control of cereal leaf beetle larvae. In our trial some chitin synthesis inhibitors showed a satisfactory efficacy, but Bt insecticides failed to be efficient.
As a first control measure we propose to control overwintering adults by treating narrow border stripes of fields where more than 25 adult beetles per square meter were encountered. This measure should be conducted before the adults disperse into the whole field.
For the control of the cereal leaf beetles larvae we propose the following decision threshold: - if a yield of less than 5 t/ ha is expected, the insecticides should be applied when more
than two larvae on the flag leaf are present, - if a yield between 5 and 6 t/ ha is expected, the insecticides should be applied when more
than 1-1.5 larvae on the flag leaf are present, - if the yield is expected to be higher than 6 t/ ha, the insecticides should be applied if more
than 0.5-1 larvae on one flag leaf are present.
97
Fig. 1. The flight activity of aphids in Zagreb 1996-1998, recorded in suction and yellow traps.
1996
0
100
200
300
400
500
600
700
III IV V VI VII VIII IX X XI
N°
YELLOW WATER TRAP AGRAPHID
1997
0
1000
2000
3000
4000
5000
6000
III IV V VI VII VIII IX X XI
N°
YELLOW WATER TRAP AGRAPHID
1998
0
50
100
150
200
250
300
350
400
III IV V VI VII VIII IX X XI
N°
YELLOW WATER TRAP AGRAPHID
98
Fig. 2. The flight activity of Rhopalosiphum padi in Zagreb 1996-1998, recorded in suction and yellow traps.
R. padi 1996
0
20
40
60
80
100
120
140
160
V VI VII VIII IX X XI
N°
AGRAPH ID YELLOW WATER TRAP
07.05.26.09.
20.11.
24.10.
R. padi 1997
0
80
160
240
320
400
480
V VI VII VIII IX X XI XII
N°
AGRAPHID YELLOW WATER TRAP
07.05. 12.11.11.11.
17.09.
R. padi 1998
0
5
10
15
20
25
30
35
V VI VII VIII IX X XI
N°
AGRAPHID YELLOW WATER TRAP
03.05.
03.09.
04.11
12.11.
99
In Croatia 10-20 % of cereals are sown on fields where cereals had been grown the preceding year. However, damage due to Zabrus tenebrioides Goeze (Col. Carabidae) is very rare. In our conditions, a three year monoculture of cereals is needed for developing economically harmful densities of Z. tenebrioides. In such cases the greatest problem is to persuade farmers to treat in autumn and not to wait until spring when the use of insecticides can not prevent high damages. In the third year of a cereal monoculture an autumn application of soil or foliar insecticides should be regularly carried out. There are many species of dipterous larvae damaging cereals in Croatia. This pest complex was only partly investigated. According to Kovačević (1952) Mayetiola destructor Say, Sitodiplosis mosellana (Géhin), Contarinia tritici (Kirby) (all Dipt.: Cecidomyiidae), Oscinella frit L. and Chlorops pumilionis (Bjerkander) (both Dipt: Chloropidae) are present in Croatia, but we have never registered any economic damages of these species except for frit fly on maize. We have recorded strong attack and damages by Haplodiplosis marginata Roser (Dipt.: Cecidomyiidae) in wheat fields in the mountain region of Poakakotlina. Some authors recently mentioned the presence of Delia coarctata (Fallén) (Dipt.: Anthomyiidae) and Phorbia fumigata (Meigen) (both Dipt.: Anthomyiidae), though no data on economic impact is available. We have recorded a very wide distribution of D. platura (Meigen) on many host plants, with some damage on wheat. We suspect that this poorly studied insect pests is much more important not only on cereals, but also on other commonly planted crops in Croatia. Each year some species of leaf miners of the family Agromyzidae were found damaging the tops of wheat leaves, though not causing any economic damage.
Concluding we can state that at the moment insect pest do not cause important damage to cereal crops in Croatia. The greatest potential danger are aphids especially if the importance of BYDV and other viruses will increase. Due to relatively large areas on which in Croatia cereals are grown we consider that any insecticide applications should be restricted as much as possible to prevent harm to natural enemies of insect pests and to the environment.
References Beš, A. 1967: Prilog poznavanju biologije i ekonomskog značaja pšeničnog tripsa –
Haplothrips tritici Kurd. na području Bosne i Hercegovine, doktorska disertacija. Igrc, J. 1985: Važnost i potreba suzbijanja lisnih uši (Aphididae) strnih žita, Agronomski
glasnik, 3-4: 109-118. Igrc, J. 1989: Lisne uši strnih žitarica, Glasnik zaštite bilja, 338-342. Igrc, J in Maceljski, M. 1999: Poljoprivredna entomologija, 65-111. Kovačević, Ž. 1952: Primijenjena entomologija, Poljoprivredni štetnici. Maceljski, M. 1995: Štete od štetoèinja u Hrvatskoj, Glasnik zaštite bilja, 6: 261-265.

100
Integrated Control in Cereal Crops IOBC wprs Bulletin 24 (6) 2001
pp. 101 - 107
101
The Hessian fly in Morocco: Surveys, loss assessment, and genetic resistance in bread wheat
Lhaloui, S. 1, M. El Bouhssini 2 and A. Amri 2 1 Institut National de la Recherche Agronomique, Centre Aridoculture, P.O. Box 589, Settat,
Morocco 2 International Center for Agricultural Research in the Dry Areas, ICARDA, Aleppo, Syria
Summary Hessian fly, Mayetiola destructor (Say) is the most destructive insect pest of wheat (Triticum spp) in the major cereal growing regions of the world. It is believed to have originated in West Asia which is the centre of diversity of wheat, and has spread out to Europe, North Africa, and North America. Heavy populations are detected regularly in North America and western Mediterranean countries. In North Africa, especially in Morocco, grain yield losses have been estimated to 42 and 36 % in bread wheat using an insecticide control method, and near isogenic resistant and susceptible lines respectively (Lhaloui et al., 1992; Amri et al., 1992). As a comparison, losses have been estimated to 32 % in durum wheat (Lhaloui et al., 1992).
The most efficient and economic method of control of this pest is the genetic resistance via the use of resistant cultivars. In the USA, 29 genes of resistance have been named and characterised. Ten of these genes (H5, H7H8, H11, H13, H14H15, H21, H22, H23, H25, and H26) were selected as conferring resistance to Hessian fly in the field in Morocco (El Bouhssini et al., 1996). Most of them are located on the A or the D genomes. The H5 gene was located in a South Dakota bread wheat germplasm, and was released as the first variety resistant to Hessian fly in Morocco, under the name of ‘Saada’ in 1988. The H22 gene has successfully been introgressed into an adapted Moroccan bread wheat cultivar, and has recently been released under the name of ‘Aguilal’. Also, the CIMMYT bread wheat resistant line L222 has been registered in the official catalogue, under the name ‘Arrihane’.
In addition to these known genes of resistance, we have identified a large number of sources in the wild wheat relatives. These sources are very useful because they increase the gene bank available to breeders to choose the resistance from, and they also widen the genetic base.
Key words: Hessian fly, infestations, losses, plant resistance, bread wheat.
Introduction Bread wheat is one of the major cereal crops in Morocco. It is grown over 1.5 Million ha annually. However, the production potential of this crop is limited by several biotic and abiotic stress factors. Hessian fly, Mayetiola destructor (Say) is the most destructive insect pest of wheat (Triticum spp) in the major cereal growing regions of the world. It is believed to have originated in West Asia which is the centre of diversity of wheat, and has spread out to Europe, North Africa, and North America. Heavy populations are detected regularly in North America and western Mediterranean countries. In North Africa, especially in Morocco, this insect is the focal research subject in the program of protecting cereals against damaging pests.
The objective of this paper is to give an overview of what has been accomplished in the field of host plant resistance to this pest in Morocco, and the plans for future research.
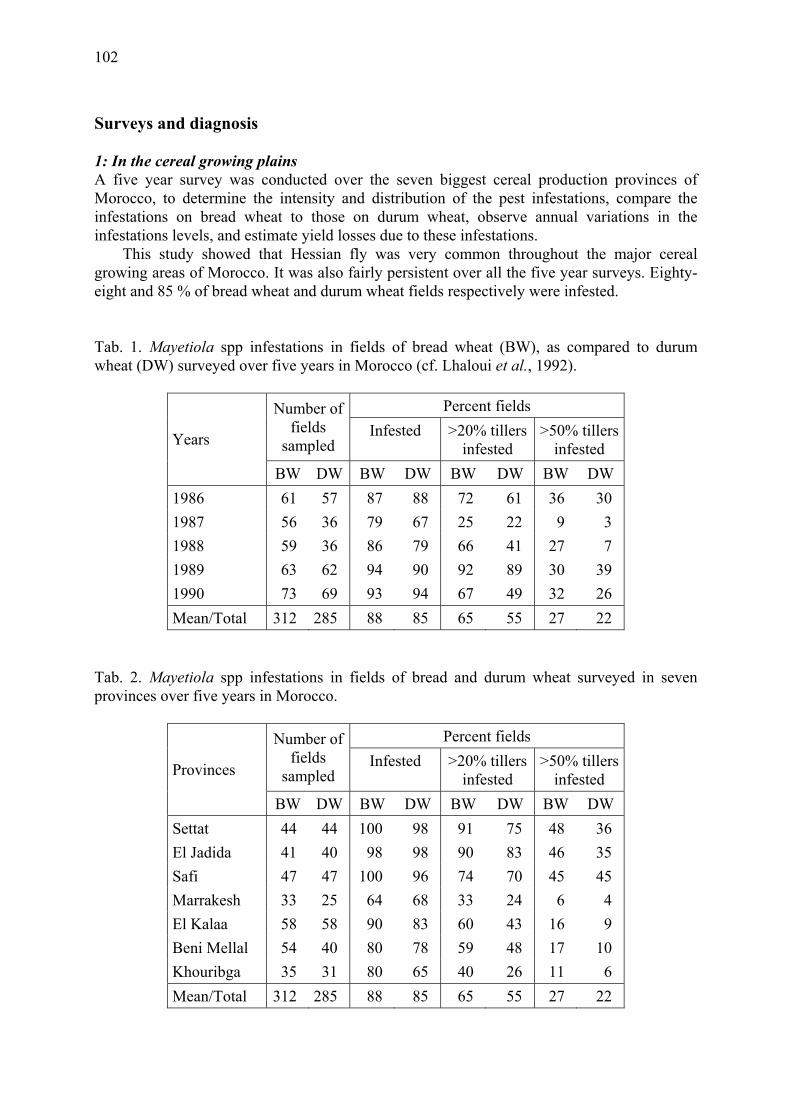
102
Surveys and diagnosis 1: In the cereal growing plains A five year survey was conducted over the seven biggest cereal production provinces of Morocco, to determine the intensity and distribution of the pest infestations, compare the infestations on bread wheat to those on durum wheat, observe annual variations in the infestations levels, and estimate yield losses due to these infestations.
This study showed that Hessian fly was very common throughout the major cereal growing areas of Morocco. It was also fairly persistent over all the five year surveys. Eighty-eight and 85 % of bread wheat and durum wheat fields respectively were infested.
Tab. 1. Mayetiola spp infestations in fields of bread wheat (BW), as compared to durum wheat (DW) surveyed over five years in Morocco (cf. Lhaloui et al., 1992).
Percent fields Number of
fields sampled
Infested >20% tillers infested
>50% tillers infested Years
BW DW BW DW BW DW BW DW 1986 61 57 87 88 72 61 36 30 1987 56 36 79 67 25 22 9 3 1988 59 36 86 79 66 41 27 7 1989 63 62 94 90 92 89 30 39 1990 73 69 93 94 67 49 32 26 Mean/Total 312 285 88 85 65 55 27 22
Tab. 2. Mayetiola spp infestations in fields of bread and durum wheat surveyed in seven provinces over five years in Morocco.
Percent fields Number of
fields sampled
Infested >20% tillers infested
>50% tillers infested Provinces
BW DW BW DW BW DW BW DW Settat 44 44 100 98 91 75 48 36 El Jadida 41 40 98 98 90 83 46 35 Safi 47 47 100 96 74 70 45 45 Marrakesh 33 25 64 68 33 24 6 4 El Kalaa 58 58 90 83 60 43 16 9 Beni Mellal 54 40 80 78 59 48 17 10 Khouribga 35 31 80 65 40 26 11 6 Mean/Total 312 285 88 85 65 55 27 22
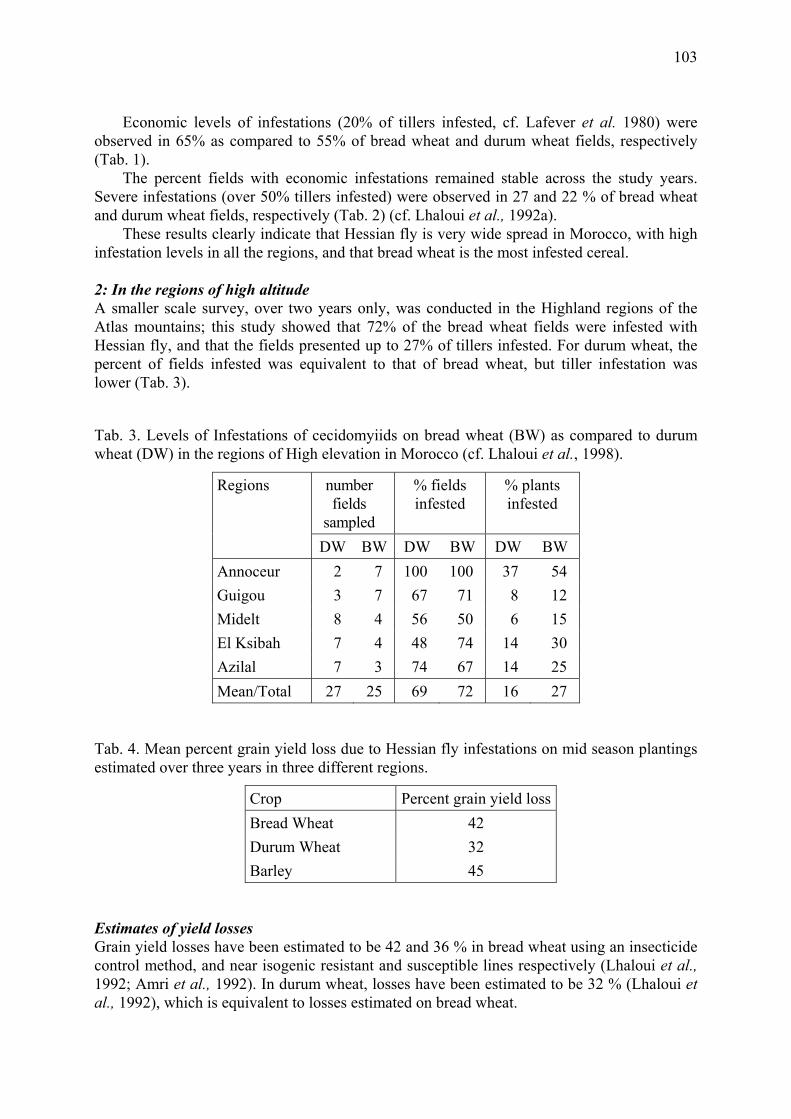
103
Economic levels of infestations (20% of tillers infested, cf. Lafever et al. 1980) were observed in 65% as compared to 55% of bread wheat and durum wheat fields, respectively (Tab. 1).
The percent fields with economic infestations remained stable across the study years. Severe infestations (over 50% tillers infested) were observed in 27 and 22 % of bread wheat and durum wheat fields, respectively (Tab. 2) (cf. Lhaloui et al., 1992a).
These results clearly indicate that Hessian fly is very wide spread in Morocco, with high infestation levels in all the regions, and that bread wheat is the most infested cereal. 2: In the regions of high altitude A smaller scale survey, over two years only, was conducted in the Highland regions of the Atlas mountains; this study showed that 72% of the bread wheat fields were infested with Hessian fly, and that the fields presented up to 27% of tillers infested. For durum wheat, the percent of fields infested was equivalent to that of bread wheat, but tiller infestation was lower (Tab. 3). Tab. 3. Levels of Infestations of cecidomyiids on bread wheat (BW) as compared to durum wheat (DW) in the regions of High elevation in Morocco (cf. Lhaloui et al., 1998).
number fields
sampled
% fields infested
% plants infested
Regions
DW BW DW BW DW BW Annoceur 2 7 100 100 37 54 Guigou 3 7 67 71 8 12 Midelt 8 4 56 50 6 15 El Ksibah 7 4 48 74 14 30 Azilal 7 3 74 67 14 25 Mean/Total 27 25 69 72 16 27
Tab. 4. Mean percent grain yield loss due to Hessian fly infestations on mid season plantings estimated over three years in three different regions.
Crop Percent grain yield lossBread Wheat 42 Durum Wheat 32 Barley 45
Estimates of yield losses Grain yield losses have been estimated to be 42 and 36 % in bread wheat using an insecticide control method, and near isogenic resistant and susceptible lines respectively (Lhaloui et al., 1992; Amri et al., 1992). In durum wheat, losses have been estimated to be 32 % (Lhaloui et al., 1992), which is equivalent to losses estimated on bread wheat.
104
The estimate of yield loss test showed that yield increases between chemically protected and non-protected varieties, averaged over a four year period of the test, 42, 32, and 45% for bread wheat, durum wheat and barley, respectively (Tab. 4). In an average rainfall season, the percentage of loss was estimated to be 35% of the yield. This indicates that losses caused by this pest on durum wheat are equivalent to those caused on bread wheat (Lhaloui et al., 1992b).
Genetic control: identification of sources of resistance and development of resistant cultivars Host plant resistance has been widely utilised to limit the damage caused by insect pests over the world. Sources of resistance have been continuously sought and introgressed into adapted cultivars. This method presents many advantages:
1. It is economical for the farmer, as compared to the repeated use of chemicals, it does not cost him anything; everything is incorporated into the seed of the resistant cultivar.
2. It is safe for man and animals and does not present any toxicity. 3. It is environmentally sound and safe, and thus does not pollute the environment.
1: Methodology of screening In the greenhouse and the growth chambers, the screening procedure we followed is similar to that described by Cartwright and LaHue (1944). The genetic material consists of collections of wild wheat relatives, and nurseries generated by breeders from crosses between identified sources of resistance and adapted Moroccan varieties. The number of entries can vary from 5,000 to 1,000 per year. Lines are seeded in standard greenhouse flats, containing a mixture of 2/3 soil and 1/3 peat, at a rate of one row per line, and 25 seeds per row. Each flat contains a susceptible (cv. Nesma) and a resistant (cv. Saada ) check. When plants are in the two-leaf stage, flats are covered with a cheesecloth tent, and about one hundred females of newly emerged and mated Hessian flies are released in each flat. Females are allowed to lay eggs for two days. Three weeks later, plants are removed from the flats and checked for their resistance reaction. Plants that are stunted and had a dark green colour were considered as susceptible, those that have normal growth, with a light green colour are considered as resistant. Resistance is further confirmed by the presence of dead first instar larvae at the bases of stems.
Advanced breeding material is screened in the field, usually at the Jemaa shaim experimental station, which is considered as the hot spot of Hessian fly occurrence in Morocco. They are seeded in 3 m lines, 50 cm spaced. The seeding date is chosen in late December to allow plants to get the maximum infestation by the second generation of adult Hessian flies. The screening is done visually in February after the infestations have occurred and plants had shown resistance or susceptibility reaction. The selection is made in April, at crop maturity, in collaboration with the breeding program.
2: Major results and accomplishments In the beginning of the program, we screened al the existing Moroccan germplasm. Unfortunately it turned out to be all susceptible.
Then we screened the North American uniform Hessian fly nursery in 1984, and the results showed that three genes of this nursery provided a high level of resistance to the Moroccan populations of this pest. These were H5, H11, and H13.
The H5 gene existed in a south Dakota spring bread wheat germplasm SD8036. This line was tested in Morocco for yield performance, and released in 1989 as the first cultivar
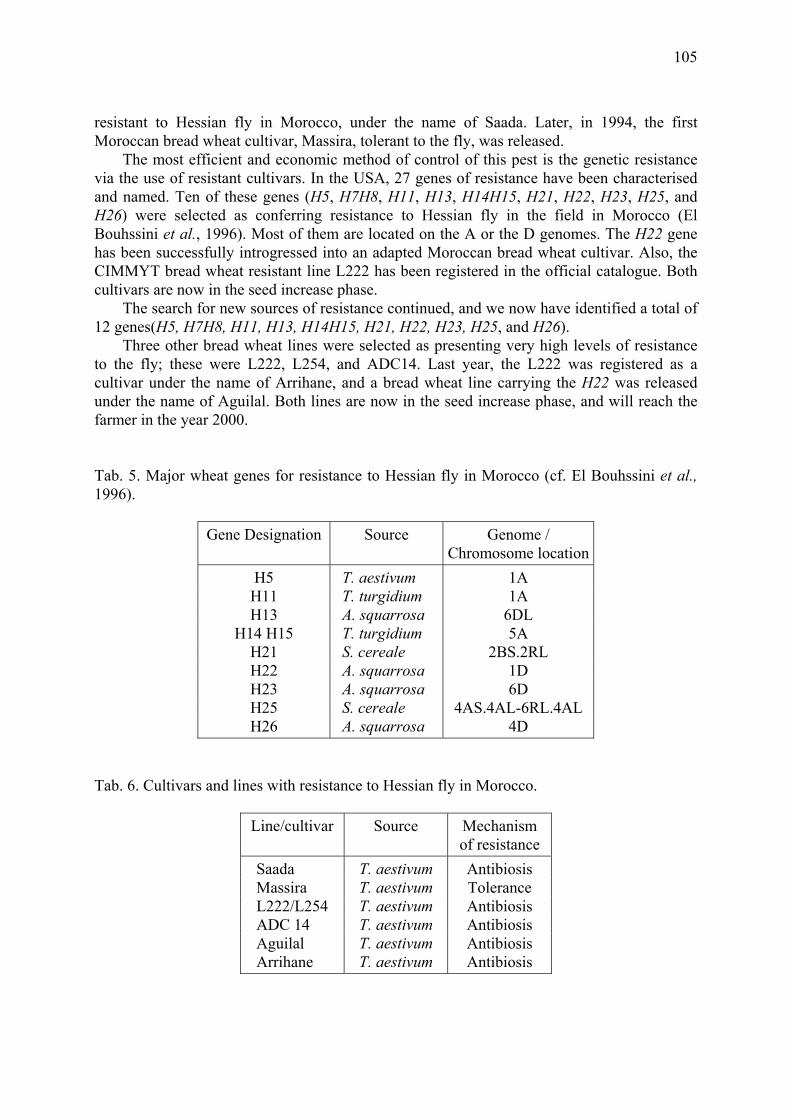
105
resistant to Hessian fly in Morocco, under the name of Saada. Later, in 1994, the first Moroccan bread wheat cultivar, Massira, tolerant to the fly, was released.
The most efficient and economic method of control of this pest is the genetic resistance via the use of resistant cultivars. In the USA, 27 genes of resistance have been characterised and named. Ten of these genes (H5, H7H8, H11, H13, H14H15, H21, H22, H23, H25, and H26) were selected as conferring resistance to Hessian fly in the field in Morocco (El Bouhssini et al., 1996). Most of them are located on the A or the D genomes. The H22 gene has been successfully introgressed into an adapted Moroccan bread wheat cultivar. Also, the CIMMYT bread wheat resistant line L222 has been registered in the official catalogue. Both cultivars are now in the seed increase phase.
The search for new sources of resistance continued, and we now have identified a total of 12 genes(H5, H7H8, H11, H13, H14H15, H21, H22, H23, H25, and H26).
Three other bread wheat lines were selected as presenting very high levels of resistance to the fly; these were L222, L254, and ADC14. Last year, the L222 was registered as a cultivar under the name of Arrihane, and a bread wheat line carrying the H22 was released under the name of Aguilal. Both lines are now in the seed increase phase, and will reach the farmer in the year 2000.
Tab. 5. Major wheat genes for resistance to Hessian fly in Morocco (cf. El Bouhssini et al., 1996).
Gene Designation Source Genome /
Chromosome location H5 T. aestivum 1A H11 T. turgidium 1A H13 A. squarrosa 6DL
H14 H15 T. turgidium 5A H21 S. cereale 2BS.2RL H22 A. squarrosa 1D H23 A. squarrosa 6D H25 S. cereale 4AS.4AL-6RL.4AL H26 A. squarrosa 4D
Tab. 6. Cultivars and lines with resistance to Hessian fly in Morocco.
Line/cultivar Source Mechanism of resistance
Saada T. aestivum Antibiosis Massira T. aestivum Tolerance L222/L254 T. aestivum Antibiosis ADC 14 T. aestivum Antibiosis Aguilal T. aestivum Antibiosis Arrihane T. aestivum Antibiosis
106
In addition, we have identified a large number of sources of resistance in wild relatives; among this germplasm, There are many accessions of Triticum, Aegilops, and Hordeum. These constitute a very rich gene bank that we can turn to when the characterised genes are no longer effective, and widen the genetic base of resistance used in the breeding program.
Conclusion Overall, we have identified a large number of sources of resistance, both in adapted wheat lines, and in several wild sources. The resistance that was identified is mostly of the antibiosis type; plants were not stunted, had normal growth with light green colour, and contained dead first instars of Hessian fly at the bases of their stems, which indicates that these larvae died when they started feeding on the plants (antibiosis reaction). Antibiosis is the most desirable form of resistance in the case of host plant resistance to Hessian fly as it is controlled by a gene for gene relationship.
The selected breeding lines were homogeneous for resistance and presented good agronomic characters. This indicates, that lots of progress has been achieved as far as resistance to Hessian fly in both bread and durum wheat is concerned in Morocco.
However, because of the nature of Hessian fly genetics, and its ability to develop new virulent biotypes, we need to stay continuously alerted, and ahead of biotype development. In fact, the speed of rise of new more virulent biotypes depend on the size of the pest population, the number of generations, and acreage on which the resistant gene has been deployed. Hessian fly has large populations, with two to three generations per year. Thus a large genetic variability among individuals of the population which is the material needed for the selection pressure to act on. The development of these biotypes is even faster if the cultivar carrying the resistance is grown over a large acreage. This will be expected, as improved more productive varieties have always been adopted by farmers, and replaced older varieties. The durum and bread wheat improvement program of Morocco have to stay ahead of new biotypes by conducting surveys of deployed cultivars, estimating the % susceptibility in the varieties; in other terms, the percent of virulence in the population.
Also, the search for new sources of resistance to the developing biotype has to start very early and not wait until the biotype erupt. Cultures of the new virulent individuals have to be kept in the laboratory, and used in the search for new sources of resistance.
References Amri, A., El Bouhssini, M., Lhaloui, S., Cox, T.S. & Hatchett, J.H. 1992: Estimates of yield
loss due to Hessian fly (Diptera: Cecidomyiidae) on bread wheat using near isogenic lines. Al Awamia 77: 75-87.
Cartwright, W.B. & LaHue, D.W. 1944: Testing wheats in the greenhouse for Hessian fly resistance. J. Econ. Entomol. 37: 385-387.
El Bouhssini, M., Lhaloui, S., Amri, A., Jlibene, M., Hatchett, J.H., Nssarellah, N. & Nachit, M.M. 1996: Wheat genetic control of Hessian fly (Diptera: Cecidomyiidae) in Morocco. Field Crops Research 45: 111-114.
Lafever, H.N., Sosa, O., Gallun, R.L., Foster, J.E. & Kuhn, R.C. 1980: Survey monitors of Hessian fly population in Ohio wheat. Ohio Report on Research and Development; Agriculture, Home Economics, Natural Resources 64(4): 51-53.
107
Lhaloui, S., Buschman, L., El Bouhssini, M., Amri, A., Hatchett, J.H., Keith, D., Starks, K. & El. Houssaini, K. 1992 a: Infestations of Mayetiola spp. (Diptera: Cecidomyiidae) in bread wheat, durum wheat, and barley: Results of five annual surveys in the major cereal growing regions of Morocco. Al Awamia 77: 21-53.
Lhaloui, S., Buschman, L., El Bouhssini, M., Starks, K., Keith, D.L. & El. Houssaini, K. 1992 b: Control of Mayetiola species (Diptera: Cecidomyiidae) with carbofuran in bread wheat, durum wheat, and barley, with yield loss assessment and its economic analysis. Al Awamia 77: 55-73.
Lhaloui, S., El Bouhssini, M. & Amri, A. 1998: Survey of insect pests of cereals in the Highlands of Morocco in 1996 and 1997. 1986 Annual Research Report. Centre Aridoculture. Settat, Morocco.

108
Integrated Control in Cereal Crops IOBC wprs Bulletin 24 (6) 2001
pp. 109 - 112
109
Ecological Pest Management (EPM): General Problems
Wladimir B. Tshernyshev Department of Entomology, Faculty of Biology, Moscow State University, Moscow 119899, Russia
Summary Strategies of EPM and IPM are principally different. EPM uses only such methods which do not upset the natural balance of the agro-ecosystem and rejects both chemical pesticides and mass inundation by artificially reared natural enemies. EPM cannot use Economic Injury Level directly. Certain combinations of two parameters, density of pest and density of its natural enemies (the probability of pest outbreak), should be a token for short-termed measures in EPM. The advantages, shortcomings and basic tasks of EPM are discussed.
Key words: pests, integrated control, ecological control, natural enemies
What is Ecological Pest Management? Integrated Pest Management (IPM) incorporates all methods of plant protecting, including both ecological and anti-ecological ones. Ecological Pest Management is often considered as only a part of IPM (Kogan, 1998).
Proposed by us (Tshernyshev, 1994, 1995, 1996) Ecological Pest Management (EPM) is a direct result of IPM development and includes the same methods of plant protection except those which can upset the natural balance of the agro-ecosystem. One would think that we could better name it Ecological Integrated Pest Management (EIPM - Kozar, 1992; Sokolov et al., 1994; Sugonyaev & Monastyrsky, 1997) or Ecologically Based Integrated Pest Management (EBIPM - National Research Council, 1996). Strictly speaking EPM is really an integration of many methods of plant protection. However, the general strategies of EPM and the various types of IPM are quite different.
Firstly, EPM bases on keeping the natural stability of agro-ecosystem, and rejects any chemical pesticides and other methods of plant protection which can upset natural balance. One should keep in mind that IPM considers all methods of plant protection which are able to increase the yield (Food and Agriculture Organisation, 1975; Kogan, 1998). It is well known that every hard chemical pesticide is harmful to a certain extent to the environment.
Secondly, EPM is not able to use directly the backbone of IPM, i.e. the concept of Economic Injury Threshold, because when pest densities have already reached such high levels, only hard measures are able to save the yield. The decision to take measures should be based on two separate parameters: the abundance of the pest and that of its natural enemies. Every combination of these parameters corresponds to definite level of probabilities that the economic injury level will soon be reached (i.e. possible outbreak development). The necessary table of combinations may be derived from long-term monitoring data of arthropods. The admissible risk will depend on the kind of crop and geographical region.
110
EPM and IPM from the point of view of population dynamics Accordingly to the general theory of population dynamics (Victorov, 1976; Isayev et al., 1984), the level of any population density usually varies in definite limits, being regulated by predators and non-specialised parasites. Sometimes these predators and parasites can not hold the reproduction of pest population and so-called "slipping out" takes place (pest outbreak). Specialised parasites are usually effective only at the highest levels of the pest populations.
The level of an economic injury threshold is usually higher than the level of slipping out. The general task of EPM is to prevent the pest population from slipping out of the control of their natural enemies. If the natural enemies are always abundant we can forget about pesticides. In IPM we also use so-called « levels of natural enemies efficacy». It means that if there are no more than «n» specimens of a given pest species per one predator (parasite) in the field, you should not use pesticides even when the abundance of the pest exceeds the economic injury threshold. However, the backbone of every IPM concept is the economic injury level. It means that in practice, we may wait until the pest density is very high and then use pesticides.
The management of natural enemies and their alternative prey species The main measure in EPM is a management of natural enemies. Grassy margins around the field, meadows, meliorate ditches, hedges, forest belts, forest edges and fields of perennial herbs may be good refuges for predators and parasites. We should note that only species inhabiting relatively open spaces (usually ecotones) are able to colonise the field, forest species cannot do it. The stability of an agro-ecosystem can also be increased by the introduction of plant polycultures, i.e. by sowing different plants (especially flowering cultural plants) on separate strips and by placing "cassettes" with any artificially reared «food insects» in the field to attract natural enemies (Kovalenkov & Tjurina, 1993). If the slipping out of any pest is outlined, a partial mowing of the nearest grassy field margins, meadows or perennial herbs can increase the natural enemies density in the field (Nyazov, 1992; Khamrayev, 1992).
All natural enemies should be provided with food during periods when there are no pests in the field. However, the alternative prey species also need their host plants. Therefore we have to regulate complexes of wild plants near the crop fields.
Short-term measures in EPM In EPM we have at least four barriers for pests in the field. 1) Natural predators (insects, spiders, mites, may be harvested). They are universal and can effectively work at every level of pest abundance. Many non-specialised parasites also belong to this category of natural enemies. This barrier is especially important. 2) If the monitoring shows that the abundance of natural enemies is not sufficient, we can increase their number by mowing the nearest perennial herbs, meadows or grassy margins. 3) Next step is a release of some artificially reared enemies. However, too many mass releases may be dangerous for the stability of an agro-ecosystem due to competition with natural enemies and eradication of alternative preys (hosts). 4) In many cases the soft (microbiological and any similar) pesticides may be used. The limitations are the same as in the previous case.
Therefore, in contrast to IPM, an EPM strategy demands the interruption of the outbreak development in its very beginning when the pest abundance level is lower than the economic injury threshold.
111
Advantages and shortcomings of EPM Advantages of EPM are the following: 1) no pollution of environment and food products; 2) no problems of resistance to chemical pesticides, 3) supporting of maximal biodiversity and conservation of rare species; 4) favourable conditions for natural pollinators; 4) long-term effect of agro-landscape management; 6) low expenses.
The shortcomings of EPM are: 1) The main hindrance is a psychological barrier. All persons engaged in production are sure that it is impossible to grow the yield without chemical pesticides; 2) relatively lower reliability, especially in the beginning of landscape management procedure, therefore the replacement of the IPM by the EPM should be made gradually; 3) much more complex monitoring schemes for both the pests and the beneficial arthropods, including also their alternative preys (hosts), both in the field and around it (field margins and surrounding biotopes). Such monitoring should be made by well-educated specialists. Indeed, in many cases estimation of population density only of well distinguished species (indicator species - Sugonyaev & Monastyrsky, 1997) is sufficient; 4) elaboration of the EPM-system for such pests which can also decrease the quality of production for instance for bugs Eurygaster integriceps Put., and for many orchard pests. In this case the economic injury level may be very close to level of slipping out; 5) elaboration of EPM-system for long distance migratory pests like some locust species; 6) elaboration such system for new alien species like the Colorado beetle, because the complex of their natural enemies has not been formed finally so far.
The main directions of scientific research in EPM elaboration The main topics and stages of research are the following: 1) to determine the dominating species of predators and parasites in the field and the spectrum of their preys (pests and inhabitants of weeds and wild plants); 2) to elaborate the management of alternative preys (hosts) outside the field; 3) to provide additional food sources for entomophagous arthropods, e.g. nectar, pollen and honeydew, and to determine their preferred flowering plants; 3) to study interactions between natural enemies; 4) to investigate seasonal colonisation of the field by natural enemies, optimal places for their hibernation, aestivation and reproduction; 5) supporting of field margins on the stage of succession optimal for natural enemies; 6) to study interactions between natural enemies and artificially reared and released predators and parasites, microbiological and chemical pesticides; and 7) construction of optimal types of agro-landscapes.
Conclusion Ecological Pest Management is supposed to replace the concept of Integrated Pest Management (IPM) in the near future. We think that namely cereal crops will provide the best opportunity to elaborate the first EPM system. We suppose also that such a system of natural balance in agro-ecosystem may be also feasible for disease and weed control.
References Food and Agriculture Organisation 1975: Report FAO Panel of Experts on Integrated Pest
Control, 5th October 15-25, 1974, Rome, Italy: FAO- UN. Meeting report 1975/m/2, 41 pp. (cit. by M. Kogan, 1998)
Isajev, A.S., Khlebopros, R.G., Nedorjezov, L.V., Kondakov, Ju, P. & Kiseljev, V.V. 1984: Population dynamics in forest insects. Novosibirsk, Nauka, 224 pp. (in Russian).
112
Khamrajev, A.S., 1992: [Anthropogenous influence on the dominating complex of pests and entomophaguos insects in ecosystem of cotton crop in south-west of Uzbekistan.] Doklady of Acad. Sci. Uzbekistan 10-11: 85-87 (in Russian).
Kogan, M. 1998: Integrated Pest Management: Historical Perspectives and Contemporary Developments. Ann. Rev. Entomol. 43: 243-270.
Kovalenkov, V.G. & Tjurina, N.M. 1993: [Is it possible to rule the activity of entomophagous insects ?] Plant Protect. 8: 7-8 (in Russian).
Kozar, F., 1992: Ecological plant protection in Hungary. In: Proc. of the Congress Agriculture and Environment in Eastern Europe and the Netherlands. Agric. University, Wageningen: 283-291.
National Research Council 1996: Ecologically Based Pest Management. New Solution for a New Century. Washington, DC. Natl. Acad. 160 pp.
Nyazov, O.D. 1992: [Ecological principles of cotton crop protection.] Izvestia Acad. Sci., Turkmenistan: 3-13 (in Russian).
Sokolov, M.S., Monastyrsky, O.A. & Pikushova, E.A. 1994: [Application of ecological principles to plant protection.] Pushchino, RA Agric., 477 pp. (in Russian).
Sugonyaev, E.S. & Monastyrsky, A.L. 1997: [Introduction to the management of insect populations - rice pests in Vietnam.] Khanoy, 291 pp. (in Russian).
Tshernyshev, W.B. 1994: [Ecological plant protection.] Plant Protect. 8: 46-47 (in Russian). Tshernyshev, W.B. 1995: Ecological pest management: general approaches. J. Appl. Ent. 119:
379-381. Tshernyshev, W.B. 1996: [Insect Ecology.] Moscow, Publ. House of Moscow University: 297
pp. (in Russian). Victorov, G.A. 1976: [Ecology of entomophagous parasitic insects.] Moscow, Nauka, 127 pp.
(in Russian).
Integrated Control in Cereal Crops IOBC wprs Bulletin 24 (6) 2001
pp. 113 - 118
113
Hessian fly (Mayetiola destructor Say) damage in relay intercropping of cereals in Finland
Erja Huusela-Veistola, Arja Vasarainen and Jaana Grahn Agricultural Research Centre of Finland, Plant Production Research, FIN-31600 Jokioinen, Finland
Summary Relay intercropping is a double-cropping system where a ‘cover crop’ (spring cereal or oil-seed rape) and a winter cereal are usually sown simultaneously in the spring. The ‘cover crop’ is harvested in the first year and the winter cereal in the second year. Relay intercropping saves time and energy, improves the soil properties and keeps the fields green throughout the year. Severe damage of winter cereals has occurred in relay intercropping fields in SW Finland. Hessian fly, Mayetiola destructor Say (Diptera: Cecidomyiidae), has damaged several intercropped winter cereals so heavily that many farmers have given up the new promising cropping system. To date, damage caused by the Hessian fly in Finland has been overlooked although damage in rye and barley has been reported as early as in the early 1900s. Since 1995, Hessian fly infestations have occurred especially in spring-sown winter wheat, but also in rye and barley in relay intercropped fields. In 1999, Hessian fly infestations were found also in ordinary spring cereal (barley, wheat) and winter wheat fields. In the USA, resistant wheat varieties are being used to decrease the damage caused by the Hessian fly. Delayed sowing time, crop rotation and tillage may also decrease crop losses. However, in relay intercropping, spring-sown winter cereals are more and longer susceptible to the Hessian fly attack because their growth is retarded. In addition, it is difficult or impossible to target pesticides to larvae inhabiting the base of undersown winter cereals. The importance of Hessian fly as a pest in relay intercropping in Finland is discussed.
Key words: double-cropping, Cecidomyiidae, Hessian fly, integrated control, intercropping
Introduction The bird cherry-oat aphid (Rhopalosiphum padi L.) is the main pest of spring cereals in Finland. Generally, aphid outbreaks occur 2-3 times per decade. Thus, insecticides are not used every year in large scale in cereal production in Finland. The orange wheat blossom midge (Sitodiplosis mosellana [Géhin]) and the frit fly (Oscinella frit L.) occasionally cause local problems to winter cereals.
Changes in farming systems, e.g. trends in conservation tillage and non-tillage, may make the conditions more suitable for new or previously minor pest species. Integrated or sustainable cereal production may have different pest problems than conventional production methods. Usually, large monoculture fields favour pests than more diversified intercropped fields (Andow, 1991).
Relay intercropping Today, winter-green fields have become popular because of the environmental support provided by the EU. Relay intercropping is a double-cropping system where a ‘cover crop’ (spring cereal or oil-seed rape) and a winter cereal are usually sown simultaneously in the spring. The ‘cover crop’ is harvested in the first year and the winter cereal in the second year.
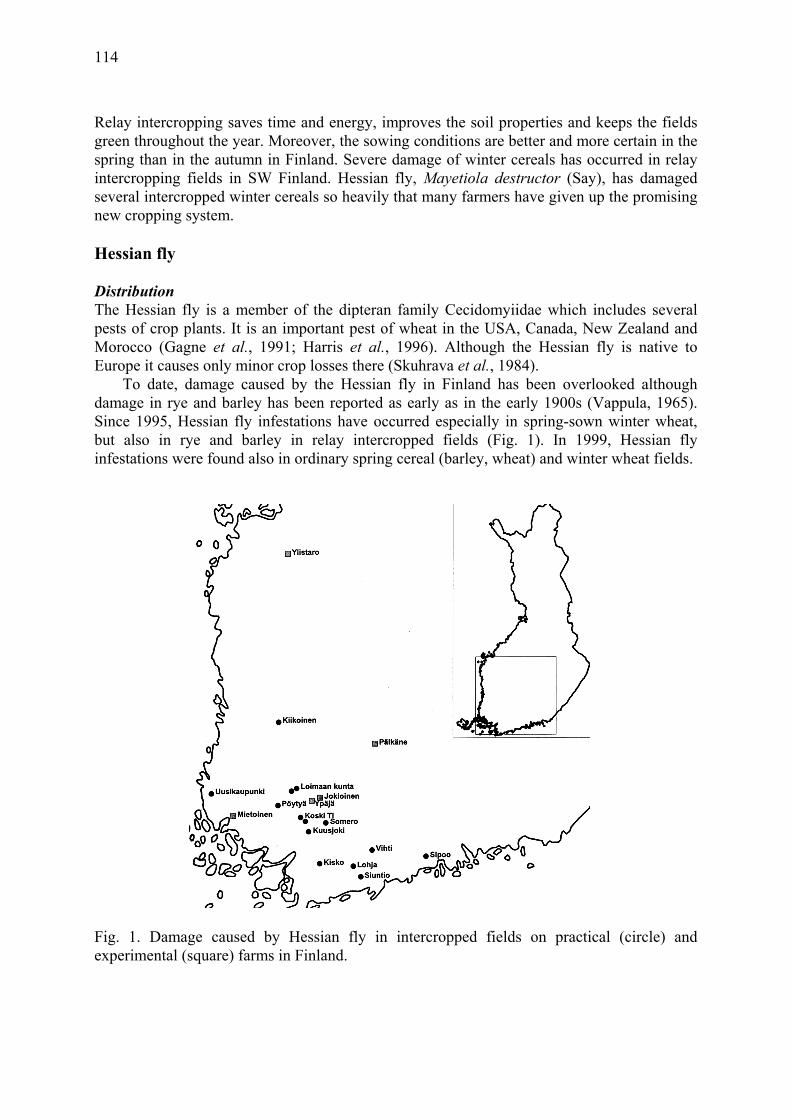
114
Relay intercropping saves time and energy, improves the soil properties and keeps the fields green throughout the year. Moreover, the sowing conditions are better and more certain in the spring than in the autumn in Finland. Severe damage of winter cereals has occurred in relay intercropping fields in SW Finland. Hessian fly, Mayetiola destructor (Say), has damaged several intercropped winter cereals so heavily that many farmers have given up the promising new cropping system. Hessian fly Distribution The Hessian fly is a member of the dipteran family Cecidomyiidae which includes several pests of crop plants. It is an important pest of wheat in the USA, Canada, New Zealand and Morocco (Gagne et al., 1991; Harris et al., 1996). Although the Hessian fly is native to Europe it causes only minor crop losses there (Skuhrava et al., 1984).
To date, damage caused by the Hessian fly in Finland has been overlooked although damage in rye and barley has been reported as early as in the early 1900s (Vappula, 1965). Since 1995, Hessian fly infestations have occurred especially in spring-sown winter wheat, but also in rye and barley in relay intercropped fields (Fig. 1). In 1999, Hessian fly infestations were found also in ordinary spring cereal (barley, wheat) and winter wheat fields.
Fig. 1. Damage caused by Hessian fly in intercropped fields on practical (circle) and experimental (square) farms in Finland.
115
Life cycle Adult Hessian flies resemble small mosquitoes. They are weak fliers and only live for about three days. Soon after mating the female deposits reddish 0.4-0.5-mm-long eggs on the upper surface of leaves of host plants. The eggs hatch in 3-10 days, depending on the temperature. The first-stage larvae, which are first reddish but soon become white, move down to the base of the leaf. The two later larval stages are immobile and they feed on plant juice, burrowing between the leaf sheath and the stem. A puparium or ‘flaxseed’ develops after two to four weeks. The Hessian fly overwinters as larvae or pupae inside the puparium.
The Hessian fly may have from one to six (basically two) generations per year (Barnes, 1956). The number of generations depends on the temperature, moisture and food plants available (Barnes, 1956). Especially the length of the pupal stage varies and, therefore, brood may be a better term than generation (Buntin & Chapin, 1990). In practice, there are several overlapping broods per year; all life stages can be found simultaneously in the summertime in Finland.
Damage Wheat and barley are favourite hosts of the Hessian fly, but it can feed on rye, triticale and many other grasses, e.g. Agropyron spp., Elymus spp. and Phleum spp., as well (Jones, 1939; Barnes 1956; Johnson et al., 1987). Oats seems to be resistant to Hessian fly (Morrill, 1982). The injury is caused by the larvae which feed near the base of the plant. Because Hessian fly is a sapfeeder, larvae cause little apparent physical damage to the plant tissue. Hessian fly infestation causes crop losses in several ways: 1) by killing or severely stunting seedlings and tillers, 2) by breaking the stems of mature plants and 3) by reducing the grain size and number (Barnes, 1956). Damage is related to the degree of infestation and the growth stage of the host plant. In some cases, plant tillering may partly compensate for the damage caused by the Hessian fly even if the main stem was destroyed. Tillering response varies between wheat cultivars (Wellso & Hoxie, 1994).
Crop protection Crop protection recommendations are based on those applied in the USA where Hessian fly is one of the most destructive pests of wheat.
Resistant varieties In the USA, several resistant wheat varieties are being used to decrease the damage caused by the Hessian fly. A total 27 resistant genes have been found (Ratcliffe & Hatchett, 1997). Resistance is based on larval antibiosis, which means that larvae cannot live and develop in resistant plants and die in a few days. However, due to selective pressure, more virulent biotypes of Hessian fly, which are able to overcome plant resistance, are becoming common.
Fly-free sowing dates With late sowing of winter wheat, damage caused by the Hessian fly may be avoided (Buntin et al., 1990). The recommended fly-free sowing dates applied in the USA are based on rainfall and temperature conditions that are connected to the occurrence of Hessian fly adults.
Cultural practices The most important cultural controlling method of Hessian fly is crop rotation: continuous growing of wheat in the same field should be avoided. Moreover, deep ploughing and destruction of volunteer wheat and old crop residues are recommended.
116
Chemical control Use of insecticides is not recommended because it is not usually economically feasible. Sprays should be applied before peak egg deposition (Buntin & Hudson, 1991). If Hessian fly has infested a field, chemical control is not effective anymore. Larvae are not susceptible to systemic insecticides once they have moved to the leaf base. A single application of insecticide is usually not enough, and repeated applications are economically not feasible (Buntin & Hudson, 1991). If fly problems are perennial, prophylactic systemic granular insecticides (phorate, disulfoton, carbofuran) may be applied at planting (Morrill & Nelson, 1975; Buntin, 1992; Buntin et al., 1992).
Natural enemies Although over 40 parasitoid species have been found in the Hessian fly (MacFarlane, 1989), the control effect of natural enemies is questionable. Homoporus destructor (Say) (Hym.: Pteromalidae), Eupelmus allynii (French) (Hym.: Eupelmidae) and Platygaster hiemalis (Forbes) (Hym.: Platigasteridae) are the most common parasitic wasps of Hessian fly in the USA (Hill, 1953; Lidell et al., 1987). Usually, the natural enemies are not effective enough to prevent crop losses but they may reduce fly populations.
Crop protection problems in relay intercropping Relay intercropping of cereals favour the Hessian fly. Spring-sown winter cereals are more and longer susceptible to the Hessian fly attack because their growth is retarded. Hessian fly overwinter well in intercropped fields because no crop rotation or tillage is used every year. Eggs and pupa are not susceptible to insecticides. There are no distinct flying periods because of overlapping generations, which makes the control of flying or ovipositing adults difficult. In addition, it is nearly impossible to target pesticides to larvae inhabiting the base of under-sown winter cereals. Chemical control of Hessian fly was tried out on a farm in Kuusjokí in 1997. An intercropped (barley+winter wheat) field was sprayed with dimethoate and labda-cyhalothrin three times (13 June, 28 June and 18 July), but the number of Hessian fly pupae did not differ between the sprayed and the control field. The granular insecticides used in the USA are not available in Finland. The wheat varieties used in Finland are not known to be resistant to Hessian fly.
Hessian fly as a pest in relay intercropping – preliminary results Preliminary studies to optimise the relay intercropping system have been conducted at Agricultural Research Centre of Finland (MTT) since 1998. Different cover crops and winter cereals have been tested. Moreover, different seed rates have been compared to find out an optimal seed mixture.
Different ‘cover crops’ (barley, oats and oil-seed rape) and seed rates were tested in Ypäjä in 1998-1999 (Fig. 1). Although oil-seed rape and oats are resistant to Hessian fly, their use as ‘cover crops’ did not prevent infestation of spring sown winter cereals by the Hessian fly.
Different winter cereals (wheat, rye, triticale) were compared in three locations (Mietoinen, Pälkäne and Ylistaro; see Fig. 1) in 1998-1999. The number of Hessian fly pupae was higher in spring-sown wheat and rye than in triticale in the autumn samples of Mietoinen. However, spring-sown triticale did not overwinter in any location. In the next spring, Hessian fly pupae were found in spring-sown winter wheat and rye but not in autumn-sown winter cereals. Unfortunately, yield results from the experiments are not yet available.
Important practical knowledge was acquired during the experiments. Perennial weeds should be avoided in relay intercropped field. Crop residues should be managed carefully
117
before they smother winter cereals. Finding combinations of crops and varieties suitable for certain conditions increases the chances of successful relay intercropping.
Sometimes, under favourable conditions, yields of winter cereals in relay intercropping have been fairly good in spite of the moderate numbers of Hessian flies. Nevertheless, relay intercropping cannot be recommended before damage caused by the Hessian fly to winter cereals can be prevented or decreased. An ecologically and economically feasible solution to the problem is not yet available. In future work, the susceptibility of different wheat and rye varieties practicable in Finland should be tested. Moreover, the importance of adjacent fields and uncultivated areas for the success and phenology of the Hessian fly in Finland should be studied.
References Andow, D.A. 1991: Vegetational diversity and arthropod population response. Annu. Rev.
Entomol. 36: 561-586. Barnes, H.F. 1956: Gall midges of economic importance: gall midges of cereal crops. Vol
VII. London; Grosby Lockwood and Son. 261 pp. Buntin, G.D. 1992: Assessment of a microtube injection system for applying systemic
insecticides at planting for Hessian fly control in winter wheat. Crop. Prot. 11: 366-370. Buntin, G.D & Chapin, J.W. 1990: Biology of Hessian fly (Diptera: Cecidomyiidae) in the
Southeastern United States: geographic variation and temperature-dependent phenology. J. Econ. Entomol. 83: 1015-1024.
Buntin, G.D. & Hudson, R.D. 1991: Spring control of the Hessian fly (Diptera: Cecido-myiidae) in winter wheat using insecticides. J. Econ. Entomol. 84: 1913-1919.
Buntin, G.D., Bruckner, P.L. & Johnson, J.W. 1990: Management of Hessian fly (Diptera: Cecidomyiidae) in Georgia by delayed planting of winter wheat. J. Econ. Entomol. 83: 1025-1033.
Buntin, G.D., Ott, S.L. & Johnson, J.W. 1992: Integration of plant resistance, insecticides, and planting date for management of the Hessian fly(Diptera: Cecidomyiidae) in winter wheat. J. Econ. Entomol. 85: 530-538.
Gagne, R.J., Hatchett, J.H., Lhaloui, S & EL Bouhssini, M. 1991: Hessian fly and Barley stem gall midge, two different species of Mayetiola (Diptera: Cecidomyiidae) in Morocco. Ann. Entomol. Soc. America 84: 436-443.
Harris, M.O., Dando, J.L., Griffin, W. & Madie, C. 1996: Susceptibility of cereal and non-cereal grasses to attack by Hessian fly (Mayetiola destructor). New Zealand J. Crop & Hortic. Sci. 24: 29-238.
Hill, C.C. 1953: Parasites of the Hessian fly in the North Central States. United States Department of Agriculture, Circular 923, 15 pp.
Johnson, J.W., Buntin, G.D., Foster, J.E., Roberts, J.J. & Raymer, P.L. 1987: Response of triticale to the Hessian fly (Diptera: Cecidomyiidae). J. Entomol. Sci. 22: 51-54.
Jones, E.T. 1939: Grasses of the tribe Hordeae as hosts of Hessian fly. J. Econ. Entomol. 32: 505-510.
Lidell, M.C., Schuster, M.F. & Turney, H.A. 1987: Biology and distribution of the Hessian fly and its parasitoids in Texas. Progress Report - Texas Agric. Exp. Station 4530, 7 pp.
MacFarlane, R.P. 1989: Mayetiola destructor (Say), Hessian fly (Diptera: Cecidomyiidae). Techn. Commun. Commonw. Inst. Biol. Control 10: 101-104.
Morrill, W.L. 1982: Hessian fly: host selection and behaviour during oviposition, winter biology, and parasitoids. J. Georgia Entomol. Soc. 17: 150-156.
118
Morrill, W.L. & Nelson, L.R. 1975: Hessian fly control with carbofuran. J. Econ. Entomol. 69: 123-124.
Ratcliffe, R.H. & Hatchett, J.H. 1997: Biology and genetics of the Hessian fly and resistance in wheat. In: New Development in Entomology. Bondari, K. (ed.). Research Signpost, Scientific Information Guild, Trivandrum, India: 47-56.
Skuhrava, M., Skuhravy, V. & Brewer, J.W. 1984: The distribution and long-term changes in population dynamics of gall midges on cereals in Europe. Cecidollogia Intern. 5: 1-7.
Vappula, N.A. 1965: Pests of cultivated plants in Finland. Acta Entomologia Fennica 19. Wellso, S.G. & Hoxie, R.P. 1994: Tillering response of ‘Monon’ and ‘Newton’ winter wheats
infested biotype L Hessian fly (Diptera: Cecidomyiidae) larvae. The Great Lakes Entomologist 24: 235-239.
Integrated Control in Cereal Crops IOBC wprs Bulletin 24 (6) 2001
pp. 119 - 127
119
Results of a nation-wide survey of spider assemblages in Hungarian cereal fields
Ferenc Samu 1, Ferenc Tóth 2, Csaba Szinetár 3, Géza Vörös 4 and Erika Botos 1 1 Plant Protection Institute, Hungarian Academy of Sciences, PO Box 102, Budapest,
H-1525 Hungary 2 Department of Plant Protection, Gödöllõ University of Agricultural Sciences, 1 Páter K. u.,
Gödöllõ, H-2103 Hungary 3 Department of Zoology, Berzsenyi College, PO Box 170 Szombathely, H-9701 Hungary 4 Plant Protection and Soil Conservation Station, Tolna County, Szekszárd, H-7100 Hungary
Summery Within the framework of a national survey on spider assemblages of agricultural areas, and co-operating with the research project "IPM of cereals", since 1992 the arachnofauna of cereals has been systematically investigated in Hungary. Samples by pitfall trapping and/or suction sampling took place at 16 different locations, representing five smaller regions of Hungary. As a result over 10,000 specimens, representing more than 150 species were caught. The present paper analyses the similarities and differences between the spider assemblages found in the various fields, regarding dominant species, diversity and community structure. Data analyses indicate, that cereal spider communities in Hungary are dominated by a well defined and limited set of species, which are more or less ubiquitous in every field. These most dominant and widespread agrobiont species are: Pardosa agrestis, Meioneta rurestris, Oedothorax apicatus, Pachygnatha degeeri, Tibellus oblongus. Apart from the agrobionts, cereal fields had a diverse spider community, reaching an estimated species richness of 110 species at several locations. Indicator species analysis showed, that for the cereal fields, as such, there were no strictly specific indicator spider species. Considering arable fields in general (i.e. cereals plus alfalfa) these habitats had few indicator species when compared to natural grassy habitats. These species are mostly native to wetland habitats. We propose that they could became widespread in agricultural habitats, because through dispersal and life history characteristics they became pre-adapted to the ephemeral conditions of agricultural fields.
Key words: spider, natural enemy, biological control, cereal, alfalfa, fauna origin, wetlands
Introduction Spiders are one of the most important predatory group of arthropods in cereal ecosystems (Nyffeler & Benz, 1987). There are a number of studies of the cereal arachnofauna in Western Europe and North America which revealed that this special and strongly human influenced vegetation type can accommodate a great diversity and density of spiders. Despite the potential of cereal fields to harbour a rich spider fauna, individual fields show great variation. In some fields the spiders were as diverse and abundant as in natural habitats (Toft, 1989), while from other fields impoverished and sparse spider communities were reported (Nyffeler et al., 1994).
In Hungary prior to the studies reported here, the cereal spider community had not been studied. To obtain basic information about the spider communities in Hungarian cereal fields, and other agricultural areas, several studies were conducted in parallel from the early 1990's
120
onwards. The present paper provides a meta-analysis of these studies, aiming at answering the questions:
1. Which are the dominant species of spiders in cereals? 2. Are dominant species the same across cereal spider communities; are there regional
differences present? 3. What are the structural characteristics of cereal spider communities; how similar are
cereal spider communities to other arable and comparable natural communities? 4. Which are the indicator species, that could signify the similarities or dissimilarities
between the cereal and other habitats examined?
Material and methods The present paper gathers data from several studies, which were part of two broad projects: "The survey of Hungarian agricultural spider fauna" (project leader: Plant Protection Institute, HAS), and "IPM of cereals" (project leader: Plant Protection Department of the Gödöllõ University). Within the framework of these projects cereal fields were sampled at 16 different locations, representing five smaller regions of Hungary. Investigations reported here took place between 1992 and 1998, each lasting between one to three years. We have included only those sites into the analysis, where in total more than 300 spider individuals were caught (Tab. 2).
Two standard collecting methods were applied in the studies. In four studies spiders were sampled by a hand-held suction sampler (Samu & Sárospataki, 1995), which proved to be very efficient in collecting spiders, although it is biased towards the juvenile stages and towards the foliage dwelling and/or web building species (Samu et al., 1997). At six study sites pitfall trapping was used to collect spiders; and there were only two sites where both methods were applied. Pitfalls tend more to collect adult specimens, and is biased towards to cursorial spider fauna (Topping & Sunderland, 1992). Details of the sampling protocols are given in Samu et al. (1996) and Tóth et al. (1999). Considering the above mentioned characteristics of the methods applied, they are more complemental than comparable. Therefore in the present meta-analysis of data from different studies all comparisons were made between data sets obtained by the same method.
Results and discussion Dominant species Spider assemblages in Hungarian cereal fields are characterised by a well defined and limited set of species. The most dominant, so called agrobiont species were ubiquitous in every field, corroborating results obtained in other European cereal fields (Luczak, 1975). The first five species which had the largest joint dominance considering all studies comprised over 3/4 of the total spider fauna in each of the fields (d-vac: 76.07%±5.500, pitfall: 77.97%±10.717, values are mean±S.D.). Species composition of agrobiont species are very similar across different sites as compared among data sets collected by similar methods (Tab. 1). In the present studies the average similarity was 70% for both methods. Combining both methods, it can be said that the most widely and abundantly occurring species in the Hungarian cereal fields are: P. agrestis, M. rurestris, O. apicatus, P. degeeri, and T. oblongus.
Considering the 10 most abundant species, regionality had no significant influence on spider species composition, i.e. more similar communities were not necessarily closer together in physical distance. (The association between species composition distances and
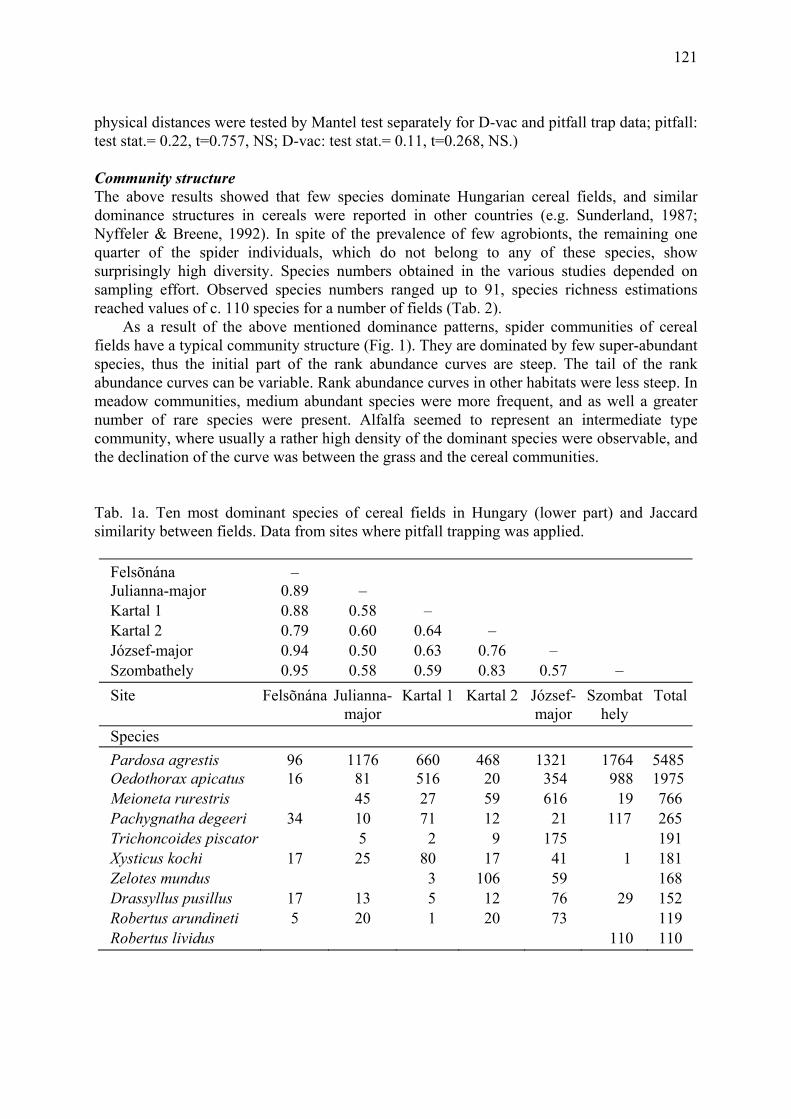
121
physical distances were tested by Mantel test separately for D-vac and pitfall trap data; pitfall: test stat.= 0.22, t=0.757, NS; D-vac: test stat.= 0.11, t=0.268, NS.)
Community structure The above results showed that few species dominate Hungarian cereal fields, and similar dominance structures in cereals were reported in other countries (e.g. Sunderland, 1987; Nyffeler & Breene, 1992). In spite of the prevalence of few agrobionts, the remaining one quarter of the spider individuals, which do not belong to any of these species, show surprisingly high diversity. Species numbers obtained in the various studies depended on sampling effort. Observed species numbers ranged up to 91, species richness estimations reached values of c. 110 species for a number of fields (Tab. 2).
As a result of the above mentioned dominance patterns, spider communities of cereal fields have a typical community structure (Fig. 1). They are dominated by few super-abundant species, thus the initial part of the rank abundance curves are steep. The tail of the rank abundance curves can be variable. Rank abundance curves in other habitats were less steep. In meadow communities, medium abundant species were more frequent, and as well a greater number of rare species were present. Alfalfa seemed to represent an intermediate type community, where usually a rather high density of the dominant species were observable, and the declination of the curve was between the grass and the cereal communities. Tab. 1a. Ten most dominant species of cereal fields in Hungary (lower part) and Jaccard similarity between fields. Data from sites where pitfall trapping was applied.
Felsõnána – Julianna-major 0.89 – Kartal 1 0.88 0.58 – Kartal 2 0.79 0.60 0.64 – József-major 0.94 0.50 0.63 0.76 – Szombathely 0.95 0.58 0.59 0.83 0.57 – Site Felsõnána Julianna-
major Kartal 1 Kartal 2 József-
major Szombat
hely Total
Species Pardosa agrestis 96 1176 660 468 1321 1764 5485 Oedothorax apicatus 16 81 516 20 354 988 1975 Meioneta rurestris 45 27 59 616 19 766 Pachygnatha degeeri 34 10 71 12 21 117 265 Trichoncoides piscator 5 2 9 175 191 Xysticus kochi 17 25 80 17 41 1 181 Zelotes mundus 3 106 59 168 Drassyllus pusillus 17 13 5 12 76 29 152 Robertus arundineti 5 20 1 20 73 119 Robertus lividus 110 110
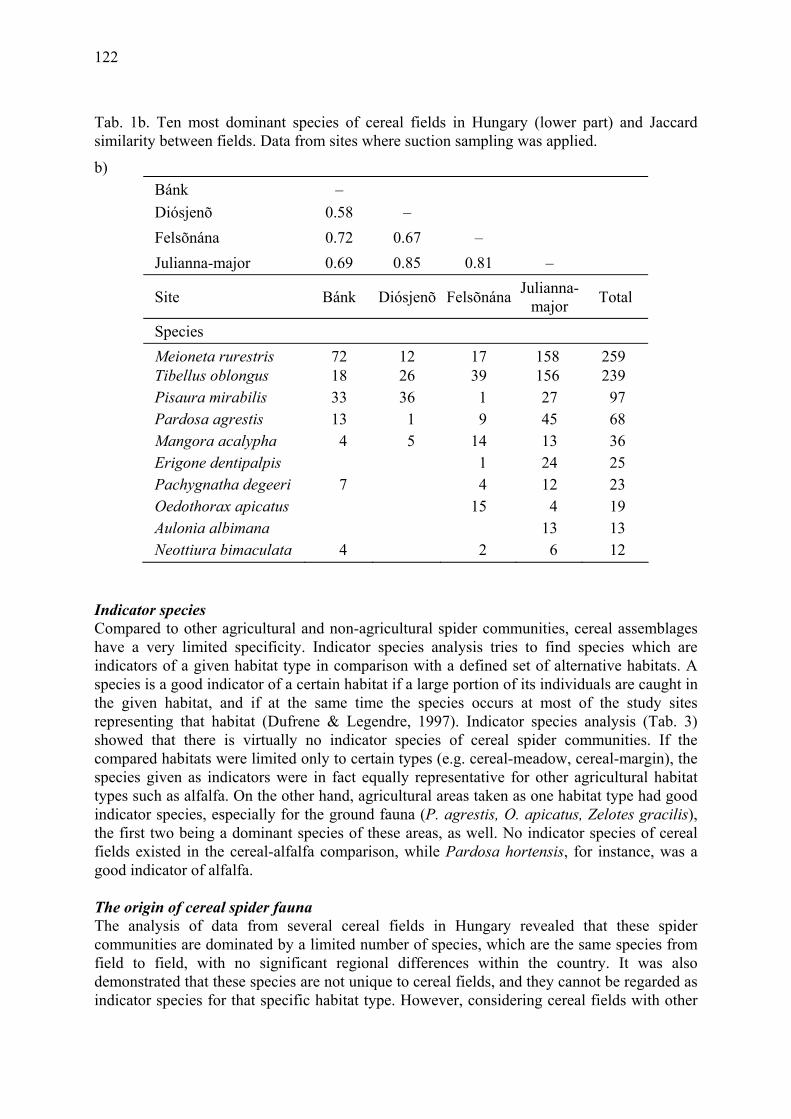
122
Tab. 1b. Ten most dominant species of cereal fields in Hungary (lower part) and Jaccard similarity between fields. Data from sites where suction sampling was applied.
b) Bánk – Diósjenõ 0.58 – Felsõnána 0.72 0.67 – Julianna-major 0.69 0.85 0.81 –
Site Bánk Diósjenõ Felsõnána Julianna-major Total
Species Meioneta rurestris 72 12 17 158 259 Tibellus oblongus 18 26 39 156 239 Pisaura mirabilis 33 36 1 27 97 Pardosa agrestis 13 1 9 45 68 Mangora acalypha 4 5 14 13 36 Erigone dentipalpis 1 24 25 Pachygnatha degeeri 7 4 12 23 Oedothorax apicatus 15 4 19 Aulonia albimana 13 13 Neottiura bimaculata 4 2 6 12
Indicator species Compared to other agricultural and non-agricultural spider communities, cereal assemblages have a very limited specificity. Indicator species analysis tries to find species which are indicators of a given habitat type in comparison with a defined set of alternative habitats. A species is a good indicator of a certain habitat if a large portion of its individuals are caught in the given habitat, and if at the same time the species occurs at most of the study sites representing that habitat (Dufrene & Legendre, 1997). Indicator species analysis (Tab. 3) showed that there is virtually no indicator species of cereal spider communities. If the compared habitats were limited only to certain types (e.g. cereal-meadow, cereal-margin), the species given as indicators were in fact equally representative for other agricultural habitat types such as alfalfa. On the other hand, agricultural areas taken as one habitat type had good indicator species, especially for the ground fauna (P. agrestis, O. apicatus, Zelotes gracilis), the first two being a dominant species of these areas, as well. No indicator species of cereal fields existed in the cereal-alfalfa comparison, while Pardosa hortensis, for instance, was a good indicator of alfalfa.
The origin of cereal spider fauna The analysis of data from several cereal fields in Hungary revealed that these spider communities are dominated by a limited number of species, which are the same species from field to field, with no significant regional differences within the country. It was also demonstrated that these species are not unique to cereal fields, and they cannot be regarded as indicator species for that specific habitat type. However, considering cereal fields with other
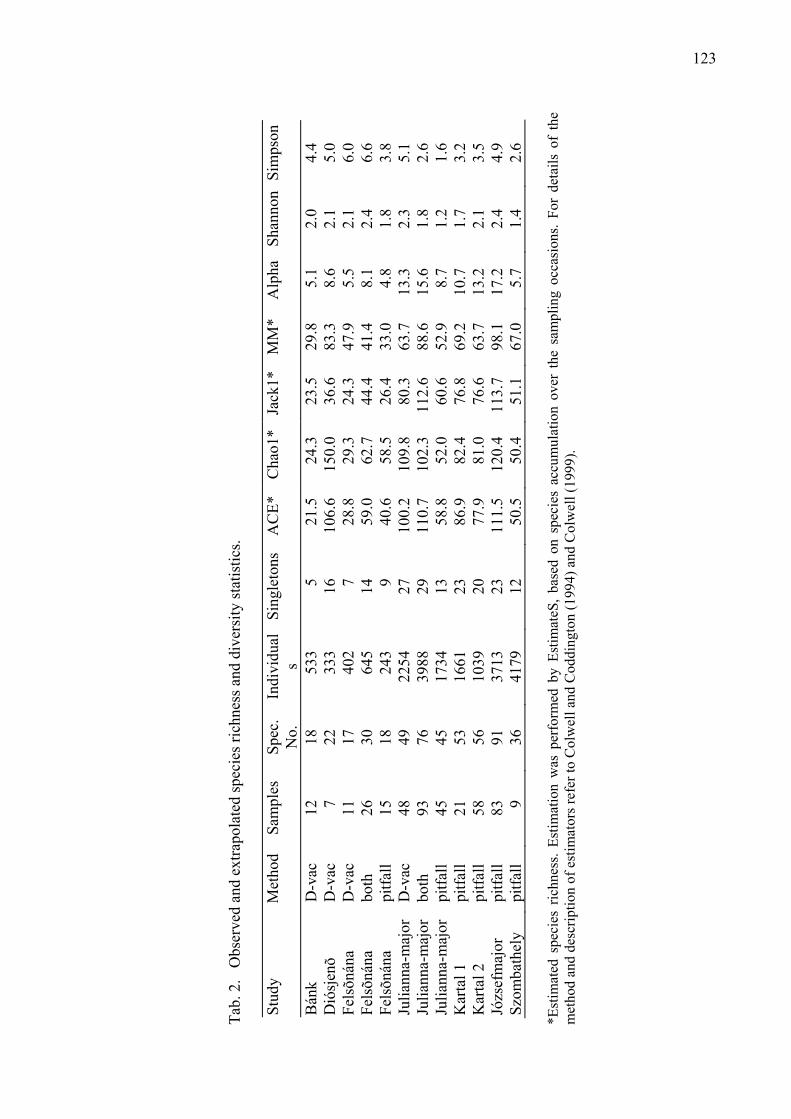
123
Tab.
2.
Obs
erve
d an
d ex
trapo
late
d sp
ecie
s ric
hnes
s and
div
ersi
ty st
atis
tics.
St
udy
Met
hod
Sam
ples
Sp
ec.
No.
In
divi
dual
s Si
ngle
tons
A
CE*
C
hao1
* Ja
ck1*
MM
* A
lpha
Sh
anno
nSi
mps
on
Bán
k D
-vac
12
18
5
33
5
21.
5 2
4.3
23.
5 29
.8
5.1
2.
0 4.
4 D
iósj
enõ
D-v
ac
7
22
333
16
10
6.6
150.
0 3
6.6
83.3
8
.6
2.1
5.0
Fels
õnán
a D
-vac
11
17
4
02
7
28.
8 2
9.3
24.
3 47
.9
5.5
2.
1 6.
0 Fe
lsõn
ána
both
26
30
6
45
14
59.
0 6
2.7
44.
4 41
.4
8.1
2.
4 6.
6 Fe
lsõn
ána
pitfa
ll 15
18
2
43
9
40.
6 5
8.5
26.
4 33
.0
4.8
1.
8 3.
8 Ju
liann
a-m
ajor
D-v
ac
48
49
2254
27
10
0.2
109.
8 8
0.3
63.7
13
.3
2.3
5.1
Julia
nna-
maj
orbo
th
93
76
3988
29
11
0.7
102.
3 11
2.6
88
.6
15.6
1.
8 2.
6 Ju
liann
a-m
ajor
pitfa
ll 45
45
17
34
13
58.
8 5
2.0
60.
6 52
.9
8.7
1.
2 1.
6 K
arta
l 1
pitfa
ll 21
53
16
61
23
86.
9 8
2.4
76.
8 69
.2
10.7
1.
7 3.
2 K
arta
l 2
pitfa
ll 58
56
10
39
20
77.
9 8
1.0
76.
6 63
.7
13.2
2.
1 3.
5 Jó
zsef
maj
or
pitfa
ll 83
91
37
13
23
111.
5 12
0.4
113.
7
98.1
17
.2
2.4
4.9
Szom
bath
ely
pitfa
ll 9
36
41
79
12
50.
5 5
0.4
51.
1 67
.0
5.7
1.
4 2.
6
*Est
imat
ed s
peci
es r
ichn
ess.
Estim
atio
n w
as p
erfo
rmed
by
Estim
ateS
, ba
sed
on s
peci
es a
ccum
ulat
ion
over
the
sam
plin
g oc
casi
ons.
For
deta
ils o
f th
e m
etho
d an
d de
scrip
tion
of e
stim
ator
s ref
er to
Col
wel
l and
Cod
ding
ton
(199
4) a
nd C
olw
ell (
1999
).
123
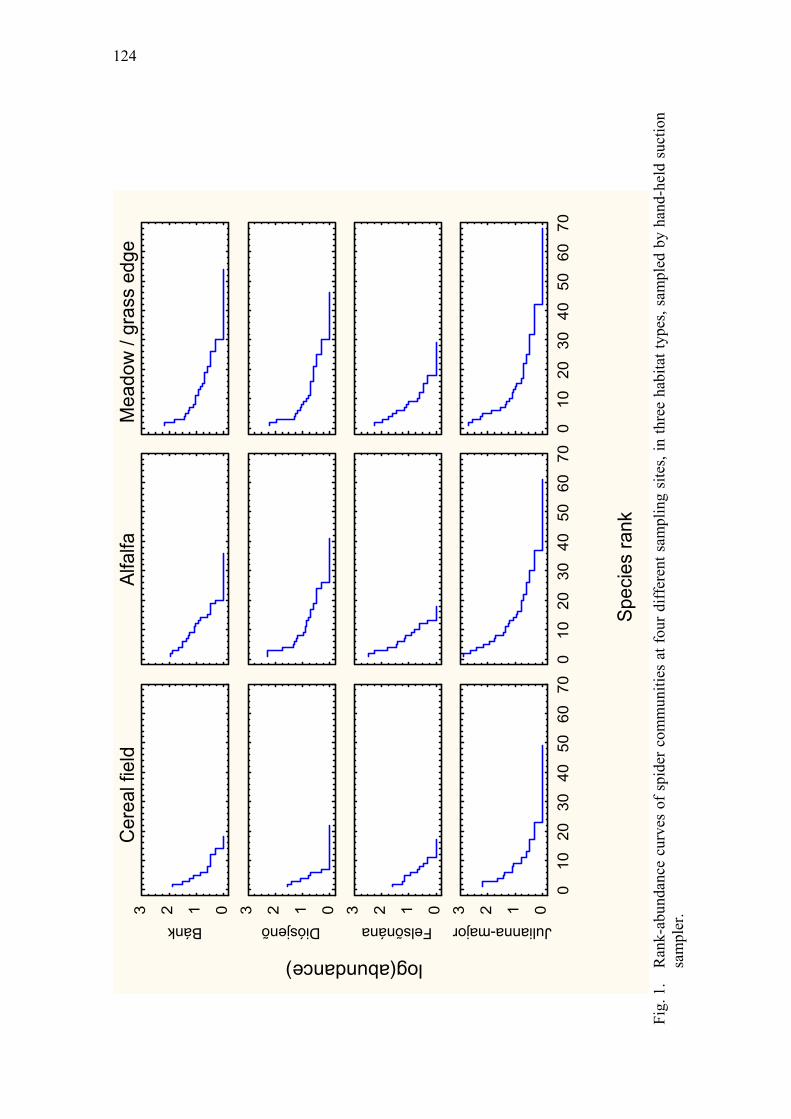
124
Spec
ies
rank
log(abundance)
Bánk
0123
Diósjenõ
0123
Felsõnána
0123
Julianna-major
0123
010
2030
4050
6070
0
1020
3040
5060
70
010
2030
4050
6070
Cer
eal f
ield
Mea
dow
/ gr
ass
edge
Alfa
lfa
Fi
g. 1
. R
ank-
abun
danc
e cu
rves
of s
pide
r com
mun
ities
at f
our d
iffer
ent s
ampl
ing
site
s, in
thre
e ha
bita
t typ
es, s
ampl
ed b
y ha
nd-h
eld
suct
ion
sam
pler
.
124
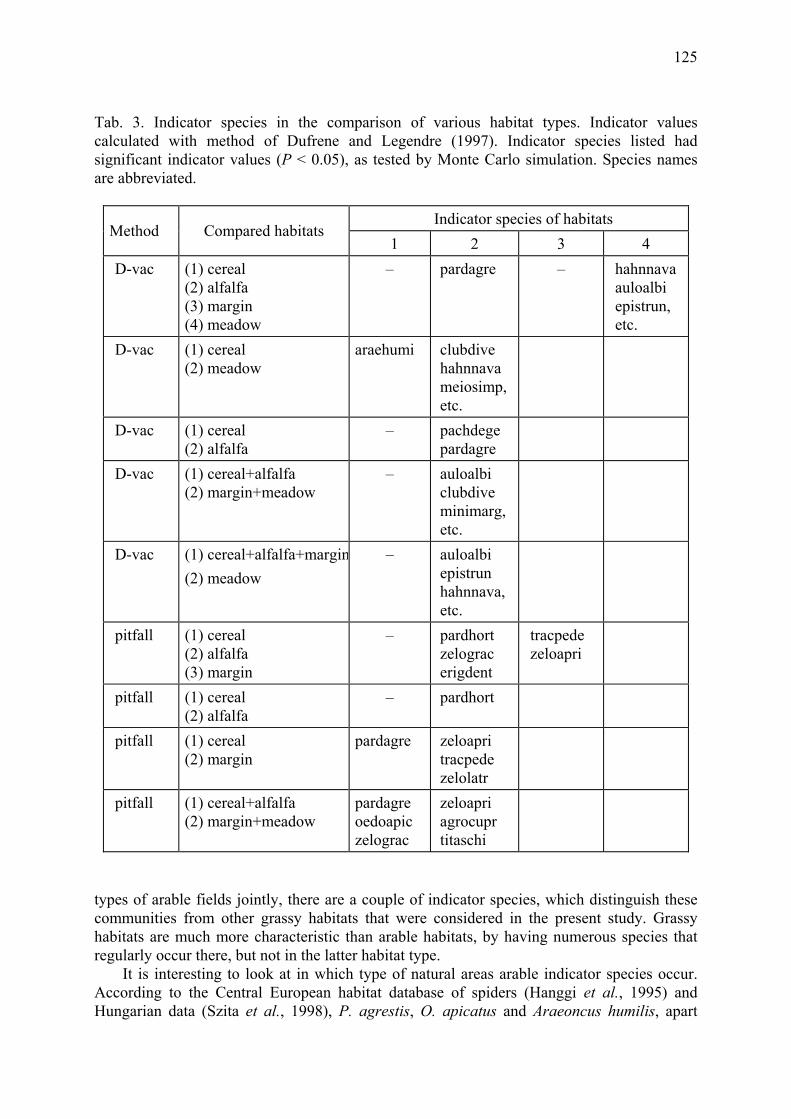
125
Tab. 3. Indicator species in the comparison of various habitat types. Indicator values calculated with method of Dufrene and Legendre (1997). Indicator species listed had significant indicator values (P < 0.05), as tested by Monte Carlo simulation. Species names are abbreviated.
Indicator species of habitats
Method Compared habitats 1 2 3 4
D-vac (1) cereal (2) alfalfa (3) margin (4) meadow
– pardagre – hahnnavaauloalbi epistrun, etc.
D-vac (1) cereal (2) meadow
araehumi clubdive hahnnava meiosimp, etc.
D-vac (1) cereal (2) alfalfa
– pachdege pardagre
D-vac (1) cereal+alfalfa (2) margin+meadow
– auloalbi clubdive minimarg, etc.
D-vac (1) cereal+alfalfa+margin(2) meadow
– auloalbi epistrun hahnnava, etc.
pitfall (1) cereal (2) alfalfa (3) margin
– pardhort zelograc erigdent
tracpede zeloapri
pitfall (1) cereal (2) alfalfa
– pardhort
pitfall (1) cereal (2) margin
pardagre zeloapri tracpede zelolatr
pitfall (1) cereal+alfalfa (2) margin+meadow
pardagre oedoapic zelograc
zeloapri agrocupr titaschi
types of arable fields jointly, there are a couple of indicator species, which distinguish these communities from other grassy habitats that were considered in the present study. Grassy habitats are much more characteristic than arable habitats, by having numerous species that regularly occur there, but not in the latter habitat type.
It is interesting to look at in which type of natural areas arable indicator species occur. According to the Central European habitat database of spiders (Hanggi et al., 1995) and Hungarian data (Szita et al., 1998), P. agrestis, O. apicatus and Araeoncus humilis, apart
126
from widely occurring in arable and similar human disturbed habitats, all native to wetland areas, such as saline grasslands, coastal sand dunes, beaches. These areas are characterised by frequent, regular perturbances of seasonal flooding, sand movement, tides, etc.
Marshall and Rypstra (1999) argues that one factor that determines which species can dominate structurally simple ecosystems, such as agricultural land or wetland areas, is strong interspecific competition. We think that, although intense competition may infrequently occur in those ecosystems, agricultural spider species are the likely losers in such situation. There is evidence that directly or indirectly supports that it is not superior competitive ability that makes these species dominant in agro-ecosystems. For instance, the most dominant agricultural species, P. agrestis, does not occur in more permanent grasslands, where more resources, but also more competitor species can be found (Szita et al., 1998). A subspecies of the same species, Pardosa agrestis purbeckensis, was experimentally shown to be inferior in interference competition with other wolf spiders in a salt marsh area (Schaefer, 1974). Other littoral Pardosa species similarly were shown to be inferior in competitive situations (Döbel et al., 1990).
Here we suggest that the similarity between wet land and agricultural ecosystems is more in structural similarity and perturbance pattern, which actually interrupts or resets competitive situations. Therefore the success of agricultural spider species should lie in their ability to cope with perturbance and find suitable niches under structurally simple conditions. Adaptations to these factors might lie in good dispersal ability (Bishop & Riechert, 1990) and life history characteristics (Toft, 1989; Samu et al., 1998). Attempts to augment spider densities in cereals should consider these characteristics, and devise agricultural practices with the structural needs, dispersal modes and life cycle patterns of spiders in mind.
Acknowledgements The study was supported by OTKA grants F 17691 and 23627. FS was funded by a research grant from the Ecological Centre of HAS. FS and CsSz were Bolyai Fellows of HAS.
References Bishop, L. & Riechert, S.E. 1990: Spider colonization of agroecosystems mode and source.
Env. Entomol. 19: 1738-1745. Döbel, H.G., Denno, R.F. & Coddington, J.A. 1990: Spider (Araneae) community structure in
an intertidal salt marsh: effects of vegetation structure and tidal flooding. Env. Entomol. 90: 1356-1370.
Dufrene, M. & Legendre, P. 1997: Species assemblages and indicator species: the need for a flexible asymmetrical approach. Ecol. Monogr. 67: 345-366.
Hänggi, A., Stöckli, E. & Nentwig, W. 1995: Habitats of Central European spiders. Misc. Faun. Helvet. 4: 1-460.
Luczak, J. 1975: Spider communities of crop fields. Pol. Ecol. Stud. 1: 93-110. Marshall, S.D. & Rypstra, A.L. 1999. Spider competition in structurally simple ecosystems. J.
Arachnol. 27: 343-350. Nyffeler, M. & Benz, G. 1987: Spiders in natural pest control: a review. J. Appl. Entomol.
103: 321-339. Nyffeler, M. & Breene, R.G. 1992: Dominant insectivorous polyphagous predators in winter
wheat: high colonisation power, spatial dispersion patterns, and probable importance of the soil surface spiders. Dtsch. Ent. Z., N. F. 39: 177-188.
127
Nyffeler, M., Sterling, W.L. & Dean, D.A. 1994: Insectivorous activities of spiders in United States field crops. J. Appl. Entomol. 118: 113-128.
Samu, F., Németh, J. & Kiss, B. 1997: Assessment of the efficiency of a hand-held suction device for sampling spiders: improved density estimation or oversampling? Ann. Appl. Biol. 130: 371-378.
Samu, F., Németh, J., Tóth, F., Szita, É., Kiss, B. & Szinetár, C. 1998: Are two cohorts responsible for bimodal life history pattern in the wolf spider Pardosa agrestis in Hungary? Proceedings 17th European Colloquium of Arachnology, Edinburgh: 215-221.
Samu, F. & Sárospataki, M. 1995: Design and use of a hand-hold suction sampler and its comparison with sweep net and pitfall trap sampling. Fol. Entomol. Hung. 56: 195-203.
Samu, F., Vörös, G. & Botos, E. 1996: Diversity and community structure of spiders of alfalfa fields and grassy field margins in South Hungary. Acta Phytopath. Entomol. Hung. 31: 253-266.
Schaefer, M. 1974: Experimentelle Untersuchungen zur Bedeutung der interspezifischen Konkurrenz bei 3 Wolfspinnen-Arten (Araneida: Lycosidae) einer Salzwiese. Zool. Jb. Syst. 101: 213-235.
Sunderland, K.D. 1987: Spiders and cereal aphids in Europe. Bull. SROP/WPRS 10: 82-102. Szita, É., Samu, F., Bleicher, K. & Botos, E. 1998. Data to the spider fauna (Araneae) of
Körös-Maros National Park (Hungary). Acta Phytopath. Entomol. Hung. 33: 341-388. Toft, S. 1989: Aspects of the ground-living spider fauna of two barley fields in Denmark:
species richness and phenological synchronization. Entomol. Meddl. 57: 157-168. Topping, C.J. & Sunderland, K.D. 1992: Limitations to the use of pitfall traps in ecological
studies, exemplified by a study of spiders in a field of winter wheat. J. Appl. Ecol. 29: 485-491.
Tóth, F. 1999: Comparative analyses of epigeic spider assemblages in Northern Hungarian Winter wheat fields and their adjacent margins. J. Arachnol. 27: 241-248.

128
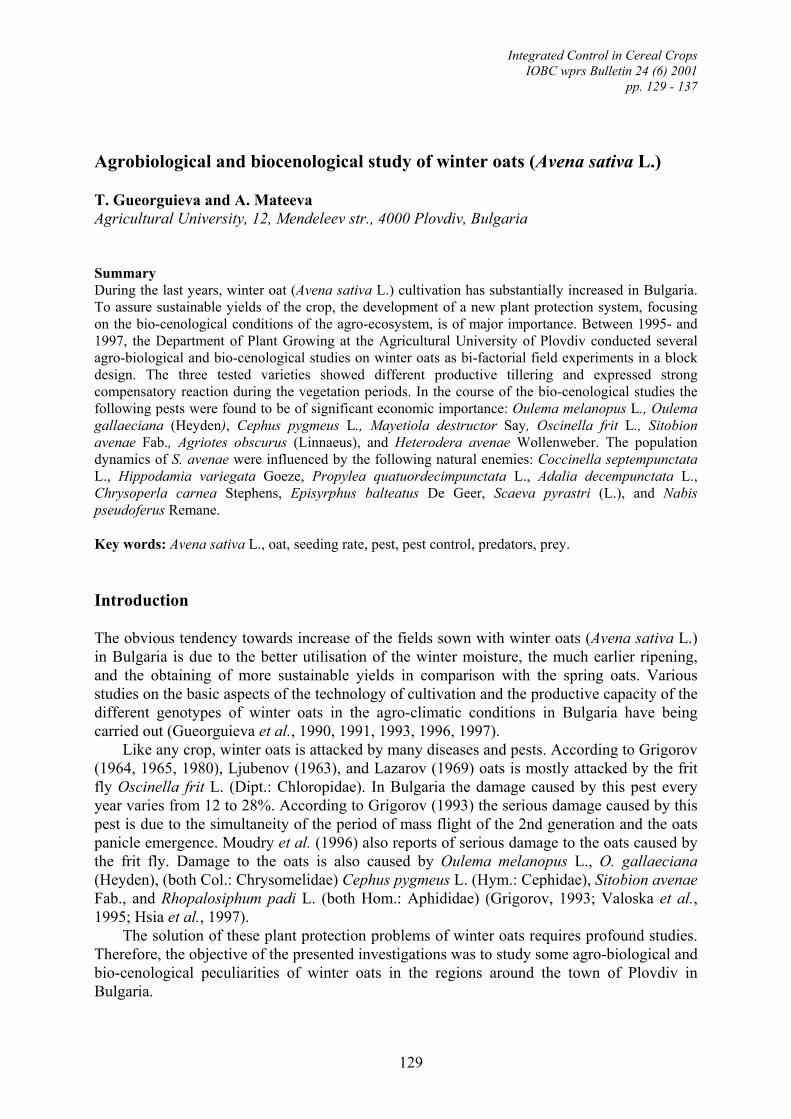
Integrated Control in Cereal Crops IOBC wprs Bulletin 24 (6) 2001
pp. 129 - 137
129
Agrobiological and biocenological study of winter oats (Avena sativa L.) T. Gueorguieva and A. Mateeva Agricultural University, 12, Mendeleev str., 4000 Plovdiv, Bulgaria
Summary During the last years, winter oat (Avena sativa L.) cultivation has substantially increased in Bulgaria. To assure sustainable yields of the crop, the development of a new plant protection system, focusing on the bio-cenological conditions of the agro-ecosystem, is of major importance. Between 1995- and 1997, the Department of Plant Growing at the Agricultural University of Plovdiv conducted several agro-biological and bio-cenological studies on winter oats as bi-factorial field experiments in a block design. The three tested varieties showed different productive tillering and expressed strong compensatory reaction during the vegetation periods. In the course of the bio-cenological studies the following pests were found to be of significant economic importance: Oulema melanopus L., Oulema gallaeciana (Heyden), Cephus pygmeus L., Mayetiola destructor Say, Oscinella frit L., Sitobion avenae Fab., Agriotes obscurus (Linnaeus), and Heterodera avenae Wollenweber. The population dynamics of S. avenae were influenced by the following natural enemies: Coccinella septempunctata L., Hippodamia variegata Goeze, Propylea quatuordecimpunctata L., Adalia decempunctata L., Chrysoperla carnea Stephens, Episyrphus balteatus De Geer, Scaeva pyrastri (L.), and Nabis pseudoferus Remane.
Key words: Avena sativa L., oat, seeding rate, pest, pest control, predators, prey.
Introduction The obvious tendency towards increase of the fields sown with winter oats (Avena sativa L.) in Bulgaria is due to the better utilisation of the winter moisture, the much earlier ripening, and the obtaining of more sustainable yields in comparison with the spring oats. Various studies on the basic aspects of the technology of cultivation and the productive capacity of the different genotypes of winter oats in the agro-climatic conditions in Bulgaria have being carried out (Gueorguieva et al., 1990, 1991, 1993, 1996, 1997).
Like any crop, winter oats is attacked by many diseases and pests. According to Grigorov (1964, 1965, 1980), Ljubenov (1963), and Lazarov (1969) oats is mostly attacked by the frit fly Oscinella frit L. (Dipt.: Chloropidae). In Bulgaria the damage caused by this pest every year varies from 12 to 28%. According to Grigorov (1993) the serious damage caused by this pest is due to the simultaneity of the period of mass flight of the 2nd generation and the oats panicle emergence. Moudry et al. (1996) also reports of serious damage to the oats caused by the frit fly. Damage to the oats is also caused by Oulema melanopus L., O. gallaeciana (Heyden), (both Col.: Chrysomelidae) Cephus pygmeus L. (Hym.: Cephidae), Sitobion avenae Fab., and Rhopalosiphum padi L. (both Hom.: Aphididae) (Grigorov, 1993; Valoska et al., 1995; Hsia et al., 1997).
The solution of these plant protection problems of winter oats requires profound studies. Therefore, the objective of the presented investigations was to study some agro-biological and bio-cenological peculiarities of winter oats in the regions around the town of Plovdiv in Bulgaria.
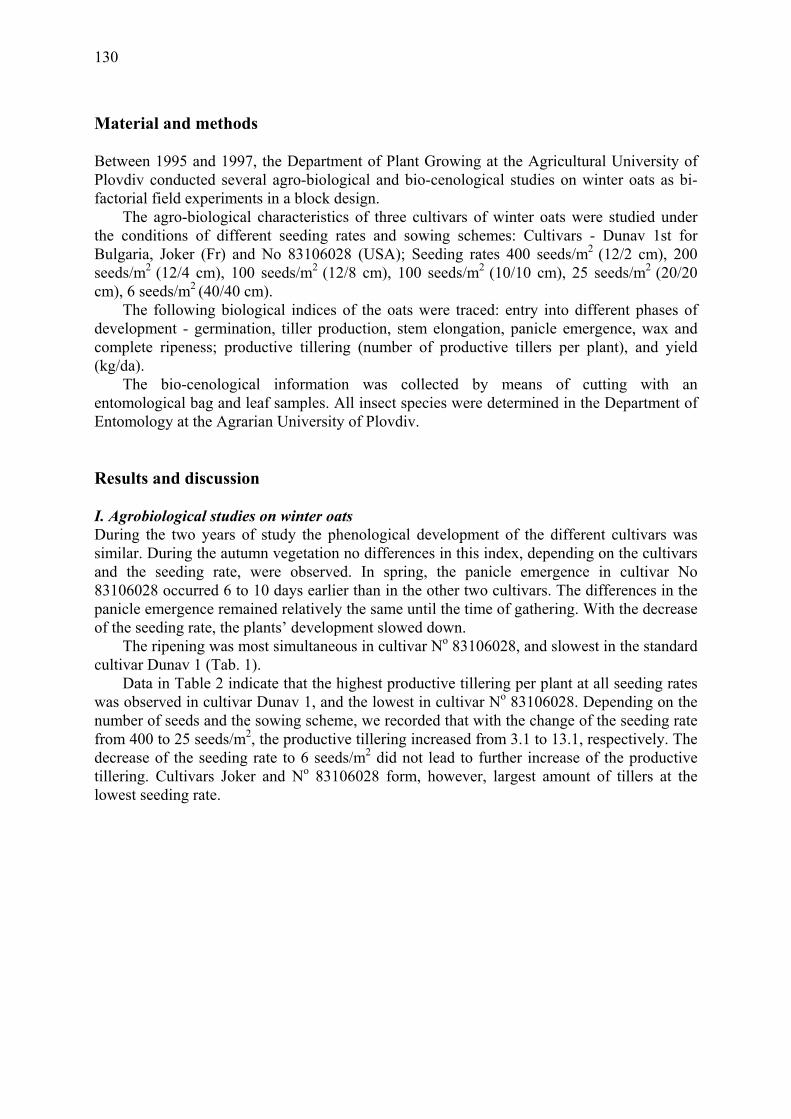
130
Material and methods Between 1995 and 1997, the Department of Plant Growing at the Agricultural University of Plovdiv conducted several agro-biological and bio-cenological studies on winter oats as bi-factorial field experiments in a block design.
The agro-biological characteristics of three cultivars of winter oats were studied under the conditions of different seeding rates and sowing schemes: Cultivars - Dunav 1st for Bulgaria, Joker (Fr) and No 83106028 (USA); Seeding rates 400 seeds/m2 (12/2 cm), 200 seeds/m2 (12/4 cm), 100 seeds/m2 (12/8 cm), 100 seeds/m2 (10/10 cm), 25 seeds/m2 (20/20 cm), 6 seeds/m2 (40/40 cm).
The following biological indices of the oats were traced: entry into different phases of development - germination, tiller production, stem elongation, panicle emergence, wax and complete ripeness; productive tillering (number of productive tillers per plant), and yield (kg/da).
The bio-cenological information was collected by means of cutting with an entomological bag and leaf samples. All insect species were determined in the Department of Entomology at the Agrarian University of Plovdiv.
Results and discussion I. Agrobiological studies on winter oats During the two years of study the phenological development of the different cultivars was similar. During the autumn vegetation no differences in this index, depending on the cultivars and the seeding rate, were observed. In spring, the panicle emergence in cultivar No 83106028 occurred 6 to 10 days earlier than in the other two cultivars. The differences in the panicle emergence remained relatively the same until the time of gathering. With the decrease of the seeding rate, the plants’ development slowed down.
The ripening was most simultaneous in cultivar No 83106028, and slowest in the standard cultivar Dunav 1 (Tab. 1).
Data in Table 2 indicate that the highest productive tillering per plant at all seeding rates was observed in cultivar Dunav 1, and the lowest in cultivar No 83106028. Depending on the number of seeds and the sowing scheme, we recorded that with the change of the seeding rate from 400 to 25 seeds/m2, the productive tillering increased from 3.1 to 13.1, respectively. The decrease of the seeding rate to 6 seeds/m2 did not lead to further increase of the productive tillering. Cultivars Joker and No 83106028 form, however, largest amount of tillers at the lowest seeding rate.
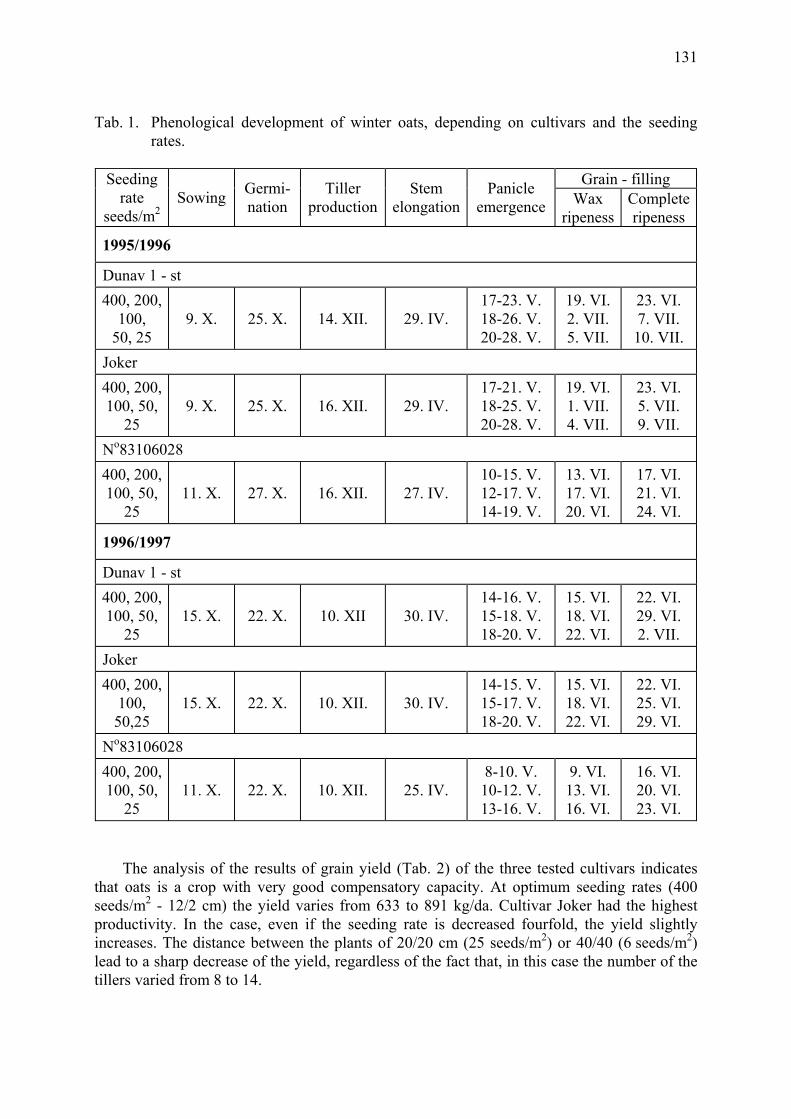
131
Tab. 1. Phenological development of winter oats, depending on cultivars and the seeding rates.
Grain - filling Seeding
rate seeds/m2
Sowing Germi-nation
Tiller production
Stem elongation
Panicle emergence Wax
ripeness Complete ripeness
1995/1996
Dunav 1 - st 400, 200,
100, 50, 25
9. X. 25. X. 14. XII. 29. IV. 17-23. V. 18-26. V. 20-28. V.
19. VI. 2. VII. 5. VII.
23. VI. 7. VII. 10. VII.
Joker 400, 200, 100, 50,
25 9. X. 25. X. 16. XII. 29. IV.
17-21. V. 18-25. V. 20-28. V.
19. VI. 1. VII. 4. VII.
23. VI. 5. VII. 9. VII.
No83106028 400, 200, 100, 50,
25 11. X. 27. X. 16. XII. 27. IV.
10-15. V. 12-17. V. 14-19. V.
13. VI. 17. VI. 20. VI.
17. VI. 21. VI. 24. VI.
1996/1997
Dunav 1 - st 400, 200, 100, 50,
25 15. X. 22. X. 10. XII 30. IV.
14-16. V. 15-18. V. 18-20. V.
15. VI. 18. VI. 22. VI.
22. VI. 29. VI. 2. VII.
Joker 400, 200,
100, 50,25
15. X. 22. X. 10. XII. 30. IV. 14-15. V. 15-17. V. 18-20. V.
15. VI. 18. VI. 22. VI.
22. VI. 25. VI. 29. VI.
No83106028 400, 200, 100, 50,
25 11. X. 22. X. 10. XII. 25. IV.
8-10. V. 10-12. V. 13-16. V.
9. VI. 13. VI. 16. VI.
16. VI. 20. VI. 23. VI.
The analysis of the results of grain yield (Tab. 2) of the three tested cultivars indicates
that oats is a crop with very good compensatory capacity. At optimum seeding rates (400 seeds/m2 - 12/2 cm) the yield varies from 633 to 891 kg/da. Cultivar Joker had the highest productivity. In the case, even if the seeding rate is decreased fourfold, the yield slightly increases. The distance between the plants of 20/20 cm (25 seeds/m2) or 40/40 (6 seeds/m2) lead to a sharp decrease of the yield, regardless of the fact that, in this case the number of the tillers varied from 8 to 14.
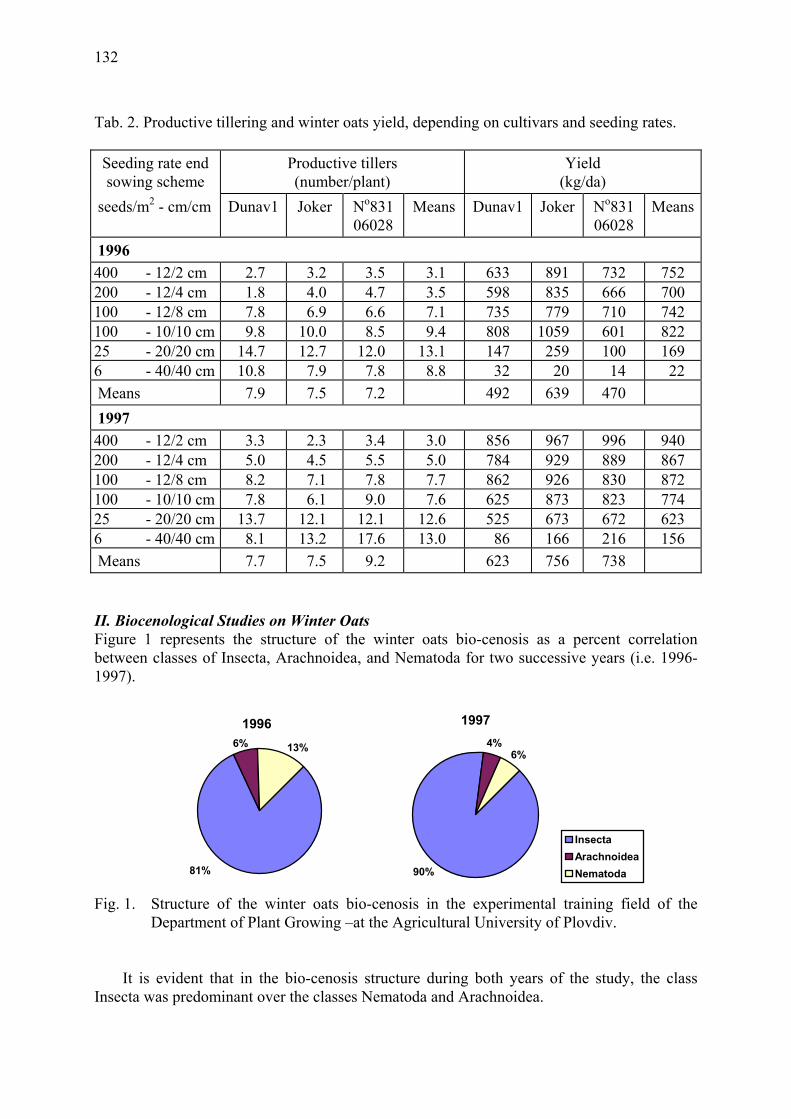
132
Tab. 2. Productive tillering and winter oats yield, depending on cultivars and seeding rates.
Seeding rate end sowing scheme
Productive tillers (number/plant)
Yield (kg/da)
seeds/m2 - cm/cm Dunav1 Joker No83106028
Means Dunav1 Joker No83106028
Means
1996 400 - 12/2 cm 2.7 3.2 3.5 3.1 633 891 732 752 200 - 12/4 cm 1.8 4.0 4.7 3.5 598 835 666 700 100 - 12/8 cm 7.8 6.9 6.6 7.1 735 779 710 742 100 - 10/10 cm 9.8 10.0 8.5 9.4 808 1059 601 822 25 - 20/20 cm 14.7 12.7 12.0 13.1 147 259 100 169 6 - 40/40 cm 10.8 7.9 7.8 8.8 32 20 14 22 Means 7.9 7.5 7.2 492 639 470 1997 400 - 12/2 cm 3.3 2.3 3.4 3.0 856 967 996 940 200 - 12/4 cm 5.0 4.5 5.5 5.0 784 929 889 867 100 - 12/8 cm 8.2 7.1 7.8 7.7 862 926 830 872 100 - 10/10 cm 7.8 6.1 9.0 7.6 625 873 823 774 25 - 20/20 cm 13.7 12.1 12.1 12.6 525 673 672 623 6 - 40/40 cm 8.1 13.2 17.6 13.0 86 166 216 156 Means 7.7 7.5 9.2 623 756 738
II. Biocenological Studies on Winter Oats Figure 1 represents the structure of the winter oats bio-cenosis as a percent correlation between classes of Insecta, Arachnoidea, and Nematoda for two successive years (i.e. 1996-1997).
1996
81%
13%6%
1997
90%
6%4%
InsectaArachnoideaNematoda
Fig. 1. Structure of the winter oats bio-cenosis in the experimental training field of the
Department of Plant Growing –at the Agricultural University of Plovdiv. It is evident that in the bio-cenosis structure during both years of the study, the class
Insecta was predominant over the classes Nematoda and Arachnoidea.
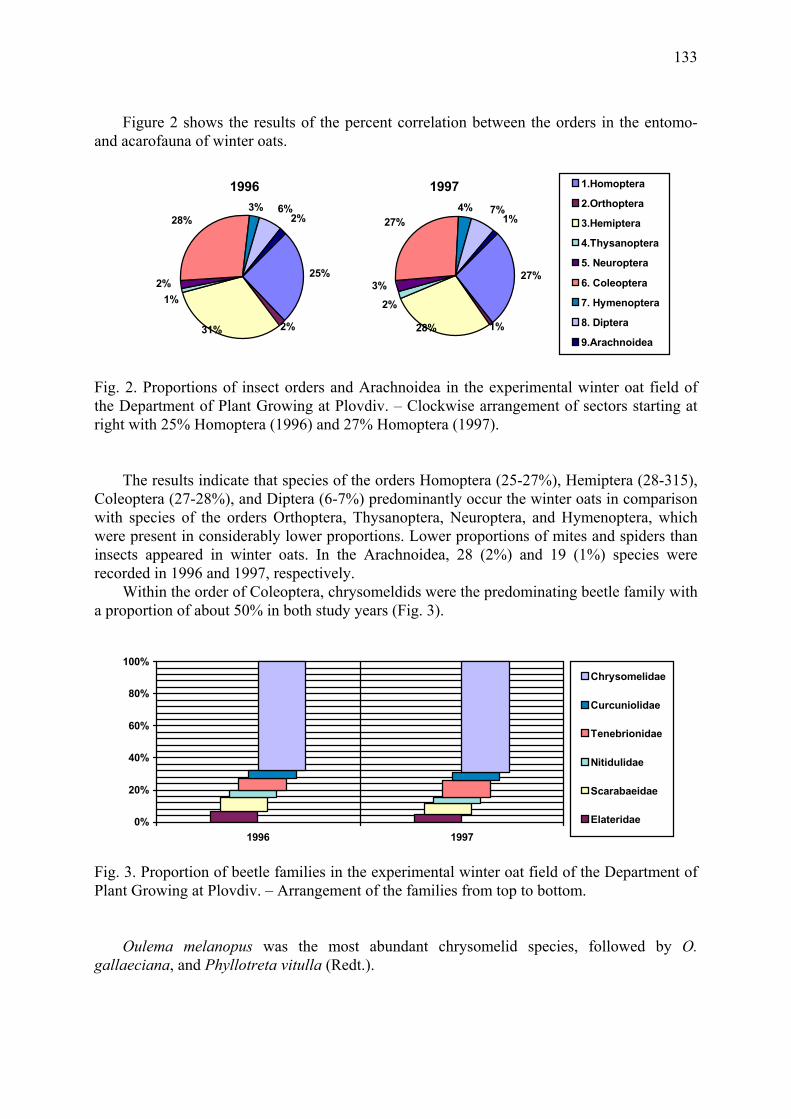
133
Figure 2 shows the results of the percent correlation between the orders in the entomo- and acarofauna of winter oats.
1996
28%6%
2%
2%31%
25%2%
1%
3%
1997
27%7%
1%4%
2%
3%27%
28% 1%
1.Homoptera
2.Orthoptera
3.Hemiptera
4.Thysanoptera
5. Neuroptera
6. Coleoptera
7. Hymenoptera
8. Diptera
9.Arachnoidea
Fig. 2. Proportions of insect orders and Arachnoidea in the experimental winter oat field of the Department of Plant Growing at Plovdiv. – Clockwise arrangement of sectors starting at right with 25% Homoptera (1996) and 27% Homoptera (1997).
The results indicate that species of the orders Homoptera (25-27%), Hemiptera (28-315),
Coleoptera (27-28%), and Diptera (6-7%) predominantly occur the winter oats in comparison with species of the orders Orthoptera, Thysanoptera, Neuroptera, and Hymenoptera, which were present in considerably lower proportions. Lower proportions of mites and spiders than insects appeared in winter oats. In the Arachnoidea, 28 (2%) and 19 (1%) species were recorded in 1996 and 1997, respectively.
Within the order of Coleoptera, chrysomeldids were the predominating beetle family with a proportion of about 50% in both study years (Fig. 3).
0%
20%
40%
60%
80%
100%
1996 1997
Chrysomelidae
Curcuniolidae
Tenebrionidae
Nitidulidae
Scarabaeidae
Elateridae
Fig. 3. Proportion of beetle families in the experimental winter oat field of the Department of Plant Growing at Plovdiv. – Arrangement of the families from top to bottom.
Oulema melanopus was the most abundant chrysomelid species, followed by O.
gallaeciana, and Phyllotreta vitulla (Redt.).
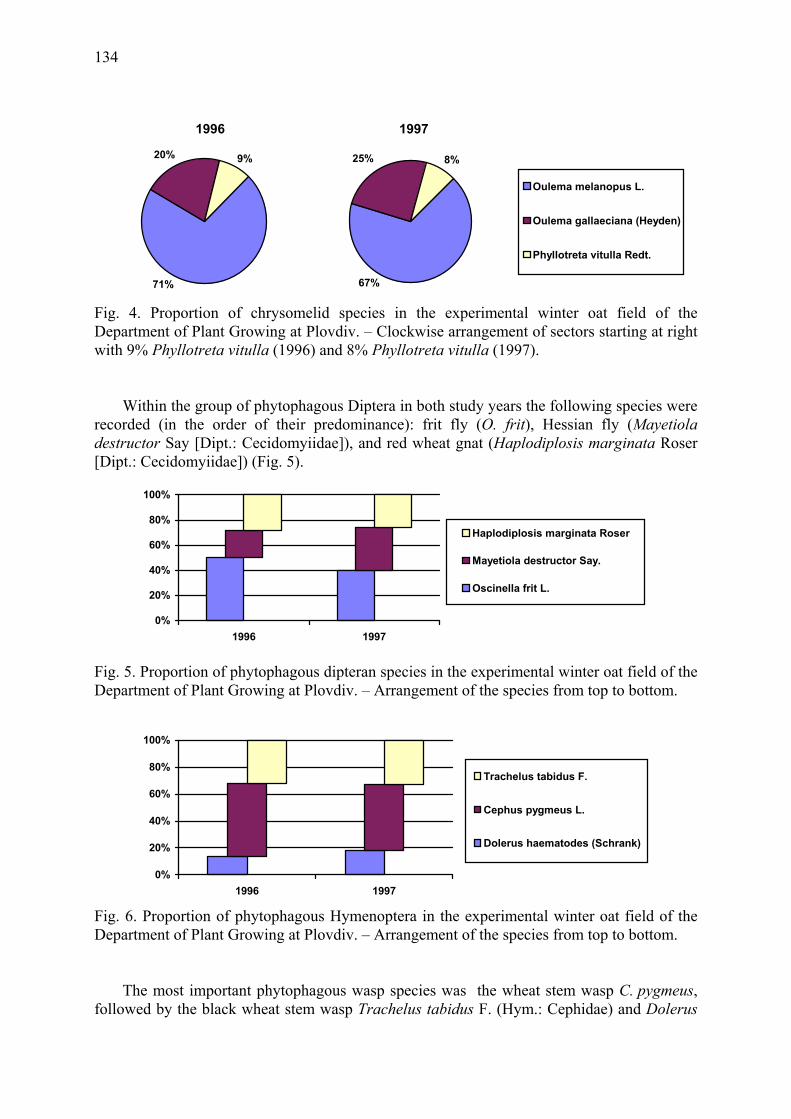
134
1996
20% 9%
71%
1997
67%
8%25%
Oulema melanopus L.
Oulema gallaeciana (Heyden)
Phyllotreta vitulla Redt.
Fig. 4. Proportion of chrysomelid species in the experimental winter oat field of the Department of Plant Growing at Plovdiv. – Clockwise arrangement of sectors starting at right with 9% Phyllotreta vitulla (1996) and 8% Phyllotreta vitulla (1997).
Within the group of phytophagous Diptera in both study years the following species were
recorded (in the order of their predominance): frit fly (O. frit), Hessian fly (Mayetiola destructor Say [Dipt.: Cecidomyiidae]), and red wheat gnat (Haplodiplosis marginata Roser [Dipt.: Cecidomyiidae]) (Fig. 5).
0%
20%
40%
60%
80%
100%
1996 1997
Haplodiplosis marginata Roser
Mayetiola destructor Say.
Oscinella frit L.
Fig. 5. Proportion of phytophagous dipteran species in the experimental winter oat field of the Department of Plant Growing at Plovdiv. – Arrangement of the species from top to bottom.
0%
20%
40%
60%
80%
100%
1996 1997
Trachelus tabidus F.
Cephus pygmeus L.
Dolerus haematodes (Schrank)
Fig. 6. Proportion of phytophagous Hymenoptera in the experimental winter oat field of the Department of Plant Growing at Plovdiv. – Arrangement of the species from top to bottom.
The most important phytophagous wasp species was the wheat stem wasp C. pygmeus,
followed by the black wheat stem wasp Trachelus tabidus F. (Hym.: Cephidae) and Dolerus
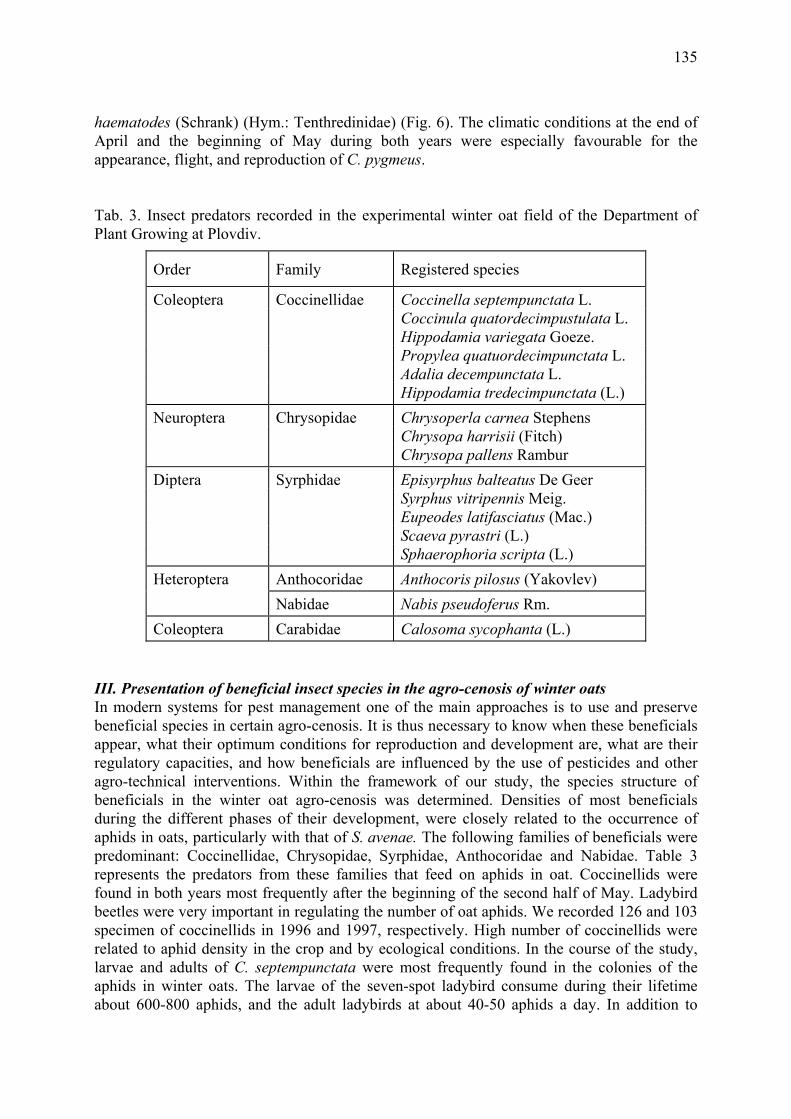
135
haematodes (Schrank) (Hym.: Tenthredinidae) (Fig. 6). The climatic conditions at the end of April and the beginning of May during both years were especially favourable for the appearance, flight, and reproduction of C. pygmeus.
Tab. 3. Insect predators recorded in the experimental winter oat field of the Department of Plant Growing at Plovdiv.
Order Family Registered species
Coleoptera Coccinellidae Coccinella septempunctata L. Coccinula quatordecimpustulata L. Hippodamia variegata Goeze. Propylea quatuordecimpunctata L. Adalia decempunctata L. Hippodamia tredecimpunctata (L.) Neuroptera Chrysopidae Chrysoperla carnea Stephens Chrysopa harrisii (Fitch) Chrysopa pallens Rambur Diptera Syrphidae Episyrphus balteatus De Geer Syrphus vitripennis Meig. Eupeodes latifasciatus (Mac.) Scaeva pyrastri (L.) Sphaerophoria scripta (L.) Heteroptera Anthocoridae Anthocoris pilosus (Yakovlev) Nabidae Nabis pseudoferus Rm. Coleoptera Carabidae Calosoma sycophanta (L.)
III. Presentation of beneficial insect species in the agro-cenosis of winter oats In modern systems for pest management one of the main approaches is to use and preserve beneficial species in certain agro-cenosis. It is thus necessary to know when these beneficials appear, what their optimum conditions for reproduction and development are, what are their regulatory capacities, and how beneficials are influenced by the use of pesticides and other agro-technical interventions. Within the framework of our study, the species structure of beneficials in the winter oat agro-cenosis was determined. Densities of most beneficials during the different phases of their development, were closely related to the occurrence of aphids in oats, particularly with that of S. avenae. The following families of beneficials were predominant: Coccinellidae, Chrysopidae, Syrphidae, Anthocoridae and Nabidae. Table 3 represents the predators from these families that feed on aphids in oat. Coccinellids were found in both years most frequently after the beginning of the second half of May. Ladybird beetles were very important in regulating the number of oat aphids. We recorded 126 and 103 specimen of coccinellids in 1996 and 1997, respectively. High number of coccinellids were related to aphid density in the crop and by ecological conditions. In the course of the study, larvae and adults of C. septempunctata were most frequently found in the colonies of the aphids in winter oats. The larvae of the seven-spot ladybird consume during their lifetime about 600-800 aphids, and the adult ladybirds at about 40-50 aphids a day. In addition to
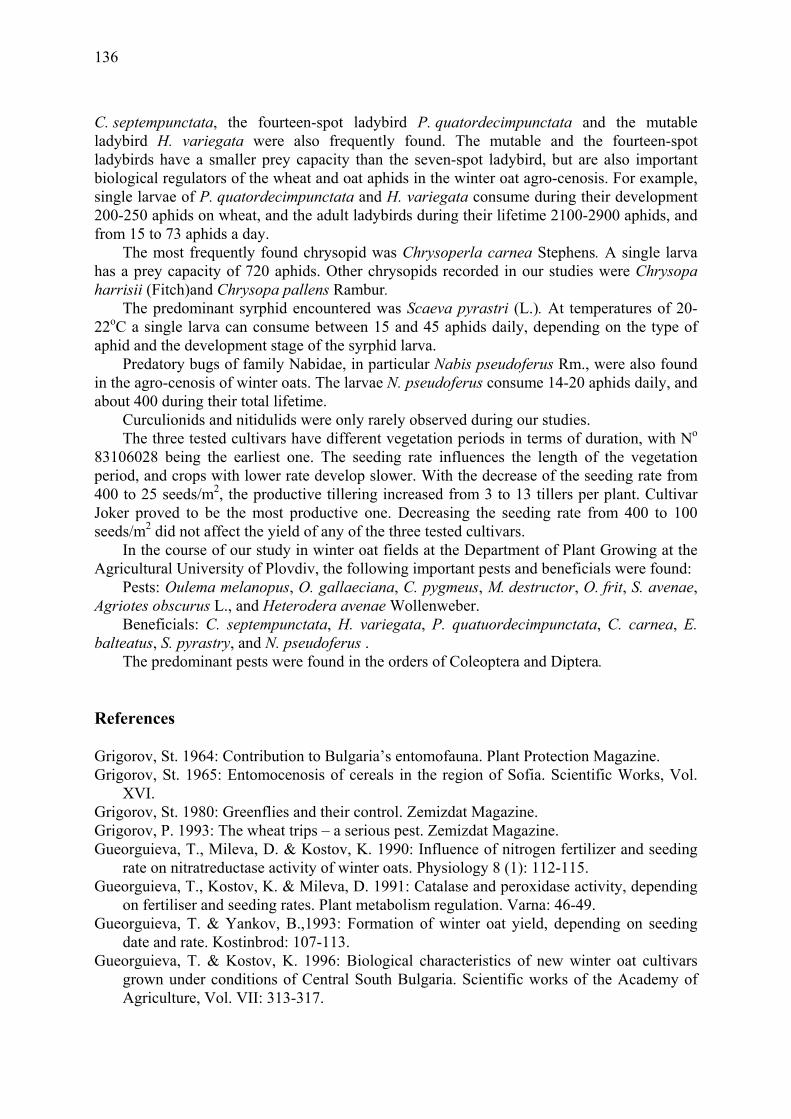
136
C. septempunctata, the fourteen-spot ladybird P. quatordecimpunctata and the mutable ladybird H. variegata were also frequently found. The mutable and the fourteen-spot ladybirds have a smaller prey capacity than the seven-spot ladybird, but are also important biological regulators of the wheat and oat aphids in the winter oat agro-cenosis. For example, single larvae of P. quatordecimpunctata and H. variegata consume during their development 200-250 aphids on wheat, and the adult ladybirds during their lifetime 2100-2900 aphids, and from 15 to 73 aphids a day.
The most frequently found chrysopid was Chrysoperla carnea Stephens. A single larva has a prey capacity of 720 aphids. Other chrysopids recorded in our studies were Chrysopa harrisii (Fitch)and Chrysopa pallens Rambur.
The predominant syrphid encountered was Scaeva pyrastri (L.). At temperatures of 20-22oC a single larva can consume between 15 and 45 aphids daily, depending on the type of aphid and the development stage of the syrphid larva.
Predatory bugs of family Nabidae, in particular Nabis pseudoferus Rm., were also found in the agro-cenosis of winter oats. The larvae N. pseudoferus consume 14-20 aphids daily, and about 400 during their total lifetime.
Curculionids and nitidulids were only rarely observed during our studies. The three tested cultivars have different vegetation periods in terms of duration, with No
83106028 being the earliest one. The seeding rate influences the length of the vegetation period, and crops with lower rate develop slower. With the decrease of the seeding rate from 400 to 25 seeds/m2, the productive tillering increased from 3 to 13 tillers per plant. Cultivar Joker proved to be the most productive one. Decreasing the seeding rate from 400 to 100 seeds/m2 did not affect the yield of any of the three tested cultivars.
In the course of our study in winter oat fields at the Department of Plant Growing at the Agricultural University of Plovdiv, the following important pests and beneficials were found:
Pests: Oulema melanopus, O. gallaeciana, C. pygmeus, M. destructor, O. frit, S. avenae, Agriotes obscurus L., and Heterodera avenae Wollenweber.
Beneficials: C. septempunctata, H. variegata, P. quatuordecimpunctata, C. carnea, E. balteatus, S. pyrastry, and N. pseudoferus .
The predominant pests were found in the orders of Coleoptera and Diptera.
References Grigorov, St. 1964: Contribution to Bulgaria’s entomofauna. Plant Protection Magazine. Grigorov, St. 1965: Entomocenosis of cereals in the region of Sofia. Scientific Works, Vol.
XVI. Grigorov, St. 1980: Greenflies and their control. Zemizdat Magazine. Grigorov, P. 1993: The wheat trips – a serious pest. Zemizdat Magazine. Gueorguieva, T., Mileva, D. & Kostov, K. 1990: Influence of nitrogen fertilizer and seeding
rate on nitratreductase activity of winter oats. Physiology 8 (1): 112-115. Gueorguieva, T., Kostov, K. & Mileva, D. 1991: Catalase and peroxidase activity, depending
on fertiliser and seeding rates. Plant metabolism regulation. Varna: 46-49. Gueorguieva, T. & Yankov, B.,1993: Formation of winter oat yield, depending on seeding
date and rate. Kostinbrod: 107-113. Gueorguieva, T. & Kostov, K. 1996: Biological characteristics of new winter oat cultivars
grown under conditions of Central South Bulgaria. Scientific works of the Academy of Agriculture, Vol. VII: 313-317.
137
Gueorguieva, T. & Kostov, K. 1996: Economic characteristics of new winter oat cultivars grown under conditions of Central South Bulgaria. Scientific works of the Academy of Agriculture, Vol. VII: 318-321.
Gueorguieva, T.& Dimitrova, M. 1997: Economic characteristics of winter oat panicle according to the crop structure and the degree of tillering. Soil Science, Agrochemistry, and Ecology Magazine 32 (6): 61-63.
Gueorguieva, T., Mokreva, T. & Yanchev, I. 1997: Tillering as a factor of productivity formation in winter oats under conditions of reduced plant density. Scientific works of the Academy of Agriculture, Vol. 4 (1): 23-25.
Hsiao, W.F. & Khachtourian, G.G. 1997: Impact of cereal hosts on the susceptibility of Rhopalosiphum padi (Homoptera: Aphididae) to the entomopathogenic fungus. Verticillium lecanii. Plant Protection Bulletin Taipei 39 (4): 313-327.
Lazarov, A. 1969: The frit fly – Oscinosoma frit (Diptera) – as a pest on cereals in Bulgaria and the means for its control.
Ljubenov, Y. 1961: The wild cereal plants as a reserve and source of the frit fly reproduction. Agricultural Thought Magazine, Vol. 5.
Moudry, J., Vozenilkova, B. & Votavova, O., 1996: Damage to oats by frit fly (Oscinella frit L.): 71-80.
Valoska, B., Sadova, M.. & Liskova, M., 1995: Response of selected cereal cultivars to Heterodera avenae Woll. pathotype H 12. Slovac Republic: 215-218.

138
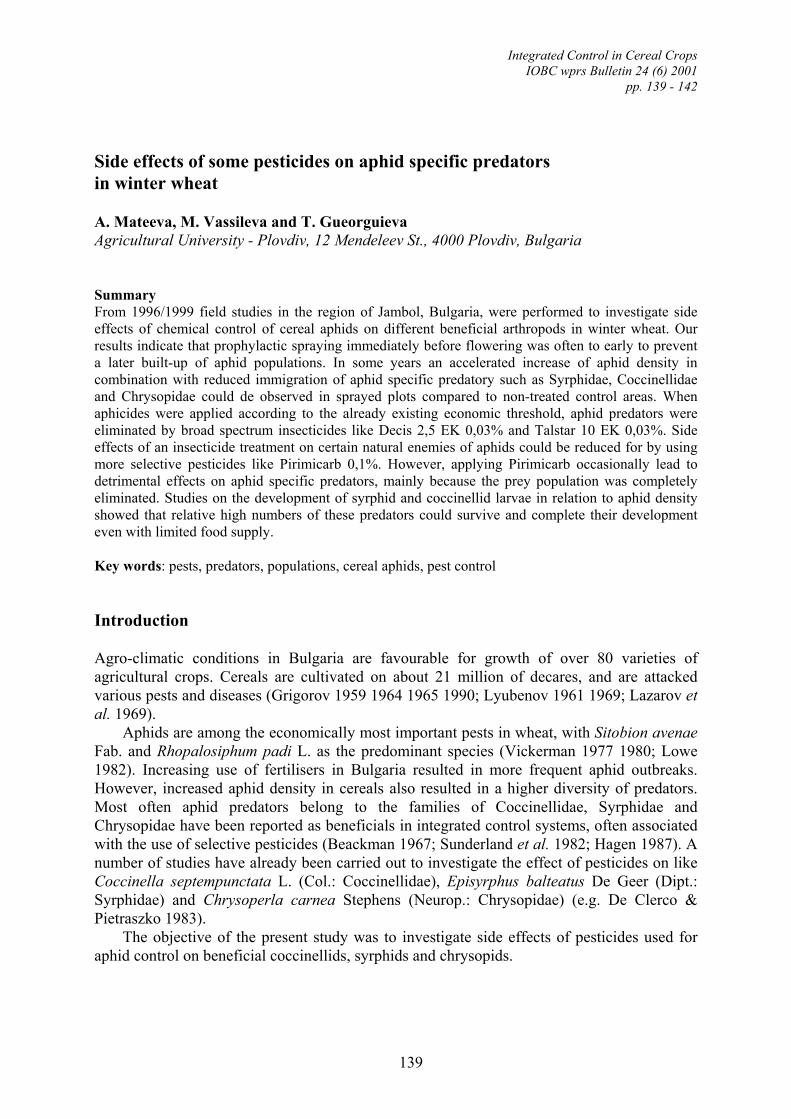
Integrated Control in Cereal Crops IOBC wprs Bulletin 24 (6) 2001
pp. 139 - 142
139
Side effects of some pesticides on aphid specific predators in winter wheat
A. Mateeva, M. Vassileva and T. Gueorguieva Agricultural University - Plovdiv, 12 Mendeleev St., 4000 Plovdiv, Bulgaria
Summary From 1996/1999 field studies in the region of Jambol, Bulgaria, were performed to investigate side effects of chemical control of cereal aphids on different beneficial arthropods in winter wheat. Our results indicate that prophylactic spraying immediately before flowering was often to early to prevent a later built-up of aphid populations. In some years an accelerated increase of aphid density in combination with reduced immigration of aphid specific predatory such as Syrphidae, Coccinellidae and Chrysopidae could de observed in sprayed plots compared to non-treated control areas. When aphicides were applied according to the already existing economic threshold, aphid predators were eliminated by broad spectrum insecticides like Decis 2,5 EK 0,03% and Talstar 10 EK 0,03%. Side effects of an insecticide treatment on certain natural enemies of aphids could be reduced for by using more selective pesticides like Pirimicarb 0,1%. However, applying Pirimicarb occasionally lead to detrimental effects on aphid specific predators, mainly because the prey population was completely eliminated. Studies on the development of syrphid and coccinellid larvae in relation to aphid density showed that relative high numbers of these predators could survive and complete their development even with limited food supply.
Key words: pests, predators, populations, cereal aphids, pest control
Introduction Agro-climatic conditions in Bulgaria are favourable for growth of over 80 varieties of agricultural crops. Cereals are cultivated on about 21 million of decares, and are attacked various pests and diseases (Grigorov 1959 1964 1965 1990; Lyubenov 1961 1969; Lazarov et al. 1969).
Aphids are among the economically most important pests in wheat, with Sitobion avenae Fab. and Rhopalosiphum padi L. as the predominant species (Vickerman 1977 1980; Lowe 1982). Increasing use of fertilisers in Bulgaria resulted in more frequent aphid outbreaks. However, increased aphid density in cereals also resulted in a higher diversity of predators. Most often aphid predators belong to the families of Coccinellidae, Syrphidae and Chrysopidae have been reported as beneficials in integrated control systems, often associated with the use of selective pesticides (Beackman 1967; Sunderland et al. 1982; Hagen 1987). A number of studies have already been carried out to investigate the effect of pesticides on like Coccinella septempunctata L. (Col.: Coccinellidae), Episyrphus balteatus De Geer (Dipt.: Syrphidae) and Chrysoperla carnea Stephens (Neurop.: Chrysopidae) (e.g. De Clerco & Pietraszko 1983).
The objective of the present study was to investigate side effects of pesticides used for aphid control on beneficial coccinellids, syrphids and chrysopids.
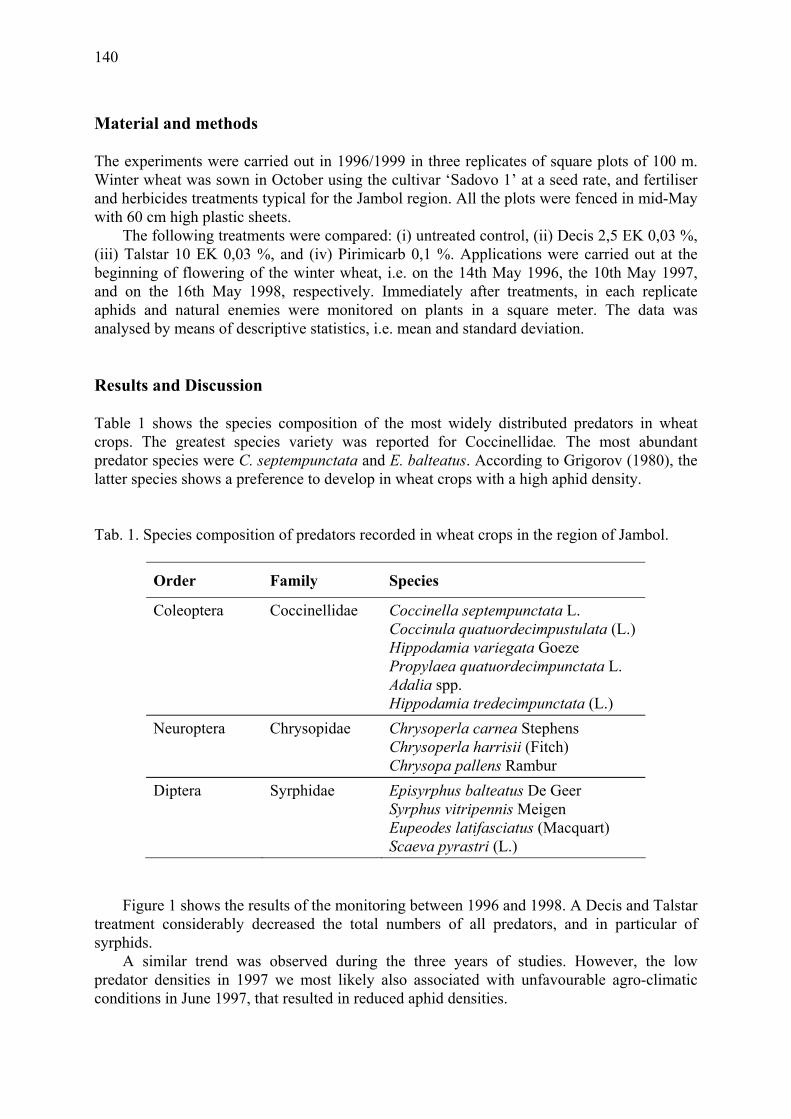
140
Material and methods The experiments were carried out in 1996/1999 in three replicates of square plots of 100 m. Winter wheat was sown in October using the cultivar ‘Sadovo 1’ at a seed rate, and fertiliser and herbicides treatments typical for the Jambol region. All the plots were fenced in mid-May with 60 cm high plastic sheets.
The following treatments were compared: (i) untreated control, (ii) Decis 2,5 EK 0,03 %, (iii) Talstar 10 EK 0,03 %, and (iv) Pirimicarb 0,1 %. Applications were carried out at the beginning of flowering of the winter wheat, i.e. on the 14th May 1996, the 10th May 1997, and on the 16th May 1998, respectively. Immediately after treatments, in each replicate aphids and natural enemies were monitored on plants in a square meter. The data was analysed by means of descriptive statistics, i.e. mean and standard deviation. Results and Discussion Table 1 shows the species composition of the most widely distributed predators in wheat crops. The greatest species variety was reported for Coccinellidae. The most abundant predator species were C. septempunctata and E. balteatus. According to Grigorov (1980), the latter species shows a preference to develop in wheat crops with a high aphid density.
Tab. 1. Species composition of predators recorded in wheat crops in the region of Jambol.
Order Family Species
Coleoptera Coccinellidae Coccinella septempunctata L. Coccinula quatuordecimpustulata (L.) Hippodamia variegata Goeze Propylaea quatuordecimpunctata L. Adalia spp. Hippodamia tredecimpunctata (L.) Neuroptera Chrysopidae Chrysoperla carnea Stephens Chrysoperla harrisii (Fitch) Chrysopa pallens Rambur Diptera Syrphidae Episyrphus balteatus De Geer Syrphus vitripennis Meigen Eupeodes latifasciatus (Macquart) Scaeva pyrastri (L.)
Figure 1 shows the results of the monitoring between 1996 and 1998. A Decis and Talstar
treatment considerably decreased the total numbers of all predators, and in particular of syrphids.
A similar trend was observed during the three years of studies. However, the low predator densities in 1997 we most likely also associated with unfavourable agro-climatic conditions in June 1997, that resulted in reduced aphid densities.
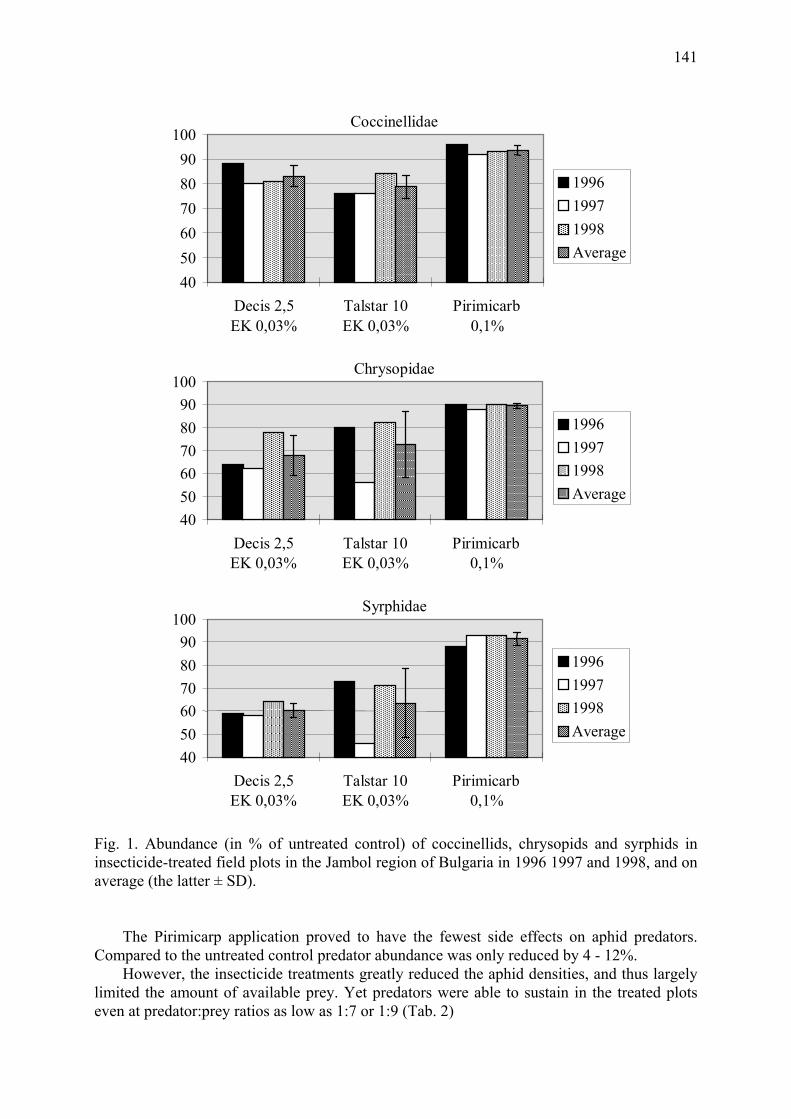
141
Coccinellidae
405060708090
100
Decis 2,5EK 0,03%
Talstar 10EK 0,03%
Pirimicarb0,1%
199619971998Average
Chrysopidae
405060708090
100
Decis 2,5EK 0,03%
Talstar 10EK 0,03%
Pirimicarb0,1%
199619971998Average
Syrphidae
405060708090
100
Decis 2,5EK 0,03%
Talstar 10EK 0,03%
Pirimicarb0,1%
199619971998Average
Fig. 1. Abundance (in % of untreated control) of coccinellids, chrysopids and syrphids in insecticide-treated field plots in the Jambol region of Bulgaria in 1996 1997 and 1998, and on average (the latter ± SD).
The Pirimicarp application proved to have the fewest side effects on aphid predators.
Compared to the untreated control predator abundance was only reduced by 4 - 12%. However, the insecticide treatments greatly reduced the aphid densities, and thus largely
limited the amount of available prey. Yet predators were able to sustain in the treated plots even at predator:prey ratios as low as 1:7 or 1:9 (Tab. 2)
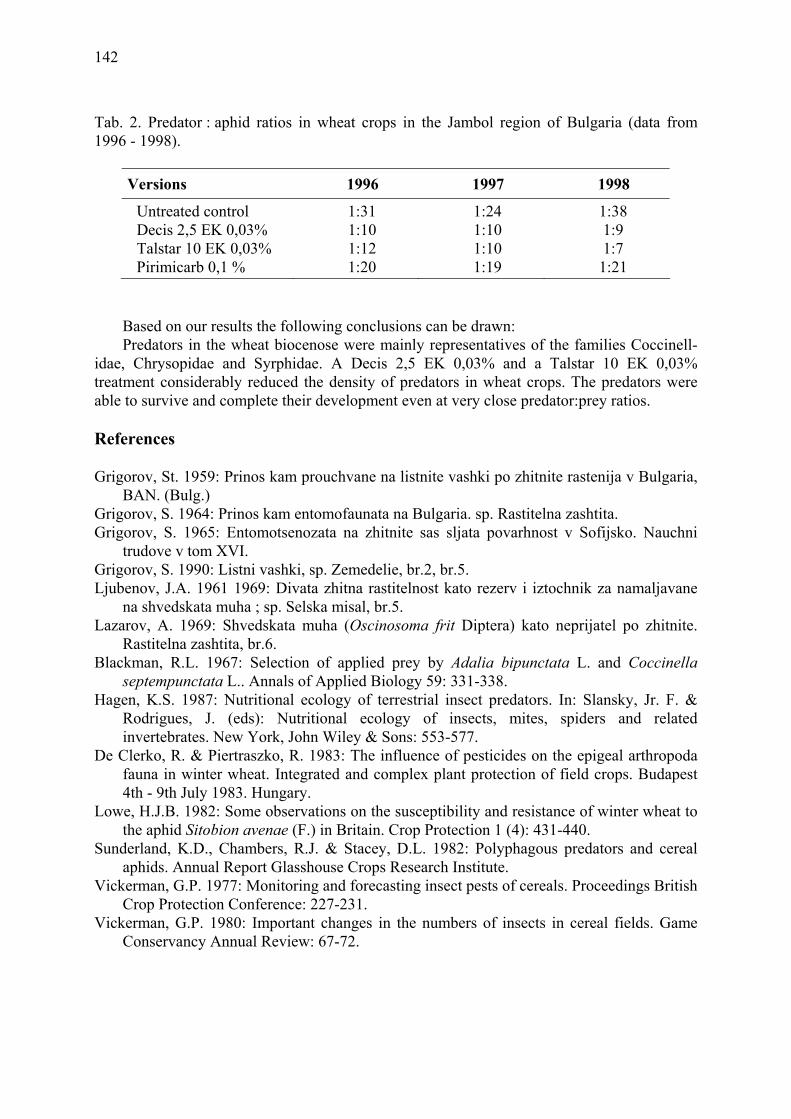
142
Tab. 2. Predator : aphid ratios in wheat crops in the Jambol region of Bulgaria (data from 1996 - 1998).
Versions 1996 1997 1998
Untreated control 1:31 1:24 1:38 Decis 2,5 EK 0,03% 1:10 1:10 1:9 Talstar 10 EK 0,03% 1:12 1:10 1:7 Pirimicarb 0,1 % 1:20 1:19 1:21
Based on our results the following conclusions can be drawn: Predators in the wheat biocenose were mainly representatives of the families Coccinell-
idae, Chrysopidae and Syrphidae. A Decis 2,5 EK 0,03% and a Talstar 10 EK 0,03% treatment considerably reduced the density of predators in wheat crops. The predators were able to survive and complete their development even at very close predator:prey ratios.
References Grigorov, St. 1959: Prinos kam prouchvane na listnite vashki po zhitnite rastenija v Bulgaria,
BAN. (Bulg.) Grigorov, S. 1964: Prinos kam entomofaunata na Bulgaria. sp. Rastitelna zashtita. Grigorov, S. 1965: Entomotsenozata na zhitnite sas sljata povarhnost v Sofijsko. Nauchni
trudove v tom XVI. Grigorov, S. 1990: Listni vashki, sp. Zemedelie, br.2, br.5. Ljubenov, J.A. 1961 1969: Divata zhitna rastitelnost kato rezerv i iztochnik za namaljavane
na shvedskata muha ; sp. Selska misal, br.5. Lazarov, A. 1969: Shvedskata muha (Oscinosoma frit Diptera) kato neprijatel po zhitnite.
Rastitelna zashtita, br.6. Blackman, R.L. 1967: Selection of applied prey by Adalia bipunctata L. and Coccinella
septempunctata L.. Annals of Applied Biology 59: 331-338. Hagen, K.S. 1987: Nutritional ecology of terrestrial insect predators. In: Slansky, Jr. F. &
Rodrigues, J. (eds): Nutritional ecology of insects, mites, spiders and related invertebrates. New York, John Wiley & Sons: 553-577.
De Clerko, R. & Piertraszko, R. 1983: The influence of pesticides on the epigeal arthropoda fauna in winter wheat. Integrated and complex plant protection of field crops. Budapest 4th - 9th July 1983. Hungary.
Lowe, H.J.B. 1982: Some observations on the susceptibility and resistance of winter wheat to the aphid Sitobion avenae (F.) in Britain. Crop Protection 1 (4): 431-440.
Sunderland, K.D., Chambers, R.J. & Stacey, D.L. 1982: Polyphagous predators and cereal aphids. Annual Report Glasshouse Crops Research Institute.
Vickerman, G.P. 1977: Monitoring and forecasting insect pests of cereals. Proceedings British Crop Protection Conference: 227-231.
Vickerman, G.P. 1980: Important changes in the numbers of insects in cereal fields. Game Conservancy Annual Review: 67-72.
Integrated Control in Cereal Crops IOBC wprs Bulletin 24 (6) 2001
pp. 143- 145
Influence of the stubble burning on some pests and earth-worms density
A. Mateeva 1, D. Svetleva 1, D. Andonov 2 and St. Stratieva 2 1 Agricultural University, Plovdiv 4000, Bulgaria 2 COS, Yambol 8600, Bulgaria
Summary In recent years more attention has been paid to the impact of the stubble burning on soil pest population densities, as well as on some indicators of soil fertility such as earth-worms. An impartial assessment of this technique and an analysis of the consequences for the phytosanitary conditions of the soils is of paramount importance for cereal growers in Bulgaria. The main objective of this investigation was to study the influence of stubble burning on some pests and also on earth-worms densities. The study was conducted on a 12 ha cereal plot in the Yambol district of Bulgaria. Results show that the stubble burning leads to a reduction of total pest numbers and earth-worm biomass. Key words: cereals, stubble burning, plough in the stubble, earth-worms, harmful pests Introduction Grain cereals take up two thirds of the cultivated area in Bulgaria and constitute the base of the Bulgarian agricultural production. It is a common practice to burn the stubble after harvest. However, this process often gets out of control with all the inherent dangers for the environment. Moreover, this practice needs a re-thinking particularly because of the increased interest in different forms of agriculture such as conventional, organic or bio-ecological. With this respect an impartial analysis and assessment of the phytosanitary conditions of the soils are needed. In addition, a comprehensive understanding of the farmers’ reasoning is required. The stubble management and the consequences for the soil ecosystem has recently attracted a lot of scientific interest (Haines et al., 1990; Chan & Heenan, 1993; Double et al., 1994). The main objective of the present study was to investigate the influence of stubble burning on some pests and earth-worms densities in Bulgaria.
Material and methods The study was conducted on a 12 ha cereal plot in the Yambol district of Bulgaria. The field was separated into three experimental treatments with 10 m of protection strip. The stubble burning (the first treatment) was conducted directly after harvest and after 15 ml/m2 precipitation. In the second treatment the stubble was ploughed in. The third treatment was as a control without any agricultural practices. In every field 10 samples were taken from 1 m2 marked sectors in the plough layer with a thickness of 10 - 25 cm. Pests were analysed and determined at the Department of Entomology in the Agricultural University in Plovdiv.
Results and discussion In Table 1 data on the density of different life stages of harmful coleopteran and lepidopteran species in the superficial ploughing layer is presented.
144
Tab. 1. Average density of harmful species of the orders Coleoptera and Lepidoptera. Average density per m2 Treatments Order Coleoptera Order Lepidoptera Larvae Pupae Adults Larvae Pupae Stubble burning 2 14 3 2 12 Ploughing in the stubble 1 3 1 – 1 Control 13 16 4 3 13
Higher numbers of Coleoptera were recorded in the control treatment (i.e. without
applying any agricultural practices). The greatest reduction in density of Coleoptera and Lepidoptera were observed in the second treatment (with ploughing of the stubble). Ploughing most likely killed a great proportion of the insects in the superficial ploughing layer. In contrast stubble burning did not greatly affect the density of coleopteran and lepidopteran pest in the soil surface, particularly that of the pupae. The latter is probably due to two important factors: first the pupal stages are situated in depth beyond the ploughing layer, and second they are relatively the most stable life stages of insects, particularly with regard to various adverse ecological and anthropogenic effects. The control treatment was characterised with the relatively highest densities and diversities of forms and stages of harmful species. In this undisturbed environment all development stages of the two insect orders (certainly except for adult butterflies) were found. Our results on the influence of different agricultural practices in cereal fields after harvest coincide with those of Pankhurst et al. (1995).
Data on biomass of earth-worms are presented in Table 2.
Tab. 2. Average density of earth-worms.
Average density per m2 Treatments on 25.07.1999 on 15.08.1999 Numbers g/m2 Numbers g/m2 Stubble burning 7 105 8 118 Ploughing in the stubble 21 360 43 650 Control 27 430 19 380
On the first sampling occasion in June 1999, the highest density was recorded in the
control treatment, followed by the ploughing treatment. The differences in absolute values between the two treatments in June were not substantially high. However, on the second sampling occasion in August 1999 higher numbers of earth-worms were recorded in the ploughing compared to the control treatment. This probably reflects the favourable effect of ploughing on the density of earth-worms which are indicators for the intensive soil formation activity. Lowest numbers of earth were always recorded in the stubble burning treatment. Based on our data we thus conclude that stubble burning leads to reduction of density of coleopteran and lepidopteran pests and also to sharp decrease in the earth-worms biomass. An
145
especially favourable practice for the purposes of a more ecologically oriented agriculture we thus recommend the ploughing in of the stubble.
References Chan, K. & Heenan, I.D.P. 1993: Surface hydraulic properties of a red earth under continuos
cropping with different management practices (wheat-lupine rotation). Australian Journal of Soil Research 31(1): 13-24.
Double, B.M., Kirkegaard, I.A. & Buckerfield, I.C. 1994: Short term effects of tillage and stubble management on earth-worm populations in cropping systems in southern New South Waks. Australian Journal of Soil Research 45(7): 1587-1600.
Haines, P.I. & Uren, N.C. 1990: Effects of conservation tillage farming on soil microbial biomass, organic matter and earth-worm populations in North-Eastern Victoria. Australian Journal of Experimental Agriculture 30(3): 365-371.
Pankhurst, C.E., Hawke, B.G., McDonald, H.I., Kirkby, C.A., Buckerfield, I.C., Michelsen, P., Brien, K.A. & Gupta, V.V.Sr. 1995: Evaluation of soil biological properties as potential bioindicators of soil health. Australian Journal of Experimental Agriculture 35(7):1015-1028.

146
Integrated Control in Cereal Crops IOBC wprs Bulletin 24 (6) 2001
pp. 147- 151
147
A study of aphid predation by Coccinella septempunctata L. (Coleoptera: Coccinellidae) using gut dissection Holger Triltsch BBA, Institute for Integrated Plant Protection, Stahnsdorfer Damm 81, D-14532 Kleinmachnow, Germany Short communication Since 1994 a long-term investigation on the diet of Coccinella septempunctata L. under field conditions has been carried out. Because the essential aphid prey is present only during a restricted time period, aphidophagous ladybirds have to consume a lot of different alternative food types, e.g. pollen, nectar, or other arthropods (Putman, 1964; Hemptinne & Desprets, 1986). Most of our knowledge on the diet of C. septempunctata is based on laboratory experiments or on a few observations of ladybird individuals. Therefore, little is known about the relative importance of the different food types under field conditions. Moreover, we are not able to quantify the amount of aphids eaten by a ladybird in the field.
To get some more information about the diet composition of C. septempunctata during the course of the year and in different locations this long-term field survey was undertaken. Additionally, a method to quantify aphid consumption under field conditions was developed.
To date, about 2,000 adults and 500 larvae of C. septempunctata have been dissected and their gut content analysed. Ladybirds were collected in three different agricultural areas. At the Berlin-Staaken (BS) site ladybird adults were collected throughout the whole year in different crop and non-crop habitats. At the two other sampling sites, Northern Flaeming (NF) and Magdeburger Boerde (MB), adults of C. septempunctata were collected in June and July in cereals. Since 1995 ladybird larvae were also investigated.
While capturing the ladybirds for further investigation, other potential prey arthropods, as well as certain plant material were also sampled. In many cases this material was useful in identifying food items present in the alimentary canal. In addition, feeding experiments with prey types, previously never detected in the gut but mentioned as prey of predaceous coccinellids, namely ladybird eggs and larvae of Oulema spp. (Col.: Chrysomelidae) (Rogers et al., 1972; Agarwala & Dixon, 1992), were carried out under laboratory conditions. An illustrated small catalogue of common food remains found in the alimentary canal of C. septempunctata has already been published (Triltsch, 1999).
All ladybird individuals were captured by sweepnetting or after visual searches. They were rendered inactive at low temperatures (below -10°C) and killed in 80% ethanol to prevent any excretion. The ladybirds were dissected under a binocular microscope and the alimentary canal of each individual was removed. The food remains were inspected in glycerol and classified as belonging to the following food types: (1) aphids, (2) non-aphid arthropods, (3) fungal spores, (4) pollen and other plant material, (5) inorganic material, and (6) unidentifiable items. Frequency of a certain food type was defined as the percentage (%) of individuals of each sample containing that type of food. The category “combined meal” was adapted from Sunderland et al. (1995) and includes cases where more than one food type was found in a single gut. Since 1995 a more detailed identification of prey species within the category “non-aphid arthropods” was performed.
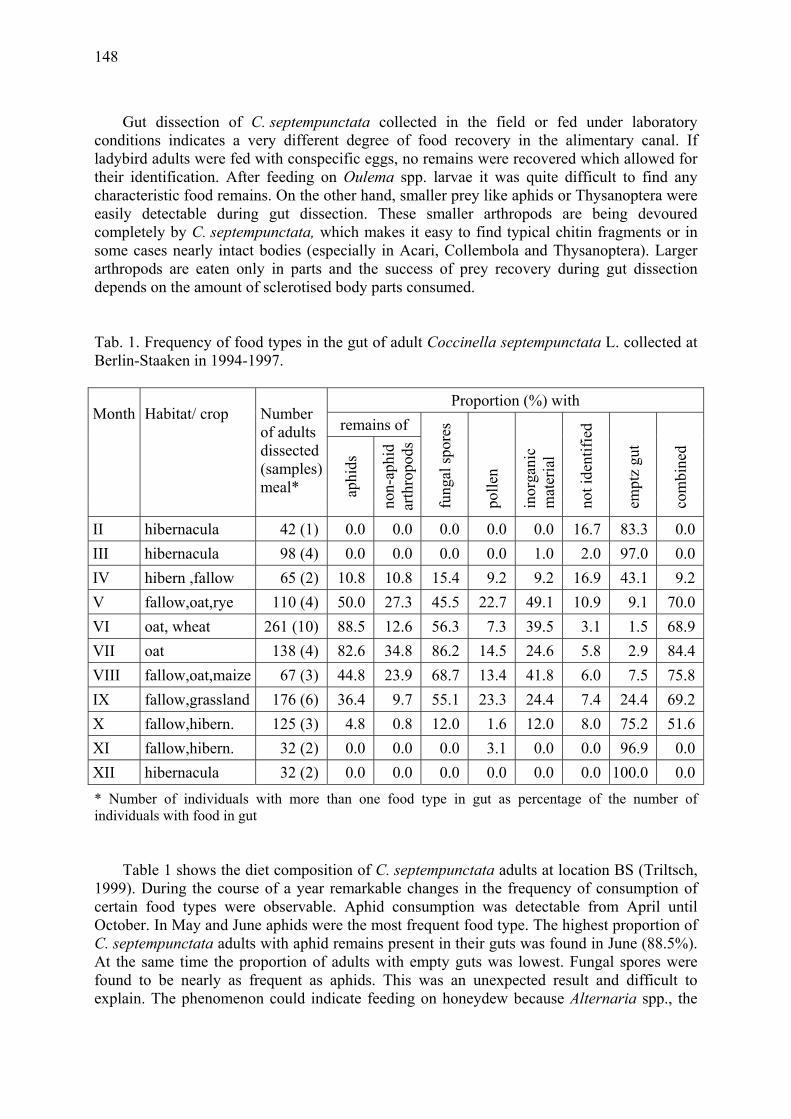
148
Gut dissection of C. septempunctata collected in the field or fed under laboratory conditions indicates a very different degree of food recovery in the alimentary canal. If ladybird adults were fed with conspecific eggs, no remains were recovered which allowed for their identification. After feeding on Oulema spp. larvae it was quite difficult to find any characteristic food remains. On the other hand, smaller prey like aphids or Thysanoptera were easily detectable during gut dissection. These smaller arthropods are being devoured completely by C. septempunctata, which makes it easy to find typical chitin fragments or in some cases nearly intact bodies (especially in Acari, Collembola and Thysanoptera). Larger arthropods are eaten only in parts and the success of prey recovery during gut dissection depends on the amount of sclerotised body parts consumed.
Tab. 1. Frequency of food types in the gut of adult Coccinella septempunctata L. collected at Berlin-Staaken in 1994-1997.
Proportion (%) with
remains of Month Habitat/ crop Number
of adults dissected (samples) meal* ap
hids
non-
aphi
d ar
thro
pods
fung
al sp
ores
polle
n
inor
gani
c m
ater
ial
not i
dent
ified
empt
z gu
t
com
bine
d
II hibernacula 42 (1) 0.0 0.0 0.0 0.0 0.0 16.7 83.3 0.0 III hibernacula 98 (4) 0.0 0.0 0.0 0.0 1.0 2.0 97.0 0.0 IV hibern ,fallow 65 (2) 10.8 10.8 15.4 9.2 9.2 16.9 43.1 9.2 V fallow,oat,rye 110 (4) 50.0 27.3 45.5 22.7 49.1 10.9 9.1 70.0 VI oat, wheat 261 (10) 88.5 12.6 56.3 7.3 39.5 3.1 1.5 68.9 VII oat 138 (4) 82.6 34.8 86.2 14.5 24.6 5.8 2.9 84.4 VIII fallow,oat,maize 67 (3) 44.8 23.9 68.7 13.4 41.8 6.0 7.5 75.8 IX fallow,grassland 176 (6) 36.4 9.7 55.1 23.3 24.4 7.4 24.4 69.2 X fallow,hibern. 125 (3) 4.8 0.8 12.0 1.6 12.0 8.0 75.2 51.6 XI fallow,hibern. 32 (2) 0.0 0.0 0.0 3.1 0.0 0.0 96.9 0.0 XII hibernacula 32 (2) 0.0 0.0 0.0 0.0 0.0 0.0 100.0 0.0 * Number of individuals with more than one food type in gut as percentage of the number of individuals with food in gut
Table 1 shows the diet composition of C. septempunctata adults at location BS (Triltsch, 1999). During the course of a year remarkable changes in the frequency of consumption of certain food types were observable. Aphid consumption was detectable from April until October. In May and June aphids were the most frequent food type. The highest proportion of C. septempunctata adults with aphid remains present in their guts was found in June (88.5%). At the same time the proportion of adults with empty guts was lowest. Fungal spores were found to be nearly as frequent as aphids. This was an unexpected result and difficult to explain. The phenomenon could indicate feeding on honeydew because Alternaria spp., the
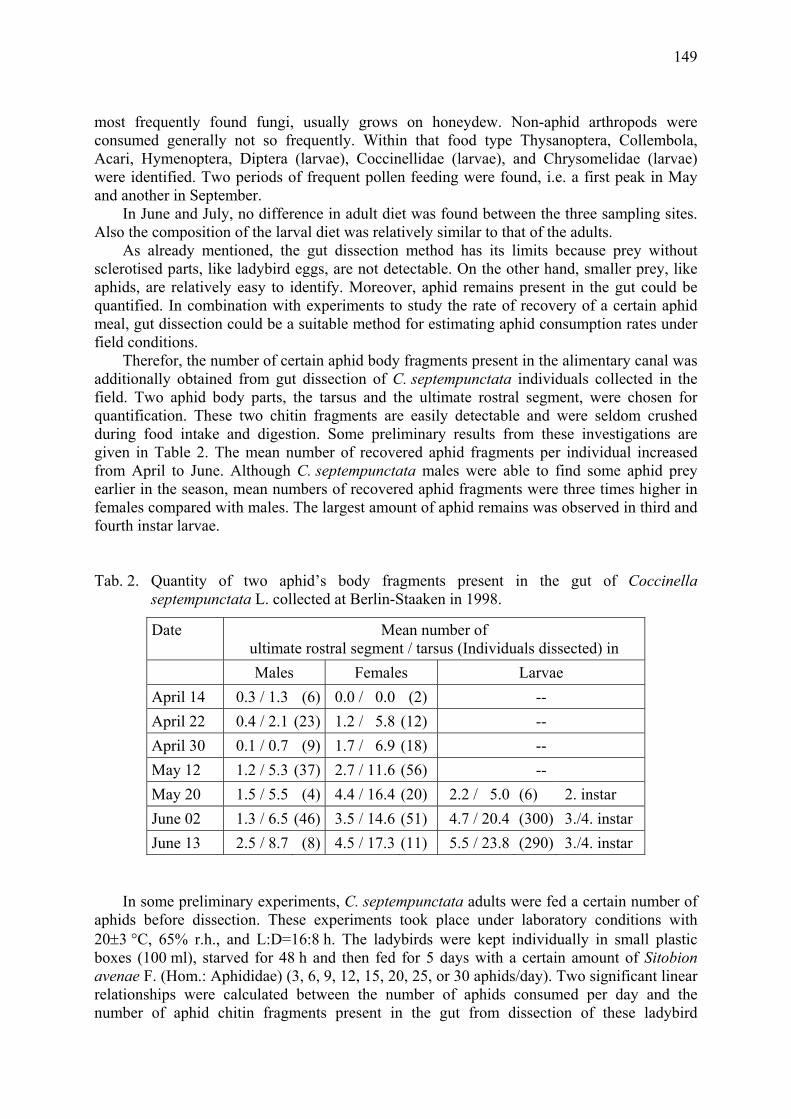
149
most frequently found fungi, usually grows on honeydew. Non-aphid arthropods were consumed generally not so frequently. Within that food type Thysanoptera, Collembola, Acari, Hymenoptera, Diptera (larvae), Coccinellidae (larvae), and Chrysomelidae (larvae) were identified. Two periods of frequent pollen feeding were found, i.e. a first peak in May and another in September.
In June and July, no difference in adult diet was found between the three sampling sites. Also the composition of the larval diet was relatively similar to that of the adults.
As already mentioned, the gut dissection method has its limits because prey without sclerotised parts, like ladybird eggs, are not detectable. On the other hand, smaller prey, like aphids, are relatively easy to identify. Moreover, aphid remains present in the gut could be quantified. In combination with experiments to study the rate of recovery of a certain aphid meal, gut dissection could be a suitable method for estimating aphid consumption rates under field conditions.
Therefor, the number of certain aphid body fragments present in the alimentary canal was additionally obtained from gut dissection of C. septempunctata individuals collected in the field. Two aphid body parts, the tarsus and the ultimate rostral segment, were chosen for quantification. These two chitin fragments are easily detectable and were seldom crushed during food intake and digestion. Some preliminary results from these investigations are given in Table 2. The mean number of recovered aphid fragments per individual increased from April to June. Although C. septempunctata males were able to find some aphid prey earlier in the season, mean numbers of recovered aphid fragments were three times higher in females compared with males. The largest amount of aphid remains was observed in third and fourth instar larvae.
Tab. 2. Quantity of two aphid’s body fragments present in the gut of Coccinella septempunctata L. collected at Berlin-Staaken in 1998.
Date Mean number of ultimate rostral segment / tarsus (Individuals dissected) in
Males Females Larvae April 14 0.3 / 1.3 (6) 0.0 / 0.0 (2) -- April 22 0.4 / 2.1 (23) 1.2 / 5.8 (12) -- April 30 0.1 / 0.7 (9) 1.7 / 6.9 (18) -- May 12 1.2 / 5.3 (37) 2.7 / 11.6 (56) -- May 20 1.5 / 5.5 (4) 4.4 / 16.4 (20) 2.2 / 5.0 (6) 2. instar June 02 1.3 / 6.5 (46) 3.5 / 14.6 (51) 4.7 / 20.4 (300) 3./4. instar June 13 2.5 / 8.7 (8) 4.5 / 17.3 (11) 5.5 / 23.8 (290) 3./4. instar
In some preliminary experiments, C. septempunctata adults were fed a certain number of
aphids before dissection. These experiments took place under laboratory conditions with 20±3 °C, 65% r.h., and L:D=16:8 h. The ladybirds were kept individually in small plastic boxes (100 ml), starved for 48 h and then fed for 5 days with a certain amount of Sitobion avenae F. (Hom.: Aphididae) (3, 6, 9, 12, 15, 20, 25, or 30 aphids/day). Two significant linear relationships were calculated between the number of aphids consumed per day and the number of aphid chitin fragments present in the gut from dissection of these ladybird
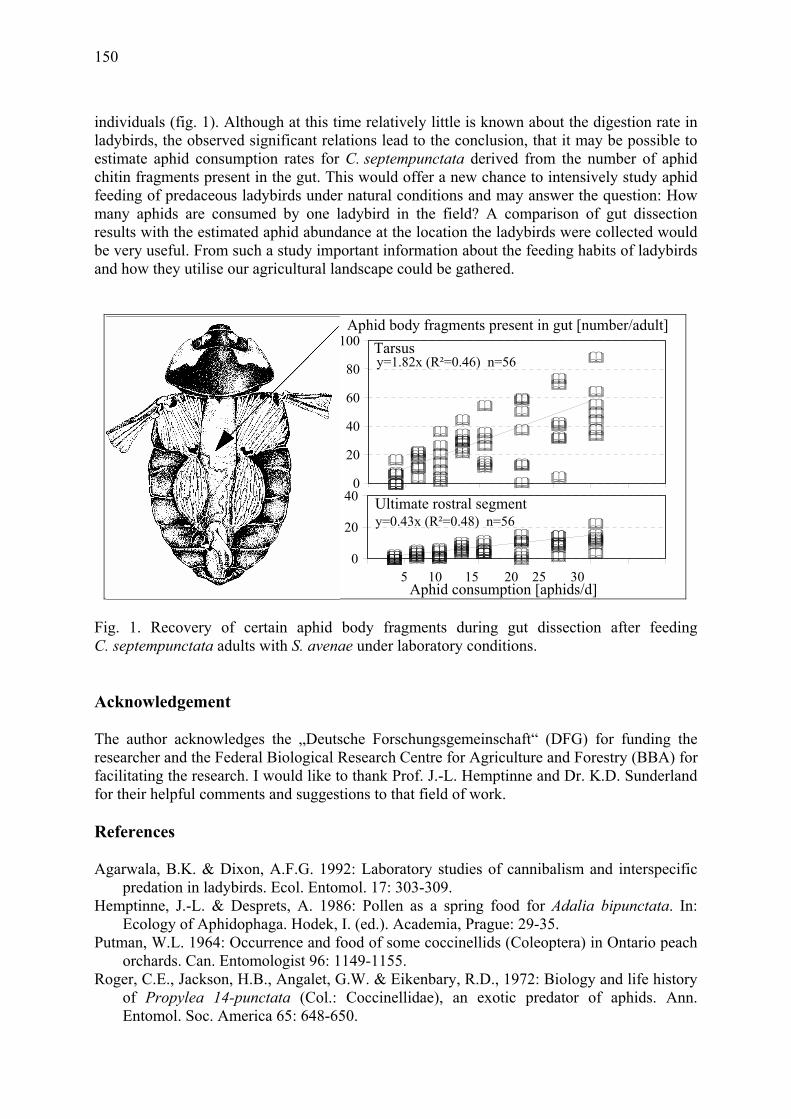
150
individuals (fig. 1). Although at this time relatively little is known about the digestion rate in ladybirds, the observed significant relations lead to the conclusion, that it may be possible to estimate aphid consumption rates for C. septempunctata derived from the number of aphid chitin fragments present in the gut. This would offer a new chance to intensively study aphid feeding of predaceous ladybirds under natural conditions and may answer the question: How many aphids are consumed by one ladybird in the field? A comparison of gut dissection results with the estimated aphid abundance at the location the ladybirds were collected would be very useful. From such a study important information about the feeding habits of ladybirds and how they utilise our agricultural landscape could be gathered.
0
20
400
20
40
60
80
100Aphid body fragments present in gut [number/adult]
Tarsus
Ultimate rostral segment
5 10 15 20 25Aphid consumption [aphids/d]
30
y=0.43x (R²=0.48) n=56
y=1.82x (R²=0.46) n=56
Fig. 1. Recovery of certain aphid body fragments during gut dissection after feeding C. septempunctata adults with S. avenae under laboratory conditions.
Acknowledgement The author acknowledges the „Deutsche Forschungsgemeinschaft“ (DFG) for funding the researcher and the Federal Biological Research Centre for Agriculture and Forestry (BBA) for facilitating the research. I would like to thank Prof. J.-L. Hemptinne and Dr. K.D. Sunderland for their helpful comments and suggestions to that field of work.
References Agarwala, B.K. & Dixon, A.F.G. 1992: Laboratory studies of cannibalism and interspecific
predation in ladybirds. Ecol. Entomol. 17: 303-309. Hemptinne, J.-L. & Desprets, A. 1986: Pollen as a spring food for Adalia bipunctata. In:
Ecology of Aphidophaga. Hodek, I. (ed.). Academia, Prague: 29-35. Putman, W.L. 1964: Occurrence and food of some coccinellids (Coleoptera) in Ontario peach
orchards. Can. Entomologist 96: 1149-1155. Roger, C.E., Jackson, H.B., Angalet, G.W. & Eikenbary, R.D., 1972: Biology and life history
of Propylea 14-punctata (Col.: Coccinellidae), an exotic predator of aphids. Ann. Entomol. Soc. America 65: 648-650.
151
Sunderland, K.D., Lövei, G.L. & Fenlon, J. 1995: Diets and reproductive phenologies of the introduced ground beetles Harpalus affinis and Clivinia australasiae (Coleoptera: Carabidae) in New Zealand. Aust. J. Zool 43: 39-50.
Triltsch, H. 1999: Food remains in the guts of Coccinella septempunctata L. (Coleoptera: Coccinellidae) adults and larvae. Eur. J. Entomol. 96(4): 355-364.

152
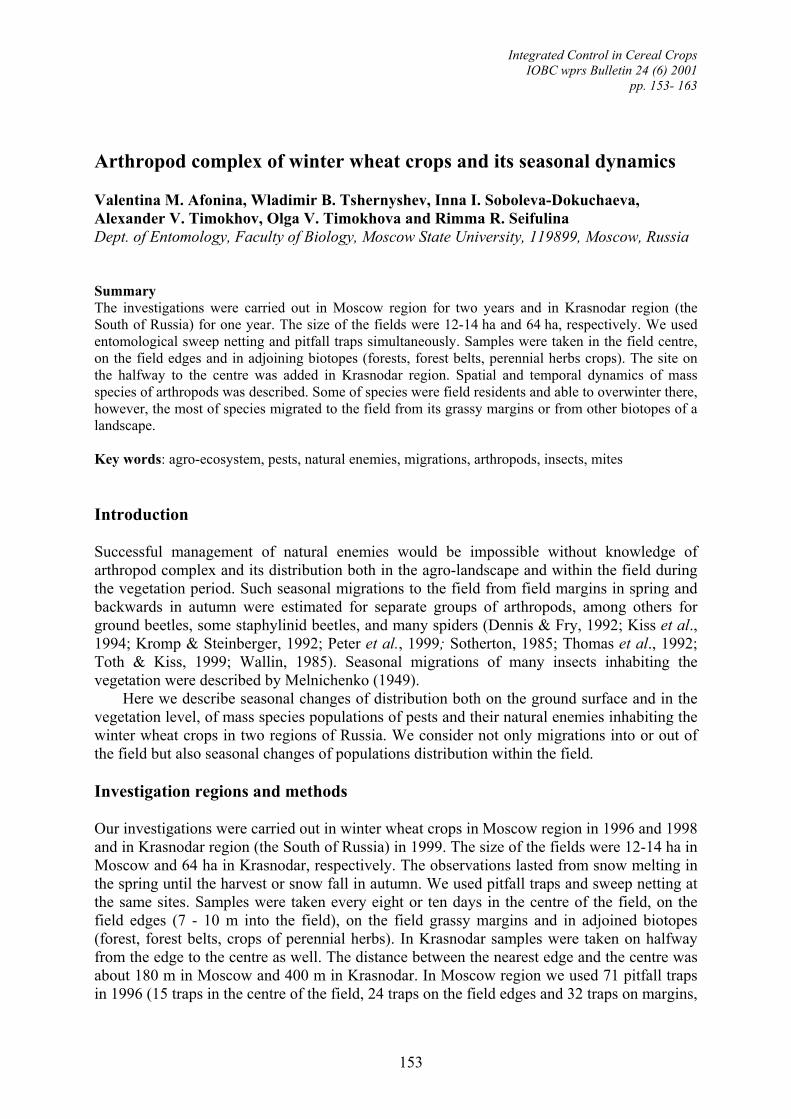
Integrated Control in Cereal Crops IOBC wprs Bulletin 24 (6) 2001
pp. 153- 163
153
Arthropod complex of winter wheat crops and its seasonal dynamics Valentina M. Afonina, Wladimir B. Tshernyshev, Inna I. Soboleva-Dokuchaeva, Alexander V. Timokhov, Olga V. Timokhova and Rimma R. Seifulina Dept. of Entomology, Faculty of Biology, Moscow State University, 119899, Moscow, Russia Summary The investigations were carried out in Moscow region for two years and in Krasnodar region (the South of Russia) for one year. The size of the fields were 12-14 ha and 64 ha, respectively. We used entomological sweep netting and pitfall traps simultaneously. Samples were taken in the field centre, on the field edges and in adjoining biotopes (forests, forest belts, perennial herbs crops). The site on the halfway to the centre was added in Krasnodar region. Spatial and temporal dynamics of mass species of arthropods was described. Some of species were field residents and able to overwinter there, however, the most of species migrated to the field from its grassy margins or from other biotopes of a landscape. Key words: agro-ecosystem, pests, natural enemies, migrations, arthropods, insects, mites
Introduction Successful management of natural enemies would be impossible without knowledge of arthropod complex and its distribution both in the agro-landscape and within the field during the vegetation period. Such seasonal migrations to the field from field margins in spring and backwards in autumn were estimated for separate groups of arthropods, among others for ground beetles, some staphylinid beetles, and many spiders (Dennis & Fry, 1992; Kiss et al., 1994; Kromp & Steinberger, 1992; Peter et al., 1999; Sotherton, 1985; Thomas et al., 1992; Toth & Kiss, 1999; Wallin, 1985). Seasonal migrations of many insects inhabiting the vegetation were described by Melnichenko (1949).
Here we describe seasonal changes of distribution both on the ground surface and in the vegetation level, of mass species populations of pests and their natural enemies inhabiting the winter wheat crops in two regions of Russia. We consider not only migrations into or out of the field but also seasonal changes of populations distribution within the field.
Investigation regions and methods Our investigations were carried out in winter wheat crops in Moscow region in 1996 and 1998 and in Krasnodar region (the South of Russia) in 1999. The size of the fields were 12-14 ha in Moscow and 64 ha in Krasnodar, respectively. The observations lasted from snow melting in the spring until the harvest or snow fall in autumn. We used pitfall traps and sweep netting at the same sites. Samples were taken every eight or ten days in the centre of the field, on the field edges (7 - 10 m into the field), on the field grassy margins and in adjoined biotopes (forest, forest belts, crops of perennial herbs). In Krasnodar samples were taken on halfway from the edge to the centre as well. The distance between the nearest edge and the centre was about 180 m in Moscow and 400 m in Krasnodar. In Moscow region we used 71 pitfall traps in 1996 (15 traps in the centre of the field, 24 traps on the field edges and 32 traps on margins,
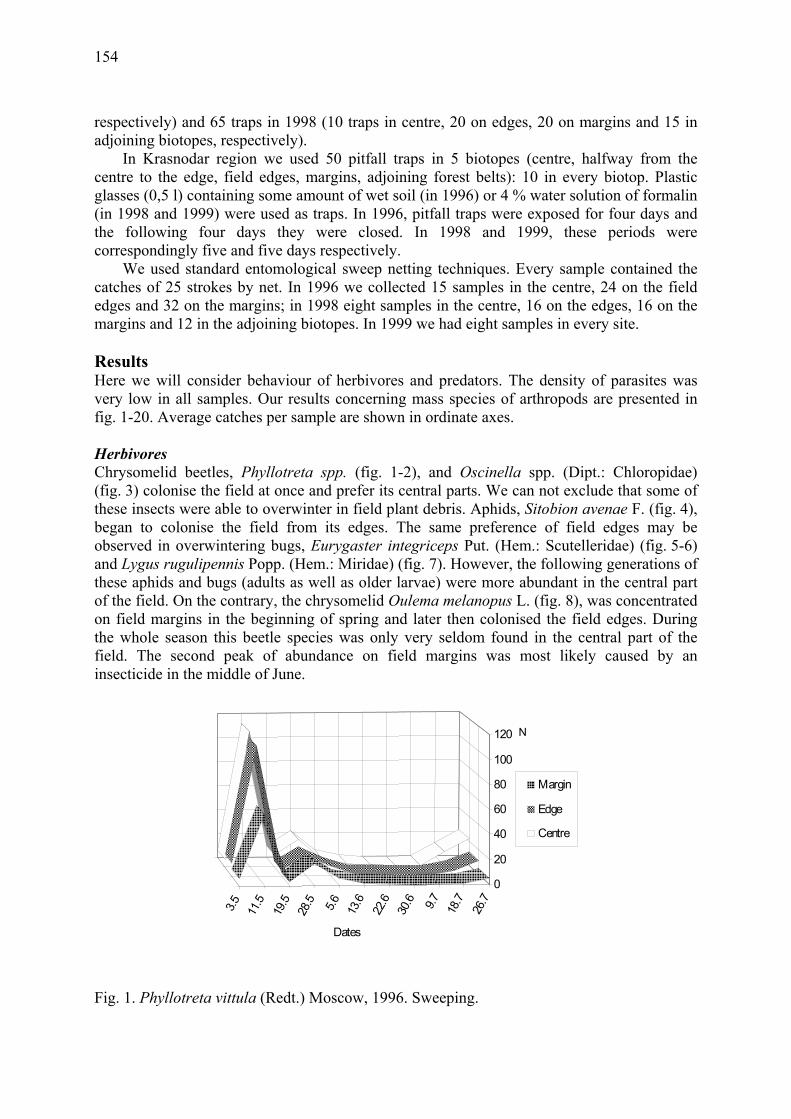
154
respectively) and 65 traps in 1998 (10 traps in centre, 20 on edges, 20 on margins and 15 in adjoining biotopes, respectively).
In Krasnodar region we used 50 pitfall traps in 5 biotopes (centre, halfway from the centre to the edge, field edges, margins, adjoining forest belts): 10 in every biotop. Plastic glasses (0,5 l) containing some amount of wet soil (in 1996) or 4 % water solution of formalin (in 1998 and 1999) were used as traps. In 1996, pitfall traps were exposed for four days and the following four days they were closed. In 1998 and 1999, these periods were correspondingly five and five days respectively.
We used standard entomological sweep netting techniques. Every sample contained the catches of 25 strokes by net. In 1996 we collected 15 samples in the centre, 24 on the field edges and 32 on the margins; in 1998 eight samples in the centre, 16 on the edges, 16 on the margins and 12 in the adjoining biotopes. In 1999 we had eight samples in every site.
Results Here we will consider behaviour of herbivores and predators. The density of parasites was very low in all samples. Our results concerning mass species of arthropods are presented in fig. 1-20. Average catches per sample are shown in ordinate axes.
Herbivores Chrysomelid beetles, Phyllotreta spp. (fig. 1-2), and Oscinella spp. (Dipt.: Chloropidae) (fig. 3) colonise the field at once and prefer its central parts. We can not exclude that some of these insects were able to overwinter in field plant debris. Aphids, Sitobion avenae F. (fig. 4), began to colonise the field from its edges. The same preference of field edges may be observed in overwintering bugs, Eurygaster integriceps Put. (Hem.: Scutelleridae) (fig. 5-6) and Lygus rugulipennis Popp. (Hem.: Miridae) (fig. 7). However, the following generations of these aphids and bugs (adults as well as older larvae) were more abundant in the central part of the field. On the contrary, the chrysomelid Oulema melanopus L. (fig. 8), was concentrated on field margins in the beginning of spring and later then colonised the field edges. During the whole season this beetle species was only very seldom found in the central part of the field. The second peak of abundance on field margins was most likely caused by an insecticide in the middle of June.
Fig. 1. Phyllotreta vittula (Redt.) Moscow, 1996. Sweeping.
3.5 11.5
19.5
28.5 5.6 13.6
22.6
30.6 9.7 18.7
26.7
0
20
40
60
80
100
120 N
Dates
Margin
Edge
Centre
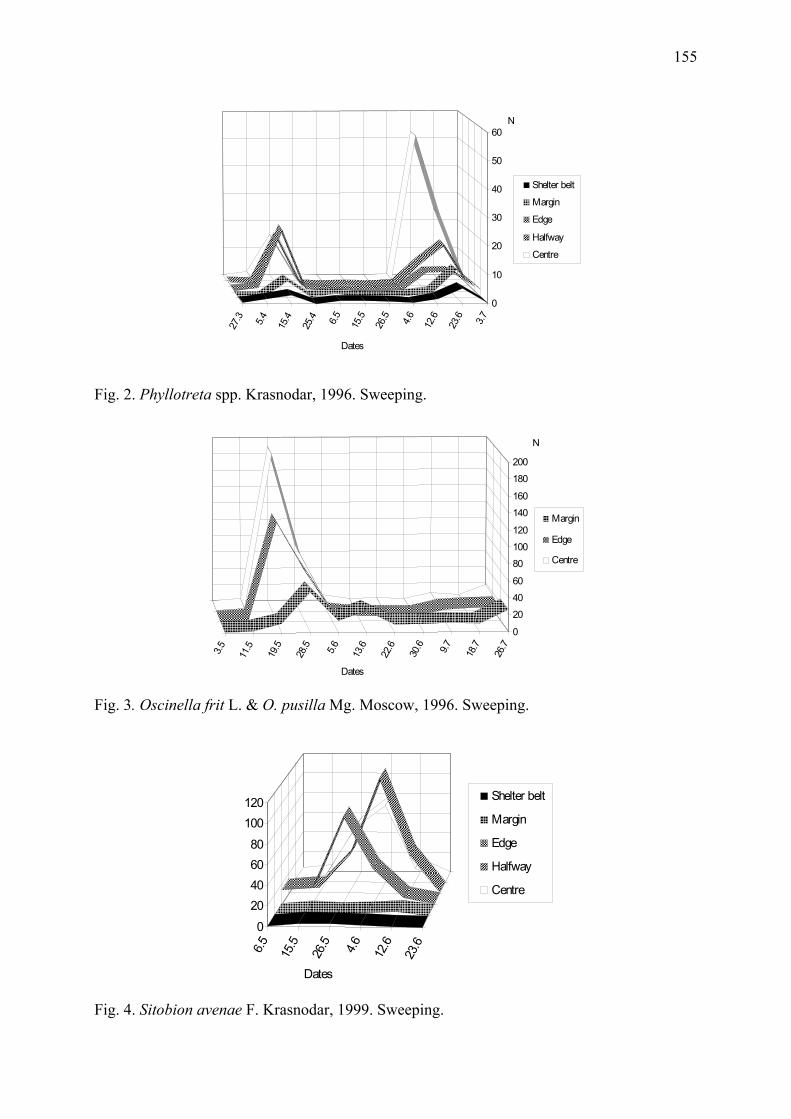
155
Fig. 2. Phyllotreta spp. Krasnodar, 1996. Sweeping.
Fig. 3. Oscinella frit L. & O. pusilla Mg. Moscow, 1996. Sweeping.
Fig. 4. Sitobion avenae F. Krasnodar, 1999. Sweeping.
27.3 5.4 15.4
25.4 6.5 15.5
26.5 4.6 12.6
23.6 3.7
0
10
20
30
40
50
60N
Dates
Shelter belt
Margin
Edge
Halfway
Centre
3.5 11.5
19.5
28.5 5.6 13.6
22.6
30.6 9.7 18.7
26.7
0
20
40
60
80
100
120
140
160
180
200
N
Dates
Margin
Edge
Centre
6.5 15.5
26.5 4.6 12.6
23.6
0
20406080
100120
Dates
Shelter belt
Margin
Edge
Halfway
Centre
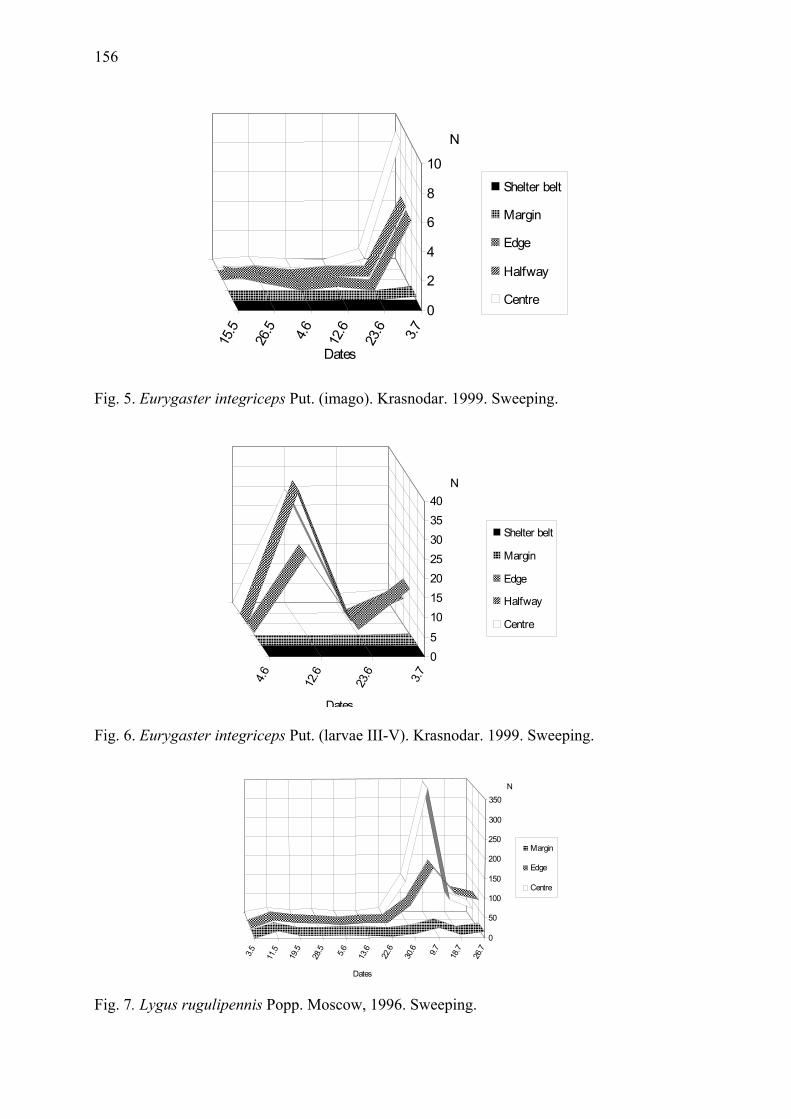
156
Fig. 5. Eurygaster integriceps Put. (imago). Krasnodar. 1999. Sweeping.
Fig. 6. Eurygaster integriceps Put. (larvae III-V). Krasnodar. 1999. Sweeping.
Fig. 7. Lygus rugulipennis Popp. Moscow, 1996. Sweeping.
15.5
26.5 4.6 12.6
23.6 3.7
0
2
4
6
8
10
N
Dates
Shelter belt
Margin
Edge
Halfway
Centre
3.5 11.5
19.5
28.5 5.6 13.6
22.6
30.6 9.7 18.7
26.7
0
50
100
150
200
250
300
350N
Dates
Margin
Edge
Centre
4.6 12.6
23.6 3.7
05
10152025303540
N
Dates
Shelter belt
Margin
Edge
Halfway
Centre
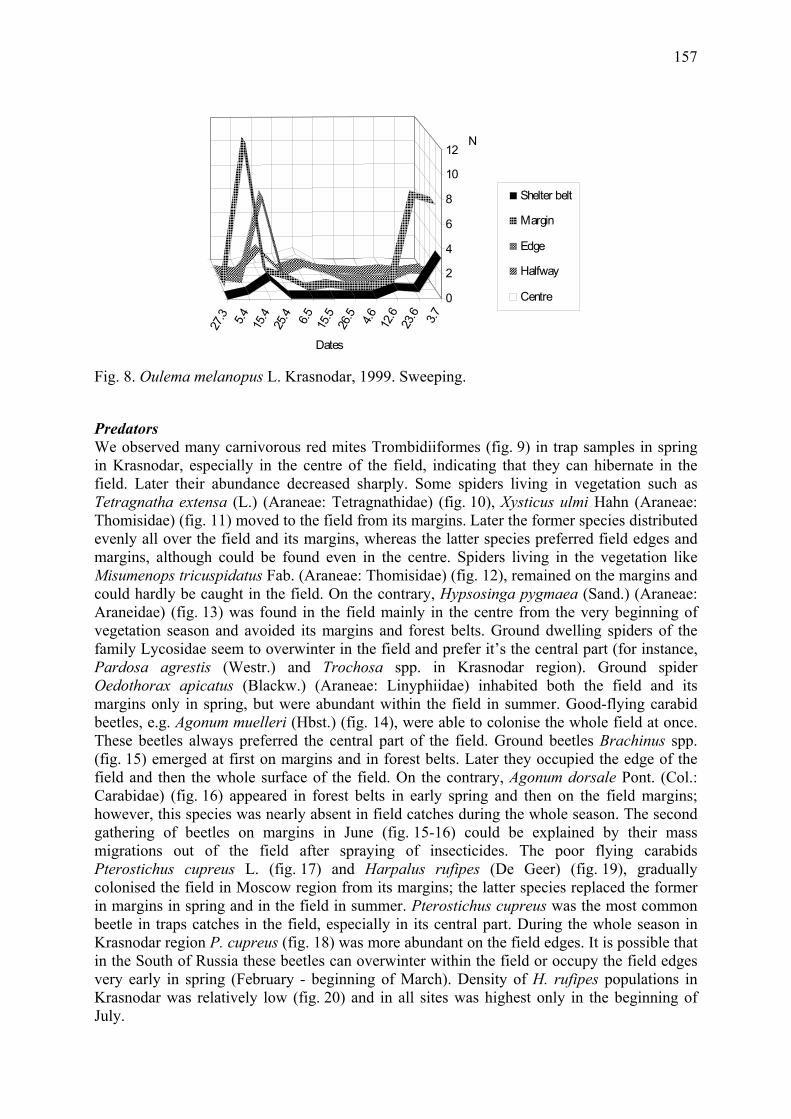
157
Fig. 8. Oulema melanopus L. Krasnodar, 1999. Sweeping. Predators We observed many carnivorous red mites Trombidiiformes (fig. 9) in trap samples in spring in Krasnodar, especially in the centre of the field, indicating that they can hibernate in the field. Later their abundance decreased sharply. Some spiders living in vegetation such as Tetragnatha extensa (L.) (Araneae: Tetragnathidae) (fig. 10), Xysticus ulmi Hahn (Araneae: Thomisidae) (fig. 11) moved to the field from its margins. Later the former species distributed evenly all over the field and its margins, whereas the latter species preferred field edges and margins, although could be found even in the centre. Spiders living in the vegetation like Misumenops tricuspidatus Fab. (Araneae: Thomisidae) (fig. 12), remained on the margins and could hardly be caught in the field. On the contrary, Hypsosinga pygmaea (Sand.) (Araneae: Araneidae) (fig. 13) was found in the field mainly in the centre from the very beginning of vegetation season and avoided its margins and forest belts. Ground dwelling spiders of the family Lycosidae seem to overwinter in the field and prefer it’s the central part (for instance, Pardosa agrestis (Westr.) and Trochosa spp. in Krasnodar region). Ground spider Oedothorax apicatus (Blackw.) (Araneae: Linyphiidae) inhabited both the field and its margins only in spring, but were abundant within the field in summer. Good-flying carabid beetles, e.g. Agonum muelleri (Hbst.) (fig. 14), were able to colonise the whole field at once. These beetles always preferred the central part of the field. Ground beetles Brachinus spp. (fig. 15) emerged at first on margins and in forest belts. Later they occupied the edge of the field and then the whole surface of the field. On the contrary, Agonum dorsale Pont. (Col.: Carabidae) (fig. 16) appeared in forest belts in early spring and then on the field margins; however, this species was nearly absent in field catches during the whole season. The second gathering of beetles on margins in June (fig. 15-16) could be explained by their mass migrations out of the field after spraying of insecticides. The poor flying carabids Pterostichus cupreus L. (fig. 17) and Harpalus rufipes (De Geer) (fig. 19), gradually colonised the field in Moscow region from its margins; the latter species replaced the former in margins in spring and in the field in summer. Pterostichus cupreus was the most common beetle in traps catches in the field, especially in its central part. During the whole season in Krasnodar region P. cupreus (fig. 18) was more abundant on the field edges. It is possible that in the South of Russia these beetles can overwinter within the field or occupy the field edges very early in spring (February - beginning of March). Density of H. rufipes populations in Krasnodar was relatively low (fig. 20) and in all sites was highest only in the beginning of July.
27.3 5.4 15.4
25.4 6.5 15.5
26.5 4.6 12.6
23.6 3.7
0
2
4
6
8
10
12N
Dates
Shelter belt
Margin
Edge
Halfway
Centre
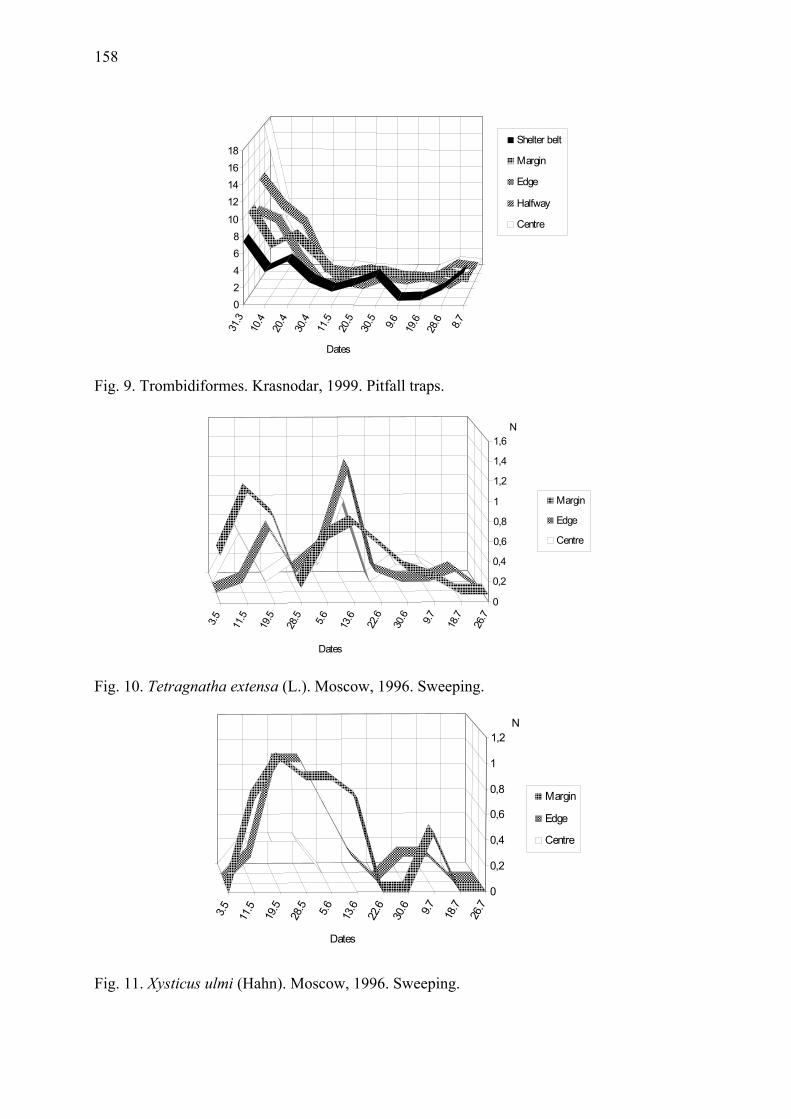
158
Fig. 9. Trombidiformes. Krasnodar, 1999. Pitfall traps.
Fig. 10. Tetragnatha extensa (L.). Moscow, 1996. Sweeping.
Fig. 11. Xysticus ulmi (Hahn). Moscow, 1996. Sweeping.
31.3
10.4
20.4
30.4
11.5
20.5
30.5 9.6 19.6
28.6 8.7
02468
10
12141618
Dates
Shelter belt
Margin
Edge
Halfway
Centre3.5 11.5
19.5
28.5 5.6 13.6
22.6
30.6 9.7 18.7
26.7
0
0,2
0,4
0,6
0,8
1
1,2
1,4
1,6N
Dates
Margin
Edge
Centre
3.5 11.5
19.5
28.5 5.6 13.6
22.6
30.6 9.7 18.7
26.7
0
0,2
0,4
0,6
0,8
1
1,2N
Dates
Margin
Edge
Centre
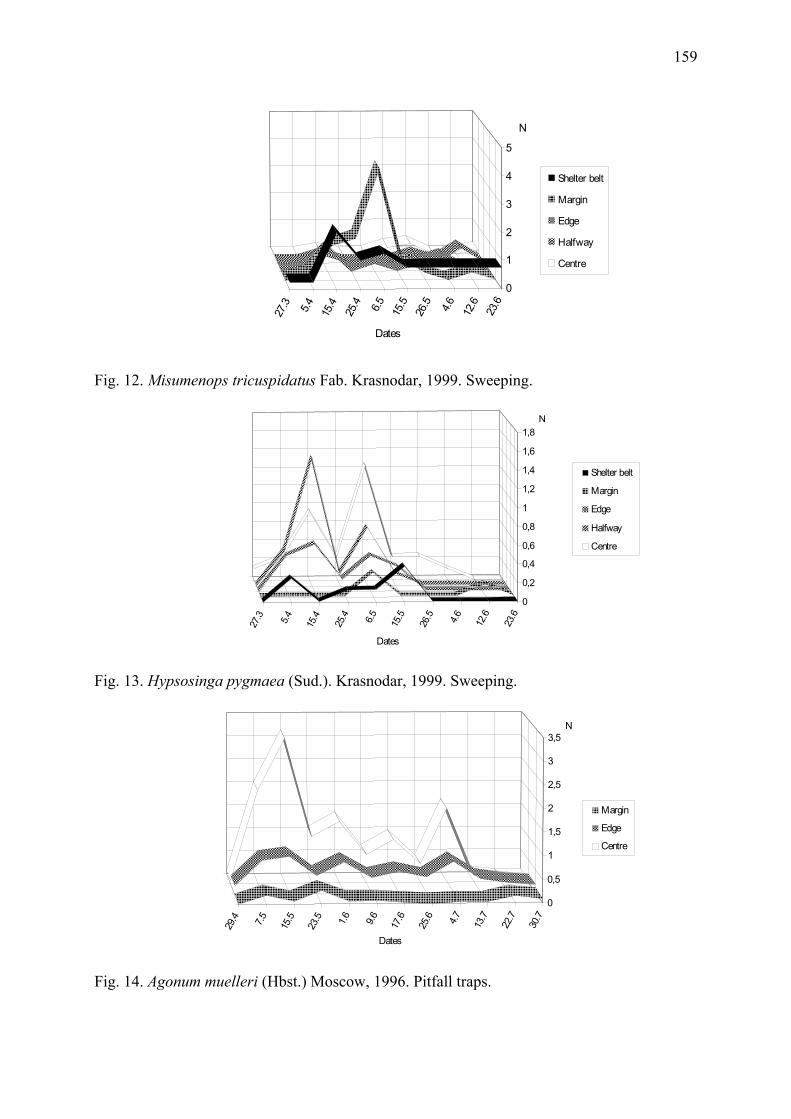
159
Fig. 12. Misumenops tricuspidatus Fab. Krasnodar, 1999. Sweeping.
Fig. 13. Hypsosinga pygmaea (Sud.). Krasnodar, 1999. Sweeping.
Fig. 14. Agonum muelleri (Hbst.) Moscow, 1996. Pitfall traps.
27.3 5.4 15.4
25.4 6.5 15.5
26.5 4.6 12.6
23.6
0
1
2
3
4
5
N
Dates
Shelter belt
Margin
Edge
Halfway
Centre
29.4 7.5 15.5
23.5 1.6 9.6 17.6
25.6 4.7 13.7
22.7
30.7
0
0,5
1
1,5
2
2,5
3
3,5N
Dates
Margin
Edge
Centre
27.3 5.4 15.4
25.4 6.5 15.5
26.5 4.6 12.6
23.6
0
0,2
0,4
0,6
0,8
1
1,2
1,4
1,6
1,8N
Dates
Shelter belt
Margin
Edge
Halfway
Centre
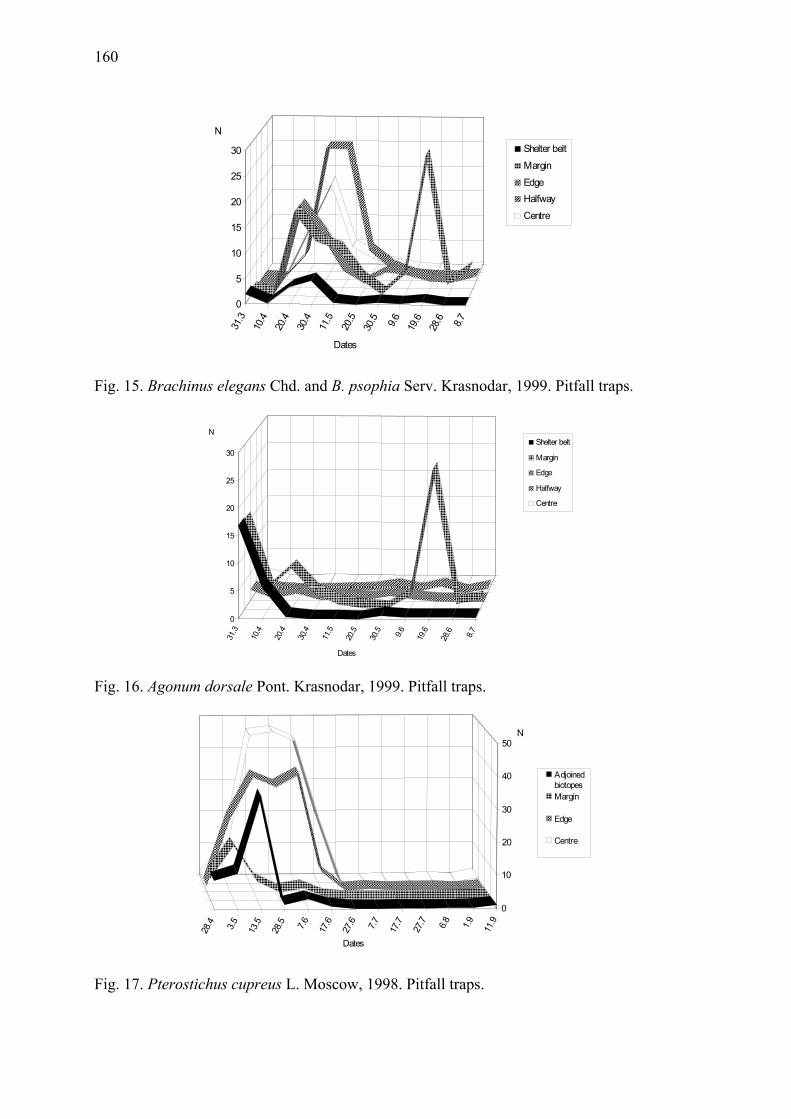
160
Fig. 15. Brachinus elegans Chd. and B. psophia Serv. Krasnodar, 1999. Pitfall traps.
Fig. 16. Agonum dorsale Pont. Krasnodar, 1999. Pitfall traps.
Fig. 17. Pterostichus cupreus L. Moscow, 1998. Pitfall traps.
31.3
10.4
20.4
30.4
11.5
20.5
30.5 9.6 19.6
28.6 8.7
0
5
10
15
20
25
30
N
Dates
Shelter belt
Margin
EdgeHalfway
Centre31
.3
10.4
20.4
30.4
11.5
20.5
30.5 9.6 19.6
28.6 8.7
0
5
10
15
20
25
30
N
Dates
Shelter belt
Margin
Edge
Halfway
Centre
28.4 3.5 13.5
28.5 7.6 17.6
27.6 7.7 17.7
27.7 6.8 1.9 11.9
0
10
20
30
40
50N
Dates
AdjoinedbiotopesMargin
Edge
Centre
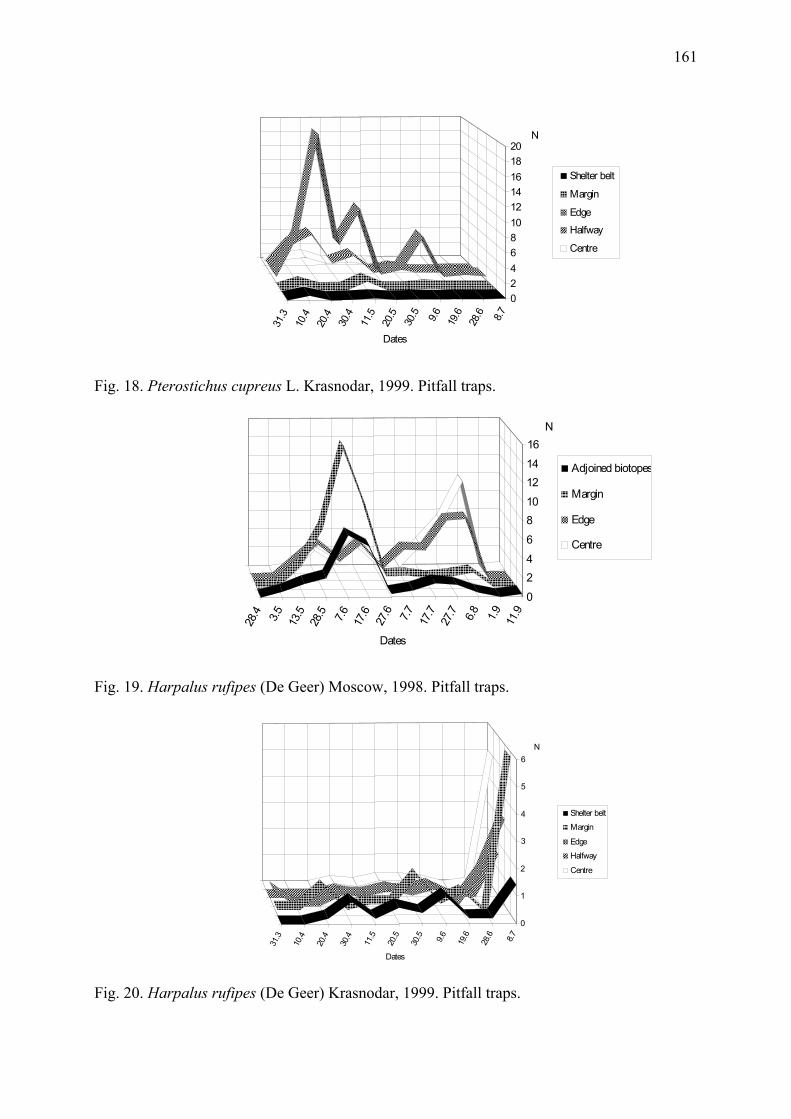
161
Fig. 18. Pterostichus cupreus L. Krasnodar, 1999. Pitfall traps.
Fig. 19. Harpalus rufipes (De Geer) Moscow, 1998. Pitfall traps.
Fig. 20. Harpalus rufipes (De Geer) Krasnodar, 1999. Pitfall traps.
31.3
10.4
20.4
30.4
11.5
20.5
30.5 9.6 19.6
28.6 8.7
02468101214161820
N
Dates
Shelter belt
Margin
Edge
Halfway
Centre28
.4 3.5 13
.528
.5 7.6 17
.627
.6 7.7 17
.727
.7 6.8 1.9 11
.9
0
24
6
810
1214
16N
Dates
Adjoined biotopes
Margin
Edge
Centre
31.3
10.4
20.4
30.4
11.5
20.5
30.5 9.6 19.6
28.6 8.7
0
1
2
3
4
5
6N
Dates
Shelter belt
Margin
Edge
Halfway
Centre
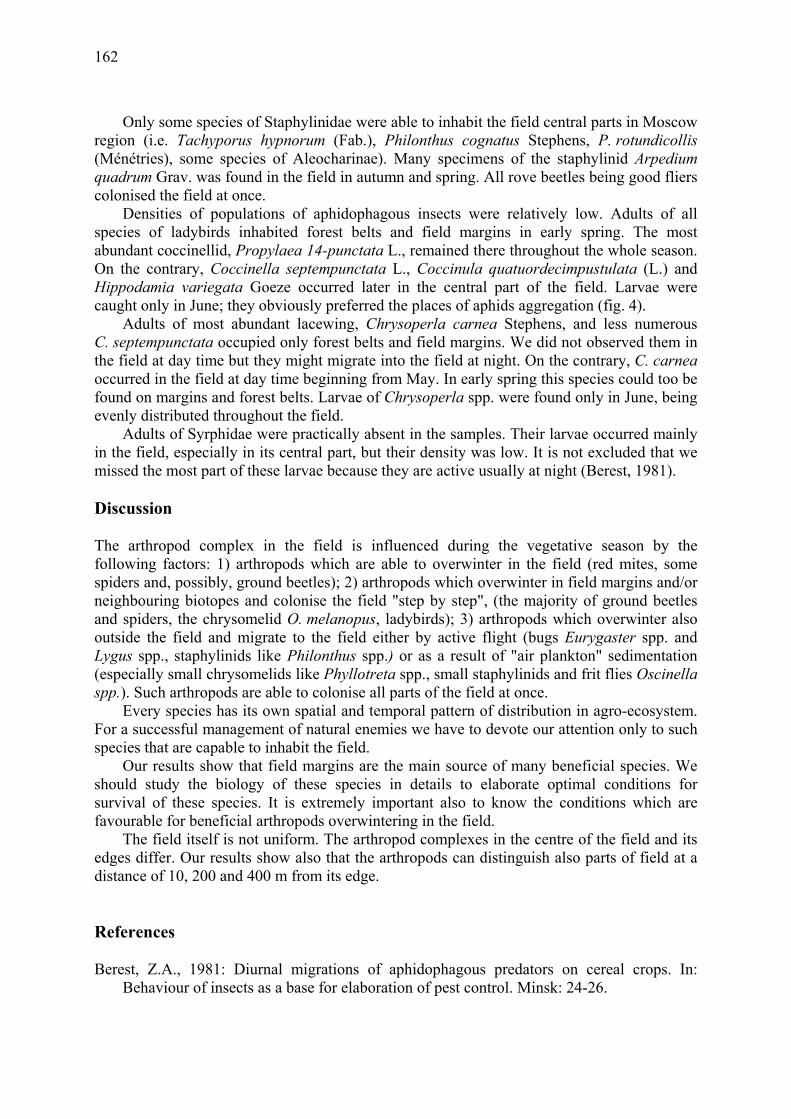
162
Only some species of Staphylinidae were able to inhabit the field central parts in Moscow region (i.e. Tachyporus hypnorum (Fab.), Philonthus cognatus Stephens, P. rotundicollis (Ménétries), some species of Aleocharinae). Many specimens of the staphylinid Arpedium quadrum Grav. was found in the field in autumn and spring. All rove beetles being good fliers colonised the field at once.
Densities of populations of aphidophagous insects were relatively low. Adults of all species of ladybirds inhabited forest belts and field margins in early spring. The most abundant coccinellid, Propylaea 14-punctata L., remained there throughout the whole season. On the contrary, Coccinella septempunctata L., Coccinula quatuordecimpustulata (L.) and Hippodamia variegata Goeze occurred later in the central part of the field. Larvae were caught only in June; they obviously preferred the places of aphids aggregation (fig. 4).
Adults of most abundant lacewing, Chrysoperla carnea Stephens, and less numerous C. septempunctata occupied only forest belts and field margins. We did not observed them in the field at day time but they might migrate into the field at night. On the contrary, C. carnea occurred in the field at day time beginning from May. In early spring this species could too be found on margins and forest belts. Larvae of Chrysoperla spp. were found only in June, being evenly distributed throughout the field.
Adults of Syrphidae were practically absent in the samples. Their larvae occurred mainly in the field, especially in its central part, but their density was low. It is not excluded that we missed the most part of these larvae because they are active usually at night (Berest, 1981).
Discussion The arthropod complex in the field is influenced during the vegetative season by the following factors: 1) arthropods which are able to overwinter in the field (red mites, some spiders and, possibly, ground beetles); 2) arthropods which overwinter in field margins and/or neighbouring biotopes and colonise the field "step by step", (the majority of ground beetles and spiders, the chrysomelid O. melanopus, ladybirds); 3) arthropods which overwinter also outside the field and migrate to the field either by active flight (bugs Eurygaster spp. and Lygus spp., staphylinids like Philonthus spp.) or as a result of "air plankton" sedimentation (especially small chrysomelids like Phyllotreta spp., small staphylinids and frit flies Oscinella spp.). Such arthropods are able to colonise all parts of the field at once.
Every species has its own spatial and temporal pattern of distribution in agro-ecosystem. For a successful management of natural enemies we have to devote our attention only to such species that are capable to inhabit the field.
Our results show that field margins are the main source of many beneficial species. We should study the biology of these species in details to elaborate optimal conditions for survival of these species. It is extremely important also to know the conditions which are favourable for beneficial arthropods overwintering in the field.
The field itself is not uniform. The arthropod complexes in the centre of the field and its edges differ. Our results show also that the arthropods can distinguish also parts of field at a distance of 10, 200 and 400 m from its edge.
References Berest, Z.A., 1981: Diurnal migrations of aphidophagous predators on cereal crops. In:
Behaviour of insects as a base for elaboration of pest control. Minsk: 24-26.
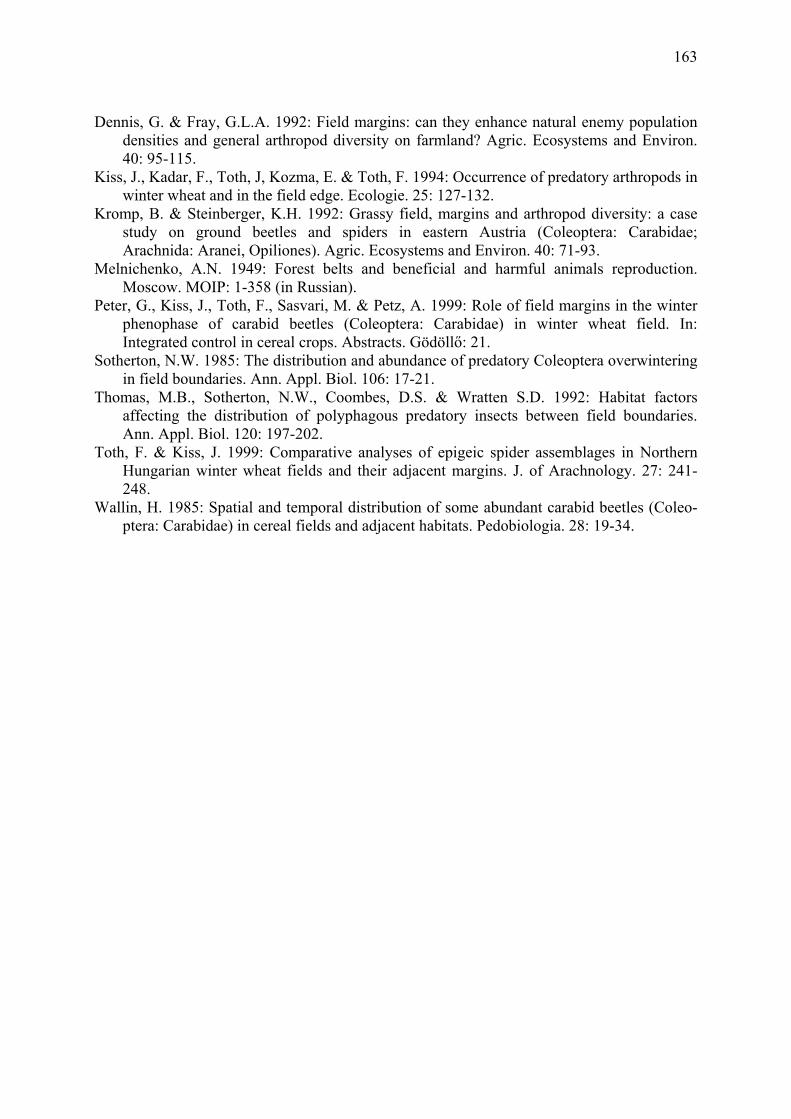
163
Dennis, G. & Fray, G.L.A. 1992: Field margins: can they enhance natural enemy population densities and general arthropod diversity on farmland? Agric. Ecosystems and Environ. 40: 95-115.
Kiss, J., Kadar, F., Toth, J, Kozma, E. & Toth, F. 1994: Occurrence of predatory arthropods in winter wheat and in the field edge. Ecologie. 25: 127-132.
Kromp, B. & Steinberger, K.H. 1992: Grassy field, margins and arthropod diversity: a case study on ground beetles and spiders in eastern Austria (Coleoptera: Carabidae; Arachnida: Aranei, Opiliones). Agric. Ecosystems and Environ. 40: 71-93.
Melnichenko, A.N. 1949: Forest belts and beneficial and harmful animals reproduction. Moscow. MOIP: 1-358 (in Russian).
Peter, G., Kiss, J., Toth, F., Sasvari, M. & Petz, A. 1999: Role of field margins in the winter phenophase of carabid beetles (Coleoptera: Carabidae) in winter wheat field. In: Integrated control in cereal crops. Abstracts. Gödöllő: 21.
Sotherton, N.W. 1985: The distribution and abundance of predatory Coleoptera overwintering in field boundaries. Ann. Appl. Biol. 106: 17-21.
Thomas, M.B., Sotherton, N.W., Coombes, D.S. & Wratten S.D. 1992: Habitat factors affecting the distribution of polyphagous predatory insects between field boundaries. Ann. Appl. Biol. 120: 197-202.
Toth, F. & Kiss, J. 1999: Comparative analyses of epigeic spider assemblages in Northern Hungarian winter wheat fields and their adjacent margins. J. of Arachnology. 27: 241-248.
Wallin, H. 1985: Spatial and temporal distribution of some abundant carabid beetles (Coleo-ptera: Carabidae) in cereal fields and adjacent habitats. Pedobiologia. 28: 19-34.

164
Integrated Control in Cereal Crops IOBC wprs Bulletin 24 (6) 2001
pp. 165 - 173
165
Studies of the pests of Canary-grass (Phalaris canariensis L.)
Kozma, E., Gólya. G. & Z. Záhorszki Szent István University, Faculty of Agricultural. and Environmental Sciences Department of Plant Protection, H-2100 Gödöllő, Páter K. u. 1. Hungary
Summary The aim of the present study was to gain knowledge about insect pests of Canary-grass (Phalaris canariensis L.), because little information is available on its pests and diseases and their dynamics. We conclude, that Oulema melanopus L. could be one of the dangerous pests on Canary-grass. In Hungary under optimal ecological circumstances Rhopalosiphum padi L. and the newly occurring Diuraphis noxia (Mordwilko) increase rapidly on the leaves and ears of Canary-grass.
Introduction Canary-grass (Phalaris canariensis L.) is grown in a relatively small area in Hungary and it is mostly exported as feed for birds. Canary-grass belongs to the Gramineae family. It has a poor fibrous root system and its stalk is thin straw. Its inflorescence is panicle shape (Fazekas, 1997; Antal, 1987).
In Hungary four species of barley beetles occur on cereals: Oulema melanopus L., O. rufocyanea (Suffrian), O. gallaeciana (Heyden) and O. septentrionis (Weise) (Kaszab 1962). These barley beetles originally lived on wild Gramineae spp. Later they changed to cereals (Kadocsa, 1957). First they caused significant damage on spring barley and oat, then they became the most important pest of winter wheat (Szilágyi et al., 1986). Labeyrie (cit. Balachowsky, 1963) mentioned Canary-grass as a host plant. Barley beetles are not only dangerous because of their direct damage to foliage, but also for their role as a virus vector (Princinger, 1991). The great grain aphid Sitobion avenae Fabr. is considered to be the most frequent cereal aphid by Szalay-Marzsó (1970). Kozma et al. (1994) found, that the most common aphid species near Gödöllő were Schizaphis graminum Rondani, Rhopalosiphum padi L., Metopolophium dirhodum Walker, Sitobium avenae and Diuraphis noxia (Mordvilko). D. noxia first appeared in a yellow pan trap in 1989 in the main cereal growing area of central Hungary (Basky & Eastop, 1991). In 1993 it was found in the territory of the River Tisza, Transdanubia and on the Great Plain (Basky, 1993a, 1993b), and on maize (Kozma et al., 1995). D. noxia is indigenous in the Mediterranean area and in the Iranian Turkestanian mountain range (Mordvilko, 1929; Nevskii, 1929). It has been a pest on wheat and barley in southern Russia since before 1900 (Grossheim, 1914). The first published outbreak of D. noxia was in the Crimea (Mokrzhetsky 1901) and was associated with the increase in the wheat growing area in the Ukraine. It was recorded as a serious pest of cereals in Ukraine in 1972 (Dyadechko & Ruban, 1975), in the USA (Pike, 1991) and South-Africa (Aalbersberg et al. 1987). D. noxia overwinters in the egg stage on winter wheat in Hungary. After harvest it lives on volunteer wheat, on Sorghum halapense and other Gramineae weeds. The alatae developing on these plants fly to winter wheat where the males and females develop, and after fertilisation the oviparae lay eggs which overwinter. It has six to eight generations per year (Burton, 1989; Pike, 1991). D. noxia causes white or purple streaks and rolled leaves (Hewitt et al. 1984), perhaps by injecting a toxin and by disturbing tissue water
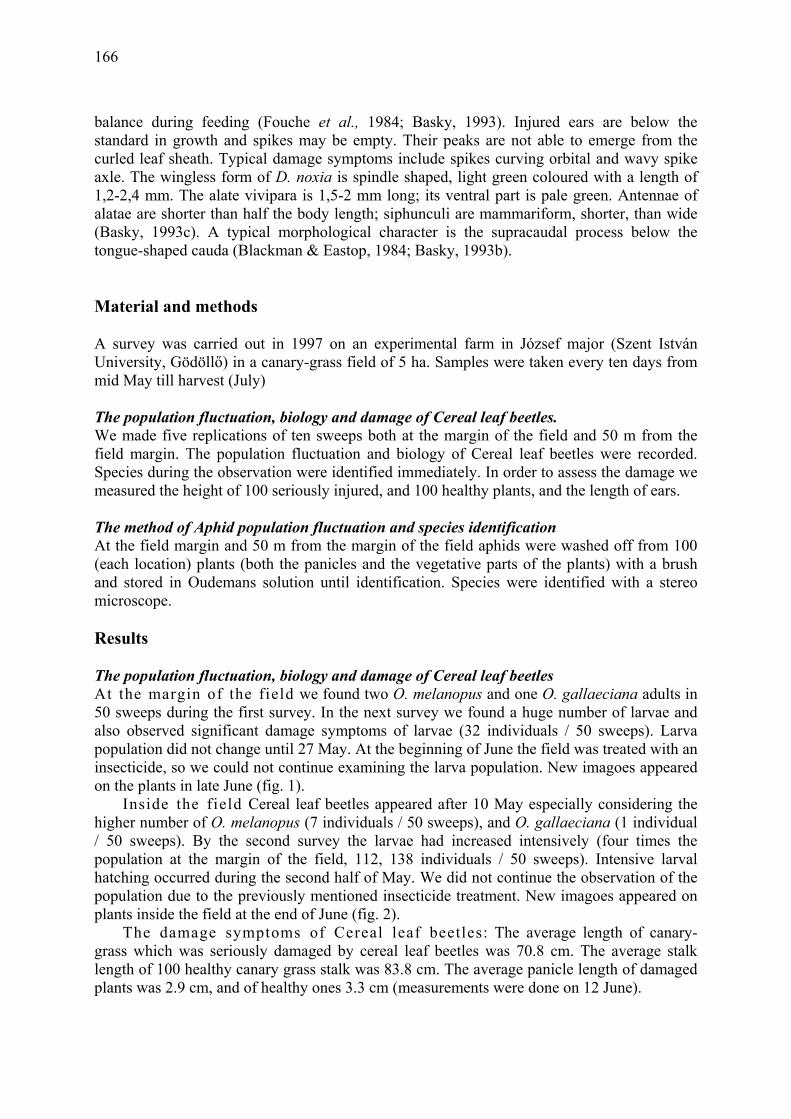
166
balance during feeding (Fouche et al., 1984; Basky, 1993). Injured ears are below the standard in growth and spikes may be empty. Their peaks are not able to emerge from the curled leaf sheath. Typical damage symptoms include spikes curving orbital and wavy spike axle. The wingless form of D. noxia is spindle shaped, light green coloured with a length of 1,2-2,4 mm. The alate vivipara is 1,5-2 mm long; its ventral part is pale green. Antennae of alatae are shorter than half the body length; siphunculi are mammariform, shorter, than wide (Basky, 1993c). A typical morphological character is the supracaudal process below the tongue-shaped cauda (Blackman & Eastop, 1984; Basky, 1993b).
Material and methods A survey was carried out in 1997 on an experimental farm in József major (Szent István University, Gödöllő) in a canary-grass field of 5 ha. Samples were taken every ten days from mid May till harvest (July) The population fluctuation, biology and damage of Cereal leaf beetles. We made five replications of ten sweeps both at the margin of the field and 50 m from the field margin. The population fluctuation and biology of Cereal leaf beetles were recorded. Species during the observation were identified immediately. In order to assess the damage we measured the height of 100 seriously injured, and 100 healthy plants, and the length of ears.
The method of Aphid population fluctuation and species identification At the field margin and 50 m from the margin of the field aphids were washed off from 100 (each location) plants (both the panicles and the vegetative parts of the plants) with a brush and stored in Oudemans solution until identification. Species were identified with a stereo microscope.
Results The population fluctuation, biology and damage of Cereal leaf beetles At the margin of the field we found two O. melanopus and one O. gallaeciana adults in 50 sweeps during the first survey. In the next survey we found a huge number of larvae and also observed significant damage symptoms of larvae (32 individuals / 50 sweeps). Larva population did not change until 27 May. At the beginning of June the field was treated with an insecticide, so we could not continue examining the larva population. New imagoes appeared on the plants in late June (fig. 1).
Inside the field Cereal leaf beetles appeared after 10 May especially considering the higher number of O. melanopus (7 individuals / 50 sweeps), and O. gallaeciana (1 individual / 50 sweeps). By the second survey the larvae had increased intensively (four times the population at the margin of the field, 112, 138 individuals / 50 sweeps). Intensive larval hatching occurred during the second half of May. We did not continue the observation of the population due to the previously mentioned insecticide treatment. New imagoes appeared on plants inside the field at the end of June (fig. 2).
The damage symptoms of Cereal leaf beetles: The average length of canary-grass which was seriously damaged by cereal leaf beetles was 70.8 cm. The average stalk length of 100 healthy canary grass stalk was 83.8 cm. The average panicle length of damaged plants was 2.9 cm, and of healthy ones 3.3 cm (measurements were done on 12 June).
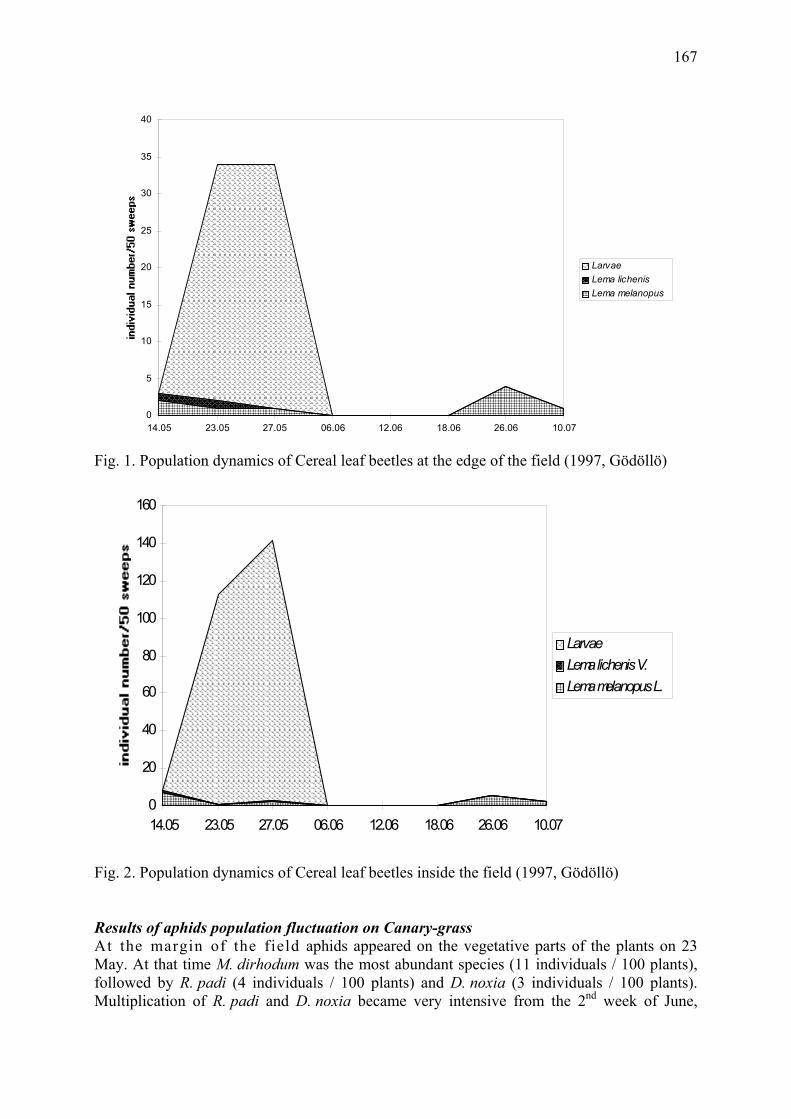
167
Fig. 1. Population dynamics of Cereal leaf beetles at the edge of the field (1997, Gödöllö)
Fig. 2. Population dynamics of Cereal leaf beetles inside the field (1997, Gödöllö) Results of aphids population fluctuation on Canary-grass At the margin of the field aphids appeared on the vegetative parts of the plants on 23 May. At that time M. dirhodum was the most abundant species (11 individuals / 100 plants), followed by R. padi (4 individuals / 100 plants) and D. noxia (3 individuals / 100 plants). Multiplication of R. padi and D. noxia became very intensive from the 2nd week of June,
0
5
10
15
20
25
30
35
40
14.05 23.05 27.05 06.06 12.06 18.06 26.06 10.07
LarvaeLema lichenisLema melanopus
0
20
40
60
80
100
120
140
160
14.05 23.05 27.05 06.06 12.06 18.06 26.06 10.07
LarvaeLema lichenis V.Lema melanopus L.
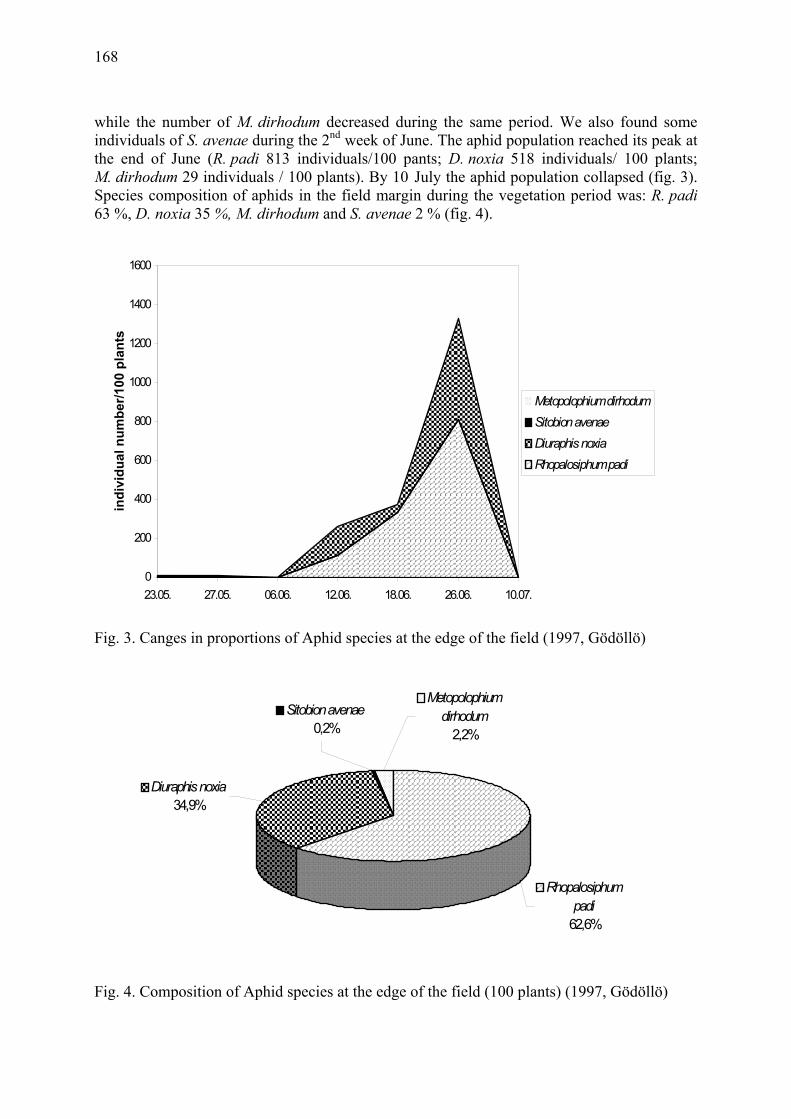
168
while the number of M. dirhodum decreased during the same period. We also found some individuals of S. avenae during the 2nd week of June. The aphid population reached its peak at the end of June (R. padi 813 individuals/100 pants; D. noxia 518 individuals/ 100 plants; M. dirhodum 29 individuals / 100 plants). By 10 July the aphid population collapsed (fig. 3). Species composition of aphids in the field margin during the vegetation period was: R. padi 63 %, D. noxia 35 %, M. dirhodum and S. avenae 2 % (fig. 4).
Fig. 3. Canges in proportions of Aphid species at the edge of the field (1997, Gödöllö)
Fig. 4. Composition of Aphid species at the edge of the field (100 plants) (1997, Gödöllö)
0
200
400
600
800
1000
1200
1400
1600
23.05. 27.05. 06.06. 12.06. 18.06. 26.06. 10.07.
indi
vidu
al n
umbe
r/100
pla
nts
Metopolophium dirhodumSitobion avenaeDiuraphis noxiaRhopalosiphum padi
Diuraphis noxia34,9%
Rhopalosiphumpadi
62,6%
Sitobion avenae0,2%
Metopolophium dirhodum
2,2%
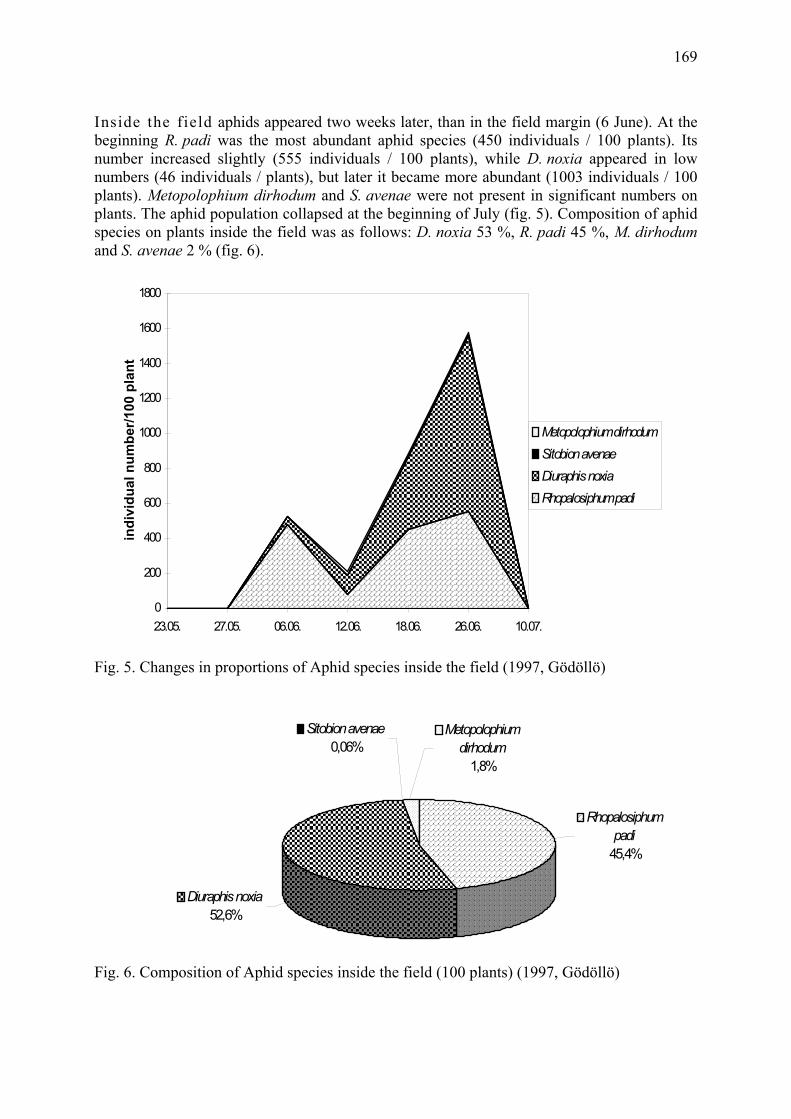
169
Inside the field aphids appeared two weeks later, than in the field margin (6 June). At the beginning R. padi was the most abundant aphid species (450 individuals / 100 plants). Its number increased slightly (555 individuals / 100 plants), while D. noxia appeared in low numbers (46 individuals / plants), but later it became more abundant (1003 individuals / 100 plants). Metopolophium dirhodum and S. avenae were not present in significant numbers on plants. The aphid population collapsed at the beginning of July (fig. 5). Composition of aphid species on plants inside the field was as follows: D. noxia 53 %, R. padi 45 %, M. dirhodum and S. avenae 2 % (fig. 6).
Fig. 5. Changes in proportions of Aphid species inside the field (1997, Gödöllö)
Fig. 6. Composition of Aphid species inside the field (100 plants) (1997, Gödöllö)
0
200
400
600
800
1000
1200
1400
1600
1800
23.05. 27.05. 06.06. 12.06. 18.06. 26.06. 10.07.
indi
vidu
al n
umbe
r/100
pla
nt
Metopolophium dirhodumSitobion avenaeDiuraphis noxiaRhopalosiphum padi
Diuraphis noxia52,6%
Rhopalosiphum padi
45,4%
Sitobion avenae0,06%
Metopolophium dirhodum
1,8%
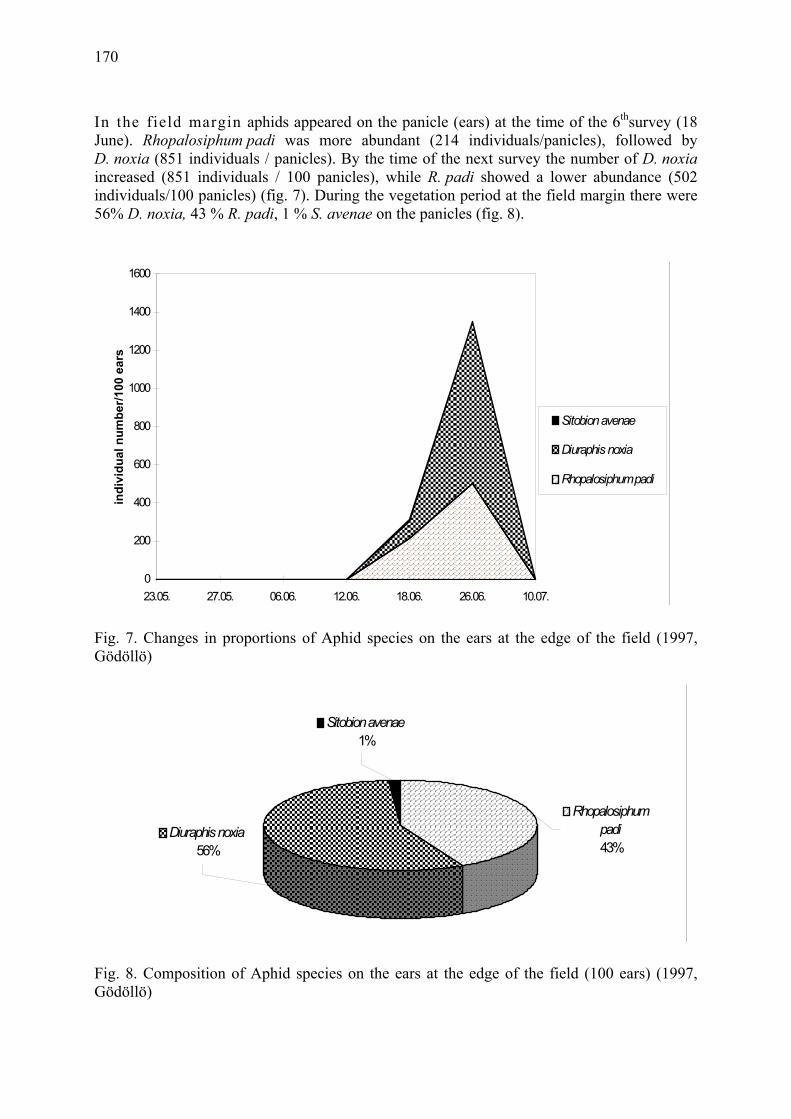
170
In the field margin aphids appeared on the panicle (ears) at the time of the 6thsurvey (18 June). Rhopalosiphum padi was more abundant (214 individuals/panicles), followed by D. noxia (851 individuals / panicles). By the time of the next survey the number of D. noxia increased (851 individuals / 100 panicles), while R. padi showed a lower abundance (502 individuals/100 panicles) (fig. 7). During the vegetation period at the field margin there were 56% D. noxia, 43 % R. padi, 1 % S. avenae on the panicles (fig. 8).
Fig. 7. Changes in proportions of Aphid species on the ears at the edge of the field (1997, Gödöllö)
Fig. 8. Composition of Aphid species on the ears at the edge of the field (100 ears) (1997, Gödöllö)
0
200
400
600
800
1000
1200
1400
1600
23.05. 27.05. 06.06. 12.06. 18.06. 26.06. 10.07.
indi
vidu
al n
umbe
r/100
ear
s
Sitobion avenae
Diuraphis noxia
Rhopalosiphum padi
Diuraphis noxia56%
Sitobion avenae1%
Rhopalosiphum padi43%
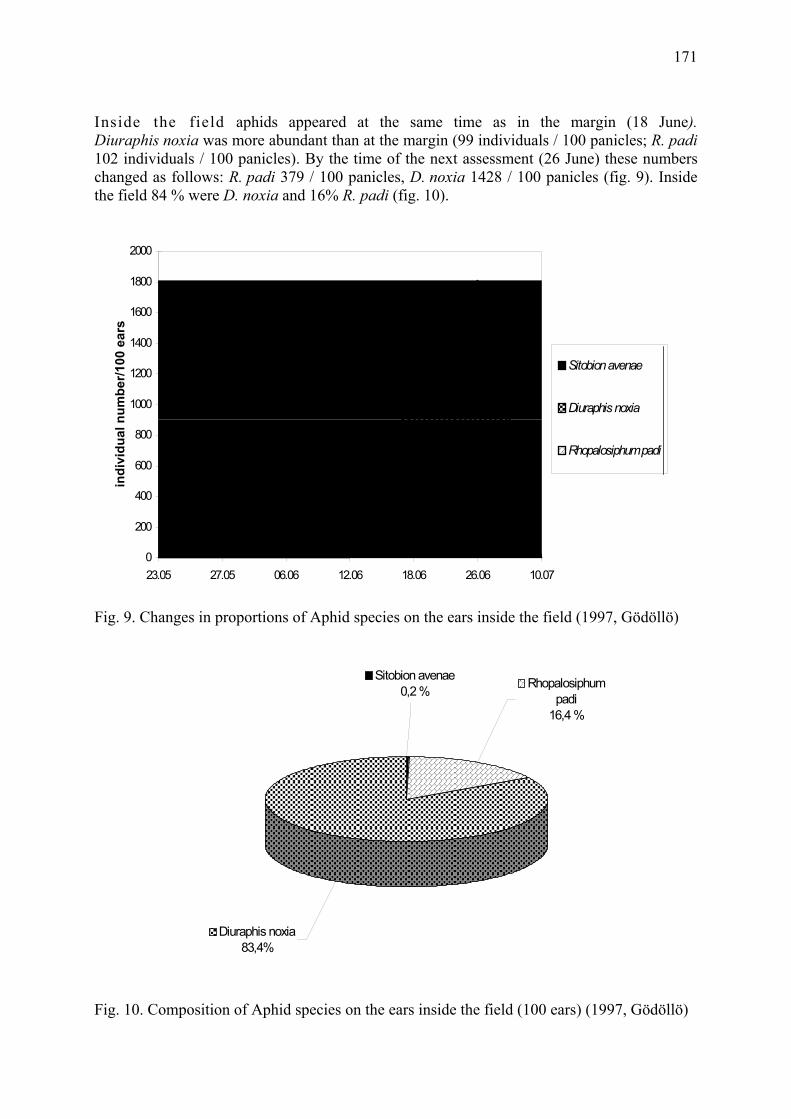
171
Inside the field aphids appeared at the same time as in the margin (18 June). Diuraphis noxia was more abundant than at the margin (99 individuals / 100 panicles; R. padi 102 individuals / 100 panicles). By the time of the next assessment (26 June) these numbers changed as follows: R. padi 379 / 100 panicles, D. noxia 1428 / 100 panicles (fig. 9). Inside the field 84 % were D. noxia and 16% R. padi (fig. 10).
Fig. 9. Changes in proportions of Aphid species on the ears inside the field (1997, Gödöllö)
Fig. 10. Composition of Aphid species on the ears inside the field (100 ears) (1997, Gödöllö)
0
200
400
600
800
1000
1200
1400
1600
1800
2000
23.05 27.05 06.06 12.06 18.06 26.06 10.07
indi
vidu
al n
umbe
r/100
ear
s
Sitobion avenae
Diuraphis noxia
Rhopalosiphum padi
Sitobion avenae0,2 % Rhopalosiphum
padi16,4 %
Diuraphis noxia83,4%
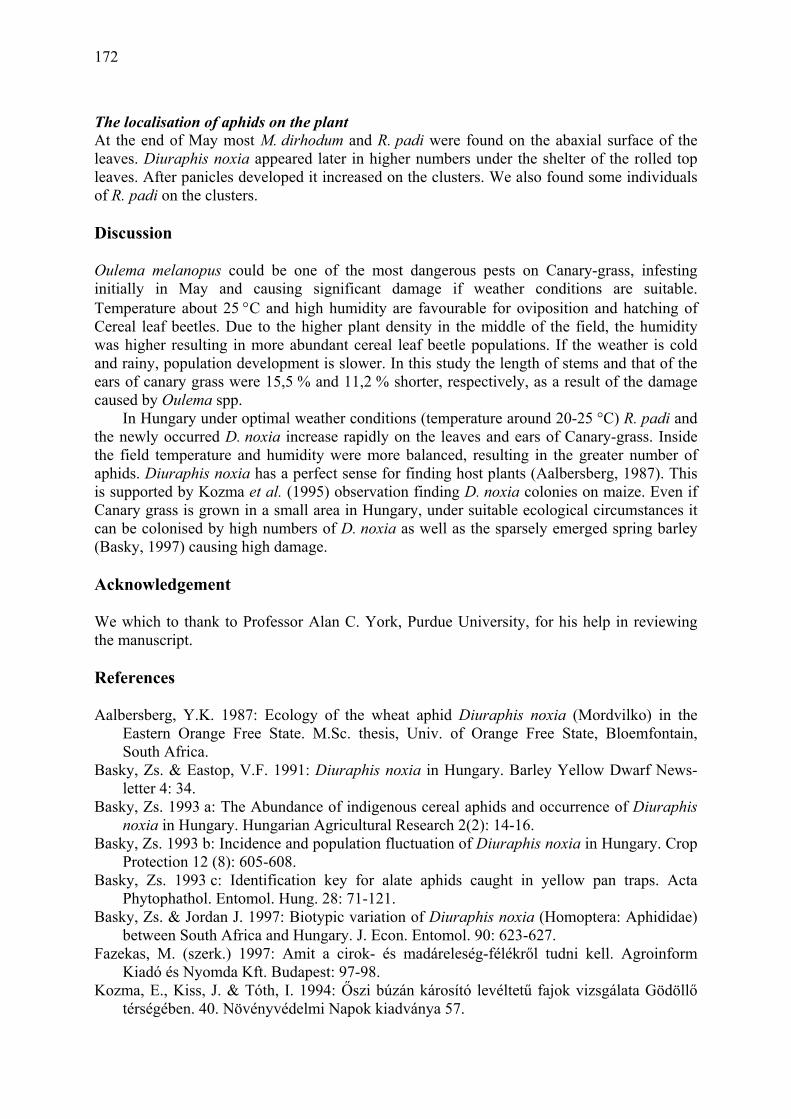
172
The localisation of aphids on the plant At the end of May most M. dirhodum and R. padi were found on the abaxial surface of the leaves. Diuraphis noxia appeared later in higher numbers under the shelter of the rolled top leaves. After panicles developed it increased on the clusters. We also found some individuals of R. padi on the clusters.
Discussion Oulema melanopus could be one of the most dangerous pests on Canary-grass, infesting initially in May and causing significant damage if weather conditions are suitable. Temperature about 25 °C and high humidity are favourable for oviposition and hatching of Cereal leaf beetles. Due to the higher plant density in the middle of the field, the humidity was higher resulting in more abundant cereal leaf beetle populations. If the weather is cold and rainy, population development is slower. In this study the length of stems and that of the ears of canary grass were 15,5 % and 11,2 % shorter, respectively, as a result of the damage caused by Oulema spp.
In Hungary under optimal weather conditions (temperature around 20-25 °C) R. padi and the newly occurred D. noxia increase rapidly on the leaves and ears of Canary-grass. Inside the field temperature and humidity were more balanced, resulting in the greater number of aphids. Diuraphis noxia has a perfect sense for finding host plants (Aalbersberg, 1987). This is supported by Kozma et al. (1995) observation finding D. noxia colonies on maize. Even if Canary grass is grown in a small area in Hungary, under suitable ecological circumstances it can be colonised by high numbers of D. noxia as well as the sparsely emerged spring barley (Basky, 1997) causing high damage.
Acknowledgement We which to thank to Professor Alan C. York, Purdue University, for his help in reviewing the manuscript.
References Aalbersberg, Y.K. 1987: Ecology of the wheat aphid Diuraphis noxia (Mordvilko) in the
Eastern Orange Free State. M.Sc. thesis, Univ. of Orange Free State, Bloemfontain, South Africa.
Basky, Zs. & Eastop, V.F. 1991: Diuraphis noxia in Hungary. Barley Yellow Dwarf News-letter 4: 34.
Basky, Zs. 1993 a: The Abundance of indigenous cereal aphids and occurrence of Diuraphis noxia in Hungary. Hungarian Agricultural Research 2(2): 14-16.
Basky, Zs. 1993 b: Incidence and population fluctuation of Diuraphis noxia in Hungary. Crop Protection 12 (8): 605-608.
Basky, Zs. 1993 c: Identification key for alate aphids caught in yellow pan traps. Acta Phytophathol. Entomol. Hung. 28: 71-121.
Basky, Zs. & Jordan J. 1997: Biotypic variation of Diuraphis noxia (Homoptera: Aphididae) between South Africa and Hungary. J. Econ. Entomol. 90: 623-627.
Fazekas, M. (szerk.) 1997: Amit a cirok- és madáreleség-félékről tudni kell. Agroinform Kiadó és Nyomda Kft. Budapest: 97-98.
Kozma, E., Kiss, J. & Tóth, I. 1994: Őszi búzán károsító levéltetű fajok vizsgálata Gödöllő térségében. 40. Növényvédelmi Napok kiadványa 57.
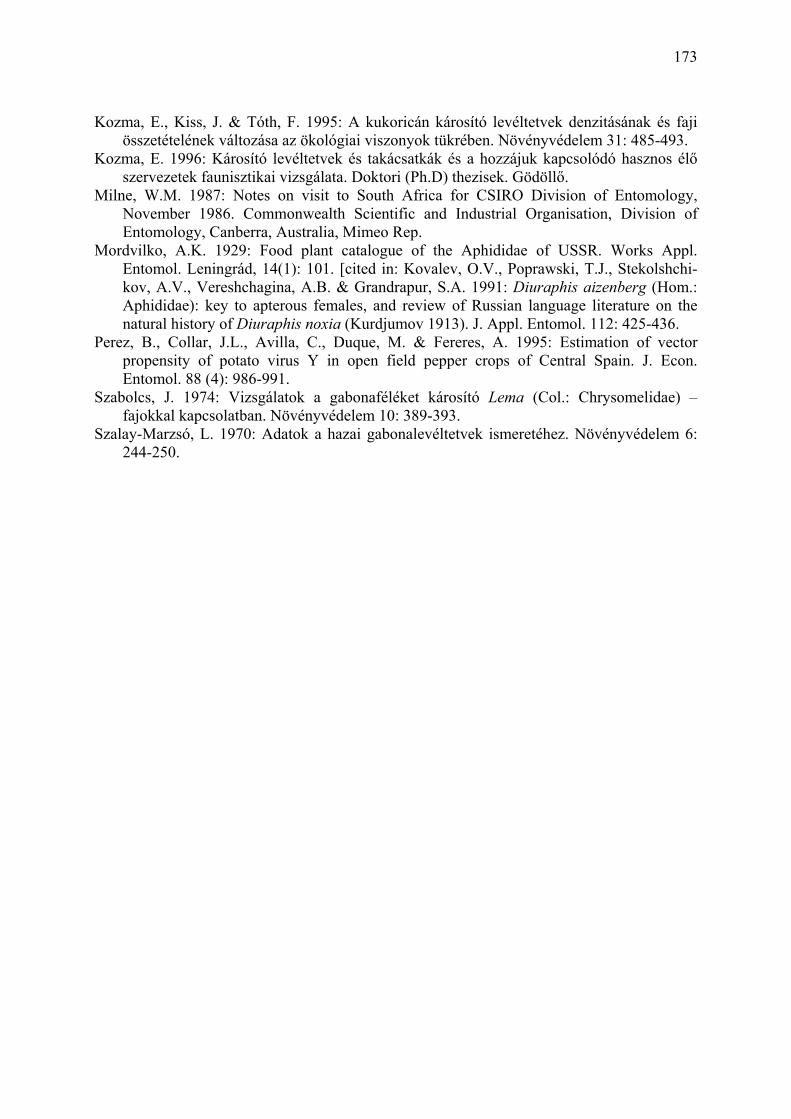
173
Kozma, E., Kiss, J. & Tóth, F. 1995: A kukoricán károsító levéltetvek denzitásának és faji összetételének változása az ökológiai viszonyok tükrében. Növényvédelem 31: 485-493.
Kozma, E. 1996: Károsító levéltetvek és takácsatkák és a hozzájuk kapcsolódó hasznos élő szervezetek faunisztikai vizsgálata. Doktori (Ph.D) thezisek. Gödöllő.
Milne, W.M. 1987: Notes on visit to South Africa for CSIRO Division of Entomology, November 1986. Commonwealth Scientific and Industrial Organisation, Division of Entomology, Canberra, Australia, Mimeo Rep.
Mordvilko, A.K. 1929: Food plant catalogue of the Aphididae of USSR. Works Appl. Entomol. Leningrád, 14(1): 101. [cited in: Kovalev, O.V., Poprawski, T.J., Stekolshchi-kov, A.V., Vereshchagina, A.B. & Grandrapur, S.A. 1991: Diuraphis aizenberg (Hom.: Aphididae): key to apterous females, and review of Russian language literature on the natural history of Diuraphis noxia (Kurdjumov 1913). J. Appl. Entomol. 112: 425-436.
Perez, B., Collar, J.L., Avilla, C., Duque, M. & Fereres, A. 1995: Estimation of vector propensity of potato virus Y in open field pepper crops of Central Spain. J. Econ. Entomol. 88 (4): 986-991.
Szabolcs, J. 1974: Vizsgálatok a gabonaféléket károsító Lema (Col.: Chrysomelidae) – fajokkal kapcsolatban. Növényvédelem 10: 389-393.
Szalay-Marzsó, L. 1970: Adatok a hazai gabonalevéltetvek ismeretéhez. Növényvédelem 6: 244-250.
Copyright © 2022 FDOKUMEN