ESAP Proceedings - CiteSeerX
212
Pastoral Livestock Systems: Opportunities and Challenges as a Livelihood Strategy Proceedings of the 15 th annual conference of the Ethiopian Society of Animal Production (ESAP) held in Addis Ababa, Ethiopia, October 4–6, 2007 Part II: Technical Papers Ethiopian Society of Animal Production P.O. Box 80019, Addis Ababa, Ethiopia ESAP Proceedings
-
Upload
khangminh22 -
Category
Documents
-
view
1 -
download
0
Transcript of ESAP Proceedings - CiteSeerX

Pastoral Livestock Systems: Opportunities and Challenges
as a Livelihood Strategy
Proceedings of the 15th annual conference of the Ethiopian Society of Animal Production (ESAP) held in Addis Ababa, Ethiopia, October 4–6, 2007
Part II: Technical Papers
Ethiopian Society of Animal Production P.O. Box 80019, Addis Ababa, Ethiopia
ES
AP
Pro
ceed
ings

Pastoral Livestock Systems: Opportunities and Challenges
as a Livelihood Strategy
Proceedings of the 15th annual conference of the Ethiopian Society of Animal Production (ESAP) held in Addis Ababa, Ethiopia, October 4–6, 2007
Ethiopian Society of Animal Production P.O. Box 80019, Addis Ababa, Ethiopia

Members of the Executive Committee of ESAP:
Dr. Tadele Dessie (ILRI, Ethiopia), President Ato Tezera Getahun (PFE), Vise President W/t Fanos Mekonnen (ILRI-IPMS), Secretary Dr. Tamrat Degefa (EIAR, Debre Zeit), Editor-in-Chief Ato Fekede Feyissa (EIAR, Holleta), Assistant Editor-in-chief Dr. Emiru Zewdie (NAIC, Addis Ababa), Accountant (Account's Officer) Dr. Nuru Adigaba (HBRC, Holeta), Auditor W/t Rehrahie Mesfin (EIAR, Holleta), Treasurer W/ro Yalemeshet W/Amanuel (EIAR, Debre Zeit), Vise secretary Dr. Zelalem Yilma (EIAR, Holeta), Liaison Officer
ESAP Office Secretary:
W/t Selamawit Tadesse, Office Secretary
Correct citation:
ESAP (Ethiopian Society of Animal Production) 2007. Pastoral Livestock Systems: Opportunities and Challenges as a Livelihood Strategy. Tamrat Degefa and Fekede Feyissa (Eds). Proceedings of the 15th Annual conference of the Ethiopian Society of Animal Production (ESAP) held in Addis Ababa, Ethiopia, October 4–6, 2007. ESAP, Addis Ababa. pp.

Table of Contents Welcome Address (15th ESAP Conference) Dr. Tadelle Dessie (ESAP President).................................................. iii Animal Feed and Nutrition ..................................................................................................................1 The Need For Grassland Research ............................................................................................................................. 3
Alemayehu Mengistu Compatibility and yield performance of different annual forage legumes undersown to different maize varieties.......................................................................................................................................................................... 7
Aklilu Mekasha, Ashebre Tegegn, Abrham Abera and Mandefro Nigussie Evaluation of the impact of plane of nutrition on growth and carcass traits of Horro lambs castrated at different ages ............................................................................................................................................................... 13
Gemeda Duguma, Tesfaye Taddesse, Takele Kumsa and Solomon Abegaz Evaluation of cowpea hay (V. unguaculata) vs. noug cake supplementation of cynodon dectylon on growth performances and carcass characteristics of Horro rams at Bako............................................................... 25
Temesgen Jembere, Gemeda Duguma, Ketama Demisse and Diriba Geleti Long term effects of plane of nutrition on lifetime productivity of Horro ewes.......................................................... 33
Gemeda Duguma, Solomon Abegaz and Ulfina Galmessa Napier grass (Pennisetum purpureum L.) on the edge of irrigation canals in the lowlands of Kewot woreda (Shewarobit), Ethiopia: a promising entry point............................................................................................ 41
Likawent Yeheyis, Nake Ziku, Ameha Sebsibe and Agraw Amane Effects of variety and growth stage on proportions of different morphological fractions in oats (Avena sativa L.).......................................................................................................................................................... 47
Fekede Feyissa , Adugna Tolera , Solomon Melaku Animal Production .............................................................................................................................63 Major Constraints and Development Intervention in Livestock Marketing in Pastoral Areas of Borana: A Review and Policy Implications............................................................................................................................... 65
Fufa Dawo, Mengistu Nigusse, Chindi Bayissa, Ejeta Jabessa, Sileshi Damte, Elisabeth Farmers and Brutawit Dawit Abdi
Payment systems influence quality: Ethiopian milk and milk products current situation and future move............................................................................................................................................................................. 81
Zelalem Yilma, Aynalem Haile and Tadelle Dessie .............................................................................................. 81 The effect of different weaning age on growth performance of calves under full suckling system at Horro Guduru Cattle Breeding and Improvement Ranch.......................................................................................... 97
Habtamu Abera Mulugeta Kebede, Ulfina Galemessa, Jiregna DesalegnandTsegaye Chemeda The food and feeding habit of oreochromis niloticus l. (pisces: cichlidae) in lake babogaya, Ethiopia ................ 109
Lemma Abera Hirpo The breeding saeason and condition factor of oreochromis niloticus (pisces: cichlidae) in lake babogaya, ethiopia .................................................................................................................................................... 119
Lemma Abera Hirpo Reconnaissance survey on the river fisheries of Benishangul-gumuz regional state ........................................... 129
Yared Tigabu and Husein Abegaze Current status and condition of introduced fish species in small water bodies: case studies at Birati reservoir ..................................................................................................................................................................... 163
Adamneh Dagne and Fassil Degefu Growth performance and economic returns of male monosex and unsexed tilapia (Oreochromis niloticus L.) culture in ponds fed on wheat bran............................................................................... 173
Adamneh Dagne, Aschalew Lakew Fassil Degefu and Abeba W/Gebriel

Ethiopian Society of Animal Production
ii 15th ESAP-Proceedings
Economic Valuation of Phenotypic Traits: An Impetus for Market Orientation of Livestock Production Systems? ................................................................................................................................................................... 183
Girma Tesfahun Kassie, Clemens C.B.A. Wollny, Awudu Abdulai, Adam Drucker, and Workneh Ayalew Spatial differences in soil nutrient flux and stocks in Ethiopian highland mixed farming system: implications for livestock nutrient redistribution and sustainability of the system .................................................. 191
Amare Haileslassie

Welcome Address (15th ESAP Conference)
Dr. Tadelle Dessie (ESAP President)
H.E.Dr. Abera Deressa, State Minister, Ministry of Agriculture and Rural Develo9pment (MOARD) Dr. Solomon Assefa DDG, EIAR,
• Distinguished invited Guests, • Representatives of:
• Farmers • Pastoralists
• Development practitioners, • Entrepreneurs, • Think-thanks, • Conference Participants,
Ladies and Gentlemen:
On behalf of the executive committee of the Ethiopian Society of Animal Production (ESAP) in particular and the ESAP family in general, I feel deeply honored and overwhelmingly pleased when I welcome each and every one of you to this robust gathering of the 15th Annual Conference of our Society.
Ladies and Gentlemen:
Ethiopia is endowed not only with large but diverse livestock resources. However, Ethiopia is using its rich endowment to little advantage. For many years’ livestock production in Ethiopian-and indeed agriculture more generally was seen as a poor investment for development. But after years of being ignored, livestock issues are beginning to be put back on Ethiopia’s development agenda. Livestock are being recognized as essential assets for livelihoods; as key to moving out of poverty; as a way into lucrative markets; as a source of foreign exchange; as well as it serves as an important cultural resources, social safety nets and means of saving.
Today, however, a new ‘livestock revolution’, fulelled by a massive growth in global demand for food of animal origin (milk, meat, eggs), is being hailed, with important development implications for developing world including Ethiopia. Market is in the center of this new revolution as it is demand driven.
Distinguished Guests and Participants
It was with the intension of helping to address some of these questions more specifically in the pastoral settings, in light of experiences from the national and global environment that this years’ conference theme has bee committed to the “Pastoral Livestock System: Opportunities and Challenges as a Livelihood strategy”.

Ethiopian Society of Animal Production
iv 15th ESAP-Proceedings
The trusts of this conference include:
1. Current and emerging livelihood strategies in pastoral areas 2. Examine the implications of national development policies and strategies as they pertain to
enhancement of livelihood in pastoral areas in the third millennium 3. On-going global debate on future of Pastoralism as a livelihood strategy as related to
Ethiopian context 4. Challenges and Opportunities in service delivery and human capacity building in pastoral
areas to improve human welfare in the third millennium 5. The role of the private sector in enhancing livelihood strategies in pastoral areas in the third
millennium
Ladies and Gentlemen:
The future of the pastoral livestock systems in particular and Ethiopian livestock industry in general lies greatly on the commitment of all of us, professionals, serving in the research, development and education system, private sector, policy makers, CSOs to change the above challenges into opportunities and benefit through utilization of resources in a sustainable manner to the benefit of the economic development of the nation in general and pastoralists in particular.
Ladies and Gentlemen:
After analyzing the Strength, opportunities, weaknesses and challenges we in the livestock sector development is facing, the EC committee of ESAP raised pertinent questions. Such as should we continue as we are or do we need to transform our selves as a society that contribute more in the livestock sector development supporting other stakeholders?
Ladies and Gentlemen:
ESAP is the transformation process with the vision to actively involve in
• Knowledge management to be a national and regional warehouse of development/research information
• Public-private partnership that is to play a role in establishing the link amongst major stakeholders and help bridge the weak link between academia/experts and policy makers, and also between producers and marketers.
• Working on advocacy and networking etc
If ESAP is to do the above, it needs huge support from public institutions, the privates sector and NGOs that should make significant investment in assisting ESAP and members should also be engaged in formulating and implementing the new visions of ESAP.
Let me mention very few of the achievements of ESAP this year that are worth mentioning:
1. Development of knowledge management system for programs and projects in the country. 2. Livestock Policy recommendations were prepared and presented to the concerned bodies at
MoARD and other stakeholders, 3. ESAP was able to organize a workshop on Animal Genetic Resources in Africa at Institute of
Biodiversity (IBC) together with League of Pastoral People (LPP) an NGO based in Germany IBC, PFE; this conference was funded by FAO and LPP. Country focal points on AnGR from

Ethiopian Society of Animal Production
15th ESAP-Proceedings v
the whole of Africa gathered to prepare an output which was used as an input to the Interlaken Conference held just a month ago.
4. ESAP was also able increase its financial status almost six times from what it was just two years ago.
5. Four newsletters, each issue focusing on a pertinent topic were published, of which three of them were funded by different NGOIs which showed interest on the pertinent issue.
6. On top of this all, ESAP was also able to publish Amharic livestock production and management manuals, again each focusing on pertinent topics intended to benefit the farmers and development agents at the low level were prepared in a very simplified language.
7. ESAP has also been able to be a registered member of world Animal Association and the DAD Net of FAO.
Are very few to mention:
More presentations and discussions are to come on this issue in the courses of the conference.
Last but by no means not least, I would like to thank all organizations and individuals that in one way or another contributed to the success of this conference organization and help us to undertake our mission as a professional society. Special thanks go to the management of EIAR for allowing us to use this hall with its facilities.
I thank you all for your attention


ANIMAL FEED AND NUTRITION


The Need For Grassland Research
Alemayehu Mengistu
Email: [email protected]
For more than a hundred years scientific research has been recognized as essential to the development and improvement of agriculture. Its service to modern agriculture is commonly considered to have begun with the work of Lawes and Gilbert at Rothamsted in 1829. Since that time, research has grown continuously. Most countries have one or more stations for research; some have a system of several, representing all-important agricultural regions.
Most efforts of these stations have been concentrated on the problems of field crops such as wheat, maize, sugar cane, and cotton, and on fruits and vegetables. Now, principally on account of the emphasis on soil conservation and the scarcity and rising cost of farm labour, there is a tendency to give more attention to grassland management, including the production, harvesting, and storage of forage crops; the establishment and management of pasture and range plants by selection and breeding; the selection and management of livestock for maximum return from grazing lands; and the production and utilization of supplementary feed needed to carry the animals over periods when grazing is inadequate for their maintenance or for economic production above maintenance. To treat all phases of grassland research adequately and efficiently, it is necessary to have the participation and effective co-operation of workers trained in the various sciences, such as animal husbandry, animal and plant genetics, pathology and physiology, soils agronomy, agrostology, ecology, botany, zoology, chemistry, entomology, and economics. Departments or divisions of animal industry and plant industry should co-operate freely and fully. This is usually effected by plant science men handling the problems of plant production and the effects of animals upon plants, and the animal science men handling the livestock and determining the effects of plants upon animals.
It seems appropriate, therefore, to outline the basic problems of grassland agriculture and the various phases of grassland management, which require research.
“The old desire that every farm should first produce food enough and to spare for every man and beast upon it, before any thought of produce sales has been outdated. In some cases, tractors and fertilizers seem to have eliminated the need for animals. Fields have been worked for years on end without the smallest addition of animal manure. In some areas, overstocking and soil destruction have been accentuated by the reduction of livestock diseases and the provision of watering places without proper regard for the carrying capacity of the vegetation.
“The need for an animal-plant balance is generally accepted but it has never been adequately investigated. Animal and crop production for sale on world markets have little to do with the creation of a permanent way of life on the land.
“A Natural Cycle: Soil fertility in farming is bound up with the growing of plants, whether s natural vegetation, pastures, or field crops, with the consuming of these crops by man and animals, and with the return of animal waste and other plant food to the soil. Experiences have shown that it is impossible to break this cycle for more than a short period of years without dire consequences to the land and the people dependent upon it. All permanent farm systems depend upon this simple structure. But we pay far too little attention to soil-building farming systems, especially on heavily bonded or mortgaged farms where the soil is being destroyed by taking everything off and returning little or nothing.

Ethiopian Society of Animal Production
4 15th ESAP-Proceedings
In many countries (like South Africa), research is being undertaken which aims to discover the inter-relationship between animals and plants in the work of soil building. One of the objects is the production of a continuous flow of feed of a consistently high standard, without which animals cannot be satisfactorily produced. There follows the investigation of what proportion of plant growth the soil can afford to lose each year without suffering depletion. This proportion and no more (either in animal or plant form) should be available for sale off the farm. This is not animal production, nor is it crop production, but it is closely bound up with both. It is essentially soil conservation.
“Ultimately, no system of farming can be regarded as nationally practical unless it allows for the maintenance of fertility on the farm. ‘Improved’ methods of agricultural production, introduced in all good faith, have undoubtedly led to soil destruction over the last decades, such as the introduction of the mould board plough without adequate measures to prevent accelerated erosion.
“The Knowledge Required: We know, because the animals feed every day, there must be a continuity of flow of animals’ feed from herbage, whether form natural growth, or pastures, or crops, or all three. The greater the improvement in the type of livestock, the greater is the skill needed to provide a satisfactory flow of feed. Critical knowledge is required of what the pasture and range can do: when the top growth of pasture plants can be removed with the least damage to root growth and root reserve, which are essential for the continued life and effective performance of the plants during the remainder of the current season and during the seasons to come; the potentialities of different pasture and range types as annual, temporary, or permanent grazing, or as hay crops; the sequence of pastures throughout they year; and the correct use of available supplements from arable land.
“The working of this flow of feed into a system-in which the animals are moved from field to field through the seasons with an easy margin of sufficiency and with experienced assurance of the capacity of each ley and forage unit-is one of the most fascinating studies in farming. The correct use of the manure produced, whether on pastures of concentrates, the purchase and application of commercial fertilizers all are intimately connected with the fertility level of the farm as a whole.
“Without this knowledge, grave risks must be taken that the animals may find themselves without feed for a month or two, owing to a break or failure in the sequence. This break actually happens on the majority of farms every year. The kind of pastures and crops used a needs critical trial; they have different fertility requirements and it is more than likely that, on the poorer soils, most of them will need more fertilizing than the manure produced on the farm affords.
“Research should aim at a true balance between the soil and the type of animal, the crop and the type of pasture. A guess is not likely to be right-the alternatives are too numerous is, the issues are too complex. Under most conditions in many countries (like Ethiopia), this kind of integration has not been attempted on a critical experimental basis. The far too common occurrence of scrub cattle, soil depletion and erosion, and the failure of artificial pastures testify to the need for acquiring this knowledge. We cannot afford to be without effective research on such fundamental problems. Guesses are costly, and failures may point to the wrong answers. The right answers must be sought by experiments, laid down with a view to the permanence of the whole farming system and not solely from the point of view of immediate production of saleable commodities.”

Animal Feed and Nutrition
15th ESAP-Proceedings 5
Research has already shown how grasslands can be made more productive. This study has brought forward many of examples, and there are many others in the literature. But simply attaining the highest yields of forage is not enough. Such forage may have such a high water content and low protein, mineral or net energy value that animals do not consume enough to thrive. Hence, the researcher’s work is never done. Research needs to be intensified, digging deeper into old and new problems. Research needs to be broadened, to comprehend all the complex factors involved. Along this path- when the results of research are passed on to actual producers on farms in terms they can understand-lies grater production from grasslands, more nutritious feed food for livestock people everywhere, and a better way of life for farmers.


Compatibility and yield performance of different annual forage legumes
undersown to different maize varieties
Aklilu Mekasha, Ashebre Tegegn, Abrham Abera and Mandefro Nigussie
Melkassa Agricultural Research Center, P.O.Box 436, Nazareth Ethiopia
Abstract Compatibility and yield performance of four annual forage legumes and their effect on three maize varieties were assessed in terms of maize grain and residue dry matter and forage yields of the legumes at Melkassa Agricultural Research Center (MARC) for two years (2003-2005). The maize varieties included in the trial were Melkassa-I, Katumani, and A511 representing extra early, early and intermediate maturity sets, respectively. The forage legumes were Lablab purpureus-147, Vigna unguiculata-9333, Macropetilium lathyroids-6955 and Melilothus alba-7275. The treatments were arranged, in factorial RCBD with three replications. The results revealed that in all the maize varieties, grain yield did not show significant difference (P>0.05) due to undersowing the annual forage legumes. However Melkassa-1 and Katumani gave relatively better but not significantly different (P> 0.05) yields of 42.8 and 41.8 q ha-1, respectively. Among the legumes, Lablab purureus-147 gave significantly higher (P<0.05) forage dry matter yields of 10.6 and 11.2 q ha-1 when undersown to the extra early and early maturing maize varieties, respectively. On the other hand significantly higher maize residue yields (P<0.05) were recorded when the forage legumes were undersown to the intermediate maturity maize variety A511. Therefore, from the results of the present study it could be concluded that undersowing erect growing annual forage legumes with narrow leaf orientation to extra early and early maturing maize varieties could be promising for dry land areas.
Key words: Undersowing, annual forage legumes, extra early, early and intermediate maize varieties
Introduction The central Rift Valley area of Ethiopia is known for its traditional agropastoral mode of
livestock production (Amsalu et. al, 2002) where crop production is increasing with human population and the demand for food crops. The expansion of crop production to moisture stressed areas with low, erratic, unpredictable rainfall patterns and high evapotranspiration rates are backed by development of alternative crop varieties (Mandefro et. al., 2001). The development and release of late, intermediate, early and extra early maturing crop varieties with better agronomic management practices have thus provided farmers with wider opportunities to further expand crop cultivation to marginal grazing land.
Maize is one of the most important crops widely cultivated and increasingly expanding for food grain production and stover for animal feed. Besides, leaf striping, tassels and thinnings at vegetative stage of the crop are vital source of feed (Diriba et al., 2002; Halima, 2005). The farming system; however, still remains far behind to make an adequate supply of feed and shortages prevail year round. With endeavors to overcome, high yielding forage grasses and legumes with minimum package were introduced (Alemayehu, 2000). But the priority by the farmers to allocate land more often to crops and their reluctance in allotting for forage as crop has remained an obstacle to adoption (Alemayehu, 2000). In such areas, integration of forges in

Ethiopian Society of Animal Production
8 15th ESAP-Proceedings
to the cropping system could serve as an alternative to improve feed supply (Mohammed-Saleem et.al., 1986; Chamberlin, 1986; Abate et. al., 1992; Alemayehu, 2000; Diriba et. al., 2002; Tekleyohannes and Worku, 2000).
Integration of forage crops mainly of legumes with priority food crops, are proven to have multiple economic, environmental and social advantages, over mono cropping of the same crops. The implications may be explained in terms of increasing labour and capital effectiveness in one hand, reducing weed growth, soil erosion, risk of crop failures, and disease and pest damages on the other. Moreover, intercropping reduces the requirements for application of additional nitrogen fertilizer. It improves availability of soil nitrogen to the companion and subsequent crops with further increment in grain and stover yield and quality (Getnet and Lulseged, 1991). The advantages; however, overweigh when ever the intercrops are compatible in time and space so that adverse competition effects could be avoided (Aklilu and Alemayehu, 2007) for maximum gross monetary return (Patel and Rajagopal, 2000). The purpose of this study was therefore to asses the effectiveness of undersowing different annual forage legumes with different maize varieties in terms of forage yield and grain and residue biomass yield of maize.
Materials and Methods Study site
The experiment was conducted at Melkassa Agricultural Research Center for two years (2003-2005). The center is located in the mid Rift Valley areas of Ethiopia at 8o 24’ N latitudes and 39o
21’ E longitudes. The center has an altitude of 1550 mamsl with mean annual rainfall of 763mm and maximum and minimum temperature of 28.5 and 13.9 OC, respectively. The soils are loam in texture with 1.16 % organic matter content, 0.112 % total nitrogen content, 5.64 ppm P2O5
content, 3.12 meq/100 K2O and pH value of 7.6.
Treatments and design
The treatments consisted of three maize varieties namely Melkassa-1, Katumani and A511 which represents extra early maturing (90 days after sowing), early maturing (110 days after sowing) and intermediate maturing (130 days after sowing) categories respectively and four forage legumes included were Lablab purpureus-147, Vigna unguiculata-9333, Macropetilium lathyroids-6955 and Melilothus alba-7275. The three maize varieties were under sown with the four annual forge legumes in a Randomized Complete Block Design (RCBD) with three replications. The legumes were selected on the bases of their erect bushy growing habit and narrow leaf orientation.
Management, data collection and analysis
The maize varieties were planted on a net plot area of 12 m2( 4mX3m) with inter and intra row spacing of 0.75m and 0.25m at the onset of main rainy season ( June- July) on finely and uniformly ploughed and ridged furrows. Sixteen kg ha-1 nitrogen and 48 kg ha-1 P2O5 were applied in the form of (NH4)2 HPO4 at maize planting to all plots. The annual forage legumes were undersown in between rows of maize at 75cm and 10 cm inter and intra row spacing at knee height growth stage of maize.
The undersown annual forage legumes were harvested at 50% flower pod stage by cutting close to the ground. The harvested fresh matter was weighed to the nearest kg instantly in field with spring balance of 25 kg capacity. Representative samples of about 200gm were oven dried to constant weight at 70 OC for estimation of dry matter yield.

Animal Feed and Nutrition
15th ESAP-Proceedings 9
At maturity, plant height of maize was measured from ground to the tip of the tassel. The crop was mowed close to the ground; ears striped off and threshed. Rsidue drymater yield was estimated by Oven drying about 200gm of the stover, leaves, cob, and the husk all together at 105 OC to constant weight. The grain yield of maize was estimated after drying the seeds to about 10-15% moisture content. Total dry matter yield was estimated as the sum of maize residue dry matter yield and the undersown forage legumes dry matter yield. The data were finally subjected to analysis of variance at 5% level of significance.
Results and Discussion Analysis of the two years data did not show significant year (P>0.05) effect on maize grain,
residue dry matter and total dry matter yields. The result given in Table 1 is thus based on pooled analysis of variance of the two years data.
Undersowing of the annual forage legumes did not show significant effect (P<0.05) on grain yield of all maize varieties. However, compared to that of the sole maize, inclusion of Lablab purpureus-147, Vigna unguiculata-9333 and Melilothus alba-7275, reduced grain yield of the maize varieties by 3.6 to 9% in the case of extra-early; 1.6 to 19.9% in the case of early and 9.4 to 12.9 % in the case of intermediate categories. While, there was slight improvement in all categories with inclusion of Macropetilium lathyroids-6955 (Table 1). The findings were partly in agreement with Lupwayi el.a1. (1996) and Mpairwe et. al. (2002) where inclusion of forage legumes depressed grain yield of companion cereals by more than 8%.
Among the forage legumes, Lablab purpureus-l47 showed significantly higher (P<0.05) forage dry matter yields of 10.6 and 11.2 qha-1 when undersown to the extra early and early maize categories, respectively followed by Vigna unguiculata-9333. The results were in agreement with Reddy and Visser (1997), where higher forage yields of cowpea was reported with early maturing millet varieties. The observed higher forage yields of the legumes under extra early and early maize categories were also comparable to the observed plant height (Table 1). The inclusion of legumes slightly increased plant height of Melkassa-1 and A511 and depressed that of Katuman over the respective pure stands of the varieties. Contrary to the tall growing A511, significantly shorter (P<0.05) plant height of Melkassa-1 and Katumani might have thus avoided shading effects to the under story legumes and hence competition for light (Reddy and Visser, 1997). Besides, erect growth and narrow leaf orientation of the legumes might have also increased competitiveness of the crops in intercrop for light (Ram and Singh, 2003). The extra early and earliness of the maize varieties might have also reduced duration of competition effects for nutrient and moisture with the legumes (Redfearn et. al., 1999).
Maize residue dry matter yields were significantly higher (P<0.005) when forage legumes were undersown to the intermediate maturity maize A511 (Table 1) and also for pure stand of the variety. The observed increment was 22% higher with inclusion of Vigna unguiculata-9333 over the yield of the variety in pure stand. Similar increment in fodder (residue) yields of cereals was reported by Mpuirwe et. a1. (2002) when intercropped with forage legume. Intercropping forage legumes also found to improve the fodder crude protein concentration and dry matter digestibility with reduced neutral detergent fiber content of the residue (Mpairwe et. al, 2002).
Though it was significantly higher (P<0.005) for the intermediate A511, under sowing of the annual forage legumes generally increased the total dry matter yield (maize residue + forage legumes) in all the maize varieties. Compared to the pure stands of each category, the observed

Ethiopian Society of Animal Production
10 15th ESAP-Proceedings
yield increment was 34.1 to 44.1% higher in case of the extra early, 12.9 to 46.5% higher in the case of the early and 15.1 to 27.95% higher in case of the imtermedate varieties( Table 1). The increase in total yield was brought about by higher leaf-area index, leaf: stem ratio, crop growth rate, relative growth rate, net assimilation rate, forage and nitrogen uptake of the component crops as observed by Ram and Singh (2003).
Table 1 Effect of undersowing annual forage legumes on grain and residue dry matter yield of maize and the under sown legumes and total harvestable dry matter yield from maize field.
Conclusions and Recommendations As observed in present study undersowing of annual forage legumes, selected on the bases of their erect, non-spreading and non-trailing growth habit and narrow vertically oriented leaves, increased the total dry matter yield harvested from the maize field that can be utilized as feed by livestock. The increase in total yield was brought about by increase in dry matter yield of the undersown legumes and maize residue with out affecting maize grain yield. The annual legumes however showed best performance and gave more yields when undersown with early and extra early maturing maize varieties than with intermediate / late maturing varieties. Among the tested annual forage legumes Lablab purpureus-147 and Vigna ungiculata-9333 were found to be best compatible for undersowing with maize under semiarid condition. Therefore, from the results of the present study it could be concluded that undersowing these annual forage legume accessions (or lines or collections) to early and extra early maturing maize varieties will be promising for dry land areas. In the future similar work need to be done to identify and develop
Treatment Grain yield (q/ha)
Legume DM yield (q/ha)
Height of maize at harvest (m)
Residue DM yield (q/ha)
Total DM Yield (t/ha)
Extra-early category( 90 days after
Melkassa-1 44.3 0.0 1.59 22.0 2.2 Melkassa-1- Lablab purpureus-147 40.3 10.6 1.68 25.0 3.2 Melkassa-1- Macropetilium lathyroids- 46.0 3.5 1.65 18.0 2.2
Melkassa-1- Vigna unguiculata-9333 40.8 9.9 1.61 22.0 3.2 Melkassa-1- Melilothus alba- 7275 42.7 5.8 1.67 23.7 3.0 Early category (110 days after sowing)
Katumani 44.2 0.0 1.97 25.6 2.6 Katumani- Lablab purpureus-147 43.5 11.2 1.97 26.3 3.6 Katumani- Macropetilium lathyroids- 44.9 2.9 1.89 27.0 3.1
Katumani- Vigna unguiculata-9333 35.4 4.8 1.95 25.3 3.0 Katumani- Melilothus alba- 7275 41.0 3.7 1.85 25.1 2.9 Intermediate category(130 days after sowing)
A511 37.2 0.0 2.27 48.3 4.8 A511- Lablab purpureus-147 33.7 8.4 2.24 49.3 5.8 A511- Macropetilium lathyroids-6955 38.2 2.0 2.30 59.1 6.1 A511- Vigna unguiculata-9333 32.4 6.5 2.31 55.3 6.2 A511- Melilothus alba- 7275 33.1 3.1 2.31 52.5 5.6
LSD 16.95 4 0.09 11.4 1.2

Animal Feed and Nutrition
15th ESAP-Proceedings 11
compatible and high yielding varieties of forage crops to be grown in association with all varieties of food crops grown in differently agroecologies. So that, we able to successfully integrate forage production with food crops production and enhance availability of feed to achieve feed and food security of the country.
Acknowledgments We are extremely thankful to the ILRI Forage Crops Genbank who kindly supplied us planting materials of the forage legumes and the Ethiopian Institute of Agricultural Research for financing this activity. References
Abate Tedla, Tekalign Mamo and Getinet Gebeyehu (1992) Integration of forage legumes in to cereal cropping systems in vertisols of the Ethiopian highlands. Tropical agriculture 69:68-72.
Alemayehu Mengistu (2000) Forage production in Ethiopia. A case study with implication for livestock production. ESAP publication No, 3.
Aklilu Mekasha and Alemayehu Mengistu (2007) Measurements in pasture and forage cropping systems. Ethiopian Institute of Agricultural Research. Technical manual 18.
Amsalu Sisay, Rober Baars, and Zinash Sileshi (2002) Herbacious species composition and dry matter yield of grazing areas in the mid rift valley of Ethiopia. In: livestock in food security roles and contributions-proceedings of the 9th annual conference of the Ethiopian Society of Animal Production (ESAP) held in Addis Ababa, Ethiopia, August 30-31, 2001.
Chamberlin R. J., Peake D.C.I., Mccown R.L.,Vallis I. and Jones R.I.K. (1986) Competition for nitrogen between maize crop and forage legume intercrops in a wet-dry tropical environment. In: Haque I., Jutzi S. and Neate P.J. H. (eds.) potentials of forage legumes in farming systems of Sub-Saharan Africa. Proceedings of a workshop held at ILCA, Addis Ababa, Ethiopia, and 16-19 September 1985. ILCA, Ethiopia.
Diriba Geleti and Lemma Gizachew (2002) Forage yield performance and residual effect of undersown forage crops on maize grain and residue yields. In: proceedings of the 9th annual conference of the Ethiopian Society of Animal Production (ESAP), held in Addis Ababa, Ethiopia, August 30-31, 2001.
Getnet Assefa and Lulseged Gebrehiwot (1991) Effect of forage legume on the yield of subsequent cereal crops. In: Proceedings of the 4th annual livestock improvement conference 13/5 November 1991. IAR, Addis Ababa, Ethiopia.
Halima Hassen (2005) Impact of defoliation of maize leaf on grain, stover and undersown forage production. In: proceedings of the 12th annual conference of the Ethiopian Society of Animal Production (ESAP) held in Addis Ababa, Ethiopia, August 12-14, 2004.
Lupwayi, N. Z., Abate Tedla and Hailu Regassa (1996) On farm integration of forage legumes in to cereal cropping systems in the Ethiopian highlands. African Crop Science Journal 4(3):365-372.
Mandefro Nigussie, Hussien Mohammed, Gelana Sebokssa, Gezahegne Bogale, Yosef Beyene, Hail-Michael S. and Aderajew Hadis (2001) Maize Improvement for drought stressed areas of Ethiopia. In: the second national maize workshop of Ethiopia 12-16 November, 2001 Addis Ababa, Ethiopia.

Ethiopian Society of Animal Production
12 15th ESAP-Proceedings
Mohammed-Saleem M.A. and R.M. Otsyina (1986) Grain yields of maize and the nitrogen contribution following Stylosanthes pasture in the Nigerian sub-humid zone.Expl.Agric.22, 207-214.
Mpairwe, D.R., Sabiitti, E.N., Ummuna, N.N., Tegegne, A. and Osuji, P. (2002) Effect of intercropping cereal crops with forage legumes and source of nutrients on cereal grain yield and fodder dry matter yields. African Crop Science Journal 10(1):pp 81-97.
Patel, J.R and Rajagopal, S. (2000). Nitrogen management for production of sorghum (Sorghum bicolar) and cowpea (Vigna unguiculata) forage under intercropping system. Indian J. Agronomy 48(1): pp34-37.
Ram, S. N. and Singh, B. (2003). Physiological growth parameters forage yield and nitrogen uptake of sorghum (Sorghum bicolar) as influenced with legume intercropping, harvesting time and nitrogen level. Indian J.Agronomy48 (1):pp38-41.
Reddy, K.C. and Visser, P.L. (1997) Cowpea intercrop growth and yield as affected by time of planting relative to millet. African Crop Science Journal 5(4): pp 351-357.
Redfearn, D.D., Buxton, D.R. and Devine, T.E. (1999) Sorghum intercropping effect on yield, morphology, and quality of forage Soybean. Crop Science 39(5): pp 1380-1384
Tekle-Yohannes Berhanu and Worku Jimma (2000). The effect of under sowing barley with forage legumes on grain and straw yields of barley and herbage yields of forage legumes in the highlands of Bale. In: proceedings of the 7th annual conference of the Ethiopian society of Animal Production (ESAP) held in Addis Ababa, Ethiopia, 26-27, May 1999.

Evaluation of the impact of plane of nutrition on growth and carcass traits of Horro lambs castrated at different ages
Gemeda Duguma1, Tesfaye Taddesse1∗, Takele Kumsa and Solomon Abegaz2
Oromia Agricultural Research Institute, Bako Agricultural Research Center, P.O.Box 03, West Shoa, Bako Ethiopia; 2Jimma University, Ambo College, P.O.Box 19 Ambo, West Shoa, Ambo, Ethiopia
Abstract A total of 54 Horro rams from Bako Agricultural Research Center were used with the main objectives of investigating the impact of different nutritional levels on growth and carcass traits of Horro lambs castrated at different ages. The lambs were randomly assigned to three different treatments based on their birth status (whether they were single born or twin born) and liveweight. The different treatments were: Grazing + 200g concentrate/head/day (T1), Grazing + 350g concentrate/head/day (T2) and Grazing + 500g concentrate/head/day (T3). The concentrate offered was composed of 49.5% noug cake (Guizotia abyssinica), 49.5% ground maize grain and 1% salt. Each treatment had three different groups (uncastrated, castrated at six months and those castrated at 12 months of age) with six lambs per group. Treatment had significant influences (p < 0.05) both on liveweight and body condition of animals, but not consistent. Significant differences (p < 0.05) were also observed among intact, those castrated at six months and those castrated at 12 months of age. The results of this study has showed that rams castrated at 12 months of age have shown a higher liveweight gain and dressing out percentage over the other groups. Thus, from the results of the current study and results of works done earlier on the same breed, it can be concluded that castration of Horro sheep before yearling age is not advisable.
Key words: Body condition, castration, Horro sheep, liveweight
Introduction The aim of the sheep producer is to get his lambs to slaughter weight in a short time with
maximum amount of lean meat, minimum bone and an amount of fat, which is desired by the market. Among the many factors, which contribute to variation in growth performance and carcass composition in sheep, plane of nutrition plays a major role. A high plane of nutrition improves performance and carcass composition of lambs (Owen, 1976; Andrew and Speedy, 1980; Mega and Nyakv, 1985; cited by Massae et al., 1992). This is in association with increased intake of dietary energy and protein.
Castration also plays an important role in fattening in addition to its contribution in controlled mating schemes designed for genetic improvement and/or controlled reproduction. In the sheep production system the major aim of castration is to fatten animals. In entire animals, the level of androgen is high and thus protein anabolism is favored. The skeleton also responds to testesterone, with the bones becoming larger. Bone is not an edible tissue, but its proportion in the carcass affects those of other edible carcass tissues such as lean meat (Mahgoub and Lodge, 1998). In many countries, castration of sheep that are intended for slaughter is a common long-standing practice.
∗ Corresponding author

Ethiopian Society of Animal Production
14 15th ESAP-Proceedings
In Ethiopia farmers castrate rams older than 2 years of age and fatten them for the highly priced markets that precede holy festivals. This is particularly important at smallholder level and entails castration of 'unwanted' males before they reach puberty. Louica et al., (1977) reported that castration at different ages might produce different outcomes. However, Solomon et al., (2000) reported that early castration for Horro lambs appears to be the best time of castration. Nevertheless, Gemeda et al., (2002) suggested that castration before a year of age for Horro sheep is not advisable for meat production. Demissie et al., (1989) also reported that castration of young animals resulted in slower growth, increased internal fat deposition, increased fat: muscle ratios in the carcass, and lighter bone formation for the same breed of sheep. The differences in research results observed from the same breed of sheep might be due to the same feeding regimes practiced in the studies. As a result this study was initiated with the following objective.
Objective To investigate the impact of nutritional level on growth and carcass traits of Horro lambs castrated at different ages.
Materials and Methods
Fifty-four Horro ram lambs from the center were used for the study. They were treated against internal and external parasites before and during the trial. The lambs were stratified based on body weight and their birth status (whether they were born single or twin), and randomly assigned to three different treatments. Each treatment had three different groups (un-castrated lambs, castrated at six month and castrated at year of age). The animals were fed until the age of about 15 months. The three different treatments were: Grazing + 200g concentrate/head/day (T1), Grazing + 350g concentrate/head/day (T2) and Grazing + 500g concentrate/head/day. The three feeding levels were based on the previous recommendation made by Ulfina et al. (2003) at Bako Research Center.
Lambs were allowed to graze around the pen from about one month to weaning during half of the day (9:00am to 1:00pm) and supplemented their respective treatment feed during half of the day (1:00pm to 5:00am). Subsequently after weaning lambs were allowed to graze on natural pasture during the day (9:00am to 1:00pm) and supplemented their respective treatment feed at night. The concentrate supplement was composed of 49.5% maize grain, 49.5% noug cake and 1% salt. The amounts of supplements were same through out the study period. Feed offered and refused was weighed daily through out the course of the experiment.
Animals were weighed at the beginning and fortnightly during the course of the experimental period. At the end of the experiment three lambs from each group were slaughtered. The carcass was portioned into hind or fore quarter between 10th and 11th ribs. Three ribs (11th and 13th) were chilled overnight at -4oc, and then the rib eye muscle was traced after cutting the chilled rib eye muscle at two sites (left and right) using a graduated ruler.
The major carcass traits measured were; head, forelegs, hind legs, lung and trachea, liver, heart, kidney fat tree, visceral full, visceral empty, carcass weight, forequarters, hindquarters, tail weight, dressing percentage, kidney fat, omental fat, skin, spleen, fat thickness at 12th rib (left and right), eye rib area (left and right) and age at slaughter in days.

Animal Feed and Nutrition
15th ESAP-Proceedings 15
Statistical analysis
The General Linear Model of the Statistical Analysis System (SAS, 1996) was used in the analysis of the data.
Results and discussion
Analysis of variance of liveweight change and least squares means (+ SE) were given in Tables 1 and 2, respectively. The overall least squares means of liveweight of rams treated under different feeding levels were 25.0+4.98, 33.5+4.82 and 39.0+4.31 for T1, T2 and T3, respectively. As the analysis of variance showed there was no significant variation in growth performance of Horro rams offered the three feed treatments in the first 75 days of the experiment. However, liveweight differences were observed 6th months after the experiment was commenced (Table 1). Gemeda et al. (2006) have also reported that Horro rams offered different feeding levels did not show significant variation in liveweight change for the first two months of feeding period.
Age of castration had significant effect on liveweight of rams though it was not consistent. No significant differences were observed in rams' liveweight both at early and end of the experimental period (Table 1). Its effect was revealed almost 3 months after the commencement of the experiment and ended at about 14 months. The differences in body condition scores have almost followed the same trend (Table 2). Solomon, et al. (2000) who used the same breed of sheep, but castrated at early age than ours, reported no significant variation in growth performance between lambs castrated at different ages. The difference may be due to differences in feeding levels as they treated all experimental animals under similar feeding levels. The results of the current study were in agreement with Demissie et al., (1989) who reported a greater growth response and final body weight for entire lambs than castrates. In our study, either entire rams or rams castrated at yearling of age showed a higher liveweight and body condition score as compared to those castrated at early age (at 6 month of age).
The effect of treatment by group interaction did not significantly influence both rams liveweight and body condition score. Analysis of variances and least squares means (±SE) of average daily gains (ADG) of Horro rams is given in Tables 3 and 4, respectively. Average daily gain of animals was significantly affected (at least at p<0.05) by feeding treatments only during the first 215 days of the feeding period (Table 3). The least squares means of average daily gain from 0 - 159 days and from 159 - 215 days of age for T1, T2 and T3 were 25.0±4.98, 33.5±4.82, 39.0±4.31 and 19.7±8.01, 33.3±7.85 and 35.4±8.24, respectively (Table 4).
The least square means of average daily gains for intact rams, castrated at 6 months and 12 months of age were 33.7+4.49, 27.5+4.49 and 36.1+4.66, respectively. During the first 215 days intact rams showed a faster gain followed by those rams castrated at yearling age. In general, under all the three feeding levels rams castrated at 12 months of age have shown the highest average daily gain followed by uncastrated rams. Here it is clearly observed that castration at 6 months of age has depressed growth as compared to late castration (12 months of age) and intact. This is in agreement with results reported by Louca et al., (1977) who reported castration at 7 months of age, depressed growth as compared to those left intact. Mahgoub and Lodge (1994 b) also reported for Omani sheep that castration at 1 week of age resulted in a lower rate of growth and deposition of excess fat. Gemeda et al. (2002) also reported that early castration for the Horro sheep breed is not advisable before a year of age.

Ethiopian Society of Animal Production
16 15th ESAP-Proceedings
Table 1. Analysis of variance for liveweight of Horro sheep as affected by feeding treatments and castration at different ages
Mean Squares and significance level Sources df
IWt Wt2 Wt4 Wt6 Wt8 Wt10 Wt12 Wt14 Wt16 Treatment 2 17.33NS 16.06NS 44.04NS 106.67** 87.40** 111.95** 105.36** 67.61NS 54.15NS
Group 2 3.67NS 50.64NS 118.14** 100.01** 121.27** 90.14** 88.93* 37.805NS 25.22NS
Trt * Group 4 5.14NS 21.91NS 21.46NS 16.78NS 10.83NS 5.70NS 11.41NS 21.95NS 10.72NS E. mean 14.11 16.67 20.51 16.65 13.49 15.37 16.71 22.43 20.30
R2 (%) 14.07 32.07 43.35 54.32 58..78 55.55 54.14 42.72 39.33 C.V. (%) 30.68 27.22 23.51 18.42 15.77 15.64 16.29 17.77 15.91 *p<0.05; ** p<0.01; Trt*group=Treatment by group interaction; IWT=Initial Liveweight; Wt2=Liveweight measured two months from the commencement of the trail; Wt4= Liveweight measured four
months from the commencement of the trial; ...; Wt16=Liveweight measured 16 months from the commencement of the trial
Table 2. Analysis of variance for body condition of Horro sheep as affected by feeding treatments and castration at different ages
Mean Squares and significance level Sources df IBC BC2 BC4 BC6 BC8 BC10 BC12 BC14 BC16
Treatment 2 0.11NS 1.24* 3.44** 4.07*** 3.19*** 1.60NS 0.88NS 2.59* 1.49NS Group 2 0.07NS 0.24NS 1.45* 0.72* 0.73NS 0.91NS 1.36* 0.51NS 0.86NS
Trt * Group 4 0.63NS 0.45NS 1.20* 0.73** 0.40NS 0.35NS 0.13NS 0.31NS 0.10NS E. mean square 0.46 0.36 0.40 0.16 0.37 0.52 0.37 0.73 0.70
R2 (%) 18.89 32.92 59.31 74.91 50.57 34.58 38.17 36.49 31.51 C.V. (%) 26.13 20.03 18.55 11.36 21.16 23.04 20.22 26.50 23.98
*p<0.05; ** p<0.01; Trt*group=Treatment by group interaction; IBC=Initial Body condition score; BC2=Body condition score measured two months from the commencement of the trial; BC4= Body
condition score measured four months from the commencement of the trial; ...; BC16= Body condition score measured 16 months from the commencement of the trial.
Table 3. Analysis of variance for average daily gains of rams castrated at different ages
Source df ADG1 ADG2 ADG3 ADG Treatment 2 2967.79** 753.57** 1004.12NS 378.84NS Group 2 2.360.13** 128.07NS 124.22NS 141.63NS Trt * Group 4 432.31NS 1199.87NS 643.65NS 48.32NS E. mean square 270.99 666.34 610.93 167.56 R2 (%) 65.41 32.31 27.44 32.65 C.V. (%) 36.25 87.07 250.90 39.51 ADG1=Average Daily Gain from 0-159 days; ADG2= Average Daily Gain from 159-318 days; ADG3= Average Daily Gain from 318-477 days; ADG= Average Daily Gain from 0-477days
Table 4. Least squares means (±SE) of liveweight gain of rams treated under different feeding levels
Source ADG1 ADG2 ADG3 ADG Overall Means 45.4 29.7 9.9 32.8 Treatment 1 28.4±5.11a 19.7±8.01a 10.2±7.67a 25.0±4.98a 2 58.4±4.86b 33.3±7.85b 0.7±8.23b 33.5±4.82ab 3 56.2±5.01b 35.4±8.24b 21.4±7.89ac 39.0±4.31b Groups Intact 42.1±4.86a 33.3±8.24 14.6±7.89 33.7±4.49 Castrated at 6M 36.0±4.59a 26.6±7.20 8.1±6.89 27.5±4.98 Castrated at 12M 65.0±5.49b 28.5±8.60 9.6±8.90 36.1±4.66
Different superscripts in rows denote significant differences within effects. Abbreviations as indicated in Table 3.

Animal Feed and Nutrition
15th ESAP-Proceedings 17
Fig. 1. Liveweight change of rams offered different treatments
10.012.014.016.018.020.022.024.026.028.030.032.0
1 3 5 7 9 11 13 15 17 19 21 23 25 27 29 31 33
Time (Every 2 weeks)
Liv
ewei
ght (
LS
Mea
ns)
TRT 1 TRT 2 TRT 3
Fig. 2. Liveweight change of rams castrated at different ages
10.012.014.016.018.020.022.024.026.028.030.032.0
1 3 5 7 9 11 13 15 17 19 21 23 25 27 29 31 33
Time (Every 2 weeks)
Liv
ewei
ght (
LS
Mea
ns)
Grp 1 Grp 2 Grp 3
Carcass Traits
Analysis of variances and least squares means (+SE) of the different carcass traits measured was given in Tables 5 and 6, respectively. No significant variation was observed in carcass traits among the different groups, except for hindquarter, heart, blood and lung (Table 5). Significant difference was observed between intact and castrates. However, no significant difference was observed between those animals castrated at 6 month of age and those castrated at yearling. The least square means for fore quarter were 6.4±0.37, 6.2±0.37 and 6.2±0.37 for intact, castrated at 6 months of age and castrated at 12 months of age, respectively. Research results for Omani sheep reported by Mahgoub and Lodge (1994a) were in agreement with results of the current study. According to Mahgoub and Lodge (1994a), uncastrated lambs had a higher carcass lean

Ethiopian Society of Animal Production
18 15th ESAP-Proceedings
content in the fore quarter that was associated with more developed shoulder and neck regions than those of castrates.

Animal Feed and Nutrition
15th ESAP-Proceedings 19
Table 5. Analysis of variance for body condition of Horro sheep as affected by feeding treatments and castration at different ages
FWT DP FQ HQ REY LVR HRT KD LNG VF VE OF BLD Treatment 2 36.786 0.986 3.566* 0.739 5.378(0.06) 28039.962 1296.167 65.909 4439.962 0.083 0.111 101607.386* 0.021 Group 2 30.144 1.091 2.489 1.152(0.07) 6.008* 27008.144 2519.076(0.09) 489.394* 39122.348** 0.823 0.066 25801.326 0.117(0.06) Trt * Group 4 3.372 3.796 0.234 0.207 0.549 17659.295 1356.247 45.513 9085.497 0.875 0.614 8451.282 0.024 R2 (%) 67.55 42.01 70.00 69.05 73.32 54.73 68.81 57.91 74.62 43.78 34.75 63.67 59.80 C.V. (%) 11.04 4.57 13.41 10.12 12.50 23.74 17.02 10.45 13.09 8.31 17.46 92.79 12.87 E. mean 10.484 3.581 0.803 0.306 1.318 19075.00 801.813 112.50 5521.875 0.367 0.149 21962.50 0.0289
*p<0.05; ** p<0.01; Trt*group=Treatment by group interaction; FWT= Final Liveweight; DP=Dressing Percentage; FQ=Fore Quarter; HQ=Hind Quarter; REY=Rib eye Area; LVR=Liver; HRT=Heart; KD=Kidney; LNG=Lung; VF=Visceral Full; VE=Visceral Empty;
OF=Omental Fat; BLD=Blood

Animal Feed and Nutrition
15th ESAP-Proceedings 21
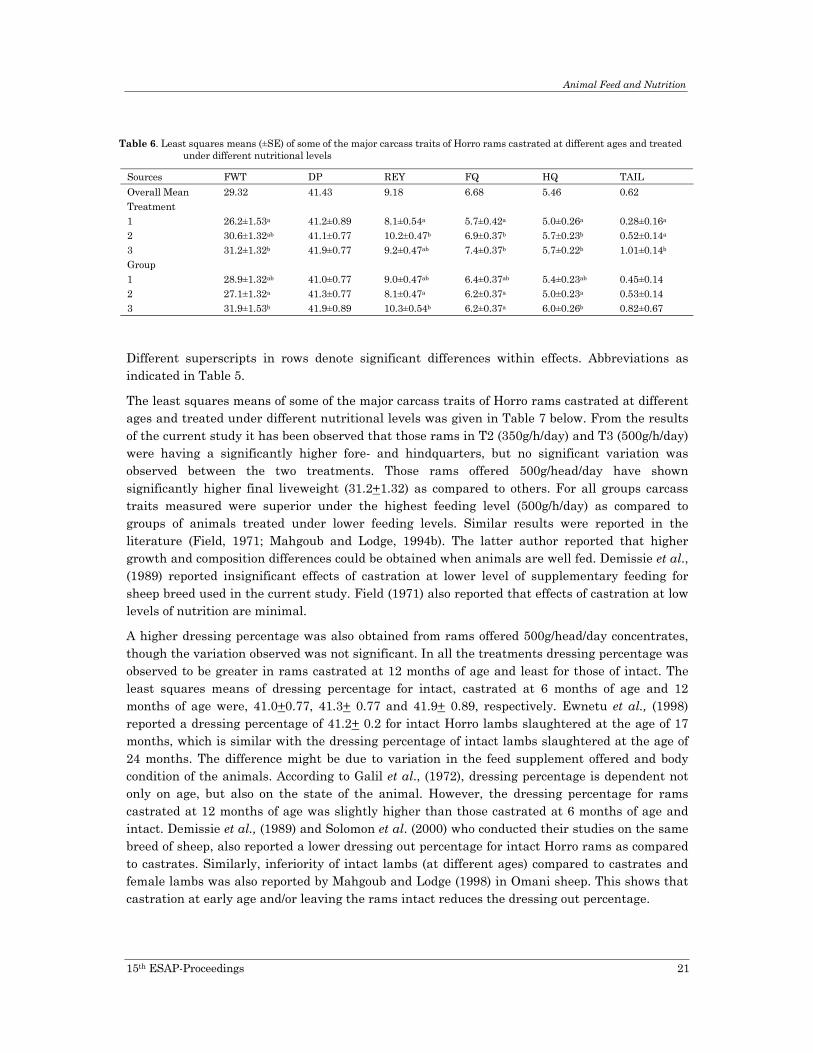
Table 6. Least squares means (±SE) of some of the major carcass traits of Horro rams castrated at different ages and treated under different nutritional levels
Sources FWT DP REY FQ HQ TAIL Overall Mean 29.32 41.43 9.18 6.68 5.46 0.62 Treatment 1 26.2±1.53a 41.2±0.89 8.1±0.54a 5.7±0.42a 5.0±0.26a 0.28±0.16a 2 30.6±1.32ab 41.1±0.77 10.2±0.47b 6.9±0.37b 5.7±0.23b 0.52±0.14a 3 31.2±1.32b 41.9±0.77 9.2±0.47ab 7.4±0.37b 5.7±0.22b 1.01±0.14b Group 1 28.9±1.32ab 41.0±0.77 9.0±0.47ab 6.4±0.37ab 5.4±0.23ab 0.45±0.14 2 27.1±1.32a 41.3±0.77 8.1±0.47a 6.2±0.37a 5.0±0.23a 0.53±0.14 3 31.9±1.53b 41.9±0.89 10.3±0.54b 6.2±0.37a 6.0±0.26b 0.82±0.67
Different superscripts in rows denote significant differences within effects. Abbreviations as indicated in Table 5.
The least squares means of some of the major carcass traits of Horro rams castrated at different ages and treated under different nutritional levels was given in Table 7 below. From the results of the current study it has been observed that those rams in T2 (350g/h/day) and T3 (500g/h/day) were having a significantly higher fore- and hindquarters, but no significant variation was observed between the two treatments. Those rams offered 500g/head/day have shown significantly higher final liveweight (31.2+1.32) as compared to others. For all groups carcass traits measured were superior under the highest feeding level (500g/h/day) as compared to groups of animals treated under lower feeding levels. Similar results were reported in the literature (Field, 1971; Mahgoub and Lodge, 1994b). The latter author reported that higher growth and composition differences could be obtained when animals are well fed. Demissie et al., (1989) reported insignificant effects of castration at lower level of supplementary feeding for sheep breed used in the current study. Field (1971) also reported that effects of castration at low levels of nutrition are minimal.
A higher dressing percentage was also obtained from rams offered 500g/head/day concentrates, though the variation observed was not significant. In all the treatments dressing percentage was observed to be greater in rams castrated at 12 months of age and least for those of intact. The least squares means of dressing percentage for intact, castrated at 6 months of age and 12 months of age were, 41.0+0.77, 41.3+ 0.77 and 41.9+ 0.89, respectively. Ewnetu et al., (1998) reported a dressing percentage of 41.2+ 0.2 for intact Horro lambs slaughtered at the age of 17 months, which is similar with the dressing percentage of intact lambs slaughtered at the age of 24 months. The difference might be due to variation in the feed supplement offered and body condition of the animals. According to Galil et al., (1972), dressing percentage is dependent not only on age, but also on the state of the animal. However, the dressing percentage for rams castrated at 12 months of age was slightly higher than those castrated at 6 months of age and intact. Demissie et al., (1989) and Solomon et al. (2000) who conducted their studies on the same breed of sheep, also reported a lower dressing out percentage for intact Horro rams as compared to castrates. Similarly, inferiority of intact lambs (at different ages) compared to castrates and female lambs was also reported by Mahgoub and Lodge (1998) in Omani sheep. This shows that castration at early age and/or leaving the rams intact reduces the dressing out percentage.
Ethiopian Society of Animal Production
22 15th ESAP-Proceedings
Table 7. Least squares means (standard deviations) of some of the major carcass traits of Horro rams castrated at different ages and treated under different nutritional levels
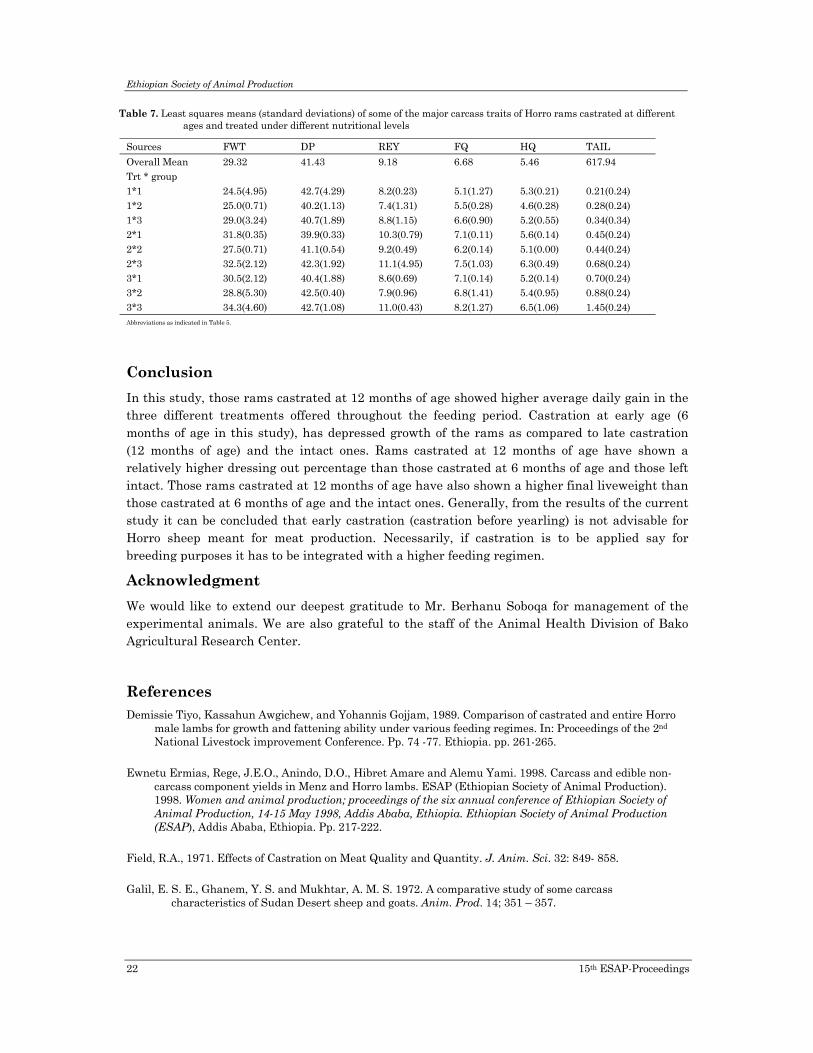
Sources FWT DP REY FQ HQ TAIL Overall Mean 29.32 41.43 9.18 6.68 5.46 617.94 Trt * group 1*1 24.5(4.95) 42.7(4.29) 8.2(0.23) 5.1(1.27) 5.3(0.21) 0.21(0.24) 1*2 25.0(0.71) 40.2(1.13) 7.4(1.31) 5.5(0.28) 4.6(0.28) 0.28(0.24) 1*3 29.0(3.24) 40.7(1.89) 8.8(1.15) 6.6(0.90) 5.2(0.55) 0.34(0.34) 2*1 31.8(0.35) 39.9(0.33) 10.3(0.79) 7.1(0.11) 5.6(0.14) 0.45(0.24) 2*2 27.5(0.71) 41.1(0.54) 9.2(0.49) 6.2(0.14) 5.1(0.00) 0.44(0.24) 2*3 32.5(2.12) 42.3(1.92) 11.1(4.95) 7.5(1.03) 6.3(0.49) 0.68(0.24) 3*1 30.5(2.12) 40.4(1.88) 8.6(0.69) 7.1(0.14) 5.2(0.14) 0.70(0.24) 3*2 28.8(5.30) 42.5(0.40) 7.9(0.96) 6.8(1.41) 5.4(0.95) 0.88(0.24) 3*3 34.3(4.60) 42.7(1.08) 11.0(0.43) 8.2(1.27) 6.5(1.06) 1.45(0.24) Abbreviations as indicated in Table 5.
Conclusion In this study, those rams castrated at 12 months of age showed higher average daily gain in the three different treatments offered throughout the feeding period. Castration at early age (6 months of age in this study), has depressed growth of the rams as compared to late castration (12 months of age) and the intact ones. Rams castrated at 12 months of age have shown a relatively higher dressing out percentage than those castrated at 6 months of age and those left intact. Those rams castrated at 12 months of age have also shown a higher final liveweight than those castrated at 6 months of age and the intact ones. Generally, from the results of the current study it can be concluded that early castration (castration before yearling) is not advisable for Horro sheep meant for meat production. Necessarily, if castration is to be applied say for breeding purposes it has to be integrated with a higher feeding regimen.
Acknowledgment We would like to extend our deepest gratitude to Mr. Berhanu Soboqa for management of the experimental animals. We are also grateful to the staff of the Animal Health Division of Bako Agricultural Research Center.
References Demissie Tiyo, Kassahun Awgichew, and Yohannis Gojjam, 1989. Comparison of castrated and entire Horro
male lambs for growth and fattening ability under various feeding regimes. In: Proceedings of the 2nd National Livestock improvement Conference. Pp. 74 -77. Ethiopia. pp. 261-265.
Ewnetu Ermias, Rege, J.E.O., Anindo, D.O., Hibret Amare and Alemu Yami. 1998. Carcass and edible non-carcass component yields in Menz and Horro lambs. ESAP (Ethiopian Society of Animal Production). 1998. Women and animal production; proceedings of the six annual conference of Ethiopian Society of Animal Production, 14-15 May 1998, Addis Ababa, Ethiopia. Ethiopian Society of Animal Production (ESAP), Addis Ababa, Ethiopia. Pp. 217-222.
Field, R.A., 1971. Effects of Castration on Meat Quality and Quantity. J. Anim. Sci. 32: 849- 858.
Galil, E. S. E., Ghanem, Y. S. and Mukhtar, A. M. S. 1972. A comparative study of some carcass characteristics of Sudan Desert sheep and goats. Anim. Prod. 14; 351 – 357.

Animal Feed and Nutrition
15th ESAP-Proceedings 23
Gemeda Duguma, Takele Kumsa, Ulfina Galmessa and Solomon Abegaz. 2002. The effect of age and sex on growth performance and carcass characteristics of Horro lambs. ESAP (Ethiopian Society of Animal Production) 2003 Challenges and opportunities of livestock marketing in Ethiopia. Yilma Jobre and Getachew Gebru (Eds). In: proceedings of the 10th Annual conference of the Ethiopian Society of Animal Production (ESAP) held in Addis Ababa, Ethiopia, August 22-24, 2002, Addis Ababa, Pp 99-103.
Gemeda, D., Solomon Abegaz and Ulfina Galmessa. 2006. Lifetime productivity of Horro Ewes maintained at Bako Agricultural Research Center. Eth. J. of Ani. Prod. 6(1), 85-89.
Louca, A., Economides, S. and Hancock, J., 1977. Effects of castration on growth rate, feed conversion efficiency and carcass quality in Damascus goats. Anim. Prod. 24: 387-391.
Mahgoub, O. and Lodge, G.A., 1994a. Growth and body composition of Omani Local sheep. a. Live-weight growth and carcass and non-carcass characteristics. Anim.Prod.58: 365-372.
Mahgoub, O. and Lodge, G.A., 1994b. Growth and body composition of Omani Local sheep. b. Growth and distribution of musculature and skeleton. Anim.Prod.58: 373-379.
Mahgoub,O. and Lodge, G.A., 1998. A comparative study on growth, body composition and carcass tissue distribution in Omani sheep and goats. Journal of Agricultural science, Cambridge. 131: 329-339.
Massae, E.E and Mtenga, L.A. 1992. Effect of plane of nutrition on growth performance and carcass composition on lambs in Tanzania. In Ray, B, Lebbie, S.H.B and Reynolds, L (eds). Small Ruminant Research and Development in Africa. Proceedings of the 1st Biennial Conference of the African Small Ruminant Research Network, ILRAD, Nairobi, Kenya, 10-14 December 1980. International Livestock center for Africa, Nairobi, Kenya.
Owen, J.B. 1976. Sheep Production. Bailliere and Tindall. London. pp. 68-69.
SAS. 1996. User’s Guide, Statistics. Statistical Analysis Systems Institute, Inc, Cary, North Carolina.
Solomon Abegaz, Fikru Terefe, Ulfina Galmessa and Gemeda Duguma. 2000. Growth performance and carcass characteristics of Horro lambs castrated at different ages. In: Proceedings of the 8th
National Conference of Ethiopian Society of Animal Production (ESAP), 24-26 August 2000. Addis Ababa, Ethiopia.
Takele Kumsa, Gemeda Duguma, Fikru Terefe, Ulfina Galmessa and Yohannes Gojjam. 2006. Study on sexual and fattening performance of partially castrated Horro Rams. Eth. J. of Ani. Prod. 6 (2), 29-36.
Ulfina Galmessa, Gemeda Duguma, Solomon Abegaz, Solomon Gizaw and Raina, V.S. 2003. Effect of plane of nutrition on age and weight at sexual maturity in Horro ram lambs. Indian J. Anim. Sci. 73(9): 1069-1071.


Animal Feed and Nutrition
15th ESAP-Proceedings 25
Evaluation of cowpea hay (V. unguaculata) vs. noug cake supplementation of cynodon dectylon on growth performances and carcass characteristics of Horro rams at Bako
Temesgen Jembere∗, Gemeda Duguma, Ketama Demisse and Diriba Geleti
OARI, Bako Agricultural Research Center, P.O. Box 03,West Shoa, Ethiopia
Abstract The effect of cowpea (V. unguiculuta) hay supplementation on growth performance and carcass characteristics of Horro rams was investigated at Bako Agricultural research Center for about three months with the objective of determining the amount of cowpea hay that can substitute the recommended level of noug cake. Thirty-five growing Horro rams were used for the purpose of the study. The animals were assigned to the following five treatments: Those group offered Cynodon dactylon hay + 200g maize grain + 200g noug cake (T1), Cynodon dactylon hay + 200g maize grain + 150g noug cake + 90g cowpea hay (T2), Cynodon dactylon hay + 200g maize grain + 100g noug cake + 185g cowpea hay (T3), Cynodon dactylon hay + 200g maize grain + 50g noug cake + 275g cowpea hay (T4) and Cynodon dactylon hay + 200g maize grain + 370g cowpea hay (T5). No significant differences were observed amongst the different treatments used for both live weight changes and carcass characteristics. Thus, in areas where noug cake is not available one can use cowpea hay for sheep fattening under Bako condition. The results of the current study warrant investigations of cowpea grains as protein sources for fattening.
Keywords: Cowpea hay, Noug cake, weight gain, carcass traits, yearling Horro rams
Introduction In the western region of Ethiopia, sheep are an important part of agricultural activity
contributing substantially to household income and food security. They are part of the crop-livestock mixed production system and are raised under traditional management system based on grazing natural pasture and use of crop aftermath. Under this type of management, increase in production is mainly achieved through increase in animal number and not through enhanced productivity per animal. However, the increase in productivity through increasing the number of animals is not a viable option due to the alarmingly growing human population. Intensified feed and livestock production may be one way to raise production per land and livestock unit in a sustainable fashion (Shapiro et al., 1994).
Results of a study conducted in some of the western parts of the country (Solomon et al., 2005) has indicated that about 39.0 % of the farmers owning small ruminants offer some form of supplementation before marketing and majority of farmers sale their animals early before attaining optimum market weight. It is also reported in the literature that sheep productivity is mainly constrained by scarcity of feed and diseases (Solomon et al., 2005; Tibbo, 2006). As far as the feed issue is concerned, protein is the most animal production-limiting ingredient of feedstuff. The most commonly used protein source feed in the western part of the country is noug cake, whose availability is limited to the presence or absence of oil extracting factories. Farmers in the rural parts of the country cannot access the noug cake and their animals are suffering from protein deficiency.
∗ Corresponding author

Ethiopian Society of Animal Production
26 15th ESAP-Proceedings
Cowpea (Vigna unguiculata), which is grown extensively as a subsistence crop in many countries in Africa and throughout the tropics, is one of the forage legumes important for animal feed, or as green manure (Tarawai et al., 1997). Onwueme and Sinha (1991) indicated also that cowpea is a warm weather annual crop and can be grown successfully on a great variety of soils provided they are well drained. Samuel and Mesfin (2003) also reported that under sowing of cowpea with sorghum ten days after the emergence of sorghum on every row would give better dry matter without affecting sorghum grain yield. These could likely indicate the possibility of using cowpea hay as animal feed particularly for rural people who could not have access to noug cake. However, information regarding the level of cowpea that can replace noug cake is scanty in our country. The present study was, therefore, conducted with the objectives of investigating the effect of cowpea supplementation on growth performance and carcass characteristics of yearling Horro rams and to determine the level of its supplementation that can substitute the recommended level of noug cake.
Materials and methods
The study was conducted at Bako Agricultural Research Center that is located at about 250km from Addis Ababa on the main road to Nekemte. The area situated at an altitude of 1650masl and receives mean annual rainfall of 1200mm in a bimodal distribution, 80% of which falls from May to September. Bako area had a mean relative humidity of 60% and mean minimum and maximum temperatures of 13.5ºC and 27ºC, respectively. The centre farm management and animal feeds and nutrition research divisions produced cowpea hay used for the experiment. Cynodon dectylon hay was harvested from locally called pump station in the centre and pilled under shade maintaining green colour. Noug cake and maize grain are purchased from local market around Bako and mixed with salt according to the recommendation in centre.
Thirty-five yearling Horro rams were purchased from nearby markets for use in this study. They were de-wormed and disinfected for internal and external parasites up on their arrival at the center. The animals were randomly assigned to five different treatments, seven animals per treatment, based on their liveweight and fed in-group. The experiment was conducted for 98 days. During the experimental period, each individual ram was weighed fortnightly. Feeds offered and refused were recorded every day for each group until the end of the experiment. The experimental animals were exposed to their respective treatment feeds for fifteen days before the commencement of the experiment.
The treatments were:-
8. 200g ground maize grain + 200g noug cake/head/day (T1), 9. 200g ground maize grain + 150g noug cake + 90g cowpea hay (T2), 10. 200g ground maize grain + 100g noug cake + 185g cowpea hay (T3), 11. 200g ground maize grain + 50g noug cake + 275g cowpea hay (T4), and 12. 200g ground maize grain + 370g cowpea hay (T5).
Treatment 1 (T1) is the recommended level Bako Animal Production Research Division uses for fattening of yearling Horro rams and used as a positive control for the purpose of this experiment. The substitution of Noug cake with cowpea was in iso-protein basis. Ground maize

Animal Feed and Nutrition
15th ESAP-Proceedings 27
grain (200g/head/day) was provided for all animals assigned to the different treatments. Cynodon dactylon was offered ad lib as a basal diet for all the treatments.
At the end of the experiment four rams from each treatment were randomly selected and slaughtered for carcass analysis. Prior to being slaughtered, the animals were withheld from feed for about 12h. The rams were weighed again after the 12h feed withdrawal to record empty liveweight. Carcass and non-carcass components were weighed and recorded immediately after slaughter. The carcass was portioned into hind or fore quarter between 10th and 11th ribs. Three ribs (11th and 13th) were chilled overnight at -4oc, and then the rib eye muscle was traced after cutting the chilled rib eye muscle at two sites (left and right) using a graduated ruler. The major carcass traits measured were; head, forelegs, hind legs, lung and trachea, liver, heart, kidney fat tree, visceral full, visceral empty, carcass weight, forequarters, hindquarters, tail weight, dressing percentage, kidney fat, omental fat, skin, spleen, fat thickness at 12th rib (left and right), eye rib area (left and right) and age at slaughter in days.
The General Linear Model (GLM) procedure of Statistical Analysis Systems Institute (SAS, 1999) was used to assess the effects of treatments on liveweight and carcass traits. Initial body weight was included as a covariate in the analysis of body weight; while treatment was the only independent effect in the analysis of carcass traits.
Results and discussions
The results of live weight change taken every two weeks and carcass characteristics are presented in Tables 1 and 2, respectively. The average daily basal feed (Cynodon dectylon) was influenced by the treatments. There were no significant differences (p > 0.05) in live weight measured within the treatment (Table 1). The effects of initial live weight of the animals were significant (p ≤ 0.01) on their live weight at all periods of the experiment. However, its significance has showed a diminishing trend from the early to the end of the experimental period. Those groups of animals assigned to treatments 1 and 4 were heavier than those of the other groups almost at all periods of the experiment. As indicated in table 1, the average daily weight gain in grams is also highest for T1 (84.90±3.0) and T4 (86.0±10.6) though there is no significance difference among treatments. There were also no significant differences (p > 0.05) in carcass traits measured between different feeding treatments (Table 2). Some of the carcass traits showed strong positive correlation (final weight with empty body weight (0.88), dressing percentage (0.88), fore quarter (0.87) and hind quarter (0.84) and loose positive correlation with lung with trachea (0.45). Final weight also showed negative correlation with blood volume (-0.22). It can therefore be deducted that 275g-cowpea hay can replace a 150g of Noug cake in the diet of sheep fattening.
Conclusion and Recommendations Generally, total live weight gain (kg) and average daily gain (gm) did not significantly vary for
yearling Horro rams regardless of the treatments varied indicating the possibility of using sole cowpea hay in place of noug cake and/or any of noug cake and cowpea hay combination used in the treatment. The same is true for the carcass traits. The present study revealed that cowpea hay could be used instead of noug cake as a protein source for growing Horro rams since no significant difference was observed with in treatments. As to the amount of cowpea hay that can substitute noug cake, 370g cowpea hay per day can be used without the inclusion of noug cake per animal and if noug cake is accessible the following compositions of cowpea can be used with

Ethiopian Society of Animal Production
28 15th ESAP-Proceedings
noug cake; 150g noug cake + 90g Cowpea hay; 100g noug cake + 185g cowpea hay; 50g noug cake + 275g cowpea hay. The results of the current study warrant investigations of cowpea grains as protein sources for fattening sheep

Animal Feed and Nutrition
Table1. Least squares means (±SE) of liveweight changes of Horro rams as affected by feeding treatments
WK2 -Kg WK4-Kg WK6-Kg WK8-Kg WK10-Kg WK12-Kg WK14-Kg TWG -gm Overall mean 22.38 22.56 23.49 24.64 26.24 27.71 28.54 78.3±8.6 Treatment NS NS NS NS NS NS NS NS 1 22.4±0.90 22.8±0.91 23.6±0.91 25.7±1.68 27.1±1.04 28.3±1.05 29.3±0.99 84.90±3.0 2 23.3±0.90 23.0±0.91 23.8±0.91 25.6±1.68 26.4±1.05 27.9±1.05 28.6±0.99 77.90±9.7 3 21.7±0.91 21.7±0.91 22.4±0.92 20.9±1.69 25.3±1.05 27.0±1.06 27.3±1.00 71.10±7.4 4 22.6±0.90 23.0±0.90 24.0±0.91 25.5±1.68 26.6±1.04 28.3±1.05 29.5±0.99 86.0±10.6 5 21.8±0.91 22.3±0.90 23.7±0.91 25.4±1.68 25.9±1.05 27.2±1.05 28.1±0.99 71.4±10.8 R2 (%) 49.0 51.0 42.5 29.0 31.0 31.1 34.6 - C.V. (%) 10.72 10.66 10.26 18.10 10.58 10.03 9.26 29 Wk2 = weight at week two, Wk4 = weight at week four, Wk6 = weight at week six, Wk8= weight at week eight, Wk10 =weight at week ten, Wk12 =weight at week twelve, Wk14 =weight at week two and TWG= Total weight gain (gm)

Ethiopian Society of Animal Production
30 15th ESAP-Proceedings
Table2. Least squares means (±SE) of carcass traits of yearling Horro rams subjected to different treatments
Treatments Statistics Variable carcass traits T1 T2 T3 T4 T5 Over all
mean C.V.
Slaughter weight (kg) 29.3±10.00 28.6±1.10 27.6±0.9 29.4±1.30 20.9±0.60 28.6 10.8 Empty body weight (kg) 10.9±0.66 12.1±0.80 10.7±0.5 11.3±1.00 11±0.5 11.2 13 Dressing percentage -% 42.2±2.50 46.6±3.10 40.9±1.7 43.5±4.10 42.4±1.20 43.1 13 Forequarter (kg) 6.2±0.30 6.7±0.40 5.9±0.3 6.3±0.60 6.2±0.26 6.3 12.9 Hind quarter (kg) 4.8±0.30 5.5±0.37 4.75±0.2 5±0.5 4.8±0.30 4.96 13.6 Blood (kg) 1.1±0.14 1.1±0.10 1.3±0.2 1±0.1 1.2±0.05 1.12 22.5 Lung with trachea (g) 358±23.0 402±18.0 368±10 398±22.0 370±41.0 379 13.4 Tail (g) 390±135.0 622±112.0 600±100 673±87.0 687±100.0 594 36.5 Heart (g) 151±10.0 155±16.7 151±10.8 138±5.0 137±4.0 146 14.2 Liver (g) 445±30.0 432±25.0 416±33 406±18.0 391±20.0 418 12.5 Gall bladder (g) 13±2.0 11±2.0 5.5±0.5 16±4.0 17±6.0 13 54.8 Kidneys (g) 86.3±2.00 95±7.0 80±0 91±6.0 83±3.0 87 10.5 Kidney fat (g) 49±5.0 67±9.0 50±16 56±10.0 46±9.0 54 40.0 Viscera full (kg) 7.9±0.40 8.0±0.20 7.7±0.3 8±0.40 8.8±0.90 8.1 13.3 Viscera empty (kg) 1.9±0.13 2±0.1 2.7±0.7 2.2±0.10 2.2±0.03 2.2 29.3 Abdominal fat (g) 91±15.0 168±52.0 95±32 133±43.0 221±95.0 142 77 Spleen (g) 63±12.0 80±10.0 80±4 71±8.0 73±11.0 73 26 Rib-eye (lion) (cm2) 9.3±0.40 10.9±0.90 9.3±0.4 9.3±0.50 9.4±0.40 9.6 11.6 Fat thickness (cm) 0.4±0.04 0.4±0.05 0.44±0.05 0.5±0.02 0.4±0.01 0.4 18.9 Head (kg) 1.5±0.04 1.5±0.05 1.4±0.07 1.5±0.1 1.5±0.06 1.5 9.5 Genital organs (g) 465±13.0 422±57.0 367±36 390±31.0 393±26.0 407 17.7 Skin (kg) 2.57±0.12 2.7±0.12 2.4±0.19 2.7±0.30 2.65±0.13 2.6 14.5 Hind leg (g) 267±8.0 277±13.0 285±16 288±20.0 251±7.0 273 10.3 Foreleg (g) 275±6.0 292±12.0 295±18 290±25.0 245±4.0 279 11.1

Animal Feed and Nutrition
15th ESAP-Proceedings 31
References Jemal Dekebo, Chala Mererra1, Diriba Geleti1, Ulfina Gelmessa, Diriba Diba, Adane Hirpa and Temesgen
Jambare. 2004. Weight gain, Carcass characteristics and economic evaluation of Horro Ram su[[lamented with different substitution levels of Maize grain and molasses. Proceedings of the 13th Annual conference of the Ethiopian Society of Animal Production (ESAP) held in Addis Ababa, Ethiopia, August 25-27, 2004. ESAP, Addis Ababa. Pp 46-51.
Markos Tibbo. 2006. Productivity and health of indigenous sheep breeds and crossbreds in the central Ethiopian highlands. Ph.D. Dissertation. Swedish University of Agricultural Sciences (SLU), Uppsala, Sweden
Onwueme, I.C. and T.D. Sinha, 1991.Field crop production in tropical Africa.
Samuel Menbere and Mesfin Dejene. 2003. Effect of undersowing annual forage legumes on grain and dry matter stalk yield of Sorghum (Sorghum bicolar L.) and dry matter forage yield in the eastern Amahara region. In: 10th proceeding of Ethiopian Society of Animal Production. Addis Ababa, Ethiopia. Pp 285-291.
SAS 1999. Statistical Analysis system SAS Institute Inc. Cary, North America.
Shapiro, B.I., Mohamed-Saleem and L. Reynolds, 1994. Socio-economic constraints to strategic sheep fattening: Evidence from the Ethiopian highlands. In: Lebbie, S.H.B., Rev, B. and Irungu, E.K. 1993. Small Ruminant Research and Development in Africa. Proceedings of the Second Biennial Conference of the African Small Ruminant Research Network, AICC, Arusha, Tanzania, 7-11 December 1992. ILCA/CTA, Addis Ababa, Ethiopia. Pp. 9-14.
Solomon Abegaz, Gemeda Duguma, Ulfina Galmessa, Berhanu Soboqa and Fikru Terefe. 2005. Small ruminant production system in East Wollegga and West Shoa zones. Research Report, Oromia Agricultural Research Institute, Bako Agricultural Research Center, Bako, Ethiopia. 31 Pp.
Tarawali, S.A., Singh, B.B., Peters, M. and Blade, S.F. (1997). Cowpea haulms as fodder. In: Singh,B.B., Mohan Raj, D.R., Dashiell, K.E. and Jackai, L.E.N. (eds) Advances in cowpea Research. IITA/JIRCAS, Ibadan, Nigeria. Pp313-325.


Animal Feed and Nutrition
15th ESAP-Proceedings 33
Long term effects of plane of nutrition on lifetime productivity of Horro
ewes
Gemeda Duguma1∗, Solomon Abegaz2 and Ulfina Galmessa2
1OARI, Bako Agricultural Research Center, P.O.Box 03, West Shoa, Bako; 2Jimma University, Ambo College, P.O.Box 19, West Shoa, Ambo
Abstract The effect of long-term plane of nutrition on subsequent productivity of Horro ewes was investigated for 3 years starting from weaning at about 90 days of age. The feeding levels used were low (100g/head/day; T1), medium (300g/head/day; T2) and high (Ad lib; T3). The treatment with different feed levels started at weaning and continued until 18-months of age. Feeding treatment did not significantly affect (p > 0.05) any of the production traits considered, except liveweight and body condition of ewes. Twin born ewes tended to wean more number and weight of lambs, though not significant, than did ewes born as singles. Dam yearling weight had significant effect on total number of lambs born, total number of lambs' weaned and total weight of lambs weaned. From the results of the current study and works done in the past it seems realistic to suggest strategic feeding (like pre- and post-mating, feeding during the last trimester of pregnancy, etc.) than feeding ewes for lifelong. Another important finding from the current study is that, selection for yearling weight may be useful to indirectly improve ewe lifetime productivity.
Key words: Plane of nutrition, Horro ewes, productivity
Background and Justification In subsistence agriculture common in developing countries like Ethiopia, farmers keep small
ruminants for sale. Thus, gross income is determined by the number of offspring produced by the females in the flock, which implies high fertility and prolificacy are desirable, and pre-requisites towards increased productivity. The total number and weight of lambs produced during the lifetime of breeding female is of major economic importance in any sheep enterprise. The higher the number and weight of lambs weaned per ewe lifetime, the lower the overheads for each animal, and the more resources can be utilized to increasing production. Lifetime ewe productivity is improved through the optimization of reproduction of ewes, as well as survival and growth of their lambs. Snyman et al. (1998) also reported that among others, reproduction and survival rates are universally important in any environment or livestock production system. Other traits vary in importance and can, in some situations, be of little or no value.
The annual reproductive rate is a convenient measure for direct comparison of reproductive output in different production systems, especially in traditional ones where breeding is completely uncontrolled and where the number of females 'joined' or mated is not exactly known (Wilson, 1989). Most of the research undertaken on native goats and sheep in Africa has not only ignored but also positively rejected the seasonal nature of the breeding cycle in the tropics. An imposed short-breeding season lowers reproductive output by limiting animals to one parturition per year (Wilson, 1989). According to this author managing the age at which breeding female is
∗ Corresponding author

Ethiopian Society of Animal Production
34 15th ESAP-Proceedings
first allowed to conceive and give birth can also potentially reduce lifetime reproductive performance. Management practices used in this context include a minimum age and/or a minimum weight at which first service is allowed. These minimum targets are rarely met when breeding is controlled, due to other restrictions, notably those of a short-mating season at a particular time of year, which is considered to provide the best conditions for the dam or young (Wilson, 1989).
Though there is still uncertainty about the stage of development at which nutrition influences an animal's subsequent ability to achieve its genetic potential for reproduction (Robinson, 1990), improved nutrition and health would lead to improved reproductive output (Wilson, 1989). Williams (1984) observed that under nutrition for an 8-week period from 6 weeks of age reduced ovulation rates in ewes for up to 3 years. In ruminants, the low protein content of tropical pasture (< 80 g/kg) delays puberty (Oyedipe et al., 1982), to levels that not only restrict growth (Topps, 1977) but also often fail to meet maintenance needs. Solomon et al. (1995) reported that well-fed Horro ewe lambs attained puberty at seven months of age weighing 21kg and produce viable lambs. However, the information of long-term effects of plane of nutrition on subsequent productivity of Horro ewes is scanty. The present study was, therefore, initiated to examine the effects of long-term plane of nutrition on lifetime productivity of Horro ewes.
Materials and Methods The study was conducted at Bako Agricultural Research Center that is situated at about 250
km west of Addis Ababa on the main road to Nekemte at an altitude of approximately 1650 m above sea level (09° 06´ N and 37° 09´ E). Bako has a hot and humid climate and receives a mean annual rainfall of about 1219 mm, more than 80 % of which is recorded in the months of May to September. Mean monthly maximum and minimum temperatures are about 28°C and 14°C, respectively, with 21°C of average temperature. Potential evapotranspiration averages 62 mm per month.
Sixty ewe lambs of three months of age were assigned to three different feeding levels. The feeding levels used were low (100g/head/day; Trt1), medium (300g/head/day; Trt2) and high (Ad lib; Trt3). The animals were assigned randomly to the different treatments based on their age, body weight and body condition score. The treatment feed mixture was composed of 49.5% ground maize, 49.5% noug cake, and 1% salt. Concentrate supplementation was started at weaning and continued until 18-months of age. The experimental animals were allowed to graze together on natural pasture during the day (9:00 am to 5:00 pm) and received their respective concentrate supplements in-group basis during the night. Feed intake and refusals were recorded daily on group basis. The animals were watered to appetite twice a day. The animals were monitored until the end of the study period at about 3rd to 5th parities. They were weighed and scored fortnightly and at parturition. Mating was out door and mature fertile ram was assigned to run with ewes throughout the course of the study period. Trained herdsmen and supervisors were assigned to collect service data.
Traits considered were total number of lambs born per ewe lambing (TNB), total number of lambs weaned per ewe lambing (TNW) and total weight of lambs weaned per ewe lambing (TWW). The first three to five lambings (as there is an individual variation and may be variation between feeding treatments parity ranges from 3 to 5 in the current study) of an ewe were taken as an indication of lifetime reproduction. Total number of lambs born, weaned, and total weights of lambs weaned per ewe lambing over different parities were computed as described by Gemeda

Animal Feed and Nutrition
15th ESAP-Proceedings 35
(2001). For instance, total weight of lambs weaned for each ewe was calculated by adding weaning weights of all lambs weaned by the ewe in a specific lambing time. Total weight weaned over the different lambings was calculated by adding the total weight of lambs weaned per ewe during the different lambings. Weaning weight of lambs was recorded at about 90 days without making any adjustment.
The traits, total numbers of lambs born and weaned were considered as continuous in the current study. This was justified due to the fact that these traits are a combination of at least three to five separate lambings, which increased the number of categories. Data were analyzed using the GLM Procedures in SAS (1996). The different feeding levels used and dam type of birth (single, twin) were fitted in to the model as independent variables while TNB, TNW and TWW were fitted as dependent variable. Dam yearling weight was fitted as covariable to investigate whether dam liveweight at a year of age could have significant relationship with any of the traits considered. Furthermore, simple correlation analysis was made to evaluate the association among the dams' early growth (production) traits and their lifetime productivity in terms of TNB, TNW and TWW.
Results and Discussions
Analysis of variance for total number born (TNB), total number weaned (TNW) and total weight weaned (TWW) is presented in Table 1, while least-squares means for the same traits are shown in Table 2. No significant difference (p>0.05) was observed among the animals treated under different level of feeding in any of the reproduction traits evaluated (Table 1). However, analyses of variance showed that the fixed effect models accounted for 43.3, 49.0 and 44.6% of the variances for TNB, TNW and TWW, respectively.
Table 1. Analysis of variance for number of lambs born, number weaned and weight weaned over lifetime
Mean square and level of significance Sources df TNB TNW TWW Treatment 2 0.353NS 0.342NS 99.167NS Dam type of birth 1 0.637NS 3.009* 422.231NS Dam yearling weight 1 22.946** 9.467** 1555.606** Error mean square 2.272 0.712 159.324 R2 (%) 43.3 49.0 44.6 C.V. (%) 39.2 59.9 76.2 NS=no significant difference at least at p<0.05; *= p<0.05; ** p<0.01
Table 2. Least squares means (±SE) for number of lambs born, number weaned and weight weaned over lifetime
TNB TNW TWW Overall mean 3.84 1.41 16.56 Treatment 1 3.7±0.63 1.7±0.35 19.5±5.26 2 3.8±0.48 1.4±0.27 15.1±4.01 3 4.2±0.51 1.6±0.28 21.0±4.26 Dam type of birth Single 3.7±0.32 1.2±0.18 14.1±2.69 Twin 4.1±0.55 2.0±0.31 23.0±4.57 TNB = Total Number Born; TNW = Total Number Weaned; TWW = Total Weight Weaned
Feeding treatment had significant influence on liveweight of dams during the experimental periods (Not shown here). Animals treated under highest plane of nutrition reached their
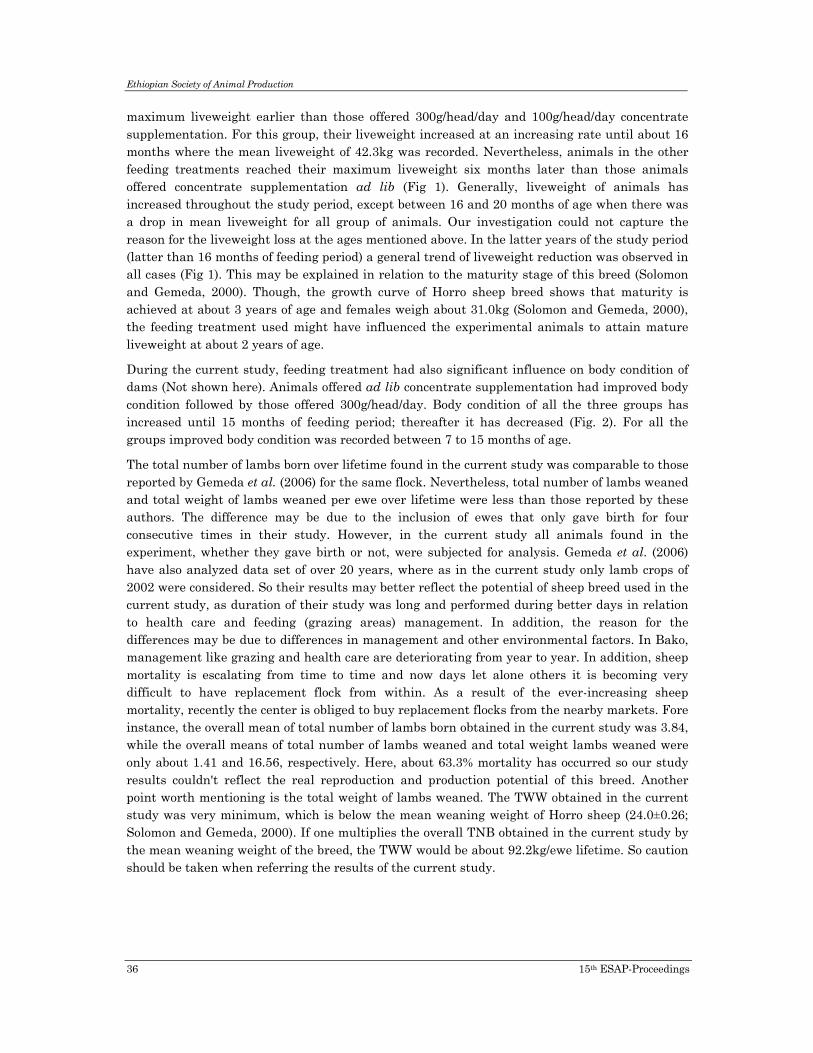
Ethiopian Society of Animal Production
36 15th ESAP-Proceedings
maximum liveweight earlier than those offered 300g/head/day and 100g/head/day concentrate supplementation. For this group, their liveweight increased at an increasing rate until about 16 months where the mean liveweight of 42.3kg was recorded. Nevertheless, animals in the other feeding treatments reached their maximum liveweight six months later than those animals offered concentrate supplementation ad lib (Fig 1). Generally, liveweight of animals has increased throughout the study period, except between 16 and 20 months of age when there was a drop in mean liveweight for all group of animals. Our investigation could not capture the reason for the liveweight loss at the ages mentioned above. In the latter years of the study period (latter than 16 months of feeding period) a general trend of liveweight reduction was observed in all cases (Fig 1). This may be explained in relation to the maturity stage of this breed (Solomon and Gemeda, 2000). Though, the growth curve of Horro sheep breed shows that maturity is achieved at about 3 years of age and females weigh about 31.0kg (Solomon and Gemeda, 2000), the feeding treatment used might have influenced the experimental animals to attain mature liveweight at about 2 years of age.
During the current study, feeding treatment had also significant influence on body condition of dams (Not shown here). Animals offered ad lib concentrate supplementation had improved body condition followed by those offered 300g/head/day. Body condition of all the three groups has increased until 15 months of feeding period; thereafter it has decreased (Fig. 2). For all the groups improved body condition was recorded between 7 to 15 months of age.
The total number of lambs born over lifetime found in the current study was comparable to those reported by Gemeda et al. (2006) for the same flock. Nevertheless, total number of lambs weaned and total weight of lambs weaned per ewe over lifetime were less than those reported by these authors. The difference may be due to the inclusion of ewes that only gave birth for four consecutive times in their study. However, in the current study all animals found in the experiment, whether they gave birth or not, were subjected for analysis. Gemeda et al. (2006) have also analyzed data set of over 20 years, where as in the current study only lamb crops of 2002 were considered. So their results may better reflect the potential of sheep breed used in the current study, as duration of their study was long and performed during better days in relation to health care and feeding (grazing areas) management. In addition, the reason for the differences may be due to differences in management and other environmental factors. In Bako, management like grazing and health care are deteriorating from year to year. In addition, sheep mortality is escalating from time to time and now days let alone others it is becoming very difficult to have replacement flock from within. As a result of the ever-increasing sheep mortality, recently the center is obliged to buy replacement flocks from the nearby markets. Fore instance, the overall mean of total number of lambs born obtained in the current study was 3.84, while the overall means of total number of lambs weaned and total weight lambs weaned were only about 1.41 and 16.56, respectively. Here, about 63.3% mortality has occurred so our study results couldn't reflect the real reproduction and production potential of this breed. Another point worth mentioning is the total weight of lambs weaned. The TWW obtained in the current study was very minimum, which is below the mean weaning weight of Horro sheep (24.0±0.26; Solomon and Gemeda, 2000). If one multiplies the overall TNB obtained in the current study by the mean weaning weight of the breed, the TWW would be about 92.2kg/ewe lifetime. So caution should be taken when referring the results of the current study.
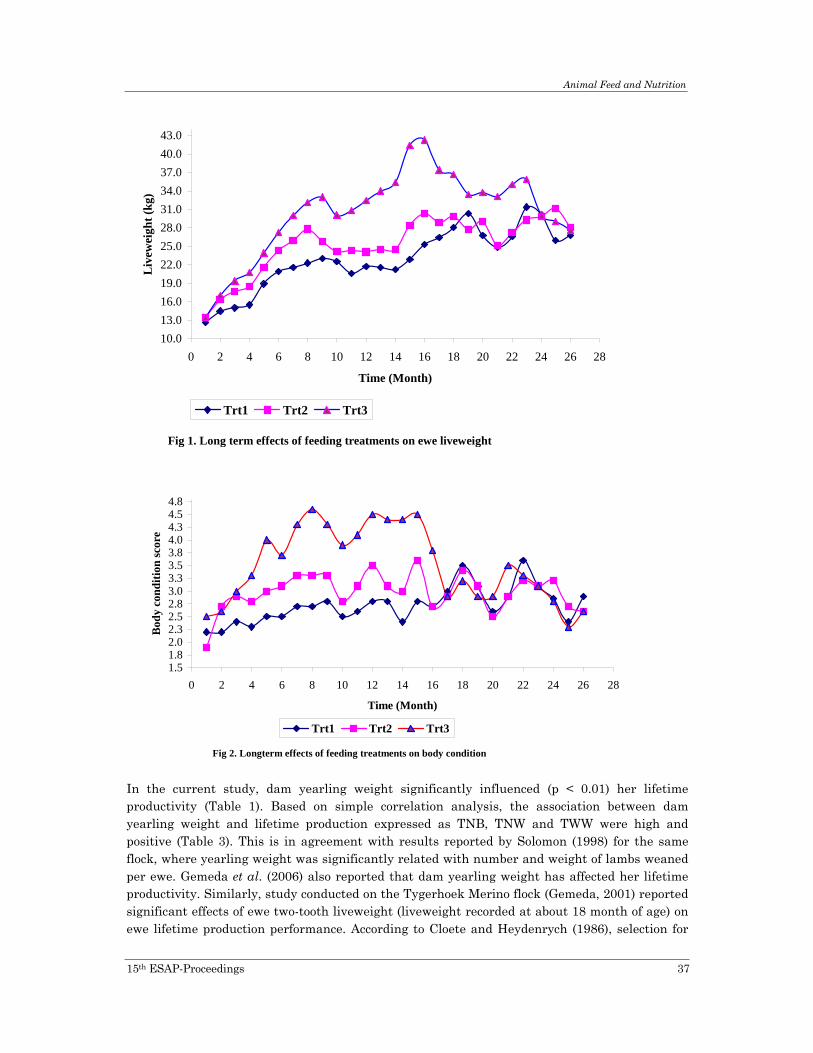
Animal Feed and Nutrition
15th ESAP-Proceedings 37
Fig 1. Long term effects of feeding treatments on ewe liveweight
10.013.016.019.022.025.028.031.034.037.040.043.0
0 2 4 6 8 10 12 14 16 18 20 22 24 26 28
Time (Month)
Liv
ewei
ght (
kg)
Trt1 Trt2 Trt3
Fig 2. Longterm effects of feeding treatments on body condition
1.51.82.02.32.52.83.03.33.53.84.04.34.54.8
0 2 4 6 8 10 12 14 16 18 20 22 24 26 28
Time (Month)
Bod
y co
nditi
on sc
ore
Trt1 Trt2 Trt3
In the current study, dam yearling weight significantly influenced (p < 0.01) her lifetime productivity (Table 1). Based on simple correlation analysis, the association between dam yearling weight and lifetime production expressed as TNB, TNW and TWW were high and positive (Table 3). This is in agreement with results reported by Solomon (1998) for the same flock, where yearling weight was significantly related with number and weight of lambs weaned per ewe. Gemeda et al. (2006) also reported that dam yearling weight has affected her lifetime productivity. Similarly, study conducted on the Tygerhoek Merino flock (Gemeda, 2001) reported significant effects of ewe two-tooth liveweight (liveweight recorded at about 18 month of age) on ewe lifetime production performance. According to Cloete and Heydenrych (1986), selection for

Ethiopian Society of Animal Production
38 15th ESAP-Proceedings
an increased two-tooth liveweight would probably be associated with an increase in reproductive rate.
Table 3. Simple correlation coefficients (r) of selected production and reproduction traits
WW = Weaning Weight; 6MW = Six month Weight; 9MW = Nine month Weight; 12MW = Yearling Weight; TNB = Total Number Born; TNW = Total Number Weaned;
TWW = Total Weight Weaned; *= p<0.05; ** p<0.01; ***= p<0.001
Twin born dams tended to wean more number and weight of lambs, though not significant, than did ewes born as singles. This is in agreement with results reported for the same flock by Gemeda et al. (2006). However, it is in contrast to results reported by Cloete and Heydenrych (1986) and Gemeda (2001) in Merino flock of the Tygerhoek.
Conclusion According to the present study, lifetime productivity of Horro ewes as measured by total
number of lambs born, total number lambs weaned and total weight of lambs weaned per ewe lifetime production was not significantly influenced by the different feeding levels used. However, there was a tendency of improved production for those ewes offered concentrate ad lib compared to relatively low levels. Thus, from the results of the current study and works done in the past it seems realistic to suggest strategic feeding (like pre- and post-mating, feeding during the last trimester of pregnancy, etc.) than feeding ewes for lifelong as it has cost implication.
Dam yearling weight had significant influence on traits investigated. This may be suggestive of a significant improvement in ewe's lifetime production by indirect selection for ewe's yearling weight.
Acknowledgment The authors would like to extend their deepest gratitude to Mr. Berhanu Soboqa and Mr. Mulugeta Shifa for management of the experimental animals. We are also grateful to the staff of the Animal Health Division of Bako Agricultural Research Center.
References
Cloete, S. W. P. and Hydenrych, H. J. 1986. Factors affecting reproduction in Merino ewes of the Tygerhoek. S. Afr. J. Anim. Sci. 16: 36 - 42.
Gemeda Duguma, Solomon Abegaz and Ulfina Galmessa. 2006. Lifetime productivity of Horro ewes maintained at Bako Research Center. Eth. J. Anim. Prod. 6 (1): 83-89.
Variables WW 6MW 9MW 12MW TNB TNW TWW WW ---- 0.72*** 0.49** 0.46** 0.28NS 0.08NS 0.09NS 6MW ---- 0.82*** 0.72*** 0.37* 0.37* 0.38* 9MW ---- 0.84*** 0.38* 0.44** 0.47** 12MW ---- 0.64*** 0.62*** 0.59*** TNB ---- 0.61*** 0.60*** TNW ---- 0.96*** TWW ----

Animal Feed and Nutrition
15th ESAP-Proceedings 39
Gemeda Duguma. 2001. A genetic study of early growth traits and ewe productivity in Merino sheep. MSc Thesis, University of Stellenbosch, South Africa. 78 Pp.
Oyedipe, E.O., Osori, D.I.K., Akerejola, O. and Saror, D. 1982. Effect of level of nutrition on onset of puberty and conception ratres of zebu heifers. Theriogenology. 18:525-539.
Robinson, J.J. 1990. Nutrition in the reproduction of farm animals. Nutrition Research Reviews. 3:253-276.
SAS. 1996. SAS User’s Guide: Statistics, Statistical Analysis Systems Institute, Inc., Cary, NC.
Snyman, M. A., Erasmus, G. J. and Van Wyk, J. B. 1998. The possible genetic improvement of reproduction and survival rate in Afrino sheep using a threshold model. S. Afr. J. Anim. Sci. 28: 120 - 124.
Solomon Abegaz and Gemeda Duguma. 2000. Genetic and phenotypic parameters of growth, reproduction and survival performance of Horro sheep at Bako Agric. Res. Center. Research Report. International Livestock Research Institute (ILRI), Addis Ababa, Ethiopia. 57 Pp.
Solomon Abegaz. 1998. Relationship between grwoth performance and susquent productivity in Horro sheep. Fifth National Conference of the Ethiopian Society of Animal Production, 15-17 May 1997, Addis Ababa, Ethiopia. pp.93-100.
Solomon Gizaw, Yohannes Gojjam and Solomon Abegaz. 1995. Lifetime reproduction and growth in Horro ewe lambs bred at 7 or 8 months of age. In Proceedings of the fifth Ethiopian society of Animal Production (ESAP), Addis Ababa, Ethiopia.
Topps, J.H. 1977. The relationship between reproduction and unnder nutrition in beef cattle. World Review of Animal Production. 13(2):43-49.
Wilson, R.T. 1989. Reproductive performance of African Indigenous small ruminants under various management Systems: a review. Animal Reproduction Science: 20:265-286.


Animal Feed and Nutrition
15th ESAP-Proceedings 41
Napier grass (Pennisetum purpureum L.) on the edge of irrigation
canals in the lowlands of Kewot woreda (Shewarobit), Ethiopia: a
promising entry point
*1Likawent Yeheyis, Nake Ziku, Ameha Sebsibe and Agraw Amane
Debre Birhan Agricultural Research Center, P.O.Box 112, Debre Birhan, Ethiopia.
Abstract In Kewot, Shewarobit area, feed shortage is one of the most important constraints for low productive and reproductive performance of livestock. To minimize this problem introducing improved forage species has to be considered. To this effect, two activities, adaptation trial and participatory on-farm demonstration of Napier grass, were conducted. The adaptation trial was conducted using seven lines of Napier grass in randomized complete block design (RCBD) with three replications at Shewarobit for 1.5 (one and half) years starting from July 2002. The participatory on-farm demonstration was conducted starting from July 2004 using two best lines selected from the adaptation trial. During the whole adaptation period (1.5 years) 11 harvests were possible. Mean forage dry matter (DM) yield per harvest of the seven Napier grass lines evaluated was statistically significant (p<0.05). ILRI 15743 gave the highest forage DM yield per harvest (2.72t/ha) and ILRI 16798 gave the lowest DM yield per harvest (1.63t/ha). ILRI 15743 gave the highest forage DM yield per year (15.04 t/ha) and ILRI 16798 gave the lowest DM yield per year (8.79t/ha). ILRI 14355 had the highest tillering capacity (102.33 tillers per plant) but with low leaf to stem ratio (3:1) and plot cover (47%) as compared to the other Napier grass lines. The difference in mean forage DM yield among different harvests was significantly different (p<0.05). In general ILRI 15743 and ILRI 16789 are recommended as the best adaptive and productive Napier grass lines around Shewarobit area under rain fed conditions. Moreover, the participatory on-farm activity demonstrated that planting of the two lines of Napier grass on the edges of the irrigation canal has been a useful entry point in Shewarobit area. There was a 150 % increase in participation of farmers. Similar areas with irrigation schemes could also benefit from the technology.
Keywords: Napier grass, irrigation canal, edge of a canal, lowland, Shewarobit.
Introduction For Shewarobit, an area with mixed crop-livestock farming system, livestock plays a vital role
for the poor smallholder farmer as source of power, food, immediate cash income, & fertilizer. However, majority of the plain area around Shewarobit is used for food crop production. The degraded hillsides and rocky land which is dominated by browse species is left for grazing. Because of this livestock feed shortage & scarcity of grazing land is critically sever at Shewarobit (Sheno Agricultural Research Center (SHARC) survey report, 2002). In such areas where livestock is suffering from feed shortage, cultivating productive & nutritious forage species is one way to solve the problem.
Napier grass is a perennial, deep rooted & highly productive forage species that can be easily adopted by farmers. According to Tessema et al, 2002, Napier grass grown around northwestern
1
* Corresponding author. Email: [email protected]

Ethiopian Society of Animal Production
42 15th ESAP-Proceedings
Ethiopia has got a CP, NDF, ADF and IVDMD content (%) of 11.5, 61.57, 35.53 and 65.50 respectively. Napier grass grows rapidly, is relatively tolerant to drought, moderate to high quality, which can maintain high number of animal units, and could survive for more than 5 years on elevations exceeding more than 900m (Sollenberger et al. 1990 as cited by Tesema 1999). However, there are no recommended lines of Napier grass in the area. Thus, adaptation trial followed by participatory on-farm napier grass demonstration activities were conducted in Shewarobit areas where there is a critical feed shortage as well as potential entry point for integration into the existing irrigation schemes. Material and Methods The study area (Shewarobit) is located 220 km north east of the capital city, Addis Ababa. The area is classified under hot to warm moist agro-ecological zone (M2-5). The area has got two rainy seasons, Belg (short and rare) and the main rainy season. The annual average rainfall from 18 years record at Shewarobit was about 1008 mm and the temperature ranges from 16.5oC to 32 oC (Kewot woreda Bureau of Agriculture, unpublished data).
Adaptation trial
Seven lines of Pennisetum purpureum (ILRI 16798, 15743, 16840, 16801, 16809, 16789, and 14355) adaptive around Bako area were brought and planted in RCBD with three replications at Shewarobit. Planting time was at the onset of the main rainy season by using stem cuts. Plot size was 5*1.5m with spacing of 75cm between rows and 50cm between plants. Spacing for both between replication and between plots was 1m. Fertilizer was applied at the rate of 100kg/ha DAP and 50kg/ha urea at the time of planting. Moreover, 50kg/ha urea was applied a year after planting during the onset of the main rainy season. Plant height at cutting was 1m. The lines were evaluated under rain fed condition but the testing site was located just next to an irrigated plot of land and because of this the soil moisture condition was usually moist. Finally after data is collected analysis of variance (ANOVA) was carried out using linear model of Agrobase (1999) statistical package.
Demonstration of selected lines of Napier grass
The two best lines of Napier grass selected from the adaptation trial were planted on farmers field on the edges of the irrigation canals. Planting time was at the onset of the main rainy season by using stem cuts. Planting was on a single row on both sides of the irrigation canal with spacing of 50 cm between plants. Finally field day was arranged for participating and adjacent farmers, development agents and Woreda Bureau of agriculture experts to jointly evaluate the performance of Napier grass planted following the irrigation scheme and assess the farmers’ and experts’ opinion on the technology.
Result and Discussion Adaptation trial
The summary of mean DM yield per harvest, mean DM yield per hectare per year, number of tillers per plant, plot cover and leaf to stem ratio for all napier grass lines evaluated for the whole experimental period is shown in table 1.

Animal Feed and Nutrition
15th ESAP-Proceedings 43
Instead of total forage DM yield per year, mean forage DM yield per harvest was used to compare the forage yield potential of the seven Napier grass lines to avoid the effect of the addition of the variation between different harvests in to the mean square of error (residual effect).
During the whole experimental period (1.5 years) 11 harvests were possible. Mean forage DM yield per harvest of the seven Napier grass lines evaluated was statistically significant (p<0.05). ILRI 15743 gave the highest forage DM yield per harvest (2.72t/ha) and ILRI 16798 gave the lowest DM yield per harvest (1.63t/ha) (Table 1). ILRI 14355 was with the highest tillering capacity (102.33 tillers per plant) but with low leaf to stem ratio (3:1) and plot cover (47%) as compared to the other Napier grass lines.
Mean forage DM yield among different harvests was significantly different (p<0.05). However, harvest by variety interaction was not statistically significant (p>0.05) for forage DM yield. This depicts the forage DM yield performance rank of the seven Napier grass lines was consistent among the different harvests.
Table 1. Summary table for mean DM yield per harvest, DM yield per hectare, number of tillers per plant, plot cover and leaf to stem ratio.
Napier grass Mean forage DM st (t/ha)
DM yield per ha No. of tillers per Plot cover (%) Leaf : stem ratio
ILRI 15743 2.72 a 15.04 62.11 68 4:1 ILRI 16789 2.32 ab 15.32 83.33 78 4:1 ILRI 14355 2.27 abc 14.51 102.33 47 3:1 ILRI 16801 2.12 bc 13.00 97.33 73 4:1 ILRI 16840 1.94 bcd 11.09 73.66 82 4:1 ILRI 16809 1.82 cd 10.42 75.55 65 4:1 ILRI 16798 1.63 d 8.79 76.66 47 4:1 CV (%) 46.39 - - - - LSD 0.484 - - - - * Values under the same column with different letter are statistically significant (p<0.05).
Among the whole 11 harvests with in the whole 1.5-year experimental period the first seven harvests were carried out during the first year of the trial and the rest four harvests were carried out during the last six months of the experimental period.

Ethiopian Society of Animal Production
44 15th ESAP-Proceedings
Table 2. Summary table for DM yield (t/per hectare) and harvesting date for each harvest of the seven Napier grass lines.
Harvests and harvesting date Napier 1st 2nd Nov.
30,2002 3rd 4th 5th 6th 7th 8th 9th Sep. 10th Oct 11th
16798 0.90 0.43 1.18 0.97 1.97 2.29 1.04 3.04 3.36 0.84 1.75 15743 1.64 0.53 2.76 1.10 4.38 3.04 1.59 3.90 4.20 1.03 1.45 16840 1.18 0.52 1.20 1.06 2.98 2.78 1.37 3.92 4.12 1.08 1.28 16801 1.36 0.45 1.98 1.23 3.57 2.84 1.57 3.69 4.10 1.18 1.15 16809 0.91 0.86 0.46 1.02 3.23 2.67 1.27 3.46 3.94 0.88 1.20 16789 1.61 0.59 2.55 1.24 4.18 3.38 1.77 3.39 4.13 1.30 1.50 14355 1.22 0.66 3.03 1.05 3.93 2.80 1.81 4.20 3.79 0.95 1.53
In general mean total forage DM yield per year ranged from 8.79t/ha to 15.31t/ha for ILRI 16798 and 16789, respectively. The maximum DM yield per ha per year obtained in this study is similar with the result reported by Samuel and Mesfin, 2002. However, this result is different from the result reported by Tessema et al, 2002 (10.67 t DM/ha per year). This variation could be due to the differences in moisture content of the testing sites, Napier grass lines used and soil fertility condition of the testing sites. For this experiment the testing site was relatively moist because of the irrigation canal on the two sides of the experimental site and the trees surrounding it.
The total amount of DM yield per year obtained from the recommended lines is a substantial amount to support animals in such and similar feed deficient areas. The productivity of the lowland native pasture on average is one ton DM per hectare per year (Alemayehu, 1985). In such areas, integrating Napier grass and producing about fifteen fold DM yield as compared to native pasture is an intervention to be encouraged.
Demonstration of selected lines of Napier grass
On the participatory on-farm demonstration of Napier grass, initially 20 farmers have planted on the edges of irrigation canals at Gimdrie, Shewarobit (Figure 1). Currently the number of farmers producing Napier grass in the area has increased to 50.
According to the participating farmers, on average about 6-7 harvests were possible annually from Napier grass planted on canals where water flow is every day. Whereas a minimum of 5 harvests were possible from Napier grass planted on canals where water flow is within 5-7 days interval.
On October 2006 a field day was organized by Debre Birhan Agricultural Research Center to evaluate this technology under on-farm condition. The participating farmers explained their appreciation on the performance of the Napier grass lines and the observed utility particularly during the previous dry season when they had critical feed shortage in the locality. They further enumerated a number of additional advantages such as its importance to stabilize the edge of the canal, reduce water loss through evaporation from the canal and did not observe any effect so far on the water flow. Some of the participating farmers have also sold the cuttings of Napier grass for adjacent districts and generated income.

Animal Feed and Nutrition
15th ESAP-Proceedings 45
During the field day the adjacent farmers who didn’t participate in Napier grass production are interested on the technology and asked to participate in the activity. In general, according to the assessment of the participated farmers, Kewot woreda Bureau of Agriculture and other participants, planting of Napier grass on the edges of the irrigation canal has been a successful entry point in Shewarobit area. Participants of the field day indicated that efficient utilization of the produced forage is lacking. This inefficient utilization of the available forage is observed during the main rainy season, when there is relatively enough amount of feed from natural pasture.
Conclusion and Recommendation
Among the seven Napier grass lines evaluated, ILRI 15743 and 16789 are proved to be adaptive and productive under rain fed condition on moist testing site around Shewarobit. Thus, these lines of Napier grass can be introduced into other areas of Shewarobit and similar districts in the country.
Moreover, producing Napier grass on the edges of irrigation canals has been successful and identified as an important entry point. This is demonstrated by a 150 % increase in participation of farmers by copying the technology and the sell of planting materials to neighboring districts.
Farmers of the area should be assisted through practical training and demonstration on conservation and efficient utilization of Napier grass for more productive animals to increase meat and milk production in the area.
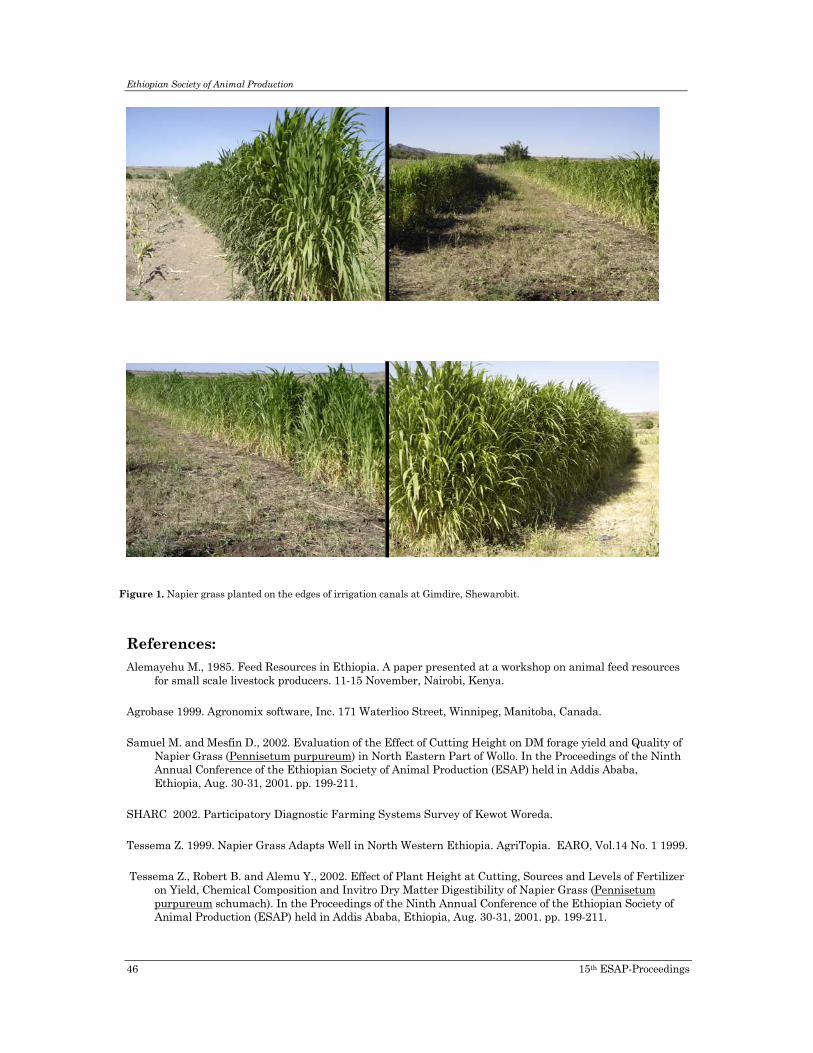
Ethiopian Society of Animal Production
46 15th ESAP-Proceedings
Figure 1. Napier grass planted on the edges of irrigation canals at Gimdire, Shewarobit.
References: Alemayehu M., 1985. Feed Resources in Ethiopia. A paper presented at a workshop on animal feed resources
for small scale livestock producers. 11-15 November, Nairobi, Kenya.
Agrobase 1999. Agronomix software, Inc. 171 Waterlioo Street, Winnipeg, Manitoba, Canada.
Samuel M. and Mesfin D., 2002. Evaluation of the Effect of Cutting Height on DM forage yield and Quality of Napier Grass (Pennisetum purpureum) in North Eastern Part of Wollo. In the Proceedings of the Ninth Annual Conference of the Ethiopian Society of Animal Production (ESAP) held in Addis Ababa, Ethiopia, Aug. 30-31, 2001. pp. 199-211.
SHARC 2002. Participatory Diagnostic Farming Systems Survey of Kewot Woreda.
Tessema Z. 1999. Napier Grass Adapts Well in North Western Ethiopia. AgriTopia. EARO, Vol.14 No. 1 1999.
Tessema Z., Robert B. and Alemu Y., 2002. Effect of Plant Height at Cutting, Sources and Levels of Fertilizer on Yield, Chemical Composition and Invitro Dry Matter Digestibility of Napier Grass (Pennisetum purpureum schumach). In the Proceedings of the Ninth Annual Conference of the Ethiopian Society of Animal Production (ESAP) held in Addis Ababa, Ethiopia, Aug. 30-31, 2001. pp. 199-211.

Animal Feed and Nutrition
15th ESAP-Proceedings 47
Effects of variety and growth stage on proportions of different
morphological fractions in oats (Avena sativa L.).
Fekede Feyissa a, Adugna Tolerab , Solomon Melaku c
a Ethiopian Institute of Agricultural Research (EIAR), Holetta Research Center, Animal Feeds and Nutrition Research Program, P.O.Box 2003, Addis Ababa, Ethiopia b Department of Animal and Range Sciences, Hawasa University, Awassa College of Agriculture, P.O.Box 5, Awassa, Ethiopia c Department of Animal Sciences, Haramaya University, P.O.Box 138, Dire Dawa, Ethiopia
Abstract This paper presents relative proportions of morphological fractions of 20 oats (Avena sativa L.) varieties harvested at different growth stages at Holetta, central highlands of Ethiopia. On average the proportion of leaf blade decreased from 52.2 to 15.6% with parallel increase in the proportion of stem from 19.4 to 57.6% as growth advanced from boot stage to grain maturity stage. The average proportion of leaf sheath decreased from 28.4 to 18% as growth advanced from boot stage to the soft dough stage, but it tended to regain at grain maturity stage (26.8%). The panicle proportion was found to be relatively stable increasing only by 4% units with advance in growth from heading to the soft dough stage. The different varieties also exhibited considerable differences with respect to the proportion of morphological fractions over the different growth stages. Taking the physiological maturity for forage harvest of the soft dough stage as a reference, the oats varieties PI – 5800, CI – 8251 and Grayalgeris were found to contain a higher proportion of leaf in their dry matter (DM) than the other varieties, while the oats varieties PI – 244480, SRCP X 80 Ab 2291 and SRCP X 80 Ab 2806 had comparatively higher proportion of stem in their DM. The results showed the presence of considerable varietal differences in the proportion of morphological fractions thereby suggesting the possibility of improving forage production in oats through proper exploitation of the varietal differences.
Keywords: Oats; Variety; Morphological fractions; Growth stage
Introduction
Oats (Avena sativa L.) is a well-adapted fodder crop grown for a long period of time in the highlands of Ethiopia. Although it was initially perceived as a fodder crop, its grain has also become part of the staple diet of human beings in some parts of the country such as Selale, Debre Brehan, Arsi and Gojam (Lulseged, 1981). Oats being an annual forage crop is highly useful for integration into the prevailing mixed crop- livestock farming systems of the Ethiopian highlands on accounts of its short-term yielding characteristics, use in overcoming seasonal feed shortages, convenience in crop rotations and its fodder conservation characteristics.
Different lines of oats were introduced from different parts of the world to Ethiopia in the early 1970s and mid 1980s. However, due to lack of formal variety development and release mechanism for forage crops in the country, no significant progress has been made beyond

Ethiopian Society of Animal Production
48 15th ESAP-Proceedings
preliminary screening and selection works. Studies conducted on oats varieties in Ethiopia were inadequate to fully describe the overall forage production potentials of the different varieties. To this effect, recommendations so far made on oats have been based on some general aspects of the varieties; mainly environmental adaptation and herbage yield regardless of morphological features and quality (Astatke, 1976). On the other hand, proportion and quality of different morphological fractions as causes of differences in nutritional quality in forage crops and crop residues has been a subject of numerous experiments (Thiago and Kellaway, 1982; Åman and Nordkvist, 1983; Kernan et al., 1984; Ohlde et al., 1992; Tan et al., 1995; Adugna and Sundstøl, 1999). Similar studies (Ørskov, 1988; Ohlde et al., 1992) also showed that proportion and quality of the different morphological fractions varies considerably in temperate cereals such as wheat, oats, barley and rye. The leaf blade and leaf sheath portions have been reported to be more nutritious and digestible than stems.
It is generally evident that dry matter yield as a single index of productivity could not lead to conclusive remarks in forage crops. Getnet (1999) through interviewing farmers has pointed out that the varieties of oats that were recommended from earlier introductions and put under production had high stem proportion and the hay made out of them is less palatable to livestock. This clearly shows that the different varieties need to be assessed for their morphological features and nutritional quality to make concrete recommendations for forage production. Therefore, this study was designed to assess the proportion of different morphological fractions at different growth stages in 20 selected varieties.
Materials and Methods Experimental site
The experiment was conducted at Holetta Agricultural Research Center (HARC) in the central highlands of Ethiopia. The center is located at 38° 30`E, 9° 3`N and 45 km west of Addis Ababa and lies at an elevation of 2400 m above sea level. Based on an average meteorological data of 34 years (1969 – 2003) of the HARC, the annual rainfall of the area is 1066 mm with bimodal distribution, over 70% of which occurs during the main rainy season (June to September) and 30% during the small rainy season (February to April). The average annual minimum and maximum temperatures of the area are 6° to 22°C. The area is also characterized by occasional frost that occurs in the months of October to December, where temperatures below zero are recorded for few days during these months.
The major soil type of the area is a red-brown clay loam nitosol, and analysis of composite soil sample taken from the upper 20 – 30 cm soil horizon of the specific experimental plot in this study indicated that the soil had a pH (1:1 H2O) of 5.1, total N content of 0.2%, P content of 12.4 ppm, OM content of 2.2% and cation exchange capacity (CEC) of 17.0 meq/100 g soil. Similarly, values for the major climatic variables during the course of the experimental period (June – December, 2003) were: total rainfall (686 mm), average minimum and maximum temperatures (6.5° and 21.2°C) and relative humidity of 60.6% (HARC meteorological data).
Oats varieties
Twenty oats varieties that were selected on the basis of their adaptation to the highlands of Ethiopia from previous introduction and screening works were used for the experiment. The varieties and their respective origins are shown in Table 1.

Animal Feed and Nutrition
15th ESAP-Proceedings 49
Sowing, data collection and measurements
The varieties were sown on 24th of June 2003 in a Randomized Complete Block Design (RCBD) with four replications. Sowing was made by drilling the seeds in rows of 0.2 m wide on 4m x 3m plots spaced 0.5 m apart. A starter dose of fertilizer at the rate of 18/46 N/P2O5 kg/ha (100 kg DAP/ha) was applied to all plots at sowing. A uniform seeding rate of 100 kg/ha was used for all the varieties as per previous recommendation for pure stand of oats in the highlands of Ethiopia (Astatke, 1979). All the plots were hand weeded once, a month after sowing and thereafter as required based on occurrence of weeds.
The varieties were closely examined beginning from the early vegetative growth and record of the different growth stages (boot, heading, milk, soft dough and grain maturity stages) was taken. To determine proportions on DM basis of the different morphological fractions, five plants were randomly clipped at ground level from each plot at the different growth stages (Habib et al., 1995; Getnet, 1999). The plants were then manually fractionated into the different morphological fractions including leaf blade, leaf sheath, stem and panicle except at boot stage where panicle was not developed and at grain maturity where it was harvested along with seed. After measuring their fresh weights, the fractions were oven dried at 100°C for 24 h in order to determine their dry biomass. Proportions of each morphological fraction were then determined as the ratio of dry biomass of each fraction to total dry biomass multiplied by 100.
Statistical analysis
Analysis of variance was performed using the statistical analysis system (SAS) software (SAS, 2001) and mean separation was carried out using the Duncans new multiple range test.
The following general linear model was used for the analysis:
Yijk = μ + Bi + Oj+ Sk+ (OS)jk + Eijk
Where, Y – the measured response
μ - the overall mean
Bi – effect of the ith block
Oj – effect of the jth oats variety
Sk – effect of kth growth stage
(OS)jk – interaction effect of jth oats variety and kth growth stage
Eijk – the error term associated with each Yijk
Results and Discussion Proportion of leaf blade
Table 2 shows the proportion of leaf blade in 20 oats varieties at different growth stages. The proportion of leaf blade ranged from 44 to 61% at boot stage, 16 to 22% at heading, 13 to 20% at milk, 12 to 23% at the soft dough and 11 to 20% at grain maturity stages. Significantly higher (P<0.05) proportion of leaf blade was obtained at boot stage than in the other stages for all the varieties. The proportion of leaf blade showed a marked reduction as growth advanced from boot to heading stage, but showed slight and non-significant (P>0.05) variation from milk stage

Ethiopian Society of Animal Production
50 15th ESAP-Proceedings
onwards in most of the varieties. The overall average proportion of leaf blade decreased by 70% as growth advanced from boot stage to grain maturity stage.
Considerable and variable differences were also observed among the varieties in the proportion of leaf blade at different growth stages. SRCP X 80 Ab 2252, SRCP X 80 Ab 2806 and 79 Ab 382 (TX) (80 SA 94) had significantly higher leaf blade proportion (P<0.05) whereas Grayalgeris, PI-5800 and CI-8237 had significantly lower (P<0.05) proportion than most of the other varieties at boot stage. Jasari, Lampton, CI-8237, CI-8251 and CI-8235 had significantly higher (P<0.05) proportion of leaf blade than most of the other varieties at heading stage. At milk stage, the proportion of leaf blade was significantly higher (P<0.05) in PI-5800 followed by Jasari, Grayalgeris and Lampton. On the other hand, PI-244480, Clintland 60 MN 16016 and SRCP X 80 Ab 2764 had significantly lower (P<0.05) proportion of leaf blade at heading stage, while 79 Ab 382 (TX) (80 SA 94), SRCP X 80 Ab 2767 and CI-8235 had significantly lower (P<0.05) proportion of leaf blade than most of the other varieties at milk stage.
At the soft dough stage, the proportion of leaf blade was significantly higher (P<0.05) in PI-5800, CI-8251, Grayalgeris, PI-338517 and PI- 244475, but was significantly lower (P<0.05) in CI-8237, SRCP X 80 Ab 2764, 79 Ab 384 (TX) (80 SA 95) and SRCP X 80 Ab 2767 than most of the other varieties. At grain maturity stage, Jasari, PI-338517, Grayalgeris, PI-5800 and CI-8251 had significantly higher (P<0.05) proportion of leaf blade, while SRCP X 80 Ab 2252, Coker SR res 80 SA 130 and SRCP X 80 Ab 2806 had significantly lower (P<0.05) proportion of leaf blade than most of the other varieties. It was generally shown that varieties with higher proportion of leaf blade during the early growth stage had lower proportion of leaf blade towards later stages and vice versa.
Proportion of leaf sheath
Table 3 shows the proportion of leaf sheath in 20 oats varieties at different growth stages. The overall trend showed that the proportion of leaf sheath decreased from boot to soft dough stage but tended to regain at grain maturity. It generally ranged from 24.7 to 33.3% at boot, 21.5 to 28.4% at heading, 17.2 to 23.6% at milk, 15.1 to 23.4% at soft dough and 24.6 to 30.3% at grain maturity stages. The overall mean proportion of leaf sheath decreased from 28 to 18% with advancing growth from boot stage to the soft dough stage and increased to 27% at grain maturity stage with reduction in overall average proportion only by 5.5% as growth advanced from boot stage to grain maturity stage.
As in the case of leaf blade, the variation in the proportion of leaf sheath among varieties was not consistent over the different growth stages. SRCP X 80 Ab 2767, SRCP X 80 Ab 2764 and Ky to 78394 Canada in descending order had comparatively higher, while SRCP X 80 Ab 2252, SRCP X 80 Ab 2806 and PI-244480 had lower proportion of leaf sheath at boot stage than the other varieties. At heading stage, significantly higher (P<0.05) proportion of leaf sheath was recorded for SRCP X 80 Ab 2252, PI-244480 and Coker SR res 80 SA 130, whereas Grayalgeris and CI- 8251 had significantly lower (P<0.05) proportion of leaf sheath than most of the other varieties. At milk stage, the relative proportion of leaf sheath was significantly higher (P<0.05) in Clintland 60 MN 16016, PI-244480 and PI-5800, and significantly lower (P<0.05) in Jasari, CI-8235, 79 Ab 382 (TX) (80 SA 94) and Grayalgeris than most of the other varieties. Similarly, Clintland 60 MN 16016, PI-8235 and PI-244475 had higher (P<0.05), whereas SRCP X 80 Ab 2767, Lampton, and SRCP X 80 Ab 2291 had significantly lower (P<0.05) proportion of leaf sheath at the soft dough stage. The proportion of leaf sheath in the straw (at grain maturity) was
Animal Feed and Nutrition
15th ESAP-Proceedings 51
comparatively higher in Clintland 60 MN 16016 and Ky to 78394 Canada in descending order and was lower in PI-244480 and SRCP X 80 Ab 2806.
Proportion of stem
The proportion of stem in 20 oats varieties at different growth stages is presented in Table 4. Unlike the proportion of leaf blade, the stem fraction showed an increasing trend with advancing maturity from boot stage to grain maturity stage in all the varieties. The stem proportion was significantly lower (P<0.05) at boot stage and higher (P<0.05) at grain maturity stage, but did not significantly vary (P>0.05) between milk and soft dough stages. The proportion of stem in general ranged from 10.64 to 28.83% at boot, 27.03 to 39.44% at heading, 349 to 43.4% at milk, 33.3 to 43.7% at soft dough and 52.2 to 63.5% at grain maturity stages. The overall average proportion of stem showed an increment of 196% with advancing growth from boot stage to grain maturity stage.
As in the case of the other morphological fractions, there was significant but variable differences among the varieties in the proportion of stem at different growth stages. The oats varieties Grayalgeris, PI-338517, CI-8251 and PI-244480 had significantly higher (P<0.05) proportion of stem than most other varieties at boot and heading stages. On the other hand, 79 Ab 382 (TX) (80 SA 94), Clintland 60 MN 16016, SRCP X 80 Ab 2767 and Ky to 78394 Canada had significantly lower (P<0.05) proportion of stem at boot stage, whereas SRCP X 80 Ab 2767 had lower proportion of stem followed by SRCP X 80 Ab 2252 and SRCP X 80 Ab 2291 at heading stage. The oats variety PI-244480 had still higher proportion of stem followed by SRCP X 80 Ab 2291 at both milk and soft dough stages. Likewise, the proportion of stem was relatively higher in 79 Ab 384 (TX) (80 SA 95) at both stages. The oats varieties CI- 8251 and SRCP X 80 Ab 2806 also had higher proportion of stem at milk and soft dough stage respectively. The proportion of stem was significantly lower (P<0.05) in PI-5800 followed by Clintland 60 MN 16016, PI-338517, SRCP X 80 Ab 2764 and SRCP X 80 Ab 2767 at milk stage. Similarly, SRCP X 80 Ab 2767, PI-338517 and PI- 5800 had lower proportion of stem at the soft dough stage. The proportion of stem in the straw (at grain maturity stage) was higher in SRCP X 80 Ab 2806, PI-244480, SRCP X 80 Ab 2767 and 79 Ab 384 (TX) (80 SA 95) while PI-338517, Jasari, PI- 5800, Clintland 60 MN 16016 and Grayalgeris had comparatively lower proportion of stem in the straw. In general, stem accounted for more than 50% of the straw in all the varieties.
Proportion of panicle
Table 5 shows the proportion of panicle in the 20 varieties at heading, milk and soft dough stages. The proportion of panicle showed an increasing trend from heading to the soft dough stage in most varieties with few exceptions such as CI-8235 and CI- 8251 in which the panicle proportion was significantly higher (P<0.05) at milk stage than at heading and soft dough stages. In general, the proportion of panicle ranged from 17.0 to 28.5% at heading, 18.8 to 31.2% at milk and 20.1 to 37.6% at soft dough stages. The overall average proportion of panicle increased by 18% as growth advanced from heading to the soft dough stage.
SRCP X 80 Ab 2767 had significantly higher (P<0.05) while PI- 244480 had significantly lower (P<0.05) proportion of panicle than the other varieties at all the growth stages. Moreover, 79 Ab 382 (TX) (80 SA 94), Ky to 78394 Canada, SRCP X 80 Ab 2764 and CI-8235 had comparatively higher proportion of panicle at heading and milk stages and CI-8237 and Lampton had relatively

Ethiopian Society of Animal Production
52 15th ESAP-Proceedings
higher proportion of panicle in addition to those mentioned above at the soft dough stage. The proportion of panicle tended to be lower in CI-8251, Lampton and CI-8237 at heading stage, in CI- 8237, PI-5800 and PI-244475 at milk stage and in CI-8251, PI-5800 and PI-244475 at the soft dough stage, all following PI-244480 which consistently had the lowest proportion of panicle over the growth stages.
Leaf to stem ratio
Leaf to stem ratio of the 20 oats varieties at different growth stages is shown in Table 6. The leaf to stem ratio generally showed a decreasing trend from boot to grain maturity stages, but sharply declined between boot to heading stages and the decline from heading stage onwards was low and variable. It ranged from 2.5 to 9.8, 1.1 to 1.7, 0.8 to 1.2, 0.8 to 1.3 and 0.6 to 1.0 units at boot, heading, milk, soft dough and grain maturity stages, respectively. The leaf to stem ratio was significantly higher (P<0.05) at boot stage than in the other growth stages in all the varieties, but the difference was not significant (P>0.05) from heading to grain maturity stages in most of the varieties. The overall average leaf to stem ratio of the 20 varieties was decreased by 85% as growth advanced from boot stage to grain maturity stage.
Considerable variability was realized among the varieties with respect to leaf to stem ratio at different growth stages. Clintland 60 MN 16016, 79 Ab 382 (TX) (80 SA 94), SRCP X 80 Ab 2767 and Ky to 78394 Canada had significantly higher (P<0.05) leaf to stem ratio than most of the other varieties whereas, Grayalgeris, CI-8251 and PI-338517 had lower (P<0.05) leaf to stem ratio at boot stage. At heading stage, leaf to stem ratio was still higher in SRCP X 80 Ab 2767 followed by SRCP X 80 Ab 2252 and Lampton while Grayalgeris, PI-244480 and PI-338517 had lower leaf to stem ratio. At milk stage, PI-5800, Clintland 60 MN 16016 and Lampton had significantly higher (P<0.05) while CI-8235, 79 Ab 382 (TX) (80 SA 94) and 79 Ab 384 (TX) (80 SA 95) had significantly lower (P<0.05) leaf to stem ratio than most of the other varieties. Similarly, the oats varieties PI-5800, PI-244475 and CI-8251 in descending order had higher leaf to stem ratio, while 79 Ab 384 (TX) (80 SA 95), SRCP X 80 Ab 2764 and SRCP X 80 Ab 2291 had comparatively lower leaf to stem ratio at the soft dough stage. The leaf to stem ratio in the straw (at grain maturity stage) was higher in PI-338517 followed by Jasari and PI-5800 but lower in SRCP X 80 Ab 2806 followed by PI-244480 and SRCP X 80 Ab 2767.
In general, both variety and growth stage had considerable effects on the proportion of morphological fractions in oats. The variation among the varieties in the proportion of morphological fractions might have arisen from heritable genotypic characteristics such as differences in maturity and plant height. Capper et al. (1988) reported higher proportions of leaf in the straw of shorter barley and wheat varieties. Ramazin et al. (1986) also reported that shorter or late-maturing barley varieties are likely to have higher proportion of leaf and better quality straw than tall or early-maturing varieties. Similarly, Mohammed (1992) confirmed that leaf proportion was higher in late maturing wheat cultivars. Moreover, better straw quality was reported in shorter varieties of wheat, barley and oats (Colucci et al., 1992). The results of the present study in oats was in agreement with the above findings as shorter varieties tended to have higher proportion of leaf and leaf to stem ratio than taller varieties. This could be due to more number of nodes from where the leaves arise and/or shorter stem inter-nodes in shorter varieties as compared to in taller varieties that are characterized by continuous elongation throughout the growing season.

Animal Feed and Nutrition
15th ESAP-Proceedings 53
Early maturing varieties such as SRCP X 80 Ab 2252, 79 Ab 382 (TX) (80 SA 94), SRCP X 80 Ab 2806 and Clintland 60 MN 16016 had higher proportion of leaf than stem with the corresponding higher leaf to stem ratio during the early stages of growth, while late maturing varieties such as Grayalgeris, PI-338517, CI-8251, PI-244475 and PI-5800 had comparatively higher leaf to stem ratio towards the later stages of growth. This could be attributed to the longer vegetative growth period which allowed late maturing varieties to make full use of the better growing conditions as compared to early maturing varieties that progress through different development stages at a faster rate and tend to express their potential in the earlier growth stages.
The tendency to shift from vegetative growth stage to the grain filling stage could explain the marked reduction in the proportions of leaf blade and leaf sheath as growth advanced from boot stage to milk stage in the oats varieties. Nelson et al (1995) illustrated that during the course of development from boot stage to heading and milk stages, nutrients stored in the lower leaves are redistributed to the upper plant, including the developing kernels, causing some of the bottom leaves to die with the consequent drop in the proportion of leaves in wheat, barley and oats. On the other hand, the proportion of leaf blade in maize stover was reported to be similar between the two early stages of maturity (30.2 and 22.5% grain moisture content), but significantly decreased as grain moisture content decreased to 12.3% (Adugna and Sundstøl, 1999). Shattering loss due to brittleness and detachment from the stem was reported to be the major cause for reduction in the proportion of leaf blade in maize stover with advancing maturity (Adugna and Sundstøl, 1999). The absence of much difference in the proportion of leaf blade from heading to grain maturity stages and the comparatively higher proportion of leaf sheath towards later stages could imply the ability of oats to retain more of their leaf material as compared to the coarse stemmed crops such as maize.
The increase in the proportion of leaf sheath at later stage could be explained with respect to the development pattern of the stem as the sheath represents the tubular portion of a grass leaf that encloses the stem. At boot stage, the stem was highly succulent and less developed while the sheath was thicker. From heading to soft dough stages, the stem showed progressive development while the sheath was getting thinner with the consequent low proportion. Hence, the increase in the proportion of leaf sheath at grain maturity stage indicates that the sheath may rebound its thickness after the termination of stem development in oats. Adugna and Sundstøl (1999) also reported that the proportion of leaf sheath decreased only by 4.5% as grain moisture content decreased from about 30 – 10% in maize.
The overall average proportion of stem increased by 196%, whereas, the proportions of leaf blade, leaf sheath and leaf to stem ratio decreased by 70%, 5.5% and 85%, respectively, as growth advanced from boot to grain maturity stage. The stem accounted for more than 50% of the straw in all the oats varieties. Contrary to this, Capper et al (1988) reported that leaf blade and sheath made up a higher proportion than stem in barley and wheat straws (35.5 and 43%, respectively). Similarly, a study on eight maize varieties at Awassa (Adugna et al., 1999) has shown that the proportion of stem ranged from 30.6 to 49.7% with a mean of 39.1% in the stover.
The proportion of panicle was increased by 18% as growth advanced from heading to the soft dough stage. The milk and soft dough stages did not differ much with regard to the average proportion of morphological fractions which in turn could imply that herbage quality may not differ at these growth stages so that harvesting for hay could be made at a stage when yield is high. Besides its effect on proportion of morphological fractions, stage of maturity at harvest is the most important factor determining the yield and quality of a cereal crop when used as a forage. As reported by Johnston et al. (1998), forage yield increased by 90% to 110% as maturity

Ethiopian Society of Animal Production
54 15th ESAP-Proceedings
advanced from the boot to the soft dough stage in both oats and barley. At the same time the authors reported that, CP dropped by about 40 to 50%, ADF and NDF levels increased by 15% to 25%. This indicates that maximum yield of energy per unit area will occur when the cereal is harvested at the soft dough stage whereas protein content is high in the earlier stages. Ciha (1983) also reported that forage yield increased by 37%, 68%, 73% and 137% whereas the CP decreased by 32%, 37%, 36% and 53% from heading to the soft-dough stage in oats, barley, wheat and triticale, respectively. With earlier harvest, a second cutting could be possible under good moisture conditions that promote better re-growth, and this enables to get a considerable amount of high quality forage (Ciha, 1983).
Generally, the considerable variability among the oats varieties with respect to the proportions of morphological fractions and leaf to stem ratio at different growth stages indicates the presence of wide scopes for exploiting varietal differences for forage production. Moreover, the inconsistency of variation in the proportion of morphological fractions among the varieties at different growth stages indicates the need and possibility to select different varieties for different growth stages based on the intended quality of the forage to be produced. Owing to their high proportion of leaf blade, SRCP X 80 Ab 2252, SRCP X 80 Ab 2806, 79 Ab 382 (TX) (80 SA 94) and Clintland 60 MN 16016 could provide comparatively better quality forage than the other varieties at boot stage. On the other hand, better quality forage could be obtained from PI-5800, CI-8251 and Grayalgeris at physiological maturity for forage harvest (soft dough stage) as they had comparatively higher proportion of leaf blade at this stage.
Conclusion The proportion of morphological fractions was influenced by both variety and growth stage.
The proportion of leaf blade decreased with concomitant increase in the proportion of stem with advance in growth from boot stage to the grain maturity stage in all the varieties. The variation in the proportion of morphological fractions in different oats varieties at different growth stages was inconsistent indicating the possibility to select different varieties at different growth stages based on the intended use of the variety. Varieties with higher proportion of leaves at a given growth stage could be recommended for hay production, while those varieties with higher proportion of stem could be useful for silage making. Generally, the considerable variability among the varieties in the proportion of morphological fractions shows the presence of wide opportunity to improve forage production from oats through proper exploitation of varietal differences.
Acknowledgements We would like to acknowledge the financial support by the Agricultural Research and Training Project (ARTP) of the Ethiopian Agricultural Research Organization (EARO). We are also grateful to the staff of Feeds and Nutrition Research Program at Holetta Agricultural Research Center for their keen cooperation during the execution of the experiment both at field and in the laboratory.

Animal Feed and Nutrition
15th ESAP-Proceedings 55
References Adugna Tolera and Sundstøl, F. 1999. Morphological fractions of maize stover harvested at different stages of
grain maturity and nutritive value of different fractions of the stover. Anim. Feed Sci. Technol. 81: 1-16.
Adugna Tolera, Berg T., and Sundstøl, F. 1999. The effect of variety on maize grain and crop residue yield and nutritive value of the stover. Anim. Feed Sci. Technol. 79: 165-177.
Åman, P. and Nordkvist, E. 1983. Chemical composition and in vitro degradability of botanical fractions of cereal straw. Swedish J. Agric. Res. 13: 61 – 67.
Astatke Haile. 1976. Results of experiments in forage crops and pasture management in the highlands of Ethiopia (1971 – 1976), Forage and Range Bulletin No. 1: IAR (Institute of Agricultural Research), Addis Ababa, Ethiopia.
Astatke Haile. 1979. Forage Crops and Pasture Management in the Highlands of Ethiopia. Forage and Range Bulletin No. 2: IAR (Institute of Agricultural Research), Addis Ababa, Ethiopia.
Capper, B.S., Thomson, E.F. and Herbert, F. 1988. Genetic variation in the feeding value of barley and wheat straw. In: Reed, J.D., Capper, B.S., Neate, P.J.H. (Eds.), Plant Breeding and the Nutritive value of Crop Residues. Proc. Workshop held at ILCA, Addis Ababa, Ethiopia, 7 – 10 December 1987, ILCA, Addis Ababa, pp. 177 – 193.
Ciha, A.J. 1983. Forage production of triticale relative to other spring grains. Agron. J. 75: 610 – 613.
Colucci, P.E., Falk, D., Macleod, G.K. and Grieve, D.G. 1992. In situ organic matter degradability of untreated and urea-treated varieties of spring barley and oat straws, and of untreated varieties of winter wheat straws. Anim. Feed Sci. Technol. 37: 73 – 84.
Getnet Assefa. 1999. Feed resource assessment and evaluation of forage yield, quality and intake of oats and vetches grown in pure stands and in mixtures in the highlands of Ethiopia. M.Sc thesis. Department of Animal Nutrition and Management, Swedish University of Agricultural Sciences, Uppsala, Sweden.
Habib, G., Shah, S.B.A. and Inayat, K. 1995. Genetic variation in morphological characteristics, chemical composition and in vitro digestibility of straw from different wheat cultivars. Feed Sci. Technol. 55: 263-274.
Johnston, J., Wheeler, B. and McKinlay, J. 1998. Forage production from spring cereals and cereal-pea mixtures. Ministry of Agriculture and Food, Ontario, Canada. (http://www.search.gov.on.ca:8002/compass?view-template=simple1).
Kernan, J.A., Coxworth, E.C., Crowle, W.C. and Spurr, D.T. 1984. The nutritional value of crop residues from several wheat cultivars grown at different fertilizer levels. Anim. Feed Sci. Technol. 11: 301 – 311.
Lulseged G/Hiwot. 1981. Summary of fodder oats research undertaken by IAR. Pasture and fodder forage bulletin no. 2, IAR, Addis Ababa.
Mohammed, J. 1992. Selection and evaluation of potential wheat cultivars for double-cropping under irrigation in Awash valley, Ethiopia. Straw yield and quality as affected by duration of growing period. Trop. Agric. (Trinidad) 69(2): 186 – 190.
Nelson, J.E., Bauer, A. and Connor, J.F. 1995. Growth staging of wheat, barley and wild oat. A strategic step to timing of field operation. Montana Agricultural Experiment Station Capsule Information Series No. 30. (http://Growth Staging of Wheat, Barley and Wild Oat. htm)

Ethiopian Society of Animal Production
56 15th ESAP-Proceedings
Ohlde, G.W., Becker, K., Akin, D.E., Rigsby, L.L., Lyon, C.E. 1992. Differences in rumen bacterial degradation of morphological fractions in eight cereal straws and the effects of digestion on different types of tissues and mechanical properties of straw stalks. Anim. Feed Sci. Technol. 36: 173-186.
Ørskov E.R. 1988. Consistency of differences in nutritive value of straw from different varieties in different seasons. In: Reed, J.D., Capper, B.S., Neate, P.J.H. (Eds.). Plant Breeding and the Nutritive value of Crop Residues. Proc. Workshop held at ILCA, Addis Ababa, Ethiopia, 7 – 10 December 1987, ILCA, Addis Ababa, pp. 163 – 176.
Ramazin M., Ørskov E.R. and Tuah A.K. 1986. Rumen degradation of straw. 2. Botanical fractions of straw from two barley cultivars. Anim. Prod. 43: 271-278.
Statistical Analytical Systems (SAS). 2001. SAS/STAT user’s guide release 8.1. Statistical Analysis Systems Institute, Inc, Cary, NC, USA.
Tan, Z.L., Chen, H.P., He, L.H., Fang, R.J., Xing, T.X. 1995. Variation in the nutritional characteristics of wheat straw. Anim. Feed Sci. Technol. 53: 337 – 344.
Thiago, L.R.L.de.S. and Kellaway, R.C. 1982. Botanical composition and extent of lignification affecting digestibility of wheat and oat straw and paspalum hay. Anim. Feed Sci. Technol. 7: 71 - 81.

Animal Feed and Nutrition
15th ESAP-Proceedings 57
Table 1 Varieties of oats used in the study
Serial No Variety Origin 1 79 Ab 382 (TX) (80 SA 94) CIMMYT 2 79 Ab 384 (TX) (80 SA 95) CIMMYT 3 CI – 8251 Yugoslavia 4 Jasari Kenya 5 SRCP X 80 Ab 2806 CIMMYT 6 Lampton Ethiopia 7 SRCP X 80 Ab 2252 CIMMYT 8 CI – 8235 USA 9 CI – 8237 USA 10 Grayalgeris Algeria 11 SRCP X 80 Ab 2291 CIMMYT 12 Coker SR res 80 SA 130 CIMMYT 13 SRCP X 80 Ab 2764 CIMMYT 14 SRCP X 80 Ab 2767 CIMMYT 15 Clintland 60 MN 16016 CIMMYT 16 PI – 338517 Not specified 17 PI – 244475 Not specified 18 PI – 5800 Not specified 19 PI – 244480 Not specified 20 Ky to 78394 Canada CIMMYT

Ethiopian Society of Animal Production
58 15th ESAP-Proceedings
Table 2 Proportion of leaf blade on dry matter basis in 20 oats varieties at different growth stages
Growth stage Variety Boot Head Milk Soft dough Grain
79 Ab 382 (TX) (80 SA 94) 60.1ab 17.5fghi 13.0f 15.6defgh 14.7bcde 79 Ab 384 (TX) (80 SA 95) 53.3bcdef 18.6defgh 13.9f 13.3gh 12.6de CI – 8251 48.3defg 21.1abc 18.1abc 21.5ab 19.1abc Jasari 51.3cdefg 22.1a 19.1ab 17.7bcdef 21.9a SRCP X 80 Ab 2806 60.3ab 19.4bcdef 17.6bcd 15.4efgh 11.5e Lampton 47.7efg 21.7ab 18.3abc 15.1fgh 15.0bcde SRCP X 80 Ab 2252 61.3a 17.9efgh 13.9f 17.4cdef 11.4e CI – 8235 49.3cdefg 21.0abc 13.5f 16.6cdefg 16.1abcde CI – 8237 46.0fg 21.2abc 18.2abc 12.3h 14.2bcde Grayalgeris 44.4g 19.1cdefg 18.4abc 20.5abc 19.9ab SRCP X 80 Ab 2291 56.6abc 19.9abcde 14.9ef 16.4defg 14.3bcde Coker SR res 80 SA 130 55.5abcd 17.2fghi 13.8f 14.3fgh 11.5e SRCP X 80 Ab 2764 51.5cdefg 16. 9ghi 14.5ef 13.0gh 16.6abcde SRCP X 80 Ab 2767 54.2abcde 18.5defgh 13.5f 13.9fgh 12.2de Clintland 60 MN 16016 59.3ab 16.3hi 13.5f 13.9fgh 16.2abcde PI – 338517 46.0fg 19.0cdefg 16.5cde 19.5abcd 19.9ab PI – 244475 47.4efg 20.8abcd 17.5bcd 19.4abcde 18.4abcd PI - 5800 45.9fg 20.5abcd 20.5a 23.2a 19.8ab PI – 244480 49.3cdefg 15.5i 14.6ef 15.3fgh 12.6de Ky to 78394 Canada 56.5abc 17.2fghi 14.5ef 14.8fgh 13.3cde Mean 52.2 19.1 16.0 16.5 15.6 SE 2.7 0.83 0.9 1.4 2.3 abc means with different letters within a column are significantly different (P<0.05)

Animal Feed and Nutrition
15th ESAP-Proceedings 59
Table 3 Proportion of leaf sheath on dry matter basis in 20 oats varieties at different growth stages
Growth stage Variety Boot Head Milk Soft dough Grain
79 Ab 382 (TX) (80 SA 94) 29.3abcd 23.1defg 17.9def 16.4defg 27.0ab 79 Ab 384 (TX) (80 SA 95) 28.4bcde 23.9cdefg 18.9cdef 16.4defg 26.4ab CI – 8251 26.2cde 21.9fg 18.0def 19.2bcde 27.1ab Jasari 27.0bcde 22.2efg 17.2f 16.0efg 25.6b SRCP X 80 Ab 2806 25.1de 24.8bcd 19.4cdef 16.1defg 24.9b Lampton 29.6abc 24.5bcde 20.0bcd 15.5fg 26.3ab SRCP X 80 Ab 2252 24.7e 28.4a 19.6cde 19.0bcdef 27.58ab CI – 8235 29.4abcd 23.9cdef 17.6ef 21.5ab 27.9ab CI – 8237 30.0abc 24.1cdef 20.6bc 17.1cdefg 26.6ab Grayalgeris 26.7cde 21.5g 17.9def 16.6cdefg 26.5ab SRCP X 80 Ab 2291 26.8bcde 24.1cdef 18.6cdef 15.5fg 25.7b Coker SR res 80 SA 130 27.7bcde 27.0ab 20.6bc 19.6bcd 27.5ab SRCP X 80 Ab 2764 31.2ab 24.3cdef 19.4cdef 15.7efg 26.7ab SRCP X 80 Ab 2767 33.3a 26.0abc 18.7cdef 15.1g 26.4ab Clintland 60 MN 16016 29.9abc 24.2cdef 23.6a 23.4a 30.3a PI – 338517 28.2bcde 22.5defg 19. 5cdef 17.4cdefg 27.9ab PI – 244475 28.6bcde 22.3efg 20.5bc 21.1ab 26.1ab PI - 5800 29.6abc 24.2cdef 22.3ab 20.0abc 27.0ab PI – 244480 25.9cde 28.1a 23.2a 20.9ab 24.6b Ky to 78394 Canada 30.2abc 22.9defg 18.4cdef 18.6bcdefg 28.6ab Mean 28.4 24.2 19.6 18.1 26.8 SE 1.6 0.9 0.8 1.2 1.6 abc means with different letters within a column are significantly different (P<0.05)
Table 4 Proportion of stem on dry matter basis in 20 oats varieties at different growth stages
Growth stage Variety Boot Head Milk Soft dough Grain maturity
79 Ab 382 (TX) (80 SA 94) 10.6h 31.9ef 38.2bcdef 36.7bcde 58.3abcde 79 Ab 384 (TX) (80 SA 95) 18.3cdef 33.3cdef 40.3bc 39.3abcd 61.0abc CI – 8251 25. 6ab 35.6bc 40.1bc 38.3bcde 53.8de Jasari 21.7bcde 32.4cdef 37.0defg 37.9bcde 52.5e SRCP X 80 Ab 2806 14.7fgh 32.6cdef 37.5cdefg 39.8abc 63.5a Lampton 22.7bcd 32.4cdef 37.1defg 36.3bcde 58.8abcd SRCP X 80 Ab 2252 14.0fgh 30.3fg 39.5bcd 36.8bcde 61.0abc CI – 8235 21.3bcde 32.7cdef 38.4bcdef 38.8abcd 56.0cde CI – 8237 24.1abc 33.4cdef 39.4bcde 36.7bcde 59.3abcd Grayalgeris 28.8a 37.1ab 38.1bcdef 36.4bcde 53.6de SRCP X 80 Ab 2291 16.5efgh 31.3ef 40. 9ab 41.2ab 60.0abc Coker SR res 80 SA 130 16.8defg 32.3cdef 39.2bcde 37.5bcde 61.0abc SRCP X 80 Ab 2764 17.2def 31.4ef 36.6efg 38.1bcde 56.7bcde SRCP X 80 Ab 2767 12.5fgh 27.0g 36.7defg 33.3e 61.4abc Clintland 60 MN 16016 10.8gh 32.7cdef 36.1fg 37.0bcde 53.4de PI – 338517 25.8ab 35.6bcd 36.5efg 34.6de 52.2e PI – 244475 24.1abc 34.3bcde 38.8bcdef 36.4bcde 55.5cde PI - 5800 24.5ab 33.4cdef 34.9g 34.8cde 53.2de PI – 244480 24.8ab 39.4a 43.4a 43.7a 62.8ab Ky to 78394 Canada 13.3fgh 32.3def 38.0bcdef 36.8bcde 58.1abcde Mean 19.4 32.3 38.3 37.5 57.6 SE 2.1 1.2 1.0 1.8 2.2 abc means with different letters within a column are significantly different (P<0.05)

Ethiopian Society of Animal Production
60 15th ESAP-Proceedings
Table 5 Proportion of panicle on dry matter basis in 20 oats varieties at different growth stages
Growth stage Variety Head Milk Soft dough
79 Ab 382 (TX) (80 SA 94) 27.6a 30.9ab 31.3abcd 79 Ab 384 (TX) (80 SA 95) 24.3cde 27.0cdef 31.0abcd CI – 8251 21.4f 23.7fghi 21.0hi Jasari 23.4def 26.7cdefg 28.4bcdefg SRCP X 80 Ab 2806 23.2def 25.6defgh 28.6bcdefg Lampton 21. 5f 24.6efghi 33.1abc SRCP X 80 Ab 2252 23.4def 27.0cdef 26.9cdefgh CI – 8235 22.3def 30.6ab 23.2fghi CI – 8237 21.3ef 21.9ij 33.9ab Grayalgeris 22.4def 25.6efgh 26.6defgh SRCP X 80 Ab 2291 24.7bcd 25.6efgh 26.9cdefgh Coker SR res 80 SA 130 23.5def 26.4cdefg 28.6bcdefg SRCP X 80 Ab 2764 27.4ab 29. 6abc 33.2abc SRCP X 80 Ab 2767 28.5a 31.2a 37.6a Clintland 60 MN 16016 26.8abc 24.9efghi 24.4efghi PI – 338517 22.9def 27.6bcde 28.6bcdef PI – 244475 22.6def 23.32hi 23.1fghi PI - 5800 22.0def 22.3hi 22.2ghi PI – 244480 17.0g 18.8j 20.1i Ky to 78394 Canada 27.6ab 29.1abcd 29.8bcde Mean 23. 7 26.1 27.9 SE 1.1 1.2 2.2 abc means with different letters within a column are significantly different (P<0.05)

Animal Feed and Nutrition
15th ESAP-Proceedings 61
Table 6 Leaf to stem ratio of 20 oats varieties at different growth stages (Leaf to stem ratio = Leaf blade + Leaf sheath/stem)
Growth stage Variety Boot Head Milk Soft dough Grain
79 Ab 382 (TX) (80 SA 94) 9.4ab 1.3cde 0.8e 0.9bcd 0.7bcdefgh 79 Ab 384 (TX) (80 SA 95) 4.6de 1.3cde 0.8e 0.8d 0.7fgh CI – 8251 3.0de 1.2cde 0.9cde 1.1abc 0.9abcde Jasari 3.7de 1.4bcd 1.0bcd 0.9bcd 0.9ab SRCP X 80 Ab 2806 6.0bcd 1.4bcd 1.0bcd 0.8d 0.6h Lampton 3.4de 1.4bcd 1.0bcd 0.8d 0.7cdefgh SRCP X 80 Ab 2252 6.2bcd 1.5ab 0.9de 1.0bcd 0.6fgh CI – 8235 4.4de 1.4bcd 0.8e 1.0bcd 0.8abcdefg CI – 8237 3.3de 1.4bcd 1.0bcd 0.8d 0.7defgh Grayalgeris 2.5e 1.1e 1.0bcd 1.0bcd 0.9abcde SRCP X 80 Ab 2291 5.4cde 1.4bcd 0.8e 0.8d 0.7efgh Coker SR res 80 SA 130 5.0de 1.4bcd 0.9cde 0.9bcd 0.7fgh SRCP X 80 Ab 2764 5.4cde 1.3bcde 0.9cde 0.8d 0.8abcdefgh SRCP X 80 Ab 2767 8.7abc 1.7a 0.9cde 0.9bcd 0.6fgh Clintland 60 MN 16016 9.8a 1.2cde 1.1ab 1.1abc 0.9abcd PI – 338517 3.0de 1.2cde 1.0bcd 1.1abc 1.0a PI – 244475 3.2de 1.3cde 1.0bcd 1.1abc 0.8abcdef PI - 5800 3.1de 1.4bcd 1.2a 1.3a 0.9abc PI – 244480 3.1de 1.1e 0.9cde 0.8d 0.6gh Ky to 78394 Canada 8.7abc 1.3cde 0.9cde 0.9bcd 0.7bcdefgh Mean 5.1 1.3 0.9 0.9 0.8 SE 1.2 0.1 0.1 0.1 0.1 abc means with different letters within a column are significantly different (P<0.05)

Animal Feed and Nutrition
15th ESAP-Proceedings 63
ANIMAL PRODUCTION


Animal Production
15th ESAP-Proceedings 65
Major Constraints and Development Intervention in Livestock Marketing in Pastoral Areas of Borana: A Review and Policy Implications
Fufa Dawo1, Mengistu Nigusse2, Chindi Bayissa1, Ejeta Jabessa1, Sileshi Damte2, Elisabeth Farmers2 and Brutawit Dawit Abdi2
1ACDI/VOCA, P O Box 19, Yabello, Borana, 2ACDI/VOCA, P O Box 546 Code1110, Addis Ababa;
Abstract Livestock production and marketing are the livelihoods of pastoralists everywhere or at least in Borana area. Livestock marketing is governed by many factors and depends on the type of buyers and their terminations (domestic consumption or export purposes) and associated country requirements. The major problem for livestock suppliers (pastoralists) is to get potential and reliable buyers. Pastoralist livestock production and supply should be based on market demand so that they can get reasonable benefit from sell of their livestock. Livestock sell or trading for domestic consumption will not bring much benefit for the suppliers, traders and even for the country. Livestock production and trading including value added export is the one that generate best income for the country, traders and suppliers or producers. The major bottleneck for livestock and their product export from Ethiopia is presence of livestock diseases that cause trade barrier; as a result, the country can not fulfill sanitary and phytosanitary standards required for export purposes. If livestock disease can be controlled, the risk of other chemicals for food of animal origin from Ethiopia in general and pastoral areas in particular is very minimal or absent; hence, it is good opportunity for the country to export animal products originating from pastoral areas under name of organic products by giving such brands as “(Natural-) Borana range beef” etc. Can we make use of this chance by controlling the major livestock diseases found in the country is a question that must come to the attention of concerned bodies in general and policy makers in particular. For livestock production, feed or grassland availability is very important but very much constrained by bush encroachment that has negative consequences on production, reproduction, over all livestock performances, and ultimately on marketing. In this paper particular attention was given to livestock (production-), marketing and associated constraints and the need to embark on control of trans-boundary livestock diseases (like FMD) to access better (export) market. In addition progresses so far made by different actors with their constraints and the current interventions made by ACDI/VOCA2 (an international NGO) is presented and recommendations were forwarded.
Introduction Pastoralism is an adaptation to marginal lands, characterized by climate uncertainty and low-
grade resources. The livelihood of pastoralism is based on livestock production but pastoral systems are more than simply livestock production. They are also consumption systems that support 100-200 million mobile pastoralists globally: many more if extensive agro-pastoralists are included. They have natural resource management systems that provide a wide range of services and products that are nationally and globally valued, such as biodiversity, tourism and raw materials (Hatfiled and Davies, 2006).
2
Agricultural Cooperative Development International/Volunteers in Overseas Cooperative Assistance

Ethiopian Society of Animal Production
66 15th ESAP-Proceedings
Pastoralists live in some of the world’s most adverse environments, and have evolved their own coping mechanisms. However, a decade of drought has weakened coping mechanisms and considerably reduced the household asset base. As a result, even a minor shock in the system translates into major food insecurity. Hence, at the level of communities, there is a need to strengthen affected people’s own capacities to withstand the effects of drought (Yacob Aklilu et al., 2003). How can this be achieved is the question that need to be asked and should linger in every bodies mind.
Resources of pastoralists is their living livestock and if, for example, epidemic disease is going to occur during the recycling drought period then the disaster will be more catastrophic to the livestock, the livelihoods of pastoralists. Once this capital has gone, depending on the type and nature of their livestock, it takes years to recover. A fundamental difference, for example, between pastoral and agricultural livelihoods is that pastoralists take much longer time to recover after drought. This is largely because their economy is dependent on reproductive capital that is their livestock. A key intervention in pastoral areas, therefore, must necessarily be the preservation of livestock and related natural resources as a base for post drought recovery. Besides control of important livestock diseases livestock and (value added-) livestock product marketing is very decisive.
The other alternative strategy should be to build the financial capacity of the pastoralist during good times of the year so that they will have relatively better financial capacity to overcome effect of drought and any other problems they face. Income generation through use of different resources present in the area is one of the options by which financial potential of pastoralists can be built. The most sustainable way by which pastoralists can generate good income from their living capital is sell of their livestock when there is good livestock market and save the money that can inturn be used during emergency periods like drought, livestock diseases epidemics, in times of failure in livestock markets etc. For this access to livestock market, know how of the market trends, operations and systems, follow up of livestock market information and some technical support from development workers in the area are crucial. But during drought, alternative and rapid measures in livestock selling or destocking during alarm phase of drought or sometimes a head of it depending on prediction of early warning information is important. The paper addresses points to be focused while research and development is carried in pastoral areas with major emphasis on pastoral livelihood initiative livestock marketing project implemented by ACDI/VOCA in southern pastoral areas of Oromia..
Borana Area and Its Natural Resource (Livestock-) Potential PLI livestock marketing project area in Oromia is implemented in both Borana and Guji zones
of Oromia. The pastoral areas of Borana and Guji zones (Borana area) of Oromia region represent one of the lowland areas of southern Oromia occupying a total land area of 95,000 km2 (Abule Ebro, 2005; Zandera and Mburu, undated). The area has altitude that ranges from 600 m.a.s.l3. at Teltele to 2200 m.a.s.l. at Yabello, has average temperature that ranges from 19 0C to 35 0C and receives average rainfall that ranges from 400 mm to 760 mm with two rainy seasons: short and long rainy seasons. This pastoral area is gifted with many natural resources including vast land for livestock grazing, endowed with precious minerals, two endemic birds [namely the Ethiopian Bush crow (Zavattarionis stresemanni) and white tailed swallow (Hirundo megaensis)] and some wild mammals (Project Yabello, 2005). Above all the area is well known for the cattle 3
Meter above sea level

Animal Production
15th ESAP-Proceedings 67
and goat breeds that sustain the life of pastoralists in the area and also constantly supply these animals for fattening units and abattoirs found in central part of the country and export. Many camels and wild animals are also found in the area and the camels are now sources of milk, meat, and when sold cash incomes. The general land use pattern in PLI project area of Oromia is indicated in table 1.
Table 1. Land Use Patterns in Oromia PLI Project Areas
District Total area Cultivated Cultivable Forest land Grazing land Other (ha)
Arero 1089000 7920 322200 179000 490050 89830 Dire 1270800 25315 133300 500 281100 830585 Dugda Dawa NA NA NA NA NA NA Liben 89500 18874 80550 7705 736471 - (0) Moyale 113000 3160 48720 36000 15384 9736 Taltale 1099000 25672 277172 55017 520913 220226 Yabello 555000 11034 62000 39129 295791 147046 Total 4216300 91975 923942 317351 2339709 1297423 Source: Borana Zonal Rural and Agricultural Development Office (1996E.C.)
ha - hectares; NA - not available
The presence of some of the wildlife species in the area will be a threat for domestic livestock in the area as well as livestock marketing in that they are reservoirs of important livestock diseases like FMD, a disease that currently contributes to trade restrictions. For example, Saudi Arabia’s trade embargo as a result of presence livestock diseases in the Horn of Africa is a critical livelihood constraint for pastoralists, who formerly relied on trading livestock for essential food supplies (DFID, 2001). The ban was repeated in 2006 and exacerbated based on the outbreak of rift valley fever in Northern Kenya that was not yet lifted up. Despite all these bans, Saudi and other customers in the Gulf are reported to prefer meat from the livestock originating in the pastoral areas of Ethiopia and Somalia to the meat of animals from elsewhere in the world (Halderman, 2004). Still boran cattle and black-head Somali sheep appear to be most preferred in Middle East markets (FAO 2006).
Livestock Potential in Borana Area of Oromia Lowland areas of southern Oromia have many livestock species like cattle, goats, sheep, and
camels etc (Table 2). In particular the Borana cattle have superior genetic potential and also are well known for their different merits like milk production (Zender et al., 2005) and meat production in the country.
Table 2: Livestock Population and Distribution Across PLI Project Areas of Oromia
District Cattle Goat Sheep Camel Mule Donkey Horse Chicken
Yabello 143633 77823 21611 112333 359 2237 200 32,823 Dire 460897 132246 62088 45340 2785 12777 3331 28000 Taltale 127188 40000 15000 44000 610 1533 21 2000 Arero 274489 95112 42670 1005 170 5444 56 36759 Moyalle 35000 12820 3467 4808 60 1925 20 8167 Liben 466895 472906 183311 366170 - - - 472906 Dugda NA NA NA NA NA NA NA NA
Total 1508102 830907 328147 472556 3984 23916 3628 580655 Source: Borana Zone Rural and Agricultural Development Office (2003/2004),
NA = Not available

Ethiopian Society of Animal Production
68 15th ESAP-Proceedings
The average national reproduction rate of cattle, goats, sheep and camels is estimated to be 1.2%, 0.5%, 1%, and 1.14%, respectively and annual off take rate of cattle, sheep, goats and camels is 10%, 35%, 38%, and 6.5%, respectively (Belachew and Jemberu, 2003). With this off take and reproduction rates, livestock population will increase and adds pressure on the limited and degraded marginal land where bush encroachment, agricultural expansion and high human population pressure is becoming another significant problem. Hence, unless improvements at grass root level like improvement in degraded land management (rang land rehabilitation), feed productivity and minimizing bush encroachment problem and family planning (for human population) are in place, it is unlikely to overcome the problems.
Livestock Population in Pastoral Areas of Ethiopia and Their Contribution to National Economy
Ethiopia’s huge livestock population favoured by varied agro-ecological zones is a good merit for the country in that the country owns different and huge number of livestock species especially in lowland areas. The pastoral areas in Ethiopia cover two-thirds of the land mass of the country and support 12-15% (or 10-12 million people) of the country’s human population (Solomon Desta, 2006). The percentages of Ethiopia’s total livestock population found in pastoral areas: 20%-30% of the cattle, 25%-52% of the sheep, 45%-73% of the goats, 100% of the camels (Halderman, 2004).
This huge number of livestock species present in the lowlands of Ethiopia contributes to about 90 percent of the country’s live animal export (UNDP, 1997). In general, livestock sector has been estimated to contribute 12-16% of national GDP and 30-35% of agricultural GDP4 (Ayele Solomon et al., 2003). Yacob Aklilu (2003) also reported that if other intermediate values of livestock are properly assessed, the sector is expected to contribute more than 20% to the total GDP. According to very recent report (Hatfiled and Davies, 2006), pastoralism accounts for 35% of the Ethiopia agricultural GDP. Hence, strategic development interventions in these pastoral areas can significantly boost livestock take-off.
Current Livestock Marketing Development Interventions in Southern Pastoral Areas of Oromia
Livestock production in pastoral areas in general is a means of their livelihood with out which their life can be jeopardized. Borana cattle breed found in southern Oromia is the dominant and the best beef animal in the country or even in the horn of Africa as they have extremely good genetic potential (Philipsson, 1992). The breed is widely distributed in Southern pastoral area of Ethiopia and Northern pastoral area of Kenya (Zenther and Mburu, undated). The breed is found in two forms improved (found in Kenya) and non-improved (found in southern pastoral areas of Ethiopia and Northern pastoral area of Kenya). Still the production system is traditional and not market oriented. Livestock in pastoral areas are sold to meet family needs for cash income, which is used to buy food grains and industrial by products like cooking oil and clothing for their household consumption or use. Sometimes specially in times of rainfall shortage that in turn affects availability of animal feed forces them to supply higher animals to market during which the price is clearly very low as compared to normal times. Livestock in
4
Gross domestic product

Animal Production
15th ESAP-Proceedings 69
good times of the year is a living bank for the pastoralists as most pastoralists prefer to save their money on hoofed animals, which is a risky business during the drought period.
PLI Livestock Marketing Project Oromia Overview of Pastoralist Livelihood Initiative (PLI) Project
Absence livestock marketing infrastructure was mentioned as one of the major problem for livestock marketing in pastoral areas of Ethiopia (Belachew and Jemberu, 2003). In response to this, many NGOs’ tried to address the problem in one way or the other. ACDI/VOCA is implementing the livestock marketing component of PLI project funded by USAID5. The Organization works with pastoralists, agro-pastoralists, rural entrepreneurs, small and micro scale enterprises, livestock industry associations, financial institutions, livestock marketing cooperatives, NGOs, government agencies, multilateral organizations as well as research institutions in the areas.
The PLI project program is a two-year initiative with an overall goal to “mitigate the impact of drought and other shocks by sustainably improving preparedness, livelihoods and incomes of pastoralists in Ethiopia (Anon, 2005). The underlining strategy of the program is to improve resilience to shocks such as drought through stronger livestock marketing systems in pastoralist areas (Catley et al., 2007).
PLI program was atypical for at least two reasons:
• To develop best-practice guidelines and policy for livestock relief interventions in pastoralist areas.
• To encourage innovation by allowing implementing agencies to identify new types of response and re-allocate up to 10% of their total budget without prior permission from USAID.
A complementary strategy of PLI was to support privatized primary-level veterinary service in pastoral areas expecting that animal health service provision will be improved through direct benefits to the pastoral households through improved milk supply and other benefits, while reducing livestock mortality and increasing the number of animals available for sale (Catley et al., 2007) and also by playing crucial role in disease control together with proper veterinarians. Currently, private sectors are also involved in export activities of live livestock and chilled meat to the Gulf States and Egypt, which means purchasing livestock from pastoral areas.
Livestock Marketing
Of the PLI implementing NGOs’, ACDI/VOCA focuses on livestock marketing in major pastoral areas of Borana and Guji zones of Oromia region in addition to Afar National Regional State and Somalia Region with the following objectives:
• To increase pastoralists’ profits from livestock sales, • To stimulate a more supportive enabling environment for livestock industry development,
particularly in support of pastoralist market access, • To strengthen performance, integration and coordination throughout the Ethiopian livestock
5
United states agency for international development

Ethiopian Society of Animal Production
70 15th ESAP-Proceedings
sub-sector as a platform for long-term industry growth and competitiveness, • To establish operationally sustainable marketing facilities that would enable pastoralists to
conduct economically optimal marketing transactions, and • To enable pastoralists to sell livestock commercially to reduce the number of animals in
advance of the drought’s negative effects.
Interventions in Livestock Marketing by ACDI/VOCA in Oromia (Borana & Guji zones) Currently ACDI/VOCA is • Constructing six livestock markets in Oromia, three of which were already inaugurated and
operational (Fig 1.) but still three are going to be constructed soon. The constructed market has necessary infrastructure like watering and feeding troughs, loading ramps, tax collection and veterinary offices, crushes for giving health services, detention areas for sick animals and inspection and check points.
• Collect livestock market data and publish and distribute livestock market monitoring bulletins per month since end of 2005. The bulletin is timely distributed to different partners like GOs’, NGOs, and pastoralist cooperatives and also posted on the notice boards of livestock market sites in addition to sending soft copy through email to many partners so that all market participants and partners can get latest information concerning livestock marketing in the country. Hence, the organization has been significantly contributing to potential gap areas like market infrastructure and livestock market information collection and dissemination.
Fig.1. Haro-Bake livestock market constructed by ACDI-VOCA in Borana zone, Oromia region, Ethiopia
Other Contributions of ACDI/VOCA in Pastoral Areas of Borana and Guji Zones include: • Capacity development for cooperatives, traders, pastoralists, and groups like training in
business skill development, safe save mechanisms, market awareness creation, etc. • In country tour for pastoralists, cooperative members, and local traders to Adama fattening
Animal Production
15th ESAP-Proceedings 71
units or feedlots and abattoirs found around Modjo and Debre Zeit. • Aboard tour for experience sharing for cooperative members, government officials etc found in
pastoral areas (two people are going to visit Egypt) etc. Both tours created linkage between traders, pastoralists and abattoirs.
• Technical support to fattening units or ranches owned by cooperatives found in pastoral areas. Technical support for fattening animals under ranch conditions and how to use locally available feed resources was given to cooperative members.
• Promotion of linkage between producers and processors for processing and marketing, etc
The constructed modern livestock markets in different pastoral areas (e.g. Fig. 1) are facilitating and supporting livestock marketing. ACDI/VOCA’s objective in livestock marketing is not only limited to construction of livestock markets but also it works on market linkage like creating linkage between traders, pastoralists and abattoirs and exporters through arranging tours for traders, pastoralists and cooperative members. This was possible through arrangement of in country and abroad tours for pastoralists, traders, cooperative members, exporters and higher government officials so that all responsible bodies will get necessary experience from the educational tour. In addition, the organization does many activities that are needed for policy makers concerning how and what cross border livestock trade looks like and corrective measures to be taken. Currently the market linkage created between fattening farms found in Adama and pastoralists found in Borana zone of Oromia region is playing crucial roles in livestock marketing. By doing so pastoralists have created good relationship with the exporters, meat processing plants (abattoirs) and also got many experiences related to livestock marketing. These trainings enabled the pastoralists and livestock traders in the area to get good concept and experience in livestock marketing activities.
Emergency response
• Provision of loans to traders and pastoralist cooperatives as an emergency response to drought. For example during the 2006 dry season, the organization provided a total loan of 540,000.00 birr to two major cooperatives in Borana zone of Oromia region as an emergency response or as a cooping mechanism for the problem that enabled the pastoralists to use the money for different purposes including purchasing of livestock, conditioning them before sale, and get the necessary benefit out of it. As a result, the pastoralist efficiently utilized the loan and repaid the loan (100%).
• Provision of interest free loan for livestock trader. This is to encourage traders to buy more animals from the pastoralists during drought. In both ways although the trader can also be benefited, it is mainly meant to help the pastoralists sell and the traders buy more animals before being lost by the effect of drought.
In general, the investment in PLI project was very much successful; hence, recommended to be renewed for at least three years so that more works can be done and newly identified problems can be addressed [be it is in the same name or different name(s) (Catley et al., 2007)].
Some International Requirements of Livestock and Livestock Products by Importing Countries
Different countries have their own requirements of livestock and their product importation that must be achieved or meet by exporting countries. For example, Dagg et al. (2006) reported

Ethiopian Society of Animal Production
72 15th ESAP-Proceedings
that export food commodities must meet the requirement of both importing country and domestic standards. End product quality control, and similar methods aimed at ensuring food safety, can not adequately ensure the safety of the final product unless it is addressed through sound science-based risk management principles through out the food supply chain. Hence, two quality assurances need to be met: on-farm and processed food quality assurances (Dagg et al., 2006).
In pastoral areas of Ethiopia it might be possible to fulfill the on-farm quality assurance if livestock diseases are under control because other chemical introduction to on-farm is very minimal or totally absent and the product can be considered as “organic product”. On-farm (livestock production) safety means a preventive approach for food safety and can be good opportunity to fetch better price, but not possible because of presence of trade impairing livestock diseases in the country. The striking issue is that of diseases like FMD control and its eradication. Once disease control is in place and practical, good opportunity also exists for building brands in the name of “organic product” like “(Organic-) Borana beef or Natural Borana range beef, Borana range beef” etc just like “natural range beef, conservation beef and desert lamb” as in South Africa and/or the recent coffee brands of Ethiopia. All these contribute to fetch better price from sell of livestock through having international recognition; hence, the beneficiaries can be the farmers, traders, and the country.
Consumers in both developed and developing countries are requiring a broader diversity and quality of meat cuts, more ease in preparation, and enhanced assurances about product safety (Morgan and Prakash, 2006). The international food trade is increasingly being regulated by disease control requirements, rather than tariffs and quotas; as a result government authorities and agricultural and health organizations and industries are under increasing pressure to deliver comprehensive, integrated food safety polices, aimed at protecting the public health and welfare (Dagg et al., 2006) and to have access to international market as per requirements of World Trade Organization (WTO). We have to know that there is direct link between feed safety and the safety of foods of animal origin. Hence, it is well known that feed production and manufacture be considered as an integral part of the food production chain that is why the Codex Alimentarius Commission has negotiated a code of practice on good animal feeding, adopted in 2004 to help meet such requirements (Codex Alimentarius Commission, 2004). This possesses another challenge to developing countries where many diseases like trans-boundary livestock diseases are endemic, disease certification is a problem and livestock production is traditional; hence, it is hardly possible to fulfill uniform standards with the modern type of production that starts its operation with certification of feeds provided to the animals. This approach has two main purposes
• to protect the health of the society i.e. end users and • to prevent the developing world from not participating in such markets. Since the code of
conduct is already in place, it needs to be well stated in a such way that issues in developing countries can be addressed so that “fair livestock and their products trade” can be established globally.
Previously Identified Constraints to Livestock Marketing
Many livestock interventions were made by different NGOs’ and government organizations, yet their crucial solution for livestock marketing and necessary infrastructure development was not fulfilled (Belachew and Jamberu, 2003; Getachew Gebru et al., 2003). For example, according to Belachew and Jamberu (2003), the major problems of livestock marketing in

Animal Production
15th ESAP-Proceedings 73
Ethiopia are inadequate market infrastructure, virtual absence of market oriented livestock production system, inadequate number of exporting firms with low level of capacities, inadequate knowledge of international trade, low level of quarantine facilities and procedures, prevalence of various livestock diseases, repeated bans, excessive cross-border illegal trading, and stiff competitions with other countries. These mainly hold true for live livestock marketing. Export of packed meat from Ethiopia is even by far lower than live animal export due mainly to absence of technical knowledge, prevalence of many notifable livestock diseases and also absence of (meat-) marketing information etc.
Major and Constant Bottlenecks for Livestock Trading a Head
Any business is not without constraints, for life by itself is full of constraints. Constraints for livestock trading in Ethiopia are not only major ones but also are known to be constants. These constraints are either predicted from previous experiences or understood from recent observations. But in livestock marketing, most of these constraints are known unless and otherwise new ones emerged and their relative importance and degree varies. Hence, livestock diseases and associated activities will remain or be figured out as the first and the single most important problem that remain as constant obstacle to livestock and their product marketing (meat and live animal) from Ethiopia (Filip, 2006; Getachew Gebru et al., 2005). Having known the major problems constraining livestock marketing, why we or the country in general did not take corrective measures is the question that should come to or linger in every bodies mind be we are from NGOs’ or GOs’ side. This is mainly because of absence of disease control policy in the country and to some extent due to lack of detailed knowledge epidemiology of important livestock diseases that affect livestock marketing.
The country, both NGOs’ and GOs’, in general is experiencing response to outbreak cases based on ring vaccinations in areas where livestock disease outbreaks occurred. Such approach has serious drawback for the country in that long term intervention system and disease eradication and monitoring are not in place for successful eradication or control of important livestock diseases so that livestock marketing, be it is live animals and/or processed products like meat can generate huge number of income that can be obtained from the untapped livestock resource. Major diseases, which need eradication or control that can enable the country to have access to developed countries market or at least better market are the following.
Cattle: foot and mouth disease (FMD), contagious bovine pleuropneumonia (CBPP) and lumpy skin disease (LSD), and bovine pasteurellosis, anthrax and blackleg. During live cattle export, cattle take vaccine against these six diseases. Of these diseases, some but fragmented activity to wards control of CBPP is ongoing.
Goats and/or sheep: contagious caprine pleuropneumonia (CCPP), peste des petitis ruminants (PPR), sheep and goat pox. Currently, CCPP is a real problem in southern pastoral area and no effort is made towards its control. Research and development in animal health area is demanding from different angles to generate technology and apply existing ones, respectively.
Despite the presence of trade barrier livestock disease in the country, live animal export increased to USD 27.6 million in 2005/2006 from a mere USD 1.9 million in 2003/2004 indicating that there is good progress in livestock marketing. Similarly, export of meat and meat products increased to USD 18.5 million in 2005/2006 from USD 7.7 million in 2003/2004. In addition, export of leather and leather products also went up by 11% compared to last year due mainly to improvement in international price (Reporter Newspaper, 2007a). According to very recent

Ethiopian Society of Animal Production
74 15th ESAP-Proceedings
report the leather and leather product sell increased by 13% and the international price increased by 20% (Reporter Newspaper, 2007b).
Livestock Disease Implications and The Need to Conduct Research (and Development) for Disease Control
According to FAO (2002) report, presence of foot and mouth disease (FMD) in a country indicates the level of poverty in that country. This suggests that any country need to control diseases that are controllable through various measures. FMD is not a killer disease for livestock except in calves but it reduces production and work output of animals. Being non killer diseases, policy makers in developing countries did not give much attention, for had it been a killer disease like rinderpest, control and/or eradications measures should have been in place long time a go. Decision to control and/or eradicate a disease from a country or an area (as in disease free zone) should be based on sound economic analysis as it as done for FMD in Thailand (Perry et al., 1999). Ethiopia has to follow similar procedure to embark on control of FMD at least in promising areas like Borana in a form of creation of disease free zone.
Strategy and policy to control important livestock diseases together with impact on trade need to be addressed based on market demand. The fear of un-introduced diseases like rift valley fever that caused ban on Ethiopian livestock and their products need to be constantly addressed through frequent disease surveillance and monitoring coupled with strong and frequent negotiation with importing countries based on scientific (i.e. laboratory) justifications. Such livestock movement and trading ban (control) with out strong scientific support can seriously affect the livelihood of the pastoralists especially when the issue takes a couple of months or year(s) like the case of rift valley fever in early 2007.
Critical Interventions Required Investment in Livestock Disease Control and Research
Epidemic diseases that affect both livestock production and marketing (and human health, if zoonotic) need to get high priority for disease control because of its multiple effects. Currently the country vaccinates live animals intended for export against six diseases before export: anthrax, blackleg, contagious bovine pleuropneumonia bovine (CBPP), pasteurellosis, lumpy skin disease (LSD) and FMD. Although fragmented type of vaccination is being conducted in the southern pastoral area against CBPP, all in all vaccination against FMD, the major disease currently creating trade barrier was not included. The situation is more exacerbated when new disease to which the country and the professionals has not been acquainted with, no natural barriers for its spread and professionals have no experience of control of the disease (for example sudden camel mortality observed in Afar in 2006 and southern pastoral areas in 2007); hence it can result in catastrophic economic loss both in livestock and human health (if zoonotic). Research is very much demanding to identify causative agents and/or serotypes that is circulating in the area and contributed to diseases outbreak.

Animal Production
15th ESAP-Proceedings 75
Understanding Economics of Trans-boundary Livestock Disease Control
It is well known that presence of FMD in an area will not allow livestock and their products to be exported to developed countries. According to FAO report (FAO, 2002), prevalence of FMD in a country now a days indicate level of poverty in the country. Epidemic diseases like FMD that can easily be distributed cause serious economic effect as a result of fear of introducing the disease to the importing country and affecting livestock trade and national economy, for importing countries need the exporting country to be free from such diseases. A study conducted in Thailand indicates that benefit of control of FMD accounted for 10% of disease control investment (cost benefit ratio 15:1; Perry et al., 1999). Presence of disease control policy for such globally important diseases is crucial for a country like Ethiopia that has such huge livestock potential. Hence, the country needs to have long term plan like 10-15 years or more to control important diseases from the country. In addition importing countries also apply “precautionary principle” in that they ban livestock and livestock products originating from non-disease outbreak countries but found near by disease outbreak countries like the case of rift valley fever in Kenya and Somalia in 1998/2000 and in Northern Kenya 2006/2007 that significantly affected livelihoods of pastoralists in the area.
Way forward: Creation of Disease Free Zone as an Option to Promote Livestock Marketing
Disease eradication alone from the whole parts of the country is not economically feasible and also not a guarantee to fetch good market from the developed world. There must also be good breed that has/have got global acceptance like the Boran cattle breed (Philipsson, 1992; Zander et al., 2005). Priority has to be given to areas that have strong livestock potential and the return of investment on disease eradication activity is rewarding. Such area/s is (are) well known nationally and/or internationally and the Boran cattle breed found in the Borana area is by far the best one as far as Ethiopia is concerned. Hence, it should get the priority for disease eradication and/or creation of disease free zone for cattle because of presence of superior cattle genetic make up or exceptional boran cattle breed in the area (Zander and Mburu, undated).
Creation of disease free zone and/or eradication of diseases from these promising areas need huge investment or logistics like in terms of money for running the project that includes purchase of drugs, vaccines, vehicles, equipments, construction of facilities, training of human power, employment of trained human power, investigation (new-) of disease outbreaks and characterization of the causative agent(s), control of livestock movement from specified places, conducting of vaccination campaign, sero-monitoring of diseases against which control is in place, etc. All these activities need strong and strategically applied policy together with well trained human power and logistics in place. Such strategy will enable the pastoralists and/or the country to fetch better price from sale of livestock and value added livestock products, etc; hence, build pastoralists financial capacity so that they will have purchasing power that is supplemented by existing livestock production potential. This will be possible if the resources they have at hand that is their livestock is going to bring for them good income. During this time no support will be required even if there will be natural disasters like short term drought because the pastoralists will have relatively good financial potential to help themselves.
Drought mitigation measures like contingency planning and preparedness or arranging of resource to be mobilized, de-stocking and re-stocking of livestock will be possible and even easier if these livestock diseases are under control. Still contingency planning during drought or

Ethiopian Society of Animal Production
76 15th ESAP-Proceedings
disease outbreak will not bring lasting solution, although very much supportive, unless we build the financial capacity of the pastoralists through livestock disease control and marketing. How to go a head with it? If there is a will (to seek and provide budget), there is a way on how to go a head. The pastoralists have their own law that is respected by every pastoralist in the area including the government(s) and understanding between neighboring borders or country like Kenya. Hence, it is a matter of inculcating the issue in the pastoralists’ traditional law and culture and letting them understand the merits, benefits etc of disease control from different directions (Ethiopia and Kenya in this case), brain storming to bring attitudinal change that can enforce them to bide to the technical comments. One thing we must know is that the society from both Ethiopia and Kenya are living together, sharing markets, schools and also hospitals. Investment into livestock disease control in cross boarder areas won’t be a problem but needs critical thinking.
The livestock disease control issues in pastoral areas should then be supported by sell of their animals. Which animals should be sold? The underlining issue is that pastoralists need to maintain the breeding stocks while selling other animals. This means if the pastoralists want to continue with pastoralism and have their livelihood base it is a must for them to maintain the breeding livestock, their resource base. Of all their livestock, breeding stock (breeding bulls and heifers) need to get better attention not only by pastoralists but also by policy makers in that because majority of the livestock marketing and fattening units in the country are mainly based on livestock originating from pastoral areas of the country. Hence, the business should continue without affecting the breeding stocks of the pastoralists.
Some Policy Issues for Pastoral Development and Livestock Marketing Having known the distribution of livestock in pastoral areas and their contribution to rural
livelihoods, export market and national economy, many operational aspects need rational policy issues. Any effort to revamp the pastoral economy will have to begin with strategies to develop pastoral livestock, the production of which these areas have a comparative advantage.
Three components need to be considered, namely, development of water and pasture resources, improvement of animal health services and development of livestock markets. The following policy issues need timely attention:
1. The virtual absence of disease control policy and program, at least for diseases that need to be eradicated from potential areas of the country like Borana so as to get access to international market according to international law, is very important. Livestock diseases are the major contributor to not fulfilling international livestock (and meat) marketing standards. We believe that by controlling major livestock diseases that hindered livestock marketing, the country can also get much benefit from the disease control investment. Investment into livestock disease control is undoubtably profitable but need formal recommendation based on research findings as it was done for control of FMD in Thailand (Perry et al., 1999).
2. Breeding policy. The promising heifers and bulls needed for breeding purposes need to be preserved by the pastoralists so that the cycle can continue.
3. Land use policy that also includes bush control policy. Many pastoral areas are very vast and are also degraded due to so many reasons that include high human population pressure, high livestock pressure, expansion in agricultural activities and bush encroachment. Rehabilitation of the natural resource base and overcoming of bush encroachment is an issue
Animal Production
15th ESAP-Proceedings 77
of serious concern in pastoral areas. Although eradication of bush might have negative effect on the plants, there must be a policy that can address or facilitate how best it can be addressed.
4. Livestock marketing and development policy that include trade and pricing policy, to encourage the developed countries to reduce trade barriers, to reduce domestic protection of industrial sectors and to make limited use of subsides and taxes.
In any pastoral area development interventions, key and basic development interventions worth mentioning:
• Control of major livestock diseases as a base for livestock (and livestock product) export through creation of disease free zone,
• Control of bush encroachment that disfavoured grass growth and grazing land that can directly affects livestock (re-)production, and
• Investigation of potential water sources because the three are very crucial and even decisive for pastoralists, the livelihood of which is based on livestock production and marketing (in times of need). Such activities coupled with other basic development programmes (like education) or interventions will have long term (even sustainable) impact and need to be well planned, facilitated, strengthened, and implemented properly. For example, provision of food and feed to save the life of pastoralists and their livestock, respectively, together with de-stocking and restocking activities by different organizations as a response to drought mitigation alone and vaccination campaign when there is outbreak of livestock diseases is not the best and sustainable way of development intervention. In particular developing the financial capacity of the pastoralists through livestock disease eradication and/or control in a form of creation of disease free zone and facilitate access to better market to develop their financial resource that can have better and long term impact and a means of getting ride of dependence, conflicts (UN Millinum Project 2005), vulnerability to and capacity to adapt to changes should have got much attention. During this time the pastoralists will have better or excellent market for their livestock and can have better financial potential and can withstand shocks by themselves and finally,
• Long term (10-20 years) plan of disease control and/or eradication has to be designed and implemented to benefit all actors.
Acknowledgment
PLI project had been implemented through the generous fund from the American people through USAID.
References Abule Ebro, 2005. Nutritional assessment of in Borana area, ACDI/VOCA, Addis Ababa Ethiopia
(Unpublished report).
Anon 2005. Pastoralist Livelihoods Institute Design, USAID, Addis Ababa.

Ethiopian Society of Animal Production
78 15th ESAP-Proceedings
Ayele Solomon, Assegid Workalemahu, Jabbar M.A., Ahmed, M.M. and Belachew Hurissa (2003). A review of structure, performance and development initiatives. Socio-economics and Policy Research Working Paper 52, ILRI, Nairobi, Kenya. 35pp.
Belachew Hurissa and Jambere Eshetu 2003. Challenges and opportunities of livestock marketing in Ethiopia. In Challenges and opportunities of livestock marketing in Ethiopia. Proceedings of the 10th annual conferences of the Ethiopian Society of Animal Production (ESAP) held in Addis Ababa, Ethiopia, August 21-23, 2003, pp23-34, pp. 1-13.
Catley A., Yacob Aklilu, Y and Berhanu Admassu , 2007. Introduction: livelihood based relief interventions in Pastoralist areas of Ethiopia. In Impact assessments in livelihood-based drought interventions in Dire and Moyale woredas, FIC, USA, pp 1-3.
Codex Alimentarius Commission (CAC), 2004. Code of practice on good animal feeding. CAC report CAC/RCP 54-2004. Available at: http://www.codexalimentarius.net/download/standars/10080/CXC-054-2004e.pdf accessed on 10 May 2006).
Dagg PJ., Butler RJ, Murray JG., Biddle RR.2006. Meeting requirements of importing countries: practice and policy for on-farm approaches to food safety. Rev.sci.tech.Off.int.Epiz. 25 (2): 685-700.
DFID 1999. Policy Reforms. In: Sustainable livelihoods guidance sheets DFID
FAO 2006 . Feasibility Study for Systems to Improve the Animal Health Status of Ethiopian Exports of Livestock and Livestock Commodities. FAO, Draft working document.
FAO (Food and Agricultural Organization), 2002. Socio-economic consequences for poor livestock farmers of animal diseases and VPH problems. In: Improved animal health for poverty reduction and sustainable livelihoods. Pp. 44.
Filip C, 2006. Ethiopian Borana and Southern Somali Areas Livestock Value Chain Analysis Report. Pastoralist Livelihood Initiative, Livestock Marketing Project. August 30, 2006, p 27.
Getachew Gebru, Solomon Desta, and D. Layne Coppock, 2003. Managing risk in pastoral systems: research and outreach experiences of the pastoral risk management (PARIMA) project in Southern Ethiopia and Northern Kenya. In Challenges and opportunities of livestock marketing in Ethiopia. Proceedings of the 10th annual conferences of the Ethiopian Society of Animal Production (ESAP) held in Addis Ababa, Ethiopia, August 21-23, 2003, pp. 147-153.
Getachew Gebru, Solomon Desta, Seyoum Tezerra, and D. Layne Coppock, 2005. Institutional innovation for improving pastoral access to emerging export markets for small ruminants: a case from the East African Range land. Paper presented at the Deutscher Tropentag, October 11-13, 2005, Hohenheim, “The Global Food & Product Chain— Dynamics, Innovations, Conflicts, Strategies”.
Halderman, M. 2004. The political economy of pro-poor livestock policy-making in Ethiopia. Pro-poor livestock Policy Initiative Working Paper No. 19, FAO 59 pp.
Hatfiled R. and Davies J, 2006. Global review of the economics of pastoralism. World Initiative for Sustainable pastoralism, IUCN, Nairobi, Kenya.
Morgan N. and Prakash A, 2006. International livestock markets and the impact of animal diseases. Rev.sci.tech.Off.int.Epiz. 25 (2): 517-528.
Perry B.D., Kalpravidh W., Coleman P.G., Horst H.S., McDermott J.J., Randolph T.F. & Gleeson L.J., 1999. The economic impact of foot and mouth disease and its control in South-East Asia: a preliminary assessment with special reference to Thailand. Rev. sci. tech. Off. int. Epiz., 18 (2): 478-497.

Animal Production
15th ESAP-Proceedings 79
Philipsson J. 1992.The management of global animal genetic resource, Rome, Italy, April 1992. FAO. www.fao.org/docrep/006/t0665e/T0665E07.htm visited on May 10, 2007.
Project Yabello, 2005. Report on “Effect of Habitat Alteration on Ethiopian Endemic Birds”. A joint expedition to southern Ethiopia by the University of Glasgow and the Ethiopian Wildlife and Natural History Society. Pp. 55.
Reporter Newspaper 2007a. Development in the external sector. V XI, No 557, page 8.
Reporter Newspaper, 2007b. External Sector Developments, volume XI, No. 565, page 8.
Solomon Dest 2006. Pastoralism and Development in Ethiopia. Economic Focus. Bulletin of the Ethiopian Economic Association, 9(3): 12-20
UN Millennium Projects, 2005. Investing in Development, A Practical Plan to Achieve Millennium Development Goals. New York
UNDP (United Nation Development Programme), 1997. Drought contingency planning to support pastoralists in Ethiopia, UNDP, Emergency Unit for Ethiopia.
Yacob Aklilu, 2003. Critical issues impacting livestock trading in Kenya, Ethiopia and Sudan. In Challenges and opportunities of livestock marketing in Ethiopia. Proceedings of the 10th annual conferences of the Ethiopian Society of Animal Production (ESAP) held in Addis Ababa, Ethiopia, August 21-23, 2003, pp 35-47.
Zander K., Holm-Müller K., Mburu J., Drucker A., 2005. Assessing The Value of Animal Genetic Resources as Justification for Conservation Initiatives - The Case of The Borana Cattle In East Africa. In: Medicine, health, and genetic resources discussed at conservation biology conference Annual Meeting of the Society for Conservation Biology July 26, 2005, Brazil.
Zander K and Mburu J., undated. Compensating Pastoralists for Conserving Animal Genetic Resources: The Case of Borana Cattle in Ethiopia. Center for Development Research Bonn, Germany. http://dlc.dlib.indiana.edu/archive/00001521/00/
Zander_Compensating_040521_Paper161.pdf accessed on March 2007.


Animal Production
15th ESAP-Proceedings 81
Payment systems influence quality: Ethiopian milk and milk products current situation and future move
Zelalem Yilma1*, Aynalem Haile2 and Tadelle Dessie2
1Dairy Technology, EIAR, Holetta Research Center, P.O. Box 2003, Addis Ababa, Ethiopia, email: [email protected] ; 2International Livestock Research Institute, P.O. Box 5689, Addis Ababa, Ethiopia
Summary
Ethiopia has a potential for livestock development due to the large livestock population and the relatively favorable environment for livestock production. Milk represents an important livestock product and makes a significant contribution to the nutrition as well as income of the livestock owner. However, the dairy sector didn’t develop to its potential due to several factors such as shortage of crossbred dairy cows; lack of capital by dairy producers, inadequate animal feed resources both in terms of quality and quantity; unimproved animal husbandry system; inefficient and inadequate milk processing materials and methods; low milk production and supply to milk processing centers and poor marketing system. These factors attribute in one way or another to the low annual growth rate in milk production of 2.1% that falls behind the human population growth of 3.4% per year. However, there is a possibility of developing the dairy sector through a well coordinated and integrated approach from farm to table and bringing in all stakeholders into the venture. This paper assesses the current situation of the Ethiopian dairy sector with especial emphasis on milk quality and marketing. Instances of successful countries in dairy development and payment systems affecting amount of milk delivered to collection centers or dairies and milk quality are presented. On-going initiatives and the economic as well as health implication of quality problems of milk are also briefly discussed. Important points that have to be taken into account in order to improve volume of milk delivered to collection centers or dairies; microbial as well as compositional qualities of milk; and dairy farm income of milk producers are highlighted.
Keywords: Milk, quality, marketing, Ethiopia
Introduction The world milk production increased between year 2000 and 2005 by over 600 million tons
with annual growth rate of 1.8%. Regionally, the highest annual growth rate was observed in East and South East Asia (9.5%) and the lowest in Eastern Europe (-0.7%). China and Viet Nam showed the highest annual growth rate (17-17.5%), while the lowest annual growth rate was recorded for Hungary (-1.4%) (IFCN, 2006).
The current rapid growth and expansion of urban farming in Africa is a response to market demands arising from rapid urbanization. Sub-Saharan Africa as a whole is experiencing fairly high rates of urbanization. Currently, 30% of the population lives in urban areas, a figure that may reach over 50% by the year 2025. Such rapid urbanization has, in many countries, led to a rapid increase in food demand accompanied by a change in food habits, often not satisfied by rural production. Urban farming has therefore emerged as an alternative strategy to respond to this increasing market demand. In addition, consumers all over the world are increasingly
Ethiopian Society of Animal Production
82 15th ESAP-Proceedings
concerned about the safety of their food in general and milk and milk products in particular and uncertain about production practices. Therefore, quality should not be ignored at all stages of the dairy chain from farm to table. This can be achieved by relating quality of a given product with producer price.
Though Ethiopia’s cattle population is estimated at 35.5 million of which 13.4% dairy animals (CSA, 2006), the annual growth rate in milk production (2.1%) falls behind the annual human population growth (3.4%). In Ethiopia, the traditional (smallholder) milk production system, which is dominated by indigenous breeds of low genetic potential for milk production, accounts for about 97-98% of the total annual milk production in the country (Reda, 1998; Felleke, 2003). The low productivity of the country’s livestock production system in general and the traditional sector in particular is mainly attributed to shortage of crossbred dairy cows; lack of capital by dairy producers, inadequate animal feed resources both in terms of quality and quantity; unimproved animal husbandry system; inefficient and inadequate milk processing materials and methods; low milk production and supply to milk processing centers; and poor marketing system.
Making improvement interventions to the traditional sector is therefore crucial if development of the livestock sector of the country is targeted. However, the country holds large potential for dairy development due to its large livestock population, the favorable climate for improved, high-yielding animal breeds, and the relatively disease-free environment for livestock. Given the considerable potential for smallholder income and employment generation from high-value dairy products, development of the dairy sector in Ethiopia can contribute significantly to poverty alleviation and nutrition in the country. With the present trend characterized by the transition towards market-oriented economy, the dairy sector appears to be moving towards a takeoff stage. Liberalized markets and private sector investment and promotion of smallholder dairy are the main features of this stage (Ahmed et al. 2004).
Generally, in Ethiopia there is no or very weak formal marketing and grading system that is geared towards relating quality of a given animal product in general and milk and milk products in particular to market price. Moreover, quality considerations seem to be less important than quantitative aspects. In most cases, quality measures are limited to organoleptic properties of a given product that differ from one buyer (middle men or consumer) to another. Identification of formal markets that demand products of not only acceptable but also high quality helps to relate quality to market price and therefore has a potential to enhance commercialization of the smallholder livestock production. Such an approach provides an incentive for farmers to produce milk and milk products of acceptable quality from nutritional as well as human health point of view. This approach of availing a formal market with a price related grading system for milk has been demonstrated to be successful in many countries; Costa Rica is a pertinent example (Chamberlain, 1993).
This paper highlights the current situation of the Ethiopian dairy sector and how payment systems can influence the quantity and quality of market milk. Instances of the international scenario of payment systems that relate price to quality of milk are also presented.
Dairy trade in sub-Saharan Africa
Generally, the world supply of dairy products exceeds commercial demand. This situation has led to the stockpiling of dairy products (notably skim milk and butter) in the developed countries, the world's main producers of dairy products. Developing countries, which account for

Animal Production
15th ESAP-Proceedings 83
about 24% of the total output of world dairy products, constitute the main dairy-deficit region of the world. Sub-Saharan Africa has rapidly changed its net dairy trade position from a small net importer in the early 1960s to a major net importer in the 1970s and early 1980s. Two major factors have contributed to this change:
5. Rapid population growth and rising per caput disposable income in the region, leading to a fast growth in effective demand for dairy products; and
6. Slow growth in the production of dairy products in the region.In year 1980, Sub-Sahara African countries imported all dairy products at US$ 705.1 million and milk alone at US$ 620 million (FAO Trade Yearbook, 1982).
Generally, human population in Sub-Saharan Africa has been growing at nearly twice the rate of growth in dairy production in the region during the last two decades. This factor has resulted in declining per caput production of dairy products in the region, and it is not surprising that the volume and value of dairy imports into the region have grown relatively fast during this time. Fast population growth, an increasing degree of urbanization and rising per caput incomes in Sub-Saharan Africa have generally led to a situation whereby effective demand for dairy products in the region has outstripped the local production of these products. This situation has made it necessary to make massive imports of dairy products into Sub-Saharan Africa in order to satisfy demand in the region.
The major objective of the dairy development policies in most countries of Sub-Saharan Africa appears to be the promotion of local dairying in order to satisfy the basic requirements for dairy products by the population and hence to curb dairy imports which tend to place a heavy burden on the already scarce foreign exchange reserves.
Implication of quality problems It is well established that food-borne diseases cause significant economic and social losses.
Potential threats to human health related to dairy products and dairy farming include: errors in pasteurization; consumption of raw milk products; contamination of milk products by emerging heat-resistant pathogens; emergence of antimicrobial resistance in zoonotic pathogens; chemical adulteration of milk; transmission of zoonotic pathogens to humans through animal contacts and foodborne diseases related to cull dairy cows (Ruegg, 2003).
The primary routes of potential exposure of humans to disease causing bacteria associated with the dairy industry include: ingestion of contaminated milk; and direct contact with infected animals.
Milk-borne illnesses have been recognized since the beginning of the dairy industry. Prior to widespread adoption of pasteurization, bacterial infections such as diphtheria, scarlet fever and tuberculosis were often linked to consumption of raw milk products. Hygienic milk production practices, proper handling, storage and pasteurization have been highly effective in ensuring the safety of dairy products by decreasing the threat of milk borne diseases such as tuberculosis, brucellosis, and typhoid fever. There have been a number of food-borne illnesses resulting from the ingestion of raw milk, or dairy products made with milk that was not properly pasteurized or was poorly handled causing post-processing contamination. More that 90% of all reported cases of dairy related illnesses are reported to be of bacterial origin (Bean et al., 1996). The bacterial pathogens in raw milk and other dairy products that are of current concern to human health include: Enterobacteria including Salmonella spp., Escherichia coli O157:H7 and Yersinia

Ethiopian Society of Animal Production
84 15th ESAP-Proceedings
enterocolitica (gastroenteritis, typhoid, food poisoning, septicemia), mycobacteria (tuberculosis), Brucella sp. (fever, malaise and weight loss), Bacillus cereus (B. cereus food poisoning), Listeria monocytogenes (food poisoning and meningitis), Staphylococcus aureus (can form blisters and cause other disease) and Campylobacter jejuni (Campylobacteriosis - bacterial diarrheal illness) (HITM, 2004).
In Ethiopian a few of the earlier works reported the isolation of pathogenic species such as Salmonella (Bagni et al., 1998; Ashenafi, 2002), Mycobacterium bovis (Getaneh and Lemma, 1987) and Listeria monocytogenes (Ashenafi, 2002) from milk samples; and Bacillus cereus and Staphylococcus aureus from Ayib samples (Ashenafi, 1990) in different parts of the country. Listeria monocytogenes can cause meningitis and septicemia with up to 30% mortality. Gastroenteritis due to Salmonella spp. can lead to long-term illness such as reactive arthritis. Infection with Salmonella paratyphi B may lead to septicemia (enteric fever). Brucella melitensis causes undulant fever, a severe disease that can be long-lasting and incapacitating. Verocytotoxigenic Escherichia coli O157:H7 causes enteritis but may also cause Hemolytic Uremic Syndrome (HUS) and kidney damage, particularly in young children and others with a weakened immune system.
The negative effect of foodborne diseases is not only limited to human health and well being but also goes further to impinge on the economy of individuals and nations. There are only limited data on the economic consequences of food contamination and food-borne diseases. In studies in the USA in 1995, it was estimated that the annual cost of the 3.3-12 million cases of food-borne illness caused by seven pathogens was US $6.5-35 billion (FAO/WHO, 2002). Buzby and Roberts (1996), on the other hand estimated the U.S. medical and productivity costs of bacterial human food-borne illness at 2.9 to 6.7 billion dollars each year with pathogens at the top of the list including: Salmonella species ($0.6-3.5 billion), Staphylococcus aureus ($1.2 billion), Campylobacter species ($0.6-1.0 billion), Escherichia coli O157 ($0.2-0.6 billion). The medical costs and the value of the lives lost during just five food-borne outbreaks in England and Wales in 1996 were estimated at UK£ 300-700 million. The cost of the estimated 11 500 daily cases of food poisoning in Australia was calculated at AU$ 2.6 billion annually (FAO/WHO, 2002).
According to Food and Agricultural Organization of the United Nations (FAO), as reported by ENA (2004), the value of annual milk and dairy product losses due mainly to mishandling across five African and the Middle East countries (Kenya, Tanzania, Uganda, Ethiopia and Syria) is over 90 million USD. The level of losses was estimated at up to 40% of the total milk produced.
Quality standards As food safety and quality are a growing concern all over the world particularly from human
health point of view, many countries implement quality control programs for all food items including animal products. In the US, for instance a quality milk program, including dairy herd inspections and pasteurization as the critical control step, is in effect (Buzby and Roberts., 1996). Milk of good hygienic quality is necessary to produce milk products of good quality and adequate shelf life in order to provide a safe, wholesome food for the consumer (O’Connor, 1994). Consumers generally demand for products of consistent quality, standards, hygiene, proper presentation and ease of use. Different organizations have been working in different countries to establish quality standards to ensure the health of the consumer. Originally associated with medical prevention, hygiene referred to maintaining and increasing the general well-being and performance of the consumer. Nowadays, food hygiene is more than a purely medical term. The

Animal Production
15th ESAP-Proceedings 85
research activities mainly focus on interactions between man and his environment and the effects of these interactions on health. Health hazards to the consumer are often grouped into microbiological, physical and chemical (FDA, 2004). A microbial criteria stipulate that a type of microorganisms, groups of microorganisms, toxin produced by a microorganism must either not be present at all, be present in only a limited number of samples, or be present at less than a specified number or amount in a given quantity of a food ingredient (NRC, 1985).
Different microbiological tests are used to indicate the hygienic condition of manufacturing of a given product. Coliform count provides an indication of unsanitary production practices and/or mastitis infection. A count less than 100 Colony Forming Units (CFU)/ml is considered acceptable for milk intended to be pasteurized before consumption. Counts of 10 CFU/ml or less are achievable and desirable if raw milk will be consumed directly (Jones and Sumner, 1999; Ruegg, 2003).
Several countries and states have established criteria for high quality milk. Common safety limits for raw milk used by selected countries are presented in Table 1.
Table 1. Commonly used safety limits of raw milk employed in selected countries
Country SCC/ml TBC/ml Antibiotics USA < 7.5 x 10⁵ < 105 Not allowed Canada < 4.99 x 10⁵ < 1.21 x 10⁵ Not allowed France < 4 x 10⁵ < 105 Not allowed Sweden < 4 x 10⁵ < 5 x 10⁴ Not allowed Russian Federation < 106 < 4 x 10⁶ Not allowed Israel < 6 x 10⁵ < 2.5 x 10⁵ Not allowed South Africa < 4 x 10⁵ < 104 Not allowed Brazil < 7 x 10⁵ < 7 x 10⁵ Not allowed China < 5 x 10⁵ < 4 x 10⁵ Not allowed Australia < 2.5 x 10⁵ < 5 x 10⁴ Not allowed Source: IFCN (2006); SCC: Somatic Cell Count; TBC: Total Bacteria Count; ml: milliliter
What type of sampling and testing is done on milk products?
• Raw milk is tested for bacteria (standard plate count), somatic cell count, antibiotic residues and temperature. • Pasteurized milk samples are tested for bacteria (standard plate count), coliform bacteria, butterfat, phosphates (an enzyme that if present indicates improper pasteurization), antibiotic residues and temperature. • Cheese samples are tested on a random basis. Cheeses made from either raw or pasteurized milk are tested for coliform bacteria, fecal coliform and Staphylococcus aureus.
• Water supplies for milk producing and processing operations are tested. Water is tested for coliform bacteria. • Prior to processing, milk must be tested for antibiotics using an approved test.
Good hygienic practice and developments in quality As with hygiene and food safety, the issue of quality has been growing prominently in recent
years and the optimum approach to these two areas is remarkably similar.
Providing quality assured products to the consumer has traditionally relied on quality control of finished product, that is, a set of procedures to test and analyze the product to ensure it

Ethiopian Society of Animal Production
86 15th ESAP-Proceedings
conforms to the required specification. The drawbacks of this approach as applied to food hygiene are now well recognized and include:
• In spite of quality control procedures, incidents of food poisoning still occur; • Extensive quality control programs result in a relatively high cost of sampling and analysis;
• Microorganisms are not evenly distributed and may be concentrated in a very small proportion of a batch of food. This makes traditional quality control testing schedules, based on statistical sampling, even less effective.
• The cost of rejected goods will be higher if control is based solely on finished product testing.
As a result, developments in quality management have more recently focused on the prevention of defects in the first place (through effective design and hazard elimination) rather than trying to measure defects once the product has been manufactured. Applying this approach to hygiene has led to the development of preventive Quality Assurance (QA) systems. Hazard Analysis Critical Control Point (HACCP) in particular is employed in the identification of places where pathogenic organisms can survive/enter/proliferate in the food and managing these as the key control strategy rather than relying on testing end product (IDF, 1994).
Milk pricing and quality
The objectives of payment systems vary depending on production type. Depending on market demand and the supply situation in a certain region, dairies may be interested in receiving raw milk with different fat percentages. If the prices of the milk components reflect the value of the dairy products that can be successfully marketed, an incentive is created for the farmer to produce raw milk of an appropriate composition. Manufacturers of milk powder have especial interests in raw milk with a high content of protein (i.e. solids), as this determines the yield per kg of raw milk. Cheese manufactures are interested in the fat, protein and casein contents, because these components determine the cheese yield.
Changing raw milk composition: “The idea is simple – pay for what you get – and encourage farmers to supply the type of raw milk you need in your production”. By incorporating bacteria and somatic cell count in the payment system, the farmer is encouraged to do his best to produce high quality raw milk. A study by International Dairy Federation (1995) showed that 82% of the countries participated in one study had reached their objectives through payment systems. This goes to show that the incentives provided by a payment system directly influences the quality, quantity and composition of the raw milk supply.
The quality of the raw milk supply can be influenced via the payment system. Premiums and deductions based on e.g. bacteria content, somatic cell count, freezing point depression (added water) and antibiotic residues create the incentive to upgrade the quality of raw milk. Thereby the payment system influences the actions of the farmer, because negligence with hygiene, adulteration of raw milk by adding water, failure to discard raw milk from mastitic cows or cows on antibiotics, will cost the farmer money (Table 2). In the worst cases the milk will be rejected entirely, and no payment will be made. On the other hand, farmers supplying superior quality raw milk will be rewarded by an extra payment (FOSS, 2001).
Though payment systems can influence milk quality and the amount of milk delivered to collection centers and dairies, quality standards set must relate to local conditions. If milk is boiled before use and consumed within hours of production, high-quality standards are not so

Animal Production
15th ESAP-Proceedings 87
important. As the time between production and consumption increases, then standards for milk quality on the farm must also increase (Chamberlain, 1993). If the cost of improving quality exceeds the benefit to farmers, it will not work. Farmers must see a suitable incentive to improve quality through pricing and improved markets. From experiences of different countries the best way to improve milk quality is by paying premiums for good hygiene and composition. As an example, in Costa Rica, the quality of milk received at factories did not improve until a ‘payment for quality’ scheme was introduced. After 14 years of the scheme, substandard milk received at the factory was reduced from 40% to 0.5%. The payment scheme was accompanied by long-term education, and demonstration of better practices (Chamberlain, 1993).
Table 2. Major determinants of raw milk price and rejection limits
Factors that increase price Factors that decrease price Rejection criteria High fat and protein Low fat and protein Added water Low bacteria count Moderate bacteria count Too high bacteria count Low somatic cell count Moderate somatic cell count Too high somatic cell count Good taste Acceptable taste Bad taste Fresh Stale Inhibitory substances/antibiotics Cool Too high temperature Harmful contaminants Source: FOSS (2001)
Payment systems based on bacterial qualities of milk results in improvements in bacterial qualities of milk. For instance in Poland in 1996 almost 30% of the milk suppliers supplied milk below 4 x 10⁵ CFU/ml, while the figure was only 8% in 1995. In the same time span, the percentage of suppliers delivering milk with a bacteria count above 3 x 10⁶ CFU/ml dropped from 85% to 65% (FOSS, 2001). In Demark, in 1972 the first class bacteria limit was changed from 4 x 10⁵ to 2 x 10⁵ CFU/ml. First, the percentage of farmers in the first class dropped from 80% to 65%, but it only took six months before 80% of the farmers were delivering first class milk again. This positive trend has continued, and in 2001 the first class extra limit was below 3 x 10⁴ CFU/ml and 90% of the farmers deliver milk of this quality (FOSS, 2001).
A payment system (premium and penalty) based on total bacterial count and somatic cell count used in Denmark in 2001 is presented in Tables 3 and 4.
Table 3. Bacteria quality grading (Denmark, 2001)
Class Class limit CFU/ml Recommended price adjustment DKK/kg milk Class 1 extra <3 x 10⁴ +0.05 Class 1 <105 0 Class 2 <3 x 10⁵ -0.05 Class 3 >3 x 10⁵ -0.15 Source: FOSS (2001); DKK : Denmark Kroner
Table 4. Somatic cell quality grading (Denmark, 2001)
Class Class limit cells/ml Recommended price adjustment DKK/kg milk Class 1 extra <3 x 10⁵ +0.04 Class 1 <4 x 10⁵ 0 Class 2 <6 x 10⁵ -0.05 Class 3 >6 x 10⁵ -0.15 Source: FOSS (2001)
In Denmark, the price of raw milk is determined from the contents of fat and protein in the raw milk. A deduction or a premium is given in accordance to the quality classification. The price of

Ethiopian Society of Animal Production
88 15th ESAP-Proceedings
fat and protein is based on the EU intervention prices for the current year on butter and skim milk. They are adjusted for the milk treatment costs. Recommended values in 2001 are presented in Table 5.
Table 5. Recommended values of fat and protein (Denmark, 2001)
Values for DKK per kg Fat 25.17 Protein 33.10 Milk treatment costs 0.06 Source: FOSS (2001)
Two examples illustrating milk pricing based on quality are summarized below.
Example 1: Good quality milk Milk composition: Fat: 4.30%, Protein: 3.60%, Bacterial count: 1.5 x 10⁴ CFU/ml, SCC: 2 x 10⁵
Base price = (Value of fat x fat%) + (value of protein x protein%) – milk treatment cost:
(25.17 x 0.043) + (33.10 x 0.036) – 0.06: +2.21 Bacteria grading: Class 1 extra: +0.05 Somatic cell grading: Class 1 extra: +0.04 Price/kg milk: 2.30 DKK
Example 2: Acceptable quality milk Milk composition: Fat: 3.96%, Protein: 3.10%, Bacterial count: 1.5 x 10⁵ CFU/ml, SCC: 7.6 x 10⁵. Base price:
(25.17 x 0.0395) + (33.10 x 0.031) – 0.06: +1.96 Bacteria grading: Class 2: +0.05 Somatic cell grading: Class 3: +0.15 Price/kg milk: DKK 1.76
When we compare the aforementioned two examples we observe that there is a loss of 0.54 DKK/liter of milk (23.5%) due to quality problems attributed to mishandling during production and transportation.
In different countries, quality tests are performed by concerned bodies and information on quality that help for price setting are communicated accordingly. In the Czech Republic where the milk processing industry is in a stage of privatization of formerly state owned dairy enterprises for instance, there is the Association of the Central Laboratories, doing the evaluation of purchased milk, consisting of six Central Laboratories and one Reference Method Centre. The Central Laboratories are either private, independent or are part of the structure of the dairy industry. The farmers supply the raw milk samples into the Central Laboratories according to the scheme. The laboratories carry out the analyses and they send the results of the testing to the dairy factories (Drbohlav, 1998).
The dairy factories pay the farmers for the purchased raw milk according to the signed agreements and based on the purchased quantity, the contents of the main components of milk, and further parameters of quality, using the data obtained from the Central Laboratories. The same data is available to the farmers, as well. The correctness of the results of determination of milk composition, of microbiological quality, of inhibitors, of somatic cells, of freezing point and of the technical state is controlled by the Reference Method Centre. This Reference Method

Animal Production
15th ESAP-Proceedings 89
Centre supplies the Central Laboratories, above all with calibration samples to carry out the calibration of the apparatus, and to carry out periodically organized comparative tests. This process secures a comparable evaluation (Drbohlav, 1998).
The Ethiopia scenario
Milk testing and quality control mainly address chemical composition, in particular fat content and stability for processing milk into cheese. In the last decade, due to the increase in the international milk trade, the interpretation of these terms has been expanded to include hygienic control (Giangiacomo, 2000). In developed countries, quality requirements are governed more and more by guidelines, ordinance and laws in states and countries (Spreer, 1998). For small-scale dairy plants the tests normally carried out include physiochemical and bacteriological qualities, density to determine possible adulteration by water and acidity to determine suitability for processing (Metzer, 2000). Nevertheless, most of the milk is distributed in the informal channel without passing through formal quality test procedures. The case of Ethiopia is not different. Mainly due to lack of efficient methods of handling and preservation of dairy products, there is a considerable deterioration of hygienic as well as nutritional qualities as milk passes through the different channels in the dairy chain.
In Ethiopia as the traditional sector accounts for the largest share of the total annual milk production, most of the milk produced is processed on-farm using traditional technologies. The meager available reports indicate that the processing conditions are substandard. Consequently, smallholder dairy products are characterized by their poor quality. This poor hygiene often arises from poor handling at farm, collection centers, during transportation and at retail points.
On open markets buyers of dairy products are practicing a certain type of quality test. Particularly the transaction of Ayib is almost always subject to organoleptic test. It is therefore quite uncommon that a buyer of Ayib is not tongue-testing the Ayib before buying it. This helps them evaluate the freshness; taste and acidity of the product thereby avoid buying products of poor organoleptic qualities. This type of test is only partly associated with the effects of putrefactive microorganisms that can be detected by a simple tongue test. The presence of pathogenic microorganisms however can not be detected by such test.
In Ethiopia, payment systems based on quality of milk and milk products do not exist. However, quality tests are commonly employed to either accept or reject milk at collection centers, which include: specific gravity/density; clot-on-boiling and alcohol. However, efforts have been made by the Ethiopian Quality Standards Agency to set certain standards for the detection of groups of microorganisms that indicate the general hygienic conditions of production and certain pathogens that can be transmitted through the consumption of contaminated milk and milk products. Some of the standards include: Enumeration of colony-forming units of micro- organisms – colony count technique at 30°C (ES ISO 6610:2001) identical with ISO 6610:1992; Enumeration of coliforms – colony count technique at 30°C (ES ISO 5541-1:2001) identical with ISO 5541-1:1986; Detection of Salmonella (ES ISO 6785:2001) identical with ISO 6785:1985. These types of standards are, however, accepted protocols to the detection and enumeration of indicator and pathogenic microorganisms in the laboratory. Although these information are the basis of setting quality standards, so far there is no payment system (premiums/bonuses and penalties) in relation to quality in a well coordinated manner.

Ethiopian Society of Animal Production
90 15th ESAP-Proceedings
Locally manufactured commercial milk
For the current report three brands of milk that are available in Addis Ababa markets (super markets) are considered that include: Mama – agro-industry, Shola and Lema.
Mama: At the time of reporting the consumer price of milk that has undergone pasteurization and homogenization and that contains 2.7% fat, 3.5% protein, 4.7% lactose, 0.8% ash/minerals, and vitamins A1, B1, B2, C and D (Table 6) is 7 birr/L. The price of mama’s Ultra Heat Treated (UHT) milk (fat 2.8%, protein 3.5%, lactose 4.7% and ash 0.8 and vitamins A, B1, B2, C and D) is 9 birr/L (Figure 1).
Shola: The composition (fat, protein, lactose and ash/minerals) (Table 6) of pasteurized Shola milk (Figure 2) is the same as that of pasteurized and homogenized mama milk. The difference lies on the vitamin content where it is not indicated on the package of Shola milk. The consumer price of pasteurized Shola milk is 6.50 birr/L.
Figure 1: Mama - locally manufactured commercial milk: Pasteurized and homogenized (a); UHT (b)
Lema milk: The retail price of pasteurized and homogenized full cream Lema milk (Figure 2) with fat 3.6%, protein 3.5%, lactose 4.7%, calcium 1.2g; and vitamins A, B1, B2, C and D (Table 6) is 6.60 birr/L.
Figure 2: Locally manufactured commercial milk: Shola (a); Lema (b)
a b
a b

Animal Production
15th ESAP-Proceedings 91
Imported milk - Enjoy – half cream milk
The consumer price for imported milk available in big supermarkets in Addis Ababa with the composition presented below (Table 6) is 14 birr/liter, twice the price paid for milk marketed by mama – Sebeta Agro Industry. Shelf life of Enjoy (Figure 3) is indicated to be 6 months from the date of production if stored at room temperature away from sun heat.
Figure 3. Enjoy - Half Cream Milk – imported milk
Table 3. Compositional quality of locally manufactured and imported commercial milk
Content per 100 g Composition Mama,
homogenized Mama, UHT Shola Lema
Pasteurized & Enjoy, UHT
Energy, kcal NI NI NI NI 50 Kcal SNF, g NI NI NI NI 8.5 Fat, g 2.7 2.8 2.7 3.6 1.5 Protein, g 3.5 3.5 3.5 3.5 3.4 Lactose, g 4.7 4.7 4.7 4.7 - Powder milk, g - - - - 1.5 Ash, g 0.8 0.8 0.8 1.2 - Calcium, mg - - - - 125 Vitamin A1, I.U. - + NI - + NI 62.5 I.U. (A) Vitamin B1, µg + NI + NI - + NI 35 (B) Vitamin B2 + NI + NI - + NI - Vitamin C + NI + NI - + NI - Vitamin D + NI + NI - + NI - Price: Birr/liter 7.00 9.00 6.50 6.60 14.00 +: present, NI: value Not Indicated, UHT: Ultra Heat Treated
On-going initiatives – International Cooperation Land O’Lakes International Development
Land O’Lakes, Inc. is a private, cooperatively owned agribusiness incorporated in the United States that was formed in 1921. Land O’Lakes applies an integrated approach to international development that capitalizes on farm-to-market cooperative agribusiness. In Ethiopia, Land O’Lakes provides technical assistance to dairy farmers, producer groups and cooperatives, input suppliers, and processors to have a competitive Ethiopian dairy industry built upon private investment that generates employment and income to smallholder families and provides for Ethiopian consumers. The key components of the technical assistance include: milk shed

Ethiopian Society of Animal Production
92 15th ESAP-Proceedings
development; stimulate business development; strengthen market linkages among stake holders; and advance dairy industry organization.
Netherlands Development Organization (SNV)
SNV is an international development agency that provides advisory services to public and private organizations in reducing poverty, amongst others through private sector development and support to the development of value chains through its program - Support to Business Organizations and their Access to Markets (BOAM). In Ethiopia SNV is supporting the value chains of dairy, edible oil and oil seeds, pin apple, mango and honey. SNV supports the development of value chains by establishing market linkages, bringing value chain actors together, developing agricultural agro-processing activities, linking private sector to public sector initiatives and where possible working with the Dutch business community, from producer organizations and processing companies to multinationals. The overall aim is to increase the access to markets by Ethiopian companies. The three strategic intervention areas of the dairy component include: milk collection centers and linkage to farmers; milk packaging and quality management. The overall program period is 5 years starting from September, 2005.
Crop Diversification and Marketing Project (FOA)
‘Crop Diversification and Marketing Project (GFTS/ETH/067/ITA)’ is one of the projects run by Food and Agriculture Organization of the United Nations – Ethiopia (FAOET). The major object of the project is promoting economic growth in rural areas of the Arsi zone of the Oromia region where there is already reasonable and recognized market access. Livestock development is one of the identified intervention areas of the project that comprises three programs considered to have potential for smallholder commercialization that include: dairy production, intensive livestock finishing (fattening), processing and marketing of skins and hides. The main objective of the dairy production program is to raise subsistence smallholder dairy farmers to commercial level. The designed activities to achieve this objective include: distribution of crossbred heifers to increase milk production thereby increasing the amount of milk delivered to milk collection, processing and marketing cooperative centers; establish new cooperatives and up-grade the existing ones; improve the marketing channel through improving quality of products, the marketing system and identifying linkages between producers and consumers. The project period is 4 years starting from January, 2006.
Important points to consider for future development
In order to improve the quantity and quality of milk delivered to milk collection centers and dairies; the quality of market milk and milk products that reach the end user (consumer); lift the more or less subsistence type of smallholder dairying to commercial level; and protect and improve the health of the consumer, a due emphasis should be given to the following important points:
• Sources of microbial contamination of milk must be minimized by adoption of hygienic standards that can be easily evaluated. Uniform adoption of milking practices that reduce microbial contamination of milk should be emphasized.
• Improvements of the raw milk quality at the farm level are closely linked to financial consequences.

Animal Production
15th ESAP-Proceedings 93
The pricing of milk should aim at motivating milk producers to increase their efforts in hygienic milking practices and handling of raw milk. It is recommended, therefore, that milk is paid for partly according to its microbiological quality measured by internationally recognized methods. • Hazard Analysis Critical Control Point (HACCP) programs at the farm-level have been promoted as a key to assuring dairy farm safety. It requires critical multidisciplinary review of existing management processes; the establishment of limits via identification of critical control points; the use of routine surveillance procedures; effective record keeping; and documentation of standard procedures.
• Dairy farm food safety can also be assured by an alternative tool referred to as “Hurdle Technology” which refers to the application of a combination of selected “hurdles” to microbiological growth combined with processing steps that maintain and improve the microbial stability and sensory quality of foods. Hurdle commonly used in food processing are directed at reducing growth of microorganisms present on harvest food products and include chilling, alteration in pH, the use of competitive microorganisms and alteration in water content. The basic concept of hurdle technology is to produce an environment that is hostile to the growth of microorganisms. • Government policies should not only focus on the installation of a modern marketing infrastructure (to ensure milk collection, processing and distribution), but such policies must also ensure the quality of products and payment systems based on quality. • Central laboratories need be established that will determine quality of milk supplied by producers of different scale at different frequencies. Central Laboratories should supply data on milk quality to milk collection centers and dairy factories who should accordingly adjust their purchasing prices of raw milk according to quality. • To grade the quality of milk, a sample of milk received from the individual milk producer must be taken. The sample is submitted to the following tests at different frequencies:
• Bacterial test each week • Somatic cell count determination at least once every 4 weeks
• Determination of the inhibitory substances at least once every 4 weeks • Determination of added water at least once every 12 weeks
• The need for the establishment of advisory services in the country is important to make improvements in the hygienic practices and quality of products. Institutions and Organizations such as the MoARD, EIAR and ILRI can be involved in Agricultural Advisory Services. All the advisors have to pass special advisory skill courses.
• When considering analysis of market and quality of milk and milk products the following points should be considered:
• Is there a market for higher milk production
• How much additional milk can the market absorb in each season of the year • Is there a market for milk of higher hygienic quality
Reference Ahmed M.A.M., Ehui S. and Yemesrach Assefa. 2004. Dairy development in Ethiopia. EPTD Discussion paper
No. 123. International Food Policy Research Institute. Washington, U.S.A.
Ashenafi, M. 1990. Microbiological quality of Ayib, a traditional Ethiopian cottage cheese. International Journal of Food Microbiology, 10:261-268.

Ethiopian Society of Animal Production
94 15th ESAP-Proceedings
Ashenafi, M. 2002. The microbialoy of Ethiopian foods and beverages: A review. SINET: Ethiop. J. Sci. 25(1):97-140.
Bagni, M., Cuteri, V. and Mekonnen, M. (1998). Salomonella contamination of food of animal origin in Ethiopia. Ob. Doc. Vet. 19:55-58.
Bean, N.H., Goulding, J.S., Lao, C., Angulo, F.J. 1996. Surveillance of foodborne disease outbreaks – United States, 1988-1992. Morbidity Mortality Weekly Rep. 45 (SS-5), 1.
Buzby, J.C. and Roberts, T. 1996. ERS updates US foodborne disease costs for seven pathogens. Food Rev 19:20-25.
Chamberlain A. 1993. Milk production in the tropics. Longman Scientific & Technical, Longman Group UK Ltd, UK, England.
CSA. 2006. Agricultural Sample Survey. Livestock, Poultry and Beehives population (private peasant holdings). Federal Democratic Republic of Ethiopia Central Statistical Authority (CSA), Addis Ababa, Ethiopia.
Drbohlav, J. 1998. Dairy Industry, Milk Quality and Pricing in Czech Republic. Dairy Research Institute. Available at: http://www.fao.org/regional/seurold/public4/Czech.htm
ENA. 2004. Milk, Dairy Products Loss Of Five African, Middle East Countries Stands At 90 Mln. USD, Ethiopian News Agency (ENA), Addis Ababa, 10/22/2004.
FAO Trade Yearbook, 1982
FAO/WHO. 2001. Principles and guidelines for the conduct of microbiological risk assessment. Codex Alimentarius – Food hygiene, Basic text, 2nd edition, Food and Agriculture Organization of the United Nations (FAO) and World Health Organization (WHO).
FAO/WHO. 2002. Foodborne disease. FAO/WHO Global Forum of Food Safety Regulators, Marrakech, Morocco, 28-30 January 2002. Food and Agriculture Organization of the United Nations (FAO) and World Health Organization (WHO).
FDA. 2004. HACCP guidelines. US Department of Health and Human Services, Public Health Service. Food and Drug Administration (FDA).
FOSS. 2001. The key to high quality products lies in your raw milk supply. Influence the composition, volume and hygienic quality of the raw milk through payment systems, FOSS Electric A/S, Slangerupgade, Denmark. http://www.foss.dk
Getachew Feleke. 2003. Milk and Dairy Products, Post-harvest Losses and Food Safety in Sub-Saharan Africa and the Near East. A Review of the Small Scale Dairy Sector – Ethiopia. FAO Prevention of Food Losses Programme. FAO, Rome, Italy.
Getaneh, K. and E. Lemma. 1987. Isolation of Mycobacterium from bovine milk and tissue: implications for public health and animal production. In: National Livestock Improvement Conference, pp. 107-110. Institute of Agricultural Research, Addis Ababa, Ethiopia.
Giangiacomo, R. 2000. Milk testing, quality control, hygiene and safely. FAO e-mail conference on “Small-scale milk collection and processing in developing countries”. June 6 – August 3, 2000. 108 p.
HITM. 2004. Food safety hazards and controls for the home food preparer. Hospitality Institute of Technology and Management (HITM), Minnesota, USA. http://www.hi-tm.com
Animal Production
15th ESAP-Proceedings 95
IDF. 1994. Recommendations for the hygienic manufacture of milk and milk based products. Bulletin of the International Dairy Federation (IDF). No. 292., 32 p.
IFCN. 2006. Dairy Report 2006. For a better understanding of milk production world-wide. International Farm Comparison Network (IFCN) Dairy Research Center, Kiel, Germany.
Jones G.M. and Sumner S. 1999. Testing bulk milk samples. Dairy. Publication 404-405. Virginia Cooperative Extension. Virginia State University.
Metzer, R. 2000. Milk payment : General considerations. FAO E-Mail conference on small-scale milk collection and processing in developing countries. June 6 – august 3,2000.
NRC. 1985. An evaluation on microbiological criteria for foods and food ingredients. Subcommittee on microbiological criteria, Committee on Food Protection, National Research Council (NRC).
O’Connor, C.B. 1994. Rural dairy technology. ILRI training manual 1. ILRI (International Livestock Research Institute), Addis Ababa, Ethiopia. pp. 133.
Reda, T. 1998. Milk processing and marketing options for rural small-scale producers. In: National Conference of the Ethiopian Society of Animal Production (ESAP), pp. 61-67.
Ruegg P.L. 2003. Practical food safety interventions for Dairy Production. J. Dairy Sci. 86: (E. Suppl.):E1-E9.
Spreer, E. 1998. Milk and dairy product technology. Mixa, A (translator). Marcel Dekker, INC. ISBN: 0-8247-0094-5. New York, pp. 39-58.

Animal Production
15th ESAP-Proceedings 97
The effect of different weaning age on growth performance of calves under full suckling system at Horro Guduru Cattle Breeding and Improvement Ranch
Habtamu Abera1 Mulugeta Kebede1, Ulfina Galemessa3, Jiregna Desalegn1andTsegaye Chemeda2
1 Oromia Agricultural Research Institute, Bako Research centre, P. O. Box 03 West Showa, Ethiopia. 2 Horro Guduru cattle Breeding and Improvement Ranch 3 Ambo College Jimma University
Abstracts
Study on determination of cave’s weaning age under full suckling system was conducted at Horro Guduru Cattle Breeding and Improvement Ranch for 12 months. The calves were born in the ranch and maintained under similar management conditions. Sixty newly born Horro (30) and Horro-Jersey (30) calves were allocated to six treatment groups and were introduced into the experiment using a pre-determined order of arrival, within sex they were then randomly assigned to six treatments viz weaning of Horro at four, six, and eight and Horro-Jersey crossbred calves at four six and eight months of age. To each treatments ten calves were allocated in 2*3 factorial designs (Breed and treatments) in following arrangements: Horro-Jersey weaned at four months (T1), Horro weaned at four months (T2), Horro weaned at six months (T3), Horro-Jersey weaned at six months (T4), Horro weaned at eight months (T5) and Horro-Jersey weaned at eight months (T6). Body weights were taken once per months. Data were analyzed using GLM procedure of Statistical Analysis System (SAS, 1998). Birth weight, body weight at different ages and average daily gain from birth to pre-weaning weight, from weaning to pos-weaning weight and birth to weaning weight were fitted to the model as dependent variables and sex, breeds and weaning age were fitted to the model as independent factors. Correlation analysis was also made to examine the association between birth weight, pre-weaning weight, weaning age and the pos-weaning weight of the calves. The over all mean of pre-weaning weight, weaning weight, and post weaning weight were 40±7 kg, 48.6±8 kg and 71±9 kg, respectively. Weaning age and breeds significantly affected weaning weight of the present study. The analysis of variance showed that the weaning weight of Horro-Jersey and Horro calves were 39±2, 55±2 and 54±2 kg and 40±2, 51±2 and 50±2 kg at four, six and eight months of age, respectively. Correlation analysis revealed that physical traits significantly increased (p< 0.01) with weaning age: sex (r=0.323), weaning weight (r=0.516) and post weaning daily weight gains(r= 0.834). The positive correlation observed between weaning age and weaning weight and other traits of the calves may indicate weaning age has some influence on the growth performance of the calves. Therefore, weaning at certain weight is more important than restricting weaning age. Generally, if optimum management was employed, the current weaning weight could have been obtained at earlier age. Even though it is only possible to recommend six months of weaning age from the particular data the advantage of early weaning in freeing the dam from suckling stimulus and/or lactation stresses on the reproductive performance of the herd should be investigated.
Key words: Calves, weaning age, full-suckling, physical traits, growth performance

Ethiopian Society of Animal Production
98 15th ESAP-Proceedings
Introduction Weaning and weaning management are the most effective tools to manipulate important
factors in dairy cattle management. These factors include the breeding efficiency and fertility of the cow herd, feed utilization, and animal behavior, future carcass merits of bulls and future breeding efficiency of heifer weaners. Pre-weaning performance traits such as birth and weaning weight have important implications on herd productivity, management systems and breeding policies to be followed. They are also important early indicators of adaptability and management adequacy (Mekonnen and Goshu, 1996). Calf rearing is one of the most important profit centers on the management system of every successful dairy farm. The future success of any farm depends on how calves are raised. Whatever a calf may be, if it is not properly fed and managed, it will not attain the large size necessary for maximum production (Banerjee, 1999). Growth is one of the most important traits used as selection criteria for the improvement of farm animals and the weaning weight of calves was significantly affected by how the calves are grown up to their weaning age. Measurement of growth usually account for weight gain for day, degree of maturity, maturity rate and body weight at a given age (Bordy, 1945). Measurements of growth vary with genetic potential of the breed and environment. There are several factors, which influence weaning weight and the final size of an animal, including weight at birth, breed, management, sex, feeding and gestation (Sendros, et al., 1987; Anthony, 2001). A knowledge of the mean birth weight a breed of cattle is paramount important in that it not only gives an indication of the mature weight of the breed but also enable to make an estimate of the absolute daily weight gain that can be expected on a particular plane of nutrition and the time required to achieve a given stage of maturity (Saed et al. 1987). Weaning weight differences may have persistent influence the reproductive and productive performance of the calves. In addition, low growth rate in young calves is by far the most important factor contributing to late maturity. The poor growth rate in calves may be due to lack of adequate nutrition associated with poor management practices. The management system, to sustain well growing the calf from birth needs correct quality and quantity of food and protection from diseases and environmental condition (Matthewman, 1993).
The rearing of young animals from birth until the age when they can make satisfactory use of forage or coarser feedstuffs is a major problem through out the world. This problem is more acute in developing countries where exotic dairy breeds and crossbreds are used for dairy purpose. The usual practices of the ranch calves are allowed to suckle at least up to 6 months of age. Determination of weaning weight of a particular breed under different weaning age is essential to assess the genetic potential of the breed under different weaning system. However, scarce information is available on weaning weight of Horro and Horro-Jersey calves under different weaning age. Therefore, this study was undertaken with the objective to determine the effect of different weaning age on growth performance of calves under full suckling system at Horro Guduru Cattle Breeding and Improvement Ranch.
Materials and methods Study area:
This study was carried out at Horro Guduru cattle breeding and improvement ranch. The ranch is located at 275 km West Addis Ababa. The altitude ranges between 2,260 and 2,296 m.a.s.l. The mean annual rainfall is 1,835 mm and the monthly rainfall varies from a minimum 26 mm (December) to the highest 396 mm (August). The monthly maximum and minimum

Animal Production
15th ESAP-Proceedings 99
temperature ranges between the highest 23.5º C in March, the lowest 19.5º in August, 9.9º C in December, and 11.1º C in August to September, respectively.
Study designs
Sixty newly born (thirty Horro and thirty Horro-Jerseys) calves were used from Horro Guduru Cattle Breeding and Improvement Ranch. The calves were fully suckling their dams during the day up to their respective weaning age and cows were not milked. After birth the calves were allocated to six treatment groups and were introduced into the experiment using a pre-determined order of arrival, within sex they were then randomly assigned to six treatments viz weaning of Horro at four, six, and eight months of age and weaning of Horro-Jersey crossbred calves at four six and eight months of age. To each treatment ten calves were allocated in 2*3 factorial designs (Breed and treatments) in following arrangements:
T1= Horro –Jersey calves weaned at four Months T2= Horro calves weaned at four Months T3= Horro calves weaned at six Months T4= Horro –Jersey calves weaned at six Months T5= Horro calves weaned at eight Months T6= Horro –Jersey calves weaned at eight Months
Management of study animals
Horro Guduru Cattle Breeding and Improvement Ranch is a newly established Ranch. Its objectives are undertaking genetic improvement within the Horro cattle breed through selection of growth and fertility traits. Its then distributes the superior bulls (sires) for farmers and upgrades the genetic potential of milk production of Horro by crossing with Jersey (to produce 50% crossbred in calf heifers) and supply to farmers. As a result, the ranch uses full suckling system to boast fast growth rate of the calves. Accordingly, calves are fully suckling their dams two times a day (in the morning and in the evening) until weaning. Weaning is undertaken when calves are 6 months old and after weaning they were kept in different group (male and female separately). Grazing was the main feed source of the breeding program. The calves were joined with their dams only during suckling otherwise they are isolated and kept in separate places during the day and night time. The calves were supplemented Rhodes hay during weaning at daytime and feeding in groups
Data Collection
Data were collected from all of sixty calves. The calves were weighed on monthly basis for one year. Data on the calves birth weight, pre-weaning weight, weaning weight and pos-weaning weight of the calves were collected up to the end of the experiment.
Statistical Analysis
Data were analyzed using GLM procedure of SAS (SAS, 1998). Birth weight, body weight at different ages and average daily gain from birth to pre-weaning weight, from weaning to pos-weaning weight and birth to weaning weight were fitted to the model as dependent variables

Ethiopian Society of Animal Production
100 15th ESAP-Proceedings
and sex, breeds and weaning age were fitted to the model as independent factors. Pair wise correlation analysis was also made to examine the association between birth weight, pre-weaning weight, weaning age and the pos-weaning weight of the calves.
Results and discussions Birth Weight of the calves
The overall mean birth weight of Horro and Horro –Jersey calves were 18±1.6 kg. Birth weights of calves are affected by a variety of genetic and environmental factors. Similarly, several works reported that birth weight influenced by year and season of birth, age, lactation status and fertility of the dam, breed and sex of the calf (Lubout et al, 1986; Newman and Deland, 1991; Sohwalbach, 1997). Horro-Jersey calves were heavier at birth than Horro breeds, but the difference was not statistically significant. But Ahunu et al. (1993) reported that significant genotypic differences existed in birth weight between the West African Short horn and their Jersey crosses. The results were also consistent with Alemu et al. (1989) for Borana and Borana- Frisian crosses at Abernossa Ranch. The current value is similar to the report of Mulugeta (1989) where the average birth weight of Horro calves at Bako research Center was reported to be 18.6kg. Jiregna et al. (2006) also reported a higher (18 kg) weight for Bako than Horro Guduru Ranch (17.5±2.6kg). The heavier weight at Bako was due to the difference in the prepartum management of the cows, as the health and vigor of calves at birth depends on the nutrition of the cow during the last 60 days before freshening. During this period, approximately 70% of the birth weights of the calf develop and the cow must store nutrients for early lactation when milk production exceeds the cow's capacity for feed consumption (Kellems and Church, 1998). Whereas the observed average birth weight for these Horro and Horro-Jersey are smaller than the values reported for Arsi x Holstein-Friesian calves in Arsi (Kiwuwa et al., 1983), Boran x Holstein-Friesian calves in Abernosa (Mekonnen, 1987) and Fogera x Friesian calves in Metekel (Addisu, 1999). Sex of the calves significantly (p<0.05) affected the birth weight. Male calves weighed 1 kg higher than their female counter part (Table 2). These results are in agreement with the results on Horro calves of Jiregn et al. (2006) and Mulugeta (2003). In these report male calves were 6.6% heavier than their female counterpart. The increment of birth weight with increasing level of exotic blood agreed with the report of Ahunu et al. (1993). The study also revealed that the birth weight were significantly (p<0.01) and positively correlated to pre-weaning weight(r=0.372), weaning weight(r=0.333), average yearly weight (r=336) and post weaning weight(r=0.383), respectively. This suggests that birth weight of the calves affects the weaning weight and the subsequence growth performance.
Pre-weaning weight of the calves
The over all means of pre-weaning weight of calves for both breeds were 40±7 kg. The analysis of variance is shown in (Table 3). The pre-weaning weight of treatments 1, 2, 3, 4 and 5 of were significantly (p<0.05) affected by weaning age of calves. Those weaned at six months were at better pre-weaning weight when compared with four and eight months of ages. Pre-weaning weight was not significantly affected by sex and breeds of the calves (Table 3). However, the pre-weaning weight of males was generally (41±1.4 kg) higher than the females (40±1.4 kg) and Horro-Jersey calves were heavier than Horro calves (Table 3). The over all means of pre-weaning daily weight gains of the calves in present study was 0.3±0.08 kg. Calves weaned at four months

Animal Production
15th ESAP-Proceedings 101
of age were at better pre-weaning gain when compared with other treatments. Breed and sex of the calves did not affect the pre-weaning weight and pre-weaning daily weight gains of the present study. Under the conditions of this study, crossbred calves generally performed better than pure breed. The amount of milk received by the calf is completed limits pre-weaning growth. The fact that breed differences were detected at the pre-weaning stages suggests that the Horro dam is a poorer milk producer; but growth rate difference and effect of weaning age of on pre-weaning and post-weaning traits was not significant. Moreover, average daily gain of pre-weaning weight and 6-month weaning weight were significantly (P < 0.05) affected by age weaning (Table 3). The results were related to Hailu and Tadele (2004). This results support the past findings of Hailu andTadele (2004) on crossbreeding Boran cattle with Simmental breeds. The pre-weaning daily weight gain was estimated to be 0.3 kg for Horro and 0.29 kg for Horro –Jersey calves. In agreement with the reports of crossbred calve 440 gm for the crossbreds and 382.3 gm for the Fogera calves (Addis and Hedged, 2003). From this study it can be concluded that growth traits, specially pre-weaning growth of calves under tropical condition are affected by the genotype of the calf.
Weaning Weight of the calves
The overall mean of weaning weight and weaning weight gain of Horro and Horro-Jersey was 48.6±8 kg and 0.17±0.015 kg, respectively. Weaning weight was significantly affected by weaning age and breed (Table1). The analysis of variance was showed that the weaning weight and daily weaning weight gains of Horro-Jersey and Horro calves were 39±2, 55±2 and 54±2 kg and 40±2, 51±2 and 50±2 kg and 0.17±0.016, 0.19±0.015 and 0.15 ±0.015 kg and 0.19±0.014, 0.19±0.015 and 0.13±0.015kg at four, six and eight months of age, respectively. Comparable with the results on Horro calves at Guduru at ages of 30, 60, 90, 120, 150, and 180 days average mean of body weight were 24.6±7.9, 32.6±9.3, 40.0±9.6, 47.7±12.9, 52.2±13.1 and 61.6±16.6kg, respectively (Jiregn et al. 2006). This could be due to the fact that calves that were heaviest at birth were heaviest at weaning (Mukhtar, 1961; Osman and Rizgalla, 1968). Similar reports were available for indigenous breeds (IAR, 1976; Mulugeta, 1991; Tegegne et al., 1990). Calves are generally weaned between 8-10 months of age. The actual age depends on several factors: feed availability, production system breeds and environmental factors. The mean weaning weight of Boran x Holstein Friesian crossbred calves at Abernossa Ranch which weaned at age of 8 months was 140.7 ± 2.62 kg (Ababu et al. 2006). As reported by Ababu (2002) the total body weight gain and average daily weight gain from birth to weaning was higher than the present study that was found to be 116.4 kg and 484 gm, respectively. The estimates for the weaning weight and average daily gain in the present study are lower than those reported by Asheber (1992) for the Fogera breed and Rege et al., (1994) for Ghana Short horn, Gudali and their Jersey crosses. The present findings agree with reports of Trail et al., (1985), Mekonnen (1987), Asheber (1992) and Addisu and Hegede (2003). Sex of calf had no significant influence on the weaning weight. The weaning weights of males were lower at all weaning ages and all breeds (Table 3). Besides, the daily weaning weight gains of females were lower at all weaning age and breeds. The variation in body weight gain should be attributed to genetic difference between sex and breeds. Similar results had been reported By Gebre Ezgibre and Mulugeta (1995) On Horro calves. The physiological effect of suckling is known to stimulate efficient closure of osesophageal groove thereby effectively passing of the nutrients to the abomasums that result in better growth (Preston, 1989). Moreover, Preston (1989) reported that suckling milk is a catalytic supplement for feed resource such as crop residues and by-products, which, if given alone or even

Ethiopian Society of Animal Production
102 15th ESAP-Proceedings
supplemented with fermentable nitrogen would not support maintenance. Superior growth rates and higher efficiency have been recorded when calves suckle their dams compared with bucket feeding (little et al.1991). The current result is consistent with study on Horro calves in which suckling increased growth of calves during the pre-weaning period (Gebre-Ezgibhre et al.2000). The weight gain from weaning to one year was lower than the report of Addis and Hedged (2003). Breed type has a significant (p<0.05) influence on weaning weight of calves. Weaning weight was approximately two-third the result of milking ability of the dam and one-third the result of the inherent growth potential of the calf (Harwin, 1989). The reason is that different genotypes are not expected to perform similarly under all environments mainly due to genotype-environmental interactions (Bourdon, 2000). The over all mean of daily weaning weight gain of the present findings was 0.17±0.015 kg, which was lower than the mean weaning weight gain (305gm) of Horro at six months of age (Mulugeta, 1991). The different trends observed in daily weaning weight gain of Horro and Horro-Jersey calves were could be probably due to the breed difference in birth weight and weaning age. Related study on the weaning weights of Jersey at Wolaita showed 85.1 kg for female and 84.8 kg for males (Mesfine and Tigneh, 1993). Least square means of the weaning weigh of the two breeds of calves is shown in (Table2). There was statistically significant (P<0.05) difference between the breeds. Other research showed that calves from Brahman-cross cows gained around 1.5 pounds per day between 7 and 9 months of age when left with the cow for an extended nursing period (Crockett, 1977). Crossbred calves were found to be significantly heavier (50.4 kg) than the Horro (46.8±1.8kg) calves at Weaning (Table 2). The superiority of the crossbreds over the Horro calves indicates the effect of heterosis as result of crossing with the Jersey breed, since both groups suckled Horro cows. Mekonnen (1987) and Asheber (1992) also reported that weaning weight and preweaning gain of the native purebreds were significantly lower than the crossbred calves. This finding was also consistent with Addis and Hedged (2003). Correlation analysis revealed that physical traits significantly increased (p< 0.01) with weaning age: sex (r=0.323), weaning weight (r=0.516), and post weaning daily weight gains(r= 0.834).
Post weaning weight of the calves
The over all mean of post-weaning weight and post- weaning daily weight gain of the calves were 71±9 kg and 0.41±0.08 kg, respectively. The analysis of variance revealed that post-weaning daily weight gain was significantly (p< 0.05) affected by the age of weaning. There was statistically significant difference (P<0.05) between breeds (Table 3). Horro-Jersey calves were heavier (75.7±1.8 kg and 0.46±0.03 kg) than Horro calves (66.7±1.9 kg and 0.36±0.029 kg) (Table 3). Similarly, Tadesse et al. (2005) reported 40-50 gm heifers’ body weight gain during pre- and post- weaning periods for Friesian compared to Jersey crosses. Correlation analysis showed a highly significant association between post-weaning and birth weight (p<0.01, r=0.383) and weaning weight (p<0.01, r=0.599) (Table 4). The overall mean of 12 month and average yearly weight of the calves were 89±14 kg and 42.8±9 kg, respectively. The overall mean body weight at 12 months was comparable with the 87.5 kg of earlier finding for Horro calves (Mulugeta 2003).
Conclusions and Recommendations From the results it could be concluded hat the birth weight affected both the weaning weight
and the growth performance of the calves. Therefore, calves birth weight for a given breed is

Animal Production
15th ESAP-Proceedings 103
paramount importance as it is a good indicator of the weaning weight. This enables the breeder to make an estimate of the absolute daily weight gain that can be expected on a particular suckling and the time required to achieve a given stage of maturity. The positive correlation observed between weaning age and weaning weight and other traits of the calves may indicate weaning age has some influence on the growth performance of the calves. Therefore, weaning at certain weight is more important than restricting weaning age. Generally, if optimum management was employed, the current weaning weight could have been obtained at earlier age. Even though it is only possible to recommend six months of weaning age from the particular data the advantage of early weaning in freeing the dam from suckling stimulus and or lactation stresses on the reproductive performance of the herd should be investigated.
Acknowledgements The Authors are grateful to Mr. Negash Teshome, Mr. Mohammad Abdella, Mr. Mulugeta
Shifa, Mr. Tamene Garedew and Mr. Yohannes Kejela for the help rendered either in the management of calves or data collection. Horro Guduru Cattle Breeding Ranch is also acknowledged for helping data collections
Table 1. Effect of age of weaning and sex on calves weaning weight, daily weaning weight gain, 12month weight, weaning- 12 months weight gain and birth to 12 month weight gain of Horro and Horro-Jersey calves
Source of Birth Weaning Weaning g)
12 month Weaning-12 gain (kg)
Birth to 12 month weight
Overall 18±1.6 48.6±8 0.17±0.015 89±14 0.12±0.04 0.19±0.040
Treatment 1 19±0.5a 39±2e 0.17±0.016b 97±5ba 0.17±0.012a 0.21±0.013ba 2 17±0.5c 40±2ef 0.19±0.014a 87±5d 0.12±0.013b 0.19±0.014dcab 3 17±0.5c 51±2c 0.19±0.015ac 79±5e 0.078±0.012d 0.17±0.013edc 4 19±0.5a 55±2a 0.19±0.015ac 93±4c 0.105±0.012c 0.20±0.013cab 5 17±0.5c 50±2dc 0.13±0.015d 79±5e 0.089±0.013ecd 0.17±0.013edc 6 18±0.5bca 54±2ba 0.15±0.015de 100±5ab 0.12±0.014b 0.22±0.015a Sex Male 18.7±0.3a 49±1.6a 0.17±0.009a 88±2a 0.12±0.008a 0.20±0.008a Female 17.9±0.3a 47±1.5a 0.17±0.009a 90±3a 0.11±0.007a 0.19±0.007a CV (%) 8 16 27 16 33 20 R-square 0.33 0.40 0.21 0.27 0.42 0.23 a,b, c, d e = Significance at p<0.05 & Non significance
Table 2. Birth weight, weaning weight, daily weaning weight gain, 12month weight, weaning- yearly weight gain and birth to yearly weight gain as affected by breed/genotypes
Source of Birth weight Weaning Weaning weight 12 months Weaning-yearly g)
Birth to yearly g)
Breeds ** ** ** ** Ns ** Horro 17±0.28 46.8±1.8 0.17±0.009 81±2.9 0.096±0.008 0.17±0.008 Females 17±0.38 47±2.6 0.16±0.012 82±3 0.096±0.01 0.18±0.01 Male 18±0.42 46±2.6 0.18±0.013 80±4 0.095±0.01 0.17±0.01 Horro-Jersey 19±0.29 50.4±1.8 0.17±0.009 96±2.9 0.13±0.008 0.21±0.008 Female 18±0.42 51±2.6 0.16±0.013 93±4 0.12±0.01 0.20±0.01 Male 19±0.40 49±2.5 0.18±0.013 100±3 0.45±0.01 0.22±0.01 ** Significant at p<0.05

Ethiopian Society of Animal Production
104 15th ESAP-Proceedings
Table 3. Effect of weaning age and sex on pre-weaning weight, pre-weaning weight gain, average year of weight, average year weight gain, pos-weaning weight, and post-weaning gain of Horro and Horro Jersey calves
Source of variation
Preweaning weight (Kg)
Preweaning gain (kg)
Average of year weight (kg)
Average gain (kg)
Post weaning weight (kg)
Post weaning weight gain (kg)
Overall mean 40±7 0.3±0.08 42.8±9 0.12±0.03 71±9 0.41±0.08 Treatment Ns 1 39±2b 0.39±0.02a 39±2b 0.10±0.00 69±3b 0.29±0.028e
2 38±2b 0.43±0.02a 37±2b 0.10±0.00 70±3b 0.21±0.025f
3 43±2a 0.28±0.02b 43±2a 0.12±0.00 63±3d 0.35±0.027d
4 46±2a 0.30±0.02b 49±2a 0.14±0.00 74±3c 0.42±0.027c
5 36±2b 0.17±0.02c 42±2a 0.12±0.00 67±3b 0.55±0.027b
6 40±2a 0.19±0.02c 46±2a 0.13±0.00 83±3a 0.68±0.029a
Sex Ns Ns Ns NS Ns Ns Male 41±1.4 0.29±0.016 42.2±1.7 0.12±0.00 73.9±1.7 0.42±0.017
Female 40±1.3 0.29±0.016 43.5±1.7 0.11±0.00 68.9±1.9 0.41±0.016
Breed Ns Ns Ns Ns ** ** HH 39±1.3 0.30±0.22 40±1.7 0.11±0.00 66.7±1.9 0.36±0.029
HJ 42±1.4 0.29±0.22 44±1.7 0.12±0.00 75.7±1.8 0.46±0.03
CV (%) 18 24 21 21 13 20 R-square 0.19 0.59 0.20 0. 20 0.34 0.79
Table 4. Pearson Correlations between age of weaning, weaning weight and body growth of Horro and Horro-Jersey calves at Horro Guduru Improvement Ranch
BR BW PW PWG SEX WW WG AYW YWT WYG BYG PSW PSG TRT - -.021 -.020 - .332** .516** -.276* .318* -.027 -.331* -.031 .232 .834**
BR - -.192 .003 .082 -.176 -.009 -.207 - - - - -.268*
BW .372** .179 -.241 .333** .220 .336** .428** .353** .328* .383** .131 PW .479** -.114 .797** .879** .778** .471** .101 .443** .600** .200 PWG -.296* -.079 .696** .270* .352** .448** .343* .230 -
SEX .064 -.186 .131 -.145 -.206 -.124 -.173 .317* WW .596** .803** .387** -.134 .359** .599** .615** WG .576** .406** .130 .398** .465** -.090 AYW .671** .226 .643** .862** .675** YWT .823** .992** .806** .284* WYG .820** .503** -.029 BYG .802** .291* PSW .567** PSG ** Correlation is significant at the 0.01 level (2-tailed).
* Correlation is significant at the 0.05 level (2-tailed).
TRT-Weaning age in month, BR Breed, BW Birth weight, PW preweaning weight, PWG- pre-weaning weight gain, Sex, WW weaning weight, WG weaning gain AYW Average yearly weight, YWT – 12
months weight, WYG weaning –yearly gain, BYG Birth to yearly gain, PSW Post weaning weight, PSG post weaning gain

Animal Production
15th ESAP-Proceedings 105
References Ababu Dekeba. 2002. Evaluation of Performance of Boran Cows in the Production of Crossbreed Dairy Heifers
at Abernosa Ranch, Ethiopia. M.Sc. Thesis, Alemaya University.
Ababu Dekeba, Workneh Ayalew, P.B. Hedge and Zerihun Taddese. 2006. Performance of the Abernosa Ranch in the Production of Ethiopian Boran X Holstein Crossbreed Dairy Heifers in Ethiopia.) . Eth. J. Anim. Prod. 6(1) - 2006: 33-53.
Acker, D. and Cunningham M. 1998. Evaluation of feeder animals. In: D. Acker and M.Cunningham (editors). Animal Science and Industry. 5th Ed. Printice Hall Upper Saddle River. NJ.
Addisu Bitew. 1999. Evaluation of reproductive and growth performance of Fogera cattle and their F1 Friesian cross at Metekel Ranch. MSc Thesis. AlemayaUniversity of Agriculture. Alemaya, Ethiopia.
Addisu Bitew1 and B.Prabhakar Hegede 2003. Reproductive and growth performance of Fogera cattle and their F1Friesian crosses at Metekel ranch, Ethiopia. Challenges and Opportunities of LivestockMarketing in Ethiopia. Proceedings of the 10th annual conference of the Ethiopian Society of Animal Production (ESAP) held in Addis Ababa,Ethiopia, August 22-24, 2002. ESAP, Addis Ababa. 407pp.
Ahunu, B. K., Arthur, P F., Danbaro, G. and Aboagye, G. S. (1993). Pre-weaning growth performance of West African Shorthorn Cattle and their Jersey crossbreds in Ghana. Tropical Animal Health and Production, 25: 33-40.
Alemu Gebre Wold, Tadesse Bekele, Getachew Worku, Tefera Gebre Meskel and Eksisa Ketema. 1989.Evaluation of Brahman-crossbred Boran, Pure Brahman and pure Boran cattle at Abernossa Ranch of the Minstiry of Agriculture. The 2nd National Livestock Improvement Conference held from 24-26 February 1988, Addis Ababa, Ethiopia.
Anthony, L. Ernest (ed). 2001. Dairy cattle and milk production. Biotech Books. Delhi-110035.
Asheber Sewalem. 1992. Evaluation of the reproductive and preweaning growth performance of Fogera cattle and theirF1 Friesian crosses at Andassa Cattle Breeding Station, Ethiopia. M.Sc. Thesis, Alemaya University of Agriculture, Alemaya, Ethiopia.
Banerjee, G.C. 1999. A Textbook of Animal Husbandry. Eighth edition. PP.742.
Bordy, S. 1945. Bioenergetics and growth. Renhold Publ. Prod crop. New York.
Bourdon, R. M., 2000. Understanding animal breeding. 2nded. Prentice Hall. New Jersey.
Burfening, P.J., Kress, D.D., Friedrich, R.L. and Vaniman, D.D., 1978. Phenotypic and genetic relationships between calving ease gestation length, birth weight and preweaning growth. J. Anim. Sci. 47, 595.
Crockett, J.R. 1977. "Breed and management effects on calf production on the muck soils of south Florida." Proc. 26th Annual Beef Cattle Short Course. Univ. Fla., Gainesville, pp. 18-34.
Gebre-Egziabher G. Yohanes and Mulugeta Kebede. 1995. Daily liveweight gain of cattle grazing wet season natural pasture at Bako Research Center. The 3rd National Livestock Improvement Conference held from 27-29 April 1995, Addis Ababa, Ethiopia.
Gebre-Egziabher G. Yohanes, Tesfaye Kumsa, Alganesh Tola and Cherinet Asfaw, 2000. Effect of suckling on pre-weaning growth and cow reproduction in Horro and crossbred cows. In: Proc. 7th ESAP Con., 26-27 may 1999, Addis Ababa, Ethiopia. Page 212-216.

Ethiopian Society of Animal Production
106 15th ESAP-Proceedings
Hailu Dadi and Tadele Mirkena.2004. Influence of Dam Genotype, Age of Dam and Parity on Age at FirstCalving, Calving Interval and Birth Weight in Indigenous and Crossbred Cattle at Adami Tulu.Farm Animal Biodiversity in Ethiopia: Status and Prospects. Proceedings of the 11th annual conference of the Ethiopian Society of Animal Production (ESAP) held in Addis Ababa, Ethiopia, August 28-30, 2003.
Hailu Dadi. 2001. Genetic parameter estimates for weaning traits in a multibreed beef cattle population. MSc Thesis, University of Stellenbosch, South Africa.
Harwin, G.O., 1989. Strategies for beef production in South Africa. A selection of lectures. Stock Owners Cooperative limited, South Africa.
I.A.R. (Institute of Agricultural Research), 1976.Results of Experiments in Animal Production. Animal Production report. No. 1.
Jiregna Desalegn, Ulfina Galmessa, Mulugeta Kebede and Adisu Yadetta.2006. Growth Performances and Mortality rate of Horro Calves under different weaning system. The Role of AgriculturalUniversities/Colleges in TransformingAnimal Agriculture in Education, Research and Development in Ethiopia: Challenges & Opportunities. The Proceedings of the 13th annual conference of the Ethiopian Society of Animal Production (ESAP) held in Addis Ababa, Ethiopia, August 25-27, 2005.
Kellems, Richard O. and Church, D. C. 1998. Livestock feeds and feeding 4th ed. Prentice Hall, Upper Saddle River, New Jersey 07458. pp 573.
Kiwuwa, G.H., Trail, J.C.M., Kurtu, M.Y., Worku, G., Anderson, FM. And Durkin, J.1983. Crossbred dairy cattle productivity in Arsi region, Ethiopia.ILCA Research Report No.11.ARDU and ILCA, Addis Ababa, Ethipia.
Little D.A., Anderson F.M. and Durkin J.W., 1991. Influence of partial suckling of crossbred dairy cows on milk off take and calf growth in the Ethiopian highlands. Trop. Anim. Prod. 23: 108-114.
Lubout, P.C; Lepen, J.M. and Venter, H.A.W. 1986. Factors affecting the performance of Nguni and Pedi cattle . Proceeding 3rd World Congress on Genetic applied to Livestock production. Genetic of reproduction, lactation, growth adaptation diseases and parasite resistance, Lincoln, USA, XI, 499.
Matthewman, W. Richard. 1993. Dairying. Center for Tropical Veterinary Medicine. CTA. Macmilian.
Mekonnen Haile-Mariam and Goshu Mekonnen.1996. Reproductive performance of zebu, Firesian and Firesian –Zebu crosses. Trop.Agric (Trinidad) 73(2): 142-147.
Mekonnen Haile-Mariam. 1987. Evaluation of reproductive and growth performance of Boran cattle and Friesian atAbernossa, Ethiopia. M.Sc. Thesis, Alemaya University of Agriculture, Alemaya, Ethiopia.
Mesfine Tesfaye and Tigneh Alemu. 1993. Performance of Jersey cattle at Wolita Sodo farm. The 4th National Livestock Improvement Conference held from 13-15 November 1991, Addis Ababa, Ethiopia.
Muktar A. 1961. Some observations on the rate of gain, birth and weaning weight of south Darfur ccalves in regard to sex, season of birth and size of dam. Sudan J. Vet. Sci. Anim. Husb. 2: 208-211.
Mulugeta K. 1989.Birth weight, Early mortality and Body development in indigenous Horro cattle. In: Proceeding of the Third National Livestock Improvement Conference. Addis Ababa, Ethiopia, 24-26 May 1989. IAR. Addis Ababa. Pp. 112-115.
Mulugeta K. 2003. An Evaluation of Reproductive performance of Horro cattle in Ethiopia. 2003. PhD Thesis.
Animal Production
15th ESAP-Proceedings 107
Mulugeta Kebede, Tesfaye Kumsa, and Gebre-Egziabher Gebre-Yohannes. 1991. Some productive and reproductive performances of Horro cattle at Bako research center. In: Proceedings of the fourth National Livestock Improvement Conference (NLIC). 13-15 Nov 1991, Addis Ababa, Ethiopia, 78-82.
Newman, S. and Deland, M.P. 1991. Lifetime productivity of crossbred cows. 2.Age and weight at first oestrous, calf birth weight associated calving interval and reproduction rate, Aust. J.Exp.Agric. 31,296.
Notter, D.R., Cundiff, L.V., Smith, G.M., Laster, D.B. and Gregory, K.E., 1978. Characterisation of biological types of cattle. VI. Transmitted and maternal effects on birth and survival traits in progeny of young cows. J. Anim. Sci. 46,892.
Osman A. and Rizgalla Y. 1968. Normal growth and development up to one year of age of Sudanese cattle with special reference to the influence of sex and sire. j. Agri. Sci. (camb.) 70: 117-121.
Preston, T.R. 1989. The development of milk production system in the tropics. Technical Center for the Agriculture and Rural Cooperation, the Netherlands.
Rege, J.E.O., Aboagye, G.S., Ahah, S., and Ahunu, B.K. 1994. Crossbreeding Jersey with Ghana Short horn and Sokoto Gudali cattle in a tropical environment: additive and heterotic effects for milk production, reproduction and calf growth traits. Anim. Prod. 59: 21-29.
Saeed, P., N. Ward, D. Light, J. W. Durkin, and R. T. Wilson. 1987. Characterization of Kenana cattle at Umbanion, Sudan. ILCA Research Report No 16. ILCA, Addis Ababa.
SAS (Statistical Analysis System). 1998. SAS Institute Inc., Cary, NC, USA.
Schwalbach, L.M.J. 1997.Effects of body condition at calving and reproduction tract score on subsequent performance of Bonsmara cattle. MSc Thesis, Bloemfontein, USA.
Sendros Demeke, Beyene Kebede, Tesfaye Bekure, Mulugeta Kebede, and Hailu Gebremariam. 1987. Preliminary results of cattle crossbreeding (European x Zebu) study II. Growth performance of crossbred calves. P. 73-75. In; Proceeding of the First National Livestock Improvement Conference, 11-13 Feb. 1987. Addis Ababa, Ethiopia.
Tadesse Bekele, Yohannes Gojam, Zelalem Yilma and Yoseph Shiferaw.2005. Growth performance of crossbred calves reared on skim milk as partial milk replacer. Participatory Innovation and Research: Lessons for Livestock Development. Proceedings of the 12th annual conference of the Ethiopian Society of Animal Production (ESAP) held in Addis Ababa, Ethiopia, August 12-14, 2004.
Tawonezvi, H.P.R., Ward, H.K., Trail, J.C.M. and Light, D., 1988. Evaluation of beef breeds for rangeland weaner production in Zimbabwe. I. Productivity of purebred cows. Anim. Prod. 47, 351.
Tegegne, A, Mukassa-Mugerwa,E. and Ketama, H. 1990. Effect of early weaning on the growth performance of Borana and Boran *Firesian bulls calves Bulls. Hth. Prod. Afr.38: 103-106.


Animal Production
15th ESAP-Proceedings 109
The food and feeding habit of oreochromis niloticus l. (pisces: cichlidae) in lake babogaya, Ethiopia
Lemma Abera Hirpo
Zwai Fishery Research Center, P.O.Box 229, Zwai, Ethiopia; E-mail: [email protected]
Abstract
The food of Oreochromis niloticus in Lake Babogaya, Ethiopia was studied from the stomach contents of 535 fish during the period of September 2005 to August 2006. A total of 15 algal genera belonging to 3 families were identified. In addition, unidentifiable animal remains of zooplankton origin, macrophytes, detritus and sand grains were also presented. Oreochromis niloticus was found to be essentially zooplanktivores at juvenile stage and phytoplanktivores at adult stage in Lake Babogaya. Among phytoplankton, diatoms were the most frequent (44.1 %), followed by blue greens (42.1 %) and green algae (13.81 %). Based on percentage composition by number, diatoms were the most diet of O. niloticus in the Lake that contributed 52% of the total food ingested. Blue greens contributed 38% and green algae 10 %. In general, the composition of the phytoplankton diet varied seasonally.
Key Words/phrases: Ethiopia, Lake Babogaya, Oreochromis niloticus, Food
Introduction Cheap source of protein is urgently required to support an ever increasing human population.
Fishery resources definitely can offer one of the solutions to the problem of food shortage in a country like Ethiopia. Moreover, Oreochromis niloticus is the most preferred fish in Ethiopia for human consumption and the demand has increased rapidly over the last two decades (Zenebe Tadesse, 1999).
The inland water body of the county is estimated at about 7,400 km2 of lake area and about 7000 km total length of rivers (Shibru Tedlla, 1973). From the inland water bodies, crater lakes are well represented in Africa, including Ethiopia (Baxter, 2002). The crater lakes in Ethiopia may provide admirable opportunities for comparative biological studies owing to the considerable variations in their morphometric, physical and chemical features. Among these are the Bishoftu crater lakes, which form an extensive series of volcanic explosion craters in the vicinity of the town and harbour a variety of fish species.
Generally, The potential fish yield of these water bodies of the country is roughly between 30,000 and 40,000 metric tones per year for the main water bodies alone, and so far only 20% of this is being utilized (FAO, 1995). The three fish species found in Lake Babogaya are O.niloticus, C.gariepinus and Tilapia zilli. They are introduced in the lake by the MOA aiming at enhancing the fishery of the lake. From these species O.niloticus is a case in point to this study. Oreochromis niloticus, a member of the group, is a broadly distributed in Ethiopia (Trewavas, 1983). It is found in almost all lakes and rivers of Ethiopia (Shibru Tedla, 1973). Therefore, it is one of the most important species in the fisheries of Ethiopia.
In spite of its important of the fish, very little work has been done on the fishery and the resource is exploited without enough knowledge on the biology of the fish (Zenebe Tadesse,

Ethiopian Society of Animal Production
110 15th ESAP-Proceedings
1999). Therefore, knowing the information on the food and feeding habits of O .niloticus can provide basic knowledge for the proper management of the resource. However, such knowledge is not available for the species in Lake Babogaya and this has hindered proper management of the fishery. Therefore, the major objective of the present study was to generate basic biological information that could help to make proper exploitation and management strategies on the Ethiopian fishery in general and O.niloticus in Lake Babogaya in particular. The specific objectives were to assess food and feeding habits of O.niloticus in the Lake.
Study area Lake Babogaya
Lake Babogaya is one of the volcanic Crater Lake found in the vicinity of Beshoftu town in East Showa. The Lake is a small, roughly circular and fairly deep lake found at an altitude of 1870 m and at about 90N latitude and 390E longitude (Prosser, et al., 1968; Wood, et al., 1984). Like the other volcanic crater lakes of the area, it is a closed system surrounded by very steep and rocky hills. The vertical distance from the lake's surface to the crater rim is 20 m, and this affords moderate protection from wind (Baxter, 2002).
Limnological studies made on Lake Babogaya described its bathymetry (Prosser et al., 1968), water chemistry (Prosser et al., 1968; Wood et al., 1984; Rippey and Wood, 1985; Zinabu Gebre-Mariam, 1994 Baxter, 2002; Zinabu Gebre-Mariam et al., 2002), thermal stratification and mixing (Wood et al., 1976; 1984), chlorophyll a and phytoplankton (Wood and Talling, 1988; Zinabu Gebre-Mariam, 1994), bacterial abundance (Zinabu Gebre-Mariam et al., 2002) and zooplankton associations (Green, 1986).The fish community found in Lake Babogaya is O.niloticus, C.gariepinus and Tilapia zilli.
Mean monthly minimum air temperature ranged from 7.4 to 13.50C, while the maximum mean monthly air temperature varied from 22.8 to 31.5 0C. Monthly total rainfall varied from 2.1 mm of January 2006 to 239.5 mm of July 2006. Surface water temperature was mostly between 220C and 24.50C, while the bottom temperature was almost constant (19.20C-19.40C) (Wood, et al., 1984). Where as, in a very recent study of Yeshemebet Major (2006), the water temperature and dissolved oxygen ranging from 230C to 270C and 7 mg l-1 to 14 mgl-1 respectively
Materials and methods Field Sampling and measurement
Samples O.niloticus of were collected monthly between September 2005 and August 2006 using gill net. Monthly sampling was done at two different sites of the lake. Site one (Harmeniawian house), is located about 20 meters offshore at a depth of 4 to 12 m. Site two (ILRI) is 2 m to 7 m deep and 10 m away from the shore and relatively have a dense macrophyte around the shore. Gill net (8 and 10 cm stretched mesh size) of 50 m long each was set parallel to the vegetation. The gear was set in the afternoon (05:00 pm) and lifted in the following morning (7.00 am). In addition, fish caught by fishermen were also included to obtain a wide range of fish size group and increase the sample size of fish taken monthly. Then Total length (TL) and total

Animal Production
15th ESAP-Proceedings 111
weight (TW) of all collected fish specimens were measured to the nearest 0.1 cm and 0.1g. respectively.
Food and feeding habits Stomach contents
Stomach contents preserved in 5% formaldehyde solution were analyzed for food composition. Then identification of stomach contents was made visually for large food items and microscopically for others. Food items were identified using descriptions from several sources (Blomqvist, 1981; Defaye, 1988; Dussart and Fernando (1988); John et al., 2002). The algae in the stomach contents were counted by the transect method (Lind, 1974).
Relative contribution of major food items
The relative importance of the different food items found in the stomach was determined using numerical method i.e. Percentage frequency of occurrence and percentage composition by number (Windell and Bowen, 1978) as described below.
i. Percentage frequency of occurrence:
In this case the number of stomachs in which each of the food items occurred was recorded and the percentage of this was calculated relative to the total number of stomachs containing food. This value, therefore, estimates the proportion of fish in the population ingesting a particular food item.
ii. Percentage composition by number:
It expresses the relative abundance of a particular food category as a percentage of the food items of the total gut contents. This method appears to give a better indication of the contribution of various food items to the diet.
Seasonal feeding periodicity
Seasonal difference in the food habit of O. niloticus was studied from the frequency of empty stomachs and the relative contribution of major food items based on results from frequency of occurrence and numerical abundance methods.
Results Food and feeding habits Stomach contents
The samples used in this study were 690 fish (200 males and 490 females) whose total length ranged from 4 - 28 cm. Of these 155 (22.5%) had empty stomachs. Items encountered in the stomach contents are listed in Table 1. The stomach content was found to be composed of diverse
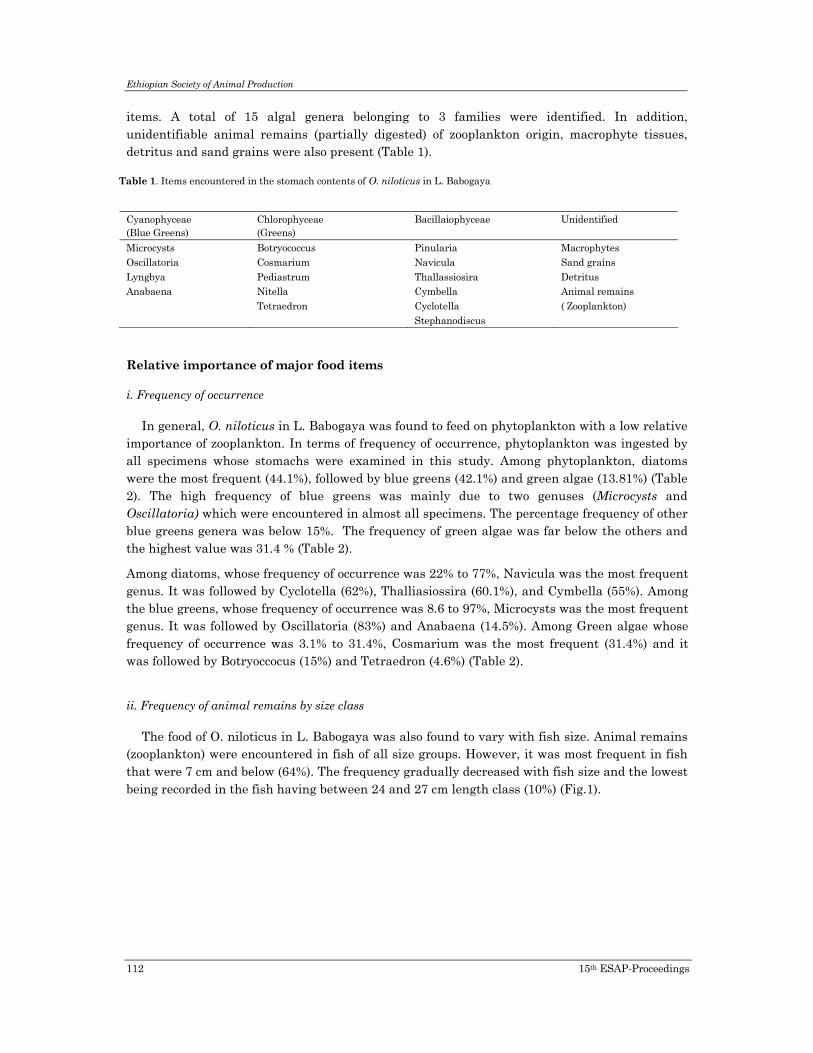
Ethiopian Society of Animal Production
112 15th ESAP-Proceedings
items. A total of 15 algal genera belonging to 3 families were identified. In addition, unidentifiable animal remains (partially digested) of zooplankton origin, macrophyte tissues, detritus and sand grains were also present (Table 1).
Table 1. Items encountered in the stomach contents of O. niloticus in L. Babogaya
Relative importance of major food items i. Frequency of occurrence
In general, O. niloticus in L. Babogaya was found to feed on phytoplankton with a low relative importance of zooplankton. In terms of frequency of occurrence, phytoplankton was ingested by all specimens whose stomachs were examined in this study. Among phytoplankton, diatoms were the most frequent (44.1%), followed by blue greens (42.1%) and green algae (13.81%) (Table 2). The high frequency of blue greens was mainly due to two genuses (Microcysts and Oscillatoria) which were encountered in almost all specimens. The percentage frequency of other blue greens genera was below 15%. The frequency of green algae was far below the others and the highest value was 31.4 % (Table 2).
Among diatoms, whose frequency of occurrence was 22% to 77%, Navicula was the most frequent genus. It was followed by Cyclotella (62%), Thalliasiossira (60.1%), and Cymbella (55%). Among the blue greens, whose frequency of occurrence was 8.6 to 97%, Microcysts was the most frequent genus. It was followed by Oscillatoria (83%) and Anabaena (14.5%). Among Green algae whose frequency of occurrence was 3.1% to 31.4%, Cosmarium was the most frequent (31.4%) and it was followed by Botryoccocus (15%) and Tetraedron (4.6%) (Table 2).
ii. Frequency of animal remains by size class
The food of O. niloticus in L. Babogaya was also found to vary with fish size. Animal remains (zooplankton) were encountered in fish of all size groups. However, it was most frequent in fish that were 7 cm and below (64%). The frequency gradually decreased with fish size and the lowest being recorded in the fish having between 24 and 27 cm length class (10%) (Fig.1).
Cyanophyceae (Blue Greens)
Chlorophyceae (Greens)
Bacillaiophyceae Unidentified
Microcysts Botryococcus Pinularia Macrophytes Oscillatoria Cosmarium Navicula Sand grains Lyngbya Pediastrum Thallassiosira Detritus Anabaena Nitella Cymbella Animal remains Tetraedron Cyclotella ( Zooplankton) Stephanodiscus

Animal Production
15th ESAP-Proceedings 113
0
10
20
30
40
50
60
70
4_7 8_11 12_15 16_19 20_23 24_27
Total length (cm)
Freq
uenc
y of ani
mal re
mains
Fig. 1. Frequency of animal remains in different size classes of O. niloticus in L. Babogaya
Table 2. Relative importance of different food items present in the stomach contents of O. niloticus in L. Babogaya.
Food items Numerical (%) Frequency (%) Cyanophceae (Blue greens)
38 42.1
Microcysts 18.1 97 Oscillatoria 8.9 83 Anabaena 6.3 14.5 Lyngbya 4.3 8.6 Chlorophyceae (Green algae)
10 13.81
Cosmarium 4.6 31.4 Botryococcus 2.76 15 Tetraedron 1.8 4.6 Pediastrum .5 3.1 Nitella .43 3.5 Bacillariophyceae (Diatoms)
52 44.1
Navicula 14.1 77 Cyclotella 12.7 62 Cymbella 8.7 55 Thaliasiossira 7.7 60.1 Stephanodiscus 5.9 41.6 Pinularia 2.5 22
iii. Numerical abundance
Based on percentage composition by number, diatoms were the most important diet of O. niloticus in L. Babogaya, which contributed 52 % of the total food ingested. Blue greens contributed 38% and green algae 10 % (Table 2).
Among diatoms Navicula, Cyclotella, Cymbella and Thallasiossira contributed 14.1 %, 12.7%, 8.7% and 7.7%, respectively, of the total food counted (Table 2). Among blue greens, Microcysts accounted for 18.1% of the total number of food item ingested. Oscillatoria and Anabaena also contributed 8.9% and 6.3%, respectively. Microcysts were the most abundant genus not only from its group but also from the total food ingested. Numerically the most important green algal genera were Cosmarium, Botryococcus and Tetraedron, which contributed 4.6%, 2.76% and 1.8%, respectively (Table 2). Animal remains of zooplankton origin, macrophyte tissues, amorphous detritus and sand grains were also observed frequently in the diet of the fish. Generally diatoms and blue greens as a group contributed the bulk of the diet, and were the most important food of O. niloticus in L. Babogaya. Green algae were consumed regularly but in very small quantity.

Ethiopian Society of Animal Production
114 15th ESAP-Proceedings
4.1.3. Seasonal feeding periodicity
The frequency of fish with empty stomach varied throughout the sampling months. Fish with empty stomach were most frequent in September and in between March to August. Whereas the frequency is relatively lower for the remaining months (Fig.2).
0
10
20
30
40
50
60
70
Sep.2
005
OctNov Dec
Jan.20
06 Feb
Mar Apr
May Ju
n Jul
Aug
Month
Freq
uenc
y of
em
pety
stom
ache
Fig. 2. Frequency of O. niloticus with empty stomachs from Lake Babogaya.
In terms of percentage frequency of occurrence diatoms were ranged from 22%-77% (Table 2) with relatively the highest values in between December and April. The lowest values were recorded for the remaining periods (Fig. 3a). The value for blue greens ranged from 8.6% to 97% with the highest values being recorded in between May and August including September and the lowest values in between October to April. Green algae, on the other hand, varied from 3.1% – 31.4% (Table 2) with the highest values recorded in between January and March and relatively the lowest values in the remaining sampling months. (Fig.3a).
Numerical contribution of diatoms ranged from 2.5% – 14.1% with relatively high proportions in between November to May including August and the lowest value was in the remaining months (Fig 3.b). The value for blue greens ranged from 4.3% – 18.1% with relatively high proportions in between March to August. Also, the numerical contribution of green algae ranged from 0.43%– 4.6% with relatively high proportions in between September and February; the lowest value was recorded for the remaining months (Fig. 3.b).(a) (b)
0%
20%
40%
60%
80%
100%
Sep.2
005
OctNov Dec
Jan.2
006
Feb
Mar Apr
May Ju
n Jul
Aug
Month
Num
ber (
%)
DiatomsGreenBlue Green
Fig. 3. Relative importance of major food items of O. niloticus in L. Babogaya determined using (a) percentage frequency of occurrence (b) percentage composition by number

Animal Production
15th ESAP-Proceedings 115
Discussion The study showed that O. niloticus in L. Babogaya feeds on a variety of food items. The fish
ingests phytoplankton, zooplankton, macrophytes, detritus and some other unidentifiable organism groups. The findings confirm the fact that, tilapia is opportunistic, which is capable of shifting from one diet to another depending on temporal and/ or spatial variations in availability of the diet in the habitat (Fryer and Iles, 1972; Philipart and Ruwet, 1982; Matipe and De Silva, 1985). The food items ingested by O. niloticus in the present study were also reported for the same fish in other Ethiopian water bodies (Getachew Teferra, 1987; Zenebe Taddese, 1988; Tudorancea et al., 1988). These studies have variously reported that adult O. niloticus feeds mainly on phytoplankton and occasionally on macrophytes and detritus. In addition foods of animal origin, mostly zooplankton, are also consumed by adult fish on a regular basis (Fryer and Iles, 1972; Moriarity, 1973; and Getachew Tefera, 1987).
Although phytoplankton were dominant in the diet, the contribution of zooplankton was quite significant for O. niloticus in the present study. Zooplanktons were ingested by all size groups of the fish and in all sampling occasion (Fig. 1 & 3). Zooplanktivorous feeding habit has been reported for O. niloticus in other water bodies (Moriarity, 1973; Fryer and Iles, 1972; Zenebe Tadesse, 1988). Generally, however, O. niloticus is considered to be omnivorous when young, but shifts to a phytoplanktivorous habit afterwards in Lake Babogaya. This is similar to the findings of several other authors on Ethiopian O. niloticus populations (Fryer and Iles, 1972, Getachew Tefera, 1987; Zenebe Tadesse, 1988; Tudorancea et al., 1988; Yirgaw Teferi, 1997).
Macrophyte pieces and detritus were also the other very common items in the diet of O. niloticus in L.Babogaya. These food items have also been reported from the stomach of O. niloticus in Lake Ziway (Zenebe Tadesse, 1988) and tilapia in general in other water bodies (Fryer and Iles, 1972; Philipart and Ruwet, 1982). Sand grains were also encountered in significant quantities and frequencies in the stomach contents of O. niloticus in the present study. Similar other authors reported in other water bodies (Fagade, 1971; Zenebe Tadesse, 1988). Among the algal diet encountered in the stomach of the fish, diatoms and blue greens as a group were found to be the most important food items of O. niloticus in L. Babogaya (Table 2). Similar results have been reported for the species in Lakes Awassa (Tudorancea et al. 1988), Ziway (Zenebe Tadesse, 1988), Chamo (Yirgaw Teferi et al., 2000) and Haiq (Kebede Alemu, 1995). It was also the case for the fish in Lake Rudolf and Nile Canal (Harbott, 1975). The dominance of blue greens as a group in the stomach of the fish in this study, however, was mainly due to Microcysts and Oscillatoria (Table 3). Microcysts and Oscillatoria is relatively more dominant in the phytoplankton community of the Ethiopian water bodies because of its wide range of salinity tolerance (Wood and Talling, 1988; Elizabeth Kebede and Willen, 1998) and this could be the reason for its dominance particularly in terms of frequency of occurrence in the stomach of the fish in this study. The high importance of blue greens, especially, Microcysts, has been reported for the same species in several other water bodies (Kebede Alemu, 1995; Getachew Teferra, 1993; Yirgaw Teferi et al., 2000).
Rainfall pattern appeared important in determining variation in the composition of the food of O. niloticus in L. Babogaya. The contribution of blue greens and greens was relatively highest towards the rainy season (Fig. 3). In addition, samples taken in these months were also light brown in color suggesting high level of organic matter (Bowen, 1980). Thus, an increase of phytoplankton in the diet of O. niloticus could be due to an increase in biomass following nutrient loading by run off (allochtonous) and/or autochthnously (Getachew Teferra, 1987; Zenebe Tadesse, 1988). On the other hand in the relatively driest months, numerical

Ethiopian Society of Animal Production
116 15th ESAP-Proceedings
contribution of blue greens and greens decreased where as that of diatoms and occurrence of zooplankton remains was high (Fig. 3).
Another seasonal variation in the feeding of O. niloticus in L. Babogaya was also indicated by temporal variation in frequency of empty stomachs. Highest frequency of fish with empty stomach was recorded during rainy seasons (Fig. 2). This coincided with peak spawning months of the fish in this lake. Thus, reduced feeding activity in these months could be attributed to peak spawning activity. Spawning O. niloticus spend most of the time in spawning than feeding activities (Getachew Teferra, 1987; Zenebe Tadesse, 1988; Demeke Admassu, 1994; 1996; Yirgaw Teferi, 1997). For instance, similar results have been found for the same species in Lake Ziway (Zenebe Tadesse, 1988) and in Lake Chamo (Yirgaw Teferi, 1997).
Acknowledgements I would like to thank EARTP for financial support and my friends at Lake Babogaya, for their
help in sampling work. Also all staff members of Zwai Fishery acknowledged for helping me in many ways. In particular, my friends Abrish, Mimie and Ahmed in solving some personal problems.
References Baxter, R. M. (2002). Lake morphometry and chemistry. In: Ethiopian Rift Valley lakes, Tudorancea, C. and
Taylor, W.D. (eds.), pp. 45-60. Backhuys Publishers, Leiden, The Netherlands.
Blomqvist P. (1981). Vaxtplanktonpendium. (Blomqvist, Ed). Uppsala University, Uppsala, 185pp.
Defaye D. (1988). Contribution a la connaissance des crustaces copepodes d’ethiopie. Hydrobiologia, 164: 103-147.
Demeke Admassu (1994). Maturity, Fecundity, Brood size and sex ratio of Tilapia (Oreochromis niloticus L.) in Lake Awassa. SINET: Ethiop. J. Sci. 17(1):53-96.
Demeke Admassu (1996). The breeding season of tilapia, Oreochromis niloticus L. in Lake Awassa (Ethiopian rift valley). Hydrobiologia, 337:77-83.
Dussart BH. and Fernando CH. (1988). Sur quelques Mesocyclops (Crustacea, Copepoda). Hydrobiologia 157: 241-264.
Elizabeth Kebede and Willen, E, (1998). Phytoplankton in a salinity alkalinity series of lakes in the Ethiopian Rift Valley. Algological studies 89: 63-96.
Fagade, SO. (1971). The food and feeding habits of Tilapia species in the Lagos Lagoon. J. Fish Biol., 3: 151-156.
FAO (1995). Review of the Fisheries and Aquaculture Sector. Ethiopia. FAO, Rome.
Fryer, G. and Iles, TD. (1972).The cichlid Fishes of the Great Lakes of Africa: Their Biology and Evolution. Oliver and Boyd, Edinburgh, pp. 66-72.
Getachew Teferra (1987). Food, nutrition and digestive efficiency in Oreochromis niloticus L. (Pisces: Cichlidae) in Lake Awassa, Ethiopia.Unpubl. Ph.D. Dissertation, University of Waterloo, Canada, 109pp.

Animal Production
15th ESAP-Proceedings 117
Getachew Tefera (1993). The composition and nutritional status of the diet of Oreochromis niloticus in Lake Chamo, Ethiopia. J. Fish Biol., 42: 864-874.
Green, J. (1986). Zooplankton associations in some Ethiopian Crater lakes. Freshwat. Biol. 16:495–499.
Harbott BJ. (1975). Preliminary observation on the feeding of Tilapia nilotica Linn. In Lake Rudolf. Afr. J. Trop.Hydrbiologia. Fish, 4: 27-37.
John DM. Brook AJ. and Whitton BA., (eds.) (2002).The freshwater algal flora of the British Isles. The British Physiological Society, Cambridge.
Kebede Alemu (1995). Age and growth of O. niloticus (Pisces: Cichlidea) in Lake Haiq, Ethiopia, Unpbl. M sc Thesis. School of Graduate Studies, AAU, 87pp.
Lind OT. (1974). Handbook of common methods in limnology. The C. V. Mosby Co. Saint Louis: 99- 103.
Matipe O. and De Silva SS. (1985). Switches between zoophagy, phytophagy and detritivory of Sarotherodon mossambicus (peters) populations in twelve men made Sri Lanka lakes. J. Fish Biol., 26: 49-61.
Moriarty ,DJW. (1973). The Physiology of digestion of green algae in the cichlid fish, Tilapia nilotica. J. Zool. Lon., 171: 25-29.
Philipart JC. and Ruwet TM. (1982). Ecology and distribution of Tilapias. In: The Biology and Culture of Tilapias. Proceedings of the international conference, (Pullin, R.S.V.and Lowe-McConnell, R.H., ed.) Manila, Philippines, PP. 15-59.
Prosser, M. V., Wood, R. B., and Baxter, R. M. (1968). The Bishoftu crater lakes: a bathymetric and chemical study. Arch. fur Hydrobiologia 65:309-324.
Rippey, B. and Wood, R. B. (1985). Trend in major ion composition of five Bishoftu crater Lakes. SINET: Ethiop.J .Sci. 8: 9-29.
Shibru Tedla (1973). Fresh-water Fishes of Ethiopia. Haile Selassie I University Dept. of Biology, Addis Ababa, Ethiopia, 101 pp.
Trewavas E. (1983). Tilapiine Fishes of the Genera Sarotherodon, Oreochromis and Danakilia. British Museum (Natural History). Dorchester: Henery Ling Ltd. The Dorset press, pp. 1-27.
Tudorancea C. Fernando CH. and Paggi JC. (1988). Food and feeding ecology of Oreochromis niloticus (Linnaeus) juveniles in Lake Awassa (Ethiopia). Arch.Hydrobiol. (supp), 79: 267-289.
Windell JT. and Bowen, S.H. (1978). Methods for the study of fish diets based on analysis of stomach contents. In: Methods for assessment of fish production in fresh waters, Bagenal TB. (ed.) IBP. Hand book No.3, Blackwell, Oxford, pp. 219-226.
Wood, R. B., Prosser, M. V. and Baxter, R. M. (1976). The seasonal pattern of thermal characteristics of four Bishoftu cater lakes, Ethiopia. Freshwat. Biol. 6: 519-530.
Wood, R. B., Baxter, R. M. and Prosser, V. (1984). Seasonal and comparative aspects of chemical stratification in some tropical crater lakes, Ethiopia. Freshwat. Biol. 14: 551-573.
Wood RB. and Talling, J.F. (1988) Chemical and algal relationships in a salinity series of Ethiopian inland waters. Hydrobiologia. 158: 29-67.

Ethiopian Society of Animal Production
118 15th ESAP-Proceedings
Yeshimebet Major (2006).Temporal change in the community structure and photosynthetic production in Lake Babogaya, Ethiopia. M.Sc. thesis. School of Graduate Studies, Addis Ababa University. Addis Ababa.79pp
Yirgaw Teferi (1997). The condition factor, feeding and reproductive biology of Oreochromis niloticus Linn. (Pisces: Cichlidae) in Lake Chamo, Ethiopia. Unpubl. M.Sc. thesis. School of Graduate Studies, Addis Ababa University. 79pp.
Yirgaw Teferi, Demeke Admassu and Seyoum Mengistou (2000). The food and feeding habit of Oreochromis niloticus L. (Pisces: Cichlidae) in Lake Chamo, Ethiopia. SINET: Ethiop. J. Sc. 23 (1):1-12.
Zenebe Tadesse (1988). Studies on some aspects of the biology of Oreochromis niloticus L.(Pisces. Cichlidae) in Lake Ziway, Ethiopia. Unpubl. M.Sc. thesis. School of Graduate Studies, Addis Ababa University. 78pp.
Zenebe Tadesse (1999). The nutritional status and digestibility of Oreochromis niloticus L.diet in Lake Langeno, Ethiopia. Hydrobiologia 416: 976-106.
Zinabu Gebre-Mariam (1994). Long-term changes in indices of chemical and productivity status of a group of tropical Ethiopian lakes with differing exposure to human influence. Arch. Hydrobiologia 132(1):115-125.
Zinabu Gebre-Mariam (2002). The Ethiopian Rift Valley lakes: Major threats and strategies for conservation. In: Ethiopian Rift Valley lakes, Tudorancea, C. and Taylor, D.W. (eds.), p. 259-271, Backhuys Publishers, Leiden, The Netherlands.

Animal Production
15th ESAP-Proceedings 119
The breeding saeason and condition factor of oreochromis niloticus (pisces: cichlidae) in lake babogaya, ethiopia
Lemma Abera Hirpo
Zwai Fishery Research Center, P.O.Box 229, Zwai, Ethiopia.; E-mail: [email protected]
Abstract The breeding season and condition factor of Oreochromis niloticus were studied in lake Babogaya from samples collected over 12 months between September 2005 to August 2006 using gillnets of 8 and 10 cm stretched mesh. State of gonad maturation and Gonadosomatic index (GSI) values showed that Oreochromi niloticus in Lake Babogaya breeds all year round with peak activities between April to August. Fulton condition factor (FCF) of the population of the fish was 2.13. Two factor ANOVA indicated a significant seasonal fluctuation (P<0.001) in the condition of both sexes, but not between male and female O.niloticus. Poor body conditions coincided with time of peak breeding activity. The interaction effects of sex and month on Fulton condition factors was not significant.
Key words: Ethiopia, L. Babogaya, Oreochromis niloticus, breeding season and Condition factor
Introduction Providing adequate food for a rapidly increasing human population is one of the greatest
challenges in the world. The problem is particularly acute in countries like Ethiopia where, besides population explosion, natural and man-made calamities have aggravated the problem. In addition to increasing food production from land agriculture, therefore, it is necessary to sustainably exploit the aquatic ecosystems to contribute towards the effort of food security by virtue of their high productivity. Ethiopia’s fish resources could undoubtedly offer one of the solutions to the problem of food shortage in the country. Therefore, it is necessary to sustainably exploit the fish resources.
The country is endowed with sizable amount of lotic (running) and lentic (stagnant water) environments whose fishery potential has not yet been fully realized (Brook Lemma, 1987). The inland water body of the county is estimated at about 7,400 km2 of lake area and about 7000 km total length of rivers (Shibru Tedlla, 1973). From the inland water bodies, crater lakes are well represented in Africa, including Ethiopia (Baxter, 2002). Among these are the Bishoftu crater lakes, which form an extensive series of volcanic explosion craters in the vicinity of the town and harbour a variety of edible fish species.
Generally, The potential fish yield of these water bodies of the country is roughly between 30,000 and 40,000 metric tones per year for the main water bodies alone, and so far only 20% of this is being utilized (FAO, 1995). The most important specie of fish, which are ecologically and economically important and accounting for over 95% of Ethiopia’s fishery, includes Oreochromis niloticus (Tilapia), Clarias gariepinus (Catfish), Barbus species and Lates niloticus (Nile perch), and others (LFDP, 1996 in Zenebe Tadesse, 1998).
The three fish species found in lake Babogaya are O.niloticus, C.gariepinus and Tilapia zilli. They are introduced in the lake by the MOA aiming at enhancing the fishery of the lake. From these species O.niloticus is a case in point to this study. Information on the reproductive biology

Ethiopian Society of Animal Production
120 15th ESAP-Proceedings
of O .niloticus has been reported in the country by several authors (Zenebe Tadesse (1988; 1997), Demeke Admassu (1994; 1996), and Yirgaw Teferi et al. (2001) and Stewart (1988) in Lake Turkana. In all areas for which data are available, the fish breeds continuously throughout the year in the Ethiopian lakes, but the breeding activity is intensive during the periods from December to March in Lake Ziway (Zenebe Tadesse, 1988), January to April and July to September in Lake Awassa (Demeke Admassu, 1994; 1996), April to August (peaking in June and July) in Lake Tana (Zenebe Tadesse, 1997) and from March to June in Lake Chamo (Yirgaw Teferi, (1997). Stewart (1988) also reported that the species in Lake Turkana breeds continuously throughout the year but peak breeding occurs during March to July. The peak breeding activity of the fish in Lakes Awassa and Ziway, according to Demeke Admassu (1994) and Zenebe Tadesse (1988) respectively, appear to be correlated with rainfall, peak in phytoplankton biomass and other associated factors
Since, O .niloticus is fast growing fish it can be cultured to produce large quantity of inexpensive animal protein. In spite of its important very little work has been done on the fishery and the resource is exploited without enough knowledge on the reproductive biology of the fish (Zenebe Tadesse, 1999). Therefore, knowing the information on the reproductive biology of O .niloticus can provide basic knowledge for the proper management of the resource. However, such basic information is non-existent for Lake Babogaya and this has hindered proper management of the fisheries.
Therefore, the major objective of the present study was to generate basic biological information that could help to make proper exploitation and management strategies on the Ethiopian fishery in general and O.niloticus in Lake Babogaya in particular. The specific objectives were to assess breeding season and condition factor of O.niloticus in the Lake.
Description of the study area
Lake Babogaya
Lake Babogaya is one of the volcanic Crater Lake found in the vicinity of Beshoftu town in East Showa (Fig. 1). The Lake is a small, roughly circular and fairly deep lake found at an altitude of 1870 m and at about 90N latitude and 390E longitude (Prosser, et al., 1968; Wood, et al., 1984). Like the other volcanic crater lakes of the area, it is a closed system surrounded by very steep and rocky hills. The vertical distance from the lake's surface to the crater rim is 20 m, and this affords moderate protection from wind (Baxter, 2002) The lake is fed primarily by precipitation falling directly on its surface and run-off from its small catchment area (Prosser et al., 1968), which was formed from volcanic rocks of basalt, rhyolite and tuff (Mohr, 1961). Some morphological, physical and chemical characteristics of the Lake are described in table 1.

Animal Production
15th ESAP-Proceedings 121
Figure 1. Location of Lake Babogaya in relation to the other Bishoftu Crater Lakes (Lamb, 2001)
Table1. Some morphological, physical and chemical characteristics of Lake Babogaya ( bYeshemebet Major, 2006, c Zinabu Gebre-Mariam, 1994, d Prosser et al., 1968)
Parameters Values Latitude 90N and 390Ed Altitude (m) 1870 d Surface area (Km2) 0.58 d Volume (Km3) 0.022 d Maximum depth (m) 71 b Mean depth (m) 38 d Conductivity,K25 ( μscm-1 ) 900c Alkalinity ( meq l-1 ) 10.2b PH 9.2b Salinity (gl-1 ) 0.9b SiO_2 ( meq l-1 ) < .1b Alkalinity (meq l-1) 10.80b Na+ (meq l-1) 5.50b Cl- (meq l-1) 0.90b Sum of cations (meq l-1) 11.7b Sum of anions (meq l-) 11.4b

Ethiopian Society of Animal Production
122 15th ESAP-Proceedings
Mean monthly minimum air temperature ranged from 7.4 to 13.50C, while the maximum mean monthly air temperature varied from 22.8 to 31.5 0C. Monthly total rainfall varied from 2.1 mm of January 2006 to 239.5 mm of July 2006. Surface water temperature was mostly between 220C and 24.50C, while the bottom temperature was almost constant (19.20C-19.40C) (Wood, et al., 1984). Where as, in a very recent study of Yeshemebet Major (2006), the water temperature and dissolved oxygen ranging from 230C to 270C and 7 mg l-1 to 14 mgl-1 respectively.
Materials and methods Field Sampling and measurement
Samples of O.niloticus were collected monthly between September 2005 and August 2006 using gill net. Monthly sampling was done at two different sites of the lake. Site one (Harmeniawian house), is located about 20 meters offshore at a depth of 3 to 12 meters. Site two (ILRI) is 3 meter to 7 meter deep and 10 meter away from the shore and relatively have a dense macrophyte around the shore. Gill net (8 and 10 cm stretched mesh size) of 50 m long each mesh size was set parallel to the vegetation. The gear was set in the afternoon (05:00 pm) and lifted in the following morning (7.00 am). In addition, fish caught by fishermen were also included to obtain a wide range of fish size group and increase the sample size of fish taken monthly. Then immediately after capture, total length (TL) and total weight (TW) of each specimen were measured to the nearest 0.1 cm and 0.1g, respectively and sexes of each specimen were determined by pressing the abdomen and/or dissected the gonads.
Determination of breeding season
The breeding season of O.niloticus was determined from the percentage of fish with mature gonads taken each month. The sexes of all fish and the maturity stages of the gonads were determined. The maturity level of each gonad was determined by visual examination using maturity keys. A five-point maturity scale was used for this purpose (Holden & Raitt, 1974) and all examined maturity stages were recorded. Therefore, the breeding season of O.niloticus was determined based on the frequency of fish with ripe gonads and on Gonadosomatic index (GSI). The GSI for each fish was computed as the weight of the gonads as the percentage of the total body.
GSI = (GW/TW) X100
Where, GW: Gonad weight in gram
TW: Total weight in gram
Determination of condition factor
Condition factor of the fish was determined by computing Fulton’s condition factor as in Bagenal and Tesch (1978), i.e.
FCF = (TW / TL3) X 100
Where, FCF = Fulton’s condition factor
TW = total weight in grams
TL = total length in centimeter

Animal Production
15th ESAP-Proceedings 123
Two ways ANOVA was employed to investigate differences in FCF between sampling months and sexes
and to test the sex by month interaction (Sokal and Rohlf, 1981).
Results Size composition of the Sample
A total of 917 (565 female and 352 male) O.niloticus individuals were caught during the study. The total length of the fish ranged from 4 to 28 cm and the corresponding total weight ranged between 6 and 680 grams for both sexes.
As shown in figure 2, the greater proportion of the sampled fish for both sexes range in size between 14 and 22 cm. The peak being also between 17 and 19 cm for the sexes. This length group alone was about 36% for females and 29% for males. Fish over 23 cm, and below 10 cm TL were least represent in the sample (Fig.2)
0
5
10
15
20
25
30
35
40
5_7 8_10 11_13 14-16 17-19 20-22 23-25 26-28
Total Length (cm)
Num
ber o
f fis
h (%
)
FemalesMales
Figure 2. Length-frequency distribution of O.niloticus in Lake Babogaya
Breeding Season
Mean gonadosomatic index (GSI) ranged from 0.7 – 3.5 for females and from 0.6 - 2.1 for males. GSI values varied highly significantly between sampling periods for both sexes (ANOVA, P < 0.001). Temporal variation in GSI was remarkably similar between males and females (Fig. 3). Thus, there was a biannual cycle in which GSI increased from March peaking in April for female and June for male (Fig. 3). GSI values were lower between October to February.
The cycle in GSI was also reflected in monthly variation in the frequency of fish with ripe gonads (Fig. 3 and 4). The frequency was found to be high between April to August including September for both sexes (Fig. 4) which was coincides with the periods of peak GSI values. In addition, lowest frequency of ripe fishes was recorded at times of lowest GSI values.

Ethiopian Society of Animal Production
124 15th ESAP-Proceedings
0
0.5
1
1.5
2
2.5
3
3.5
4
Sep.2
005
OctNov Dec
Jan.20
06 Feb
Mar Apr
May Ju
n Jul
Aug
Month
Mea
n G
SI
FemaleMale
Figure. 3. Temporal variation in gonadosomatic index (GSI) of O. niloticus from L. Babogaya
0
10
20
30
40
50
60
70
80
Sep.2
005
OctNov Dec
Jan.20
06 Feb
Mar Apr
May Ju
n Jul
Aug
Month
Freq
uenc
y (%
)
FemaleMale
Figure. 4. Temporal variation in frequency (%) of ripe female and male O. niloticus From L. Babogay
Condition Factor
Mean ± S.E. Fulton’s condition factor (FCF) values ranged from 1.97 ± 0.06 in June to 2.39 ± 0.04 in January for females whereas from 1.86 ± 0.01 in July to 2.32 ± 0.04 in December for males. Average FCF (± SE) combined for the sexes were 2.13 ± 0.03; that of females was 2.17 ± 0.02 whereas that of males was 2.11 ± 0.04. FCF varied significantly between sampling months in both sexes (ANOVA, P<0.001).However, sex by month interaction was insignificant (ANOVA, P>0.05

Animal Production
15th ESAP-Proceedings 125
Discussion In O. niloticus, seasonal variation in GSI and the percentage of ripe fish (Fig.3 and 4) were
quite apparent and the pattern was more or less similar in both sexes. Indeed, fish with well developed gonads and ripe eggs were noted almost throughout the year. GSI values and percentage of ripe fish indicated that breeding in O. niloticus was year round peaking from April to August. Zenebe Tadesse (1988) also reported that the related species, O. niloticus in Lake Zwai reproduces continuously throughout the year with a high peak of activity between December and March. The presence of individual breeding fish in Lake Babogaya at all time of the year may be partly attributed to the low seasonal fluctuations in temperature. Lowe-McCconnell (1982) also stated that in the tropics seasonal fluctuations in temperature and photoperiod are generally very low and this might be favorable for species to spawn at any time of the year.
The peak breeding activity of O. niloticus in L. Babogaya was coincident with the rainy season of the area (Fig 3). The role of rainfall in timing reproduction is well documented (Fryer and Iles, 1972; Balarin and Hatton, 1979; Lowe-McConnell, 1987). Rainfall through associated biotic and abiotic factors acts as a cue for tilapia to breed intensively, so that, offspring is produced at times of better growth and survival (Lowe-McConnell, 1982). Thus, rainfall might have the same role in the breeding cycle of O. niloticus in L. Babogaya as well. Run off, for instance, could increase nutrients resulting in increased food availability, and improved quality of food (Jalabert and Zohar, 1982; Zenebe Tadesse, 1988; Demeke Admassu, 1996).
Correlation between rainfall and peak spawning has also been reported for other tilapia populations in Ethiopia (Zenebe Tadesse, 1988; 1997; Demeke Admassu, 1994; 1996; Yirgaw Teferi, 1997) and elsewhere (Fryer and Iles, 1972; Jalabert and Zohar, 1982; Lowe-McConnell, 1982; Stewart, 1988). These authors have variously suggested the above mentioned role of rainfall in O. niloticus breeding. Demeke Admassu (1996), for instance, reported that peak breeding of the fish in L. Awassa is coincident with rainfall and associated increase in phytoplankton biomass. In addition the quality of the available food in the lake is believed to be improving during and immediately after the rains (Getachew Teferra, 1987). Furthermore; zooplankton biomass is likely to improve following those events. Seyoum Mengistou and Fernando (1991) also showed an increase in the zooplankton biomass of L. Awassa during the rainy season.
Condition factor which are used to compare the well-being or fatness of fish are based on the hypothesis that the heavier fish of a given length are in better condition. The pattern of seasonal variation in Fulton condition factor of both sexes in O. niloticus was similar throughout the year. Condition factor of both sexes of O. niloticus in lake Babogaya was significantly different (ANOVA, P<0.001) in the different months. A study done on the related species in Lake Zwai by Zenebe Tadesse (1988) also showed similar result. Numerous authors (LeCren, 1951; Getachew Teferra, 1987; Zenebe Tadesse, 1988; 1997; 1999) agree that such variation could arise due to seasonal fluctuations in environmental factors, food supply and quality, feeding rate, degree of parasitization and reproductive activity. From the present study it was clear that poor body conditions conceded with peak breeding activity. Zenebe Tadesse (1988) also reported for the same species in Lake Zwai. This may indicate that production of sperms in males and eggs in females during breeding season may drain metabolic energy. Also engagement in breeding activity as well as parental care could possibly suppress somatic growth, as the fish devote less time for feeding during the breeding season. In conclusion, in Lake Babogaya O. niloticus breeds
Ethiopian Society of Animal Production
126 15th ESAP-Proceedings
all year round with a high peak of activity between April and August and poor body conditions coincided with peak breeding months.
Acknowledgements I would like to thank the EARTP for financial support and my friends at Lake Babogaya, for
their help in sampling. Also all staff members of Zwai Fishery Research Center are gratefully acknowledged for helping me in many ways. In particular, my friends Abreham (Abrish) G/ Tsadik, Hensene (Mimie) and Ahemed deserve special thanks in solving some personal problems.
References Bagenal, T. B. and Tesch, F.W. (1978). Age and growth. In: Methods for assessment of fish production in
Fresh waters, PP.101-136. Bagenal, T.B. (ed.). Hand book No.3, Blackwell Scientific Publications, Oxford, England..
Balarin, J. D. and Hatton, J. (1979). Tilapia: A guide to their biology and culture in Africa University of Stirling, Scotland, pp. 1-42.
Baxter, R. M. (2002). Lake morphometry and chemistry. In: Ethiopian Rift Valleylakes, Tudorancea, C. and Taylor, W.D. (eds.), pp. 45-60. Backhuys Publishers,Leiden, The Netherlands.
Brook Lemma (1987). The present status and potentials for future development of Inland fisheries in Ethiopia. In: Proceeding of Management of Water and Natural Resource toincrease food production in Africa, IAR, pp. 99-108.
Demeke Admassu (1994). Maturity, Fecundity, Brood size and sex ratio of Tilapia (Oreochromis niloticus L.) in Lake Awassa. SINET: Ethiop. J. Sci. 17(1): 53-96.
Demeke Admassu (1996). The breeding season of tilapia, Oreochromis niloticus L. in Lake Awassa (Ethiopian rift valley). Hydrobiologia 337 :77-83.
FAO (1995). Review of the Fisheries and Aquaculture Sector. Ethiopia. FAO, Rome.
Fryer, G. and Iles, T. D. (1972). The cichlid Fishes of the Great Lakes of Africa: Their Biology and Evolution. Oliver and Boyd, Edinburgh, pp. 6-72.
Getachew Teferra (1987). Food, nutrition and digestive efficiency in Oreochromis niloticus L. (Pisces: Cichlidae) in Lake Awassa, Ethiopia.Unpubl. Ph.D. Dissertation, University of Waterloo, Canada, 109pp.
Holden, M. J. and Raitt, D. F. S. (1974). Manual of fisheries science. Part 2.Methods of resource investigation and their application. FAO. Fish tech. Pap. (115) rev. 1: 214 pp.
Jalabert, B. and Zohar, Y. (1982). Reproductive Physiology of cichlid fishes, with particular reference to Tilapia and Sarotherodon. In: Pullii and Low-McConnell, R.H. (eds). The Biology and culture of Tilapias, pp 129-140, R.S.V. ICLARM Conference proceeding, Philippines, Manila,.
Le Cren, E. D. (1951). The length-weight relationship and seasonal cycle in gonadal Weight and condition in the perch ( Perca fluviatilis). J.Anim. Ecol. 20: 201-219.
Lowe-McConnell, R. H. (1982). Tilapias in fish communities. In: Pullin RSV. and Lowe-

Animal Production
15th ESAP-Proceedings 127
McConnell RH. (ed.). The biology and culture of tilapias, pp 309-31, ICLARM Conference Proceedings 6, Manila, Philippines:
Lowe-McConnell, R. H. (1987). Ecological studies in tropical fish communities.Cambridge University Press, 382 pp.
Mohr, P. A. (1961). The geology, structure and origin of the Bishoftu explosion craters, Shoa, Ethiopia. Bull. Geophys. Obs., Addis Ababa, 2: 65-101.
Seyoum Mengistou and Fernando CH. (1991). Seasonality and abundance of some dominant crustacean Zooplankton in Lake Awassa, a tropical rift valleylake in Ethiopia. Hydrobiologia 266: 137-152.
Sokal, R. R. and Rohlf, F. J. (1981). Biometry. W. H. Freeman and Company, san Francisco Shibru Tedla (1973). Fresh-water Fishes of Ethiopia. Haile Selassie I University Dept. of Biology, Addis Ababa, Ethiopia, 101 pp.
Stewart, K. M. (1988). Changes in condition and maturation of Oreochromis niloticus L. population of Ferguson’s Gulf, Lake Turkana, Kenya. J. Fish Biol. 33: 181-188.
Wood, R. B., Baxter, R. M. and Prosser, V. (1984). Seasonal and comparative aspects of chemical stratification in some tropical crater lakes, Ethiopia. Freshwat. Biol. 14:551- 573.
Yeshimebet Major (2006).Temporal change in the community structure and Photosynthetic production in LakeBabogaya,Ethiopia. M.Sc. thesis. School of Graduate Studies, Addis Ababa University. Addis Ababa.79pp.
Yirgaw Teferi (1997). The condition factor, feeding and reproductive biology of Oreochromis niloticus Linn. (Pisces: Cichlidae) in Lake Chamo, Ethiopia. M.Sc. thesis. School of Graduate Studies, Addis Ababa University. Addis Ababa.79pp.
Yirgaw Teferi, Demeke Admassu and Seyoum Mengistou (2001). Breeding season, maturation, and fecundity of Oreochromis niloticus L. (Pisces: Cichlidae) in Lake Chamo, Ethiopia. SINET: Ethiop. J. Sci. 24(2):255-264.
Zenebe Tadesse (1988). Studies on some aspects of the biology of Oreochromis niloticus L. (Pisces. Cichlidae) in Lake Ziway, Ethiopia. M.Sc. thesis. School of Graduate Studies, Addis Ababa University, Addis Ababa, 78 pp.
Zenebe Tadesse (1997). Breeding season, Fecundity, Length-weight relationship and Condition factor of Oreochromis niloticus L. (Pisces: Cichlidae) in Lake Tana, Ethiopia. SINET Ethiop. J. Sci. 20 (1):31-47.
Zenebe Tadesse (1998). Food and Feeding Ecology of Tilapia, Oreochromis niloticus L. effects of diet on the lipid quality of fish in some Lakes in Ethiopia. Ph.D. dissertation school of Graduate studies, Addis Ababa University, Addis Ababa, 139 pp.
Zenebe Tadesse (1999). The nutritional status and digestibility of Oreochromis niloticus L. diet in Lake Langeno, Ethiopia. Hydrobiologia 416: 976-106.
Zinabu Gebre-Mariam (1994). Long-term changes in indices of chemical and productivity of a group of tropical Ethiopian lakes with differing exposure to human influence. ArchHydrobiologia 132(1):115-125.


Animal Production
15th ESAP-Proceedings 129
Reconnaissance survey on the river fisheries of Benishangul-gumuz regional state
Yared Tigabu1 and Husein Abegaze2
1 National Fisheries and other Living Aquatic Resources Research Center; 2 Ministry of Agriculture
Abstract For a food insecure and low income developing countries like Ethiopia the development of fisheries resources can provide steady flow of nutritious food and household income for the population, particularly the local communities. Despite the substantial benefits, which the fisheries can offer, development of the sub-sector is a recent phenomenon in the country due to lack of proper attention and support given to it. Very recently, the role of fisheries to food security and rural development has been gaining recognition and support. The survey was conducted in Benishangul- Gumuz regional state in 2003. The main objective of the study was to highlight the fishery resource potentials and constraints, on the one hand and identify the needs for research and development interventions, on the other. Second hand and up to date information about water bodies and the current status of aquatic resources of the region has acquired through discussion with resource persons, staff members of bureau of agriculture and other concerned offices and by visited some accessible water bodies. The region has abundant water resources for the development of fisheries. Considering natural resource of the region, it is endowed with large water resource potential. The region lies in Abay and Baro-Akobu basins in which several big perennial rivers and non- perennial rivers flow across it and drain in to either of the two basins. The region's surface water can be grouped in to five sub-basins namely, Didesa, Baro, Dabus, Beles, and main Abay in which the whole surface area of the region is drained. There are extremes of annual fluctuation in water level from severe flood to complete desiccation in dry season. The rivers are rich in fish diversity and commercially important fish species like tilapia, catfish and nile perch are inhabit in the water bodies of the regions. Fishing is practiced mostly by natives of the region for self consumption and local markets. The landing sites are mostly isolated due to absence of roads. The fisheries of the region are unlike the rest of the country, mainly subsistence based on the main rivers and flood plain. Fishing activity is generally traditional, and is based on local made materials. In all of the fishing areas fishermen are not able to increase their catch because of scarcity of modern fishing gears and poor road access to the potential markets.
Key words/phrases: fish resource, perennial rivers, fishing gears, fish handling and preservation
Introduction For a food insecure and low income developing countries like Ethiopia the development of
fisheries resources can provided steady flow of nutritious food and household income for the population, particularly the local communities. However, the sustainability of these socio-economic benefits depends on the presence and adequate implementation of informed fisheries development and management programs.

Ethiopian Society of Animal Production
130 15th ESAP-Proceedings
Despite the substantial benefits, which the fisheries can offer, development of the sub-sector is a recent phenomenon in the country due to lack of proper attention and support given to it. Very recently, the role of fisheries to food security and rural development has been gaining recognition and support.
Taking in to account the limited technical capacity of the region to make assessment of the regional fisheries, the regional bureau of agriculture has requested expertise assistance from ministry of agriculture and national fisheries and other aquatic resources research center. In respond to the technical assistance requested by the region, the task mission is formed and in charged to conduct a field study with the main aim of identifying the technical and economical potentials of fisheries in the region and develop strategies, which enable the regional government to take up the fisheries resources available in the region to the benefits of its population.
Subsistence fishing in the region has been under taking using a wide range of traditional gears, which include spear, hand line, trap, poisonous plant, cast net and different types of scoop net produced from locally available materials. River fishing activity is confined to the shallow littoral areas, which are usually the feeding and breeding grounds for most fish species, suggesting that various fish species of the rivers have been exploited without the biological and ecological knowledge of the fish stocks. Adequate information on the type and diversity of fish for the region is available through the studies conducted by joint Ethio-Russian Biological Expedition (JERBE). Thus, the main aim of the survey was to highlight the fishery resource potentials and constraints, on the one hand and identify the needs for research and development interventions, on the other.
The participation of women with male partners is active in crop production, sowing, animal production and sheep and goat rearing. However, Poultry is considered to be totally the responsibility of women. Fishing is one of the principals of farm activities in which women are engaged. This however differs among ethnic groups. Gumuz women and children in Metekel zone are highly involved in fishing during the dry season, at the shallow margins of the rivers near their homes. Female participation also varies according to ecological and seasonal conditions.
Materials and methods Study area
The Benshangul- Gumuz region is located at 80 45’ latitude north and 340 36’ longitude east and has total area of 80,000sq km. It lies over altitude range of 600 and 2730 m.a.s.l lowest at Kumruk and highest at Belaya Mountain respectively. Rain fall is mono mode and occurs for 6-7 months. It receives an annual average rain fall of about 1000 mm. It is bordered with Sudan in the West, Amhara in the north and northeast, Oromiya in the south and southeast, and Gambella in the South. The region is administered by 3 zones and 20 Woredas (two special Woredas) and has around 20 towns. Metekel zone has the largest of the region’s area. The Blue Nile valley divides the region in to two parts.
Methodology
The survey was conducted in the Benshangul- Gumuz region in 2003. The survey covered all three adminstrative zones (Metkel,Assosa and Kamashi ) of the region. Mainly second hand and up to date information about water bodies and the current status of aquatic resources of the

Animal Production
15th ESAP-Proceedings 131
region has acquired through discussion with resource persons, staff members of bureau of agriculture and other concerned offices and by visited some accessible water bodies.
Results and discussion Water and fish resource
Fish resources are dependent on water resources. The region has abundant surface water resource primarily rivers and streams. Considering natural resource of the region, it is endowed with large water resource potential, both surface and ground water. Except for the smaller tributaries, all the main rivers originate from the highlands of neighboring regions, mainly Oromiya and Amhara. Maximum flooding of rivers occurs in July to September as a result of high run off formation from the catchments. Lowest flow occurs from December to March where many seasonal streams get dry.
Table1. Main rivers of the region
No. Name of Rivers Location zone/Woreda Type 1 Abay in the region Perennial 2 Dabus river Asossa Perennial 3 Didesa river Kamashi Perennial 4 Gilgel beles river Metekel Perennial 5 Beles river Metekel Perennial 6 Sonka river Assosa/Bambese Perennial 7 Bull Negero R. Assosa Perennial 8 Lypapo river Metekel Perennial 9 Selga river Assosa Perennial 10 Suare-Debsa Metekel bullen Perennial 11 Hoha river Assosa Perennial 12 Hardy river Metekel Perennial 13 Budisky river Metekel Perennial 14 Barber river Metekel Perennial 15 Dura river Metekel Perennial 16 Baro river Border of Benshangul & Gambell R Perennial 17 Gambela Asosa Non-perennial 18 Burzy Asosa Non-perennial 19 Ashina Asosa Non-perennial 20 Kuna Asosa Non-perennial 21 Da;e Asosa Non-perennial 22 Ondil Asosa Non-perennial 23 Shanga Asosa Non-perennial 24 Keshimando Asosa Non-perennial 25 Kurbe Asosa Non-perennial 26 Atsejuni Asosa Non-perennial 27 Sonka Asosa Non-perennial 28 Harergana Kamashi Non-perennial 29 Worabu Metekel Non-perennial 30 Chandi(upper) Metekel Non-perennial 31 Gehse Metekel Non-perennial 32 Kila Metekel Non-perennial Source: Ministry of Water Resources, hydrology Department
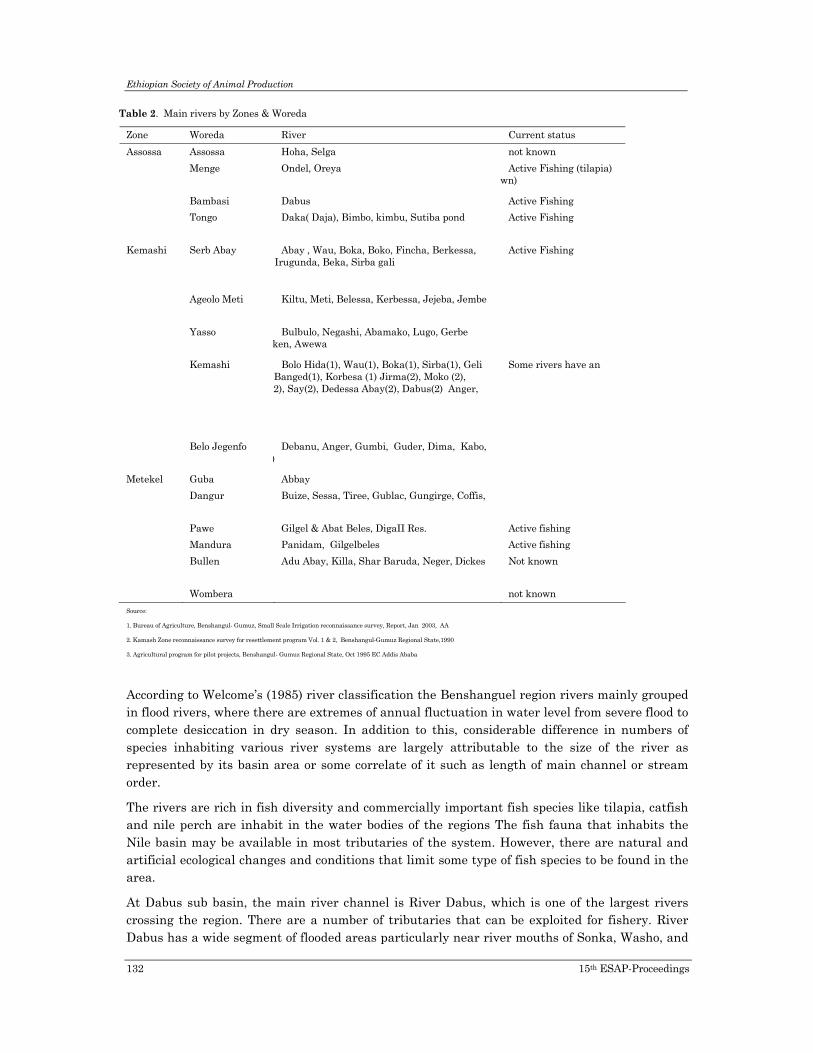
Ethiopian Society of Animal Production
132 15th ESAP-Proceedings
Table 2. Main rivers by Zones & Woreda
Zone Woreda River Current status Assossa Assossa Hoha, Selga not known Menge Ondel, Oreya Active Fishing (tilapia)
wn)
Bambasi Dabus Active Fishing Tongo Daka( Daja), Bimbo, kimbu, Sutiba pond Active Fishing
Kemashi Serb Abay Abay , Wau, Boka, Boko, Fincha, Berkessa, Irugunda, Beka, Sirba gali
Active Fishing
Ageolo Meti Kiltu, Meti, Belessa, Kerbessa, Jejeba, Jembe
Yasso Bulbulo, Negashi, Abamako, Lugo, Gerbe ken, Awewa
Kemashi Bolo Hida(1), Wau(1), Boka(1), Sirba(1), Geli Banged(1), Korbesa (1) Jirma(2), Moko (2), 2), Say(2), Dedessa Abay(2), Dabus(2) Anger,
Some rivers have an
Belo Jegenfo Debanu, Anger, Gumbi, Guder, Dima, Kabo, )
Metekel Guba Abbay Dangur Buize, Sessa, Tiree, Gublac, Gungirge, Coffis,
Pawe Gilgel & Abat Beles, DigaII Res. Active fishing Mandura Panidam, Gilgelbeles Active fishing Bullen Adu Abay, Killa, Shar Baruda, Neger, Dickes Not known
Wombera not known Source:
1. Bureau of Agriculture, Benshangul- Gumuz, Small Scale Irrigation reconnaissance survey, Report, Jan 2003, AA
2. Kamash Zone reconnaissance survey for resettlement program Vol. 1 & 2, Benshangul-Gumuz Regional State,1990
3. Agricultural program for pilot projects, Benshangul- Gumuz Regional State, Oct 1995 EC Addis Ababa
According to Welcome’s (1985) river classification the Benshanguel region rivers mainly grouped in flood rivers, where there are extremes of annual fluctuation in water level from severe flood to complete desiccation in dry season. In addition to this, considerable difference in numbers of species inhabiting various river systems are largely attributable to the size of the river as represented by its basin area or some correlate of it such as length of main channel or stream order.
The rivers are rich in fish diversity and commercially important fish species like tilapia, catfish and nile perch are inhabit in the water bodies of the regions The fish fauna that inhabits the Nile basin may be available in most tributaries of the system. However, there are natural and artificial ecological changes and conditions that limit some type of fish species to be found in the area.
At Dabus sub basin, the main river channel is River Dabus, which is one of the largest rivers crossing the region. There are a number of tributaries that can be exploited for fishery. River Dabus has a wide segment of flooded areas particularly near river mouths of Sonka, Washo, and

Animal Production
15th ESAP-Proceedings 133
Koshm rivers. The Fundure River spreads out around Selama Gebeya creating a suitable environment for fishing to the people in the adjacent villages.
The Beles sub basin covers relatively large area. The main channel of Beles River highly fluctuates its level throughout the year. Some tributaries of the Beles River completely dry out in the dry season. The settlements of the Gumuz Ethnic group are mainly found along the Beles River and its tributary valleys. Types of fish spices in this sub basin are attached in annex1.
The main Abbay is the largest of all the rivers in the region and the main channel of all sub basins (except Baro) drain to the river in Ethiopia. It is fast flow at upper catchments and it gets slow and fairly uniform at low lands that has sandy banks. The lower reaches of the river is likely suitable for rowing boats. A lot of villages appear along the riverbank that belongs to mainly Gumuz people. There are access roads at different parts of main river. Types of fish spices in this sub basin are attached in annex 2.
At Didesa Sub basin the river channel starts from high lands of Oromiya region and it short crosses the Benshangul-Gumuz Region. Two important rivers namely, Anger and Debana are tributaries of it. River Anger is more suitable for fishery relative to others because of its slow flow and fairly uniform channel. Access road is limited to only some areas. Types of fish spices in this sub basin are attached in annex 3.
The main tributary rivers of Baro River are Daka, Bimbo and Kimbu. Fishing activity is high in those rivers. They are located at low lands and their water level is fluctuates greatly in a year. In the dry season a man can cross easily on foot. No access road is available to these catchments.
Mao and Komo are the major ethnic groups in the catchments. The Komo people are active in fisheries. They particularly fish from the above mentioned tributary rivers. The main river channel is Baro, which is sited in Gambella Region. Due to the absence of road access to these areas the team did not manage to visit the sub basin.
The nature of fisheries and existing practice
Fishing is practiced mostly by natives of the region for self consumption and local markets. The landing sites are mostly isolated due to absence of roads. The fisheries of the region are unlike the rest of the country, mainly subsistence based on the main rivers and flood plain. Fishing activity is generally traditional, and is based on local made materials.
The settlement of the community, mainly the Gumuz, follows along the course of the rivers. The Gumuz people in the region have strong tradition of fishing and use fish in their daily diets. The major rain season is June to October. During this time the river level becomes high and fishing is very difficult. So, fishing activity decreases during those months and increases then after. The communities tend to be dynamic with the proportional importance of different activities changing from season to season in response to changing ecological and other circumstantial conditions. Therefore, Fishing tends to intensify as the dry season progresses or it occurs during down turns in agricultural and other activities. The fishermen are using gears locally produced, easily repaired with local parts, and represent a very low capital investment. The fishing gears are diversified but rather primitive.
According to the information we obtained from Tongo Woreda bureau of agriculture experts, there are 400 to 500 family heads (Komo people) that engaged in fishing at Kabo Shumete, Kawa, Yiwa and Tasha Kebeles of that woreda. They produced 22.5 tons of dried fish with in six

Ethiopian Society of Animal Production
134 15th ESAP-Proceedings
months in 2002 from Daka River. Other particular situation in this area is that every part of the riverside is belonged among each family heads. Every family head has a permanent owner ship to his part of the river. Due to little contact between the fisheries officers and the traditional fishing communities there is no clear information about the management system of the fishery resources. There are no access roads to those areas.
In all of the fishing areas fishermen are not able to increase their catch because of scarcity of modern fishing gears and poor road access to the potential markets. The high temperature in the region makes it difficult to handle fresh fish for a longer period of time after catch.
It appears that the potential for the development of riverine fishery is vast. Further more, the fishery sector’s contribution to the local economy seems to be enormous. However, these potentials are now under estimated. The necessary attention has not been given to this sector by concerned and relevant institutions. The neglect starts right from the Bureau of Agriculture. There is no assigned fishery officer in the structure of the regional bureau. There is obvious shortage of trained manpower and budget to make the essential activities.
Fish species
The knowledge of fish species and their distribution is very important for the management of fishery in the region. There are 106 fish species in white Nile and 64 in Blue Nile drainage system of the country (Golubtsov and Mina, 2003). Almost all rivers of the region are connected to the Abay River. Therefore, a large number of species appears in the rivers of the region. According to the local people information, only a few species dominate in the catch around the year. According to the results of the joint Ethio-Russian biological expedition team’s taxonomical survey (JERBE report 1992, 1996 and 2000) twenty-five species were registered from the Beles River. Similar survey on the Abbay, Dedessa and Dabus Rivers identified twenty-six, eight and seven fish species respectively. The differences in numbers of species inhabiting various river systems are largely attributable to the size of the river as represented by its basin area.
Due to the lack of catch data it is difficult to know the catch composition in the catch. Different local names are given for the same species at different locality. It is the result of different ethnic people speaks different language. However, according to the list of different field reports 53 fish species are so far identified in the water bodies of the region at different time. The most common species are not more than 25.
Fishing Gears and capture method
A number of traditional fishing methods and gears are practiced in the region, some of these are:
1. Scoop net or Reed sieves
Its local name is “Yeha”. It is manufactured from locally available plant, (Temenay tree in Amharic) by twisting and making 0.5 to 2 cm mesh size shallow scoop nets. The fishermen use this gear in the shallow riverbanks to catch small size fish. They build a fence over the river with a small opening and continuously place the scoop net in front of the opening and scoop up the fish. They use different size scoop nets, and the effectiveness of the gear depends on its size. Due to its easy handling the gear often used by women and children. It should be noted that,

Animal Production
15th ESAP-Proceedings 135
this is the second Ethiopian fishery (next to Gambella region) where men and women alike are involved in fishing activities. There are two types of such gear, with and without handle.
2. Cast nets
The net is cast over fish and catches them by closing on them as it is with drawn. Its use is normally limited to shallow waters. These nets are cast by hand only. The nets are cast from shore, in waist-deep water or from rocks. Some practice is needed for handling this gear effectively. Casting calls for perfectly coordinated movements of body, legs and arms. They made the net entirely by hand from plant fibers by twisting and rarely from twines that extracted from car tyre.
3. Spears
The spear is used to spear the fish after the fishermen have spotted it. They used two different type of metal spears for hunting and fish. Their designs are different to suit the targets. The spear has a length of 1-2m, of which 20-40cm is the sharp point.
4. Hook
This is a simplest form of fishing which requires only a line and a baited hook. The line is cast in to the water where the fish supposedly are, the fish take the bait and are hauled in. Hook and line fishing is inexpensive and easy. Almost any shoreline can be used and the catch is live and of high quality. The hook is baited with the preferred bait.
5. Stupefacient or poison plants
The group informed that the fishermen uses naturally occurring poison plants to catch fish deadly or unconscious. It is one of traditional method widely used for fishing. The poison is prepared from crushed bark locally known as Genor.
6. Traps
Its local name is “Gambudi”. It is made of bamboo and it has a shape like hives (basket type). They use different sizes of traps. Farmers used a bunch or cluster of sorghum for attraction fish but most of them use non-baited.
Management of fishery
The current exercise of traditional fish resources management system in the region is not clear. However, practical tenure already exercised at river banks Daka by community members. It is highly important to examine their community based fisheries management system.
Unless fisheries management established, there is no sustainable fish resource in river system. There are two different but complementary approaches to the management of fisheries. The first one is reactive. Following on a problem, which arose, a remedy measure is taken. The second approach is active, in the sense that targets are set policies implemented to try to achieve them. The latter approach requires a much better understanding of the process affecting the fisheries. The detail information should be gathered from scratch. Managing fisheries means, to a large extent, managing the commercial fisheries. Therefore information on the relation between catch & effort, fishing methods, size and catch composition are necessary to be collected.

Ethiopian Society of Animal Production
136 15th ESAP-Proceedings
Fish production and utilization
Despite the absence of necessary data, it is difficult to indicate the degree of utilization. However, from people daily activity and tradition it may judged that fish is highly considerable resources. It is known seasonal fishing is done along every river and streams where fishes are exist. Therefore, we can conclude that significant amount of fish is caught and utilized among rural people.
A substantial portion of the fishery catch is sold in fresh and dried form. Fresh fish is retailed at village and landing sites directly to consumers (mainly farmers). Market of fish in gutted or prepared form is very rare. Sun dried fish prepared in most rudimentary fashion, traditionally and low input cost.
Handling of fresh fish
The fish handling system in the region is traditional and unhygienic. After the catch (from most of the water bodies) the fishermen have to walk by average for 2- 6 hours to the nearest traditional market6, carrying fish in sacks on the back of donkeys, in order to bring their catch to the traditional market, as there is no road access to the river side. Considering in to account the time needed until the fish is ready for cook in the hands of the consumer the fish stays for a longer time with out any means of preservation in the hot climate of the region. At this condition post harvest losses of fish occur during the numerous steps from catch to market.
Drying
Sun drying is common in all parts of the region. Preparation of fish for drying is slightly differ from place to place. Fish is filleted, cut into large strips and hung up to dry on strings for three or four days. Due to high atmospheric humidity in the region, the dried fish become moist and exposed for insect infestation. The major constraints of dried fish are easily infested by insects and produce bad smell due to the oxidation of fats that is not appeal to consumers.
According to the Bambasi Woreda livestock expert explanation, the so-called Nigerians or Felatas settled along Dabus River about four years ago (It is believed they came from Nigeria), have highly skilled on fishing and fish handling techniques. The supply of fresh fish to the Bambasi town is increased after they settled in Bambasi woreda. This group also used salt for fish preservation. They mix salt and whole fish in the polypropylene sack and stir it to make fair distribution of salt on fish.
Smoking7
Smoking is another preservation technique that is used to prepare fish products with long storage lives. Preservation is achieved by a combination of drying and deposition of chemicals that are contained in the smoke of burning wood.
In the region, traditional smoking operation has done rarely and causally in some ethnic groups. They hung up the fish around the roof to dry and smoked for long time. Smoke of the burning
6
all items bartered local market that appears 1-2 times per week 7
The current fish smoking activity is practiced at Bgole Kebele in Sirba Abbay Woreda

Animal Production
15th ESAP-Proceedings 137
woods, (which is used for cooking) made the fish smoked and dried through times. They do not use specialized oven for smoking purpose.
Fish marketing
In some places, fish in excess of the daily in take subjected to curing through drying. The native people, except Metekel zone at Abbay tributary rivers, are generally accustomed to sale fish, as an alternative source of cash income. They never lack market out let for their fresh and dried fish products in local markets. Fresh fish frequently appears on traditional market that near to the resources. In addition to this, it is common selling fresh fish at the village for neighboring peoples.
Fish market in the region is readily and potentially available. For the region people where supply of livestock products are short or unaffordable, fish is the cheapest and nutritious sources of food. For those who fish for sell, fish is the quickest source of cash income. This is where the role of fishery in food security manifests. The fish prices are different from place to place.
Opportunities and constraints Opportunities
The most important opportunities for fisheries development in the region arise from the considerable potential for further exploitation of resources, combined with a growing demand for fish products. The opportunity for development is further enhanced by the rapid response of fishermen to increase production (assuming certain conditions are met) as well as by a favorable economic environment for the development of private sector initiative within the frame work of the newly introduced market based economic policy.
Real opportunities are identified as follows:
• The availability of large water bodies and untapped fish stocks, which are of commercial importance,
• Existing and growing demand for fish and fish products. • The comparative advantage of fish as cheap and nutritious food,
• Alternative sources of household cash income for fishery operators,
• Alternative source of food during food deficit seasons for rural people. • Favorable economic environment for small scale private industries
Constraints
Despite the above opportunities for sectoral development in the region, multiple constraints are existing. Major constraints are identified as follows:
• Lack of research outputs (and limited expertise) and extension support to river fishery in general. • Low level of fishing technology and organization. • Lack of onshore infrastructure such as landing facilities and access road.
• Under-development of the fish marketing system. • General lack of information on the, socio economic and fish stock

Ethiopian Society of Animal Production
138 15th ESAP-Proceedings
• Insufficient knowledge of the techniques of fish handling and preparation for sale or consumption.
Proposed Interventions Followings are suggested priority interventions, which identifies the main fishery waters and
the mechanisms for transforming their fisheries from subsistence to (small-scale) market oriented system.
Prioritized fishery waters
Depending on the larger sizes the fishery resource available and their values and contribution to local and regional socio-economic development seven main fishery water bodies are identified as a priority area for research and development interventions. These main fishery water bodies are: Abay, Dabus, Dedessa, Anger, Daka and Beles (Abat and Gilgel).
Research intervention
Developing a modern fishery should essentially start with assessment of the resource. Fisheries researchers contribute to fisheries science in two main areas; first by studying the basic biology and distribution of resource species, and second, by studying the population dynamics of the species.
The aim of fisheries assessment is to establish the status of a resource and to determine the levels at which it may be sustainably exploited. Fishery resource surveys should be carefully designed to collect data over a broad area. Estimates of the expected catch rates, the level of exploitation at which catches are sustainable, and price and cost information, are the basic parameters which allow a reasoned judgment on whether or not a potential fishery is likely to be biologically and economically viable.
In general, the research should be answering the following major biological and socio-economical questions;
• What commercially important species are available?
• What are likely catch rates?
• Which fishing gear is appropriate? • What is potential sustainable yield? • What is appropriate level of fishing effort?
• What are practical management strategies? • How acceptable is the product? • How can the product be handled?
• What markets exist for the product?
• What fishing costs are involved? • What are likely returns to fisheries?
Animal Production
15th ESAP-Proceedings 139
In order to provide answers to the questions raised above, several different types of information are
required from fisheries surveys. These include data on species composition, distribution and abundance
data, environmental data, socio-economic and financial information.
Development interventions
An information on social, economic, physical and biological status, current utilization, rate of consumption between different groups etc., are the basic data for fishery development. Therefore, it is a particular urgent exploring for determination of development options for river fisheries. This initial step will have the following immediate objective:
• To identify resource potentials in rivers and improve fish handling, preservation and fishing techniques.
• To carry out frame surveys to analyze the socio-economic factors influencing the development of river fisheries.
• Identify development opportunity for management options for each river fishery and formulate integrated development projects as deemed necessary.
Development intervention involves measures to wards increasing and improving fish production and consumption in the region.
Specifically, these include:
• Facilitation of gear supplies, • Arrangements for easy access to credit,
• Support to formation of fishermen association,
• Capacity building through training, • Provision of basic infrastructure, • Encouragement of enterpreneurship in fish trade, and
• Launching fish consumption promotion.
Conclusion The study team concluded that the region has enough water resources which, can be
developed for their fisheries to small-scale commercial level. Because all the landed fish will be consumed by the local communities the contribution of fisheries to filling food shortage in some area and improving the diets of the people is significant. It generates cash income to those who will be engaged in catching and fish distribution. However, the development of the regional fisheries constrained by technical, socio-economic and institutional factors. Therefore, the team advised the regional government to pay greater attention to make use of their readily available fish stocks through following and implementing the above-suggested interventions. Should the suggestions be implemented the regional government can take the initiative and the lead whilst the federal research and development institution may collaborate.
Recommendation • Identifying the fish resource potential of the water bodies

Ethiopian Society of Animal Production
140 15th ESAP-Proceedings
• Improve fishing gear and method of fishing
• Introduce proper fish utilization, preservation and processing techniques • Start effective extension and training program to fishermen • Give the necessary attention to the sector
• Organize and support fisheries cooperatives
Fish species identification Annex 1. Beles River, a tributary of the Blue Nile System
C. 25 km SE Mankush (formerly Guba); 110 7’N 350 24’30’’E; Date of sampling 04/12/2000;
Identification by JERBE
1. Mormyrops anguilloides (Linnaeus, 1758) 2. Mormyrus cashive (Linnaeus, 1758) 3. M. hasselquistii (Valenciennes, 1846) 4. M. kannume (Forskal, 1775) 5. Brycinus macrolepidotus (Valenciennes, 1849) 6. Micralestes acutidens (Peters, 1852) 7. Distichodus engycephalus (Gunther, 1864) 8. Barbus large sp 9. Barbus small sp 10. Chelaethiops bibie (de Joannis, 1835) 11. Gara sp 12. ? Leptocypris niloticus (de Joannis, 1835) 13. Lebeo coubie (Ruppell, 1832) 14. ? L. cylindricus (Peters, 1852) 15. L. forskalii (Ruooell, 1835) 16. L. horie (Heckel, 1846) 17. L. niloticus (Forskal, 1775) 18. Bagrus bajad (Forskal, 1775) 19. B. Docmak (Forskal,1775) 20. Schibe mystus (Linnaeus, 1758) 21. Chiloglanis sp 22. Synodontis schall (Bloch & Schneider, 1801) 23. S. serratus (Ruppell, 1829) 24. Oreochromis niloticus (Linnaeus, 1758) 25. Tetraodon lineatus (Linnaeus, 1758)
Annex 2. Blue Nile at Bamasa
c. 35 km SWW Mankush (Formerly Guba) 11014’N 34059’E Date of sampling 07-11/12/2000 Identification by JEBRE

Animal Production
15th ESAP-Proceedings 141
1. Mormyrops anguilloides (Linnaeus, 1758) 2. Mormyrus cashive (Linnaeus, 1758) 3. M. hasselquistii (Valenciennes, 1846) 4. M. kannume (Forskal, 1775) 5. Pollimyrus petherici (Boulenger, 1898) 6. Alestes sp 7. Brycinus macrolepdotis (Valenciennes, 1852) 8. B. nurse (Ruppell, 1832) 9. Hydrocynus forskalii (Cuvier, 1819) 10. Micralestes acutidens (Peters, 1852) 11. Nannocharax sp 12. Barbus sp 13. Garra sp 14. ? Leptocypris niloticus (de Joannis, 1835) 15. Labeo coubie (Ruppell, 1832) 16. ? L. cylindricus (Peters, 1852) 17. L. niloticus (Forsskal, 1775) 18. B. docmak (Forsskal, 1775) 19. Schibe mystus (Linnaeus, 1758) 20. S. uranoscopus (Ruppell, 1832) 21. Synodontis frontosus (Vaillant, 1895) 22. S. Schal (Bolch & Schneider, 1801) 23. S. serrantus (Ruppell, 1829) 24. S. sorex (Gunther, 1864) 25. Oreochromis niloticus (Linnaeus, 1758)
Annex 3. Didesa Sub basin
Pollimyrus isidori (Valenciennes, 1846) Alestes macrolepidotus (Valenciennes, 1849) Barbus intermedius (Ruppel, 1837) Raiamas ipati(Boulenger, 1901) Labeo forskalli (Ruppel, 1835) L. cylindricus (Peters, 1852) Varicorhinus beso (Ruppel, 1839) Garra quadrimaculata (Ruppel, 1836) G. cf.dembeensis (Ruppel, 1836) Neomacheilus abyssinicus (Boulenger, 1902) Bagrus docmak (Forasskal, 1775) Oreochromis niloticus (Linne, 1758)

Ethiopian Society of Animal Production
142 15th ESAP-Proceedings
References Agricultural program for pilot projects, Benshangul-Gumuz
Bureau of Agriculture, Benshangul-Gumuz, small scale irrigation reconnaissance survey report, Jan 2003 Addis Ababa.
Golubtsov, A.S and Mina M.V. 2003. Fish species diversity in the main drainge systems of Ethiopia: Current state of knowledge and research perspectives. Ethiopian Journal of Natural Resources 5(2):281-318.
Joint-Russian Biological Expedition (JERBE), 1992, 1996. And 2000 field report
Kamash zone reconnaissance survey for resettlment program volume 1 and 2, Benshangul-Gumuz
Ministry of water resources, hydrology department, 1999, Addis Ababa.
Welcome, R.L. (1985) River fisheries. FAO Fisheries Technical Paper No.262

Animal Production
15th ESAP-Proceedings 143
Kinds and levels of post harvest losses and the possible ways to reduce the losses in Lake Ziway
Yared Tigabu1 Abera Degbasa 2 and Ahmed Mohammed 2
1 National Fishery and other Living Aquatic Resources research Center, PO.box 64, Sebeta; 2 Ziway Fishery Resources Research Center.
Abstract The survey was conducted to determine and measure the kinds and extent of losses and to propose the required actions to prevent post harvest losses in Lake Ziway. In Ethiopia there are significant post harvest losses due to different reasons but no one has assessed these losses. The loss assessment was carried out by adopting the methodology of wood C.D. (1985) by measuring flow of fish through the system. Direct weight measurement of the catch was performed quickly with a simple balance at landing site. The total catch of the fish by species and the total discarded (due to spoilage, size, lack of market, etc) was measured. The study was conducted between January 2004 and December 2005. From estimated 450.50 ton total tilapia (in this context tilapia refers to Oreochromis niloticus and zilli species) catch with in 24 months the total post harvest loss constitute 68.34 tons (15.17 %), of which 48.68 ton (10.81%) of tilapia was discarded due to size discrimination and 19.66 tons (4.36%) was discarded due to spoilage. From estimated 370.69 tons of catfish species (Clarias gariepinus) catch, the post harvest losses were 53.05 tons (14.31%), of which 21.82 tons (5.9%) due to size discrimination and 31.23 tons (8.4%) discarded due to spoilage. Where as out of the total estimated 84.9 tons of carp species (Carassius carasus) only 0.85 ton (1 %) and 2.89 ton (3.4%) was discarded due to size discrimination and spoilage, respectively. From the total 11 species inhabit in the lake only 4 are commercially important. The other 7 species are not utilized and considered as a by-catch when they appear in the catch. The main reasons for post harvest losses are the non-selective character of the gears, inadequate handling facilities and delay between catch, collection and distribution, absence of regulations governing quality and standards of fish to be sold for human consumption, lack of regular supervision from the government side and poor extension service and fragmentation of duties and responsibilities in different institution.
Key words/phrases: post harvest losses, tilapia, catfish, carp, spoilage, size discard, fishing gears, fish handling.
Introduction Post harvest losses in fisheries include material losses of fish due to spoilage, breakage, size,
discarding by catch and operational losses. There are also losses of value, what the fish is worth in monetary terms, losses of quality, when stale fish becomes less attractive to consumers, losses in nutritional value, when the fish contribute less towards the diet of consumer than it did (Geoftrey R., 1990).
A recent estimate of total world post harvest loss is between 17.9 and 39.5 million ton (average 27 mil) per year (Alverson et.al., 1994), this means in average about 30% of the total world catches. Losses in African countries are as much as 40% of the annual catch (FAO, 1989). Losses occur as a result of flaws in the handling, storage, distribution and processing of fish and in

Ethiopian Society of Animal Production
144 15th ESAP-Proceedings
marketing techniques. The study of losses should be done on a case by case basis, and is a key step for improvement (Alverson et.al., 1994). The important issue is how to reduce them to make more food available and, to raise income of the fishing communities.
In Ethiopia there are significant post harvest losses due to different reasons but no one has assessed these losses. The present rate of exploitation ranged 30 to 40% of the over all potential (LFDP, 1996), there is a room for expansion, but in major rift valley lakes like Ziway, Awassa and Chamo there is a sign of over exploitation. The only way to develop fishery in those areas is by proper utilization of the catch. There is no room for further expansion of fishery, but by reducing post harvest losses at all stages of fish handling we can increase the amount of fish which reach to consumers.
The need for assessment is a first step towards over coming losses and defining solutions to the existing problem. The final stage is to describe means of reducing losses. We must know what kind of losses occur, and when, if we are to under stand what processing systems need to be improved and in what respect careful studies of losses could indicate where improvements are most needed and what should be changed. The code of conduct Article II (FAO, 1998) stated that member states should adopt appropriate measures to ensure the right of consumers to safe, wholesome and unadulterated fish and fishery products. The findings of this study can be used as the base for formulation of quality assurance system in the country.
Lake specific studies are needed to provide more precise information on the losses during the various stages of fish production (capture to marketing). The information could help to reduce post harvest losses while increasing fish (protein) consumption with out increasing the catch.
The main objective of the study was to identify and measure the kinds and extent of losses and to propose the required actions to prevent it.
Material and Methods The study area
Lake Ziway is the most northerly rift valley lake. It is located between 7051' N to 80 07' N and 38043' E to 38057' E at an altitude of 1840 m. Lake ziway has an open water area of 434 km2 and the third biggest of the rift valley lakes (after Abaya and Chamo). It has a maximum length of 32 km and a maximum width of 18km. It is a shallow lake having a mean depth of 2.5m and maximum depth 7m (Van den bossche and Bernacsek, 1991). The Lake is fed by two major rivers, i.e. ketar and Meki River, and has one out flow in the south, the bulbula river which flow in to Lake Abiyata.
Methodology
The loss assessment was carried out adopting the methodology of wood C.D. (1985) by measuring flow of fish through the system (assessment format is developed). Direct weight measurement of the catch was performed quickly with a simple balance at landing site. The total catch of the fish by species, the total discarded (due to spoilage, size, lack of market, etc) amount of fish was measured. The appearance, texture and odour of the fish was assessed by Howgate (1994) sensory evaluation of fish freshness.

Animal Production
15th ESAP-Proceedings 145
From the discarded fish due to spoilage, sings of spoilage, off odours, slime formation, gas formation, discoloration and change of texture was assessed visually by Huss (1994) sensory method to identify cause of spoilage. From processed product (gutted and filleted) the obtained yield was measured at the landing site. The data collection sites were Batu (Ziway batu fisher man community), Tulugudo (Islanders fishermen community) and Meki (gebrial-Abosa fishermen community). Data were collected every week from representative landing site. The study was conducted between January 2004 and December 2005.
Total monthly catch was calculated using the formula:
Sum of sampling day catch x monthly fishing days Number of sampling days
Monthly discard was determined by
Sum of sample days discard x monthly fishing days Number of sampling days
Percent spoilage calculated:
Total wt. of spoilage x 100 Total weight of catch
The operational yield was determined by:
Whole weight of fish-operational discard
Other information on the over all fishery activity was obtained through observation and discussion with fishermen, traders and fishery experts.
Results and discussion From the total 11 species inhabit in the lake, only 4 are commercially important but the rest
are considered as a by-catch and through away when they appear in the catch.
From estimated 450.50 ton total tilapia (in this context tilapia refers to Oreochromis niloticus and zilli species) catch with in 24 months, the total post harvest loss constitute 68.34 tons (15.17 %) of which 48.68 ton (10.81%) of tilapia was discarded due to size discrimination and 19.66 tons (4.36%) was discarded due to spoilage. From estimated 370.69 tons of catfish species (Clarias gariepinus) catch, the post harvest losses were 53.05 tons (14.31%), of which 21.82 tons (5.9%) due to size discrimination and 31.23 tons (8.4%) discarded due to spoilage. Where as out of the total estimated 84.9 tons of carp species (Carassius carasus) only 0.85 ton (1 %) and 2.89 ton (3.4%) was discarded due to size discrimination and spoilage, respectively.
The fishermen uses four types of gears: beach seine, gill net, long line and hook and line. The main reason for discarding fish due to size is the non-selective character of the beach seine gear. Beach seine and gill net are used to catch all fish species while long line is used to catch only catfish and hook and line used to catch only tilapia.
The beach seines used in Lake Ziway fishery are different from Lake Koka and Langano. The wings have a length of up to 200 meters each, stretched mesh sizes less than 6 cm. and a height of around 3 meters. The sack (cod end) is up to 8 m. long and has a mesh size less than 5 cm. The

Ethiopian Society of Animal Production
146 15th ESAP-Proceedings
net is produced locally from imported white nylon twine with a standard twine size of 210/12 and 210/15. Due to the small size of the mesh this gear is not selective and can harvest all size of fish including very small size fish, which has no market at landing sites. The permitted mesh size of the gear is 8 cm. The number of beach seine in the lake is estimated to be 207 and contributed the bulk of the catch (Yared, 2003). The existing gillnet which is made up of 210/1 and 210/2 twine size and small size hook (shank length less than 30 cm) on long line are not appropriate gear for cat fish harvesting. As the fish caught by these gears, the fish kicks or tramples and decompose easily, due to depletion of glycogen. Less glycogen means less lactic acid production and hence short life of fish (H.H.Huss, 1994)
Immediately after the catch, a complicated series of chemical and bacterial changes begin to take place within the fish. If these changes are not controlled, the fish quickly become spoiled due to bacterial contamination and autolysis (Huss, 1994). The main reasons for spoilage in the area are: in adequate handling facilities and delay between catch, collection and distribution. The fishermen uses planked canoes for beach seining and reed crafts for gillnetting and long line. The fish are exposed to direct sun and wind. The hygiene of the boats are also poor. On landing sites the fish are dumped on the ground where they are sold to buyers. At no stage in this chain the fish is protected from direct sun and wind. There is no proper fish handling and preserving facilities both on boat and landing sites.
Long fishing and staying time and the time lapse between capture and arrival at landing sites is very long (an average 2-4 hours) with out any efficient cold chain system. Gill net and long line fishermen come to fishing grounds in the morning to set their gears and return the following morning to collect their catch (24 hours fishing time). Beach seines are deployed in the after noon and the catches are collected and brought to the landing site in the morning. Research finding in Lake Kariba show that an average of 35% by weight of the total catch spoils due to bacterial attack and autolysis if nets are set for more than 13 hours in tropical climate with out cooling (Mulambozi, 1990). There are no regulations governing quality and standards of fish to be sold for human consumption. This is evidence at landing sites where the quality of fish is mixed. In extreme cases spoiled fishes are also sold in the landing sites. Otherwise the amount of spoiled fish could have been greater than that of mentioned above. There is no regular supervision from the government side and the extension service (awareness creation, training, follow up etc) is very poor. The lack of serious demand for good quality fish tends to encourage carelessness of the fishermen and processors. Quality assessment of the fish used only organoleptically and the trader relies on his own sensory judgment and on trust on the fishermen as there is no government inspection service body.
The sharp decrease in the amount of post harvest losses due to spoilage in catfish catch from 11.8 % from the total catch of catfish in 2004 (table 1) to 3.6% in 2005 (table 2) was due to the reduction of gill net and long line fishery in the lake. Gill net and long line have 24 hours fishing time, which will create favorable condition for bacterial attack and autolysis. The production of catfish was exceeding that of tilapia since 2000 due to introduction of long line gear (Yared, 2003) but in 2005 (table 2) the total tilapia production was higher than the catfish catch. The main reason for the reduction of catfish production is over fishing, according to Yared, 2003 for the last five years thousands of hooks on long line were deployed in the lake. In 2005 as the catch of catfish dropped, the numbers of long line fishermen decreased and as a result post harvest losses due to spoilage reduced. The average size of catfish in the catch was decreasing in 2005 and as a result the discarded amount of fish due to size is greater in 2005 (6.9 % from the total catch of catfish), in 2004 spoilage constituted only 3.6 % from the total catch of catfish.

Animal Production
15th ESAP-Proceedings 147
The post harvest loss increases as the catch increases. This is during fasting seasons where the demand for fish are high and the fishermen increases fishing effort with out changing fish handling mechanism. The ambient temperature during the main fasting season March to May is high and this also attributed for high spoilage rate.
Table 1.Estimated total catch and post harvest losses (due to size and spoilage) in ton by 2004
Month Tilapia Cat fish Carp Catc Siz Spoil Catc Siz Spoil Cat Siz Spoil
January 15.6 2.5 0.60 14.0 0.7 1.81 6.3 0 0.02
Februar 16.6 2.8 1.25 26.1 1.0 3.54 2.9 0 0
March 24.6 4.1 1.80 39.6 1.3 4.15 6.6 0.0 0.50
April 19.8 2.7 0.50 9.45 0.9 1.05 8.4 0.0 0.65
May 9.12 0.9 0.23 11.0 0.3 1.25 8.8 0.0 0.30
June 4.17 0.6 0.11 2.61 0.0 0.10 0.7 0 0
July 1.95 0.1 0.06 7.68 0.2 0.55 3.3 0 0
August 35.4 5.7 3.15 37.6 2.8 5.12 19. 0.0 1.15
Septem 8.73 0.9 0.15 16.2 0.5 1.15 1.8 0 0
October 4.26 0.6 0.07 43.8 2.8 6.30 0.8 0 0
Novemb 14.5 1.4 0.50 8.30 0.4 0.52 0.8 0 0
Decemb 23.8 3.5 1.70 2.87 0.2 0.25 1.1 0 0.01
Total 178. 26. 10.12 219. 11. 25.79 61. 0.1 2.63
% 100 14. 5.7 100 100 11.8 100 0.2 4.3
Table 2..Estimated total catch and post harvest losses (due to size and spoilage) in ton by 2005
Month Tilapia Cat fish Carp Catc Size Spoil Catc Siz Spoil Cat Siz Spoil
Janua 16.95 1.20 0.70 11.9 0.6 0.30 13. 0.6 0.20
Febru 28.19 2.80 1.60 23.8 1.4 0.80 1.2 0.0 0.01
March 112.8 7.50 3.40 18.3 0.9 0.60 0.6 0 0
April 25.35 1.65 0.85 14.3 0.8 0.31 0.4 0 0
May 10.55 0.90 0.51 6.42 0.2 0.28 0.2 0 0
June 8.50 0.60 0.30 10.2 0.8 0.25 0.3 0 0
July 3.20 0.20 0.08 5.10 0.3 0.10 1.5 0 0.03

Ethiopian Society of Animal Production
148 15th ESAP-Proceedings
Augus 26.12 3.90 1.15 31.5 3.7 1.90 4.5 0.0 0.02
Septe 10.80 0.90 0.15 7.40 0.4 0.30 0.3 0 0
Octobe 12.96 1.56 0.43 11.2 0.5 0.30 0.4 0 0
Nove 4.80 0.12 0.02 3.40 0.1 0.10 0.2 0 0
Decem 11.55 1.25 0.35 7.60 0.4 0.20 0.3 0 0
Total 271.7 22.58 9.54 151. 10. 5.44 23. 0.7 0.26
% 100 8.3 3.5 100 6.9 3.6 100 3.1 1.1
The fish production and marketing enterprise (FPME) at Ziway branch with its facilities such as cold store, processing table and good quality inspection system is a far better position in keeping the proper hygienic standard of fish until it reaches the consumers. The enterprise fish collectors discards up to 20% of fish due to size and spoilage at fish collection sites (personal communications). Most of the private traders are not selective like FPME fish collectors they buy small size and poor quality fish. As there is no quality control system in the fish trade the private fish traders relies on their sensory judgement and trust on the fishermen.
At the landing site the fish is processed on the ground and stones are used as processing table. The yields of each operation in FPME plant and at landing sites are different.
Table 3: Yield by operation
Product type FPME Yield (%)
Landing site Yield (%)
Tilapia fillet 29-32 25-28 “ gutted 37-40 32-37 Catfish fillet 78-80 74-78 Cr.carp fillet 82-86 78-82
The difference of the yield came due to size of the fish as FPME processed relatively larger size fish, skill of the worker and working facility. A study on fish yield by (Montaner et.al., 1994) also shown that the yield varies according to the quality of raw material, the training of the worker, size of the fish and working material and facilities.
Conclusion Fish, being an extremely perishable foodstuff, needs careful treatment in handling and
processing both from public health aspects and improvement of the welfare of fishing communities. The main reasons for post harvest losses are the non-selective character of the gears, inadequate handling facilities and delay between catch, collection and distribution, absence of regulations governing quality and standards of fish to be sold for human consumption, lack of regular supervision from the government side and poor extension service and fragmentation of duties and responsibilities in different institution.
Although the extent of the problem varied from place to place, the country as a whole is losing significant amount of fish annually through post harvest losses. This is a massive economic and nutritional waste, which a country like Ethiopia already in danger of protein malnutrition could

Animal Production
15th ESAP-Proceedings 149
ill afford. The improvement of facilities from the point of production until it reaches the consumer is vital.
Recommendation: 1. To improve fishing gear and method of fishing
• Increase the mesh size of the gears. • Shorting the fishing time
• Introduce appropriate twine size & hanging ratio and hook size for catfish harvesting.
• Up grading the boat condition (shade, sanitary etc.)
2- Maintaining the fish at low temperature
To minimize spoilage, fish should be kept as cool as possible immediately after catching until processing starts. If the fish are chilled with ice it can keep in an edible condition for an increased period. How ever, as ice is not available in that area fish can be kept cool by other means, including the following.
• Keeping the fish in the shade out of direct sun.
• Placing damp sacking over the fish. This helps to reduce the temperature as the water evaporates. The sacking must be kept wet and the fish must be well ventilated.
• Mixing the fish with wet grass, leaves or wet weeds, so that the water can evaporate and cool the fish.
3. Maintaining a hygienic environment
• Keep the fish as clean as possible and avoid damaging fish by careless handling • Keep all tools (gear, boat etc.) clean • Keep the fish in containers and off the ground, filleting and gutting must be carried out on table.
• Clean the fish working area regularly and prevent fish offal from being contact with clean fish.
4. Start applying quality control practice in fishery sector by adopting regulations governing quality and standards of fish to be sold to consumers. The concept of quality and quality assurance is poorly understood among fishermen, traders and consumers.
5. Introduce proper fish utilization, preservation and processing techniques and start effective training program for fishermen and trader on proper fish handling, processing and storing techniques. The training should be carried out a steady pace and in a repetitive manner.
6. Make compatible duties and responsibilities of different institutions.
The reduction of post harvest losses through improved handling and processing, transport and distribution system should be given high priority, as it will make an important contribution to the betterment of fishery sector

Ethiopian Society of Animal Production
150 15th ESAP-Proceedings
Reference Alverson, D.L., Freeberg, M.H., Pope, J.G., Muravaski, S.A., (1994). A global assessment of fisheries by-catch
and discards AO Fish. Tech. pap., (339):233.
FAO (1989). Fish technology in Africa. FAO Regional Cooperative research in Africa. Rome.
FAO (1998) Responsible fish utilization. Technical Guide lines for Responsible Fisheries. No.7 Rome.
Geoffrey, R. (1990). The kinds and levels of post harvest losses in African inland fisheries. In: proceeding of the symposium on post-harvest fish technology. CIFA Technical paper No 19. Rome, FAO. 1992 (1-9).
Howgate, P. (1994). Proposed draft Guide line for the Sensory Evaluation of Fish and Shell fish. Cx/FF9 (ital.) 94/0. Joint FAO/WHO food standards programme.
HussH.H. (1994). Assurance of sea food quality. FAO fisheries technical paper No. 334.
LFDP (Lake Fisheries Development Project) final report May (1996) Addis Ababa, Ethiopia.
Montaner, M.I., Parin,M.A., Zugarramudi, A.Y Lupin,H.M.,(1994a) Requerimiento insumos en industria pesquera. Alim., (Espana), (253):19-24
Mulambozi (1990) Post harvest fish technology in Zambia. In: Proceedings of the symposium on post harvest fish technology. Cairo p.103-106.
Van den Bosche,J.p.and Bernacsek (1991). Source Book for the Inland Fishery of Africa. CIFA Technical paper No. 318.3. FAO, Rome.
WOOD, C.D. (1985). A methodology for the assessment of losses of cured fish and evaluation of countermeasures. In: Proceedings of the FAO expert consultation on fish technology in Africa, Lusaka, P.360-368
Yared Tigabu (2003). The current status of Lake Ziway fishery In: Proceeding of a national workshop. Biological society of Ethiopia. Addis Ababa, Ethiopia. P1-

Animal Production
15th ESAP-Proceedings 151
Fishery production system in mid rift-valley of Ethiopia
Ahmed Mohammed1, Aberra Degabassa 2 and Taha Mume3
1& 2 Zeway Fisheries Resources Research Center, P.O.box, 229, Zeway; 3 Adami Tulu Agricultural Research center, P.O.box , 257, Zeway
Abstract Agriculture is the dominant sector in Ethiopia and fishery is part of this huge national economy. Fishery is not fully and wisely utilized in our country. This may be due to various production system constraints. Therefore, to undertake any development action in the sector, fishery, identification of the existing production system and important production constraints is very crucial. This work was to identify fishery production system and constraints, the indigenous fishery production practices used and generate future research agenda. This work was conducted in mid rift-valley fishery communities around lake Zeway, Langano, Beseka Debrzeit lakes , Koka reservoir, Balbela reservoir,, Elan natural pond, Wonji ponds and their respective towns (Arsi-nagele, Bulbul, Batu, Meki, Mojo, Bishoftu, Adama, and Matahara). Fishery communities around lakes and their respective towns were purposively selected. Fishers, fish traders and fish food seller (hotels) were selected randomly and one hundred two (102) respondents were interviewed. It was identified that the major problems of fishery production system of the study area are unwise fishery and aquatic resources utilization, absence of applicable fishery policy and regulation in the region or lack of regional fishery and aquatic resources policy, lack of suitable fishery market and poor post- harvest handling and processing practice. Hence solving these problems is found as the basic step for fishery development of the area.
Key Words: Fish, fishers, fishery marketing, fishing efforts, Beach seine & fishery production constraints
Introduction The fishery industry has been of critical importance to the economy and to the social well-
being of humanity. It provides a vital source of food, employment, recreation, trade and economic well being for people throughout the world. However, Current harvest trends and fishery conditions put these attributes of the industry at risk. It is threatened with problems of over-exploitation, environmental degradation and consequently non recovered resources resulting in loss of its potentials. These resources, although renewable, are not infinite and need to be properly managed, if their contribution to the nutritional, economic and social well-being of the growing world's population is to be sustained (FAO 1995).
Agriculture is the dominant sector in Ethiopia and fishery is part of this huge national economy. Fishery is not fully and wisely utilized in our country. Therefore, many interventions are required for better management and the best possible use of the aquatic resources of the country. Our country is endowed with 7400 km2 of lakes which harbor various fish fauna that are ecologically and economically important to the country (Tedla, 1973 and Zenebe, 1998).
Crude estimates based on commercial catch and other parameters have shown that the country’s inland water can support 30 to 40 thousand metric tons of fish per year (LFDP, 1994). Compared

Ethiopian Society of Animal Production
152 15th ESAP-Proceedings
with the potential yield the current fishing rate is low and accounted for only 15-20% (Mebrat, 1993). The low in production and productivity may be due to various production system constraints. Anon (1999) indicted that very little attention was given by the government for fishery management and development. However, with the high rate of population growth and the progressive shortage of livestock products, the situation is now changing and the demand for fish is growing very fast. Therefore, to undertake any development action in the sector, fishery, identification of the existing production system and important production constraints is very crucial. Hence, the objectives of this study were to identify the existing production system and constraints, to see the indigenous practices used and to generate future research agenda.
Study area
This work was conducted in mid rift-valley fishery communities around lake Zeway, Langano, Beseka Bishoftu area lakes , Koka reservoir, Belbal reservoir, Elan natural pond, Wonji ponds and their respective towns (Arsi-nagele, Bulbul, Batu, Meki, Mojo, Bishoftu, Adama, and Matahara).The area is rich in different water bodies such as lakes , reservoirs, ponds and rivers. The major Lakes are Zeway, Abijata, Langano, Shala, Baseka, Hora, Koriftu, Hora kilole, Babogaya, Calklaka, Bishoftu, Arangade and Dimtu; reservoirs such as Koka, Balbela and Wadecha; ponds (Wake mia, Wake tiyo, Adulala boku and Boku kurbo) and rivers (Awash, Modjo, Belbela, Wedecha, Dukem, Tebo, Meki ,Katar, kesem, Bulbula, Jido, Hora Kalio and Gogessa) are found in the area. Lake zeway
Lake Zeway is found in East shoa zone Oromia region. It is 160km far from Finfine (Addis Ababa) the capital city of Ethiopia. The lake has an area of 434km2, the biggest lake in the region and third biggest lake from the rift valley lakes (after lake Abaya & Chamo). Its mean and maximum depths are 2.5m and 7m respectively (Vad den et.al 1985 cf LFDP, 1995). Estimated potential yield of the lake is ranges from 3000-6680 tons per year (FAO/UNDP, 1982 cf LFDP, 1995). Lake Zeway is also known by the name ''Hara dambal'' oromic word and near to Batu and Meki twons. The lake is fed by two major rivers, Ketar and Meki River, and has one outflow (Bulbula River) in the south, which flows into Lake Abiyata (LFDP, 1993). Five bigger islands are situated in Lake Zeway :Tulu Gudo (4. 8 km2), Tsedecha (2. 1 km2), Funduro (0 .4 km2), Debre Sina (0 .3 km2) and Galila (0. 2 km2) (Anon,1999). Currently Tulu Gudo Tsedecha ,Funduro and Galila are inhabited with people except Debre sina. Lake Langano
Lake Langano is lies south of Bulbula twon and east of the road from Addis Ababa to Shashemane. The lake has a total surface area of 230km2, mean depth of 17m and maximum depth of 46m. According to FAO/UNDP (1982) cf LFDP (1995) estimated potential yield of the lake is 1500-3100 tons per year. Koka Reservoir
Koka reservoir is found in East shoa zone, 90 km from Addis Ababa. The reservoir was built for hydroelectric power generation and has two feeder rivers (Awash and Modjo).The reservoir has an area of 255km2, and mean depth of 9m (Bossche and Bernascek, 1991). The potential yield of the reservoir is 2000 to 2,550 tons per year (Kahn, 1983; Weloomme, 1979; Bossche and Bemacsek, 1991).The reservoir has four commercially important fish Species, tilapia (Oreochromis niloticus) 54%, cat fish (Clarias gariepinus) 25%, common carp (Cyprinus carpio) 18% and Barbus (Barbus intermedius) 3% (LFDP,1996)

Animal Production
15th ESAP-Proceedings 153
Lake Baseka
Lake Baseka is 195 km from Addis Ababa. It is found near to Metahar twon on the main road Harar to Addis Ababa. The lake is expanding from time to time and has an area of 39km2. Its potential yield is estimated around 205 tones per year (Information on fisheries management in Federal Democratic Republic of Ethiopia, Jan. 2003. Internet file). Wonji ponds
There are seven different sized ponds (33.25 hectors) in Wonji area. The ponds were constructed from 1978 to 1984 for sugar cane irrigation. A total of about 84,500 Oreochromis niloticus fingerlings were introduced to Wake mia,Wake tiyo and Boku adulala by the then East Shoa of Agricultural Office and Zeway Fisheries Resources Development center in 2001(Zeway Fisheries Resources Development center, 2001).
Methodology The work was conducted from July 2004 to July 2005. Different water bodies in mid rift-valley
such as Lake Zeway, lake Langano, lake Baseka, Bishoftu area lakes, Koka reservoir, Balbela reservoir, Elan natural pond, Wonji ponds and their respective towns (Arsi-nagele, Bulbul, Batu, Meki, Mojo, Bishoftu, Adama, and Matahara) were purposively selected. Fishers, fish traders and fish food sellers (hotels) were selected randomly. Informal survey and questioner were tested for final structured questionnaire preparation. Structured questionnaire has been employed for data collection and 102 respondents were interviewed. Important socio-economic data such as house hold character, education level, land and livestock owner ship, income sources, fish species preference, and fishery marketing situation and fishery data such as fish population trend, fishing efforts and fishery production constraints were collected. Secondary data were collected to testing primary data.
Finally data analysis was performed using the descriptive procedure of Statistical Package for Social Sciences (SPSS 2000) program.
Results and discussions Socio-economic House hold characteristics
Table.1. Family size and Age
N Minimum Maximum Mean Family size 65 1 21 7 Age 65 8 68 33
Average Fisher has 7 family members. There is a family has as large as 21 members. This may be due to polygamy mirage practice found in the study area. Though average fishers has an age of 33, there is an indicator that fishery activities can undertaken by as young kid as of 8 years (an age commonly known as hook guy or those involved in filleting) and up to an old age peoples of 68 years

Ethiopian Society of Animal Production
154 15th ESAP-Proceedings
Table.2. Fishers Education, Land and Livestock ownership and income sources
Frequency Percent Education level
Non educated Formal education Grade 1-6 Grade 7-12 Above grade 12
22 19 24 0
33.8 29.2 36.9
Fishers Land ownership
Have land No land
30 35
46.2 53.8
Fishers Livestock ownership
Have livestock No livestock
61 4
93.8 6.2
Fishers income sources priority Fishery Land Livestock Others
44 14 4 3
67.7 21.5 6.2 4.6
The result indicates that 33.8% of fishers are not attending formal education but 66.2%, however there are no respondents above grade 12. About 46.2% (n=65) has land and the rest who has no land depends on fishery for their survival. The result revealed that 67.7% respondent's major income was from fishery and the rest 21.5%, 6.2% and 4.6% were from land, livestock and other means respectively. This indicates that the existing fishery production system in mid-rift valley is not pure fishery production system rather it is mixed type of production system with other economic activities.
Table.3. Fishers Fish species preference and consumption pattern
No of fishes consumed per family per day Fish species N Percent Minimum Maximum Mean
Tilapia 53 81.5 1 20 6.32 Catfish 9 13.8 1 2 2 Carp 3 4.6 1 2 1.5
From the table the most preferred fish species by respondents is tilapia. However, catfish and carp also have significant contribution.
1.2. Fishery marketing
Table.4.Market Out-let
To whom fishers selling their fish N Percent
Trader 20 30.8 Fish production and marketing Enterprise 31 47.7 Consumer 10 15.4 Hotels 4 6.2 When we consider fishery marketing situation of the area, 47.7% (N=31) fishers sold their fish to Fish
production and Marketing enterprise, 30.8% (20 ) to Traders and the rest is to consumers and hotels.
Currently identified market structure in the study area has the following three (3) options of market
channels.

Animal Production
15th ESAP-Proceedings 155
Channel.1
Fishers Consumers
Hotels Consumers
Channel.2
Fishers Fish traders Consumers
Hotel Consumers
Channel.3
Fishers Fish production & Marketing Consumers
Hotels Consumers
Table.5. Fish selling price
Tilapia ( Qoroso ) Cat fish ( Ambaza ) Seller
Number of fish Sold for 1bir
Filet price of 1kg
Number of fish Sold for 1bir
Filet price of 1kg
Average 4 6.34 2 4.82 Minimum 1 4 1 3
Fishers
Maximum 7 8 3 7 Average 2 13.25 1 7 Minimum 1 8 1 7
Traders
Maximum 3 24 1 15
This table indicates that fish price on landing site which is fishers selling price is very low as compared to that of traders at marker whether it is whole or filleted.
Table.6. Types of fish foods and their prices per dish
Price in birr Fish food N Minimum Maximum Mean
Smoked Fish Food 2 9 17 13.00 ''Asa Lablab'' 29 4 18 7.39 ''Asa Cotlet'' 16 5 18 9.90 ''Asawot'' 10 4 7 5.30 Roasted Fish 13 4 9 5.77 ''Asa Shorba'' 2 4 4 4.00 ''Asa Gulash'' 6 5 17 8.33

Ethiopian Society of Animal Production
156 15th ESAP-Proceedings
Table.7.Ranks given to Fishery Market Constraints
Lack of market Low Low Supply Low price Transportation Preservation Rank
N % N % N % N % N % N % I do not know 4 6.2 4 6.2 5 7.7 4 6.2 9 13.8 10 15.4 1st 11 16.9 1 15.4 7 10.8 31 47.7* 2 3.1 0 0
2nd 4 6.2 1 27.7* 10 15.4 16 24.6 11 16.9 3 4.6
3rd 6 9.2 1 21.5 13 20.0* 7 10.8 11 16.9 9 13.8
4th 16 24.6 5 7.7 8 12.3 4 6.2 18 27.7* 8 12.3 5th 4 6.2 9 13.8 13 20.0 3 4.6 12 18.5 18 27.7* 6th 20 30.8* 5 7.7 9 13.8 0 0 2 3.1 17 26.2 The identified fishery marketing problems were low price, lack of Market place, low demand,
transportation, and preservation and low supply is (low yield or harvest declination). According to their importance fishery marketing constraints were ranked as follows:
1st. Low price
2nd. Lack of Market place
3rd. Low demand, Transportation, and Preservation and
4th. Low supply (Low yield or harvest)
Fishery Fish Population trend
Table.8. Fish population Trend by species
Tilapia Catfish Carp Population trend N % N % N %
Increasing 0 0 31 47.7 19 29.2 Decreasing 52 80.0 24 36.9 14 21.5 No change 8 12.3 6 9.2 14 21.5 I don't know 5 7.7 4 6.2 18 27.7 The respondents indicate that Cat fish and Carp species show slight increase in the area as compared
to tilapia species which is in decreasing trend.
Table.9. Fish species Dominance
Fish species N
Tilapia 65 100.0 All respondents confirm that however tilapia is under declining situation (Table.8.) still it is the
dominant fish species of the area.

Animal Production
15th ESAP-Proceedings 157
Fishing efforts
Tale.9. Fishing efforts on water bodies
LFDP, 1996 and Getinet, 2002 Present study ( 2004/05) Water bodies
Coop
erat
ives
Fish
ers
Boat
s
Beac
h se
ines
Gill
net
s
Hoo
k &
lin
es
cast
net
s
Coop
erat
ives
fishe
rs
Boat
s
Beac
h se
ines
Gill
net
s
Hoo
k an
d lin
es
cast
net
s
L. Zeway 20 1760 120 124 2470 1056 0 12 904 132 134 70 977 0 L. Langano 2 71 29 34 12 0 0 5 259 184 189 32 142 0 L. Baseka 0 0 0 0 0 0 0 2 33 14 1 1 14 0 L.Hora kilote 0 0 0 0 0 0 0 1 12 0 4 0 0 0 Koka reservoir 1 48 33 33 57 2 0 7 284 103 82 238 346 0 Balbela 0 0 0 0 0 0 0 1 20 2 0 0 0 10
Elan natural 0 0 0 0 0 0 0 1 30 6 6 5 10 0
Wanjii ponds 0 0 0 0 0 0 0 0 0 0 0 0 0 0 23 1879 182 191 2539 1058 0 29 1542 441 416 346 1489 10 Change in efforts (in %) 11.54%
(6), - 9.85% (337)
49.92% (269)
43.82% (220)
-73.46% (2193)
16.92% (2193)

Ethiopian Society of Animal Production
158 15th ESAP-Proceedings
Comparing with pervious fishery result at present number of cooperatives increased by 11.54% (6),
boats increased by 49.92% (269), beach seines increased by 43.82% (220), hook & lines increased by
16.92% (2193). But fishers and number of gill nets are reduced by 9.85% (337) and 73.46% (2193)
respectivelyThis data also indicates that Beach Seine, which is very destructive types fishing net is
increasing from time to time. At present utilization of this net is very high on lake Langano compared
the other water bodies.
Fig.1. Fishing Gears Distribution of the area
Beach seine, 418, 19%
Gill net, 342, 15%
Cast Net, 10, 0%Hook & long line,
1489, 66%
Beach seineGill netCast NetHook & long line
Table.10. Views on resource use rights and protection
Responsible bodies N % Fishers 17 16.7 Government 58 56.9 Both Government and Fishers 24 23.5 I do not know 3 2.9 Total 102 100
Of 102 respondents 56.9% said that fishery and aquatic resources protection responsibility is the government's responsibility; 23.5% of the respondents share the accountability with government and 16.7 of them fully committed them selves for protecting the resources. Most of the respondents give fishery and aquatic resources protection responsibility only to the government. This can be due to open access of the resources and lack of awareness on natural resources conservation for sustainable utilization

Animal Production
15th ESAP-Proceedings 159
Table.11.Fishery production problems by water bodies
Types of water bodies Name of water Specific problems
Poor fish handling and processing practice on landing site High utilization of destructive fishing material (beach seine) Over-exploitation
Zeway
Illegal fishing Illegal fishing Increasing numbers of fishery cooperatives and fishing efforts
(Can lead to over-exploitation) Poor fish handling and processing practice on landing site
Langano
High utilization of destructive fishing material (beach seine) Distraction of fishing nets by rocky soil and crocodile in the lake and
absence of suitable fishing nets to the lake Baseka
Treat of pollution from car wash on the lake
Lakes
Hora kilole Lack of training for fishers Moving land or ''fila'' Utilization of destructive fishing material (beach seine) Treat from industrial bio product
Koka
Poor fish handling and processing practice on landing site
Reservoirs
Balbela Siltaton Wanjii Absence of fishing materials Ponds Elan Absence of appropriate landing sites
Table.11. General Fishery Production Constraints
Over-exploitation Market Absence of regional Poor post-harvest cessing practice
Rank
N % N % N % N %
1st 36 55.4* 15 23.1 17 26.2 4 6.2 2nd 13 20.0 24 36.9* 28 43.1* 6 9.2 3rd 16 24.6 26 40.0 20 30.8 15 23.1 4th 0 0 0 0 0 0 40 61.5*
Fishery community of the study area has prioritized general fishery production problems that the first serious problem is Over-exploitation (unwise resources utilizaton), the second is Absence of regional fishery policy and regulation and the third is lack of suitable market and the fourth is poor post- harvest handling and processing practice.
Conclusions and recommendations The existing fishery production system is mixed type of production system. More over it is
totally capture type and there is no aquaculture practice in the area, despite favorable physical environment. Aquaculture is one of the profitable fish farming technology and also a good chance for diversification of agricultural sector as fish farm can be integrated with livestock and crop production.
Fishery production of the area is under series situation because there is no regional fishery policy. Regardless of the carrying capacity of the resources there is consistent increase in fishing efforts. For instance beach seine which is destructive types of fishing gear is widely utilized in the area. Although fishery resources are renewable, are not infinite and need to be properly

Ethiopian Society of Animal Production
160 15th ESAP-Proceedings
managed for sustainable utilization. Hence to reverse the adverse situation of fishery production of the area
• Introducing appropriate fishery technologies that can enhance fish production and productivity such as pond culture, farm and cage culture are very important to minimize stress on existing open access fishery of the area.
• Fish species preference was observed in the study area which can lead to over-exploitation of the most preferred fish hence awareness creation on importance of each fish species has to be conducted
• Existing marketing channel seems traditional and has limited marketing options therefore detail market situation has to be studied for further improvement.
• Fishery sector of the region has to have its own policy rule and regulation based on the context of the real situation.
• Appropriate fishing gears for each water bodies and fish species has to determine .Number and types of fishing materials has to limited based on types and carrying capacity of the resources.
References Anon, 1999. Regional Government of Oromia, Oromia Economic Study Project.
FAO/UNDP.1982. Data book on land use and agriculture in Ethiopia. Vol. I. 254p; Vol. II pp 255-742, Rome, FAO/UNDP publ. (AG.DP/ETH/78/003).
FAO, 1995 Review of the Fisheries and Aquaculture sector: Ethiopia. Rome, FAO.
Getinet G/Tsedik, 2002. Base Line Survey Report on Current Status of Fishery and Other
LivingAquatic. EARO, National Fishery and Other Living Aquatic Resources Research Center, Ethiopia.
Information on fisheries management in Federal Democratic Republic of Ethiopia, Jan. 2003. Internet file
Kahan, 1983. Fisheries legislation in Ethiopia. FAO fish. Law Advisory Prog. (FL/IDR/83/11).
LFDP 1993. Fisheries Baseline Survey, Lake Zeway. Lake Fisheries Development Working Paper no 7. Addis Ababa, Ministry ofAgriculture.
LFDP, 1994. Preliminary estimation of the maximum sustainable yield of the lakes covered by the Lake Fisheries Development. Working Paper no. 10. Addis Ababa, Ministry of Agriculture.
LFDP, 1996. Lake fisheries and Development Project , Fisheries statistical Bulletin , No . 2 FRDD, MOA. 1-35 pp.
LFDP, 1995. Fisheries Statistical Bulletin No.2. LFDP working papers no.19.30 pp.
LFDP, 1996. Proceedings of the National Fisheries Seminar. Working Paper no. 21, Zeway November 1995.
Mebrat, A., 1993. Overview of the fishery sector in Ethiopia. In Proceedings of the National Seminar on Fisheries Policy and Strategy. Addis Ababa (Ethiopia).pp 45-53. Rome,
FAO.Tedla , S., 1973. Fresh water fishes of Ethiopia. Haile Selassie I University, Addis Ababa.

Animal Production
15th ESAP-Proceedings 161
Vanden. Bossche, J.-P. and Barmacsek, G., 1985. Source book on the inland fishery resources of Africa. Vol. III. CIFA Tech. Pap.
Vanden. Bossche, J.-P. and Bernacsek, G., 1991. Source book for the inland fishery resources of Africa. CIFA Tech. paper no.318.3. FAO, Rome. P219
Welcome,R.L., 1979. The inland fisheries of Africa. CIFA Occ.Pap. (7):P69.
Zenebe, T., 1998. Food and feeding ecology of tilapia, Oreochromis niloticus L. and effects of diet on the lipid quality of fish in some lakes in Ethiopia. A thesis submitted to school of graduated studies, in partial fulfillment for the degree of Doctor of philosophy in biology. Addis Ababa University.
ZFRDC, 2001. Zeway Fisheries Resources Development center work report on fish introduction.


Animal Production
15th ESAP-Proceedings 163
Current status and condition of introduced fish species in small water bodies: case studies at Birati reservoir
Adamneh Dagne and Fassil Degefu
National Fisheries and Other Aquatic Life Research Center, P.o.Box 64, Sebeta, Ethiopia
Abstract Current status and condition of introduced fish species in Birati reservoir were studied in four different sampling periods between 2005 and 2006. A total of 373 fish (52 % Carassius carassius; 31 % Oreochromis niloticus and 17 % Cyperinus carpio) were caught using gill nets of 60, 80,100,120,140 and 160 mm stretched mesh. The size ranges of fish (total length) were Carassius carassius from 100 to 530 mm TL and 50 to 2100g Twt; Cyperinus carpio from 190 to 600mm TL and 90 TO 3625g Twt., Oreochromis niloticus from 150 to315mm TL and 55 to 620g Twt. The relations between total weight and total length for the three species were curvilinear. Lengths at first maturity stage (50% matured population) were Cyperinus carpio 235 mm; Carassius carassius 293 mm and Oreochromis niloticus 200 mm in total length. During the sampling period the three fish species showed different peak in their maturity. Carassius carassius 88 & 66% in June & August; Oreochromis niloticus 50% in August and Cyperinus carpio 75 & 71% in February and August following the raise in temperature and water level.
Key words: Aquaculture, Oreochromis niloticus, carassius carassius, Cyperinus carpio, length- weight
Introduction There are two fundamentally different ways of producing fish. Fisheries (the harvesting of
wild fish stocks held in common ownership) and aquaculture (the active rearing of privately owned fish stocks). Juveniles are stocked into communal or public water bodies, often leading to new use rules and thereby transforming both technological and institutional aspects of aquatic resources use. On the other hand, self recruiting fish, whether indigenous or introduced, contribute substantially to the catch from many rural aquaculture systems. Systems such as those have been very much neglected by research and extension.
Fish introductions have been used to enhance fish production by filling less utilized ecological niche for aquaculture, sport and recreational purpose and to control disease and weeds. However, fish introductions will not always be useful. Apart from displacement of native fish populations, through competition, predation and hybridization, introduction can result in habitat alterations, degradation of water quality and introduction of fish parasites (Tayler, Courtney & Mc Cann, 1984). Habitat alteration includes consuming and uprooting aquatic vegetation which increases turbidity. It will also cause a sever decline and in some cases total disappearance of many native fish species.
However, a code of practice or pre-study mechanism need to be developed to be followed before any introduction of non-native species are made so that the deleterious effects associated with fish introductions will be minimized.

Ethiopian Society of Animal Production
164 15th ESAP-Proceedings
Reservoirs are essential component of most irrigation systems and together with those built for power generation, flood control and surface water harvesting which retain a large volume of water worldwide. In addition to their role in providing water for agriculture, industrial and domestic purposes and their role in power generation, most of these reservoirs and dams have the potential to play an important role in fish production which is the cheapest animal protein food in the country and contribute significantly to the livelihoods of communities along their surrounding. Even though some of the reservoirs and dams (E.g. Koka, Fincha, Birati, Tolley, Gefersa, Legedadi, Midemar etc…) are stocked with fish species, yet there is less recognition that fisheries potential of most of these water bodies greatly exceeds current use, provided that environmentally and socially sustainable systems of use can be developed and adopted.
A major element in fishery management in many countries is to prevent any increase in and possibly even reduce fishing pressure in the intensively fished foreshore areas. Aquaculture would probably be the only means of maintaining the over all supplies, if fishing restrictions affect the landings. Sizeable increase in population can also be expected through aquaculture under favorable conditions. The native fish stocks of the rift valley lakes, have declined due to over fishing and the pressure exerted by the demand of the increasing human population (Yared Tigabu, 2003). Some of those lakes do, and others may soon need stock enhancement. The need to supplement animal protein in the region may in the end justify such introductions.
Although there are other ways of enhancing fish production for example by breeding native fish and restocking them in the lakes or through aquaculture in suspended cages, culturing fish in artificial ponds supplied with inputs and technology, the low-tech approach will be to introduce more fish species.
Therefore, the purpose of this study was to assess the current status of introduced fish species at Birati reservoir.
Study areas Birati reservoir is found 100 km North West of Addis Ababa near Mugger Cement Factory,
and has an estimated area of 10-15 ha and maximum depth of 9.5m. The reservoir was constructed by the factory in the 70’s to harvest water for industrial and domestic purpose. Though the sole purpose of the reservoir is for industrial and domestic use, the then Sebeta Fish Culture Station, the current National Fisheries and Other Living Aquatic Resources Research Center introduced three fish species (Carassius carassius; Oreochromis niloticus and Cyperinus carpio) in the reservoir. Secondary data indicated that 12,000 Crusian carp, 10,000 Oreochromis niloticus and 4,000 Tilapai zillii (which is not found in our sampling) were introduced in the reservoir in 1979 and 1980 EC.
Materials and Methods Atotal of 373 fish (Carassius carassius; Oreochromis niloticus and Cyperinus carpio) were
collected in four different sampling periods from Oct., 2005-Aug., 2006 using gillnets of 60, 80, 100, 120, 140 and 160 mm stretched mesh. Weight, length, sex and maturity stage of each fish species were recorded on site during sampling. Length-weight relationship for both species was calculated using least square regression analysis (Bagenal and Tesch, 1978). Zooplankters of the reservoir were sampled using tow nets of 100 µm mesh size. Samples were preserved in 5%

Animal Production
15th ESAP-Proceedings 165
formalin and identified in the laboratory using compound microscope (x100 magnification). Literature and identification keys (Fernando, 2002; Adamneh, 2004) were used for taxonomic activity.
Results and Discussion
Table1. Zooplankters identified in Birati reservoir
Rotifers Cladocerans Copepods Others Anuraeopsis fissa Ceriodaphnia corunuta Calanoid sp. Chironomid larvae Asplanchna sp. Daphnia barbata Nauplii Water bugs Brachionus angularis Diaphanosoma excisum Thermocyclops decpiens Brachionus caudatus Moina micrura Brachionus patulus Brachionus falcutus Filinia longiseta Filinia opoliensis Filinia novaezealandae Hexarthra sp. Keratella tropica Lecane sp. Polyrthera vulgaris Trichocerca tigres
The number of rotifer species is higher compared with that of cladocerans and copepods probably due to their relationship with the suspended solids in which the secchi depth of the reservoir was less than 0.5m. According to Adamneh (2004) and Mengestou et al. (1991) such large number of rotifers with few crustaceans was also observed in the natural water bodies in the Rift Valley.
Table1. Fish catch during the sampling period at Birati reservoir
Months Cyperinus carpio Carassius carassius Oreochromis niloticus Oct.,05 10 20 1 Feb.,06 18 96 63 Jun.,06 13 41 43 Aug.,06 22 38 8

Ethiopian Society of Animal Production
166 15th ESAP-Proceedings
17%
52%
31%
C. carpio
C. carassius
O. niloticus
Fig.1 Catch composition
The catch composition of the reservoir was dominated by Carassius carassius followed by Oreochromis niloticus. Cyperinus carpio which contribute lessthan 20% to the total catch has higher biomass in terms of the total weight of the catch, a single fish weighing up to 3.5kg. Size ranges of fish (total length (TL) and total weight (TWt) were Carassius carassius from 100 to 530 mm TL and 50 to 2100g Twt; Cyperinus carpio from 190 to 600mm TL and 90 to 3625g Twt. and Oreochromis niloticus from 150 to315mm TL and 55 to 620g Twt.
0
20
40
60
80
100
120
Oct., 05 Feb., 06 Jun., 06 Aug., 06
Months
Num
ber o
f cat
chs
C. carpio
C. carassius
O. niloticus
Fig.2. Total catches of fish species
The higher catch in the second sampling (February) might be linked with the rise in the water temperature. The lowest catch for Cyperinus carpio could be due to its bottom dwelling habit and the sampling methods used that is suspended gillnets.

Animal Production
15th ESAP-Proceedings 167
a,
y = 3E-05x2.8676, R2 = 0.8521, n=195
0
500
1000
1500
2000
2500
0 100 200 300 400 500 600
Length (mm)
Wt.
(g)
b,
y = 5E-05x2.8117, R2 = 0.922, n=115
0
100
200
300
400
500
600
700
0 50 100 150 200 250 300 350
Length (mm)
Wt.
(g)
c,
y = 6E-05x2.765, R2 = 0.934, n=62
0
500
1000
1500
2000
2500
3000
3500
4000
0 100 200 300 400 500 600 700
Length (mm)
Wei
ght (
g)
Fig.3. Length-weight curve of a, Carassius carassius; b, Oreochromis niloticus and c, cyperinus carpio from Birati reservoir.
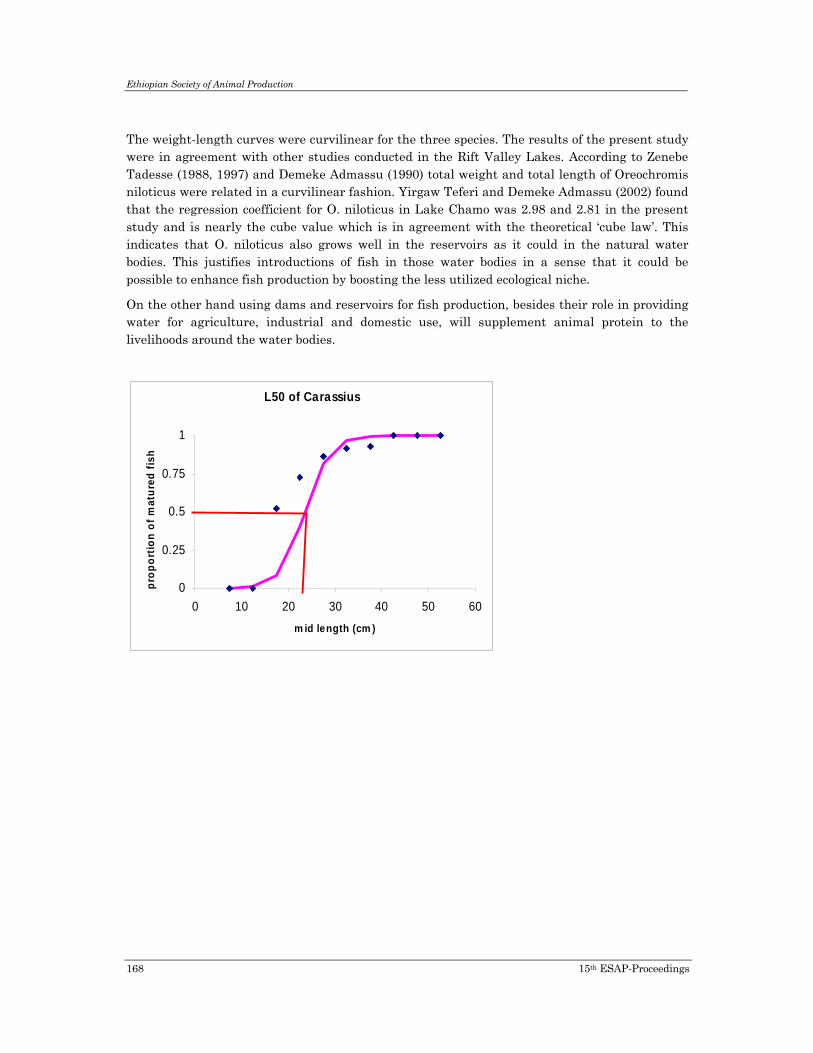
Ethiopian Society of Animal Production
168 15th ESAP-Proceedings
The weight-length curves were curvilinear for the three species. The results of the present study were in agreement with other studies conducted in the Rift Valley Lakes. According to Zenebe Tadesse (1988, 1997) and Demeke Admassu (1990) total weight and total length of Oreochromis niloticus were related in a curvilinear fashion. Yirgaw Teferi and Demeke Admassu (2002) found that the regression coefficient for O. niloticus in Lake Chamo was 2.98 and 2.81 in the present study and is nearly the cube value which is in agreement with the theoretical ‘cube law’. This indicates that O. niloticus also grows well in the reservoirs as it could in the natural water bodies. This justifies introductions of fish in those water bodies in a sense that it could be possible to enhance fish production by boosting the less utilized ecological niche.
On the other hand using dams and reservoirs for fish production, besides their role in providing water for agriculture, industrial and domestic use, will supplement animal protein to the livelihoods around the water bodies.
L50 of Carassius
0
0.25
0.5
0.75
1
0 10 20 30 40 50 60m id length (cm )
prop
ortio
n of
mat
ured
fish

Animal Production
15th ESAP-Proceedings 169
Fig.5 L50 (50 % of the fish maturation) for Carassius carassius, Cyperinus carpio and Oreochromis niloticus were 23.5, 29.3 and 20 cm respectively.
The three fish species are found in the reservoir as poly culture. The results of L50 (the size of the fish at which 50% of the fish attains its first sexual maturity) were shown in Figure 5. Therefore, fishing activities that will be conducted in the reservoir should consider the mesh size to be employed in the reservoir in such a way that fish with sizes less than 20cm in the case of O. niloticus should not be harvested to give chance for the fish to breed at least once in their life time. This does not mean that the fish will not breed below the specified length. As we all know O. niloticus breeds at its early age but it is to mean that half the population will attain its first sexual maturity at the length of 20cm. The main idea behind this analysis is to suggest one of the management options for sustainable fishing that is the use of appropriate fishing gear.
L50 of O. niloticus
0
0.25
0.5
0.75
1
0 5 10 15 20 25 30 35
m id length (cm )
prop
ortio
n of
mat
ured
fish
L50
0
0.25
0.5
0.75
1
0 10 20 30 40 50 60 70
M id length (cm )
Prop
ortio
n of
mat
ured
fish

Ethiopian Society of Animal Production
170 15th ESAP-Proceedings
Besides the natural lakes that Ethiopia is endowed with, there are a number of dams and reservoirs constructed and are under construction for hydroelectric power and irrigation since they play increasingly important role in the economy of the country. For instance Myneguse, Midemar, Koria, Gerai, Gefersa, Legedadi, Birati, Tolley, Gelgel Gibe, Koka, Fincha are some of the dams and reservoirs which can be used for fish production as well.
A number dams and reservoirs including the above listed are stocked with different fish species. Introduction of fish species either endemic or exotic in those water bodies are drastic actions where ecological implications have rarely been taken in to account. Experiences in Lake Victoria and Kyoga indicate that it would be very dangerous to introduce non-native fishes into other lakes which still have high economic fish fauna (Ogutu-Ohwayo, 1992). However, a reduction in native fish stocks in many natural and non-stocked water bodies (dams and reservoirs) will justify introduction of fish to increase fish production for food, recreation, and to control disease vectors and weeds.
In countries like Ethiopia, limnological investigations have either been neglected or been limited to fishery programs. Only lately some concerted efforts have been there to deal with broader overviews of tropical limnology and its distinct features. Even then, more is known about lakes than other Ethiopian freshwater bodies. In our attempt to investigate the current status of introduced fish species in Birati reservoir, Oreochromis niloticus, Cyperinus carpio and Carassius carassius introduced earlier are found adapted in the reservoir. We have found different cohorts of the three fish species during our sampling. The catch compositions were dominated by C. carassius greater than 50% followed by O. niloticus.
Conclusion The three fish species introduced in the reservoir are well adapted showing different size
class. Fishing could be started as the fish species in the reservoir establishes different cohorts. Since the fish species in the reservoir are present as poly culture and could be harvested with the same nets, it will be advisable to use 100mm stretch mesh size and above for sustainable fishing in the reservoir. Further study with intensive sampling is needed to determine the growth and peak reproductive season of the fish species in the reservoir.
Acknowledgements The authors wish to thank the fishermen (Negussie and Tsegaye) and NFLARRC staffs for
their assistance during our field sampling. We are grateful to our driver Kebede Bereda who takes care of our safety and for his field assistance as well. This work was financed by EIAR and field samplings were facilitated by NFLARRC.
References Adamneh Dagne (2004) Abundance and species composition of Zooplankton in the Rift Vally Lake-Lake
Ziway. MS.c thesis, UNESCO-IHE, Institute for Water Education. 72pp.
Bagenal T.B. and Tesch F.W. (1978) Age and growth. In: Methods for Assessment of fish production in freshwater, 3rd ed., pp. 101-136, (Bagenal T.B., ed.), Oxford: IBP Hand book No. 3,Black well.

Animal Production
15th ESAP-Proceedings 171
Demeke Admassu 1990. Some morphometric relationship and the condition factor of Oreochromis niloticus (Pisces: Ciichlidae) in Lake Awassa, Ethiopia. Sinet:Ethiop.J. Sci., 13(2): 83-96.
Fernando C.H. (2002) A Guide to Tropical Freshwater Zooplankton. Identification, Ecology and Impact on Fisheries. Backuys Publishers, Leiden, 291pp.
Ogutu-Ohwayo, R. (1992) The purpose, costs and benefits of fish introductions: With specific reference to the Great Lakes of Africa. Mitt. Internat. Verein. Limnol. 23. pp. 37-44.
Seyoum Mengestou, J. Green and C.H. Fernando (1991) Species composition, distribution and seasonal dynamics of Rotifera in a Rift Valley Lake in Ethiopia (Lake Awassa). Hydrobiologia 209: 203-214.
Taylor, J. N., Courtney W. R. JR., & McCann, jr. (1984) Known impacts of exotic fishes in the continental United States. – In: Courtney, W.R.jr. & Stauffer, J.R. jr. (eds.). Distributio, biology, and management of exotic fishes: 322-373. –John Hopkins University Press, Baltimore.
Yared Tigabu (2003) The current status of Lake Ziway Fisheries. Proc. Biological Society of Ethiopia. Addis Ababa Ethiopia. Pp 1-10.
Yirgaw Teferi and Demeke Admassu 2002. Length-Weight relationship, body condition and sex ration of tilapia (Oreochromis niloticus L.) in Lake Chamo, Ethiopia. Sinet: Ethiop. J. Sci., 25(1):19-26.
Zenebe Tadesse, 1988. Studies on some aspects of the biology of O.niloticus L. (Pisces Cichlidae) in Lake Ziway, Ethiopia. Unpublished Msc. thesis, Addis Ababa University. 78pp.
Zenebe Tadesse, 1997. The nutritional status and digestibility of Oreochromis niloticus L. diet in Lake Langano, Ethiopia. Depertment of Biology, Addis Ababa University.

Animal Production
15th ESAP-Proceedings 173
Growth performance and economic returns of male monosex and unsexed tilapia (Oreochromis niloticus L.) culture in ponds fed on wheat bran
Adamneh Dagne, Aschalew Lakew Fassil Degefu and Abeba W/Gebriel
National Fisheries and Other Aquatic Life Research Center, P.o.Box 64, Sebeta, Ethiopia
Abstract
The effect of sex on the growth performance of tilapia (Oreochromis niloticus) fed with wheat bran was investigated in two experiments each with a replicate. Hand-sexed male monosex and unsexed fingerlings with average initial weight of 46.6, 53.3 and 32.1 and 33.7g were stocked in earthen ponds respectively at the stocking density of two fish m-2. The fish were cultured for 8 months fed daily at 5% body weight. The results of the experiment showed that male monosex were superior in their growth performance over the unsexed ones throughout the experiment period (17.7% in the 1st month and 62.8% in the 7th month). This is because of the fact that recruitments in the unsexed treatment were so great that the offspring compete for food with the adults leading the original stock to be stunted. At the end of the experiment the numbers of recruitments (fries produced) in unsexed treatment were 5742 but 614 in male monosex treatment due to sorting error in the later case. Analysis on the economic data indicated that both treatments showed positive net return for the culturing periods of 6, 7 and 8 months. However, there was a difference in attaining the optimum net return in culturing Oreochromis niloticus as male monosex and unsexed. The unsexed treatment reached its optimum net return after 6 months of culturing whereas the male monosex reached after 7 months. Culturing for extra one month (7 month for the unsexed and 8 months for male monosex) showed 32% and 24% decline from the optimum net return reactively. Hence growing male monosex Oreochromis niloticus for 7 months will be profitable at Sebeta condition. In our attempt to investigate the growth performance of Oreochromis niloticus as unsexed and male monosex culture, the later appeared to be the best and is low-tech culturing technique which can be practiced by the local fishermen with little training.
Key words: Earthen pond, industrial by products, feed conversion
Introduction Tilapia are native to Africa, but have been introduced in many countries around the world.
They are disease resistant, reproduce easily, eat a wide variety of foods and are tolerant to poor water quality with low dissolved oxygen level. These characteristics make tilapia suitable for culture in most developing countries. They are most often grown in ponds, cages and rice fields. Management of tilapia ponds ranges from extensive systems using only organic or inorganic fertilizers to intensive systems using high protein feed, aeration and water exchange.
Tilapia (Oreochromis niloticus) is the most dominant among the group of tilapia farmed in sub-saharan Africa. It is farmed either for subsistence or commercial purpose and the great majority of the culture practices are semi-intensive. The importance of Oreochromis niloticus for semi-intensive culture systems is from their ability to utilize feeds from a wide range of materials including plants (Morairty, 1973; Getachew and Fernando, 1989). Its relatively fast growth rate,
Ethiopian Society of Animal Production
174 15th ESAP-Proceedings
adaptability to a wide range of culture conditions and high market demand also suits O. niloticus for semi-intensive culture (Kebede Alemu, 2003).
In pond cultures O. niloticus mature at much younger age than that living in lakes (Lowe Mc Connel, 1979) and O. niloticus in poor body condition mature at small size than those in good condition (Balarin and Hatton, 1979). Though pond culture is the most popular method of growing tilapia, the major drawback of pond culture is the high levels of uncontrolled reproduction that may occur in grow out ponds. Tilapia recruitment, the production of fry and fingerlings may be so great that offspring compete for food with the adults. The original stock becomes stunted yielding only a small percentage of marketable fish. It is under such circumstance that culturing of monosex male tilapia is desirable as a means to control unwanted reproduction and to exploit the relatively fast growth rate of males. Two major strategies, mixed sex and male monosex culture can be used to control spawning and recruitment while producing tilapia in ponds. Monosex male population can be obtained in a number of ways of which manual sexing, sex reversal and hybridization are the major ones.
Manual sexing which is commonly used by producers is the process of separating males from females by visual inspection of the external urogenital pores. Secondary sexual characteristics may also be used to distinguish sex. Reliability of sexing depends on the skill of the workers, the species to be sorted and the size. Experienced workers can reliably sex 15 gram fingerling Tilapia mossambica, 30 gram Tilapia nilotica and 50 gram Tilapia aurea ( Rakocy and Andrew McGinty, 1989). Periodic harvesting of tilapia fry and fingerlings with nets to reduce competition for food, culture in suspended cages in which spawned eggs fall through the cage mesh and die preventing overcrowding, culture at very high densities, stocking predacious fish as fingerlings or adults in the tilapia pond also reduces unwanted recruits and hence reduce cost of production.
Growing human population coupled with an increasing demand for protein encourages agriculture and aquaculture to develop and apply technologies that enables to utilize natural resources more efficiently. From this point of view tilapia culture of male monosex in small water bodies will be the other potential scenario of fish production.
The objective of the present study is therefore to evaluate, the growth performance of male monosex and unsexed tilapia (Oreochromis niloticus) in pods fed with locally available feeds i.e. wheat bran and its economic significance.
Materials and Methods Study area
National Fisheries and Other Aquatic Life Research Center-Sebeta is found 24 km South West of Addis Ababa. It is located at latitude of 08054’N; 38038’E and at a altitude of 2225m asl. Physico-chemical parameters of the treatments were recorded (Table 1). This study was conducted from March-October, 2006 at NFLARC Earthen ponds.
Culture Techniques
Growth performance study of unsexed culture and male monosex culture tilapia was evaluated over eight months in earthen pond system. Ponds were prepared by draining and sun

Animal Production
15th ESAP-Proceedings 175
drying for two weeks. Wire mesh enclosures were installed on the water inlets and outlets of each pond to prevent entry of unwanted fish and escape of experimental fish.
Lime was spread over the pond bottoms at the rate of 250 kg/ha and the ponds were filled to 30 cm deep with water to increase the alkalinity of the ponds. After 5 days the level of water in all ponds was raised to 1 meter. Oreochromis niloticus fries and fingerlings collected from Lake Babogaya were acclimatized at Sebeta earthen ponds for two weeks. This is done so because the hatchery facility we have is not currently functional. Prior to stocking sexing was done manually by visual inspection of the external urogenital pores with the aid of magnifying hand lens. Each pond (200m2 area) was stocked with 400 fish (Oreochromis niloticus) at the stocking density of two fish per square meter. The average initial weights of unsexed culture were 32.1 and 46.6 gram and male monosex 33.7 &53.5 gram respectively. Higher initial weights in the male monosex treatment relative to unsexed culture, is intentional to reduce percentage of errors in identifying male Oreochromis niloticus which was seen in the result.
Growth
Samples of at least 50 fish from each treatment in each pond were collected monthly using a seine net for weight-length measurement to the nearest 0.1 g and 0.5 cm respectively. The biomass of fish in each pond was estimated from the number of fish initially stocked in each pond and their average body weight from the samples. Immediately after taking measurements on the field fish were returned to the ponds. Tilapia reproduction occurred in all ponds but with different magnitude (Table 4) and recruitments were collected, counted and group weighed during weight-length measurement. Fries from unsexed culture were released back to the respective replicates but those from male monosex culture were transferred into another pond. Mortality of the fish was monitored every day and recorded. At the end of the experiment all fish were removed from the ponds and the total number, weight and length in each pond were determined. Survival rate was estimated from yield data at the end of the study.
Feed and feeding regime
Wheat bran, bought from a wheat processing factory, was used in the experiment. Daily feed required for each experiment was calculated as 5% fish body biomass per day. The daily amount of feed required for fish in each pond was weighed and delivered by spreading the feed by hand twice a day (50% of the ration at 10:00 am and the remaining 50% at 3:00 pm) through out the experimental period. Water samples were also analyzed for its natural food content (plankton) in the ponds (Table2 &3). Feed conversion ratio (FCR) for wheat bran is estimated as weight of feed added to increase in wet fish biomass ignoring the natural food consumed by the fish. Plankton species were identified using books and literature (Fernando, 2002; Adamneh, 2004).
Dissolved oxygen, conductivity, pH and water temperature were measured once during the experiment due to lack of those instruments at our center.

Ethiopian Society of Animal Production
176 15th ESAP-Proceedings
Results and Discussion
Table1. Physico-chemical parameters of experimental ponds
Measured values Treatments
Parameters
Unsexed Male mono sex Area of ponds (m2) 200 200 Depth (m) 1 1 pH 8.8 8.3 Dissolved Oxygen (mg/l) 10.4 5.9 Conductivity meter (µS/cm) 194 223 Mean monthly air temperature (0C) 20 20 Mean monthly Water temperature (0C) 19.7 19.7
Table2. Plankton communities a) unsexed treatment
Zooplankton Phytoplankton Others Remarks Asplnchna sp. Anabena sp.* Chironomid larvae Brachionus angularis Clostrium sp.* Ephemeropetera sp. Brachionus caudatus Pediastrium sp. Euglena sp. Brachionus clyciflorus Phacus andulatus Nematode sp. Brachionus falcatus Scendesmus sp. Pelecoptera sp. Brachionus dimidiatus Tabularia sp. Filinia longiseta Filinia novaezelandiae Filinia opoliensis Keratella tropica** Polyrthera vulgaris Trichocerca sp. Alona sp. Monia micrura Cyclopoid sp. Nauplii b) Male mono sex treatment Zooplankton Phytoplankton Others Remarks Asplnchna sp. Anabena sp.** Chironomid larvae Brachionus angularis Clostrium sp.** Ephemeropetera sp. Brachionus caudatus Microcystis sp. Euglena sp. Brachionus clyciflorus Navicula sp. Pelecoptera sp. Brachionus falcatus Pediastrium sp. Brachionus dimidiatus Phacus sp. Brachionus quadridentatus Scendesmus sp. Brachionus patulus Staurastrium sp. Brachionus plicatilis Filinia longiseta Filinia novaezelandiae . Filinia opoliensis Keratella tropica** Polyrthera vulgaris Trichocerca ruttneri Alona sp. . Monia micrura Cyclopoid sp. (Thermocyclops decpiens)
Nauplii** *Abundant ** Very abundant

Animal Production
15th ESAP-Proceedings 177
Plankton species identified from one treatment were also confirmed in the other one. However, two replicates (earthen pond 2 unsexed and earthen pond 3 male monosex) were green for the last three months which was due to high Anabena and Clostrium spp. (Table 2).
Table3. Mean monthly weight gain of fish in each replicate Value + SD (March-October, 2006)
Months Replicates Unsexed1 Unsexed2 Male1 Male2 March 32.1+11.6 46.6+18.8 33.7+12.2 53.5+15.3 April 49.0+ 15.9 63.8+ 15.8 65.0+ 20.5 67.7+ 16.4 May 57.6+15.8 70.2+ 17.1 79.1+ 28.9 76.5+ 17.9 June 71.9+19.8 86.4+ 21.8 121.0+ 36.7 89.9+ 22.5 July 83.5+22.5 99.8+ 21.3 148.6+ 41.9 117.6+ 27.3 August 96.3+33.4 109.4+ 21.9 164.7+ 48.6 118.9+ 27.3 September 96.8+30.4 118.6+ 25.1 209.8+ 54.4 140.8+ 34.9 October 97.3+29.6 119.1+ 23.9 210.2+ 63.2 142.3+ 29.6
Even though it is not statistically tested, differences are observed in the mean monthly weight gain of fish in the two treatments.
Table4. Growth performance, yield and percentage survival of Oreochromis niloticus grown as mixed sex and male monosex culture fed with wheat bran
Treatments Variables Unsexed Male monosex
Average initial wt. (g/fish) 39.4 43.6 Average harvest wt. (g/fish) 108.2 176.2 Weight gain (g/fish) 68.8 132.6 Growth rate (g/day) 0.29 0.55 % Survival 65.5 67.5 FCR 86.5 61.7 Fingerling recruitments (nos.) 5742 614 Net fish yield (kg/ha) 1421.6 2384 Annual net production (kg/ha/year) 2437 4087
Growth performance data for male monosex and unsexed Oreochromis niloticus are presented in table 3 & 4. From the table, male monosex treatment is superior (is bout twice) to unsexed one in their average weight gain and 1.7 times in net fish yield per hectare. The number of recruitments 614 in male monosex treatment (Table 4) was due to the error during hand sexing. It is quit common to have such errors and a single Oreochromis niloticus can produce as much fingerlings when present in such treatment. The increment in the average weight of fish in the unsexed and male monosex treatments were almost none from the 7th months on wards (Figure1).

Ethiopian Society of Animal Production
178 15th ESAP-Proceedings
Table 5 Average weight of Oreochromis niloticus (mixed sex and male monosex treatments)
Average wt. (g) Months Unsexed Male monosex
Mar. 39.4 43.6 Apr. 56.4 66.4 May 64.0 77.8 Jun. 79.2 105.5 Jul. 91.7 133.1 Aug. 102.9 141.8 Sept. 107.7 175.3 Oct. 108.2 176.2
0.0
20.0
40.0
60.0
80.0
100.0
120.0
140.0
160.0
180.0
200.0
Mar. Apr. May Jun. Jul. Aug. Sept. Oct.
Months
Ave
rage
wt.
(g)
unsexed
male
Fig. 1 Growth curve for male monosex and unsexed Oreochromis niloticus
Although there appears to be little or no change in growth of fish to wards the end of the experimental period, growth of the fish was increasing through out the culturing period indicating that the maximum yield that one could gain by feeding the fish for 6 and 7 months for unsexed and male monosex respectively. Feeding Oreochromis niloticus in ponds as male monosex showed better growth performance than those grown as unsexed. The lower growth performance of the unsexed treatment could be explained due to stress (high numbers of fries), energy required for the development of reproductive organs during breeding which is almost none in the male monosex treatment.(Figure 1). As it is observed in our experiment the recruitments, the production of fries and fingerlings, were high in the unsexed treatment (Table 4). In such cases the offspring compete for food with the adults leading the original stock to a stunted growth. Moreover, Oreochromis niloticus is a mouth brooder in which females will not feed while the carry the eggs in their moth. This observation suggests that recruitments limit the growth of the fish when grown in ponds. Percentage of survival was nearly similar 66% and 68% in unsexed and male monosex treatments respectively. The reason behind for such

Animal Production
15th ESAP-Proceedings 179
mortality is not identified in this experiment. However, stress due to monthly sampling, predators (birds) and natural mortality could be speculated.
Culturing of Orochromis niloticus as male monosex in ponds feed on wheat bran resulted higher mean fish weight than those cultured as unsexed (mixed sex). The growth curves in this study demonstrated different growth phases between and with in the treatments. Unsexed treatment showed linear growth phase while male monosex treatment showed non-uniform growth phases, started with linear then followed by exponential and vice versa. In the exponential growth phase, it will suggest that the food was adequate for fish growth and there was efficient utilization of protein by the fish. In the case of unsexed treatment, though the same supplemental feed was applied, the diets will be utilized as energy supplements for growth and reproduction as well. The growth rate results of the two experiments also confirmed this fact that the daily growth rate of fish in male monosex treatment was twice to that in the unsexed treatment. This suggests that the numbers of recruitments in the unsexed treatment were limiting the growth of the fish.
Instantaneous growth rate (IG) of the fish and total production were calculated for both experiments using the formula:
IG = ln (final size-ln(initial size) Change in time
Initial and final sizes of fish in unsexed and male monosex treatments were 12.9 and 13.5, 18.6 and 21.5 cm respectively. The change in time was 7 months.
Unsexed treatment IG = (ln (18.6)-ln(12.9))/7 IG = 0.0522
Male monosex treatment IG = (ln(21.5)-ln(13.5))/7 IG = 0.0658
Table 6. Cost benefit analysis of male and unsexed Oreochromis niloticus grown in a hectare for a year
Months Unit Treatments Unsexed Male sex Gross revenue Birr 21324.60 35761.20 Variable costs ,, 12378.00 13293.43 Return above variable costs ,, 8946.60 22467.77 Fixed cost ,, 3500.00 3500.00 Total cost ,, 15878.00 16793.43 Net return above total costs ,, 5446.60 18967.77

Ethiopian Society of Animal Production
180 15th ESAP-Proceedings
05000
10000150002000025000300003500040000
6 7 8 6 7 8
Culturing periods in months
Unsexed Male
Treatments
Birr
Gross revenue
Total costs
Net return
Fig. 2 et return from culturing Oreochromis niloticus as male monosex and unsexed harvested in the 6th, 7th and 8th months.
Analysis on the economic data indicated that both treatments showed positive net return for the culturing periods of 6, 7 and 8 months. However, there was a difference in attaining the optimum net return in culturing Oreochromis niloticus as male monosex and unsexed (Figure 2). The unsexed treatment reached its optimum net return after culturing for 6 months whereas the male monosex reached after 7 months of culturing. Even though culturing of Oreochromis niloticus for 8 months showed positive net return, there is higher difference in the decline from the optimum net return between unsexed and male monosex treatments by 65.8% and 24% respectively. The difference in attaining optimum net return in the two treatments is that the presence of high numbers of fries and fingerlings in the unsexed treatment created competition for food and space which will lead to have a population with stunted growth which was not for male monosex treatment.
In conclusion, the results of the present study revealed that culturing of Oreochromis niloticus in ponds as male monosex resulted with higher net return as compared with culturing of Oreochromis niloticus as unsexed. This suggests that culturing of male monosex Oreochromis niloticus in water bodies, waste and marginal lands is profitable and low-tech culturing technique which can be practiced by the local fishermen with little training. This experiment is preliminary and the first of its kind. Therefore, further study has to be conducted using different size fish and different level of input.
Acknowledgments The authors like to thank Ms. Abeba W/Gebriel for her technical assistance in identifying
sexes of the fish and for her great effort during sampling in the experimental period. We would like to extend our thanks to all research staffs of NFLARRC and fishermen (Nigussie and Tsegaye) who worked tirelessly during sampling, feeding and day to day monitoring of the experiment. Last but not least we thank EIAR for providing and releasing the required budget timely and the executing agency NFLARRC in taking the leading role for the completion of the experiment.

Animal Production
15th ESAP-Proceedings 181
References Adamneh Dagne (2004) Abundance and species composition of Zooplankton in the Rift Vally Lake-Lake
Ziway. MS.c thesis, UNESCO-IHE Institute for Water Education. 72pp.
Balarin J.D. and Hatton, J. (1979) Tilapia: A guide to their Biology and culture in Africa University of stirling, Scotl and,6o p.3. Fernado C.H. ( 2002) A Guide to Tropical Freshwater Zooplankton. Identification, Ecology and Impact on Fisheries. Backhuys Publishers, Leiden, 291pp. 4.
Getachew Tefera and Fernando C.H. (1989) Substitution of organic manure for pelleted feed in tilapia production. Aquaculture, 101: 213-222.
James E. Rakocy and Andrew S. McGinty (1989) Pond culture of Tilapia. SARC Publication No. 280. 6. Kebede Alemu (2003) The growth performance of O. niloticus reared in fresh water ponds loaded with varying levels of poultry manure.
Lowe Mc connell (1979) The biology and culture of Tilapia
Moriarty d.j.w. (1973) The physiology o digestion of blue green in Chichlid fish, Tilapia nilotica. Journal of Zoology. London, 171: 25-39.


Animal Production
15th ESAP-Proceedings 183
Economic Valuation of Phenotypic Traits: An Impetus for Market
Orientation of Livestock Production Systems?
Girma Tesfahun Kassie1*, Clemens C.B.A. Wollny2, Awudu Abdulai3, Adam Drucker4, and Workneh Ayalew1
1International Livestock Research Institute, P.O.Box 5689, Addis Ababa, Ethiopia, 2Bingen University of Applied Sciences, Berlinstrasse 109, 55411 Bingen/Rhein, Germany, 3University of Kiel, Olshausenstr. 40, Room: 106, 24098 Kiel, Germany, 4School for Environmental Research, Charles Darwin University, Darwin NT 0909, Australia
Abstract
This paper aims at presenting the importance of economic valuation for the market orientation of livestock production systems in Ethiopia. Reorientation of livestock production systems towards consumer preferences and demands through timely and comprehensive transformation is currently the main agenda among the stakeholders of livestock development. Market orientation of livestock production system requires proper valuation of both traded and non-traded products and services generated from the system. Intermediate results based on a sample of 275 households in Dano district of Central Ethiopia revealed that farm households have consistent preferences for the different phenotypic traits of the animals they keep in the farms and buy from the market. Economic valuation of these preferred traits of the indigenous cattle population is one of the inputs to increase the dynamism and efficiency of the livestock production system given the need for market orientation. The valuation would also help in fine tuning livestock improvement interventions to enhance the intensification and commercialization of the traditional livestock keeping systems predominant in agrarian Ethiopia.
Introduction Livestock resources contribute on average 35% and up to 80% of agricultural GDP in some
Sub-Saharan African (SSA) countries (ILRI, 2003). The livestock wealth of communities in Africa is not merely a source of food, or a means of income, or a marginal enterprise. Rather, it is much more important asset buffering livelihood shocks due to failures in inert resources and enterprises, absorbing production risks that happen in more risky farm enterprises, building assets for vulnerable communities, and saving lives under desperate social scenarios. This way, it significantly contributes towards achieving food security at household level.
Ethiopia is said to have larger livestock resource than any country in Africa. An estimated 42 million cattle, 15 million sheep, 14 million goats, and 7 million pack animals, among others, exist in private holdings (CSA, 2004). The national animal genetic resource (AnGR) status report by the Institute of Biodiversity Conservation (IBC) shows that there are 25 cattle, 13 sheep, 15 goat, 4 camel, 4 donkey, 2 horse, 2 mule and 5 chicken indigenous breeds identified so far in Ethiopia. There are also 3 dairy cattle, 7 sheep, 7 chicken and 2 goat exotic breeds used for food and agriculture (IBC, 2004).
Although Ethiopia has presumably the largest livestock population in Africa, performance in the production of major food commodities of livestock origin has been quite low (Befekadu and

Ethiopian Society of Animal Production
184 15th ESAP-Proceedings
Berhanu, 2000). Even at its current undeveloped state, the sector contributes 30-33% of the national agricultural Gross Domestic Product (GDP) and 15-16% of the national foreign currency earnings (Ayele Solomon et al., 2003; Sileshi Ashine, 2003).
The livestock production system of the country at large is predominantly subsistence oriented whereby the livestock products and services are primarily produced for household/on farm consumption. The system is also a low input production process with most of the required inputs supplied by the family. The feeding system is virtually entirely dependent on natural pasture and free grazing. Very few areas in the country practice cut and carry fodder feeding regime or rotating paddock system. Such a system can hardly meet the growing demand for livestock products and services due to the ever increasing human population.
Reorientation of livestock production systems towards consumer preferences and demands through timely and comprehensive transformation is currently the main agenda among the stakeholders of livestock improvement. Market orientation of livestock production system requires proper valuation of both traded and non-traded products and services generated from the system. This is why eliciting farmers’ preferences of the phenotypic characteristics of livestock and estimating the economic values of these characteristics become crucially important. Proper identification and valuation of the different characteristics would make resource allocation decisions among the different livestock improvement interventions for commercialization of the system quite fast and easy. This paper aims at showing how eliciting and valuation of the preferred phenotypic traits would facilitate transformation of livestock production. The next section briefly describes what economic valuation of the phenotypic traits means. Section three provides an explanation of the market orientation concept as related to livestock production. Section four shows how economic valuation and commercialization of livestock production are related. Section five presents an example from a case study in Dano district of Central Ethiopia. The final section presents concluding remarks.
What is Economic Valuation of Phenotypic Traits? The fitness of local breeds of livestock for the diverse needs and objectives of subsistence and
semi-subsistence livelihoods emanates from the various traits they have as a result of immense genotypic and environmental processes. Sustainable development of the livestock sector and concomitantly the improvement in such livelihoods, therefore, depends very much on properly identifying, understanding, valuing, prioritizing, and maintaining the important traits of the livestock.
Any strong argument in favor of conservation of animal genetic resources in general and domestic farm animal genetic resources in particular, needs to be substantiated with strong economic logic clearly implying why a society has to conserve given the unfavorable market trend. Roosen et al. (2005) argue that the value of livestock breeds is not captured completely in the market because of the (quasi) public good character of genetic resources. For this reason, methods for valuing livestock biodiversity have to go beyond the market place. With specific reference to developing countries, the difference between the market value of a particular livestock genetic resource and its total economic value to humans is particularly large (Roosen et al., 2005).
Some research activities have been carried out in the area of economic valuation of traits of animal genetic resources preferred by producers, who are the primary beneficiaries of

Animal Production
15th ESAP-Proceedings 185
improvements in AnGR (Drucker, 2004a, 2004b; Wollny, 2003). Earlier undertakings are in developed countries of North America and Europe. Ladd and Gibson (1978) conducted a research to estimate the worth of a trait of an animal using the production function approach in the United States. Kulak et al. (2003) also used production function approach to estimate values of sheep traits, taking only two of them, to compare values calculated with and without consideration of risk due to price changes. Sy et al. (1997) did a research in Canada aimed at economic valuation of the traits of cattle preferred by three groups of producers using consumer demand approach.
Scarpa et al. (2003a) quantified the economic values of the traits of a creole – local – pig in Yacutan Mexico. Similarly, Scarpa et al. (2003b) have estimated the values for the traits of indigenous cattle in Kenya while comparing methods which depend on stated and revealed preferences of consumers. Both studies used the consumer demand approach instead of the production function approach. Tano et al. (2003) estimated the economic values of traits of indigenous breeds of cattle focusing on trypanotolerance.
As a new area of economic investigation, there are still some differences among researchers in methods of trait data collection, preference elicitation, and data analysis. Revealed preference approach of data generation was used by few researchers (e.g., Richard and Jeffrey, 1996; Jabbar and Diedhiou, 2003) while others used stated preference approaches (e.g., Sy et al., 1997; Scarpa et al., 2003a, 2003b; Tano et al., 2003).
Contingent valuation and conjoint analysis are the two main stated preference methods used to elicit preferences of respondents for cattle traits (e.g. Sy et al., 1997; Tano et al, 2003) But, very recently researches advocating choice modeling (e.g., Scarpa et al., 2003a) are coming up. The other convergence of research in this thematic area is the data analysis part. Discrete choice models are being employed universally in economic valuation studies as they convincingly relate the stated value of the good to the perceived utility of the characteristics of the good. In the case of revealed preference studies the empirical estimation is solely hedonic price function (Roosen et al., 2005).
Market Orientation Market orientation is a wide concept which can be defined in different ways depending on the
biophysical and socioeconomic patterns of the production system. Different writers have used different terminologies to denote the structural transformation of the production system – in this case the livestock production system – towards the consumer preferences and profit maximization. For example, Pingali and Rosegrant (1995) and Quiroz and Valdés (1995) used the concept of agricultural commercialization, Delgado (1995) and Barghouti et al. (2004) used agricultural diversification whereas Timmer (1988) and Nindi (1993) employed the concept of transformation in agricultural production context. The essential elements in all of the theories are consumer preferences, profit maximization and dynamism. This paper employs the definition given by Pingali (1997) that market orientation is the production of goods and services with the required quantity and quality level as determined by the demand in the market. Market orientation also implies dynamic, developed, demand driven, high quality, profit maximizing, high input, and diversified production system.

Ethiopian Society of Animal Production
186 15th ESAP-Proceedings
Economic Valuation and Market Orientation Economic valuation of phenotypic traits starts from elicitation of the preferences of consumers
of the livestock raised or bought from the market. This preference underlies the willingness to pay for the traits. The economic value to be attached for each of the traits therefore estimates the price the consumer/farmers would be willing to pay for the specific trait of the animal. Market orientation, as indicated above, is principally about reorienting the production system to generate products and services demanded by the consumers. The demand of the consumers is embedded in the preference of phenotypic characteristics and the most demanded would have higher economic values. Therefore, the livestock production system would focus on the preferred characteristics of the animals in order to secure sustainable market share and commercialize the whole system.
In addition to the change in the collegial relationships which the professional community used to work with (Zohrabian et al., 2003), the ratification of the Convention on Biological Diversity (CBD, 1992) has brought about the issue of attaching economic values of species/breed/trait preferences both for crops and animals for sustainable management of genetic resources. Attaching economic values for preferred breeds or traits of animals in a breed is not straightforward. For easily marketable goods and services, markets usually provide important information about intrinsic values (Roosen et al., 2005) through the fact that market prices reflect the relative scarcity of traded goods and preferences for these goods. However, for (quasi) public goods markets are not available to provide such information. While farm animals can be considered as private goods, animal genetic resources embedded in these animals can be considered as quasi-public goods (Scarpa et al., 2003b). Markets generally fail to capture all classes of economic value, especially when a resource has public good properties (non-rival, non-excludable, or non-transparent), as do genetic resources (Drucker, 2004a).
The development of the economic values, therefore, makes resource allocation and marketing decisions more rational and welfare maximizing. There would also be a shift in enterprise choice as conventional wisdom or belief might also be changed as found out by Ayalew et al. (2003) that conventional productivity evaluation criteria were inadequate and biased towards crossbred animals with readily marketable products and services while the total welfare gain from indigenous breeds was not less at all. This would increase the efficiency with which resources are used and outputs are mixed so that producers would maximize their profits. This integrity of the production and marketing decisions would result in comprehensive transformation of the production system with due consideration of the intrinsic values of the different components of the system. This is essentially an input from the whole process of economic valuation for sustained market orientation of the (Semi-) subsistence livestock production system.
An Example from Central Ethiopia A comprehensive study is being conducted in Dano district of West Shewa zone in central
Ethiopia with the general objective of estimating the economic values of the preferred phenotypic traits of the indigenous cattle population in the district. The research focuses on the elicitation of the preferences of phenotypic traits, estimating the economic value of each of the traits, and comparing these stated preferences with the revealed ones as observed in the actual transactions in cattle markets. The research was justified for the basic reason that prices of animals are determined mainly based on phenotypic and qualitative traits than quantitative traits such as live weight or carcass weight as commonly practiced in developed markets.

Animal Production
15th ESAP-Proceedings 187
Intermediate results based on a sample of 275 households revealed that households have consistent preferences for the different phenotypic traits of the animals they buy from the market. The preferences are strongly influenced by the purpose of buying and/or selling and by the occupation of the buyer (butcher, farmer, or live animal trader). The report by Kassie (2005) shows that livestock keepers in Dano district and livestock buyers in the markets, wherein cattle from the district are traded, look for specific traits to determine the price of the cattle they want to buy or sell. At the farm-level, important traits of male cattle include origin, age, plowing strength, body size, and calf vigor.
In the markets, farmer-buyers focus more on plowing strength, age, origin, calf vigor, and body size, in order, to set the price of the male cattle they want to buy. For female cattle, farmers give priority to fertility (in terms of the number of calves and calving interval), age, calf vigor, origin, milk yield, and body size, in order, when asked in their villages. In the markets, farmer buyers look at origin, milk yield, age, fertility, calf vigor, and body size. These trait preferences are the main elements in determining the willingness to pay of the livestock keepers in Dano district and the relevant markets.
This explicit elicitation of the trait preferences of livestock keepers and traders shall help in refining cattle type selection for both production and reproductive purposes. Elicited preferences are apparently the revealed demands expressed through the attributes (phenotypic characteristics) of the good (in this case, cattle). This is a real world example of the Lancasterian utility theory which states that goods are not the direct objects of utility; rather it is the characteristics of the goods from which utility is derived (Lancaster, 1966).
Estimating the economic values for these preferred traits would also add value to the decision making process in selecting cattle types with specific and useful characteristics. If research and development efforts make use of the result, then livestock production will be reoriented towards satisfying the needs and wants of the consumers and concomitantly towards maximizing profit. The research results are expected to develop a local level capacity and a middle and upper level awareness in this regard to transform the low production and subsistence production to highly productive and market oriented one.
Conclusions Market orientation of the livestock production system is not an alternative any more, rather
an obligatory option that has to be designed and started sooner than later. This orientation requires a number of activities and changes both with in and out of the production system. External factors are crucially important and yet reorientation starts from structural transformation of the system itself in order to make it responsive to the market demands and efficient in allocating resources and choosing enterprises. Economic valuation of the preferred traits of the indigenous cattle population is one of the inputs to increase the dynamism and efficiency of the livestock production system. Consumer preferences would be identified, knowledge about the preferred characteristics of the animals would be generated, and estimation of the marginal economic gains from improvement of a trait will be possible as a result of economic valuation. This should be an indispensable component of the overall research and development effort in the livestock production arena.
Currently comprehensive research activities are being carried out by International Livestock Research Institute (ILRI) and collaborating institutions in Africa – specifically in Benin,

Ethiopian Society of Animal Production
188 15th ESAP-Proceedings
Ethiopia and Kenya – so as to make use of economic valuation (and generated values) for improving the livelihoods of poor livestock keepers in the continent. We strongly believe that concerted effort from all concerned stakeholders can bring about the well needed reorientation of livestock production and, particularly, economic valuation would strongly reinforce the argument for rational resource allocation in the development, utilization and conservation of the valuable animal genetic resources that countries like Ethiopia are endowed with.
Acknowledgement We would like to thank ILRI-BMZ project for funding this research. The valuable comments of
Habtemariam Kassa, Tadele Dessie, Ashenafi Mengistu and Ekin Keskin on the earlier version of the paper are highly appreciated. We also thank the research staff of Bako agricultural research centre and above all the farmers in Dano district.
References Ayalew, Workneh, J. M. King, E. Bruns, and B. Rischkowsky, 2003. Economic Evaluation of Smallholder
Subsistence Livestock Production: Lessons from an Ethiopian Goat Development Program. Ecological Economics 45(3): 473 - 485.
Ayele Solomon, Assegid Workalemahu, Jabbar M. A., Ahmed M. M. and Belachew Hurissa, 2003. Livestock Marketing in Ethiopia: A Review of Structure, Performance and Development Initiatives. Socioeconomics and Policy Research Working Paper 52. ILRI (International Livestock Research Institute), Nairobi, Kenya. 35 pp.
Barghouti S., S. Kane, K. Sorby, and M. Ali, 2004. Agricultural Diversification for the Poor: Guidelines for practitioners. Agriculture and Rural Development Discussion Paper 1. The World Bank, Washington D.C.
Befekadu Degefe and Berhanu Nega, 2000. Annual Report on the Ethiopian Economy: Volume I, 1999/2000. The Ethiopian Economic Association, Addis Ababa, Ethiopia. 429 pp.
CSA (Central Statistics Authority), 2004. The 2001/02 Ethiopian Agricultural Sample Enumeration (ESAE), Executive Summary. May, 2004, Addis Ababa, Ethiopia.
Delgado, C.L., 1995. Agricultural Diversification and Export Promotion in Sub-Saharan Africa. Food Policy, 20, 225-243.
Drucker, A.G., 2004a. The Economics of Farm Animal Genetic Resource Conservation and Sustainable Use: Why is it Important and What have we Learned? Background Study Paper Number 21. Commission on genetic resources for food and agriculture. FAO, Rome, Italy.
Drucker, A. G., 2004b. Economics of AnGR Conservation and Sustainable Use: Theory, Practice and Implications. In: ESAP (Ethiopian Society of Animal Production) 2004. Farm Animal Biodiversity in Ethiopia: Status and Prospects. Asfaw Yimegnuhal and Tamrat Degefa (eds.). Proceedings of the 11th Annual conference of the Ethiopian Society of Animal Production (ESAP) held in Addis Ababa, Ethiopia, August 28 –30, 2003. ESAP, Addis Ababa.
IBC (Institute of Biodiversity Conservation), 2004. The State of Ethiopia's Farm Animal Genetic Resources: Country Report. A Contribution to the First Report on the State of the World's Animal Genetic Resources. IBC. May 2004. Addis Ababa, Ethiopia.
ILRI (International Livestock Research Institute), 2003. Improving the Livelihoods of Poor Livestock-keepers in Africa through Community-Based Management of Indigenous Farm Animal Genetic Resources. Project Proposal Submitted to German Federal Ministry for Economic Cooperation and Development (BMZ). ILRI. Addis Ababa, Ethiopia.

Animal Production
15th ESAP-Proceedings 189
Jabbar, M. A. and M. L. Diedhiou, 2003. Does Breed Matter to Cattle Farmers and Buyers? Evidence from West Africa? Ecological Economics, 45: 461 – 472.
Kassie, Girma T., 2005. Economic Valuation of the Preferred Traits of Indigenous Horro Cattle in Ethiopia: trait preferences and cattle marketing. Report of a qualitative survey. (Unpublished research report).
Kulak, K., J. Wilton, G. Fox and J. Dekkers, 2003. Comparisons of Economic Values with and without Risk for livestock trait improvement. Livestock Production Science, 79: 183 – 191.
Ladd, G.W. and C. Gibson, 1978. Microeconomics of Technical Change: What’s a Better Animal Worth? American Journal of Agricultural Economics, 60: 236-240.
Lancaster, K., 1966. A New Approach to Consumer Theory. Journal of Political Economy, 74: 132-57.
Nindi, B., 1993. Agricultural Transformation in Sub-Saharan Africa: The Search for Viable Options. Nordic Journal of African Studies, 2(2): 142–158.
Pingali, P.L., and M.W. Rosegrant, 1995. Agricultural Commercialization and Diversification: Processes and Policies. Food Policy 20 (3): 171–85.
Pingali, P.L., 1997. From Subsistence to Commercial Production Systems: The Transformation of Asian Agriculture. American Journal of Agricultural Economics 79 (May): 628–34.
Quiroz, J.A. and A. Valdes, 1995, Agricultural Diversification and Policy Reform,. Food Policy 20, 245-255.
Richards, T.J. and S.R. Jeffrey, 1996. Establishing Indices of Genetic Merit Using Hedonic Pricing: An Application to Dairy Bulls in Alberta. Canadian Journal of Agricultural Economics, 44: 251-264.
Roosen, J., A. Fadlaoui and M. Bertaglia, 2005. Economic Evaluation for Conservation of Farm Animal Genetic Resources. J. Anim. Breed. Genet., 122 (2005), 217 – 228.
Scarpa, R., P. Kristjanson, E. Ruto, M. Radeny, A. Drucker, and J.E.O. Rege, 2003a. Valuing Indigenous Farm Animal Genetic Resources in Kenya: A Comparison of Stated and Revealed Preference Estimates. Ecological Economics, 45: 409-426.
Scarpa, R., A. Drucker, S. Anderson, N. Ferraes-Ehuan, V. Gomez, C. Risoparion and O. Rubio-Leonel, 2003b. Valuing Animal Genetic Resources in Peasant Economies: The Case of the Box Keken Creole Pig in Yacutan. Ecological Economics, 45: 427-443.
Sileshi Ashinie, 2003. Managing Water for Livestock and Fisheries Development. In: Integrated Water and Land Management Research and Capacity Building Priorities for Ethiopia. Proceedings of a MoWR/EARO/IWMI/ILRI, International workshop, ILRI, Addis Abeba, Ethiopia, 2-4 Dec. 2002.
Sy, H. A., M.D. Farminow, G.V. Johnson and G. Crow, 1997. Estimating the Values of Cattle Characteristics Using an Ordered Probit Model. American Journal of Agricultural Economics, 79: 463-476.
Tano K., M.D. Faminow, M. Kamuanga, and B. Swallow, 2003. Using Conjoint Analysis to Estimate Farmers’ Preferences for Cattle Traits in West Africa. Ecological Economics, 45: 393 –408.
Timmer, C.P., 1988. The Agricultural Transformation. In Handbook of Development Economics, edited by H.B. Chenery and T.N. Shrinivasan. Amsterdam: North Holland.
Wollny, C. B. A., 2003. The Need to Conserve Farm Animal Genetic Resources in Africa: Should Policy Makers be Concerned? Ecological Economics, 45: 341-351.

Ethiopian Society of Animal Production
190 15th ESAP-Proceedings
Zohrabian, A., G. Traxler, S. Caudil, and M. Smale, 2003. Valuing Pre-Commercial Genetic Resources: A Maximum Entropy Approach. American Journal of Agricultural Economics, 85: 429 – 436.

Animal Production
15th ESAP-Proceedings 191
Spatial differences in soil nutrient flux and stocks in Ethiopian highland
mixed farming system: implications for livestock nutrient redistribution
and sustainability of the system
Amare Haileslassie
International Livestock Research Institute (ILRI), P. O. Box 5689, Addis Ababa, Ethiopia, Email: [email protected]
Abstract Dwindling soil fertility has become an increasingly urgent problem in tropical agro-
ecosystems, an observation confirmed by farmers, researchers and policy makers. This paper reports how nutrient redistribution (by livestock) and inputs affects the degree of variability of nutrients stocks, fluxes and sustainability of different land uses in enset based cereal farming system. We collected information on farmers’ resources and nutrient management practices from stratified randomly selected households in Galesa watershed in the Central Highlands of Ethiopia. In addition, we collected soil samples from each land use and calculated nutrient stocks, partial and full nutrient balances (N, P and K) for one cropping season. Our results show that within the enset-based system, a strong redistribution of N, P and K took place between the meadows- cereals- homestead fields. It is also evident that the ‘nutrient source fields’ have lower nutrient stocks and higher degree of out flux, while the ‘destination’ fields are accumulating nutrients and showed significantly higher stocks of N, P and K. This pool can be a potential source of nutrient loss to the environment in the form of leaching, denitrification and thus incurring cost of inorganic inputs to the farm households. Indeed, the total deliberately manured area (homestead; 6%) is small compared to the size of areas where nutrients are transferred from (distant fields). In conclusion integrating livestock into the production system per se does not ensure sustainability on a significant part of the cultivated land in mixed farming system, unless mechanisms for optimum transfer between the fields are introduced.
Key words: Highland farming system; nutrient stocks and fluxes; livestock; nutrient redistribution; nutrient accumulation; sustainability; livestock.
Introduction
Dwindling soil fertility has become an increasingly urgent problem in tropical agro-ecosystems, an observation confirmed by farmers, researchers and policy makers (Stoorvogel and Smaling, 1998). In Ethiopia, the highlands (>1500m elevation) occupy 44% of the area of the country and are home to 90% of the human population and 75% of livestock. Soil nutrient depletion and related low agricultural productivity are serious problems (Tilahun et al., 2001, 2005; Haileslassie et al., 2006). In a study on nutrient balances at national and regional level, Haileslassie et al., (2005) reported large variations in the nutrient balances of different cropping systems, ranging from nutrient accumulating cropping systems (e.g. enset, Ensete ventricosum) to cropping systems including most cereals (e.g. teff, Eragrostis tef) with strongly negative nutrient balances.

Ethiopian Society of Animal Production
192 15th ESAP-Proceedings
It is argued that integration of livestock into farming system is the way to sustain agricultural productivity via redistributing and recycling nutrients between and within ecosystem compartments (e.g. primary, secondary and household) (De Jager et al, 1998; Van den Bosch et al., 1998)). However, the roles of livestock in this nutrient redistribution and recycling are poorly understood (Haileslassie et al., 2006). In contrast, the climatic and socioeconomic change currently taking place suggests (e.g. population pressures and the needs for agricultural intensification) that sustaining the productivity of an increasingly fragile ecosystem requires a better understanding of these nutrient redistribution and recycling mechanisms and the development of new and innovative management strategies (Achard and Banoin , 2003).
This paper reports on how smallholder farmers in Galesa watershed in the central high lands of Ethiopia manage their soil using livestock as nutrient redistributing and recycling agent. The main objectives were: 1) to examine the extent of nutrient gains and losses and ecosystem sustainability in different land use systems of the watershed (by calculating nutrient balances); and 2) Based on the sources, paths and destination of different fluxes, to discuss the mechanisms of nutrient redistribution and recycling by livestock. Materials and methods Study area: biophysical settings
Galesa watershed is situated on the Western escarpment of the Rift Valley in the Central Highlands of Ethiopia (Figure 1). Farmers in the watershed practice enset8 based cereals production system. Ecologically the watershed (elevation 2880-3095 m.a.s.l.) is located in the cool highlands (‘Dega’) (FAO 1983; Ethiopian Mapping Agency 1980). Rainfall data from Ginchi (~20 km Southwest of the study site) shows mean annual rainfall of 1117 mm. Soils are well drained; reddish brown; friable clay to clay loams and developed on volcanic rocks (Luvisols). In the 2002/2003 cropping season, the study area was covered by 40% cereals, 36% fallow, 16% meadow, and 6% enset and potato ( Figure 1). More than 92% of the cereal land is planted with barley (Hordeum vulgare). Livestock play an important role in the crop production systems (e.g. draught power, income generation, manure supply, etc (Haileslassie et al., 2006)).
Household sampling and survey
Some 184 farm households were identified in Galesa watershed. Using a participatory wealth ranking method, the households were stratified into three wealth groups. The major criteria used for stratification were the number of oxen and other livestock owned by the farmers, followed by the farm size. Then, a total of 50 (Table 1) farm households were randomly selected from the wealth groups based on their proportional distribution. A semi-structured questionnaire was used to collect information related to farmers’ resources and nutrient management practices (e.g. nutrient inputs). In addition, farm activities of five randomly selected households were intensively monitored.
8
Enset (Ensete ventricosum), is a long-leaved, banana like perennial plant used for food, fodder and fiber production in parts of the Central Highlands and major parts of southern Ethiopia.

Animal Production
15th ESAP-Proceedings 193
Table1. Characteristics of sample farmer wealth groups in an enset based farming system of Central Highlands of Ethiopia
Wealth classes Samples size
Land * holding (ha)
Livestock* (TLU)
Oxen * (TLU)
Rich 10 3.3 12.3 2.4 Medium 20 2.3 6.7 1.5 Poor 20 1.6 2.3 0.5
Tropical Livestock Unit (TLU) conversion factor for cattle=0.75, horses=1, mules=0.66, sheep and goat=0.1 are used a TLU is 250Kg live weight; * are mean values for wealth classes
Soil and land use data
The watershed boundary was delineated by physical observation and Digital Elevation Model (DEM) derived from 10 meters contour interval. The land use was mapped using air photos in combination with a Geographic Positioning System (GPS). Three composite soil samples (0-30 cm depth, each sample consisting of five sub samples) were collected for each land use type in the watershed. The samples were then dried and passed through a 2-mm sieve and analyzed in the laboratory of the International Livestock Research Institute (ILRI), Addis Ababa. Soil pH was determined in 1:2.5 soil water ratio, texture was measured by applying the hydrometer method (Bouyoucus 1951). Available P was determined with the Bray method (Bray and Kurtz 1945), while total N was determined by Kjeldahl digestion, distillation and titration. Exchangeable K was analyzed using an atomic absorption spectrophotometer following an ammonium acetate extraction. Cation Exchange Capacity (CEC) was determined at pH 7 using ammonium acetate as exchanger cation. All statistical methods used are elaborated in Haileslassie et al., (2006).

Ethiopian Society of Animal Production
194 15th ESAP-Proceedings
Figure1. Location and land uses of Galesa watershed
Small streams
Land usesCerealsFallowHomesteadsMeadowNurseryTrees
600 0 600 1200 1800 Meters
N
Study site

Animal Production
15th ESAP-Proceedings 195
Nutrient balances
Five types of major input and output fluxes were considered to calculate N, P and K balances (Smaling and Fresco 1993; De Jager et al., 1998), which are addressed as IN1-5 and OUT1-5 throughout this paper. We estimated nutrient stocks from soil bulk density and nutrient concentration in soil samples. Fluxes, which are directly related to farm management, like inorganic fertilizer input (IN1), organic fertilizers input (IN2), harvested products (OUT1) and residues removed (OUT2), were estimated from the household survey. The ‘hard to quantify flows’ like wet deposition (IN3); symbiotic nitrogen fixation (IN4a); nitrogen fixation by free-living bacteria (IN4b); deposition of nutrients from irrigation (IN5a); leaching (OUT3) and gaseous losses (OUT4) were estimated using transfer functions as elaborated in Haileslassie et al. (2005) and Haileslassie et al. (2006).
Results Soil nutrient gradient across different land uses
In enset-based farming system, land use types closer to residences (enset and potato) had significantly higher pH, available P, P stock, exchangeable K and CEC (Table 2). Meadows also showed significantly higher mean values for available P, pH, total N and N stocks. Farmers in the study area are well aware of soil fertility differences. They use indigenous soil classification methods as basis for soil nutrient management practices, i.e. crops are grown depending on the quality of the soil and nutrient inputs are adjusted accordingly. Crop yields, soil depth, soil color, drainage and workability are the basis for the local soil classification (Haileslassie et al., 2006).
In general, soil nutrient management in the system consists of fallowing (1 year, only for barley areas) and application of manure and household waste to homestead land.
Table 2. Comparisons of mean soil parameters (0-30cm) under different land uses in enset based farming systems, Central Highlands of Ethiopia
Land use Soil parameters
Fallow Enset Potato Cereals Meadow
Bulk density( grcm3-1) 1.16c 0.83b 0.99a 1.03a 0.97a
Clay (%) 35.4a 29.4ab 26.7b 34.7a 26.7b
Silt (%) 47.9 49.9 45.9 39.3 37.3
Sand (%) 16.6b 20.7b 27.3a 26.0a 36.0a
pH 5.1a 5.9b 5.9b 4.9a 5.1a
Organic C (%) 3.3a 4.1ab 4.4ab 2.9a 5.3b
Total N (%) 0.3a 0.4a 0.4a 0.3a 0.6b
C:N 10.5 10.4 10.3 10.0 9.1
N stock(Mg ha-1) 9.8a 12.6ab 13.4ab 9.5a 15.6b
Available P (ppm) 0.4a 8.6b 13.5c 0.5a 0.9a
P stock(Mg ha-1) 2.3a 4.3b 5.2b 2.3a 2.1a

Ethiopian Society of Animal Production
196 15th ESAP-Proceedings
CEC (cmolc kg-1) 27.0ac 36.1b 33.7ab 24.4c 32.0abc
Exchangeable K(cmolc kg-1) 1.0a 4.1b 5.2b 0.4a 0.4a
K stock(Mg ha-1) 48.0 47.0 37.5 44.2 33.3
Comparison is based on one way ANOVA (Tukey’s HSD test; 0.95 confidences); values in a row followed by the same letter are not significantly different; triplicate samples for each land use type.
During months of feed shortage (July-September) fallow land is used for grazing and animal droppings on fallow plots are incorporated into the soil and partly transferred to the homestead. Soil parameters (pH, organic matter, available P, total N, total P, total K, exchangeable K and CEC) of these land uses receiving major portion of manure produced in the watershed showed significantly higher values of soil quality indicators. Land uses like fallow and cereal showed no statistically significant differences. However, effects of fallow on improvements of soil properties were remarkable.
Organic and inorganic inputs
Crops are harvested by uprooting (e.g. pulses, enset, and potato) or mowing close to the surface (e.g. cereals). Fine sized residues (wheat, barley) are invariably used as animal feed with priority given to lactating cows, oxen and calves. Enset leaves are used as animal feed in years of extended dry season, but most often they are incorporated into the soil. During off cropping seasons arable fields are also accessible for grazing (i.e. aftermath grazing). The ingested feed pass through animals and used as input to the system (recycling). Thus, an organic fertilizer (manure) constitutes the major portion of nutrient input by farmers (Figure 2), and the amount varies considerably across different land uses and wealth classes. All wealth classes do not apply fresh manure to their plots. Night droppings of livestock are collected daily, piled in the front yard (for 8-12 months) and spread at the beginning of the short rainy season. In dry seasons, dung (only from cattle) is collected and dried as dung cake to be used for household energy during the rainy season. In the enset-based system farms had significantly larger size (2.2 ha) and included more livestock (6.15 TLU, Tropical Livestock Unit) compared to the farms of teff based farming (4.1 TLU (Haileslassie et al., (2006)). TLU correlated positively with farm size (r=0.56; p=0.00) and with manure application (r= 0.60; p=0.00).
Urea and DAP were the only mineral fertilizers applied to cereals. In enset-based system, farmers mix DAP and urea at the rate of 2:1 ratio before application. Normally it is broadcasted during seeding and incorporated into the soils with oxen drawn ploughs. Farmers in the enset-based system apply higher quantities of organic fertilizer than the inorganic fertilizers (Figure 3). In the study area, fertilizer is applied depending on economic and cultural values and level of soil fertility. Fore example, crops like enset and potato are grown closer to residence and they receive considerable amounts of manure. Analysis of the household survey clearly shows that a much smaller fraction of farmers classified as poor (16%) were applying DAP and urea, while the majority of households classified as ‘rich’ (86%) did use mineral fertilizer. Application of manure showed a similar trend. TLU correlated positively with farm size (r=0.56; p=0.00) and with manure application (r= 0.60; p=0.00)

Animal Production
15th ESAP-Proceedings 197
Figure 2. Share of manure in total nutrient inputs by land use types (enset-based cereals farming)
a)
Rich (n=10) Medium (n=20) Poor (n=20)
Wealth groups( Enset-system)
0
20
40
60
80
100
120
140
160
DA
P an
d U
REA
(kg
ha-1
yr-1
)
a
b
b
p=0.01
b)
Rich (n=10) Medium (n= 20) Poor ( n=20)
Wealth groups ( Enset-system)
0.0
0.6
1.2
1.8
2.4
3.0
3.6
4.2
4.8
Man
ure
( Mg
ha-1
yr-1
)
p=0.00
a
b
c
c)
Rich (n=10) Medium ( n=20) Poor ( n=20)
Wealth groups ( Enset-system)
0.00
0.04
0.08
0.12
0.16
0.20
0.24
Was
te (t
ons h
a-1
yr-1
)
p=0.19
a
a
a
Figure 3. DAP, Urea(a), Manure (b) and Household waste (c) applied by sample farm households under different wealth groups in enset-based farming systems (Tukey’s HSD test at 0.95 confidence intervals; n= sample size; a and b indicate significantly different means)
0
20
40
60
80
100
120
Barley Wheat Potato Enset Fallow Grazing
Land use
shar
e of
man
ure
in
nutr
ient
s in
puts
(%)
N P K

Ethiopian Society of Animal Production
198 15th ESAP-Proceedings
Nutrient balances, stocks and flux rates
Balances: Full nutrient balances were calculated for enset-based cereal farming systems (Table 4). The results indicate a considerable accumulation contrasting with a slight depletion of P. The partial (management related) nutrient balances revealed positive balances for major land uses with the exception of oats, potatoes and meadows (Table 3). The out fluxes (e.g. harvested products) are counter balanced by influxes from livestock manure inputs. On meadows (foot slope) the full nutrient balance was less negative than the partial nutrient balance and this finding can be explained by counter balances of the sedimentation process for nutrient out fluxes by grazing.
Table 3 Partial nutrient balances at land use level in enset based farming systems in Central Highlands of Ethiopia (in kg ha-1 yr –1)
Inorganic and organic +IN2)
Crop yields and crop residues (OUT1+OUT2)
Balances Land uses Area (ha)
N P K N P K N P K Barley 243 23 42 63 16 9 44 7 33 -41 Wheat 13 72 60 34 60 11 55 49 55 12 Oat 1 0 0 0 4 3 8 -4 -3 -8 Potato 39 113 13 129 114 12 140 -1 1 -11 Enset 13 149 32 169 97 13 153 53 19 17 Fallow 321 50 12 65 52 9 48 -2 2 17 Meadow 146 31 7 36 81 13 79 -51 -6 -44 Enset system 776 43 22 45 50 10 59 -6 11 -14
Stocks: Potatoes, enset and meadows land uses had the highest stocks of N (Table 4). P stocks on potato and enset fields were higher than on all other plots. The lowest mean P stock was recorded on cereals land while the highest was found on potato (5.21 Mg ha-1). Highest mean value of K stock was measured on fallow land followed by enset and potato. Annual K depletion relative to its stock was small.
Flux rates: Annual depletion of N stocks was strong under meadows, while N accumulated on enset plots (0.22% of N stock). But when aggregated at farming system /watershed level, annual N-depletion was small (0.12%). Soil erosion, deposition and manure inputs are major fluxes in the watershed.
Table 4 Nutrient stocks and fluxes in enset-based farming systems
Flow and stocks Cereals Potato Enset Fallow Meadow All N-stock( Mg ha-1) 9.5 13.4 12.6 9.5 15.6 11.4 N-flow(kg ha-1yr-1) -10.0 -23.0 +28.0 -19.0 0.0 -12.0 N-flow(%of stock yr-1) 0.1 0.2 0.2 0.2 0.0 0.1 P-stock(Mg ha-1) 2.3 5.2 4.3 2.3 2.1 3.0 P-flow(kg ha-1yr-1) +34.0 -2.0 +20.0 -1.0 +2 +12.0 P-flow(%of stock yr-1) 1.5 0.0 0.5 0.0 0.1 0.4 K-stock( Mg ha-1) 44.2 47.8 47.6 48.0 33.3 44.2 K-flow(kg ha-1yr-1) -43.0 -82.0 -20.0 -27.0 +52.0 -20.0 K-flow(%of stock yr-1) 0.1 0.2 0.0 0.1 0.2 0.1

Animal Production
15th ESAP-Proceedings 199
Discussions and conclusions Spatial differences in nutrient balance and stocks: the role of animal excreta in nutrient
redistribution
In the study area, the partial (management related) nutrient balances did not appear to be dramatically negative, neither for N nor for K. For P the partial nutrient balance was slightly positive (Table 3). Input of manure counter-balance the different output process, particularly on homestead fields. The Galesa watershed loses plant nutrients, but these losses make up only a small fraction of overall nutrient stocks (Table 4), and will probably not endanger agricultural land use in the near future. However, the image of sustainable land use changes quite dramatically if we analyze the nutrient balances of individual land use types or crops, i.e., components of the farming systems (Table 4: full balance). In the watershed system some land use types have clearly negative nutrient balances (e.g. potato) while other components of the system accumulate nutrients (e.g. enset grown on homesteads).
These findings illustrate that although the net losses of the watershed seems to be limited, the considerable transfer of nutrients from the distant fields to homestead caused variation of stocks and fluxes across the subsystems. Similarly some pedogenic processes like erosion transfer or redistribute nutrients between systems and subsystems. For example the eroded material from upland is deposited on the foot slope (grazing areas). Therefore the cause of decreasing productivity on cereal fields, as claimed by farmers, is not because the whole nutrient leaves the system. Instead the redistribution process accumulates nutrient in one of the subsystem (enset fields) while at the same time depleting nutrients from other subsystem (e.g. cereals fields). Balances for meadows are remarkably different in that they displayed a counter balance between the different redistributing agents (i.e. erosion and livestock). From our result it is apparent that farmers are more interested on niche management than the sustainability of the whole system. To maintain healthy ecosystem functioning consideration must be given to the distance fields, from where they drive the bulk of their annual crop production.
Our results also illustrate a general scaling problem when looking at nutrient balances: while many studies at supranational or national scales invariably show strongly negative nutrient balances (e.g. Stoorvogel and Smaling 1998; Haileslassie et al. 2005), this does not necessarily mean that the entire amount of nutrients leave the system, since a significant quantity of nutrients removed from arable land can be deposited on adjacent ecosystems (e.g. meadows), processes which are usually ignored in the aggregated perspective of higher spatial scale studies (Haileslassie et al., 2006). For example, the strongly negative partial nutrient balance for meadows in the enset system was clearly less negative if the full balance was considered. This was caused by the inclusion of erosion and especially deposition, which partly compensated for the negative partial fluxes (e.g. output as grazing by livestock, Table 5).
In contrast to the partial nutrient balances, full nutrient balances have been used as an indicator of sustainability with respect to soil fertility (Whitbread et al. 2003; Nambiar et al.,. 2001; Bouma 2002; Dechert et al., 2004). The utility of full nutrient balances is greatly increased, when they are related to soil nutrient stocks (Van den Bosch et al. 1998). Using nutrient balances and stocks implicitly assumes that the methods used to quantify nutrient stocks actually quantify stocks of available nutrients (Haileslassie et al., 2006). However, major nutrient fluxes like erosion and sedimentation, do not only affect the stock of available nutrients, but they also affect e.g. primary minerals, which have not been weathered yet. For this reason we compare our fluxes to total N, P and K stocks.

Ethiopian Society of Animal Production
200 15th ESAP-Proceedings
In general, the percentage of annual loss of N stocks in study area can exceed 3.5% and spatially vary depending on the magnitude of transfer. This is in agreement with earlier studies arguing that more than 1% removal or enrichment of total N stocks indicate unsustainable agroecosystems (Hilhorst et al., 2000). For the P stocks the estimate is even more difficult, but also here using total P is clearly a large overestimate of P that may become available for agricultural use. In this study, it became evident that redistribution and recycling associated with the distinct features of mixed farming systems account for inter-system variations in stocks and fluxes of N, P and K.
Impacts of farmers livestock management strategies on nutrient redistribution
The use of major portion of crop residues for feed involves removing nutrients from cropping area. Adoption of this practice could be linked to the multiple benefits that accrue to individual households that practice it. However, it has a cost in terms of nutrient recycling as most nutrients are not returned to the cropping land and for it to be sustainable, there is a need for additional nutrients to be sourced externally to the system. Indeed, the discrepancies (in nutrient stock and fluxes) between different land use types /crops (within the watersheds) displayed in our result are caused by well adapted niche management and supported by the livestock compartment as redistributing agent.
In the study areas farmers adapt a strategy of using the foot slope as meadow and uplands for settlement and crop production. Haileslassie et al., (2006) reported that the upper and lower interfluves (landscape units) are more prone to erosion and the removed material is deposited on the foot slope at least temporarily. The implication of farmers’ decision on land use is redistributing this removed nutrient with the sediment back to the upper and lower interfluves areas. This is achieved through livestock-feed-manure relation. However, farmers rather tend to concentrate on specific crops than the sustainability of the entire farming system, which is revealed through considerable transfer of nutrients to homestead areas (compare nutrient stocks and fluxes under enset, potato and meadow). As a result, simultaneous nutrient oversupply on some, and depletion on other fields implies that long-term sustainability is threatened because nutrients are not optimally used. Thus, future soil fertility management research in highland farming systems should be directed towards developing indicators and methodologies, enabling farmers to further improve their nutrient management practises, and promoting optimal nutrient redistribution and input strategies. The potential role of ruminants in terms of improving the rate of nutrient turnover and redistribution mechanisms can be investigated
System’s sustainability
The transfer and recycling of organic nutrient inputs (organic sources) from non-cultivated fields to cultivated fields and from distant fields to homestead fields by animal is one of the major factors for the discrepancy of the magnitude of nutrient depletion and stock. Nevertheless, the studies carried out by Haileslassie et al., (2006) show that the total manured areas (enset and potato farms) is small and thus raising livestock in itself does not ensure maintenance of fertility on a significant part of the mixed farming system ( e.g. cultivated land). The fallow areas, even though the soil fertility gradient is not significantly different from the rest of land uses, remain the key land use form in terms of forage sources and in nutrient transfer from the field to homestead. A similar path exists between cereals field and the homestead. In conclusion,

Animal Production
15th ESAP-Proceedings 201
to make the system sustainable strategies that can address the present problem of niche level management should be sought.
References Achard F. and Banoin M. 2003. Fallows forage production and nutrient transfer by livestock in Niger.
Nutrient cycling in Agroecosystem 65: 183-189.
Bouma J. 2002. Land quality indicators of sustainable land management across scales. Agriculture Ecosystems and Environment 88: 129-136.
Bouyoucus C.J. 1951. A calibration of the hydrometer method for making mechanical analysis of soils. Soil Science 59: 434-438.
Bray H.R. and Kurtz L.T. 1945. Determination of total organic and available forms of phosphorus in soils. Soil Science 9: 39-46.
Dechert G., Veldkamp E. and Anas I. 2004. Is soil degradation unrelated to deforestation? Examining soil parameters of land use systems in upland Central Sulawesi, Indonesia. Plant and Soil 265: 197-209.
De Jager A., Nandwa S.M. and Okoth P.F. 1998. Monitoring nutrient flows and economic performance in African farming system (NUTMON) I. Concept and methodology. Agriculture Ecosystems and Environment 71: 37-48.
Ethiopian Mapping Agency 1980. Contour map of Ethiopia (Ginchi 1:50,000). Ethiopian Mapping Agency, Addis Ababa, Ethiopia.
FAO 1983. Generalized agro climatic map of Ethiopia. Ethiopian Mapping Agency, Addis Ababa, Ethiopia.
Fournier F. 1989. Effect of human activity on soil quality. In: Bouma J. Bregt A.K. (Eds), Land qualities in space and time. International Society of Soil Science, Wageningen, The Netherlands, pp. 25-31.
Haileslassie A., Priess J., Veldkamp E., Teketay D., and Lesschen, P., 2005. Assessment of soil nutrient depletion and its spatial variability on smallholders’ mixed farming systems in Ethiopia using partial versus full nutrient balances. Agriculture, Ecosystems and Environment. 108: 1-16.
Hilhorst T., Muchena F., Defoer T., Hassink J., Smaling E.M.A. and Toulmin C. 2000. Managing soil fertility in Africa: diverse settings and changing practice. In: Hilhorst T., Muchena F.M. (Eds), Nutrients on the move–soil fertility dynamics in African farming systems. International Institute for Environment and Development, London, pp. 1-27.
Nambiar K.K.M., Gupta A.P., Qinglin F.U. and LI S. 2001. Biophysical, chemical and socio economic indicators for assessing agricultural sustainability in the Chinese coastal zone. Agriculture Ecosystems and Environment 87: 209-214.
Smaling E.M.A. and Fresco L.O. 1993. A decision support model for monitoring nutrient balances under agricultural land uses. Geoderma 60: 235-256.
Stoorvogel J.J. and Smaling E.M.A. 1998. Research on soil fertility decline in tropical environments: integration of spatial scales. Nutrient Cycling in Agroecosystems 50: 151-158.
Tilahun A., Takele B. and Endrias G. 2001. Reversing the degradation of arable land in the Ethiopian Highlands. Managing African Soils No. 23. International Institute for Environment and Development, 29 pp

Ethiopian Society of Animal Production
202 15th ESAP-Proceedings
Van den Bosch H., Gitari J.N., Ogaro V.N., Maobe S.A. and Vlaming J. 1998. Monitoring nutrient flows and economic performance in African farming system (NUTMON) II. Monitoring nutrient flows and balances in three districts in Kenya. Agriculture Ecosystems and Environment 71: 63-80.
Walkley A. and Black C.A. 1934. An examination of the Degtjareff method for determining soil organic matter, and a proposed modification of the chromic acid titration method. Soil Science 37: 29-38.
Whitbread A., Blair G., Konboon Y., Lefroy R. and Naklang K. 2003. Managing crop residues, fertilizer and leaf litters to improve soil C, nutrient balances, and the grain yield of rice and wheat cropping systems in Thailand and Australia. Agriculture Ecosystems and Environment 100: 251-263.