BOOK OF PROCEEDINGS - CiteSeerX
266
AICWER 2013 BOOK OF PROCEEDINGS Abuja International Conference on Water, Energy and Environmental Research November 25-28, 2013, Abuja, Nigeria Edited by Jacinta A. Opara,PhD
-
Upload
khangminh22 -
Category
Documents
-
view
5 -
download
0
Transcript of BOOK OF PROCEEDINGS - CiteSeerX
AICWER 2013 BOOK OF
PROCEEDINGS Abuja International Conference on Water, Energy and
Environmental Research
November 25-28, 2013, Abuja, Nigeria
Edited by
Jacinta A. Opara,PhD

©2013 International Association for Teaching and Learning
All rights reserved
Printed and Published in the Kingdom of Spain
First Published in 2013
Editorial Office Calle Joan Miro 4 bajo
18140 Granada Spain
Tel/Fax: 958-59-23-65
The right of the Editors to be identified as the authors of this work has been asserted according to relevant EU laws and regulations. The publication is indexed and registered at Ministry of Culture, Madrid
Typeset and Illustrations by Luis Cabellero(Spain) Proofreading by Ms Betty Oruahwo and Veronica Ezebuiro(Nigeria) Cover Design by Christophe Guerrero(France) Project Manager: Joseph Kosu(Ghana) Project Assistant: Nkeiru Kamalu and Felicia Uwakwe(Nigeria) Lithography: Beverly Resources, Spain Sub-Editing: Dominic Connolly(Ireland) Media and ICT: Prince Alexis(Ghana) Project Director:Dr Asoluka C. Njoku Executive Director: Prof Peter Akanwa
Apart from any fair dealing for the purposes of research or private study, or criticism or review, as permitted by European Commission, this publication may only be reproduced, stored or transmitted, in any form or by any means, electronic, mechanical, photocopying, recording or otherwise with the prior permission in writing of the publishers.
Message
It is a great pleasure to furnish you herewith the Proceedings which herein contains a collection of the papers presented at Abuja International Conference on Water, Energy and Environmental Research (AICWER2013) organized by African Society for Scientific Research and African Association for Teaching and Learning in cooperation with several partners and collaborating journals in the international community. The conference was held November 25-28, 2013 at FCT Education Resource Center, Abuja FCT, Nigeria.
The AICWER series is an academic activity for interested scholars, scientists, technologists, policy makers, corporate bodies and graduate students. The aim of the conference is to diffuse research findings and create a conductive environment for scholars to debate and exchange ideas that lead to development in social, political, cultural and economic spheres of the global community.
Following the call for papers by the International Scientific Commission, papers we received more than 220 proposals from 25 different countries from all continents. As a commitment to the vision and mission of academic excellence and integrity, each paper was anonymously reviewed by two members of the editorial sub-committee of the Commission. This book of proceedings contains a selection of the papers presented at the conference.
We wish to express our sincere thanks to a high powered Adhoc Local Orgainising Committee composed of eminent scholars including Professor Peter U. Akanwa, Professor Anele Kinikanwo, Professor M.O.N Obagah,Professor Addison Wokocha, Professor Oby Okonkwor, Professor Gerhard Berchtold, Professor Samir Mohamed Alredaisy and others. We thank the cooperating partners for their cooperation and support for the project. We express our profound gratitude to all and sundry especially our Special Guests, delegates, reviewers, the media, the Nigerian foreign missions and all the cooperating partners for their contributions in promoting this noble academic event.
Please read on!!!
Jacinta A. Opara,PhD Convenor, Abuja International Conference on Water, Energy and Environmental Research Visiting Associate Professor, Universidad Azteca, Chalco-Mexico

Programme Committee Chief Patron
Professor Addison M. Wokocha Registrar/Chief Executive,Teachers Registration Council,Abuja-Nigeria
Congress Chair
Prof. Shobana Nelasco,Senior Research Fellow, Bharathidasan University, India
Congress Co-Chairs
Prof Gerhard Berchtold, Vice-Rector, Universidad Azteca, Mexico
Dr Austin N. Nosike, The Granada Management Institute, Spain
Prof. M.O.N. Obagah,Ignatius Ajuru University of Education, Port Harcourt, Nigeria
Dr Nkasiobi Silas Oguzor,Provost, Federal College of Education (Technical), Omoku-Nigeria
Professor Oby C. Okonkwor, Nnamdi Azikiwe University,Awka-Nigeria
Prof. Samir Mohamed Alredaisy,University of Khartoun, Sudan
Convenor
Dr Jacinta A. Opara, President,African Association for Teaching and Learning
Special Guest of Honour
Professor Dr David Iornem, Commonwealth University
Guest Speaker
Professor Dr. Hari Prasanna Deka Boruah CSIR-North East Institute of Science and Technology, Assam, India
Secretary-General
Associate Professor(Dr) Asoluka C. Njoku Dean, School of Social Sciences, Alvan Ikoku College of Education, Owerri-Nigeria
Moderators
Associate Professor(Dr) Ephraim Orikpe , Federal College of Education(Tech),Umunze-Nigeria
Professor Kinikanwo Anele, Faculty of Social Sciences, University of Port Harcourt, Nigeria
Professor Peter U. Akanwa, Dean, College of Business Studies, Imo State University, Nigeria
Associate Professor(Dr) Andrew Jatau, Federal College of Education, Pankshin-Nigeria

Conference Bureau Chief
Ms Betty Oruahwo,MBA, Secretary,African Society for the Scientific Research,Accra-Ghana
Ms Vera Ezebuiro, University of Nigeria,Nsukka-Nigeria
Deputy Bureau Chief
Ms Ann Chukwu,MSc, Beverly Resources
Ms Nkeriru Kamalu, Imo State University, Owerri-Nigeria
Ms Felicia Uwakwe, Federal University of Technology, Owerri-Nigeria
Bureau Executive
Vivian Akujobi, Beverly Resources Frank Chukwu,Beverly Resources Prince Alexis, Beverly Resources

AICWER2013
Scientific Advisory Board
Jovan Shopovski,University Ss “Cyril and Methodius” Skopje, Macedonia
Sibylle Heilbrunn, Ruppin Academic Center, Emek-Efer, Israel Sule Kut, Istanbul Bilgi University, Turkey
Arda Arikan, Akdeniz University, Antalya, Turkey Maryam Chkhartishvili, Tbilisi State University, Georgia
Natarajan Gajendran,Indian Society for Education and Environment A. R. Sayfoo,Vocational Training Institute, Mauritius
Kinikanwo A. Anele, University of Port Harcourt, Nigeria A.C. Nwokocha,Michael Okpara University of Agriculture, Umudike-Nigeria
Mahwish Washeed,International Islamic University, Pakistan Raphael C. Njoku,University of Louisville, USA
S.S. Lloyd,West Coast University, Panama Sodienye Austin Abere,Rivers State University of Science and Technology, Nigeria
Timothy A. Falade,New York Institute of Technology, Jordan Pedro Cravo,International Association for the Scientific Knowledge, Portugal
Fernando Alberto Ferreira,Polytechnic Institute of Santarem, Portugal John A. Idumange,Niger Delta University, Nigeria
Orifjan Namozov,Prague Development Centre(PRADEC), Czech Republic Ivan Genov,Science and Education Foundation, Bulgaria
Bassey Ubong,Federal College of Education (Technical), Omoku-Nigeria Abraham I. Oba,Niger Delta Development Commission, Nigeria
Jozsef Pal, University of Szeged, Hungary Dimitri A. Sotiropoulos, University of Athens, Greece
Werner J. Patzelt, Univerisity of Dresden, Germany Vincent Hoffmann-Martinot, University of Bordeaux, France
Mohamed Ben Aissa, University of Tunis, Tunisia Marco Cilento, Sapienza University of Rome, Italy Werner J. Patzelt, University of Dresden, Germany
Emanuele Santi, African Development Bank, Tunis, Tunisia Kamaruzaman Jusoff, Universiti Putra Malaysia
Nkasiobi S. Oguzor, Federal College of Education (Technical), Omoku, Nigeria Jacinta A. Opara,President, African Association for Teaching and Learning
Sokol Pacukaj,Aleksander Moisiu University, Albania Lisa Licata, Sapienza University of Rome
Alessandro Pistecchia, Sapienza University of Rome Anele Nwokoma, American University of Nigeria Antonello Battaglia, Sapienza University of Rome
Oby C. Okonkwor, Nnamdi Azikiwe University,Awka-Nigeria

Co-Organising Partners
Abuja International Conference on Water, Energy and Environmental Research (AICWER2013); is organized by African Society for Scientific Research (ASSR) and African Association for Teaching and Learning with the Support and Cooperation of: International Association for the Scientific Knowledge, Portugal;Mediterranean Center for Social and Educational Research, Italy; Federal College of Education(Technical), Omoku; European Scientific Institute, Macedonia;Universidad Azteca, Mexico;Ignatius Ajuru University of Education-Nigeria;Human Resource Management Research Society, United Kingdom;Universidad Central de Nicaragua, Nicaragua; Raphael Nosike Foundation and Beverly Resources
CHARACTERIZATION OF HOUSEHOLD WASTE IN KINONDONI MUNICIPALITY, DAR ES SALAAM Aisa S. Oberlin
Department of Civil Engineering, Dar es Salaam Institute of Technology,
P.O. Box 2958 Dar es Salaam, Tanzania Abstract This study was carried out in Kinondoni municipality to determine the per capita daily waste generation rate and waste composition, and correlate these variables with socioeconomic factors of the householders. Questionnaires, interviews, waste characterization, and observation were used in data collection. A sample of 75 respondents residing in middle and low-income settlements were selected for the study. The results showed that the generation rate of household wastes was 0.44 kg/persons/day. On average household solid waste consisted of kitchen/food waste, paper, plastics, glass, metals, aluminium and other wastes, the proportion of each waste was approximately 74.10%, 8.30%, 9%, 0.75%, 0.60%, 0% and 7.25%, respectively An evaluation of the relationship between daily per capita generation of household waste and socio-economic factors indicated a weak positive correlation with household size (r = 0.219, and r = 0.138 for middle and low-income households respectively). While, the obtained value of the Pearson coefficient (r) indicated very weak negative correlation (r = -0. 108 and r= -0.096 for middle and low-income households respectively) between the per capita daily waste generation and the household income. These findings suggest that there is a need to examine other factors that underlie the generation of household wastes. Key words: household waste, solid waste management, waste characterization, socio-economic factors, Kinondoni Introduction To plan a solid waste management strategy for a given city or municipality, it is essential to know the quantity of waste generated and its composition. Various authors in solid waste management have described the importance of waste characterization. Waste characterization studies provide useful data on the composition and quantities of solid waste streams (Newenhouse and Schmit, 2000). Bolaane and Ali, (2004) attributed that knowing the waste characteristics is important to waste management policy making and monitoring. Chung and Poon, (2001) stated that data from waste characterization are essential for waste disposal facilities planning and waste management policy formulation. Solomon (2011), reported that the waste characterization study on household level provides more detailed, accurate and crucial information on waste composition and the per capita daily waste generation. According to Bandara et al. (2007), the per capita waste generation rate is needed to predict future waste generation rates and for evaluating the waste generation trends in given communities. Qu, Li et al. (2009), indicated that compositional studies are important for several reasons, such as the need to estimate material recovery potential, to identify sources for component generation, to facilitate the design of processing equipment, and to maintain
compliance with national laws. For example, if solid waste generated at household level consists of large portions of kitchen or food waste, this indicates that frequent collection is needed due to its nature of decomposing rapidly and bringing foul smell. It would be impossible to successfully understand and manage waste if management does not consider waste generation and composition. So as to maintain good waste management, we need not only accurate data on waste generation but also information on the factors that contribute to their generation. In several studies a relationship between waste characteristics (per capita daily waste generation and waste composition) and socio-economic factors is shown. Amongst other socioeconomic factors that have been said to influence per capita daily waste generation are household size and income of the households.
The recent studies of Parizeau et al. (2006), Bandara et al. (2007) and Ojeda-Benitez et al. (2008), concluded that as the number of household members increases, waste generation per capita has been found to decrease. Bandara et al. also concluded that as the number of people in a household increases, there is a reduction in the per capita waste generation rate, thereby establishing the fact that when waste generation parameters are considered, per household waste generation is as important as the per capita waste generation rate. Other studies with similar observations include that of Sujauddin et al. (2008), Jenkins (1993), Mosler et al. (2006), Qu et al. (2009). Abu Qdais et al. (1997), found a statistically significant but weak negative relationship between waste generation per capita and household size in Abu Dhabi. While Bolaane and Ali (2004), show that there is a poor relationship between the number of persons in a household and the waste generation rate. Studies of Hong et al. 1993; Jenkins 1993; Jenkins et al. 2003; Bandara et al. 2007; Afroz et al. (2010), correlated higher income with higher per capita daily waste generation.
In Dar es Salaam there is no recent waste characterization study which has been carried out to document the per capita daily waste generation and composition of household waste. According to the information given by Kinondoni Municipal health Officer1, waste characterization studies are rarely carried out in Dar es Salaam city owing to the lack of funding to carry out appropriate field studies and the lack of awareness among policy makers and waste management officials of its importance. The earlier studies in Dar es Salaam which were performed to characterize domestic waste include: Kaseva and Mbuligwe (2005), who found the average per capita generation rate of domestic solid as calculated at 0.42 kg/cap/day, while 0.39 kg/capita/day was reported by Kaseva and Gupta (1996), for low income households. These studies did not deal with the socio-economical factors that influence per capita daily waste generation.
The purpose of this study was, therefore, to determine the per capita daily waste generation and the composition of household solid waste generated in Kinondoni municipality at the source of generation (households). Waste characterization studies have been carried out mainly at the disposal points or material recovery facilities, rather than at the source of waste before any scavenging or recycling activities occur. However, only a few studies have been conducted at the source of generation, namely individual households. In this study it was decided to conduct waste characterization study at the source, as, it allowed for the collection of personal data from each of the participating household. Since it represented a single source, therefore, produced more accurate data. Additionally, it was important to carry out waste characterization study at source in order to assess the effect of the socio-economic factors of householders on per capita daily waste generation and composition. The socio-economic factors considered included: household size and income. The reason for considering only these two factors is that they have
1 Discussion held in 2008

widely been acknowledged as important factors influencing solid waste characteristics (Collins and Bryan 1977; Cointreau 1982; Zuilen 2006; Abel 2007). Understanding how these variables affect households’ waste generation enables policy makers to take more informed decisions about where and when to implement a particular policy.
This paper starts with introduction followed by brief description of Kinondoni municipality. The methodology is discussed in detail. The results and discussions include: the characteristics of the respondents, per capita daily waste generation, and composition of waste. The effects of socio-economic factors on per capita daily generation rates and composition are also discussed in detail. Lastly, the conclusion is provided. 2.0 About Kinondoni municipality Kinondoni is the largest municipality of the three municipalities in Dar es Salaam City. Others being Ilala and Temeke (see figure 1). The whole of Kinondoni municipality effectively encompasses an area of 531 km2, and a population of 1,083,913 according to national census of 2002 and estimates for 2007 was around 1,3337,8752. The population density is estimated at 2,825 persons per square kilometre. The municipality is administratively divided into twenty seven (27) wards, which in turn are sub-divided into villages for rural areas and sub-wards commonly known as Mtaa3(singular) or Mitaa(plural) in the urban areas.
2 Population projection from 2002 census by using a growth rate of 5.4% per year. The next Tanzanian National census is on 25th August 2012 3Mtaa is the lowest level of the local government system in the urban setting
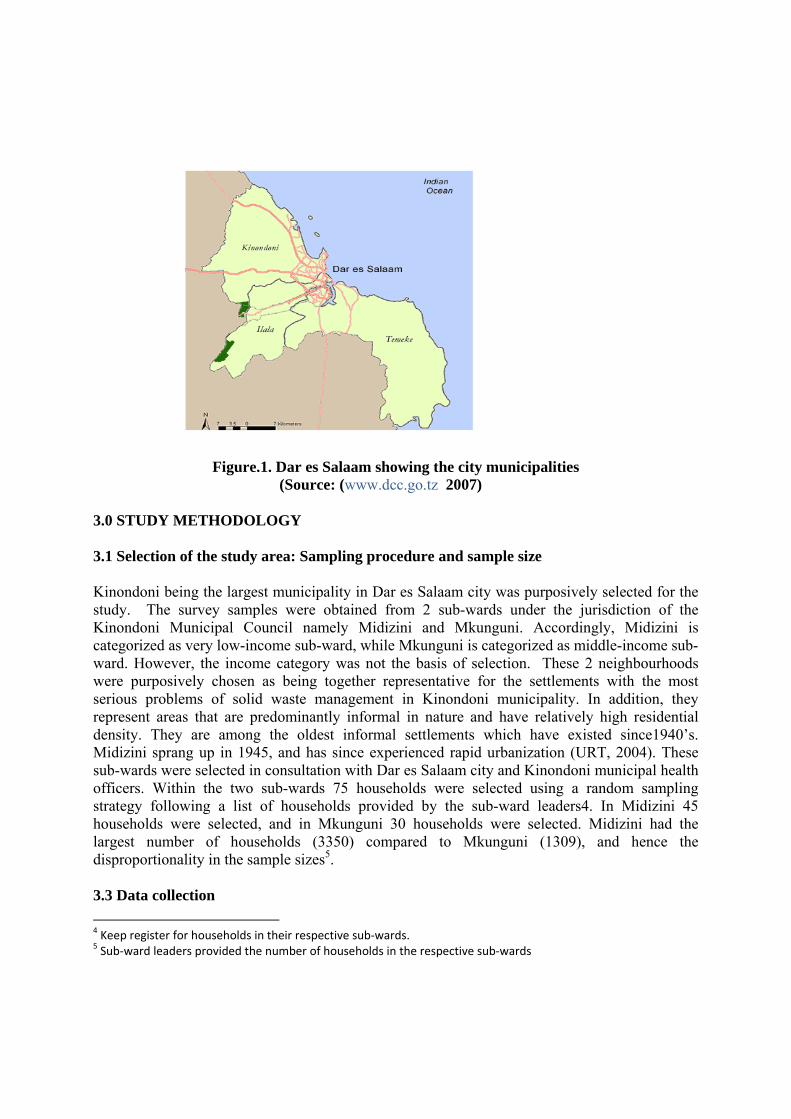
Figure.1. Dar es Salaam showing the city municipalities (Source: (www.dcc.go.tz 2007)
3.0 STUDY METHODOLOGY 3.1 Selection of the study area: Sampling procedure and sample size Kinondoni being the largest municipality in Dar es Salaam city was purposively selected for the study. The survey samples were obtained from 2 sub-wards under the jurisdiction of the Kinondoni Municipal Council namely Midizini and Mkunguni. Accordingly, Midizini is categorized as very low-income sub-ward, while Mkunguni is categorized as middle-income sub-ward. However, the income category was not the basis of selection. These 2 neighbourhoods were purposively chosen as being together representative for the settlements with the most serious problems of solid waste management in Kinondoni municipality. In addition, they represent areas that are predominantly informal in nature and have relatively high residential density. They are among the oldest informal settlements which have existed since1940’s. Midizini sprang up in 1945, and has since experienced rapid urbanization (URT, 2004). These sub-wards were selected in consultation with Dar es Salaam city and Kinondoni municipal health officers. Within the two sub-wards 75 households were selected using a random sampling strategy following a list of households provided by the sub-ward leaders4. In Midizini 45 households were selected, and in Mkunguni 30 households were selected. Midizini had the largest number of households (3350) compared to Mkunguni (1309), and hence the disproportionality in the sample sizes5. 3.3 Data collection
4 Keep register for households in their respective sub-wards. 5 Sub-ward leaders provided the number of households in the respective sub-wards
A field work was conducted to identify the socioeconomic parameters, solid waste generation and composition. The main tools used in data collection were household questionnaire survey, waste characterization, interviews, and direct observation. 3.3.1 Structured household survey questionnaires This tool was used in this study to gather information on demographic information which is concerned with location and size of household, characteristics and status of the respondents in terms of gender, household size and age. Socio-economic status variables include education, source of income, and monthly income. Another variable which is included in this part is business activity. These variables may affect solid waste management practices, amount of waste generated attitudes and perception of the household towards solid waste management. The household survey questionnaires and the waste characterization study were combined and carried out at the same time in May to June 2008. The questionnaire contained a total of 27 questions related to the household waste management in selected areas, but only the data that were useful for the waste characterization study will be reported here. 3.3.2 Waste characterization study This study was carried out by research team (a researcher and 4 research assistants) to determine the per capita daily waste generation and the percentage fractions of household waste constituents. The surveyed households were subsequently asked to participate in waste characterization exercise. Each selected household was provided with a plastic bag to keep all their waste generated for the particular day of study. One for each day of the study, and one extra bag in case this was necessary. In order to obtain a realistic estimate, measurement of the amount of waste produced by a particular household was performed for three different days, in a week and then the average value was recorded. The bagged waste from each household was sorted by research team into seven pre-determined fractions, namely food waste, glass, plastics, paper, metal/tins, aluminium, and residues (inerts, ashes, and sweepings). Each waste fraction was weighed separately and its weight recorded. A portable weighing machine of 50 kg capacity was used to weigh the waste samples. Other materials were plastic bags with a volume of 12 litres for collecting and weighing the waste constituents. The amount of waste generated per capita per day for each household in the selected study area was determined. 3.3.3 Face to face interviews Face to face interviews were held with key informants who included: Dar es Salaam City Health Officer, Kinondoni Municipal Health Officer, sub-ward leaders from sub-wards under study, and formal waste contractors6 providing service in the selected sub-wards. These officials have overall responsibility in solid waste management; and waste contractors are solid waste management service providers. The rationale for conducting interviews with these people was to obtain expert information on solid waste management, given their knowledge, and experience.
3.3.4 Secondary information Secondary information such as available documents, e.g. different reports from municipal solid waste departments served also as a source of information. 3.4 Analysis of data
6 Solid waste service providers with legal contracts of providing collection and disposal services to households
Data analysis covers both descriptive as well as bivariate analysis. While the former was used to describe characteristics of the sample population by the use of the Statistical Package for Social Sciences (SPSS version 16) program, the latter assessed the relationships between the respondents’ socio-economic characteristics and the amount of wastes generated using Pearson’s coefficient(r). Attributes in the study include gender, employment, income, education, age, household, size, and daily waste weights. Hypothesis of the study stated that the per capita daily waste generation was directly linked to household size and income per household. The dependent variable used was the amount of waste generated by weight per capita per day. 4.0 RESULTS AND DISCUSSIONS 4.1 Socio-economic characteristics of the respondents According to the household survey, the average household size from sampled population was 4.48 and 7.71 in Mkunguni and Midizini, respectively. The mean household size was found to be 6.1 as calculated from average means of each sub-ward. The value of household’s size obtained in this research was slightly larger than what was reported by National Bureau of Statistics, (2002)7. The major causes of rapid urban population growth in the whole of Tanzania are high natural births and rural-urban migration(UN-Habitat 2010). The average age for respondents were 40 with the lowest being 21 and highest 75 years old when considering the total sample of the study. The study found that 16% of the respondents were male and 84% of the respondents were female in Mkunguni. In Midizini 20% of respondents were male and 80% of respondents were female. There were more people employed in the formal sector in Mkunguni (67%) as compared to Midizini. Only 18% of the respondents in Midizini sub-ward were employed in formal sector. In all cases, there were a significant number of respondents working in informal sector with 70% in Midizini and 33% in Mkunguni. Over two third, (66.47%) of respondents in Midizini the most educated members of households had primary school level of education, 28% secondary school education and only 5% with members who had tertiary education. In Mkunguni, 45% most educated members had secondary school education and 45% reported to have completed primary school education. The remaining 10% of households had members who had university education. In this study two socio-economic factors were related to per capita waste generation: income and household size. As mentioned in the introduction the reason for considering only these two factors is that they have widely been acknowledged as important factors influencing solid waste characteristics.
The survey found that a significant number of interviewed households conduct business activities which take place from their households representing 65.67% in Midizini, and 37% in Mkunguni. Within these sub-wards food-related businesses are undertaken by households as their source of income. Income is measured in Tanzanian Shillings (TZS) per household per month. In Midizini 10.7 % earn between TZS 0 – 50,000/=, 61.3% earn between TZS 50,001 to 100,000/=, and 28% earn between 100,001 to 150,000/=. Whereas, in Mkunguni, 1.3% earn between TZS 50,000 to 100,000/=, and 5.3% earn between TZS 100,001 to 150,000/=, the majority 88% earn between 150,000 to 200,000/=, the remaining 5.3% earn more than TZS 200,000/=. 4.2 Solid waste generation rates
7 According Tanzanian Bureau of Statistics (2002) the average value of household size was calculated at 4.8 and, 3.9 for Midizini and Mkunguni sub-wards respectively.
The mean waste generation rate values were established to be 0.39 and 0.49 kg/cap/day with a mean value of (calculated by first averaging the daily weight of waste for each household, then dividing this by the number of people in each household, as reported in the household survey, and then averaging the daily per capita waste generation figures across the studied households for Midizini and Mkunguni, respectively. From these findings, an average of 0.44 kilograms of solid waste generated per person per day was computed. The rate is quite in line with World Bank Standard for developing countries which is 0.3 to 0.6 kg/c/d. Another, study on waste generation reported average domestic waste generation rates of 0.34 kg/day per person in low-income areas and 0.42 kg/day per person in planned areas in Dar es Salaam (Kaseva and Mbuligwe 2005). In Nairobi a study carried out by Kasozi and von Blottnitz,(2010), in low to middle income level households per capita generation rates varied from 0.24 – 0.82 kg/person/day, with a mean of 0.43 kg/person/day. A study in Accra Ghana, by Boadi and Kuitunen,(2004), found the specific waste generation rate in low income areas, was at 0.40 kg per capita per day and in middle income areas showed a specific waste generation rate of 0.68 kg per capita per day. 4.3 Physical composition of waste The results of household waste composition are shown in table 1. A comparison of the average composition of solid waste of the two areas with those reported for some other countries for the overall average of low and middle-income households is presented in Table 2 (Abu Qdais et al, 1997; Kasonzi and von Blottnitz, 2010; Nabegu, 2010)
From table 1 it can be noted that kitchen/food waste makes up the largest fraction of household waste at 74%, which might be expected for domestic/ household waste in developing countries. This is probably attributable to the fact that in the study sub-wards most of the food items were unprocessed with high moisture content, bulky and therefore denser. Also it can be noted that the percentages of plastics (9%) and paper (8.30%) was fairly high compared with glass, metals and aluminium, and the percentages of glass (0.75%) and metal (0.60%) are relatively low compared with other cities (table 1). This is due to the fact in recent times plastics materials have turned up as food containers, water bottles, medicine bottles etc. where previously metal or glass containers were commonly used. The absence of recycling programs in Kinondoni municipality also results in large quantities of plastics entering the waste stream. Being low and middle-income areas, few people consume imported canned food and drinks due mainly to social and economical factors. The high content of residual waste (ash, dust, silt, sand, sweepings) of waste was high due to high density of ash and earth contents. Investigation and observations indicated that the overdependence on firewood and charcoal as a source of energy by the majority of households led to the excessive presence of ash in household waste. In addition to this, the proportion of ash, silt, and sand may be high also due to the presence of unsurfaced yards and streets within the settlements. Furthermore, it was common to see in Kinondoni some people using paper and thin plastics as an igniting agent for their charcoal stoves, which may also increase the presence of ash in the solid waste composition.
Table 1. Physical composition of household waste in areas under study
s/n Waste component (%) Midizini (n=45)
Mkunguni (n=30)
Average (%)
1. Kitchen/food waste 68.70 79.50 74.10 2. Paper 8.75 7.85 8.30
3. Plastics 11.00 7.00 9.00 4. Glass 1.00 0.50 0.75 5. Metal 1.20 0.00 0.60 6. Aluminium 0.00 0.00 0.00 7. Residual waste 9.35 5.15 7.25 Total 100.00% 100.00% 100.00%
Table 2.Comparison of major solid waste components for studied areas in Kinondoni with some other cities
Average component weight (%)
Waste component
Kinondoni Nairobi-Kenya Kano-Nigeria
Abu Dhabi-UAE
Food/kitchen waste
74.10 58.6% 47 50.5
Paper 8.30 11.9 6 7 Plastics 9.00 15.9 10 11 Glass 0.75 1.9 7 10 Metal 0.60 2.0 5 8.5 Other 7.25 9.7 18 13 References This study Kasozi and von
Blottnitz,(2010) Nabegu, (2010) Abu Qdais,
et al.(1997)
4.4 Influence of socio-economic factors on per capita daily waste generation As earlier mentioned, household size and income of the household are the two variables which are generally considered to be most important socio-economic factors affecting per capita waste generation and the composition of waste. The relationships between per capita and household size as well as income are shown in figure 2. Also a statistical method of bivariate analysis using Pearson’s coefficient (r) was employed to see whether there is any correlation between these variables.
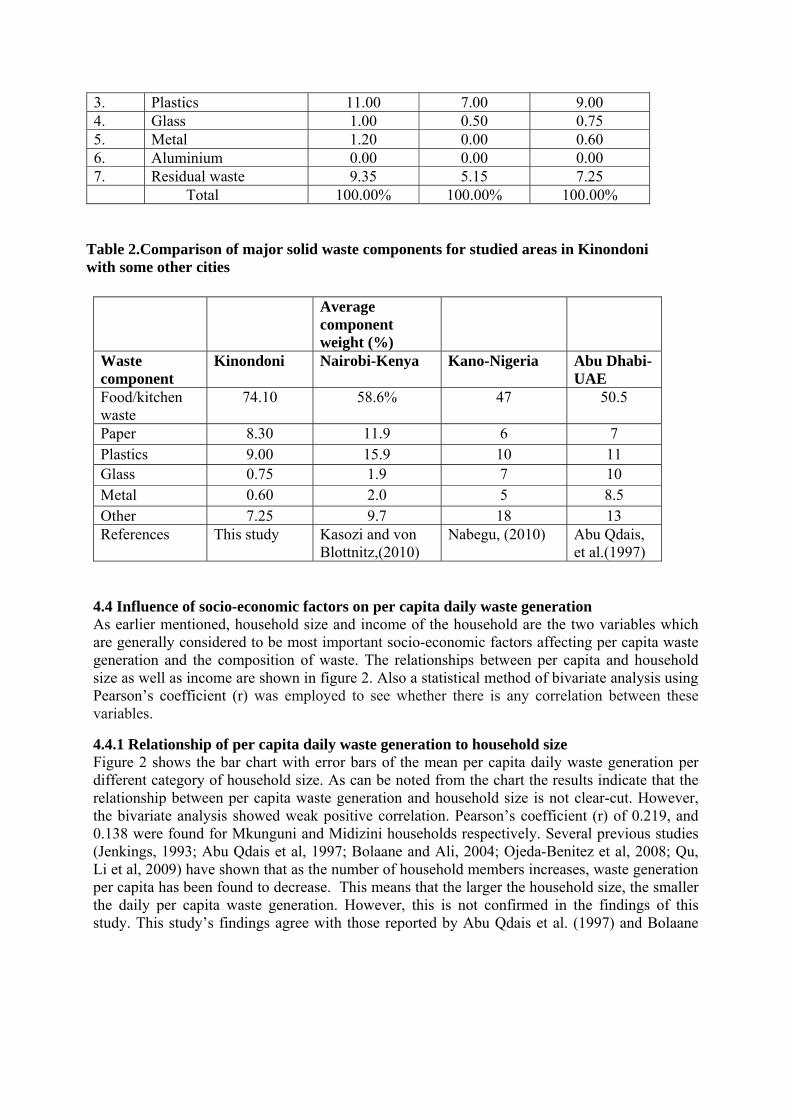
4.4.1 Relationship of per capita daily waste generation to household size Figure 2 shows the bar chart with error bars of the mean per capita daily waste generation per different category of household size. As can be noted from the chart the results indicate that the relationship between per capita waste generation and household size is not clear-cut. However, the bivariate analysis showed weak positive correlation. Pearson’s coefficient (r) of 0.219, and 0.138 were found for Mkunguni and Midizini households respectively. Several previous studies (Jenkings, 1993; Abu Qdais et al, 1997; Bolaane and Ali, 2004; Ojeda-Benitez et al, 2008; Qu, Li et al, 2009) have shown that as the number of household members increases, waste generation per capita has been found to decrease. This means that the larger the household size, the smaller the daily per capita waste generation. However, this is not confirmed in the findings of this study. This study’s findings agree with those reported by Abu Qdais et al. (1997) and Bolaane
and Ali,(2004) who found a poor relationship between the number of persons in a household and the waste generation rate in Abu Dhabi and Gaborone respectively.
Per capita daily waste generation rate Per capita daily waste generation rate vs. household size in Mkunguni vs. household size in Midizini
Figure 2. Per capita daily waste generation rate vs. household size in Mkunguni and Midizini sub-wards
The reasons for this surprising pattern may be contributed to households’ social and economic activities. In household survey study it was observed that, waste from business activities taking place at households were mixed with the waste produced from domestic activities. Also residual waste such as sweepings and ash contents were mixed with domestic waste. These fractions of waste are independent of household size. In addition, per capita daily waste generation may be independent to household’s size as there were variations of household size during the study period as relatives and friends move in and out. Another possible explanation could be that from a statistical point of view the accuracy of determining these parameters increases with an increase in the number of samples that are analyzed.
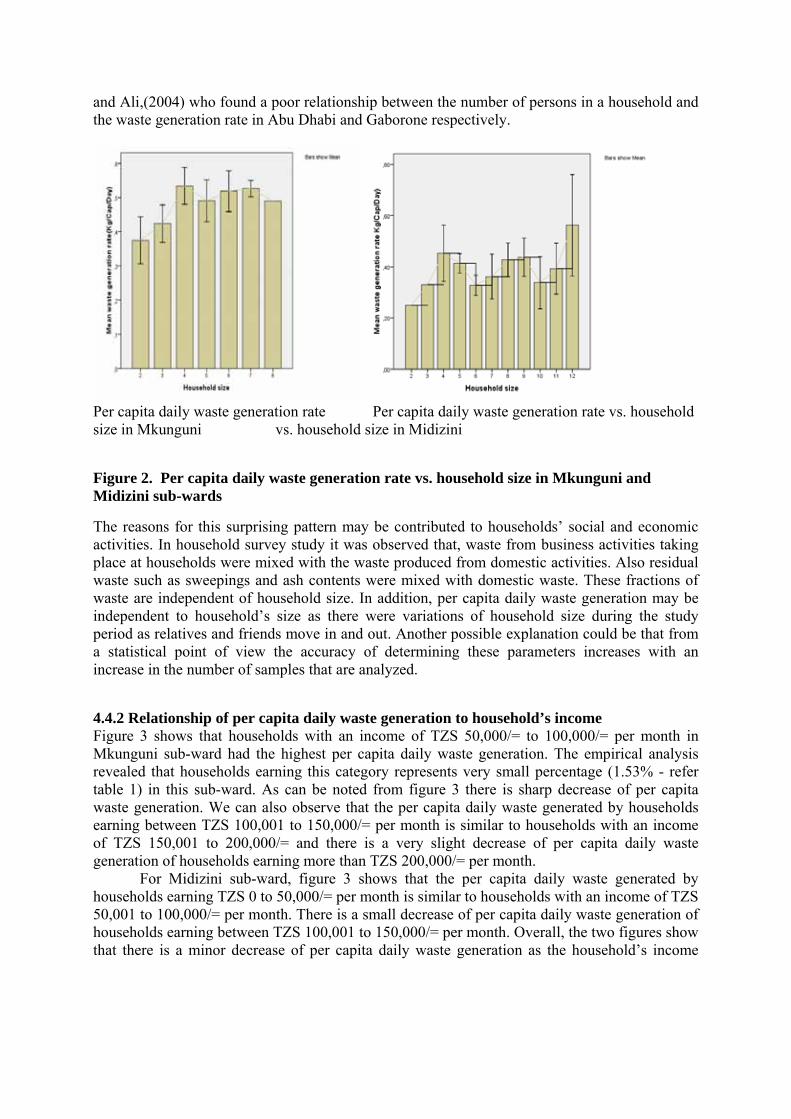
4.4.2 Relationship of per capita daily waste generation to household’s income Figure 3 shows that households with an income of TZS 50,000/= to 100,000/= per month in Mkunguni sub-ward had the highest per capita daily waste generation. The empirical analysis revealed that households earning this category represents very small percentage (1.53% - refer table 1) in this sub-ward. As can be noted from figure 3 there is sharp decrease of per capita waste generation. We can also observe that the per capita daily waste generated by households earning between TZS 100,001 to 150,000/= per month is similar to households with an income of TZS 150,001 to 200,000/= and there is a very slight decrease of per capita daily waste generation of households earning more than TZS 200,000/= per month.
For Midizini sub-ward, figure 3 shows that the per capita daily waste generated by households earning TZS 0 to 50,000/= per month is similar to households with an income of TZS 50,001 to 100,000/= per month. There is a small decrease of per capita daily waste generation of households earning between TZS 100,001 to 150,000/= per month. Overall, the two figures show that there is a minor decrease of per capita daily waste generation as the household’s income
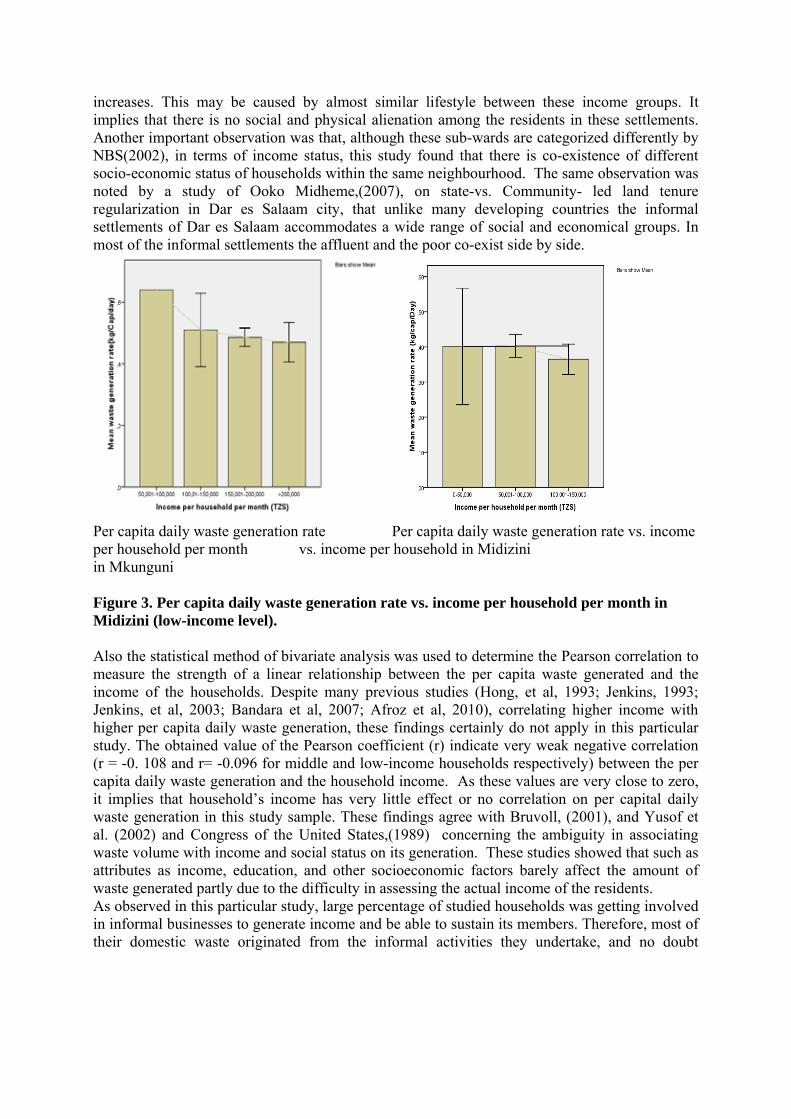
increases. This may be caused by almost similar lifestyle between these income groups. It implies that there is no social and physical alienation among the residents in these settlements. Another important observation was that, although these sub-wards are categorized differently by NBS(2002), in terms of income status, this study found that there is co-existence of different socio-economic status of households within the same neighbourhood. The same observation was noted by a study of Ooko Midheme,(2007), on state-vs. Community- led land tenure regularization in Dar es Salaam city, that unlike many developing countries the informal settlements of Dar es Salaam accommodates a wide range of social and economical groups. In most of the informal settlements the affluent and the poor co-exist side by side.
Per capita daily waste generation rate Per capita daily waste generation rate vs. income per household per month vs. income per household in Midizini in Mkunguni Figure 3. Per capita daily waste generation rate vs. income per household per month in Midizini (low-income level). Also the statistical method of bivariate analysis was used to determine the Pearson correlation to measure the strength of a linear relationship between the per capita waste generated and the income of the households. Despite many previous studies (Hong, et al, 1993; Jenkins, 1993; Jenkins, et al, 2003; Bandara et al, 2007; Afroz et al, 2010), correlating higher income with higher per capita daily waste generation, these findings certainly do not apply in this particular study. The obtained value of the Pearson coefficient (r) indicate very weak negative correlation (r = -0. 108 and r= -0.096 for middle and low-income households respectively) between the per capita daily waste generation and the household income. As these values are very close to zero, it implies that household’s income has very little effect or no correlation on per capital daily waste generation in this study sample. These findings agree with Bruvoll, (2001), and Yusof et al. (2002) and Congress of the United States,(1989) concerning the ambiguity in associating waste volume with income and social status on its generation. These studies showed that such as attributes as income, education, and other socioeconomic factors barely affect the amount of waste generated partly due to the difficulty in assessing the actual income of the residents. As observed in this particular study, large percentage of studied households was getting involved in informal businesses to generate income and be able to sustain its members. Therefore, most of their domestic waste originated from the informal activities they undertake, and no doubt
affected waste per capita values. The study found that, significant amount of residual waste (sand, sweepings) which is generally dense and heavy also contributed to the generation of household waste. From our data of bivariate analysis we conclude that there was no relationship between these two variables and thus the null hypothesis should be rejected. 4.5 CONCLUSION The characterization of household waste in the studied areas has provided detailed information on household waste composition and the per capita daily waste generation. This study found that the average per capita waste generation of the whole studied selected sample was 0.44 kg/cap/day, when socio-economic category was considered in the analysis per capita daily waste generation varied, in Midizini (low-income sub-ward ) was 0.39 kg/cap/day and in Mkunguni (medium-income sub-ward) was 0.49 kg/day/day. These findings seem to be comparable with previous studies, although no recent waste characterization studies have been carried out in Dar es Salaam on this topic. The study by Kaseva and Mbuligwe, (2005), calculated the average per capita generation rate of domestic solid wastes to be 0.42 kg/cap/day, whereas, Kaseva and Gupta, (1996), reported a mean of 0.39 kg/capita/day. The composition of household waste contains more kitchen waste than other waste materials, which is a typical households waste characteristic in developing countries. The kitchen/food waste accounted for the highest proportion at 74.50%. These results suggest the feasibility of composting to ensure environmental protection by greatly reducing the volume of waste that would have to be disposed of. Perhaps the next step needed is for Kinondoni municipality to examine the potential for composting. Also paper (8.30%) and plastics (9%) are recyclable materials and their presence in domestic wastes suggests again taking a closer look at the possibilities for re-use and recycling. Glass (0.75%) and metal (0.60%) are also recyclable materials but their presence is almost negligible. The average amounts of waste generated per person can be used to predict the total amount of waste generated within a municipality. Household size had a weak positive relationship with the per capita daily waste generation rate. However, this relationship needs further investigation. Contrary to some previous studies, the waste generation rate was not directly related to household income. It appears that the relationship between income and waste generation rate depends on other factors. In this case, the higher waste generation rate as measured for low-income households could be attributed to consumption of unprocessed food, social and economic activities taking place within household’s premises. The findings of this study can be helpful in developing policies concerning household waste. A more detailed and comprehensive research is necessary to establish reliable information on household waste generation and composition as well as the relationship between socio-economics factors and household waste generation rate in the entire Dar es Salaam City, including waste characterization at different times of the year, in a wider range of areas to suggest a more conclusive result in the future. Acknowledgments This paper was prepared in the framework of the “Partnership for Research on Viable Environmental Infrastructure Development in East Africa’(PROVIDE) program. The advisory support of Dr Peter Oosterveer and Professor Gert Spaargaren is gratefully acknowledged.
References Abel A (2007) An analysis of solid waste generation in a traditional African city: The example of
Ogbomoso, Nigeria. International Institute for Environment and Development (IIED)." Environment and Urbanization.19: 527-537.
Abu Qdais, Hamoda MF, Newham J (1997). Analysis of Residential Solid waste at Generation Sites Waste Management and Research15: 395 - 406.
Afroz RK. Hanaki, R. Tuddin (2010). The Role of Socio-economic Factors on Household Waste Generation: A study in a Waste Management Program in Dhaka City, Bangladesh.Research Journal of Applied Sciences 5(3): 183-190.
Bandara, N. J. G., J. P. A. Hettiaratchi, S. C. Wirasinghe and S. Pilapiiya (2007). Relation of Waste Generation and Composition to Socio-economic Factors: A case study.Environ Monit Assess, pp 31-39.
Boadi KO, Kuitunen M (2004). Municipal Solid Waste Management in the Accra Metropolitan Area, Ghana.The Environmentalist, pp 211–218.
Bolaane B, Ali M (2004). Sampling Household Waste at Source: Lessons Learnt in Gaborone.Waste Management and Research pp142-148.
Bruvoll A. (2001). Factors Influence Solid Waste Generation and Management. The Journal of Solid Waste Technology and Management, pp 156-162.
Chung SS, Poon, CS (2001). Characterisation of Municipal Solid Waste and its Recyclable Contents of Guangzhou. Waste Management and Research, pp 473-485.
Cointreau SJ (1982). Environmental Management of Urban Solid Wastes in Developing Countries. IA project guide (16th ed.):Urban Development Technical Paper World Bank, Washington, DC.
Collins J, Bryan D (1977). The effects of size of the provision of public services. The cases of solid waste collection in smaller cities.Urban Affairs Quarterly, pp 333-347.
Congress of the United States (1989). Office of Technology Assessment. DCC (2004). Dar es Salaam City Profile. D. e. S. C. Council, City Director, pp 93. Hong SH,Adams RM , Love HA (1993). An Economic Analysis of Household Recycling of
solid Wastes: The Case of Portland, Oregon,.Journal of Environment, Economics and Management, pp 136-146.
Jenkins RR. (1993). The Economics of Solid Waste Reduction. The Impact of Users Fees. Brookfield, VT: Edward Elgar Publishing Limited.
Jenkins RR, Martinez SA, Palmer K Podolsky MJ (2003). The Determinants of Household Recycling: A Material-Specific Analysis of Recycling Program Features and Unit Pricing.Journal of Environment, Economics and Management, pp 294-318.
Kaseva ME, Gupta SK (1996). Recycling - An Environmentally Friendly and Income Generating Activity Towards Sustainable Solid Waste Management. Case study: Dar es Salaam City, Tanzania. Resources, Conservation and Recycling, pp 299-309.
Kaseva ME, Mbuligwe SE (2005). Appraisal of Solid Waste Collection Following Private Sector Involvement in Dar es Salaam City, Tanzania.Habitat International, pp 353-366.
Kasozi A, von Blottnitz H (2010). Solid Waste Management in Nairobi: A Situation Analysis Technical Document accompanying the Integrated Solid Waste Management Plan, University of Cape Town, pp 59.
Mosler JH, Drescherb S, Zurbru¨gg C, Rodrı'guez CT, Miranda, GO. (2006). Formulating Waste Management Strategies Based on Waste Management Practices of Households in Santiago de Cuba, Cuba. Habitat International, 30, 849 - 862.
Nabegu AB (2010). An Analysis of Municipal Solid Waste in Kano Metropolis, Nigeria. Journal of Human Ecology, pp 111-119
NBS (2002). Tanzanian Household Budget Survey 2000/2001. Newenhouse, CS. Schmit JT (2000). Qualitative methods add value to waste characterization
studies.Waste Management and Research pp 105-114. Ojeda-Benitez SG Lozano-Olvera, R. Adalberto Morelos and C. Armijo de Vega (2008).
Mathematical Modeling to Predict Residential Solid Waste Generation. Waste Management, pp 7-13.
Ooko Midheme EP (2007). State- vs.Community-led Land Tenure Regularization in Tanzania: The case of Dar es Salaam City. International Institute for Geo-Information Science and Earth Observation. Master of Science in Urban Planning and Land Administration. Enschede, The Netherlands.
Parizeau K, Maclaren V, Chanthy L. (2006). Waste Characterization as an Element of Waste Management Planning: Lessons Learned from a Study in Siem Reap, Cambodia. Resource, Conservation and Recycling., 49, pp110-128.
Qu XZ, Li XX, Sui Y, Yang L, Chen Y (2009). Survey of Composition and Generation Rate of Household Wastes in Beijing, China. Waste Management 29: 2618-2624.
Solomon A. (2011). The role of households in solid waste management in East Africa Capital Cities. Environmental Policy. PhD dissertation. University of Wageningeng, Wageningen, The Netherlands.
Sujauddin M, Huda SM, Rafiqul Hoque AT (2008) Household solid waste characteristics and management in Chittagong, Bangladesh. Waste Management 28: 1688–1695.
Tadesse TA Ruijs, Hagos F (2008). Household waste disposal in Mekelle City, Northern Ethiopia.Waste Management 10: 2003-2012.
UN-Habitat (2010). Informal settlements and finance in Dar es Salaam, Tanzania Nairobi, United Nations Human Settlements Programme: 66.
URT(United Repbulic of Tanzania), (2004). The community infrastructure upgrading projects. Community upgrading plans, Kinondoni municipality
Yusof MB, Othman, F, Hashim N, Ali, CN. (2002). The Role of Socio-Economic and Cultural Factors in Municipal Solid wastw generation: A Case Study in Taman Perling, Johor Bahru. . Jurnal Teknologi 37, 55-64.
Zuilen LF. (2006). Planning of an integrated solid waste management system in Suriname: A Case study in Greater Paramaribo with focus on households. PhD dissertation, University of Ghent.
PERFORMANCE OF SOYBEAN AND NEEM METHYL ESTERS AS BIODIESEL ON DIESEL ENGINE
Joseph .S. Enaburekhan
Department of Mechanical Engineering, Bayero University,Kano-Nigeria.
&
Shehu Bello
Department of Mechanical Engineering Technology, Nuhu Bamalli Polytechnic, Zaria-Nigeria.
ABSTRACT
To study the feasibility of using two local produced plant oils Soybeans (Glycine max, Family: Fabaceae), and Neem (Azadirachta indica, Family: Meliaceae) as diesel substitute, a comparative study on their combustion characteristics on a C.I. engine were made. Experimental investigations were carried out on diesel engine with bio diesel blends of Soybeans oil Methyl Esters and Neem Oil Methyl Esters .The engine used for the experiments was single cylinder four stroke air cooled. Soybeans Methyl Esters and Neem Methyl Esters were derived through transesterification process and parameters of transesterification were optimized. The blending was done with pure diesel in the ratio of 15:85(B15 and N15), 20:80 (B20 and N20), 25:75 (B25 and N25), by volume. Pure diesel was used as control. Tests were carried out to examine their engine performance of different blends in comparison to diesel. From the experimental results it was shown that B20 has more closer performance to diesel, followed by B25%, in terms of torque, brake power and specific fuel consumption, with B20% giving a higher toque above that of diesel at 1800rpm. while Neem biodiesel blends have poor performance. These studies have revealed that soybean oils at 20% and 25% blend with diesel can be used as a diesel substitute without bringing any modifications in the engine.
Keywords: Soybean methyl ester,Neem methyl ester, torque, brake power, brake specific fuel consumption
INTRODUCTION
The exhaust from petroleum products, especially diesel is known to be toxic and carcinogenous in nature, since they contain polycyclic aromatic hydrocarbons (Aqeel ,Gholamreza , & Haslenda, 2011) . An alternative fuel should be sought, one of such fuels is triglycerides and their derivatives or simply biodiesel.Biodisel is defined as the Mono alkylesters of long chain fatty acids derived from renewable feedstock, such as vegetable oil or animal fats, for use in Compression ignition engine(Yosimoto, 2001).Higher viscosity , lower volatility, weak itomization, cabon sediments accumulation , and vibration of the engine are the main impediments of using pure bio diesel as fuel in a diesel engine. These impediments are reduced drastically by transesterification, preheating and blending(Shakila, Seyed,Fateme, &Najaf
2011.). Blending is done in such away that conventional diesel carries higher percentage of the blending mixture, this gives the biodiesel some desirable characteristics of the conventional diesel with added advantages of being non poisonous and environmental friendly (Aqeel. et al) .Performance test on the diesel engine if blended bio diesel is used is of importance, parameters most importantly torque, brake power, exhaust temperature, specific fuel consumption and efficiency at varying loads with respect to the speed need to be investigated and compare to that of conventional petroleum diesel, this finally provides the correct biodiesel blend to be used without problem. Jatropa is mostly so far the most widely used biodiesel feed stock, despite its unavailability and cost(Kanothe ,Gerpen ,&Krahl.2004) Alternatively, in this work, biodiesels made from Soybean and Neem oils with blend ratios of petroleum diesel of 15:85,20:80, and 25:75,i.e B15%,B20%, and B25% were studied in terms of torque, brake power and specific fuel consumption at varying speeds for different loading conditions. In order to find the most suitable biodiesel feedstock apart from widely used Jatropa, and correct blend ratio whose engine performance will be equal or better than that of petroleum diesel at less cost. Initially the engine was run by diesel fuel. Then, the experiments were repeated replacing diesel by different biodiesel blends, doing so various engine performances were obtained, analyzed and reported.
METHODS
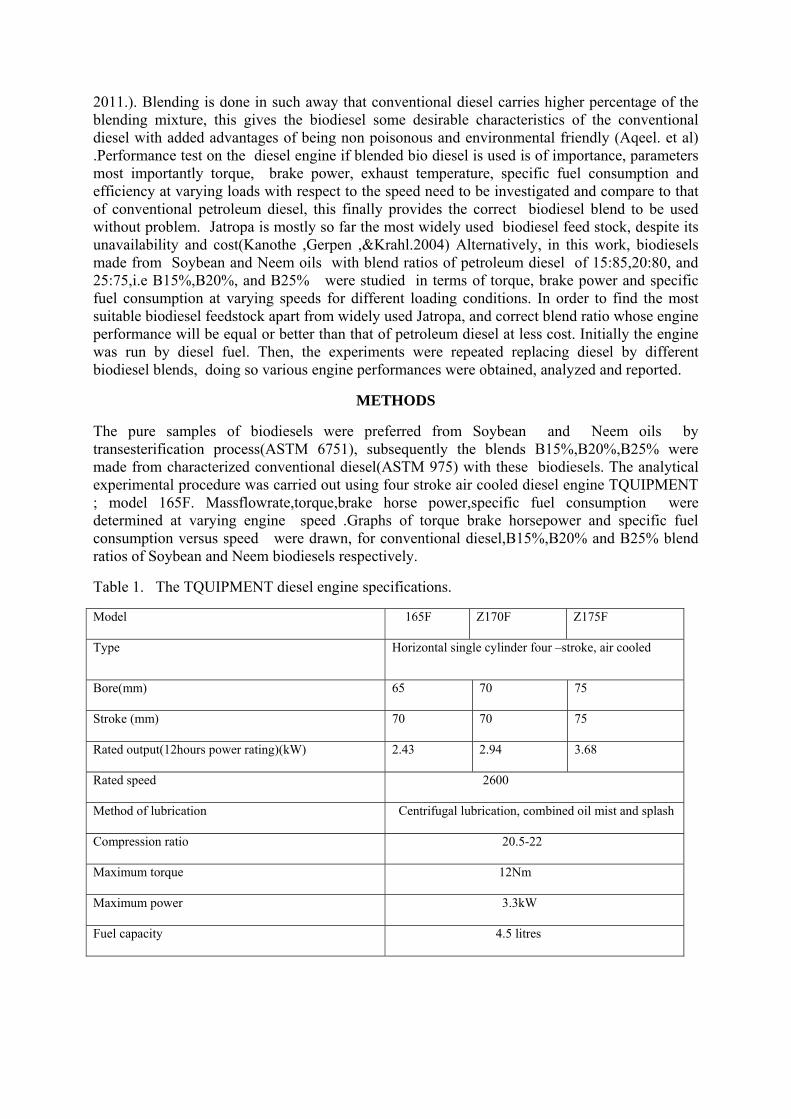
The pure samples of biodiesels were preferred from Soybean and Neem oils by transesterification process(ASTM 6751), subsequently the blends B15%,B20%,B25% were made from characterized conventional diesel(ASTM 975) with these biodiesels. The analytical experimental procedure was carried out using four stroke air cooled diesel engine TQUIPMENT ; model 165F. Massflowrate,torque,brake horse power,specific fuel consumption were determined at varying engine speed .Graphs of torque brake horsepower and specific fuel consumption versus speed were drawn, for conventional diesel,B15%,B20% and B25% blend ratios of Soybean and Neem biodiesels respectively.
Table 1. The TQUIPMENT diesel engine specifications.
Model 165F Z170F Z175F
Type Horizontal single cylinder four –stroke, air cooled
Bore(mm) 65 70 75
Stroke (mm) 70 70 75
Rated output(12hours power rating)(kW) 2.43 2.94 3.68
Rated speed 2600
Method of lubrication Centrifugal lubrication, combined oil mist and splash
Compression ratio 20.5-22
Maximum torque 12Nm
Maximum power 3.3kW
Fuel capacity 4.5 litres
Oil sump capacity 1.2 litres
Valve clearance(cold) (mm) 0.1-0.2
Intake valve opens 16˚ before T.D.C
Intake valve closes 36˚ after B.D.C
Exhaust valve open 52˚ before B.D.C
Exhaust valve closes 14 ˚after T.D.C
Width(mm) 535
Length(mm) 326
Height(mm) 445
PROCEDURES
Engine Test Setup
The experiment setup consisted of engine test bed, whose specification was given in Table 1, with fuel supply from the tank. The fuel followed through a graduated pipette of sectioned volumetric capacities of 8ml,16ml, and 32ml. For this experiment, 8ml volumetric capacity was used of each sample ,stop watch was used to measure the time within which 8ml of a sample at varying speed and torque was consumed, upon which volumetric and mass flow rates were calculated.torque was directly read,brake power and fuel consumption were calculated from performance equations. A hydraulic brake dynamometer coupled with the engine was used to load the engine. Load was varied by changing the water flow rate to the dynamometer to allow an increment of 100rpm to the engine speed. The exhaust temperature was measured using thermocouple. This set up was used throughout the experiments. Each time a sample finished, the fuel system was flushed using the succeeding sample, before it was used .
Engine performance Equations Mass flow rate = µ (Bugaje, Higima,& Umar,2011)
Where: m = Mass Flow Rate of Fuel (kg/s) V = Volume Flow Rate of Fuel (cm3/s) ρ= Density of Water (kg/cm3) µ= Specific gravity (kg/cm3)
Torque of the engine
Torque is the available work on the output shaft of the engine it is measured by dynamometer ,it is from the torque out put power is calculated . Torque is given as = Where F= load applied(N) b= perpendicular distance from the point of action Brake Power
The available power on the output shaft of the engine is the brake power, it is calculated from the torque measured by dynamometer. = ---- (Giri,2009)
Where Bp= brake power (kW) N= angular speed (rpm) T= torque developed by the shapt in (NM) Brake Specific fuel consumption It is defined as the ratio of mass flow rate of fuel into the engine per second it is given as: = . (Giri,2009)
Where = mass flow rate(kg/s) and Bp= Brake power(kW)
RESULTS
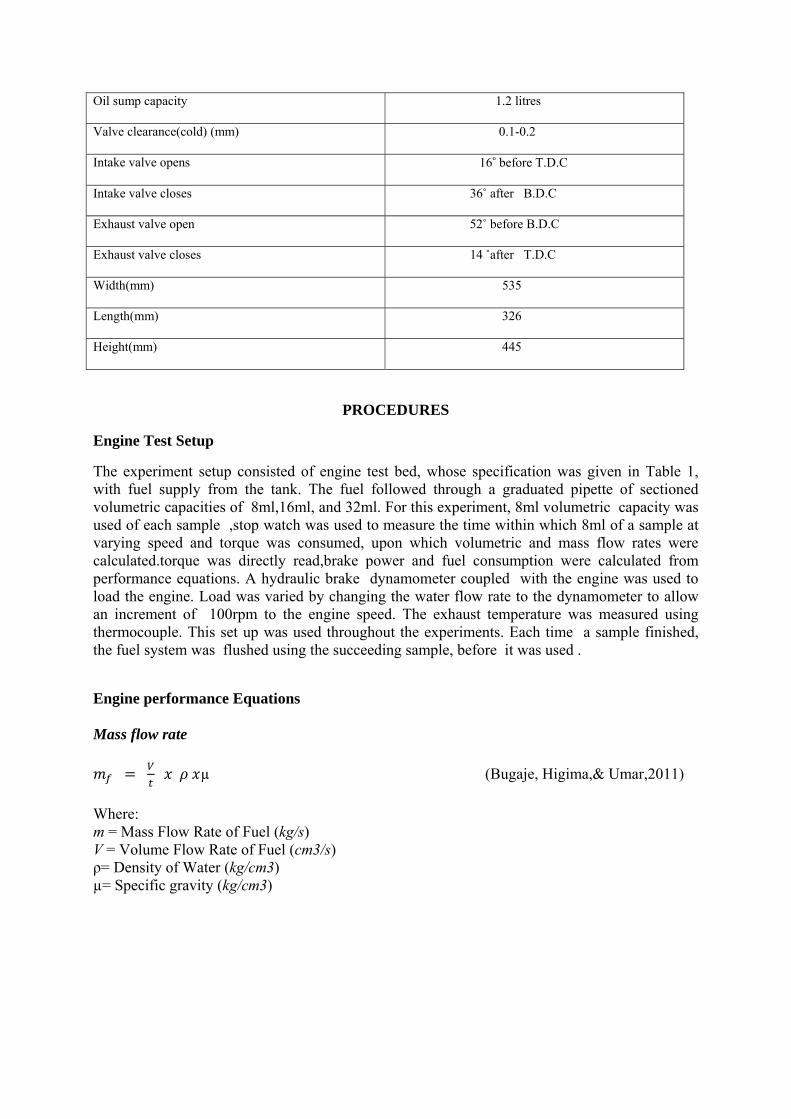
Figure 1. Comparison of torque and Speed for Diesel,B15% and N15%.
0
2
4
6
8
10
12
1600 1700 1800 1900 2000 2100 2200
Torq
ue(N
m)
Speed(rpm)
Diesel
B15%
N15%
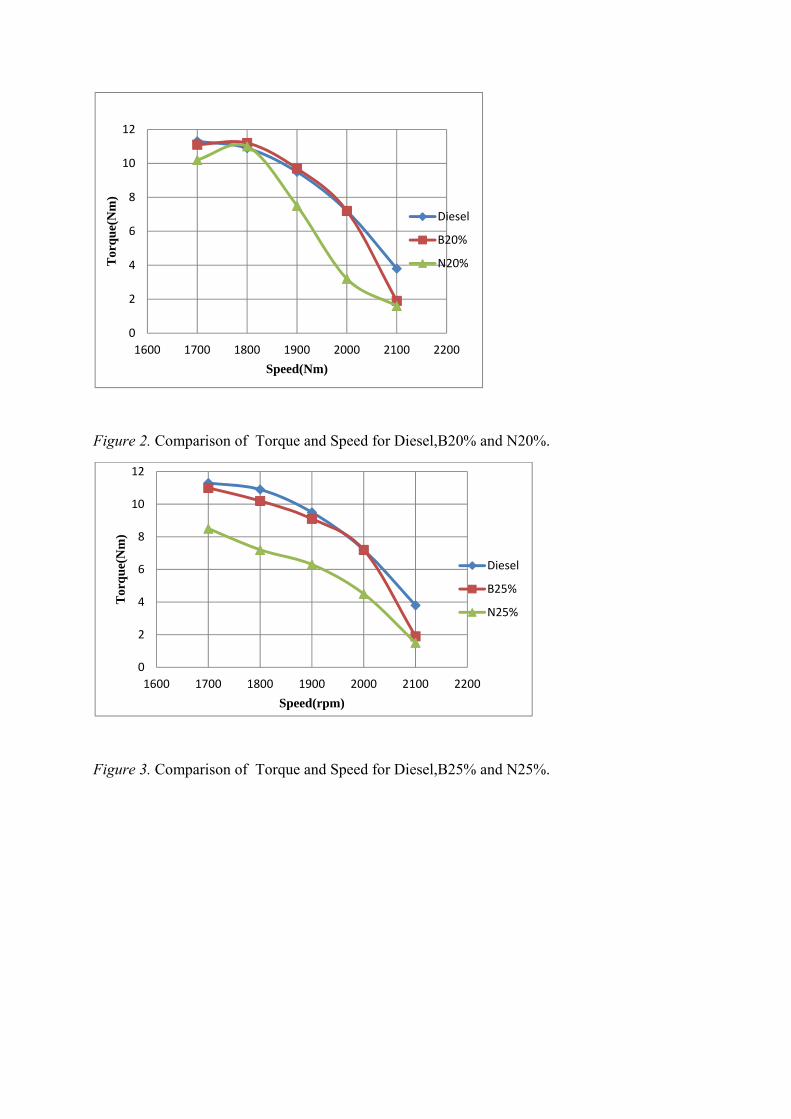
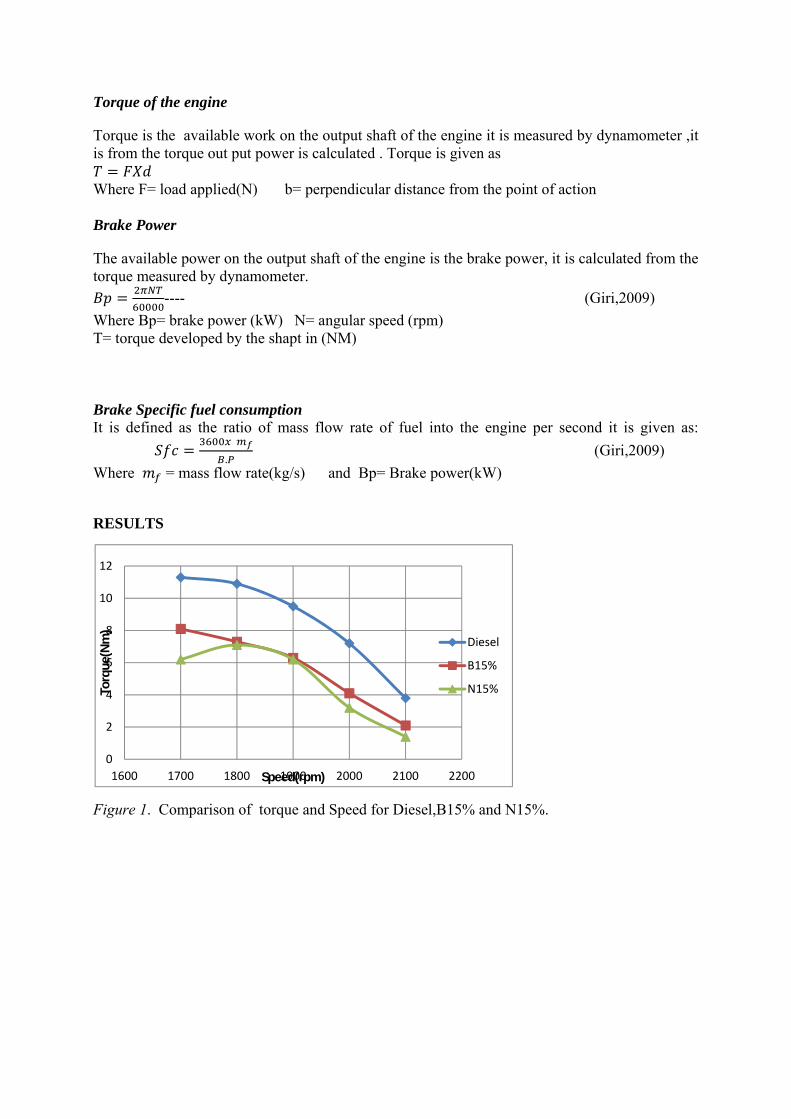
Figure 2. Comparison of Torque and Speed for Diesel,B20% and N20%.
Figure 3. Comparison of Torque and Speed for Diesel,B25% and N25%.
0
2
4
6
8
10
12
1600 1700 1800 1900 2000 2100 2200
Tor
qu
e(N
m)
Speed(Nm)
Diesel
B20%
N20%
0
2
4
6
8
10
12
1600 1700 1800 1900 2000 2100 2200
Tor
qu
e(N
m)
Speed(rpm)
Diesel
B25%
N25%
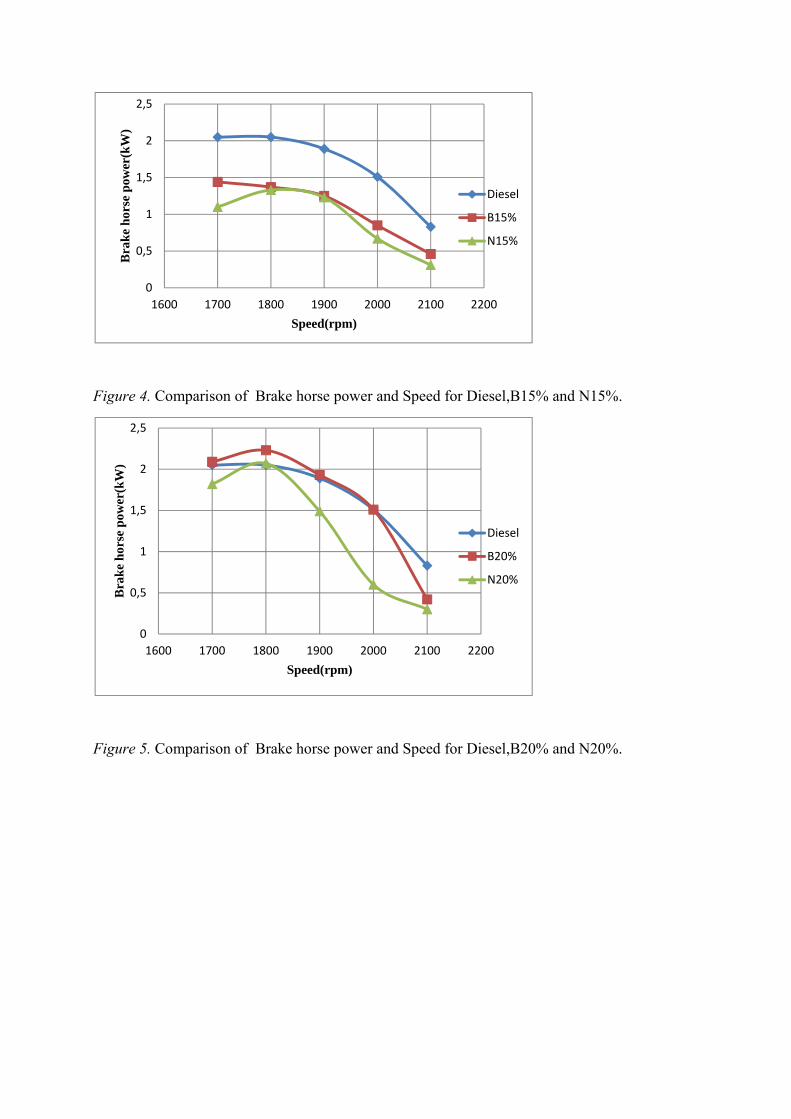
Figure 4. Comparison of Brake horse power and Speed for Diesel,B15% and N15%.
Figure 5. Comparison of Brake horse power and Speed for Diesel,B20% and N20%.
0
0,5
1
1,5
2
2,5
1600 1700 1800 1900 2000 2100 2200
Bra
ke
hor
se p
ower
(kW
)
Speed(rpm)
Diesel
B15%
N15%
0
0,5
1
1,5
2
2,5
1600 1700 1800 1900 2000 2100 2200
Bra
ke
hor
se p
ower
(kW
)
Speed(rpm)
Diesel
B20%
N20%
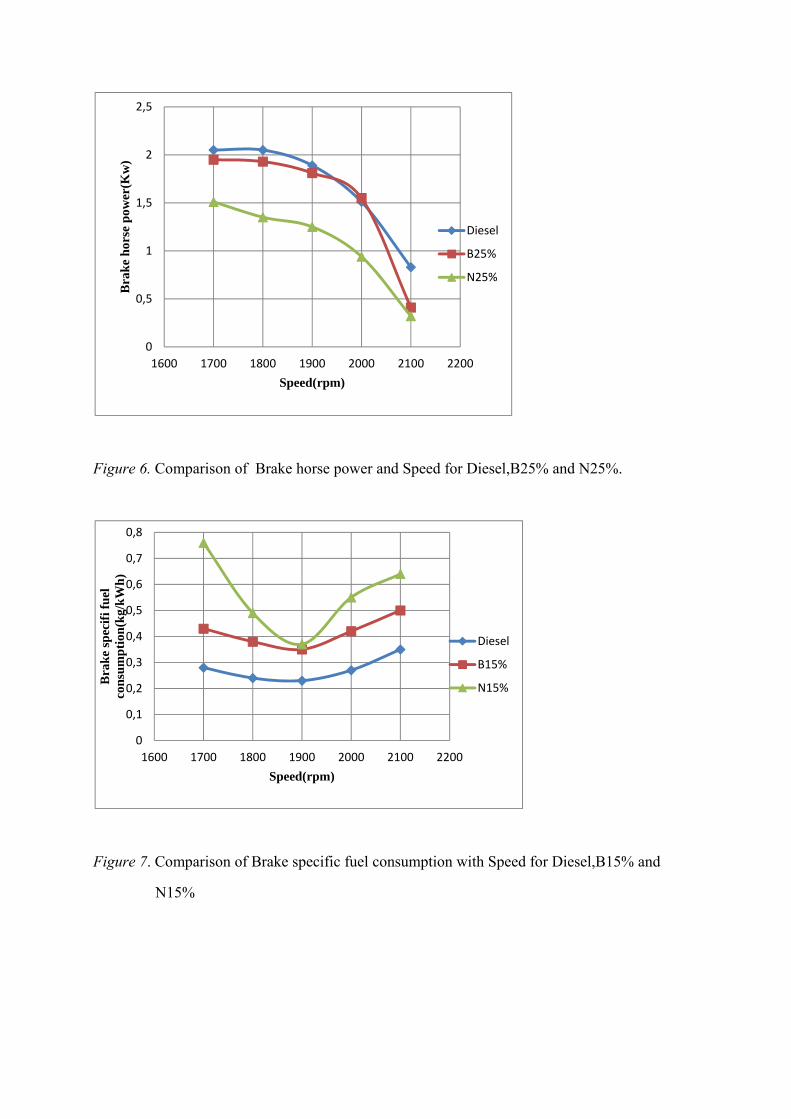
Figure 6. Comparison of Brake horse power and Speed for Diesel,B25% and N25%.
Figure 7. Comparison of Brake specific fuel consumption with Speed for Diesel,B15% and
N15%
0
0,5
1
1,5
2
2,5
1600 1700 1800 1900 2000 2100 2200
Bra
ke
hor
se p
ower
(Kw
)
Speed(rpm)
Diesel
B25%
N25%
0
0,1
0,2
0,3
0,4
0,5
0,6
0,7
0,8
1600 1700 1800 1900 2000 2100 2200
Bra
ke
spec
ifi f
uel
co
nsu
mp
tion
(kg/
kW
h)
Speed(rpm)
Diesel
B15%
N15%
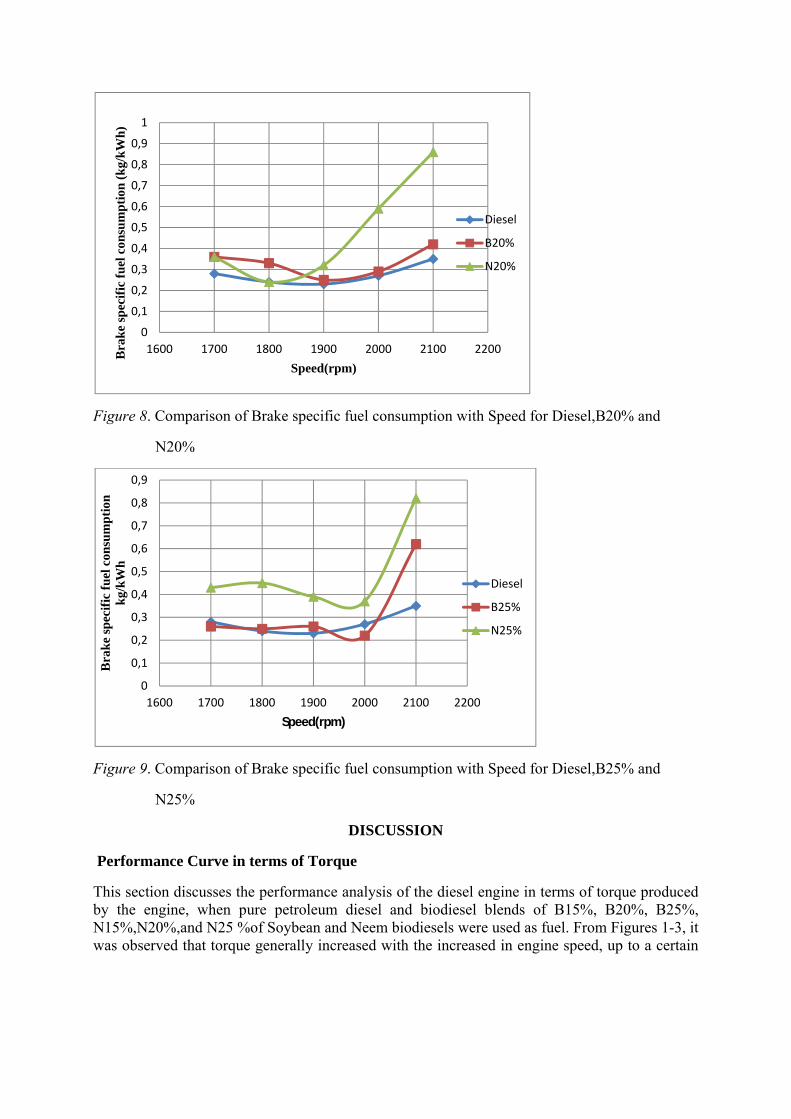
Figure 8. Comparison of Brake specific fuel consumption with Speed for Diesel,B20% and
N20%
Figure 9. Comparison of Brake specific fuel consumption with Speed for Diesel,B25% and
N25%
DISCUSSION
Performance Curve in terms of Torque
This section discusses the performance analysis of the diesel engine in terms of torque produced by the engine, when pure petroleum diesel and biodiesel blends of B15%, B20%, B25%, N15%,N20%,and N25 %of Soybean and Neem biodiesels were used as fuel. From Figures 1-3, it was observed that torque generally increased with the increased in engine speed, up to a certain
0
0,1
0,2
0,3
0,4
0,5
0,6
0,7
0,8
0,9
1
1600 1700 1800 1900 2000 2100 2200Bra
ke
spec
ific
fu
el c
onsu
mp
tion
(k
g/k
Wh
)
Speed(rpm)
Diesel
B20%
N20%
0
0,1
0,2
0,3
0,4
0,5
0,6
0,7
0,8
0,9
1600 1700 1800 1900 2000 2100 2200
Bra
ke
spec
ific
fu
el c
onsu
mp
tion
k
g/k
Wh
Speed(rpm)
Diesel
B25%
N25%
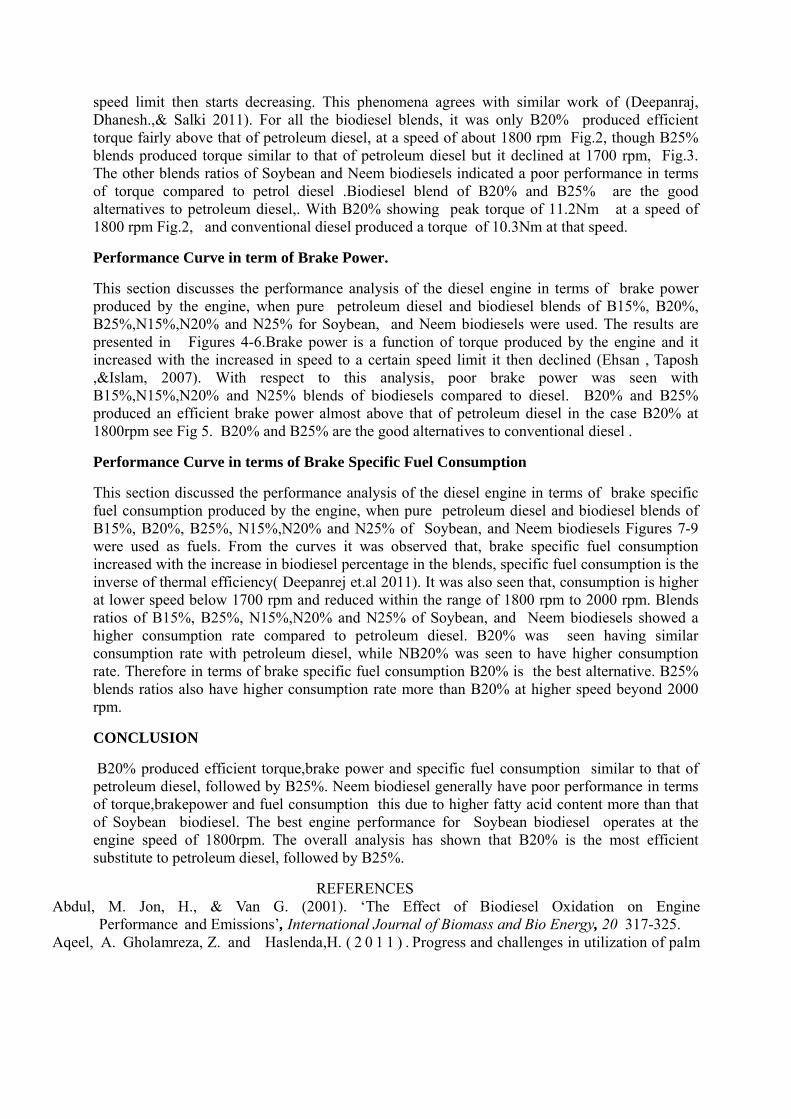
speed limit then starts decreasing. This phenomena agrees with similar work of (Deepanraj, Dhanesh.,& Salki 2011). For all the biodiesel blends, it was only B20% produced efficient torque fairly above that of petroleum diesel, at a speed of about 1800 rpm Fig.2, though B25% blends produced torque similar to that of petroleum diesel but it declined at 1700 rpm, Fig.3. The other blends ratios of Soybean and Neem biodiesels indicated a poor performance in terms of torque compared to petrol diesel .Biodiesel blend of B20% and B25% are the good alternatives to petroleum diesel,. With B20% showing peak torque of 11.2Nm at a speed of 1800 rpm Fig.2, and conventional diesel produced a torque of 10.3Nm at that speed.
Performance Curve in term of Brake Power.
This section discusses the performance analysis of the diesel engine in terms of brake power produced by the engine, when pure petroleum diesel and biodiesel blends of B15%, B20%, B25%,N15%,N20% and N25% for Soybean, and Neem biodiesels were used. The results are presented in Figures 4-6.Brake power is a function of torque produced by the engine and it increased with the increased in speed to a certain speed limit it then declined (Ehsan , Taposh ,&Islam, 2007). With respect to this analysis, poor brake power was seen with B15%,N15%,N20% and N25% blends of biodiesels compared to diesel. B20% and B25% produced an efficient brake power almost above that of petroleum diesel in the case B20% at 1800rpm see Fig 5. B20% and B25% are the good alternatives to conventional diesel .
Performance Curve in terms of Brake Specific Fuel Consumption
This section discussed the performance analysis of the diesel engine in terms of brake specific fuel consumption produced by the engine, when pure petroleum diesel and biodiesel blends of B15%, B20%, B25%, N15%,N20% and N25% of Soybean, and Neem biodiesels Figures 7-9 were used as fuels. From the curves it was observed that, brake specific fuel consumption increased with the increase in biodiesel percentage in the blends, specific fuel consumption is the inverse of thermal efficiency( Deepanrej et.al 2011). It was also seen that, consumption is higher at lower speed below 1700 rpm and reduced within the range of 1800 rpm to 2000 rpm. Blends ratios of B15%, B25%, N15%,N20% and N25% of Soybean, and Neem biodiesels showed a higher consumption rate compared to petroleum diesel. B20% was seen having similar consumption rate with petroleum diesel, while NB20% was seen to have higher consumption rate. Therefore in terms of brake specific fuel consumption B20% is the best alternative. B25% blends ratios also have higher consumption rate more than B20% at higher speed beyond 2000 rpm.
CONCLUSION
B20% produced efficient torque,brake power and specific fuel consumption similar to that of petroleum diesel, followed by B25%. Neem biodiesel generally have poor performance in terms of torque,brakepower and fuel consumption this due to higher fatty acid content more than that of Soybean biodiesel. The best engine performance for Soybean biodiesel operates at the engine speed of 1800rpm. The overall analysis has shown that B20% is the most efficient substitute to petroleum diesel, followed by B25%.
REFERENCES Abdul, M. Jon, H., & Van G. (2001). ‘The Effect of Biodiesel Oxidation on Engine
Performance and Emissions’, International Journal of Biomass and Bio Energy, 20 317-325. Aqeel, A. Gholamreza, Z. and Haslenda,H. ( 2 0 1 1 ) . Progress and challenges in utilization of palm
oil biomass as fuel for decentralized electricity generation. Renew. Sustain. EnergyRev, 15 574-583
Bugaje,I.M.Umar,B,HighinaB.K,(2011).Performance of biodiesel compared to conventional diesel fuel in stationary internal combustion engines .Journal of applied technology in environmental sanitation, 2, 199-205
Deepanraj,B. Dhanesh,C. Salki,R.(2011) Use of palm oil biodisel blends as a fuel for compression ignition engine . American Journal of Applied Science 8(11): 1154-1158, .
Ehsan, M.Taposh R. M.Islam, M.M.(2007). Running a diesel engine with biodiesel Proceedings of
the7thInternational Conference on Mechanical Engineering, 7 34-38.
Giri, N.K. 2009 Automobile technology Khanna Publishers India 2nd Edition 156-178
Hossain, A.Boyce,A.N. (2009). Comparative study of biodiesel production from pure palm oil and waste palm oil. Arab Gulf J. Sci. Res. 27(1-2): 3338
Kanothe ,G., J.V. Gerpen and J. Krahl. (2004). Biodisel hand book. AOCS press Illinois.
Knothe,G.;Matheaus,A.C.;Ryan III T.W (2003). Cetane numbers of branched and straight-chain fatty esters determined in an ignition quality tester. Fuel, 82 971-975.
Shakila,M . Seyed, A; Fatemeh ,T; Najaf, H.(2011) Studying effect of alternative biodiesel fuel in performance and pollutants of diesel engines .Jounal of world academic science,engineering and technology,55,743-746
Yosimoto. Y. Onodera,.M,& Tamaki,H.(2001). Performance and emission characteristics of diesel engines fuelled by vegetable oils, SAE Paper ,01 18-23
ASSESSMENT OF INDOOR CARCER LINKED RADIONUCLIDES IN SOKOTO URBAN DWELLING
1*Yusuf Ahijjo Musa, 1Musa Momoh and 2Adamu Nchama Baba-Kutigi.
1*Department of Phyiscs, Usmanu Danfodiyo University, Sokoto-Nigeria
2Department of Phyiscs, Federal University, Dutsin-Ma, Katsina-Nigeria
1* Usmanu Danfodiyo University, P.M.B. 2346, Sokoto-Nigeria: Correspondence Author
ABSTRACT
Radiation can be ambiguous to the layman. Typically, one only has an understanding of radiation from news, movies, or books. Largely these sources tend to sensationalize radiation, relating to solar and thermal radiations with little emphasis to ionizing radiations from primordial and anthropogenic radionuclides. Gamma-ray spectroscopy was used for determination of K-40 and Ra-226 in this study that was carried out by collecting air sample with Activated Charcoal Detectors (ACDs) mounted in thirty living apartment sample points in Sokoto. This provided information about the level of radionuclides present in the dwellings which have been implicated as a carcinogen to the lungs through ionizing radiations. Due to the sampling procedure in all the points, the results obtained now represent the entire dwelling. Thereby, allowing us to ascertain the environmental induced health impacts of K-40 and Ra-226.
Keywords: carcinogen, gamma-ray spectroscopy, ionization, radionuclides, Sokoto
INTRODUCTION
Natural radioactivity is widely spread in the earth’s environment and it exists in various geological formations like soils, rocks, plants, water and air (Malance et al., 1996, Abdo et al., 1999). As early as the days of the Manhattan Project, "health physicists in USA" have predicted that long term health effects from exposures to internally deposited alpha- and beta-emitting radioisotopes, inhaled or ingested from radioactive contaminated environment will be severe (Persson, 1994). Unstable nuclides are known as radioactive nuclides or radionuclides. They decay loosing excessive mass energy by the emission of particle and photons. There are two types of radionuclides. Thorium-232, Radium-226, Radon-222, and Lead-210 are Uranium progenies of health impacts. And Potassium-40 is a significant source because it has a half-life that is larger than the age of the earth (Ian, 2007). Mainly, they emit alpha particles, beta particle and gamma radiation, although they may decay by spontaneous fission. There are also artificial radionuclides, like 60Co which is manufactured through the following reaction in equation (1) (Cember, 1983). + ⟶ (Radioactive) (1)
Advantages of gamma spectroscopy over alpha spectroscopy of 210Pb (Zaborska et al., 2007), are that gamma spectroscopy is non-destructive, several isotopes can be measured simultaneously in one
spectrum (including 210Pb), only physical preparation of the samples (no time consuming chemical separation) is needed and the detection efficiency is only dependent on physical parameters (Salbu et al., 2012).
THE STUDY AREA
Sokoto metropolis is the study area. Sokoto lies on the Latitude 13.08333330, Longitude 5.250, and Altitude 895 (feet). The time zone in Sokoto is Africa/Lagos, sunrise at 06:27 and sunset at 18:46. It is located in the extreme northwest of Nigeria, bordering Niger and Benin Republics, near to the confluence of the Sokoto River and Rima River. It has an annual average temperature of 33.3oC; on the whole, it is a very hot area. Sokoto state is in the dry Sahel, surrounded by sandy savannah and isolated hills (www.fallingrain.com/world/NI/51/sokoto.html,). Sokoto state is highly endowed with the wealth of limestone which attracted the chosen site of one existing cement company, and this limestone also contains a fairly amount of carcinogenic radionuclides (Adediran et al, 1998), and could emit the potential dose of this environmental health potencies that could possibly cause the lung cancer. This is no longer doubtful that low concentration of 222Rn can as well deliver the radiation dose which can cause internal hazards to human (Field et al., 2000), METHODOLOGY
This research was conducted on the use of a commercially purchased activated charcoal detectors (ACDs). ACDs are passive devices deployed for 1-7 days so as to measure the indoor radionuclides by adsorption on the active sites of the activated carbon (Oikawa et al., 2006). After sampling of the thirty gridded points randomly, so as to cover the entire Sokoto metropolis, the detector canisters are then sealed and sent to CERT, Zaria for analysis by sodium Iodide NaI ( ℓ) counter. After the equilibration period 21to24 days, the collectors can be directly gamma counted, or analytically prepared for liquid scintillation counting techniques. But in this case, the samples were gamma counted by sodium Iodide NaI ( ℓ) counter at the Centre for Energy Research and Training (CERT), Zaria. In the gamma counting method, the canisters containing 40g of ACDs were used. A single measurement in one room is used to estimate the “whole house” concentration as this is an indoor aimed research. A total number of sixty absorber canisters were constructed using a plastic cylinder with measured diameter of 3.5 cm and height 5.0 cm. Thirty (30) of which was equally perforated at the lid and a position for membrane filter, and well sealed round to avoid cross-ventilation that could probably reduce the expected radon concentration. And the remaining thirty (30) plastic cylinders with measured diameter 4.0 cm and height 6.0 cm without perforation to harbour other canisters with fairly smaller dimensions to enhance proper sealing until they are gamma counted were also prepared. The dose of every sampled point was also measured with the aid of Dose Rate Metre, Rados [RDS-120]. Dose rate is the interaction of gamma rays or a measure of the energy deposited in the tissue by gamma ray flux and is measured in Sievert (Sv) where 1Sv is 1joule per kilo. (Ahmad et al., 2000). Thus, the three principles of expressing radiometric measurements are; Activity concentration, Count per second and dose rate was extensively utilised as the result of the analysed result may show in this research.

MATERIALS
A 400 g bottle of commercial ACDs produced by Reidel-De Haen AG Seelze Hannover of purity 93% and Batch No 18002, purchased from Hali Shua’ibu Science Laboratory Ltd. Sokoto, was used throughout the sampling exercise. An electronic chemical balance of Shimadzu Corporation, assembled by SPM Japan, which is capable of measuring between 0.1 mg to 320 g, was used to measure 40 g of ACDs needed in the canister. The balance was obtained from Central Laboratory, in the Faculty of Science, Usmanu Danfodiyo University, Sokoto.
RESULT
Samples were prepared following the procedures discussed in the previously. And the result was obtained subject to the following technique and analysis that shall be discussed herein.
Sodium Iodide (NaI ( )) Detectors
Gamma ray detection with a NaI ( ℓ) crystal was discovered by Robert Hofstadter in 1948. Later that year
gamma spectroscopy with NaI ( ℓ) was discovered by Hofstadter and his graduate student, John McIntyre. The basic properties of the detector were researched and reported in the Physical Review over the next few years. Since then the scintillation detector (of which there are many different crystals), in particular the NaI ( ℓ) detector, have been used in a wonderful array of important physical experiments
(William et al, 1989). Below is table 1: illustrating some features of NaI ( ℓ) detector. It consists of a single crystal of thallium activated sodium iodide, optically coupled to the photocathode of a photomultiplier tube. When a gamma ray enters the detector, it interacts by causing ionization of the sodium iodide. This creates excited states in the crystal that decay by emitting visible light photons. This emission is called scintillation, which is the reason why this type of sensor is known as a scintillation detector. The thallium doping of the crystal is critical for shifting the wavelength of the light photons into the sensitive range of the photocathode.
Table 1: Show the Performance of a typical NaI ( ℓ) detector
Material NaI ( ℓ)
Density (g/cm3) 3.67
Time Constant (ns) 230
Luminescence Wavelength (nm) 420
Relative Light Intensity 100
Refractive Index 1.85
Energy Calibration
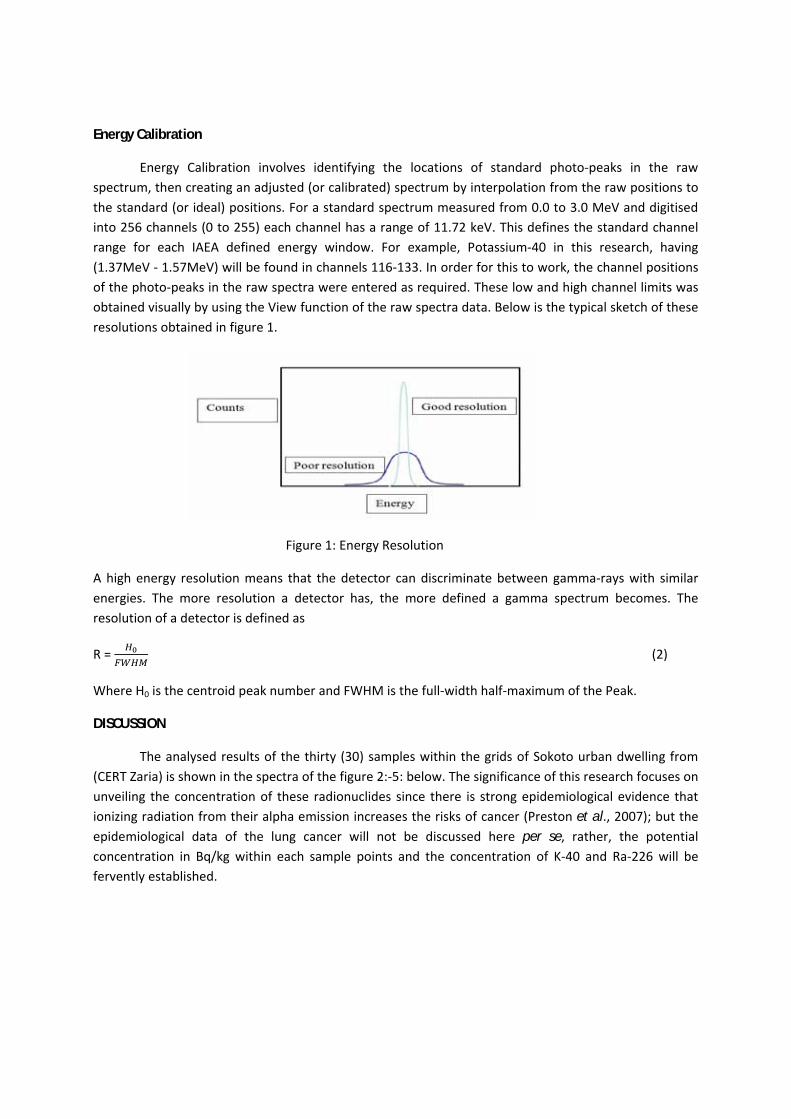
Energy Calibration involves identifying the locations of standard photo-peaks in the raw spectrum, then creating an adjusted (or calibrated) spectrum by interpolation from the raw positions to the standard (or ideal) positions. For a standard spectrum measured from 0.0 to 3.0 MeV and digitised into 256 channels (0 to 255) each channel has a range of 11.72 keV. This defines the standard channel range for each IAEA defined energy window. For example, Potassium-40 in this research, having (1.37MeV - 1.57MeV) will be found in channels 116-133. In order for this to work, the channel positions of the photo-peaks in the raw spectra were entered as required. These low and high channel limits was obtained visually by using the View function of the raw spectra data. Below is the typical sketch of these resolutions obtained in figure 1.
Figure 1: Energy Resolution
A high energy resolution means that the detector can discriminate between gamma-rays with similar energies. The more resolution a detector has, the more defined a gamma spectrum becomes. The resolution of a detector is defined as
R = (2)
Where H0 is the centroid peak number and FWHM is the full-width half-maximum of the Peak.
DISCUSSION
The analysed results of the thirty (30) samples within the grids of Sokoto urban dwelling from (CERT Zaria) is shown in the spectra of the figure 2:-5: below. The significance of this research focuses on unveiling the concentration of these radionuclides since there is strong epidemiological evidence that ionizing radiation from their alpha emission increases the risks of cancer (Preston et al., 2007); but the epidemiological data of the lung cancer will not be discussed here per se, rather, the potential concentration in Bq/kg within each sample points and the concentration of K-40 and Ra-226 will be fervently established.
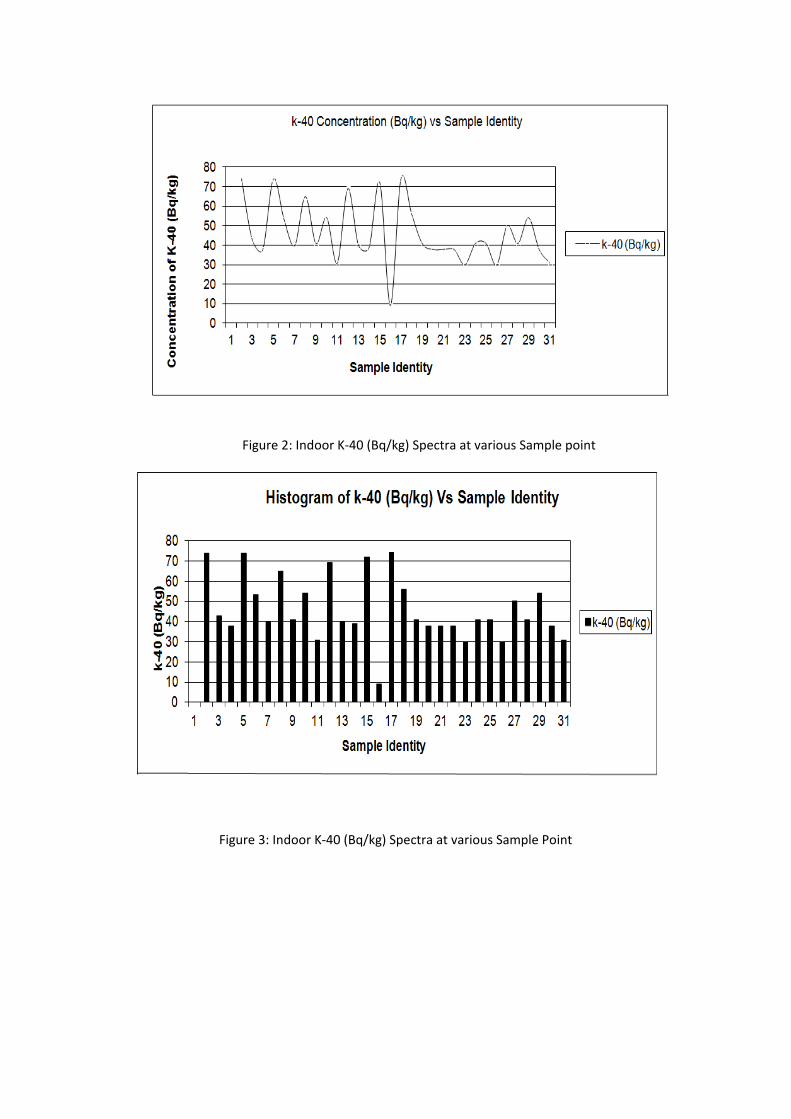
Figure 2: Indoor K-40 (Bq/kg) Spectra at various Sample point
Figure 3: Indoor K-40 (Bq/kg) Spectra at various Sample Point
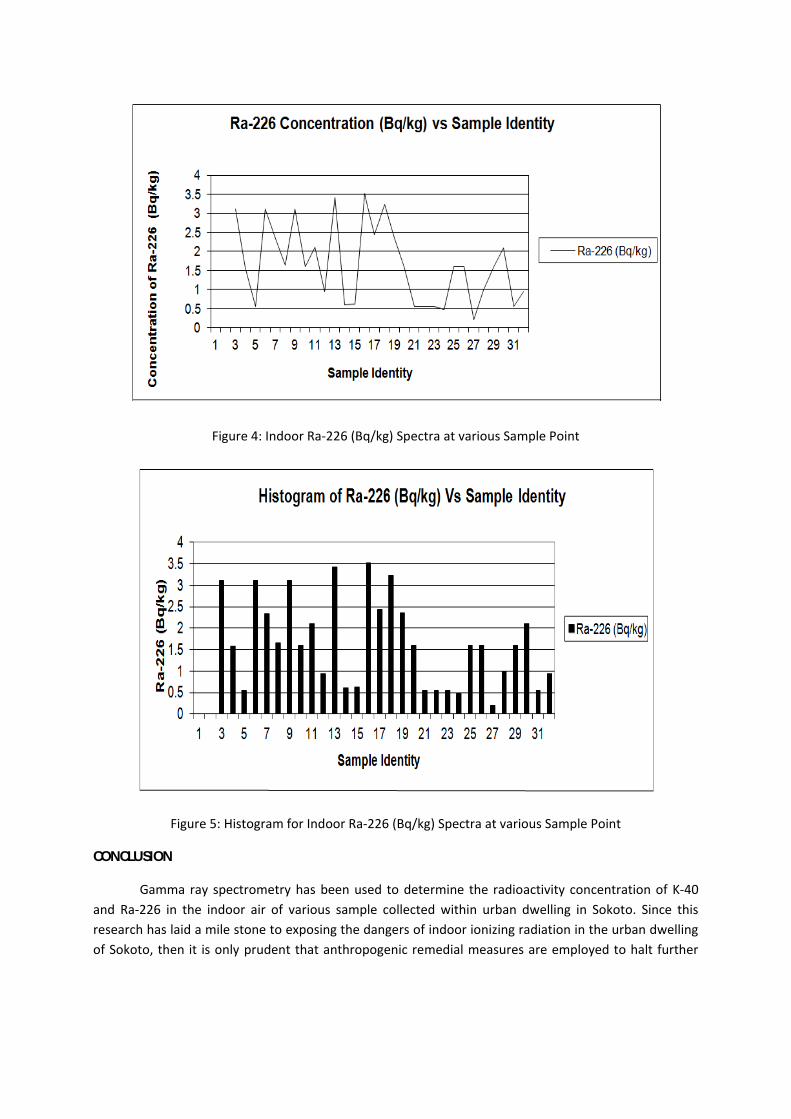
Figure 4: Indoor Ra-226 (Bq/kg) Spectra at various Sample Point
Figure 5: Histogram for Indoor Ra-226 (Bq/kg) Spectra at various Sample Point
CONCLUSION
Gamma ray spectrometry has been used to determine the radioactivity concentration of K-40 and Ra-226 in the indoor air of various sample collected within urban dwelling in Sokoto. Since this research has laid a mile stone to exposing the dangers of indoor ionizing radiation in the urban dwelling of Sokoto, then it is only prudent that anthropogenic remedial measures are employed to halt further
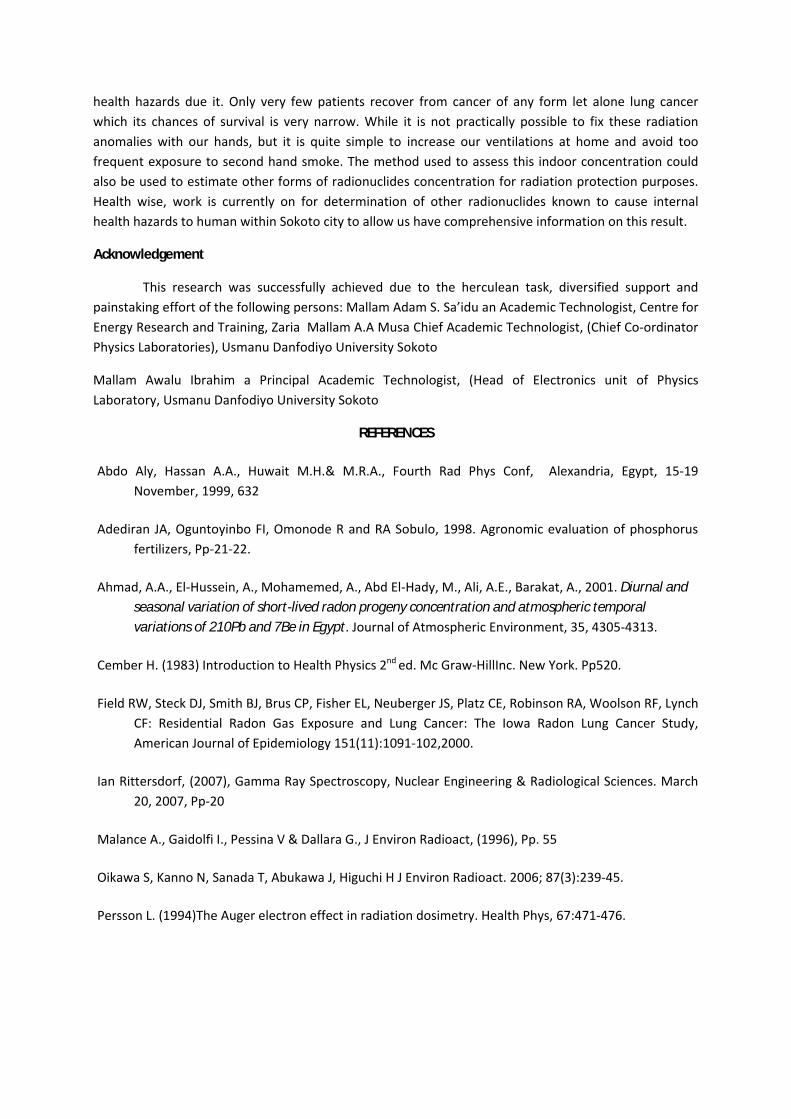
health hazards due it. Only very few patients recover from cancer of any form let alone lung cancer which its chances of survival is very narrow. While it is not practically possible to fix these radiation anomalies with our hands, but it is quite simple to increase our ventilations at home and avoid too frequent exposure to second hand smoke. The method used to assess this indoor concentration could also be used to estimate other forms of radionuclides concentration for radiation protection purposes. Health wise, work is currently on for determination of other radionuclides known to cause internal health hazards to human within Sokoto city to allow us have comprehensive information on this result.
Acknowledgement
This research was successfully achieved due to the herculean task, diversified support and painstaking effort of the following persons: Mallam Adam S. Sa’idu an Academic Technologist, Centre for Energy Research and Training, Zaria Mallam A.A Musa Chief Academic Technologist, (Chief Co-ordinator Physics Laboratories), Usmanu Danfodiyo University Sokoto
Mallam Awalu Ibrahim a Principal Academic Technologist, (Head of Electronics unit of Physics Laboratory, Usmanu Danfodiyo University Sokoto
REFERENCES
Abdo Aly, Hassan A.A., Huwait M.H.& M.R.A., Fourth Rad Phys Conf, Alexandria, Egypt, 15-19 November, 1999, 632
Adediran JA, Oguntoyinbo FI, Omonode R and RA Sobulo, 1998. Agronomic evaluation of phosphorus fertilizers, Pp-21-22.
Ahmad, A.A., El-Hussein, A., Mohamemed, A., Abd El-Hady, M., Ali, A.E., Barakat, A., 2001. Diurnal and seasonal variation of short-lived radon progeny concentration and atmospheric temporal variations of 210Pb and 7Be in Egypt. Journal of Atmospheric Environment, 35, 4305-4313.
Cember H. (1983) Introduction to Health Physics 2nd ed. Mc Graw-HillInc. New York. Pp520.
Field RW, Steck DJ, Smith BJ, Brus CP, Fisher EL, Neuberger JS, Platz CE, Robinson RA, Woolson RF, Lynch CF: Residential Radon Gas Exposure and Lung Cancer: The Iowa Radon Lung Cancer Study, American Journal of Epidemiology 151(11):1091-102,2000.
Ian Rittersdorf, (2007), Gamma Ray Spectroscopy, Nuclear Engineering & Radiological Sciences. March 20, 2007, Pp-20
Malance A., Gaidolfi I., Pessina V & Dallara G., J Environ Radioact, (1996), Pp. 55
Oikawa S, Kanno N, Sanada T, Abukawa J, Higuchi H J Environ Radioact. 2006; 87(3):239-45.
Persson L. (1994)The Auger electron effect in radiation dosimetry. Health Phys, 67:471-476.

Preston DL, Ron E, Tokuoka S, Funamoto S, Nishi N, Soda M, Mabuchi K, Kodama K. (2007). Solid cancer incidence in atomic bomb survivors: 1958–1998. Radiat Res 168:1– 64;
Salbu, B., Burkitbaev, M., Strømman, G., Shishkov, I., Kayukov, P., Uralbekov, B. & Rosseland, B. O. (2012). Environmental impact assessment of radionuclides and trace elements at the Kurday U mining site, Kazakhstan. Journal of Environmental Radioactivity. In press.
The Geography of Sokoto state at a glance www.fallingrain.com/world/NI/51/sokoto.html, retrieved on 6th September, 2013.
William R.; Field, Steck, Daniel J.; Lynch, Charles F. (1999). "Exposure to Atmospheric Radon". Environmental Health Perspectives 107(2): 123.doi: 10.2307/3434368.
Zaborska, A., Carroll, J., Papucci, C., Pempkowiak, J., Intercomparison of alpha and gamma spectrometry techniques used in 210Pb geochronology. J. Env. Rad. 93 (2007) 38 – 50.
ENVIRONMENTAL SAFETY AND SUSTAINABILITY: A PANACEA FOR HEALTHY NATIONAL DEVELOPMENT IN NIGERIA
Musa Sabo Abdullahi
Department of Chemistry, Federal College of Education, Kontagora, Nigeria.
Abstract
The role of legislation in inducing responsible attitudes and behaviors towards the environment cannot be overlooked. Legislation serves as an effective instrument for environmental protection, planning, pollution, prevention and control. The following provides a summary of Nigerian legislation on the environment. This paper attempts to discuss environmental problems in Nigeria, characteristic disposal of waste, the consequences of inappropriate disposal, environmental safety as well as its sustainability and protection. Recommendations were also given. One of such recommendations is that environmental protection techniques need to be cultured, home-grown and the framework should begin from “Bottom to Top” and should be community based. The framework should be organized at the village or community level. A numbered of community should be grouped together at the (political) ward level and from ward level to Local Government Level to oversee this function. Environmental protection agents at the local government level should be empowered to punish every offender in form of tax or penalty. Environmental awareness education should be included and enforced in the primary and post primary school curricula.
Keywords: Environment, waste disposal, safety, sustainability, protection
Introduction
The earth is primarily a life support system. It consists essentially of biochemical processes that imbue it with the capacity to sustain life. As an ecosystem, the earth however, has a threshold within which it can effectively absorb or withstand interruptions and radical changes in the biochemical processes that help to sustain life.
Environmental problems and the accelerating changes in living conditions have become a fundamental part of the world in general and metropolises in particular. Earlier, environmental problems have been considered as technical and economic problems; while in the recent decades the social dimensions of environmental problems such as public attention and people’s attitudes towards environment have become one of the areas of environmental sociology and environmental psychology (Khalil et al, 2007). Similarly, the developmental activities of man over the decades have primarily restructured the environment and upset the delicate balance of nature. It has resulted in a number of changes on the planet, earth. These changes according to Iroha et al (2008) are essentially inimical to the continued existence of man and other life forms on earth.
Globally, the increasing affluence in urban centers, relative to the countryside, has posed problems to the management of the environment (Hardoy and Mitlin, 2001). Urban environments have become the “cesspools” due to increased pollution (air, water, sound
and land). The physical correspondence and appearance of different products, and ultimately the waste thereof define the state of any environment. The “throw-away” culture is symbolism for fashionableness, ‘relevance’ and modernity. The attempt of this paper is to show how environmental pollution management has become an issue as a result of advancement of technology, tastes and preferences of the modern society and how the “throw-away culture” (Toffler, 1970) poses a great challenge to environments per se, urban planners and managers especially in the developing countries. Nigeria can be cited as one of the developing countries where environmental pollution has become a fundamental and challenging problem across the country.
The World Health Organization (WHO) refers to waste as “something, which the owner no longer wants at a given time and space and which has no current or perceived market value”. This line of thought represented a broad-based approach toward the classification of what constitutes waste. However, what one regards as waste may not be totally useless, as much can be recycled to produce new products. Wastes may be gaseous, liquid, or solid. Whereas gaseous and liquid wastes are free flowing and can easily migrate from one place to another, solid wastes are not free flowing. Handling and containment of liquid and to greater extent solid wastes has remained one of man's intractable problems (Ogbonna et al, 2002).
Nigeria was a country relatively free of environmental problems until late 1990s when it began to experience high rate of population growth. As a result of this population growth, industrialization and modernization, the environmental problems became a serious issue. The rapid increase in population began to use more food with increased by-products, water and its resultant waste, household wastes, remnants of new and renovation of houses which results in uncontrollable amount of environmental pollution. Additionally, urbanization became a great source of contamination of the air, water, land and the environment in general. Development of land, necessary for industrialization, began to violate the country's wildlife habitats. Soil erosion specifically in some parts of the country simultaneously became a prevalent issue, as the country realized the effects of years of agriculture and logging upon the land. All of these potential environmental emergencies came to a head throughout the 1970s and the 1980s, causing a great deal of attention and concern to be cast upon various major problems in need of remedy (Nidal and Zeyad, 2007) This paper attempts to discuss how environmental safety can bring about healthy national development in Nigeria and world at large. The resultant impacts of man’s interaction with his environment have enormously contributed to environmental problems facing Nigerian nation. Some of these problems according to Omofonmwan and Osa-Edoh (2008) are urbanization, overpopulation, deforestation, desertification and pollution among others.
Characteristic disposal of waste
Khan (2003) defines solid waste as “material that is cheaper to throw away than to store or use.” He goes on to say, nevertheless, that such unwanted material can be segregated, transformed, recycled and re-used with great environmental and financial gain or benefit. In the same strain, it important to note that sources of solid waste are different and this knowledge can be useful in showing that different types of waste are subject to spatial mapping.
Studies on Bamenda City in Cameroon by Achankeng (2003) indicate that one new and increasing element in waste composition is that of non-biodegradable waste. Electronic waste or E-waste, and waste from foreign goods are increasing. This show how the element of globalization influences wastes generation in the developing world give that the problem transcends across national borders. Lifestyles are linked to various wastes production. From the table it is conspicuous that the nature of waste could produce some benefits especially in agricultural production in the case where urban agriculture is accommodated as part of urban livelihoods and development. The cradle of the throwaway culture,
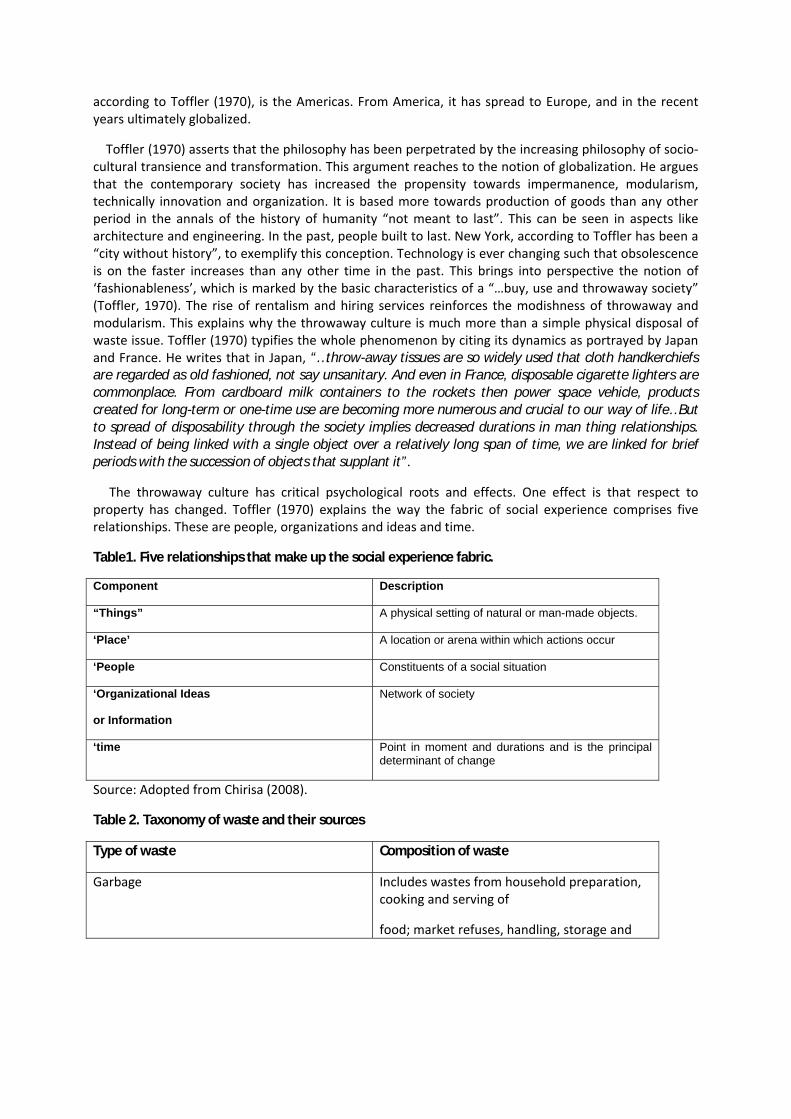
according to Toffler (1970), is the Americas. From America, it has spread to Europe, and in the recent years ultimately globalized.
Toffler (1970) asserts that the philosophy has been perpetrated by the increasing philosophy of socio-cultural transience and transformation. This argument reaches to the notion of globalization. He argues that the contemporary society has increased the propensity towards impermanence, modularism, technically innovation and organization. It is based more towards production of goods than any other period in the annals of the history of humanity “not meant to last”. This can be seen in aspects like architecture and engineering. In the past, people built to last. New York, according to Toffler has been a “city without history”, to exemplify this conception. Technology is ever changing such that obsolescence is on the faster increases than any other time in the past. This brings into perspective the notion of ‘fashionableness’, which is marked by the basic characteristics of a “…buy, use and throwaway society” (Toffler, 1970). The rise of rentalism and hiring services reinforces the modishness of throwaway and modularism. This explains why the throwaway culture is much more than a simple physical disposal of waste issue. Toffler (1970) typifies the whole phenomenon by citing its dynamics as portrayed by Japan and France. He writes that in Japan, “…throw-away tissues are so widely used that cloth handkerchiefs are regarded as old fashioned, not say unsanitary. And even in France, disposable cigarette lighters are commonplace. From cardboard milk containers to the rockets then power space vehicle, products created for long-term or one-time use are becoming more numerous and crucial to our way of life…But to spread of disposability through the society implies decreased durations in man thing relationships. Instead of being linked with a single object over a relatively long span of time, we are linked for brief periods with the succession of objects that supplant it”.
The throwaway culture has critical psychological roots and effects. One effect is that respect to property has changed. Toffler (1970) explains the way the fabric of social experience comprises five relationships. These are people, organizations and ideas and time.
Table1. Five relationships that make up the social experience fabric.
Component Description
“Things” A physical setting of natural or man-made objects.
‘Place’ A location or arena within which actions occur
‘People Constituents of a social situation
‘Organizational Ideas
or Information
Network of society
‘time Point in moment and durations and is the principal determinant of change
Source: Adopted from Chirisa (2008).
Table 2. Taxonomy of waste and their sources
Type of waste Composition of waste
Garbage Includes wastes from household preparation, cooking and serving of
food; market refuses, handling, storage and
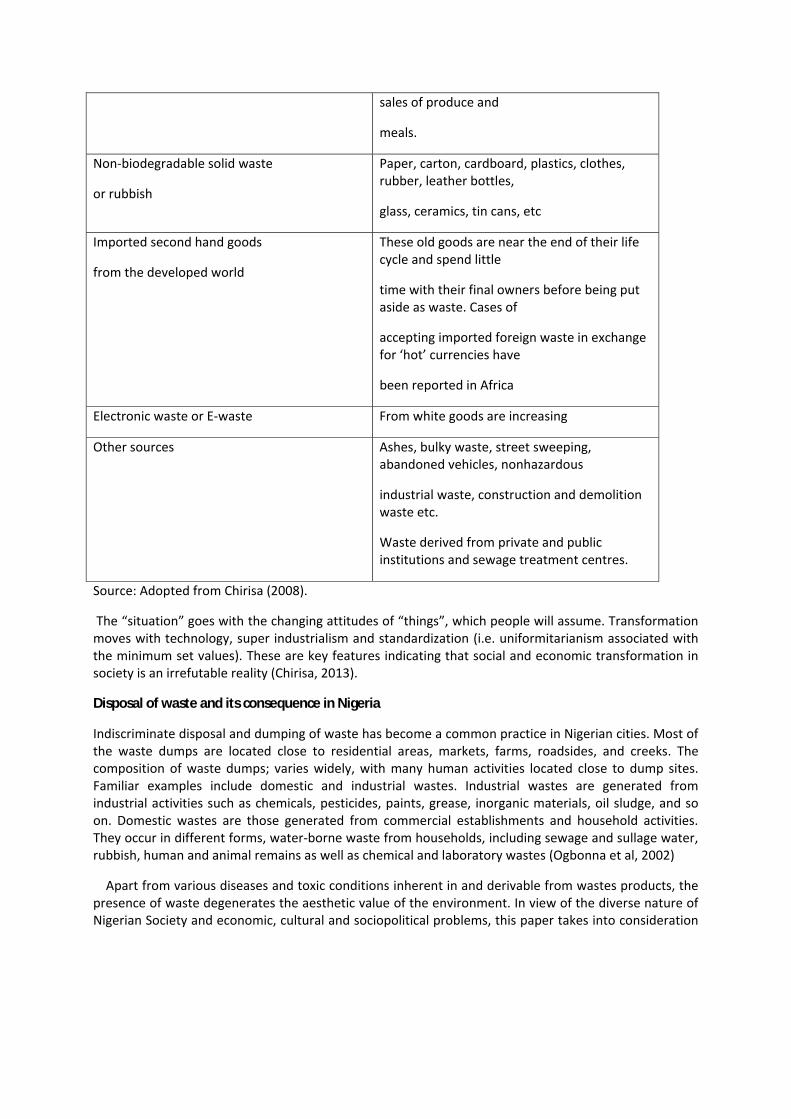
sales of produce and
meals.
Non-biodegradable solid waste
or rubbish
Paper, carton, cardboard, plastics, clothes, rubber, leather bottles,
glass, ceramics, tin cans, etc
Imported second hand goods
from the developed world
These old goods are near the end of their life cycle and spend little
time with their final owners before being put aside as waste. Cases of
accepting imported foreign waste in exchange for ‘hot’ currencies have
been reported in Africa
Electronic waste or E-waste From white goods are increasing
Other sources Ashes, bulky waste, street sweeping, abandoned vehicles, nonhazardous
industrial waste, construction and demolition waste etc.
Waste derived from private and public institutions and sewage treatment centres.
Source: Adopted from Chirisa (2008).
The “situation” goes with the changing attitudes of “things”, which people will assume. Transformation moves with technology, super industrialism and standardization (i.e. uniformitarianism associated with the minimum set values). These are key features indicating that social and economic transformation in society is an irrefutable reality (Chirisa, 2013).
Disposal of waste and its consequence in Nigeria
Indiscriminate disposal and dumping of waste has become a common practice in Nigerian cities. Most of the waste dumps are located close to residential areas, markets, farms, roadsides, and creeks. The composition of waste dumps; varies widely, with many human activities located close to dump sites. Familiar examples include domestic and industrial wastes. Industrial wastes are generated from industrial activities such as chemicals, pesticides, paints, grease, inorganic materials, oil sludge, and so on. Domestic wastes are those generated from commercial establishments and household activities. They occur in different forms, water-borne waste from households, including sewage and sullage water, rubbish, human and animal remains as well as chemical and laboratory wastes (Ogbonna et al, 2002)
Apart from various diseases and toxic conditions inherent in and derivable from wastes products, the presence of waste degenerates the aesthetic value of the environment. In view of the diverse nature of Nigerian Society and economic, cultural and sociopolitical problems, this paper takes into consideration
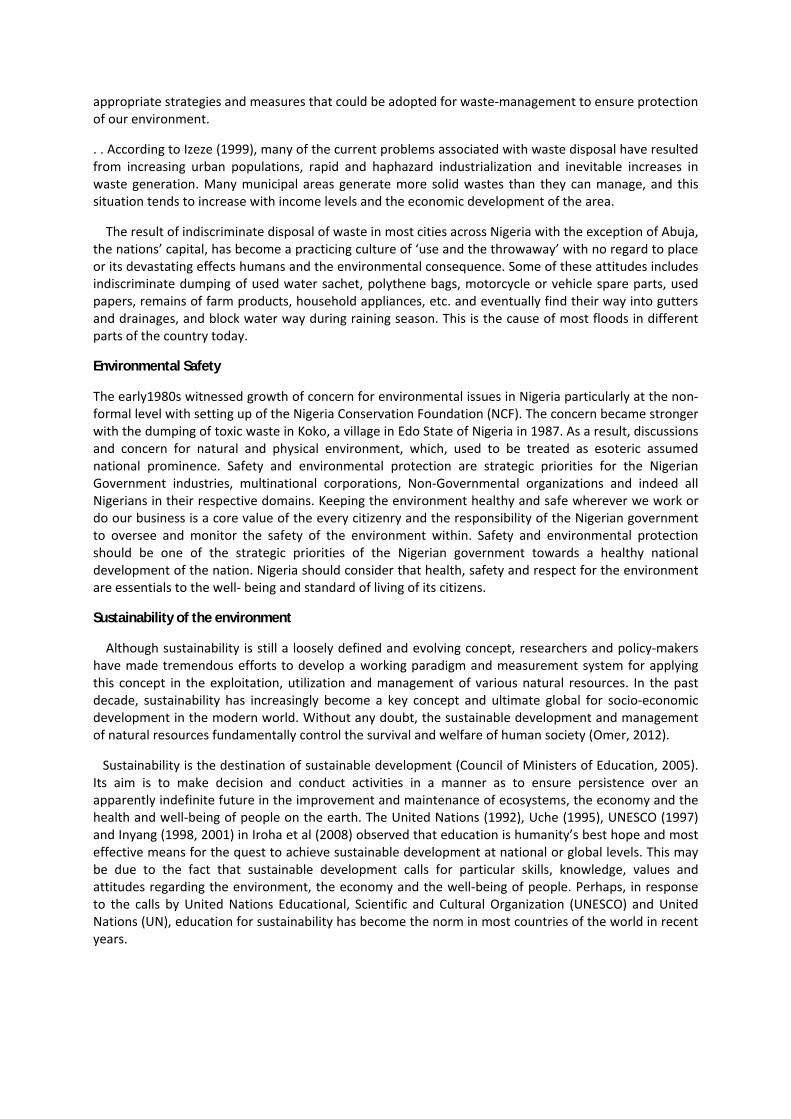
appropriate strategies and measures that could be adopted for waste-management to ensure protection of our environment.
. . According to Izeze (1999), many of the current problems associated with waste disposal have resulted from increasing urban populations, rapid and haphazard industrialization and inevitable increases in waste generation. Many municipal areas generate more solid wastes than they can manage, and this situation tends to increase with income levels and the economic development of the area.
The result of indiscriminate disposal of waste in most cities across Nigeria with the exception of Abuja, the nations’ capital, has become a practicing culture of ‘use and the throwaway’ with no regard to place or its devastating effects humans and the environmental consequence. Some of these attitudes includes indiscriminate dumping of used water sachet, polythene bags, motorcycle or vehicle spare parts, used papers, remains of farm products, household appliances, etc. and eventually find their way into gutters and drainages, and block water way during raining season. This is the cause of most floods in different parts of the country today.
Environmental Safety
The early1980s witnessed growth of concern for environmental issues in Nigeria particularly at the non-formal level with setting up of the Nigeria Conservation Foundation (NCF). The concern became stronger with the dumping of toxic waste in Koko, a village in Edo State of Nigeria in 1987. As a result, discussions and concern for natural and physical environment, which, used to be treated as esoteric assumed national prominence. Safety and environmental protection are strategic priorities for the Nigerian Government industries, multinational corporations, Non-Governmental organizations and indeed all Nigerians in their respective domains. Keeping the environment healthy and safe wherever we work or do our business is a core value of the every citizenry and the responsibility of the Nigerian government to oversee and monitor the safety of the environment within. Safety and environmental protection should be one of the strategic priorities of the Nigerian government towards a healthy national development of the nation. Nigeria should consider that health, safety and respect for the environment are essentials to the well- being and standard of living of its citizens.
Sustainability of the environment
Although sustainability is still a loosely defined and evolving concept, researchers and policy-makers have made tremendous efforts to develop a working paradigm and measurement system for applying this concept in the exploitation, utilization and management of various natural resources. In the past decade, sustainability has increasingly become a key concept and ultimate global for socio-economic development in the modern world. Without any doubt, the sustainable development and management of natural resources fundamentally control the survival and welfare of human society (Omer, 2012).
Sustainability is the destination of sustainable development (Council of Ministers of Education, 2005). Its aim is to make decision and conduct activities in a manner as to ensure persistence over an apparently indefinite future in the improvement and maintenance of ecosystems, the economy and the health and well-being of people on the earth. The United Nations (1992), Uche (1995), UNESCO (1997) and Inyang (1998, 2001) in Iroha et al (2008) observed that education is humanity’s best hope and most effective means for the quest to achieve sustainable development at national or global levels. This may be due to the fact that sustainable development calls for particular skills, knowledge, values and attitudes regarding the environment, the economy and the well-being of people. Perhaps, in response to the calls by United Nations Educational, Scientific and Cultural Organization (UNESCO) and United Nations (UN), education for sustainability has become the norm in most countries of the world in recent years.
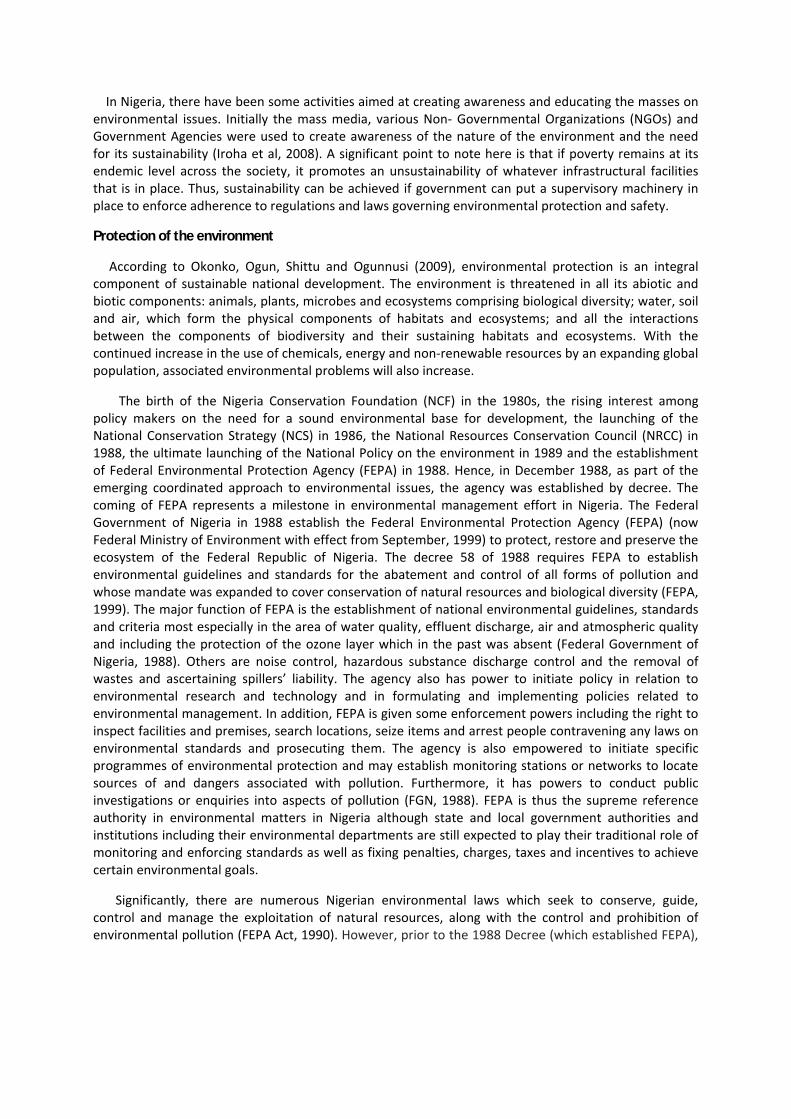
In Nigeria, there have been some activities aimed at creating awareness and educating the masses on environmental issues. Initially the mass media, various Non- Governmental Organizations (NGOs) and Government Agencies were used to create awareness of the nature of the environment and the need for its sustainability (Iroha et al, 2008). A significant point to note here is that if poverty remains at its endemic level across the society, it promotes an unsustainability of whatever infrastructural facilities that is in place. Thus, sustainability can be achieved if government can put a supervisory machinery in place to enforce adherence to regulations and laws governing environmental protection and safety.
Protection of the environment
According to Okonko, Ogun, Shittu and Ogunnusi (2009), environmental protection is an integral component of sustainable national development. The environment is threatened in all its abiotic and biotic components: animals, plants, microbes and ecosystems comprising biological diversity; water, soil and air, which form the physical components of habitats and ecosystems; and all the interactions between the components of biodiversity and their sustaining habitats and ecosystems. With the continued increase in the use of chemicals, energy and non-renewable resources by an expanding global population, associated environmental problems will also increase.
The birth of the Nigeria Conservation Foundation (NCF) in the 1980s, the rising interest among policy makers on the need for a sound environmental base for development, the launching of the National Conservation Strategy (NCS) in 1986, the National Resources Conservation Council (NRCC) in 1988, the ultimate launching of the National Policy on the environment in 1989 and the establishment of Federal Environmental Protection Agency (FEPA) in 1988. Hence, in December 1988, as part of the emerging coordinated approach to environmental issues, the agency was established by decree. The coming of FEPA represents a milestone in environmental management effort in Nigeria. The Federal Government of Nigeria in 1988 establish the Federal Environmental Protection Agency (FEPA) (now Federal Ministry of Environment with effect from September, 1999) to protect, restore and preserve the ecosystem of the Federal Republic of Nigeria. The decree 58 of 1988 requires FEPA to establish environmental guidelines and standards for the abatement and control of all forms of pollution and whose mandate was expanded to cover conservation of natural resources and biological diversity (FEPA, 1999). The major function of FEPA is the establishment of national environmental guidelines, standards and criteria most especially in the area of water quality, effluent discharge, air and atmospheric quality and including the protection of the ozone layer which in the past was absent (Federal Government of Nigeria, 1988). Others are noise control, hazardous substance discharge control and the removal of wastes and ascertaining spillers’ liability. The agency also has power to initiate policy in relation to environmental research and technology and in formulating and implementing policies related to environmental management. In addition, FEPA is given some enforcement powers including the right to inspect facilities and premises, search locations, seize items and arrest people contravening any laws on environmental standards and prosecuting them. The agency is also empowered to initiate specific programmes of environmental protection and may establish monitoring stations or networks to locate sources of and dangers associated with pollution. Furthermore, it has powers to conduct public investigations or enquiries into aspects of pollution (FGN, 1988). FEPA is thus the supreme reference authority in environmental matters in Nigeria although state and local government authorities and institutions including their environmental departments are still expected to play their traditional role of monitoring and enforcing standards as well as fixing penalties, charges, taxes and incentives to achieve certain environmental goals.
Significantly, there are numerous Nigerian environmental laws which seek to conserve, guide, control and manage the exploitation of natural resources, along with the control and prohibition of environmental pollution (FEPA Act, 1990). However, prior to the 1988 Decree (which established FEPA),
there were some laws and acts of Government relating to environmental protection. They include; the mineral act of 1969, 1973 and 1984, oil in navigable water Decree of 1968, associated Gas injection act of 1969 and Chad Basin development act of 1973 to mention but a few. These laws and / or acts where promulgated to address specific and identified environmental problems. These were narrow in scope and spatially restricted. Decree No 58 of 1988 as amended by Decree 59 of 1992, which gave birth to the FEPA (Now Ministry of Environment) empower the agency to have control over all issues relating to Nigeria Environment, its resources, exploitation and management. Despite the legal backing and funding, which FEPA enjoys from the federal government, the level of success so far recorded by FEPA is a far cry from her set objectives and goals. This is because the rate of environmental degradation is growing worse than what it was before the establishment of FEPA. For example, urbanization, deforestation, desertification and pollution are now more remarkable than ever before (Omofonmwan and Osa-Edoh 2008).
To this end, the unsustainable exploitation of the environment is blamed on the inability or failure of the environmental laws to correct acts as well as attitudes and beliefs of the different peoples of Nigeria, which impact negatively on the environment and the lack of enforcement of the laws stand out as the most fundamental cause of the inability of the legislations to protect the Niger Delta environment. This is blamed on inadequate funding, corruption, the lack of operational facilities, the low involvement of professionals, the uncooperative attitude of the multinational corporations, and the centralization of legislative powers in the central government, along with the privatization of the Nigerian state.
Recommendations
Environmental protection techniques need to be cultured, home-grown and the framework should begin from “Bottom to Top” and should be community based. The framework should be organized at the village or community level. A numbered of community should be grouped together at the (political) ward level and from ward level to Local Government Level.
Environmental protection agents at the local government level should be empowered to punish every offenders in form of tax or penalty. Environmental awareness education should be included and enforced in the primary and post primary school curricula.
There is the need for an effective system of public education, to ensure better awareness, appreciation and management of safe environment with regards to the multiple roles of individuals.
Nigerian government should develop a knowledge and informative package consisting of theoretical, technical and managerial solutions for the treatment and reuse or recycling of waste arising from man’s activities.
There is the need to create awareness in environmental sustainability which should be translated into action through sustained environmental education both formal and informal education.
Conclusion
Environmental safety and its protection is a growing concern world over. Thus, there is the need for an urgent establishment of environmental protection techniques which need to be cultured, home-grown and the framework should begin from “Bottom to Top” and should be community based. The framework should be organized at the village or community level. The local government environmental protection agents should be empowered to enforce environmental laws and administer penalty to offenders. This will bring about safe and healthy environment for sustainable development.
References
Achankeng E (2003). Globalization, Urbanization and Municipal Solid Waste in Africa, African Studies Association of Australasia and the Pacific Conference Proceedings - African on a Global Stage, http://www.ssn.flinders.edu.au/global/afsaap
Council of Ministers of Education (2005). Educating for Sustainability: The Status of
Sustainable Development in Canada. http://www.cmec.Ca/Else/Environment.en.pdf
Chirisa, I. (2013). Solid waste, the ‘Throw-Away’ culture and livelihoods: Problems and prospects in Harare, Zimbabwe. Journal of Environmental Science and Water Resources. 2(1), pp. 001 – 008.
FEPA (1999): National Master Plan for Public Awareness on Environment and Natural Resources conservation in Nigeria, FEPA, Garki, Abuja.
FGN (1988): Federal Environmental Protection Agency Decree 58, 1988, Federal Ministry of Information and Culture, Lagos, Nigeria.
Hardoy, J. E., Mitlin, D. (2001). Environmental problems in an urbanizing world: finding solutions in Africa, Asia, and Latin America. Sterling, VA, Earthscan Publications.
Iroha, K., Uwatt, I. E. and Asim, A. E. (2008). Nigerian Teachers’ Attitude Towards
Environmental Sustainability Issues in the Curriculum. The Social Sciences. 3(2): 126-131
Inyang-Abia, M. E. (1998). Agenda 21-Based Curriculum Paradigm of R Environmental Education and Sustainable Development in Nigeria. Ife J. Edu. Studies. 5: 252-259.
Inyang-Abia, M. E. (2001). Greening the Science, Technology, Mathematics (STM).
Curriculum. A Synthesis for Sustainable Development in Nigeria. West Afr. J. Edu. Res. . 4:81-86.
Izeze I. (1999). Waste management: A solution. The Guardian Newspaper. 18 August, p 41
NEST. (1992). The Challenge of Sustainable Development in Nigeria. Pp.152 -172 An NGO Report Prepared For United Nations Conference on Environment and Development, Rio De Janeiro, Brasil June 1-12.
Ogbonna, D. N., Ekweozor, I. K. E. and Igwe, U. (2002). Waste management: A tool for environmental protection in Nigeria. AMBIO: A Journal of the Human Environment. Vol. 31 (1), pp. 55-57. Okonko, I. O., Ogun, A. A., Shittu, O. B. and Ogunnusi, T. A. (2009). Waste
Utilization as a means of Ensuring Environmental Safety – An Overview. EJEAFChe, 8(9), 2009, 836-855. 150 (3): pp 468493.
Omer, A. M. (2012). Sustainable water resources management, future demands and adaptationstrategies in Sudan. Journal of Environmental Science and Water Resources Vol. 1(7), pp. 151 – 168.
Omofonmwan, S. I. and Osa-Edoh, G. I. (2008). The Challenges of Environmental Problems in Nigeria. J. Hum. Ecol., 23(1): 53-57.

Toffler A (1970). Future Shock, Pan Books, London
Uche, S. C. (1995). Education and Sustainable Development: An Introduction In: M. B. Lawal, E. J. Aniah, S. C. Uche and I. A. Animashun (Eds). Education for Sustainable Development . Lagos. Macmillan Nigeria Publishers, pp.1.
United Nations Educational, Scientific and Cultural Organization (UNESCO). (1997).
Educating for a Sustainable Future: A Transdisciplinary Vision for Concerted Action. International Conference in Thessaloniki.
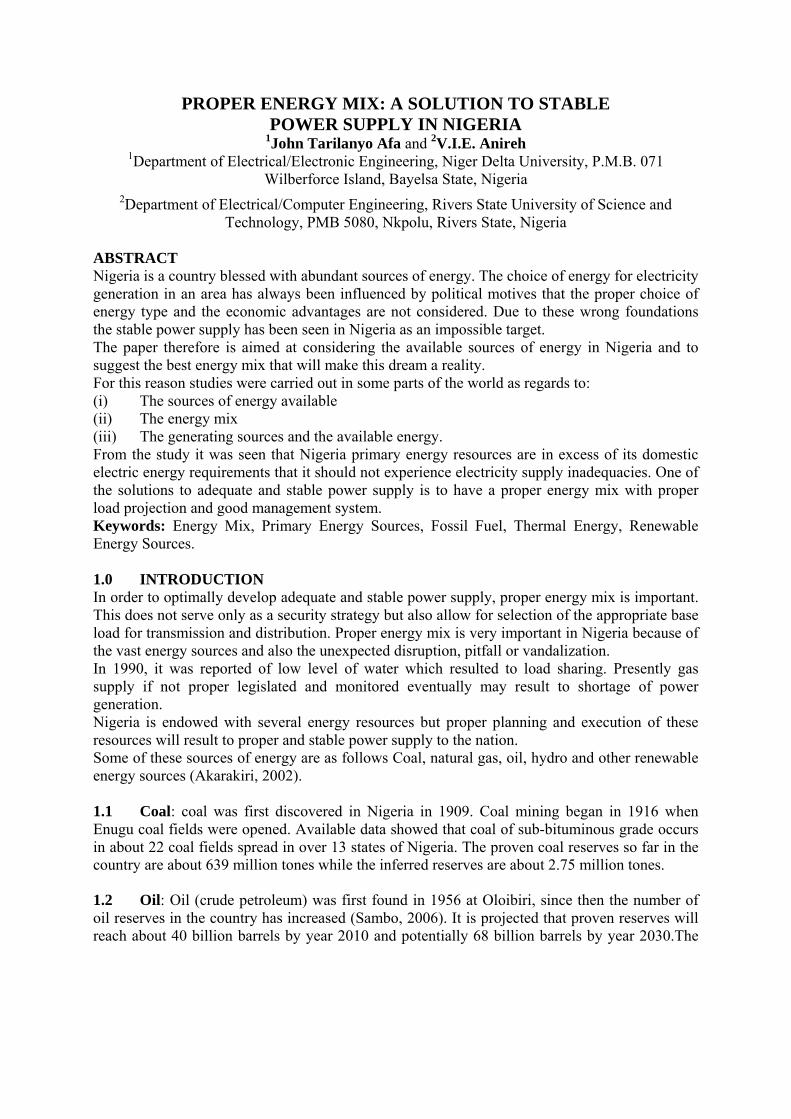
PROPER ENERGY MIX: A SOLUTION TO STABLE POWER SUPPLY IN NIGERIA
1John Tarilanyo Afa and 2V.I.E. Anireh 1Department of Electrical/Electronic Engineering, Niger Delta University, P.M.B. 071
Wilberforce Island, Bayelsa State, Nigeria
2Department of Electrical/Computer Engineering, Rivers State University of Science and Technology, PMB 5080, Nkpolu, Rivers State, Nigeria
ABSTRACT Nigeria is a country blessed with abundant sources of energy. The choice of energy for electricity generation in an area has always been influenced by political motives that the proper choice of energy type and the economic advantages are not considered. Due to these wrong foundations the stable power supply has been seen in Nigeria as an impossible target. The paper therefore is aimed at considering the available sources of energy in Nigeria and to suggest the best energy mix that will make this dream a reality. For this reason studies were carried out in some parts of the world as regards to: (i) The sources of energy available (ii) The energy mix (iii) The generating sources and the available energy. From the study it was seen that Nigeria primary energy resources are in excess of its domestic electric energy requirements that it should not experience electricity supply inadequacies. One of the solutions to adequate and stable power supply is to have a proper energy mix with proper load projection and good management system. Keywords: Energy Mix, Primary Energy Sources, Fossil Fuel, Thermal Energy, Renewable Energy Sources. 1.0 INTRODUCTION In order to optimally develop adequate and stable power supply, proper energy mix is important. This does not serve only as a security strategy but also allow for selection of the appropriate base load for transmission and distribution. Proper energy mix is very important in Nigeria because of the vast energy sources and also the unexpected disruption, pitfall or vandalization. In 1990, it was reported of low level of water which resulted to load sharing. Presently gas supply if not proper legislated and monitored eventually may result to shortage of power generation. Nigeria is endowed with several energy resources but proper planning and execution of these resources will result to proper and stable power supply to the nation. Some of these sources of energy are as follows Coal, natural gas, oil, hydro and other renewable energy sources (Akarakiri, 2002). 1.1 Coal: coal was first discovered in Nigeria in 1909. Coal mining began in 1916 when Enugu coal fields were opened. Available data showed that coal of sub-bituminous grade occurs in about 22 coal fields spread in over 13 states of Nigeria. The proven coal reserves so far in the country are about 639 million tones while the inferred reserves are about 2.75 million tones. 1.2 Oil: Oil (crude petroleum) was first found in 1956 at Oloibiri, since then the number of oil reserves in the country has increased (Sambo, 2006). It is projected that proven reserves will reach about 40 billion barrels by year 2010 and potentially 68 billion barrels by year 2030.The
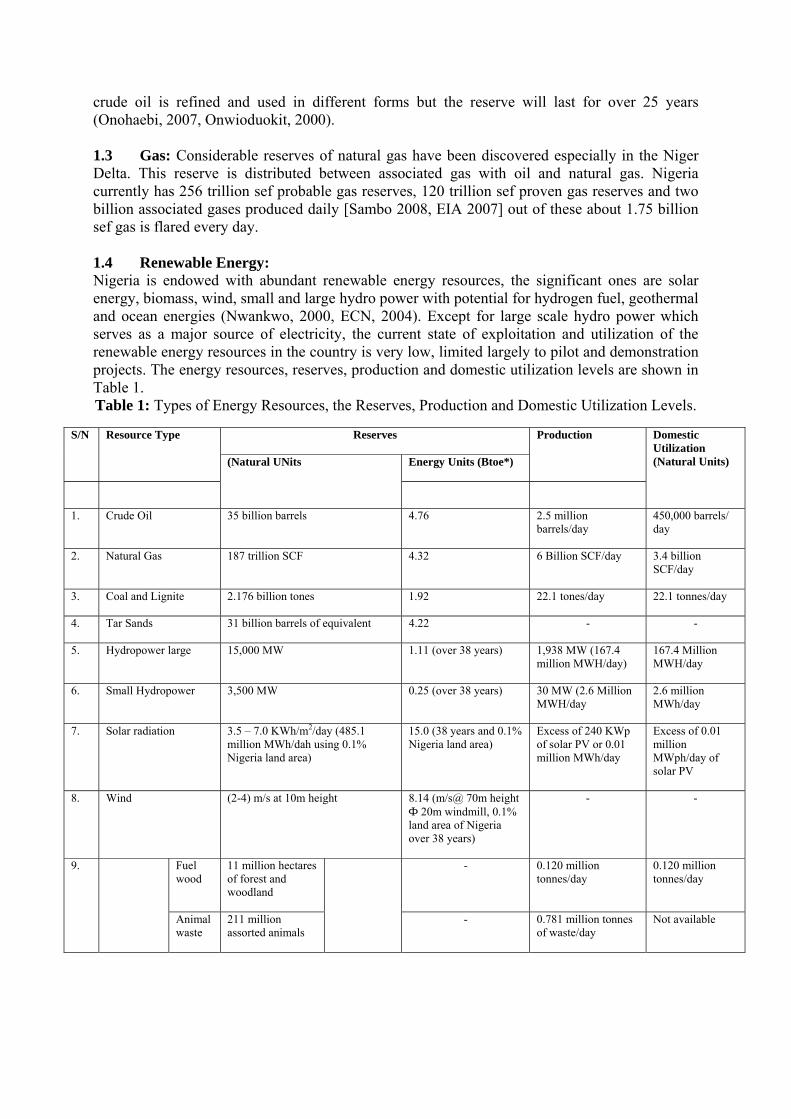
crude oil is refined and used in different forms but the reserve will last for over 25 years (Onohaebi, 2007, Onwioduokit, 2000). 1.3 Gas: Considerable reserves of natural gas have been discovered especially in the Niger Delta. This reserve is distributed between associated gas with oil and natural gas. Nigeria currently has 256 trillion sef probable gas reserves, 120 trillion sef proven gas reserves and two billion associated gases produced daily [Sambo 2008, EIA 2007] out of these about 1.75 billion sef gas is flared every day. 1.4 Renewable Energy: Nigeria is endowed with abundant renewable energy resources, the significant ones are solar energy, biomass, wind, small and large hydro power with potential for hydrogen fuel, geothermal and ocean energies (Nwankwo, 2000, ECN, 2004). Except for large scale hydro power which serves as a major source of electricity, the current state of exploitation and utilization of the renewable energy resources in the country is very low, limited largely to pilot and demonstration projects. The energy resources, reserves, production and domestic utilization levels are shown in Table 1. Table 1: Types of Energy Resources, the Reserves, Production and Domestic Utilization Levels.
S/N Resource Type Reserves Production Domestic Utilization (Natural Units) (Natural UNits Energy Units (Btoe*)
1. Crude Oil 35 billion barrels 4.76 2.5 million barrels/day
450,000 barrels/ day
2. Natural Gas 187 trillion SCF 4.32 6 Billion SCF/day 3.4 billion SCF/day
3. Coal and Lignite 2.176 billion tones 1.92 22.1 tones/day 22.1 tonnes/day
4. Tar Sands 31 billion barrels of equivalent 4.22 - -
5. Hydropower large 15,000 MW 1.11 (over 38 years) 1,938 MW (167.4 million MWH/day)
167.4 Million MWH/day
6. Small Hydropower 3,500 MW 0.25 (over 38 years) 30 MW (2.6 Million MWH/day
2.6 million MWh/day
7. Solar radiation 3.5 – 7.0 KWh/m2/day (485.1 million MWh/dah using 0.1% Nigeria land area)
15.0 (38 years and 0.1% Nigeria land area)
Excess of 240 KWp of solar PV or 0.01 million MWh/day
Excess of 0.01 million MWph/day of solar PV
8. Wind (2-4) m/s at 10m height 8.14 (m/s@ 70m height Φ 20m windmill, 0.1% land area of Nigeria over 38 years)
- -
9.
Fuel wood
11 million hectares of forest and woodland
- 0.120 million tonnes/day
0.120 million tonnes/day
Animal waste
211 million assorted animals
- 0.781 million tonnes of waste/day
Not available
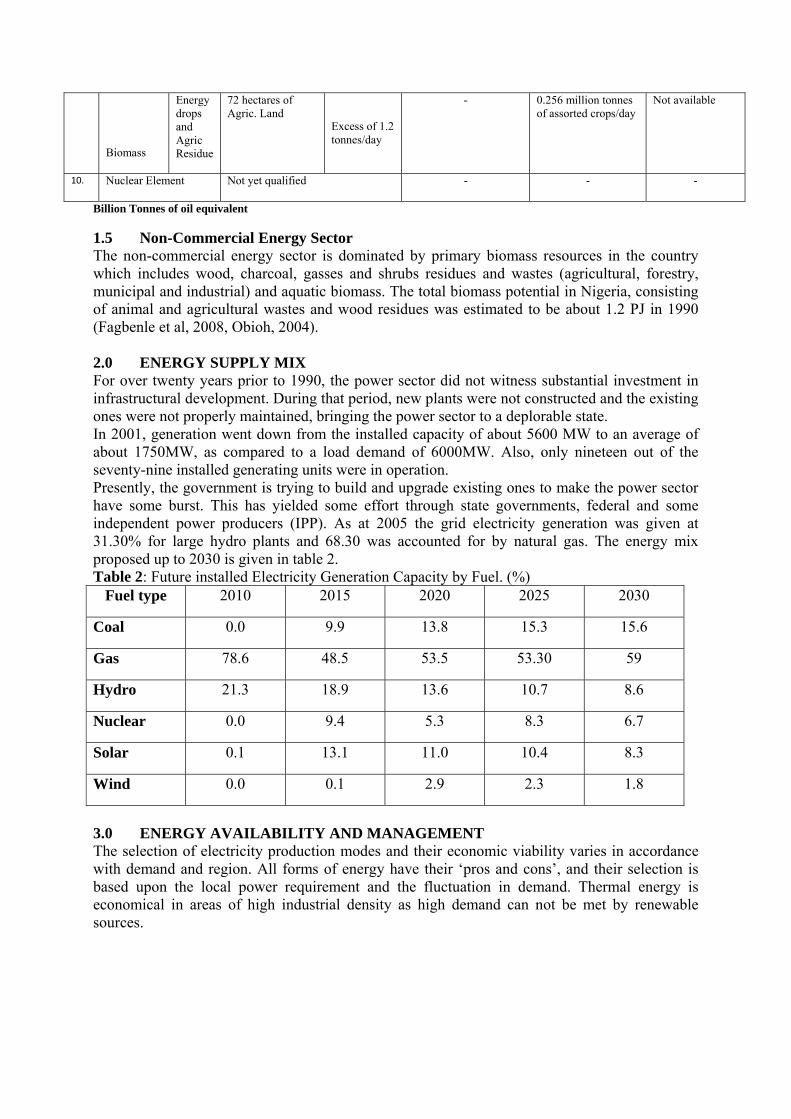
Biomass
Energy drops and Agric Residue
72 hectares of Agric. Land
Excess of 1.2 tonnes/day
- 0.256 million tonnes of assorted crops/day
Not available
10. Nuclear Element Not yet qualified - - -
Billion Tonnes of oil equivalent
1.5 Non-Commercial Energy Sector The non-commercial energy sector is dominated by primary biomass resources in the country which includes wood, charcoal, gasses and shrubs residues and wastes (agricultural, forestry, municipal and industrial) and aquatic biomass. The total biomass potential in Nigeria, consisting of animal and agricultural wastes and wood residues was estimated to be about 1.2 PJ in 1990 (Fagbenle et al, 2008, Obioh, 2004). 2.0 ENERGY SUPPLY MIX For over twenty years prior to 1990, the power sector did not witness substantial investment in infrastructural development. During that period, new plants were not constructed and the existing ones were not properly maintained, bringing the power sector to a deplorable state. In 2001, generation went down from the installed capacity of about 5600 MW to an average of about 1750MW, as compared to a load demand of 6000MW. Also, only nineteen out of the seventy-nine installed generating units were in operation. Presently, the government is trying to build and upgrade existing ones to make the power sector have some burst. This has yielded some effort through state governments, federal and some independent power producers (IPP). As at 2005 the grid electricity generation was given at 31.30% for large hydro plants and 68.30 was accounted for by natural gas. The energy mix proposed up to 2030 is given in table 2. Table 2: Future installed Electricity Generation Capacity by Fuel. (%)
Fuel type 2010 2015 2020 2025 2030
Coal 0.0 9.9 13.8 15.3 15.6
Gas 78.6 48.5 53.5 53.30 59
Hydro 21.3 18.9 13.6 10.7 8.6
Nuclear 0.0 9.4 5.3 8.3 6.7
Solar 0.1 13.1 11.0 10.4 8.3
Wind 0.0 0.1 2.9 2.3 1.8
3.0 ENERGY AVAILABILITY AND MANAGEMENT The selection of electricity production modes and their economic viability varies in accordance with demand and region. All forms of energy have their ‘pros and cons’, and their selection is based upon the local power requirement and the fluctuation in demand. Thermal energy is economical in areas of high industrial density as high demand can not be met by renewable sources.
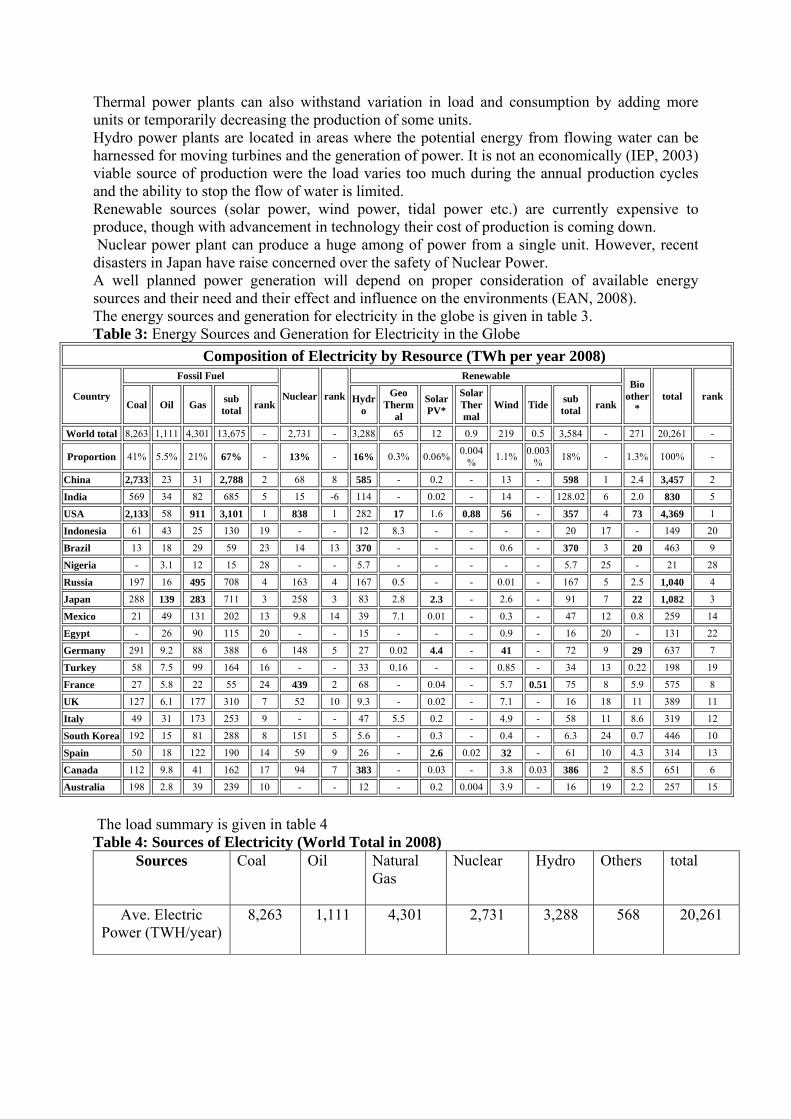
Thermal power plants can also withstand variation in load and consumption by adding more units or temporarily decreasing the production of some units. Hydro power plants are located in areas where the potential energy from flowing water can be harnessed for moving turbines and the generation of power. It is not an economically (IEP, 2003) viable source of production were the load varies too much during the annual production cycles and the ability to stop the flow of water is limited. Renewable sources (solar power, wind power, tidal power etc.) are currently expensive to produce, though with advancement in technology their cost of production is coming down. Nuclear power plant can produce a huge among of power from a single unit. However, recent disasters in Japan have raise concerned over the safety of Nuclear Power. A well planned power generation will depend on proper consideration of available energy sources and their need and their effect and influence on the environments (EAN, 2008). The energy sources and generation for electricity in the globe is given in table 3. Table 3: Energy Sources and Generation for Electricity in the Globe
Composition of Electricity by Resource (TWh per year 2008)
Country
Fossil Fuel
Nuclear rank
Renewable Bio
other*
total rank Coal Oil Gas
subtotal
rank Hydr
o
GeoTherm
al
SolarPV*
SolarThermal
Wind Tidesub total
rank
World total 8,263 1,111 4,301 13,675 - 2,731 - 3,288 65 12 0.9 219 0.5 3,584 - 271 20,261 -
Proportion 41% 5.5% 21% 67% - 13% - 16% 0.3% 0.06%0.004
% 1.1%
0.003%
18% - 1.3% 100% -
China 2,733 23 31 2,788 2 68 8 585 - 0.2 - 13 - 598 1 2.4 3,457 2
India 569 34 82 685 5 15 -6 114 - 0.02 - 14 - 128.02 6 2.0 830 5
USA 2,133 58 911 3,101 1 838 1 282 17 1.6 0.88 56 - 357 4 73 4,369 1
Indonesia 61 43 25 130 19 - - 12 8.3 - - - - 20 17 - 149 20
Brazil 13 18 29 59 23 14 13 370 - - - 0.6 - 370 3 20 463 9
Nigeria - 3.1 12 15 28 - - 5.7 - - - - - 5.7 25 - 21 28
Russia 197 16 495 708 4 163 4 167 0.5 - - 0.01 - 167 5 2.5 1,040 4
Japan 288 139 283 711 3 258 3 83 2.8 2.3 - 2.6 - 91 7 22 1,082 3
Mexico 21 49 131 202 13 9.8 14 39 7.1 0.01 - 0.3 - 47 12 0.8 259 14
Egypt - 26 90 115 20 - - 15 - - - 0.9 - 16 20 - 131 22
Germany 291 9.2 88 388 6 148 5 27 0.02 4.4 - 41 - 72 9 29 637 7
Turkey 58 7.5 99 164 16 - - 33 0.16 - - 0.85 - 34 13 0.22 198 19
France 27 5.8 22 55 24 439 2 68 - 0.04 - 5.7 0.51 75 8 5.9 575 8
UK 127 6.1 177 310 7 52 10 9.3 - 0.02 - 7.1 - 16 18 11 389 11
Italy 49 31 173 253 9 - - 47 5.5 0.2 - 4.9 - 58 11 8.6 319 12
South Korea 192 15 81 288 8 151 5 5.6 - 0.3 - 0.4 - 6.3 24 0.7 446 10
Spain 50 18 122 190 14 59 9 26 - 2.6 0.02 32 - 61 10 4.3 314 13
Canada 112 9.8 41 162 17 94 7 383 - 0.03 - 3.8 0.03 386 2 8.5 651 6
Australia 198 2.8 39 239 10 - - 12 - 0.2 0.004 3.9 - 16 19 2.2 257 15
The load summary is given in table 4 Table 4: Sources of Electricity (World Total in 2008)
Sources Coal Oil Natural Gas
Nuclear Hydro Others total
Ave. Electric Power (TWH/year)
8,263 1,111 4,301 2,731 3,288 568 20,261
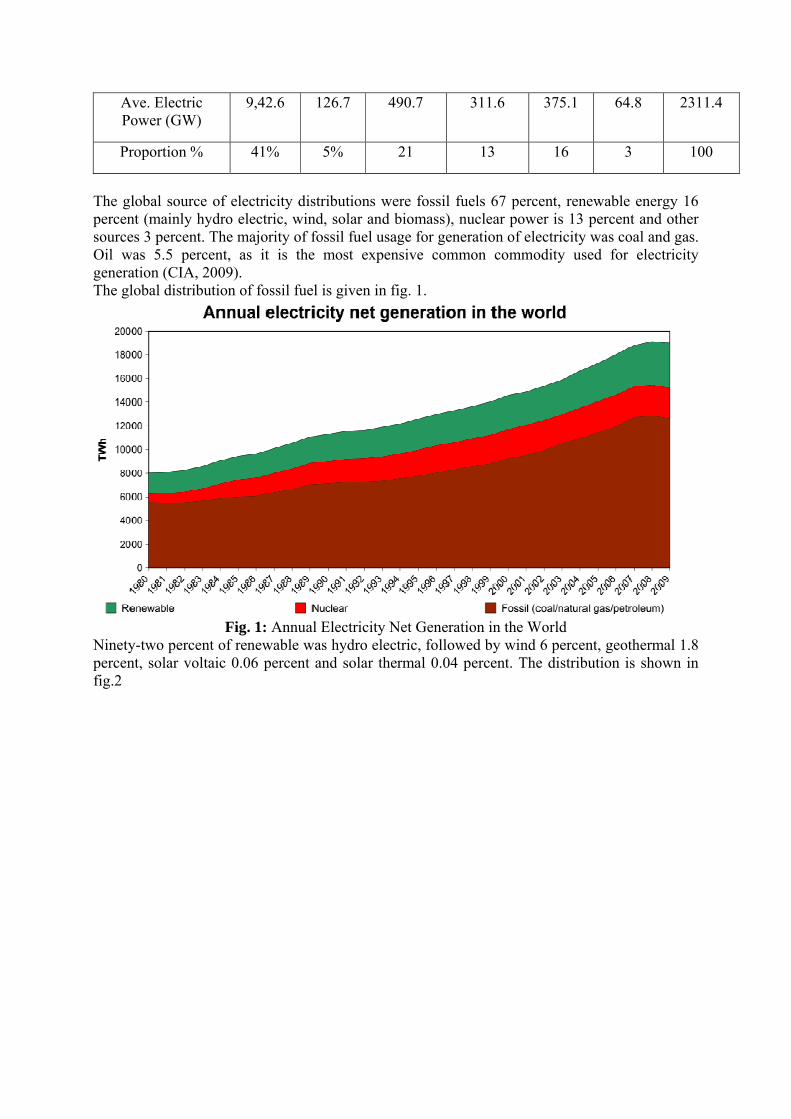
Ave. Electric Power (GW)
9,42.6 126.7 490.7 311.6 375.1 64.8 2311.4
Proportion % 41% 5% 21 13 16 3 100
The global source of electricity distributions were fossil fuels 67 percent, renewable energy 16 percent (mainly hydro electric, wind, solar and biomass), nuclear power is 13 percent and other sources 3 percent. The majority of fossil fuel usage for generation of electricity was coal and gas. Oil was 5.5 percent, as it is the most expensive common commodity used for electricity generation (CIA, 2009). The global distribution of fossil fuel is given in fig. 1.
Fig. 1: Annual Electricity Net Generation in the World
Ninety-two percent of renewable was hydro electric, followed by wind 6 percent, geothermal 1.8 percent, solar voltaic 0.06 percent and solar thermal 0.04 percent. The distribution is shown in fig.2
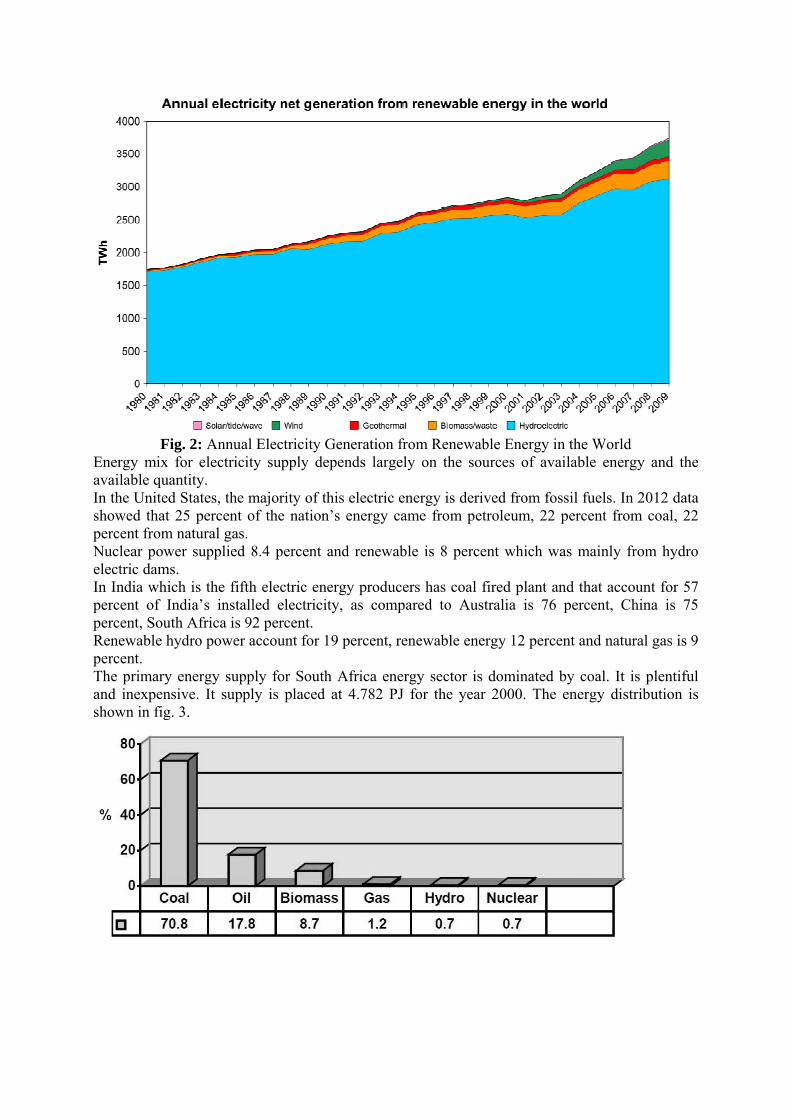
Fig. 2: Annual Electricity Generation from Renewable Energy in the World
Energy mix for electricity supply depends largely on the sources of available energy and the available quantity. In the United States, the majority of this electric energy is derived from fossil fuels. In 2012 data showed that 25 percent of the nation’s energy came from petroleum, 22 percent from coal, 22 percent from natural gas. Nuclear power supplied 8.4 percent and renewable is 8 percent which was mainly from hydro electric dams. In India which is the fifth electric energy producers has coal fired plant and that account for 57 percent of India’s installed electricity, as compared to Australia is 76 percent, China is 75 percent, South Africa is 92 percent. Renewable hydro power account for 19 percent, renewable energy 12 percent and natural gas is 9 percent. The primary energy supply for South Africa energy sector is dominated by coal. It is plentiful and inexpensive. It supply is placed at 4.782 PJ for the year 2000. The energy distribution is shown in fig. 3.
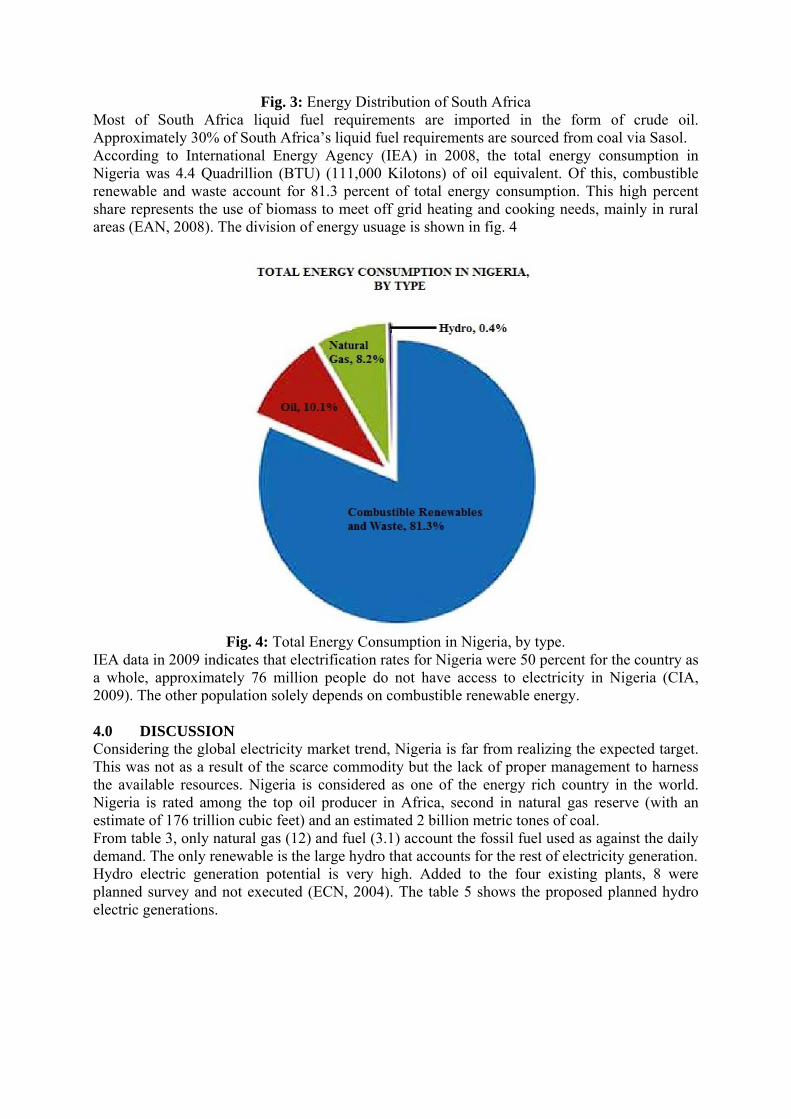
Fig. 3: Energy Distribution of South Africa Most of South Africa liquid fuel requirements are imported in the form of crude oil. Approximately 30% of South Africa’s liquid fuel requirements are sourced from coal via Sasol. According to International Energy Agency (IEA) in 2008, the total energy consumption in Nigeria was 4.4 Quadrillion (BTU) (111,000 Kilotons) of oil equivalent. Of this, combustible renewable and waste account for 81.3 percent of total energy consumption. This high percent share represents the use of biomass to meet off grid heating and cooking needs, mainly in rural areas (EAN, 2008). The division of energy usuage is shown in fig. 4
Fig. 4: Total Energy Consumption in Nigeria, by type.
IEA data in 2009 indicates that electrification rates for Nigeria were 50 percent for the country as a whole, approximately 76 million people do not have access to electricity in Nigeria (CIA, 2009). The other population solely depends on combustible renewable energy. 4.0 DISCUSSION Considering the global electricity market trend, Nigeria is far from realizing the expected target. This was not as a result of the scarce commodity but the lack of proper management to harness the available resources. Nigeria is considered as one of the energy rich country in the world. Nigeria is rated among the top oil producer in Africa, second in natural gas reserve (with an estimate of 176 trillion cubic feet) and an estimated 2 billion metric tones of coal. From table 3, only natural gas (12) and fuel (3.1) account the fossil fuel used as against the daily demand. The only renewable is the large hydro that accounts for the rest of electricity generation. Hydro electric generation potential is very high. Added to the four existing plants, 8 were planned survey and not executed (ECN, 2004). The table 5 shows the proposed planned hydro electric generations.
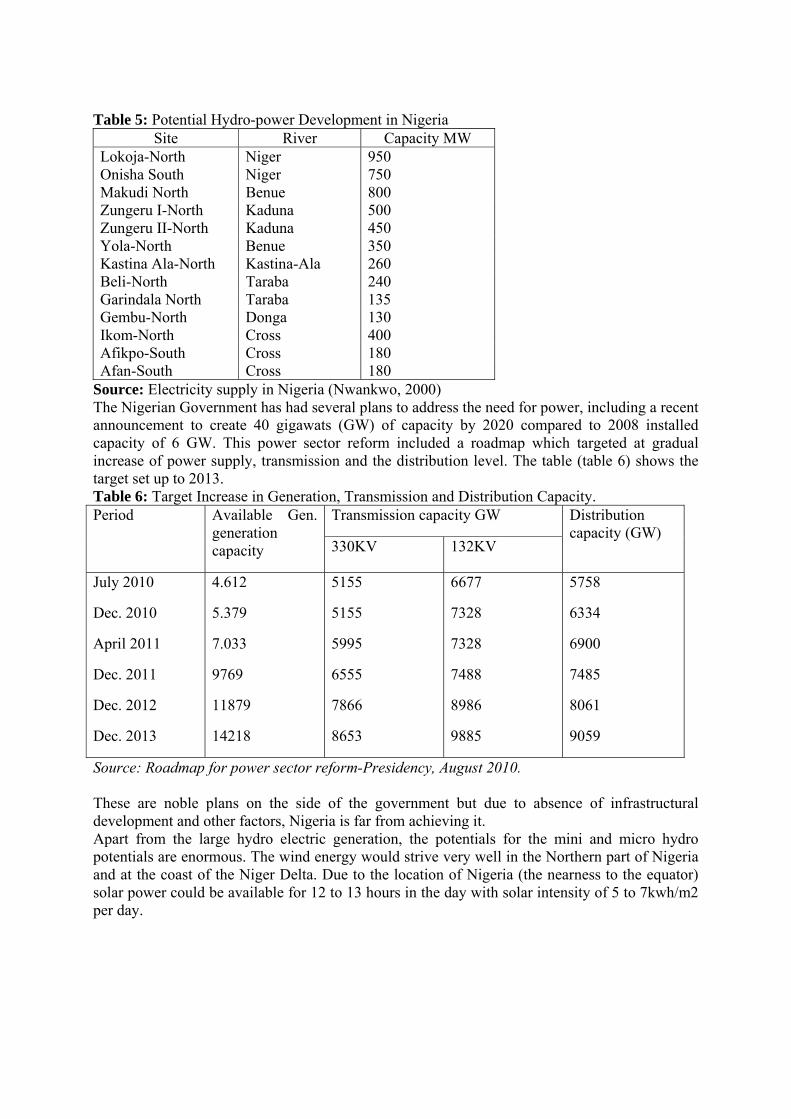
Table 5: Potential Hydro-power Development in Nigeria
Site River Capacity MW Lokoja-North Niger 950 Onisha South Niger 750 Makudi North Benue 800 Zungeru I-North Kaduna 500 Zungeru II-North Kaduna 450 Yola-North Benue 350 Kastina Ala-North Kastina-Ala 260 Beli-North Taraba 240 Garindala North Taraba 135 Gembu-North Donga 130 Ikom-North Cross 400 Afikpo-South Cross 180 Afan-South Cross 180
Source: Electricity supply in Nigeria (Nwankwo, 2000) The Nigerian Government has had several plans to address the need for power, including a recent announcement to create 40 gigawats (GW) of capacity by 2020 compared to 2008 installed capacity of 6 GW. This power sector reform included a roadmap which targeted at gradual increase of power supply, transmission and the distribution level. The table (table 6) shows the target set up to 2013. Table 6: Target Increase in Generation, Transmission and Distribution Capacity. Period Available Gen.
generation capacity
Transmission capacity GW Distribution capacity (GW)
330KV 132KV
July 2010
Dec. 2010
April 2011
Dec. 2011
Dec. 2012
Dec. 2013
4.612
5.379
7.033
9769
11879
14218
5155
5155
5995
6555
7866
8653
6677
7328
7328
7488
8986
9885
5758
6334
6900
7485
8061
9059
Source: Roadmap for power sector reform-Presidency, August 2010. These are noble plans on the side of the government but due to absence of infrastructural development and other factors, Nigeria is far from achieving it. Apart from the large hydro electric generation, the potentials for the mini and micro hydro potentials are enormous. The wind energy would strive very well in the Northern part of Nigeria and at the coast of the Niger Delta. Due to the location of Nigeria (the nearness to the equator) solar power could be available for 12 to 13 hours in the day with solar intensity of 5 to 7kwh/m2 per day.
5.0 CONCLUSION With the abundance of energy resources, Nigeria need not import energy to achieve a sustainable generating capacity suffices the targeted economic growth and also has excess generation to sell to neighbouring countries. In the face of global electricity market trend which focuses on building a cleaner, more diverse and more sustainable electricity mix, Nigeria has the resources to meet this target. However, the country is lacking in policies and the will power to harness resources and develop and/or improve the electricity infrastructure. Nigeria has been able to trace the collapse of the industrial sector, small and medium scale businesses and economic standstill of the nation to the inadequate and erratic state of the country’s electricity market. Several commitments have been made by different governments of Nigeria financially and to some point human resources but such huge financial commitments are sabotaged by (i) Selfish political Motive – Putting the wrong persons in positions and sitting the
infrastructures at the wrong location incurring heavy losses. No clear description of roles and responsibilities of appointed committees and offices.
(ii) Greed and corruption – siphoning the money committed through back door, heavy kick backs, and purchasing old equipment.
(iii) Vandalism and theft – transmission lines and transformers are vandalized at will. Illegal connection and theft due to improper monitoring and sometimes abated by the electricity employee.
Others are Insufficient transmission and distribution facilities Ineffective regulation In-appropriate industries and market structure Electricity is fundamental and inevitable to our daily living as well as the sustainability of our industrial growth. It poses threat to a country’s national economic sustainability development and appreciable growth is conspicuous in various nations of the world. We therefore commend the present government in taken the country out of this deplorable state but it is necessary to mention that proper energy mix is a sure way of reaching the proper landmark. The environmental effect on water level (hydroelectricity) has been reported. The vandalism of pipes and the activities of militants also have not been pleasant in the past years. The only way to enhance energy security (total blackout or load sharing) is to broaden the nation’s energy supply mix. From the available energy resources of Nigeria it is proper to recommend that no one source of energy be more than forty (40%) percent. REFERENCES 1. Akarakiri, J.B. (2002). Rural Energy in Nigeria. The Electricity Alternative: Domestic use
of Energy Conference, pp. 1 – 7. 2. CIA World Factbook (2009). Central Intelligence Agency (CIA), United States of
America. 3. E.C.N. (2004). National Energy Policy, Federal Republic of Nigeria, Published by the
Energy Commission of Nigeria (ECN). 4. EIA (2007). Country Analysis Brief – Nigeria, Energy Information Administration (EIA),
Department of Energy, U.S. Government. 5. Energy Agency (2008). Energy (EAN) balance for the world.
6. Fagbenle, R.Q, Adeleja A.O. and Bellow, A.K. (2008). Modeling of Wired Energy Potential in Nigeria. Final Report of the Power Sector Reform committee, Abuja.
7. IEP (2003). Integrated Energy Plan for the Republic of South Africa, Department of Minerals and Energy.
8. Nwankwo, O.I. (2000). Electricity Supply in Nigeria, 4th International Conference on Power Systems Operation and Planning, Accra, Ghana: 147 – 150.
9. Obioh, I.B. (2004). Trends in Greenhouse Gas Emission in Nigeria, 1988 – 2000, A Project Report submitted to the Nigerian Environmental Study/Action Team (NEST), Ibadan.
10. Onohaebi, O.S. (2009). Power Outages in the Nigerian Transmission Grid, Research Journal of Applied Sciences, 4(1): 1 – 9.
11. Onwioduokit A. (2000). Privatization of Power Utility in Nigeria; Issues and options, in Proceeding of the 4th International Conference on Power Systems Operation and Planning, Accra, Ghana, pp. 36 – 40.
12. Sambo, A.S. (2006). Renewable Energy Electricity in Nigeria the way forward, in Proceeding of the Renewable Electricity Policy Conference, Abuja, Nigeria, pp. 1 – 42.
13. Sambo, A.S. (2008). The Role of Energy in Achieving Millennium Development Goals (MDGs) National Engineering Tech. Conference (NETEC), 1 – 42.
FACTORS THAT DETERMINE BIOREMEDIATION OF ORGANIC COMPOUNDS IN THE SOIL
Asira, Enim Enim Department of Chemistry,College of Education,Akamkpa - Cross River State,Nigeria
ABSTRACT
Man’s quest for technological advancement and the need to meet food supply for growth have distorted the natural balance of the soil constituents. Year round, waste products find their way to the soil from natural and anthropogenic sources. When these waste products enter the soil; they are subjected to physical, chemical and biological processes that ultimately determine their fate and transport characteristics. Organic compounds are among these waste products. Knowledge of factors that determine fate of organic compounds in the soil became quite apt to know the condition under which biodegradation processes can be effective. In this study therefore various factors have been discussed. Also, requisite information about the design of bioremediation system for organic compounds had been explained to allow for better understanding of potential toxicity of the organic compound to micro organisms, nutrient requirement for biodegradation activity and the compatibility of site geochemistry with nutrient solution proposed for addition. Key words: Bioremediation, determine, factors, Organic compounds, and soil.
INTRODUCTION
The production soil is made up of 5% organic matter. The biological active components of the organic soil include polysaccharide, amino acids, nucleotide, organic sulphur and phosphorus compounds. These organic matter determines the productivity of the soil, it serves as a source of food for micro organisms and influences the physical properties of the soil. However, due to the excesses of human activities on the soil, the once balanced natural equilibrium of the soil had been heavily bombed by the production and discharge of waste organic compounds are (classified into (i) conventional pollutants (aldehydes, ketone, alcohols) (2) Aromatic hydrocarbons (3polynuclear aromatic hydrocarbon (PAHs) and (4) synthetic organic compounds (organo pesticides, fungicides and herbicides) and organic fertilizers. The biodegradation of these organic pollutants in soil is depended on the microbial transformation in the soil, the microbial ecology of the soil, environmental factors and the rate of biological reaction kinetics and substances required for bioremediation. AIM; The major aim of this study is to identify the various factors that influence the bioremediation of organic pollutants in the soil. SPECIFIC OBJECTIVES. To provide information for the design of bioremediation system and information to indicate whether or not bioremediation is an important treatment technology
FACTORS THAT AFFECT BIOREMEDIATION OF ORGANIC POLLUTANTS IN THE SOIL; The main presence of microbial ecology had a link with bioremediation in that organic compounds are the source of carbon and energy for must micro organisms. When appropriate concentrations and environmental conditions are not harsh to the microorganisms, many of the organic compounds considered harmful can be degraded in the soil. Knowledge of biological responses to organic compounds provides an understanding of metabolic potential by which micro organism may transform these organic compounds. The observation of microbial intermediate indicates a biological response to the parent compound has taken place and that the possibility for the remediation by biological process exists. This factor determines the principles of microbial ecology as related to the soil. MICROBIAL ECOLOGY OF THE SOIL. It is now established that quite significant numbers of micro organisms are distributed in the soil (Back, 1989). It was once suggested that members of microorganisms in soil decreased with depth (Waksman, 1916). Evidence of that point was aptly captured in the development of technique to investigate water table aquifer used as an instrument for the education of microbial ecology of the subsurface ,(Mc Nabb and Mallard 1984). The analyses of the subsurface samples indicate that micro organisms predominate on the subsurface of soil particles. Biochemical diversity of micro organisms present in the subsurface was evident my variety of organic and compound reportedly metabolized. Petroleum hydrocarbon (fields and products of gasification) are reported to be substrate for soil micro organisms under varied growth conditions. ENVIRONMENTAL FACTOR; Micro organisms require a suitable set of environment factors in order to grow, these factors include, chemical and physical properties of pH, osmotic pressure, temperature and absence of poisonous conditions. The pH of the environment indicates the potentials for microbial activity. Growth of micro organism can raise or lower the pH producing end products that correspondently affect pH or remove the parent organic compounds. The measurement of pH in soil could indicate the potential for microbial growth. Temperature affects microbial growth in that an increase in temperature results in an increase in microbiological growth. Many micro organisms in the soil have optimum temperature for growth between 100 - 300c. Micro organisms require adequate water for active growth. The availability of water depends on the number of molecules present in the solution. An increase in the concentration of the molecules of water relative to the concentration of molecules in the microbial cells results in the movement from the cell to the water environment (Osmosis). The soil moisture content is critical to the growth of micro organisms. If the soil is dry microbial growth will be limited. When the moisture content is near saturation, oxygen transfer because growth limiting factor. BIOLOGICAL REACTION KINETICS The rate at which micro organism can remove organic confounds from the soil can be expressed mathematically to ascertain the time required for remediation. The first order rate constant is based on the observations that as the concentration of the organic compound increases, the rate of degradation increases. The first order rate constant, k is calculated as follows:
K=[2.303/t]log[Co/(CO-C1)]. Where t= time, C0 is initial concentration, C1 IS the concentration at time, t and t1/2 is the half life of the compound to be degraded and is expressed as;
t1/2 = (0.693/k).
At the start of evaluation of bioremediation at a site, existing information should be considered ands such information include: - The solubility of the compound to be biodegraded. This indicates the potential availability of
the compound to the micro organisms. - Information about the environmental factors that upon stimulation were critical to
degradation must be available. Dragun (1988), for instance, contains a list of organic compounds and provides information about condition requisite for evaluation to develop the rate of biodegradation presented.
Generally, hydrocarbons are good compounds for bioremediation. The edited paper by Gibson (1984) and Atlas (1984) provided an overview of microbial degradation of petroleum hydrocarbon. The complex mixture of hydrocarbons has components that are biodegradable with degradation rate decreasing as molecular weight of the hydrocarbon increases. Equally, hydrocarbons with three or less rings degrade at greater rate than those with complex rings. Example is polynuclear hydrocarbons (PAH). Hence, increasing the molecular weight or branching of organic compound may tend to slow the rate of biodegradation of organic compound soil. Most organic compound tends to persist in the soil under anaerobic conditions. Example, chlorinated compounds. Such compounds undergo biodegradation under environmental condition that would promote the growth of anaerobic bacteria,
PCE = TCE +Cl = DCE The removal of chlorine atom above enhances the potential for anaerobic micro organisms. To enhance the degradation of dichloroethane (DCE), an environment for the growth of methane - utilizing bacteria must be created. The addition of methane to the soil results in the growth of these bacteria with a short period.
DCE bacterial CE + Cl reduction
It therefore means that both anaerobic and aerobic degradation may be a good mechanism to remove such persistent organic compounds from the soil CONCLUSION The basic premises of microbial ecology are related to bioremediation in that many organic compounds can be used by micro organisms as a source of carbon and energy. Many of the organic compounds are, no doubt, hazardous to the soil, hence the need for bioremediation. Bioremediation of organic compounds in the soil based on the understanding of the carbon cycle and extrapolation of compound mineralization in environment to the soil. Environmental factors such as PH, redox potential and temperature play important role in determining the potential for bioremediation.
Equally, biological reaction kinetics, and the type of nutrients (organic compounds), that can be delivered to the micro organisms would determine whether or not bioremediation will be feasible. Before designing a bioremediation system, there is need for the assessment of the site to evaluate the history, ecology and hydrology; and laboratory assessment of the microbiology to provide information to show whether bioremediation is an appropriate measure treatment technology. The success of bioremediation is achieved when there is reduction of concentration of the organic compounds in the soil, increase in microbial activities of compounds degraded and the presence of metabolic intermediates in the soil. REFERENCES Atlas, R. M. (1984). Petroleum Microbiology. McMillan N. Y. Back, W. (1989). Early Concepts of the role of micro organisms in . Ground water 27:618-622. Dragun, J. (1988). The soil chemistry of Hazardous materials. Hazardous materials control research inst. Silver MD Gibson, D. T. (ed) (1984). Microbial Degradation of organic compounds. Marcel Dekker. H. Y. Mc Nabb, J. F. and Mallard (1984). Microbiological sampling in the assessment of Ground water pollution. In Ground Water Pollution microbiology. G. Britton and C. P. Gerba (eds). John Wiley and Sons. N. Y. pp. 235-260. Naranyanan P. (2009): Environmental Pollution: principles, Analysis and Control. CBS Publishers and Distributors Pvc. Ltd. New Delhi pp. 642. Waksman, S. A. (1916). Bacterial numbers in soil, at different depths, and in different season of the year. Soil science 1:363-380.
FRESHWATER POLLUTION IN SOME NIGERIAN LOCAL COMMUNITIES, CAUSES, CONSEQUENCES & PROBABLE SOLUTIONS
Aboyeji, Oyebanji Oluseun
College of Education (Technical) Lafiagi, P. M. B. 01, Lafiagi, Kwara State, Nigeria.
Abstract
Water is a valued natural resource for the existence of all living organisms. However, this valued resource is increasingly being threatened as human populations grow and demand more water of high quality for domestic purposes and economic activities. Therefore, the management of the quality of this precious resource is of special importance. All water pollution is dangerous to the health of living organism, but fresh water pollution can be especially detrimental to the health of humans and aquatic organisms as it is used as primary sources of portable water by population all over the world particularly in Nigerian communities. This paper examines cases which reflect different causes of freshwater pollution, the seriousness of this pollution, and the consequences on health and proffer probable ways of mitigating the ongoing fresh water pollution problems among Nigerian communities.
Keywords: Pollution, water, resources, causes, mitigation
Introduction
Water pollution is a major global problem which requires ongoing evaluation and revision of water resource policy at all levels (international down to individual aquifers and wells). It has been suggested that it is the leading worldwide cause of deaths and diseases and that it accounts for the deaths of more than 14,000 people daily (West, 2006; Pink, 2006).
Water is vital to the existence of all living organisms, but this valued resource is increasingly being threatened as human populations grow and demand more water of high quality for domestic purposes and economic activities [UNEPGEMS, 2000]. The significance of water to human and other biological systems cannot be over emphasized, and there are numerous scientific and economic facts that, water shortage or its pollution can cause severe decrease in productivity and deaths of living species (Garba et al., 2008; 2010). Clean and plentiful water provides the foundation for prosperous communities. We rely on clean water to survive, yet right now we are heading towards a water crisis.
Over the last years, in many African countries a considerable population growth has taken place, accompanied by a steep increase in urbanization, industrial and agricultural land use. This has entailed a tremendous increase in discharge of a wide diversity of pollutants to receiving water bodies and has caused undesirable effects on the different components of the aquatic environment and on fisheries [Saad et al., 1984]. As a result, there is growing appreciation that nationally, regionally, and globally, the management and utilization of natural resources need to be improved and that the amount of waste and pollution generated by human activity need to be reduced on a large scale.
The quality of any body of surface or ground water is a function of either or both natural influences and human activities [Stark et al., 2001; Kolawole et al., 2008]. It is now generally accepted that aquatic environments cannot be perceived simply as holding tanks that supply water for human
activities. Rather, these environments are complex matrices that require careful use to ensure sustainable ecosystem functioning well into the future [UNEPGEMS, 2000].
Reports by Food and Agricultural Organization (WHO) of U.S.A revealed that in African countries, particularly Nigeria, water related diseases had been interfering with basic human development (FAO, 2007). An estimated of 580 people in India die of diarrheal sickness every day. Some 90% of China’s cities suffer from some degree of water pollution, and nearly 500 million people lack access to safe drinking water (Chinadaily.com.cn. June 7, 2005 assessed today September 25, 2013). In addition to the acute problems of water pollution in developing countries, developed countries continue to struggle with pollution problems as well. In the most recent national report on water quality in the United States, 45 percent of assessed stream miles, 47 percent of assessed lake acres, and 32 percent of assessed bays and estuarine square miles were classified as polluted (EPA, 2002).
According to Galadima et al.(2011) the common sources of water that are available to local communities in Nigeria are fast being severed by a number of anthropogenic factors, of which pollution remain the most dominant problem.
Water pollution occurs when unwanted materials with potentials to threaten human and other natural systems find their ways into rivers, lakes, wells, streams, boreholes or even reserved fresh water in homes and industries.
Water pollution is the discharge of waste water from commercial and industrial waste (intentionally or through spills) into surface waters; discharges of untreated domestic sewage, and chemical contaminants, such as chlorine, from treated sewage; release of waste and contaminants into surface runoff flowing to surface waters (including urban runoff and agricultural runoff, which may contain chemical fertilizers and pesticides); waste disposal and leaching into groundwater; eutrophication and littering.
Rivers are the most important freshwater resource for man. Unfortunately, river waters are being polluted by indiscriminate disposal of sewerage, industrial waste and plethora of human activities, which affects their physico-chemical characteristics and microbiological quality [Kosh and Nayar, 1999]. Increasing numbers and amounts of industrial, agricultural and commercial chemicals discharged into the aquatic environment have led to various deleterious effects on aquatic organisms. Aquatic organisms, including fish, accumulate pollutants directly from contaminated water and indirectly via the food chain [Hammer, 2004; Mohammed, 2009]. The pollutants are usually pathogens, silt and suspended solid particles such as soils, sewage materials, disposed foods, cosmetics, automobile emissions, construction debris and eroded banks from rivers and other waterways (Galadima et al., 2011).
Owing to the large quantity of effluent discharged to the receiving waters, the natural processes of pathogen reduction are inadequate for protection of public health. In addition, industrial wastes that alter the water pH and provide excessive bacterial nutrients often compromise the ability of natural processes to inactivate and destroy pathogens [Gerardi & Zimmarman, 2005]. The extent of discharge of domestic and industrial effluents is such that rivers receiving untreated effluent cannot provide the dilution necessary for their survival as good quality water sources. The transfer of unfavorable releases from industries is detrimental to human and animal health and safety [Adekunle & Eniola, 2008].
Disposal of sewage wastes into a large volume of water could increase the biological oxygen demands to such a high level that all the available oxygen may be removed; consequently, fishes, bottom-dwelling animals and even marine plants can be contaminated and/or killed, creating
significant disruption in the food chain. On the other hand, when this contaminated water is directly consumed without proper treatment (a common practice to local communities), spread of diseases such as typhoid, dysentery, cholera, hepatitis etc. will occur (Galadima et al., 2011).
In Nigeria today research indicates that, majority of the common fresh water sources are polluted, resulting to serious outbreak of these and other diseases. A study by Umeh et al. (2004) as cited from Galadima et al.(2011) work showed that 48% of the people in Katsina-Ala Local Government area of Benue state are affected by urinary schistosomiasis, due to increase in water pollution index. Some previous investigations indicate that 19% of the whole Nigerian population is affected, with some communities having up to 50% incidence. This has raised serious concerns to World Health Organization, in an attempt to improve cultural and socio-economic standards of people in the tropical region (Okigbo, 1984; Umeh, 1989; Umeh et al., 2004).
According to Kolawole et al. (2011) prevention of river pollution requires effective monitoring of physico-chemical and microbiological parameters. In most countries, the principal risks to human health associated with the consumption of polluted water are microbiological in nature [WHO, 1997].The bacteriological examination of water has a special significance in pollution studies, as it is a direct measurement of deleterious effect of pollution on human health [APHA, 1981]. Coliforms are the major microbial indicator of monitoring water quality although not an actual cause of disease. Other microorganisms sometimes found in surface waters which have caused human health problems include: Burkholderia pseudomallei, Cryptosporidium parvum, Giardia lamblia, Salmonella, Novovirus and other viruses, Parasitic worms [Brenner et al., 1993; Grant, 1997].
More importantly effluent discharge practices in Nigeria are yet too crude and society is in danger, especially in the industrialized part of the cities. The Federal Environmental Protection Agency (FEPA) established to check these environmental abuses has had little or no impact on pollution control in our cities [Ezeronye & Amogu, 1998]. The aim of this review is to assess the impact of wastewater pollution on aquatic environments and humans in Nigeria.
1.1 Demand for water.
According to the report of Galadima et al. (2011) recent statistic indicates that 1.2 and 2.4 billion people suffer from lack of safe water supply and secure sanitation respectively. In many developing countries, Nigeria in particular, more than half of the population is affected.
Fresh waters represent the main sources of safe water for household, agricultural and even industrial applications. They are required for drinking, cooking, recreational activities, farming, fishing etc., making them unavoidable for the evolution of society and civilization (Orubu, 2006).
Rivers are the most important freshwater resource available to the local inhabitants which are either unsafe or difficult to obtain and are severely stressed by poor management. These make access to clean water a serious problem, in some instances women and children need to walk for hours to fetch ordinary drinking water (Galadima et al., 2011).
2. Causes of Water Pollution in most Nigerian Communities
2.1 Domestic based water pollution.
One of the most critical problems of developing countries is improper management of vast amount of wastes generated by various anthropogenic activities. More challenging is the unsafe disposal of these wastes into the ambient environment. Water bodies especially freshwater reservoirs are the most affected. This has often rendered these natural resources unsuitable for both primary and/or
secondary usage [Fakayode, 2005]. Land disposal of solid waste creates an important source of ground water pollution. The problem of pollution from refuse heaps is greatest where high rainfall and shallow water table occur. Important pollutant frequently found in leachates from refuse dump includes BOD, iron, manganese, chloride and nitrate (Krist, 2000).
2.2 Industrial based water pollution
Wastewaters are generated by many industries as a consequence of their operation and processing. Depending on the industry and their water use, the wastewaters contain suspended solids, both degradable and non-biodegradable organics; oils and greases; heavy metal ions; dissolved inorganics; acids, bases and coloring compounds [Kosaric, 1992]. In Nigeria, there are many small to large cottage industrial establishments that discharge such harmful wastewater effluents. Although, the physicochemical analysis of the effluents indicates that most of these industries conform to the recommended FEPA [FEPA, 1991] guidelines, however, exceptions occur in the total dissolved solids (TDS) and Nitrate (NO3
-) contents.
2.3 Agricultural Pollution
According to Galadima et al. (2011) agriculture, as the single largest user of freshwater on a global basis and as a major cause of degradation of surface and groundwater resources through erosion and chemical runoff, has cause to be concerned about the global implications of water quality. The associated agro food-processing industry is also a significant source of organic pollution in most countries.
The primary agricultural pollutants are nutrients (particularly nitrogen and phosphorus), sediment, animal wastes, pesticides, and salts. Agricultural sources enter surface water through direct surface runoff or through seepage to ground water that discharges to a surface water outlet. The most common sources of excess nutrients in surface water are chemical fertilizers and manure from animal facilities. Such nutrients cause eutrophication in surface water. Eutrophication is thus depriving the river of oxygen (called oxygen debt). As algae dominates and turn the water green, the growth of other water plants is suppressed; these die first disrupting the food chain.
Pesticides used for pest control in agricultural operations can also contaminate surface as well as ground-water resources. Some of these pesticides contain endocrine disrupting chemicals that can mimic or antagonize the effects of endogenous hormones could potentially have serious effects not only on the development and well-being of an individual organism, but perhaps more importantly on the ability of that organism to reproduce, and its offspring to survive and eventually reproduce(Burkhardt-Holm, 2010). Nitrates also soak into the ground and end up in drinking water. Health problems can occur as a result of this and they contribute to methemeglopbinemia or blue baby syndrome which causes death in infants.
2.4. Oil Spill Based Water Pollution
Oil spillage is a result of leakage of hydrocarbon from the pipes. To a large extent, poor maintenance of oil pipelines and poor monitoring of pressure regimes of the fluids with respect to the strength of the pipe are the main causes. Production of oil and gas is usually accompanied by substantial discharge of wastewater in the form of brines. Based on the report of Galadima et al. (2011) constituents of brines include sodium, calcium, ammonia, boron, trace metals, and high total dissolved solids (TDS).
In Nigeria, the local people of the oil rich Niger-Delta, including women and children who are mostly victims of oil spills and other environmental hazards caused by the oil companies, in their own voices, they recount horrifying scenes of killings by agents of the state, destruction of the ecosystem, desecration of sacred sites and the neglect and impoverishment of the people whose lands produce the wealth that sustains the Nigerian nation-state (Krist, 2000).
Several oil spill incidents have occurred in various parts and at different times along Nigerian coasts as cited in the work of Galadima et al (2011). Some major spills in the coastal zone are the GOCON’s Escravos spill in 1978 of about 300,000 barrels, SPDC’s Forcados Terminal tank failure in 1978 of about 580,000 barrels and Texaco Funiwa-5 blowout in 1980 of about 400,000 barrels. Other oil spill incidents are those of the Abudu pipe line in 1982 of about 18,818 barrels, The Jesse Fire Incident which claimed about a thousand lives and the Idoho Oil Spill of January 1998, of about 40,000 barrels (Peter and Olusegun, 2006). The most publicized of all oil spills in Nigeria occurred on January 17 1980 when a total of 37.0 million litres of crude oil got spilled into the environment. This spill occurred as a result of a blow out at Funiwa 5 offshore station. Nigeria's largest spill was an offshore well-blow out in January 1980 when an estimated 200,000 barrels of oil (8.4million US gallons) spilled into the Atlantic Ocean from an oil industry facility and that damaged 340 hectares of mangrove (Nwilo and Badejo, 2005).
3. Consequences of Water Pollution
The effect of water pollution can be catastrophic, depending on the kind of chemicals, concentration of the pollutants and where there are polluted. Many water bodies near urban areas (cities and towns) are highly polluted. This is the result of both garbage dumped by individual and dangerous chemicals legally and illegally dumped by manufacturing industries, health centers, schools and market places.
Eventually, humans are affected by this problem as well. People can get disease such as hepatitis by eating seafood’s that has been poisoned. In many poor nations of the world, there is always outbreak of cholera and diseases as a result of poor drinking water treatment from contaminated waters
According to CIA (2010) report as cited in Galadima et al. (2011) children and new born babies are mostly affected by these severities, as can be seen from the high infant mortality rate in the country. More so, on the other hand, health deteriorations have seriously raised concerns due to persistent human and animal’s productivity declination. Water related diseases are the most common causes of illness and death, affecting mainly poor inhabitants in the local communities. Several cases have been reported. In October 2010, 29115 cases involving 1191 deaths of cholera have been reported in just 15 out the 37 states including Federal Capital Territory. The figure increased from 1616 and 126 deaths in 2004. According to Galadima et al. (2011) it was observed that the outbreak is still in existence in new areas due to continuous water pollution. Pond water constitutes more than 70% of total water used in Idere community of Oyo state.
Heavy metals poisoning is also a serious health and environmental problem, that in most Nigerian reports, results from absorption in contaminated water or via associated food. Recently Ibeto and Okoye (2010) as cited in the report of Galadima et al. (2011) conducted a study on 240 people, comprising of children, pregnant/nursing women and men in Enugu state. Nickel, manganese and chromium were detected with concentrations exceeding the allowed limits permitted by WHO, in the blood samples of the respondents. The poisoning was generally believed to be occupationaland water-based. In a related development, more than 400 children from seven villages around Gummi and Bukkuyum Local Government areas of Zamfara state, died from Lead poisoning within justsix
months in 2010. Medical experts’ reports from the state Ministry of Health and Medecins Sans Frontieres (MSF) described the affected children to show devastating symptoms such as;
“gastro-intestinal upsets, skin rashes, changes of mood; some were lethargic, some partially paralysed, some had become blind and deaf. The worst affected were coming into the small Ministry of Health clinic with seizures that could last for hour and would sometimes lead to coma and then often to death.”
The poisoning which is primarily associated with mineral exploitation, consumption in water and food and air-based inhalation, have so far affected 3,600 children, with further expectations that 180 villages covering around 30,000 people may be affected. Numerous of these cases are available today in various Nigerian and international publications, the major concern remains how the problems could be fully addressed
4 Approaches to pollution control
It has clearly been established that, pollution of source of domestic water which are surface water is an ongoing problem in most Nigerian communities, especially the government-ignored villages. The tragedy is seriously crippling human development, proper identification of preventive and control measures would be very useful. The above review of the causes, effects or consequences of water pollution on surface waters evidences the need for control of this type of pollution in developing countries, which can best be achieved by proper education and enlightenment of local people on the importance of water sanitation and good waste disposal method, reduction or prevention at the source. Such measures do lead to raw material recovery and reduction in effluent discharges or lower treatment costs. Legal, administrative and technical measures are also necessary to reduce or eliminate the undesirable effects of domestic, agricultural oil spillage and industrial effluents in receiving waters. The establishment of water treatment plants and good regulatory strategies. Adequate budgetary funding is therefore necessary. This can be controlled by standards imposed by the authorities. Levies can be imposed to cover the cost of off-site treatment and disposal.
Conclusion
Overuse and pollution of the world's freshwater resources are a recent development. Their long-term consequences are still unknown. Already, however, they have taken a heavy toll on the environment, and they pose increasing risks for many species. Polluted water and lack of sanitation also greatly risk human health. Moreover, the state of freshwater resources contributes to the deterioration of coastal waters and seas. It is therefore critical that more care is taken to reduce pollutants in our fast retreating freshwater supplies.
REFERENCES
1. Adekunle, A.S.; Eniola, I.T.K. Industrial effluents on quality of segment of Asa River within an industrial estate in Ilorin, Nigeria. New York Sci. J. 2008, 1, 17.
2. American Public Health Association (APHA). Standard Methods for the Examination of Water and Wastewater, 15th ed.; APHA: Washington, DC, USA, 1981; pp. 85-99, 773-779, 786-828.
3. Brenner, K.P.; Rankin, C.C.; Roybal, Y.R., Jr.;Stelma, G.N.; Scarpino, P.V.; Dufour, A.P. New medium for the simultaneous detection of total coliforms and Escherichia coli in water. Appl. Environ. Microbiol. 1993,59, 3534-3544.
4. Burkhardt – Holm, P. (2010). Endocrine disrupts and water quality: a state of the art Reviewed. International journal of water Resources Development 26 (3): 477 – 493.
5. Ezeronye, O.U and Amogu, N.1998 Microbiological Studies of Effluents from the Nigerian Fertilizer and Paper Mill Plants. International Journal of Environmental Studies, 54: 213-221.
6. Fakayode, S. O. 2005 Impact assessment of industrial effluent on water quality of the receiving Alaro River in Ibadan Nigeria AJEAM-RAGEE 10: 1-13. (goodstyle)
7. FEPA (Federal Environmental Protection Agency). 1991 Guidelines to Standards for Environmental Pollution Control in Nigeria, FG Press Lagos Nigeria.238pp
8. Garba, Z.N., Gimba, C.E., Hamza, S.A & Galadima, A. (2008): Tetrimetric determination of arsenic in well water from Getso and Kutama, Gwarzo Local Government Area, Kano state, Nigeria Chem Class Journal, vol. 5, pp78-80.
9. Garba, Z.N., Hamza, S.A & Galadima, A. (2010) Arsenic level speciation in fresh water from Karaye Local Government Area, Kano State, Nigeria. International Journal of Chemistry, India. Vol. 20, No. 2: 113-117.
10. Gerardi, M.H.; Zimmerman, M.C. Wastewater Pathogens; John Wiley & Sons, Inc.: Hoboken, NJ, USA, 2005, pp. 3-4.
11. Grant, M.A. A new membrane filtration medium for simultaneous detection and enumeration of Escherichia coli and total coliform. Appl. Environ. Microbiol. 1997, 63, 3526-3530.
12. Galadima, A., Bisiriyu, M.T., Garba, Z.N., Ibrahim,B.M (2009) Determination of Arsenic in well water from Gidan Dare and Gidan Igwai Areas, Sokoto North Local Government,Sokkoto State, Nigeria. A paper presented during the Chemical Societ Conference, Bayero University Kano, Nigeria, 2009. [7]
13. Galadima, A., Garba, Z. N., Leke, L., Almustapha, M. N. & Adam, I. K. (2011). Domestic Water Pollution among Local Communities in Nigeria ---- Causes and Consequences. European Journal of Scientific Research ISSN 1450-216X Vol.52 No.4 (2011), pp.592-603 ©EuroJournals Publishing, Inc. 2011 http://www.eurojournals.com/ejsr.htm
14. Hammer, M.J. Water and Wastewater Technology, 5th ed.; Practice-Hall Inc.: Upper Saddle River, NJ, USA, 2004; pp. 139-141.
15. Ibeto, C.N. and Okoye, C.O.B (2010) High levels of Heavy metals in Blood of Urban population in Nigeria. Research Journal of Environmental Sciences, 4(4): 371-382.
16. Krist, A O. (2000). Environmental Problem in the Oil Rich Niger-Delta in Nigeria. Newslineat GREEN AFRICA.
17. Kolawole, O.M.; Ajibola, T.B.; Osuolale, O.O. Bacteriological Investigation of a wastewater discharge run-off stream in Ilorin, Nigeria. J. Appl. Environ. Sci. 2008, 4, 33-37. 4. 5
18. Kosaric, N.1992 Treatment of industrial waste waters by anaerobic processes- new developments In Recent Advances in Biotechnology Vardar-Sukan, F.and Sukan, S.S. (eds.). Kluwer Academic Publishers, Netherlands.
19. Koshy, M.; Nayar, T.V. Water quality aspects of River Pamba. Pollut. Res. 1999, 18, 501-510.
20. Mohammed, F.A.S. Histopathological studies on Tilapia zilliand Solea vulgarisfrom lake Quran, Egypt. World J. Fish Mar. Sci.2009, 1, 29-39. 7.
21. Nwilo, P.C. & O.T. Badejo, (2005): Oil Spill Problems and Management in the Niger Delta. International Oil Spill Conference, Miami, Florida, USA
22. Peter C.N. & Olusegun T.B. (2006). Impacts and Management of Oil Spill along the Nigerian Coastal Areas http://www.fig.net/pub/figpub/pub36/chapters/chapter_8.pdf
23. Pink, Daniel H. (April 19, 2006). "Investing in Tomorrow's Liquid Gold". Yahoo.

24. Saad, M. A, H. El-Rayis, O. & Ahdy, H. (1984). Status of nutrients in Lake Mariut, a delta lake in Egypt suffering from intensive pollution. Mar Pollut Bull 15 (1): 408-411
25. Stark, J.R.; Hanson, P.E.; Goldstein, R.M.; Fallon, J.D.; Fong, A.L.; Lee, K.E.; Kroening, S.E.; Andrews, W.J. Water Quality in the Upper Mississippi River Basin, Minnesota, Wisconsin, South Dakota, Iowa, and North Dakota, 1995–98; United States Geological Survey: Reston, VA, USA, 2001.
26. United Nations Environment Programme Global Environment Monitoring System/Water Programme. Water Quality for Ecosystem and Human Health; National Water Research Institute: Burlington, ON, Canada, 2000.
27. World Health Organization (WHO). Guidelines for Drinking Water Quality: Surveillance and Control of Communities Supplies, 2nd ed.; WHO: Geneva, Switzerland, 1997; Volume 3.
28. West, Larry (March 26, 2006). "World Water Day: A Billion People Worldwide Lack Safe Drinking Water". Wikipedia 2006
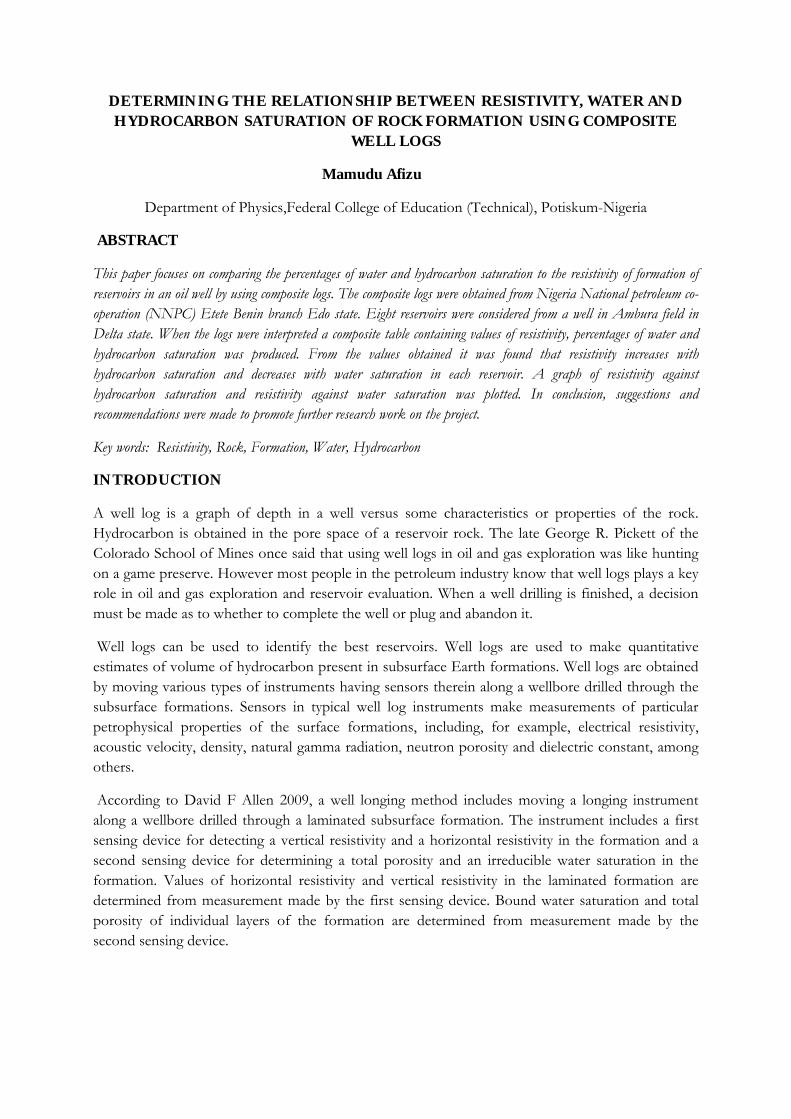
DETERMINING THE RELATIONSHIP BETWEEN RESISTIVITY, WATER AND HYDROCARBON SATURATION OF ROCK FORMATION USING COMPOSITE
WELL LOGS
Mamudu Afizu
Department of Physics,Federal College of Education (Technical), Potiskum-Nigeria
ABSTRACT
This paper focuses on comparing the percentages of water and hydrocarbon saturation to the resistivity of formation of reservoirs in an oil well by using composite logs. The composite logs were obtained from Nigeria National petroleum co-operation (NNPC) Etete Benin branch Edo state. Eight reservoirs were considered from a well in Ambura field in Delta state. When the logs were interpreted a composite table containing values of resistivity, percentages of water and hydrocarbon saturation was produced. From the values obtained it was found that resistivity increases with hydrocarbon saturation and decreases with water saturation in each reservoir. A graph of resistivity against hydrocarbon saturation and resistivity against water saturation was plotted. In conclusion, suggestions and recommendations were made to promote further research work on the project.
Key words: Resistivity, Rock, Formation, Water, Hydrocarbon
INTRODUCTION
A well log is a graph of depth in a well versus some characteristics or properties of the rock. Hydrocarbon is obtained in the pore space of a reservoir rock. The late George R. Pickett of the Colorado School of Mines once said that using well logs in oil and gas exploration was like hunting on a game preserve. However most people in the petroleum industry know that well logs plays a key role in oil and gas exploration and reservoir evaluation. When a well drilling is finished, a decision must be made as to whether to complete the well or plug and abandon it.
Well logs can be used to identify the best reservoirs. Well logs are used to make quantitative estimates of volume of hydrocarbon present in subsurface Earth formations. Well logs are obtained by moving various types of instruments having sensors therein along a wellbore drilled through the subsurface formations. Sensors in typical well log instruments make measurements of particular petrophysical properties of the surface formations, including, for example, electrical resistivity, acoustic velocity, density, natural gamma radiation, neutron porosity and dielectric constant, among others.
According to David F Allen 2009, a well longing method includes moving a longing instrument along a wellbore drilled through a laminated subsurface formation. The instrument includes a first sensing device for detecting a vertical resistivity and a horizontal resistivity in the formation and a second sensing device for determining a total porosity and an irreducible water saturation in the formation. Values of horizontal resistivity and vertical resistivity in the laminated formation are determined from measurement made by the first sensing device. Bound water saturation and total porosity of individual layers of the formation are determined from measurement made by the second sensing device.
In rocks, saturation refers to fraction or percent of the pore space that is occupied by some fluid or hydrocarbon. If the pore spaces in a rock are completely full of water, we say they are 100% saturated. If the pore spaces have 40% of their volume occupied with hydrocarbon and the rest with water, there is obviously 60% water saturation in the pore system. The total fraction of both hydrocarbon and water is 100% or simply 1 if we are dealing in fractional parts instead of percentage
Resistivity of a well is a measure of the resistance a given volume of fluid in the well will offer to the flow of current. When the resistivity of a clear solution (RO) and the true resistivity (R t) are determined, the resistivity index is the ratio of R t to Ro. Most natural waters in rocks contain salts of various kinds. The majority of natural waters are conductive. The equation for the resistance of a one meter cube to current flow through two parallel faces can be written: Resistance of cube of water = resistivity of water * length / area. If length and area both equal 1, then: Resistance (ohm) = RW (ohm - meter) (resistivity of water).The resistance, in ohms, of a one meter cube of water is numerically equal to the resistivity of the water in ohm-meters. This is true for any material or combination of materials and is not restricted only to water.
Consider a one meter cube of rock that is 100% water saturated, that is, all the pores are filled with water. Resistivity of the cube may be written in terms of the current path length, area and resistivity. The concept of formation resistivity factor is one of the most important in petrophysical analysis. Formation resistivity factor is the ratio of the resistivity of 100% water saturated rock to the resistivity of the water with which it is saturated. F = Ro / RW .The resistivity of the current path is RW and the path length (Le1) is at least one meter, but probably longer. The area is proportional to porosity. Resistivity of a formation in a direction along the direction of the layers of the formation and the direction transverse to the layer direction are referred to as horizontal and vertical resistivities respectively.
LITERATURE REVIEW
Much work has been done to develop empirical relationships between water resistivity, porosity, and water saturation. G.E. Archie in 1942 showed with core samples, that formation resistivity factor, water resistivity and rock resistivity are related by the following expression over wide ranges of porosity: F = Ro / RW( F=formation factor, Ro = resistivity of rock filled with water (ohm-m), RW = resistivity of water (ohm-m). Archie also stated that water saturation is related to the rock resistivity by the expression: Sw = (Ro / Rt) ^ (1 / N). N = saturation exponent (unitless), Ro = resistivity of rock filled with water (ohm-m), Rt = resistivity of rock filled with water and oil (ohm-m) , Sw = water saturation (fractional)
A method for estimating hydrocarbon volume in a layered subsurface formation includes determining a vertical resistivity and horizontal resistivity in the formation. Values of horizontal resistivity and vertical resistivity of the formation are calculated based on the bound water saturation and total porosity for each layer and on an estimated irreducible bulk volume of water in each layer. The estimated values are compared to the determined horizontal resistivity and vertical resistivity.
The estimated irreducible water saturation in each layer is adjusted and estimating the values is repeated until differences between the estimated values and the determined vertical and horizontal resistivity values fall below a selected threshold. The hydrocarbon volume is estimated from adjusted irreducible water saturation for each layer. (David F, Allen 2009).
According to Roland Chemali 2012, formation evaluation is performed based on deconvolution guided by microresistivity images. It involves interpreting the vertical and horizontal resistivity in terms of Vshale and hydrocarbon content. Method for estimating properties of fluid in rock formations at selected locations within a geologic basin includes generating an initial model of the basin. The model includes an output spatial distribution of at least rock formation, mineral composition, rock formation porosity, and composition of fluid in the rock formation porosity. (Soraya Betan court 2010).
Electricity can pass through a formation only because of conductive water contained within the formation. Perfectly dry rocks are very seldom encountered in the subsurface. Water is in their pores or absorbed in their interstitial clay, therefore subsurface formations have finite, measurable resistivities. A raservior has a conducting part: salt water and a non- conducting part hydrocarbon. Conductivity is the reciprocal of resistivity. A substance with infinite resistivity has conductivity of zero and a substance with low resistivity has high conductivity. According to Archie 1942, the resistivity of the formation water, Rw is an instrisic property of the water and is a function of its salinity and temperature. The higher this variable, the more conductive is the water and the lower its resistivity. The ability of a rock to conduct electricity is due to the ions in its pore spaces.
With a large percentage of the world’s known hydrocarbon reservoir located in carbonate reservoirs, the push to increase production has revealed a need to improve oil saturation calculation in carbonate transition zone. He discovered that carbonate transition zones exhibit resistivity and pressure gradient phenomena that respond like water zones to resistivity and pressure gradient measurement. Prasonjo and Y. Sallam (2006).
According to Ivan. S 2012 reservoir rocks hydrocarbon saturation calculation with resistivity log is substantially limited by information shortage about petro physical characteristics of reservoirs mineral components. The adaptive resistivity log data interpretation is forced to share in the effective pore volume. Petro physical assurance of this technique is relation between measured resistivity and changes in reservoir water holding capacity. It is necessary to specify three resistivity characteristics values. There are resistivity of the reservoir in case when all pore volume is filled with irreducible water, resistivity of water bearing reservoir and oil bearing reservoir with maximal available total porosity.
METHODOLOGY
In this paper reference was made particularly to resistivity log. Deep resistivity was considered because hydrocarbon was found there. The track had a scale of (0.2 to 2000)Ω m. The resistivity of clear solution of the rock was determined and the true resistivity was measured from the resistivity log. Six reservoirs were considered from the well and their resistivity indexes were computed. Water saturation of each reservoir was determined from the resistivity index. Assuming the total resistivity
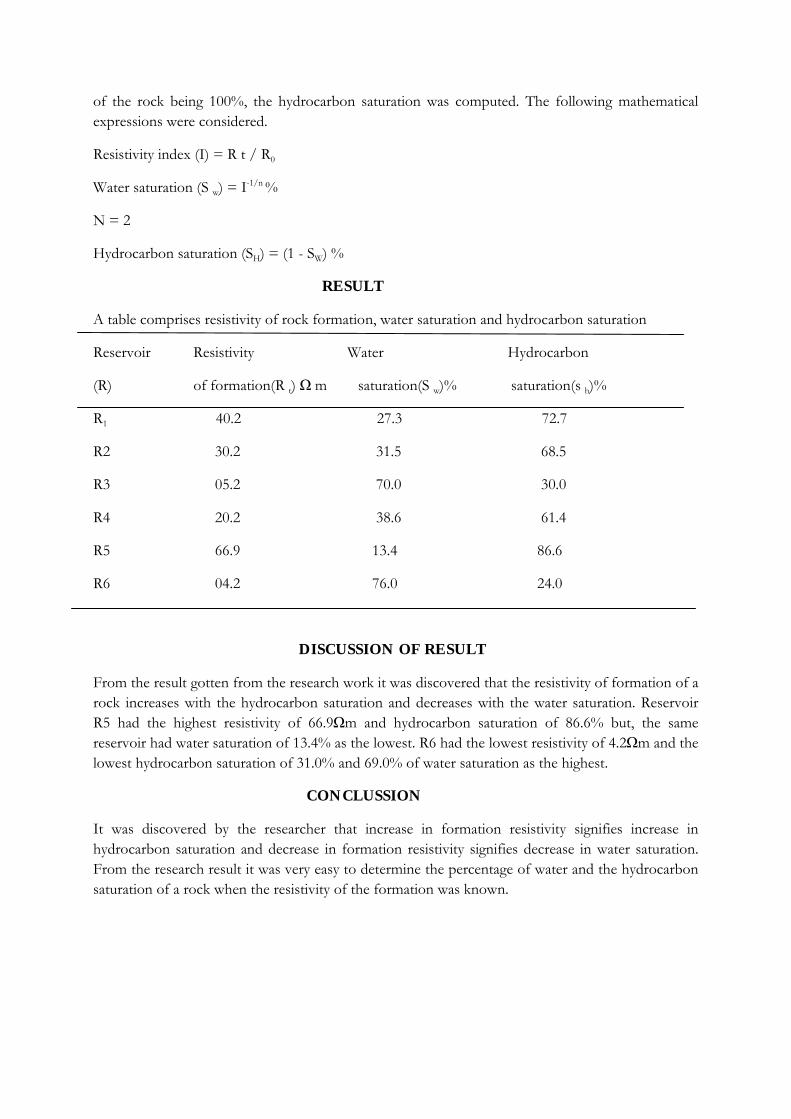
of the rock being 100%, the hydrocarbon saturation was computed. The following mathematical expressions were considered.
Resistivity index (I) = R t / R0
Water saturation (S w) = I-1/n %
N = 2
Hydrocarbon saturation (SH) = (1 - SW) %
RESULT
A table comprises resistivity of rock formation, water saturation and hydrocarbon saturation
Reservoir Resistivity Water Hydrocarbon
(R) of formation(R t) Ω m saturation(S w)% saturation(s h)%
R1 40.2 27.3 72.7
R2 30.2 31.5 68.5
R3 05.2 70.0 30.0
R4 20.2 38.6 61.4
R5 66.9 13.4 86.6
R6 04.2 76.0 24.0
DISCUSSION OF RESULT
From the result gotten from the research work it was discovered that the resistivity of formation of a rock increases with the hydrocarbon saturation and decreases with the water saturation. Reservoir R5 had the highest resistivity of 66.9Ωm and hydrocarbon saturation of 86.6% but, the same reservoir had water saturation of 13.4% as the lowest. R6 had the lowest resistivity of 4.2Ωm and the lowest hydrocarbon saturation of 31.0% and 69.0% of water saturation as the highest.
CONCLUSSION
It was discovered by the researcher that increase in formation resistivity signifies increase in hydrocarbon saturation and decrease in formation resistivity signifies decrease in water saturation. From the research result it was very easy to determine the percentage of water and the hydrocarbon saturation of a rock when the resistivity of the formation was known.
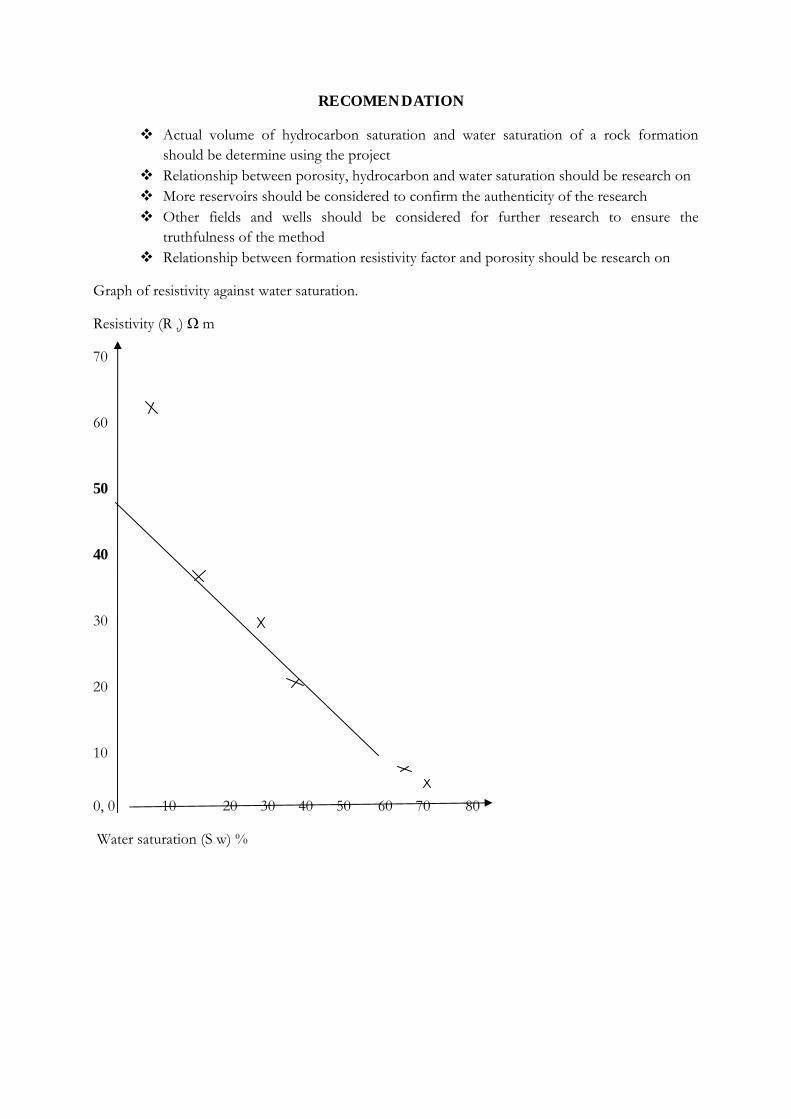
RECOMENDATION
Actual volume of hydrocarbon saturation and water saturation of a rock formation should be determine using the project
Relationship between porosity, hydrocarbon and water saturation should be research on More reservoirs should be considered to confirm the authenticity of the research Other fields and wells should be considered for further research to ensure the
truthfulness of the method Relationship between formation resistivity factor and porosity should be research on
Graph of resistivity against water saturation.
Resistivity (R t) Ω m
70
60
50
40
30
20
10
0, 0 10 20 30 40 50 60 70 80
Water saturation (S w) %
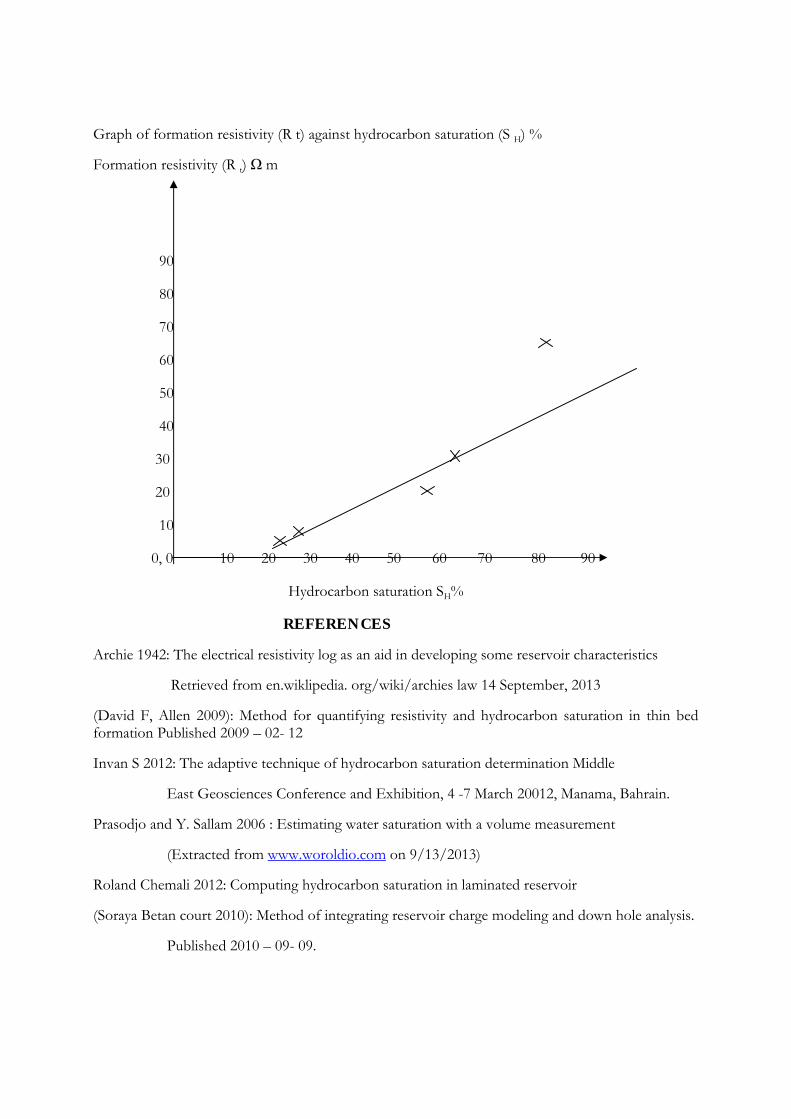
Graph of formation resistivity (R t) against hydrocarbon saturation (S H) %
Formation resistivity (R t) Ω m
90
80
70
60
50
40
30
20
10
0, 0 10 20 30 40 50 60 70 80 90
Hydrocarbon saturation SH%
REFERENCES
Archie 1942: The electrical resistivity log as an aid in developing some reservoir characteristics
Retrieved from en.wiklipedia. org/wiki/archies law 14 September, 2013
(David F, Allen 2009): Method for quantifying resistivity and hydrocarbon saturation in thin bed formation Published 2009 – 02- 12
Invan S 2012: The adaptive technique of hydrocarbon saturation determination Middle
East Geosciences Conference and Exhibition, 4 -7 March 20012, Manama, Bahrain.
Prasodjo and Y. Sallam 2006 : Estimating water saturation with a volume measurement
(Extracted from www.woroldio.com on 9/13/2013)
Roland Chemali 2012: Computing hydrocarbon saturation in laminated reservoir
(Soraya Betan court 2010): Method of integrating reservoir charge modeling and down hole analysis.
Published 2010 – 09- 09.
NIGERIA’S WATER CHALLENGES AND THE MILLENNIUM
DEVELOPMENT GOALS (MDG’S)
Emmanuel Tsegha
Civil Engineering Department, Federal Polytechnic, Bauchi-Nigeria
Abstract
Water is a pre-requisite for human health and well-being as well as preservation of the environment. It is vital to all living creatures on earth. To underscore the importance of this fact the United Nations (UN) General Assembly in 2005 elevated water to the status of human right of the people. Again at its Millennium Summit in the year 2000 the UN signed up to the Millennium Development Goals (MDG’s) which represent a global agreement by the world leaders setting out key standards that nations of the world should achieve by the year 2015. The component of water in the MDG’s is very prominent. Apart from standing alone as a principal target (Goal 8) it is also directly or indirectly related to Goals 1,4,5 and 6, a total of four other goals. This paper examines the current rate of progress in this sector vis-a-vis the MDG’s targets, whether the nation is on track or off-track in realizing this particularly essential, inclusive goal. It concludes with some suggestions in finding ways to achieve this time-bound commitment
Key words: Water target, Accessibility, Funding, Financial Autonomy, Social capital.
Introduction Access to water is vital for every living creature on earth. The importance of water, rightly termed, “fluid of life” is clear to us all and cannot be overlooked. It is a pre-requisite for human health and well-being as well as preservation of the environment. Indeed if water is polluted or destroyed, it means virtually every life is endangered. We can last weeks without food, but not more than four days without water (Pickering & Owen, 1995). Furthermore, the use of clean water is a preventive measure, and as the saying goes, “prevention is better than cure”. But it is a paradox that this most widely occurring substance on earth, covering over 70% of the planet, yet remains a scarcity to millions of people. Of this estimated amount about 90% is ocean water which is too salty and therefore is hardly used for drinking, farming or manufacturing (UNICEF, 2004). The percentage remainder exists variously in polar icecaps, in rivers and lakes and a portion imprisoned in underground aquifers. It is such a precious resource, revered by many customs and has a lot of relevance in traditional and religious rituals (Nelson, 1999). A 2012 report by the World Health Organization (WHO) and United Nations International Children’s Emergency Fund (UNICEF) established that over 70 million Nigerians lack access to clean, potable water. This grim reality is corroborated by the minister of Water Resources, Sarah Ochekpe on the occasion of celebrating World Water Day on March 22, 2013. To underscore the importance of water the UN General Assembly in 2005 elevated water to the status of human rights of the people, and designated March 22 of every year as World Water Day.

Going by the UN declaration it follows that millions of Nigerians are suffering from gross violation of their fundamental human right. Indeed Governor Banbangida Aliyu of Niger State at the Presidential Water Summit in February, 2013 in Abuja called for a legislation that will empower citizens to sue the government for failing to provide water and other essentials. We cannot agree more with governor Aliyu. It will be recalled that the Federal Ministry of Water Resources organized a Presidential Water Summit on 12/02/2013 which was well attended by stakeholders. President Goodluck Jonathan himself attended and made some pronouncements on the subject matter. Situation Analysis of Water and Sanitation in Nigeria There’s no gainsaying the fact that there exist huge challenges to water, sanitation and public health in the nation, and there’s every need to improve on the situation. Even going by African standards Nigeria with over 40% of the population lacking clean drinking water is a worst case scenario. Sanitation generally refers to keeping the environment clean, especially by providing facilities and services for the safe disposal of human waste. Hygiene, a twin relation to sanitation, is the practice of keeping oneself clean in order to avoid disease(s). Both sanitation and hygiene are integral to water supply, and health benefits can surely be maximized by improvement in this area. In many parts of the country people and livestock struggle for water from unsafe stagnant ponds, while children trek over 5km daily to fetch water from streams for household usage before going to school (UNICEF, 2004 ). Because of lack of access to clean water and sanitation, water-borne diseases such as dysentery, cholera, typhoid fever, and diarrhoea remain rampant, killing hundreds every year. The water that is supposed to be a source of life ends up killing people. According to WaterAid, an International Non-Governmental Organization dedicated to the provision of safe water, infant mortality in Nigeria is 198/1000, with a great number of those deaths caused by diarrhoeal diseases. A 2012 UN report also reveals that about 40 billion hours per day are lost in Africa in the frantic search for water, and goes on to reveal that, “these lost working hours equals a whole year’s worth of labour by the entire workforce in France.” These lost man-hours in fetching water from long distances should have been devoted to other productive ventures, and economically viable activities. The overall economic loss in a year can better be imagined. School days are also lost by pupils because of water and sanitation related diseases. Water Component of the Millennium Development Goals (MDG’s) At its Millennium Summit in the year 2000 in NewYork, the UN signed up to the MDG’s which represent a global agreement by the world leaders setting out key standards that the nations of the world should achieve by the year 2015. The key standards are as follows:
i. Eradication of Extreme Poverty and Hunger ii. Active Universal Basic Primary Education iii. Promotion of Gender Equality and Empowering Women. iv. Reduction of Child Mortality v. Improve Material Health
vi. Combat HIV/AIDS, Malaria and other Terminal Diseases vii. Ensure Environmental Sustainability viii. Provide Safe Drinking Water and Sanitation ix. Develop Global Partnership for Development.
The water target is to supply 75% (three quarters) of the population with potable water by 2015 and 70% of the same population with adequate sanitation But statistics from the ministry of Water Resources shows that only about 60% of the population has access to safe drinking water while access to sanitation is put at 32%. It can be seen that provision of water being itself a principal target is also directly or indirectly related to Goals No. 1, 4, 5 and 6. The critical position of water in realizing the MDG’s cannot be overemphasized. Potable water helps to eradicate extreme poverty and hunger while it also helps to reduce incidences of water-borne diseases. When combined, water, sanitation and hygiene reduce the number of deaths caused by diarrhoeal diseases by an average of 65%. This assertion is by WaterAid (2013), an International NGO whose vision is a world where everyone has access to safe drinking water and effective sanitation. With the target date (2015) by the corner the big question is whether the water and sanitation targets are achievable. Minister of Water Resources, Sarah Ochekpe assures Nigerians and the world that the water goal is achievable. Her words, “… government recently launched a road map for its water sector with the target of achieving 75% access to potable water for all Nigerians by 2015.” According to her, the road map is also expected to facilitate the improvement of Nigeria’s sanitation rating and ensure that no Nigerian child in the next few years trek long distance to carry water on their heads before going to school. But a 2012 report by WaterAid shows that,
“At the current rates of progress the water target will be missed by 18 years (2033) and the sanitation target is currently completely off-track, coverage having fallen from 37% in 1990 to 32% in 2008.”
We shall live to see how the two predictive statements on water and sanitation targets between WaterAid and the Water Minister will play out. The Water-Sanitation Matrix The water-sanitation connection is such that the level of sanitation of a community is directly proportional to the availability of water. That is to say that, communities with access to potable water tend to have adequate and efficient sanitation. The issue of sanitation has not been given the attention and promotion it deserves. For example, markets, motor parks, sports stadia etc lack supplies of drinking water, water for washing hands after defecation and adequate toilet facilities. During the last World Toilet Day on November 19, 2012 no effort was made by the various governments to celebrate the occasion and to draw attention to the acute shortage of toilet facilities in the nation. Not to talk of efforts towards addressing the issue. Toilet facilities should be an integral part of designs of common markets, motor parks, shopping complexes etc. The idea of open defecation should be discouraged as much as possible. Engineers and architects should come with designs of toilet facilities suitable for these various cultural and geophysical settings.

Sector Funding and Responsibilities Nigeria has a 3-tier system of federal, state and local governments each having different responsibilities for the funding, provision and management of water, sanitation and hygiene. Given the proximity of Local Governments to the most vulnerable communities it will not be out of place to shift emphasis on provision and management of water and sanitation to the local governments. But the Local Governments have limited authority, limited funding and limited technical capacity which constrain their ability to meet their ever growing statutory obligations, water supply inclusive. In addition they do not have financial autonomy. There is no doubt that sector funding is low and inefficient. At the presidential water summit in February, 2013 inadequate funding was identified as a major constraint. President Goodluck Jonathan himself acknowledged that the water sector, “requires a commitment of N350billion,” to fix the sector. The water sector gets an average of N40billion in the national annual budgets, which is a far cry from the figure the president mentioned. Matters get aggravated with these ab initio insufficient budgets being grossly misused and outrightly embezzled, leaving the taps dry and accentuating the plight of citizens, especially the rural dwellers. In a 2012 investigative report by Premium Times titled, “The massive MDG Mess: How Nigeria’s Water Ministry steals billions…” it is revealed how the Federal Ministry of Water Resources and its agencies, mismanage billions of naira allocated as part of the MDG funds. The report concluded by blaming the presidency for not acting on recommendations of the Monitoring and Evaluation teams, thus allowing massive corruption to continue. Meanwhile, Nigerians continue to suffer from lack of potable water due to excessive graft and greed of water ministry officials. A clear negation of universal values and lack of social capital. If only these culpable ministry officials could imbibe values of common good, transparency etc. and realize the urgent water need of the people as typified in a statement by this Erin-Emu community woman that, “we don’t even want to know how much they have collected or spent, let them just help us and come and give us the water”. Disproportionate Funding Government has many needs to cater for and cannot meet them all at a go. There has to be priority, proportionate disbursement of funds for these needs. This brings to mind the ritual of allocating the lion’s share of the nation’s annual budgets to defense (security) which came to a head last year (2012), when a whopping N921 billion was budgeted for security. A budget that was bigger than that of 12 other ministries combined. In spite of this generous, overdressed security budget Nigerians are not any safer. We are yet to reduce incidents of kidnappings, armed robbery etc. Bombs are still booming across the nation. Securing lives and property is extremely essential but the nation can deploy some of this security funds to areas like water, agriculture and health care. Meanwhile instead of the proliferation of security check points across the nation, relevant technologies for intelligence gathering such as remote cameras, closed-circuit television (CCTV) etc. should be encouraged. These are security measures experts have propounded and which is the norm in various other climes of the world. We
just need to reduce drastically the security budget and deploy more funds to priority areas such as water. Types of Water Resources In managing water resources there are two categories of water to deal with, surface water and ground water. Between the two, managing surface water resources is more tasking, requiring large structures such as dams with equally large accompanying appurtenances. It is technically easier to tap the underground water resources than harnessing and channeling the surface water resources that abound for consumption. This explains why there is indiscriminate drilling of boreholes by individuals and “pure – water” manufacturers across the nation. Coupled with the difficulty in harnessing surface water resources there is insufficient manpower in water resources management, which is even more acute at the most critical level, the local governments. According to Mustafa and Yusuf (2013), “In Nigeria today, there are about 130 universities and less than 6 of them offer courses in water resources.” There is every need for the nation to improve on the training of manpower in this priority area. There are enough water resources in the nation; we only need to properly harness them. Water accessibility remains fragile due mainly to poor resource management than actual scarcity. Water as a Social Amenity In 2005, U.N declared water as a right of the people. This means that water resources should be seen as a social amenity, an essential resource that everybody should have access to. This declaration notwithstanding, water can be used as an economic commodity through which government can generate some revenue. The poor should not be denied access to water but could be granted some level of subsidy. Moreover, if the poor can afford to spend on airtime recharge cards, they should as well pay a token for water. It can also be argued that if people are made to pay, however small, they will be mindful of deliberate wastages. The PVP Component of Rural Water Supply PVP stand for Photovoltaic Pumping system, which utilizes solar energy from the sun. In this system photovoltaic modules convert solar energy into electricity which drives an electric pump that pumps water from a deep well or borehole into an elevated (over-head) storage tank. The water is then tapped by the community for their domestic and other uses as the case may be. We are in the tropics where solar energy is abundant, free and inexhaustible. The PVP option is suited for remote, rural areas where the communities are not covered by electricity supply from the national grid lines. Furthermore, it is cheaper, cleaner than diesel or petrol generators, and is easy to operate and maintain. Some states have already installed the PVP system. It is hoped that more states, and indeed the local governments would follow suit and utilize this reliable water supply scheme for the benefit of their people. Summary and Points of Recommendation As we all know, water is a pre-requisite for human health and well being, a vital element to all living creatures on earth. It preserves the environment generally. From the MDG’s perspective it can be

seen that apart from standing on its own as a primary target, it is directly or indirectly related to 4 other goals. They are goals number (i), (iv), (v), and (vi). But given the current rate of progress it is doubtful that the water target will be realized despite assurances from the Minister of Water Resources. And if the water target is missed it is almost certain that the other 4 water-related goals will also be missed. Efforts have to be doubled or even trebled in order to realize the MDG’s water and associated targets in the remaining period and sustain it thereafter. Towards this end, the following recommendations/ suggestions are hereby offered. Sector Funding There is no doubt that water sector funding is low as confirmed by president Goodluck Jonathan himself. Funding is inefficient in the sense that the little that is budgeted is grossly misused and/or outrightly pilfered, leaving the taps dry. Even funds from donor agencies are not spared. The issue of insufficient funding leads to the practice of disproportionate budgeting. Disproportionate Budgeting (Funding) Agreed that there are growing security challenges but the practice of security budget outstripping those of twelve other ministries combined as happened in 2012 borders on overdressing the issue. Securing lives and property is essential but the nation can deploy some of this security funds to areas like water, agriculture etc. If children (people) keep dying from water-related diseases then what is there to secure and protect. Manpower Development That there is shortage of trained manpower in the area of water resources management cannot be gainsaid. This is glaring from the fact that out of over 100 universities in the nation today less than 6 of them offer courses in water resources management. The shortage is even more acute at the most critical level, the local government areas. There are enough water resources in the nation, we only need to properly harness them. We need to train more personnel in the field who, with needed financial backing, will do the harnessing for the nation. Water accessibility remains fragile due largely to poor resources management than actual scarcity. Financial Autonomy for the Local Governments It is hoped that the on-going debate at the National Assembly on this subject matter will conclude by legislating in favour of financial autonomy for the Local Governments. Proximity of the Local Governments to the most vulnerable communities underscores the need to grant independence to Local Government Councils so that they will effectively play their deserved role as catalysts for grassroots development. Local Government Councils are not meant to be mere appendages, tied to the apron strings of state governments. State Governors are doing a lot of damage to Local Government finances. They keep on appointing illegal Caretaker committees against the constitutional stipulation that, “local government administration must be run by democratically elected members” (Nigerian Constitution, 1999).
Water as an Economic Commodity Notwithstanding the UN declaration that water is a right of every citizen, which means it should be treated as a social amenity, water should be treated as an economic commodity, through which government can generate some revenue. But water privatization is not advocated; the reasoning being that water is too vital an element and should remain in the hands of the government. The poor should not be denied access though, because they cannot pay for it. Government should subsidize for the poor, which is to say they should pay a token (not full) rate for water. Afterall, the poor do pay for GSM recharge cards without subsidy from anybody. The PVP Option The Local Government councils are encouraged to embrace this environmentally friendly technology of providing water to their communities, utilizing the abundant, free and inexhaustible solar energy. Technicians will be trained in the installation, operation and maintenance of the system which is not difficult in any way. The communities will be involved and made to view the project as actually their own. The local governments can utilize this technology to improve on the standard of living of their people and remove poverty from them who constitute the bulk of the entire population. Social Capital It must be stated that, with all necessary funding and all necessary suggestions they stand to take us to nowhere near the targets without that culture of universal virtues. Virtues of common good, transparency, patriotism and the like. The truth is that monumental deficit in these virtues does bestride and straddle the nation precariously. It is lack of these virtues that is behind pilfering of water budgets, deliberately running down the country’s refining capacity in order to partake in the lucrative import of fuels, deliberately running down the country’s power generation capacity and so on. We must learn to imbibe the culture of accountability, and be paragons of these virtues in order to make any meaning progress.
References Constitution of the Federal Republic of Nigeria, 1999. Part 1, Section 7. Mustafa, S. and Yusuf, M. I. (2013). A textbook of hydrology and water resources. Revised ed. Nelson, D. (1999). Environmental Science, a global concern (5th ed.) New York: McGraw-Hill. Pickering, K. T. and Owen, L. A. (1995). Global environmental issues. London: Butler and Tanner Ltd. WaterAid Nigeria (2011). Country Programme Strategy for 2006-2011. UNICEF (2004). Water Supply in the Rural Areas of Nigeria.
CHARACTERIZATION OF CHEMICAL PROCESSES INVOLVED IN OZONE DEPLETION
Asira, Enim Enim
Department Of Chemistry,College Of Education, Akamkpa - Cross River State,Nigeria
ABSTRACT
The earth’s carrying capacity to support human life has been overstretched by increasing need to meet food requirements, consumption of resources; amount of waste generation and choice of technologies. These activities release into the atmosphere, chemical constituents of varied concentrations. When these chemicals enter into the atmosphere, they are subjected to various transformations that yield products or intermediates that tend to alter atmospheric chemical balance. In recent years, the global problem of ozone depletion has underscored the danger of overstepping earth’s ability to absorb waste products. This study therefore, focuses on the various chemical reactions involved in ozone depletion and the effects of ozone layer depletion on plant, animals, materials and climate. Key words: Atmosphere, ozone, depletion, processes and effects.
INTRODUCTION
It takes no stretch of imagination to see that human species are agents of earth proportion. In our effort to make the earth yield more food for ourselves, we constantly diminish earth’s ability to sustain life of all kinds. The earth’s capacity to support humans is determined by our most basic food requirements, levels of consumption of resources, by the amount of waste generated, technology choices and our success at mobilizing to deal with major threats. One of the global problems that has of late underscored the danger of overstepping the earth’s ability to absorb waste products is ozone depletion on daily basis, waste products are constantly emitted into the atmosphere through natural and anthropogenic activities carried out on the earth. Some of these waste products destroy the ozone layer. Ozone is a triatomic molecule which is blue in colour and has a characteristic pungent smell. Under average condition, at ground level, each cm of air contains about 0.1% of ozone (Santra 2012). It occurs in significant amount (710ppm) in the lower stratosphere. High level of ozone is generally observed during hot, still sunny, weather where air mass has previously collected emission of hydrocarbons (NOx). Ozone destructions are also dependent on geographical locations. For example, 4% of ozone destruction is in the tropics, 9% in the temperate zones and 14% in the Polar Regions (Bhatia, 2006). The decrease in rainfall level and increasing draughts in the world indicate that ozone depletion and global warming has taken place. The aim of this study is focus on the characterization chemical processes involved in ozone layer depletion. The specific objective is to explain the various effects of ozone layer depletion on humans, plants, materials and animals.

FORMATION OF OZONE The formation of ozone in the troposphere is contributed by two sources: 1. Downward movement from the stratosphere 2. Direct photochemical production within the troposphere Downward Movement: The NOx from stratosphere abstract energy in the UV radiation range <430 nm from the sun light and dissociated to give NO and reactive oxygen atom (O*). The reactive oxygen atom then reacts with oxygen gas at the troposphere to produce ozone molecule NO2 + hv = NO + O* O2 + O2 tm = O3 + m DIRECT PHOTO CHEMICAL PRODUCTION OF OZONE Above 50cm (60-80xm), molecule oxygen, O2 absorbs energy at <240nm, and dissociates to form atomic oxygen, O* O2 hv O* + O* 240nm Molecular oxygen (O2) in upper stratosphere absorbs UV radiation (<240nm) to form ozone O2(g) + O + M hv O3 + M (<240nm) The presence of ozone in the atmosphere shields living being on earth from the ecological harmful effects. High level of ozone destroys rubber due to its weak 0-0 bond and affects bronchial function and w toxic to plant and vegetation due to production of harmful intermediates (oxidants). OZONE DEPLETION CHEMICAL PROCESSES Ozone depletion is simply the destruction of ozone layer in the stratosphere. The relative concentration of NO2 and O3 determine whether the destruction or generation of ozone takes place (Naranyanan, 2009). In general, there are three principal ways of ozone (O3) depletion: - Hydrogen system (OH System) - Nitrogen system (NO2 system) - Chlorine system (CFCl3 wCF2cl2 system) OH SYSTEM This system destroys only 10% of O3 and the reaction occur above 40km over the earth crust. Water vapour in the atmosphere react with the oxygen atom (O*) produced by photochemical dissociation to yield hydroxyl group. The hydroxide in turn, reacts with ozone to form water and oxygen molecule.
H2O(g) + O* (ID) = 20H OH + O3 = H2O + O2(g)
H2O(g) + O* = OH + O2
Net: O* + O3 = 202(g)
This can as well be formed from oxidation of methane (CH4). CH4(g) + O* (ID) = CH3 + OH NITROGEN SYSTEM (NO2 SYSTEM) Sixty percent ozone destruction occurs through N2O system. The N2O produced by bacterial action of micro organism in ocean and soil (denitrification) diffuses upwards from troposphere to stratosphere where its reacts with O* in the presence of light to produce NO, which then destroys ozone. The detailed reaction is expressed below:
NO2 + O* (ID) = 2NO N2O + hv = NO + O* NO + O3 = NO2 + O2 NO2 + O* = NO + O2
Net: O3 +O = 202 CHLORINE SYSTEM (CFCl3 or CF2 Cl2 SYSTEM) Neutral chlorine contributes only very little to ozone destruction. The main sources of chloro species are chloro fluoro carbons, (CFCs) from fire extinguisher, perfumes, air conditioners, aluminum industries and plants that produce rubber. These compounds are inert in the troposphere but become disassociated in stratosphere.
CFCl3 + CF2Cl2 hv Cl2(g) 180-220nm
Cl2 hv Cl + Cl Cl’ + O3 = ClO + O2(g)
CLO + O* = Cl + O2 Net: O + O3 = 202(g) EFFECTS OF OZONE LAYER DEPLETION Correlation between the attendant increase in UV-B and estimated ozone loss may affect rate of skin cancer. EPA suggested that every 1% decrease of ozone column will result in 3% rise in incidence of non-melanoma. Besides, enhanced levels of UV-B has the direct harmful effects on humans in the following ways below: - It suppresses the body immune responses - It causes damage to the eyes, especially in the development of cataracts. TERRESTIAL PLANTS Plants are mostly adapted to some level of visible radiation. But two thirds have been found to be sensitive to UV-B radiation (Narayanan, 2009) sensitive plants show reduced growth and smaller leaves unable to photosynthesize as efficient as others. Such plants are affected as
- They yield small amount of seeds or fruits - They show changes in chemical composition, which affects food quality - Upset the delicate balance in natural ecosystem thus changing the dissolution and balance of
plants. CLIMATE: Ozone cycles through its round of creation and destruction. The overall absorption of radiations is dumped as heat in the stratosphere. Any depletion of stratospheric ozone is predicted to cool the region, hence changes the temperature structure of the atmosphere to some extent. CONCLUSION Natural and anthropogenic activities on earth are constantly emitting chemical wastes into the atmosphere. These chemical wastes in the atmosphere undergo various chemical processes that tent to produce intermediates that ultimately lead to ozone formation and destruction. Ozone molecule in the atmosphere no doubt serves the purpose of blanketing the earth surface from the harmful effects uv radiations. However, it depletion through various chemical process stated in this study, has greatly impacted negatively on humans, animals, plants and climate. The understanding of the source of chemical wastes that destroy ozone layer and cascade of chemical processes involved in ozone depletion become apt and imperative in the choice of technologies to be employed in monitoring and remediation of atmosphere ozone depletion. REFERENCES
Bhatia, S. C. (2006). Environmental Chemistry. CBS Publisher. New Delhi. Bridgman, H. (1991). Global Air Pollutants: problems for the 1990s. New York. Belhaven Press. O’Neal, P. (1983). “Environmental Chemistry” (2nd edn). Santra, S. C. (2012). Environmental Science. New central book publisher (p) Ltd. Kolkara. Singer, S. F. (ed) (1990). “Global effects of Environmental Pollution. Springerverlag. New York
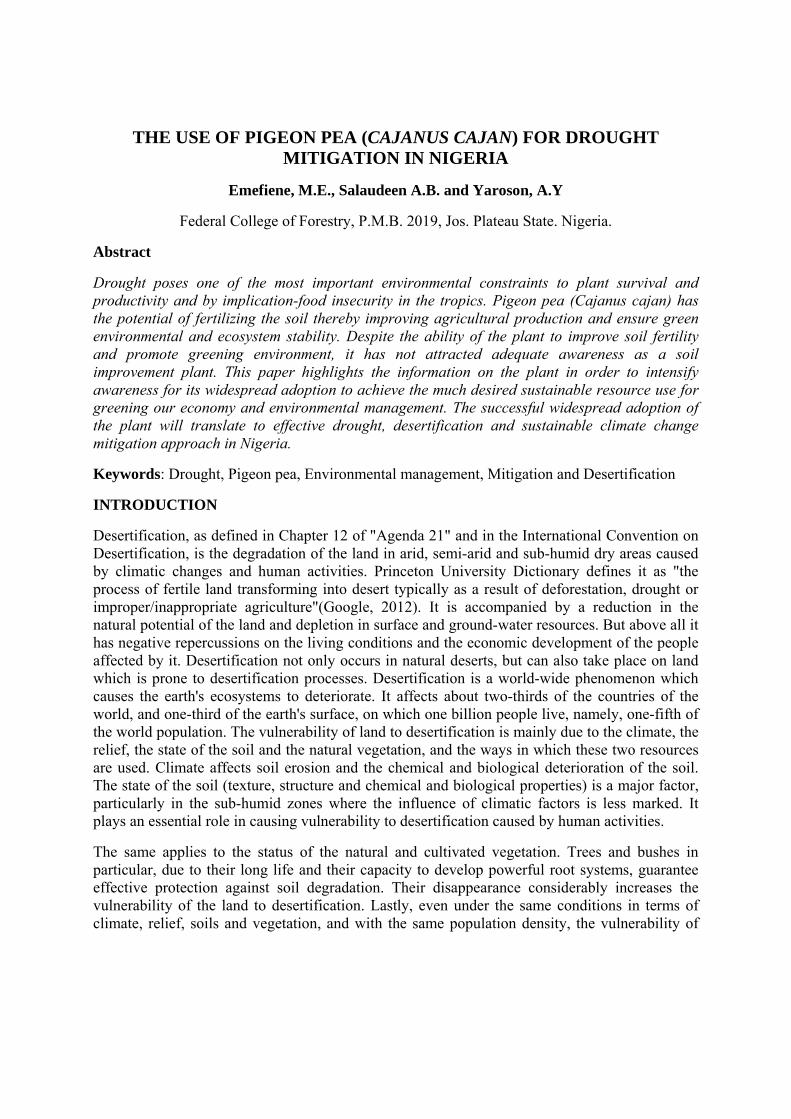
THE USE OF PIGEON PEA (CAJANUS CAJAN) FOR DROUGHT MITIGATION IN NIGERIA
Emefiene, M.E., Salaudeen A.B. and Yaroson, A.Y
Federal College of Forestry, P.M.B. 2019, Jos. Plateau State. Nigeria.
Abstract
Drought poses one of the most important environmental constraints to plant survival and productivity and by implication-food insecurity in the tropics. Pigeon pea (Cajanus cajan) has the potential of fertilizing the soil thereby improving agricultural production and ensure green environmental and ecosystem stability. Despite the ability of the plant to improve soil fertility and promote greening environment, it has not attracted adequate awareness as a soil improvement plant. This paper highlights the information on the plant in order to intensify awareness for its widespread adoption to achieve the much desired sustainable resource use for greening our economy and environmental management. The successful widespread adoption of the plant will translate to effective drought, desertification and sustainable climate change mitigation approach in Nigeria.
Keywords: Drought, Pigeon pea, Environmental management, Mitigation and Desertification
INTRODUCTION
Desertification, as defined in Chapter 12 of "Agenda 21" and in the International Convention on Desertification, is the degradation of the land in arid, semi-arid and sub-humid dry areas caused by climatic changes and human activities. Princeton University Dictionary defines it as "the process of fertile land transforming into desert typically as a result of deforestation, drought or improper/inappropriate agriculture"(Google, 2012). It is accompanied by a reduction in the natural potential of the land and depletion in surface and ground-water resources. But above all it has negative repercussions on the living conditions and the economic development of the people affected by it. Desertification not only occurs in natural deserts, but can also take place on land which is prone to desertification processes. Desertification is a world-wide phenomenon which causes the earth's ecosystems to deteriorate. It affects about two-thirds of the countries of the world, and one-third of the earth's surface, on which one billion people live, namely, one-fifth of the world population. The vulnerability of land to desertification is mainly due to the climate, the relief, the state of the soil and the natural vegetation, and the ways in which these two resources are used. Climate affects soil erosion and the chemical and biological deterioration of the soil. The state of the soil (texture, structure and chemical and biological properties) is a major factor, particularly in the sub-humid zones where the influence of climatic factors is less marked. It plays an essential role in causing vulnerability to desertification caused by human activities.
The same applies to the status of the natural and cultivated vegetation. Trees and bushes in particular, due to their long life and their capacity to develop powerful root systems, guarantee effective protection against soil degradation. Their disappearance considerably increases the vulnerability of the land to desertification. Lastly, even under the same conditions in terms of climate, relief, soils and vegetation, and with the same population density, the vulnerability of

the land to desertification will vary widely depending on the way in which the natural resources are used by the human communities and their livestock.
Droughts occur frequently in the areas affected by desertification, and are generally a feature of their natural climate. The relations between desertification and drought on the one hand, and human influence on the other, are complex. Occasional droughts (due to seasonal or inter-year variations in rainfall) and long-term droughts covering wide areas are both caused or aggravated by the influence of man on the environment (the reduction in vegetation cover, the change in the Albedo effect, changes in the local climate, the greenhouse effect, etc.). Human influence can also hasten desertification and aggravate the negative consequences on man. But the degradation of land due to desertification has a serious compounding effect on drought, and thereby reduces the chances of the local people to cope with difficult periods.
Climatic changes are both a consequence and a cause of desertification. The destruction of the natural grass and woody vegetation cover in dry areas affects the topsoil temperature and the air humidity and consequently influences the movements of atmospheric masses and rainfall. Furthermore, the drying of the soils and the destruction of soil cover encourage air erosion.
Even though the cycles of drought years and climatic changes can contribute to the advance of desertification, it is mainly caused by changes in the ways man uses the natural resources, mainly by over-grazing, land clearance, over-cropping cultivated land and wood formations and more generally using land in a way that is inappropriate for the local conditions. Human activities connected with agriculture, livestock and forestry production vary widely from one country and from one type of society to another, as do the strategies for land-use and the technologies employed.
In many cases, traditional and durable rain fed agricultural methods (food crops and alternating fallow) and ancestral pastoral practices are no longer suitable under present-day conditions. Strong demographic pressure has increased the demand on land resources, and this is aggravated when cash-crop farming spreads to the detriment of subsistence farming and to the detriment of the rangelands used by nomadic peoples. However, the impact of human societies on natural resources does not depend solely on the demographic density, and the notions of "load capacity" and "critical threshold" must be handled with great care. Many examples demonstrate that these criteria can vary enormously, depending upon the strategies and the technologies used by the people.
The seriousness of desertification depends on factors which vary from one region, country or year to another. These factors include: the severity of the climatic conditions in the period considered (particularly in terms of the annual rainfall); population pressure and the standard of living of the people involved; the level of the country's development, and the quality of the preventive measures established there.
Pigeon pea remains one of the most drought tolerant crop (Valenzuela and Smith, 2002) and can give some grain yield during dry spells when other legumes such as field beans will have wilted and dried up (Okiror, 1986). Ability of pigeon pea to withstand severe drought better than many legumes is due to its deep roots (Flower and Landlow, 1987) and osmotic adjustment (OA) in the leaves (Subbarao, 2000). The legume maintains photosynthetic function during stress better compared to cow pea (Vigna unguicultala L. Walp) (Lopez et al, 1987).
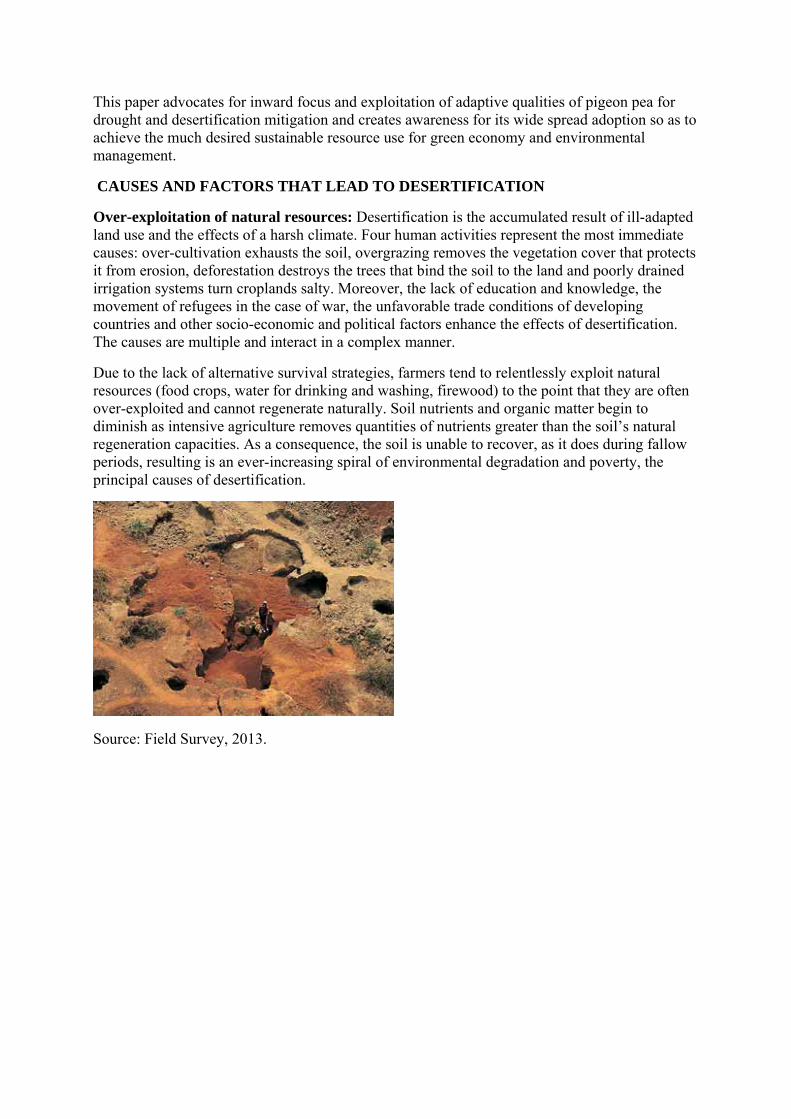
This paper advocates for inward focus and exploitation of adaptive qualities of pigeon pea for drought and desertification mitigation and creates awareness for its wide spread adoption so as to achieve the much desired sustainable resource use for green economy and environmental management.
CAUSES AND FACTORS THAT LEAD TO DESERTIFICATION
Over-exploitation of natural resources: Desertification is the accumulated result of ill-adapted land use and the effects of a harsh climate. Four human activities represent the most immediate causes: over-cultivation exhausts the soil, overgrazing removes the vegetation cover that protects it from erosion, deforestation destroys the trees that bind the soil to the land and poorly drained irrigation systems turn croplands salty. Moreover, the lack of education and knowledge, the movement of refugees in the case of war, the unfavorable trade conditions of developing countries and other socio-economic and political factors enhance the effects of desertification. The causes are multiple and interact in a complex manner.
Due to the lack of alternative survival strategies, farmers tend to relentlessly exploit natural resources (food crops, water for drinking and washing, firewood) to the point that they are often over-exploited and cannot regenerate naturally. Soil nutrients and organic matter begin to diminish as intensive agriculture removes quantities of nutrients greater than the soil’s natural regeneration capacities. As a consequence, the soil is unable to recover, as it does during fallow periods, resulting is an ever-increasing spiral of environmental degradation and poverty, the principal causes of desertification.
Source: Field Survey, 2013.
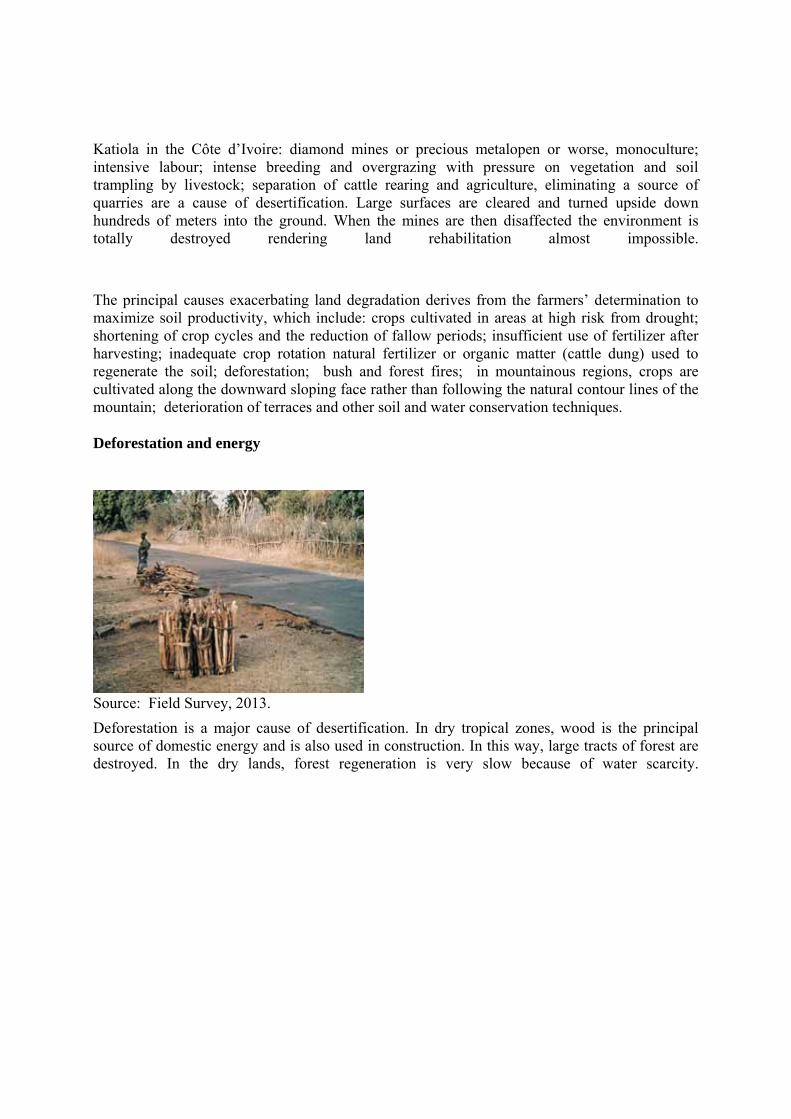
Katiola in the Côte d’Ivoire: diamond mines or precious metalopen or worse, monoculture; intensive labour; intense breeding and overgrazing with pressure on vegetation and soil trampling by livestock; separation of cattle rearing and agriculture, eliminating a source of quarries are a cause of desertification. Large surfaces are cleared and turned upside down hundreds of meters into the ground. When the mines are then disaffected the environment is totally destroyed rendering land rehabilitation almost impossible.
The principal causes exacerbating land degradation derives from the farmers’ determination to maximize soil productivity, which include: crops cultivated in areas at high risk from drought; shortening of crop cycles and the reduction of fallow periods; insufficient use of fertilizer after harvesting; inadequate crop rotation natural fertilizer or organic matter (cattle dung) used to regenerate the soil; deforestation; bush and forest fires; in mountainous regions, crops are cultivated along the downward sloping face rather than following the natural contour lines of the mountain; deterioration of terraces and other soil and water conservation techniques.
Deforestation and energy
Source: Field Survey, 2013.
Deforestation is a major cause of desertification. In dry tropical zones, wood is the principal source of domestic energy and is also used in construction. In this way, large tracts of forest are destroyed. In the dry lands, forest regeneration is very slow because of water scarcity.
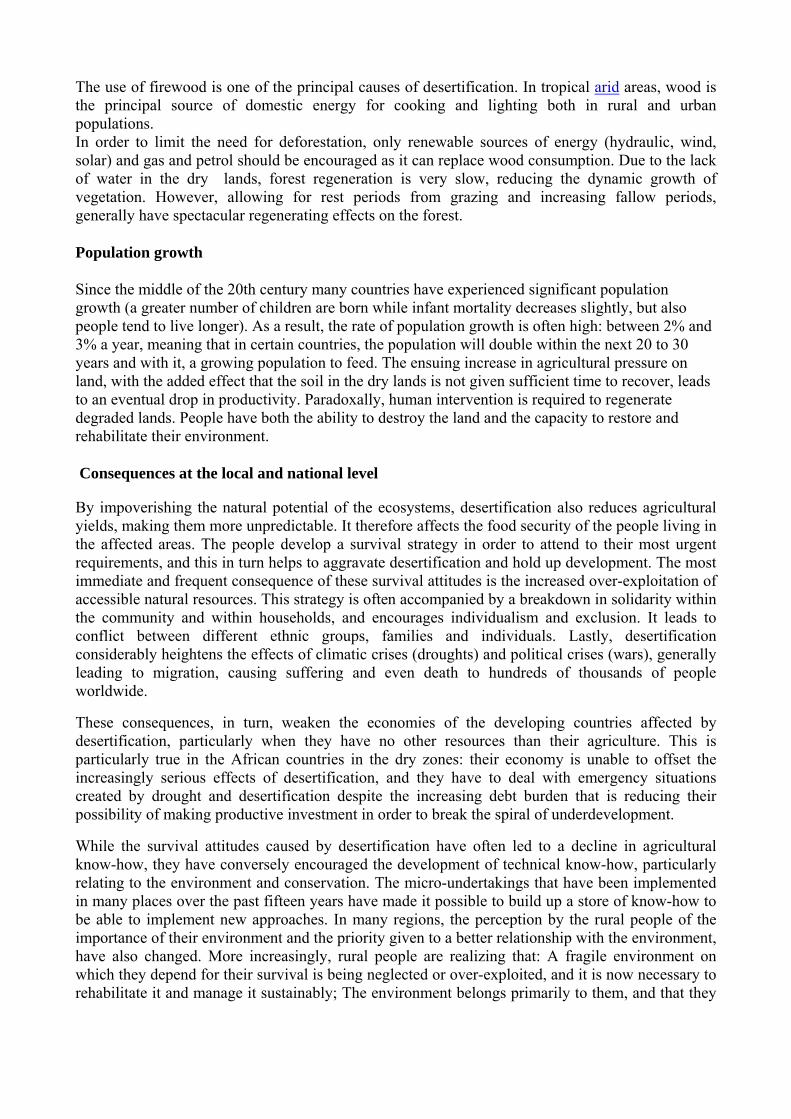
The use of firewood is one of the principal causes of desertification. In tropical arid areas, wood is the principal source of domestic energy for cooking and lighting both in rural and urban populations. In order to limit the need for deforestation, only renewable sources of energy (hydraulic, wind, solar) and gas and petrol should be encouraged as it can replace wood consumption. Due to the lack of water in the dry lands, forest regeneration is very slow, reducing the dynamic growth of vegetation. However, allowing for rest periods from grazing and increasing fallow periods, generally have spectacular regenerating effects on the forest.
Population growth
Since the middle of the 20th century many countries have experienced significant population growth (a greater number of children are born while infant mortality decreases slightly, but also people tend to live longer). As a result, the rate of population growth is often high: between 2% and 3% a year, meaning that in certain countries, the population will double within the next 20 to 30 years and with it, a growing population to feed. The ensuing increase in agricultural pressure on land, with the added effect that the soil in the dry lands is not given sufficient time to recover, leads to an eventual drop in productivity. Paradoxally, human intervention is required to regenerate degraded lands. People have both the ability to destroy the land and the capacity to restore and rehabilitate their environment.
Consequences at the local and national level
By impoverishing the natural potential of the ecosystems, desertification also reduces agricultural yields, making them more unpredictable. It therefore affects the food security of the people living in the affected areas. The people develop a survival strategy in order to attend to their most urgent requirements, and this in turn helps to aggravate desertification and hold up development. The most immediate and frequent consequence of these survival attitudes is the increased over-exploitation of accessible natural resources. This strategy is often accompanied by a breakdown in solidarity within the community and within households, and encourages individualism and exclusion. It leads to conflict between different ethnic groups, families and individuals. Lastly, desertification considerably heightens the effects of climatic crises (droughts) and political crises (wars), generally leading to migration, causing suffering and even death to hundreds of thousands of people worldwide.
These consequences, in turn, weaken the economies of the developing countries affected by desertification, particularly when they have no other resources than their agriculture. This is particularly true in the African countries in the dry zones: their economy is unable to offset the increasingly serious effects of desertification, and they have to deal with emergency situations created by drought and desertification despite the increasing debt burden that is reducing their possibility of making productive investment in order to break the spiral of underdevelopment.
While the survival attitudes caused by desertification have often led to a decline in agricultural know-how, they have conversely encouraged the development of technical know-how, particularly relating to the environment and conservation. The micro-undertakings that have been implemented in many places over the past fifteen years have made it possible to build up a store of know-how to be able to implement new approaches. In many regions, the perception by the rural people of the importance of their environment and the priority given to a better relationship with the environment, have also changed. More increasingly, rural people are realizing that: A fragile environment on which they depend for their survival is being neglected or over-exploited, and it is now necessary to rehabilitate it and manage it sustainably; The environment belongs primarily to them, and that they
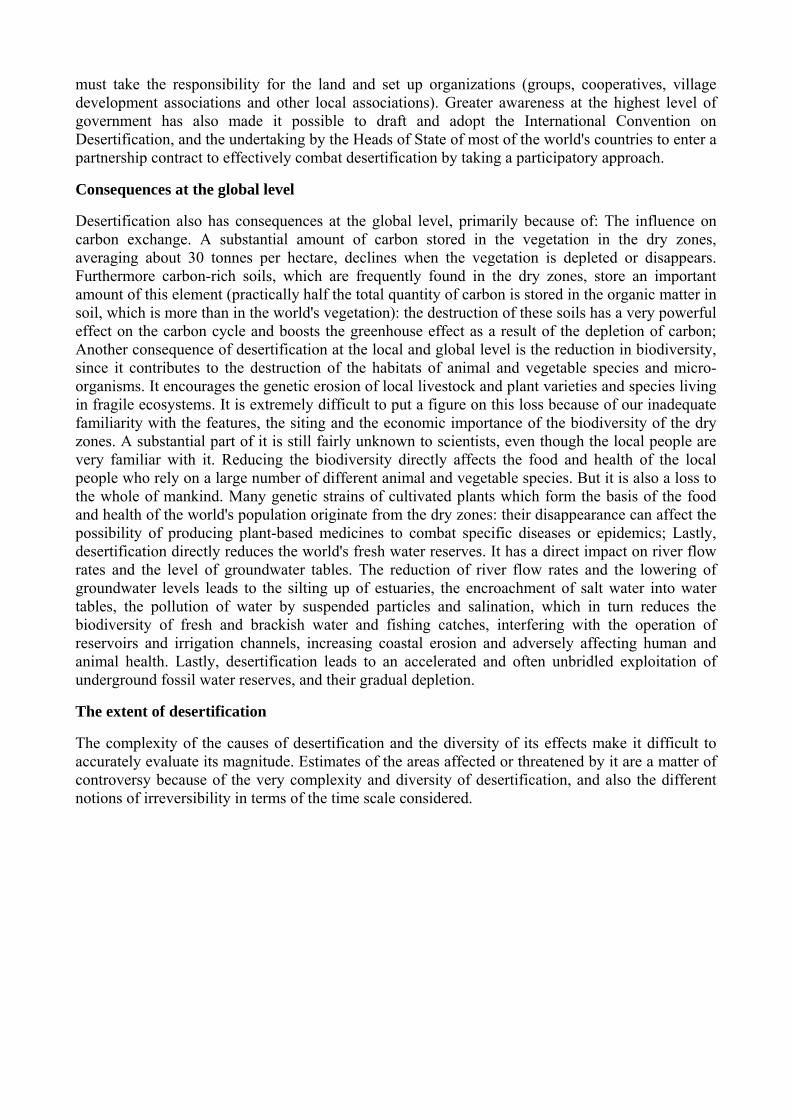
must take the responsibility for the land and set up organizations (groups, cooperatives, village development associations and other local associations). Greater awareness at the highest level of government has also made it possible to draft and adopt the International Convention on Desertification, and the undertaking by the Heads of State of most of the world's countries to enter a partnership contract to effectively combat desertification by taking a participatory approach.
Consequences at the global level
Desertification also has consequences at the global level, primarily because of: The influence on carbon exchange. A substantial amount of carbon stored in the vegetation in the dry zones, averaging about 30 tonnes per hectare, declines when the vegetation is depleted or disappears. Furthermore carbon-rich soils, which are frequently found in the dry zones, store an important amount of this element (practically half the total quantity of carbon is stored in the organic matter in soil, which is more than in the world's vegetation): the destruction of these soils has a very powerful effect on the carbon cycle and boosts the greenhouse effect as a result of the depletion of carbon; Another consequence of desertification at the local and global level is the reduction in biodiversity, since it contributes to the destruction of the habitats of animal and vegetable species and micro-organisms. It encourages the genetic erosion of local livestock and plant varieties and species living in fragile ecosystems. It is extremely difficult to put a figure on this loss because of our inadequate familiarity with the features, the siting and the economic importance of the biodiversity of the dry zones. A substantial part of it is still fairly unknown to scientists, even though the local people are very familiar with it. Reducing the biodiversity directly affects the food and health of the local people who rely on a large number of different animal and vegetable species. But it is also a loss to the whole of mankind. Many genetic strains of cultivated plants which form the basis of the food and health of the world's population originate from the dry zones: their disappearance can affect the possibility of producing plant-based medicines to combat specific diseases or epidemics; Lastly, desertification directly reduces the world's fresh water reserves. It has a direct impact on river flow rates and the level of groundwater tables. The reduction of river flow rates and the lowering of groundwater levels leads to the silting up of estuaries, the encroachment of salt water into water tables, the pollution of water by suspended particles and salination, which in turn reduces the biodiversity of fresh and brackish water and fishing catches, interfering with the operation of reservoirs and irrigation channels, increasing coastal erosion and adversely affecting human and animal health. Lastly, desertification leads to an accelerated and often unbridled exploitation of underground fossil water reserves, and their gradual depletion.
The extent of desertification
The complexity of the causes of desertification and the diversity of its effects make it difficult to accurately evaluate its magnitude. Estimates of the areas affected or threatened by it are a matter of controversy because of the very complexity and diversity of desertification, and also the different notions of irreversibility in terms of the time scale considered.
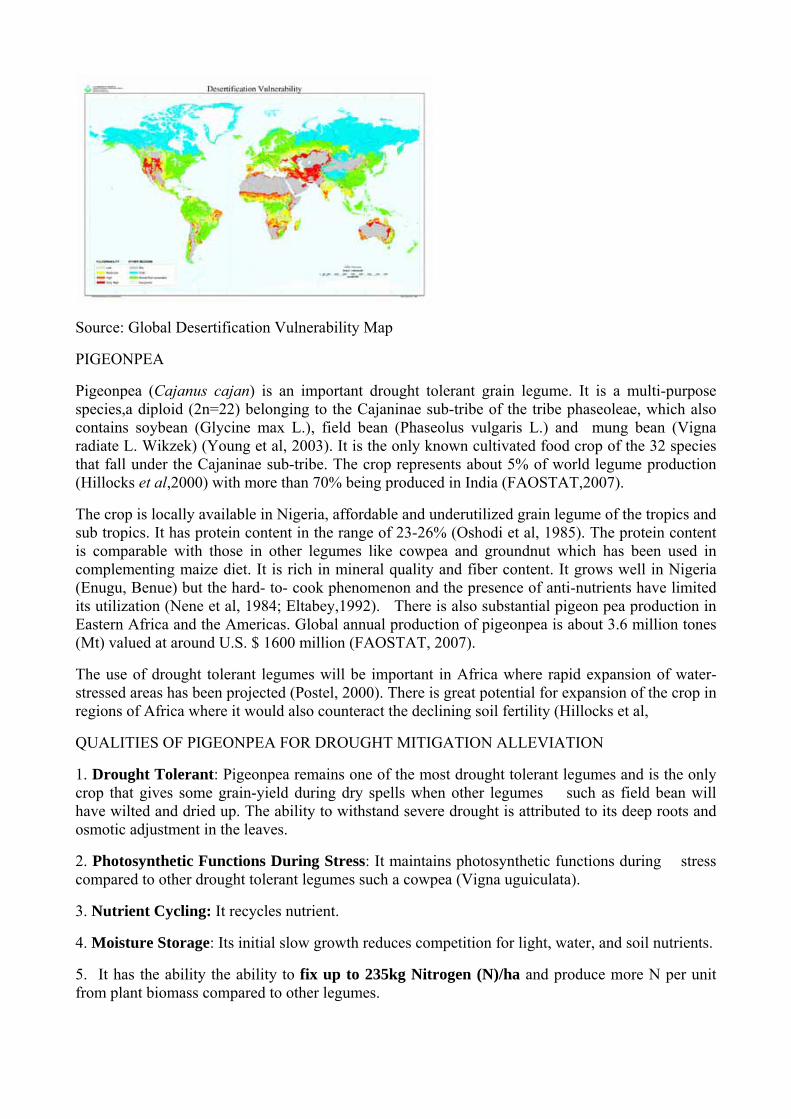
Source: Global Desertification Vulnerability Map
PIGEONPEA
Pigeonpea (Cajanus cajan) is an important drought tolerant grain legume. It is a multi-purpose species,a diploid (2n=22) belonging to the Cajaninae sub-tribe of the tribe phaseoleae, which also contains soybean (Glycine max L.), field bean (Phaseolus vulgaris L.) and mung bean (Vigna radiate L. Wikzek) (Young et al, 2003). It is the only known cultivated food crop of the 32 species that fall under the Cajaninae sub-tribe. The crop represents about 5% of world legume production (Hillocks et al,2000) with more than 70% being produced in India (FAOSTAT,2007).
The crop is locally available in Nigeria, affordable and underutilized grain legume of the tropics and sub tropics. It has protein content in the range of 23-26% (Oshodi et al, 1985). The protein content is comparable with those in other legumes like cowpea and groundnut which has been used in complementing maize diet. It is rich in mineral quality and fiber content. It grows well in Nigeria (Enugu, Benue) but the hard- to- cook phenomenon and the presence of anti-nutrients have limited its utilization (Nene et al, 1984; Eltabey,1992). There is also substantial pigeon pea production in Eastern Africa and the Americas. Global annual production of pigeonpea is about 3.6 million tones (Mt) valued at around U.S. $ 1600 million (FAOSTAT, 2007).
The use of drought tolerant legumes will be important in Africa where rapid expansion of water-stressed areas has been projected (Postel, 2000). There is great potential for expansion of the crop in regions of Africa where it would also counteract the declining soil fertility (Hillocks et al,
QUALITIES OF PIGEONPEA FOR DROUGHT MITIGATION ALLEVIATION
1. Drought Tolerant: Pigeonpea remains one of the most drought tolerant legumes and is the only crop that gives some grain-yield during dry spells when other legumes such as field bean will have wilted and dried up. The ability to withstand severe drought is attributed to its deep roots and osmotic adjustment in the leaves.
2. Photosynthetic Functions During Stress: It maintains photosynthetic functions during stress compared to other drought tolerant legumes such a cowpea (Vigna uguiculata).
3. Nutrient Cycling: It recycles nutrient.
4. Moisture Storage: Its initial slow growth reduces competition for light, water, and soil nutrients.
5. It has the ability the ability to fix up to 235kg Nitrogen (N)/ha and produce more N per unit from plant biomass compared to other legumes.
BENEFITS OF PIGEON PEA
Nutrient recycling; Moisture storage; Highly nutritious for consumption; Good source of amino acids; Green manure crop; Fodder and forage crop; Medicinal; Food supplement and Weed control.
DROUGHT, VULNERABILITY, ADAPTATION AND MITIGATION
Drought is natural part of climate that affects nearly every region on earth (Wilhite, 2000; Wilhite and Buchanan, 2005). Although specific definitions of drought may vary by sector and region, drought generally originates from a deficiency of precipitation over an extended period of time, resulting in a water shortage for some activity, group, or environmental sector.
Vulnerability refers to the potential to be adversely affected by an event or change. The extent to which drought may damage or harm a system depends on the level of exposure, the systems sensitivity and ability to adapt to new conditions. Vulnerability therefore, is a function of exposure, sensitivity and adaptive capacity which may be considered at many levels including individual, household and nationally (Orinde et al, 2006). According to the Nigerian Maritime Administration and Safety Agency (NIMASA, 1999) poor people are mostly vulnerable to deviations from the average climatic conditions such as prolonged drought and national disasters such as floods. Currently, Nigeria is experiencing adverse climatic conditions with negative impacts on the welfare of millions of peoples as a result of persistent droughts and flooding. Off season rains and dry spell have sent growing up and rivers flow in the arid and Sub-Saharan regions reducing, which results in fewer water supplies for agriculture, hydroelectric power generation and other uses.
Mitigation means actions that we can take before or at the beginning of drought to help reduce the impacts of drought. Mitigating drought involves a wide range of agricultural practices including finding additional water supplies and conserving water that is already available. However, it is not enough to make drought plans based only on agricultural practices. There are many other strategies at government level that are just as important. It is important to realize that we will not be able to defend drought overnight. Some of these strategies will take time to implement an d to see the result. We continually need to plan and to follow the plans in order to prevent drought from having devastating impact on life.
STRATEGIES FOR MITIGATING DROUGHT:
The Crop based strategies for mitigating drought are: Land planning system; Soil management techniques; Crop management techniques; Integrated watershed management; Other water management technique; Other practices
Land planning systems: Some lands can only sustain limited cultivation because they are prone to drought. These are best used for alternate uses rather than normal food grain crops. Land-use systems give stability to dry land production systems and also make good use of the land and rainfall during the off-season.
Some examples of alternate crops you can grow are: Growing of short duration legume crops; Establishing perennial grasses for livestock farming; Agroforestry or silvipasture practices.
Soil management techniques: Tillage during the off-season or in pre-rainy season, helps with rain water intake by breaking the hard soil and making the soil surface more permeable; This allows water to seep to the deeper soil layers and keeps the soil wet for longer time; The result is the soil will have more moisture during sowing the crop; Tillage also controls weeds which depletes the soil moisture; Off-season tillage also destroys the effs, cocoons and larvae of some pests by exposing them to the sun which otherwise affect the already stressed crop plants.

Crop management techniques:
Selection of Crops: Avoid growing of drought prone crops like maize, cotton etc; Growing drought resistant grain crops like sorghum, pearl millet, finger millet, fox tail millet etc. Growing drought resistant legume crops like pigeonpea, green gram, horse gram etc; Growing of oil seed crops like castor, sunflower, niger, sesame, safflower etc.
Intercropping practices: Intercropping refers to growing more than one crop in the same land area in rows of definite proportion and pattern. Intercropping system provides insurance against total crop failure in drought prone areas. A few examples of suitable intercropping systems under drought are: Sorghum and Pigeonpea; Pearl millet and Pigeonpea; Pearl millet and Cowpea; Sunflower and Horse gram
Plant Density: It is important to keep optimum plant population and row spacing. Generally wider plant spacing is preferred in drought prone areas. There is need for carefulness not to space the plants too widely. This will not use available soil moisture to the capacity.
Weed management: Weeds compete with crops for soil moisture and nutrients; Weeds also hosts some pests and diseases and these will migrate and affect the crops which are already under stress under drought conditions; So, good weed control from the early stages of crops is essential in drought areas.
Surface Mulching: Surface mulching either by timely inter cultivation or by covering the soil surface with plant residues benefits the crops; Reduce water evaporation from soil; Reduces water runoffs from the cropped fields; Help control weeds; Adds organic matter to the soil and improves soil quality.
Integrated Nutrient Management (INM): INM takes care of physical, chemical and biological needs of the soil. It meets the nutrient needs of the soil from the use of organic and inorganic fertilizers.
Benefits of INM: Increases water holding capacity of the soil; Increases the amount of nutrients in the soil; Make the soil more resistant to diseases; Make the soil better able to withstand drought.
Integrated Water Management (IWM): IWM is the efficient way to continually manage land and water resources in the drought prone areas. The focus of IWM is conservation and efficient way of using rain water. IWM combines several approaches to minimize the risk of drought.
These approaches are: Soil and water conservation; Rain water harvesting; Efficient land and crop management
Other Water management techniques: Every drop of water will make a difference during drought and so efficient conservation of rain water is key to mitigate drought. The different methods of conserving water are: Building masonry storage tanks and broken embankments in community ponds and reservoirs; Building earth percolation ponds and reservoirs; Desilting all water storage structures; Building check dams; Rooftop rain water harvesting.
CONSTRAINTS :Despite the modernization of observation facilities by the use of satellite imagery and computers to analyze the data, there are still many uncertainties at the global, regional and national level on the causes, the extent and the seriousness of desertification. For those who manage natural resources, these uncertainties prevent them from planning properly. They also introduce constraints on the operation of early warning systems with regard to agricultural production and disasters such as grasshopper infestations.
RECOMMENDATION
Above all, at the national and local level information is urgently necessary. The results of high spatial and spectrum resolution satellite images such as SPOT or Landsat images, combined with high-frequency low resolution satellite data such as Meteosat and NOAA data, can be used by the geographic information systems and completed by the results obtained from the new methods of collecting soil data using navigation satellites (GPS). These methods, whose development supported by FAO, would make it possible to observe, evaluate and monitor both the bio-physical and the socio-economic aspects of desertification.
Drought must be addressed in an integrated fashion with the other themes of the current Commission on Sustainable Development cycle, considering social, economic and environmental aspects. Strategies for drought management, including contingency planning should be incorporated into sustainable agricultural practices, soil conservation, crop diversification and integrated water resources management and combating desertification, taking into account the legal framework and mandate of the United Nations Convention to Combat Desertification and its role in mitigating the effects of drought.
CONCLUSION
This paper thus advocates pigeon-pea as an important crop with great potential for success in Nigeria. Increased production of pigeonpea can do much towards greening our economy and environment and address food crisis in Nigeria. The great potentials in marketing organic pigeonpea will go a long way to boost international markets. Local consumption of pigeon pea by Nigerians must be encouraged by introducing its use in various forms and creating awareness of its nutritional, green economy, drought mitigation and environmental management benefits.
REFERENCES
Agona, J.A., Muyinza, H. (2005). Promotion improved handling, processing, utilization and marketing of pigeonpea in Apec district. Technical Report. United Kingdom. Department for International Development (DFID)-The National Agricultural Research Development (NARD). Client Oriented Research Fund (CORF) (2006)Project.
Atachi, P., Machi, B.(2004). Intercropping cowpea with pigeonpea in an integrated pest management system in South Benin Annales des Scinces Agronomiques du Benin, 6(2):1-2.
Google Dictionary (2012).
ICRSAT (2013). http://vasat.icrisat.org/How can we mitigate drought_a virtual coalition to mitigate drought preparedness.htm.
Whilhite, D. A.(2000). Drought as a natural hazard: Concepts and definitions. In: Drought: A Global Assessment, Vol.1, Whilhte, D.A. (ed). Routledge, New York, pp. 1-18.
Whilhite, D. A. and Buchanan, M. (2005). Drought s hazard: Understanding the natural and social context. In: Drought and Water Crisis: Science, Technology and Management Issues, Whilhite, D.A. (ed.). CRC.Press (Taylor amd Francis), New York, pp.3-29.
Yearbook of International Environmental Law (2011) 21 (1): 310-312. doi: 10.1093/yiel/yvs014.
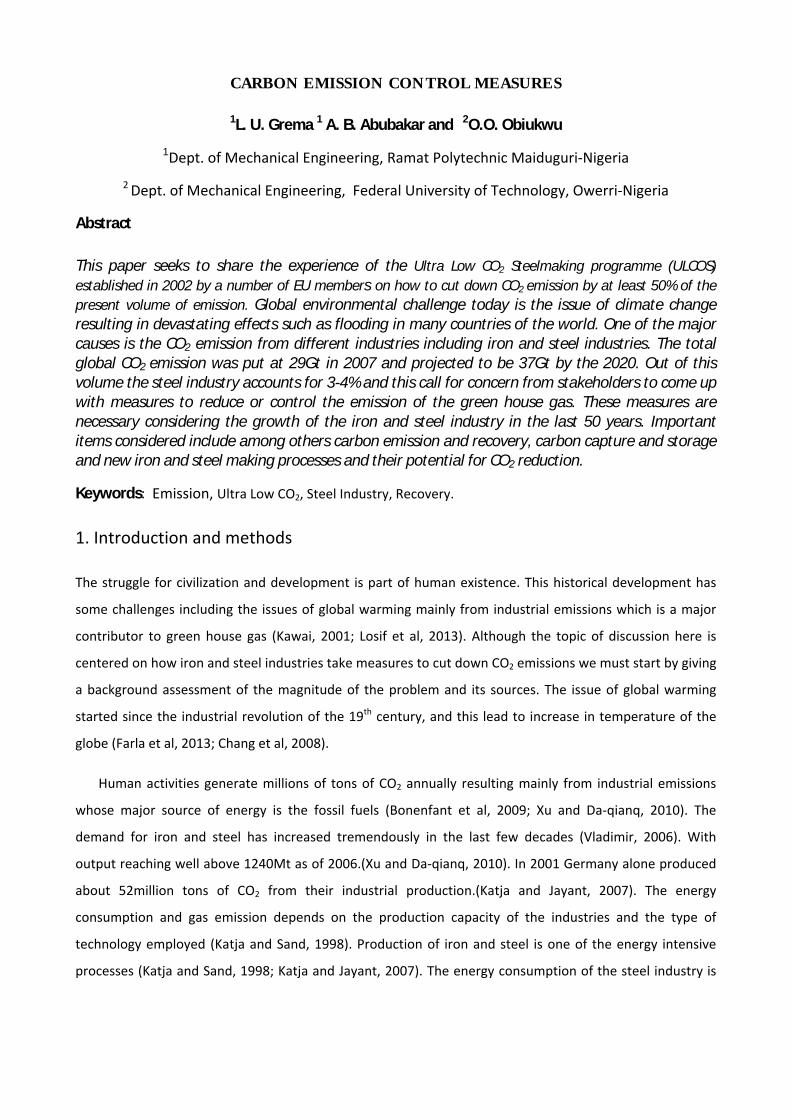
CARBON EMISSION CONTROL MEASURES
1L. U. Grema 1 A. B. Abubakar and 2O.O. Obiukwu
1Dept. of Mechanical Engineering, Ramat Polytechnic Maiduguri-Nigeria
2 Dept. of Mechanical Engineering, Federal University of Technology, Owerri-Nigeria
Abstract
This paper seeks to share the experience of the Ultra Low CO2 Steelmaking programme (ULCOS) established in 2002 by a number of EU members on how to cut down CO2 emission by at least 50% of the present volume of emission. Global environmental challenge today is the issue of climate change resulting in devastating effects such as flooding in many countries of the world. One of the major causes is the CO2 emission from different industries including iron and steel industries. The total global CO2 emission was put at 29Gt in 2007 and projected to be 37Gt by the 2020. Out of this volume the steel industry accounts for 3-4% and this call for concern from stakeholders to come up with measures to reduce or control the emission of the green house gas. These measures are necessary considering the growth of the iron and steel industry in the last 50 years. Important items considered include among others carbon emission and recovery, carbon capture and storage and new iron and steel making processes and their potential for CO2 reduction.
Keywords: Emission, Ultra Low CO2, Steel Industry, Recovery.
1. Introduction and methods
The struggle for civilization and development is part of human existence. This historical development has
some challenges including the issues of global warming mainly from industrial emissions which is a major
contributor to green house gas (Kawai, 2001; Losif et al, 2013). Although the topic of discussion here is
centered on how iron and steel industries take measures to cut down CO2 emissions we must start by giving
a background assessment of the magnitude of the problem and its sources. The issue of global warming
started since the industrial revolution of the 19th century, and this lead to increase in temperature of the
globe (Farla et al, 2013; Chang et al, 2008).
Human activities generate millions of tons of CO2 annually resulting mainly from industrial emissions
whose major source of energy is the fossil fuels (Bonenfant et al, 2009; Xu and Da-qianq, 2010). The
demand for iron and steel has increased tremendously in the last few decades (Vladimir, 2006). With
output reaching well above 1240Mt as of 2006.(Xu and Da-qianq, 2010). In 2001 Germany alone produced
about 52million tons of CO2 from their industrial production.(Katja and Jayant, 2007). The energy
consumption and gas emission depends on the production capacity of the industries and the type of
technology employed (Katja and Sand, 1998). Production of iron and steel is one of the energy intensive
processes (Katja and Sand, 1998; Katja and Jayant, 2007). The energy consumption of the steel industry is
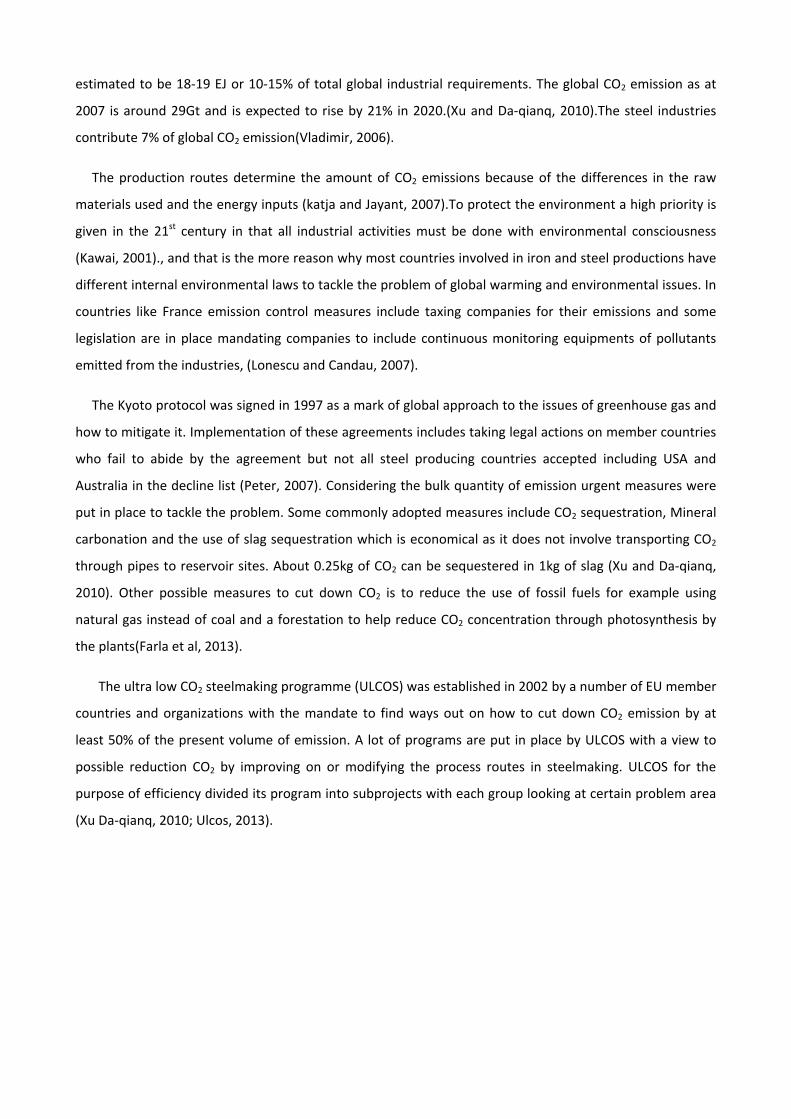
estimated to be 18-19 EJ or 10-15% of total global industrial requirements. The global CO2 emission as at
2007 is around 29Gt and is expected to rise by 21% in 2020.(Xu and Da-qianq, 2010).The steel industries
contribute 7% of global CO2 emission(Vladimir, 2006).
The production routes determine the amount of CO2 emissions because of the differences in the raw
materials used and the energy inputs (katja and Jayant, 2007).To protect the environment a high priority is
given in the 21st century in that all industrial activities must be done with environmental consciousness
(Kawai, 2001)., and that is the more reason why most countries involved in iron and steel productions have
different internal environmental laws to tackle the problem of global warming and environmental issues. In
countries like France emission control measures include taxing companies for their emissions and some
legislation are in place mandating companies to include continuous monitoring equipments of pollutants
emitted from the industries, (Lonescu and Candau, 2007).
The Kyoto protocol was signed in 1997 as a mark of global approach to the issues of greenhouse gas and
how to mitigate it. Implementation of these agreements includes taking legal actions on member countries
who fail to abide by the agreement but not all steel producing countries accepted including USA and
Australia in the decline list (Peter, 2007). Considering the bulk quantity of emission urgent measures were
put in place to tackle the problem. Some commonly adopted measures include CO2 sequestration, Mineral
carbonation and the use of slag sequestration which is economical as it does not involve transporting CO2
through pipes to reservoir sites. About 0.25kg of CO2 can be sequestered in 1kg of slag (Xu and Da-qianq,
2010). Other possible measures to cut down CO2 is to reduce the use of fossil fuels for example using
natural gas instead of coal and a forestation to help reduce CO2 concentration through photosynthesis by
the plants(Farla et al, 2013).
The ultra low CO2 steelmaking programme (ULCOS) was established in 2002 by a number of EU member
countries and organizations with the mandate to find ways out on how to cut down CO2 emission by at
least 50% of the present volume of emission. A lot of programs are put in place by ULCOS with a view to
possible reduction CO2 by improving on or modifying the process routes in steelmaking. ULCOS for the
purpose of efficiency divided its program into subprojects with each group looking at certain problem area
(Xu Da-qianq, 2010; Ulcos, 2013).
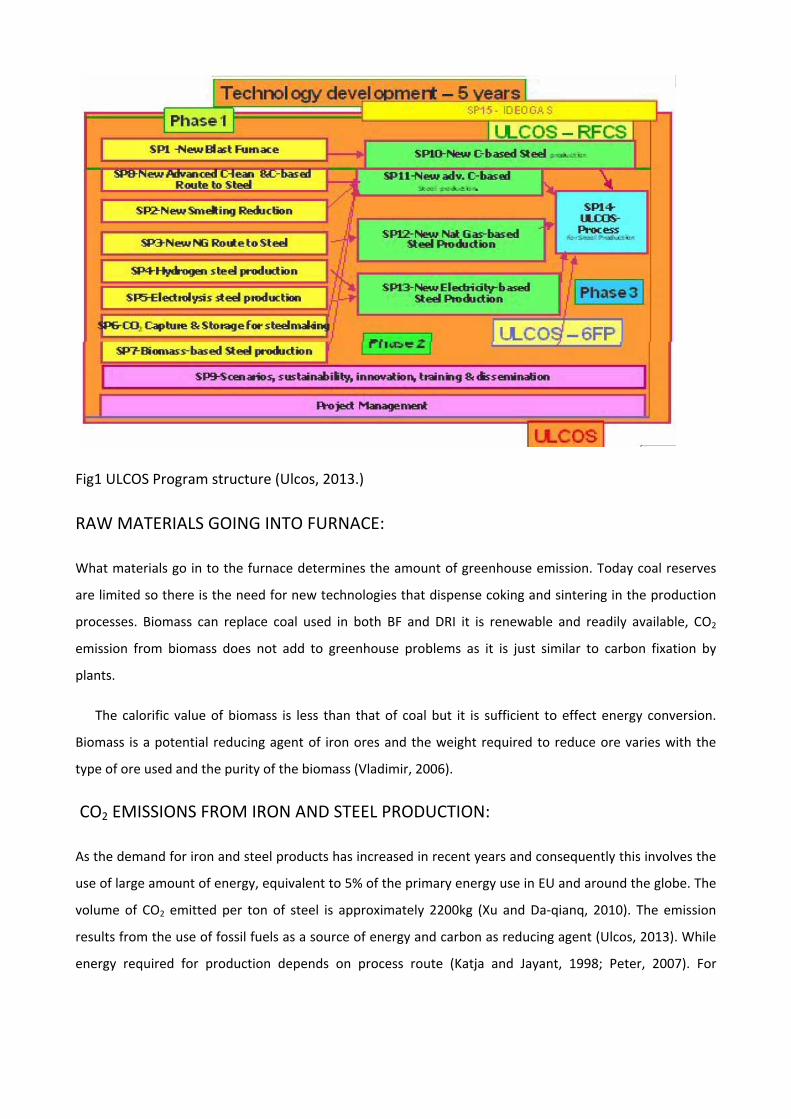
Fig1 ULCOS Program structure (Ulcos, 2013.)
RAW MATERIALS GOING INTO FURNACE:
What materials go in to the furnace determines the amount of greenhouse emission. Today coal reserves
are limited so there is the need for new technologies that dispense coking and sintering in the production
processes. Biomass can replace coal used in both BF and DRI it is renewable and readily available, CO2
emission from biomass does not add to greenhouse problems as it is just similar to carbon fixation by
plants.
The calorific value of biomass is less than that of coal but it is sufficient to effect energy conversion.
Biomass is a potential reducing agent of iron ores and the weight required to reduce ore varies with the
type of ore used and the purity of the biomass (Vladimir, 2006).
CO2 EMISSIONS FROM IRON AND STEEL PRODUCTION:
As the demand for iron and steel products has increased in recent years and consequently this involves the
use of large amount of energy, equivalent to 5% of the primary energy use in EU and around the globe. The
volume of CO2 emitted per ton of steel is approximately 2200kg (Xu and Da-qianq, 2010). The emission
results from the use of fossil fuels as a source of energy and carbon as reducing agent (Ulcos, 2013). While
energy required for production depends on process route (Katja and Jayant, 1998; Peter, 2007). For
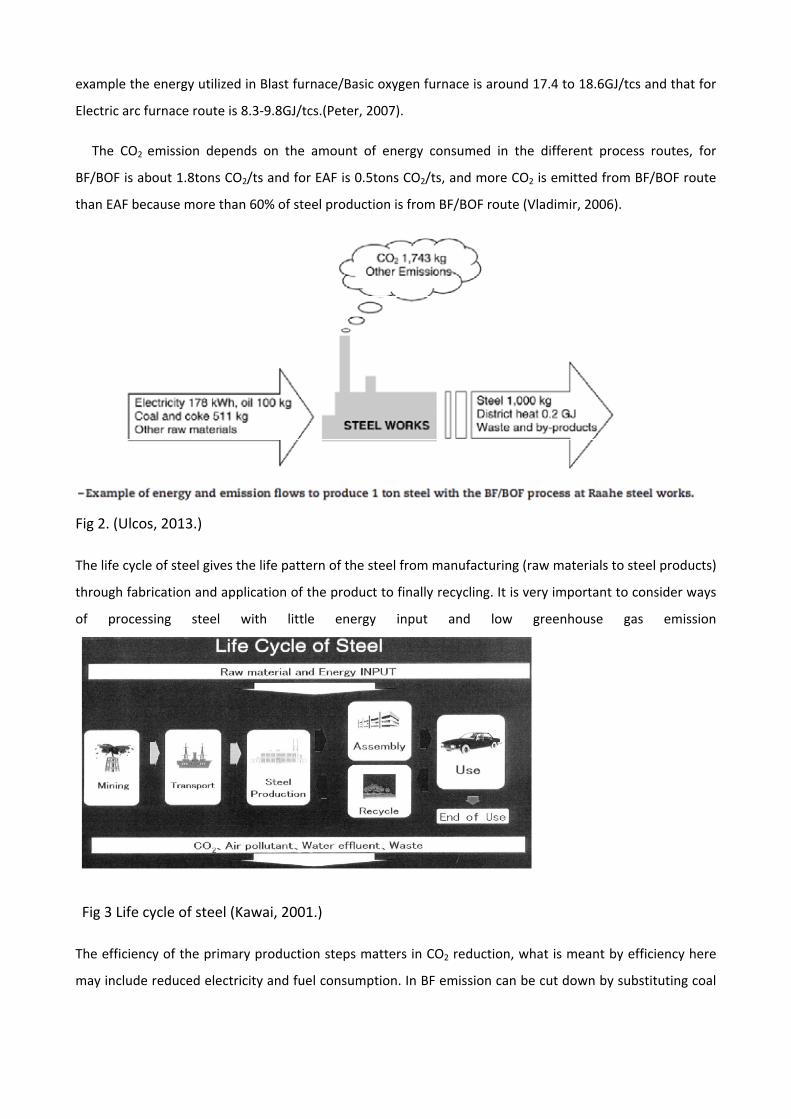
example the energy utilized in Blast furnace/Basic oxygen furnace is around 17.4 to 18.6GJ/tcs and that for
Electric arc furnace route is 8.3-9.8GJ/tcs.(Peter, 2007).
The CO2 emission depends on the amount of energy consumed in the different process routes, for
BF/BOF is about 1.8tons CO2/ts and for EAF is 0.5tons CO2/ts, and more CO2 is emitted from BF/BOF route
than EAF because more than 60% of steel production is from BF/BOF route (Vladimir, 2006).
Fig 2. (Ulcos, 2013.)
The life cycle of steel gives the life pattern of the steel from manufacturing (raw materials to steel products)
through fabrication and application of the product to finally recycling. It is very important to consider ways
of processing steel with little energy input and low greenhouse gas emission
Fig 3 Life cycle of steel (Kawai, 2001.)
The efficiency of the primary production steps matters in CO2 reduction, what is meant by efficiency here
may include reduced electricity and fuel consumption. In BF emission can be cut down by substituting coal
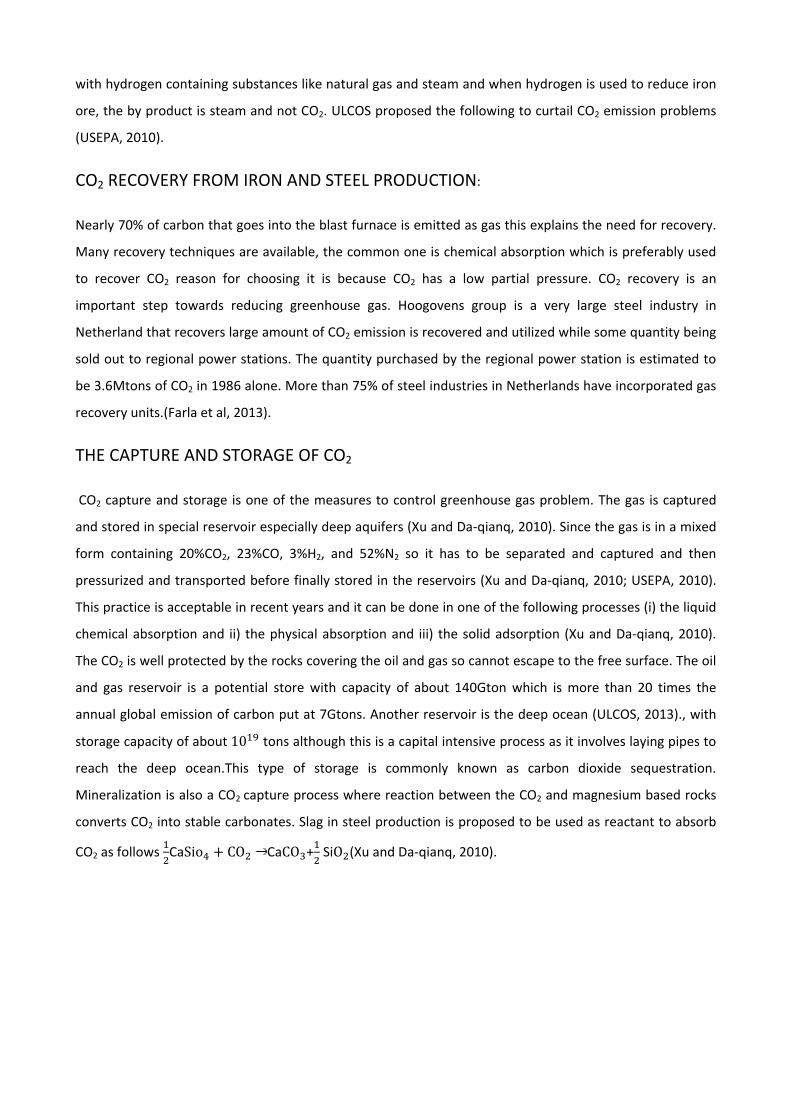
with hydrogen containing substances like natural gas and steam and when hydrogen is used to reduce iron
ore, the by product is steam and not CO2. ULCOS proposed the following to curtail CO2 emission problems
(USEPA, 2010).
CO2 RECOVERY FROM IRON AND STEEL PRODUCTION:
Nearly 70% of carbon that goes into the blast furnace is emitted as gas this explains the need for recovery.
Many recovery techniques are available, the common one is chemical absorption which is preferably used
to recover CO2 reason for choosing it is because CO2 has a low partial pressure. CO2 recovery is an
important step towards reducing greenhouse gas. Hoogovens group is a very large steel industry in
Netherland that recovers large amount of CO2 emission is recovered and utilized while some quantity being
sold out to regional power stations. The quantity purchased by the regional power station is estimated to
be 3.6Mtons of CO2 in 1986 alone. More than 75% of steel industries in Netherlands have incorporated gas
recovery units.(Farla et al, 2013).
THE CAPTURE AND STORAGE OF CO2
CO2 capture and storage is one of the measures to control greenhouse gas problem. The gas is captured
and stored in special reservoir especially deep aquifers (Xu and Da-qianq, 2010). Since the gas is in a mixed
form containing 20%CO2, 23%CO, 3%H2, and 52%N2 so it has to be separated and captured and then
pressurized and transported before finally stored in the reservoirs (Xu and Da-qianq, 2010; USEPA, 2010).
This practice is acceptable in recent years and it can be done in one of the following processes (i) the liquid
chemical absorption and ii) the physical absorption and iii) the solid adsorption (Xu and Da-qianq, 2010).
The CO2 is well protected by the rocks covering the oil and gas so cannot escape to the free surface. The oil
and gas reservoir is a potential store with capacity of about 140Gton which is more than 20 times the
annual global emission of carbon put at 7Gtons. Another reservoir is the deep ocean (ULCOS, 2013)., with
storage capacity of about10 tons although this is a capital intensive process as it involves laying pipes to
reach the deep ocean.This type of storage is commonly known as carbon dioxide sequestration.
Mineralization is also a CO2 capture process where reaction between the CO2 and magnesium based rocks
converts CO2 into stable carbonates. Slag in steel production is proposed to be used as reactant to absorb
CO2 as follows CaSio + CO CaCO + SiO (Xu and Da-qianq, 2010).
MODELLING OF INTEGRATED PLANTS:
In this modeling gas produced internally are used to generate electricity. The gas is obtained from the oven
furnace and the converter, although not all the gas produced are used for the electricity generation some
are used for heating purposes.
Fig 4. Internal electricity generation (Losif et al 2013).
The excess gas can be used as energy source for auxiliary units such as steam and lime production (Losif et
al, 2013).
DIRECT REDUCTION PROCESS:
The direct reduction process is capable of cutting CO2 by 20% through avoiding some practices common in
the Blast furnace route (Xu and Da-qianq, 2010). This process also produces DRI using shaft furnace, CO2
from this process are captured and off gas recycled (ULCOS, 2013).
SMELTING REDUCTION PROCESS:
This process basically involves the use of molten metal to reduce iron oxide and to gasify carbonic
materials. Environmental emissions are reduced in this process because coking coal are not used and
dispensing sinter plants by using lump ore. A typical type of these processes includes the Corex, Finex and
the HIsmelt, the Corex is developed by Siemens (Xu and Da-qianq, 2010). In this process pure oxygen is
used and off gas can readily be stored (ULCOS, 2013).
Top Gas Recycled (TGR –BLAST FURNACE):
In top gas recycled blast furnace process CO2 emitted is stored and the remaining gas sent back into the
furnace through the base and act as reducing agent (ULCOS, 2013).
CONCLUSION:
Many countries have taken different measures to deal with the issue of global warming resulting from their
industrial emissions, although this is a broader and more general approach to the problem as we are only
concerned with emissions from iron and steel industries and specific steps taken by such industries to cut
down greenhouse gas. In fact the steel industries has been confronted with the issue of global warming and
most countries involve in iron and steel production have passed serious internal legislations and are
signatories to international policies to try mitigate the problem.
The setting up of ULCOS as a body responsible for achieving the greenhouse gas cut down has put in
place a lot plans to be implemented by the steel industries. Carbon capture and storage is seen as the most
urgent and more effective way to control CO2 emission despite problems of implementation in large
commercial scale. Secondly the possibility of using steel slag for CO2 sequestration is also receiving
attention where the basicity and acidity characteristics of the slag play an important role. Here
sequestration is achieved through interaction between the CO2 and cations. Thirdly, CO2 recovery is also
one way of reducing greenhouse emission, majority of CO2 emission take place in the Blast furnace so
recovery from this point is necessary though is capital intensive but it is a wise investment.
REFERENCES
1) Bonenfant, D., Kharoune, L., Souve, S., Hausler, R., Niquette, P., Mimeault, M., Kharoune, M. (2009)
Molecular analysis of CO2 Adsorption Process on Steel Slag Oxides. 3, pp20-28
2). Chang, Y. F., Lewis, C., Lin S.J. (2008). Comprehensive Evaluation of Industrial CO2 Emission
(1989-2004) in Taiwan. 36, pp2471-2480
3) Farla, J. C. M., Hendriks, C. A., and Blok, K. CO2 Recovery from Industrial processes. Retrieved June 21,
2013 from www.springerlink.com/index/u7075275w920x688.pdf
4) Kawai, J. (2001). Development of Environmentally Conscious Steel Products. 22 pp 111-122.
5) Katja, S. Jayant, S. (1998). India’s Iron and Steel Industry. Retrieved June 20, 2013 from
http://ies.lbl.gov/iespubs/41844.pdf
6) Katja, S., Sand, R.D. (2007). Where are the Industrial Technologies in Energy-Economy Models. 29,
pp799-825.
7) Losif, A. M., Birat, J.P., Mirguax, O., Ablitzer, D. Reduction of CO2 Emissions in the Steel Industry based
on LCA Methodology. Retrieved june 20, 2013 from www.ulcos.org/en/docs/Ref33%20-
%20TMS_CO2_correct_1.pdf
8) Lonescu, A. Candau, Y. (2007). Air Pollutant Prediction by process Modelling. 22, pp1362-1371.
9) Peter, L. (2007). Impacts of EU Carbon Emission Trade Directive on Energy intensive – Industries. 63,
pp799-806.
10). ULCOS Program Addressing Climate Change Challenge. Retrieved July 10, 2013
www.ulcos.org/en/docs/Ref28%20-%20ISIJ_157_H0053.pdf
11). U.S. Environmental Protection Agency 2010. Available and Emerging Technologies for Reducing
Greenhouse Gas Emissions from Iron and Steel Industries. Retrieved June 22, 2013
www.epa.gov/nsr/ghgdocs/ironsteel.pdf
12) Vladimir, S. (2006). Iron ore Reduction Using Sawdust. 31, pp1892-1905.
13) Xu C., Da-qiang, C. (2010). A Brief Overview Low CO2 Emission Technologies for Iron and Steel Making.
17(3), pp 01-07
DETERMINATION OF HEAVY METALS OF ROAD DEPOSITED
SEDIMENT IN ADO-EKITI, NIGERIA USING XRF TECHNIQUE
*Ogunmodede O.T and **Ajayi, O.O
*Afe Babalola University Ado-Ekiti, Ekiti State, Nigeria,
**Federal University of Technology Akure, Ondo State, Nigeria.
Abstract
In this work x-ray fluorescence(XRF) technology was used to evaluate the soil pollution with heavy metals (K, Ti, Cr, Mn, Fe, Cu, Zr) in rain run-off deposited metal sediment of road side soil in Ado Ekiti, Nigeria. The investigated sediment of road side was collected in open places along the road at different districts in Ado Ekiti. XRF was carried out at the laboratory of Obafemi Awolowo University centre for energy research using handheld thermo scientific energy-dispersive XRF analyzer. The experimental result indicate that the concentration of heavy elements in Adebayo road is the highest level detected while the road at new Iyin road is lowest and they are greater than the level detected in a control soil collected from a zone situated far from the road. For the majority of metals, pronounced maximum, concentrations were detected in the site. Anthropogenic releases give rise to highest concentrations of the metals relative to the normal background values and in some locations their levels exceed the alert level admitted by the Nigeria guideline.
Key words: X –Ray fluorescence (XRF) technique, heavy metals, soil pollution, anthropogenic
Introduction
Sediments on road surfaces and in curbside areas are ubiquitous in urban and sub-urban drainage basins. These deposits are easily sampled, and provide a useful indicator of the degree of pollution status of a locate (1), curbside sediment and associated contaminants are typically available for mobilization and transportation to sub surface drainage system by storm water run-off. Established research has shown that sediments and dusts transported and stored in the urban environment have the potential to provide consider able loading of heavy metals to receiving water and water bodies particularly with charging environmental conditions. (2).
Street sediments that accumulate along parameters in urban environments originate mainly from natural and anthropogenic sources. Heavy metal from natural sources vary significally within catchment and may include materials transported by water from surrounding soils, pollutants from dry and net atmospheric deposition and biological materials from vegetation. Significant quality of particulate matter can also be attributed to anthropogenic sources such as abrasion of vehicular component and their exhaust emission, incinerators, power plants and foundry operations, type and road surface wear. (3); (4).
These deposits as street sediments have become an important medium for study of anthropogenic pollutants and their possible sources (5),(6),(7),(8),(9). Urban street sediment has limited residence tunes and therefore provides a record of recent accumulation (10),(11). The attractiveness of non-destructive method and the ability to perform simultaneous multi-elemental determination has to an extensive application in industrial and research laboratories of accurate,
precise and sensitive atomic and unclear analytical techniques for the investigation of different types of materials.
The main goal of the present research was to use XRF techniques in order to assess the heavy metals distribution in road side soil sediments in Ado- Ekiti Nigeria.
MATERIALS AND METHODS
Studied area was Ado Ekiti city which his at 70031’ N and 505’ E. Fifty sediment sample were collected from ten reads from five districts of the city with the aid of stainless spoon, washed with soap and rinsed with district water for each sampling (12). These roads are Adebayo road, Basin road, Ilawe road, Ajilosun road, Mathew road, Okeyinmi road, New Iyin road, Odo –Ado road, State secretariat road, University road. Two sampling site were designated on each road. The samples were collected once every month for five month during the rainy reason from May to September 2012. All the samplings were perform three days after the rain. Sample collected were stored in sealed polythene bags and transported to the laboratory for pre- treatment and analyses.
Soil sample were air dried, mechanically ground using a stainless shell roller and serve to Obtain < 2mm fraction. A 20-30g sub sample was drawn from the bulk soil (<2mm fraction) and reground to obtain <200mm fraction using a mortar and pestle. The fire material used to determine the pH using soil water ratio of 1:5 using a consorte C862 bench top conductivity /pH/Do meter. Organic carbon was determine by the method walkley and Black method.
XRF analyzes were carried out at the laboratory using hand held thermo scientific XLT;- 793 NITON energy- dispersive XRF analyzer having as excitation source a miniaturized 30ku X-ray tube.Each soil sample was analyzed five times for 240s using two X-ray filters, one for elements from k to cu and the second for element from Zu to Sb.
RESULT AND DISCUSSION
Soil PH value are presented in table I medication that the soils collected around Adebayo, New Iyin road, Basiri road, Mathew road, Ajilosun, road, Ilawe road, Okeyinmi road, Odo-Ado road, state secretariat road, and University road are alkaline (pH in the range of 7.973± 0.05 to 8.846± 0.12) and the control soil of Ado- Ekiti city is slightly and (PH= 6.185±0.05).
XRF result for the collected soil samples evidentiated the existence of the following major and minor element: Fe, K, Mn, Ti (major) and Cr, Cu, Ni, and Zr (minor). The average concentrations of heavy metal Mn, Cr, Cu, Ni, and, Zr of five measurement of each of the soil sample are given in table 2. For the element, Ag, Cd, Hg, Sb, Se, and Sn the XRF result have not been reported because their concentration were below the detection limits.
Total Fe concentrations in metal silt sediment ranged from 410.13 mg/kg at New Iyin road to 476.88 mg/kg at Adebayo road. Total Ti ranged from 1.101 mg/kg at New Iyin road to 1.728 mg/kg at Mathew road, ranged from 21.74 mg/kg to 42.79 mg/kg at New Iyin road and University road. Respectively ranged from 0.23 mg/kg to 1.85 mg/kg at Basiri roads and Adebayo road respectively. Ni ranged from 47.118 mg/kg at New Iyin road to 65.55 mg/kg at Oke Iyinmi road. Mn ranged from 51.33 mg/kg to 75.81 mg/kg at New Iyin road and Adebayo road as show in table (2). The value of the metal at the road was higher than the control.
The three road, Adebayo Oke Iyinmi, and University road ranked highest in traffic density had the highest Ti, Cr, Ni, Zr and Mn Contents in soil, which were above the recommended mean for agriculture soil but lower than the maximum tolerable level proposed for agriculture soil (90- 300 mg/kg), (13)
The mean and medium were used as estimates of central tendency standard error of the mean were all small. The distribution of original data for Fe, K, Mn, Ti, Cr, Cu, Ni and Zr are positive skewed. The substantial different in the symmetric parameter in the case of K, Ni, Cu, Fe, Mn and Ti indicate a non- normal distribution. This supporting a possibility of random infiltration of the metals from some anthropogenic source s. Large standard deviations in the case of Fe, Mn, Cu and N levels revealed their random fluctuating concentration level in the sediment.
Among significant variable that controls or influences the distribution and concentration of heavy metal in the environment are the size of sediments and organic matter ( 14),(15),(16)
The degree of correlation between trace metal and organic matter and size distribution is often used to study the origin of many metals (17). To verify this relationship in this study, correlations between all the metals and the parameter mention were carried out.
CONCLUSION XRF technique has been employed in order to establish the type of metal in soil sediment in Ado- Ekiti road. The experimental result indicate that the concentrations of heavy element varies from zone depend on the level of traffic volume on the road and population and they are greater than the level detected in the control soil. Anthropogenic release give rise to higher concentration of the metal relative to the normal background value and in some location their level exceed then alert level admitted by the Nigerian guideline
REFERENCES
1. Stone, M., Marsalek, J., 1996. Trace metal composition and speciation in street sediment: Sault Ste. Marie, Canada. Water, Air and Soil Pollution 87, 149-169
2.Pereira, E., J.A. Baptista-Neto, B.J. Smith and J.J.Mcallister, 2007. The contribution of heavy metal pollution derived from highway runoff to Guanabara Bay sediments--Rio de Janeiro/Brazil.Ann. Braz. Acad. Sci., 79: 739-750. PMID: 18066440 3. Sutherland, R.A. and C.A. Tolosa, 2000. Multi-element analysis of road-deposited sediment in an urban drainage basin, Honolulu, Hawaii. Environ. Pollut., 110: 483-495. DOI: 10.1016/S0269-7491(99)00311-5 4. Pagotto, C., N. Remy, M. Legret and P. Le Cloirec, 2001. Heavy metal pollution of road dust and roadside soil near a major rural highway. Environ. Technol., 22: 307-319. PMID: 11346288 5. Ferguson, J.E. and N.D. Kim, 1991. Trace elements in street and house dusts: Sources and speciation. Sci. Total Environ., 100: 125-150. DOI: 10.1016/0048- 9697(91)90376-P 6. Watts, S.E.J. and B.J. Smith, 1994. The contribution of highway run-off to river sediments and implications for the impounding of urban estuaries: A case study of Belfast. Sci. Total Environ., 146: 507-514. DOI: 10.1016/0048-9697(94)90276-3 7. McAllister, J.J., B.J. Smith and J.A. Baptista Neto, 2000. The presence of calcium oxalate dehydrate (weddellite) in street dusts from Niteroi, Brazil and its health implications. Environ. Geochem. Health, 22: 195-210. DOI: 10.1023/A:1026593729453
8. McAllister, J.J., B.J. Smith, J.A. Baptista Neto and J.K. Simpson, 2005. Geochemical distribution and bioavailability of heavy metals and oxalate in street sediments from Rio de Janeiro, Brazil: A preliminary investigation. Environ. Geochem. Health, 27: 429-441. DOI: 10.1007/s10653-005-2672-0 9. McAllister, J.J., B.J. Smith, J.A. Baptista Neto and J.K. Simpson, 2005. Geochemical distribution and bioavailability of heavy metals and oxalate in street sediments from Rio de Janeiro, Brazil: A preliminary investigation. Environ. Geochem. Health, 27: 429-441. DOI: 10.1007/s10653-005-2672-0 10. 2.Pereira, E., J.A. Baptista-Neto, B.J. Smith and J.J.Mcallister, 2007. The contribution of heavy metal pollution derived from highway runoff to Guanabara Bay sediments--Rio de Janeiro/Brazil.Ann. Braz. Acad. Sci., 79: 739-750. PMID: 18066440 11. Sutherland, R.A., 2003. Lead in grain size fractions of road-deposited sediment. Environ. Pollut., 121: 229-237. DOI: 10.1016/S0269-7491(02)00219-1 12. Awofolu, O.R., 2005. A survey of trace metals in vegetation, soil and lower animals along some selected major and roads in metropolitan city of Lagos. Environ. Monitor. Assess., 105: 431-447. DOI: 10.1007/s10661-005-4440-0 13. .ICRCL., 1987. Interdepartmental committee for the Redevelopment of Contaminated Land, Guidance on the Assessment and Redevelopment of Contaminated Land. Paper 59/83 2nd Edn. Department of the Environment, London 14. Lin, Y.P., T.P. Teng and T.K. Chang, 2002.Multivariate analysis of soil heavy metal pollution and landscape pattern in Changhua County in Taiwan. Landscape Urban Plann., 62: 19-35. DOI: 10.1016/S0169-2046(02)00094-4 15. Huang, K.M. and S. Lin, 2003. Consequences and implication of heavy metal spatial variations in sediments of Keelung River drainage basin, Taiwan. Chemosphere, 53: 1113-1121. DOI: 10.1016/S0045-6535(03)00592-7 16. Lakhan, V.C., K. Cabana and P.D. LaValle, 2003. Relationship between grain size and heavy metals in sediments from beaches along the coast of Guyana. J. Coast. Res., 19: 600-608. http://www.jstor.org/stable/4299201 17. Jumbe, A.S. and N. Nandini, 2009. Heavy metals analysis and sediment quality values in urban lakes. Am. J. Environ. Sci., 5: 678-687. http://www.scipub.org/fulltext/ajes/ajes56678-687.pdf
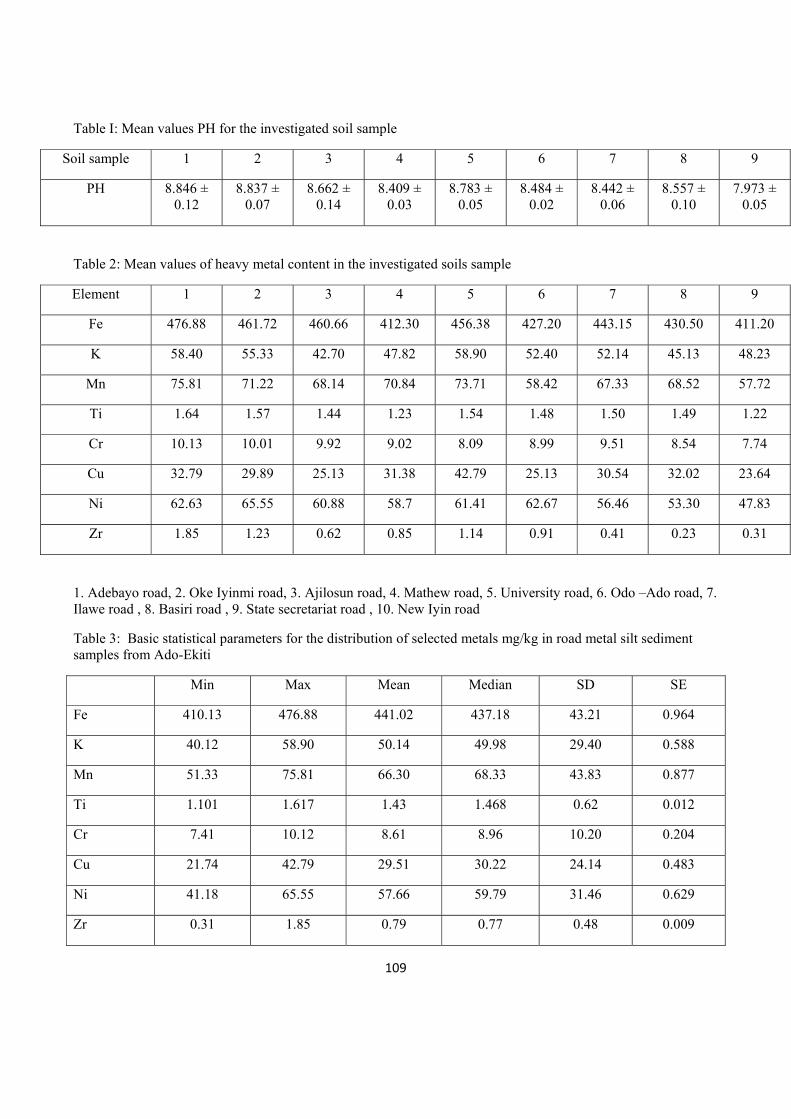
109
Table I: Mean values PH for the investigated soil sample
Soil sample 1 2 3 4 5 6 7 8 9
PH 8.846 ± 0.12
8.837 ± 0.07
8.662 ± 0.14
8.409 ± 0.03
8.783 ± 0.05
8.484 ± 0.02
8.442 ± 0.06
8.557 ± 0.10
7.973 ± 0.05
Table 2: Mean values of heavy metal content in the investigated soils sample
Element 1 2 3 4 5 6 7 8 9
Fe 476.88 461.72 460.66 412.30 456.38 427.20 443.15 430.50 411.20
K 58.40 55.33 42.70 47.82 58.90 52.40 52.14 45.13 48.23
Mn 75.81 71.22 68.14 70.84 73.71 58.42 67.33 68.52 57.72
Ti 1.64 1.57 1.44 1.23 1.54 1.48 1.50 1.49 1.22
Cr 10.13 10.01 9.92 9.02 8.09 8.99 9.51 8.54 7.74
Cu 32.79 29.89 25.13 31.38 42.79 25.13 30.54 32.02 23.64
Ni 62.63 65.55 60.88 58.7 61.41 62.67 56.46 53.30 47.83
Zr 1.85 1.23 0.62 0.85 1.14 0.91 0.41 0.23 0.31
1. Adebayo road, 2. Oke Iyinmi road, 3. Ajilosun road, 4. Mathew road, 5. University road, 6. Odo –Ado road, 7. Ilawe road , 8. Basiri road , 9. State secretariat road , 10. New Iyin road
Table 3: Basic statistical parameters for the distribution of selected metals mg/kg in road metal silt sediment samples from Ado-Ekiti
Min Max Mean Median SD SE
Fe 410.13 476.88 441.02 437.18 43.21 0.964
K 40.12 58.90 50.14 49.98 29.40 0.588
Mn 51.33 75.81 66.30 68.33 43.83 0.877
Ti 1.101 1.617 1.43 1.468 0.62 0.012
Cr 7.41 10.12 8.61 8.96 10.20 0.204
Cu 21.74 42.79 29.51 30.22 24.14 0.483
Ni 41.18 65.55 57.66 59.79 31.46 0.629
Zr 0.31 1.85 0.79 0.77 0.48 0.009
110
IMPORTANCE OF ADOPTING A DROUGHT POLICY
Abdullahi Hassan Gana
Department of Biological Sciences Yobe State University, Damaturu-Nigeria
Abstract
This research aims at exploring the importance of Drought Policy at International, National and Local level. Water, its importance and effects of its scarcity were discussed. The impact of climate change on drought in the 21st century is intense as this disaster is frequently reoccurring in many regions around the world regardless of the climatic conditions and geographic location. Australia is the only country that has adopted a Drought Policy in the world. Georgia State in the United State also has a Drought Policy in place. The Drought Policies were briefly reviewed to show the importance of adopting such policy. The policy provides safety net to affected victims.
Keywords: drought, water, policy, disaster, hazard
Introduction
Water is a chemical substance which contains a molecule of oxygen and two atoms of hydrogen H2O which are connected by covalent bonds (Gosling et al., 2010). Water is a resource that exists in dynamic forms which are solid, liquid and gas (National Atlas, 2011). Availability of water is one of the serious problems in the world of mankind today (Hamdy et al., 2003). Water covers more than 70.9% of the earth surface, and it is also important to all forms of life (National Atlas, 2011). On the earth’s surface oceans account for 96.5% of the total water; 1.7% ground water and glacier, fresh water accounts for only 0.003%. Water on earth circulates continuously through what is known as the hydrologic cycle (National Atlas, 2011).
Methodology During the research previous literature on the socioeconomic effects of drought were reviewed using library catalogue, journals, books and published conferences.
The Importance of water
Water is a vital resource making it very important in the part of every living thing on the planet (Molden, 2007). It is used for various reasons which include:
• Drinking, all living organism need water for their survival. In case of human being approximately 60% of the body is water, and 95% of that is blood. On average, a human body needs 2 litres per day to make it function normally (Molden, 2007)
• Agricultural it is used to grow farm produce for human consumption and grazing animals. However,
other living organisms, both plants and animals, need water for their survival. In many countries of the world, water is used for irrigation and a significant proportion of the population may rely on agriculture as their primary source of income, as this sector consumes highest percentage of water in the world every year (Molden, 2007).
111
• Domestic use - water is used every day in houses for things such as cooking, washing, bathing, and cleaning (Leon, 2012)
• Industrial, water is been used by industries for their daily activities, of which it is believed that this
sector consumes a lot during manufacturing processes. The industrial consumption of water increases its demand in many developed countries and some fast growing economies in the world. Although not only developed or developing countries are in serious demand of water but many countries around the world are now facing the same problem (Molden, 2007).
The effect of water scarcity
There is much talk about the issue of water crisis around the world. It is believed that more than 1.2 billion people globally lack access to safe and clean water for their daily activities (Rijsberman, 2006). Many have suggested that if there was a third World War it would be as a result of water security. More than 900 million people in rural areas live in poverty; they are surviving on less than a dollar per-day which is also in line with lack of access to water for their livelihoods (WHO, 2003). Rijsberman (2006) defined water scarcity as lack of access to safe and affordable water to satisfy the daily needs of individuals. The term ‘water scarcity’ is also referred to as water insecurity. The increasing demand on water is directly related to issues such as population growth, economic progress, land use change, climate change and water pollution. These are combined to make its availability a serious environmental issue in the future (Davies and Simonovic, 2003). The problems associated with lack of sufficient water have affected the lives of millions of people around the world. Adverse impact of water shortage can affect man mentally, socially and economically. The modern global awareness of water scarcity has increased the interests of many governmental and non-governmental organisations toward the modelling of water resource management both in terms of demand and supply of water (Davies and Simonovic, 2003). It is also believed that in the next 50 years problems related to scarcity of water and pollution of water bodies could virtually affect one third of the world’s population (Hamdy et al., 2003). Water scarcity is a situation that affects the normal supply of water or its quality which renders it insufficient to satisfy the demand from all sectors, such as environment, agriculture, industrial and domestic (Gosling et al., 2011). On a global scale more than half of the world’s population now live in urban areas, and this is expected to rise by 60% by 2030 (Nyemba et al., 2010). The problem of water scarcity is worse in the regions with high temperature and less humidity, which is mostly attributed to poor rainfall (Nyemba et al., 2010). The problems of water affect not only the human population but the ecosystem services. Water has significant impacts on all social, economic and environmental sectors which in turn threatens the sustainability of natural resources (UN water, 2007). This is reflected in the fact that individuals, governments and companies can secure water for their operations and daily activities without considering the consequences on the natural environment (UN water, 2007). Lack of access to safe water has impacts on the well-being of people. Improper sanitization and poor personal hygiene causes significant health issues particularly diseases such as diarrhoea, cholera, typhoid and malaria claiming more than 2.18 million lives every year of which one third are children under the age of 5 (Pru¨ss et al, 2002; UN water, 2007 ). Understanding the context of water scarcity has significant impacts on agricultural and industrial activities. A 2006 report discussed the issues of high profile water shortage in Australia, Botswana, Canada, China, Fiji, Kuwait, Liberia, Malawi, Pakistan, Philippines, South Africa, Uganda, United Arab Emirates and United States of America. According to the UN (2007) some experts are divided on the issue of whether the world is seriously facing the problem of water shortages. Rijsberman (2006) argued that water is truly scarce in the physical sense (as a supply) and is available but the method of using the resource is the problem (a demand problem). However, it was concluded that water is indeed physically scarce (Pru¨ss et al, 2002). Addressing the issue of water
112
scarcity needs a holistic, inter-sectorial and multidisciplinary approach with management that can guarantee proper usage of resources for the equitability of social and economic welfare without compromising the ecosystem (UN water, 2007; Gosling et al., 2011). According to El Kharraz et al., (2012) making a proper water management plan is a key stepping stone in reducing poverty and increasing economic growth.
Drought as a natural Hazard
Several authors and scholars have identified drought as a natural hazard. Considering that droughts have various impacts in different parts of the world. It is also identified as one of the major global threat of the 21st century. Drought is considered a natural hazard as it occurs naturally and its severe form has negative impacts on people and their immediate environment; with the growing demand on water aggravating its threats (Mishra and Singh, 2011). The occurrence of drought is complex and also depends on the hydrological processes that feed moisture to the atmosphere. When a dry hydrological condition occurs it initiates a positive feedback mechanism, with moisture depleting from the top-soil reducing the rates of evapotranspiration, and in turn decreasing the atmospheric relative humidity (Bravar and Kavvas, 1991). The lower the relative humidity the lower the probability of rainfall, as it rarely reaches saturation point at low-pressure system. Disturbance from oceans and seas brings enough moisture from outside the dry region and can provide sufficient rainfall to reduce drought conditions in an area (Bravar and Kavvas, 1991). Drought is also ranked first amongst other natural hazards in terms of numbers of affected people (Wilhite, 2000b). However, drought differs from other natural hazards in different ways (Wilhite, 2000a). According to Wilhite (2000a) there are four main factors that differentiate drought from other natural hazards, which includes the following:
• It is difficult to determine when a drought event starts and ends and whether the impacts increases and accumulate slowly over a considerable period of time
• There is no universal definition for drought making it difficult to diagnose drought or defining the boundaries.
• The impacts do not affect structures (buildings and homes) and spreads over a large geographic area. Other natural hazards such as hurricanes, floods, tornadoes, and earthquakes generate damage to structures.
• Anthropogenic or human activities can directly trigger the impacts of drought unlike other natural hazards. Factors such as over-exploitation. Over-cultivation, excessive irrigation and over-population directly affect the ability of soil to capture and hold water.
Considering the different aspects determining drought other scholars have different thoughts on how to rank and classify drought. It is ranked considering the following factors:
The degree of severity, the length of the event, total areal extent, total loss of life, total economic loss, social effect, long-term impact, suddenness, occurrence associated with other hazards. These factors are used to rank drought as first amongst natural hazards (Bryant, 1991). Drought is considered as the fatal natural hazard determined by research conducted and its ripple socio-economic aspects of human life (Bryant, 1991).
Need for drought policy
Compared to other resources water is a renewable resource but when it is gone it cannot be retrieved, and has no alternatives or substitutes (SABMiller and WWF, 2009). The way water is been managed in countries around the world is unsustainable, considering that most nations have not attached any priority to sustainable water management for the future (SABMiller and WWF, 2009). There is a need for countries around the world to consider and take a step forward toward mitigating and addressing the issues of water insecurity and drought. According to the Integrated Regional Information Networks report, (IRIN 2012) a national drought policy could not only involve the establishment of institutions for effective monitoring and setting up early warnings, but it would also empower the affected communities to demand safety nets and protection. The ultimate goal of a
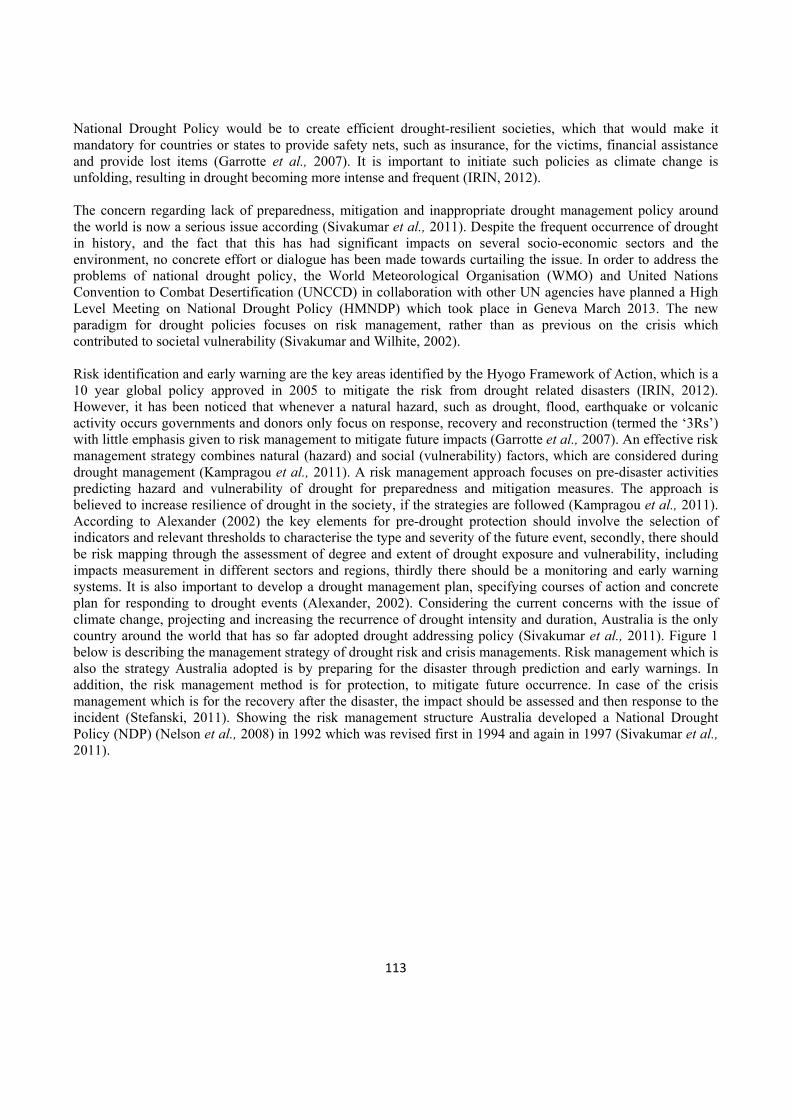
113
National Drought Policy would be to create efficient drought-resilient societies, which that would make it mandatory for countries or states to provide safety nets, such as insurance, for the victims, financial assistance and provide lost items (Garrotte et al., 2007). It is important to initiate such policies as climate change is unfolding, resulting in drought becoming more intense and frequent (IRIN, 2012). The concern regarding lack of preparedness, mitigation and inappropriate drought management policy around the world is now a serious issue according (Sivakumar et al., 2011). Despite the frequent occurrence of drought in history, and the fact that this has had significant impacts on several socio-economic sectors and the environment, no concrete effort or dialogue has been made towards curtailing the issue. In order to address the problems of national drought policy, the World Meteorological Organisation (WMO) and United Nations Convention to Combat Desertification (UNCCD) in collaboration with other UN agencies have planned a High Level Meeting on National Drought Policy (HMNDP) which took place in Geneva March 2013. The new paradigm for drought policies focuses on risk management, rather than as previous on the crisis which contributed to societal vulnerability (Sivakumar and Wilhite, 2002). Risk identification and early warning are the key areas identified by the Hyogo Framework of Action, which is a 10 year global policy approved in 2005 to mitigate the risk from drought related disasters (IRIN, 2012). However, it has been noticed that whenever a natural hazard, such as drought, flood, earthquake or volcanic activity occurs governments and donors only focus on response, recovery and reconstruction (termed the ‘3Rs’) with little emphasis given to risk management to mitigate future impacts (Garrotte et al., 2007). An effective risk management strategy combines natural (hazard) and social (vulnerability) factors, which are considered during drought management (Kampragou et al., 2011). A risk management approach focuses on pre-disaster activities predicting hazard and vulnerability of drought for preparedness and mitigation measures. The approach is believed to increase resilience of drought in the society, if the strategies are followed (Kampragou et al., 2011). According to Alexander (2002) the key elements for pre-drought protection should involve the selection of indicators and relevant thresholds to characterise the type and severity of the future event, secondly, there should be risk mapping through the assessment of degree and extent of drought exposure and vulnerability, including impacts measurement in different sectors and regions, thirdly there should be a monitoring and early warning systems. It is also important to develop a drought management plan, specifying courses of action and concrete plan for responding to drought events (Alexander, 2002). Considering the current concerns with the issue of climate change, projecting and increasing the recurrence of drought intensity and duration, Australia is the only country around the world that has so far adopted drought addressing policy (Sivakumar et al., 2011). Figure 1 below is describing the management strategy of drought risk and crisis managements. Risk management which is also the strategy Australia adopted is by preparing for the disaster through prediction and early warnings. In addition, the risk management method is for protection, to mitigate future occurrence. In case of the crisis management which is for the recovery after the disaster, the impact should be assessed and then response to the incident (Stefanski, 2011). Showing the risk management structure Australia developed a National Drought Policy (NDP) (Nelson et al., 2008) in 1992 which was revised first in 1994 and again in 1997 (Sivakumar et al., 2011).
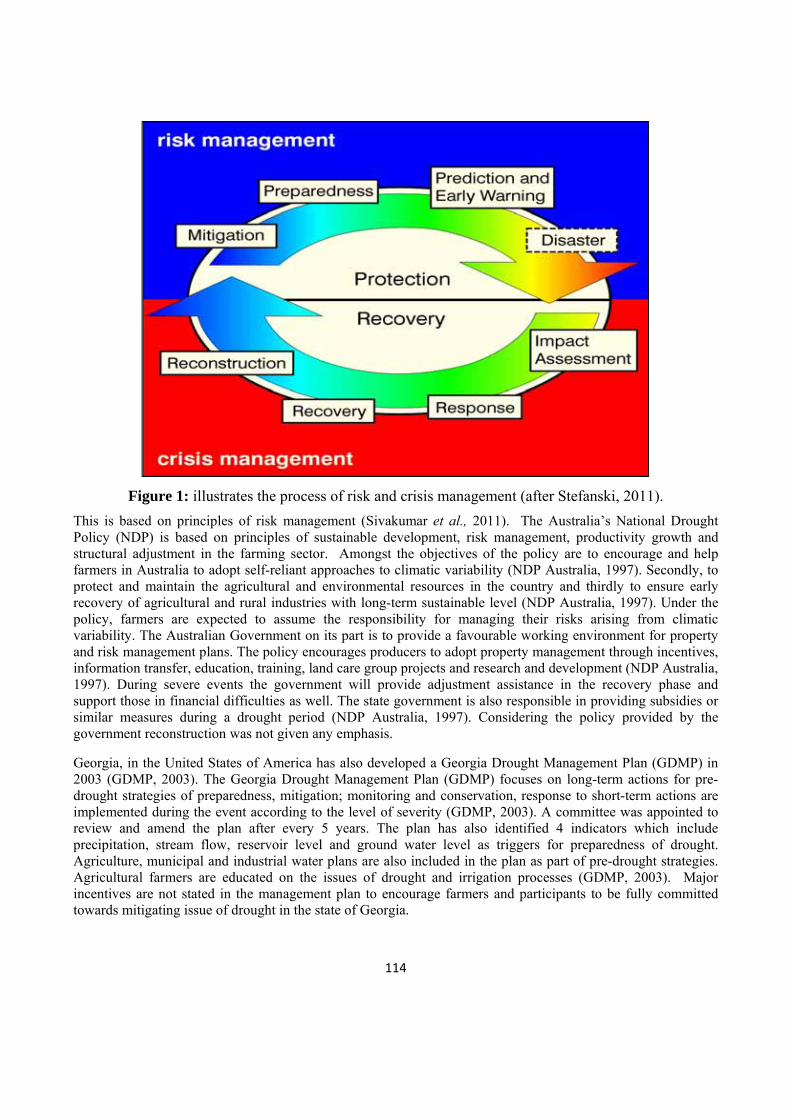
114
Figure 1: illustrates the process of risk and crisis management (after Stefanski, 2011).
This is based on principles of risk management (Sivakumar et al., 2011). The Australia’s National Drought Policy (NDP) is based on principles of sustainable development, risk management, productivity growth and structural adjustment in the farming sector. Amongst the objectives of the policy are to encourage and help farmers in Australia to adopt self-reliant approaches to climatic variability (NDP Australia, 1997). Secondly, to protect and maintain the agricultural and environmental resources in the country and thirdly to ensure early recovery of agricultural and rural industries with long-term sustainable level (NDP Australia, 1997). Under the policy, farmers are expected to assume the responsibility for managing their risks arising from climatic variability. The Australian Government on its part is to provide a favourable working environment for property and risk management plans. The policy encourages producers to adopt property management through incentives, information transfer, education, training, land care group projects and research and development (NDP Australia, 1997). During severe events the government will provide adjustment assistance in the recovery phase and support those in financial difficulties as well. The state government is also responsible in providing subsidies or similar measures during a drought period (NDP Australia, 1997). Considering the policy provided by the government reconstruction was not given any emphasis.
Georgia, in the United States of America has also developed a Georgia Drought Management Plan (GDMP) in 2003 (GDMP, 2003). The Georgia Drought Management Plan (GDMP) focuses on long-term actions for pre-drought strategies of preparedness, mitigation; monitoring and conservation, response to short-term actions are implemented during the event according to the level of severity (GDMP, 2003). A committee was appointed to review and amend the plan after every 5 years. The plan has also identified 4 indicators which include precipitation, stream flow, reservoir level and ground water level as triggers for preparedness of drought. Agriculture, municipal and industrial water plans are also included in the plan as part of pre-drought strategies. Agricultural farmers are educated on the issues of drought and irrigation processes (GDMP, 2003). Major incentives are not stated in the management plan to encourage farmers and participants to be fully committed towards mitigating issue of drought in the state of Georgia.
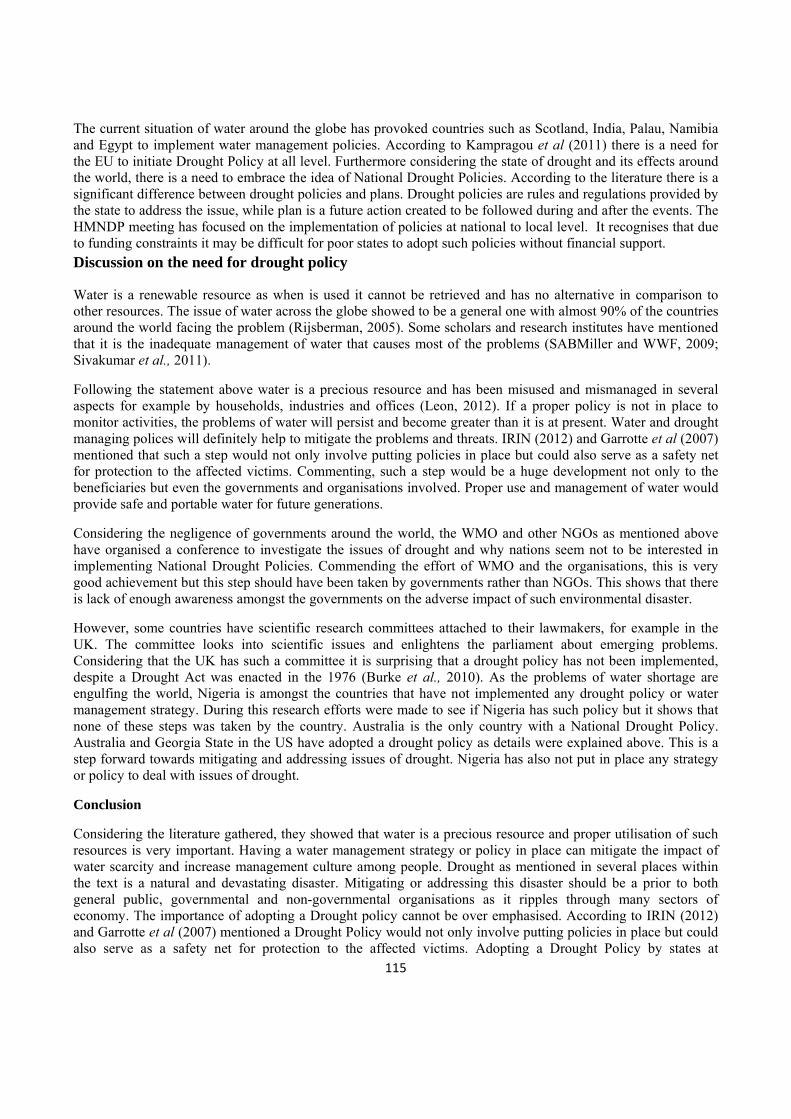
115
The current situation of water around the globe has provoked countries such as Scotland, India, Palau, Namibia and Egypt to implement water management policies. According to Kampragou et al (2011) there is a need for the EU to initiate Drought Policy at all level. Furthermore considering the state of drought and its effects around the world, there is a need to embrace the idea of National Drought Policies. According to the literature there is a significant difference between drought policies and plans. Drought policies are rules and regulations provided by the state to address the issue, while plan is a future action created to be followed during and after the events. The HMNDP meeting has focused on the implementation of policies at national to local level. It recognises that due to funding constraints it may be difficult for poor states to adopt such policies without financial support.
Discussion on the need for drought policy
Water is a renewable resource as when is used it cannot be retrieved and has no alternative in comparison to other resources. The issue of water across the globe showed to be a general one with almost 90% of the countries around the world facing the problem (Rijsberman, 2005). Some scholars and research institutes have mentioned that it is the inadequate management of water that causes most of the problems (SABMiller and WWF, 2009; Sivakumar et al., 2011).
Following the statement above water is a precious resource and has been misused and mismanaged in several aspects for example by households, industries and offices (Leon, 2012). If a proper policy is not in place to monitor activities, the problems of water will persist and become greater than it is at present. Water and drought managing polices will definitely help to mitigate the problems and threats. IRIN (2012) and Garrotte et al (2007) mentioned that such a step would not only involve putting policies in place but could also serve as a safety net for protection to the affected victims. Commenting, such a step would be a huge development not only to the beneficiaries but even the governments and organisations involved. Proper use and management of water would provide safe and portable water for future generations.
Considering the negligence of governments around the world, the WMO and other NGOs as mentioned above have organised a conference to investigate the issues of drought and why nations seem not to be interested in implementing National Drought Policies. Commending the effort of WMO and the organisations, this is very good achievement but this step should have been taken by governments rather than NGOs. This shows that there is lack of enough awareness amongst the governments on the adverse impact of such environmental disaster.
However, some countries have scientific research committees attached to their lawmakers, for example in the UK. The committee looks into scientific issues and enlightens the parliament about emerging problems. Considering that the UK has such a committee it is surprising that a drought policy has not been implemented, despite a Drought Act was enacted in the 1976 (Burke et al., 2010). As the problems of water shortage are engulfing the world, Nigeria is amongst the countries that have not implemented any drought policy or water management strategy. During this research efforts were made to see if Nigeria has such policy but it shows that none of these steps was taken by the country. Australia is the only country with a National Drought Policy. Australia and Georgia State in the US have adopted a drought policy as details were explained above. This is a step forward towards mitigating and addressing issues of drought. Nigeria has also not put in place any strategy or policy to deal with issues of drought.
Conclusion
Considering the literature gathered, they showed that water is a precious resource and proper utilisation of such resources is very important. Having a water management strategy or policy in place can mitigate the impact of water scarcity and increase management culture among people. Drought as mentioned in several places within the text is a natural and devastating disaster. Mitigating or addressing this disaster should be a prior to both general public, governmental and non-governmental organisations as it ripples through many sectors of economy. The importance of adopting a Drought policy cannot be over emphasised. According to IRIN (2012) and Garrotte et al (2007) mentioned a Drought Policy would not only involve putting policies in place but could also serve as a safety net for protection to the affected victims. Adopting a Drought Policy by states at
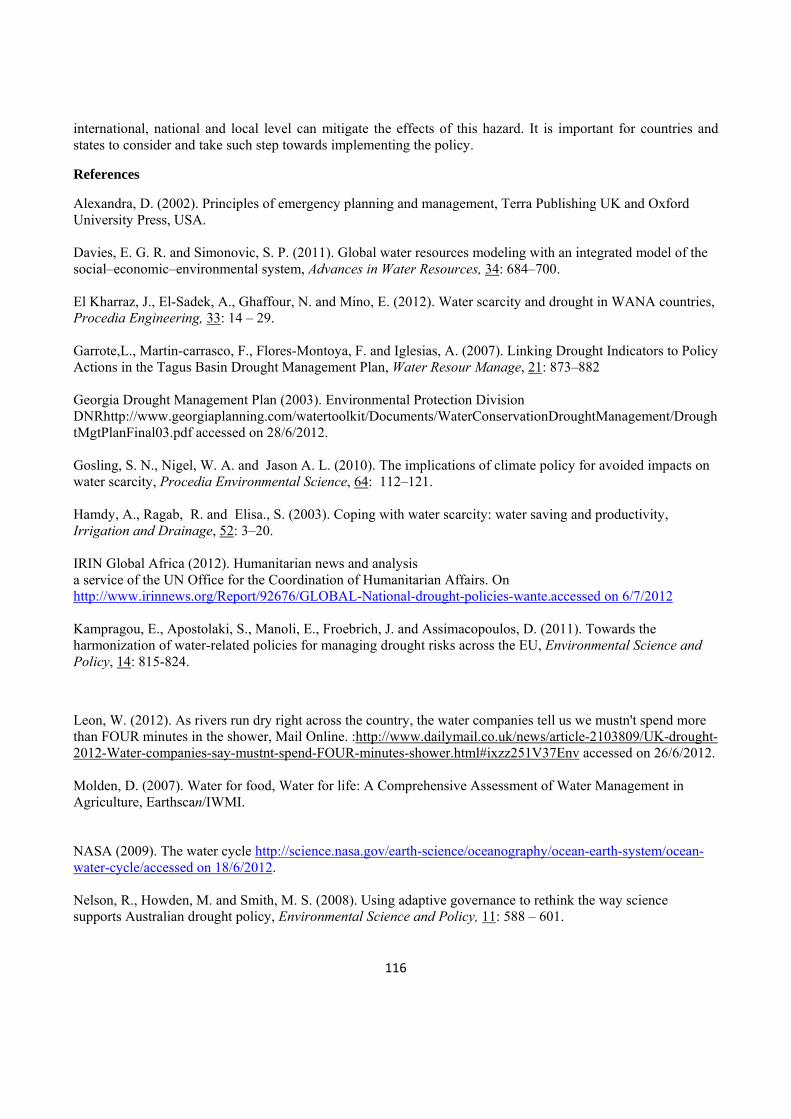
116
international, national and local level can mitigate the effects of this hazard. It is important for countries and states to consider and take such step towards implementing the policy.
References
Alexandra, D. (2002). Principles of emergency planning and management, Terra Publishing UK and Oxford University Press, USA. Davies, E. G. R. and Simonovic, S. P. (2011). Global water resources modeling with an integrated model of the social–economic–environmental system, Advances in Water Resources, 34: 684–700. El Kharraz, J., El-Sadek, A., Ghaffour, N. and Mino, E. (2012). Water scarcity and drought in WANA countries, Procedia Engineering, 33: 14 – 29. Garrote,L., Martin-carrasco, F., Flores-Montoya, F. and Iglesias, A. (2007). Linking Drought Indicators to Policy Actions in the Tagus Basin Drought Management Plan, Water Resour Manage, 21: 873–882 Georgia Drought Management Plan (2003). Environmental Protection Division DNRhttp://www.georgiaplanning.com/watertoolkit/Documents/WaterConservationDroughtManagement/DroughtMgtPlanFinal03.pdf accessed on 28/6/2012. Gosling, S. N., Nigel, W. A. and Jason A. L. (2010). The implications of climate policy for avoided impacts on water scarcity, Procedia Environmental Science, 64: 112–121. Hamdy, A., Ragab, R. and Elisa., S. (2003). Coping with water scarcity: water saving and productivity, Irrigation and Drainage, 52: 3–20. IRIN Global Africa (2012). Humanitarian news and analysis a service of the UN Office for the Coordination of Humanitarian Affairs. On http://www.irinnews.org/Report/92676/GLOBAL-National-drought-policies-wante.accessed on 6/7/2012 Kampragou, E., Apostolaki, S., Manoli, E., Froebrich, J. and Assimacopoulos, D. (2011). Towards the harmonization of water-related policies for managing drought risks across the EU, Environmental Science and Policy, 14: 815-824.
Leon, W. (2012). As rivers run dry right across the country, the water companies tell us we mustn't spend more than FOUR minutes in the shower, Mail Online. :http://www.dailymail.co.uk/news/article-2103809/UK-drought-2012-Water-companies-say-mustnt-spend-FOUR-minutes-shower.html#ixzz251V37Env accessed on 26/6/2012. Molden, D. (2007). Water for food, Water for life: A Comprehensive Assessment of Water Management in Agriculture, Earthscan/IWMI. NASA (2009). The water cycle http://science.nasa.gov/earth-science/oceanography/ocean-earth-system/ocean-water-cycle/accessed on 18/6/2012. Nelson, R., Howden, M. and Smith, M. S. (2008). Using adaptive governance to rethink the way science supports Australian drought policy, Environmental Science and Policy, 11: 588 – 601.
117
Nyemba, A., Manzungu, E., Masango, S. and Simon, M. (2010). The impact of water scarcity on environmental health in selected residential areas in Bulawayo City, Zimbabwe, Physics and Chemistry of the Earth, 35: 823–827. Pru¨ss, A., Day, K., Fewtrell, L. and Bartram, J. (2002). Estimating the global burden of disease from water, sanitation and hygiene at a global level, Environ. Health Perspect, 110: 537–542. Rijsberman. F. R. (2006). Water scarcity: Fact or fiction?, Agricultural Water Management, 80: 5–22. SABMiller and WWF. (2009). Water futures working together for a secure water future Sivakumar, M. V. K. and Wilhte, D. A. (2002). Drought preparedness and drought management. ICID-CIID international conference on drought mitigation and prevention of land desertification, key note presentation, Bled, Slovenia, 21-15 April. Sivakumar, M. V. K., Motha, R. P., Wilhite, D. A. and Qu, J. J. (2011). Towards a Compendium on National Drought Policy, Proceedings of an Expert Meeting, Washington DC, USA. Stefanski, R. (2011). Drought management and policies: World Meteorological Organisation (WMO) drought initiatives
White, D. H and Karssies, L. (2009). Australia's National Drought Policy, Water International, 24(1): 2-9.
Wilhite, D.A. (2000). Drought: A Global Assessment, Routledge, 1-2: 129–448. Wilhite, D.A., 2000b. Drought as a natural hazard: concepts and definitions, Routledge, 1: 1–18. U.S Geological survey (2009) water cycle http://www.usgs.gov/ accessed on 20/6/2012.
UN (2007). Coping with water scarcity challenge of the twenty first century, World water day.
118
ACID RAIN AND ENVIRONMENTAL PROBLEMS: IMPLICATIONS FOR THE TEACHING OF BIOLOGY IN SCHOOLS IN RIVERINE COMMUNITIES
Osu, Samuel Robert and Ekpo, Mary Okon
Department of Biology
Akwa Ibom State - Nigeria College of Education, Afaha Nsit
P.M.B. 1019, Etinan – Nigeria
Abstract
This study was conducted to investigate the influence of acid rain and environmental problems on the teaching of Biology in schools in the riverine communities of Akwa Ibom State - Nigeria. One hundred and eighty (180) Biology teachers were selected using the stratified sampling technique. A questionnaire titled “Acid rain and Teaching of Senior Secondary Biology” (ARTSSB) was used to collect data for testing the four null hypotheses of the study at .05 level of significance. Data analysis was done using the t-test statistics. Findings were made that the damage of buildings by acid rain, the destruction of forest by acid rain, the devastation of arable land by acid rain and the acidification of surface and domestic waters by acid rain all had a significant influence on the study of senior secondary Biology. Recommendations were made among others that: the ecology component of the Biology curriculum for secondary schools should be effectively taught; important environmental issues including acidification of environment by acid rain should be incorporated into the senior secondary curriculum and be carefully thought by teachers of Biology.
Keywords: Acid rain, Environmental Problems, Teaching of Biology, and Riverine Communities.
INTRODUCTION
Acid rain is the term used in environmental science that represents mixing of environmental pollutants with the rain water (Wood, and Bormeann, 1994). The mixing raises the acidity of rain water by formation of acid following chemical reactions involving pollutant gases and water. In Nigeria, the traces of acid rain is noticed in the industrialized areas and its adverse effects damage our ecosystem (Johnston, Shiner, Waver and Lodge 1982).
Acid rain primarily affect the riverine communities of Akwa Ibom State - Nigeria. The major causes of acid rain in these communities is as a result of gas flaring. According to Nwaugo, Onyeagba and Nwahcukwu (2005) gas flaring is the control burning of natural gases associated with oil production. The consisted flaring has left a devastating effect on the surrounding environment, where the activities of the oil exploration and exploitation is greatest.
Orimoogunje et al., (2010) posited that flaring is still the most common practice to dispose the waste gases that are produced during conventional oil exploration in Nigeria. Oil Company like Exxon Mobil are involved in gas flaring in Nigeria. For Exxon Mobil to gain maximum economic profit, gas flaring is the most efficient way to dispose of the associated gas. The gases, after flaring can be carried hundreds of kilometers in the atmosphere and spread throughout the area where flaring is carried out. These gases are later converted to acid gas and deposited as rain. Wet deposition of acids occurs when any form of precipitation removes acids from the atmosphere and delivers it to the environment.
119
Jacobson (1991) suggested that, the impact of acid rain on environment is a global concern that needs to be handled by countries that are highly industrialized. However, the significance of this study is to address how acid rain affects our ecosystem and also suggest measures on how it can be remedied. For instance, the industrial pollutants introduced into the atmosphere by factory smokestacks, are spread over wide areas by the prevailing winds and fall to earth with precipitation called ‘acid rain’, lowering the pH of water on ground and killing life. Consequently, an attempt to capture and remove the pollutants instead of releasing them into the atmosphere seems very difficult to execute and costly. Therefore, the clean Air Act Revisions of 1990 addressed the problem in the United State significantly for the first time. In Nigeria, the effect of acid precipitation is seriously felt in the industrialized areas, where most companies dispose their wastes indiscriminately into the environment. On this note, the attention of the Federal Government of Nigeria is being drawn through our recommendations on how to tackle the menace of air pollutant in this area.
According to Wolosz (2001), acid rain has direct impacts on forest ecosystems and their inhabitants. The damage to the forest trees and plants is widespread. Acid rain damages leaves as it falls. Acid rain runoff from the trees and forest floor infiltrates the forest’s water supplies; runoff that doesn’t enter the water supply is absorbed by the soil. The consequence of this is just as it is for any soil or water source infected with acid rain. The plants and creatures die off, and the creatures that rely on those plants and smaller creatures lose their food source and die as well.
Charkrabbarty (1982) posited that those seeking expensive paint job on their car might want to think twice in areas directly affected by acid rain. The excess sulphur dioxide and nitrogen oxides in acid rain damages automobile paint and corrodes surfaces. It is believed that the acid rain causes the damage as it dries on, and evaporates from, the surface. Auto and paint coating manufacturers are trying to develop protective coatings that prevent acid rain corrosion.
Acid rain leaches out of the soil when it is absorbed by the arable land. This directly affects the minerals levels of the soil and the creatures, such as snails, that rely on that calcium for shell growth (Lee, Perrigan and Grothans 1981). Consequently, snails die off and birds, which eat them for calcium, lay eggs with shells that are weak and brittle and therefore fall to hatch. Decreased calcium also creates excess aluminium in the soil, preventing trees and other plant life from absorbing water. Weakened plant life cannot tolerate extreme temperature or fight off insects and disease (Wolosz, 2001). Acid rain directly affects the chemical and pH balances in surface and domestic waters. The ecological effect of acid rain are most clearly seen in the aquatic, or water, environments, such as streams, lakes and marshes. Acid rain runs off the land and ends up in streams, lakes and marshes. The rain also falls directly on these areas.
As the acidity of a lake increases, the water becomes clearer and the numbers of fish and other water animals decline. Some species of plant and animal are better able to survive in acidic water than others. Freshwater shrimps, snails, mussels are the most quickly affected by acidification followed by fish such as minnows, salmon and roach. Lee and Weber (1980) posited that, the role and fry (eggs and young) of the fish are the worst affected as the acidity of the water can prevent eggs from hatching properly, can cause deformity in young fish which also struggle to take in oxygen. The acidity of the water does not just affect species directly; it also causes toxic substances such as aluminium to be released into the water from the soil, harming fish and other aquatic animals.
Lakes, rivers and marshes each have their own fragile ecosystem with many different species of plants and animals all depending on each other to survive. If a species of fish disappears, the animals which feed on it will gradually disappear too. If the extinct fish used to feed on a particular species of large insect,
120
that insect population will start to grow, this in turn will affect the smaller insects or plankton on which the larger insect feeds (Odewunmi, 1987).
This present study is therefore initiated in order to critically appraise the problems faced by the inhabitants of the riverine communities of Akwa Ibom State - Nigeria where acid rain pollution is predominant.
Statement of the Problem
The problem that attracts the attention of the researcher is the obnoxious released of hydrocarbon pollutants into the environment as a result of gas flaring in the area where the research is currently carried out. The traces of acid rain were generally noticed, which include damages of the buildings, destruction of forest, devastation of arable land and acidification of surface and domestic waters which eventually lead to the destruction of aquatic life in the study area. According to Osu and Udo (2008), other consequences caused by acid rain that should be look into in this study in the environment include wearing away the waxy protective coating of leaves, damaging them and preventing them from being able to photosynthesize properly. A combination of these effects weakens the trees which means that they can be easily attacked by diseases and insects or injured by bad weather. It is not just trees that are affected by acid rain, other plants may also suffer. All these constitute the problems that must be addressed in this study.
Purpose of the Study
The purpose of this study is to assess implications that acid rain and environmental problems have on the study of senior secondary Biology in riverine communities of Akwa Ibom State - Nigeria. Specifically the study has the following:
(i) To investigate the influence that the damage of buildings by acid rain has on the teaching of senior secondary Biology.
(ii) To assess the influence that the destruction of forest by acid rain has on the teaching of senior secondary Biology.
(iii) To ascertain the influence of devastation of arable land by acid rain on the teaching of senior secondary Biology.
(iv) To assess the influence of acidification of surface and domestic water by acid rain on the study of senior secondary Biology.
Significance of the Study
This study is significant in the following ways:
(i) The findings will be useful to Biology curriculum designers to include more environmental issues for the subject.
(ii) Senior Secondary school students in the study area will benefit as they will be helped to learn useful skills for maintaining our devastated environment by acid rain.
(iii) Teachers of Biology in Senior Secondary Schools in the study area will benefit from the findings as they will learn some methods for properly teaching the causes, effects and control measures for acid rain.
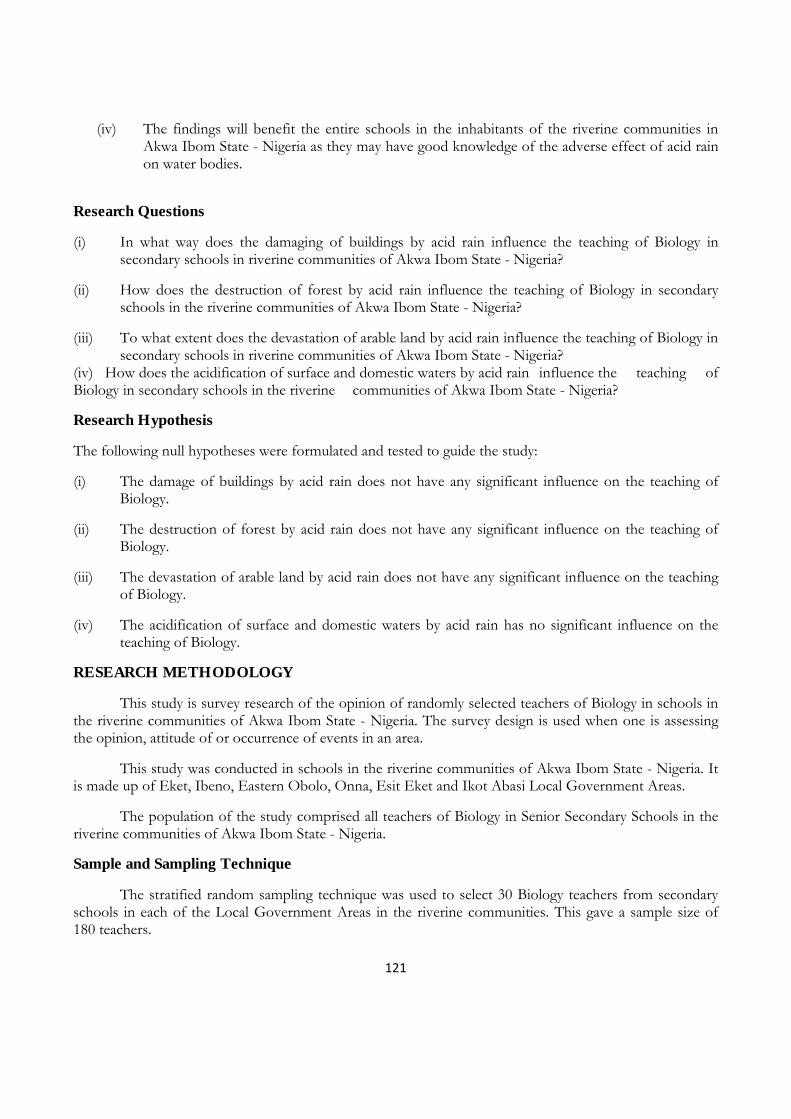
121
(iv) The findings will benefit the entire schools in the inhabitants of the riverine communities in Akwa Ibom State - Nigeria as they may have good knowledge of the adverse effect of acid rain on water bodies.
Research Questions
(i) In what way does the damaging of buildings by acid rain influence the teaching of Biology in secondary schools in riverine communities of Akwa Ibom State - Nigeria?
(ii) How does the destruction of forest by acid rain influence the teaching of Biology in secondary schools in the riverine communities of Akwa Ibom State - Nigeria?
(iii) To what extent does the devastation of arable land by acid rain influence the teaching of Biology in secondary schools in riverine communities of Akwa Ibom State - Nigeria?
(iv) How does the acidification of surface and domestic waters by acid rain influence the teaching of Biology in secondary schools in the riverine communities of Akwa Ibom State - Nigeria?
Research Hypothesis
The following null hypotheses were formulated and tested to guide the study:
(i) The damage of buildings by acid rain does not have any significant influence on the teaching of Biology.
(ii) The destruction of forest by acid rain does not have any significant influence on the teaching of Biology.
(iii) The devastation of arable land by acid rain does not have any significant influence on the teaching of Biology.
(iv) The acidification of surface and domestic waters by acid rain has no significant influence on the teaching of Biology.
RESEARCH METHODOLOGY
This study is survey research of the opinion of randomly selected teachers of Biology in schools in the riverine communities of Akwa Ibom State - Nigeria. The survey design is used when one is assessing the opinion, attitude of or occurrence of events in an area.
This study was conducted in schools in the riverine communities of Akwa Ibom State - Nigeria. It is made up of Eket, Ibeno, Eastern Obolo, Onna, Esit Eket and Ikot Abasi Local Government Areas.
The population of the study comprised all teachers of Biology in Senior Secondary Schools in the riverine communities of Akwa Ibom State - Nigeria.
Sample and Sampling Technique
The stratified random sampling technique was used to select 30 Biology teachers from secondary schools in each of the Local Government Areas in the riverine communities. This gave a sample size of 180 teachers.
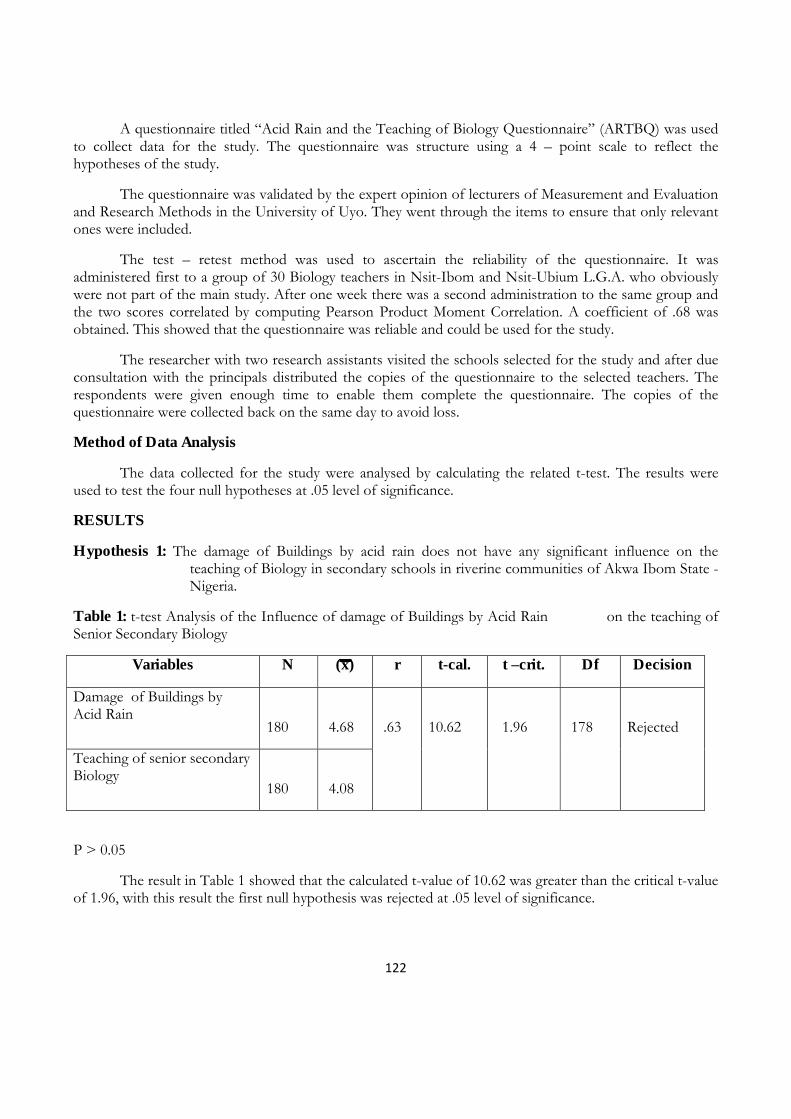
122
A questionnaire titled “Acid Rain and the Teaching of Biology Questionnaire” (ARTBQ) was used to collect data for the study. The questionnaire was structure using a 4 – point scale to reflect the hypotheses of the study.
The questionnaire was validated by the expert opinion of lecturers of Measurement and Evaluation and Research Methods in the University of Uyo. They went through the items to ensure that only relevant ones were included.
The test – retest method was used to ascertain the reliability of the questionnaire. It was administered first to a group of 30 Biology teachers in Nsit-Ibom and Nsit-Ubium L.G.A. who obviously were not part of the main study. After one week there was a second administration to the same group and the two scores correlated by computing Pearson Product Moment Correlation. A coefficient of .68 was obtained. This showed that the questionnaire was reliable and could be used for the study.
The researcher with two research assistants visited the schools selected for the study and after due consultation with the principals distributed the copies of the questionnaire to the selected teachers. The respondents were given enough time to enable them complete the questionnaire. The copies of the questionnaire were collected back on the same day to avoid loss.
Method of Data Analysis
The data collected for the study were analysed by calculating the related t-test. The results were used to test the four null hypotheses at .05 level of significance.
RESULTS
Hypothesis 1: The damage of Buildings by acid rain does not have any significant influence on the teaching of Biology in secondary schools in riverine communities of Akwa Ibom State - Nigeria.
Table 1: t-test Analysis of the Influence of damage of Buildings by Acid Rain on the teaching of Senior Secondary Biology
Variables N (x) r t-cal. t –crit. Df Decision
Damage of Buildings by Acid Rain
180
4.68 .63 10.62 1.96
178
Rejected
Teaching of senior secondary Biology
180
4.08
P > 0.05
The result in Table 1 showed that the calculated t-value of 10.62 was greater than the critical t-value of 1.96, with this result the first null hypothesis was rejected at .05 level of significance.
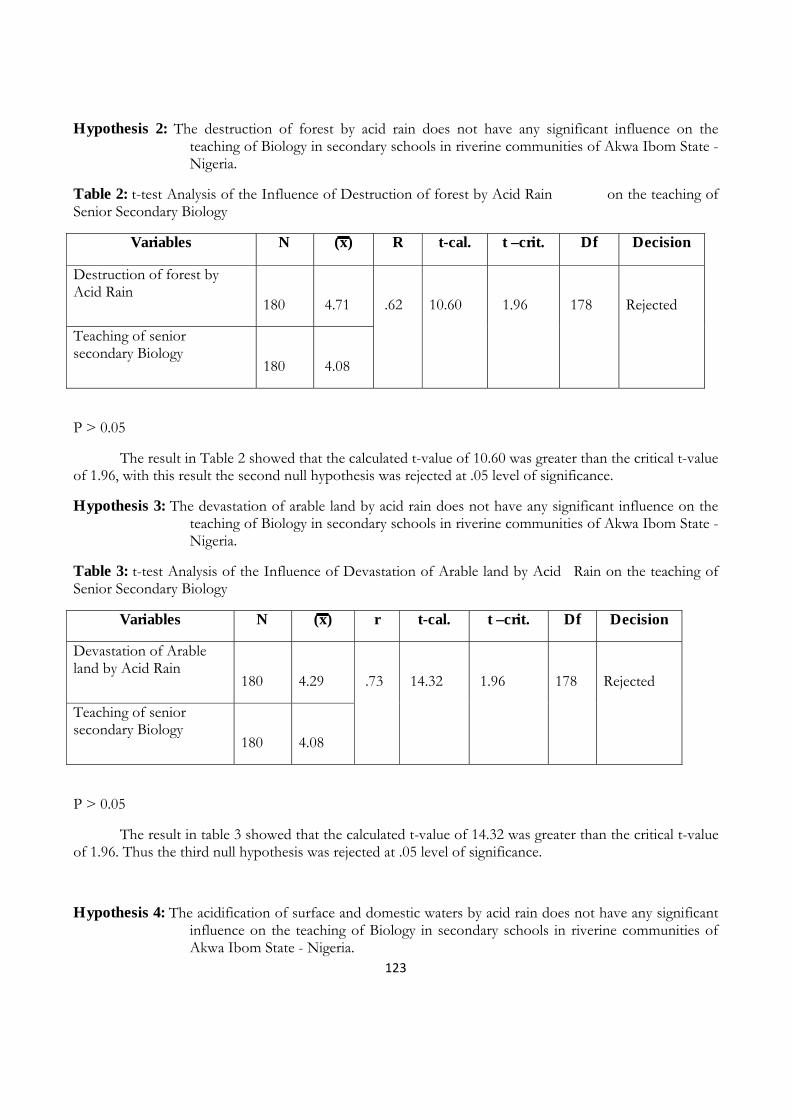
123
Hypothesis 2: The destruction of forest by acid rain does not have any significant influence on the teaching of Biology in secondary schools in riverine communities of Akwa Ibom State - Nigeria.
Table 2: t-test Analysis of the Influence of Destruction of forest by Acid Rain on the teaching of Senior Secondary Biology
Variables N (x) R t-cal. t –crit. Df Decision
Destruction of forest by Acid Rain
180
4.71
.62
10.60
1.96
178
Rejected
Teaching of senior secondary Biology
180
4.08
P > 0.05
The result in Table 2 showed that the calculated t-value of 10.60 was greater than the critical t-value of 1.96, with this result the second null hypothesis was rejected at .05 level of significance.
Hypothesis 3: The devastation of arable land by acid rain does not have any significant influence on the teaching of Biology in secondary schools in riverine communities of Akwa Ibom State - Nigeria.
Table 3: t-test Analysis of the Influence of Devastation of Arable land by Acid Rain on the teaching of Senior Secondary Biology
Variables N (x) r t-cal. t –crit. Df Decision
Devastation of Arable land by Acid Rain
180
4.29 .73 14.32 1.96 178
Rejected
Teaching of senior secondary Biology
180
4.08
P > 0.05
The result in table 3 showed that the calculated t-value of 14.32 was greater than the critical t-value of 1.96. Thus the third null hypothesis was rejected at .05 level of significance.
Hypothesis 4: The acidification of surface and domestic waters by acid rain does not have any significant influence on the teaching of Biology in secondary schools in riverine communities of Akwa Ibom State - Nigeria.
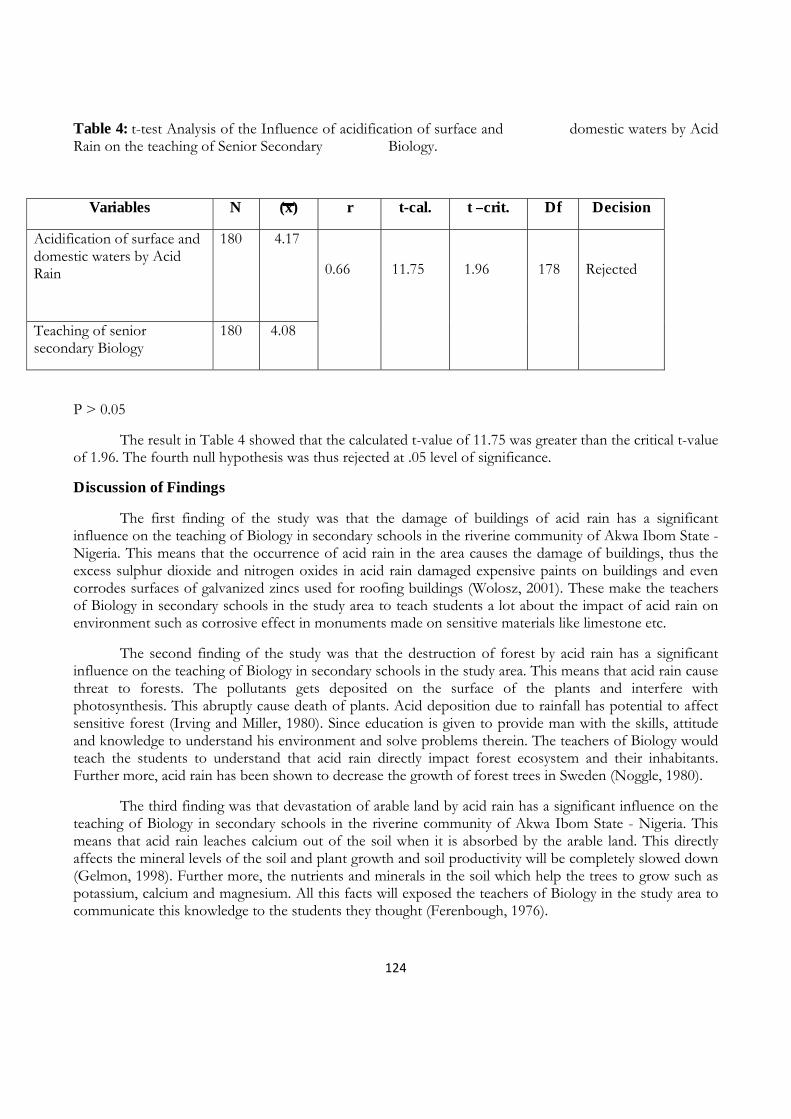
124
Table 4: t-test Analysis of the Influence of acidification of surface and domestic waters by Acid Rain on the teaching of Senior Secondary Biology.
Variables N (x) r t-cal. t –crit. Df Decision
Acidification of surface and domestic waters by Acid Rain
180 4.17
0.66 11.75 1.96 178
Rejected
Teaching of senior secondary Biology
180 4.08
P > 0.05
The result in Table 4 showed that the calculated t-value of 11.75 was greater than the critical t-value of 1.96. The fourth null hypothesis was thus rejected at .05 level of significance.
Discussion of Findings
The first finding of the study was that the damage of buildings of acid rain has a significant influence on the teaching of Biology in secondary schools in the riverine community of Akwa Ibom State - Nigeria. This means that the occurrence of acid rain in the area causes the damage of buildings, thus the excess sulphur dioxide and nitrogen oxides in acid rain damaged expensive paints on buildings and even corrodes surfaces of galvanized zincs used for roofing buildings (Wolosz, 2001). These make the teachers of Biology in secondary schools in the study area to teach students a lot about the impact of acid rain on environment such as corrosive effect in monuments made on sensitive materials like limestone etc.
The second finding of the study was that the destruction of forest by acid rain has a significant influence on the teaching of Biology in secondary schools in the study area. This means that acid rain cause threat to forests. The pollutants gets deposited on the surface of the plants and interfere with photosynthesis. This abruptly cause death of plants. Acid deposition due to rainfall has potential to affect sensitive forest (Irving and Miller, 1980). Since education is given to provide man with the skills, attitude and knowledge to understand his environment and solve problems therein. The teachers of Biology would teach the students to understand that acid rain directly impact forest ecosystem and their inhabitants. Further more, acid rain has been shown to decrease the growth of forest trees in Sweden (Noggle, 1980).
The third finding was that devastation of arable land by acid rain has a significant influence on the teaching of Biology in secondary schools in the riverine community of Akwa Ibom State - Nigeria. This means that acid rain leaches calcium out of the soil when it is absorbed by the arable land. This directly affects the mineral levels of the soil and plant growth and soil productivity will be completely slowed down (Gelmon, 1998). Further more, the nutrients and minerals in the soil which help the trees to grow such as potassium, calcium and magnesium. All this facts will exposed the teachers of Biology in the study area to communicate this knowledge to the students they thought (Ferenbough, 1976).
125
The fourth finding of this study was that the acidification of surface and surface and domestic waters has significant influence on the teaching of Biology in secondary schools in the study area. This means that the effects of acid rain on aquatic habitats are most obvious. Johnston, et al., (1982) suggested that acid rain directly affects the chemical and pH balance of surface and domestic waters. Furthermore, the excess aluminiums created by acid rain makes aquatic environment such as lakes and streams toxic which can cause damage to fish and other aquatic animals. With this finding, the teachers of Biology can now expose the students to most of these consequences of acid rain on the environment.
SUMMARY
This study was conducted to investigate the influence of acid rain and environmental problems on the teaching of Biology in schools in the riverine communities of Akwa Ibom State - Nigeria. One hundred and eighty (180) Biology teachers were selected using the stratified sampling technique. A questionnaire titled “Acid rain and Teaching of Senior Secondary Biology” (ARTSSB) was used to collect data for testing the four null hypotheses of the study at .05 level of significance. Data analysis was done using the t-test statistics. Findings were made that the damage of buildings by acid rain, the destruction of forest by acid rain, the devastation of arable land by acid rain and the acidification of surface and domestic waters by acid rain all had a significant influence on the teaching of Biology in schools in the riverine communities of Akwa Ibom State - Nigeria.
IMPLICATIONS FOR THE TEACHING OF BIOLOGY IN SCHOOLS
One of the science subjects in the senior secondary school curriculum is Biology. Almost all students offer it as a necessary science subject. The findings of this study have the following implications for the teaching of the subject.
1. The aspect of the subject known as Ecology has been avoided by many teachers and students in the past. This study has shown that acid rain destroys both terrestrial and aquatic habitats. This aspect has to be properly taught now so as to make students aware of the danger of acid rain to their immediate environment.
2. Field trips have to be organized once in a while to the riverine communities where oil drilling activities are carried out by oil companies. This will enable students and teachers to have first hand knowledge about the devastation that acid rain makes on the environment.
3. Environmental education at the secondary school is provided through many carrier subjects such as Biology. Qualified and environmental friendly teachers when employed can teach this aspect well to students.
RECOMMENDATIONS
From the findings, the following recommendations are made.
(i) Existing environmental laws in Nigeria should be enforced by the Federal Government. (ii) Field trips and discussion methods should be used as part of the strategies for teaching Biology
in schools in the riverine communities where acid rain is noticed. (iii) Increased public awareness should be created on causes, effects and control of acid rain in the
riverine communities of Akwa Ibom State - Nigeria. (iv) The component of Ecology in senior secondary Biology curriculum should be carefully taught
by teachers of the subject.
126
(v) Several environmental issues including acidification of environment by acid rain should be incorporated into the senior secondary curriculum and be carefully thought by teachers of Biology.
CONCLUSION
The problem of acid rain in the riverine communities of Akwa Ibom State - Nigeria has been an issue of great concern not only to the inhabitants of the area but also to all environment sensitive people. This has led a wide scale destruction of the environment as well as the flora and fauna (Liken et al. 1979).
It was revealed in the study that acid rain has a significant influence on the teaching of Biology in schools in the riverine communities of Akwa Ibom State - Nigeria. This influence is based on the effects of acid rain on building, forest, arable land and acidification of surface and domestic waters. The following conclusions were therefore made that:
(i) Acid rain has an adverse effect on the life of the people in the riverine communities of Akwa Ibom State - Nigeria.
(ii) That acid rain can be control through effective teaching of ecological component of Biology in schools in the study area.
(iii) That teaching methods such as field trips and discussion could help students to gain more knowledge about the influence of acid rain pollution and environmental problems in the riverine communities of Akwa Ibom State - Nigeria.
REFERENCES
Charkrabbarty, A. M. (1982). Biodegradation and Detoxification of Environmental Pollutants. C. R. S Press, Florida, Pp. 103 – 105.
Ferenbough, R. W. (1976). Effect Simulated Acid Rain on Phasecoh Velgaris (fabacea American). Journal of Botany 63 : 283 – 288.
Gelmon, H. (1998). Problems in Crop Seed germination: crop physiology edited by S. Guptel: Oxford and I. B. H. Publishing Company New Delhi, Pp. 1 – 78.
Irving, P. M. and Miller, J. E. (1980). Response of Field Grown Soybeans to Acid Precipitation alone and in Combination with Sulfur Dioxide. Drables and Tollan eds. Processing International Conference on Ecological Effect of Acid Rain Precipitation, Sandford, Norway. Pp. 170 – 171.
Jacobson, J. S. (1991). The Effect of Acid Precipitation on Crops: Acid Deposition in Europe ed. M. J. Chadwick and M. Hutton: Stockholm Environment Institute, New York Pp. 81 – 98.
Johnston, J. W; Shiner, D. S; Waver, O. T. and Lodge, D. M. (1982). Effect of Rain pH on Senescence, Growth and Yield of Bush Beans: Environmental Experiment Botany 22. Pp. 329.
Lee, J. J. and Weber, D. E. (1980). The Effect of Simulated Acid Rain on the Seedling. Emergence and Growth of Eleven Wood Species: Forestry Science 25. Pp. 395 – 398.
127
Lee, J. J; Neely, G. E; Perrigan, S. S. C. and Grothans, L. C. (1981). Effect of Simulated Acid Rain on Yield, Growth and Foliar Injury of Several Crops: Environmental Experiment 21. Pp. 171 – 185.
Likens, G. E; Wright, R. F. Galloway, J. N. and Butter, J. J. (1979). Acid Rain: Science American. 25. 241 (14) : 43 – 53.
Noggle, J. C. (1980). Sulphur Accumulation by Plants, the Role of Gaseous Sulphur in Crop Nutrition. Edited by D. S. Shier Ann Arbo Science Publishers. Pp. 289 – 297
Nwaugo, V. O., Onyeabga, R. A. and Nwahcukwu, N. C. (2005). Effect of Gas Flaring on Soil Microbial Spectrum in Parts of Niger Delta Area of Southern Nigeria. African Journal of Biotechnology. Vol. 5 (19) : Pp. 1824 – 1826.
Odewunmi, A. (1987). Pollution in Nigeria. A Report on Environmental Pollution Shell Pet. Dev. Co. Warri (in House report).
Orimoogunje, O. O. I., Ayanlade, T. A., Akinkuolic and Odiong, A. U. (2010). Perception on Effect of Gas Flaring on the Environment. Research Journal of Environmental and Earth Science 2 (4) : 188 – 193.
Osu, S. R. and Udo, B. A. (2008). Adverse Effect of Acid Rain Pollution on Environment. National Journal of Science and Technology. A Publication of School of Science, College of Education, Afaha Nsit Akwa Ibom State - Nigeria. (3) : 123 – 130.
Wolosz, T. (2001). The Effect of Acid Rain on the Environment. National Geographic Reports on the Causes of Acid Rain. Water Policy International Ltd. 1 Dome Hill, Caterham, Surrey CR3 6EE, UK.
Wood, T. and Bormeann, F. H. (1994). The Effect of Artificial Mist upon the Growth of B. Allegheninsis: Birth Environmental Pollution 1. Pp. 259 – 268.
128
WATER MANAGEMENT STRATEGIES IN RURAL ENVIRONMENT : CONTEXT
OF ECONOMIC UPLIFTMENT IN INDIA AMID IMPENDING DREAD OF CLIMATE CHANGE
P. N. Kalla
S K Rajasthan Agricultural University,
Beechwal, Bikaner 334006 Rajasthan,India
Introduction
Rural environment represents the framework of regulations, institutions, and practices in villages defining parameters for the sustainable use of environmental resources while ensuring security of livelihood and a reasonable quality of life. While the scope of environmental infrastructure is often narrowed down to the provision of suitable water supply, sewerage, and sanitation it has within its purview (a) acquisition, protection, and maintenance of open spaces, (b) clean up and restoration of degraded lands, (c) integration of existing wildlife or habitat resources, (d) sustainable approaches to controlling flooding and drainage, (e) developing river corridors and coastal areas, and (f) forest management. Rejuvenation of natural resources through activation of watersheds, renewal of wastelands along with enhancement of farm productivity, is a component of environmental infrastructure that is attaining increasing importance as expanding anthropogenic activity stresses natural resources beyond their natural regeneration capability. India has large tracts inflicted with abiotic stresses like drought, salinity and extremes of thermal oscillations which are threat to economic upliftment through agriculture.
The dread of a Climate Change is a relatively new phenomenon, which is largely attributed to increase in average global temperature. It is anticipated that the climate change would aggravate the situation by causing shifts and up scaling of stresses. The focus here is on natural resources, common properties, and rejuvenation of rural environment, especially the water resource, which is likely to act as shield against abiotic stresses and dread of climate change.
Scenario of the Rural Environment
The ecosystem within which all rural activities are conducted encompasses the air, the water bodies, and the land. India supports approximately 16 per cent of the world population and 20 per cent of its livestock on 2.5 per cent of its geographical area, making its environment a highly stressed and vulnerable system. The pressure on land has led to soil erosion, water logging, salinity, nutrient depletion, lowering of the groundwater table, and soil pollution—largely a consequence of thoughtless human intervention. The extent of land degradation, the loss in capacity of our major water reservoirs and the decline in water level in wells in the past few years is alarming. Soil erosion from overgrazing, and intensive cultivation and soil degradation from excessive use of agricultural chemicals, have wide-ranging implications.
Agricultural activities that cause land degradation include shifting cultivation without adequate fallow periods, absence of soil conservation measures and cultivation of fragile lands, unbalanced fertilizer use, faulty planning or management of irrigation. Improper agricultural practices are usually observed under constraints of

129
saturation of good lands and population pressure leading to cultivation of ‘too shallow’ or ‘too deep’ soils and ploughing of fallow land before it has recovered its fertility. Overgrazing and over-extraction of green fodder lead to forest degradation through decreased vegetative regeneration, compaction of soil, and reduced infiltration and vulnerability to erosion.
Impact on Human Health
Globally, among the biggest dangers from farming is the continuous exposure to and the unsafe use of chemicals necessary for agriculture. In India, however, the danger to human health from such environment and pollution related causes are not given their due importance as accidents from farm machinery, with a fatality rate of 22 per 1,00,000 farmers. Fatality apart, chronic exposure to air and waterborne chemicals can have adverse health effects, which sometimes, can be difficult to measure because of problems in isolating individual chemical effects.
While certain cause and effect relationships are not easy to identify, cumulative effects are likely to be most critical. Cancer risk could be high from nitrate, metals, as well as pesticides; other problems like adverse hormonal functions, liver damage could also take place, as summarized. Moreover, toxic chemicals and pesticides in air, water, and earth enter body tissues and breast milk, through which they are passed on to infants.
On one hand, as human productive capacity has gone up, whether due to the green revolution or rapid industrialization, so has its ability to generate waste. On the other, there is a growing demand on nature’s ability to provide life support as the population keeps growing and livelihood opportunities decline. We could look at this double squeeze on nature in the context of water resources. Water applied to the field in irrigation either seeps through to underground aquifers, or reappears as ‘return flow’ and finds its way back to the surface (regeneration); seepages from canals recharge groundwater aquifers; industrial use of water results in effluents; domestic and municipal uses become sewage; and whatever water evaporates comes back to earth as rain or snow. As seepages include pesticides, effluents include pollutants and untreated sewage; they find way into water bodies, which in turn leads to declining biodiversity. Excessive pressure on the environment leads to drought-proneness in certain areas owing to declining water table levels and flood-proneness in others owing to silting of reservoirs and loss of forest cover.
A much-generalized cause of environmental degradation is the failure of the governments to formulate appropriate policies to ensure sustainable land and water use. Such policy failures include price distortions through government- controlled prices, subsidies or taxes which give incorrect price signals, faulty delineation of property rights regimes and other legal structures, government projects which directly cause environmental damage, and weak public institutions. Furthermore, state appropriation of property rights has undermined traditional (often communal) property regimes, as in the case of our forest policy, and has in several cases led to de facto open access and resource degradation.
The answer, however, does not lie in large, centralized, ‘top-down’, technology-driven projects: local, decentralized, community-based, people-centered alternatives are available. Problems of scarcity of water, depleted aquifers, declining groundwater tables, and drought proneness have been successfully tackled by water harvesting endeavors in Ralegan Siddhi village in Maharashtra, Sukhomajri in Haryana, and Alwar in
130
Rajasthan. These are not ‘small’ instances to be dismissed as one-off phenomenon but examples of significant and sustained success achieved in terms of increased water availability and rise in groundwater table.
Water Harvesting in Alwar: Revival of the Tradition of Johad
A Johad is a dugout pond, created at a place chosen with native wisdom, informed by remembered patterns of water flow during the rains to harness the rainwater run-off with high embankments on three sides. The height of the embankment depends on the volume of run-off from the catchments. The water storage area varies from 2 hectares to a maximum of 100 hectares. The water collected in a Johad during monsoon penetrates into the sub-soil and recharges the groundwater, improving soil moisture in vast areas mostly downstream. Apart from arresting and storing rainwater, it stops soil erosion, mitigates flood, and ensures water availability in wells for several successive drought years.
The groundwater can be drawn from traditional open wells, built and maintained by the villagers themselves. The water from the Johad is also directly used for irrigation, watering of domestic animals and other household purposes. During the dry season, when the water gradually recedes in the Johad, the land inside the Johad becomes available for cultivation. This land, by receiving good silt and moisture, allows crops to grow without irrigation. Johad is built using simple technology and local materials.
In the Alwar district of Rajasthan it took three years to build the first Johad. In the fourth year, Tarun Bharat Sangh, a non-governmental organization (NGO) actively helping villagers, had built fifty Johads. As on date, 9000 such structures exist catering to water needs of more than 1000 villages. This area, which was classified as ‘dark zone’ in 1995, was reclassified as ‘white zone’ in 2005.
As water availability improved, agriculture became productive and cattle rearing started, resulting in increased production of milk. Studies have shown that an investment of Rs 100 per capita on Johad raises village domestic production by Rs 400 per capita per annum. Because of the dominant role of natural resources in local livelihoods, it is true that people need to have an effective voice in decisions over the natural resources they depend on. The proponents of decentralization argue that the establishment of local (formal) institutions has the capability to improve people’s management and use of common property resources, thereby improving the resource base on which poor people are often disproportionately dependent. It is hoped that through these institutions, participation can better target benefits to the poor through the identification of key stakeholders who are most affected, and can imply an on-going information exchange and discussion through consciousness-raising by shared understanding of problems and a vision for the future that leads to commitment and ownership by the community.
The governance structure is likely to change as a result of decentralization from centralized to localize, with the ‘people’ at the centre. Ideally, the higher authorities will not manage natural resources, but through a participatory process, the local people will manage them, thus resulting in a change in the pattern from a ‘command and control’, to a ‘responsive and accountable’ operative system. The new people-centered bottom-up paradigm in development thinking has created the overly optimistic view that decentralization will produce just and equitable outcomes for all, and that engaging the people will also act as a check on state power, thus helping to democratize local governance.
131
The new paradigm stresses the involvement of local people in contrast to the top-down paradigm, and tends to dominate management of natural resources at the local level. It has been argued that the emergent paradigm for humans living on and with the earth brings together decentralization, democracy, and diversity. The importance of traditional ways of combating with problems could be important too: here, informal institutions could be involved. For instance, whenever villagers in Karnataka’s Bijapur district sense a drought is imminent, they prepare for war with nature. Harbingers travel from place to place and try to bring rain through magic. Rainmaking may not work but the participants at least endeavour to do something in a situation.
Strategic Review of Agricultural Extension
Farming systems vary with agro-ecological conditions and no single intervention will work as a magical cure for improving farm productivity. In some regions, solutions for increasing yields may involve a shortening of fallow periods and extension of cropping periods while in others where soil fertility and/ or access to purchased inputs is good, solutions such as annual cropping or multi-cropping without fallow would work. Again, farming systems based on tree crops, are suitable for some regions only and should be encouraged accordingly. Further, the degree of market integration, choice of crops and cropping systems, use of conservation technologies and use of purchased inputs and their effects on the farming system, are all important in determining the sustainability of particular farming systems.
Revival of agricultural dynamism calls for corrective steps to deal with the near collapse of the extension systems in most states and the decline in agricultural research universities. Lab-to-land concept should be encouraged and put to practice by providing land-users multidisciplinary technical information and viable land-use options and alternatives identified for various agro-ecological and socio-economic units. Crop combinations and rotations suitable for different agro-ecological regions (as suggested by the Indian Council of Agricultural Research) need to be advocated for better land management. There is a need to stay abreast with evolving resource conservation technologies and practices and on analyzing the conditions and principles of sustainable land use. Efficient use of marginal lands needs to be encouraged and areas of untapped potential developed to ensure optimal utilization. For agricultural diversification to be a major element in the agricultural growth strategy, action on several fronts is necessary.
Ideally, there should be a shift of land from cereals to non-cereals (increasing both farm incomes and employment) combined with an increase in productivity in cereals to ensure that per capita availability of cereals does not decline. Improvement in fertilizer application efficiency, integrated with the use of bio fertilizers, to check the degradation of existing resources due to contamination with nitrates could be brought about through on-site farmer training programmes. Success in providing extension services so that the farmers can implement breakthroughs in research necessitates focus on water resource management for sustaining agricultural productivity, escalating economy amid dreads of impending climate change.
References
1. Chambers, Robert (1992). Rural appraisal: rapid, relaxed, andparticipatory, Discussion paper 311. Institute of Development Studies, University of Sussex, Susex.
2. Chand, R (1999). ‘Emerging crisis in Punjab agriculture severity and options for future’, Economic and Political Weekly. 2 April.
132
3. CSE (2006). Rural water harvesting case studies, http:// www.rainwaterharve sting.org/Rural /Community_based_initiative.htm, last accessed July, 2006.
4. Economic Times (2006). ‘Off-farm jobs growing faster than work force’, Tuesday 13 June, New Delhi. 5. FSI. (1998). ‘The state of forests report 1997’, Forest Survey of India. Dehradun. 6. Gadgil M. (1993). ‘Biodiversity and India’s Degraded Lands’, Ambio. 22 : 167–72. 7. MOA (2006). Agricultural statistics at a glance 2006, Ministry of Agriculture, Government of India, New
Delhi. 8. MoWR (1999). National Commission for Integrated Water Resources Development Plan, Ministry of
Water Resources, New Delhi. 9. Radhakrishna, R. (2002). ‘Agricultural growth, employment and poverty a policy perspective’, Economic
and Political Weekly, 19 January. 10. Schreier, Han and Las M. Larkulich (2002). Agricultural watershed management. Training material on
CD published by the Institute of Resources, Environment and Sustainability, University of British Columbia, Vancouver.
11. Shah, Anwar (1997). Balance, accountability, and responsiveness: lessons about decentralization. World Bank Working Paper, The World Bank, Washington D.C.
12. Srinivas, N.N. (2006). The Economic Times, Wednesday 7 June, pp. 20, New Delhi. 13. Vaidyanathan, A. (1999). Water resource management: institutions and irrigation development in India,
Oxford University Press, Delhi. 14. Vasavi, A. R. (1999), ‘Harbingers of rain: land and life in South India’, Oxford University Press, Delhi. 15. WWF (2004). ‘Living planet report 2004’, UNEP, Redefining progress, Centre for Sustainability Studies,
WWF, Switzerland.
133
THE VARIATION IN THE DEPTH OF OVERBURDEN AT DIFFERENT VES POINTS WITHIN SAMARU USING D.C RESISTIVITY TECHNIQUE
Afuwai Gwazah Cyril
Department of Physics,
Federal University,
Dutsin-Ma, Nigeria
ABSTRACT
The interpretation of 32 Schlumberger vertical electrical sounding (VES) data was carried out at Samaru College of Agriculture, A.B.U, Zaria, Sabongari Local government area of Kaduna State, Nigeria. This is an attempt to investigate the groundwater potential and the geologic characteristics of the overburden of the area. Terrameter signal averaging system (SAS) model 300 was the instrument used. No booster was used as the expected depth is within the range of penetration of the instrument. In this instrument consecutive readings are taken automatically and the results averaged continuously and displayed. The schlumberger electrode configuration was used in the data acquisition. The field procedure consists of expanding AB (distance between current electrodes) while MN (distance between potential electrodes) is fixed. This process yields a rapidly decreasing potential difference across MN, which eventually exceeds the measuring capacity of the instrument; therefore a larger value for MN was taken to continue with the survey. The VES curves were interpreted using IPI2Win resistivity computer software. The survey area is dominated by mainly four layers, namely: Overburden, Weathered basement, fractured basement and Fresh basement. The overburden consists of laterites, clay and fadama loam. The results of the interpreted VES data showed that The Overburden thickness varies from 1.3 to 5.2m, with an average of 3.1m. The lowest overburden depth is at VES20 where the depth to basement is as low as 6m. A map was produced by contouring all the overburden depths at each VES point at an interval of 0.5m. The map shows the variation of the topsoil depth from one place to another within the survey Area which is an indication of the inhomogenuity of the subsurface structures. The thickness of the aquifer varied from 1-35m with an average of 18m.
Key words: Resistivity1, Overburden2, Subsurface
1. INTRODUCTION
Water is essential to people and the largest available source of fresh water lies underground. Increased demands for water have stimulated development of underground water resources. As a result, techniques for investing the occurrence and movement of groundwater have been improved, better equipment for extracting groundwater has been developed, and concepts of resource management have been established. Groundwater is commonly understood to mean water occupying all the voids within a geologic stratum. This saturated zone is distinguished from an unsaturated zone, where voids are filled with water and air. Water contained in saturated zones is important for engineering works, geologic studies, and water supply developments (Afuwai et al, 2011).
The Samaru College of Agriculture, Zaria is located at a longitude of 11º09'48.60"N to 11˚1002.93N and at a Longitude of 7º38'06.45E to 7˚3920.54E in the sabongari local government area (L.G.A) of Kaduna state, Nigeria (Figure 1). The college is part of the Ahmadu Bello University, Zaria, and it is bounded in the east by the estate management department of the university and Institute of Agricultural research (I.A.R), and in the west by Area G Staff quarters. The study area has dry season (November to April) and wet season (May to October) with rain falling mainly during the wet season with an average annual rainfall of about 109cm (Hore, 1970). The college is accessible mainly through the Zaria-Shika main road. (Figure2).
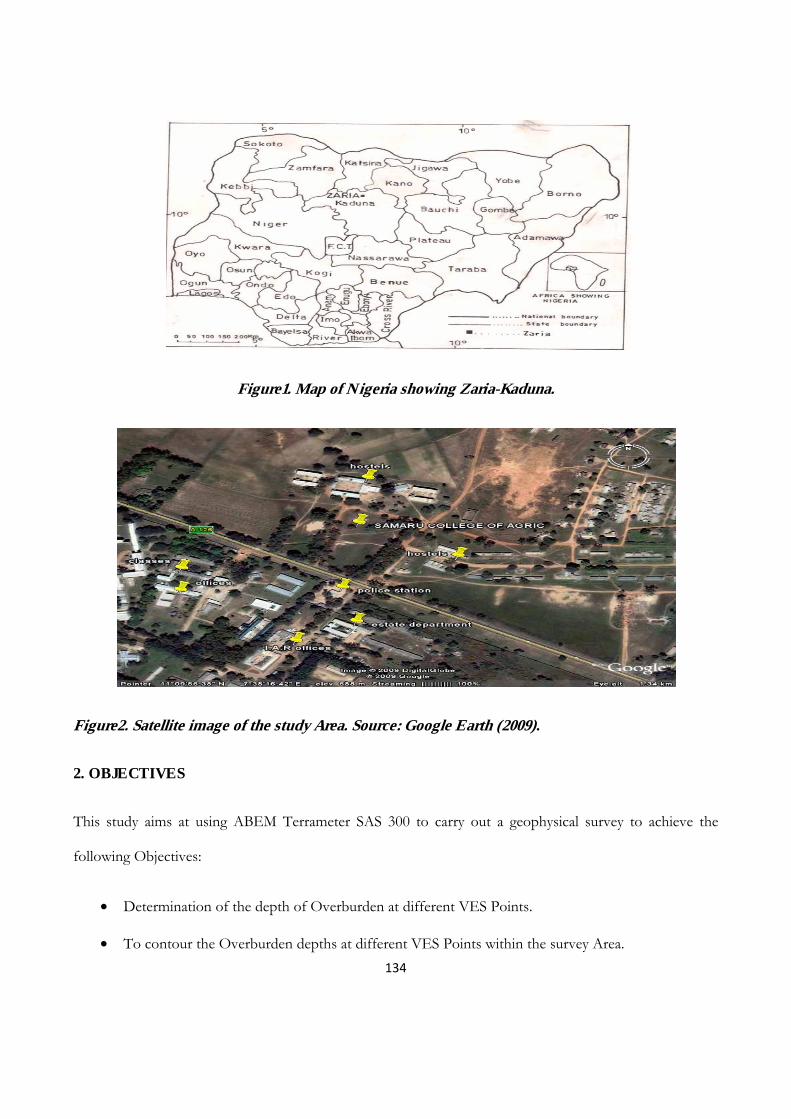
134
Figure1. Map of Nigeria showing Zaria-Kaduna.
Figure2. Satellite image of the study Area. Source: Google Earth (2009).
2. OBJECTIVES
This study aims at using ABEM Terrameter SAS 300 to carry out a geophysical survey to achieve the
following Objectives:
• Determination of the depth of Overburden at different VES Points.
• To contour the Overburden depths at different VES Points within the survey Area.
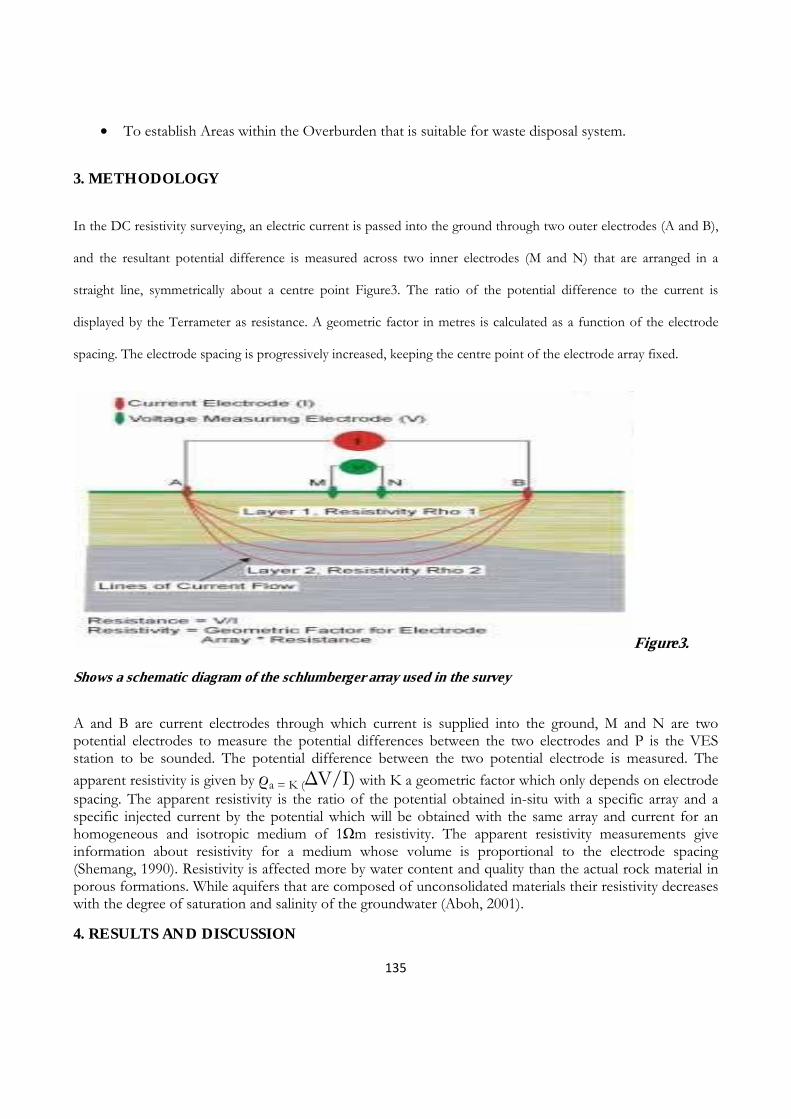
135
• To establish Areas within the Overburden that is suitable for waste disposal system.
3. METHODOLOGY
In the DC resistivity surveying, an electric current is passed into the ground through two outer electrodes (A and B),
and the resultant potential difference is measured across two inner electrodes (M and N) that are arranged in a
straight line, symmetrically about a centre point Figure3. The ratio of the potential difference to the current is
displayed by the Terrameter as resistance. A geometric factor in metres is calculated as a function of the electrode
spacing. The electrode spacing is progressively increased, keeping the centre point of the electrode array fixed.
Figure3.
Shows a schematic diagram of the schlumberger array used in the survey
A and B are current electrodes through which current is supplied into the ground, M and N are two potential electrodes to measure the potential differences between the two electrodes and P is the VES station to be sounded. The potential difference between the two potential electrode is measured. The
apparent resistivity is given by ρa = K (ΔV/I) with K a geometric factor which only depends on electrode spacing. The apparent resistivity is the ratio of the potential obtained in-situ with a specific array and a specific injected current by the potential which will be obtained with the same array and current for an homogeneous and isotropic medium of 1Ωm resistivity. The apparent resistivity measurements give information about resistivity for a medium whose volume is proportional to the electrode spacing (Shemang, 1990). Resistivity is affected more by water content and quality than the actual rock material in porous formations. While aquifers that are composed of unconsolidated materials their resistivity decreases with the degree of saturation and salinity of the groundwater (Aboh, 2001).
4. RESULTS AND DISCUSSION
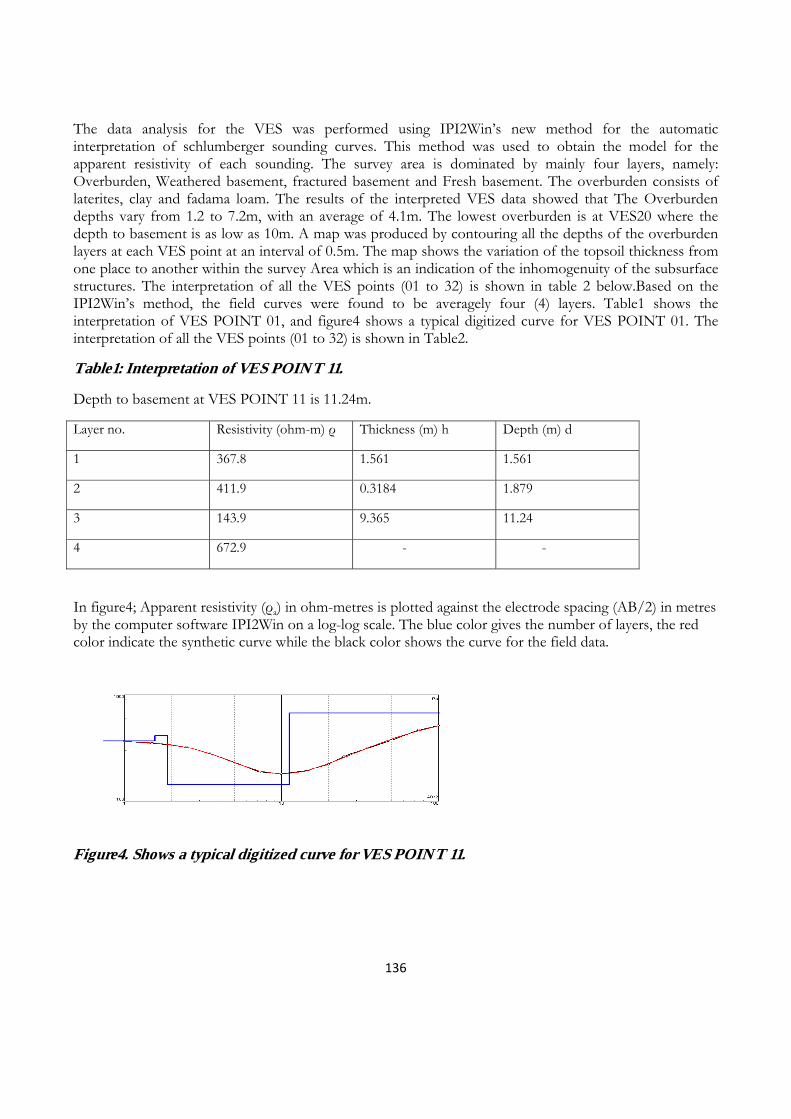
136
The data analysis for the VES was performed using IPI2Win’s new method for the automatic interpretation of schlumberger sounding curves. This method was used to obtain the model for the apparent resistivity of each sounding. The survey area is dominated by mainly four layers, namely: Overburden, Weathered basement, fractured basement and Fresh basement. The overburden consists of laterites, clay and fadama loam. The results of the interpreted VES data showed that The Overburden depths vary from 1.2 to 7.2m, with an average of 4.1m. The lowest overburden is at VES20 where the depth to basement is as low as 10m. A map was produced by contouring all the depths of the overburden layers at each VES point at an interval of 0.5m. The map shows the variation of the topsoil thickness from one place to another within the survey Area which is an indication of the inhomogenuity of the subsurface structures. The interpretation of all the VES points (01 to 32) is shown in table 2 below.Based on the IPI2Win’s method, the field curves were found to be averagely four (4) layers. Table1 shows the interpretation of VES POINT 01, and figure4 shows a typical digitized curve for VES POINT 01. The interpretation of all the VES points (01 to 32) is shown in Table2.
Table1: Interpretation of VES POINT 11.
Depth to basement at VES POINT 11 is 11.24m.
Layer no. Resistivity (ohm-m) ρ Thickness (m) h Depth (m) d
1 367.8 1.561 1.561
2 411.9 0.3184 1.879
3 143.9 9.365 11.24
4 672.9 - -
In figure4; Apparent resistivity (ρa) in ohm-metres is plotted against the electrode spacing (AB/2) in metres by the computer software IPI2Win on a log-log scale. The blue color gives the number of layers, the red color indicate the synthetic curve while the black color shows the curve for the field data.
Figure4. Shows a typical digitized curve for VES POINT 11.

137
Table2. Interpretation of VES Points 01 to 32.
VES AZIMUTH ρ1 (Ωm)
h1 (m) ρ2 (Ωm)
h2(m) ρ3(Ωm) h3(m) ρ4(Ωm) h4(m) ρ5(Ωm) h5(m)
01 NW-SE 367.8 1.561 411.9 0.3184 143.9 9.365 672.9 - - -
02 NE-SW 258 1.48 137 2.65 62.1 8.05 558 - - -
03 N-S 283 0.566 186 2.13 49.1 9.85 611 - - -
04 E-W 290 1.27 578 2.88 1413 2.16 3821 - - -
05 N-S 130.6 2.633 1713 2.856 516.5 5.97 738.9 - - -
06 N-S 97.9 0.6 139 1.62 1068 4.86 1963 - - -
07 E-W 333 1.26 181 4.23 69.6 7.77 2009 - - -
08 E-W 55 0.7 73.2 3.7 1273 2.99 114 - - -
09 E-W 58.4 1.13 76.3 3.62 679 4.5 141 - - -
10 N-S 116 0.915 292 0.457 101 1.77 568 13.3 316 -
11 E-W 148 0.409 754 0.368 69.3 18.3 10512 - - -
12 E-W 136 0.6 313 0.654 69.2 4.24 155 45 419
13 E-W 219 0.342 8518 0.374 1059 25.5 511 - - -
14 E-W 86.2 0.37 2400 0.478 319 - - - - -
15 E-W 207.2 0.6 364.7 0.7719 693.1 1.765 744.3 - - -
16 E-W 50.4 0.385 1001 0.916 76.2 53.1 3779 - - -
17 E-W 151 1.89 1957 1.67 392 74.5 447 - - -
18 E-W 98.2 2.6 258 6.92 674 14.5 720 - - -
19 E-W 105 5.54 300 1.67 486 - - - - -
20 E-W 97.9 2.62 133 8.88 432 80.6 527 - - -
21 E-W 163 0.45 89.1 4.99 316 8.42 373 - - -
22 E-W 148 2.36 165 1.07 444 21.2 1290 - - -
23 N-S 90 2.47 208 5.67 462 77.4 576 - - -
24 N-S 28.4 0.343 197 0.454 38.5 4.14 80.8 - - -
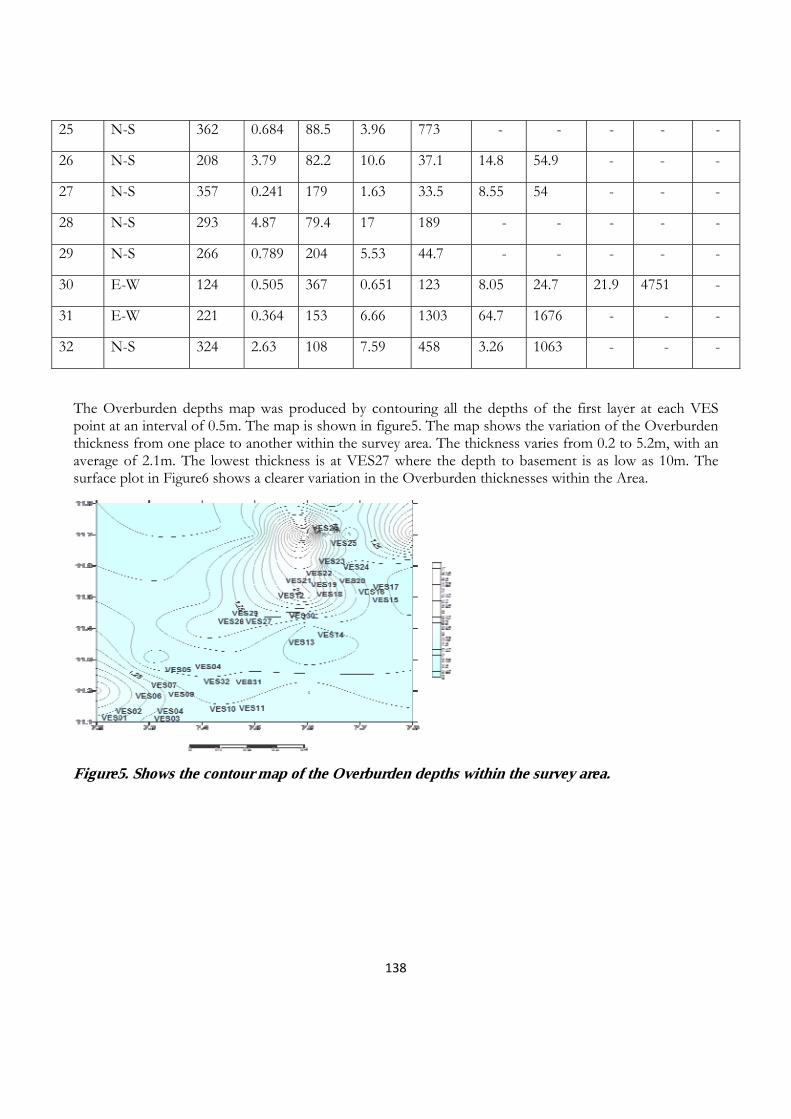
138
25 N-S 362 0.684 88.5 3.96 773 - - - - -
26 N-S 208 3.79 82.2 10.6 37.1 14.8 54.9 - - -
27 N-S 357 0.241 179 1.63 33.5 8.55 54 - - -
28 N-S 293 4.87 79.4 17 189 - - - - -
29 N-S 266 0.789 204 5.53 44.7 - - - - -
30 E-W 124 0.505 367 0.651 123 8.05 24.7 21.9 4751 -
31 E-W 221 0.364 153 6.66 1303 64.7 1676 - - -
32 N-S 324 2.63 108 7.59 458 3.26 1063 - - -
The Overburden depths map was produced by contouring all the depths of the first layer at each VES point at an interval of 0.5m. The map is shown in figure5. The map shows the variation of the Overburden thickness from one place to another within the survey area. The thickness varies from 0.2 to 5.2m, with an average of 2.1m. The lowest thickness is at VES27 where the depth to basement is as low as 10m. The surface plot in Figure6 shows a clearer variation in the Overburden thicknesses within the Area.
Figure5. Shows the contour map of the Overburden depths within the survey area.
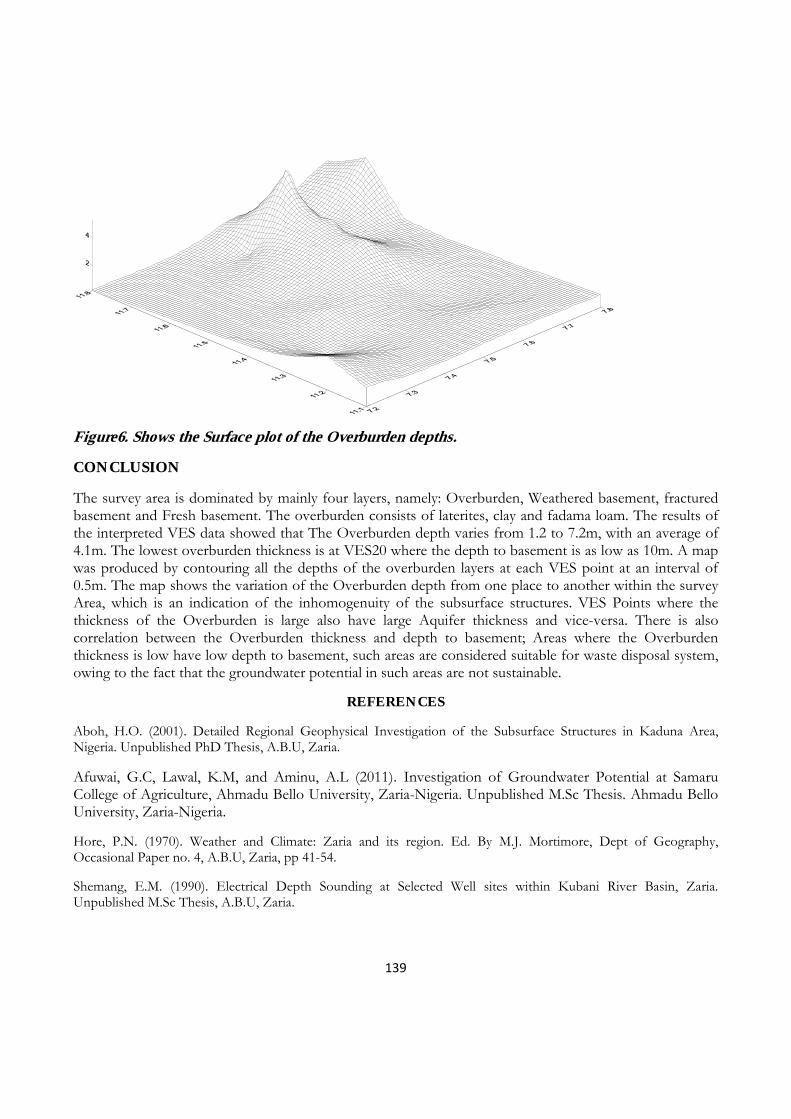
139
Figure6. Shows the Surface plot of the Overburden depths.
CONCLUSION
The survey area is dominated by mainly four layers, namely: Overburden, Weathered basement, fractured basement and Fresh basement. The overburden consists of laterites, clay and fadama loam. The results of the interpreted VES data showed that The Overburden depth varies from 1.2 to 7.2m, with an average of 4.1m. The lowest overburden thickness is at VES20 where the depth to basement is as low as 10m. A map was produced by contouring all the depths of the overburden layers at each VES point at an interval of 0.5m. The map shows the variation of the Overburden depth from one place to another within the survey Area, which is an indication of the inhomogenuity of the subsurface structures. VES Points where the thickness of the Overburden is large also have large Aquifer thickness and vice-versa. There is also correlation between the Overburden thickness and depth to basement; Areas where the Overburden thickness is low have low depth to basement, such areas are considered suitable for waste disposal system, owing to the fact that the groundwater potential in such areas are not sustainable.
REFERENCES
Aboh, H.O. (2001). Detailed Regional Geophysical Investigation of the Subsurface Structures in Kaduna Area, Nigeria. Unpublished PhD Thesis, A.B.U, Zaria.
Afuwai, G.C, Lawal, K.M, and Aminu, A.L (2011). Investigation of Groundwater Potential at Samaru College of Agriculture, Ahmadu Bello University, Zaria-Nigeria. Unpublished M.Sc Thesis. Ahmadu Bello University, Zaria-Nigeria.
Hore, P.N. (1970). Weather and Climate: Zaria and its region. Ed. By M.J. Mortimore, Dept of Geography, Occasional Paper no. 4, A.B.U, Zaria, pp 41-54.
Shemang, E.M. (1990). Electrical Depth Sounding at Selected Well sites within Kubani River Basin, Zaria. Unpublished M.Sc Thesis, A.B.U, Zaria.
140
COMPARING ALTERNATIVE METHODS OF MEASURING GEOGRAPHIC ACCESS TO HEALTH SERVICES: AN ASSESSMENT OF PEOPLE’S ACCESS
TO SPECIALIST HOSPITAL IN KEBBI STATE
Sa’ad Ibrahim
Department Of Geography, Adamu Augie College Of Education, Argungu,
Kebbi State, Nigeria
ABSTRACT
This paper presents comprehensive and analytical methodologies of Geographical Information Systems (GIS) in identifying geographic access to health service provision. It compares some alternative measures of geographic access to health care facility using spatial analysis. ArcGIS based network analysis (Origin and Destination Cost Matrix) was used to denote Output areas as the origin (demand) and hospital as the destination (supply). Raster based straight line distances (Euclidean) for same area was measured to identify this access. The accessibility of people within 60 km, 100 km, 200 km, 250 km and distances ≥ 300 km were assessed for both methods. The results for OD matrix stood at 29.77% (60 km), 42.48% (100 km), 53.78% (200 km), 72.99% (250 km) and 30.38% (≥ 300 km) whereas, for the straight line distance, 39.99% (60 km), 57.35% (100 km), 75.52% (200 km), 83.67% (250 km) and 0.0% (≥ 300 km) were recorded. The distance measurements were statistically not very strong (p- 0.07) between the methods. Moreover, travel time was also modelled at speed limit 50 km per hour using OD Matrix. The result indicates that only 33.35% are within drive time of 80 minutes (1 hr. 20 min.) and over 30% are within drive time ≥ 2 hrs. 45 min. Thus, the study encourages the use of OD Matrix in facility location analysis being more promising than the Euclidean model. The paper also strongly recommend to policy makers in the health service to embrace GIS to incorporate the technology of how service areas of health servers can be used as a basis for better use of population health service ratios to ensure equitable distribution of resources and effective health care delivery.
Keywords: Network Analysis: Straight Line Distances: Health Facility: Access
INTRODUCTION
In recent times, there is growing concern among decision makers, scientific researchers and politicians on the alternative measures to better the health care delivery system. In health service provision, the problems of the health care quality and accessibility are fundamental issues. Problems with accessibility to care would include evaluation of the adequacy of the numbers of health care facilities and the proper distribution of these facilities to ensure easy and immediate access to a health facility for every patient who needs one, the affordability, and therefore the accessibility of quality health care to all patients, etc. (Nwangwu, 2013). Today, lack of access to general health care by many communities in Nigeria is very pathetic, pervasive, and vulnerable. In many rural areas, health cases that require the attention of qualified medical practitioners are often handled by people who are very inexperienced. In this part of the country, many people cannot afford to see a specialist either because of poverty or lack of easy proximity to some of the secondary and tertiary institutions. This is due poor health care delivery system which makes availability, accessibility and affordability difficult to most people.
141
In addition, inequality and disparity in geographic accessibility might result due manner in which people and facilities are spatially arranged. And because health care delivery system has been subjected to considerable economic pressure, facilities cannot be located in all places. They are at finite fixed locations yet they serve populations that are continuously and unevenly distributed throughout a region. Due to this arrangement of population and facilities in space, inequality is rather very inevitable. However, in some scenarios, people have to travel distances longer than usual to gain access to health services as a result of the location of facilities coupled with poor road network system(( Delamater, et al. 2012: Allen 2013). In the past, the situation was much more compounded because the potential role of geographical information system in improving public health was not fully realised. This results due to lack of interaction between the GIS and health research community and recognition of the need for basic research in health and GIS (Campagna, 2006).
Currently, the increasing availability of Geographical Information Systems (GIS) in health organisations, together with the proliferation of spatially disaggregate data, has led to a number of studies that have been concerned with developing measures of access to health care services.(Higgs, 2009). Moreover, with the advancement of geographic information systems (GIS) and sophisticated computer technology, decision and policy making in facility site selection can be enhanced into a larger dataset with more complicated data structures, more accurate spatial measurement, spatial analysis and spatial modelling. GIS capability to represent spatial objects as points, line, or polygons has increased the flexibility of entity representations in facility location modelling (Indriasari , et al. 2010).
Thus, geographically based health care research commonly utilizes methodologies and measurements attainable using a geographic information system (GIS) which include network model (vector representation) and raster model (raster representation). These methods are used to measure distances and travel time between the locations of health facilities and people. For instance, distance from patients to hospital or estimate of access to care. However, measurement precision varies with method in question. Although, nowadays, the raster based measurement (straight line distance) is often replaced by more plausible methods such as the network analysis, the choice of a method is dependent of research question and units of measure within a study area (Jones, Ashby, & Naidoo 2010: Delamater, et al. 2012).
In this piece, the purpose is exploring different methods used in accessibility studies. Specifically to calculate distances and travel time (at different impedances) using network model and distances using raster based method. It also sought to compare the resulting distances measured by the methods- Euclidean (straight line) and network analysis using origin and destination matrix (OD Matrix) to ascertain if significant differences exist between methods. The research is expected to be applied within future health researches despite its outcome.
Access and geographic accessibility
A veritable literature describing GIS based studies of accessibility are available in transport, heath, green space, high way studies, communication, disaster management, and general administration. Most of these researches are geared towards quantifying distances or travel times to evaluate access against certain criteria (Liu & Zhu 2003: Ohta et al., 2007: Comber et al. 2008: Comber et al. 2009: Doriwala & Shah 2010: Keshkamat 2007: Langford & Higgs 2010: Sasaki et al., 2010: Stephen et al. 2010). Accessibility is defined by Paecz (2004)” as the potential for interaction between locations in space” Penchansky and Thomas (1981) identified five varied dimensions of access which were classified by Khan (1992) into spatial components (accessibility and availability) and aspatial components (affordability, accommodation, and acceptability). Thus, access to health care can be grouped into potential and realized delivery of services based on whether actual utilization data of the services is incorporated (realized) or based solely on the
142
characteristics of the services offered-potential (Delamater, et al. 2012).. In whatever area, it is viewed; the motive behind accessibility studies is geared towards good assessment and evaluation thereby accelerating opportunities for fruitful decision-making and planning, helping policy makers to arrive at a rationalised decision to ensure equitable distribution of resources and effective services delivery.
Data model
It is defined “as the formalised equivalent of conceptual model used by people to perceived geographical phenomena” (Borough & McDonnell 1998). The nerve centre of any GIS is the data model, which is a set of constructs for representing objects and processes in the digital environment of the computer. The GIS users interact with the operational GIS so as to carry out a number of tasks such as making maps, querying databases, facility site location and proximity analysis among others. Since the analysis to be perform in order to understanding the real world varies, the decision and choice of a given data model is influence by the nature of the real world phenomena being investigated. Because these phenomena have different characteristics, there is no single type of all-encompassing GIS data model that is best for all circumstances (Longley, et al. 2010).
Network (Vector) Model
In the network data model each objects in the real world first classified in the 2-D case point, lines, polygon or area. Points (e.g., wells, retail stores, hospital) are recorded as single coordinates pairs, lines (e.g., roads, streams) as a series of ordered coordinates pairs (also called polylines) and polygons (e.g., census tracts, soil areas) as one or more line segments that close to form polygon area. Much precision is associated with this model because vector data structure allows us to code the spatial characteristics and relationships between objects (points, lines, polygons) explicitly (i.e. topology). Therefore, network analysis which connotes a system of lines topologically structured is effective to understanding the spatial distribution and relationships of people to health facility. For instance, the network data model tries to reflect the actual vehicular travel time or distance considering that road segments (edges) are connected at road intersections (nodes), upholding real-world connectivity among locations ((Longley, et al. 2010: Delamater, et al. 2012).
Raster Model
Raster model represents geographic phenomena by array of rectangular cells or grids usually squared. The variation within the data is expressed by assigning properties or attributes to these cells (Longley, et al. 2010). Raster model is regarded as one of the attractive model for creating service areas, especially in regions without an all-encompassing transportation network (Delamater, et al. 2012).
METHOD AND PROCEDURES
The study area
Kebbi state is one of the seven states of the north-western geopolitical zone. It was carved out of the Sokoto state in August 27, 1991. Its capital is Birnin-Kebbi. The state composed of up to 35 districts divided into four emirates (Gwandu, Argungu, Zuru, and Yauri). Kebbi derived its name from the 14th century “KEBBI KINGDOM” which was a province of the former Songhai Empire. The state occupies 37,727.97 square kilometres. It bordered Sokoto state in the North-Eastern part, Zamfara state on the Eastern part and Niger state on the south part and Republic of Niger on the Western part. The population of the people (predominantly rural) was 3,256,541 according to 2006 official census. Climate of the area is tropical continental type, thus, agriculture is the mainstay of
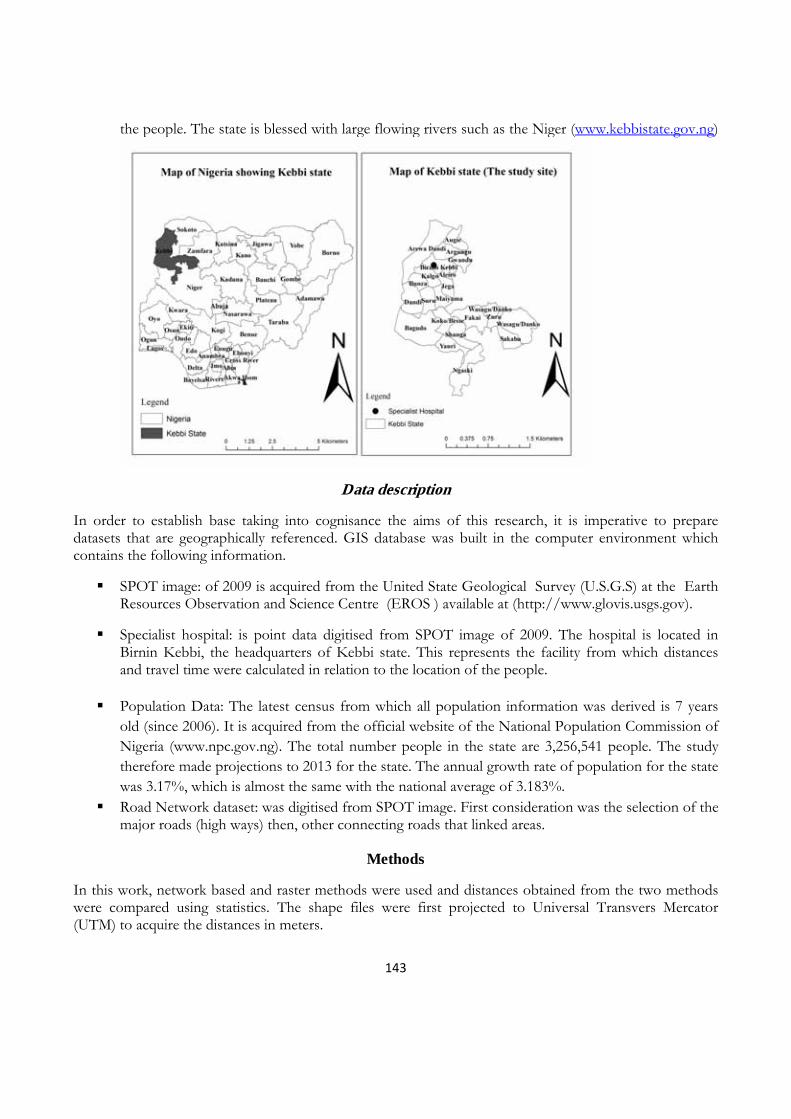
143
the people. The state is blessed with large flowing rivers such as the Niger (www.kebbistate.gov.ng)
Data description
In order to establish base taking into cognisance the aims of this research, it is imperative to prepare datasets that are geographically referenced. GIS database was built in the computer environment which contains the following information.
SPOT image: of 2009 is acquired from the United State Geological Survey (U.S.G.S) at the Earth Resources Observation and Science Centre (EROS ) available at (http://www.glovis.usgs.gov).
Specialist hospital: is point data digitised from SPOT image of 2009. The hospital is located in Birnin Kebbi, the headquarters of Kebbi state. This represents the facility from which distances and travel time were calculated in relation to the location of the people.
Population Data: The latest census from which all population information was derived is 7 years old (since 2006). It is acquired from the official website of the National Population Commission of Nigeria (www.npc.gov.ng). The total number people in the state are 3,256,541 people. The study therefore made projections to 2013 for the state. The annual growth rate of population for the state was 3.17%, which is almost the same with the national average of 3.183%.
Road Network dataset: was digitised from SPOT image. First consideration was the selection of the major roads (high ways) then, other connecting roads that linked areas.
Methods
In this work, network based and raster methods were used and distances obtained from the two methods were compared using statistics. The shape files were first projected to Universal Transvers Mercator (UTM) to acquire the distances in meters.
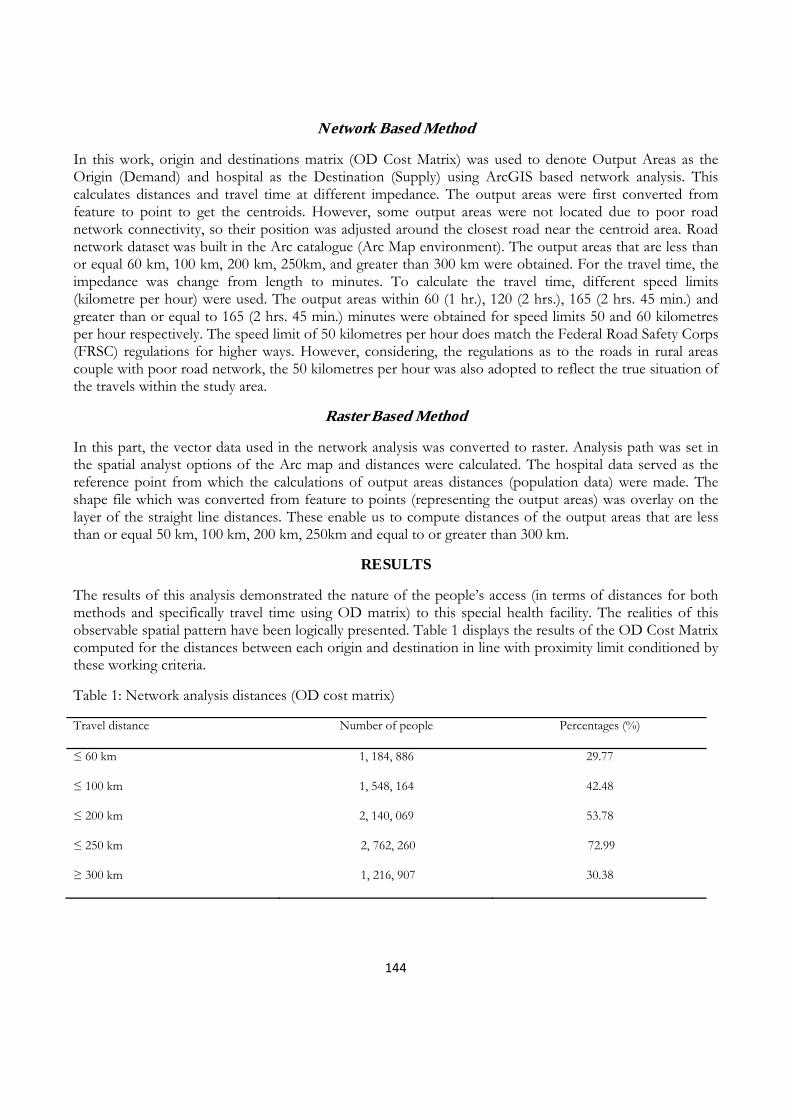
144
Network Based Method
In this work, origin and destinations matrix (OD Cost Matrix) was used to denote Output Areas as the Origin (Demand) and hospital as the Destination (Supply) using ArcGIS based network analysis. This calculates distances and travel time at different impedance. The output areas were first converted from feature to point to get the centroids. However, some output areas were not located due to poor road network connectivity, so their position was adjusted around the closest road near the centroid area. Road network dataset was built in the Arc catalogue (Arc Map environment). The output areas that are less than or equal 60 km, 100 km, 200 km, 250km, and greater than 300 km were obtained. For the travel time, the impedance was change from length to minutes. To calculate the travel time, different speed limits (kilometre per hour) were used. The output areas within 60 (1 hr.), 120 (2 hrs.), 165 (2 hrs. 45 min.) and greater than or equal to 165 (2 hrs. 45 min.) minutes were obtained for speed limits 50 and 60 kilometres per hour respectively. The speed limit of 50 kilometres per hour does match the Federal Road Safety Corps (FRSC) regulations for higher ways. However, considering, the regulations as to the roads in rural areas couple with poor road network, the 50 kilometres per hour was also adopted to reflect the true situation of the travels within the study area.
Raster Based Method
In this part, the vector data used in the network analysis was converted to raster. Analysis path was set in the spatial analyst options of the Arc map and distances were calculated. The hospital data served as the reference point from which the calculations of output areas distances (population data) were made. The shape file which was converted from feature to points (representing the output areas) was overlay on the layer of the straight line distances. These enable us to compute distances of the output areas that are less than or equal 50 km, 100 km, 200 km, 250km and equal to or greater than 300 km.
RESULTS
The results of this analysis demonstrated the nature of the people’s access (in terms of distances for both methods and specifically travel time using OD matrix) to this special health facility. The realities of this observable spatial pattern have been logically presented. Table 1 displays the results of the OD Cost Matrix computed for the distances between each origin and destination in line with proximity limit conditioned by these working criteria.
Table 1: Network analysis distances (OD cost matrix)
Travel distance Number of people Percentages (%)
≤ 60 km 1, 184, 886 29.77
≤ 100 km 1, 548, 164 42.48
≤ 200 km 2, 140, 069 53.78
≤ 250 km 2, 762, 260 72.99
≥ 300 km 1, 216, 907 30.38
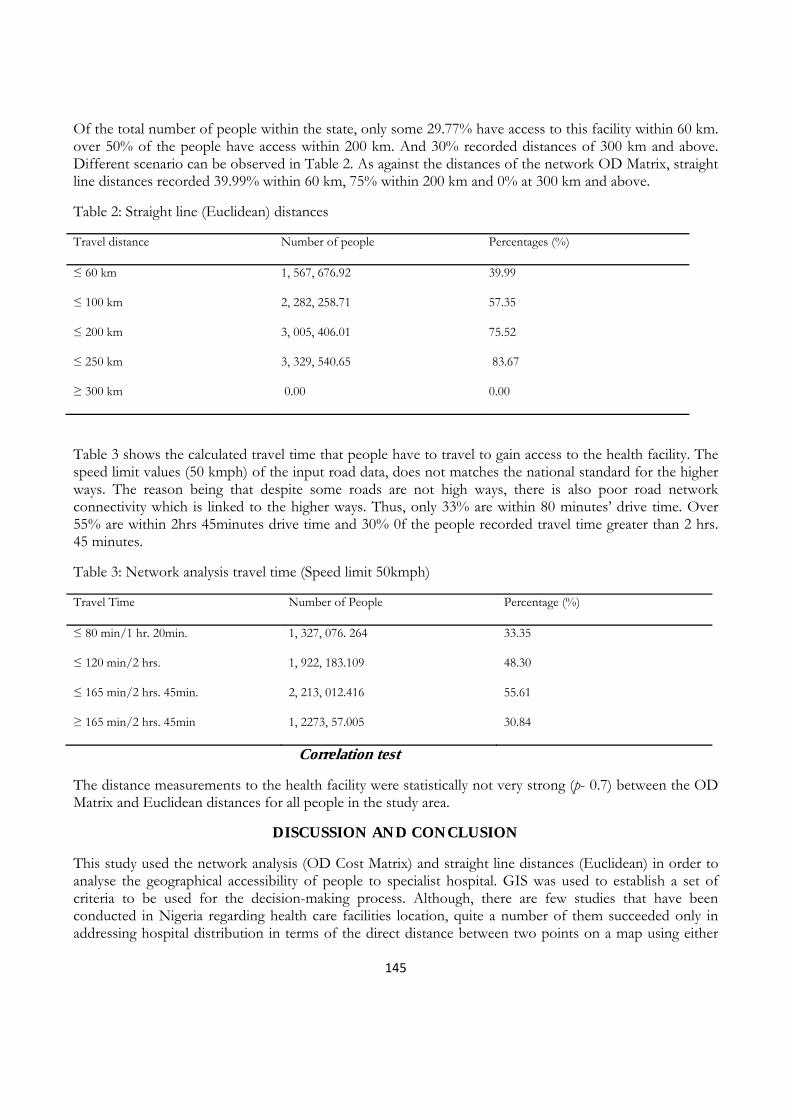
145
Of the total number of people within the state, only some 29.77% have access to this facility within 60 km. over 50% of the people have access within 200 km. And 30% recorded distances of 300 km and above. Different scenario can be observed in Table 2. As against the distances of the network OD Matrix, straight line distances recorded 39.99% within 60 km, 75% within 200 km and 0% at 300 km and above.
Table 2: Straight line (Euclidean) distances
Travel distance Number of people Percentages (%)
≤ 60 km 1, 567, 676.92 39.99
≤ 100 km 2, 282, 258.71 57.35
≤ 200 km 3, 005, 406.01 75.52
≤ 250 km 3, 329, 540.65 83.67
≥ 300 km 0.00 0.00
Table 3 shows the calculated travel time that people have to travel to gain access to the health facility. The speed limit values (50 kmph) of the input road data, does not matches the national standard for the higher ways. The reason being that despite some roads are not high ways, there is also poor road network connectivity which is linked to the higher ways. Thus, only 33% are within 80 minutes’ drive time. Over 55% are within 2hrs 45minutes drive time and 30% 0f the people recorded travel time greater than 2 hrs. 45 minutes.
Table 3: Network analysis travel time (Speed limit 50kmph)
Travel Time Number of People Percentage (%)
≤ 80 min/1 hr. 20min. 1, 327, 076. 264 33.35
≤ 120 min/2 hrs. 1, 922, 183.109 48.30
≤ 165 min/2 hrs. 45min. 2, 213, 012.416 55.61
≥ 165 min/2 hrs. 45min 1, 2273, 57.005 30.84
Correlation test
The distance measurements to the health facility were statistically not very strong (p- 0.7) between the OD Matrix and Euclidean distances for all people in the study area.
DISCUSSION AND CONCLUSION
This study used the network analysis (OD Cost Matrix) and straight line distances (Euclidean) in order to analyse the geographical accessibility of people to specialist hospital. GIS was used to establish a set of criteria to be used for the decision-making process. Although, there are few studies that have been conducted in Nigeria regarding health care facilities location, quite a number of them succeeded only in addressing hospital distribution in terms of the direct distance between two points on a map using either
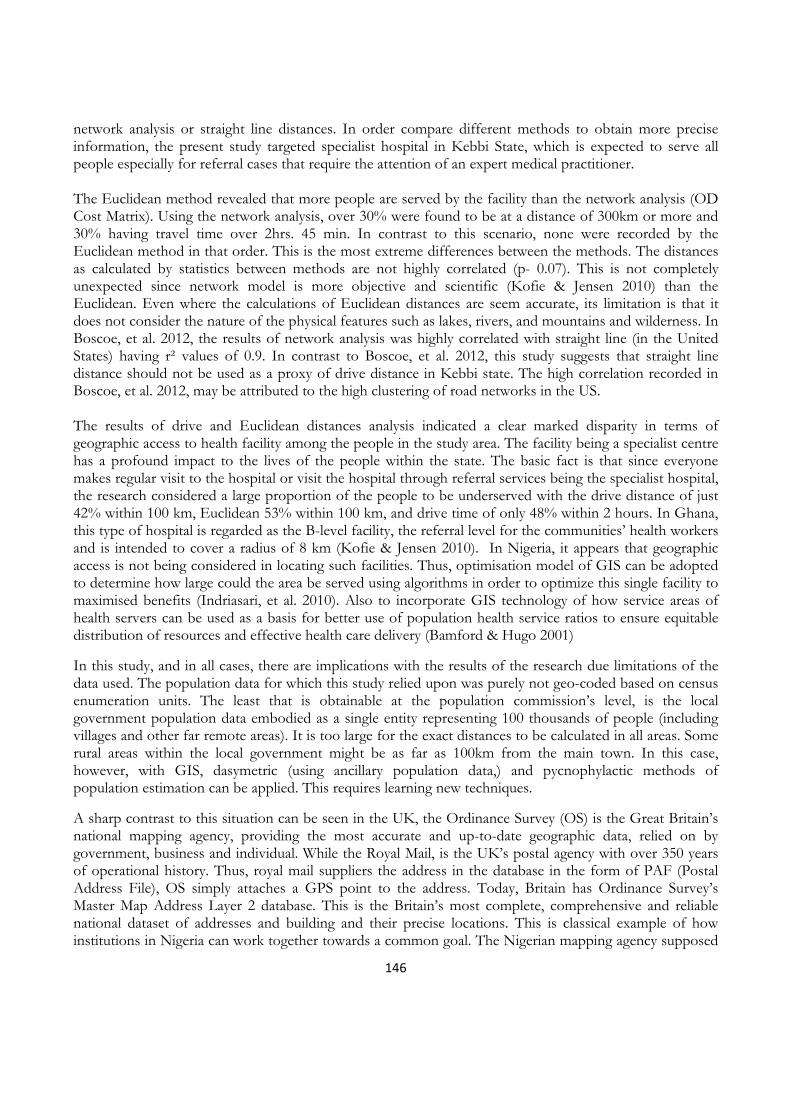
146
network analysis or straight line distances. In order compare different methods to obtain more precise information, the present study targeted specialist hospital in Kebbi State, which is expected to serve all people especially for referral cases that require the attention of an expert medical practitioner. The Euclidean method revealed that more people are served by the facility than the network analysis (OD Cost Matrix). Using the network analysis, over 30% were found to be at a distance of 300km or more and 30% having travel time over 2hrs. 45 min. In contrast to this scenario, none were recorded by the Euclidean method in that order. This is the most extreme differences between the methods. The distances as calculated by statistics between methods are not highly correlated (p- 0.07). This is not completely unexpected since network model is more objective and scientific (Kofie & Jensen 2010) than the Euclidean. Even where the calculations of Euclidean distances are seem accurate, its limitation is that it does not consider the nature of the physical features such as lakes, rivers, and mountains and wilderness. In Boscoe, et al. 2012, the results of network analysis was highly correlated with straight line (in the United States) having r² values of 0.9. In contrast to Boscoe, et al. 2012, this study suggests that straight line distance should not be used as a proxy of drive distance in Kebbi state. The high correlation recorded in Boscoe, et al. 2012, may be attributed to the high clustering of road networks in the US. The results of drive and Euclidean distances analysis indicated a clear marked disparity in terms of geographic access to health facility among the people in the study area. The facility being a specialist centre has a profound impact to the lives of the people within the state. The basic fact is that since everyone makes regular visit to the hospital or visit the hospital through referral services being the specialist hospital, the research considered a large proportion of the people to be underserved with the drive distance of just 42% within 100 km, Euclidean 53% within 100 km, and drive time of only 48% within 2 hours. In Ghana, this type of hospital is regarded as the B-level facility, the referral level for the communities’ health workers and is intended to cover a radius of 8 km (Kofie & Jensen 2010). In Nigeria, it appears that geographic access is not being considered in locating such facilities. Thus, optimisation model of GIS can be adopted to determine how large could the area be served using algorithms in order to optimize this single facility to maximised benefits (Indriasari, et al. 2010). Also to incorporate GIS technology of how service areas of health servers can be used as a basis for better use of population health service ratios to ensure equitable distribution of resources and effective health care delivery (Bamford & Hugo 2001)
In this study, and in all cases, there are implications with the results of the research due limitations of the data used. The population data for which this study relied upon was purely not geo-coded based on census enumeration units. The least that is obtainable at the population commission’s level, is the local government population data embodied as a single entity representing 100 thousands of people (including villages and other far remote areas). It is too large for the exact distances to be calculated in all areas. Some rural areas within the local government might be as far as 100km from the main town. In this case, however, with GIS, dasymetric (using ancillary population data,) and pycnophylactic methods of population estimation can be applied. This requires learning new techniques.
A sharp contrast to this situation can be seen in the UK, the Ordinance Survey (OS) is the Great Britain’s national mapping agency, providing the most accurate and up-to-date geographic data, relied on by government, business and individual. While the Royal Mail, is the UK’s postal agency with over 350 years of operational history. Thus, royal mail suppliers the address in the database in the form of PAF (Postal Address File), OS simply attaches a GPS point to the address. Today, Britain has Ordinance Survey’s Master Map Address Layer 2 database. This is the Britain’s most complete, comprehensive and reliable national dataset of addresses and building and their precise locations. This is classical example of how institutions in Nigeria can work together towards a common goal. The Nigerian mapping agency supposed
147
to be the equivalence UK’s OS while NIPOST is the Nigerian equivalence of UK’s Royal Mail. (Ajala, 2013).These data are very enormous and can be used not only for research in geographic access of facility location but also for banks, insurance company, utilities, transport, emergency services and crime to mention just a few. This is really a milestone and will no doubt increase the quality and reliable of similar researches.
In conclusion, despite the shortcomings of the data, the use of network analysis is highly recommended and that the findings of this research are still useful. Thus, the analytical methods introduced in this study can be adopted in health service provision for good decision and policy making to ensure adequate access to facilities and effective health care delivery system.
REFERENCES
Ajala, I. (2013, May 20). National address gazeteer of Nigeria- An aid to national development and a100 million missed business opportunities for Nigerian postal agency & office of the surveyor general of Nigeria . Lagos, Nigeria
Allen, C. (2013, June 23). Using raster GIS to evaluate hospital catchment areas based on travel Time in North Central Massachusetts and South Central New Hampshire.
Bamford, E., & Hugo, G. (2001). Identifying gaps in health service. 6th National Rural Health Conference. Canberra.
Borrough, P., & McDonnell, R. (1998). Principles of Geographic Information Systems, . Oxford: OUP.
Boscoe , F. P., Henry , K. A., & Zdeb, M. S. (2012). A Nationwide comparison of driving distance versus straight-line distance. The proffessional Geographer, 188-196.
Campagna, M. (2006). GIS for sustainable development. United State of America: Taylor and Francis Group.
Comber, A., Brunsdon, C., & Green, E. (2008). Using a GIS-based network analysis to determine urban greenspace accessibility for different ethnic and religious groups.. Landscape and Planning, 103-114.
Comber, A. J., Brunsdon, c., Hardy, J., & Radburn, R. (2009). Using GIS based network analysis and Optimisation routines to evaluate service provision: a case study of the UK post offfices. Applied Spatial Analysis and Policy, 47-64.
Delamater, P. L., Messina, J. P., Shortridge, A. M., & Grady, S. C. (2012). Measuring geographic access to health care: raster and network-based methods. International Journal of Health Geographics, 11-15.
Doriwala, H., & Shah, N. (2010). GIS- Based analysis of facility provision accessible to different socio-economic groups in surat city. World Applied Sciences, 740-745.
Galleria Media Limited. (2013, 06 10). Nigeria Galleria. Retrieved from http://www.kebbistate.gov.ng.
Higgs, G. (2004). A literature review of the use of GIS-Based measures of access to health care services. Health Services and Outcomes Research Methodology, 119-139.
148
Indriasari , V., Mahmud , A. R., Ahmad, N., & Shariff, A. M. (2010). Maximal service area problem for optimal siting of emergency facilities. International Journal of Geographical Science, 213-230.
Jones, S. G., Ashby, A. J., & Naidoo, A. (2010). Spatial implications associated with using euclidean distance measurements and geographic centroid imputation in health. Health Serv Res, 316–327.
Keshkamat, S. (20007). Formulation and evaluation of transportation planning alternatives using spatial multi criteria assessment and network analysis: a case study of Via Baltic express way in Norteastern Poland. Poland.
Khan , A. A. (1992). An integrated approach to measuring potential spatial access to health care services. Socio-Economic Planning Sciences, 275-287.
Kofie, R. Y., & Jessen, L. M. (2001). Towards a framework for delineating sub-districts for primary health care administration in rural Ghana: A case study using GIS. Norwegian Journal of Geography, 26-33.
Langford , M., & Higgs, G. (2010). Accessibility and public service provision: evaluating the impacts of the Post Office Network Change Progamme in the UK. Royal Geographical Society, 585-601.
Liu , S., & Zhu, X. (2003). Accessibility Analyst: An integrated GIS tool for accessibility analysis in urban transportation planning. Environment and Planning, 105-124.
Longley, P. A., Goodchild, M. F., Maiguire, D. J., & Rhind, D. W. (2010). Geographical Information Systems and Science. U.S.A: John Wileys and Sons.
National Population Commission. (2013, 07 12). 2006 Population and Housing Census. Retrieved from http://www.npc.gov.ng.
Nwangwu, P. (2013). Health delivery in Nigeria: contribution of Nigerians in diaspora. France.
Ohta , K. A., Kobashi , G. B., Takano, S., Kagaya , S. D., Yamada, H., Minakami, H., & Yamamura, E. (2007). Analysis of the geographical accessibility of neurosurgical emergency hospitals in Sapporo city using GIS and AHP. International journal of geographical information science, 687-698.
Paecz, O. (2004). Network accessibility and the spatial distribution of economic activity of the Eastern Asia. Urban studies Journal Ltd, 2211-2230.
Penchansky , R., & Thomas, J. W. (1981). The concept of access: definition and relationship to consumer satisfaction. Medical care, 127-140.
Sasaki, S., Comber, A. J., Suzuki, H., & Brunsdon, C. (2010). Using genetic algorithms to optimise current and future health planning - the example of ambulance locations. International Journal of Health Geographics, 9-4.
United State Global Satellites . (2013, 02 26). Retrieved from global visualisation viewer: Http://www.glovis.usgs.gov.
149
IDENTIFYING THE MARKET AND INVESTMENT OPPORTUNITIES IN THE WIND
SECTOR: CASE STUDY OF IRAN
Sahar Ahmadi Partovi8, Sahar Kamalzadeh9
1. Insurance Research Centre, Sa`adat Abad, Western Sarv St. , next to Salman-e-Farsi Telecom., No 43. Tehran, Iran.,
2. Saipa Investment Group, Tehran, Northern Naft st. , on the corner of the 5th Alley, Sayan Building, the 6th floor, Tehran, Iran
Abstract
Regarding the limited reserves of fossil fuel energy, its increased consumption level along with accompanying pollutions, sole reliance on the available energy resources is not justifiable. Thus, the use of renewable, free and environment-friendly energy resources has been put on most government’s agendas. According to the fact that the wind energy industry enjoys loads of economic and social benefits in addition to electricity production, it is predicted to obtain a high share in the countries’ energy portfolios. Concerning Iran’s geological location – being situated on the South of Asia, between the East and the West, the hot regions of the South and the moderate ones in the North, and on the major air streams through Asia, Europe, Africa, the Atlantic and the Pacific oceans - it could be concluded that potentially, Iran has a high capability to exploit the wind energy resources. The current article considers the wind energy industry and its merits and demerits, conditions and predictions prevailing in the energy market, the potential for investment on the industry in Iran and also, the average expenses of the industry in the world.
Introduction
Energy is the first-hand prerequisite for improvement and development in the world today [1]. The need for wind energy is increasing, and this energy is turning to the main energy providing resource as it is both accessible and abundant everywhere in the world. According to the windy regions, electricity can be produced 13 times more than the current amount [2]. As one of the cleanest energies, the wind energy is presently the focus of special attention in the advanced countries, and has obtained the fastest-growing advance trend among the new energies [3]. Great many factors are influential in the wind energy development, namely concentration of the international community on finding substitute energies due to air and environment pollution problems caused by the fossil fuels, scarce and limited available fuels, their insecurity, high price fluctuations and inability to be renewed [4].
8 Sahar Ahmadi Partovi, MA in commercial management, Allameh Tabatabaei University 9 Sahar Kamalzadeh, MA in finance, University of Tehran

150
The wind energy market enjoys a very high potential, and it is advancing at the annual rate of approximately 30% [5]. The market is intensely competitive. While the leading wind turbine manufacturers are mostly European and Europe was ranked first in the world until 2011 holding a started production capability equal to 93 MW, the Asian manufacturers are predicted to outmaneuver their European opponents [6]. The US is also increasing energy production from its renewable resources based on a definite perspective, so that the ratio of electricity production from wind energy to the total produced electricity has increased to 1.7% in 2007 compared with less than 1% in 2003 [7], and it is going to mount to 20% by the year 2030 [8]. On the other hand, since the Industrial Revolution, human activities, namely the use of fossil fuels for generating electricity, has been a probable cause of climate change. One of the solutions brought up in this field, which is being vigorously pursued nowadays, is exploitation of the renewable and environment-friendly energy resources such as wind. The use of wind energy emits no pollutants and doesn’t lead to the greenhouse effect. All the same, the wind farms have already been able to produce electrical energy at a competitive cost with the expenses of producing such energy from fossil fuels [9]. In addition to the above-cited, abundance of the wind energy across the globe has made it a noteworthy replacement for fossil fuels. Regarding the mentioned items, the prominence of investing in this industry becomes more and more obvious.
After a short description of the wind energy, wind turbines and the influential factors in their exploitation, the current article tends to consider the international trends prevailing in the energy market, its growth rate, future actual and potential markets and the key players on this industry in the world and the Middle East, and then examines the potential and capabilities, and investment costs of the wind energy.
The Wind Energy; Merits and Demerits
Wind is the horizontal movement of the air on the ground. The difference of air pressure between two points causes wind. The pressure difference is itself a result of the difference of the earth temperature [10]. Wind is made by sunshine, as well as the other energy resources like coal, crude and natural gas. The wind is called “another solar energy” by some wind energy supporters [11]. The huge resource of wind energy has some advantages and disadvantages as well as the other sources, among which the followings are worth to be considered:
- The Merits of the Wind Energy:
The wind energy is abundant and renewable. Unlike oil and gas, the wind energy will never be exhausted. Using this energy lessens our reliance on the other expensive, non-renewable energies [1]. The electricity produced by the turbines could be used by hybrid cars and replaced with diesel. Using the wind could also reduce our dependence upon nuclear energy and help produce healthier and safer types of energy. It could reduce global warming and the devastating climate changes as well, and it could also result in decreasing acid rains, from which our country is suffering. The distinguishing feature is that wind energy is not under the control of governments or large firms. As a result, using this energy will ease the international political tensions [11].
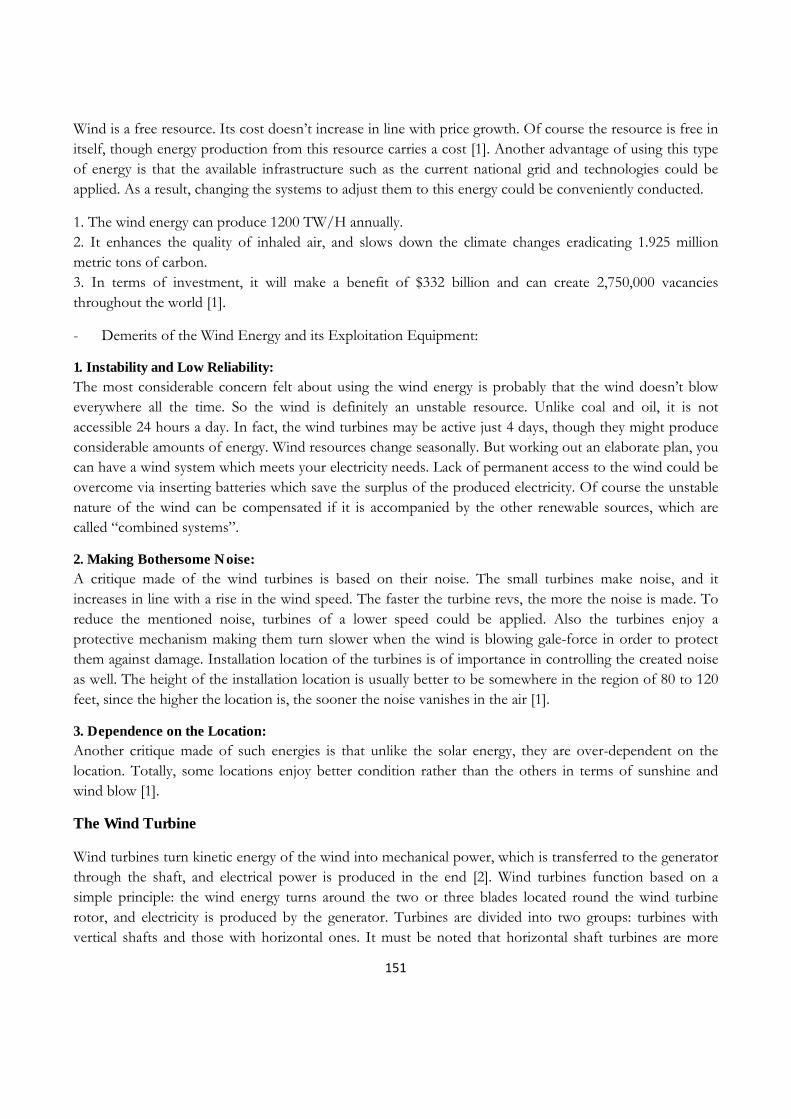
151
Wind is a free resource. Its cost doesn’t increase in line with price growth. Of course the resource is free in itself, though energy production from this resource carries a cost [1]. Another advantage of using this type of energy is that the available infrastructure such as the current national grid and technologies could be applied. As a result, changing the systems to adjust them to this energy could be conveniently conducted.
1. The wind energy can produce 1200 TW/H annually. 2. It enhances the quality of inhaled air, and slows down the climate changes eradicating 1.925 million metric tons of carbon. 3. In terms of investment, it will make a benefit of $332 billion and can create 2,750,000 vacancies throughout the world [1].
- Demerits of the Wind Energy and its Exploitation Equipment:
1. Instability and Low Reliability: The most considerable concern felt about using the wind energy is probably that the wind doesn’t blow everywhere all the time. So the wind is definitely an unstable resource. Unlike coal and oil, it is not accessible 24 hours a day. In fact, the wind turbines may be active just 4 days, though they might produce considerable amounts of energy. Wind resources change seasonally. But working out an elaborate plan, you can have a wind system which meets your electricity needs. Lack of permanent access to the wind could be overcome via inserting batteries which save the surplus of the produced electricity. Of course the unstable nature of the wind can be compensated if it is accompanied by the other renewable sources, which are called “combined systems”.
2. Making Bothersome Noise: A critique made of the wind turbines is based on their noise. The small turbines make noise, and it increases in line with a rise in the wind speed. The faster the turbine revs, the more the noise is made. To reduce the mentioned noise, turbines of a lower speed could be applied. Also the turbines enjoy a protective mechanism making them turn slower when the wind is blowing gale-force in order to protect them against damage. Installation location of the turbines is of importance in controlling the created noise as well. The height of the installation location is usually better to be somewhere in the region of 80 to 120 feet, since the higher the location is, the sooner the noise vanishes in the air [1].
3. Dependence on the Location: Another critique made of such energies is that unlike the solar energy, they are over-dependent on the location. Totally, some locations enjoy better condition rather than the others in terms of sunshine and wind blow [1].
The Wind Turbine
Wind turbines turn kinetic energy of the wind into mechanical power, which is transferred to the generator through the shaft, and electrical power is produced in the end [2]. Wind turbines function based on a simple principle: the wind energy turns around the two or three blades located round the wind turbine rotor, and electricity is produced by the generator. Turbines are divided into two groups: turbines with vertical shafts and those with horizontal ones. It must be noted that horizontal shaft turbines are more
152
common. The simplest scheme of wind turbines includes 3-blade wings, Nacelle, hub and a tower (post) [12]. Wind turbines are generally designed to last 20 years, and they have to be active for 120,000 seamless hours, while car engines are designed to last approximately 6,000 hours [13]. These turbines are also of a various range of capacities from a few watts to several megawatts, and their principal parameter is tower height and blade length [12]. The electricity output is the cube of the wind speed, i.e. if the wind speed doubles, the resulted energy will be 8 times more. Based on Albert Benz’s theory in 1919, a turbine can get 59% of the kinetic energy in the air, but only 40% to 45% of that is exploited practically due to dissipation, and the rest is wasted [14]. Thus, paying due attention to the wind system of the region is of importance when choosing the wind farm location. For instance, if the average of wind speed is less than the predicted speed by 10%, the energy output will reduce by 30% [11]. The height of the blades is very influential in the amount of energy output, since longer blades have more space to revolve around the rotor axle, and so, they make greater output. There’s an intense competition among the turbine maker companies in boosting energy production capacity of the turbines, so that we will observe a growing trend in this scale from 2011 to 2025 according to the predictions made by IHC company in market research and the wind energy strategies. Currently, the range of 1.5 to 2.5 MW faces a severe competition between the makers, but the challenge will be in the range of 3 MW and higher-capacity turbines from 2017 on, so that this range will hold 40% of the market in 2018 and about 55% in 2025 [15]. The purpose of continual improvement in the turbines is maximizing the amount of obtained energy from the winds, which requires strong rotors, longer blades and higher towers, developed electronic chips and a proper use of composite materials in the turbines [13].
Influential Factors in Demands for Wind Turbines
The first influential factor is the alternative methods of providing energy. Nowadays, the use of wind energy has been put on the agenda to meet the growing demand for energy. Wind is abundant, and also it is a clean energy. Installing the wind turbines hinges on governmental regulations concerning renewable energies and its capability to supply the wind projects financially, and the economic advantage of this energy depends entirely on the financial policies of the government.
Governmental Policies: One of really prominent factors is the government’s attitude toward the wind energy. For example, renewable portfolio standards have been passed in the US. The ratio of energy production through the wind is speculated between 10% and 25% in this regulation, and time intervals until 2015 and 2025 have been considered to achieve this ratio. Such regulations motivate establishing wind farms and increase the demands for installing wind turbines [16].
Energy Prices: Tax incentives, evolution of the wind technology and increase in the price of fossil fuels are the factors making the wind energy competitive in terms of price. The price of wind energy was $63 per megawatt in 1999, which amounted to $40 per megawatt in 2007 [17]. After the project installation is done, the other expenses are usually constant over time. But the price of electricity made through natural gas or coal undergoes fluctuations due to changes in fossil fuel prices. One of the important factors making the price of wind energy competitive rather than fossil fuels is “tax incentives” regarded for this industry. In United States the figure is 2.1 cent per 1 KW/h during the first 20 years of the turbines’ activity [18].
153
Financial Supply: There are a lot of ways to supply the projects. Some of them are provided via bank loans or partnership stocks. Some companies also invest on the wind energy to exploit its tax exemption in their other fields of activity [19].
Other Factors: Other factors like distribution capacity, wind energy alternation, financial policy stability, transportation certificates, wind farm locations, installing and maintaining responsibility and insurance of the turbines are influential in setting up the wind farms and later, in demands for the wind turbines[20].
Distribution Capacity: Wind farms are usually far away from the areas with high electricity demand. As a result, there are usually some difficulties distributing the electricity provided in such farms. In order to distribute the produced renewable energy, there needs to be intelligent grids that are able to pass around unstable loads as well. The need to more electricity networks is perceptible, and the barrier is financial supply and the difficulty of installing new lines [21].
Wind Alternation: Wind is a non-alternate source of energy, i.e. the energy output will differ relative to the wind in access. Energy saving systems could be applied to solve this problem [22].
Financial Policy Stability: In this domain, the governments’ policies in awarding tax credits needs to be stable in order not to demotivate the creditors to invest in this industry [23].
Turbine Transportation: The issue of wind turbine transportation is of a high importance in decision making. “Transportation costs” is a strategic and crucial item in the wind project management process [11]. Transporting the blades which are 30 to 40 meters length, using trucks, is a very complicated and professional matter. There are some restrictions on transporting turbines, blades and towers in some countries, so that required certificates need to be earned for transporting them from a city to another [1].
Locating Wind Energy Farm: The basic purpose is maximizing the total output of the wind energy farm, but the structure of the wind farm is influenced by the infrastructure; namely interior wiring from the wind turbines to the transformers, transportation routes, operation and maintenance costs. There are also some limitations in determining the optimum location, such as the minimum distance from residential areas, environmental protections, and the maximum allowed height [24]. Of course the problem is solved to a great extent nowadays by means of software designing the optimum structure very fast [25]. Another point that needs to be taken into consideration is the solidity of the soil under the turbines. The solidity is important and worth considering in measuring its bearing capacity. In fact, the purpose is making sure of the location suitability in terms of truck access to convey the blades, repair and maintenance issues and access to the network lines to transfer the provided electricity [24].
Access to the Network: Another factor that needs to be regarded in identifying the location is the access to the network, which affects the number of the installed turbines. As a result, the network capacity and its held voltage need to be insured [26]. Sometimes the electricity more than 20 MW obliges new capacity to be installed. The output of each turbine in the wind farm is different according to the wind alternation, distribution factor and electricity production range. Thus, it is really important to choose the best possible location to install the turbine, so that the maximum output is resulted and the interaction between different turbines is reduced [27].
154
Demand for Electricity: Nowadays the environmental effects of producing electricity have been examined and evaluated as the demand for energy, especially electricity, has sharply increased over past 100 years. In the past, high standards of life and the modern lifestyle used to be based on over-consuming energy. Nowadays the developed countries’ statistics show that the standards of life can rise apart from energy consumption [28]. The total demand for electricity was 20.2 × 10 KW/H in 2008. The major part of the demand was met by fossil fuels and nuclear energy. Just 2.8% of demanded energy has been provided via the renewable energies, which has undergone a small increase since 1999 [11].
Political Tools: Supportive policies are needed to prop up the renewable energy markets. Some of the policies could be: 1. Public sources for research and development plans, 2. Public resources for the projects, 3. Subsidies for investment costs, 4. Guaranteed prices for buying the produced electricity by the wind turbines, 5. Financial motives – like special bank loans of proper interest rates, 6. Tax incentives. Analyses of different markets show that a combination of the mentioned policies is really helpful in the wind energy market growth [11].
Installing and Starting Wind Turbines: This phase starts with wiring. Then the foundation is laid. Under the terms of the contract, the manufacturer transports all separate turbine parts to the farm and installs it. Then the experimental test is done and the turbines will start their permanent activity afterwards [29]. The manufacturer is usually in charge of repair and maintenance costs in the first two years of activity, and the faults and defects of the turbines are recognized [30]. After expiration of this period, the applicant can make use of the service providers in this field. For example, the wind turbines are checked every 2 or 4 years by independent experts. The time interval depends upon the size of the turbine, and existence of a service contract for them, or full service contracts are offered under which the manufacturer himself is responsible for maintenance, repair and sometimes replacement of the turbines [11].
Insurance of the Wind Turbines: The most prominent questions by the insurance companies are the type of risks and the person responsible for that. The manufacturer is in charge of all risks until he installs the turbines. The risk of wind turbines is that there is a possibility of disruption in their operation due to unexpected events over the whole stages of installation to maintenance after their start [31]. Sometimes the financial suppliers demand such insurances to make sure that the plan can afford its own expenses. Another type of insurance coverage is insurance of responsibility covering those incidents in which someone or something is damaged by the wind turbines. However, some of the risks cannot be ensured, e.g. a damage by the third party to the turbine, war, hazardous occurrences in the nuclear power plants, damages caused by installing equipment which has already been defective [11].
Wind Energy Market
Wind energy industry dates back to 1970s originally, when the first oil price shock occurred [1]. The industry rendered small as it couldn’t compete against the other traditional energy resources and on the other hand, there was no perceptible need for renewable energies [5]. Applying Danish technology in early 1980s, the turbine manufacturers started establishing 20 to 60 KW units which were 20 meters high. The wind energy market has started to grow since 1994, and it is still advancing at the annual average rate of about 30% [5]. The international need for the wind turbines has kept rising at a high growth rate, and it is
155
expected to surmount a value of $73.5 billion by 2015 [32]. Of course it should be noted that the growth rate is significantly different in various regions of the world. While the Asian markets have been growing at a rate of 60.6% until 2009 and 49.7% in 2010, the growth rate of the European markets, being somewhere around the region of 75.5% in 1999, has been decreasing to about 12.5% in 2010 [10].
The wind energy market is a consolidated one, i.e. the 10 leading manufacturers hold approximately 80% of the market [34] and Germany, Spain and Denmark generate over 75% of the wind energy products in Europe [35]. Wind turbine manufacturer-states are largely West-European, because the Europeans are the most experienced and expert in the world, and many companies have developed transferring their technology [5]. According to the regulations passed by the European Union, 20% of the energy required in the Union has to be produced from the renewable resources by 2020 [36]. Although Europe holds 96 GW out of the total 238 GW world started capacity by the end of 2011 [37], Asia is going to overtake Europe in terms of the started capacity by 2014 based on a prediction by the Global Wind Energy Council [38]. Chinese market is one of the most influential markets with an annual growth rate of more than 100% between 2006 and 2009, which was titled as the most booming wind turbine market in 2009 holding 13.15 GW started capacity. The started capacity reached 62 GW in 2011 [37]. The principal reason of such considerable improvement in the started capacity of Chinese market is passage of Renewable Energy Law in 2005 in this country, which obliges the networks to buy all the energy produced from renewable energy resources [7].
The wind energy market in the US was advancing at the rate of 39.8% in 2009, while the state intends to replace this energy with more than 75% of the imported oil from the Middle East applying innovations and advanced equipment. Holding a total share of 17.9% out of the world started capacity in 2011, the US ranks the second in the market [37]. The wind energy application plan is severely pursued in the US, so that 20% of American required energy is due to be produced by the wind turbines by 2030 [39]. Performance improvement and cost reduction are expected to occur in a way that in next two decades, capital expenses are reduced by 10% and the capacity increases by 15% [40].
The production capacity of the turbines needs to increase from 11.6 GW in 2006 to 300 GW in upcoming 23 years in order to provide 20% of the required electricity via the wind turbines. This level of growth requires an installation rate of 16 GW annually, started after 2018 [39].
According to 5-year prediction report of the industry prepared by the Global Wind Energy Council and issued at a conference in Copenhagen, the international wind industry expects the started capacity to reach 500 GW by the end of 2016. The total installation capacity is due to be 255 GW between 2012 and 2016. Of course the major part of this world growth will owe to Brazil and India. Latin America, Africa and Asia are going to be the key players of growth as well. Most of installation will be out of Europe and the trend will continue. Asia will become the biggest market holding the most installation relative to the other areas, so that it will have 118 GW by the year 2018. Asia will overtake Europe, which will itself be the leader of the market in 2013, and will amount to the total number of 200 GW [41]. After two decades of two or three-digit growth, Chinese market will calm down and will enjoy the same stability in the upcoming years. Indian market is estimated to get 5 GW of energy of this type by the end of 2015. European market will keep stable, and radical alteration and fluctuation seem improbable due to the clear policy framework of
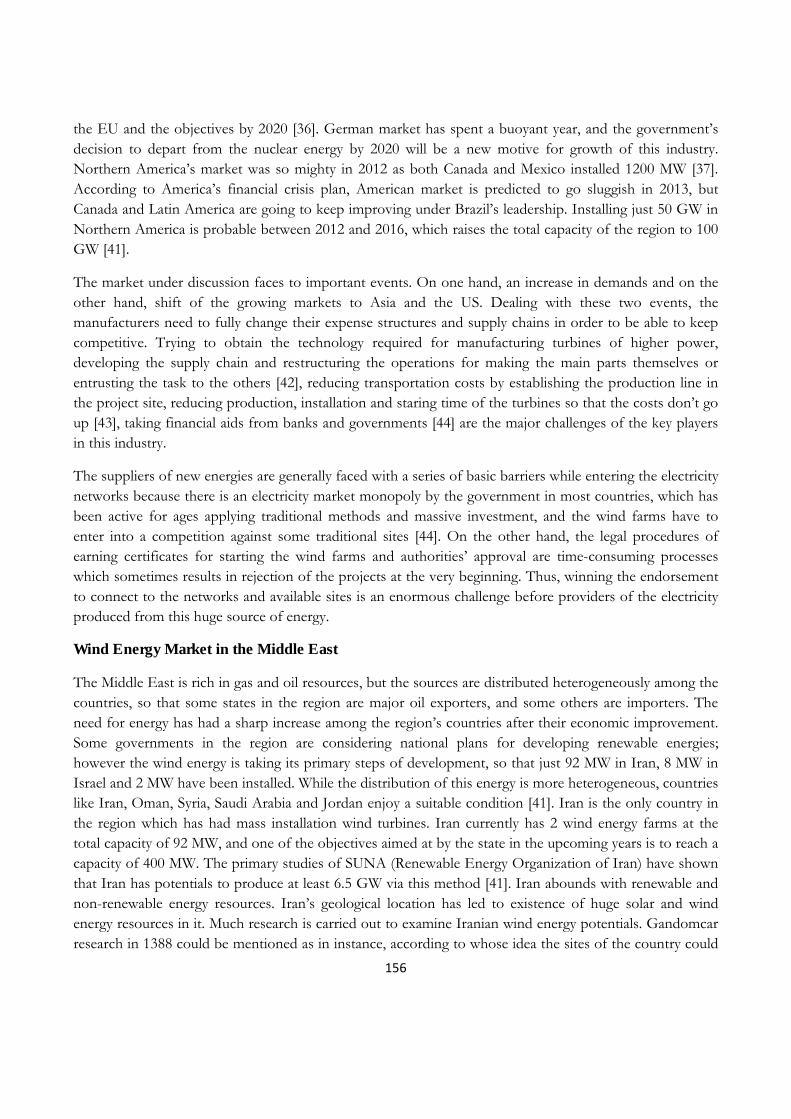
156
the EU and the objectives by 2020 [36]. German market has spent a buoyant year, and the government’s decision to depart from the nuclear energy by 2020 will be a new motive for growth of this industry. Northern America’s market was so mighty in 2012 as both Canada and Mexico installed 1200 MW [37]. According to America’s financial crisis plan, American market is predicted to go sluggish in 2013, but Canada and Latin America are going to keep improving under Brazil’s leadership. Installing just 50 GW in Northern America is probable between 2012 and 2016, which raises the total capacity of the region to 100 GW [41].
The market under discussion faces to important events. On one hand, an increase in demands and on the other hand, shift of the growing markets to Asia and the US. Dealing with these two events, the manufacturers need to fully change their expense structures and supply chains in order to be able to keep competitive. Trying to obtain the technology required for manufacturing turbines of higher power, developing the supply chain and restructuring the operations for making the main parts themselves or entrusting the task to the others [42], reducing transportation costs by establishing the production line in the project site, reducing production, installation and staring time of the turbines so that the costs don’t go up [43], taking financial aids from banks and governments [44] are the major challenges of the key players in this industry.
The suppliers of new energies are generally faced with a series of basic barriers while entering the electricity networks because there is an electricity market monopoly by the government in most countries, which has been active for ages applying traditional methods and massive investment, and the wind farms have to enter into a competition against some traditional sites [44]. On the other hand, the legal procedures of earning certificates for starting the wind farms and authorities’ approval are time-consuming processes which sometimes results in rejection of the projects at the very beginning. Thus, winning the endorsement to connect to the networks and available sites is an enormous challenge before providers of the electricity produced from this huge source of energy.
Wind Energy Market in the Middle East
The Middle East is rich in gas and oil resources, but the sources are distributed heterogeneously among the countries, so that some states in the region are major oil exporters, and some others are importers. The need for energy has had a sharp increase among the region’s countries after their economic improvement. Some governments in the region are considering national plans for developing renewable energies; however the wind energy is taking its primary steps of development, so that just 92 MW in Iran, 8 MW in Israel and 2 MW have been installed. While the distribution of this energy is more heterogeneous, countries like Iran, Oman, Syria, Saudi Arabia and Jordan enjoy a suitable condition [41]. Iran is the only country in the region which has had mass installation wind turbines. Iran currently has 2 wind energy farms at the total capacity of 92 MW, and one of the objectives aimed at by the state in the upcoming years is to reach a capacity of 400 MW. The primary studies of SUNA (Renewable Energy Organization of Iran) have shown that Iran has potentials to produce at least 6.5 GW via this method [41]. Iran abounds with renewable and non-renewable energy resources. Iran’s geological location has led to existence of huge solar and wind energy resources in it. Much research is carried out to examine Iranian wind energy potentials. Gandomcar research in 1388 could be mentioned as in instance, according to whose idea the sites of the country could
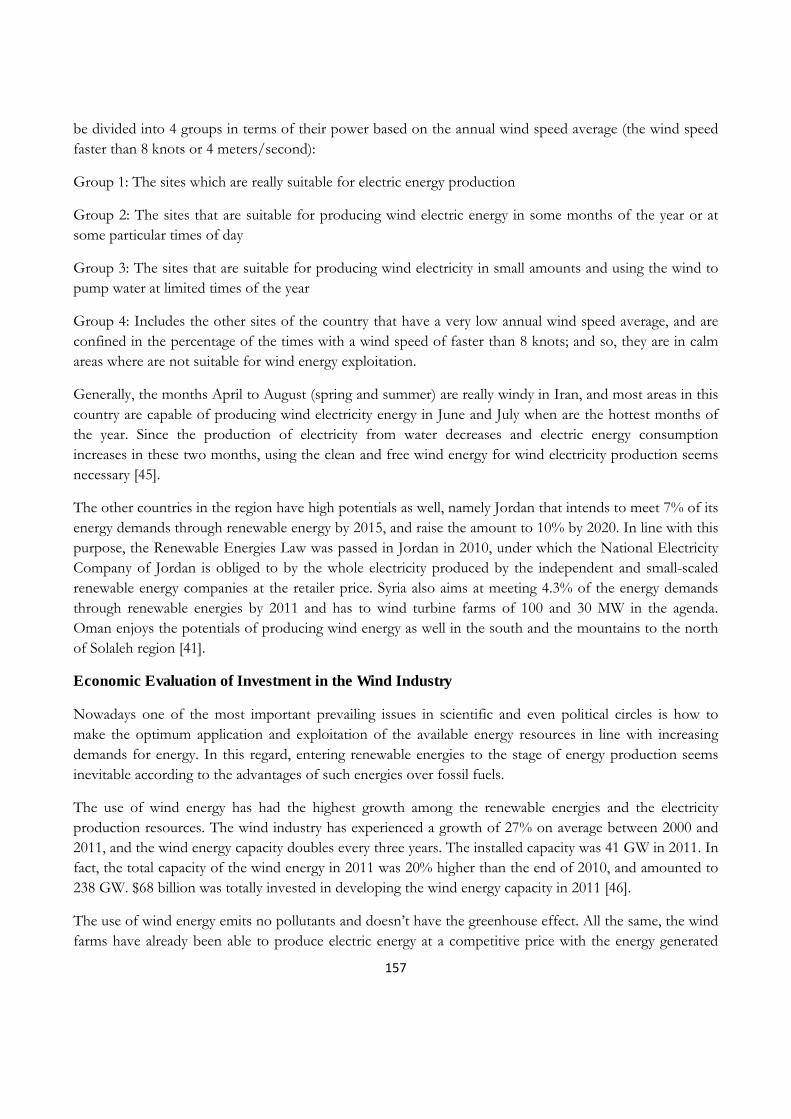
157
be divided into 4 groups in terms of their power based on the annual wind speed average (the wind speed faster than 8 knots or 4 meters/second):
Group 1: The sites which are really suitable for electric energy production
Group 2: The sites that are suitable for producing wind electric energy in some months of the year or at some particular times of day
Group 3: The sites that are suitable for producing wind electricity in small amounts and using the wind to pump water at limited times of the year
Group 4: Includes the other sites of the country that have a very low annual wind speed average, and are confined in the percentage of the times with a wind speed of faster than 8 knots; and so, they are in calm areas where are not suitable for wind energy exploitation.
Generally, the months April to August (spring and summer) are really windy in Iran, and most areas in this country are capable of producing wind electricity energy in June and July when are the hottest months of the year. Since the production of electricity from water decreases and electric energy consumption increases in these two months, using the clean and free wind energy for wind electricity production seems necessary [45].
The other countries in the region have high potentials as well, namely Jordan that intends to meet 7% of its energy demands through renewable energy by 2015, and raise the amount to 10% by 2020. In line with this purpose, the Renewable Energies Law was passed in Jordan in 2010, under which the National Electricity Company of Jordan is obliged to by the whole electricity produced by the independent and small-scaled renewable energy companies at the retailer price. Syria also aims at meeting 4.3% of the energy demands through renewable energies by 2011 and has to wind turbine farms of 100 and 30 MW in the agenda. Oman enjoys the potentials of producing wind energy as well in the south and the mountains to the north of Solaleh region [41].
Economic Evaluation of Investment in the Wind Industry
Nowadays one of the most important prevailing issues in scientific and even political circles is how to make the optimum application and exploitation of the available energy resources in line with increasing demands for energy. In this regard, entering renewable energies to the stage of energy production seems inevitable according to the advantages of such energies over fossil fuels.
The use of wind energy has had the highest growth among the renewable energies and the electricity production resources. The wind industry has experienced a growth of 27% on average between 2000 and 2011, and the wind energy capacity doubles every three years. The installed capacity was 41 GW in 2011. In fact, the total capacity of the wind energy in 2011 was 20% higher than the end of 2010, and amounted to 238 GW. $68 billion was totally invested in developing the wind energy capacity in 2011 [46].
The use of wind energy emits no pollutants and doesn’t have the greenhouse effect. All the same, the wind farms have already been able to produce electric energy at a competitive price with the energy generated
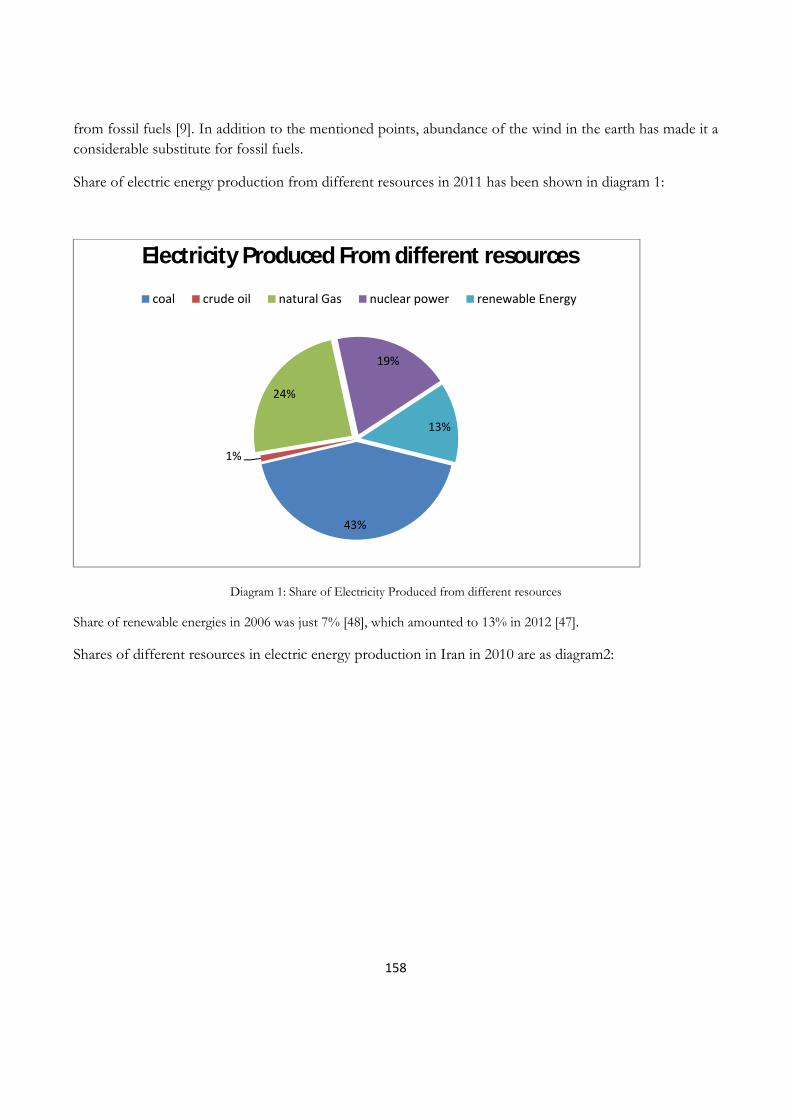
158
from fossil fuels [9]. In addition to the mentioned points, abundance of the wind in the earth has made it a considerable substitute for fossil fuels.
Share of electric energy production from different resources in 2011 has been shown in diagram 1:
Diagram 1: Share of Electricity Produced from different resources
Share of renewable energies in 2006 was just 7% [48], which amounted to 13% in 2012 [47].
Shares of different resources in electric energy production in Iran in 2010 are as diagram2:
43%
1%
24%
19%
13%
Electricity Produced From different resources
coal crude oil natural Gas nuclear power renewable Energy
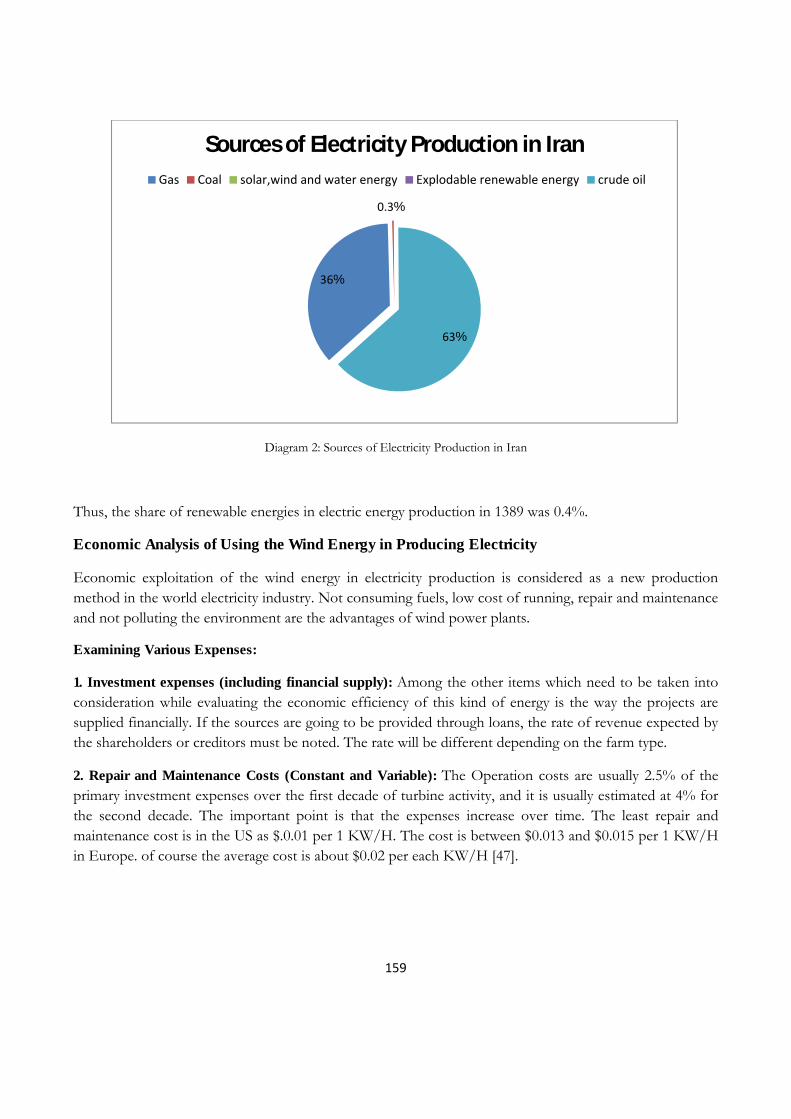
159
Diagram 2: Sources of Electricity Production in Iran
Thus, the share of renewable energies in electric energy production in 1389 was 0.4%.
Economic Analysis of Using the Wind Energy in Producing Electricity
Economic exploitation of the wind energy in electricity production is considered as a new production method in the world electricity industry. Not consuming fuels, low cost of running, repair and maintenance and not polluting the environment are the advantages of wind power plants.
Examining Various Expenses:
1. Investment expenses (including financial supply): Among the other items which need to be taken into consideration while evaluating the economic efficiency of this kind of energy is the way the projects are supplied financially. If the sources are going to be provided through loans, the rate of revenue expected by the shareholders or creditors must be noted. The rate will be different depending on the farm type.
2. Repair and Maintenance Costs (Constant and Variable): The Operation costs are usually 2.5% of the primary investment expenses over the first decade of turbine activity, and it is usually estimated at 4% for the second decade. The important point is that the expenses increase over time. The least repair and maintenance cost is in the US as $.0.01 per 1 KW/H. The cost is between $0.013 and $0.015 per 1 KW/H in Europe. of course the average cost is about $0.02 per each KW/H [47].
36%
0.3%
63%
Sources of Electricity Production in IranGas Coal solar,wind and water energy Explodable renewable energy crude oil
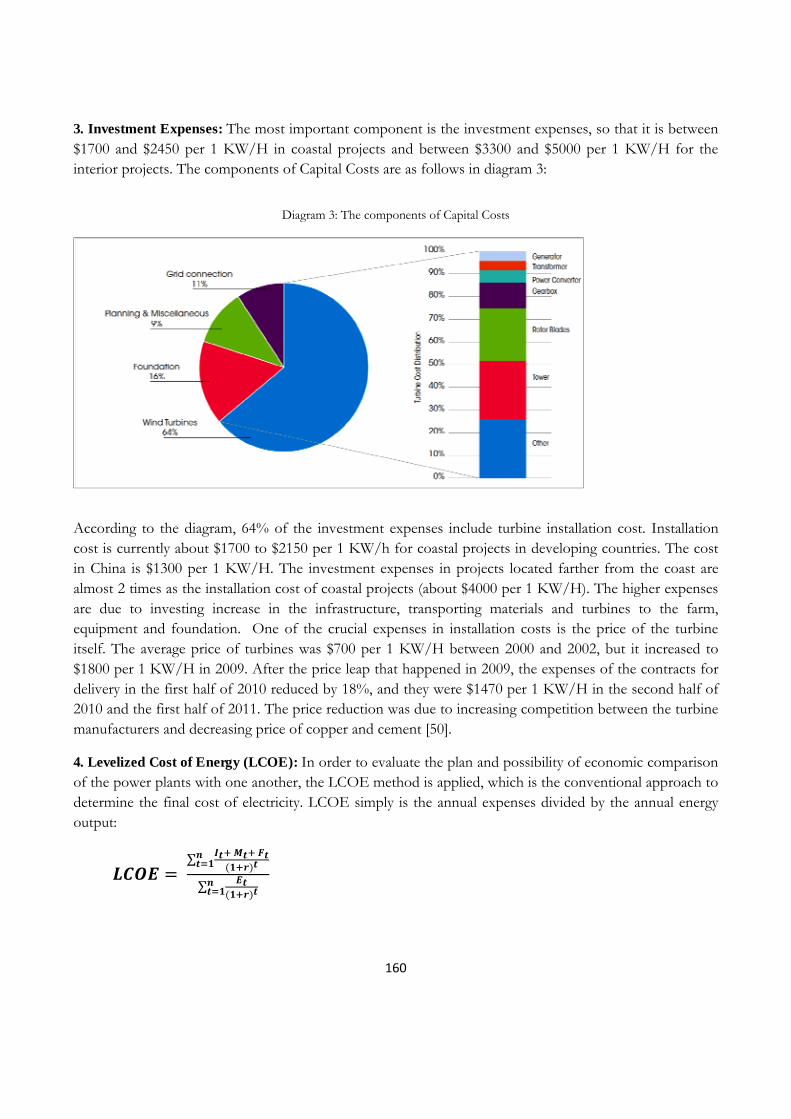
160
3. Investment Expenses: The most important component is the investment expenses, so that it is between $1700 and $2450 per 1 KW/H in coastal projects and between $3300 and $5000 per 1 KW/H for the interior projects. The components of Capital Costs are as follows in diagram 3:
Diagram 3: The components of Capital Costs
According to the diagram, 64% of the investment expenses include turbine installation cost. Installation cost is currently about $1700 to $2150 per 1 KW/h for coastal projects in developing countries. The cost in China is $1300 per 1 KW/H. The investment expenses in projects located farther from the coast are almost 2 times as the installation cost of coastal projects (about $4000 per 1 KW/H). The higher expenses are due to investing increase in the infrastructure, transporting materials and turbines to the farm, equipment and foundation. One of the crucial expenses in installation costs is the price of the turbine itself. The average price of turbines was $700 per 1 KW/H between 2000 and 2002, but it increased to $1800 per 1 KW/H in 2009. After the price leap that happened in 2009, the expenses of the contracts for delivery in the first half of 2010 reduced by 18%, and they were $1470 per 1 KW/H in the second half of 2010 and the first half of 2011. The price reduction was due to increasing competition between the turbine manufacturers and decreasing price of copper and cement [50].
4. Levelized Cost of Energy (LCOE): In order to evaluate the plan and possibility of economic comparison of the power plants with one another, the LCOE method is applied, which is the conventional approach to determine the final cost of electricity. LCOE simply is the annual expenses divided by the annual energy output:
=∑ ∑
161
is the investment costs in the year t. is the repair and maintenance price in the year t. is the fuel expenses in the year t. is the energy production in the year t. r is the reduction rate and n is the useful life of the system.
LCOE is in fact the electricity price that leads to equivalence of the project revenues and its expenses, on the condition that the investment revenue rate is equal to the reduction rate. Practically the investment revenues will rise if the energy price is higher than LCOE, but there will be a loss if the price is lower than LCOE [51].
In the US, the electricity production costs have decreased from $0.3 per 1 KW/H in 1984 to about $0.055 per 1 KW/H in 2005 [46]. In Europe a similar trend has occurred as well, so that the costs have decreased by about 40% between 1987 and 2006.
Of course, the costs have risen again owing to an increase in the costs of the turbines themselves and in the demands for wind energy. Recent research shows that currently the expense of the electricity made of the wind is less than $0.068 per 1 KW/H. Compared to $0.067 per 1 KW/H for energy based on coal and $0.056 per 1 KW/H energy based on gas [46], competitiveness of wind energy - as the source of providing electricity - with the other sources such as coal and gas is obvious.
Conclusion
Nowadays, regarding the growing importance of using renewable energies and technological advances proper exploitation of the wind energy and the other renewable resources is of great significance. According to the country’s need to electric energy and the vast extent of wind resources, increase of fuel prices in gas-fired and thermal power plants due to decreasing oil and gas supplies and removing the subsidies on oil products, wind electricity stations will be more justifiable in future relative to gas-fired and thermal power stations.
Considering the special geographical position of Iran, there are vast areas that could be regarded as significant resources for exploiting renewable energies, namely wind. Applying and developing the wind energy in the country could turn into a national obligation noting the available potentials.
References
1. Thomas Ackermann (2005), Wind Power in Power Systems, Royal Institute of Technology, John Wiley & Sons,ltd, England.
2. Chiras Dan (2010), Wind Power Basics, New Society Publishers, Canada. 3. Blair Salter (2008),” Wind Turbine Industry Analysis- A Background Document for Industry Attraction, K.T.
Industrial Development Society. 4. Wind Energy Multiyear program plan 2007-2012, Wind and Hydropower Technologies Program, US
Department of Energy Efficiency and Renewable Energy, 2007. 5. Anais Poncin, Lena Noëlck, Rémi Spinnewyn, Zheyu Huang, John Paul, Dominique Estampe (2011), SCOR
Supply chain benchmark- European Wind Turbine Manufacturers, BEM. 6. Global Wind Energy Council. China Total Installed Capacity. [online]. Available at
<http://www.gwec.net/index.php?id=125> 7. Based on MW of Electric Net Summer Capacity. EIA, U.S. Electric Net Summer Capacity, 2003–2007, 2009.
162
8. U.S. Department of Energy (DOE), Office of Energy Efficiency and Renewable Energy (EERE), 20% Wind Energy by 2030, 2008.
9. Global Wind Energy Outlook 2012, Global Wind Energy Council (GWEC). 10. Chelsea G. (1999), A Brief and somewhat Technical Introduction to Wind Energy for Newcomers. 11. Gasch R., Twele J.(2011), Wind Power Plants- Fundamental, Design, Construction and Operation, Second
Edition, Springer, Germany. 12. Tso CW (2006),” Use of Wind Turbine Technology-Case Study5”, Business Environment Council, Hong
Kong. 13. Wind Power Technology- Operation, Commercial, Developments, Wind Projects, Grid Distribution, EWEA
Council, 2004. 14. John G., Nathaniel H. & Todd H. (2011), Active Drivetrain Control to Improve Energy Capture of Wind
Turbines, Boise State University. 15. Global Wind Turbine Markets and Strategies:2011–2025, Market Study Excerpt, HIS emerging energy
research, 2011. 16. Levesque, “Utilities Owning, Buying more Wind, Planning for Carbon Regulations”, 2008. 17. North Carolina Solar Center, NC State University, Database of State Incentives for Renewables and Efficiency
(DSIRE) 18. Wiser, Bolinger & Barbose (2007), Using the Federal Production Tax Credit to build a Durable Market for
Wind Power in the United States; Bailey & Broeh (2008),“Tax Driven Wind Investment Gets Scarce in America”.
19. Harper, Karcher& Bolinger(2007), “Wind Project Financing Structures: A Review & Comparative Analysis”. 20. Utility Wind Integration Group, Utility Wind Integration State of the Art, May 2006; industry official,
interview by Commission staff, USA, 2008. 21. Manwell J.F.(2002), Wind Energy Explained, John Wiley & Sons, Ltd., UK . 22. ACORE, “Overview, Renewable Energy Provisions, American Recovery and Reinvestment Act of 2009.” 23. Peterson (2008), “Wind Energy Options for Farmers & Rural Landowners,”; Aarke & Haugen (2009), “Wind
Turbine Lease Considerations for Landowners”. 24. Morthorst, P. E., Redlinger, R.Y., Andersen, P. (2002). “Wind energy in the 21st century: economics, policy,
technology and the changing electricity industry”, Houndmills, Basingstoke. 25. NREL: Dynamic Maps, GIS Data, and Analysis Tools - Wind Maps, www.nrel.gov/gis/wind.html 26. Ensslin C.(2003), Large-Scale Integration of Wind Power, in Grid-connected Wind Turbines, Post-Graduate
Training Programme, Deutsche Wind Guard Dynamics GmbH. 27. R. Gasch & Twele J. (2012), Wind Power Plants: Fundamentals, Design,Construction, and Operation, Springer
Verlag Berlin Heidelberg. 28. Ackermann T. (2005), Wind Power in Power Systems, John Wiley & Sons, Ltd.,Stockholm. 29. Hadel J.(2009),” Assembly of the wind turbine Multibrid M5000”. [online]. Available at<
http://www.hadel.net> 30. European Wind Energy Association 2009. Wind Energy-The facts. Chapter 4: Industry and markets. [online].
Available at < http://www.wind-energy-the-facts.org/documents/download/Chapter4.pdf > 31. The Economics of Wind Power- Partlll, Wind Energy-The Facts, Denmark, 2006. 32. Global wind turbine market set to hit $73.5bn in 2015. [online]. Available at
<http://www.newenergyworldnetwork.com/renewable-energy-news/by-technology/wind/global-wind-turbine-market-set-to-hit-73-5bn-in-2015.html>
33. Europe capacity. [online]. Available at <http://www.thewindpower.net/statistics_europe.php> 34. Global Wind Report, Annual Market Report 2011, Global Wind Energy Council(GWEC) 35. Maegaard P. (2004), Wind Energy, World Wind Energy Association (WWEA), Denmark.
163
36. Official Journal of the European Union( 2009), Directive 2009/28/EC of the European Parliament and of the council. [online]. Available at http://eurlex.europa.eu/LexUriServ/LexUriServ.do?uri=OJ:L:2009:140:0016:0062.
37. Global Wind Statistics 2011, Global Wind Energy Council (GWEC). 38. Global Wind Energy Council. Europe. [online]. Available at <http://www.gwec.net/index.php?id=11> 39. 20% Wind Energy by 2030- Increasing Wind Energy’s Contribution to U.S. Electricity Supply, Executive
Summary, US Department of Energy Efficiency and Renewable Energy, 2008. 40. National Energy Policy, National Energy Policy Development Group, Government Printing Office, US, 2001. 41. Wind energy in Middle East – Wind power is in its infancy, Global Wind Energy Council (GWEC), 2011. 42. Roland Berger Strategy Consultants (2009), Wind turbine manufacturers have to use the current calm to
become fit for the future. [online]. Available at <http://www.rolandberger.com/company/press/releases/519-press_archive 2009_sc_content/Wind_turbine_manufacturers.html>
43. Winnovation - Case summaries [online]. Available at <http://www.vestas.com/en/jobs/events/winnovation- 2011/ case-summaries.aspx>
44. Pullen A., Hays K., Knolle G. (2011), PART IV: Industry and Markets. [online]. Available at <http://www.wind-energy-the-facts.org/documents/download/Chapter4.pdf>
45. Gandomkar, Amir (2009), Assessment of wind energy potential in Iran, Journal of Geography and Environmental Planning, No. 36 (4).
46. International renewable Energy Agency (IRENA),2012, Renewable Energy Technologies: cost Analysis series,volume1, issue 5/5
47. Energy Information Administration, www.eia.doe.gov 48. Houri Jafari, Hamed, E. Hashemi (2010), Energy Consumption Optimization Conference, Tehran, Iran. 49. Energy Balance(2010), Department of Energy, Electricity Ministry of Iran. 50. American wind Energy association (AWEA),(2011), small wind turbine market study, AWEA, USA. 51. Ismail Nia, A.A. and Hamze Khani, A. (2010), Economic Evaluation of the use of coal for electricity
production in Iran, Journal of Energy Economics, No. 132.
164
AN ANALYSIS OF TEMPORAL RAINFALL VARIABILITY IN ARGUNGU AREA OVER THE LAST HALF CLIMATIC YEAR (1995-2012): IMPLICATION ON RAINFED CROP PRODUCTION
Usman Lawal Gulma
Department Of Geography
Adamu Augie College Of Education, Argungu,
Kebbi State, Nigeria
ABSTRACT
This paper analyzes rainfall variability in Argungu area. Data for half climatic year 1995-2012 were obtained from Argungu station of Kebbi Agriculture and Rural Development Authority. Analysis of variance (ANOVA) was used to analyze the data. The results show that there is statistically significant difference in annual rainfall over the years. Analysis further revealed that the month of August, 2010 has the highest rainfall amount of 1066mm with the year 1996 receiving the least annual rainfall amount within the period under study respectively. The study recommends that since annual rainfall in the area is characterized by fluctuations, irrigation agriculture should be developed and supported by government to compliment rain-fed agriculture to encourage crop production in the area.
Key words: Rainfall, Variability, Significant, Analysis, Rain-fed
INTRODUCTION
Rainfall is an important aspect in both climatic and geomorphic studies. The amount of rainfall in a given region is influenced by many factors among them relief, wind speed and direction (relative to coastal orientation) and distance from the ocean. For instance when humid air masses moving across a region are forced to rise over highlands/plateau tends to bring heavy rainfall (Ayoade, 1988 in Yusuf et al, 2012).
Rainfall variability which is the degree to which rainfall amounts vary across an area or through time is an important characteristic of the climate of an area. There are two types of rainfall variability; areal (spatial) and temporal. The study of the latter is important in understanding climate change. Areal variability is the variation of rainfall amounts at various locations across a region for a specific time interval while temporal variability is the amounts at a given location across a time interval. Both temporal and areal variability of precipitation may be measured in various ways. The resulting numerical value can be used to characterize the climate of a region and to deduce evidence of climate change.
According to Food and Agriculture Organization (FAO, 2002), rainfall variability from years to days is as much a characteristic of climate as the total amounts recorded. Low values, however, do not necessarily lead to drought, nor is drought necessarily associated with rainfall. Agricultural droughts occur when water supply is insufficient to cover crop or livestock water requirements. In addition to reduced rainfall, a number of factors may lead to agricultural drought some of them not always obvious (FAO, 2002).
Generally, water availability is the most critical factor for sustaining crop productivity in rain-fed agriculture. Even if a drought tolerant crop is introduced, water is not available to crops when there is no water in the soil. Rainfall variability from season to season greatly affects soil water availability to crops and thus poses crop production risks (Jawoo, 2010). Agricultural production is affected by many uncontrollable climatic factors, the number one being rainfall. The role of rainfall in crop production has been an area of interest to many researchers (Rukman et al, 2008).
165
However, the impact of rainfall on crop production can be related to its total seasonal amount. In the extreme case of droughts, with very low seasonal amounts, crop production suffers the most. But more subtle intra-seasonal variations in rainfall distribution during crop growing periods, without change in total seasonal amount can also cause substantial reduction in yields. This means that the number of rainy days during the growing period is as important if not more as that of the seasonal total (Jacson, 1989).
Agricultural productions in the study area suffers from the effects of rainfall variability due to fluctuations, unreliable nature coupled with uneven spread during crop growing periods often resulting in crop failure over past one and half decade. Sometimes, not even the introduction of early maturing seeds could help the situation as in most cases rainfall start late and terminate early.
The aim of this paper therefore is to analyze rainfall variability and impact of such on crop production in Argungu.
DATA SOURCES AND METHOD OF ANALYSIS
The data used for this study is secondary. Rainfall records of Argungu for eighteen year period (1995-2012) were collected from Kebbi Agricultural and Rural Development Authority zone 1 weather station. Analysis of Variance (ANOVA) was used to analyze monthly rainfall.
Study Area
Argungu is located between latitude 12030'33"N to 12040'54"N and longitude 4020'54"E to 4030'54"E covering an area of 428 KM2 and elevation of 241 meters above sea level. It is bounded by Yabo Local Government area of Sokoto state to the North-East, in the South by Gwandu and Birnin Kebbi Local Government areas, while to the North and West by Augie and Arewa Local Government areas respectively.
The study area enjoys tropical continental type of climate, which is largely controlled by two air masses namely; tropical maritime and tropical continental blowing from Atlantic and Sahara desert respectively. The air masses determined the two dominant seasons, wet and dry. Humidity is 27% while wind blow at 11Km/h in ESE direction.
Argungu receive a mean annual rainfall of 800mm between May to September with a peak period in August, the remaining period of the year is dry. The average temperature is 260C and can rise up to 400C in the peak of hot season (March-July). However, during harmattan, (December – February) temperature falls to 210C.
Two groups of soils can be identified in the study area, the upland and Fadama soils. The Fadama consist of two distinct phases: wet and dry season operations. These two soil groups are generally characteristic of Sokoto Rima Basin. While the upland soils are generally sandy and well drained, the Fadama soils are generally clayey and hydromorphic which range from deep well drained soils, loamy sand, sandy loam, clay and clay loam.
The study area is mostly affected by desertification, which manifest itself by incidence of wind erosion and exposure of lateritic iron stone on the land scape. Desertification is the product of a number of factors both natural and man-made which include limited rainfall, indigenous method of cultivation, excessive
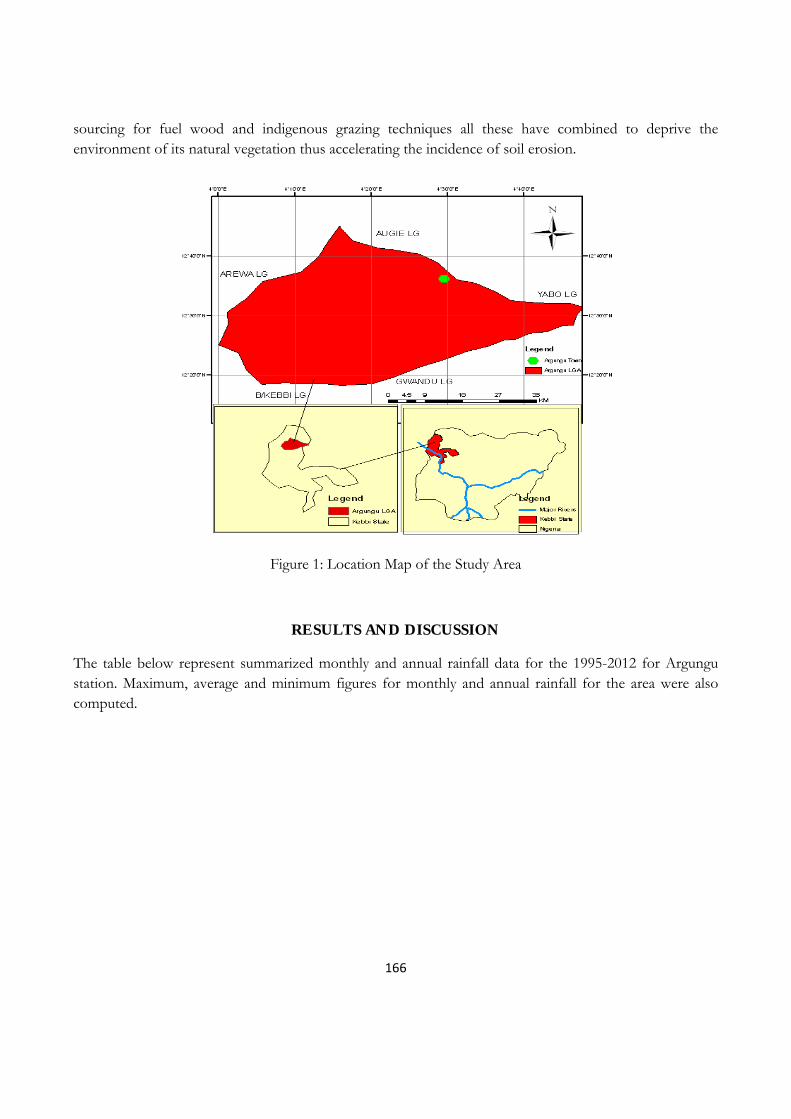
166
sourcing for fuel wood and indigenous grazing techniques all these have combined to deprive the environment of its natural vegetation thus accelerating the incidence of soil erosion.
Figure 1: Location Map of the Study Area
RESULTS AND DISCUSSION
The table below represent summarized monthly and annual rainfall data for the 1995-2012 for Argungu station. Maximum, average and minimum figures for monthly and annual rainfall for the area were also computed.
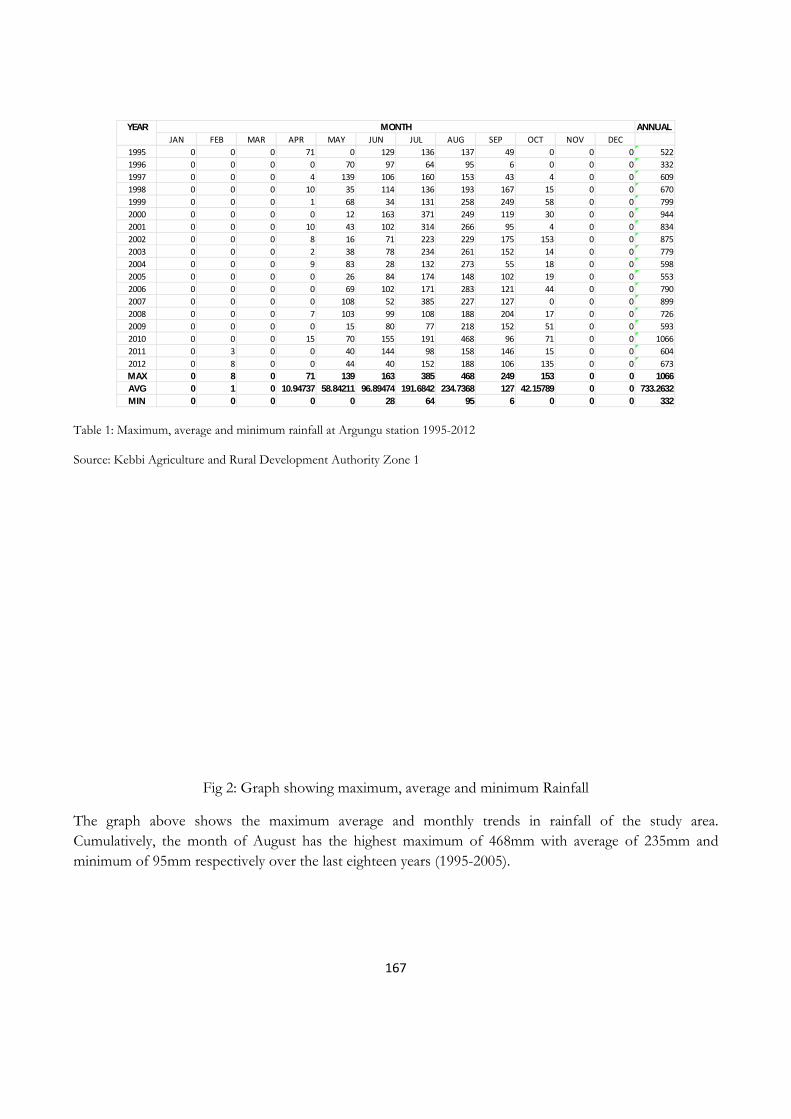
167
Table 1: Maximum, average and minimum rainfall at Argungu station 1995-2012
Source: Kebbi Agriculture and Rural Development Authority Zone 1
Fig 2: Graph showing maximum, average and minimum Rainfall
The graph above shows the maximum average and monthly trends in rainfall of the study area. Cumulatively, the month of August has the highest maximum of 468mm with average of 235mm and minimum of 95mm respectively over the last eighteen years (1995-2005).
ANNUALJAN FEB MAR APR MAY JUN JUL AUG SEP OCT NOV DEC
1995 0 0 0 71 0 129 136 137 49 0 0 0 5221996 0 0 0 0 70 97 64 95 6 0 0 0 3321997 0 0 0 4 139 106 160 153 43 4 0 0 6091998 0 0 0 10 35 114 136 193 167 15 0 0 6701999 0 0 0 1 68 34 131 258 249 58 0 0 7992000 0 0 0 0 12 163 371 249 119 30 0 0 9442001 0 0 0 10 43 102 314 266 95 4 0 0 8342002 0 0 0 8 16 71 223 229 175 153 0 0 8752003 0 0 0 2 38 78 234 261 152 14 0 0 7792004 0 0 0 9 83 28 132 273 55 18 0 0 5982005 0 0 0 0 26 84 174 148 102 19 0 0 5532006 0 0 0 0 69 102 171 283 121 44 0 0 7902007 0 0 0 0 108 52 385 227 127 0 0 0 8992008 0 0 0 7 103 99 108 188 204 17 0 0 7262009 0 0 0 0 15 80 77 218 152 51 0 0 5932010 0 0 0 15 70 155 191 468 96 71 0 0 10662011 0 3 0 0 40 144 98 158 146 15 0 0 6042012 0 8 0 0 44 40 152 188 106 135 0 0 673MAX 0 8 0 71 139 163 385 468 249 153 0 0 1066AVG 0 1 0 10.94737 58.84211 96.89474 191.6842 234.7368 127 42.15789 0 0 733.2632MIN 0 0 0 0 0 28 64 95 6 0 0 0 332
MONTHYEAR
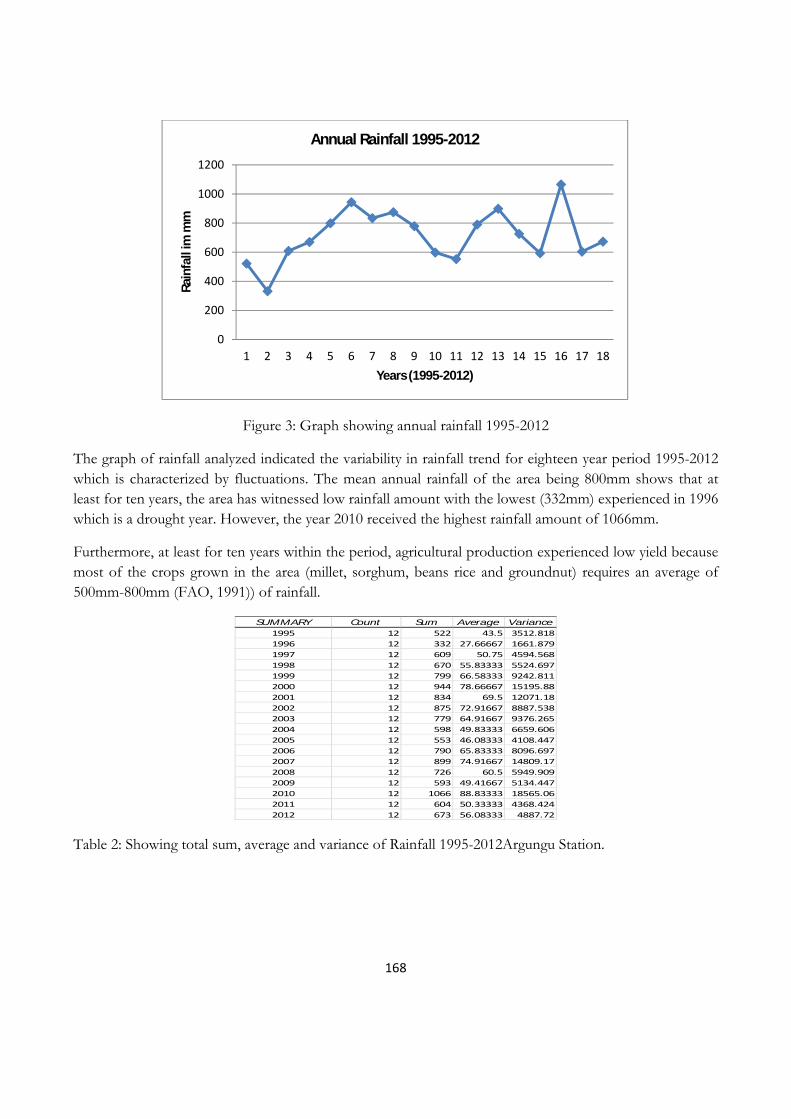
168
Figure 3: Graph showing annual rainfall 1995-2012
The graph of rainfall analyzed indicated the variability in rainfall trend for eighteen year period 1995-2012 which is characterized by fluctuations. The mean annual rainfall of the area being 800mm shows that at least for ten years, the area has witnessed low rainfall amount with the lowest (332mm) experienced in 1996 which is a drought year. However, the year 2010 received the highest rainfall amount of 1066mm.
Furthermore, at least for ten years within the period, agricultural production experienced low yield because most of the crops grown in the area (millet, sorghum, beans rice and groundnut) requires an average of 500mm-800mm (FAO, 1991)) of rainfall.
Table 2: Showing total sum, average and variance of Rainfall 1995-2012Argungu Station.
0
200
400
600
800
1000
1200
1 2 3 4 5 6 7 8 9 10 11 12 13 14 15 16 17 18
Rain
fall
im m
m
Years (1995-2012)
Annual Rainfall 1995-2012
SUMMARY Count Sum Average Variance1995 12 522 43.5 3512.8181996 12 332 27.66667 1661.8791997 12 609 50.75 4594.5681998 12 670 55.83333 5524.6971999 12 799 66.58333 9242.8112000 12 944 78.66667 15195.882001 12 834 69.5 12071.182002 12 875 72.91667 8887.5382003 12 779 64.91667 9376.2652004 12 598 49.83333 6659.6062005 12 553 46.08333 4108.4472006 12 790 65.83333 8096.6972007 12 899 74.91667 14809.172008 12 726 60.5 5949.9092009 12 593 49.41667 5134.4472010 12 1066 88.83333 18565.062011 12 604 50.33333 4368.4242012 12 673 56.08333 4887.72
169
Figure 4: Graph showing monthly distribution of highest rainfall amount year 2010 (1066mm)
Figure 5: Graph showing monthly distribution of lowest rainfall amount year 1996 (332mm)
Table 3 above indicate that there is a statistically significant difference in annual rainfall amount in Argungu between 1995-2012 since between groups variation is greater than within group variation
CONCLUSION
The study findings revealed that there is a great variability in rainfall amount in Argungu area. This was furher confirmed by the result of analysis carried out for the period 1995-2012. Fluctuations in rainfall affect crop production in the study area over greater part of the period under study.
ANOVASource of Variation SS df MS F P-value F critBetween Groups 1202523.981 11 109320.4 54.26792086 1.6534E-54 1.835818655Within Groups 410949.1111 204 2014.456
Total 1613473.093 215
170
Finally, rainfall variability in the area is an indication of climate change being experienced globally for which the study area is not an exception.
Recommendations
The significance of information on rainfall variability of Argungu area is vital for planning more especially against extreme situations such as drought and flooding in the light of foregoing this study recommendations are as follow:
1. Since annual rainfall is characterized by fluctuations, irrigation agriculture should be emphasized and supported by government to compliment rain-fed agriculture to boost crop production in the area.
2. Establishment of more weather stations in educational institutions around Argungu in order to have more access to more data on rainfall as the data available presently is grossly inadequate.
3. Replacement of present obsolete equipments with sophisticated ones in line with global best practices for more accurate data recording and reliability.
REFERENCES
Ayoade J.O. (1988) in Yusuf Y.O and Mohammed N.A (2012), An Assesment of Spatial Distribution of Rainfall Amount in Zaria, Kaduna State. Proceedings of 52 Annual Conference of Association of Nigerian Geographers. Usmanu Danfodio University
FAO (2002), Analysis of Rainfall Variability in Sub-Saharan Africa in the 1961-2002 Period. Agrometeorology Working Paper No. 9 Retrieved from http://www.fao.org/nr/climpag/pub.
FAO (1991), Water Requirements of Crops. Natural Resources Management and Environment Department. Retrieved from http://www.fao.org/docrep/U3160E/U3160E00.
Jackson J. (1989), Climate Water and Agriculture in the Tropics. Longman Scientific and Technical New York, USA.
Jawoo K. (2010), Rainfall Variability and Crop Yield Potential. Harvest Choice Labs. Retrieved from
http://harvestchoice.org/labs/rainfall-variability-and-crop-yield-potential.
Rukman W; Athur H; Esther T and Kristoff C. (2008), Rainfall Variabilty and its Impact
on Dryland Cropping in Victoria. Department on Environment and Primary Industries
Victoria, Melbourne. Retrieved from http://www.dpi.vic.gov.au/about-us/publication.
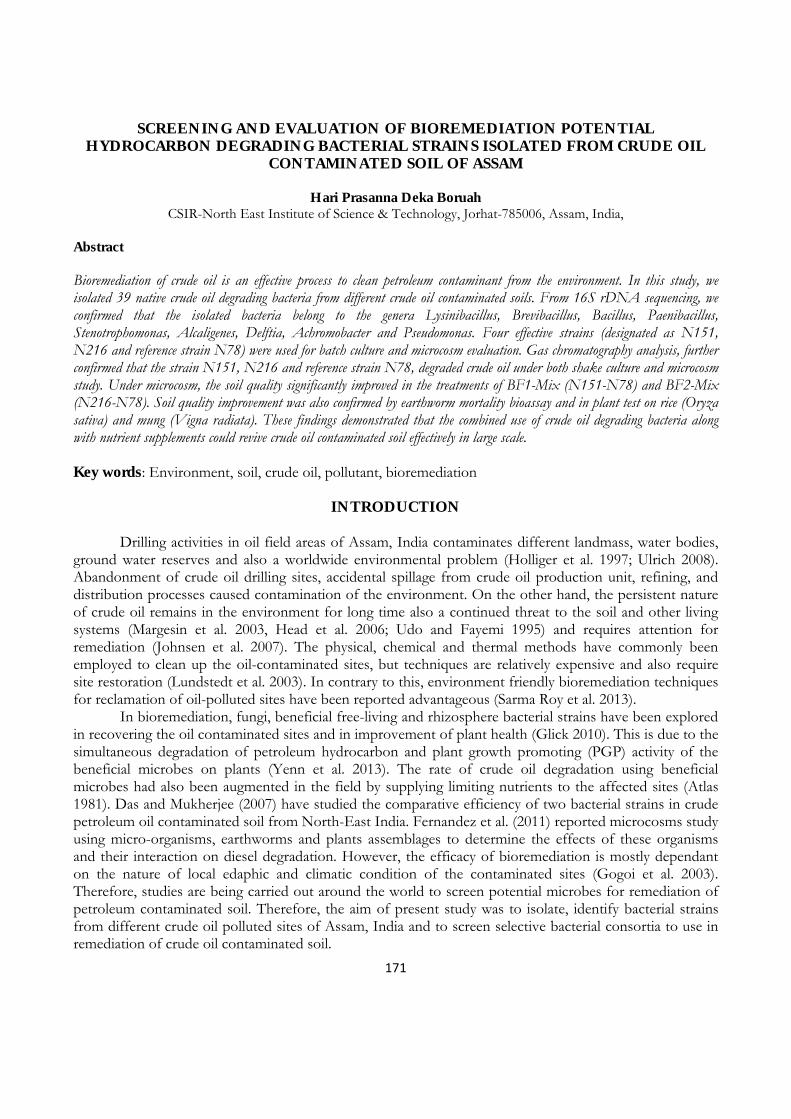
171
SCREENING AND EVALUATION OF BIOREMEDIATION POTENTIAL HYDROCARBON DEGRADING BACTERIAL STRAINS ISOLATED FROM CRUDE OIL
CONTAMINATED SOIL OF ASSAM
Hari Prasanna Deka Boruah
CSIR-North East Institute of Science & Technology, Jorhat-785006, Assam, India, Abstract Bioremediation of crude oil is an effective process to clean petroleum contaminant from the environment. In this study, we isolated 39 native crude oil degrading bacteria from different crude oil contaminated soils. From 16S rDNA sequencing, we confirmed that the isolated bacteria belong to the genera Lysinibacillus, Brevibacillus, Bacillus, Paenibacillus, Stenotrophomonas, Alcaligenes, Delftia, Achromobacter and Pseudomonas. Four effective strains (designated as N151, N216 and reference strain N78) were used for batch culture and microcosm evaluation. Gas chromatography analysis, further confirmed that the strain N151, N216 and reference strain N78, degraded crude oil under both shake culture and microcosm study. Under microcosm, the soil quality significantly improved in the treatments of BF1-Mix (N151-N78) and BF2-Mix (N216-N78). Soil quality improvement was also confirmed by earthworm mortality bioassay and in plant test on rice (Oryza sativa) and mung (Vigna radiata). These findings demonstrated that the combined use of crude oil degrading bacteria along with nutrient supplements could revive crude oil contaminated soil effectively in large scale. Key words: Environment, soil, crude oil, pollutant, bioremediation
INTRODUCTION
Drilling activities in oil field areas of Assam, India contaminates different landmass, water bodies, ground water reserves and also a worldwide environmental problem (Holliger et al. 1997; Ulrich 2008). Abandonment of crude oil drilling sites, accidental spillage from crude oil production unit, refining, and distribution processes caused contamination of the environment. On the other hand, the persistent nature of crude oil remains in the environment for long time also a continued threat to the soil and other living systems (Margesin et al. 2003, Head et al. 2006; Udo and Fayemi 1995) and requires attention for remediation (Johnsen et al. 2007). The physical, chemical and thermal methods have commonly been employed to clean up the oil-contaminated sites, but techniques are relatively expensive and also require site restoration (Lundstedt et al. 2003). In contrary to this, environment friendly bioremediation techniques for reclamation of oil-polluted sites have been reported advantageous (Sarma Roy et al. 2013).
In bioremediation, fungi, beneficial free-living and rhizosphere bacterial strains have been explored in recovering the oil contaminated sites and in improvement of plant health (Glick 2010). This is due to the simultaneous degradation of petroleum hydrocarbon and plant growth promoting (PGP) activity of the beneficial microbes on plants (Yenn et al. 2013). The rate of crude oil degradation using beneficial microbes had also been augmented in the field by supplying limiting nutrients to the affected sites (Atlas 1981). Das and Mukherjee (2007) have studied the comparative efficiency of two bacterial strains in crude petroleum oil contaminated soil from North-East India. Fernandez et al. (2011) reported microcosms study using micro-organisms, earthworms and plants assemblages to determine the effects of these organisms and their interaction on diesel degradation. However, the efficacy of bioremediation is mostly dependant on the nature of local edaphic and climatic condition of the contaminated sites (Gogoi et al. 2003). Therefore, studies are being carried out around the world to screen potential microbes for remediation of petroleum contaminated soil. Therefore, the aim of present study was to isolate, identify bacterial strains from different crude oil polluted sites of Assam, India and to screen selective bacterial consortia to use in remediation of crude oil contaminated soil.
172
MATERIALS AND METHODS
Soil sampling and characterization: All the crude oil contaminated soil samples were collected from five sites viz., Lakuwa, Geleky, Amguri of Sivasagar district, Borhola and Jorhat of Jorhat district, Assam, India (Table 1). From each location 10 samples were collected randomly by disturb sampling. To make a representative sample, bulk samples were prepared from each location and minimum of three representative samples were collected. The representative samples were immediately stored at 4°C. Total petroleum hydrocarbon (TPH) of the soil was determined according to Das and Mukherjee (2007). Briefly, TPH from 10 g soil was consecutively extracted with 100 ml of hexane, methylene chloride (CH2Cl2), and chloroform. All three extracts were pooled and dried in a fume hood at room temperature by evaporation of solvents under a gentle nitrogen stream over Na2SO4 and concentrated using a rotary evaporator to a final volume of 3.0 ml. After solvent evaporation, the amount of residual TPH was determined gravimetrically. Isolation of oil degrading bacteria: Isolation of crude oil bacterial strains was done using enrichment culture method from the collected soil samples. Contaminated soil samples were inoculated on a mineral medium M1 (g/L): 4.0, NaNO3; 3.61, Na2HPO4; 1.75, KH2PO4; 0.2, MgSO4.7H2O; 0.01, FeSO4; 0.05, CaCl2; trace element solution 1ml/L amended with 2% (v/v) crude oil and incubated for 72 h. From this enrichment culture, 1 ml was transferred to fresh M1 solid media (prepared by the addition of 1.8% agar agar) amended with 2% (v/v) crude oil as sole carbon source. The plates were incubated for 72 h for colony formation. Similarly, hydrocarbon degradation in shake flask was done using liquid M1 media with 2% (v/v) crude oil at 30°C. The visible breakdown of the crude oil layer along with the indication of biofilm formation was observed till 72h. Bifilm formation of tested bacterial strains was recorded based on formation of adherent aggregates of the bacterial cells on the surfaces of culture flask. Identification and phylogenetic analysis of bacterial isolates: Morphological and biochemical characteristics of bacterial isolates were determined according to Bergy’s manual. Molecular identification of bacterial isolates was confirmed by 16S rDNA gene PCR amplification. The PCR amplification was carried out using genomic DNA from each bacterium as template with 16S universal forward primer fD1 (5/-AGAGTTTGATCCTGGCTCAG-3/) and 16S universal reverse primer rP2 (5/-ACGGCTACCTTGTTACGACTT-3/) using Taq DNA Polymerase (Bangalore Genie, India). The PCR reactions were denatured at 95°C for 5 min, which was followed by 30 cycles of 94°C for 30 s, 50°C for 30 s, and 72°C for 90 s and then final extension at 72°C for 10 min. Purified DNA fragments were sequenced using the same sets of primers. The sequences were analyzed using BLAST (http://www.ncbi.nih.gov/BLAST/) to get a preliminary identification of the strains. The sequences were aligned using the ClustalW program (http://www.ebi.ac.uk/clustalw/) of the European Bioinformatics Institute (EMBL-EBI) and the Bio Edit Sequence Alignment Editor software (http://www.mbio.ncsu.edu/BioEdit/bioedit.html). The cluster analysis was performed using the Mega 5 software package. The 16S rDNA gene sequences were deposited in Gene Bank under accession numbers JN410947, JN41094 and JQ900510 to JQ900546 for different bacterial isolates. Viscosity measurement of bacterial degraded crude oil: Viscosity of different bacterial mediated crude oil degradation was measured with Rheometers (Anton Paar Rheolab QC, India). For this, mineral media M1 with 2% (v/v) crude oil was inoculated with three bacterial strains N151, N216 and N78 and without inoculation of bacteria as control. It was then allowed to grow for 72 h at 30°C under shaking condition. The 72 h old culture broth of each strain was directly used for viscosity measurement.
173
Microcosm study of crude oil contaminated soil: To test the efficacy of remediation of crude oil contaminated soil using the screened bacteria, simulated crude oil contaminated field plots as microcosm were created in green house condition. In brief, the soil collected from experimental garden of the institute was constituted to 8x3 m2 microcosms with a depth of six inches. Each microcosm was then contaminated with Assam light crude oil-soil ratio of 3:1 (w/w). After 30 days of acclimation of set up, zero days reading of the soil were recorded and biological treatment were performed. A total of 7 different bioformulations, nitrogen (N) as urea; potassium (K) as murate of potash; and phosphorous (P) as diammonium phosphate i.e., mixtures of nitrogen-phosphorus-potassium (NPK) was added at a ratio- 60:40:40 ha-1 (≈150, 100, 100 mg microcosm-1); organic farmyard manure (OM), vermicompost (VC) at the rate of 180 kg ha-1 (≈430 mg microcosm-1). In BF1 a 72 h old culture mixture of N151-N78 strains with 4.7 x 10¹³ CFU (Colony Forming Unit) mL-1 obtained from 48h old nutrient rich cultural broth (100 ml culture microcosm-1), BF1-Mixed: (N151-N78)-NPK-OM-VC each component added as given above, BF2: (N216-N78) strains 72 h old culture with 4.7 x 10¹³ CFU ml-1 (100 ml culture microcosm-1), BF2-Mixed: (N216-N78)-NPK-OM-VC each component added as given above. All the experiments were repeated 3 times with three replications in each treatment. Test for soil quality improvement: Triplicate samples ≈ 100 g were taken from each microcosm at an interval of 4 weeks from the day of treatment. The soil samples from each microcosm were then analyzed for TPH, pH, moisture content as described above and different soil enzyme activities (dehydrogenase, phosphatase and urease) as per standard protocol. Soil respiration, evaporation rate, CO2 flux were analysed by IRGA-CIRAS-2 (PP System, USA) attached with soil respiration chamber SRC-1. For measurement SRC-1 was attached to main system CIRAS-2. The main system was then pre-set to area (cm2) at 78.5, CO2 change at 60ppm, the maximum amount of time from start of measurement to the end at 60 seconds. After successful completion of the set up the SRC-1 chamber was held for ≈15second to flush. After that the SRC-1 chamber was placed on the soil and measurement was taken. The data were recorded and expressed as ppm for CO2 flux; gm-2h-1 for evaporation and soil respiration while ºC for temperature, respectively.
Soil toxicity test was performed using earthworm (Eisenia foetidae) to evaluate the improvement of soil health according to Dorn and Salanitro (2000). The bioremediation efficacy on oil-contaminated soil was also assessed by plant germination assay using seeds of mung (Vigna radiata) and rice (Oryza sativa). Soil samples were collected from each microcosm after 28 weeks of bioremediation and filled into small pots (15 cm width x 10 cm height x 10 cm depth) and seeds of mung and rice were sown. Regular watering was done to maintain the soil moisture content. The pots were kept in the growth chamber maintaining the photoperiod 12 h. After 15 days the growth parameters (germination, dry weight, shoot height, and root length) of the seedlings were recorded.
Total CFU of the remediated soil was enumerated by serial dilution technique. The plates were incubated at 30°C for 48 h and numbers of aerobic bacterial colonies were calculated on nutrient agar. On the other hand, total number of hydrocarbon utilizing bacterial (HUB) was enumerated by similar method on M1 media plate using crude oil as the sole carbon source. The plates were kept in inverse position with 1 ml of hexadecane on the lid and incubated at 30°C for 48 h (Mills et al. 1978). GC-MS analysis: The breakdown of crude oil due to treatment of bacterial formulations was done using Perkin Elmer Clarus 600 GC-MS equipped with Elite 5 MS column. The column and oven temperature was kept at 80°C to 280°C with an incremental column temperature at 8°C min-1 and finally held at 280°C for 10 min. The carrier gas was helium with a flow rate of 1 ml min-1. The mass spectrometric data were acquired in electron ionization mode (70 eV). The interface temperature was 280°C and mass range was 50-500 m/z. The individual components in the alkane and aromatic fractions were determined by matching
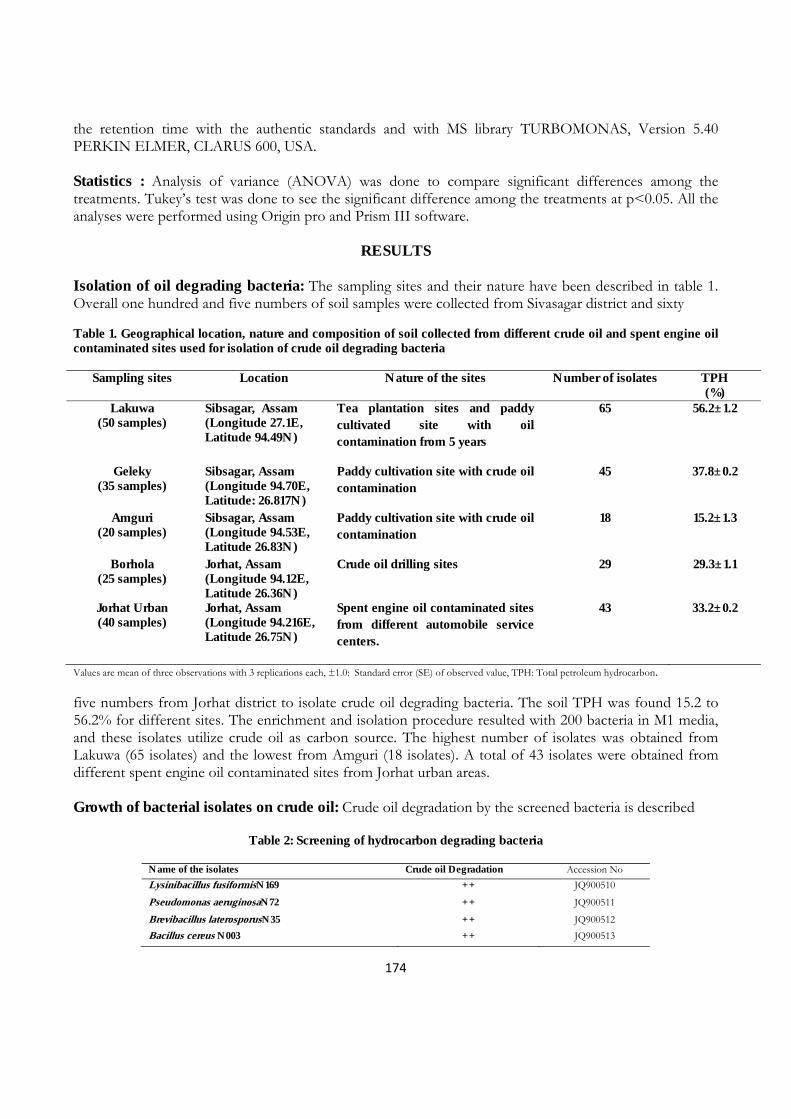
174
the retention time with the authentic standards and with MS library TURBOMONAS, Version 5.40 PERKIN ELMER, CLARUS 600, USA. Statistics : Analysis of variance (ANOVA) was done to compare significant differences among the treatments. Tukey’s test was done to see the significant difference among the treatments at p<0.05. All the analyses were performed using Origin pro and Prism III software.
RESULTS
Isolation of oil degrading bacteria: The sampling sites and their nature have been described in table 1. Overall one hundred and five numbers of soil samples were collected from Sivasagar district and sixty Table 1. Geographical location, nature and composition of soil collected from different crude oil and spent engine oil contaminated sites used for isolation of crude oil degrading bacteria
Sampling sites Location Nature of the sites Number of isolates TPH(%)
Lakuwa (50 samples)
Sibsagar, Assam (Longitude 27.1E, Latitude 94.49N)
Tea plantation sites and paddy cultivated site with oil contamination from 5 years
65 56.2±1.2
Geleky (35 samples)
Sibsagar, Assam (Longitude 94.70E, Latitude: 26.817N)
Paddy cultivation site with crude oil contamination
45 37.8±0.2
Amguri (20 samples)
Sibsagar, Assam (Longitude 94.53E, Latitude 26.83N)
Paddy cultivation site with crude oil contamination
18 15.2±1.3
Borhola (25 samples)
Jorhat, Assam (Longitude 94.12E, Latitude 26.36N)
Crude oil drilling sites 29 29.3±1.1
Jorhat Urban (40 samples)
Jorhat, Assam (Longitude 94.216E, Latitude 26.75N)
Spent engine oil contaminated sites from different automobile service centers.
43 33.2±0.2
Values are mean of three observations with 3 replications each, ±1.0: Standard error (SE) of observed value, TPH: Total petroleum hydrocarbon. five numbers from Jorhat district to isolate crude oil degrading bacteria. The soil TPH was found 15.2 to 56.2% for different sites. The enrichment and isolation procedure resulted with 200 bacteria in M1 media, and these isolates utilize crude oil as carbon source. The highest number of isolates was obtained from Lakuwa (65 isolates) and the lowest from Amguri (18 isolates). A total of 43 isolates were obtained from different spent engine oil contaminated sites from Jorhat urban areas. Growth of bacterial isolates on crude oil: Crude oil degradation by the screened bacteria is described
Table 2: Screening of hydrocarbon degrading bacteria
Name of the isolates Crude oil Degradation Accession No
Lysinibacillus fusiformisN169 ++ JQ900510
Pseudomonas aeruginosaN72 ++ JQ900511
Brevibacillus laterosporusN35 ++ JQ900512
Bacillus cereus N003 ++ JQ900513
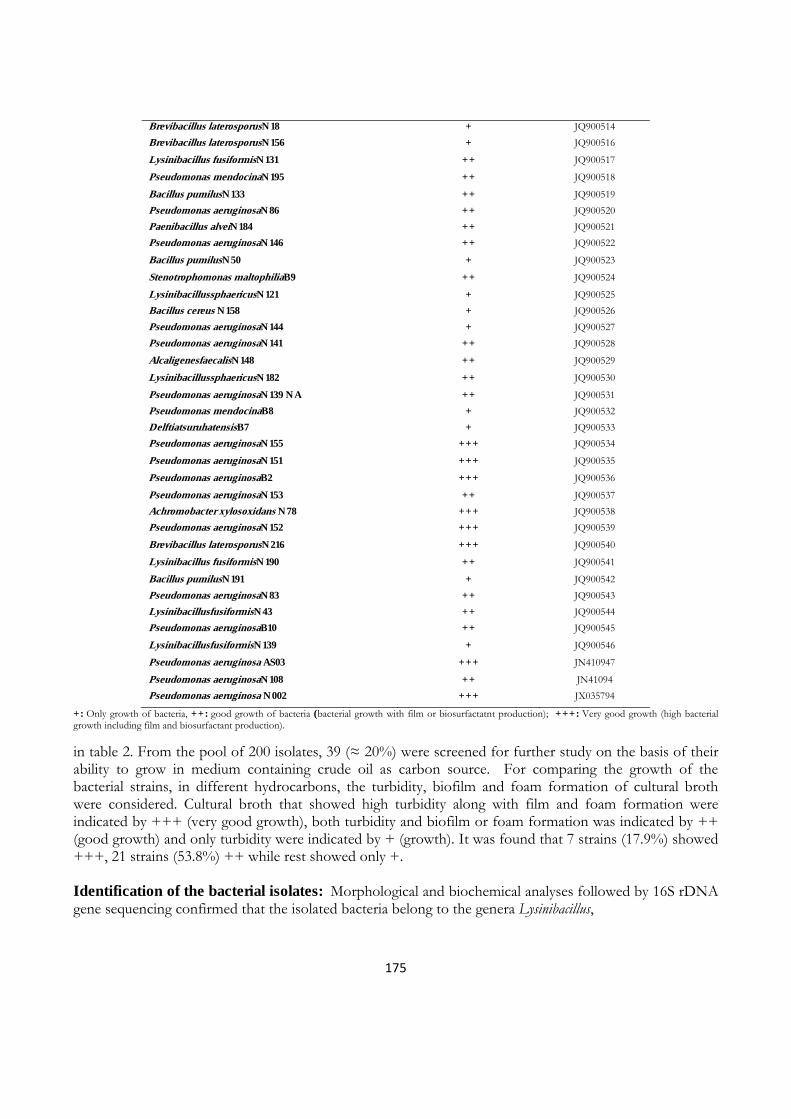
175
Brevibacillus laterosporusN18 + JQ900514
Brevibacillus laterosporusN156 + JQ900516
Lysinibacillus fusiformisN131 ++ JQ900517
Pseudomonas mendocinaN195 ++ JQ900518
Bacillus pumilusN133 ++ JQ900519
Pseudomonas aeruginosaN86 ++ JQ900520
Paenibacillus alveiN184 ++ JQ900521
Pseudomonas aeruginosaN146 ++ JQ900522
Bacillus pumilusN50 + JQ900523
Stenotrophomonas maltophiliaB9 ++ JQ900524
LysinibacillussphaericusN121 + JQ900525
Bacillus cereus N158 + JQ900526
Pseudomonas aeruginosaN144 + JQ900527
Pseudomonas aeruginosaN141 ++ JQ900528
AlcaligenesfaecalisN148 ++ JQ900529
LysinibacillussphaericusN182 ++ JQ900530
Pseudomonas aeruginosaN139 NA ++ JQ900531
Pseudomonas mendocinaB8 + JQ900532
DelftiatsuruhatensisB7 + JQ900533
Pseudomonas aeruginosaN155 +++ JQ900534
Pseudomonas aeruginosaN151 +++ JQ900535
Pseudomonas aeruginosaB2 +++ JQ900536
Pseudomonas aeruginosaN153 ++ JQ900537
Achromobacter xylosoxidans N78 +++ JQ900538
Pseudomonas aeruginosaN152 +++ JQ900539
Brevibacillus laterosporusN216 +++ JQ900540
Lysinibacillus fusiformisN190 ++ JQ900541
Bacillus pumilusN191 + JQ900542
Pseudomonas aeruginosaN83 ++ JQ900543
LysinibacillusfusiformisN43 ++ JQ900544
Pseudomonas aeruginosaB10 ++ JQ900545
LysinibacillusfusiformisN139 + JQ900546
Pseudomonas aeruginosa AS03 +++ JN410947
Pseudomonas aeruginosaN108 ++ JN41094
Pseudomonas aeruginosa N002 +++ JX035794
+: Only growth of bacteria, ++: good growth of bacteria (bacterial growth with film or biosurfactatnt production); +++: Very good growth (high bacterial growth including film and biosurfactant production).
in table 2. From the pool of 200 isolates, 39 (≈ 20%) were screened for further study on the basis of their ability to grow in medium containing crude oil as carbon source. For comparing the growth of the bacterial strains, in different hydrocarbons, the turbidity, biofilm and foam formation of cultural broth were considered. Cultural broth that showed high turbidity along with film and foam formation were indicated by +++ (very good growth), both turbidity and biofilm or foam formation was indicated by ++ (good growth) and only turbidity were indicated by + (growth). It was found that 7 strains (17.9%) showed +++, 21 strains (53.8%) ++ while rest showed only +. Identification of the bacterial isolates: Morphological and biochemical analyses followed by 16S rDNA gene sequencing confirmed that the isolated bacteria belong to the genera Lysinibacillus,
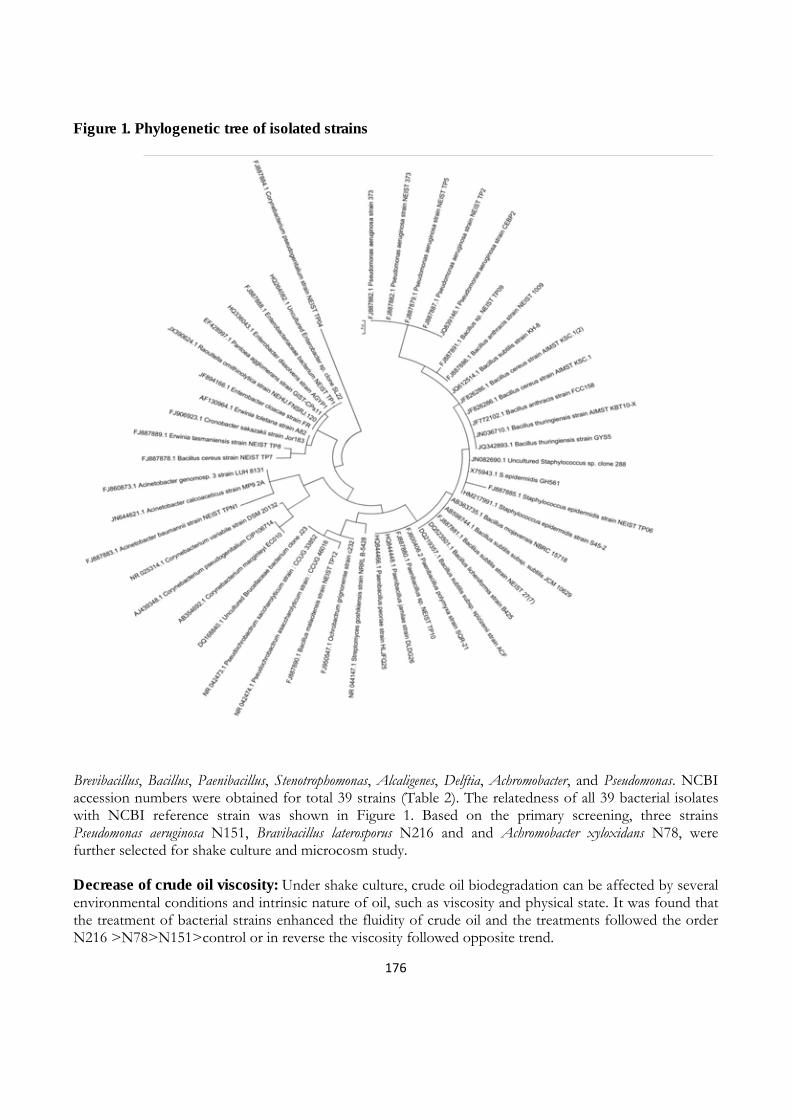
176
Figure 1. Phylogenetic tree of isolated strains
Brevibacillus, Bacillus, Paenibacillus, Stenotrophomonas, Alcaligenes, Delftia, Achromobacter, and Pseudomonas. NCBI accession numbers were obtained for total 39 strains (Table 2). The relatedness of all 39 bacterial isolates with NCBI reference strain was shown in Figure 1. Based on the primary screening, three strains Pseudomonas aeruginosa N151, Bravibacillus laterosporus N216 and and Achromobacter xyloxidans N78, were further selected for shake culture and microcosm study. Decrease of crude oil viscosity: Under shake culture, crude oil biodegradation can be affected by several environmental conditions and intrinsic nature of oil, such as viscosity and physical state. It was found that the treatment of bacterial strains enhanced the fluidity of crude oil and the treatments followed the order N216 >N78>N151>control or in reverse the viscosity followed opposite trend.
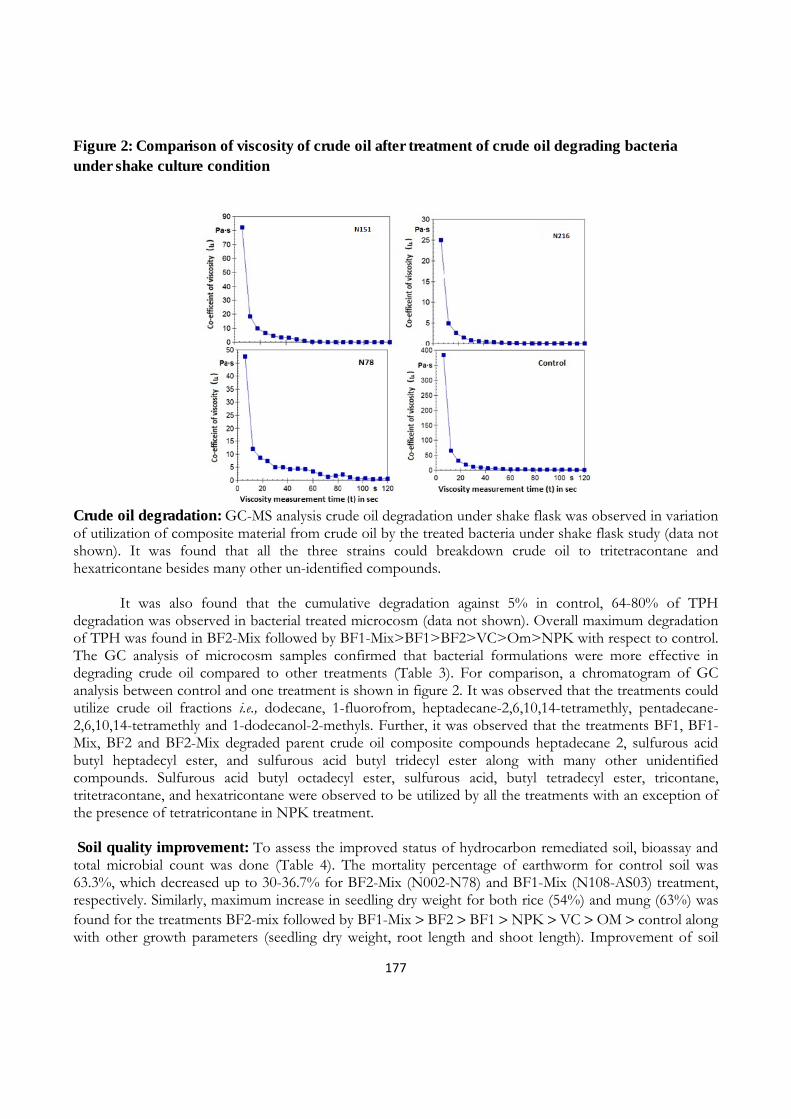
177
Figure 2: Comparison of viscosity of crude oil after treatment of crude oil degrading bacteria under shake culture condition
Crude oil degradation: GC-MS analysis crude oil degradation under shake flask was observed in variation of utilization of composite material from crude oil by the treated bacteria under shake flask study (data not shown). It was found that all the three strains could breakdown crude oil to tritetracontane and hexatricontane besides many other un-identified compounds.
It was also found that the cumulative degradation against 5% in control, 64-80% of TPH degradation was observed in bacterial treated microcosm (data not shown). Overall maximum degradation of TPH was found in BF2-Mix followed by BF1-Mix>BF1>BF2>VC>Om>NPK with respect to control. The GC analysis of microcosm samples confirmed that bacterial formulations were more effective in degrading crude oil compared to other treatments (Table 3). For comparison, a chromatogram of GC analysis between control and one treatment is shown in figure 2. It was observed that the treatments could utilize crude oil fractions i.e., dodecane, 1-fluorofrom, heptadecane-2,6,10,14-tetramethly, pentadecane-2,6,10,14-tetramethly and 1-dodecanol-2-methyls. Further, it was observed that the treatments BF1, BF1-Mix, BF2 and BF2-Mix degraded parent crude oil composite compounds heptadecane 2, sulfurous acid butyl heptadecyl ester, and sulfurous acid butyl tridecyl ester along with many other unidentified compounds. Sulfurous acid butyl octadecyl ester, sulfurous acid, butyl tetradecyl ester, tricontane, tritetracontane, and hexatricontane were observed to be utilized by all the treatments with an exception of the presence of tetratricontane in NPK treatment. Soil quality improvement: To assess the improved status of hydrocarbon remediated soil, bioassay and total microbial count was done (Table 4). The mortality percentage of earthworm for control soil was 63.3%, which decreased up to 30-36.7% for BF2-Mix (N002-N78) and BF1-Mix (N108-AS03) treatment, respectively. Similarly, maximum increase in seedling dry weight for both rice (54%) and mung (63%) was found for the treatments BF2-mix followed by BF1-Mix > BF2 > BF1 > NPK > VC > OM > control along with other growth parameters (seedling dry weight, root length and shoot length). Improvement of soil
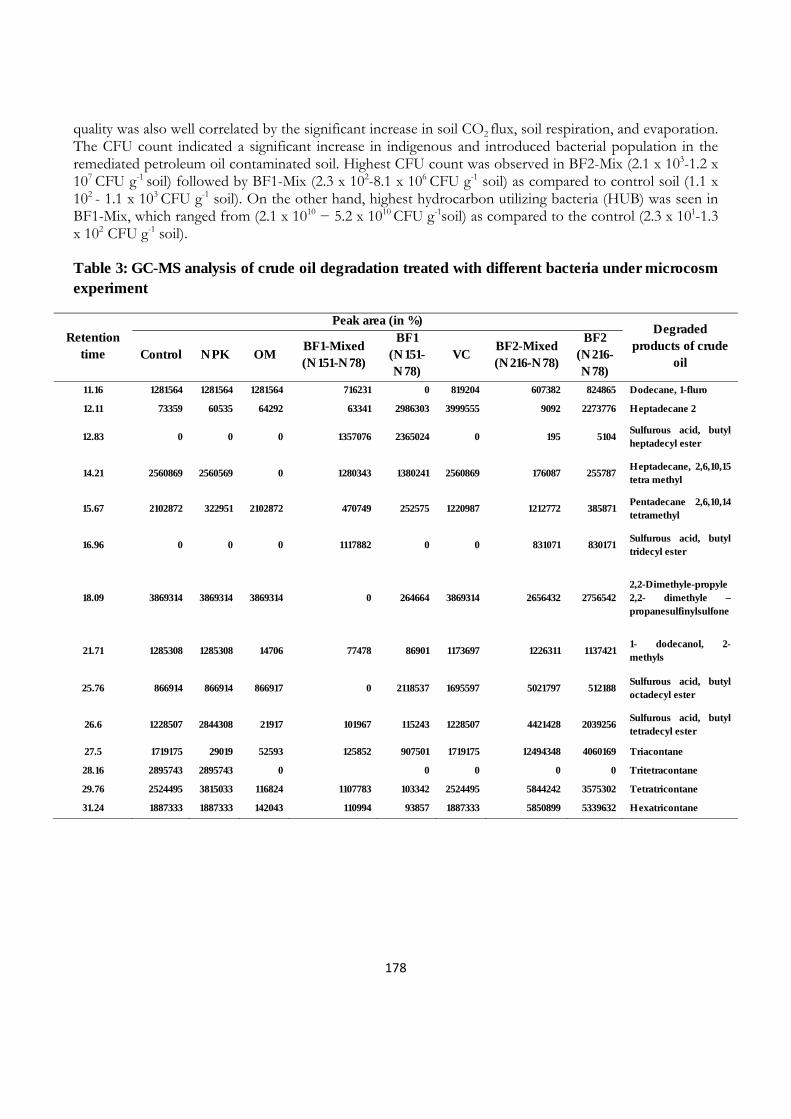
178
quality was also well correlated by the significant increase in soil CO2 flux, soil respiration, and evaporation. The CFU count indicated a significant increase in indigenous and introduced bacterial population in the remediated petroleum oil contaminated soil. Highest CFU count was observed in BF2-Mix (2.1 x 10³-1.2 x 10⁷ CFU g-1 soil) followed by BF1-Mix (2.3 x 10²-8.1 x 10⁶ CFU g-1 soil) as compared to control soil (1.1 x 10² - 1.1 x 10³ CFU g-1 soil). On the other hand, highest hydrocarbon utilizing bacteria (HUB) was seen in BF1-Mix, which ranged from (2.1 x 10¹⁰ − 5.2 x 10¹⁰ CFU g-1soil) as compared to the control (2.3 x 101-1.3 x 10² CFU g-1 soil). Table 3: GC-MS analysis of crude oil degradation treated with different bacteria under microcosm experiment
Retention time
Peak area (in %)Degraded
products of crude oil
Control NPK OM BF1-Mixed (N151-N78)
BF1(N151-N78)
VC BF2-Mixed (N216-N78)
BF2 (N216-N78)
11.16 1281564 1281564 1281564 716231 0 819204 607382 824865 Dodecane, 1-fluro
12.11 73359 60535 64292 63341 2986303 3999555 9092 2273776 Heptadecane 2
12.83 0 0 0 1357076 2365024 0 195 5104 Sulfurous acid, butyl heptadecyl ester
14.21 2560869 2560569 0 1280343 1380241 2560869 176087 255787 Heptadecane, 2,6,10,15 tetra methyl
15.67 2102872 322951 2102872 470749 252575 1220987 1212772 385871 Pentadecane 2,6,10,14 tetramethyl
16.96 0 0 0 1117882 0 0 831071 830171 Sulfurous acid, butyl tridecyl ester
18.09 3869314 3869314 3869314 0 264664 3869314 2656432 2756542 2,2-Dimethyle-propyle 2,2- dimethyle –propanesulfinylsulfone
21.71 1285308 1285308 14706 77478 86901 1173697 1226311 1137421 1- dodecanol, 2- methyls
25.76 866914 866914 866917 0 2118537 1695597 5021797 512188 Sulfurous acid, butyl octadecyl ester
26.6 1228507 2844308 21917 101967 115243 1228507 4421428 2039256 Sulfurous acid, butyl tetradecyl ester
27.5 1719175 29019 52593 125852 907501 1719175 12494348 4060169 Triacontane
28.16 2895743 2895743 0 0 0 0 0 Tritetracontane
29.76 2524495 3815033 116824 1107783 103342 2524495 5844242 3575302 Tetratricontane
31.24 1887333 1887333 142043 110994 93857 1887333 5850899 5339632 Hexatricontane
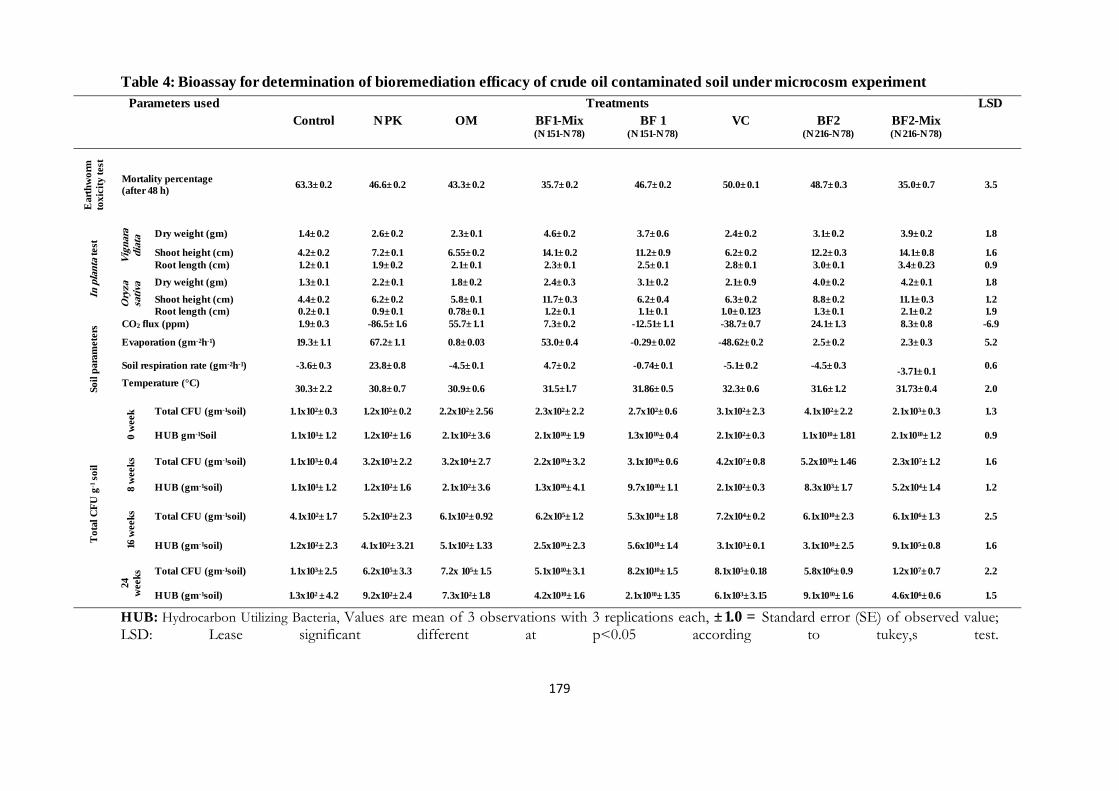
179
Table 4: Bioassay for determination of bioremediation efficacy of crude oil contaminated soil under microcosm experiment
HUB: Hydrocarbon Utilizing Bacteria, Values are mean of 3 observations with 3 replications each, ±1.0 = Standard error (SE) of observed value; LSD: Lease significant different at p<0.05 according to tukey,s test.
Parameters used
Treatments LSD Control NPK OM BF1-Mix
(N151-N78) BF 1
(N151-N78) VC BF2
(N216-N78) BF2-Mix (N216-N78)
Ear
thw
orm
to
xici
ty te
st
Mortality percentage (after 48 h) 63.3±0.2 46.6±0.2 43.3±0.2 35.7±0.2 46.7±0.2 50.0±0.1 48.7±0.3 35.0±0.7 3.5
In p
lant
a te
st
Vig
nara
diat
a Dry weight (gm) 1.4±0.2 2.6±0.2 2.3±0.1 4.6±0.2 3.7±0.6 2.4±0.2 3.1±0.2 3.9±0.2 1.8
Shoot height (cm) 4.2±0.2 7.2±0.1 6.55±0.2 14.1±0.2 11.2±0.9 6.2±0.2 12.2±0.3 14.1±0.8 1.6 Root length (cm) 1.2±0.1 1.9±0.2 2.1±0.1 2.3±0.1 2.5±0.1 2.8±0.1 3.0±0.1 3.4±0.23 0.9
Ory
za
sati
va Dry weight (gm) 1.3±0.1 2.2±0.1 1.8±0.2 2.4±0.3 3.1±0.2 2.1±0.9 4.0±0.2 4.2±0.1 1.8
Shoot height (cm) 4.4±0.2 6.2±0.2 5.8±0.1 11.7±0.3 6.2±0.4 6.3±0.2 8.8±0.2 11.1±0.3 1.2 Root length (cm) 0.2±0.1 0.9±0.1 0.78±0.1 1.2±0.1 1.1±0.1 1.0±0.123 1.3±0.1 2.1±0.2 1.9
Soil
para
met
ers CO2 flux (ppm) 1.9±0.3 -86.5±1.6 55.7±1.1 7.3±0.2 -12.51±1.1 -38.7±0.7 24.1±1.3 8.3±0.8 -6.9
Evaporation (gm-2h-1) 19.3±1.1 67.2±1.1 0.8±0.03 53.0±0.4 -0.29±0.02 -48.62±0.2 2.5±0.2 2.3±0.3 5.2
Soil respiration rate (gm-2h-1) -3.6±0.3 23.8±0.8 -4.5±0.1 4.7±0.2 -0.74±0.1 -5.1±0.2 -4.5±0.3
-3.71±0.1 0.6
Temperature (°C)
30.3±2.2 30.8±0.7 30.9±0.6 31.5±l.7 31.86±0.5 32.3±0.6 31.6±1.2 31.73±0.4 2.0
Tot
al C
FU
g-1 s
oil
0 w
eek Total CFU (gm-1soil) 1.1x10²±0.3 1.2x10²±0.2 2.2x10²±2.56 2.3x10²±2.2 2.7x10²±0.6 3.1x10²±2.3 4.1x10²±2.2 2.1x10³±0.3 1.3
HUB gm-1Soil 1.1x101±1.2 1.2x10²±1.6 2.1x10²±3.6 2.1x10¹⁰±1.9 1.3x10¹⁰±0.4 2.1x10²±0.3 1.1x10¹⁰±1.81 2.1x10¹⁰±1.2 0.9
8 w
eeks
Total CFU (gm-1soil) 1.1x10³±0.4 3.2x10³±2.2 3.2x10⁴±2.7 2.2x10¹⁰±3.2 3.1x10¹⁰±0.6 4.2x10⁷±0.8 5.2x10¹⁰±1.46 2.3x10⁷±1.2 1.6
HUB (gm-1soil) 1.1x101±1.2 1.2x10²±1.6 2.1x10²±3.6 1.3x10¹⁰±4.1 9.7x10¹⁰±1.1 2.1x10²±0.3 8.3x10³±1.7 5.2x10⁴±1.4 1.2
16 w
eeks
Total CFU (gm-1soil) 4.1x10²±1.7 5.2x10²±2.3 6.1x10²±0.92 6.2x10⁵±1.2 5.3x10¹⁰±1.8 7.2x10⁴±0.2 6.1x10¹⁰±2.3 6.1x10⁶±1.3 2.5
HUB (gm-1soil) 1.2x10²±2.3 4.1x10²±3.21 5.1x10²±1.33 2.5x10¹⁰±2.3 5.6x10¹⁰±1.4 3.1x10³±0.1 3.1x10¹⁰±2.5 9.1x10⁵±0.8 1.6
24
wee
ks Total CFU (gm-1soil) 1.1x10³±2.5 6.2x10⁵±3.3 7.2x 10⁵±1.5 5.1x10¹⁰±3.1 8.2x10¹⁰±1.5 8.1x10⁵±0.18 5.8x10⁶±0.9 1.2x10⁷±0.7 2.2
HUB (gm-1soil) 1.3x10² ±4.2 9.2x10²±2.4 7.3x10²±1.8 4.2x10¹⁰±1.6 2.1x10¹⁰±1.35 6.1x10³±3.15 9.1x10¹⁰±1.6 4.6x10⁶±0.6 1.5
180
DISCUSSION
Crude oil contamination of soil and other ecosystems is an inherent global environmental problem which demands immediate attention for restoration. Compared to chemical and physical methods of restoration of crude oil contaminated sites, eco-friendly bacterial mediated bioremediation have been well established (Zhuang et al. 2007). In the present study, crude oil utilizing bacteria were isolated from different level of crude oil contaminated soil of Assam. It was found that higher crude oil containing soil harbor higher numbers of crude oil utilizing bacteria and altogether 200 morphologically distinct bacteria were isolated from crude oil contaminated soil of Assam. Further 39 different hydrocarbon-degrading bacteria were characterized based on crude oil utilizing ability and finally 3 isolates (N151, N216 and N78) were selected for further study based on crude oil degradation.
Sequencing and subsequent phylogenetic analysis of the 16S rDNA gene identified the isolates as Lysinibacillus, Brevibacillus, Bacillus, Paenibacillus, Stenotrophomonas, Alcaligenes, Delftia, Achromobacter and Pseudomonas strains (Table 2). The occurrence of these bacteria in oil polluted soil and petroleum reservoirs were earlier reported by several workers (Lal and Khanna 1996; Watanabe 2001; Ganesh and Lin 2009; Wang et al. 2010; Da Cruz et al. 2011). The treatment of bacteria under microcosm condition also confirmed the degradation of complex hydrocarbons. Almost 80% loss of total petroleum hydrocarbon (TPH) was obtained within 24 weeks in bioformulation BF2-NPK-VC-OF (Figure 3). This treatment significantly increased the rate of degradation as the number of potential hydrocarbon utilizing bacteria (native to the soil) was artificially inducted. Researchers have already reported such enhanced degradation attributed to the addition of laboratory-grown native hydrocarbon utilizing microbes (Erikson et al. 1995; Lal and Khanna 1996).
To test the quality improvement of bioremediated soil, seed germination studies is considered short-term and primary assay for acute phytoxicity of pollutants. Our data indicates that rice and mung plants treated with BF1-Mix and BF2-Mix promote overall higher seedling growth. The decrease in phytotoxicity of microcosm remediated soil may be due to degradation of crude oil and the renewed activities of introduced bacteria. Studies have reported the effect of crude oil on earthworm e.g., mortality rate of E. fetida increased in soils contaminated with 2% petroleum products (Geissen et al. 2008); diesel concentrations in soil exceeding 1% caused a dose-dependent weight loss in earthworms and increased mortality (Hanna and Weaver 2002; Shin et al. 2005); and no lethal effect on earthworm with 0.1% TPH content (Schaefer 2003). Here, a reduction of 35% and 40% mortality rate of earthworm against 63% in control after 48h of rearing remediated soil under microcosm were observed. To achieve the quality improvement of remediated crude oil contaminated soil, the survival and multiplication of the introduced microorganisms is a deciding factor (Ramos et al. 1991). Gradual increase in microbial counts (total CFU/g soil and HUB/g soil) during 28 weeks of soil bioremediation indicates the survival of introduced consortium, BF2-Mix and BF1-Mix, were recorded respectively.
CONCLUSION From the above study it could be concluded that crude oil contaminated soil is a good
habitat for potent hydrocarbon degraders of the genus Lysinibacillus, Brevibacillus, Bacillus, Paenibacillus, Stenotrophomonas, Alcaligenes, Delftia, Achromobacter and Pseudomonas strain. These bacteria singly and in consortia might have contributed to improve the quality of hydrocarbon-contaminated soil. Utilization of crude oil by the introduced bacteria and was also traced from the gas chromatogram.
181
REFERENCES Atlas RM : Microbial degradation of petroleum hydrocarbons: an environmental perspective. Microbio. Rev. 45,180-209
(1981). Da Cruz GF, de Vasconcelos SP, Angolini CFF, Dellagnezze BM, Garcia INS, de Oliveira VM, Santos Neto EV,
Marsaioli AJ.: Could petroleum biodegradation be a joint achievement of aerobic and anaerobic microrganisms in deep sea reservoirs? AMB Express 1,47(2011).
Das K., Mukherjee AK: Crude petroleum-oil biodegradation efficiency of Bacillus subtilis and Pseudomonas aeruginosa strains isolated from petroleum oil contaminated soil from Northeast India. Biores. Technol.98,1339–1345(2007)
De Jong E: Effect of a crude oil spill on cereals. Env. Poll. 22,187-307 (1980). Fernández MD, Pro J, Alonso C, Aragonese P, Tarazona JV: Terrestrial microcosms in a feasibility study on the
remediation of diesel-contaminated soils. Ecotox. and Environ. Saf. 74, 2133-2140 (2011). Dorn PB, Salanitro JP: Temporal ecological assessment of oil contaminated soils before and after bioremediation.
Chem.40, 419-426 (2000). Erickson M, Dalhammar G, Borg-Karson AK: Aerobic degradation of hydrocarbon mixture in natural contaminated
potting soil in indigenous microorganisms at 20°C and 6°C. App. Microb. Biotech. 51,532-535(1995). Frick CM, Farrell RE, Germida JJ: Assesment of phytoremediation as an in-situ technique for cleaning oil contaminated
sites. PTAC Petroleum Technology Alliance Canada,Calgary (1999) Ganesh A, Lin J: Diesel degradation and biosurfactant production by Gram-positive isolates. Afr. J.Biotech. 8,5847-5854 Geissen V, Gomez-Rivera P, Lwanga E, Mendoza RB, Narcias AT, Marcias EB: Using earthworms to test the efficiency
of remediation of oil-polluted soil in tropical Mexico. Ecotox. Env. Saf. 71,638–642 (2008). Glick BR: Using soil bacteria to facilitate phytoremediation. Biotech. Adv. 28,367-374(2010). Gogoi B, Dutta N, Goswami P, Mohan T: A case study of bioremediation of petroleum-hydrocarbon contaminated soil
at a crude oil spill site. Adv Env. Res.7:767–782 (2003). Hanna SHS, Weaver RW: Earthworm survival in oil contaminated soil. Plant Soil 240,127–132(2002). Head I, Jones D, Roling W: Marine microorganisms make a meal of oil. Nature Rev. Microb.4,173–182(2006). Holliger C, Gaspard S, Glod G, Heijman C, Schumacher W, Schwarzenbach RP, Vazquez F: Contaminated
environments in the subsurface and bioremediation: organic contaminants. FEMS Microb. Rev. 20,517–523(1997). Johnsen AR, Schmidt S, Hybholy TK, Hendriksen S, Jacobsen CS, Andersen O: Strong impact on the polycyclic
aromatic hydrocarbon (PAH)-degrading community of a PAH-polluted soil but marginal effect on PAH degradation when priming with bioremediated soil dominated by mycobacteria. App. Env. Microb. 73,1474-1480(2007).
Lal B, Khanna S: Degradation of crude oil by Acinetobacter calcoaceticus and Alcaligen sodorans. J App Bac. 81,355-362(1996). Lundstedt S, Haglund P, Oberg L: Degradation and formation of polycyclic aromatic compounds during bioslurry
treatment of an aged gasworks soil. Env. Toxicol. Che. 22,1413–1420 (2003). Margesin R, Labbe D, Schinner F, Greer C, Whyte L: Characterization of hydrocarbon-degrading microbial populations
in contaminated and pristine alpine soils. App. Environ. Microb. 69,3085–3092(2003). Ramos JL, Duque E, Ramos-Gonzalez MI: Survival in soils of an herbicide-resistant Pseudomonas putida strain bearing a
recombinant TOL plasmid. App. Env. Microb. 57,260-266 (1991). Sarma Roy A, Yenn R, Singh AK, Deka Boruah HP, Saikia N, Deka M: Bioremediation of crude oil contaminated tea
plantation soil using two Pseudomonas aeruginosa strains AS03 and NA108. Af. J. Biotech. 12(19), 2600-2610(2013). Schaefer M: Behavioural endpoints in earthworm ecotoxicology: Evaluation of different test systems in soil toxicity
assessment. J Soil Sed. 3,79–84 (2003) Udo EJ, Fayemi AAA:The effect of oil pollution on soil germination, growth and nutrient uptake of corn. J Env. Qua
4,537-540(1995). Ulrici W: Contaminant soil areas, different countries and contaminant monitoring of contaminants, in Environmental
Process II. Soil Decontamination Biotechnology, H. J. Rehm and G. Reed, Eds. 11,5–42 (2008) Wang H, Xu R, Li F, Qiao J, Zhang B: 2010. Efficient degradation of lube oil by a mixed bacterial consortium. J. Env.
Sci. 22,381-388 (2010). Watanabe K: Microorganisms relevant to bioremediation. Curr. Opi. Biotech. 12,237–241(2001). Weisburg WG, Barns SM, Pelletier DA, Lane DJ: 16S Ribosomal DNA amplification for Phylogenetic Study. J. of Bac.,
173, 697-703(1991). Yenn R, Borah M., Deka Boruah HP, Sarma Roy A, Baruah R, Saikia N, Sahu OP, Tamuli AK:) Phytoremediation of
abandoned crude oil contaminated drill sites of Assam with the aid of a hydrocarbon-degrading bacterial formulation. Int. J. of Phyt.. (In press) (2013
Zhuang X, Chen J, Shim H, Bai Z: New advances in plant growth promoting rhizobacteria for bioremediation. Env. Int. 33,406-413(2007)
182
MINIMIZING EFFECT OF LAND DEGRADATION IN BENUE STATE FOR SUSTAINABLE FOOD PRODUCTION
Chagbe Kurayemen; Gyata, B.A and Ali Emmanuel
1 Department of Agricultural Education,
College of Education, Katsina Ala-Nigeria
2 Department of Soil Science, Institute of Land Resources, Jos-Nigeria
Abstract
This paper looks at land degradation and its effects on the environment globally and locally. Unless land rehabilitation measures are effective, a downward eco-social spiral is created when marginal lands are physically, chemically and biologically depleted by unsustainable land management practices resulting in lost soil resilience leading to soil degradation and permanent damage .The paper examines the land degradation types prevalent in Benue state to include: Deforestation, Overexploitation for fuel wood, overgrazing, agricultural activities and industrialization. and the severity with which they occur. The paper concludes that a multidisciplinary approach should be adopted to include effective teaching and learning of environmental education and development of sound policies that can begin the process of healing the land with its attendant benefits to the environment and agricultural revival in Benue state.
Key words: Land- Degradation- sustainability agriculture, Benue state
INTRODUCTION
In the last two decades, public interest in land quality has been increasing throughout the world as humankind recognizes the fragility of earth’s soil, water and air resources, and the need of their protection to sustain civilization. The concept of soil quality was first suggested in 1977 at a conference (Doran and Parkin 1994) which focused on the risks and benefits associated with intensive agriculture, but the concept per se was not discussed until 1980s when it was defined based on the soil function, and the methods to evaluate it were published.
Land and soil quality were usually used interchangeably and were defined in many different ways. Power and Meyers (1989) defined soil quality as the ability of soil to support crop growth, including factors such as tilth, aggregation, organic matter content, soil depth, water holding capacity, infiltration rate, pH changes and nutrient capacity. Larson and Pierce (1991) defined soil quality as the capacity of the soil to function within ecosystem boundaries and to interact positively with the environment external to that ecosystem.
Land degradation is a concept in which the value of the biophysical environment is affected by one or more contribution of human induced processes upon the land. (Eswaren 2000). (Evans, 2002).defined Land degradation as a decline in the productive ability of the soil.
The world’s productive croplands are in decline due to the pressure of human activities. The soil which is very fundamental to agricultural production is a dynamic and natural body composed primarily of weathered material, along with water, oxygen and organic materials. Soil, a key element of land resource is a vital natural resource that is nonrenewable on the human time scale (Jenny
183
1980) and is a living, dynamic, natural body that plays many key roles in terrestrial ecosystems. It is the essence of life and health for the well-being of humankind and animals and the major source of most of our food production. The soil covers most of the land surface with a fragile, thin mantle. Soil organic carbon (SOC) is the most often reported attribute and is chosen as the most important indicator of soil quality and agricultural sustainability. (Lal, 1994).
The soil is layered into sections called “horizons”. The layered nature of soil indicates its long evolution under the effects of atmospheric and biological process. The process that creates soil from bare rock is called “weathering”. In the weathering process, the atmosphere and water interact with bare rock/parent material to slowly break down parent material into smaller particles which eventually mix up with other organic substances and undergo physical as well as chemical transformation to become soil. This process is slow and complex. It is very difficult to restore lost mantle.
The process of land degradation could be physical, chemical and biological (Obi, 2010). It could take the form of structural deformation, e.g. crusting, accelerated erosion, imbalance in water to air ratio which could impede root penetration and development. Chemical degradation could include processes such as fertility depletion, laterization sodification, aluminum toxicity which can course serious toxicity or limit the ability of plant to pick up needed nutrients in the soil. The biological degradation could include decline in soil organic matter, soil biomass content and alteration is biological process in the soil.
Causes of land degradation
Productive lands of the world have been on a decline at an alarming rate. Degradation and desertification have been reported by many (Dregne, 1994). Mbagwu, J.S lal, R and Scott, T.W (1984) reported a number of factors, many or most of which are tied to human development. Mackenzie and Mackenzie (1995) identified primary causes of land degradation to include: Deforestation, Overexploitation for fuel wood, overgrazing, agricultural activities and industrialization. Obi, (2010) identified factors such as: excessive cultivation, untimely cultivation, indiscriminate and excessive use of chemicals, intensive row cropping, monoculture and high stocking rate as majour contributors to land degradation in Africa.
On the global basis, soil degradation is caused primarily by Overgrazing (35%), agricultural activities (28%), deforestation (30%), overexploitation of land to produce fuel wood (7%) and industrialization (4%). (Mackenzie and Mackenzie 2004).
The patterns are different with various regions of the world. The economic reasons for these processes are complex and are linked to the particular characteristics of each region.
Land degradation types in Benue State.
Benue State is within the Southern Guinea Savanna agro-ecological zone of Nigeria which is characterized by distinct wet and dry season. The mean annual rainfall is about 1137 mm, with a distribution between April to October. The landform is moderately undulating. The total average evapo-transpiration is estimated at about 2,602 mm with mean annual relative humidity of about 40.7 percent.(BENSEEDS)
184
The people of the state are principally engaged in agricultural activities. This activities account for a greater percentage of the degradation types which may be summed up to include:-
(a) Erosion:
Because of the clearing away of the surface cover/vegetation in order to produce food and cash crops, the surfaces of the soils are usually left bare and the rate of surface runoff increases leading to wearing away of land surface which lead to reduced fertility of the soils. Since the top soils are the richest in soil nutrients and organic matter content. This could be noticed more in the resultant gullies at the southern parts of Benue State e.g. Otukpo, Otukpa and Ugbokolo.
Siltation and accumulation of silt particles in streams and rivers in most part of Benue State are also common as a result of water erosion.
(b) Organic matter depletion:
Constant bush burning activities coupled with rapid mineralization of organic matter is a common feature of low income agriculture especially in the tropics. This leads to rapid organic matter depletion. Organic matter is the storehouse of nutrients and a soil modification material. It’s depletion causes impoverishment of soil nutrient status and consequently increases the vulnerability of the soil to crumbling and detachment and transport. It is evident that the most croplands in the state are unproductive today due to this phenomenon.
(iii) Desertification:
Naturally most parts of Benue State belong to a derived Savanna region. The constant felling of trees has generated lush regeneration of grasses over time. However, the encroachment on marginal lands due to loss of fertile and productive lands because of the quest to increase productivity and also because of demand for fuel wood and timber, certain parts of Benue State are excessively deforested and are prone to desertification and its attendant effect.
(iv) Acidification / Salinization
Although no serious report of Salinization has been reported in Benue State, the downward and lateral transport of soil nutrients in solution due to high torrential rainfall intensity in this region causes soil acidification to crop fields across state resulting to poor crop yields. The high evapo-transpiration which sometime exceeds precipitation is also potentially a Salinization process.
(v) Compaction/Crusting
Ivara, (2005) classified soils of Benue valley to consist of Alfisols, Entisols ,and Ultisols. These soils are Shallow with underlying clay accumulations and poor internal drainage. These soils also may contain plinthite sub-surface layers and sometimes protrude to surfaces of soils as out-crops.
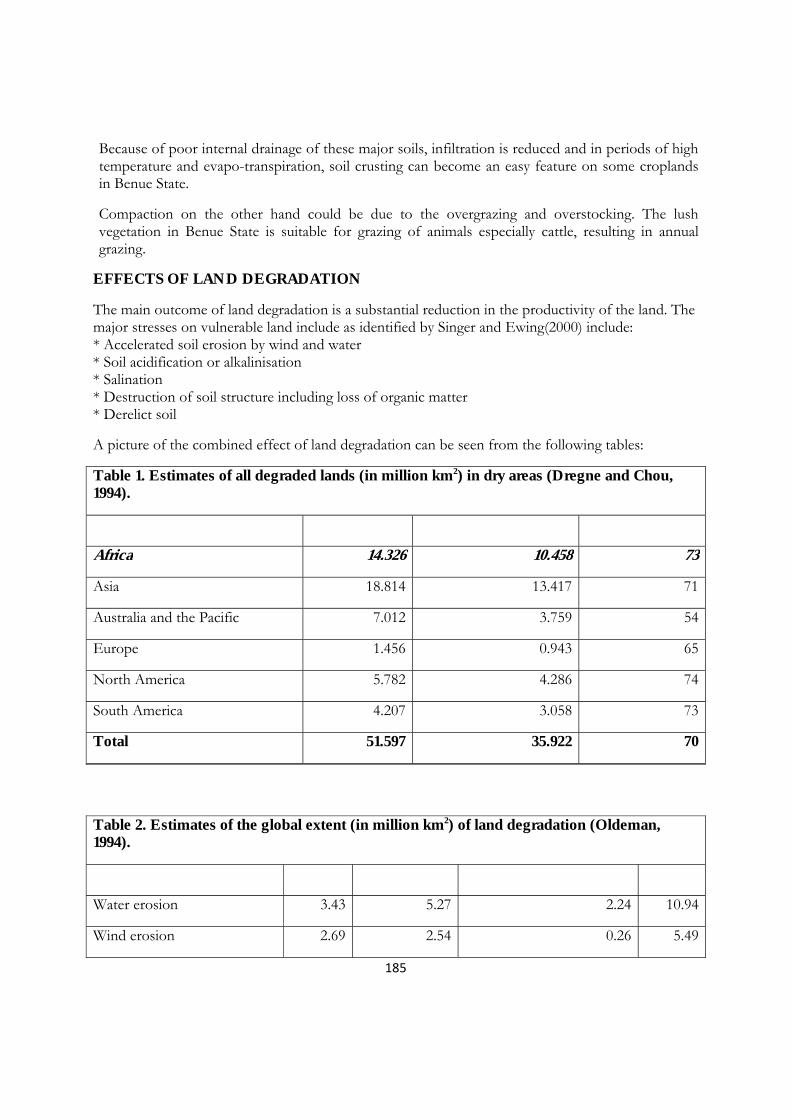
185
Because of poor internal drainage of these major soils, infiltration is reduced and in periods of high temperature and evapo-transpiration, soil crusting can become an easy feature on some croplands in Benue State.
Compaction on the other hand could be due to the overgrazing and overstocking. The lush vegetation in Benue State is suitable for grazing of animals especially cattle, resulting in annual grazing.
EFFECTS OF LAND DEGRADATION
The main outcome of land degradation is a substantial reduction in the productivity of the land. The major stresses on vulnerable land include as identified by Singer and Ewing(2000) include: * Accelerated soil erosion by wind and water * Soil acidification or alkalinisation * Salination * Destruction of soil structure including loss of organic matter * Derelict soil
A picture of the combined effect of land degradation can be seen from the following tables:
Table 1. Estimates of all degraded lands (in million km2) in dry areas (Dregne and Chou, 1994).
Continent Total area Degraded area † % degraded
Africa 14.326 10.458 73
Asia 18.814 13.417 71
Australia and the Pacific 7.012 3.759 54
Europe 1.456 0.943 65
North America 5.782 4.286 74
South America 4.207 3.058 73
Total 51.597 35.922 70
Table 2. Estimates of the global extent (in million km2) of land degradation (Oldeman, 1994).
Type Light Moderate Strong + Extreme Total
Water erosion 3.43 5.27 2.24 10.94
Wind erosion 2.69 2.54 0.26 5.49
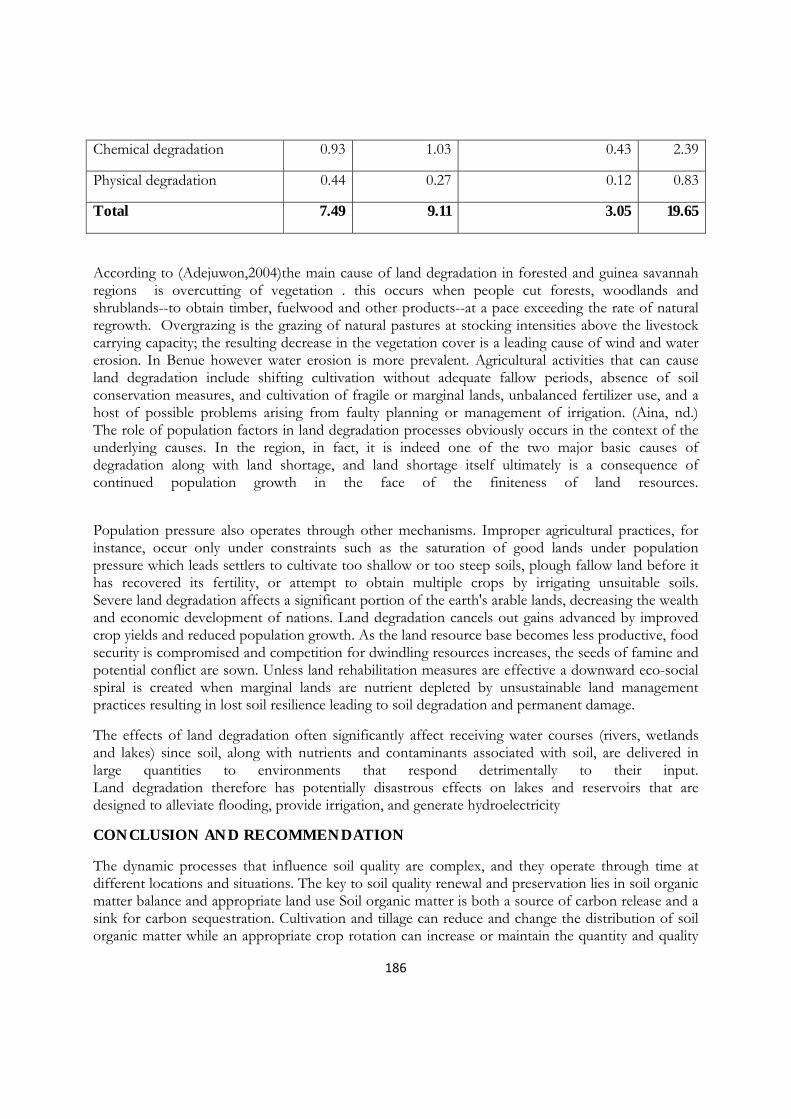
186
Chemical degradation 0.93 1.03 0.43 2.39
Physical degradation 0.44 0.27 0.12 0.83
Total 7.49 9.11 3.05 19.65
According to (Adejuwon,2004)the main cause of land degradation in forested and guinea savannah regions is overcutting of vegetation . this occurs when people cut forests, woodlands and shrublands--to obtain timber, fuelwood and other products--at a pace exceeding the rate of natural regrowth. Overgrazing is the grazing of natural pastures at stocking intensities above the livestock carrying capacity; the resulting decrease in the vegetation cover is a leading cause of wind and water erosion. In Benue however water erosion is more prevalent. Agricultural activities that can cause land degradation include shifting cultivation without adequate fallow periods, absence of soil conservation measures, and cultivation of fragile or marginal lands, unbalanced fertilizer use, and a host of possible problems arising from faulty planning or management of irrigation. (Aina, nd.) The role of population factors in land degradation processes obviously occurs in the context of the underlying causes. In the region, in fact, it is indeed one of the two major basic causes of degradation along with land shortage, and land shortage itself ultimately is a consequence of continued population growth in the face of the finiteness of land resources.
Population pressure also operates through other mechanisms. Improper agricultural practices, for instance, occur only under constraints such as the saturation of good lands under population pressure which leads settlers to cultivate too shallow or too steep soils, plough fallow land before it has recovered its fertility, or attempt to obtain multiple crops by irrigating unsuitable soils. Severe land degradation affects a significant portion of the earth's arable lands, decreasing the wealth and economic development of nations. Land degradation cancels out gains advanced by improved crop yields and reduced population growth. As the land resource base becomes less productive, food security is compromised and competition for dwindling resources increases, the seeds of famine and potential conflict are sown. Unless land rehabilitation measures are effective a downward eco-social spiral is created when marginal lands are nutrient depleted by unsustainable land management practices resulting in lost soil resilience leading to soil degradation and permanent damage.
The effects of land degradation often significantly affect receiving water courses (rivers, wetlands and lakes) since soil, along with nutrients and contaminants associated with soil, are delivered in large quantities to environments that respond detrimentally to their input. Land degradation therefore has potentially disastrous effects on lakes and reservoirs that are designed to alleviate flooding, provide irrigation, and generate hydroelectricity
CONCLUSION AND RECOMMENDATION
The dynamic processes that influence soil quality are complex, and they operate through time at different locations and situations. The key to soil quality renewal and preservation lies in soil organic matter balance and appropriate land use Soil organic matter is both a source of carbon release and a sink for carbon sequestration. Cultivation and tillage can reduce and change the distribution of soil organic matter while an appropriate crop rotation can increase or maintain the quantity and quality
187
of soil organic matter, and improve soil chemical and physical properties. The return of crop residues and the application of manure and fertilizers can all contribute to an increase in soil quality.,
There is also a need to address land degradation issues though a multidisciplinary approach one of which is the effective teaching-learning of environmental education in our schools. In so doing the socio-economic aspects e.g. poverty reduction will go a long way in minimizing environmental components which impact negativity on land such as over-exploitation of fuel wood and indiscriminate felling of trees (deforestation).
The scientific community should also be encouraged to mount integrated programmes for standard methods, data collection and research network for assessment and monitoring of soil and land degradation which are site specific
The impact of land degradation is a global phenomenon; Benue State which is the food basket of Nigeria is not immune to this menace. It is therefore recommended that appropriate agricultural activities and management techniques which include organic farming, conservation tillage practice, will promote the health of Benue Soils and reduce degradation of our soils and avoid catastrophic effects of this menace.
REFERENCES
Adejuwon S.A (2004). "The impacts of climate variability and climate change on crop yield in Nigeria". Paper presented at stakeholders' workshop on assessment of impacts and adaptation to climate change Obafemi Awolowo University, Ile Ife, Nigeria
Aina, P.O. (nd) Rainfall run-off management techniques for erosion control and soil moisture conservation. FAO. Co-operate document repository. http://www.fao.org//docrep.
Dregne, H.E. & Chou, N.T. (1994). Global desertification dimensions and cost. In Degradation and Restoration of Arid Lands Technical University of Texas.
Doran J.W., Parkin T.B. (1994): Defining and assessing soil quality. In: Doran J.W. et al. (eds.): Defining Soil Quality for a Sustainable Environment. SSSA Spec.Publ. No. 35, ASA and SSSA, Madison, WI: 3–21.
Eswaren, H. (2000) Desertification: A global assessment and risk to sustainability. Proceedings of the 16th International Congress of Soil Science, Motpellier France. 77, 1 – 18.
Evans, R. (2002) Rural land use in England and Whales and the delivery to adjacent Seas of nitrogen, phosphorus and atraizine. Soil use Management 19; 1 – 7.
Jenny H. (1980): The Soil Resource: Origin and Behavior.Ecol. Stud. 37. Springer-Verlag, New York
Ivara, E.E (2005). Characterization, Classification and Management of Nigerian Soils. 26th inaugural lecture, University of Calabar.
188
Lal, R. (1994) Tillage effects on land degradation, soil resilience, soil quality and sustainability. Soil tillage Research 27, 1- 8.
Larson, W.E., Pierce, F.J. (1991): Conservation and enhancement of soil quality. In: Mumanski J. et al. (eds.):Evaluation for Sustainable Land Management in the Developing World. Vol. 2. Techn. Pap. In: Proc. Int.Workshop, Chiang Rai, Thailand, Int. Board Soil Res.Manage. Bangkok: 175–203.
Mackerizie, F.T. and J.A. Mackarizie (1995) our changing Earth: An introduction to Earth system science and Global Environmental change. Prentice Hall.
Mbagwu, J.S. Lal, R. and Scott, T.W. (1994) Effect of desurfacing of Alfisols and Ultisols in Southern Nigeria. Soil Science society of America Journal, 48, 828 – 833.
Obi, M.I. (2010). A compendium of Lecture notes on Soil conservation Unpublished.
Oldeman, L.R. (1994). The global extent of Land degradation in: Land Resilience and Sustainable Land Use, ed. Greenland D.J. 99 – 118. Willingford: CABI.
Power, J.F., Meyers, R.J.K. (1989): The maintenance or improvement of farming systems in North Americaand Australia. In: Stewart J.W.B. (ed.): Soil quality in semi-arid agriculture. In: Proc. Int. Conf. Univ.Saskatchewan, Saskatoon, Canada: 273–292.
Singer, M.J., Ewing, S.A. (2000): Soil quality. In: Sumner M.E. (ed.): Handbook of Soil Science. CRC Press, Inc.,Boca Raton, FL: 271–298.
189
ASSESSING THE CHALLENGES AND OPPORTUNITIES IN
THE OIL AND GAS INDUSTRY
Emmanuel Tsegha
Civil Engineering Department,Federal Polytechnic,Bauchi-Nigeria
ABSTRACT
It is a huge paradox, a curious irony so difficult to swallow, not to mention digesting, that Nigeria as the world’s 6th largest oil producer can barely meet its local needs of fuel supply. This strange phenomenon begets a litany of wild and unhelpful ramifications on the nation’s economy. Talk of capital flight, talk of poor value addition to our physical resources, think about scandalous fuel subsidy outlay among others.This paper is an overview of operations in the oil and gas industry vis-à-vis these challenges, seeks to highlight the opportunities available, and the need to pursue an aggressive developmental strategy in this sector.While the world is now focusing on natural gas as a viable alternative to crude oil, there is gross, dismal under-utilisation of same and outright wastage via flaring, in Nigeria. It is also a clarion call on stakeholders to make this all-important sector an optimal, intangible wealth creator. Key words: Intangible wealth, Associated gas, Liquefaction, Greener vehicle, Social capital. INTRODUCTION
There’s no gainsaying the fact that oil and gas are the lifeblood of Nigeria’s economy and elsewhere, for now and many years to come. As we are aware, the petroleum industry is a major contributor to the National Gross Domestic Product (GDP) as well as the major foreign exchange earner, accounting for about 80% of National Revenue and over 90% of the nation’s foreign exchange earnings. This fact was stated by no other than former double president Olusegun Obasanjo while addressing the 25th Society of Petroleum Engineers (SPE) Annual Conference and Exhibition in 2003. We are told that current crude oil production is little over 2 million barrels per day (bpd). For 55 years now production has been on-going, having begun production of about 5000 bpd in 1957 near Oloibiri, Rivers State. According to the Organization of Petroleum Exporting Countries (OPEC), Nigeria has an estimated 37 billion barrels of oil reserves. Most of the country’s proven oil and gas reserves are concentrated in the Niger Delta region.
Vision 20:2020 envisages that oil reserves will increase to 40 billion barrels with discovery of new oil wells and daily production from current levels to about 4 million bpd.
Oil Industry Operations Operations in the oil industry are broadly divided into three categories namely, Upstream, Midstream and Downstream processes.
i. Upstream Sector Operations This is the sector that deals with exploration (searching), finding and production of crude oil and natural gas.
190
There are land-based operations, usually referred to as onshore and operations over water, usually referred to as offshore. International Oil Companies (IOC’s), otherwise known as Multinational Oil Companies (MOC’s) are the main operators in the Nigerian Upstream Sector. They include Shell, ExxonMobil, Chevron, Total and Agip. In this process the Federal Government of Nigeria (FGN), through the Nigerian National Petroleum Corporation (NNPC), act as the senior partner with the oil producing companies in what is called Joint Ventures (JV’s). The arm of NNPC that oversees the interest of FGN is the National Petroleum Investment Management Services (NAPIMS).
ii. Midstream Sector Operations This sector is a bridge between the upstream and the downstream sectors, and comprise of processes such as storage, transportation and marketing. The crude oil produced is moved from the production spots to the ports for direct exportation or to the refineries for processing. The sector provides for about 90% of Nigeria’s exports. iii. Downstream Sector Operations The activities in this sector include refining, transportation, storage, distribution and marketing of the refined products. NNPC is the dominant player here through its refineries and subsidiaries such as Pipelines and Products Marketing Company (PPMC). There are other players here too who are classified as either major or independent marketers depending on the volume of product they handle. Oil Refining Capacity versus Domestic Demand According to 2010BP Statistical Energy Survey, the estimated daily demand for petroleum products in Nigeria is, 33 million litres of petrol, otherwise known as premium motor spirit (PMS), 18 million litres of diesel, that is automotive gas oil (AGO), and 10 million litres of dual purpose kerosene (DPK) DPK is made up of aviation turbine kerosene (ATK) or Jet Al and household kerosene (HHK) The survey states that the estimated amount of crude oil required daily for domestic refining that would satisfy this demand adequately should be about 530,000 bpd. However, the nation’s four refineries (all government-owned), with a combined installed refining capacity for 445,000 bpd could only process 360,000 bpd due to old age and poor Turn Around Maintenance (TAM). See Table 1.0 for the ages and installed capacities of the refineries. The last ATM for these refineries is as follows: Twin PortHarcourt Refinery, last had TAM in 1999 (14 years today) Warri Refinery, last had TAM in 2004 (9years now) Kaduna Refinery, last had Tam in 2008 (5years now) But experts say that a fully functional refinery should undergo TAM every 2 years. Table 1.0: Installed Domestic Refining Capacity.
Refinery Year of Construction Installed Capacity (bpd)
i. PortHarcourt Refinery 1965(48 years old) 60,000

191
ii. Warri Refinery 1978 (35 years old) 125,000
iii. Kaduna Refinery 1980( 33 years old) 110,000
iv. Eleme (New Port Harcourt) Refinery
1989( 24 years old) 150,000
Total installed capacity 445,000
Source: NNPC
This development has led to the current important contribution (especially, PMS) ranging from 60-80%. Even if the refineries were operating at full capacities, it is clear that the situation would not have been any better. For over two decades now this has provided an excuse for the government to import fuel at higher prices and to use that as reason for claiming huge subsidies which might not have arisen if the refineries were adequate and functioning as they should. It will be recalled that recently, the National Assembly House Committee probing fuel subsidy scandal got enmeshed in bribe-taking. It is interesting to recall that on Tuesday, 21st March, 1989, while commissioning the fourth refinery at Eleme (described by Omoifo as the “4th wonder”), the then president, General Ibrahim Babangida declared that the nation will have,
“a potential surplus of approximately 100,000 bpd of refining capacity for the export market, making Nigeria a prominent member of the league of refined petroleum products exporting countries.”
This statement pre-supposes that, with the 4th refinery coming on stream the nation should have been, not only self-sufficient in petroleum products, but also be exporting these products. Today, more than two decades thenceforth, national deficiency in refined petroleum products still persists, and not for a singular intermittent occasion did it ever abate nor cease. The argument on the lips of several well-meaning Nigerians has always been that the nation needs more refineries, functional ones at that, in order to reverse this unhelpful trend of national deficiency in refined petroleum products to a position of national prosperity. National prosperity by way of more employment for citizens, more export earnings, immense varieties of petrochemical products, limiting or outright cessation of subsidy outlay. Talk about a chain of value addition to a God-given tangible asset. Late Prince Aret Adams ( former Managing Director of NNPC), late Professor Sam Aluko chorused this argument to their last days, that it is cheaper and more beneficial to refine crude oil locally and export the refined products to fetch more revenue. In buttressing this argument, Aluko (2003) went citing relevant examples two of which are;
i. “Rotterdam alone has eight refineries, which is not more than the size of Akure.” Rotterdam is the capital city of Holland.
ii. “ Singapore, a country of not up to 4 million inhabitants, with zero natural resources, no oil, has three refineries.”
“This country ought to have about 20 refineries,” he lamented. The pertinent question is why government is lukewarm about building new refinery(ies) and is equally not enthusiastic in encouraging the establishment of private ones.
192
In 2007 the Federal Government granted nine licenses to private investors to build refineries but the chairman of the Association of Private Refinery Owners of Nigeria, Justice Samuel Ilori has said that,
“federal government is responsible for frustrating the take-off of private refineries through introduction of policies that are not favourable to the project.”
Now, Africa’s richest man, Alhaji Aliko Dangote has just announced his decision to build a crude oil refinery in the country with 400,000 bpd (almost the combined total of the existing ones) by 2016. To underscore the deep apprehension of stakeholders in this refining venture he has this to say, “that it is only mad businessmen that would want to invest in refinery,” but that, “we are set to do that.” From what Dangote has said we can hazard a reasonable guess that policies are unpalatable or rather stringent for the prospective entrepreneurs. The Petroleum Industry Bill (PIB) This is a proposed legislation by the FGN to replace existing Petroleum Act of 1969. Through this bill, government is seeking to set out a new legal, regulatory and fiscal framework for the entire oil and gas industry. The PIB was first drafted in 2003 during the tenure of President Olusegun Obasanjo, again presented to the National Assembly in 2008 by the late President Umaru Yar’adua but which did not scale through. The current one (a 224-page affair) was drafted and re-presented in 2012 by President Goodluck Jonathan. Debate on the bill is currently on-going in the National Assembly. The PIB is protracted and contentious because there are so many vested interests in the oil and gas sector that are not comfortable with the passage of the bill as presently drafted. It is hoped that those conflicting interests are amicably ironed out and the bill passed and enacted to usher in a new era in the oil and gas industry. An era of more value addition to crude oil, an era of domestic self-sufficiency and exports in petroleum products, an era of private refineries etc. Improving Energy Security by Enhanced Utilization of Natural Gas Natural gas, a hydrocarbon (i.e a chemical made up of two elements, hydrogen and carbon) exist in underground reservoirs either on its own as free gas (non-associated gas) or in union with crude oil (associated gas). It is composed of butane (C4H10), ethane (C2H6), propane (C3H8) and methane (CH4), with methane being the dominant component. Due to environmental concerns and other complexities surrounding the production and use of crude oil as an energy source, the world is shifting emphasis from oil to gas as alternative energy source. Nigeria cannot be left out, more so given her abundant natural gas reserves. Experts in the petroleum industry in Nigeria have told us that the nation is blessed with over 100 trillion standard cubic feet (scf) of natural gas reserves, which is equivalent to three times Nigeria’s crude oil reserves. The gas reserves is about equally distributed between the two, associated and non-associated categories, they say. But it is clear that gas utilization has not been optimized, it is far from occupying its appropriate level in the nation’s energy mix, both domestically and internationally.
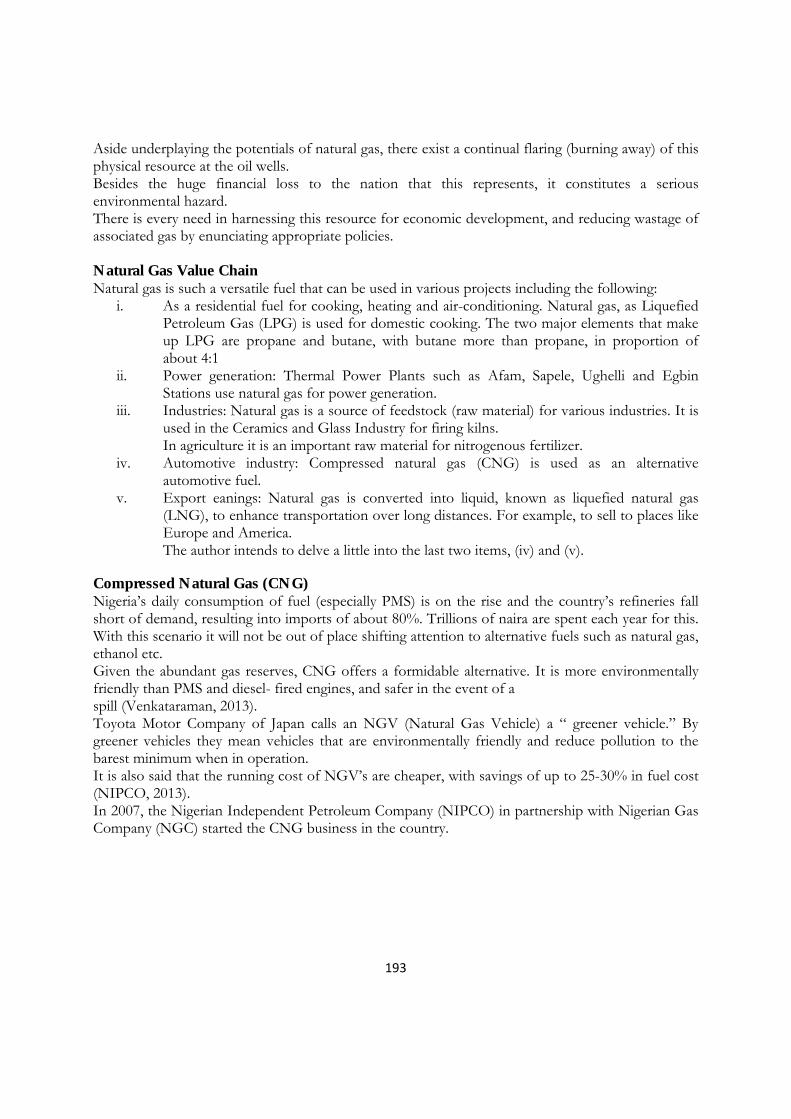
193
Aside underplaying the potentials of natural gas, there exist a continual flaring (burning away) of this physical resource at the oil wells. Besides the huge financial loss to the nation that this represents, it constitutes a serious environmental hazard. There is every need in harnessing this resource for economic development, and reducing wastage of associated gas by enunciating appropriate policies. Natural Gas Value Chain Natural gas is such a versatile fuel that can be used in various projects including the following:
i. As a residential fuel for cooking, heating and air-conditioning. Natural gas, as Liquefied Petroleum Gas (LPG) is used for domestic cooking. The two major elements that make up LPG are propane and butane, with butane more than propane, in proportion of about 4:1
ii. Power generation: Thermal Power Plants such as Afam, Sapele, Ughelli and Egbin Stations use natural gas for power generation.
iii. Industries: Natural gas is a source of feedstock (raw material) for various industries. It is used in the Ceramics and Glass Industry for firing kilns. In agriculture it is an important raw material for nitrogenous fertilizer.
iv. Automotive industry: Compressed natural gas (CNG) is used as an alternative automotive fuel.
v. Export eanings: Natural gas is converted into liquid, known as liquefied natural gas (LNG), to enhance transportation over long distances. For example, to sell to places like Europe and America. The author intends to delve a little into the last two items, (iv) and (v).
Compressed Natural Gas (CNG) Nigeria’s daily consumption of fuel (especially PMS) is on the rise and the country’s refineries fall short of demand, resulting into imports of about 80%. Trillions of naira are spent each year for this. With this scenario it will not be out of place shifting attention to alternative fuels such as natural gas, ethanol etc. Given the abundant gas reserves, CNG offers a formidable alternative. It is more environmentally friendly than PMS and diesel- fired engines, and safer in the event of a spill (Venkataraman, 2013). Toyota Motor Company of Japan calls an NGV (Natural Gas Vehicle) a “ greener vehicle.” By greener vehicles they mean vehicles that are environmentally friendly and reduce pollution to the barest minimum when in operation. It is also said that the running cost of NGV’s are cheaper, with savings of up to 25-30% in fuel cost (NIPCO, 2013). In 2007, the Nigerian Independent Petroleum Company (NIPCO) in partnership with Nigerian Gas Company (NGC) started the CNG business in the country.
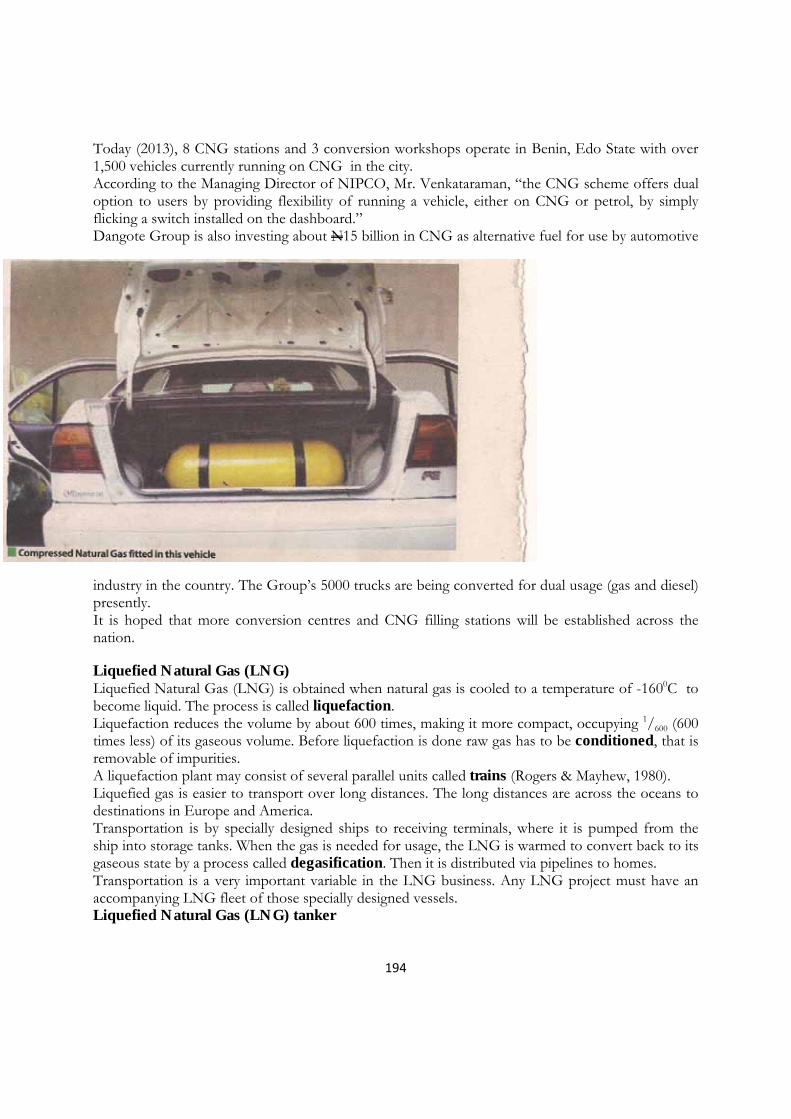
194
Today (2013), 8 CNG stations and 3 conversion workshops operate in Benin, Edo State with over 1,500 vehicles currently running on CNG in the city. According to the Managing Director of NIPCO, Mr. Venkataraman, “the CNG scheme offers dual option to users by providing flexibility of running a vehicle, either on CNG or petrol, by simply flicking a switch installed on the dashboard.” Dangote Group is also investing about N15 billion in CNG as alternative fuel for use by automotive
industry in the country. The Group’s 5000 trucks are being converted for dual usage (gas and diesel) presently. It is hoped that more conversion centres and CNG filling stations will be established across the nation. Liquefied Natural Gas (LNG) Liquefied Natural Gas (LNG) is obtained when natural gas is cooled to a temperature of -1600C to become liquid. The process is called liquefaction. Liquefaction reduces the volume by about 600 times, making it more compact, occupying 1/600 (600 times less) of its gaseous volume. Before liquefaction is done raw gas has to be conditioned, that is removable of impurities. A liquefaction plant may consist of several parallel units called trains (Rogers & Mayhew, 1980). Liquefied gas is easier to transport over long distances. The long distances are across the oceans to destinations in Europe and America. Transportation is by specially designed ships to receiving terminals, where it is pumped from the ship into storage tanks. When the gas is needed for usage, the LNG is warmed to convert back to its gaseous state by a process called degasification. Then it is distributed via pipelines to homes. Transportation is a very important variable in the LNG business. Any LNG project must have an accompanying LNG fleet of those specially designed vessels. Liquefied Natural Gas (LNG) tanker

195
Nothing can be achieved without this because the product is only paid for when it arrives its destination intact. World demand for LNG is huge and growing. World Bank estimates reveal that global demand for gas will outstrip oil by 2020. The Nigeria LNG Project Though belated, the LNG seems to be the most ambitious project in the exploitation of the massive gas reserves. There had not been any serious gas utilization plan until the inception of Nigerian LNG in 1989. The LNG Ltd., located at Finima, Bonny Island, is jointly owned by NNPC (49% share holding), Shell (25.6%), Total (15%) and Eni (10.4%)
It has a subsidiary company, Bonny Gas Transport, that provides Transport (shipping) services to LNG (LNG website, 2013). Production which began with two trains in 1999 has now been expanded to six. But this project, laudable as it is, only scratches the surface of the challenges and opportunities available. We are still left with the bulk of gas waiting to be tapped and associated gas continues to be flared. Challenges and Proposed Recommendations
i. Fuel Imports Attendant upon Domestic Refining Deficit.
196
There has been a repetition of well-meaning voices calling on government to build more refineries and/or create enabling conditions for private ones. That call is again being repeated here Intangible wealth is greater and more beneficial to the nation than tangible wealth. Tangible wealth is derived from raw materials (in this case, crude oil) export as against intangible wealth which is derived from finished products with added value. In justifying air-fare hike, the CEO of Westlink Airlines, Capt. Ibrahim Mshelia has this to say, that, “ Domestic airfares will remain high so long as Nigeria does not refine its aviation fuel (Jet Al) locally.” In the absence of adequate, functional domestic refineries it is recommended that we contract- refine abroad what we cannot refine locally. After all, we contract out abroad simple jobs such as ballot boxes, voting papers and the like. It is also hoped that the PIB currently before the National Assembly will ensure that incentives are granted to allow for the development of private refineries alongside the existing ones
ii. Gas Flaring and Under- Utilization Continued gas flaring clearly underscores the under-development of the gas industry in Nigeria. ExxonMobil (2003) has stated that, “the country stands to gain an estimated $3billion a year when the gas currently being flared, is fully commoditized.” Oil exploration and production companies have to roll out programmes geared towards the reduction, if not total ending, of gas flaring.
• Greater domestic utilization of natural gas for power generation, industries and cooking would free petroleum for exports, free the diesel, petrol and household kerosene that otherwise would have been used.
• Use of natural gas for domestic cooking could also reduce the use of firewood and help halt deforestation and consequently desertification.
• There is every need to establish a 2nd LNG plant to fully utilize the large volume of gas reserves for more exports.
iii. Security Challenges It is common knowledge that there exist security challenges in the Niger Delta, the epicentre of oil and gas operations. Cases of militant attack on oil installations, oil theft (bunkering), attacking and killing of security operatives, and piracy abound. While militant attack on oil installations in the region have slowed down due largely to the 2009 amnesty programmes, oil theft has continued unabated. The JTF battling oil theft has confessed that, “we can’t stop oil thieves,” because the barons behind the crime are wealthy, influential and untouchable Nigerians.
The involvement of this top politicians, military generals always make nonsense of the efforts of the task force. Unless the government develops the necessary political will to go after such barons behind the menace, the problem of oil theft will persist.
iv. Social Capital
197
Universal values such as hard work, high level of patriotism, high level of discipline, a sense of common good, transparency and trust-worthiness form what social scientists call social capital. In Nigeria, unfortunately, this values are lacking or totally absent. The persistent menace of oil bunkering by people in authority can be explained solely on lack of this social capital. And by extension, it is largely responsible for our developmental crisis. Many nations of the world such as Japan, China, South Korea etc. have prospered above Nigeria, not because their citizens are more intelligent than Nigerians, but simply because they exhibit high levels of social capital. May God help us to equally imbibe this culture? It is not encumbered by geographic boundaries.
References Aluko, S. (2003, August 17). Monetisation is a foolish policy. Sunday Punch. 33(1256),pp 4-7 ExxonMobil(2013, January 8). Energy issues literacy series. Daily Trust. 31(18), pp21-32 NLNG website (2013). www.nlng.com
Retrieved on July 17, 2013 from the URL. Omoifo, I. (1989, April 3). The fourth wonder . The African Guardian. 4(13), p19 Rodgers G. F. amd Mayhew Y. R. (1980). Engineering Thermodynamics, Work and Heat Transfer
(3rd ed.), Longman Group Ltd. London. Shosanya, M. (2013,April 19 ), The proposed Dangote refinery and Nigeria’s economy. Daily Trust.
31(93,) p18 Venkataraman, V. (2013, April 14). High hopes as Nigeria invests in alternative fuel for cars. Sunday
Trust 7(41). p56
198
CHALLENGES AND PROSPECTS OF GEOPHYSICAL EXPLORATION OF GEOTHERMAL SYSTEM FOR NATIONAL DEVELOPMENT
Abraham Musa Zira
Physics Department, Federal College of Education (T) Potiskum Yobe State Nigeria.
ABSTRACT
The geophysical methods are tools that are used by the Geophysicists to unravel the subsurface geology of the earth. These tools determine the lithology and the variations in the physical parameters of the earth was/is caused by the tectonic activity. It is with this view that this paper highlights the importance of geophysical methods in the exploration of geothermal system in Nigeria. The paper noted also that due the presence of hot/warm springs and high geothermal gradients in Nigeria, there is a possibility of harnessing geothermal power for electricity generation. It finally recommended that the Federal and State Governments should endeavour to explore such a good means of electricity generation that could be used to boast the economy of the country.
INTRODUCTION
Geophysical methods play a great role in exploration of geothermal energy. The geophysical surveys are targeted at measuring the physical parameters of the geothermal systems either indirectly from the surface of the earth or from shallow depth. A geothermal system consists of the following: a heat sources, a reservoir, a fluid which carries and transfers heat, and a recharge area. The heat source is due to active tectonic plate margins which represent major zones of magmatic matter that is cooling and radioactivity. (Uysal, 2009).The reservoir of the geothermal system is the volume of rocks from which heat can be extracted. This reservoir contains hot fluids, vapour and gases. The reservoir is surrounded by colder rocks through which water flows from the outside into the reservoir. The area around the reservoir which water (fluids) flows into the reservoir is called the recharge area. The hot fluids in the reservoir move under the influence of buoyancy forces towards a discharge area. In defining the geothermal system, the power produced by the system is very crucial. The typical geothermal system used for electric power generation must yield approximately 10kg of steam to produce one unit (KWh) of electricity. The production of large quantities of electricity, at rates of hundreds of megawatts, requires the production of great volumes of fluids. The reservoir should be able to maintain great volumes of fluid at high temperature or can be recharged with fluids that are heated by having contact with the rocks. The thermal re
servoir is expected to be more than 1km in depth. The geological setting in which geothermal reservoir is found can vary widely from rocks of limestone to shale, volcanic rock and granite. The most probable common single rock type in which geothermal reservoir is found is volcanic rocks. The geothermal systems are associated with fracture and heat flow instead of specific lithology. The developed geothermal reservoir around the world occur in convectional systems in which hot water
199
rises from deep of the earth and is trapped in reservoirs whose caprock has been formed by silification precipitation of other minerals elements.
Nigeria is the most populous country in Africa. It has an area of 923 850 km2, a population of 82 390 000 and thus a mean population density of 89 persons/km2. It extends between the latitudes 4°16'N (at the tip of the Niger Delta) and 13°52'N, and between longitudes 2°49'E (on the Okpara River) and 14°37'E (on the El Beid River). It has maximum dimensions of 1200 km from east to west and 1000 km from north to south and is bounded by Cameroon and Chad in the east, Niger in the north and Benin in the west. The coastline is 780 km long, excluding the indentations of Lagos Lagoon, the Niger Delta and the Cross River Estuary, which add at least 1300 km to this. The principal physiographic feature is the Niger/Benue River system which separates three highland blocks. The southern coastline is dominated by the delta of the Niger River (36 260 km2), and inland from this the coastal plain, less than 100 m, is 75-125 km wide, except in the southeast where it contracts to 50 km. Lowlands below the 100 m contour accompany the Niger inland for 400 km to its confluence with the Benue. From here the lowlands continue northeast up the Benue for a further 550 km, and northwest up the Niger for 210 km. The lower Niger system forms a great Y shape, with the delta at the base of the Y, the Niger River forming the stem and left hand branch and the Benue, the right hand branch. The Jos Plateau (1200 m as!), which rises to occasional high peaks, e.g. 1698 m at Wadi Hill and 1781 m at Shere Hill, lies between the arms of the Y and continues northwestwards as the Funtua Plateau. To the east of the Y are the mountains along the border with Cameroon, which rise to 2419 m asl at Chappal Wade, the highest point in Nigeria. To the west of the Y are the Yoruba Highlands. Other lowland areas are the Sokoto (Rima) Basin in the northwest, and around Lake Chad in the northeast. Drainage from the Jos-Funtua Plateau is either northeastwards to Lake Chad, via the Komadugu Yobe, or northwest, south or southwest to the Niger/Benue River. From most of the eastern highland block along the Cameroon frontier, drainage is northeastwards to the Benue, but the southernmost ranges drain to the Bight of Biafra via the Cross River. The Yoruba Highlands drain northeastwards to the Niger or southwards to the Bight of Benin. Climate Mean annual rainfall decreases progressively in passing inland, but it is generally wetter in the east than the west. On the coast at the border with Benin, mean annual rainfall is close to 1750 mm, but this rises to 1836 mm at Lagos (6°27'N/3°34'E) and to 3800 mm at Forcados (5°21'N/5'25'E) on the Niger Delta but it falls to 2483 mm at Port Harcourt in the eastern delta. Forcados averages 180 rainy days each year and Port Harcourt 170. There is less disparity in rainfall from west to east inland, however. Mean annual rainfall is 1378 mm at Makurdi (7°45'N/8°32'E) on the Benue River, and 1257 mm at Ilorin (8°30'N/4°32'E). In the centre it rises slightly to 1431 mm at Jos (9°55'N/8°53'E), which is situated in a wet pocket, and is 1000 m higher than Makurdi. From here rainfall declines to 865 mm at Kano
200
(12°00'N/8°30'E) and 600 mm at Maiduguri (11°53'N/13°16'E) in the northeast. The wet season is 10-11 months long on the delta, with a short dry period in December or December-January, depending upon station. On the western coast, near Lagos (6°27'N/3°24'E), the three months December-February are dry, and there is often a second dry period in August. In passing inland the August dry period is lost, but the major dry season increases in length and severity. It is 6 months long at Jos and 7 months (October-April) at Kano and 8-9 months long at Lake Chad (September-May). Temperature ranges are lower at the coast than inland. At Lagos the mean monthly temperature of the warmest month is 27°C and that of the coolest month is 24°C, while at Port Harcourt the corresponding figures are 26°C and 24°C. The figures for Jos are 24°C and 20°C, while those for both for Kano and Maiduguri are 31°C and 22°C. The prevailing winds at the coast are from the SW, and these bring the rains to the interior as the intertropical convergence moves north and south. Vegetation The coastal strip is Guinean, and either is, or was once, covered by Guinean rain forest. In passing north this grades through a Guinean-Soudanian transition zone, which may carry forest, into well wooded Soudanian savannas. Guinean species penetrate far into the savanna zones along the major rivers. Wetlands Coastal wetlands are the most extensive. In the west there are large lagoonal systems with mangrove swamps, palm-pandan swamps and reed swamps. In the east the Niger Delta and Cross Estuary both carry large areas of mangrove forest, and both permanent and seasonally inundated freshwater swamp forest. Inland there are floodplains on many rivers, as a consequence of the increasing seasonality of the rainfall in passing north. For example, although mean annual rainfall is only 653 mm at Maiduguri, some 90% of this falls in two months. In the Soudanian zone, forest on the levees is inundated at the time of flooding, as are broad grasslands behind them. Elsewhere in the north, away from rivers, there are other seasonal wetlands. These are chiefly clay-based pans and ponds which fill with water in most years.
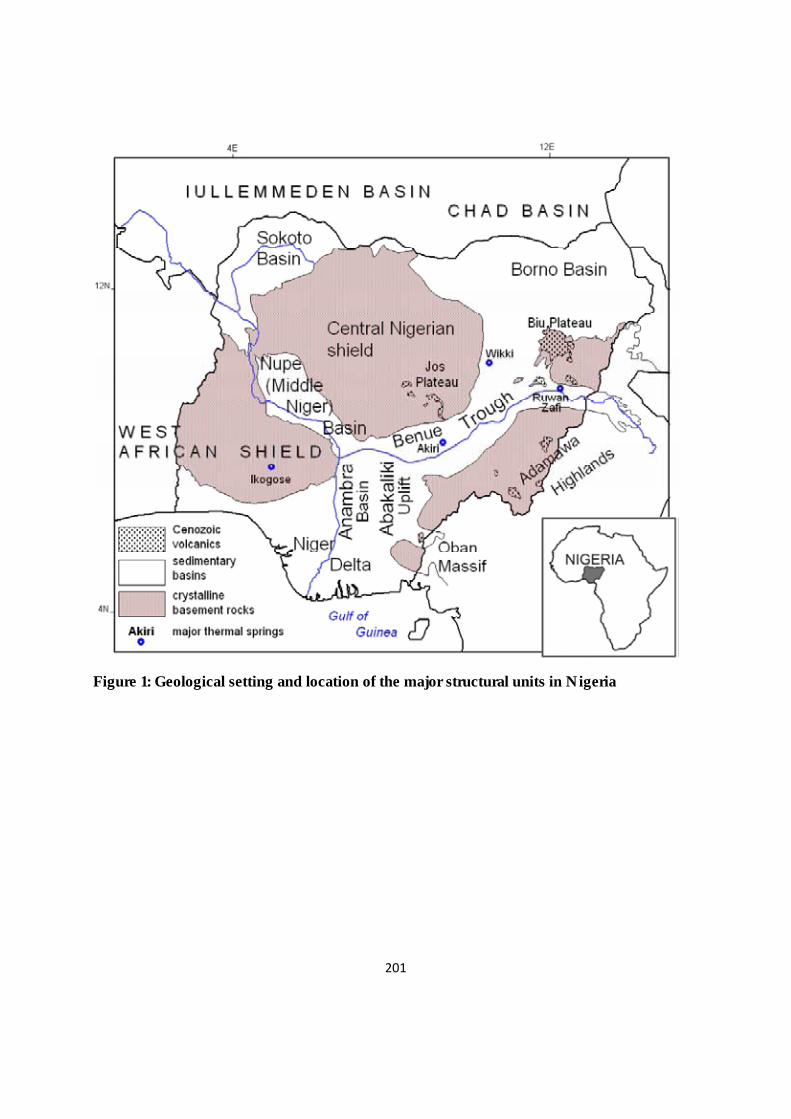
201
Figure 1: Geological setting and location of the major structural units in Nigeria
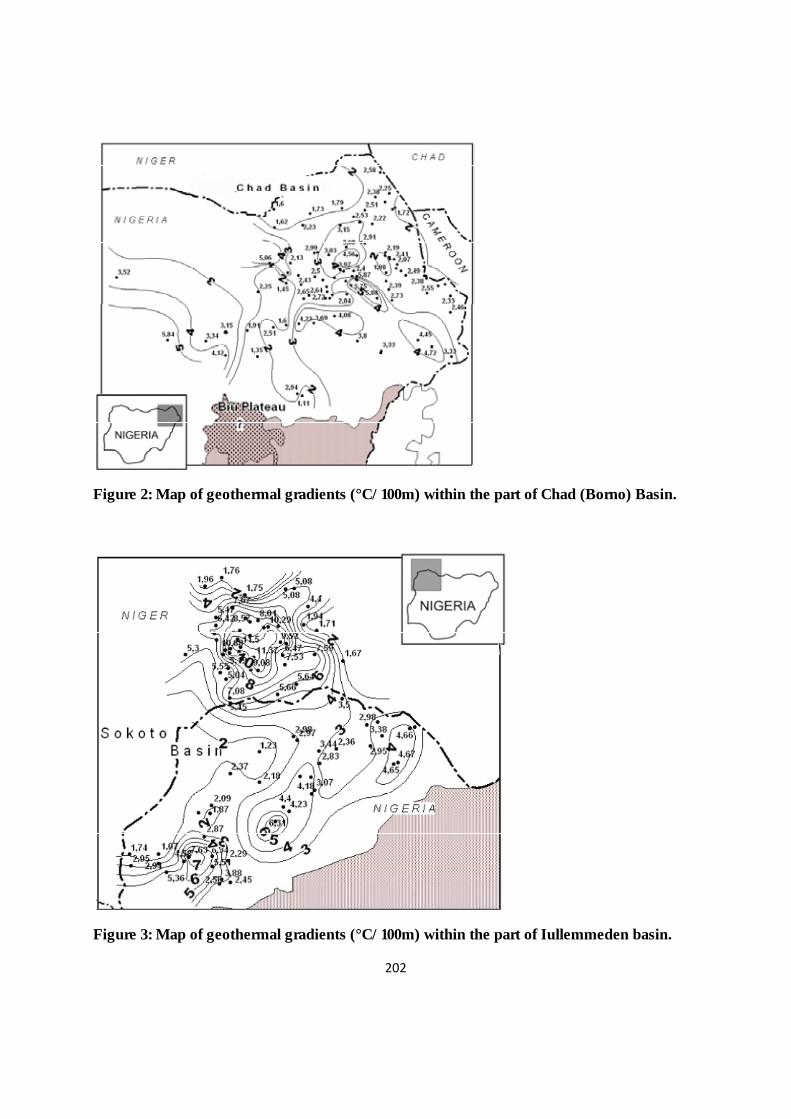
202
Figure 2: Map of geothermal gradients (°C/100m) within the part of Chad (Borno) Basin.
Figure 3: Map of geothermal gradients (°C/100m) within the part of Iullemmeden basin.
203
Overview of Geophysical Methods Applicable to Geothermal Exploration
There are numerous geophysical methods that are employed in the exploration of geothermal systems. The types of geophysical methods are as follow: Magnetotellurics (MT), Audiomagnetotellurics (AMT), Tellurics-Magnetotellurics (T-MT), Control Source Audiomagnetotellurics(CSAMT), Helicopter Electromagnetics (HEM), Time Domain Electromagnetics (TDEM),Vertical Electrical Sounding (VES), Self Potential (SP), Differetial Global Positioning System (dGPS).The geophysical methods can be grouped according to the rock parameter they measure. Resistivity of rocks can be measured using, MT, TDEM, VES, CSAMT, and HEM and measure the following parameters:
.Density of rocks is measured using gravity and seismic .Magnetic susceptibility of rocks is measured using magnetic field .Natural electrical voltage is measured using SP method and .Seismic impedance is measured using seismic reflection
The physical parameters (temperature, resistivity, density, magnetic susceptibility, and seismic impedance) of rocks provide vital information on the shape size , and depth of the deep geological structures constituting a geological reservoir and the heat source. Thermal surveys can delimit the area of enhanced thermal gradient which is a basic requirement for high-enthalpy geothermal system and define temperature distribution. The information on geothermal fluids in geological structures can be obtained with electrical and electromagnetic surveys since they are more sensitive to fluids pressure especially if salty and has variation in temperature. Generally, resistivity is influenced by porosity saturation. The curie point has the potential of providing information of the existence of a hot rocks mass in the crust. Curie point is a temperature at which a material loses its ferromagnetism due to heat. The depth to the rock that has lost its magnetism due to high-temperature can be determined using magnetic method. Further confirmation can be obtained by P-wave delay and shear wave shadow studies. If a hot fluid emerges at the surface, geochemical surveys provide the most viable indications of reservoir temperatures. The application of geophysical methods depends on the characteristics of the geothermal site to be surveyed. Due to the high cost of geophysical survey, reconnaissance survey is usually encouraged which followed by detail survey. Sometimes different methods are used during detail survey to confirm the results of reconnaissance survey (Alan and Kahan, 200).
Geological Setting and Geothermal Energy Implication in Nigeria
The Nigerian Precambrain basement complex is exposed on the earth surface within about 48% of the total land area of the country while 52% of the land is covered by Cretaceous to recent sediments deposition in several Basins. The basement complex of the central shield, Southwestern, Southeastern and Eastern margin of Nigeria has three major groups of rocks: 1) Migmatite and Gnesis dominated, 2) Schists with Quartzites and other minor lithologies forming long, narrow North-South trending belts, mainly in the Western part of the country and 3) Intrusive Granitic
204
rocks-Older Granites and Jurassic Younger Granites (Ajibade et al., 1989, Ewa and Schoeneich, 2010). The longest and deepest sedimentary zone which is filled with many kinds of plastics of marine and continental origin trends from Niger Delta in Southwest through Benue Trough towards Northeast Borno (Chad) Basin. The belt has several sub-divisions of Basins related to the crustal stretching and opening-up of the Atlantic Ocean (Gulf of Guinea) and Gondwana break-up during the lower Cretaceous time. The basins is partially interpreted as troughs and rifts which were subjected to tectonic deformations during Cretaceous to Neogene times and affected by magmatic volcanic episodes which resulted in present structural pattern. The deepest Nigerian sedimentary belt is the Niger Delta with a thickness exceeding 9km. Benue Trough consists of lower, middle and upper parts. The lower Benue Trough consists of Anambra Basin Abakaliki Anticlinorium(uplift) while the upper Benue Trough consists of Yola arm and Kerri Kerri Basins which has a thickness close to 6km in some part of the Basins.The Chad Basin is an extension of the Benue Trough and has a thickness of about 4km. The Middle Benue Trough called the Nupe or Bida Basin has a thickness of about 2km and is about 0.5-1km deep. The South-western part of Nigeria has a Basin called Sokoto Basin and has a depth of 1km. The geological structure of any area influences its general distribution of its natural resources including geothermal in the upper crust. Presently there is no much information about geothermal basement rocks in Nigeria. The only source of geothermal information is obtainable from the several warm and hot springs and seepages located within the Benue Trough (Mattick, 1982, Kogbe, 1979).
The Justification for Geothermal System
Unlike fossil fuel power plants, no smoke is emitted from geothermal power plants since no burning takes place; steam is emitted from geothermal facilities. Gases like nitrous oxide, hydrogen sulphide, sulphur dioxide, carbon dioxide are emitted but are extremely low when compared to fossil fuel emissions. Geothermal systems are environmental friendly unlike fuel plant that causes several and dangerous impacts to an environment like lung irritation, coughing, smog formation, water quality deterioration chest tightness, respiratory illness, ecosystem damage, cancer, atmospheric deposition, global warming which causes melting of polar ice. Geothermal energy provides low cost, reliable, and environmental friendly. When cited it will provide jobs for the massive unemployed graduates in our society and is a means of revamping our economy that is crippled because of shortage of power generation. It will equally generate revenue to the state and federal government. (GEA, 2011) The greater percentage of the power generation in Nigeria is attributed to hydro-power whose site is concentrated in one area (along the river Nile) resulting in long transmission distances and high energy losses and also poses lack of security in case of reduction in hydropower output arising from climatic fluctuations and therefore need to diversify energy sources. To that effect there is need to develop geothermal power in Nigeria to enhance electricity generation which will in turn boast our national economy.
205
Heat from the Earth
The earth temperature increases gradually with depth reaching more than 42000c at the center. Most of this heat is generated by radioactive isotopes. As the heat naturally moves from hotter to cooler regions, so that the earth’s heat flows along a geothermal gradient from the center tothe surface. The earth radiates an estimated of 42x106 megawatts of heat continuously. This heat is not practically captured because it arrives at the surface of the earth at low temperatures. It is only geothermal system that is practically efficient for generating power since it lies with the crust of the earth and it has a high temperature. This magmatically heated geothermal system is driven by partially molten or crystallized which propagates its heat conventionally. The geothermal systems exploration does not offer any threat to our society at all.
The Potential Geothermal areas in Nigeria
There are number of sites that indicate the possibility of geothermal system in Nigeria. From the records of the geothermal gradient, it shows that many sites in Nigeria are good for geothermal system which is of course subject to confirmation with geophysical methods. The normal geothermal gradient of the earth is between 2-30c/100m and geothermal gradient above this range is considered to be a good site for geothermal system. The geothermal gradient of Niger Delta ranges from 1.3 to 5.50c/100m. The geothermal gradient of Anambra Basin ranges from 2.5 to 4.90c /100m (Avbovbo, 1978). A similar study of the geothermal gradient of Bida Basin shows that it ranges from 2 to 2.50c/100m. The Borno Basin temperature gradient ranges from 1.1 to 5.90c/100m. The study on of Sokoto Basin has revealed its geothermal gradient to range from 0.9 to 7.60c/100m (Ewa and Schoeneich, 2010). Another indicator that shows the possibility of geothermal system in Nigeria is the presence of hot and warm springs. The following areas have springs that indicate the leakage of geothermal system from the crust: Akiri in Benue State has a hot spring which generate a temperature of about 53.50c
Wikki in Yankari Game Reserve in Bauchi State has a warm spring of the temperature of 320c Ruwan Zafi in Adamawa State located in Lamurde generate a temperature of 540c
Geothermal Gradient Facts from Bottom Hole Temperature
Bottom Hole Temperature (BHT) data from 21 oil wells in the Nigerian sector of the Chad Basin were analyzed and interpreted to investigate the thermal structure of the basin. A regional average geothermal gradient of 3.4°C/100 m geothermal gradients in the range of 3.0 to 4.4 °C/100 m were obtained. The gradients are relatively lower at the Northeast and Southwest axis and maximum at the North-centre. These differences in geothermal gradients may reflect changes in thermal conductivity of rocks, groundwater movement and endothermic reactions during diagenesis. Also the presence of Tertiary intrusive that is prevalent in the basin may be connected with the variations in the computed geothermal gradient values. The study also reveals that sediments with relatively higher geothermal gradients (3.5 to 4.4°C/100 m) mature earlier (low oil window) than those with low gradient values. Thus, under normal circumstances a high geothermal gradient enhances the
206
early formation of oil at relatively shallow burial depths, but it causes the depth range of the oil window to be quite narrow, while low geothermal gradient causes the first formation of oil to begin at fairly deep subsurface levels, but makes the oil window to be quite broad. (Cyril N. Nwankwo* and Anthony S. Ekine, 2009)
Conclusion
The paper identified some areas in Nigeria that are likely to be a target for geothermal prospects as high temperature gradient of hot and warm springs. The geothermal analysis based on geothermal gradient indicated areas of higher than average gradient values and geothermal anomalies within sedimentary basins. It is possible to conduct more precise study of geothermal gradients if temperature data from oil and gas exploration wells from Benue Trough, Chad and Sokoto basins are available. Nevertheless, the areas of geothermal anomalies with gradients above 5°C/100m found in the present study might be prospective for geothermal energy utilization. In Nigeria the most needed application of geothermal energy would be production of electricity but the real possibility of that and potential assessment needs further research. The geothermal gradient hot/warm springs mentioned above are good indicators for a possibility of harnessing geothermal power in Nigeria since this will boast the economical power of the country. The Nigerian Federal and State Government should endeavour to take a giant stride to explore such a great means of electricity generation. ( Ewa And Schoeneich, (2010) References
Alan,E.M. and Kahan,M.F. (2000): An Introduction to Geological Geophysics,Cambrige
University Press,UK.
Ajibade,C.A.,Woakes,M.,Rahaman,M.A.(1989): Proterozoic Crustal Development in the
Pan_African Regime of Nigeria In: Geology of Nigeria Abiprint and Pak Ltd.,Ibadan
Avbovbo,A.A.(1978): Geothermal Gradients in the Southern Nigerian Basin. Bulletin of
Canadian Petroleum Geology. Vol.26, No.268-274
Cyril N. Nwankwo* and Anthony S. Ekine(2009): Geothermal gradients in the Chad Basin, Nigeria, from bottom hole temperature logsInternational Journal of Physical Sciences Vol. 4 (12), pp. 777–783, December 2009 ISSN 1992-1950 © 2009 Academic Journals Ewa,K. And Schoeneich,K (2010): Geothermal Exploration in Nigeria, Proceedings World
Geothermal Congress 2010 Bali,Indonesia, 25-29 April 2010.
Geothermal Energy Association (2011): Geothermal Basics- Environmental Issues and
benefits 6.1.41
Kogbe,C.A. (1979): Geology of the Southern Eastern (Sokoto) Sector of the Iullemmeden

207
Basin,Bulletin, Department Geology ABU.Zaria,Nigeria Vol.2 No.1
Mattick,C.A.(1982): Assesment of the Petroleum, coal,and geothermal Resources of the
Economic Community of West African State (ECOWAS) region United State
Department of the Interior Geological Survey.
Uysal, T (2009): Tracing the Origin of Heat Anomalies in Hot Sedimentary Aquifer
System In Australia.http://Geothermalenergy centre of Excellence .org
208
DIVERSITY OF PHOSPHATE SOLUBILIZING BACTERIA IN WATER LOGGED TEA SOIL: EVALUATION P-SOLUBILIZING MECHANISM AND PLANT GROWTH
I. Duara1, Reshita Baruah, M. Borah, H. P. Deka Boruah*, T. C. Bora
Biotechnology, CSIR-NEIST, Jorhat 785006, Assam, India
Abstract
In this study, we are reporting fourteen phosphate solubilizing bacteria (PSBs isolated from waterlogged tea soil of Assam and Dooars region of West Bengal (WB) and evaluated their biological activities. 16 S rDNA analyses confirmed that seven isolates belonged to the phylum Firmicutes, six are from the Proteobacteria; while one representing Acinetobacteria and falls on the genus Bacillus; Pseudomonas; Staphylococcus, Acinetobacter and Enterobacteriaceae. Isolate Cornybacterium variable NEISTTP04, Staphylococcus epidermidis NEISTTP06 and Erwinia tasmaniensis NEISTTP08 showed higher phosphorus solubilizing efficiency of 50%, 78.7 and 215.9%. Nine of the isolates were positive to IAA, GA3 while six were siderophore and producers of phytase and organic acids. Seed inoculation of the isolated PSBs showed a greater root and shoot elongation of raddish (Raphanus sativus), maize (Zae mays), moong (Vigna radiata), ladies finger (Abelmoschus esculentus), compared to the uninoculated control. The strains IAA and GA3 positive showed significantly (p≤0.05) increased in root length, shoot length, and biomass production alsng with higher P accumulation by the test crops compared to un-inoculated control. Besides these, the strains Pseudomonas aeruginosa and Staphylococcus epididermis were antagonist against plant pathogens Fomes lamoensis, Rhizoctonia solani and Sphaerostilbe repens. These isolates also help in P management of the tested crops.
Key words: Diversity, phophorus, biological activity, seedling growth, disease resistance.
INTRODUCTION
With increasing demand of agricultural production and as the peak in global production will occur in the next decades, phosphorus (P) is receiving more attention as a nonrenewable resource (Cordell et al., 2009; Gilbert, 2009). The unique characteristic of P is its low availability due to slow diffusion and high fixation in soils. Earlier studies established that soil beneficial bacteria could be alternative for conversion of low available soil phosphorus to available form in sustainable crop production (Richardson and Simpson, 2011). The conversion of unavailable P in soil to available forms by different phosphorus solubilising (PSB) microorganisms due to the production enzymes phosphatase, phytase and different organic acid (Glick et al., 2007; Patten and Glick, 2002; Xie et al., 1996; Glick, 1995; Patten and Glick, 1995; Deka Boruah and Dileep Kumar., 2002; Deka Boruah et al., 2003). Therefore, isolation, characterization and economic exploitation of phosphorus solubilizing bacteria and are reported from different ecological niche (Hariprasad and Niranjana, 2009; Ponmurugon and Gopi, 2006; Baby et al., 2001; Piex et al, 2001; Chabot et al., 1996b; Kucey et al, 1989). Besides phosphorus solubilisation, the PSB’s, also produces plant growth hormone including IAA, GA3, siderophores which helps in improved plant germination and seedling development (Gelmi et al., 2002; Elezar and Escamilla, 2001). Earlier studies also reported that PSB’s also involved in plant-microbe interaction which is one of the major criteria to be used beneficial soil microbes in sustainable crop production (Poonguzhali et.al, 2007; Xie et al., 1996; Patten and Glick, 2002; Richardson, 2001). Therefore,
209
isolation, characterization of PSB’s by biochmecal and molecular means is reported for its economic exploitation (Hugenholtz. et al., 1998, Torsvik and Overeas, 2002; Polz et al., 1994; Distel et al., 1991). In the present study an assessment was made to isolate, characterize PSB’s from tea soil under waterlogged condition mostly cultivated in Assam. Stress was given to characterize their phosphorus solubilisation efficiency and their biological activity.
MATERIALS AND METHODS
ISOLATION AND IDENTIFICATION OF THE BACTERIA
A total of 150 soils samples were collected from different tea gardens of Assam, and west Bengal under water logged conditions from top 15 cm (Duarah et al., 2012). Samples were immediately stored at 40C and brought to the laboratory. The samples were then sieved using 200 mm mesh. From it, total bacteria were isolated by serial dilution technique in nutrient agar (NA), potato dextrose agar (PDA), and King’s B agar plates. After 48 h of incubation at 300C, morphologically distinct colonies were selected, purified by repeated sub-culturing in same media. The purity of the isolated colonies was further verified by microscopic observations. These cultures were maintained on NA slants at 40C. The isolates were then screened for their phosphorus solubilizing ability in Pikovskaya (PVK) and medium used by Nautiyal (1999 (Pikovskaya, 1948) using tri-calcium phosphate (Ca3(PO4)5) (Himedia) as substrate. Bacterial colonies causing clear halozones around the colonies against a turbid white background were selected and screened as phosphate solubilizers. Morphological and biochemical test were performed for the screened bacteria according to Cappucino and Sherman (2004) and Bergy’s Manual of systematic bacteriology (1984). Finally the molecular characterization of screened bacteria were performed by 16SrRNA amplification and sequencing by dye terminator method.
PHYLOGENETIC ANALYSIS
The 16srDNA of related sequences were obtained from NCBI Gene bank database using BLAST search (Altchul et al., 1990). Phylogenetic analysis was done in MEGA4 (Tamura et al., 2007). The sequences were first aligned using ClustalW (Thompson et al, 1994). This computer generated alignment was used to study the phylogenetic relationships. Form the ClustalW alignment the evolutionary distances were inferred using Neighbor-Joining method (Saitou et al, 1987). The bootstrap inferred from 100 replicates (Felsenstein et al., 1985) represented the evolutionary history of the taxa analyzed and the evolutionary distances were computed using the Maximum Composite Likelihood method (Tamura et al., 2004).
BIOLOGICAL ACTIVITY OF THE ISOLATES
P-solubilizing Efficiency - Phosphorus solubilizing efficiency of the isolated PSB strains were measured according to Ponmurugan and Gopi (2006) as mentioned below.
Solubilization efficiency (SE) % = (S-C)/C X 100
Where, S is P-solubilization zone and C is colony diameter
Phospahate solubilisation mechanism- For this, the isolates were tested by determining the enzyme production phytase, phostase and the production of organic acids according to standard methods (Lee et al, 2001; Greiner and Frank, 2007)
210
Phytohormone IAA, GA - IAA production was measured in Luria broth (Himedia) supplemented with L-tryptophan according to Patten and Glick (2002). Total IAA produced was compared to the standard curve and expressed as µg ml-1. Similarly, the GA3 production was also measured in the same media as described by Paleg (1957). The absorbance of the sample against blank was measured at 254 nm and the amount of GA3 produced was expressed as µg ml-1.
Siderophores- Siderophore production by the PSBs was determined according to Schwayn and Neilands (1987) using chrome azurol S as an indicator. After overnight incubation at 28±20C, bacterial isolates exhibiting an orange coloured zone around the colonies indicates siderophore positive.
Antifungal activity- In-vitro antifungal activity against the plant pathogens F. lameonsis, S. repens and R. solani was carried out for all the screened PSBs on NA, PDA and KB agar plates according to Deka Boruah and Dileep Kumar (2002b). The in-vitro antibiosis was repeated twice with three replicates per treatment.
Plant growth promoting phosphorus accumulation
In-vitro plant growth promoting activity of isolated PSBs were tested as described earlier by Deka Boruah and Dileep Kumar (2002a), on raddish (Raphanus sativus), maize (Zae mays), moong (Vigna radiata), ladies finger (Abelmoschus esculentus), yard long bean, and rice (Oryzae sativa) for all the isolates. Seeds without bacterial treatment were considered as control. All the experiments were set up in a growth chamber and allowed to grow maintaining the temperature (250C) and photoperiod (10h). The effect of PSBs on root length, shoot length, total root and shoot biomass was compared in 21 days old plants. All the experiments were repeated at least twice with thirty replications each.
Phosphorus accumulation by the seedlings- Accumulation of phosphorus by the test seedlings was determined according to Burd et al. (2000).
Statistical analysis
Analysis of variance (ANOVA) was done to see the significanct difference and then compared according to Tukey’s test. All the analysis was done in SPSS 16.0 programme.
RESULTS AND DISCUSSION
16SrDNA and other biological activities able to isolate only fourteen different PSBs belong to the genus Bacillus; three were from Pseudomonas; the rest belongs to genus Staphylococcus, Acinetobacter and Enterobacteriaceae were isolated from tea soils under water logging condition (Figure 1). The anaerobic situation created under waterlogged condition and low nutrient might be the reason for low PSBs in water logged tea soil. Abundance of PSBs under different ecological niche were earlier reported by Chen et al., (2001) and Castagn et al. (2010).
P-SOULIZATION AND BIOLOGICAL ACTIVITIES OF THE BACTERIAL ISOLATES
The p-solubilising efficiency and other biological activities of the isolated bacterial strains are described in table 1. All the PSBs were found to be effective in inorganic phosphate solubilization (calcium phosphate) both in the solid and liquid medium. Isolates E. tasmaniensis NEISTTP8 showed highest P-solubilization (215.9%) in solid medium and lowest by P. aeruginosa NEISTTP02 (11.8%).
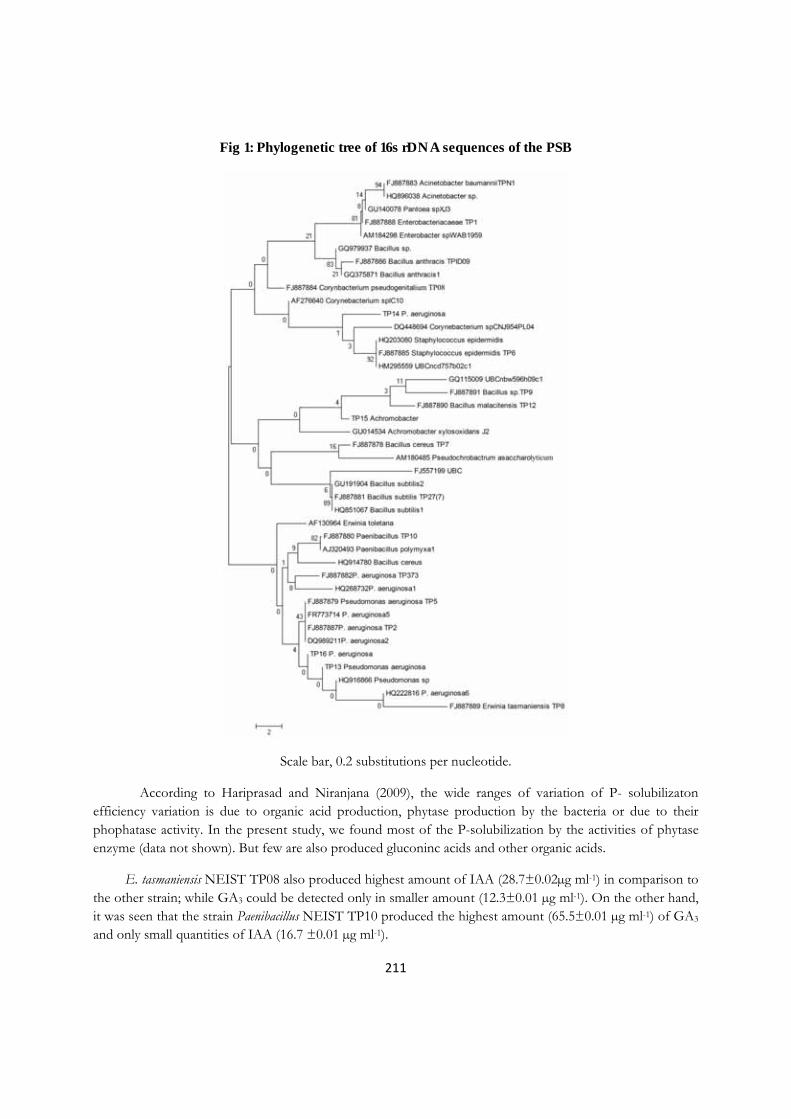
211
Fig 1: Phylogenetic tree of 16s rDNA sequences of the PSB
Scale bar, 0.2 substitutions per nucleotide.
According to Hariprasad and Niranjana (2009), the wide ranges of variation of P- solubilizaton efficiency variation is due to organic acid production, phytase production by the bacteria or due to their phophatase activity. In the present study, we found most of the P-solubilization by the activities of phytase enzyme (data not shown). But few are also produced gluconinc acids and other organic acids.
E. tasmaniensis NEIST TP08 also produced highest amount of IAA (28.7±0.02µg ml-1) in comparison to the other strain; while GA3 could be detected only in smaller amount (12.3±0.01 µg ml-1). On the other hand, it was seen that the strain Paenibacillus NEIST TP10 produced the highest amount (65.5±0.01 µg ml-1) of GA3 and only small quantities of IAA (16.7 ±0.01 µg ml-1).
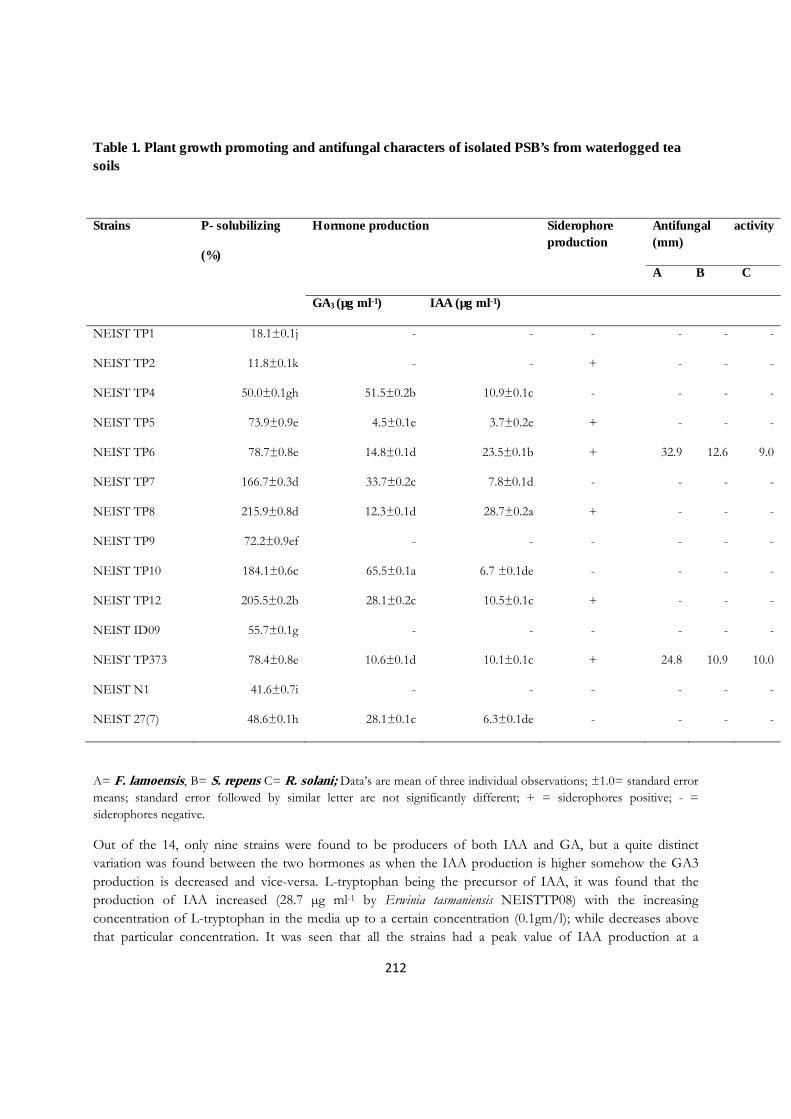
212
Table 1. Plant growth promoting and antifungal characters of isolated PSB’s from waterlogged tea soils
A= F. lamoensis, B= S. repens C= R. solani; Data’s are mean of three individual observations; ±1.0= standard error means; standard error followed by similar letter are not significantly different; + = siderophores positive; - = siderophores negative.
Out of the 14, only nine strains were found to be producers of both IAA and GA, but a quite distinct variation was found between the two hormones as when the IAA production is higher somehow the GA3 production is decreased and vice-versa. L-tryptophan being the precursor of IAA, it was found that the production of IAA increased (28.7 µg ml-1 by Erwinia tasmaniensis NEISTTP08) with the increasing concentration of L-tryptophan in the media up to a certain concentration (0.1gm/l); while decreases above that particular concentration. It was seen that all the strains had a peak value of IAA production at a
Strains P- solubilizing
(%)
Hormone production
Siderophore production
Antifungal activity (mm)
A B C
GA3 (µg ml-1) IAA (µg ml-1)
NEIST TP1 18.1±0.1j - - - - - -
NEIST TP2 11.8±0.1k - - + - - -
NEIST TP4 50.0±0.1gh 51.5±0.2b 10.9±0.1c - - - -
NEIST TP5 73.9±0.9e 4.5±0.1e 3.7±0.2e + - - -
NEIST TP6 78.7±0.8e 14.8±0.1d 23.5±0.1b + 32.9 12.6 9.0
NEIST TP7 166.7±0.3d 33.7±0.2c 7.8±0.1d - - - -
NEIST TP8 215.9±0.8d 12.3±0.1d 28.7±0.2a + - - -
NEIST TP9 72.2±0.9ef - - - - - -
NEIST TP10 184.1±0.6c 65.5±0.1a 6.7 ±0.1de - - - -
NEIST TP12 205.5±0.2b 28.1±0.2c 10.5±0.1c + - - -
NEIST ID09 55.7±0.1g - - - - - -
NEIST TP373 78.4±0.8e 10.6±0.1d 10.1±0.1c + 24.8 10.9 10.0
NEIST N1 41.6±0.7i - - - - - -
NEIST 27(7) 48.6±0.1h 28.1±0.1c 6.3±0.1de - - - -
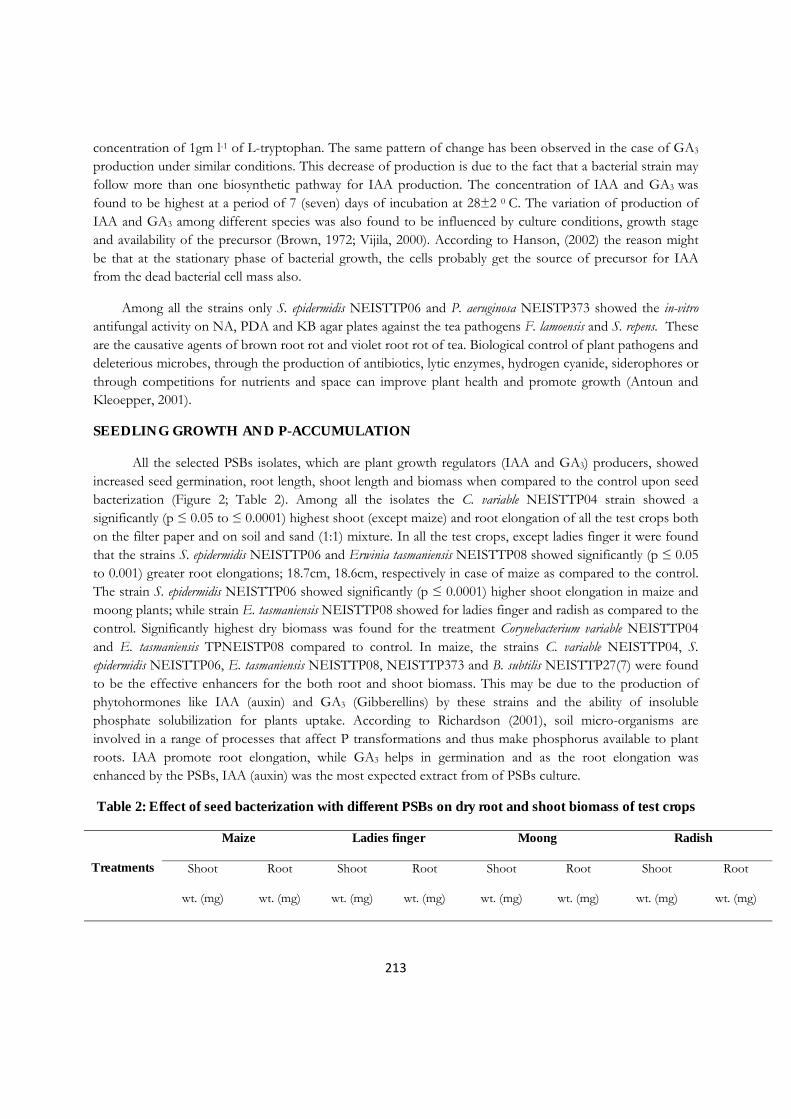
213
concentration of 1gm l-1 of L-tryptophan. The same pattern of change has been observed in the case of GA3 production under similar conditions. This decrease of production is due to the fact that a bacterial strain may follow more than one biosynthetic pathway for IAA production. The concentration of IAA and GA3 was found to be highest at a period of 7 (seven) days of incubation at 28±2 0 C. The variation of production of IAA and GA3 among different species was also found to be influenced by culture conditions, growth stage and availability of the precursor (Brown, 1972; Vijila, 2000). According to Hanson, (2002) the reason might be that at the stationary phase of bacterial growth, the cells probably get the source of precursor for IAA from the dead bacterial cell mass also.
Among all the strains only S. epidermidis NEISTTP06 and P. aeruginosa NEISTP373 showed the in-vitro antifungal activity on NA, PDA and KB agar plates against the tea pathogens F. lamoensis and S. repens. These are the causative agents of brown root rot and violet root rot of tea. Biological control of plant pathogens and deleterious microbes, through the production of antibiotics, lytic enzymes, hydrogen cyanide, siderophores or through competitions for nutrients and space can improve plant health and promote growth (Antoun and Kleoepper, 2001).
SEEDLING GROWTH AND P-ACCUMULATION
All the selected PSBs isolates, which are plant growth regulators (IAA and GA3) producers, showed increased seed germination, root length, shoot length and biomass when compared to the control upon seed bacterization (Figure 2; Table 2). Among all the isolates the C. variable NEISTTP04 strain showed a significantly (p ≤ 0.05 to ≤ 0.0001) highest shoot (except maize) and root elongation of all the test crops both on the filter paper and on soil and sand (1:1) mixture. In all the test crops, except ladies finger it were found that the strains S. epidermidis NEISTTP06 and Erwinia tasmaniensis NEISTTP08 showed significantly (p ≤ 0.05 to 0.001) greater root elongations; 18.7cm, 18.6cm, respectively in case of maize as compared to the control. The strain S. epidermidis NEISTTP06 showed significantly (p ≤ 0.0001) higher shoot elongation in maize and moong plants; while strain E. tasmaniensis NEISTTP08 showed for ladies finger and radish as compared to the control. Significantly highest dry biomass was found for the treatment Corynebacterium variable NEISTTP04 and E. tasmaniensis TPNEISTP08 compared to control. In maize, the strains C. variable NEISTTP04, S. epidermidis NEISTTP06, E. tasmaniensis NEISTTP08, NEISTTP373 and B. subtilis NEISTTP27(7) were found to be the effective enhancers for the both root and shoot biomass. This may be due to the production of phytohormones like IAA (auxin) and GA3 (Gibberellins) by these strains and the ability of insoluble phosphate solubilization for plants uptake. According to Richardson (2001), soil micro-organisms are involved in a range of processes that affect P transformations and thus make phosphorus available to plant roots. IAA promote root elongation, while GA3 helps in germination and as the root elongation was enhanced by the PSBs, IAA (auxin) was the most expected extract from of PSBs culture.
Table 2: Effect of seed bacterization with different PSBs on dry root and shoot biomass of test crops
Treatments
Maize Ladies finger Moong Radish
Shoot
wt. (mg)
Root
wt. (mg)
Shoot
wt. (mg)
Root
wt. (mg)
Shoot
wt. (mg)
Root
wt. (mg)
Shoot
wt. (mg)
Root
wt. (mg)
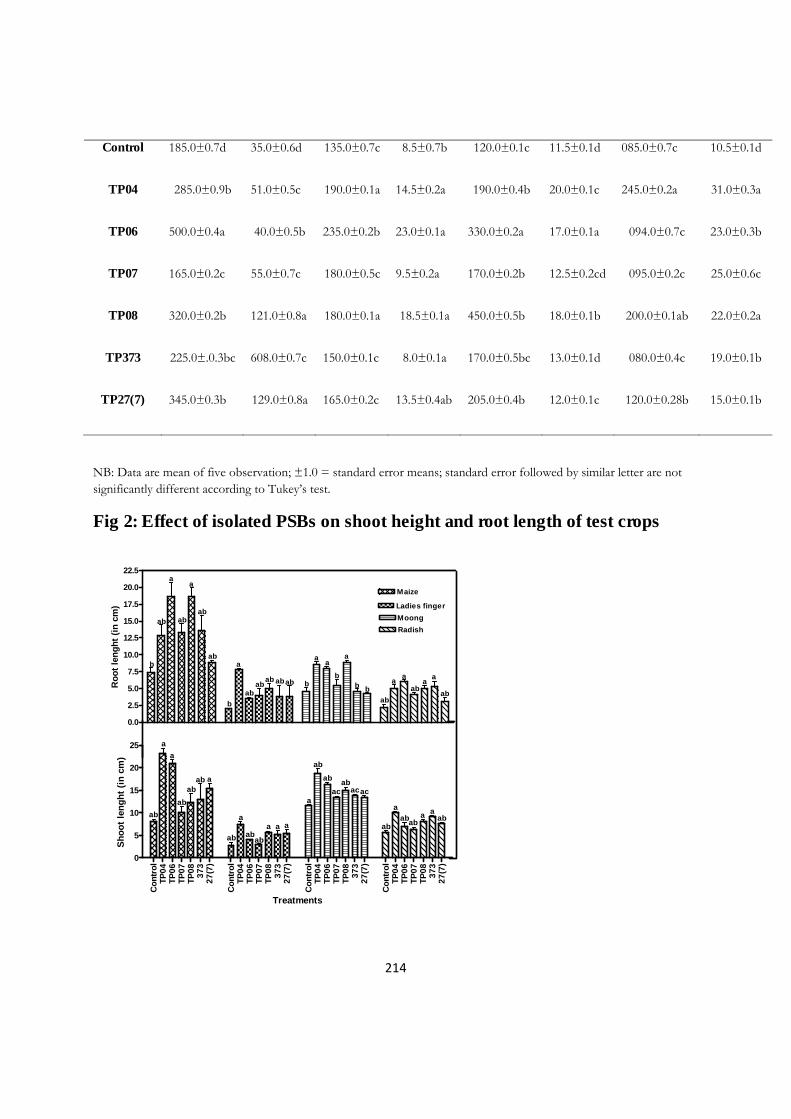
214
Control 185.0±0.7d 35.0±0.6d 135.0±0.7c 8.5±0.7b 120.0±0.1c 11.5±0.1d 085.0±0.7c 10.5±0.1d
TP04 285.0±0.9b 51.0±0.5c 190.0±0.1a 14.5±0.2a 190.0±0.4b 20.0±0.1c 245.0±0.2a 31.0±0.3a
TP06 500.0±0.4a 40.0±0.5b 235.0±0.2b 23.0±0.1a 330.0±0.2a 17.0±0.1a 094.0±0.7c 23.0±0.3b
TP07 165.0±0.2c 55.0±0.7c 180.0±0.5c 9.5±0.2a 170.0±0.2b 12.5±0.2cd 095.0±0.2c 25.0±0.6c
TP08 320.0±0.2b 121.0±0.8a 180.0±0.1a 18.5±0.1a 450.0±0.5b 18.0±0.1b 200.0±0.1ab 22.0±0.2a
TP373 225.0±.0.3bc 608.0±0.7c 150.0±0.1c 8.0±0.1a 170.0±0.5bc 13.0±0.1d 080.0±0.4c 19.0±0.1b
TP27(7) 345.0±0.3b 129.0±0.8a 165.0±0.2c 13.5±0.4ab 205.0±0.4b 12.0±0.1c 120.0±0.28b 15.0±0.1b
NB: Data are mean of five observation; ±1.0 = standard error means; standard error followed by similar letter are not significantly different according to Tukey’s test.
Fig 2: Effect of isolated PSBs on shoot height and root length of test crops
0.0
2.5
5.0
7.5
10.0
12.5
15.0
17.5
20.0
22.5
Maize
Ladies finger
Moong
Radish
b
ab
a
ab
a
ab
ab
b
a
abab
ab abab
a
b
a
b
a
b b
ab
aa
aba
a
ab
Ro
ot
len
gh
t (i
n c
m)
Co
ntr
ol
TP
04
TP
06
TP
07
TP
08
37
32
7(7
)
Co
ntr
ol
TP
04
TP
06
TP
07
TP
08
37
32
7(7
)
Co
ntr
ol
TP
04
TP
06
TP
07
TP
08
37
32
7(7
)
Co
ntr
ol
TP
04
TP
06
TP
07
TP
08
37
32
7(7
)
0
5
10
15
20
25
ab
a
a
ab
abab a
ab
a
abab
a a a
a
ab
ab
acab
acac
ab
aab
aba a
ab
Treatments
Sh
oo
t le
ng
ht
(in
cm
)
215
Data’s are mean of five observations; error bars standard error means, error bars followed by similar letter were not significantly different according to Tukey’s test.
CONCLUSION
The microbial population was found to be very low in the rhizosphere soils under water logged condition and this might be due to cultivation for longer periods (43 to 97 years). Out of more than fifty morphologically distinct isolates only fourteen were found to be positive for phosphate solubilization. Further, only nine PSBs from the isolated 14 strains were found to be the producers of plant growth regulators IAA and GA3. Six were siderophore producers; while two were found to be antagonistic against three most potent plant pathogens. Four PSBs namely C. variable NEISTTP04, S. epidermidis NEISTTP06, E. tasmaniensis NEISTP08 and P. aeruginosa NEISTTP373 have good prospects in improving plant growth and health. Phylogenetic tree construction for the PSBs is of much biotechnological interest and therefore these data will greatly assist in the rational selection of micro-organisms. This would also help in the selection the efficient bacterial populations in order to formulate them as biofertilizer or biocontrol agents for tea growers as well as other agriculturist.
ACKNOWLEDGEMENT
We would like to thank Dr. R. C. Boruah, Director, NEIST, Jorhat, for his immense support in carrying out this investigation. We are also grateful to the Department of Biotechnology, New Delhi, India for providing financial assistance and support towards the investigation.
REFERENCES
Antoun H., Kleoepper J. W.: Plant growth promoting rhizobacteria. Encyclopedia of Genetics. Brenner S. and Miller J. F. (Eds in chief). 1477-1480 (2001).
Altschul S. F., Gish W., Miller W., Myers E. W., Lipman D. J.: Basic local alignment search tool. Journal of Mol Biol. 215, 403-10 (1990).
Baby U. I., Tensingh B., Ponmurugan P. and Premkumar R.: Population dynamics of nitrogen fixing and phosphate solubilizing bacteria in tea soil. UPASI Tea Res. Found. Newsletter. 10, 4. (2001).
Balamurugan A., Princy T., Vidhya Pallavi R., Napolean P., Jayanthi R., Premkumar R.: Isolation and characterization of phosphate solubilizing bacteria in Tea(Camellia sinesis). J.Biosci. Res., 2010. Vol. 1(4):285-293
Brown M. E.: Plant growth substances produced by micro-organism of soil and rhizosphere. J. Appl. Bacteriol. 35, 443 (1972).
Cappucino James G., Sherman N.: Microbiology: A laboratory manual. Paerson, Singapore. 2004.
Castagno L.N., Estrella M.J., Sannazzaro A.I., Grassano A.E. and Ruiz O.A. (2010) Phosphate-solubilization mechanism and in vitro plant growth promotion activity mediated by Pantoea eucalypti isolated from Lotus tenuis rhizosphere in the Salado River Basin (Argentina), J. App. Microbiol. 110, 1151–1165.
216
Chabot R., Hani A., Cescas P. M.: Growth promotion of maize and lettuce by phosphate-solubilizing Rhizobium leguminosarum biovar. phaseoli. Plant Soil. 184, 311–21(1996b).
Chen, Y.P., P.D. Rekha, A.B. Arun, F.T. Shen, W.-A. Lai, C.C. Young, (2006) Phosphate solubilizingbacteria from subtropical soil and their tricalcium phosphate solubilizing abilities, App. Soil. Ecol. 34, 33–41
Deka Boruah H. P., Dileep Kumar B. S.: Biological activity of secondary metabolites produced by strain Pseudomonas fluorescens. Folia Microbiol. 47, 359-363 (2002a).
Deka Boruah H. P., Dileep Kumar B. S.: Plant disease suppression and growth promotion by florescent Pseudomonas strain. Folia Microbiol. 47(2),137-143 (2002b).
David M. L., Peter J. D..: Comparative lndole-3-Acetic Acid Levels in the Slender Pea and Other Pea Phenotypes. Plant Physiol. 93, 1539-1543 (1990).
Distel D. L., DeLong E. F. and Waterbury J. B.: Phylogenetic characterization and in situ localization of the bacterial symbiont of shipworms (Teredinidae: Bivalvia) by using 16S rRNA sequence analysis and oligodeoxynucleotide probe hybridization. Appl. Environ. Microbiol. 57, 2376–2382 (1991).
Duarah I., Deka DK, Borah D., Deka Boruah HP, Baruah R, Borah M., Lahan T., Baruah U, Barman
TS (2012) Comparison of bio-chemical characters of tea soil under three different seasons, Int. J. Tea Sci. 8(3), 31-48.
Elezar and Escamilla, Hecter P. V., Mayrn M., Torre-Martinez M. A., Cornejo G. S. and Dendoven L.: Selective production of bekaverin in a fluidized bioreactor with immobilize Gibberella fujikuroi. World Journal of Microbiol. and Biotechnol. 17, 469-474 (2001).
Felsenstein J.: Confidence limits on phylogenies: An approach using the bootstrap. Evolution 39,783-791(1985).
Gelmi C., Perez-Correa R. and Agosin E.: Modelling Gibberella fujikuroi growth and GA3 production in solid-state fermentation, Proc. Biochem. 37, 1033–1040 (2002).
Glick B. R.: The enhancement of plant growth by free-living bacteria. Can. J. Microbial., 41, 109-117 (1995).
Glick B. R., Todorovic, B., Czarny, J., Cheng, Z., Duan, J., McConkey, B.: Promotion of plant growth by bacterial ACC deaminase. Crit. Rev. Plant Sci. 26, 227–242 (2007).
Glick B.R.: The enhancement of plant growth by free-living bacteria. Can. J. Microbial., 41, 109-117 (1995).
Hariprasad P. & Niranjana S. R.: Isolation and characterization of phosphate solubilizing rhizobacteria to improve plant health of tomato. Plant Soil. 316, 13–24(2009).
Hugenholtz P., Goebel B. M. and Pace N. R.: Impact of culture independent studies on the emerging phylogenetic view of bacterial diversity. J. Bacteriol. 180, 4765–4774 (1998).
Kapoor K. K., Mishra M. M. and Kukreja K.: Phosphatesolubilization by soil microorganisms. A review. Ind. J. Microbiol. 29, 119-127 (1989).
217
Khalid A., Arshad M. and Zahir Z.A.: Screening plant growth promoting rhizobacteria for improving growth and yield of wheat. J. Applied Microbiol. 96, 473-480 (2004).
Kucey RMN, Janzen HH, Leggett ME.: Microbially mediated increases in plant-available phosphorus. Adv. Agron. 42, 199–228 (1989).
Kuklinsky-Sobral J., Araujo W. L., Mendes R., Geraldi I. O.: Isolation and characterization of soybean-associated bacteria and their potential for plant growth promotion. Environ. Microbiol. 6, 1244-1251 (2004).
Neol R. Bergy’s Manual of Systematic bacteriology (Vol 1). Williams and Wilkins. Baltimore. Hong Kong. London. Sydney 1984.
Patten C. L., Glick B. R.: Role of Pseudomonas putida: Indoleacetic acid in development of the host plant root system. Appl. Environ. Microbiol. 68, 3795-3801 (2002).
Peix, A., Rivas-Boyero, A. A., Mateos, P. F., Rodriguez-Barrueco, C., Martinez-Molina, E. and Velazquez, E.: Growth promotion of chickpea and barley by a phosphate solubilizing strain of Mesorhizobium mediterraneum under growth chamber conditions. Soil Biol. and Biochem. 33, 103–110 (2001).
Pikovskaya, R.I.: Mobilization of phosphorus in soil in connection with vital activity of some microbial species. Microbiologiya 17, 362–370 (1948).
Polz, F. M., D. L. Distel, B. Zarda, R. Amann, H. Felbeck, J. A. Ott, &Cavanaugh C. M.: Phylogenetic analysis of a highly specific association between ectosymbiotic, sulfur-oxidizing bacteria and a marine nematode. Appl. Environ. Microbiol. 60, 4461–4467 (1994).
Ponmurugan P., Gopi C.: Distribution pattern and screening of phosphate solubilizing bacteria isolated from different food and forage crops. J. of Agro. 5(4), 600-604 (2006).
Poonguzhali S., Madhaiyan M. and T. M. Sa.: Quorum-sensing signals produced by plant-growth promoting Burkholderia strains under in-vitro and in-planta conditions. Res. Microbiol. 158, 287-294 (2007).
Ranjard L, Richaume A.: Quantitative and qualitative micro scale distribution of bacteria in soil. Res. Microbiol. 152, 707-716 (2001).
Reid J. B., Davies P. J.: The genetics and physiology of gibberellin sensitivity mutants in peas. In: Karssen CM, Van Loon LC, Vreugdenhil D (eds) Progress in plant growth regulation (Proc 14th Int Conf on Plant Growth Substances, Amsterdam, 1991). Kluwer Academic, Dordrecht, The Nether-lands. 214-225 (1992).
Richardson A. E.: Prospects for using soil microorganism to improve the acquisition of phosphate by plant. Aust. J. Plant Physiol. 28, 897-906 (2001).
Rodriguez H., Fraga R.: Phosphate solubilizing bacteria and their role in plant growth promotion. Biotchnol. Adv. 17, 319–339 (1999).
Rosello-Mora R., Amann R.: The species concept for prokaryotes. FEMS Microbiol. Rev. 25, 39-67 (2001).
218
Saitou N., Nei M.: The neighbor-joining method: A new method for reconstructing phylogenetic trees. Mol. Bio. and Evol. 4, 406-425 (1987).
Schillinger U., Lucke F. K.: Antibacterial activity of Lactobacillus sake isolated from meat. Appl. and Environ. Microbiol. 55 (8), 1901-1906 (1989).
Schwayn B., Neilands J. B.: Universal assay for the detection and determination of siderophores. Anal. Biochem. 160, 47-56 (1987).
Sessitsch A, Weilharter A, Gerzabek MH, Kirchmann H, Kandeler E.: Microbial population structures in soil particle size fractions of a long-term fertilizer field experiment. Appl. Environ. Microbiol. 67, 4215-4224 (2001).
Singh S., Kapoor K. K.: Solubilization of insoluble phosphate cultured from different sources. Environ. Ecol. 12, 51-55 (1994).
Sneath P. H. A., Mair N. S., Sharpe M. E. and Holt J. G.: Bergy’s Manual of determinative Bacteriology. Williams and Wilkins. Baltimore. USA. 140-218 1984.
Tabatabai, M. A.& Bremner, J.M.: Use of p-nitrophenyl phosphate for assay of soil phosphatase activity. Soil Biol. and Biochem. 1, 301-307 (1969).
Tamura K., Nei M. & Kumar S.: Prospects for inferring very large phylogenies by using the neighbor-joining method. Proceedings of the National Academy of Sciences (USA) 101:11030-11035 (2004).
Tamura K., Dudley J., Nei M. & Kumar S.: MEGA4: Molecular Evolutionary Genetics Analysis (MEGA) software version 4.0 (2007).
Torsvik, V. and Overeas, L.: Microbial diversity and function in soil: from genes to ecosystems. Curr. Opin. Microbiol. 5, 240–245 ( 2002).
Vijilla K.: Estimation of IAA production in nitrogen fixing microorganisms. Practical manual-microbial interaction in soil. Tamil Nadu Agricultural University, Coimbatore. 38-39 (2000).
Xie H., Pasternak J. J , Glick B. R.: Isolation and characterization of mutants of the plant growth-promoting rhizobacterium Pseudomonas putida GR12-2 that overproduce indole-3-acetic acid. Curr. Microbiol. 32, 67–71(1996).
Richardson A.E. and Simpson R J (2011), Soil microorganisms mediating phosphorus availability, Plant Physiology DOI:10.1104/pp.111.175448
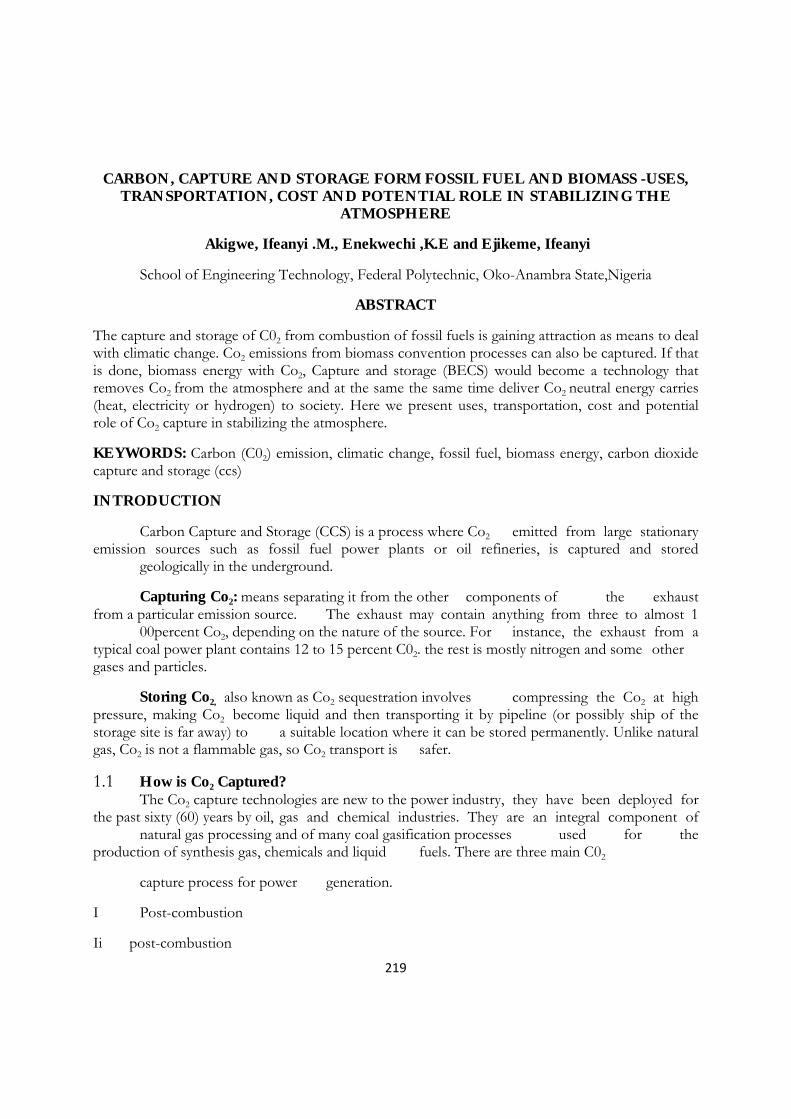
219
CARBON, CAPTURE AND STORAGE FORM FOSSIL FUEL AND BIOMASS -USES, TRANSPORTATION, COST AND POTENTIAL ROLE IN STABILIZING THE
ATMOSPHERE
Akigwe, Ifeanyi .M., Enekwechi ,K.E and Ejikeme, Ifeanyi
School of Engineering Technology, Federal Polytechnic, Oko-Anambra State,Nigeria
ABSTRACT
The capture and storage of C02 from combustion of fossil fuels is gaining attraction as means to deal with climatic change. Co2 emissions from biomass convention processes can also be captured. If that is done, biomass energy with Co2, Capture and storage (BECS) would become a technology that removes Co2 from the atmosphere and at the same the same time deliver Co2 neutral energy carries (heat, electricity or hydrogen) to society. Here we present uses, transportation, cost and potential role of Co2 capture in stabilizing the atmosphere.
KEYWORDS: Carbon (C02) emission, climatic change, fossil fuel, biomass energy, carbon dioxide capture and storage (ccs)
INTRODUCTION
Carbon Capture and Storage (CCS) is a process where Co2 emitted from large stationary emission sources such as fossil fuel power plants or oil refineries, is captured and stored geologically in the underground.
Capturing Co2: means separating it from the other components of the exhaust from a particular emission source. The exhaust may contain anything from three to almost 1 00percent Co2, depending on the nature of the source. For instance, the exhaust from a typical coal power plant contains 12 to 15 percent C02. the rest is mostly nitrogen and some other gases and particles.
Storing Co2, also known as Co2 sequestration involves compressing the Co2 at high pressure, making Co2 become liquid and then transporting it by pipeline (or possibly ship of the storage site is far away) to a suitable location where it can be stored permanently. Unlike natural gas, Co2 is not a flammable gas, so Co2 transport is safer.
1.1 How is Co2 Captured? The Co2 capture technologies are new to the power industry, they have been deployed for the past sixty (60) years by oil, gas and chemical industries. They are an integral component of natural gas processing and of many coal gasification processes used for the production of synthesis gas, chemicals and liquid fuels. There are three main C02
capture process for power generation.
I Post-combustion
Ii post-combustion
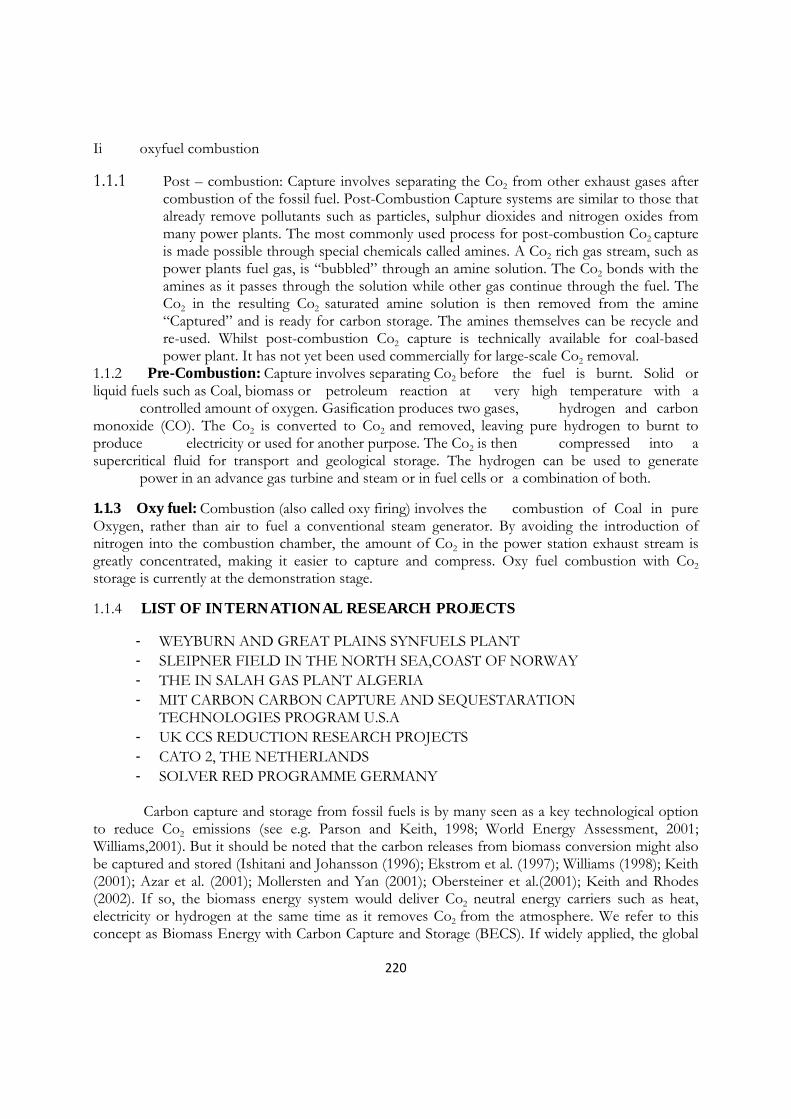
220
Ii oxyfuel combustion
1.1.1 Post – combustion: Capture involves separating the Co2 from other exhaust gases after combustion of the fossil fuel. Post-Combustion Capture systems are similar to those that already remove pollutants such as particles, sulphur dioxides and nitrogen oxides from many power plants. The most commonly used process for post-combustion Co2 capture is made possible through special chemicals called amines. A Co2 rich gas stream, such as power plants fuel gas, is “bubbled” through an amine solution. The Co2 bonds with the amines as it passes through the solution while other gas continue through the fuel. The Co2 in the resulting Co2 saturated amine solution is then removed from the amine “Captured” and is ready for carbon storage. The amines themselves can be recycle and re-used. Whilst post-combustion Co2 capture is technically available for coal-based power plant. It has not yet been used commercially for large-scale Co2 removal.
1.1.2 Pre-Combustion: Capture involves separating Co2 before the fuel is burnt. Solid or liquid fuels such as Coal, biomass or petroleum reaction at very high temperature with a controlled amount of oxygen. Gasification produces two gases, hydrogen and carbon monoxide (CO). The Co2 is converted to Co2 and removed, leaving pure hydrogen to burnt to produce electricity or used for another purpose. The Co2 is then compressed into a supercritical fluid for transport and geological storage. The hydrogen can be used to generate power in an advance gas turbine and steam or in fuel cells or a combination of both.
1.1.3 Oxy fuel: Combustion (also called oxy firing) involves the combustion of Coal in pure Oxygen, rather than air to fuel a conventional steam generator. By avoiding the introduction of nitrogen into the combustion chamber, the amount of Co2 in the power station exhaust stream is greatly concentrated, making it easier to capture and compress. Oxy fuel combustion with Co2 storage is currently at the demonstration stage.
1.1.4 LIST OF INTERNATIONAL RESEARCH PROJECTS
- WEYBURN AND GREAT PLAINS SYNFUELS PLANT - SLEIPNER FIELD IN THE NORTH SEA,COAST OF NORWAY - THE IN SALAH GAS PLANT ALGERIA - MIT CARBON CARBON CAPTURE AND SEQUESTARATION
TECHNOLOGIES PROGRAM U.S.A - UK CCS REDUCTION RESEARCH PROJECTS - CATO 2, THE NETHERLANDS - SOLVER RED PROGRAMME GERMANY
Carbon capture and storage from fossil fuels is by many seen as a key technological option to reduce Co2 emissions (see e.g. Parson and Keith, 1998; World Energy Assessment, 2001; Williams,2001). But it should be noted that the carbon releases from biomass conversion might also be captured and stored (Ishitani and Johansson (1996); Ekstrom et al. (1997); Williams (1998); Keith (2001); Azar et al. (2001); Mollersten and Yan (2001); Obersteiner et al.(2001); Keith and Rhodes (2002). If so, the biomass energy system would deliver Co2 neutral energy carriers such as heat, electricity or hydrogen at the same time as it removes Co2 from the atmosphere. We refer to this concept as Biomass Energy with Carbon Capture and Storage (BECS). If widely applied, the global
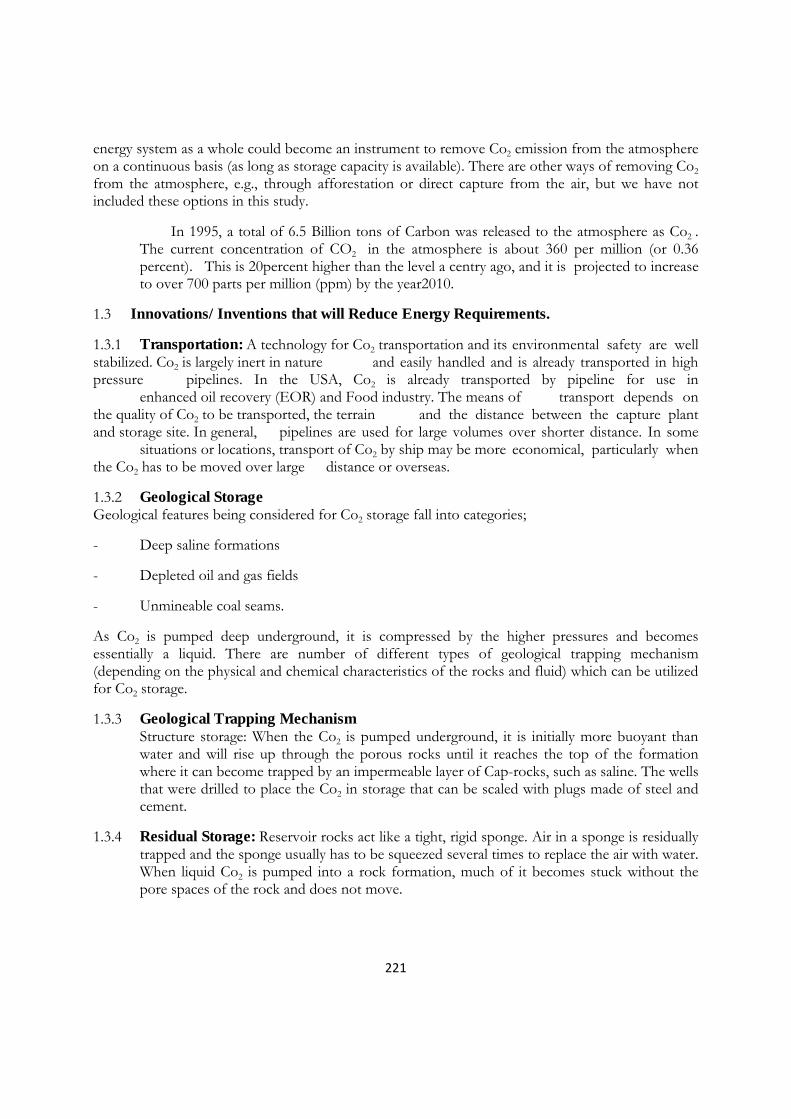
221
energy system as a whole could become an instrument to remove Co2 emission from the atmosphere on a continuous basis (as long as storage capacity is available). There are other ways of removing Co2 from the atmosphere, e.g., through afforestation or direct capture from the air, but we have not included these options in this study.
In 1995, a total of 6.5 Billion tons of Carbon was released to the atmosphere as Co2 . The current concentration of CO2 in the atmosphere is about 360 per million (or 0.36 percent). This is 20percent higher than the level a centry ago, and it is projected to increase to over 700 parts per million (ppm) by the year2010.
1.3 Innovations/Inventions that will Reduce Energy Requirements.
1.3.1 Transportation: A technology for Co2 transportation and its environmental safety are well stabilized. Co2 is largely inert in nature and easily handled and is already transported in high pressure pipelines. In the USA, Co2 is already transported by pipeline for use in enhanced oil recovery (EOR) and Food industry. The means of transport depends on the quality of Co2 to be transported, the terrain and the distance between the capture plant and storage site. In general, pipelines are used for large volumes over shorter distance. In some situations or locations, transport of Co2 by ship may be more economical, particularly when the Co2 has to be moved over large distance or overseas.
1.3.2 Geological Storage Geological features being considered for Co2 storage fall into categories;
- Deep saline formations
- Depleted oil and gas fields
- Unmineable coal seams.
As Co2 is pumped deep underground, it is compressed by the higher pressures and becomes essentially a liquid. There are number of different types of geological trapping mechanism (depending on the physical and chemical characteristics of the rocks and fluid) which can be utilized for Co2 storage.
1.3.3 Geological Trapping Mechanism Structure storage: When the Co2 is pumped underground, it is initially more buoyant than water and will rise up through the porous rocks until it reaches the top of the formation where it can become trapped by an impermeable layer of Cap-rocks, such as saline. The wells that were drilled to place the Co2 in storage that can be scaled with plugs made of steel and cement.
1.3.4 Residual Storage: Reservoir rocks act like a tight, rigid sponge. Air in a sponge is residually trapped and the sponge usually has to be squeezed several times to replace the air with water. When liquid Co2 is pumped into a rock formation, much of it becomes stuck without the pore spaces of the rock and does not move.
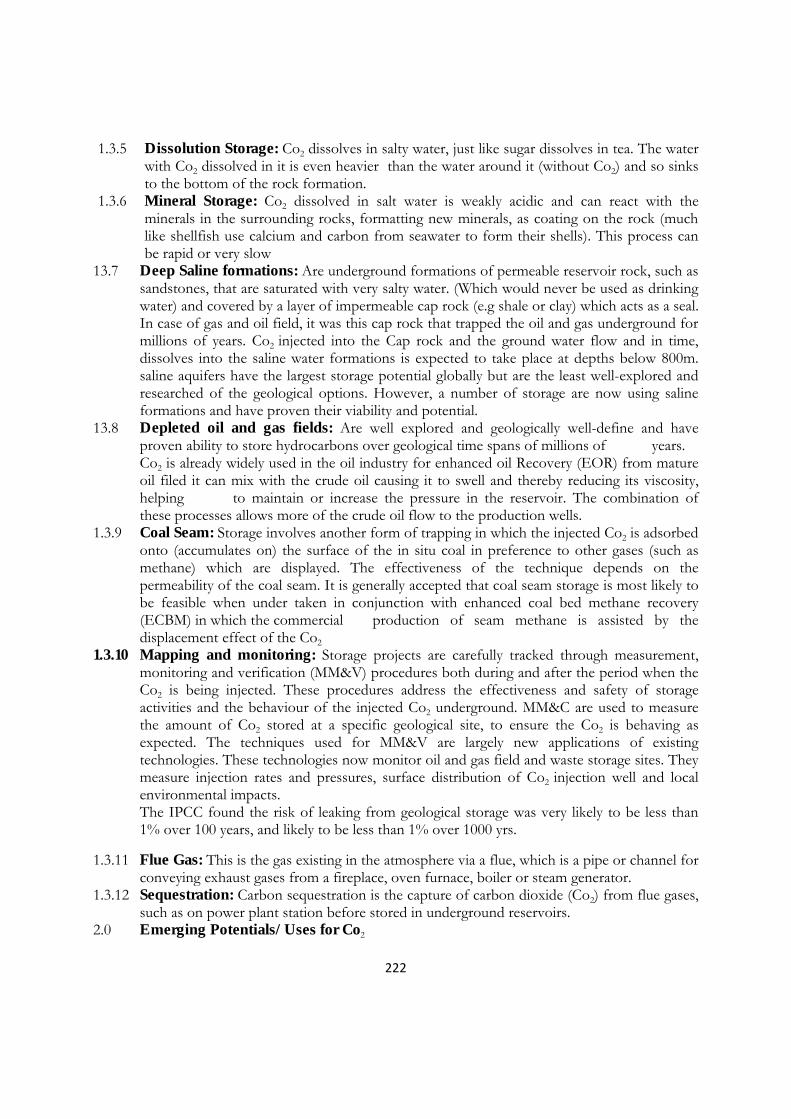
222
1.3.5 Dissolution Storage: Co2 dissolves in salty water, just like sugar dissolves in tea. The water with Co2 dissolved in it is even heavier than the water around it (without Co2) and so sinks to the bottom of the rock formation.
1.3.6 Mineral Storage: Co2 dissolved in salt water is weakly acidic and can react with the minerals in the surrounding rocks, formatting new minerals, as coating on the rock (much like shellfish use calcium and carbon from seawater to form their shells). This process can be rapid or very slow
13.7 Deep Saline formations: Are underground formations of permeable reservoir rock, such as sandstones, that are saturated with very salty water. (Which would never be used as drinking water) and covered by a layer of impermeable cap rock (e.g shale or clay) which acts as a seal. In case of gas and oil field, it was this cap rock that trapped the oil and gas underground for millions of years. Co2 injected into the Cap rock and the ground water flow and in time, dissolves into the saline water formations is expected to take place at depths below 800m. saline aquifers have the largest storage potential globally but are the least well-explored and researched of the geological options. However, a number of storage are now using saline formations and have proven their viability and potential.
13.8 Depleted oil and gas fields: Are well explored and geologically well-define and have proven ability to store hydrocarbons over geological time spans of millions of years. Co2 is already widely used in the oil industry for enhanced oil Recovery (EOR) from mature oil filed it can mix with the crude oil causing it to swell and thereby reducing its viscosity, helping to maintain or increase the pressure in the reservoir. The combination of these processes allows more of the crude oil flow to the production wells.
1.3.9 Coal Seam: Storage involves another form of trapping in which the injected Co2 is adsorbed onto (accumulates on) the surface of the in situ coal in preference to other gases (such as methane) which are displayed. The effectiveness of the technique depends on the permeability of the coal seam. It is generally accepted that coal seam storage is most likely to be feasible when under taken in conjunction with enhanced coal bed methane recovery (ECBM) in which the commercial production of seam methane is assisted by the displacement effect of the Co2
1.3.10 Mapping and monitoring: Storage projects are carefully tracked through measurement, monitoring and verification (MM&V) procedures both during and after the period when the Co2 is being injected. These procedures address the effectiveness and safety of storage activities and the behaviour of the injected Co2 underground. MM&C are used to measure the amount of Co2 stored at a specific geological site, to ensure the Co2 is behaving as expected. The techniques used for MM&V are largely new applications of existing technologies. These technologies now monitor oil and gas field and waste storage sites. They measure injection rates and pressures, surface distribution of Co2 injection well and local environmental impacts.
The IPCC found the risk of leaking from geological storage was very likely to be less than 1% over 100 years, and likely to be less than 1% over 1000 yrs.
1.3.11 Flue Gas: This is the gas existing in the atmosphere via a flue, which is a pipe or channel for conveying exhaust gases from a fireplace, oven furnace, boiler or steam generator.
1.3.12 Sequestration: Carbon sequestration is the capture of carbon dioxide (Co2) from flue gases, such as on power plant station before stored in underground reservoirs.
2.0 Emerging Potentials/Uses for Co2
223
2.1 Enhanced Oil recovery (EOR): C02 is injected into depleted oil fields. The Co2 acts as a solvent that reduces the viscosity of the oil, enabling it to flow to the production well. Once production is complete, Co2 can potentially be permanently stored in the reservoir. 2.2 Urea Yield Boosting: Most notable urea production, which globally produced and then
consumed an estimated 113mt pa of Co2. when natural gas is used as the feeds lock for urea production, surplus ammonia is usually produced. A number of projects have been implemented to capture Co2 from ammonia reformer flue gas for injection into the urea production process. Captured Co2 can be reacted with surplus ammonia to form urea. Urea is an example of solid nitrogen fertilizers
2.3 Oil and gas industry applications: Co2 is used as a fluid for the stimulation/ fracturing of oil and gas wells. It is typically trucked to site and injected as liquid carrying propping agents (sand and other materials which prop open the pores of the rock to prevent closure after stimulation).
2.4 Beverage Carbonation: Carbonation of beverages with high-purity Co2 2.5 Wine making: Co2 is used as a seal gas to prevent oxidation of the wine during maturation.
Co2 is also produce during the fermentation process, and it is already captured on-site for reuse for its inert gas properties.
2.6 Food Process preservation and packaging: Co2 is used for various applications in the food industry, including cooling while grinding powers such as spices and an insert atmosphere packing (MAP) with products such as cheese, poultry, snacks, produce and red meat, or in controlled atmosphere to prevent food spoilage in packaging application. Co2 is modified atmosphere packaging (MAP) with products such as cheese, poultry, snacks, produce and red meat , or in controlled atmosphere packaging (CAP), where food products are products are packaged in an atmosphere designed to extend shelf-life carbon dioxide is commonly used in MAP and CAP because of its ability to inhibit growth of bacteria that cause spoilage.
2.7 Coffee decaffeination: Superficial Co2 is used as the solvent for decaffeinating coffee. It is preferred due to its inert and non-toxic properties.
2.8 Pharmaceutical processes: Use of Co2 in the pharmaceutical industry may overlap with other use identified, as it typically includes inserting, chemical synthesis and supercritical fluid extraction.
2.9 Horticulture: Co2 is provided to green house to maintain option Co2 concentration and maximize plant growth rate. Sources include on-site cogeneration schemes as well as off-site industrial sources connected via pipeline networks.
2.10 Pulp and paper processing: Co2 is used to reduce pH during pulp wasting operations. 2.11 Water treatment: Co2 is used for re-mineralization of water following reverse osmosis and
pH control (reduction). 2.12 Inserting: Co2 is used in a wide range of applications where the physical properties of an
inert gas are desirable. This includes applications covered under other use categories such as welding shielding gas and gas used in food packaging and in wine production.
2.13 Steel Manufacture: Co2 is used in a minority of basic oxygen furnace as a bottom stirring agent. It is also used for dust suppression. Also in blast furnace, scraps are melted and reshaped, irons for molding machine parts, nails, etc and in other foundry projects.
2.14 Metal working: Used for varied purposes, including chilling parts for shrink fitting, and hardening of sand cores and moulds.
224
2.15 Supercritical Co2 as a solvent: Co2 is useful for high-pressure extraction and as a solvent to isolate targeted compounds, such as fragrances and favour Because of its low critical temperature and moderate pressure requirement, natural substances can be treated particularly gently. It is gaining favour as a solvent in the dry cleaning industry for this reason in niche applications, predominantly as a cleaning fluid.
2.16 Pneumatics: Pneumatic applications for Co2 include use as a portable power source for pneumatic hand tools and equipment, as well as a power source for pain ball guns and other recreational equipment.
2.17 Welding: Used as a shrouding gas to prevent oxidation of the weld metal. 2.18 Refrigerant Gas: C02 is used as the working fluid in refrigeration plant, particularly for large
industrial air conditioning and refrigeration systems. It replaces more toxic refrigerant gases that also have much greater global warming potential.
2.19 Fire Suppression Technology: When applied to a fire, Co2 provides a heavy blanket of gas that reduces the oxygen level to a point where combustion cannot occur. Co2 is used in fire extinguishers, as well as in industrial fire systems.
2.20 Enhanced Coal Bed methane Recovery (ECBM): In Co2 ECBM, Co2 is injected into the coal, displacing and releasing adsorbed methane, which can be recovered at the surface
2.21 Enhanced geothermal system (EGS)-and Power Generation: These are two ways in which superficial Co2may be utilized in EGS geothermal power station/germination; firstly, it may be used as the circulating heat exchange fluid. The benefit here is that the significant density difference between the coal Co2 flowing down the injection well(s) and hot Co2 flowing up the production well (s) would eliminate the need for a circulation pump. Secondly, this concept could be extended, and the circulation Co2 could also be used directed as the working fluid in a super critical Co2 power. Supercritical Co2 power cycles need not be limited to geothermal power plants, as the benefits of high efficiency and compact turbo machinery are not heat source-specific. The nuclear power industry is particularly interested in supercritical Co2 power cycle for this reason.
2.22 Polymer Processing: One example of Co2 as a feed stock polymer processing involves the transformation of carbon dioxide into polycarbonates using proprietary zinc base catalyst system.
2.23 Chemical Synthesis: (Excludes polymers and liquid fuels/hydrocarbons). Carbon and oxygen are both key elements in organic chemistry. Consequently, there are a wide range of chemicals that can at least theoretically utilize Co2 as a feedstock for production, including organic acids, alcohols, esters and sugars. The partiality of C02 as a feedstock will vary significantly based on the current production routes. The dominant potential demand based n current markets, could come from acetic acid, which has a current global market of LMT Pa. Acetic acid can be produced by direct catalysis of Co2 and methane
2.24 Algal bio-fixation: The productive of algal cultivation systems can be increased significantly (up to a saturation point) by the injection/addition of Co2 to the growth medium/solution.
2.25 mineralization: (calcium carbonate and magnesium carbonate): Mildly (concentrated Co2 (eg. Power station flue gas) is contacted with mineral –loaded alkaline brine. The Co2 present in the gas precipitates out as mineral carbonate (limestone/dolomite equivalent precipitates). The resulting product can be further processed to form an aggregate equivalent product for
225
the construction industry, and can also potentially displace a small portion of Portland cementing concrete.
2.26 King soda (sodium Carbonate): This is a variant of mineralization wherein Co2 is contacted with sodium rich brine, resulting in the formation of sodium, bi-carbonate (NaHCo3).
2.27 Co2 concrete curing: This technology is focused on pre case concrete production facilities, where the waste Co2 form in site flue gas permanently stored as un-reactive limestone within the concrete. This also limits the need for heats and steam in the curing process. The result is a reduction in emission of Co2 equivalent, up to 12kg of ton (286 ibs Co2 per Us ton) of per case concrete.
2.28 Bauxite residue treatment (red mud): The extraction of aunina form bauxite ore result in a highly alkaline bauxite residue slurry known as” red” Mud” concentrated Co2 can be injected into the red mud slurry to partially neutralize the product, improve its manageability, reducing its disposal costs and limiting its potential environmental impact .In the neutralization process, the Co2 is converted to mineral form (typically carbonates). The resulting product remains slightly alkaline, and has potential as a soil amendment for acidic soils.
2.29 liquid fuels (Renewable method and formic acid): Electrolysis of water produces H2. The H2 is combine with captured Co2, compressed and reacted over a catalyst at moderate temperature and pressure 5mpa-225oc to produce methanol and water. Electro-reduction of Co2 to produce formic acid (HCOOH) and O2. Formic acid is the primary fuel. Formic acid has been classified as a liquid fuel as hydrogen is only released for the liquid formic acid as require.
3.0 Viability of the proposed projects
United Kingdom had played a major role in advocating for reduction of Co2 emission and has strongly supported the deployment of CCS as part of a broader strategy to combat climate change/green house effects. Also the emerging uses of Co2 world wide can be harnessed in Nigeria to generate about N10 billion Naira (yearly)
The market price of co2 is in the range of $20 – 46 per tonne. The
combined system of materials, Equipments and manpower can
produce 20 to 50 tonnes of Co2 per day which will cost $ 920 per day,
averaging $335, 800 (U.S. dollars) per annum. Other benefits accrue
from blast furnace and charcoal Briquetting processes.
3.1 Materials and Equipment needed
1. 4 pcs Laptops (500G) with internet facilities N500,000

226
2. 1 Pcs Printer 120,000
3. photocopier/Scanner 450,000
4. Paper work & Stationeries 100,000
5. Officer equipment 100,000
6. Blast furnace construction 7.0 million
7. Generator 25KVA 4.5 million
8. Change over for the blast furnace for
C02 generation 2.0 million
9. 1 plot of land 3.5 million
10. Centrifuge compressor to compress Co2 3.5 million
11. Books/internet bills 300,000
12. Construction of storage tank 3.2 million
13. Oversea training at University of Nottingham
U.K for two key personnel 5.0 million
Total Cost 30. 27 m
3.2 MANPOWER REQUIREMENT
S/N Staff Salary per year
1 I Civil Engineer 1.5 million
2 1 Mechanical Engineer 1.5 million
3 1 Chemist 1.5 million
4 1 confidential Secretary 1.0 million
5 5 Unskilled Labour 500,000
Total cost 6,000,000
4.0 Total project Cost of Manpower Requirement is = N36.27M
4.1 RISK ASSESSMENT
227
Numerical simulations on existing storage projects conclude that very long retention times are to be expected with geological storage. A study on the sleipner field concludes that no Co2 would migrate into the North sea for 100 000 years, and that even after a million years, the annual rate of release would be only one millionth of the stored Co2 (lindeberg and Bergbom, 2003). A study of the Forties Oilfield on the effects of uncertainties of in paramteters such as flow velocity in the aquifer and capillary entry pressure into the caprock, showed that less than 0,2% of the Co2 would escape into the overlying layers within 1000years, and even in the worst case, the maximum vertical distance moved by any of the Co2 was less than halway to the seabed within this period (cawley et al,2005). Similarly, one study of the Weyburn storage site showed that within 5000 years there was 95% probability that less than 1% of the stored Co2 would be released into the bisosphere (Walton et al., 2005) and another study of the same site found nor release to the atmosphere 5000 years at all (Zhou et al, 2005).
5 CONCLUSION AND RECOMMENDATIONS
Carbon (iv) oxide or Co2 capture was initiated by the Researchers to reduce the climatic problems associated with the accumulation of carbon (ii) oxide (carbon monoxide) in the atmosphere. This gives rise to a lot of people fainting on suffocation (or even death), ozone layer depletion and various green house effects.
These problems remained over the years in the country. However, carbon (iv) oxide (Co2) ‘s potential and uses discussed in this paper will go a long way in development of oil and gas industries and cement production and steel producers which are the major revenue generation of the country and if harnessed properly in Nigeria will create Jobs for unemployed youths, aid oil and Gas industries and add value to the social well being of the populace.
Lastly, the federal GOVERNMENT OF Nigeria while trying to invest $4 billion dollars to finance a coal – fired power plant in Benue state come 2013 should utilize this technology to convert synthesis gas and C02 capture to methanol (blue fuel) which will become basis for a clean energy economy that actually reduce global warming by turning a potential green house gas, Co2 into a global warming solution (fuel), etc.
References
1. Azar et al (2001), Targets for stabilization of atmospheric Co2, Science 776,. Pp 1818-1819 2. Ekstrom et al (1997), Technologies and costs in Sweden for
capture and storage of Co2 from combination of fossil fuel for production
of power and Heat, Stockholm, Sweden
3. IPCC (2005), Carbon dioxide capture and storage New York. NY Cambridge University press
4. Johnansson (1996), Capturing Co2. IEA Greenhouse Gas R and D programme, Harvard University USA.
5. Keith and Rhode (2002), ‘‘bury, burn or both . A two for one deal on biomass carbon and energy’’, clim change 54 (3), 375-377
6. Mollersten and Yan (2001), Economic evaluation of biomass based

228
energy systems with Co2 capture and sequestration in kraft pulp mills, world
resource, Rev l3 (4), 509-525
7. Obersteiner et cl (2001), ‘‘Managing Climatic risk’’ Science 294 (5543), pp 786 – 787.
8. Parson and Keith (1998), ‘‘Fossil fuels without Co2 emissions. Progress, prospects and policy implications’’, Science 282, pp 1053 –
1054
9. Williams (2001), ‘‘Towards zero emission from coal in china ,’’ presented at U.S.A, china clean Energy forum Beijing(31 August)
229
ENERGY EFFICIENT M-OLSR FOR MANET
1Mr. K.Prabu Research Scholar, Manonmaniam Sundaranar University, Tirunelveli
Asst.Prof, Department of Computer Applications Shree Ragavendra Arts & Science College, Chidambaram.
2Dr. A.Subramani Research Supervisor, Manonmaniam Sundaranar University, Tirunelveli
Prof & Head, Department of MCA, KSR College of Engineering, Tiruchengode.
Abstract Mobile Adhoc Networks (MANET) represent distributed systems that comprises wireless mobile nodes that may freely organize it into temporary unintentional network topologies. A MANET could be a assortment of nodes that's connected through a wireless medium forming dynamic topologies. If a node is employed oftentimes for transmission or overhearing of knowledge packets, a lot of energy is consumed by that node and once specific amount of your time the energy state might not be spare for information transmission leading to link failure. Edouard Manet square measure typically powered devices; the important facet is to cut back the energy consumption of nodes, in order that the network life may be extended. during this paper introduces AN algorithmic program of Multipath-Optimized Link State Routing (M-OLSR) for energy improvement of the nodes within the network. it's complete that this answer improves the amount of nodes alive by regarding ten to twenty fifth by continuously selecting energy optimized methods within the network with some increase in normalized routing overheads. Keywords - Adhoc Networks, MANET, OLSR, Routing Protocols, Energy Efficient
I. INTRODUCTION
Mobile ad hoc network (MANET) appeared in the 1970s with the Packet Radio Network (PRNET) program of the Defense Advanced Research Projects Agency (DARPA). Initially designed for tactical networks, MANET has benefited from a growing interest in the research community since the 1980s. Indeed, since no fixed infrastructure manages the network, the MANET experiences several problems, such as frequent disconnections of links, hidden nodes, varying topology due to mobility, more interference and limited bandwidth due to the shared medium, and quick power consumption on the mobile nodes. For these reasons and many others, it has become a challenging research area, and the MANET group of the Internet Engineering Task Force (IETF) has proposed some design guidelines for MANET routing protocols [1]. A Mobile Ad Hoc Network (MANET) consists of a set of wireless mobile hosts (or nodes) that are free to move in any directions at any speed in Fig.1. Since nodes in a MANET operate on batteries and have limited transmission ranges, minimizing unnecessary communications is essential to improve the network life and throughput.
Figure 1: A Mobile ad hoc Network
230
Characteristics of a MANET MANET is characterized by some specific features as follows:
Wireless: The nodes are connected by wireless links and the communication among nodes is wirelessly. Ad hoc based: A MANET is a need based network formed by the union of nodes and the connecting links in an arbitrary fashion. The network is temporary and dynamic. Dynamic Topologies: Due to arbitrary movement of nodes at varying speed, the topology of network may change unpredictably and randomly. Multi hop Routing: There is no dedicated router and every node acts as a router to pass packets to other nodes. Autonomous and infrastructure less: Network is self organizing and is independent of any fixed infrastructure or centralized control. The operation mode of each node is distributed peer-to-peer capable of acting as an independent router as well as generating independent data. Energy Constraint: Energy conservation becomes the major design issue as nodes in the MANET rely on batteries or some other exhaustible source of energy [2].
Routing is one of the major challenges in MANETs due to their highly dynamic and distributed nature. MANET routing protocols depending on how the protocols handle the packet to deliver from source to destination. The routing protocols can be classified into two parts in Fig.2: Proactive (Table driven) and Reactive (Source initiated) routing protocols. Depending on the network structure these are classified as flat routing, hierarchical routing and geographic position assisted routing. The combination of Reactive (On demand) and Proactive (Table driven) protocols is called Hybrid Routing Protocols.
Figure 2: MANET Routing Protocols
Proactive routing protocols: Each node has one or more tables that contain the latest information of the routes to any node in the network. Each node maintain routing tables and respond to the changes in the network topology by propagating updates throughout the network in order to maintain a consistent view of the network. Many proactive routing protocols have been proposed, for e.g. Destination Sequence Distance Vector (DSDV), Optimized Linked State Routing (OLSR) and so on. Reactive protocols: Unlike proactive routing protocols, the reactive routing protocols create routes once a node wants to transmit data to a destination. The source node initiates route discovery process by flooding route query within the network. When the destination is reached, route reply request will be sent back to the source. Once the route has been found, it is maintained until either destination becomes inaccessible or the route is no longer desired then route discovery process will be invoked again. Several reactive protocols have been proposed such as Dynamic Source Routing protocol (DSR), Ad hoc On-demand Distance Vector (AODV), and so on. Hybrid routing protocols: In such network, hybrid routing protocols, i.e. combining proactive and reactive routing protocols, are used in order to take advantages on these two routing protocols where proactive maintains
231
route in a cluster and reactive maintains route between clusters. Several hybrids routing protocols have been proposed such as Zone Routing Protocol (ZRP), Zone-based Hierarchical Link State (ZHLS) and so on.
II. OPTIMIZED LINK STATE ROUTING PROTOCOL
OLSR [3][4] is an optimization of pure link state routing protocol like Open Shortest Path First (OSPF). This optimization is related to concept of multipoint relay (MPR). A multipoint relay reduces the size of control messages. The use of MPRs also minimizes flooding of control traffic. Multipoint relays forward control messages, providing advantage of reduction in number of retransmissions of broadcast control messages. OLSR contains two types of control messages: neighborhood and topology messages, known as Hello messages and Topology Control (TC) messages. OLSR provides two main functionalities: Neighbor Discovery and Topology Dissemination. With the help of these two functionalities, each node computes routes to all known destinations.
Figure 3.Selection of MPR and Broadcasting TC packets
Selection of Multipoint Relay (MPR) using HELLO messages Each node periodically broadcasts Hello messages, containing list of neighbors known to node and link status. The link status can be either symmetric or asymmetric, multipoint relay, or lost link. The Hello messages are received by all one-hop neighbors and not forwarded. Hello messages discover one-hop neighbors as well as its two-hop neighbors. Hello messages are broadcast at regular interval (Hello_interval). The neighborhood and two hop neighborhood information has holding time (Neighbor_hold_time), after which it is not valid. With the help of this information node selects its own set of MPRs among one-hop neighbors. Multipoint relays computed whenever there is change in one-hop neighborhood and two-hop neighborhood. MPR is one-hop neighbors with symmetric link, such that all two-hop neighbors has symmetric link with multipoint relays. Fig 3 shows selection of MPR node using HELLO packets. Node is selected as MPR node when it has willingness high i.e. W_HIGH or default i.e. W_DEFAULT otherwise rejected. Significance of TC messages Each node of the network maintains topological information about the network obtained with help of TC messages. Each node selected as MPR, broadcasts TC message at regular interval (TC_interval). The TC message originated from node which declares MPR selectors of that node. If change occurs in MPR selector set, then TC message can be sent earlier than pre-specified interval. The TC messages are sent to all nodes in the network by taking advantage of MPR nodes to avoid number of retransmissions. Fig 3 shows broadcasting of TC message with the help of MPR nodes. Route Calculation The neighbor information and the topology information are refreshed periodically, and they enable each node to compute the routes to all known destinations. These routes are computed with Dijkstra’s shortest path algorithm. Hence, they are optimal with respect to the number of hops. Moreover, for any route, any

232
intermediate node on this route is a MPR of the next node. The routing table is computed whenever there is a change in neighborhood or topology information. HELLO and TC packet format
Figure 4.OLSR HELLO Packet Format
Figure 5.OLSR TC Packet Format
Fig.4 shows HELLO packet format for OLSR. The Reserved portion in HELLO packets is used for further modification. Htime specifies time before transmission of next HELLO packet. Willingness entry specifies node willingness to forward traffic. Link Code gives the information about link between sender node and neighbor node. It represents status of neighbor node. Neighbor interface address denotes address of interface of neighbor node. Link Message size gives total length of link message. Fig.5 represents TC packet format for OLSR. Advertised Neighbor Sequence Number (ANSN) which increments sequence number whenever there is change in neighbor set. Reserved field is used for further modification in TC packets. Advertised Neighbor Main Address field contains main address of neighbor node.
III. MODIFIED OLSR [OLSR]
OLSR applies shortest hop routing method for the transmission of data. It leads the congestion on specific path, or rise in energy expenditure of particular intermediate nodes. If multiple paths are available, then congestion can be avoided, and energy expenditure of all nodes would be uniform. To achieve this, following changes are carried out. Following are the changes made in OLSR protocol [5][6][7]: Changes in control messages The ‘reserved’ field available in HELLO and TC message format is used to pass residual energy. This residual energy is further used to find out appropriate path. Modified HELLO message format: +-+-+-+-+-+-+-+-+-+-+-+-+-+-+-+-+-+-+-+-+-+-+-+ | Residual Energy | Htime |Willingness | +-+-+-+-+-+-+-+-+-+-+-+-+-+-+-+-+-+-+-+-+-+-+-+ | Link Code | Reserved | Link Message Size |
Reserved HTime
Willingness
Link Code
Reserved Link Message Service
Neighbor Interface Address Neighbor Interface Address
ANSN Reserved Advertised Neighbor Main Address Advertised Neighbor Main Address
..............

233
+-+-+-+-+-+-+-+-+-+-+-+-+-+-+-+-+-+-+-+-+-+-+-+ | Neighbor Interface Address | +-+-+-+-+-+-+-+-+-+-+-+-+-+-+-+-+-+-+-+-+-+-+-+ | Neighbor Interface Address | +-+-+-+-+-+-+-+-+-+-+-+-+-+-+-+-+-+-+-+-+-+-+-+ : …. : +-+-+-+-+-+-+-+-+-+-+-+-+-+-+-+-+-+-+-+-+-+-+-|(etc) Modified TC message format: +-+-+-+-+-+-+-+-+-+-+-+-+-+-+-+-+-+-+-+-+-+-+-+ | ANSN | Residual Energy | +-+-+-+-+-+-+-+-+-+-+-+-+-+-+-+-+-+-+-+-+-+-+-+ | Advertised Neighbor Main Address | +-+-+-+-+-+-+-+-+-+-+-+-+-+-+-+-+-+-+-+-+-+-+-+ | Advertised Neighbor Main Address | +-+-+-+-+-+-+-+-+-+-+-+-+-+-+-+-+-+-+-+-+-+-+-+ | ... | +-+-+-+-+-+-+-+-+-+-+-+-+-+-+-+-+-+-+-+-+-+-+-|(etc) Changes in Routing table and Topology table In OLSR, user is not aware of intermediate nodes present on the path and also its residual energies. The modified Routing Table of Multipath OLSR is as follows- from the modified routing table, information of residual energies of intermediate nodes are obtained. Dest next iface dist 14 20 37 3 20 11 14 Residual energy of intermediate node1 Residual energy of intermediate node2 ……. So from the modified Routing Table, for the given source-destination pair, multiple paths are available. Now to select one of the available path, energy aware metric is applied. The energy expenditure (in Joules) needed to transmit a packet p is given by, E(p) = i * v * tp Where i is the current value, v is the voltage, tp the time taken to transmit the packet p. For our simulation, the voltage is chosen as 5 V. Algorithm for modified OLSR [8][9]: • Maintain all one hoping nodes for each node using modified HELLO message, with the residual energy of the nodes. • Based on its one hop table, insert the appropriate entries to its routing table. • Match the entries with topology set and add to the routing table. • For each node, see recursively its last address until reached to the destination node, record the complete path information in the routing table using modified TC message (with the residual energy of the nodes). • Discard the loop entries. • Get all the paths for given source-destination pair, with the residual energy of each node to the entire network. • Select all paths, for given source-destination pair • Find out minimum energy of node, E(min), on each selected paths.
234
• Find out maximum energy of node, E(max), out of that E(min) values. • Use this selected path.
IV. SIMULATION AND RESULT
We use network simulator ns2 to analyses OLSR and OLSRM routing protocols and measure Number of node alive and Average end to end delay with varying Nodes’ velocity and node density. For simulation, two ray ground propagation models is used. The nodes are 40 in the area of 1000 X 1000 square meters. Traffic type used is CBR (Constant Bit Rate), Packet send rate is 20 packets/sec and Packet size is 512 Bytes[10].
We evaluate essential Quality of Service parameters to analyses the performance differences of OLSR and OLSRM. Each node in the network has some constant Initial energy. The QoS parameter, alive nodes are chosen to show that more number of nodes alive for longer time in the network. More number of alive nodes implies the optimization of energy. The parameter Delay is chosen to study the effect of, addition of multipath technique and energy aware metric to the original OLSR Number of Nodes Alive: This is one of the important metric to evaluate the energy efficiency of the routing protocol. It tells about Network Lifetime, • The time to the first node failure due to battery outage • The time to the unavailability of an application functionality First point gives the failure of first node, whereas second gives the time when only one node is alive (for communication at least two nodes must be alive). Both can be extracted from the trace file and tells about time at which first node died and the information about how alive nodes changes with the simulation time. Average End to End Delay: This is the time difference between sending of data packets and time at which the same data packet is received. Normalized Routing Overhead: It is the ratio of total number of routing packets to the total number of delivered data packets. A. Effect of Node Mobility and Node Density on Number of Nodes Alive: In case of OLSR, the shortest hop path is always chosen; whereas in OLSRM the path for the data delivery is considered with the available energy of nodes (at that instant) on the path, even if the path is long (in terms hop). Therefore OLSRM has more number of nodes alive compared to OLSR. As the node mobility increases, the number of alive nodes in OLSRM increases implies that modified protocol is suitable for dynamic network. By varying number of nodes, it has been observed that OLSRM has more number of nodes, for high node density. It is obvious, as multiple paths will be more for large number of nodes. So it can be seen from the results, OLSRM is best suitable for dynamic and dense network [11][12] in Fig.6&7.
Figure 6: Effect of node density on nodes alive. Figure 7: Effect of node velocity on nodes alive.
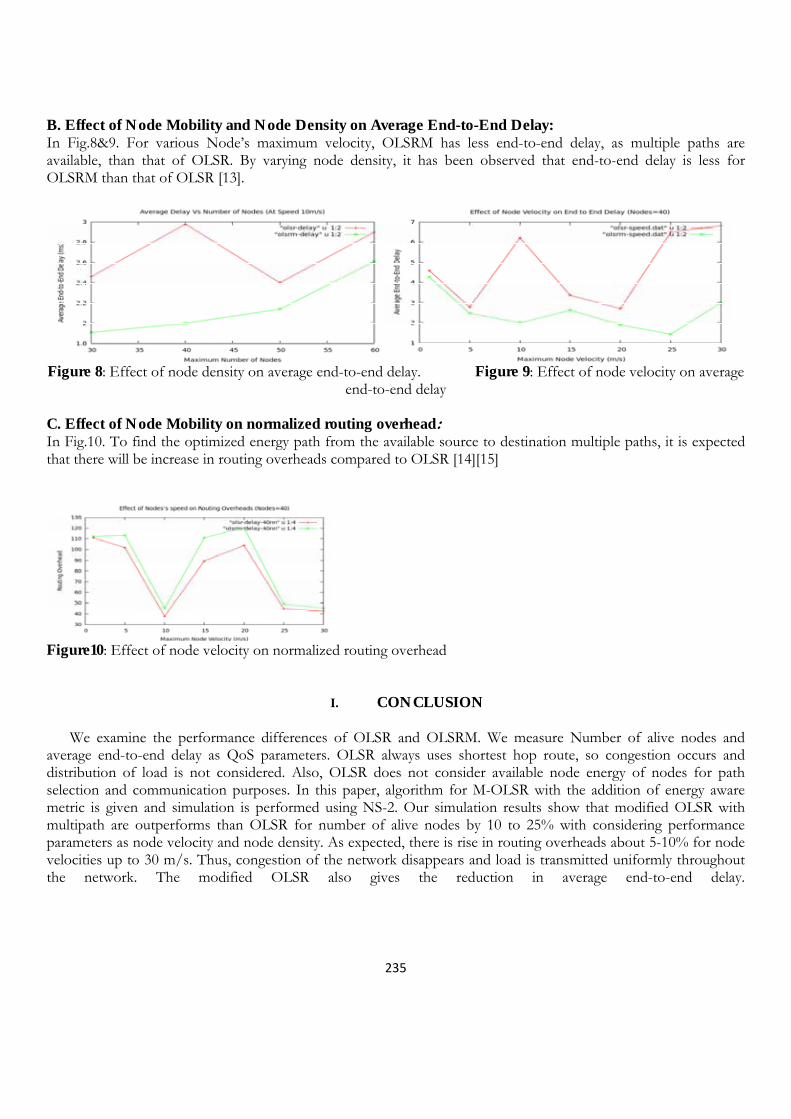
235
B. Effect of Node Mobility and Node Density on Average End-to-End Delay: In Fig.8&9. For various Node’s maximum velocity, OLSRM has less end-to-end delay, as multiple paths are available, than that of OLSR. By varying node density, it has been observed that end-to-end delay is less for OLSRM than that of OLSR [13].
Figure 8: Effect of node density on average end-to-end delay. Figure 9: Effect of node velocity on average
end-to-end delay C. Effect of Node Mobility on normalized routing overhead: In Fig.10. To find the optimized energy path from the available source to destination multiple paths, it is expected that there will be increase in routing overheads compared to OLSR [14][15]
Figure10: Effect of node velocity on normalized routing overhead
I. CONCLUSION
We examine the performance differences of OLSR and OLSRM. We measure Number of alive nodes and average end-to-end delay as QoS parameters. OLSR always uses shortest hop route, so congestion occurs and distribution of load is not considered. Also, OLSR does not consider available node energy of nodes for path selection and communication purposes. In this paper, algorithm for M-OLSR with the addition of energy aware metric is given and simulation is performed using NS-2. Our simulation results show that modified OLSR with multipath are outperforms than OLSR for number of alive nodes by 10 to 25% with considering performance parameters as node velocity and node density. As expected, there is rise in routing overheads about 5-10% for node velocities up to 30 m/s. Thus, congestion of the network disappears and load is transmitted uniformly throughout the network. The modified OLSR also gives the reduction in average end-to-end delay.
236
REFERENCES
[1] M.S. Corson, J. Macker, Mobile Ad Hoc Networking (MANET): Routing Protocol
Performance Issues and Evaluation Considerations, IETF, RFC 2501, 1999.
[2] C.-K. Toh, (2001) “Maximum Battery Life Routing to Support Ubiquitous Mobile Computing in Wireless Ad Hoc Networks”, IEEE communication magazine, pp. 138-147.
[3] T. Clausen and P. Jacquet, “rfc3626.txt”, Network working group DRAFT for OLSR protocol, Oct’03
[4] T. Clausen, P. Jacquet, Optimized Link State Routing Protocol (OLSR), IETF RFC 3626, 2003.
[5] Pinki Nayak, Rekha Agarwal, Seema Verma “An Overview of Energy Efficient Routing Protocols in Mobile Ad Hoc Network” IJRRAN Vol. 2, No. 1, March 2012,
[6] Floriano De Rango and Macro Fotino “Energy Efficient OLSR performance Evaluation under Energy Aware Metrics”, SPECTS 2009. IEEE 2009 pages: 193-198(2009)
[7] Thomas Kunz, (2008) “Energy-Efficient Variations of OLSR”, IEEE Transactions, pp. 517-522.
[8] May Zin Do and Mazliza Othman “Performance comparisons of AOMDV and OLSR routing protocols for MANET”, IEEE 2010. Iccea, vol. 1, pp.129-133(2010)
[9] Dinesh Singh, Deepak Sethi, Pooja “Comparitive Analysis of Energy Efficient Routing protocols in MANETs(Mobile Ad Hoc Networks)” IJCST Vol. 2, Issue 3, September 2011
[10] S.Rajeswari and Dr.Y.Venkataramani “An Adaptive Energy Efficient and Reliable Gossip Routing Protocol For Mobile Adhoc Networks” International Journal of Computer Theory and Engineering, Vol. 2, No. 5,October, 2010
[11] C.Yu, B.Lee, H.Yong Youn“Energy Efficient Routing Protocols for Mobile Ad Hoc Networks”
[12] Ajay Shah Hitesh Gupta Mukesh Baghel “Energy Efficient Routing Protocols in Mobile Ad hoc Networks”,IJCTA.Vol3(4).
[13] S.-M. Senouci and G. Pujolle “Energy Efficient Routing in Wireless Ad Hoc Networks”
[14] ShivaPrakash, J. P. Saini, “A review of Energy Efficient Routing Protocols for Mobile Ad Hoc Wireless Networks”, IJCIS Vol. 1, No. 4, 2010
[15] Tanu Preet Singh, Shivani Dua, Vikrant Das, “Energy- Efficient Routing Protocols In Mobile Ad-Hoc Networks” Volume 2, Issue 1, January 2012
237
GEOPHYSICAL EVALUATION OF MAGNETIC DATA OF OKENUGBO AREA, AGO -
IWOYE, SOUTHWESTERN, NIGERIA
1Oladunjoye H.T., 2*Olasunkanmi, N. K. and 3Olaleye, A.O
1 Department of Physics, Olabisi Onabanjo University, Ago-Iwoye
2*(corresponding author) Deapartment of Chemical, Geological and Physical Sciences, Kwara State University, Malete. Nigeria.
3 Department of Earth Sciences, Ladoke Akintola University of Technology, Ogbomoso. Nigeria.
Abstract The results of a magnetic study of the Okenugbo Area of Ago-Iwoye, Southwestern Nigeria are presented for the evaluation of the geostructural settings in the area to determine the competency of the basement for building constructions. The study area lies within Longitude N06°55.389-N06°55.384 and Latitude E003°55.001 and E003°54.959 in the basement complex of Nigeria. Three magnetic profiles were established for the evaluation and the magnetic anomaly map, the regional geology and its analytic signal amplitude helped in identifying the nature and depth of the magnetic sources in the study region. The magnetic residual values range from -2400 nT to +1800 nT. The area shows magnetic closures of various sizes at the Western part of the study area trending West with prominence at the center and distributed East-West which has been interpreted as fractured or faulted zones. The depth estimate revealed the apparent depth to the causative body from the surface and the basement depth range from 4.3 to 21.3 m which agrees with other literatures. The study has revealed that the area is generally competent for high rise structures and industrial site while the faulted/fractured zones are prospective better locations for hydrogeological purposes.
Keywords; Geostructure, competency, anomaly, fracture, intrusion
Introduction
The alarming rate of structural failure such as roads, buildings, dam and bridges in Nigeria has become more intense. The need for pre-foundation studies can therefore not be overemphasized as it may constitute a significant potential hazard to the downstream people such as loss of valuable lives and properties that always accompany such failure Akanmu et al. 2007. The basement mapping and geophysical foundation study usually provides subsurface information that assists the construction engineers in location of the right site and design of foundation for different structures.
There are series of geophysical methods such as electrical, gravity, electromagnetic, magnetic, seismic and radiometry, that responds to physical properties of the subsurface media which could be used singly or in combinations for subsurface sequence and structure disposition site investigation. The magnetic method is used to investigate subsurface geology on the basis of the anomalies in the earth's magnetic field resulting from the magnetic properties of the underlying rocks (Nicolas, 2007). The shape, dimensions, and amplitude of the anomalies is a function of the orientation, geometry, size, depth, and magnetic susceptibility of the body as well as the intensity and inclination of the earth's magnetic field in the survey area.

238
The Analytic Signal Amplitude has been employed for analysis of the groundmagnetic data obtained in this study, to delineate subsurface linear geologic structures which could possibly reveal the distribution of fractures within the area. If the concealed bedrock that is suppose to serve as the foundation rock is faulted/fractured, it may lead to collapse of structures sited there. The Analytic signal method is very useful for delineating magnetic source location (Nabigbian, 1972, 1974.; Roest et al, 1992); the amplitude of the simple analytic signal peaks over magnetic contacts and could be used to determine the depth to the magnetic sources. LOCATION AND GEOLOGY OF THE STUDY AREA
The study area is essentially a part of the basement complex regarded as Precambrian basement complex in the three major litho-petrologic components that make up the geology of Nigeria. The rocks present are mainly Granodiorite- porphyroblastic, Granite, Gneisses and Migmatite Gneisses, BiotiteGneisses and Biotite, Hornblende Gneiss (Rahaman, 1988). The Gneisses constitute the major rocks intended by the other groups of rocks while the minor rock types include pegmatite and quartz veins in the area. The study area lies between Longitude N06°55.389-N06°55.384 and Latitude E003°55.001 and E003°54.959 respectively located in Okenugbo, by Fowoseje Comprehensive High School in Ago-Iwoye area of Ijebu, Ogun State.
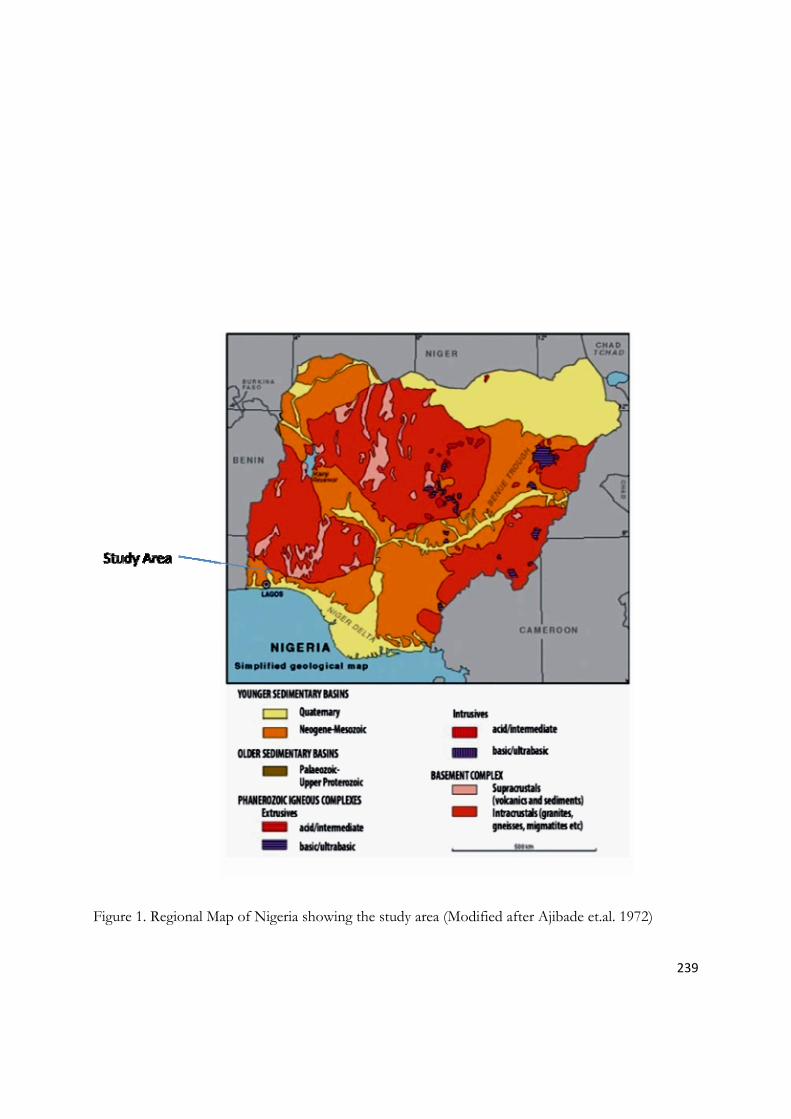
239
Figure 1. Regional Map of Nigeria showing the study area (Modified after Ajibade et.al. 1972)
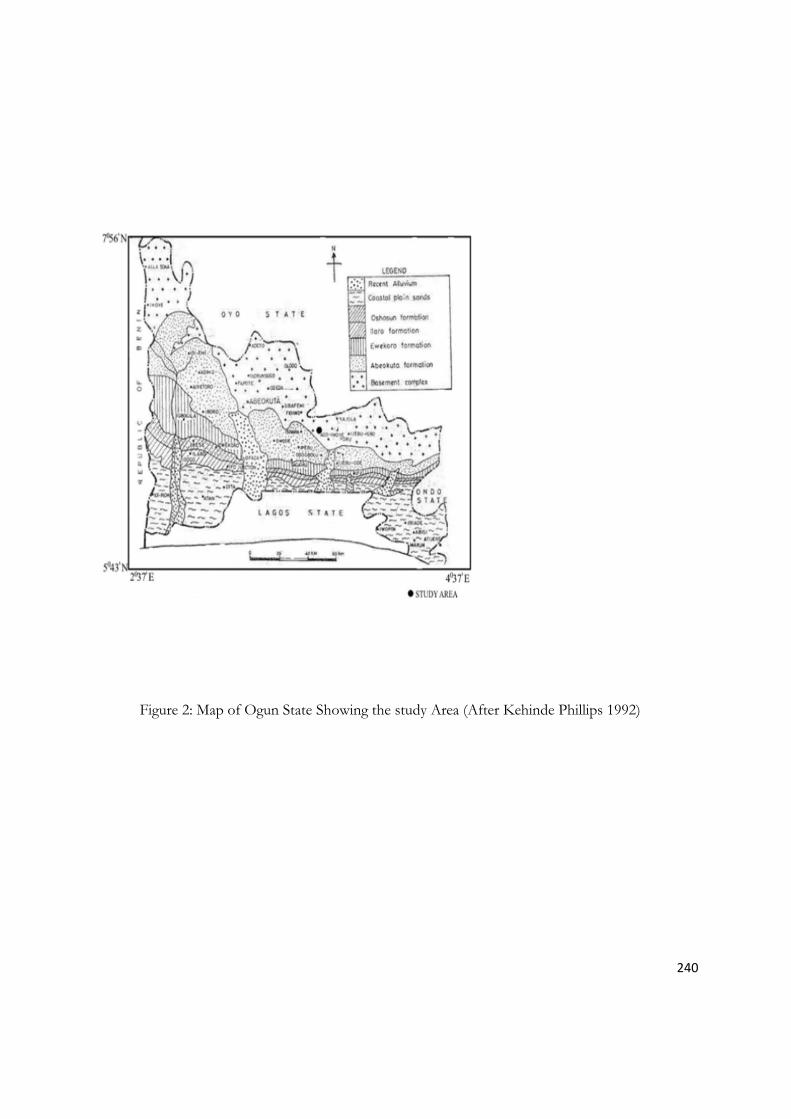
240
Figure 2: Map of Ogun State Showing the study Area (After Kehinde Phillips 1992)
241
Figure 3: Accessibility Map of the Study Area showing the Magnetic Traverses
MATERIALS AND METHOD
The instrument used for the groundmagnetic survey is the Geometries Proton Precession Magnetometer, model G- 856 which produces an absolute and relatively high resolution of the field and displays measurement in digital lighted readout. Three traverses were established along the East-North, North – East and West- East directions with length variation within 500 m and 1000 m with 20 m inter-traverses spacing, in the study area. The instrument measure small, localized variations in the Earth’s magnetic field (Nicolas, 2007) presented as the Total Magnetic Intensity TMI of the area. To make accurate magnetic anomaly maps, temporal changes (diurnal variation) in the earth’s field during the period of the survey were monitored by selecting a base station, where the magnetic intensities are being measured at a stationary point. The regional magnetic field was removed from the TMI using SignProc computer software and recorded as the residual anomaly for each traverse. The Analytic Signal was further used to enhance the residual anomaly. The analytic signal or total
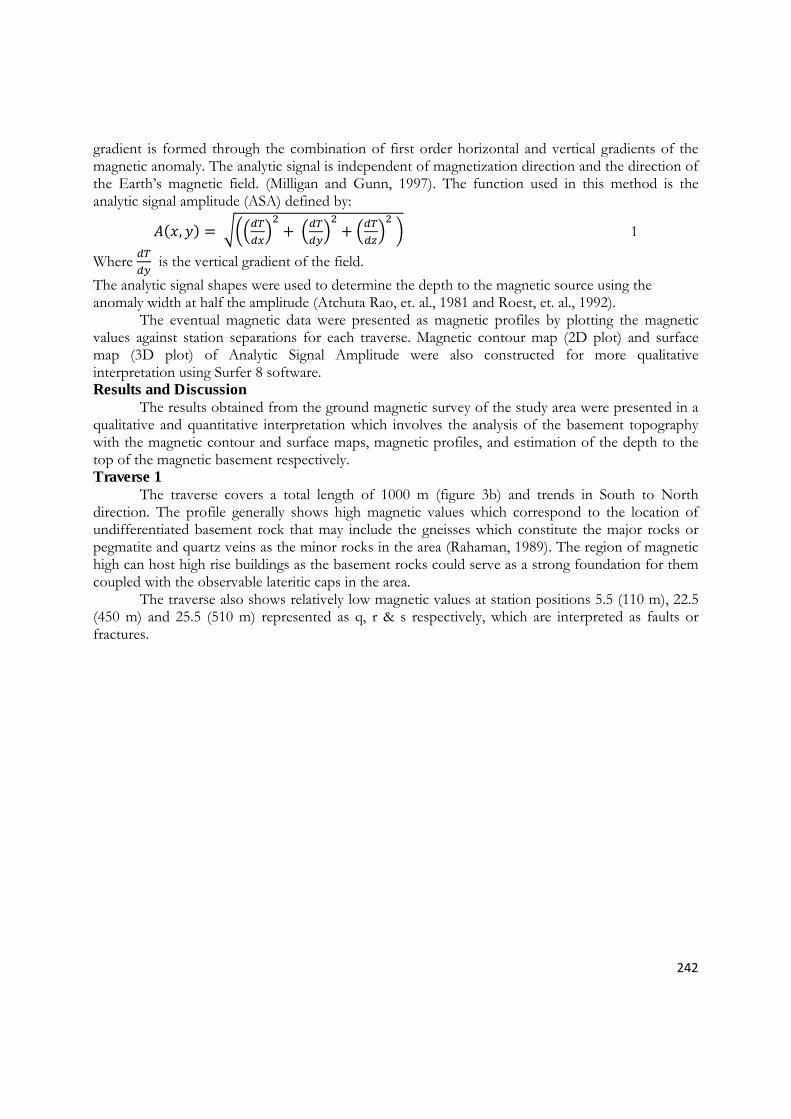
242
gradient is formed through the combination of first order horizontal and vertical gradients of the magnetic anomaly. The analytic signal is independent of magnetization direction and the direction of the Earth’s magnetic field. (Milligan and Gunn, 1997). The function used in this method is the analytic signal amplitude (ASA) defined by: , = + + 1
Where is the vertical gradient of the field.
The analytic signal shapes were used to determine the depth to the magnetic source using the anomaly width at half the amplitude (Atchuta Rao, et. al., 1981 and Roest, et. al., 1992).
The eventual magnetic data were presented as magnetic profiles by plotting the magnetic values against station separations for each traverse. Magnetic contour map (2D plot) and surface map (3D plot) of Analytic Signal Amplitude were also constructed for more qualitative interpretation using Surfer 8 software. Results and Discussion
The results obtained from the ground magnetic survey of the study area were presented in a qualitative and quantitative interpretation which involves the analysis of the basement topography with the magnetic contour and surface maps, magnetic profiles, and estimation of the depth to the top of the magnetic basement respectively. Traverse 1
The traverse covers a total length of 1000 m (figure 3b) and trends in South to North direction. The profile generally shows high magnetic values which correspond to the location of undifferentiated basement rock that may include the gneisses which constitute the major rocks or pegmatite and quartz veins as the minor rocks in the area (Rahaman, 1989). The region of magnetic high can host high rise buildings as the basement rocks could serve as a strong foundation for them coupled with the observable lateritic caps in the area.
The traverse also shows relatively low magnetic values at station positions 5.5 (110 m), 22.5 (450 m) and 25.5 (510 m) represented as q, r & s respectively, which are interpreted as faults or fractures.
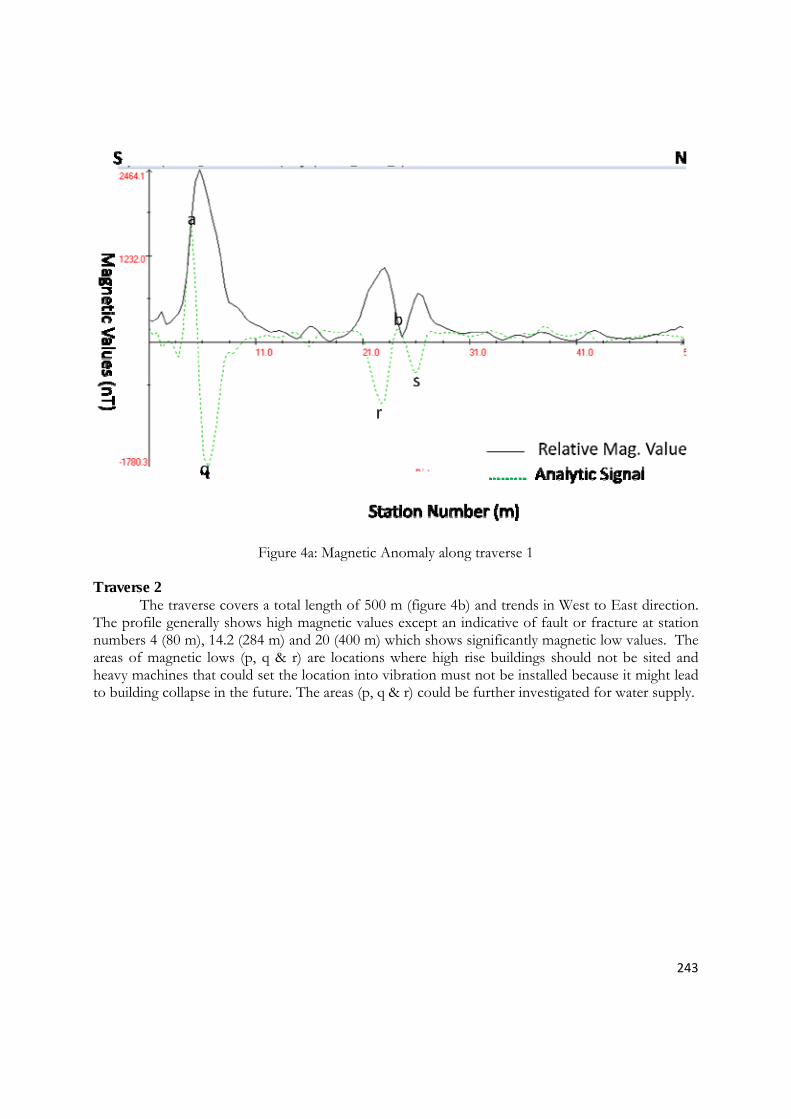
243
Figure 4a: Magnetic Anomaly along traverse 1
Traverse 2 The traverse covers a total length of 500 m (figure 4b) and trends in West to East direction.
The profile generally shows high magnetic values except an indicative of fault or fracture at station numbers 4 (80 m), 14.2 (284 m) and 20 (400 m) which shows significantly magnetic low values. The areas of magnetic lows (p, q & r) are locations where high rise buildings should not be sited and heavy machines that could set the location into vibration must not be installed because it might lead to building collapse in the future. The areas (p, q & r) could be further investigated for water supply.

244
Figure 4b: Magnetic Anomaly along traverse
Travers 3 The traverse covers a total length of 620 m (figure 4c) and trends in South to North
direction. The area has the magnetic lows and magnetic highs relatively distributed. The areas of magnetic lows (p, q, r, s, t, u, v, w, x, y & z) are locations observed to be zones of non-magnetic minerals like faults, crack or contact between two rocks but relatively prominent at point ‘y’ which shows wide fracture trend.
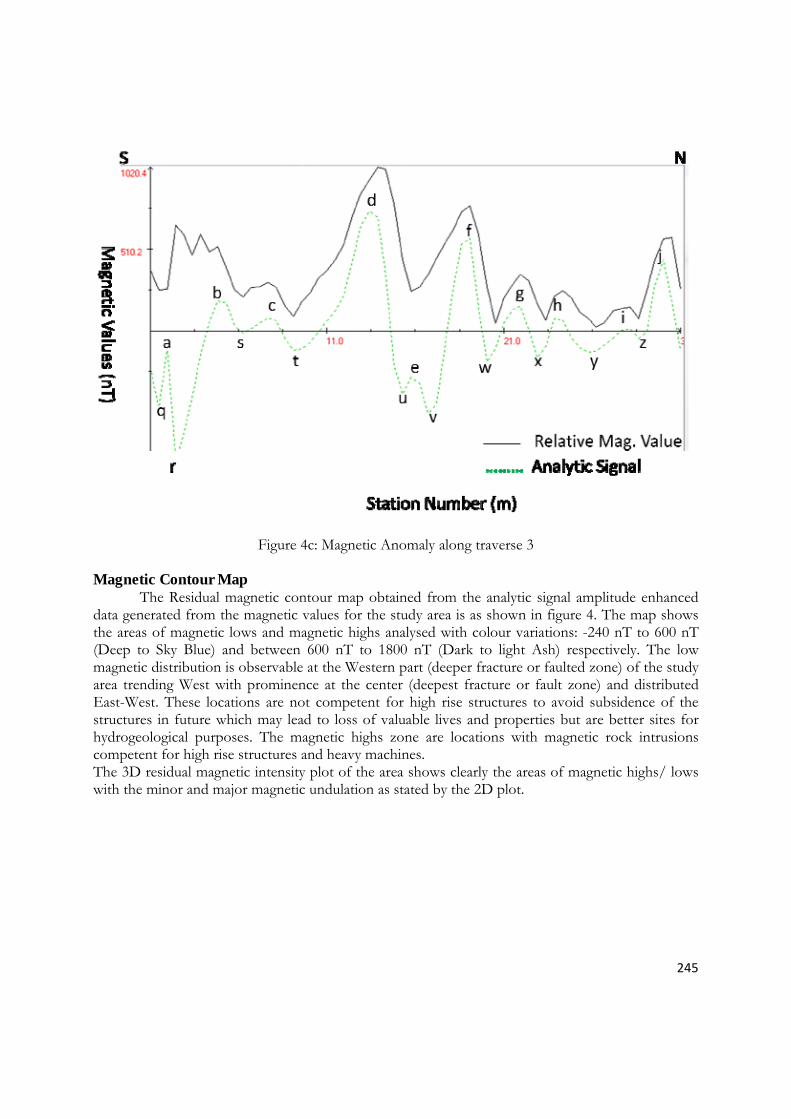
245
Figure 4c: Magnetic Anomaly along traverse 3
Magnetic Contour Map The Residual magnetic contour map obtained from the analytic signal amplitude enhanced
data generated from the magnetic values for the study area is as shown in figure 4. The map shows the areas of magnetic lows and magnetic highs analysed with colour variations: -240 nT to 600 nT (Deep to Sky Blue) and between 600 nT to 1800 nT (Dark to light Ash) respectively. The low magnetic distribution is observable at the Western part (deeper fracture or faulted zone) of the study area trending West with prominence at the center (deepest fracture or fault zone) and distributed East-West. These locations are not competent for high rise structures to avoid subsidence of the structures in future which may lead to loss of valuable lives and properties but are better sites for hydrogeological purposes. The magnetic highs zone are locations with magnetic rock intrusions competent for high rise structures and heavy machines. The 3D residual magnetic intensity plot of the area shows clearly the areas of magnetic highs/ lows with the minor and major magnetic undulation as stated by the 2D plot.

246
Figure 4: The contoured map (2D plot).

247
Figure 8. 3D Magnetic Intensity Surface Map
Depth Analysis The depth estimate from analytic signal amplitude revealed the apparent depth to the
causative body to the surface and the basement depth range from 4.3 to 16.5 m which agrees with the literatures of Badmus and Olatinsu, 2009; Shanu T.O. 1991 and Ariyo et.al. 2009., that reported different geophysical methods used around the area. The depth estimate shows shallow magnetic source straddled by near surface intrusives. The analysis involved the use of half-width of the amplitude method and it has been presented on table 1.
Table 1. Depth estimates of groundmagnetic traverses relative to the ground surface using Half-Width of the amplitude method.
Traverses Depth to magnetic sources (m)
a B c d E f G h i J
Traverse 1 12.0 15.5
Traverse 2 6.7 9.3 13.3 16.5
Traverse 3 4.3 11.8 13.0 21.3 7.0 16.1 16.5 14.2 11.8 11.8
-2200nT
-1700nT
-1200nT
-700nT
-200nT
300nT
800nT
1300nT
248
Conclusion
The results of the geophysical evaluation of magnetic survey of Okenugbo area to determine the competency of the basement for building constructions were discussed in terms of quantitative and qualitative interpretations. The quantitative interpretation involves the estimation of the overburden thickness to the top of the magnetic basement, and is as shown on Table 1. It indicated varied basement topography with depth ranging from 4.3 to 21.3 m.
The qualitative interpretation revealed that the area is generally competent for high rise structures and industrial site while some locations are better sites for hydrogeological purposes which could be ascertained with other geosphysical methods.
References Akanmu J.O., Eluwa O. and Ekpo I., (2007). Chronicles of river basin management in
Nigeria. A journal presented at the international congress on river basin management. Ariyo, S. O., Adeyemi, G .O., and Oyebamiji A. O., (2009). Electromagnetic VLF
Survey for Groundwater Development in a Contact Terrain; a Case Study of Ishara-remo, Southwestern Nigeria. Journal of Applied Sciences Research, 5(9), 1239-1246.
Badmus, B. S. and Olatinsu, O. B., 2009. Geophysical evaluation and chemical analysis of kaolin clay deposit of Lakiri village, southwestern Nigeria Journal of Physical Sciences Vol. 4 (10) pp. 592-606
Kehinde-Philips, O.O. (1992). Geological Map of Ogun state. In: Onakomaiya, S.O., Oyesiku, O.O. and Segede, F.J (eds.). Ogun state Map. Nigeria: Rex Charles Publication. Pp. 6 -20.
Milligan, P. R. and Gunn, P. J. (1997) Enhancement and Presentation of Airborne Geophysical Data. J. Aust.Geology and Geophysics, v. 17, pp. 63-75.
Nabighian, M. N. (1972) The Analytic signal of two-dimensional magnetic bodies with polygonal cross sections: its properties and use for automated anomaly interpretation. Geophysics, v. 37, pp. 507–517.
Nabighian, M.N., 1974, Additional comments on the analytic signal of two-dimensional magnetic bodies with polygonal crosssection, Geophysics, 39, 85-92.
Nicolas O.M., 2008. ‘The magnetic method’ Presented at Short Course III on Exploration for Geothermal Resources, organized by UNU-GTP and KenGen, at Lake Naivasha, Kenya. Rahaman, M.A., 1988. Recent advances in the study of the Basement Complex of Nigeria. In:
Oluyide, P.O., Mbonu, W.C., Ogezi, A.E., Egbuniwe, I.G., Ajibade, A.C. and Umeji A.C. (eds.). Precambrian Geology of Nigeria, G.S.N,. pp. 11-41.
Rahman MA (1989). Review of the Basement Geology of Southwest, Nigeria. Geol. Nigeria pp. 943-959.
Roest, W.R., J. Verhoef and M. Pilkington (1992): Magnetic interpretation using the 3D analytic signal, Geophysics, 57, 116-125.
Shanu, T.O. (1991). Geology and Geochemistry of Laterites around Ago -Iwoye. Imodi – Imosan area of Southwestern Nigeria. Unpublished B.Sc. Project, Ogun State University, Ago - Iwoye. 40p.
249
USING GIS IN THE MANAGEMENT OF HEALTH INFRASTRUCTURE WITHIN
KADUNA METROPOLIS, NIGERIA 1Aliyu, Y. A. and 2Shebe, M. W.
1,2Department of Geomatics, Faculty of Environmental Design, Ahmadu Bello University, Zaria-Nigeria
ABSTRACT
One of the most important indices of defining general welfare and quality-of-life of people in the world is the physical and mental health of individuals. The major factors causing diseases are essentially spatial; that is, their distribution and concentration vary in different locations.GIS is a decision support system that helps the managers of public health make sound decisions at less cost. In this study, coordinates of health facilities were collected using handheld GPS. Attribute data regarding these facilities were acquired. The information obtained enabled the creation of a geospatial database in ArcGIS 9.3 software. The database was queried and the results analyzed. The results show that primary health care (PHC) centres constituted just 4.61 percent of the entire health facilities within the metropolis, 10.53 percent were government owned while 89.47 percent were private owned. Buffer operation of 1.5 km for the various health facilities displayed areas that are neglected.
Key Words: GIS, Public Health, Infrastructure Mapping, Kaduna
1.0 INTRODUCTION
More than 150 years ago, public health experts realized the use of maps in analyzing the location of disease-related happenings. Many interrelated changes in the world such as urbanization, transportation and industrial development, population and life expectation growth, unsustainable agricultural development, etc. cause general and complex environmental problems that threaten the health of humankind seriously (Mesgari and Massomi, 2008). In 1840, Robert Cowan in Glasgow-England, used maps to show the relationship between crowd and incidence of yellow fever. He recognized that in regions where there is too much immigration, this disease was more epidemic. Also in 1843, he showed epidemically incidence of typhoid on a map which involved all of the infected houses (Burrough, 1986). Since then, GIS has been continuously used for the analyses of spatial health related data. During this period, the more GIS analytical capabilities were developed, the more advanced and comprehensive spatial models were developed by the collaboration of experts in both areas of GIS and epidemiology and health care.
The need for health care varies in space and so the organization of provision necessarily has a spatial component. Neither population totals nor population characteristics such as age, sex, income, occupation, fertility et cetera are uniform in space. In a like manner, the physical environment varies in characteristics from place to place and this invariably has implications for the pattern of demand for health care facilities. The spatial dimension is also important in utilization behavior since accessibility is a major determinant of the use of health care facilities (Onokerhoraye, 1997).
Data and information are vital at each stage of the emergency cycle in order to make informed decisions and develop targeted response programmes. Seemingly a simple task - the humanitarian environment poses great challenges to timely and effective information collection and management. Fragmented workflows and the process of translating information into timely decision-making is an
250
ongoing and well-documented challenge. (King, 2005; Harvard Humanitarian Initiative, 2011). The health sector, like many others, struggles to make decision amongst a simultaneous deluge and paucity of health information. (Turoff, 2008). Studies have reported over 80% of health information are geographical in nature and timely health interventions depend upon where health facilities are located and the status of each identified facility (e.g., hospitals, primary health care centers, health posts) (William, 1987).
Nowadays, health and health care are considered as models and an important factor in the quality of life of individuals. In fact, the development of public health and diseases management plays a significant role in cultural, social and economical development of any society. The most important goals of each public health organization involve environment health, control of diseases, health education and prevention, medical and nursing actions for early diagnosis, control and management of diseases (Ghazban, 2003). In fact up-to-date information and adequate models are required to help decision makers decide regarding any parameters affecting public health.
Both human settlements and activities and factors causing human diseases spread geographically. Most of the pathogenic factors are universally epidemic and do not belong to a special region or area, while some of them may occur in specific regions. Such correlations make it necessary to study and compare the spatial distribution and pattern of both the diseases, the affected population and their assumed factors. Geographic information system (GIS) can be used to analyze and compare such patterns.
In 2000, a project in Kamataka was accomplished for dividing regions and specifying local domain of health area responsibility. Reason for performing this study, was referred to the disproportion between population of the region and location of health center. The final goals were to control and supervise health center operations in their responsibility region, to optimize use of available health resources and to cover clients’ needs. Related data to service area of health center had been provided by PHC and SC institutes for all sections and regions. The result was a GIS with the ability of performing spatial analyses, such as: zoning regions, finding the best location for facilities (Wen Hsiang, 2000).
Keola et al. (2002) used GIS for examining effects of different factors on public health, showing disease distribution, performing specific analyses, visualization and provision of information on health care and also helping in different decision making. Data used in this study include: population data, data concerning infectious diseases and their occurrence locations. In this study, dependence of spreading disease on time was studied using statistical regression analyses. One of the advantages of this study is the simultaneous use of spatial and statistical analysis which provides powerful tool for decision making process. Among all examined diseases, pneumonia had a direct relation with time and highest dependence coefficient (94 %) and its distribution in crowded areas was high.
Eastern Europe International Health organization started to estimate diseases as a result of water pollution by means of GIS to specify pollution resources and direction of occurring diseases. In this research, primary studies determined system requirements for managing and taking care of diseases and also factors that cause them. Then, some of the disease intensifying factors and data related to them were gathered. Finally, GIS was used as a managing system to store and recover data, display and recognize temporal and spatial association of diseases (World Health Organization, 2002).
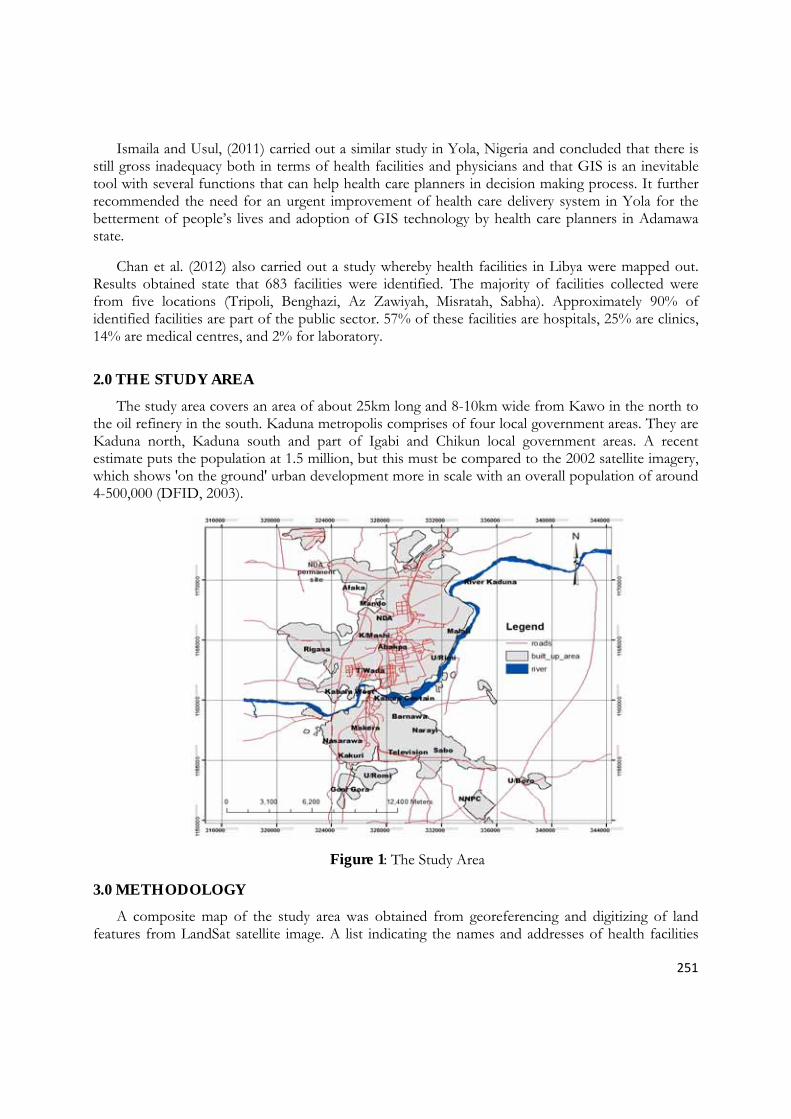
251
Ismaila and Usul, (2011) carried out a similar study in Yola, Nigeria and concluded that there is still gross inadequacy both in terms of health facilities and physicians and that GIS is an inevitable tool with several functions that can help health care planners in decision making process. It further recommended the need for an urgent improvement of health care delivery system in Yola for the betterment of people’s lives and adoption of GIS technology by health care planners in Adamawa state.
Chan et al. (2012) also carried out a study whereby health facilities in Libya were mapped out. Results obtained state that 683 facilities were identified. The majority of facilities collected were from five locations (Tripoli, Benghazi, Az Zawiyah, Misratah, Sabha). Approximately 90% of identified facilities are part of the public sector. 57% of these facilities are hospitals, 25% are clinics, 14% are medical centres, and 2% for laboratory.
2.0 THE STUDY AREA
The study area covers an area of about 25km long and 8-10km wide from Kawo in the north to the oil refinery in the south. Kaduna metropolis comprises of four local government areas. They are Kaduna north, Kaduna south and part of Igabi and Chikun local government areas. A recent estimate puts the population at 1.5 million, but this must be compared to the 2002 satellite imagery, which shows 'on the ground' urban development more in scale with an overall population of around 4-500,000 (DFID, 2003).
Figure 1: The Study Area
3.0 METHODOLOGY
A composite map of the study area was obtained from georeferencing and digitizing of land features from LandSat satellite image. A list indicating the names and addresses of health facilities
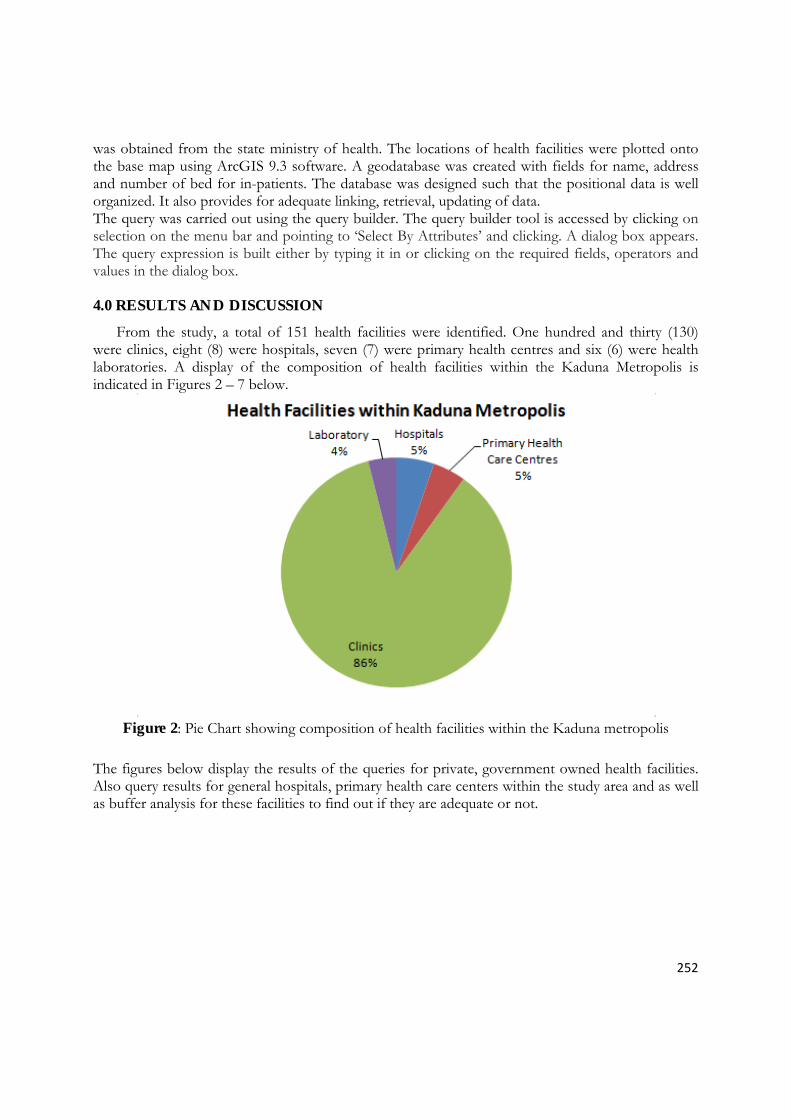
252
was obtained from the state ministry of health. The locations of health facilities were plotted onto the base map using ArcGIS 9.3 software. A geodatabase was created with fields for name, address and number of bed for in-patients. The database was designed such that the positional data is well organized. It also provides for adequate linking, retrieval, updating of data. The query was carried out using the query builder. The query builder tool is accessed by clicking on selection on the menu bar and pointing to ‘Select By Attributes’ and clicking. A dialog box appears. The query expression is built either by typing it in or clicking on the required fields, operators and values in the dialog box. 4.0 RESULTS AND DISCUSSION
From the study, a total of 151 health facilities were identified. One hundred and thirty (130) were clinics, eight (8) were hospitals, seven (7) were primary health centres and six (6) were health laboratories. A display of the composition of health facilities within the Kaduna Metropolis is indicated in Figures 2 – 7 below.
Figure 2: Pie Chart showing composition of health facilities within the Kaduna metropolis
The figures below display the results of the queries for private, government owned health facilities. Also query results for general hospitals, primary health care centers within the study area and as well as buffer analysis for these facilities to find out if they are adequate or not.
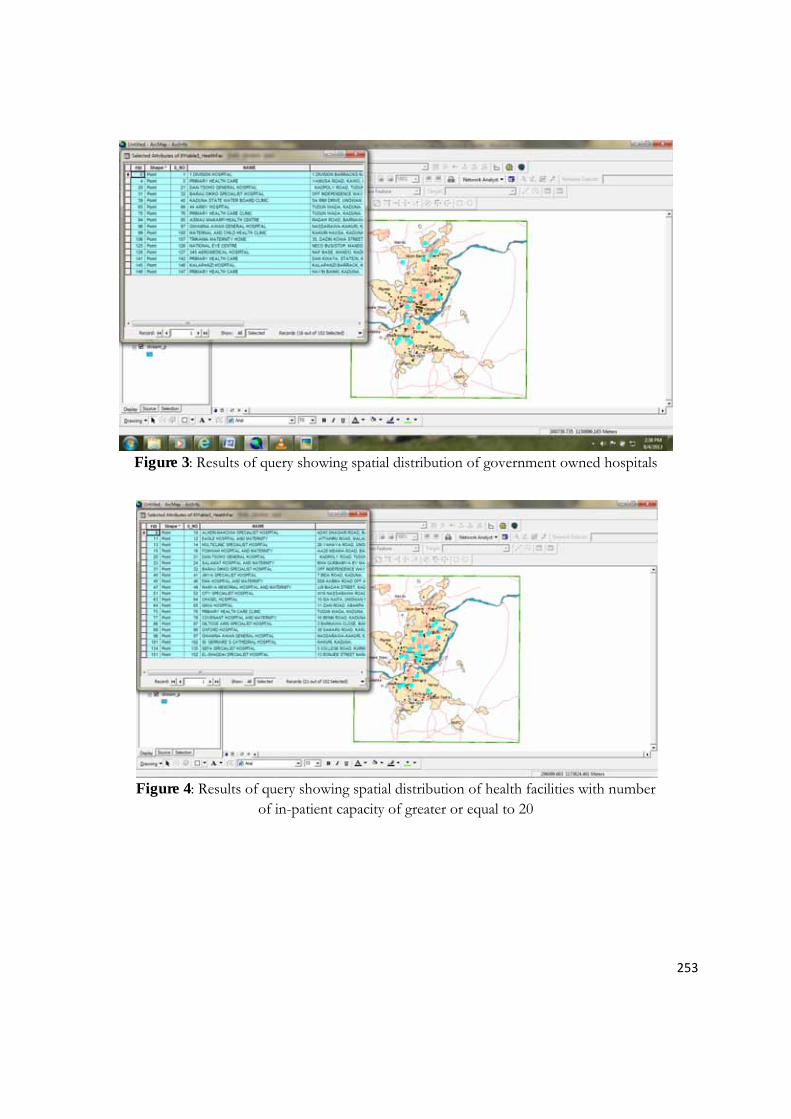
253
Figure 3: Results of query showing spatial distribution of government owned hospitals
Figure 4: Results of query showing spatial distribution of health facilities with number
of in-patient capacity of greater or equal to 20
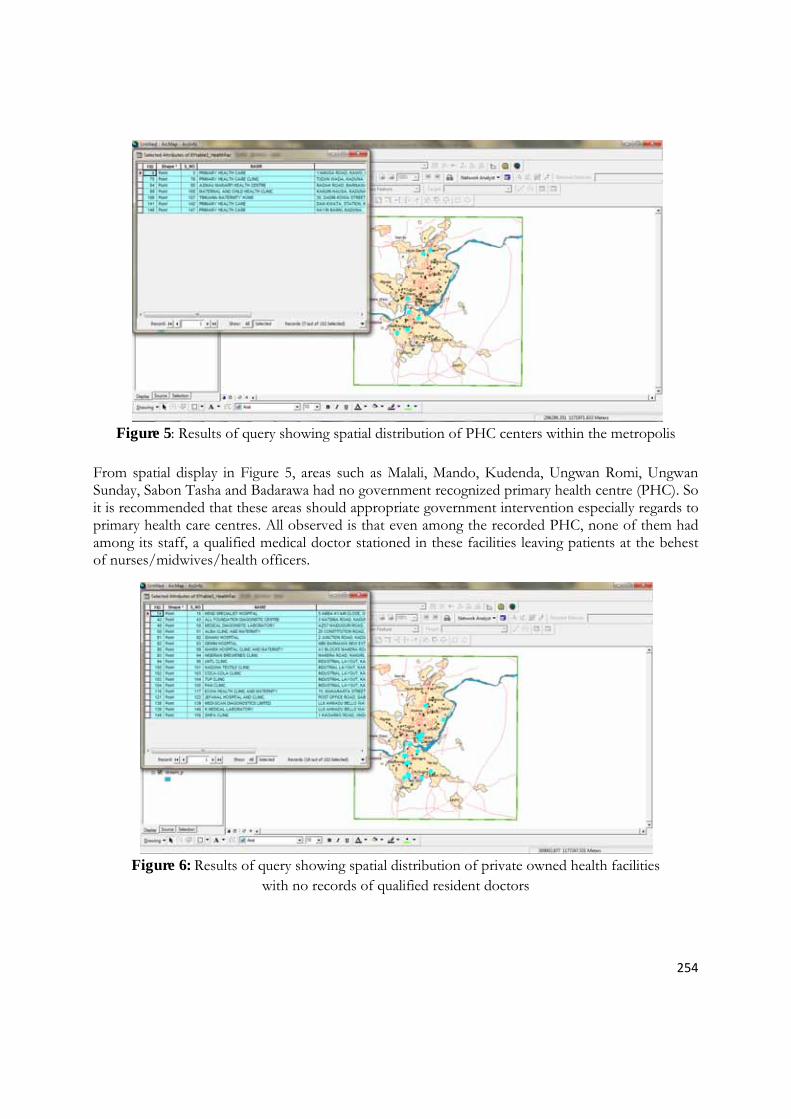
254
Figure 5: Results of query showing spatial distribution of PHC centers within the metropolis
From spatial display in Figure 5, areas such as Malali, Mando, Kudenda, Ungwan Romi, Ungwan Sunday, Sabon Tasha and Badarawa had no government recognized primary health centre (PHC). So it is recommended that these areas should appropriate government intervention especially regards to primary health care centres. All observed is that even among the recorded PHC, none of them had among its staff, a qualified medical doctor stationed in these facilities leaving patients at the behest of nurses/midwives/health officers.
Figure 6: Results of query showing spatial distribution of private owned health facilities
with no records of qualified resident doctors
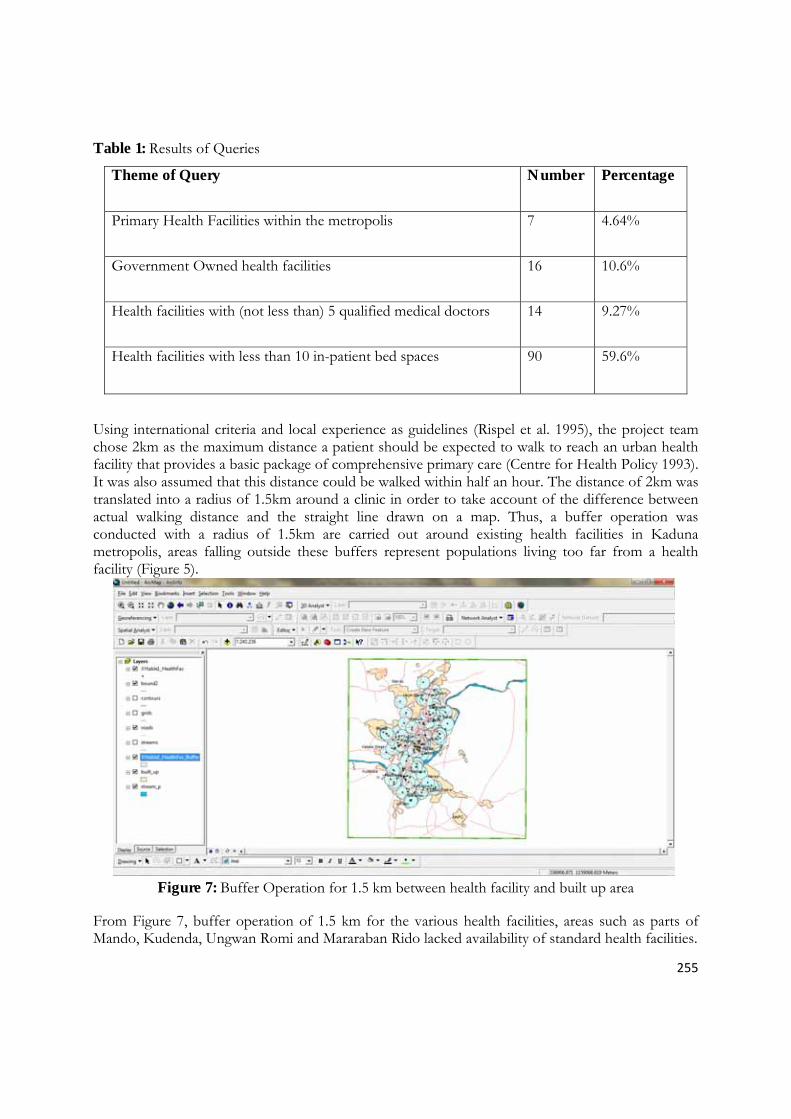
255
Table 1: Results of Queries
Theme of Query Number Percentage
Primary Health Facilities within the metropolis 7 4.64%
Government Owned health facilities 16 10.6%
Health facilities with (not less than) 5 qualified medical doctors 14 9.27%
Health facilities with less than 10 in-patient bed spaces 90 59.6%
Using international criteria and local experience as guidelines (Rispel et al. 1995), the project team chose 2km as the maximum distance a patient should be expected to walk to reach an urban health facility that provides a basic package of comprehensive primary care (Centre for Health Policy 1993). It was also assumed that this distance could be walked within half an hour. The distance of 2km was translated into a radius of 1.5km around a clinic in order to take account of the difference between actual walking distance and the straight line drawn on a map. Thus, a buffer operation was conducted with a radius of 1.5km are carried out around existing health facilities in Kaduna metropolis, areas falling outside these buffers represent populations living too far from a health facility (Figure 5).
Figure 7: Buffer Operation for 1.5 km between health facility and built up area
From Figure 7, buffer operation of 1.5 km for the various health facilities, areas such as parts of Mando, Kudenda, Ungwan Romi and Mararaban Rido lacked availability of standard health facilities.
256
5.0 CONCLUSION As a result of this study, it is concluded that the Kaduna state government need to establish
more hospitals and primary health care centres in lacking areas. Furthermore, it should incorporate into its State Health Ministry, a GIS laboratory which will be useful in effective decision making. 6.0 RECOMMENDATION
• The Kaduna State Government should increase the number of primary healthcare centres within the metropolis as well as centres offering 24-hour services.
• More doctors and especially nurses should be appointed at the existing primary health centres since most of the patients are seen by nurses.
• Working conditions for staff should be improved by improving the health workers salaries and encouraging professional development, i.e. to train more nurses as primary health care practitioners and specialize in their field of interest. This would improve the quality of care.
Limitation of the Study Due to time and financial constraints, it was impossible to include all the privately owned health facilities within Kaduna metropolis for the purpose of this study.
REFERENCES Burrough, P. (1986). Geographic Information Systems for Natural Resources Assessment. Oxford University
Press, New York.
Centre for Health Policy. 1993. The Determination of Need Norms for Health Services. Part 2. A Summary of Norms in other countries. Document submitted to the Department of National Health and Population Development.
Chan, J. L., Colombo, R. and Musani, A. (2012). Mapping Libyan Health Facilities - A Collaboration between Crisis Mappers and the World Health Organization. Proceedings of the 9th International ISCRAM Conference – Vancouver, Canada.
DFID, (2003). The Background of Kaduna in the Nigerian Federal Context. Mapping Urbanization for Urban and regional Governance. DFID Final Report – September 2003. Retrieved August, 6, 2013, from: http://home.wmin.ac.uk/MLprojects/Mapping/Report_for_Web/PDF_final/App_D_Kaduna_Back_MU.pdf
Harvard Humanitarian Initiative (2011) Disaster Relief 2.0 - The Future of Information Sharing in Humanitarian Emergencies, Washington, D.C. and Berkshire, UK. UN Foundation & Vodafone Foundation Technology Partnership
Ghazban, F. (2003). Environmental-Biological Geology. Tehran University Press.
Ismaila, A. B. and Usul, N. (2013). A GIS-based Spatial Analysis of Health care Facilities in Yola, Nigeria. GEOProcessing 2013 : The Fifth International Conference on Advanced Geographic Information Systems, Applications, and Services.
257
Keola, S., Tokunaga, M., Nitin, K. T. and Wisa, W. (2002). Spatial Surveillance of Epidemiological Disease: A Case Study in Ayutthaya Province, Thailand. GIS Development Magazine.
King, D. (2005) Humanitarian Knowledge Management. Proceedings of the Second International ISCRAM Conference, Brussels, Belgium
Mesgari, M. S. and Masoomi, Z. (2008). GIS Applications in Public Health as a Decision Making Support System and its Limitation in Iran. World Applied Sciences Journal 3 (Supple 1): 73-77. ISSN 1818-4952
Onokerhoraye, A. G. (1997). Health and Family Planning Services in Nigeria: A Spatial perspective. University of Benin publishers. ISBN 9783282417
Rispel, L., Beattie, A., Xaba, M., Form, S., Cabral, J. and Marawa, N. (1995). A Description and Evaluation of Primary Health Care Services delivered by the Alexandra Health Centre and University Clinic. Johannesburg: Centre for Health Policy.
Turoff, M. and Hiltz, S. R. (2008). Assessing the Health Information Needs of the Emergency Preparedness and Management Community. Information Services & Use, 28, 269–280
Wen Hsiang, W. (2000). Generalized Linear Models. Department of Statistics, Tunghai University, Tunghai.
William, R. E. (1987). Selling a Geographical Information System to Government Policy Makers. URISA, 3,150–6.
World Health Organization, (2002). Summit County Water Quality: Septic Systems and Potential Nitrate Pollution Analysis, URL:http://www.who.europe.int/ and http://ehasl.cvmbs.colostate.edu/projects/
258
OPTIMIZATION STUDIES OF SOIL PH FOR GROWING HIGH VALUE CROPS
Amir Abbas Shah Naqvi, Department of Chemistry, COMSATS Institute of Information Technology,
Abbottabad-22060, Pakistan Muhammad Irshad,
Department of Environmental Sciences, COMSATS Institute of Information Technology, Abbottabad-22060 Pakistan
Qamar Zaman, National Tea Research Institute, Shinkyari, Mansehra, Pakistan
Bushra Ismail Department of Chemistry, COMSATS Institute of Information Technology,
Abbottabad-22060 Pakistan Abdur Rahman Khan*,
Department of Chemistry, COMSATS Institute of Information Technology, Abbottabad-22060, Pakistan
ABSTRACT
Tea plantation requires an acidic soil with a pH range of 4.5-5.5. These pH values have not been reported for Pakistani soils. Lowering soil pH is important for better tea crop productivity in Hazara Division. Therefore, soils from three different sites of Mansehra area were sampled where tea has already been grown but due to the higher pH value, the desired tea production has not been achieved. This study focused the mitigation of pH of silt loam soil through different chemicals. Treatments were mixed in soil-water (1:1) paste and incubated for three months. Temporal changes in soil pH were also measured. Majority of the acidic chemicals significantly lowered soil pH. Combinations of amendments namely FeSO4, HNO3, S, Al2 (SO4) 3,
H2SO4, H2O2, HCl and citrus fruit material were used at different ratios in the same soil. Irrespective of the type of chemical used, all treatments ratios lowered soil pH favorably. Thus we conclude that soil pH in Mansehra area can be lowered using a suitable amendment or appropriate ratios of chemicals for a sustainable tea plantation. Same combinations may be used for other high value crops especially those acidic soil living. Keywords: soil pH, Optimization, chemicals, combinations, tea, Mansehra area
INTRODUCTION Tea (Camellia sinensisL.) belongs to family Theaceae. It is herbaceous, dicotyledonous and perennial crop. Tea may be propagated either by seed or by vegetative means. The effect on yield etc. may be due to the soil fertility, acidity, elevation and weather conditions [1]. The tea plant (Camellia sinensis L) is an evergreen of Camellia family. It was originated in China and India [2]. Tea is cash crop and one of the most important beverages used worldwide. Tea production contributes greatly to the economy and job opportunities for many countries of Asia and Africa due to its large scale production, trade and marketing. Pakistan is perhaps among the few countries where tea has attained the status of basic food especially among the poor. During
259
2009-10 Pakistan imported 95219 tons of black tea costing Rs. 21622 million with highest share from Kenya (60.95%) while the green tea import was 913.72 tons with 64.46% from China [3]. In addition to legal import, the arrival of tea through illegal channels is also common to feed the Pakistan tea market. Pakistan has a long tradition of tea drinking that has now become an integral part of the social life. The first tea experiments were initiated in the then West Pakistan (present Pakistan) in village Baffa (district Mansehra, NWFP) under the auspices of Pakistan Tea Board in 1958. Subsequently, efforts to grow tea were reinitiated in1964 at Misriot Dam near Rawalpindi but due to unfavorable soil and climatic conditions could not achieve the desired results. After the delinking of East Pakistan the entire requirement of tea is imported by Pakistan (Refer Tea imports by Pakistan, Hanif Janoo, IJTS 1:4, 2002). Pakistan is the 3rd largest importer of tea after England and Russia and the consumption is increasing day by day with the increase in population. Pakistan is importing black tea from nineteen different tea-producing countries of the world. Since self-sufficiency is inevitable in the local production of tea by proper regional soils management [4]. The genus Camellia includes some 82 species, which are mostly indigenous to highlands of south India (Sealy, 1958). Under normal conditions the tea plant is an evergreen tree and widely grows into medium size tree but under cultivation it is pruned and trained as low spreading bush to ensure that a maximum crop of young shoots can be obtained [5]. Pakistan is an agricultural country. It is bestowed with different agro-climatic conditions combined with soil of suitable physico-chemical properties. Under these diverse climatic conditions with different soils various crops, vegetables and fruits can be grown successfully. Fortunately, some of the areas of NWFP are feasible for tea cultivation due to its climatic and soil characteristics. These areas include the districts Mansehra, Batagram, Shangla and Swat. In these areas 1.5 lakh acres of land has been declared suitable for tea cultivation [6]. Tea has begun as medicine and grew into one of the most important beverage of the world. Tea is taken both by poor and rich in Pakistan. Per capita consumption of tea in Pakistan is about one kilogram per annum. Economics revealed that 100 percent tea consumed in the country is imported, and presently Pakistan is the second largest importer of tea after United Kingdom [7]. Soil samples were collected from reported areas and were analyzed for various Physical and Chemical Parameters using standard methods of USDA. Classification and genesis of soils will provide the scientific basis for the studies in future. The soil series and phases studies were done by the criteria of USDA Soil Survey Manual (U.S.D.A. 1951); some minor adjustments were made, however, to suit the local conditions [8]. It was found that on soil of pH 5.0-5.5, yield responses increased for Sulphate of ammonia when applied 20 percent of the nitrogen requirements [9]. Tea being a perennial cash crop, essentially requires acidic soil (pH 5.0-6.0) and high rainfall (above 1000mm annually) with a temperature ranging from 20 to 30°C for economic production. Once established, it remains productive for 60 to 90 years without usual care and practices needed for other traditional crops [10]. Occasionally, the tea roots will not grow into untreated soil having the pH more than 7.0 and as a result growth is slowed down and plants may die when they have been in the ground for a year. For nursery use the soil must be acidified treated with sulphur ranging from 115-450 m-2or aluminum sulphate @ 450 gm -2depending on the soil pH [11]. Eden (1976) reported the suitable range of soil pH as 4.5-5.6 for tea cultivation, in which the cuttings rooted and grew satisfactory [12]. Green (1964) pointed out that the soil of much low reaction i.e. 4.5 had no ill
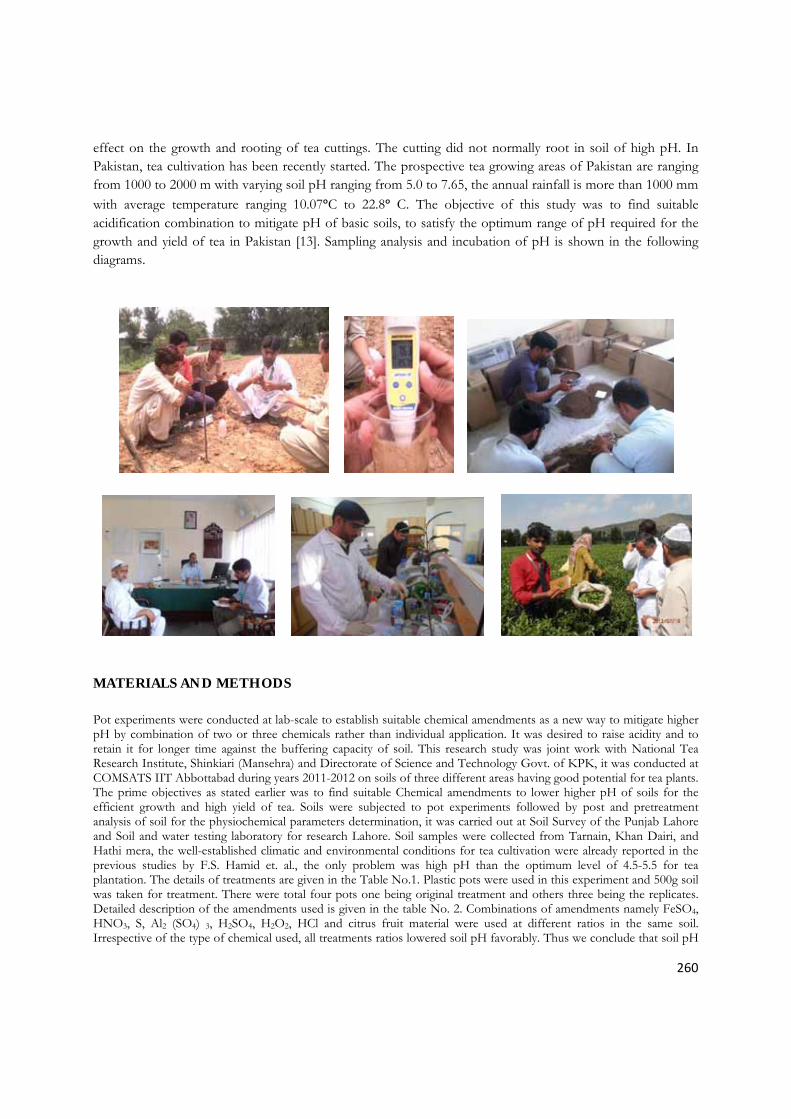
260
effect on the growth and rooting of tea cuttings. The cutting did not normally root in soil of high pH. In Pakistan, tea cultivation has been recently started. The prospective tea growing areas of Pakistan are ranging from 1000 to 2000 m with varying soil pH ranging from 5.0 to 7.65, the annual rainfall is more than 1000 mm with average temperature ranging 10.07ᵒC to 22.8ᵒ C. The objective of this study was to find suitable acidification combination to mitigate pH of basic soils, to satisfy the optimum range of pH required for the growth and yield of tea in Pakistan [13]. Sampling analysis and incubation of pH is shown in the following diagrams.
MATERIALS AND METHODS Pot experiments were conducted at lab-scale to establish suitable chemical amendments as a new way to mitigate higher pH by combination of two or three chemicals rather than individual application. It was desired to raise acidity and to retain it for longer time against the buffering capacity of soil. This research study was joint work with National Tea Research Institute, Shinkiari (Mansehra) and Directorate of Science and Technology Govt. of KPK, it was conducted at COMSATS IIT Abbottabad during years 2011-2012 on soils of three different areas having good potential for tea plants. The prime objectives as stated earlier was to find suitable Chemical amendments to lower higher pH of soils for the efficient growth and high yield of tea. Soils were subjected to pot experiments followed by post and pretreatment analysis of soil for the physiochemical parameters determination, it was carried out at Soil Survey of the Punjab Lahore and Soil and water testing laboratory for research Lahore. Soil samples were collected from Tarnain, Khan Dairi, and Hathi mera, the well-established climatic and environmental conditions for tea cultivation were already reported in the previous studies by F.S. Hamid et. al., the only problem was high pH than the optimum level of 4.5-5.5 for tea plantation. The details of treatments are given in the Table No.1. Plastic pots were used in this experiment and 500g soil was taken for treatment. There were total four pots one being original treatment and others three being the replicates. Detailed description of the amendments used is given in the table No. 2. Combinations of amendments namely FeSO4, HNO3, S, Al2 (SO4) 3, H2SO4, H2O2, HCl and citrus fruit material were used at different ratios in the same soil. Irrespective of the type of chemical used, all treatments ratios lowered soil pH favorably. Thus we conclude that soil pH
261
in Mansehra area can be lowered using a suitable amendment or appropriate ratios of chemicals for a sustainable tea plantation. Chemicals effect on lowering of soils pH was recorded on the daily basis, Data was collected for about three months. Table 1 Treatments applied to soil
Experimental Details Soils samples were collected = Tarnain (Silt Loam S1), Hathi Mera (Silt Loam S2), Khan Dairi (Clay Loam S3) Total Soil Sample Taken= 500g Chemical Amendments = 7 Biological Amendments = 1 Total Treatments= 8 Total No of soils under trial = 4 Total No of Replicate= 3 Total No. of experimental Pots = 7x4=28x4= 112 Soil paste with water = (1:1) saturated C*= Citrus Fruits freshly plucked from university lawns RESULTS AND DISCUSSIONS To avoid longevity of the this work only pH response of all the amendments will be discussed for soil No. 1 denoted as silt loam soil (S1). The mean values of the recorded results was taken. Since chemicals amendments used to enhanced the acidity in soil media that helped in the healthy growth of Tea plants. Chemical analysis results showed the soils were having silt loam texture, pH was about 7.7 and EC was turned out 7.8 mS/cm. other parameters responsible for major soil fertility Like NPK and OM% were fairly rich. From these results Soil was categorized in the adequate fertile conditions in general. Since only persisting problem was the high pH than the required for Tea plantation in the region.
Soils Treatment results
Here is the efficiency and suitability order of the all eight treatments applied to the amended soil. T2 sulphur combined with two acids; sulphuric acid and hydrochloric acid> T4 Aluminum sulphate combined with Nitric acid and sulphuric acid > T7 > C* citrus fruit freshly plucked from university trees > T6 > T3, T5 > T1. This was the efficiency order of the all amendments. It was already studied that acidic soil with suitable temperature and adequate rainfalls are
considered the critical factors for successful cultivation of tea. As the use of ammonium sulfate increases acidity of the soil therefore the maximum increase in plant height may be due to the acidic characteristics of soil created with the application of ammonium sulfate [14]. The preferable pH range of soil for raising of tea cuttings is 4.5 to 5.5. it was reported that a high pH can be corrected by mixing sulphur @ 151 to 454 gm per 0.76 cubic meters of heaped soil or treatment of aluminum sulphate solution @ 24 gms per 0.91 meter of soil [15]. Tea Research Foundation of Kenya suggested the mixing of 170 gm-2of sulphur or 300 gm-2of aluminum sulphate for the nursery soil having the pH around 6.1. Elemental sulphur is decomposed in the soil by microorganisms, releasing sulphuric acid. This is a very slow process and roots can be damaged if they come into contact with high concentration of decomposing sulphur. Aluminum
Sr. No Chemical Combinations Soil g Dose used
T1 Al2(SO4)3:H2SO4:S 500 35g:20ml :35g T2 S:HCl:H2SO4 500 40g:50ml: 10 ml T3 H2O2: Al2(SO4)3:H2SO4 500 15ml:30g:20ml T4 HCl :Al2(SO4)3:H2SO4 500 50ml:40g :10 ml T5 H2SO4: Al2(SO4)3:HNO3 500 20ml:30g:10ml T6 HNO3:Al2(SO4)3:HCl 500 50ml:30g :10ml T7 FeSO4: HNO3: Al2(SO4)3 500 25g:45ml:30g T8 Citrus fruit ( C*) 500 415g
262
sulphate contains 14% sulphur and may be of incidental value as a nutrient. The sulphur content is water soluble and aluminum sulphate even in high concentration does not damage the tea roots [16].
Effect of amendments on soil pH
As it was studied earlier that significant reduction in soil pH was observed by the application of farmyard manure, aluminum sulphate and sulphur but the effect was more pronounced in case of aluminum sulphate on the soil. Sulphur is not soluble in water but it acidifies soil relatively quickly. It improves the rate of growth of tea plants considerably. Aluminum sulphate is very soluble in water and acidifies soil without adverse effect on tea. It is quicker and cheaper to use aluminum sulphate to lower the soil pH as also reported by [17] and [18]. In the present study the acidic combinations of the elemental sulphur and aluminum sulphate were very significant in lowering of soil pH.
Table 2 Soil Analysis Results
Sr. No. Lab. No. Texture pH EC mS/cm Salinity % Ca2++Mg2+ Na1+ CO32- HCO31- Cl-1
SO42-
-------------------------------------------------------------------------------------------------------------------------------
1 24614 SiL 7.74 7.8 0.3 3.6 2 0 1.8 1 2.8
2 24615 SiL 7.72 1.1 0.3 4.4 0.44 0 3.2 0.6 1.8
3 24616 CL 7.73 1.4 0.8 10.4 6 0 2.2 3 11.2
Sr. No. Lab. No. TDS mg/l SAR ESP OM % CaCO3
----------------------------------------------------------- --------------------------------------------------------------------
1 24614 270 1.4 0.93 0.79 3.64
2 24615 273 0.29 -0.82 0.86 11.3
3 24616 805 2.63 2.55 1.03 11.82
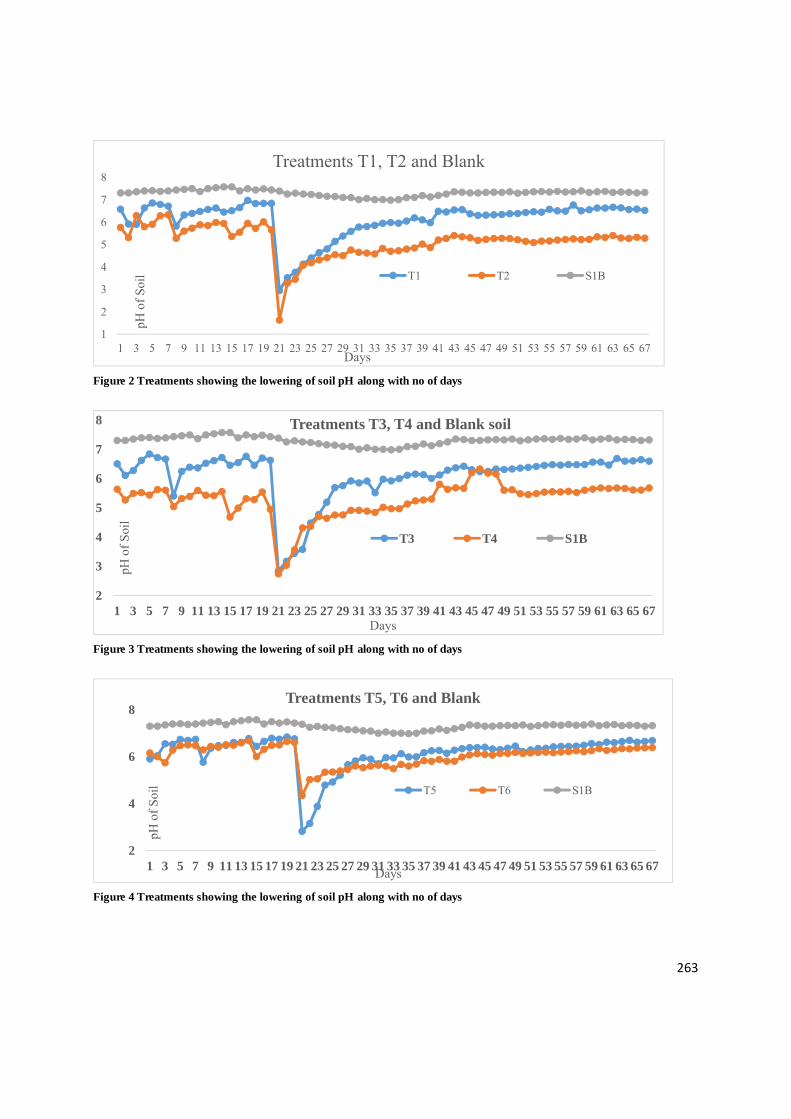
263
Figure 2 Treatments showing the lowering of soil pH along with no of days
Figure 3 Treatments showing the lowering of soil pH along with no of days
Figure 4 Treatments showing the lowering of soil pH along with no of days
1
2
3
4
5
6
7
8
1 3 5 7 9 11 13 15 17 19 21 23 25 27 29 31 33 35 37 39 41 43 45 47 49 51 53 55 57 59 61 63 65 67
pH o
f S
oil
Days
Treatments T1, T2 and Blank
T1 T2 S1B
2
3
4
5
6
7
8
1 3 5 7 9 11 13 15 17 19 21 23 25 27 29 31 33 35 37 39 41 43 45 47 49 51 53 55 57 59 61 63 65 67
pH o
f S
oil
Days
Treatments T3, T4 and Blank soil
T3 T4 S1B
2
4
6
8
1 3 5 7 9 11 13 15 17 19 21 23 25 27 29 31 33 35 37 39 41 43 45 47 49 51 53 55 57 59 61 63 65 67
pH o
f S
oil
Days
Treatments T5, T6 and Blank
T5 T6 S1B
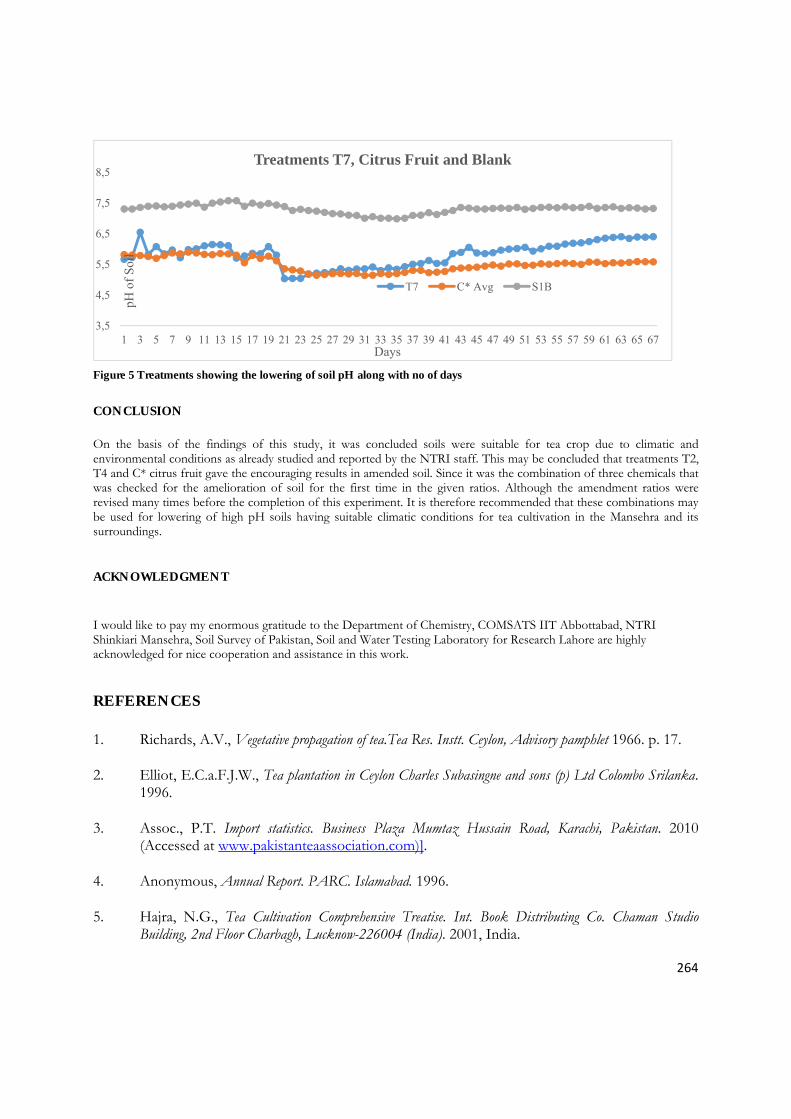
264
Figure 5 Treatments showing the lowering of soil pH along with no of days
CONCLUSION
On the basis of the findings of this study, it was concluded soils were suitable for tea crop due to climatic and environmental conditions as already studied and reported by the NTRI staff. This may be concluded that treatments T2, T4 and C* citrus fruit gave the encouraging results in amended soil. Since it was the combination of three chemicals that was checked for the amelioration of soil for the first time in the given ratios. Although the amendment ratios were revised many times before the completion of this experiment. It is therefore recommended that these combinations may be used for lowering of high pH soils having suitable climatic conditions for tea cultivation in the Mansehra and its surroundings.
ACKNOWLEDGMENT
I would like to pay my enormous gratitude to the Department of Chemistry, COMSATS IIT Abbottabad, NTRI Shinkiari Mansehra, Soil Survey of Pakistan, Soil and Water Testing Laboratory for Research Lahore are highly acknowledged for nice cooperation and assistance in this work.
REFERENCES
1. Richards, A.V., Vegetative propagation of tea.Tea Res. Instt. Ceylon, Advisory pamphlet 1966. p. 17.
2. Elliot, E.C.a.F.J.W., Tea plantation in Ceylon Charles Subasingne and sons (p) Ltd Colombo Srilanka. 1996.
3. Assoc., P.T. Import statistics. Business Plaza Mumtaz Hussain Road, Karachi, Pakistan. 2010 (Accessed at www.pakistanteaassociation.com)].
4. Anonymous, Annual Report. PARC. Islamabad. 1996.
5. Hajra, N.G., Tea Cultivation Comprehensive Treatise. Int. Book Distributing Co. Chaman Studio Building, 2nd Floor Charbagh, Lucknow-226004 (India). 2001, India.
3,5
4,5
5,5
6,5
7,5
8,5
1 3 5 7 9 11 13 15 17 19 21 23 25 27 29 31 33 35 37 39 41 43 45 47 49 51 53 55 57 59 61 63 65 67
pH o
f S
oil
Days
Treatments T7, Citrus Fruit and Blank
T7 C* Avg S1B
265
6. Khan, B.M., F. Ahmed, N. Syed, S. Sarwar and H.U. Shah, Tea Cultivation-a new avenue for poverty alleviation in mountain areas of Pakistn. “Horticultural Seminar” under the auspices of Department of Horticulture, Univ. College of Agric., Rawalakot, AJK. , 2005. p. 3.
7. Amin, R., Economics of tea cultivation in Distt. Mansehra. Bullet. Tea NTRI. 1999.
8. USDA, Soil Conservation Service. Soil Survey Staff. Soil Survey Manual. U.S. Dept. of Agric. Handb. 18. U.S. Govt. . 1951, Washington, DC.
9. Ranganathan, V., C. S. Venkata Ram and S. Matesan, Superiority of Ammonium- sulphate and Calcium Ammonium Nitrate as source of nitrogen our area to tea crop. Vol. 82. 1987: Planters Chronicle.
10. Willson, K.C. and N. Clifford, Propagation tea cultivation to consumption. Chapman and Hall London. 1992: Springer London, Limited.
11. Othieno, C.O., Soils, Tea cultivation to consumption. 1992, London: Chapman and Hall
12. Eden, T., 1976. Vegetative propagation and selection. Tea plant material. Longman Ltd. London, 1976. p. 34.
13. Green, M.J., Vegetative propagation of tea. TRIEA, 1964. p. 20.
14. Gokhale, N.G., Effect of sulfate of ammonia treatment on soil acidity and calcium content. Two and a Bud. . Tocklai Experimental Station, Asam, India. Vol. 42 1957.
15. Kathiravetpilla, A.a.K., Nursery and nursery practices, Handbook on tea,Tea Res. Institute Sri Lanka. 1986. 20-35.
16. Tolhurst, J.A.H.a.M.J.G., Fertilizers for East African tea. Tea Res. Institute of East Africa. Pamphlet, 1973. p. 12.
17. Othieno, C.O., Soils. Tea cultivation to consumption.Chapman and Hall London Sivapalan, . P. 1988. Liming of tea fields. A critical need.Tea Bull., 8(1): 3-22. 1992.
18. Banerjee, B., History of tea, Tea production and processing. Oxford and IBH Publishing CO .Pvt Ltd. New Delhi. 1993, India.

266