PROCEEDINGS BOOK - econalanya 2019
309
PROCEEDINGS BOOK 3 rd INTERNATIONAL CONFERENCE ON ECONOMIC RESEARCH 24-25 th October 2019 Alanya, TURKEY ISBN: 978-605-81058-2-9 Harun Uçak (Ed.) Alanya Alaaddin Keykubat University
-
Upload
khangminh22 -
Category
Documents
-
view
2 -
download
0
Transcript of PROCEEDINGS BOOK - econalanya 2019
PROCEEDINGS
BOOK
3rd
INTERNATIONAL CONFERENCE ON
ECONOMIC RESEARCH 24-25th October 2019
Alanya, TURKEY
ISBN: 978-605-81058-2-9
Harun Uçak (Ed.)
Alanya Alaaddin Keykubat University
3rd
INTERNATIONAL CONFERENCE ON
ECONOMIC RESEARCH
PROCEEDINGS BOOK (Full Texts - Abstracts)
ISBN: 978-605-81058-2-9
24-25th October 2019
Alanya Alaaddin Keykubat University, Turkey
Central Bank of the Republic of Turkey
Honorary President of Conference
Prof. Dr. Ekrem Kalan, Alanya Alaaddin Keykubat University, Turkey
Chairman/Editor
Harun Uçak (PhD), Alanya Alaaddin Keykubat University, Turkey
Scientific Committee
Agnieszka Parlińska (PhD), Warsaw University of Life Sciences, Poland
Alex S. Papadopoulos (PhD), University of North Carolina at Charlotte, USA
Alper Aslan (PhD), Erciyes University, Turkey
Andrea Holešinská (PhD), Masaryk University, Czech Republic
Elizabeth Real de Oliveira (PhD), Lusíada University, Portugal
Esin Cakan (PhD) Univesity of New Haven, USA
Ewa Stawicka (PhD), Warsaw University of Life Sciences, Poland
Fabio Gaetano Santeramo (PhD), University of Foggia, Italy
Jaime de Pablo Valenciano (PhD), University of Almeria, Spain
Mahir Fisunoğlu (PhD), Çukurova University, Turkey
Marta Domagalska-Gredys, Agriculture University in Cracow, Poland
Martin Grancay (PhD), Slovak University of Technology in Bratislava, Slovakia
Michael R. Reed (PhD), University of Kentucky, USA
Muhsin Kar (PhD), Yıldırım Beyazıt University, Turkey
Nejat Erk (PhD), UMUC European Division, Turkey
Taha Bahadır Saraç (PhD), Hitit University, Turkey
Tamás Czeglédy (PhD), University of Sopron, Hungary
Vida Čiulevičienė (PhD), Aleksandras Stulginskis University, Lithuania
Zbigniew Polański (PhD), Warsaw School of Economics, Poland
i
CONTENTS
Central Bank Seigniorage and Profits during the Crises of 2007-2018 1
Zbigniew Polanski and Mikolaj Szadkowski
How the Asian Infrastructure Investment Bank Challenges the World Bank:
A Comparative Analysis of Projects by the AIIB and the World Bank in Gujarat, India
2
Junhao Xu
The Effect of Domestic Risks on Economic Risk in Northern African Countries:
Findings from First and Second Generation Panel Approaches
10
Melike Torun and Dervis Kirikkaleli
Economic Analysis of Artisanal Fish Marketing Enterprise in Degema Region of Rivers
State, Nigeria
11
Ikechi Kelechi Agbugba and Mzuyanda Christian
Design of the Supplier Base by Using Supplier Reduction and Material Group
Management
24
Gerhard Lechner
Evaluation of Financial Performances of SMEs Listed in the BIST SME Industrial Index
by Using Topsis Multicriteria Decision Making Method
32
Muhammed Selcuk Kaya, Selcuk Kendirli and Mustafa Bilgin
The Role of the Accident Insurance in Agriculture for Farmers 42
Agnieszka Parlińska and Maria Parlińska
Food Safety Behaviour of Household Food Preparers in Akwa Ibom State, Nigeria 43
Ekaette Udoh and Edet Udoh
General Equilibrium Impacts of Tax Policies on Welfare of Households in Tajikistan 51
Maftuna Khakimova
An Assessment on the Financial Literacy Level of Generation Z 56
Savaş Mücteba Harputlu and Selcuk Kendirli
Incentives for Smallholders to Be Entrepreneurial: Empirical Evidence from Selected
Irrigation Schemes in Kwazulu-Natal, South Africa
Edilegnaw Wale Zegeye and U. Chipfupaa
62
Value Added from Supplier Management through the Use of Adequate Sourcing Strategies
Gerhard Lechner 63
Distinguishing Hypocritical Organizations by SROI 75
Fuminobu Mizutani
ii
Entrepreneurship and Intention of Entrepreneurship: A Case Study 78
Tomasz Bernat and Sultan Merve Çetin
Customs Union and Common Commercial Policy 83
Hüseyin Mahir Fisunoğlu
A New Vision for the Financial Regulation System in Managing Global Challenges
and Crisis
84
Fouad Beseiso
Investigating the Level of Globalization of Turkish Manufacturing Firms 97
Aslıhan Atabek Demirhan
Model of Garbology Marketing Concept on the Example of Trade Sector 98
Izabela Sztangret and Beata Reformat
Development of a Regional Marketing System 107
Andriy Mokhnenko and Iryna Perevozova
Estimation of Post-Harvest Losses along Marketing Channels of Navel and Lemon in
Kat River Valley, Eastern Cape, South Africa
108
Mzuyanda Christian, Moradeyo Adebanjo Otitoju and Siphokuhle Nohamba
Analysing the Short-Term and the Long-Term Relationship between BIST Food Beverage
Index and Food Indices on Global Market
118
Ihsan Erdem Kayral and Nisa Sansel Tandogan
Competitive Position of Polish Dairy Enterprises - Assessment of the Sustainable
Development Model
119
Ewa Stawicka
Market Interactions of Farms Implementing a Biodiversity Program: Polish Case 125
Marta Domagalska-Gredys
Lycian Penteconters: Antique Messages in Coins 126
Serdar Aslan
The Impact of SMES on Economic Growth of Azerbaijani Economy: Endogeneity and
Latent Instrumental Variable
127
Samir Orujov
Digital Economy: Opportunities and Future Challenges of Islamic Economy in Indonesia 129
Shinta Maharani and M. Miftahul Ulum
Disproportionate Gains: A Home Market Effect in an almost Arbitrary Geography 136
Jordan J. Norris
iii
Consumer Confidence and the Housing Market in Turkey 137
Ayhan Kapusuzoglu and Nildag Basak Ceylan
Growth Gains from Trade 141
Sugata Marjit, Anwesha Basu and C.Veeramani
Evaluating the Dynamic Forecasting Performance of BIST Istanbul, Ankara and Izmir
Index Volatilities
142
Ihsan Erdem Kayral and Nisa Sansel Tandogan
Features of Management by Professional and Personal Development of Personnel: The
Case of Ukraine
143
Serhii Makarenko and Tetiana Kazakova
The Interconnection among Money Supply, Interest Rate and Stock Exchange in Turkey
Ayhan Kapusuzoglu, Nildag Basak Ceylan and Ayyuce Memis
151
Investigation of the Relationship between Bitcoin and Exchange Rates 156
Seyfettin Caner Kuzucu
Analysis of Relationship between the Indicators of Money Supply and Inflation: The Case
of Turkey
161
Yıldız Özkök
The Relationship of Tourism Revenue and Economic Growth: ARDL Bound Test
Approach
168
Erkan Akgöz and Engin Tengilimoğlu
The Effect of Housing Loans Interest Rates on House Sales: The Case of Turkey 173
Taha Bahadır Saraç
Fuel Price Formation in Turkish Downstream Oil Industry 174
Mustafa Düzgün
Tourism Economy in Sustainability Concept- Perspectives and Challenges 175
Barbara Pabian
Analysis of Smallholder Farmers’ Information Needs on Climate-Smart Agriculture 181
Koketso Letlhogonolo Setshedi and Sinah Madikapi Modirwa
Development of Outsourcing in Ukraine and the World 182
Anna Chmut and Artem Lahoiskyi
The Impact of Technology on Regional Price Dispersion in the US 188
Ismail H. Genc
iv
Regional Differences in Human Capital and Occupational Choice: Evidence from Mexico 189
Kanat Abdulla
Capital Asset Pricing Model; A Catastrophic Theory Approach 190
Galo Adolfo Farfán Pacheco and Plamen Neytchev Netchev
Projects of Local Municipalities as a Tool for Regional Development in Latvia 199
Elita Jermolajeva
Determinants of the Profitability and Postharvest Losses Encountered by Fresh
Tomato Traders in Lagos State
205
Crystal Nwabuogo Aghadi , John Irungu Mburu and Mmatlou Kalaba
Analysis of Smallholder Beef Farmers’ Participation in Formal Markets in Ngaka Modiri
Molema District, North West Province, South Afrıca
206
Bongani Lawrence Kwebulane and Thato Narjorie Moagi
Impact of Agribusiness Training Programmes on Youth Empowerment in Nigeria: The
Case of Fadama Guys Programme
207
Dolapo Folasade Adeyanju, John Mburu and Djana Mignouna
The Impact of R&D Incentives on R&D Output: A Panel Count Data Analysis 208
Ipek Akad and Cagacan Deger
Economic Outlook of Unmanned Aerial Vehicles in Turkey and the World:
‘’Drone Economies’’
209
Rustem Barış Yeşilay and Armağan Macit
Industry 4.0 and Turkey Awareness 215
Eren Kamber and Gülin İdil Sönmeztürk Bolatan
Actual Issues of Cooperative Property’s Transaction Analysis 226
Soloviov Andrii and Ushkarenko Iuliia
Political Awareness of Sustainable Development in Universities 233
Hasan Bilgehan Yavuz
Econometric Analysis of Gravity Model: The Case of Turkey African Countries 234
İbrahim Çütcü and Turgut Songur
Investigation of Online Hotel Reviews with Text Mining Techniques: The Case of
Bakü Hotels
246
Erkan Akgöz and Engin Tengilimoğlu
Assessment of the Credit Volume on the Axis of the CBRT's Interest Rate Decision 254
Nihat Doğanalp and Seyfettin Caner Kuzucu
v
The Relationship between Labor Force Participation and Employment: Sectoral Findings 260
Altan Aldan and H. Burcu Gürcihan Yüncüler
Economic Impacts of Airline Deregulation: An Evaluation for the E7 Country Group 262
Deniz Macit and Begüm Buse Özsavaner
Institutional Quality and International Tourism Revenues: Panel Causality Analysis in the
Case of Five Mediterranean Countries
274
Seymur Ağazade
The Quality of Human Capital in Ukraine: Corporate Training Aspect 284
Nataliya Tyukhtenko, Kateryna Syniakova and Viktoria Gavrenkova
The Impact of Fiscal Decentralization on Economic Growth in the Baltic Countries 291
Neringa Slavinskatie
Financial Development, Stability and Its Effect on Economic Growth: An Empirical
Analysis in the Context of South Asia
292
Souvik Banerjee
Demographic Challenges to National Pension Systems of Ukraine and Poland 293
Agnieszka Parlińska and Volodymyr Rudyk
vi
PREFACE
Economics is all about choices, under which conditions these choices are made and the
circumstances of these choices. Economics can be defined a few different ways such as; it’s the study
of scarcity, the allocation of scarce resources among the choices and the study of decision making. Since economics involves topics like finance, recession, banking and wealth, there is a misconception
that economics is being all about money and the stock market. However, economics is a much
comprehensive discipline that helps us understand yesterday’s trends, interpret today’s matters and
make a prediction for the future. Economic conditions are constantly changing, and each generation looks at its own problems in its
own way. Economic laws are a part of the material which Conscience and Common-sense have to turn
to account in solving practical problems, and in laying down rules which may be a guide for the lifetime. While the laws of economics remain broadly the same, there is still space and need for new
scientific developments in economics in order to evaluate and examine the current challenges. Even
the smallest developments in the global economy have important effects on social and business life and that the studies in the field of economics have become more important than ever. In order to
discuss recent developments on economic researches, we aimed to bring scientists, decision and policy
makers, entrepreneurs, investors, and postgraduate students from all around of the world.
The 3rd International Conference on Economic research, ECONALANYA 2019, was held on 24-25th October 2019 in Alanya, Turkey and includes presentations on macro and micro level economics.
The conference is organized by Alanya Alaaddin Keykubat University in order to bring together
researchers from all over the world. Participants from about 20 countries made the conference truly international in scope. While the topics presented at the conference varies, the key speeches topics of
the conference were chosen as monetary policy and global trading system.
The conference keynote speakers shared their views and academic researches on these topics. Prof.
Dr. Richard A. Werner from Oxford University, Dr. Marc Bacchetta from World Trade Organization (WTO) and Prof. Dr. Peter Neary from Oxford University were the keynote speakers of the conference
in the opening session. Prof. Dr. Richard A. Werner outlined the key empirical problems –
“anomalies” – in conventional economics in his speech titled “The Collapse of Conventional Economics and Ascent of the New Paradigm in Macroeconomics”. Moreover, he expressed that If
there are banking crises, according to conventional economics they should never have any real impact
on the economy. But there have been over 100 banking crises in the past 50 years; with devastating impact. Dr. Marc Bacchetta had a talk about the importance of trade on global economic development
in his speech titled “Making Trade More Inclusive: The Role of Domestic Policies and International
Cooperation”. He especially expressed that peaceful trading relations in turn contribute to growth and
development worldwide. Prof. Dr. Peter Neary talked about gravity and international trade as titled “Gravity without Apologies: The Science of Elasticities, Distance, and Trade”. He presented the
theory of gravity with recent empirical results, which also encourage the participants for further
researches. It is my wish that this conference that allows scientists, practitioners and independent researchers
outside universities to present their theoretical, analytical and experimental research will contribute to
the scientific literature and policy-makers’ decisions, and I would like to express my appreciation to all participants and keynote speakers for their significant contributions. Last but not least, I would like
to send my gratitude to Saliha Çelik, Bekir Çınar, Muhammet Necati Çelik, Kemal Sür, Egemen
Güneş Tükenmez and Nazlı Türker for their valuable assistance and co-operation. I would also like to
gratefully acknowledge the generous support from Rector of Alanya Alaaddin Keykubat University Prof. Dr. Ekrem Kalan, and I would like to extend my thanks to the head of ALTİD Burhan Sili.
Lastly, I would like to thank the Central Bank of the Republic of Turkey (CBRT) for their support and
sponsorship.
Harun UÇAK, PhD.
Chairman/Editor

vii
This page intentionally left blank
3rdInternational Conference on Economic Research
24-25th October 2019, Alanya, Turkey
1
CENTRAL BANK SEIGNIORAGE AND PROFITS
DURING THE CRISES OF 2007-2018
Zbigniew Polański
National Bank of Poland and SGH Warsaw School of Economics, Poland
Email: [email protected]
Mikołaj Szadkowski
National Bank of Poland and SGH Warsaw School of Economics, Poland
Abstract
What has been the relationship between seigniorage and central banks’ financial results in recent years? Seigniorage is typically the key source of central bank profit which is largely transferred to the
government; these payments show, however, considerable volatility, often creating political economy
problems.
In this paper we study the development of seigniorage of seven central banks in the context of their financial results and transfers made to the government during the period of 2003-18, with a special
emphasis on the crisis period (2007-14). The institutions considered are the central banks of the euro
area, Japan, Poland, Sweden, Switzerland, the United Kingdom and the United States. The novelty of the paper stems from the methodology applied to calculating seigniorage, which –
contrary to other academic attempts at measuring it – is based on a direct analysis of central banks’
annual financial statements, i.e. their balance sheets and profit and loss accounts (income statements).
We show that during the period studied seigniorage tended to diverge considerably with respect to central banks’ financial results and payments made to the government.
Three more detailed questions guided our research. First, how to define and measure seigniorage?
Second, what was the impact of the crisis on seigniorage as a source of central banks’ financial results and the following transfers to respective governments? Third, what has been the influence so far and
what are the challenges of the currently discussed issues of exit policies and the normalization
process? Concerning the first question we decided, contrary to many approaches, to adopt a cash-based
definition of seigniorage which states that seigniorage is the income on central bank’s assets against its
liabilities in the form of banknotes and coins (i.e. cash) in circulation net of expenses on their issue.
Two variants of seigniorage calculation are used: in the first, seigniorage is linked to interest income on central bank assets, in the second – to total income on assets.
Referring to the second question, our results show that for the period studied, seigniorage
understood as above (both variants) typically amounted to less than 0.5 per cent of current GDP, i.e. in line with earlier estimates of seigniorage in a low inflation (and interest rate) environment. Moreover,
throughout the crisis and the implementation of quantitative easing policies, central banks’ balance
sheets expansion was usually accompanied by a considerable, but declining, as a ratio of their balance sheets, increase in cash issuance. As a result, there was no above-average increase in seigniorage
(especially in the first variant of estimates). In the crisis period seigniorage was mainly affected by a
change in the return on central banks’ assets. However, financial results of many central banks during
(and after) the crisis increased considerably. Consequently, remittances to the state budget also increased, although they varied significantly due to different policies towards central bank profit
distribution.
Finally, as concerns the third question, we estimated that the Fed and the Eurosystem have been the most protected against recording negative interest income during the normalization processamong the
analyzed central banks conducting unconventional monetary policies.
Keywords: Seigniorage, Financial Result, Global Financial Crisis, Sovereign Debt Crisis, Exit
Policies.
3rd International Conference on Economic Research
24-25th October 2019, Alanya, Turkey
2
HOW THE ASIAN INFRASTRUCTURE INVESTMENT BANK CHALLENGES THE
WORLD BANK: A COMPARATIVE ANALYSIS OF PROJECTS BY THE AIIB AND
THE WORLD BANK IN GUJARAT, INDIA
Junhao Xu
New York University Abu Dhabi
Abstract
Since opening in January 2016, the Asian Infrastructure Investment Bank (AIIB) has grown to a
hundred members and fifty approved projects. As it enters the arena of multilateral development banks,
the AIIB challenges the traditional Bretton Woods institutions and signals the desire of China, its
largest shareholder, to gain more political and economic power. In a comparative study, I compared
the project and loan agreements of three particular projects undertaken in Gujarat, India: the World
Bank’s “Rural Roads Project (1987-1995),” the World Bank’s “Second Gujarat Highway Project
(2013-2020),” and the AIIB’s “Gujarat Rural Roads Project (2017-2019).” I found that the AIIB is
similar in structure to the World Bank but provides several improvements such as more detailed
economic and environmental analyses, customizable repayments, and lack of demands on economic
liberalization and deregulation. I also found that the World Bank has gradually improved its lending
terms and implemented significant reforms since the establishment of the AIIB, almost definitely to
respond to the new competition. This paper yields support from a microscopic level for claims from
existing literature that China will become a more relevant and prominent player in global economic
and political governance. Possible directions for future research include comparisons with other
multilateral development banks such as the Asian Development Bank and quantitative studies after the
AIIB’s projects have yielded empirical results.
Keywords:Asian Infrastructure Investment Bank, China, World Bank, Global Governance,
Multilateral Development Banks, India.
1. Introduction
In January 2016, the Asian Infrastructure Investment Bank (AIIB) opened its door for business in
Beijing. It aims to improve social and economic outcomes in Asia by “investing in sustainable
infrastructure and other productive sectors” and has grown to 100 members today (AIIB 2019b).As the
AIIB enters the arena of multilateral development banks (MDBs) long dominated by the Bretton
Woods institutions, its establishment signals the desire of China, the bank’s largest shareholder, to not
only participate in but also lead global political and economic governance.
There is no contention that the AIIB, along with other China-led initiatives such as the New
Development Bank (NDB) and the more amorphous Belt and Road Initiative, reflects a fundamental
change in global political and economic power. Howis the AIIB different from the more traditional
MDBs, particularly the World Bank?How has the World Bank responded to the establishment of the
AIIB?
Through a comparative study, I argue that the AIIB is similar in structure to the World Bank but
provides several improvements such as more detailed economic and environmental analyses and more
favorable terms, thereby qualifying itself as a challenger to the Bretton Woods institutions. In response
to the establishment of the AIIB, the World Bank has improved its terms and implemented reforms,
which it had hesitated to do previously.
This paper contributes to the understanding of the AIIB’s position in global economic and political
governance by carefully examining and comparing three projects in Gujarat. It also provides concrete
evidence of how the World Bank has responded to the new competition.
2. Literature Review
Scholars are split between two main schools of thought on the subject of the AIIB. Some contend
that the AIIB is similar to existing MDBs in structure and in essence, and thus provides no meaningful
How the Asian Infrastructure Investment…
3
addition to the realm of development banks. Shahar Hameiri and Lee Jones (2018) argue that there
exists “little substantive difference between the AIIB and existing MDBs” (592). Phillip Lipscy (2015)
writes that “the AIIB is highly unlikely to undermine existing aid organizations.” Ming Wan (2016)
observes that the bank is “nested to the World Bank and the Asian Development Bank (ADB), thus
firmly situated within the existing international financial order” (58).
The second view is more optimistic, maintaining that the AIIB challenges and even improves upon
existing MDBs. Helmut Reisen (2015) estimates that the NDB and AIIB together will “attract
sufficient co-financing to rival the established MDBs in terms of annual lending” (297).
MatthewStephen and David Skidmore (2019) see the AIIB as “China’s integration into global social
networks” (61) while Abdi Dahir (2018) asserts that the growing membership of the bank “challenges
the IMF-World Bank orthodoxy.” Zhao, Gou, and Li argue that the China-led development bank is
“probably more efficient and economically sustainable, which is an improvement on the traditional
MDBs” (267).
The two views are not completely mutually exclusive – it is plausible that the AIIB challenges the
more traditional MDBs while comparable in structure to them. There is general support for the claim
that developing countries have historically had to adopt some sort of Western model when accepting
aid from Western institutions (Li 2017, 202).The AIIB and the NDB could address this problem as less
constraining alternatives.
3. Analytical Framework
I examine the research questions through a comparative study. Most papers and articles on the
AIIB focus on the big picture by either analyzing the structural similarities and differences between
the AIIB and the other MDBs, or contemplating the future of global political and economic
governance. I attempt to focus on particular projects undertaken by the MDBs. By design, this study is
more qualitative than quantitative, partially because the newly-established AIIB lacks systematic
data.I therefore focus onthe project and loan agreements.
As economic theory suggests, a new entrant to an oligopolistic market tends to drive the price
down. In the context of MDBs, this could mean lower interest rates and less demanding
conditionalities.Hoping to contribute to theories about competition between MDBs, I also aim to
analyze the effect of the AIIB’s establishment on the changes in conditionalities of the World Bank
loans.
4. Research Design
I have selected three infrastructure projects in Gujarat, India as case studies. Specifically, I have
chosen the World Bank’s “Rural Roads Project – Gujarat (1987-1995)”, “Second Gujarat Highway
Project (2013-2020) and theAIIB’s “Gujarat Rural Roads Project (2017-2019).” I focus on the World
Bank out of the Bretton Woods institutions because the World Bank has similar objectives as the AIIB
whereas IMF is primarily concerned with “global monetary cooperation and financial stability” (IMF
2019).I chose India as the country of analysis because it has more AIIB projects than any other
country – as of October 22, 2019, twelve out of the forty-four country-specific projects are in India
(AIIB 2019a). The project should be representative of AIIB’s project portfolio, which focuses on
sustainable infrastructure sectors.
Since the projects relate to the same sector in the same state, we do not need to control the
usualvariables of concern such as geography and history. We cannot compare the results of these
projects, as two of the projects are still ongoing. We can, however, use project documents and reports
available on the two banks’ databases to analyze the structural differences such as implementation
arrangements and loan conditions. The differences between AIIB’s project and the World Bank’s
ongoing project should reflectbroader differences between the two banks today, while the discrepancy
between the two World Bank projects should show how the World Bank has evolved over the past
thirty years.
J. Xu
4
5. Case Studies
5.1 Case 1. Rural Roads Project – Gujarat, World Bank, 1987-1995
The World Bank’s two biggest units are the International Bank for Reconstruction and
Development (IBRD) and the International Development Association (IDA). The IDA is more
charitable: it collects donations from the richer countries and “gives the money to the world’s poorest
countries, in the form of zero-interest loans or outright grants that need not be repaid” (The
Economist). The IBRD borrowsmoney cheaply, at around the London Interbank Offered Rate
(LIBOR), on the international financial markets and then lends that money to other developing
countries at a premium.
The IDA funded US$119.6 million out of a total cost of US$170 million for the Rural Roads
Project, which sought to “provide all-weather roads to the rural poor and to improve rural road
construction and maintenance” in Gujarat (The World Bank 1987a). The state of Gujarat was
responsible for the execution, implementation, and procurement of the project. The World Bank
required that Gujarat employ consultants of the bank’s standards to assist with the project. Notably
absent from the Project Agreement are detailed economic, risk, and environmental analyses: it merely
specifies project objectives and logistical procedures.
The Project Agreement included provisions that often attract criticisms of the World Bank’s
operations (Head 1996; Sehrawat 2018). For instance, the procurement section required “International
Competitive Bidding,” where goods and services must be procured in accordance of the “Guidelines
for Procurement under IBRD Loans and IDA Credits” (The World Bank 1987b). This is one of the
conditions termed the “Washington Consensus,” a set of economic policies focusing on economic
liberalization and deregulation used by Washington, D.C.-based institutions, including the World
Bank (Sehrawat 2018, 12).
The Credit Agreement set forth an annual 0.50% commitment charge on the credit (equivalent to
IBRD’s and AIIB’s definitions of loan) not withdrawn and an annual 0.75% service fee on the
principal. Gujarat shall repay the loan in eighty semi-annual installments, each at the rate of 0.50%
from May 1997 to November 2006 and at the rate of 1.50% from May 2007 to November 2036 (The
World Bank 1987a).
The project was completed in December 1995, a year later than scheduled. The Implementation
Completion Report notes slow start to the project as a result of “inadequate funding [from Gujarat] and
poor management,” a critical component of the project “substantially behind schedule,” and
“construction quality problems reported by Bank supervision missions.”Specifically, economic
analyses were criticized as “often undertaken by engineering staff poorly trained in economic analysis”
or not conducted at all (The World Bank 1996).
5.2 Case 2. Second Gujarat State Highway Project, World Bank, 2013-2020 (expected)
In 1994, India graduated from IDA lending to IBRD lending. Therefore, we should expect to see
less favorable terms and conditions in this project than in the IDA project above. In 2013, the Second
Gujarat State Highway Project was approved to “improve capacity, and enhance quality and safety of
road services for the users of the core road network of state highways in Gujarat” (The World Bank
2019b).
The Project Agreement stipulates that the Gujarat Roads and Buildings Department (R&BD) shall
implement the project in accordance with such World Bank’s provisions as “Anti-Corruption
Guidelines.”(The World Bank 2014b, 4-6).R&BD shall also monitor and evaluate the progress of the
project and prepare reports for the World Bank (8-9). In contrast to the previous case, detailed cost-
benefit and technical analyseswere conducted before the Project Agreement was signed: there are
more than fifty documents on resettlement action plans and environmental assessments dated earlier
than the Agreement (The World Bank 2019b). By comparison, the Rural Roads Project had two (The
World Bank 2012).
The IBRD charges a 0.25% front-end fee on the loan amount, an annual commitment fee of 0.25%
on undisbursed balances, and a semi-annual interest based on a “Variable Spread,”meaning that the
Bank notifies the borrower of the specific interest rate every Interest Period (IBRD 2010; The World
How the Asian Infrastructure Investment…
5
Bank 2015).As of July 2019, the variable spread for this loan is LIBOR+0.79% (The World Bank
2019a). Each of 26 semi-annual principal repayments is to cover 3.85% of the principal except the last
one in December 2031, which covers 3.75% (The World Bank 2014a).
Conditions of the Washington Consensus are still present throughout the Project Agreement. The
Procurement section, for instance, still requires “International Competitive Bidding” and “Quality- and
Cost-based Selection” (The World Bank 2014a).
5.3 Case 3. Gujarat Rural Roads Project, AIIB, 2017-2019 (expected)
As of 2017, around 300,000 villages out of 825,000 villages did not have all-weather road access,
constraining economic activities in rural areas (AIIB 2016).This AIIB project aims to improve the
rural road connectivity to small villages in all the districts in Gujarat, benefitting about 8 million
people.
The local government is trusted with the implementation of the project: the project document writes
that the R&BD“has sufficient professional staff to plan, manage and control the project” (AIIB 2017b,
11). The AIIB supervises via a consulting firm.
The R&BD has overall accountability for maintaining the financial management system of the
project and for ensuring that activities are carried out in accordance with the project agreements
(13).As a matter of fact, the Project Agreement indicates that the R&BD has an existing Governance
and Accountability Action Plan with anti-corruption initiatives and a centralized e-procurement
system “that was prepared earlier for the WB-funded Second Gujarat State Highway Project” (17).
The loan has a maturity of 13 years including a 5-year grace period, with customized repayments at
the “Bank’s standard interest rate for Sovereign-backed loans” (10). Specifically, the Bank will charge
a one-time 0.25% front-end fee on the loan principal, a 0.25% commitment fee on undisbursed loan
balances, and a fixed lending spread of 0.75% to 6-month USD LIBOR on the loan principal (AIIB
2016).
Detailed project assessment, including cost-benefit analyses, was conducted. The report includes
five components: technical, economic and financial analysis, fiduciary and governance, environmental
and social, and risks and mitigation measures. Unlike the previous two projects, the Project Agreement
does not include provisions similar to those of the Washington Consensus.
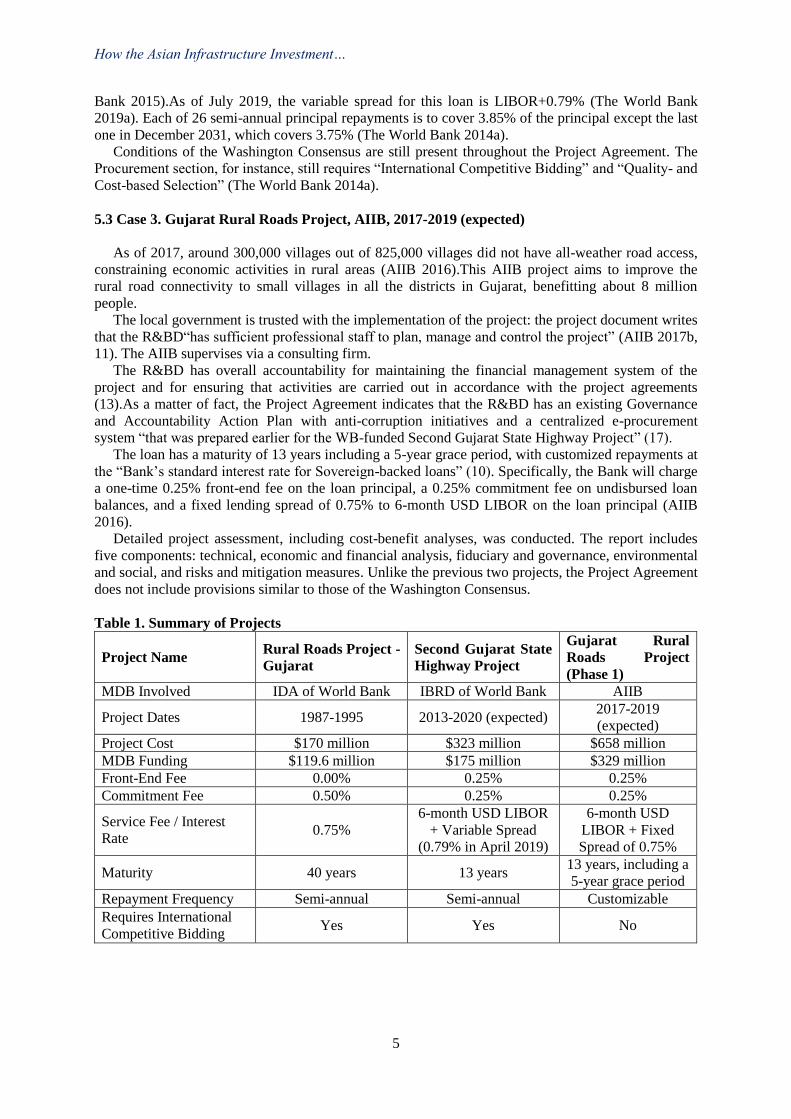
Table 1. Summary of Projects
Project Name Rural Roads Project -
Gujarat
Second Gujarat State
Highway Project
Gujarat Rural
Roads Project
(Phase 1)
MDB Involved IDA of World Bank IBRD of World Bank AIIB
Project Dates 1987-1995 2013-2020 (expected) 2017-2019
(expected)
Project Cost $170 million $323 million $658 million
MDB Funding $119.6 million $175 million $329 million
Front-End Fee 0.00% 0.25% 0.25%
Commitment Fee 0.50% 0.25% 0.25%
Service Fee / Interest
Rate 0.75%
6-month USD LIBOR
+ Variable Spread
(0.79% in April 2019)
6-month USD
LIBOR + Fixed
Spread of 0.75%
Maturity 40 years 13 years 13 years, including a
5-year grace period
Repayment Frequency Semi-annual Semi-annual Customizable
Requires International
Competitive Bidding Yes Yes No
J. Xu
6
6. Discussion
The case studies agree through a more microscopic perspective with existing literature that the
AIIB has “remarkably similar operating guidelines [as those of] the Bretton Woods framework”
(Liao).AIIB’s project agreement is indeed similar in structure to the World Bank’s agreements, but
includes more detailed technical, economic, risk, and environmental analyses.
Comparing the two World Bank projects, we observe that the commitment fee has decreased. The
IBRD project charges a higher interest rate than the IDA project, but this is due to thedifferent
functions of the two units. The second project includes significantly more analyses and provisions,
likely drawing from the lessons of the previous projects. Both projects, however, entail demands of
economic liberalization and deregulation that are not present in AIIB’s project agreement.
Comparing the two ongoing projects, we notice that the IBRD and the AIIB use the same lending
structure of charging a premium over the 6-month USD LIBOR as the interest rate, but the AIIB
project uses a fixed spread while the World Bank project uses a variable spread.If a new IBRD project
in Gujarat with the same maturity as the AIIB project were to use the method of fixed spreads, it
would face an interest rate of LIBOR+0.65%, 0.10% lower than the AIIB counterpart. This is not a
coincidence: the IBRD decreased its fixed spread over LIBORfor a loan to India with a maturity of up
to eight yearsfrom 0.75% in July 2017to 0.70% in October 2017 and later to 0.65% in January 2019,
almost definitely to respond to competition by newly-established MDBs such as the AIIB and the
NDB (IBRD 2017a; IBRD 2017b; IBRD 2019a; The World Bank 2017). Another distinction between
the two projects was that the World Bank required semi-annual repayments, while the AIIB allowed
customized repayments.
In July 2018, the IBRD adopted new loan pricing measures that differentiate the members based on
factors such as national income (IBRD 2018; The World Bank 2018a). India belongs to Group A,
which receives the most preferential treatment within the IBRD. This explains why the World Bank
offers a lower interest rate than the AIIB for a fixed spread loan to India. The AIIB, by contrast, does
not distinguish among its borrowers. That is to say, Turkey, which is in IBRD’s Group C, might
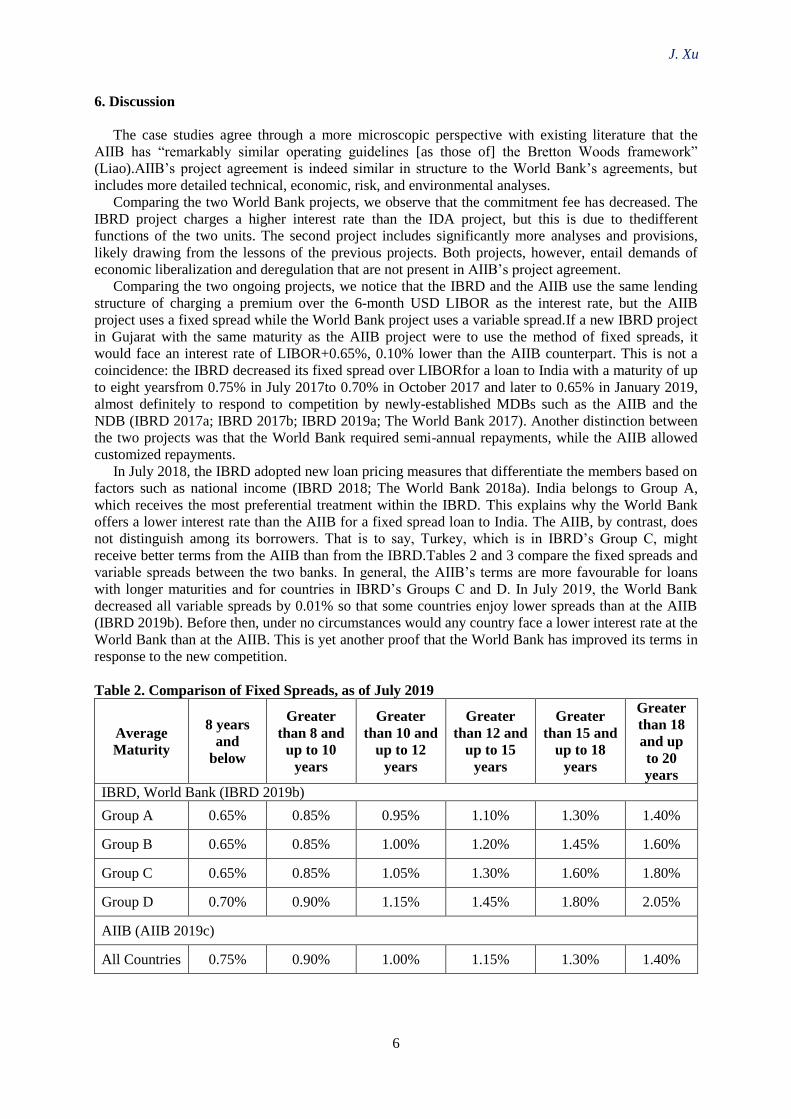
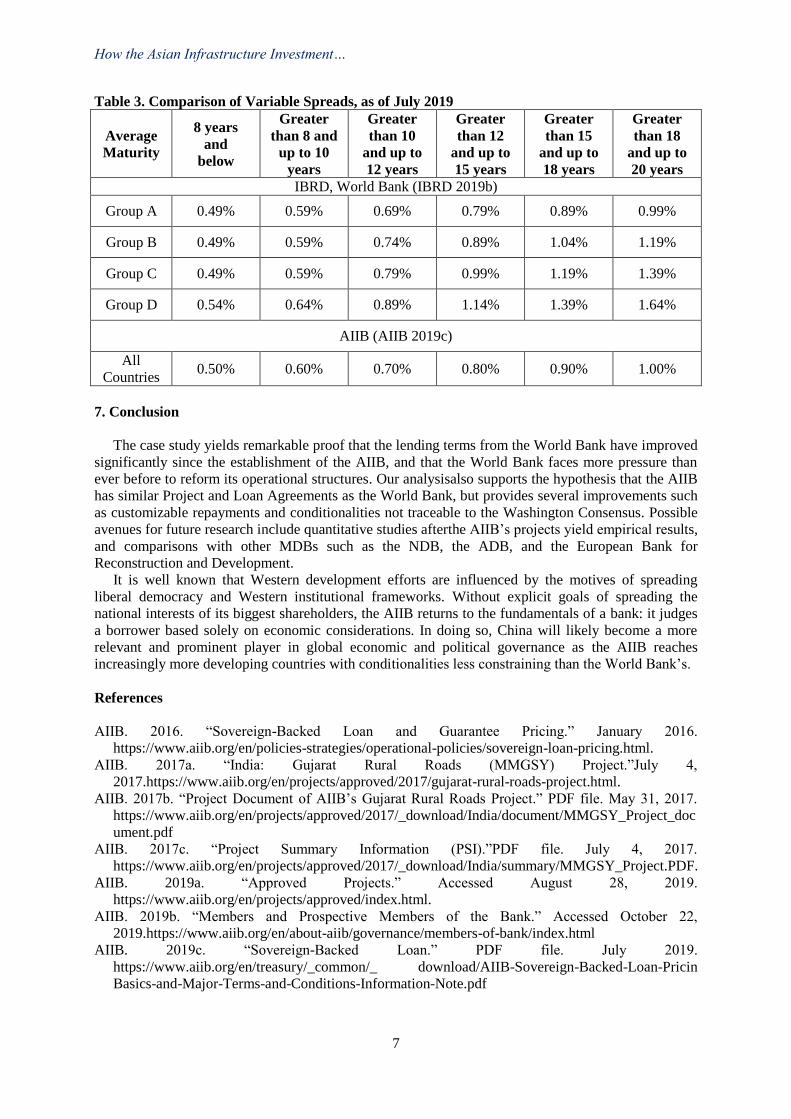
receive better terms from the AIIB than from the IBRD.Tables 2 and 3 compare the fixed spreads and
variable spreads between the two banks. In general, the AIIB’s terms are more favourable for loans
with longer maturities and for countries in IBRD’s Groups C and D. In July 2019, the World Bank
decreased all variable spreads by 0.01% so that some countries enjoy lower spreads than at the AIIB
(IBRD 2019b). Before then, under no circumstances would any country face a lower interest rate at the
World Bank than at the AIIB. This is yet another proof that the World Bank has improved its terms in
response to the new competition.
Table 2. Comparison of Fixed Spreads, as of July 2019
Average
Maturity
8 years
and
below
Greater
than 8 and
up to 10
years
Greater
than 10 and
up to 12
years
Greater
than 12 and
up to 15
years
Greater
than 15 and
up to 18
years
Greater
than 18
and up
to 20
years
IBRD, World Bank (IBRD 2019b)
Group A 0.65% 0.85% 0.95% 1.10% 1.30% 1.40%
Group B 0.65% 0.85% 1.00% 1.20% 1.45% 1.60%
Group C 0.65% 0.85% 1.05% 1.30% 1.60% 1.80%
Group D 0.70% 0.90% 1.15% 1.45% 1.80% 2.05%
AIIB (AIIB 2019c)
All Countries 0.75% 0.90% 1.00% 1.15% 1.30% 1.40%
How the Asian Infrastructure Investment…
7
Table 3. Comparison of Variable Spreads, as of July 2019
Average
Maturity
8 years
and
below
Greater
than 8 and
up to 10
years
Greater
than 10
and up to
12 years
Greater
than 12
and up to
15 years
Greater
than 15
and up to
18 years
Greater
than 18
and up to
20 years
IBRD, World Bank (IBRD 2019b)
Group A 0.49% 0.59% 0.69% 0.79% 0.89% 0.99%
Group B 0.49% 0.59% 0.74% 0.89% 1.04% 1.19%
Group C 0.49% 0.59% 0.79% 0.99% 1.19% 1.39%
Group D 0.54% 0.64% 0.89% 1.14% 1.39% 1.64%
AIIB (AIIB 2019c)
All
Countries 0.50% 0.60% 0.70% 0.80% 0.90% 1.00%
7. Conclusion
The case study yields remarkable proof that the lending terms from the World Bank have improved
significantly since the establishment of the AIIB, and that the World Bank faces more pressure than
ever before to reform its operational structures. Our analysisalso supports the hypothesis that the AIIB
has similar Project and Loan Agreements as the World Bank, but provides several improvements such
as customizable repayments and conditionalities not traceable to the Washington Consensus. Possible
avenues for future research include quantitative studies afterthe AIIB’s projects yield empirical results,
and comparisons with other MDBs such as the NDB, the ADB, and the European Bank for
Reconstruction and Development.
It is well known that Western development efforts are influenced by the motives of spreading
liberal democracy and Western institutional frameworks. Without explicit goals of spreading the
national interests of its biggest shareholders, the AIIB returns to the fundamentals of a bank: it judges
a borrower based solely on economic considerations. In doing so, China will likely become a more
relevant and prominent player in global economic and political governance as the AIIB reaches
increasingly more developing countries with conditionalities less constraining than the World Bank’s.
References
AIIB. 2016. “Sovereign-Backed Loan and Guarantee Pricing.” January 2016.
https://www.aiib.org/en/policies-strategies/operational-policies/sovereign-loan-pricing.html.
AIIB. 2017a. “India: Gujarat Rural Roads (MMGSY) Project.”July 4,
2017.https://www.aiib.org/en/projects/approved/2017/gujarat-rural-roads-project.html.
AIIB. 2017b. “Project Document of AIIB’s Gujarat Rural Roads Project.” PDF file. May 31, 2017.
https://www.aiib.org/en/projects/approved/2017/_download/India/document/MMGSY_Project_doc
ument.pdf
AIIB. 2017c. “Project Summary Information (PSI).”PDF file. July 4, 2017.
https://www.aiib.org/en/projects/approved/2017/_download/India/summary/MMGSY_Project.PDF.
AIIB. 2019a. “Approved Projects.” Accessed August 28, 2019.
https://www.aiib.org/en/projects/approved/index.html.
AIIB. 2019b. “Members and Prospective Members of the Bank.” Accessed October 22,
2019.https://www.aiib.org/en/about-aiib/governance/members-of-bank/index.html
AIIB. 2019c. “Sovereign-Backed Loan.” PDF file. July 2019.
https://www.aiib.org/en/treasury/_common/_ download/AIIB-Sovereign-Backed-Loan-Pricin
Basics-and-Major-Terms-and-Conditions-Information-Note.pdf
J. Xu
8
Dahir, Abdi Latif. 2018. “The Growing Membership of a China-led Development Bank Challenges the
IMF-World Bank Orthodoxy.” Quartz Africa. May 09, 2018. https://qz.com/africa/1273424/kenya-
joins-china-led-asian-infrastructure-investment-bank-aiib/.
The Economist. 2019. “How Does the World Bank Work?” April 09, 2019.
https://www.economist.com/the-economist-explains/2019/04/09/how-does-the-world-bank-work.
Hameiri, Shahar, and Lee Jones. 2018.“China Challenges Global Governance? Chinese International
Development Finance and the AIIB.” International Affairs94, no. 3 (May 01, 2018): 573-93.
doi:10.1093/ia/iiy026.
Head, John W. 1996.“Evolution of the Governing Law for Loan Agreements of the World Bank and
Other Multilateral Development Banks.” The American Journal of International Law90, no. 2
(April 1996): 214-34. doi:10.2307/2203684.
IBRD. 2010. “General Conditions for Loans (July 31, 2010).”PDF file. July 31, 2010.
http://siteresources.worldbank.org/INTLAWJUSTICE/Resources/IBRD_GC_English_10.pdf.
IBRD. 2017a. “IBRD Lending Rates and Spreads Applicable on or after July 1, 2017.”July 14, 2017.
http://documents.worldbank.org/curated/en/355401500651690935/
IBRD-Lending-Rates-and-Spreads-applicable-as-of-July-1-2017.
IBRD. 2017b. “IBRD Lending Rates and Spreads Applicable on or after October 1, 2017.”October 20,
2017. http://documents.worldbank.org/curated/en/391571509389477942/
IBRD-lending-rates-and-spreads-applicable-on-or-after-October-1-2017.
IBRD. 2018. “IBRD Lending Rates and Spreads Applicable on or after October 1, 2018.”October 25,
2018. http://documents.worldbank.org/curated/en/597691541437526075/
IBRD-Lending-Rates-and-Spreads-Applicable-on-or-after-October-1-2018.
IBRD. 2019a. “IBRD Lending Rates and Spreads Applicable on or after January 1, 2019.”January 24,
2019. http://documents.worldbank.org/curated/en/572821548694411686/
IBRD-Lending-Rates-and-Spreads-Applicable-on-or-after-January-1-2019.
IBRD. 2019b. “IBRD Lending Rates and Spreads Applicable on or after July 1, 2019.”July 19,
2019.http://documents.worldbank.org/curated/en/183591564434692752/
IBRD-Lending-Rates-and-Spreads-Applicable-on-or-after-July-1-2019.pdf
IMF. 2019. “About the IMF.” Accessed May 15, 2019. https://www.imf.org/en/About.
Li, Xiaojun. 2017.“Does Conditionality Still Work? China’s Development Assistance and Democracy
in Africa.” Chinese Political Science Review, no. 2 (February 03, 2017): 201-20.
doi:10.1007/s41111-017-0050-6.
Liao, Rebecca. 2015.“Out of the Bretton Woods.” Foreign Affairs. July 28,
2015.https://www.foreignaffairs.com/articles/asia/2015-07-27/out-bretton-woods.
Lipscy, Phillip Y. 2015. “Who’s Afraid of the AIIB.” Foreign Affairs. May 08, 2015.
https://www.foreignaffairs.com/articles/china/2015-05-07/whos-afraid-aiib.
Reisen, Helmut. 2015.“Will the AIIB and the NDB Help Reform Multilateral Development Banking?”
Global Policy6, no. 3 (July 14, 2015): 297-304. doi:10.1111/1758-5899.12250.
Sehrawat, Vivek. 2018. “Reforming the World Bank to Transform India.” Law Review Rev. 3. Feb 1,
2018.
Stephen, Matthew D., and David Skidmore. 2019. “The AIIB in the Liberal International Order.”The
Chinese Journal of International Politics12, no. 1 February 26, 2019): 61-91.
doi:10.1093/cjip/poy021.
Wan, Ming. 2016. The Asian Infrastructure Investment Bank: The Construction of Power and the
Struggle for the East Asian International Order. New York: Palgrave Macmillan, 2016.
The World Bank. 1987a. “Development Credit Agreement (Gujarat Rural Roads Project).”PDF file.
February 17, 1987. http://documents.worldbank.org/curated/en/676001468249914763/pdf/Credit-
1757-India-Gujarat-Rural-Roads-Project-Credit-Agreement.pdf.
The World Bank. 1987b. “Project Agreement (Gujarat Rural Roads Project).” PDF file.February 17,
1987. http://documents.worldbank.org/curated/en/628401468249915109/pdf/Credit-1757-India-
Gujarat-Rural-Roads-Project-Project-Agreement.pdf.
The World Bank. 1996. “Implementation Completion Report (Gujarat Rural Roads Project).”PDF file.
November 8, 1996. http://documents.worldbank.org/curated/en/341271468258259223/pdf/multi-
page.pdf.
How the Asian Infrastructure Investment…
9
The World Bank. 2012. “Rural Roads Project – Gujarat.”April 3, 2012.
http://projects.worldbank.org/P009855/rural-roads-project gujarat? lang=en & tab= documents
&sub Tab = project Documents.
The World Bank. 2014a. “Loan Agreement (Second Gujarat State Highway Project - GSHP-II).”PDF
file. February 12, 2014. http://documents.worldbank.org/curated/en/ 779451468257642987/
pdf/RAD856851764.pdf.
The World Bank. 2014b. “Project Agreement (Second Gujarat State Highway Project).” PDF file.
February 12, 2014. http://documents.worldbank.org/curated/en/ 687591468253215954/
pdf/RAD1283266847.pdf.
The World Bank. 2015. “IBRD Flexible Loan: Major Terms and Conditions.”PDF file. January 2015.
http://pubdocs.worldbank.org/en/682711507314955892/product-note-ibrd-flexible-loan-english-20
1709.pdf.
The World Bank. 2017. “Decrease in Fixed Spread for IBRD Flexible Loans.”July 26, 2017.
https://www.worldbank.org/en/news/press-release/2017/07/26/decrease-in-fixed-spread-for-ibrd-
flexible-loans.
The World Bank. 2018a. “Changes in IBRD Loan Pricing Effective July 1, 2018.” July 13, 2018.
http://www.worldbank.org/en/news/press-release/2018/07/13/changes-in-ibrd-loan-pricingeffective
-july-1-2018.
The World Bank. 2019a. “Lending Rates & Fees.” July 1, 2019.
http://treasury.worldbank.org/en/about/unit/treasury/ibrd-financial-products/lending-rates-and-fees
#1.
The World Bank. 2019b. “Second Gujarat State Highway Project.” July 1, 2019. http://projects.
worldbank.org/P114827/gujarat-state-highway-project-ii?lang=en&tab=overview.
Zhao, Jianzhi, Yannan Gou, and Wanying Li. 2018. “A New Model of Multilateral Development Bank:
A Comparative Study of Road Projects by the AIIB and ADB.” Journal of Chinese Political
Science, November 07, 2018. doi:10.1007/s11366-018-9580-5.
3rdInternational Conference on Economic Research
24-25th October 2019, Alanya, Turkey
10
THE EFFECT OF DOMESTIC RISKS ON ECONOMIC RISK IN NORTHERN AFRICAN
COUNTRIES: FINDINGS FROM FIRST AND SECOND GENERATION PANEL
APPROACHES
Melike Torun
Istanbul UniversityCerrahpasa, Department of Business Administration, Turkey
Email: [email protected]
Dervis Kirikkaleli
European University of Lefke, Department of Banking and Finance, Turkey
Abstract
This study aims to shed some light on the effect of financial risk, political risk and Arab Spring on
economic risk in the Northern African countries, namely Algeria, Egypt, Libya, Morocco and Tunisia
while controlling global vulnerability. In this study, we used first and second generation panel based
models, including PedroniCointegration, WesterlundCointegration, FMOLS, DOLS, DCCEMG. In
this study, we used quarterly datasets covering the period of 1997Q2 to 2015Q2 from the PRS Group.
Our empirical findings reveal that (i) there is cointegration equation between economic risk and
financial risk, political risk, global risk and Arab spring; (ii) financial and political stabilities
positively effects economic stability; (iii) Arab spring negatively affected economic stability in the
Northern African countries.
Keywords: Northern African Countries, Economic Stability, Financial Stability, Political Stability,
Panel Dynamic CCEMG.
3rdInternational Conference on Economic Research
24-25th October 2019, Alanya, Turkey
11
ECONOMIC ANALYSIS OF ARTISANAL FISH MARKETING ENTERPRISE IN
DEGEMA REGION OF RIVERS STATE, NIGERIA
Ikechi Kelechi Agbugba
Rivers State University, Department of Agricultural and Applied Economics, Nigeria
Mzuyanda Christian
North-West University, Department of Agricultural Economics & Extension, South Africa
Email: [email protected]
Abstract
The study economically analyzed the marketing of artisanal fish enterprise in Degema Local Government Area (LGA) of Rivers State, Nigeria. The study further described the socio-economic
features of the artisanal fish marketers, determined the cost and returns analysis of the fish marketers
and identified the constraints militating against the fish marketers in the study area. Four communities
(Degema, Bakana, Tombia and Ke) in the LGAs formed the area of the study. Purposive and random sampling techniques were adopted for the study. The study established that a very high percentage of
the respondents (68.3%) fall between the ages of 26 and 45. Almost half of the respondents (47.5%)
have no formal education. Distribution of respondents by occupation showed that only 34.2% are full time fishermen with greater majority of them alternating fishing with other livelihood activities such
as crop farming (57.5%) civil service/teaching (5.8%) and hunting (2.5%). Over 55% of the
respondents have household size of between 6 and 15 people. Most of the respondents have more than
15 years of fishing experience. On fishing practices by the respondents, the study showed that majority of the fishermen, (55%) use both nets, hooks and traps in fishing. Only 7.5% of the respondents have
access to credit facilities in the study area while only 14.17% have access to fishery extension
services. The cost and return analysis of the fishing enterprise show that the enterprise is profitable with a positive Net Farm Income (NFI) of ₦18, 413.68) and a benefit cost ratio of 1.39. Regression
results show that the output of artisanal fishing households is positively associated with all the
variables. There is no significant relationship between the socio-economic characteristics of the artisanal fishers and their returns reinstating as there is significant relationship between socio-
economic characteristics of artisanal fishers and the returns to the fishers. This study also identified
several constraints militating against the full exploitation of natural fishing sites. These constraints
range from technological to economic constraints. Technological constraints include: inability to construct/fix nets and traps, inability to manoeuvre/handle gears effectively, lack of modern storage
facilities, and absence of processing facilities; while some economic constraints are: high cost of
fishing gears, lack of credit facilities, low income as a result of poor catch and high cost of processing/storage facilities. These constraints negatively affects fishery livelihood due to reduced
income and profit. Findings indicate that artisanal fishing experience appears to be an important
human capital incentive for increasing fishing productivity, and further revealed that most respondents have no access to credit facilities to enable them procure fishing crafts and gears whose prices have
gone beyond the reach of an average fisherman.
Keywords: Marketing, Fish, Fishers, Fishing, Enterprise, Nigeria.
1.Introduction
Artisanal fishing is a major source of livelihood for those residing in riverine communities (Ladu, Sogbesan and Tafida, 2013). According to Raji, Okaema, Omorinkoba and Bwala (2012), they are
sometimes referred to as small-scale fisheries. These are traditional fisheries involving fishing
households, using relatively small amount of capital and energy, small fishing vessels (if any), making
short fishing trips, close to shore, and are mainly for local consumption (Amos and Linus, 2017). Artisanal fisheries can be subsistence or commercial fisheries, providing for local consumption or
export (Offor, Ibeagwa, and Ikemefuna, 2016). Previous studies revealed that fishing is an economic
Economic Analysis of Artisanal Fish …
12
activity which requires capital investment which is characterized by the use of dug-out, wooden
canoes that are often not motorized, operated by individual or small groups using labour intensive
gears of relatively low level of productivity (Agbugba, 2018). In general, artisanal capture fisheries, which are low capital, low operational costs and limited gear
coverage, characterize fishing activities in Nigeria (Fregeneet al., 2003). It may not be capital
intensive at the level of artisanal fishermen in the north because subsistence practices characterize the artisanal fisheries as also observed in Lagos and Rivers States by Adesehinwa and Bolorunduro
(2007). Fishing inputs commonly used include canoe, paddles, hooks, gill nets, cast nets, beach
seining and drift nets. However, there are costs component associated with fishing and the disposal of the catch. This is true as fishermen are engaged in marketing and distribution of their daily catch (fresh
fish) in addition to fishing (Laduet al., 2013).
The marketing activities carried out by fishermen include transportation of catch via various means
(use of canoe, donkey, bicycle, motor cycle, among others) from the waterside to various markets for on-ward selling, preservation for reduction of post-harvest losses of the highly perishable commodity.
Regardless of the fact that the fishers do not incur production costs, they also employ labour in
capturing or harvesting of fish from the natural water bodies thereby incurring costs in their daily struggle to dispose the highly perishable commodity (Ekundayo, Sogbesan and Haruna, 2014). The
fisheries sector is crucial to food security and poverty alleviation. In 2008, it was documented that the
world consumed 115 million tonnes of fish, and demand is expected to rise. Fish and fishery products are a vital and affordable source of food and high-quality protein. Fish as food is said to supply over 3
billion people with at least 15% of their annual protein intake thereby contributing about 17 kg
weights per person (FAO, 2010). According to de Silver (2011), supply of fish and fish products come
from domestic products as well as from imports. Other sources of local production include artisanal fisheries. The domestic sources of fish and its products are from the lakes, onshore coastal, brackish
water and offshore and contribute about 90% of the total domestic production while the remaining
percentage come from fish culture (Ezihe, Agbugba and Ogbeba, 2014). According to Ogbeba (2009), fish marketing involves the various activities that direct the flow of
fish whether fresh or processed from landing to the consumers. Some functions of marketing include:
collection of fish, transportation to the market centres, pricing, buying and utilization. It is pertinent to
note that marketing of fish shows that capture fisheries activities provides employment to many residents of the state (Reheim and Sutinem, 2006). However, due to the predominance of diverse fish
species such as Tilapia, Barakuda, Sharks, to mention a few, in the study area, the study dwelt on them
(Ezihe, 2013). Nigerians are high consumers of fish. Current demand for fish is estimated at 1.55 million tonnes.
Domestic fish production was 511,000 mt in 2002. Fish importation was 560,000 mt for 30,000 billion
(US 400 m) in 2002. It is therefore pertinent to note that World Bank estimates fish importation at 560,000 to 700,000 mt/year in Africa.
Nigeria is the largest importer of fish in Africa annually. Nigeria can substitute fish imports with
domestic production to create jobs and reduce poverty in rural areas where 70% of the population lives
(FAO, 2005). Lack of bargaining power is mostly due to the highly perishable nature of fish as a commodity and the gluts experienced at certain periods. In such instances, the fisherman is forced to
sell at a price resulting in low net returns or net margin or profit (Department of the Treasury, 2017).
Over the years, the operational mode of artisanal fisheries has experienced little or no change with the fisher folks still employing rudimentary techniques and gears for several decades (Obasi, 2015).
However, Nigeria has about 14 million hectares of inland marine waters which are poorly exploited.
Aquaculture potential could produce more than 2 million tonnes of fish annually. In order to bridge the gap between wild catch and the demand for fish in Benue state, a study on the economic assessment of
fish marketing has become very important.
Marketing is of high importance to fish, thus before we think of production, we must first of all
think of an available market for it (Kohls &Uhl, 1980). They further stated that, the difficulty with the global food situation appears to be not how big a pie we can bake but how to cut and share the pieces.
Agricultural production and fish marketing must develop hand in hand because they are partners in a
progressive system (Falodun, 2011). An efficient market is bound to foster the goals of economic development, namely increased real income and income redistribution.
I. K. Agbugba and M. Christian
13
From the foregoing, there are various channels through which fresh or processed fish must pass
before reaching the final consumers in time and in their desired form. The prices of fish changes as it
passes through the middlemen so that by the time it gets to the consumers it becomes quite expensive resulting in its unaffordability, as well as its unavailability to the average buyers. According to Lawal
(2002), much work has been done on the economics of fish farming, its profitability and technical
efficiency.
1.1 Objectives of the Study
The broad objective of the study is to examine the market analysis of artisanal fish enterprise in
Degema Local Government Area (LGA) of Rivers State. Specifically, the study:
(i) Described the socio-economic features of the artisanal fish marketers; (ii) Determined the cost
and returns analysis of the artisanal fish marketers; (iii) Identify the constraints militating against artisanal fish marketing.
2. Materials and Methods
The study was carried out in Degema Local Government Area in Rivers State of Nigeria with a
landmass of 2342sq km and population 920,208 (NPC, 2007). The local government has approximately
12km out of Nigeria’s 800km coast-line. This expanse of coast-line places the local government at
highly advantaged position to the waterways and the abundant wealth underneath it. According to
Udong (2010), such aquatic wealth included large stock of crayfish, bongafish, tilapia, shark, croakers, catfish, sole, sardine, snapper, mackerel, tuna, mudfish, shiny nose, shrimp, lobster and shell fishes.
The local government lies between latitudes 40 321 and 50 331 North and longitudes 70 251 and 80
251 East of the Equator, and is bounded in the North-West by Abonnema, on the south by Bonny. Degema has Tombia, Bakana, Kuma, Ke, Bille, Harry’s Town, Usokun just to mention, but few.
Purposive and random sampling techniques was adopted in selecting the respondents for the study.
Firstly, a purposive sampling procedure was adopted in selecting four (4) communities (Degema,
Tombia, Bakana and Ke) from the study area, due to the flow of Sombiroro River, a major river flowing to the fishing communities, chosen. Secondly, simple random sampling technique was chosen
in selecting 18 fish marketers (i.e. 9 wholesalers and 9 retailers) from each of the communities already
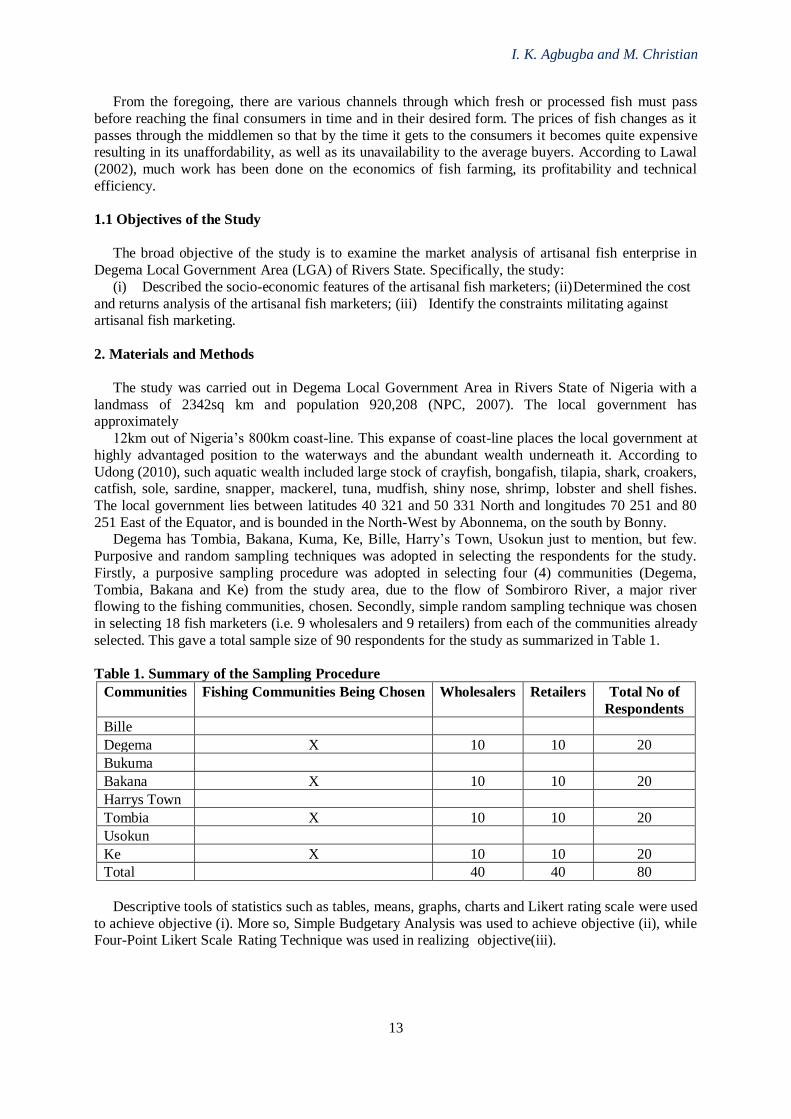
selected. This gave a total sample size of 90 respondents for the study as summarized in Table 1.
Table 1. Summary of the Sampling Procedure
Communities Fishing Communities Being Chosen Wholesalers Retailers Total No of
Respondents
Bille
Degema X 10 10 20
Bukuma
Bakana X 10 10 20
Harrys Town
Tombia X 10 10 20
Usokun
Ke X 10 10 20
Total 40 40 80
Descriptive tools of statistics such as tables, means, graphs, charts and Likert rating scale were used
to achieve objective (i). More so, Simple Budgetary Analysis was used to achieve objective (ii), while Four-Point Likert Scale Rating Technique was used in realizing objective(iii).
Economic Analysis of Artisanal Fish …
14
2.1 Simple Budgetary Analysis
Simple Budgetary analysis was used in analysing costs and returns analysis especially in fish marketing (Suleiman, 2007). The budgetarymodel is given by:
NR = P - (ΣX1….n) ………………………………………………………………………….........(1)
Where: NR = Net return from marketing of fresh fish
X1= Local government revenue (₦)
X2 = Transport charges (₦) X3 = Commission paid to selling agents (₦)
X4 = Packaging or repackaging cost (₦)
X5 = Labour cost for catching fish (₦)
X6= Depreciation on fishing gears (per day) (₦) P = Selling price of unit quantity of fresh fish (measured in small metal basin of 15kg.
2.2 Likert Rating Scale
The Likert scale was developed in 1932 by Rensis Likert. It is used extensively for attitude
measurements (Uzoagulu, 2011). It works by presenting a set of statements about an issue and requesting respondents to indicate whether they strongly agree, agree, are undecided, disagree, or
strongly disagree. These various responses are assigned values, and the total value is calculated
through the summation of the values. This total value represents the respondent’s rating of a particular
issue, and could be in favour or against the issue depending on the cut-off mark. The cut-off mark also depends on whether the rating is on a five-point scale or four-point scale. The cut-off is usually 3.0 if
the rating is on a five-point scale and 2.5 if on a four-point scale. The four-point scale will be used as
it does not give room for the respondents to be indifferent. The rating will be in this order: strongly agree (SA) = 4, agree (A) = 3, disagree (D) = 2, and strongly disagree (SD) = 1. The mean score of the
respondents based on the 4- point scale will be 4 + 3 + 2 + 1 = 10, 10/4 = 2.50. Using the interval scale
of 0.05, the upper limit cut-off point will be 2.50 + 0.05 = 2.55. The lower limit will be 2.50 – 0.05 =
2.45. Based on these, any mean score below 2.45 (i.e. MS < 2.45) will be regarded as not important.
Those between 2.45 and 2.55 will be considered as important (i.e. 2.45 < MS < 2.55). Mean score
greater than 2.55 (MS > 2.55) will however be considered very important.
3. Results and Discussion
3.1 Socio-Economic Characteristics of the Respondents
These characteristics include the background information, which are inherent attributes of the
fisherman or which are acquired as he grows (Agbugba, 2018). The socio-economic variables considered in this section include; age, household size, use of credit and extension services, fishing
experience, educational status, major and minor occupations of respondents, transport means to fishing
sites, number of fishing gears used and constraints associated with artisanal fishing.
3.1.1 Age of the Respondents
The frequency distribution of respondents according to age is shown in Table 3.1. The age
distribution of the respondents showed that most of the fishermen fall between 26 and 45 years of age.
This group accounted for 68.3% of the total respondents. This was followed by the age group of
between 46 and 65 years with 26.7% of total respondents. The least in the age distribution structure is the age group of more than 65years. This group accounted for 5% of the total respondents. The result
implies that fishing activities are dominated by people in the more active age brackets. This is
consistent with other fisheries studies such as Eziheet al. (2013) and Ekine and Binaebi (2018).
I. K. Agbugba and M. Christian
15
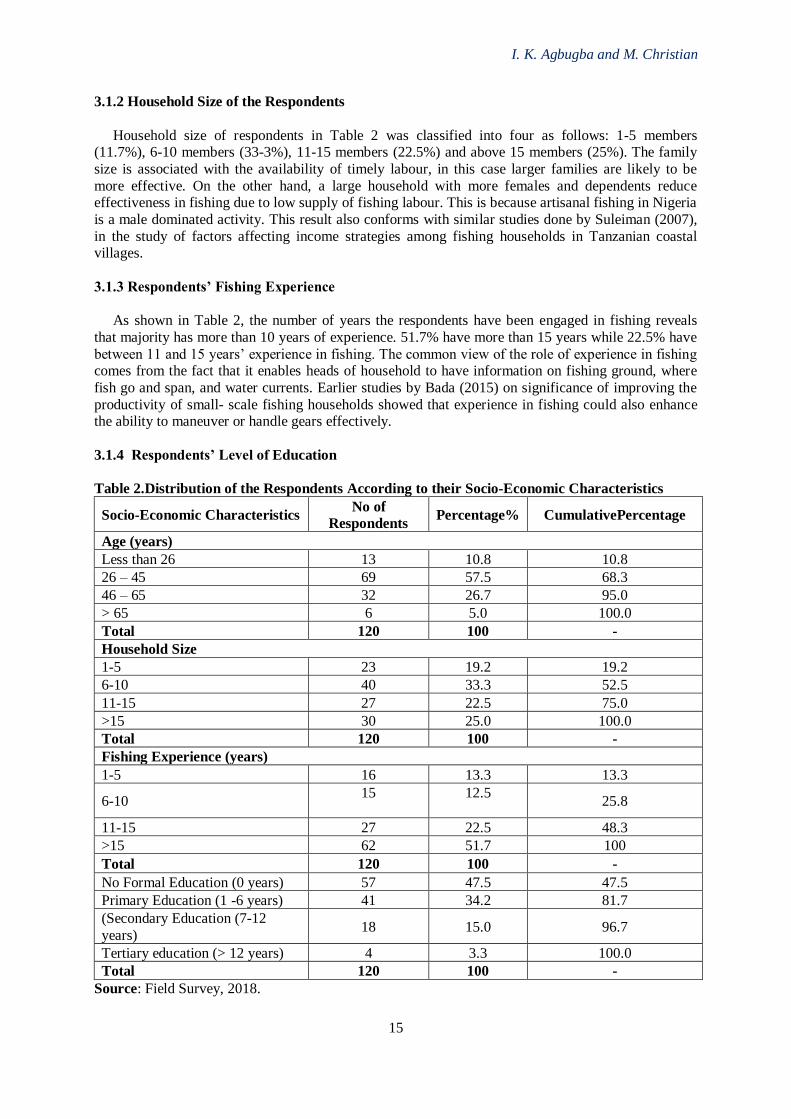
3.1.2 Household Size of the Respondents
Household size of respondents in Table 2 was classified into four as follows: 1-5 members (11.7%), 6-10 members (33-3%), 11-15 members (22.5%) and above 15 members (25%). The family
size is associated with the availability of timely labour, in this case larger families are likely to be
more effective. On the other hand, a large household with more females and dependents reduce effectiveness in fishing due to low supply of fishing labour. This is because artisanal fishing in Nigeria
is a male dominated activity. This result also conforms with similar studies done by Suleiman (2007),
in the study of factors affecting income strategies among fishing households in Tanzanian coastal villages.
3.1.3 Respondents’ Fishing Experience
As shown in Table 2, the number of years the respondents have been engaged in fishing reveals
that majority has more than 10 years of experience. 51.7% have more than 15 years while 22.5% have
between 11 and 15 years’ experience in fishing. The common view of the role of experience in fishing comes from the fact that it enables heads of household to have information on fishing ground, where
fish go and span, and water currents. Earlier studies by Bada (2015) on significance of improving the
productivity of small- scale fishing households showed that experience in fishing could also enhance the ability to maneuver or handle gears effectively.
3.1.4 Respondents’ Level of Education
Table 2.Distribution of the Respondents According to their Socio-Economic Characteristics
Socio-Economic Characteristics No of
Respondents Percentage% CumulativePercentage
Age (years)
Less than 26 13 10.8 10.8
26 – 45 69 57.5 68.3
46 – 65 32 26.7 95.0
> 65 6 5.0 100.0
Total 120 100 -
Household Size
1-5 23 19.2 19.2
6-10 40 33.3 52.5
11-15 27 22.5 75.0
>15 30 25.0 100.0
Total 120 100 -
Fishing Experience (years)
1-5 16 13.3 13.3
6-10 15
12.5
25.8
11-15 27 22.5 48.3
>15 62 51.7 100
Total 120 100 -
No Formal Education (0 years) 57 47.5 47.5
Primary Education (1 -6 years) 41 34.2 81.7
(Secondary Education (7-12
years) 18 15.0 96.7
Tertiary education (> 12 years) 4 3.3 100.0
Total 120 100 -
Source: Field Survey, 2018.
Economic Analysis of Artisanal Fish …
16
As shown in Table 3, 47.5 percent of the respondents have no formal education, 34.2 percent have
primary education or spent between 1- 6 years in school. 15 percent have secondary education or have
spent between 7-12 years in school. 33 percent of the respondents have tertiary training with more than 12 years in school.
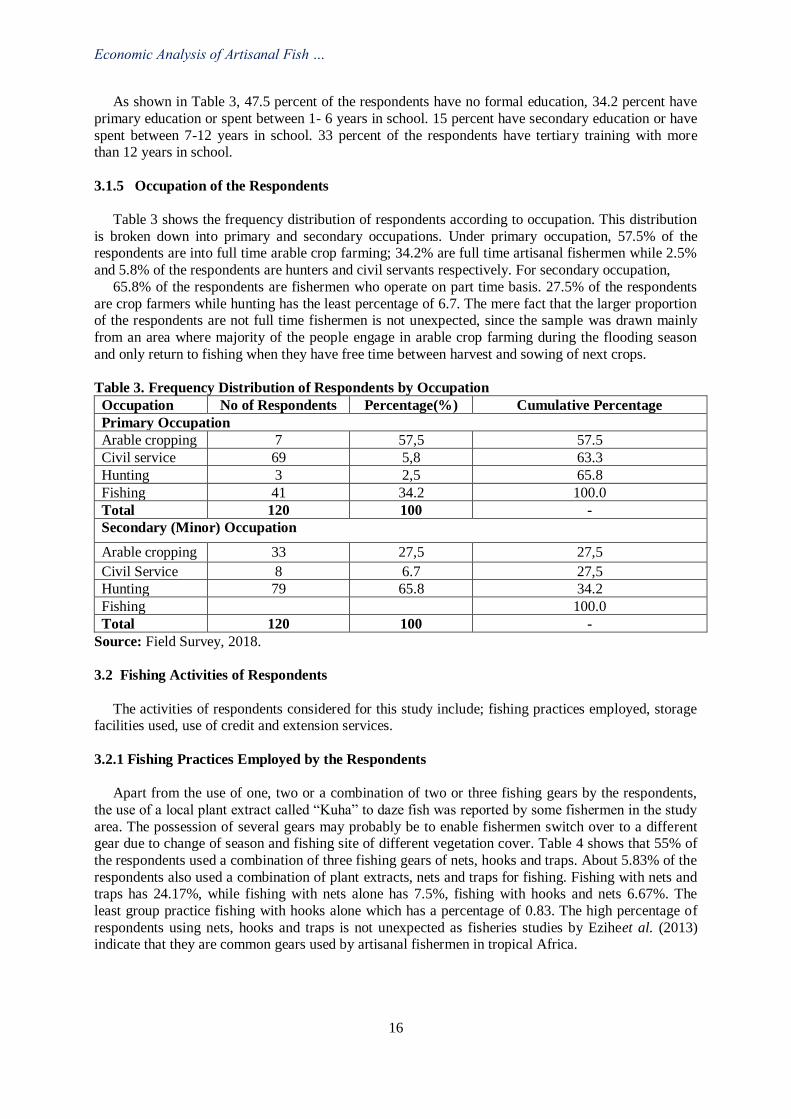
3.1.5 Occupation of the Respondents
Table 3 shows the frequency distribution of respondents according to occupation. This distribution
is broken down into primary and secondary occupations. Under primary occupation, 57.5% of the respondents are into full time arable crop farming; 34.2% are full time artisanal fishermen while 2.5%
and 5.8% of the respondents are hunters and civil servants respectively. For secondary occupation,
65.8% of the respondents are fishermen who operate on part time basis. 27.5% of the respondents
are crop farmers while hunting has the least percentage of 6.7. The mere fact that the larger proportion of the respondents are not full time fishermen is not unexpected, since the sample was drawn mainly
from an area where majority of the people engage in arable crop farming during the flooding season
and only return to fishing when they have free time between harvest and sowing of next crops.
Table 3. Frequency Distribution of Respondents by Occupation
Occupation No of Respondents Percentage(%) Cumulative Percentage
Primary Occupation
Arable cropping 7 57,5 57.5
Civil service 69 5,8 63.3
Hunting 3 2,5 65.8
Fishing 41 34.2 100.0
Total 120 100 -
Secondary (Minor) Occupation
Arable cropping 33 27,5 27,5
Civil Service 8 6.7 27,5
Hunting 79 65.8 34.2
Fishing
100.0
Total 120 100 -
Source: Field Survey, 2018.
3.2 Fishing Activities of Respondents
The activities of respondents considered for this study include; fishing practices employed, storage facilities used, use of credit and extension services.
3.2.1 Fishing Practices Employed by the Respondents
Apart from the use of one, two or a combination of two or three fishing gears by the respondents,
the use of a local plant extract called “Kuha” to daze fish was reported by some fishermen in the study
area. The possession of several gears may probably be to enable fishermen switch over to a different gear due to change of season and fishing site of different vegetation cover. Table 4 shows that 55% of
the respondents used a combination of three fishing gears of nets, hooks and traps. About 5.83% of the
respondents also used a combination of plant extracts, nets and traps for fishing. Fishing with nets and traps has 24.17%, while fishing with nets alone has 7.5%, fishing with hooks and nets 6.67%. The
least group practice fishing with hooks alone which has a percentage of 0.83. The high percentage of
respondents using nets, hooks and traps is not unexpected as fisheries studies by Eziheet al. (2013) indicate that they are common gears used by artisanal fishermen in tropical Africa.
I. K. Agbugba and M. Christian
17
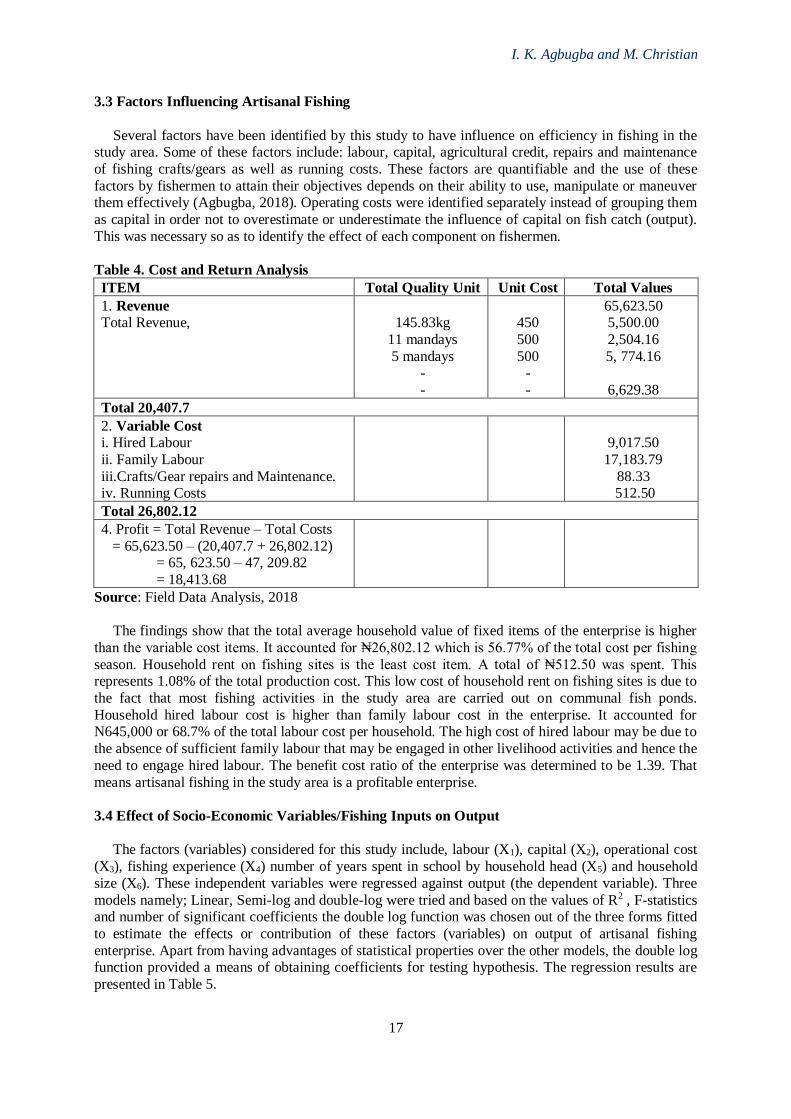
3.3 Factors Influencing Artisanal Fishing
Several factors have been identified by this study to have influence on efficiency in fishing in the study area. Some of these factors include: labour, capital, agricultural credit, repairs and maintenance
of fishing crafts/gears as well as running costs. These factors are quantifiable and the use of these
factors by fishermen to attain their objectives depends on their ability to use, manipulate or maneuver them effectively (Agbugba, 2018). Operating costs were identified separately instead of grouping them
as capital in order not to overestimate or underestimate the influence of capital on fish catch (output).
This was necessary so as to identify the effect of each component on fishermen.
Table 4. Cost and Return Analysis
ITEM Total Quality Unit Unit Cost Total Values
1. Revenue Total Revenue,
145.83kg
11 mandays
5 mandays -
-
450
500
500 -
-
65,623.50 5,500.00
2,504.16
5, 774.16
6,629.38
Total 20,407.7
2. Variable Cost i. Hired Labour
ii. Family Labour
iii.Crafts/Gear repairs and Maintenance. iv. Running Costs
9,017.50
17,183.79
88.33 512.50
Total 26,802.12
4. Profit = Total Revenue – Total Costs
= 65,623.50 – (20,407.7 + 26,802.12) = 65, 623.50 – 47, 209.82
= 18,413.68
Source: Field Data Analysis, 2018
The findings show that the total average household value of fixed items of the enterprise is higher
than the variable cost items. It accounted for ₦26,802.12 which is 56.77% of the total cost per fishing
season. Household rent on fishing sites is the least cost item. A total of ₦512.50 was spent. This represents 1.08% of the total production cost. This low cost of household rent on fishing sites is due to
the fact that most fishing activities in the study area are carried out on communal fish ponds.
Household hired labour cost is higher than family labour cost in the enterprise. It accounted for N645,000 or 68.7% of the total labour cost per household. The high cost of hired labour may be due to
the absence of sufficient family labour that may be engaged in other livelihood activities and hence the
need to engage hired labour. The benefit cost ratio of the enterprise was determined to be 1.39. That
means artisanal fishing in the study area is a profitable enterprise.
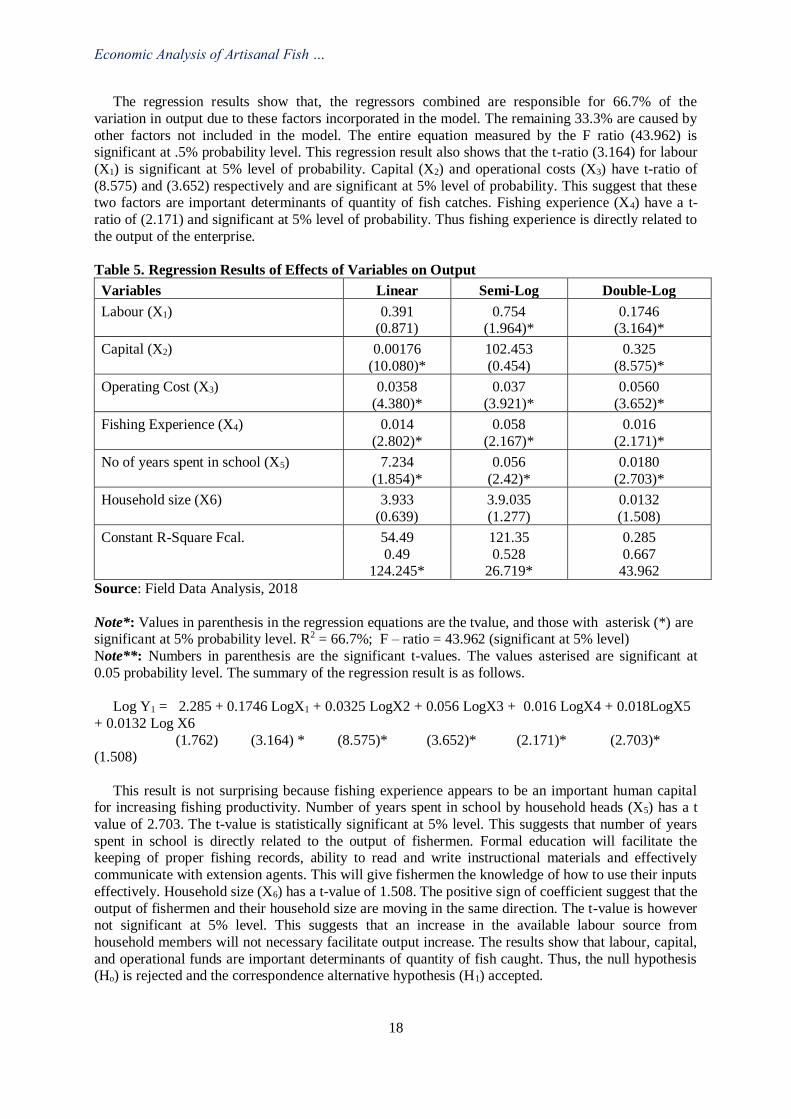
3.4 Effect of Socio-Economic Variables/Fishing Inputs on Output
The factors (variables) considered for this study include, labour (X1), capital (X2), operational cost
(X3), fishing experience (X4) number of years spent in school by household head (X5) and household
size (X6). These independent variables were regressed against output (the dependent variable). Three
models namely; Linear, Semi-log and double-log were tried and based on the values of R2 , F-statistics and number of significant coefficients the double log function was chosen out of the three forms fitted
to estimate the effects or contribution of these factors (variables) on output of artisanal fishing
enterprise. Apart from having advantages of statistical properties over the other models, the double log function provided a means of obtaining coefficients for testing hypothesis. The regression results are
presented in Table 5.
Economic Analysis of Artisanal Fish …
18
The regression results show that, the regressors combined are responsible for 66.7% of the
variation in output due to these factors incorporated in the model. The remaining 33.3% are caused by
other factors not included in the model. The entire equation measured by the F ratio (43.962) is significant at .5% probability level. This regression result also shows that the t-ratio (3.164) for labour
(X1) is significant at 5% level of probability. Capital (X2) and operational costs (X3) have t-ratio of
(8.575) and (3.652) respectively and are significant at 5% level of probability. This suggest that these two factors are important determinants of quantity of fish catches. Fishing experience (X4) have a t-
ratio of (2.171) and significant at 5% level of probability. Thus fishing experience is directly related to
the output of the enterprise.
Table 5. Regression Results of Effects of Variables on Output
Variables Linear Semi-Log Double-Log
Labour (X1) 0.391 (0.871)
0.754 (1.964)*
0.1746 (3.164)*
Capital (X2) 0.00176
(10.080)*
102.453
(0.454)
0.325
(8.575)*
Operating Cost (X3) 0.0358
(4.380)*
0.037
(3.921)*
0.0560
(3.652)*
Fishing Experience (X4) 0.014
(2.802)*
0.058
(2.167)*
0.016
(2.171)*
No of years spent in school (X5) 7.234
(1.854)*
0.056
(2.42)*
0.0180
(2.703)*
Household size (X6) 3.933
(0.639)
3.9.035
(1.277)
0.0132
(1.508)
Constant R-Square Fcal. 54.49
0.49 124.245*
121.35
0.528 26.719*
0.285
0.667 43.962
Source: Field Data Analysis, 2018
Note*: Values in parenthesis in the regression equations are the tvalue, and those with asterisk (*) are significant at 5% probability level. R2 = 66.7%; F – ratio = 43.962 (significant at 5% level)
Note**: Numbers in parenthesis are the significant t-values. The values asterised are significant at
0.05 probability level. The summary of the regression result is as follows.
Log Y1 = 2.285 + 0.1746 LogX1 + 0.0325 LogX2 + 0.056 LogX3 + 0.016 LogX4 + 0.018LogX5
+ 0.0132 Log X6
(1.762) (3.164) * (8.575)* (3.652)* (2.171)* (2.703)* (1.508)
This result is not surprising because fishing experience appears to be an important human capital for increasing fishing productivity. Number of years spent in school by household heads (X5) has a t
value of 2.703. The t-value is statistically significant at 5% level. This suggests that number of years
spent in school is directly related to the output of fishermen. Formal education will facilitate the keeping of proper fishing records, ability to read and write instructional materials and effectively
communicate with extension agents. This will give fishermen the knowledge of how to use their inputs
effectively. Household size (X6) has a t-value of 1.508. The positive sign of coefficient suggest that the
output of fishermen and their household size are moving in the same direction. The t-value is however not significant at 5% level. This suggests that an increase in the available labour source from
household members will not necessary facilitate output increase. The results show that labour, capital,
and operational funds are important determinants of quantity of fish caught. Thus, the null hypothesis (Ho) is rejected and the correspondence alternative hypothesis (H1) accepted.
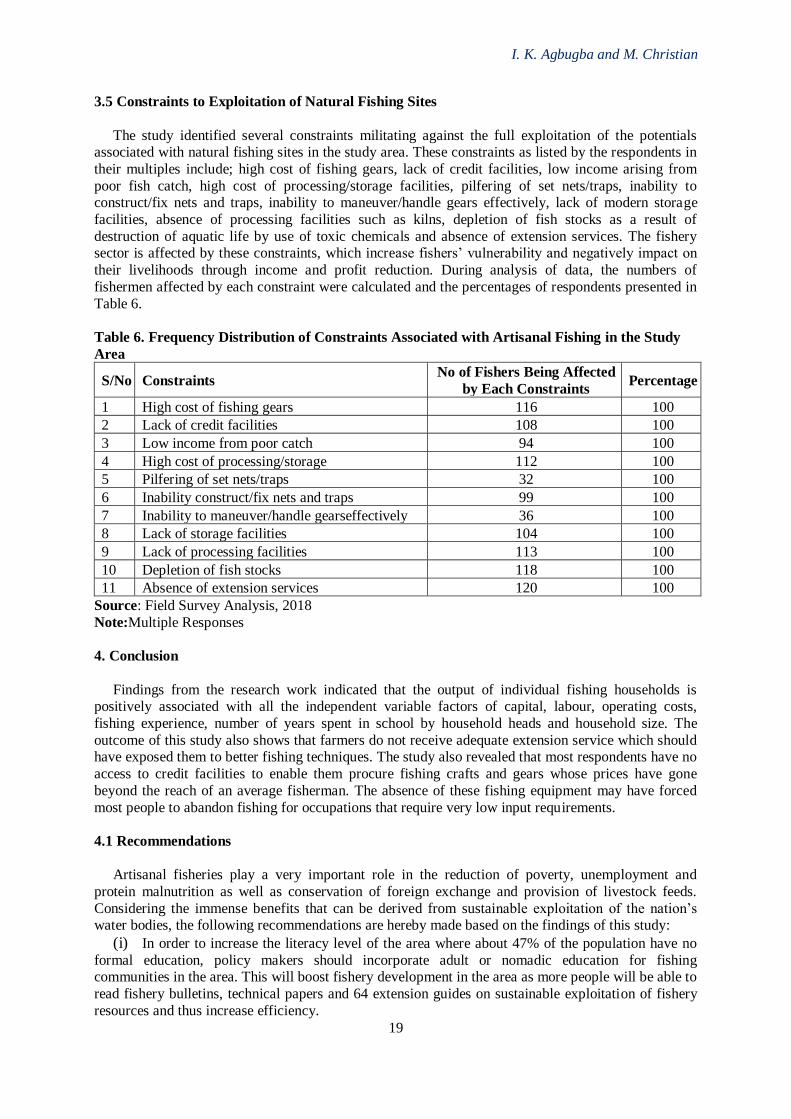
I. K. Agbugba and M. Christian
19
3.5 Constraints to Exploitation of Natural Fishing Sites
The study identified several constraints militating against the full exploitation of the potentials associated with natural fishing sites in the study area. These constraints as listed by the respondents in
their multiples include; high cost of fishing gears, lack of credit facilities, low income arising from
poor fish catch, high cost of processing/storage facilities, pilfering of set nets/traps, inability to construct/fix nets and traps, inability to maneuver/handle gears effectively, lack of modern storage
facilities, absence of processing facilities such as kilns, depletion of fish stocks as a result of
destruction of aquatic life by use of toxic chemicals and absence of extension services. The fishery sector is affected by these constraints, which increase fishers’ vulnerability and negatively impact on
their livelihoods through income and profit reduction. During analysis of data, the numbers of
fishermen affected by each constraint were calculated and the percentages of respondents presented in
Table 6.
Table 6. Frequency Distribution of Constraints Associated with Artisanal Fishing in the Study
Area
S/No Constraints No of Fishers Being Affected
by Each Constraints Percentage
1 High cost of fishing gears 116 100
2 Lack of credit facilities 108 100
3 Low income from poor catch 94 100
4 High cost of processing/storage 112 100
5 Pilfering of set nets/traps 32 100
6 Inability construct/fix nets and traps 99 100
7 Inability to maneuver/handle gearseffectively 36 100
8 Lack of storage facilities 104 100
9 Lack of processing facilities 113 100
10 Depletion of fish stocks 118 100
11 Absence of extension services 120 100
Source: Field Survey Analysis, 2018
Note:Multiple Responses
4. Conclusion
Findings from the research work indicated that the output of individual fishing households is positively associated with all the independent variable factors of capital, labour, operating costs,
fishing experience, number of years spent in school by household heads and household size. The
outcome of this study also shows that farmers do not receive adequate extension service which should have exposed them to better fishing techniques. The study also revealed that most respondents have no
access to credit facilities to enable them procure fishing crafts and gears whose prices have gone
beyond the reach of an average fisherman. The absence of these fishing equipment may have forced
most people to abandon fishing for occupations that require very low input requirements.
4.1 Recommendations
Artisanal fisheries play a very important role in the reduction of poverty, unemployment and
protein malnutrition as well as conservation of foreign exchange and provision of livestock feeds.
Considering the immense benefits that can be derived from sustainable exploitation of the nation’s water bodies, the following recommendations are hereby made based on the findings of this study:
(i) In order to increase the literacy level of the area where about 47% of the population have no
formal education, policy makers should incorporate adult or nomadic education for fishing communities in the area. This will boost fishery development in the area as more people will be able to
read fishery bulletins, technical papers and 64 extension guides on sustainable exploitation of fishery
resources and thus increase efficiency.
Economic Analysis of Artisanal Fish …
20
(ii) Financial institutions should grant more credit facilities to practicing fishermen. Collaterals for
accessing such credit should be made easy by allowing prominent traditional rulers and religious leaders to act as guarantors for securing such loans.
(iii) Results from the study indicate that artisanal fishing is viable and profitable enterprise capable
of providing employment opportunities in the rural communities. Government organs responsible for fishery development should promote the development of both artisanal and aquaculture so as to meet
the fish demand supply deficit in Nigeria. This will generate supplementary income, diversification of
livelihood activities and generation of employment opportunities as many people will return to full
time fishing as against the current practice where most fishing activities occur within few months of between January to May every year. Off season production will be put in place for continued supply of
fish.
(iv) In order to increase family labour supply and probably the level of education of the fishing communities, there is need to provide more infrastructural facilities such as schools in these remote
fishing communities so as to reduce the rural-urban migration which adversely affected the labour
supply in the area. (viii) Government should provide subsidy or fishing gears to cushion off the effect of high cost of
fishing crafts and gears as one of the factors militating against effective exploitation of fishing
resources in the country.
References
Abbot, J.C. & J.P. Makeham (1980). Agricultural economics and marketing in the tropics. Longman Group Ltd, London.
Abohweyere, P.O, Anyanwu, A.O., Jim-Saiki, L.O., Abiola, T.A, Williams, A.B., Esenwane, G.N.,
Adeogun, O.A., Gbolafun, A. &Aroriode, R.O. (2011). Fishers and fisheries: Issues of sustainable Resources Exploitation. A case study of Bonny Area in Nigeria. Nigeria Journal of Fisheries, 8 (1),
9-14.
Adegeye, A. J. &Dittoh, J.S. (1985). Essentials of agricultural economics. Impact Publishers, Ibadan. Afolabi, J. A. (2009). An assessment of garri marketing in South-Western Nigeria. Journal of Social
Science, 21(1), 33-38.
Agbugba, I.K. (2018). Smallholder Fresh Fish Marketing Enterprise: A Veritable Livelihood
Strategy for Economic Empowerment in sub-Saharan Africa, AGROTECHNOLOGY:Proceedings of the International Conference on Agriculture, Food and Aqua, 7, 23.
Ajala, M.K. &Adesehinwa, A.O.K. (2007). Roles and Efficiency of Participants in Pig Marketing in
the Northern Part of Nigeria, Journal of Central Europe Agriculture, (8)2, 311-326. Akankali, J.A & Jamabo, N.A. (2011). A review of some factors militating against sustainable
artisanal fisheries development in Niger Delta, Nigeria. Asian Journal of Agricultural Sciences,
3(5), 369-377.
Alam, F., Salauddin, P., Idris A. M. & Dey, M. M. (2012) Marketing of Major Fish Species in Bangladesh: A Value Chain Analysis, A report submitted to Food and Agriculture Organization for
the project entitled A Value-chain Analysis of International Fish Trade and Food Security with an
Impact Assessment of the Small-scale Sector. Alhaji, T.H., Jim-Saiki, L.O., Giwa, J.E., Adedeji, A.K. & Obasi, E.U. (2015). Infrastructure
constraints in Artisanal Fish Production in the Coastal Area of Ondo State, Nigeria. International
Journal of Research in Humanities and Social Studies, 2(5), 22-29. American Marketing Association (2015). The 2015 AMA Gold Top 50 Report, Marketing News,
Chicago, Illinois, USA.
Amos, S.O. & Linus, B.G. (2017). Fish Biodiversity and Fishing Activities at NjoboliyoLake,
Adamawa State, Nigeria Journal of Fisheries and Livestock Production, 5 (2), 1-6. Bada, A.S. (2015). Strategic for bridging the supply-demand gap in Fish production in Nigeria, A
Proceeding of the 19th Annual Conference of the Farm Management Association of Nigeria, 329-
333.
I. K. Agbugba and M. Christian
21
Ekine, D. I. &Binaebi, E. (2018). Structure and Performance of Fresh Fish Marketing in Yenagoa
Local Government Area of Bayelsa State. IOSR Journal of Agriculture and Veterinary Science.
11(6), 63-68. Boateng, V.F., Amfo, B., Abubakari, A & Yeboah, O.B. (2016). Do marketing margins determine
local leafy vegetables marketing in the Tamale Metropolis? African Journal of Business
Management, 10(5), 98-108. Bolorunduro, P. I. (2004) Post Harvest Loss Assessment and Adoption of Disseminated Technologies
in the Artisanal Fisheries of Northern Nigeria, Unpublished Ph.D Thesis. Department of Wildlife
and Fisheries Management, University of Ibadan, Oyo State. Bureau, D. (2012). Fish nutrition-an overview. By the Fish nutrition research laboratory group.
Retrieved from: http://www.malawicichlidhomepage.com/aquainfo/nutrition.htmlon 18th
February, 2012.
Daramola, J.A., Fasakin, E.A. &Adepurasi, E.O. (2007). Changes in physicochemical and sensory characteristics of smoke-dried fish species stored at ambient temperature. African Journal of Food
Agriculture, Nutrition and Development, 7(6), 1-14.
Department of the Treasury (2017). Farmer's Tax Guide For use in preparing 2017 Returns, Internal Revenue Service, Publication 225, Cat. No. 11049L.
Eastin, R.V. & Arbogast, G.L. (2011). Demand and Supply Analysis: Introduction, CFA Institute,
USA. Echebiri, R. N. &Mejeha, R.O. (2004). An Analysis of the Conduct and Efficiency of Garri Market in
Umuahia Area of Abia State, Nigeria. Journal of the Science of Agriculture, Food Technology and
the Environment, 4(4), 85-91.
Edward, A. & A. J. Madugu, (2011). Marketing and distribution channel of processed fish in Adamawa State, Nigeria. Global Journal of Management and Business Research, 11(4), 21-26.
Ekundayo, T.M., Sogbesan, O.A. & Haruna, A.B. (2014). Study of Fish Exploitation Pattern of Lake
Geriyo, Yola. Adamawa State, Nigeria, Journal of Survey in Fisheries Sciences, 1, 18-29. Eze, C. C., Lemchi, J.I., Ugochukwu, A.I., Eze, A.C., Awulonu, C.A.O. &Okon, A.X. (2010).
Agricultural Financing Policies and Rural Development. A Paper presented at the 84th Annual
Conference of the Agricultural Economics Society, 3.
Eze, S. O., A. N. Ezeh&Onwubuya, E.A. (2010). Women marketers’ perceived constraints on selected agricultural produce marketing in Enugu South Local Government Area: challenges of extension
training for women groups in Enugu State, Nigeria. Agro-science Journal of Tropical Agriculture,
Food, Environment and Extension, 9(3), 215- 222. Ezihe, J.A.C. (2013). Economics of Sustainable Catfish production in Benue state Nigeria,
Unpublished PhD Thesis in the Department of Agricultural Economics, University of Nigeria,
Nsukka, Nigeria. Fagbenro O.A. (2005). Evaluation of Cotton seed cake as fish feed and pond fertilizer in the
production of non-cichild fishes, Journal of Applied Fisheries and Hydrobiology, 3, 9-14.
Ezihe, J.A.C., Agbugba, I.K. &Ogbeba, J.E. (2014). Marketing channels and margin analysis of Fish
in Makurdi Local Government Area of Benue State, Nigeria, Pacesetter Journal of Agricultural Science Research, 2(6), 64-70.
FAO (1998). Guidelines for the Routine Collection of Capture Fishery Data, Prepared at the FAO
/DANIDA expert consultation Bangkok, Thailand, 122, ftp://ftp.fao.org/docrep/fao/003/x2465e/ x2465e00.pdf
FAO (2005). Aquaculture Development and research in sub Saharan Africa. Food and agriculture
organization. Retrieved from: http://www.FAOdocuments.Repository.htm on 16/08/2013. FAO (2006). Fisheries Management in the Federal Republic of Nigeria. www.fao.org/fi/fep/ en/NGA/
body. Retrieved on 18th August, 2013.
FAO (2007). Production, accessibility, marketing and consumption patterns of freshwater aquaculture
products in Asia: a cross-country comparison (Available at http//www. fao.org/fishery/aquaculture).
FAO (2010). State of the world’s fisheries and aquaculture report. Retrieved from: http://www.fao.org/
docrep/013/i1820e/i1820e.pdf on 30/06/2014. Falodun, O. M. (2011). Analysis of marketing channels and efficiency of marketing system for
smoked
Economic Analysis of Artisanal Fish …
22
Fish market in Ogun State, Nigeria, B. Agric Degree Project, Department of Aquaculture and
Fisheries Management, College of Environmental Resources Management, University of
Agriculture, Abeokuta, Ogun State Nigeria. Fregene, B.T. (2002).Poverty Assessment in Fishing Communities in Lagos State, Nigeria,
Unpublished Ph.D. Thesis Department of Wildlife and Fisheries Management, Department of
Wildlife and Fisheries Management, University of Ibadan, Oyo State. Fregene, B.T., Nokoe, K.S. & A.E. Falaye (2003) Canonical Analysis of the Role of Fishing Inputs on
Poverty Alleviation Among Marine Fisher Folks in Lagos State, Nigeria, Proceedings of the
Eighth Scientific Conference of the Sub-Saharan Africa Network (SUSAN) of the International Biometric Society (IBS), Biometry in Poverty Alleviation Programmes held at the University of
KwaZulu-Natal Pietermaritzburg Campus, South Africa, 7-11 July 2003, In: Njuho, P.M.
&Mwambi, H.G. (eds.), 172-180.
Hunt, S.D. (1976). The Nature and Scope of Marketing, Journal of Marketing, 40(3), 17-28. Kainga, E. & Adeyemo, A.O. (2012). Socioeconomics characteristics of fish marketers in Yenagoa
Local Government Area of Bayelsa State, Nigeria. World Journal Young Researchers, 2(1), 22-31.
Ladu, B.M.B., Sogbesan, A.O. &Tafida, A.A. (2013) Fisheries and Fishing Enterprises in the Hadejia Jama’arekamadugu, Yobe Basin Nigeria: A Technical report Submitted to Hadejia,
Jama’areKamaduguYobe Basin Trust Fund, 58.
Layade, A.A., Badmus, M.A. &Ibe, R.B. (2017). Marketing Analysis of Fresh Okra,InternationalJournal of Vegetable Science, 23(2), 75-79.
Madugu, A. L. & Edward, A. (2011) Marketing and distribution channel of processed fish in
Adamawa State, Nigeria; Global Journal of Management and Business Research, 11 (4), 21-26.
National Bureau of Statistics (2006). National bureau of statistics. Retrieved from: http://www.vconnect.com/national-bureau-of-
statisticseti_osalagos_b52452?gclid=CjkKEQjw_tOdBRDv9tuvl7eAtNEBEiQA9Qm5IhIhxl3fLvp
S9OOdyBoRJ8vuPuqHOZ0A ZidberkTVH3wwcB last searched 30/06/2014. National Population Commission (2006).Population Figures, NPC, Abuja FCT. National
Technical Working Group (2009). Agriculture & Food Security, Report of the Vision 2020. Retrieved
from: www.npc.gov.ng/vault/NTWG%20Final%20Report/energy%20ntwg%20report.pdf on
27/06/2013. Nwabueze, A. A. &Nwabueze, E.O. (2010). An investigation into the problems of fresh fish marketing
in Oshimili South Local Government of Delta State, Nigeria. Agricultural and Biological Journal of
North America, 2(2), 23-35. Nwaru, J. C., A. C. Nwosu &Agummuo, V.C. (2011). Socio-Economic Determinants of Profit in
Wholesale and Retail Banana Marketing in Umuahia Agricultural Zone of Abia State, Nigeria.
Journal of sustainable development in Africa, 13(1), 200-210. Obasi, I. O. (2015). Structure, Conduct and Performance of Rice Markets in Abia State, Nigeria. An
Unpublished Masters Thesis submitted to the Department of Agricultural Economics, Michael
Okpara University of Agriculture, Umudike, Nigeria.
Offor, E.I., Ibekwe, O.B & Ikemefuna, C.S. (2016). Performane of Fresh Fish marketing in port Harcourt metropolis, rivers State, Nigeria, Nigerian Journal of Agriculture, Food and Environment,
12 (3), 133-136.
Ojo, S.O. (2004) Improving Labour Productivity and Technical Efficiency in Food Crop Production: A Panacea for Poverty Reduction in Nigeria. Food Agric. Environ., 2(2), 227-231.
Okwu, O.J. &Acheneje, S. (2011). Socio-Economic Analysis of Fish Farming in Makurdi Local
Government Area, Benue State, Nigeria. European Journal of Social Sciences, 23, 4. Okwuokenye, G. F. &Onemolease, E.A.(2011). Influence of Socio-Economic Characteristics of Yam
Sellers on Marketing Margins among Yam Wholesalers in Delta State, Nigeria. Journal of
Agriculture and Social Research (JARS), 11(1), 81-90.
Opata, P.I. (2012). Marketing of Cocoyam in South-East Nigeria, Unpublished PhD Thesis in the Dept. of Agricultural Economics, University of Nigeria, Nsukka.
Raji A., Okaema A.N., Omorinkoba, W. &Bwala, R. (2012). Illegal Fishing of Inland Water Bodies
of Nigeria: Kainji Experience. Continental Journal of Fisheries and Aquatic Science, 6, 47-58.

I. K. Agbugba and M. Christian
23
Rehein, C. &Sutinem, J. G. (2006). Trade and Market Place Measures to Promote Sustainable Fishing
Practices, Issue paper 3, 58. International Centre for Trade and Sustainable Development (ICTSD)
and High Seas Task Force (HSTF) Geneva, Switzerland and Paris, France. Suleiman A. (2007). Economic Analysis of Artisanal Fish Marketing in Kebbi State, Nigeria,
Unpublished Ph.D. Thesis, Department of Agricultural Economics and Rural Sociology, Ahmadu
Bello University, Zaria. United Nations Industrial Development Organization (2015). Industrial Development Report 2016.
The Role of Technology and Innovation in Inclusive and Sustainable Industrial Development,
Vienna, Austria.
3rd International Conference on Economic Research
24-25th October 2019, Alanya, Turkey
24
DESIGN OF THE SUPPLIER BASE BY USING SUPPLIER REDUCTION AND
MATERIAL GROUP MANAGEMENT
Gerhard Lechner
University of Sopron, Hungary, Email: [email protected]
Abstract
Due in part to the very high proportion of value creation at suppliers outside of the company,
especially in the case of manufacturing companies, the development of the company is strongly
influenced by them. Suppliers are increasingly involved in processes of their customers or even take
over processes by themselves. As a result, the management of supplier relationships through
purchasing is important. In particular, it is necessary to be able to use alternative suppliers when they
are needed. Targeted Supplier Reduction and sustainable Material Group Management can contribute
to increasing efficiency and designing the Supplier Base. For this reason, the importance and activities
with regard to the reduction or optimization of the number of suppliers as well as the importance of
Material Group Management are investigated. The result is that purchasing has to implement the
diverse requirements of the own company by using a suitable supplier structure and in doing so
making value contributions. Material Group Management supports this because the purchasing
strategy can be broken down in a targeted manner and implemented sustainably. The reduction and
optimization of the number of suppliers can thus also be implemented. However, the topic of Supplier
Reduction has a sustainable character compared to the realization of cost reductions. It is more
important for purchasing to have alternative supply partners at all times to achieve priority goals.
Keywords: Material Group Management, Sourcing Strategies, Supplier Base, Supplier Reduction,
Value Added.
1. Introduction
The management of suppliers and of material groups has become increasingly important in recent
decades, as companies have focused more on their core competencies and shifted value creation to
suppliers in order to generate higher value contributions and to shift risks in parallel (Hofbauer et al.,
2015, p. 3). According to information from the Federal Statistical Office in Germany, the share of
material consumption including merchandise and wage labor in the gross production value in
manufacturing is on average 58.0% and in mechanical engineering 53.9% (Federal Statistical Office,
2018, p. 278 & p. 301). The cost of materials thus represents the largest cost block in the
manufacturing industry, from which the necessity of an efficient and systematic Supplier and Material
Group Management is derived.
The objective of this study is to identify the importance of Supplier Reduction and Material Group
Management activities by purchasing in order to create Value Added for the company. For this
purpose, a written survey with involvement of purchasing representatives who have many years of
experience was conducted in manufacturing companies. The high share of Value Added provided by
suppliers underpins the importance of Material Group Management. On the other side, Supplier
Reduction has only the character of a secondary strategy.
This paper consists of five sections. Section 1 explains the importance and possibilities of Supplier
and Material Group Management and the structure of the paper. Section 2 discusses not only the
design of the Supplier Base, but also aspects concerning Supplier Reduction activities and Material
Group Management. Section 3 describes the structure and realization of the written survey as well as
the objective with regard to the findings from the respective questions.Section4 explains the results of
the survey and graphs them. This paper concludes with Section 5 - with conclusions and derivations -
from the respective findings.
Design of the Supplier Base by…
25
2. Design of the Supplier Base
Suppliers are the highest 'good' of purchasing (cf. Lechner, 2017, p. 172) and thus an essential part
of a functioning Supplier and Material Group Management. However, the requirements for suppliers
may vary depending on the objectives.
In some cases, suppliers are needed to deliver 'simple parts', and the focus of these partners tends to
be highly cost-driven. In addition, suppliers may only be used as 'extended workbenches' to absorb
capacity peaks or support the own production. In both cases, therefore, the use of design and
development capacities does not play a decisive role. In addition to the cost-oriented focus, it is
basically only necessary for the suppliers to control quality and delivery performance.
It is different for complex assemblies and components that may be procured explicitly from
external supply partners, because specific know-how in the own company is not sufficiently available,
because necessary intellectual property rights are to be considered, because risks like technical
development success or for reasons of product liability, are to be distributed over several shoulders,
and to identify innovative suppliers (Wagner, 2009, p. 8) or to acquire innovations (Winter, 2014, p.
46; Monczka et al., 2011, p. 30; cf. Bessant & Phillips, 2013, pp. 358f.; cf. Bower & Christensen,
1995, pp. 43ff.). Usually, these partners are involved in the procurement and development process at
an early stage, so that they can support with ideas and suggestions and thus contribute actively to cost
or risk reduction. The later the integration takes place, the more difficult it becomes due to the
advanced process of considering the corresponding inputs. Independent of this, these suppliers are also
required to comply with the quality and delivery performance agreed with the company, possibly with
a longer order preview, framework or special logistics agreements.
When designing the Supplier Base, it is equally important whether the supplier is to be considered
for small quantities or for large series deliveries and consequently more manual or automated
manufacturing and assembly processes are required. This criterion is a clear requirement that shows
very quickly whether a supplier is suitable or not. If possible, the volume of a supplier should be on a
scale that is not critical. This means that, if possible, the share is on the one hand not more than 30% to
40%, but on the other hand not negligible, in order to be taken seriously as a customer in any case and
to be important for the supplier. Otherwise, it is difficult to enforce requirements (cf. Hess, 2008, p.
216).
Within the scope of supplier search, identification and selection (cf. Roodhooft & Konings, 1996,
pp. 97ff.)by own research or supplier self-assessment (Hofbauer et al., 2015, pp. 16f.; cf. Faust &
Yang, 2012, pp. 88f.), each including visit of the supplier on site, this must be found out, so that
according to the requirements and the appropriate supply partners can be found and determined (cf.
Hofbauer et al., 2015, pp. 12ff.). Not only the supplier has to fit the customer, the customer also to the
supplier.
For the listed reasons, it is the case that in the manufacturing industry the supplier structure is
consisting of small, medium and large partners, which have different strengths and can thus be used
precise for the various requirements. In turn, it can be derived that it is not possible to achieve optimal
value contributions only with suppliers from one of these segments.
2.1 Supplier Reduction Activities
For companies with a high number of suppliers, Supplier Reduction is another way to generate
additional value. In practice, the situation is often found that few buyers have to deal with a large
number of suppliers. The A- and B-suppliers are given intensive support; ordinary support is often not
possible with other suppliers for capacity reasons. Thus, a part of the purchasing volume remains
largely unprocessed from a strategic perspective. Wagner (2003, p. 702) uses the example of various
American companies to show that the number of suppliers could be reduced by up to 90%. However,
the question of the optimal number of suppliers cannot be assessed constructively and in detail at the
company level, but rather at the level of the material group or, if necessary, even at the item number
level (Hess, 2008, p. 211; Appelfeller & Buchholz, 2011, p. 122). The optimal number of suppliers
within a material group is influenced by internal and external factors, which have to be examined on a
case-by-case basis, e. g. the level of purchasing volume and the supply situation, the competitive
environment and the number of existing suppliers on the market (Droege & Comp., 1998, pp. 66f.).
G. Lechner
26
Nevertheless, in addition to the focus on individual material groups or item numbers, the reduction
in the number of suppliers at company-wide level is also important (cf. Homburg, 2002, pp. 181ff.).
The controlling instrument for this can be a supplier rating system, a preferred list of suppliers or the
strong use of framework contracts in operational execution. However, the optimal number of suppliers
of a company ultimately depends on the range of parts and assemblies required (Appelfeller &
Buchholz, 2011, p. 122).
The type of cooperation with suppliers has a high influence on the willingness of both sides to
invest, possibly represents a risk protection and has a direct impact on the commitment to implement
efficiency improvement potentials. Therefore, it is important to deal with the right partners and topics
as well as opportunities in the sense of an increase in Value Added. In this context, a differentiation is
also made between active and passive suppliers, which may not have been used for a long time, but are
present in the systems in the sense of 'nominal members'. These suppliers as well as any existing
duplicates should be deleted from the systems and thus from the supplier lists, because it unnecessarily
complicates the work of purchasing (Appelfeller & Buchholz, 2011, p. 122). Nevertheless, in practice,
the issue of Supplier Reduction is for capacitive reasons often of secondary importance.
Key figures such as the number of active suppliers as well as the amount of purchasing volume of a
supplier in a region or material group can be used to actively optimizing the number of suppliers
(Appelfeller & Buchholz, 2011, p. 189). With regard to optimization approaches in the design of the
Supplier Base, in particular the following, highly logistical possibilities should be considered:
- C-parts management: Due to the low value of the parts, the focus here is on the optimization
of process costs; in addition to the separation of C-parts procurement, possibly including decentralized
responsibility, or the use of e-procurement solutions, outsourcing to a specialist is also an option
(Wannenwetsch, 2014, pp. 37ff.; Droege & Comp., 1998, pp. 69f.).
- Set of parts: To reduce the processing effort, articles are combined into a logistic unit; this
increases the value or importance of the group and, in addition, reduces interfaces with suppliers
(Nyhuis & Eilmann, 2011, p.104).
- Product order systems (parts families, modular strategy, common parts, module, system and
platform strategies): By applying these strategies, product structure analyzes can reduce complexity
throughout the company, accelerate standardization and thus reduce the variety of parts overall
(Zifkovits, 2013, pp. 330ff.).
2.2 Material Group Management
Material Group Management is an important tool for purchasing (Rüdrich et al., 2004, pp. 13ff.) in
order to achieve additional Value Added and must therefore be a fixed pillar of the purchasing
strategy. Not only the much better overview of the total purchasing volume, but in particular bundling
and standardization activities can be initiated from the classification (cf. Lechner, 2011, p. 150).
Purchasing can work so much more focused and efficient, which in turn means that purchasing
departments that classify the purchasing volume into material groups usually align their organization
accordingly (cf. Hess, 2008, p. 232 & p. 334). Purchaser can build up specific material group know-
how, have more time for strategic tasks, and can negotiate cumulative needs with suppliers (cf.
Gabath, 2010, pp. 99f.).
The Material Group Management can thus fertilize one another with the Supplier Management.
Basically, Material Group Management is 'above' Supplier Management, because it is the basis for the
strategies that are implemented with the suppliers. The quality of the suppliers is therefore crucial with
regard to the implementation of the strategies. In particular, therefore, supplier classification is
important for Material Group Management, which focuses on both technical and economic issues. As
a result, suppliers are usually selected at material group or material number level. Supplier
qualification and development (cf. Wagner & Krause, 2009, pp. 3161ff.)is part of the process that
ensures that all the supplier's requirements for successful series delivery, process and regulatory
requirements are met. In regular supplier audits, the respective status quo is checked (cf. Appelfeller &
Buchholz, 2011, pp. 126f.).
The activities of the Material Group Management are influenced in particular by the potentials
which are in the material groups (cf. Rüdrich et al., 2004, pp. 18f.). The most important indicators are
Design of the Supplier Base by…
27
the purchasing volume, the degree of standardization of the components, the competitive environment
and the number of existing suppliers.
Usually, the greatest potentials are expected in the material groups with the highest purchasing
volumes. These mainly contain strategic, particularly valuable components and assemblies, most of
which are already handled by A-suppliers. Basically, the statement ishere that in the work with large
suppliers, an adequately high effort is to be put, because it contains the greatest opportunities and risks
in terms of Value Added.
The procedures are very different, depend on opportunities and risks and are strongly influenced by
tender, which have to be carried out cyclically. Usually, the fastest results can be achieved if only
purchasing parameters and no changed specification are tendered and negotiated. But with the call for
tenders without optimization of the specification, the best results are not achieved if the suppliers are
offered no further economies of scale for cost reduction, such as technical standardization or
simplification of assemblies. This approach aims at sustainable cost reductions and provides even
better arguments for purchasing, but in advance causes higher expenses in the own organization. This
includes, for example, the revision of functional specifications by technology, adjustments to optimize
logistics including the production process by the respective departments or make-or-buy decisions (cf.
Rüdrich et al., 2004, pp. 25ff.), which must also be decided cross-functionally from the participating
functions under holistic aspects.
Nevertheless, purchasing tends to get the best argument for gaining additional value from the
competition of potential suppliers in the market, which is built by the companies' purchasing
departments to have substitution opportunities and thus alternatives within the supplier portfolio. The
use of competition combined with bundling and standardization activities and the consistent promotion
of value-analytic measures will ultimately lead to the best solutions (cf. Appelfeller & Buchholz,
2011,p. 136 & pp. 140 ff.).
The Supplier Management is responsible for the quality of the suppliers and thus the basis for a
successful Material Group Management. This in turn establishes it in the company as part of the
strategy of purchasing. The value contributions come from the suppliers, but can be strongly
influenced by sustainable Material Group Management.
3. Data and Methodology
The research aims to investigate the importance of Supplier Reduction and Material Group
Management in order to design the Supplier Base and to create Value Added for the company. The
study was conducted between August and November 2017. A total of 628 companies were contacted
in writing via a standardized and structured questionnaire. The contact was made by email, LinkedIn
or personal delivery. 68 questionnaires were answered, which corresponds to a response rate of 10.8%.
In order to receive qualified feedback, explicitly experienced purchasing representatives, some of
them from middle or higher management, were addressed. In addition, it must be clear that the
company belongs to the manufacturing sector. This industry focus has been chosen because the
requirements of different industries sometimes differ greatly. The classification or branch is carried
out according to the definition of the main industrial groups of the European Community (Commission
of the European Communities, 2007, pp. 4ff.).Furthermore, due to the query of the sales figures or the
purchasing volumes, a different behavior between small and medium-sized enterprises (SMEs) and
groups may be derived. The definition of SMEs is based on the Recommendation of the European
Union (Commission of the European Communities, 2003, p. L 124/39), which was also based on the
Institute for SME Research Bonn in terms of turnover; the further gradations are determined on the
basis of personal experience.The purchasing volume is based on an average material quota of 50% and
is classified analogously to sales. However, it is highly industry-dependent. The question of
connecting purchasing within the organization allows conclusions to be drawn about the strategic
importance and classification of the purchase.
The purchasing agents participating in the survey have 80.9% of purchasing experience of more
than ten years. 77.9% have completed a study. 82.4% of the participants in the respective companies
stated that they held a managerial position. Of the participating companies, 72.1% were in the
industrial goods sector (66.2% of the companies were mechanical engineering alone) and 14.7% were
in the intermediate goods sector. 94.1% of the companies generate a turnover of less than € 5.0 billion
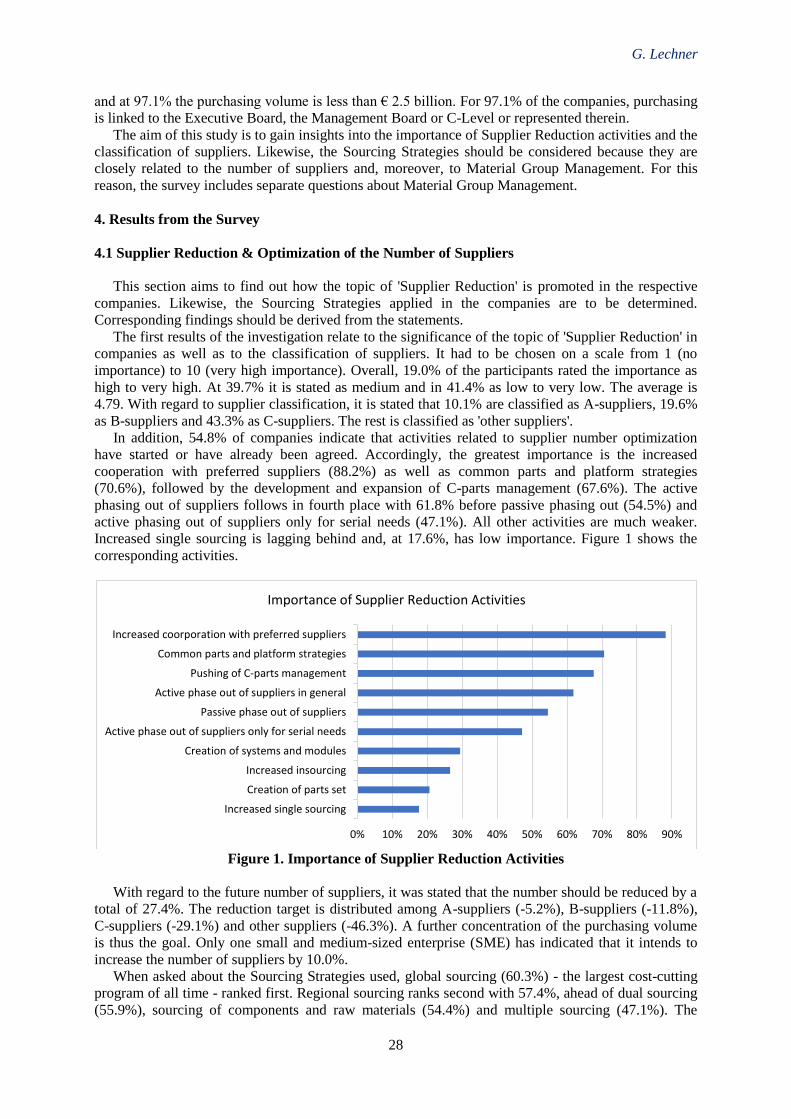
G. Lechner
28
and at 97.1% the purchasing volume is less than € 2.5 billion. For 97.1% of the companies, purchasing
is linked to the Executive Board, the Management Board or C-Level or represented therein.
The aim of this study is to gain insights into the importance of Supplier Reduction activities and the
classification of suppliers. Likewise, the Sourcing Strategies should be considered because they are
closely related to the number of suppliers and, moreover, to Material Group Management. For this
reason, the survey includes separate questions about Material Group Management.
4. Results from the Survey
4.1 Supplier Reduction & Optimization of the Number of Suppliers
This section aims to find out how the topic of 'Supplier Reduction' is promoted in the respective
companies. Likewise, the Sourcing Strategies applied in the companies are to be determined.
Corresponding findings should be derived from the statements.
The first results of the investigation relate to the significance of the topic of 'Supplier Reduction' in
companies as well as to the classification of suppliers. It had to be chosen on a scale from 1 (no
importance) to 10 (very high importance). Overall, 19.0% of the participants rated the importance as
high to very high. At 39.7% it is stated as medium and in 41.4% as low to very low. The average is
4.79. With regard to supplier classification, it is stated that 10.1% are classified as A-suppliers, 19.6%
as B-suppliers and 43.3% as C-suppliers. The rest is classified as 'other suppliers'.
In addition, 54.8% of companies indicate that activities related to supplier number optimization
have started or have already been agreed. Accordingly, the greatest importance is the increased
cooperation with preferred suppliers (88.2%) as well as common parts and platform strategies
(70.6%), followed by the development and expansion of C-parts management (67.6%). The active
phasing out of suppliers follows in fourth place with 61.8% before passive phasing out (54.5%) and
active phasing out of suppliers only for serial needs (47.1%). All other activities are much weaker.
Increased single sourcing is lagging behind and, at 17.6%, has low importance. Figure 1 shows the
corresponding activities.
Figure 1. Importance of Supplier Reduction Activities
With regard to the future number of suppliers, it was stated that the number should be reduced by a
total of 27.4%. The reduction target is distributed among A-suppliers (-5.2%), B-suppliers (-11.8%),
C-suppliers (-29.1%) and other suppliers (-46.3%). A further concentration of the purchasing volume
is thus the goal. Only one small and medium-sized enterprise (SME) has indicated that it intends to
increase the number of suppliers by 10.0%.
When asked about the Sourcing Strategies used, global sourcing (60.3%) - the largest cost-cutting
program of all time - ranked first. Regional sourcing ranks second with 57.4%, ahead of dual sourcing
(55.9%), sourcing of components and raw materials (54.4%) and multiple sourcing (47.1%). The
0% 10% 20% 30% 40% 50% 60% 70% 80% 90%
Increased single sourcing
Creation of parts set
Increased insourcing
Creation of systems and modules
Active phase out of suppliers only for serial needs
Passive phase out of suppliers
Active phase out of suppliers in general
Pushing of C-parts management
Common parts and platform strategies
Increased coorporation with preferred suppliers
Importance of Supplier Reduction Activities
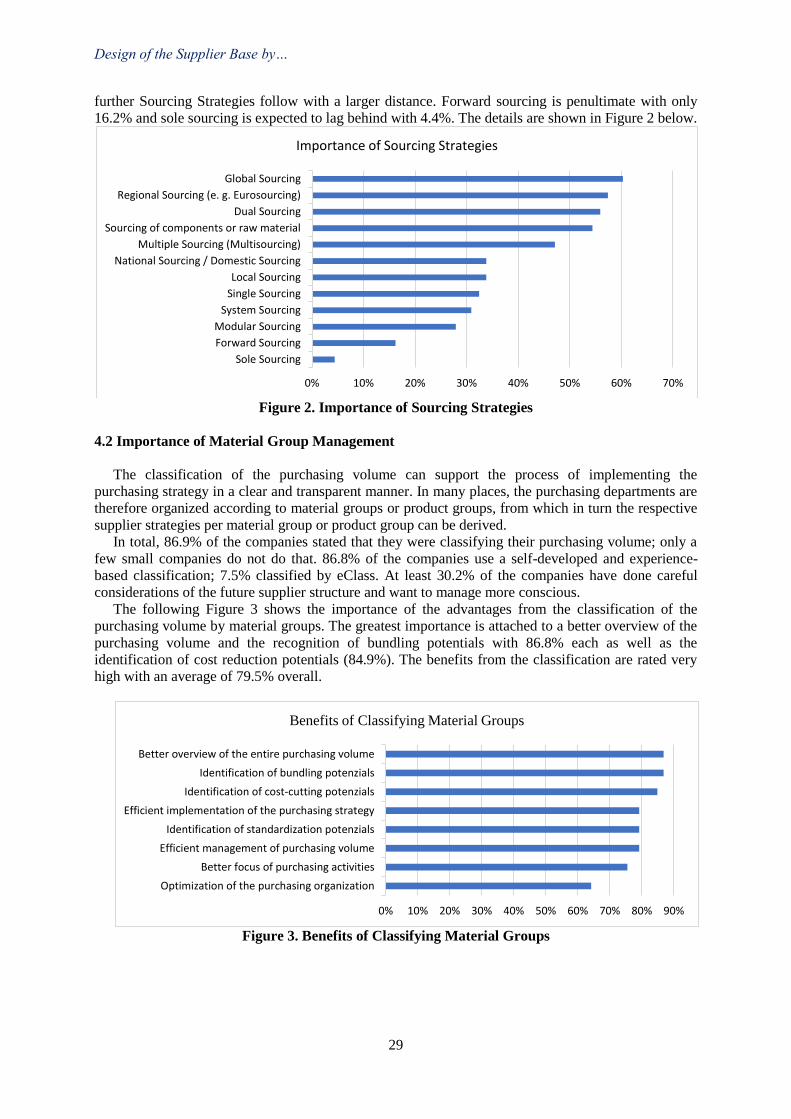
Design of the Supplier Base by…
29
further Sourcing Strategies follow with a larger distance. Forward sourcing is penultimate with only
16.2% and sole sourcing is expected to lag behind with 4.4%. The details are shown in Figure 2 below.
Figure 2. Importance of Sourcing Strategies
4.2 Importance of Material Group Management
The classification of the purchasing volume can support the process of implementing the
purchasing strategy in a clear and transparent manner. In many places, the purchasing departments are
therefore organized according to material groups or product groups, from which in turn the respective
supplier strategies per material group or product group can be derived.
In total, 86.9% of the companies stated that they were classifying their purchasing volume; only a
few small companies do not do that. 86.8% of the companies use a self-developed and experience-
based classification; 7.5% classified by eClass. At least 30.2% of the companies have done careful
considerations of the future supplier structure and want to manage more conscious.
The following Figure 3 shows the importance of the advantages from the classification of the
purchasing volume by material groups. The greatest importance is attached to a better overview of the
purchasing volume and the recognition of bundling potentials with 86.8% each as well as the
identification of cost reduction potentials (84.9%). The benefits from the classification are rated very
high with an average of 79.5% overall.
Figure 3. Benefits of Classifying Material Groups
0% 10% 20% 30% 40% 50% 60% 70%
Sole Sourcing
Forward Sourcing
Modular Sourcing
System Sourcing
Single Sourcing
Local Sourcing
National Sourcing / Domestic Sourcing
Multiple Sourcing (Multisourcing)
Sourcing of components or raw material
Dual Sourcing
Regional Sourcing (e. g. Eurosourcing)
Global Sourcing
Importance of Sourcing Strategies
0% 10% 20% 30% 40% 50% 60% 70% 80% 90%
Optimization of the purchasing organization
Better focus of purchasing activities
Efficient management of purchasing volume
Identification of standardization potenzials
Efficient implementation of the purchasing strategy
Identification of cost-cutting potenzials
Identification of bundling potenzials
Better overview of the entire purchasing volume
Benefits of Classifying Material Groups
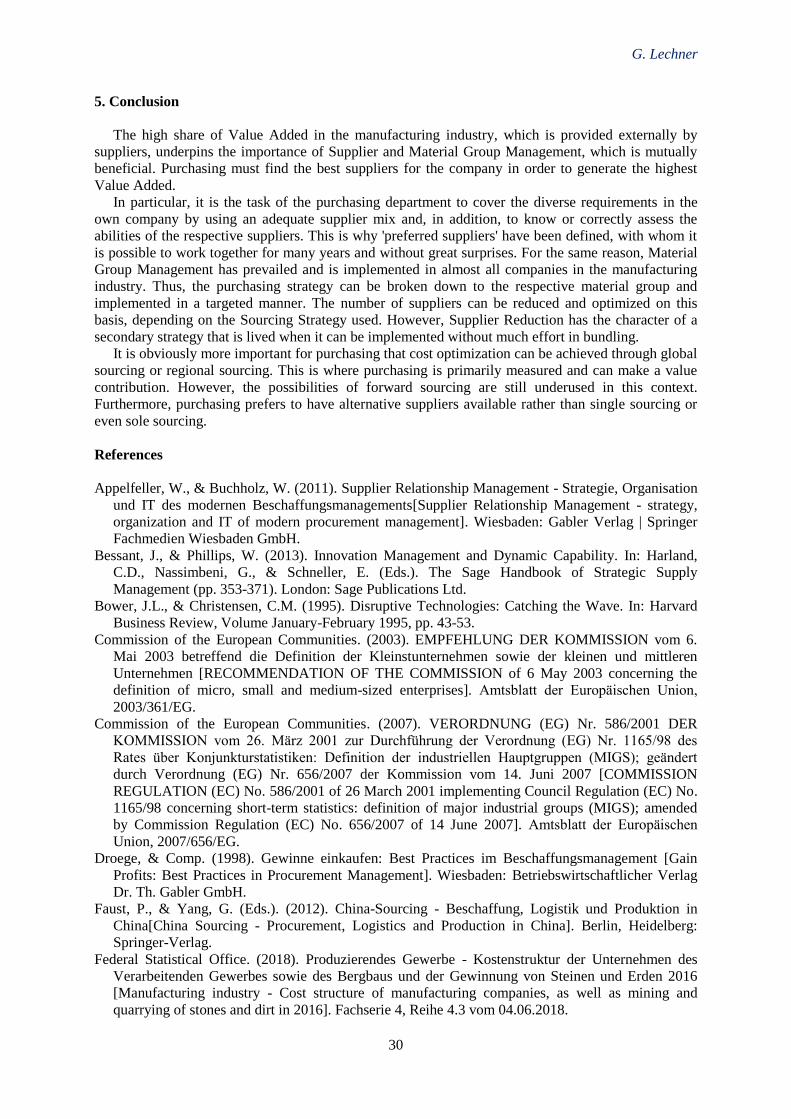
G. Lechner
30
5. Conclusion
The high share of Value Added in the manufacturing industry, which is provided externally by
suppliers, underpins the importance of Supplier and Material Group Management, which is mutually
beneficial. Purchasing must find the best suppliers for the company in order to generate the highest
Value Added.
In particular, it is the task of the purchasing department to cover the diverse requirements in the
own company by using an adequate supplier mix and, in addition, to know or correctly assess the
abilities of the respective suppliers. This is why 'preferred suppliers' have been defined, with whom it
is possible to work together for many years and without great surprises. For the same reason, Material
Group Management has prevailed and is implemented in almost all companies in the manufacturing
industry. Thus, the purchasing strategy can be broken down to the respective material group and
implemented in a targeted manner. The number of suppliers can be reduced and optimized on this
basis, depending on the Sourcing Strategy used. However, Supplier Reduction has the character of a
secondary strategy that is lived when it can be implemented without much effort in bundling.
It is obviously more important for purchasing that cost optimization can be achieved through global
sourcing or regional sourcing. This is where purchasing is primarily measured and can make a value
contribution. However, the possibilities of forward sourcing are still underused in this context.
Furthermore, purchasing prefers to have alternative suppliers available rather than single sourcing or
even sole sourcing.
References
Appelfeller, W., & Buchholz, W. (2011). Supplier Relationship Management - Strategie, Organisation
und IT des modernen Beschaffungsmanagements[Supplier Relationship Management - strategy,
organization and IT of modern procurement management]. Wiesbaden: Gabler Verlag | Springer
Fachmedien Wiesbaden GmbH.
Bessant, J., & Phillips, W. (2013). Innovation Management and Dynamic Capability. In: Harland,
C.D., Nassimbeni, G., & Schneller, E. (Eds.). The Sage Handbook of Strategic Supply
Management (pp. 353-371). London: Sage Publications Ltd.
Bower, J.L., & Christensen, C.M. (1995). Disruptive Technologies: Catching the Wave. In: Harvard
Business Review, Volume January-February 1995, pp. 43-53.
Commission of the European Communities. (2003). EMPFEHLUNG DER KOMMISSION vom 6.
Mai 2003 betreffend die Definition der Kleinstunternehmen sowie der kleinen und mittleren
Unternehmen [RECOMMENDATION OF THE COMMISSION of 6 May 2003 concerning the
definition of micro, small and medium-sized enterprises]. Amtsblatt der Europäischen Union,
2003/361/EG.
Commission of the European Communities. (2007). VERORDNUNG (EG) Nr. 586/2001 DER
KOMMISSION vom 26. März 2001 zur Durchführung der Verordnung (EG) Nr. 1165/98 des
Rates über Konjunkturstatistiken: Definition der industriellen Hauptgruppen (MIGS); geändert
durch Verordnung (EG) Nr. 656/2007 der Kommission vom 14. Juni 2007 [COMMISSION
REGULATION (EC) No. 586/2001 of 26 March 2001 implementing Council Regulation (EC) No.
1165/98 concerning short-term statistics: definition of major industrial groups (MIGS); amended
by Commission Regulation (EC) No. 656/2007 of 14 June 2007]. Amtsblatt der Europäischen
Union, 2007/656/EG.
Droege, & Comp. (1998). Gewinne einkaufen: Best Practices im Beschaffungsmanagement [Gain
Profits: Best Practices in Procurement Management]. Wiesbaden: Betriebswirtschaftlicher Verlag
Dr. Th. Gabler GmbH.
Faust, P., & Yang, G. (Eds.). (2012). China-Sourcing - Beschaffung, Logistik und Produktion in
China[China Sourcing - Procurement, Logistics and Production in China]. Berlin, Heidelberg:
Springer-Verlag.
Federal Statistical Office. (2018). Produzierendes Gewerbe - Kostenstruktur der Unternehmen des
Verarbeitenden Gewerbes sowie des Bergbaus und der Gewinnung von Steinen und Erden 2016
[Manufacturing industry - Cost structure of manufacturing companies, as well as mining and
quarrying of stones and dirt in 2016]. Fachserie 4, Reihe 4.3 vom 04.06.2018.
Design of the Supplier Base by…
31
Gabath, C. (2010). Risiko- und Krisenmanagement im Einkauf - Methoden zur aktiven Kostensenkung
[Risk and Crisis Management in Purchasing - Methods for active Cost Reduction]. Wiesbaden:
Gabler | GWV Fachverlage GmbH.
Hess, G. (2008). Supply-Strategien in Einkauf und Beschaffung - Systematischer Ansatz und
Praxisfälle [Supply Strategies in Purchasing and Procurement - Systematic approach and practical
cases]. Wiesbaden: Gabler | GWV Fachverlage GmbH.
Hofbauer, G., Glazunova, A., & Hecht, D. (2015). Strategische Lieferantenauswahl [Strategic supplier
selection]. Working Paper, Heft Nr. 36. Ingolstadt: Technische Hochschule Ingolstadt.
Homburg, C. (2002). Bestimmung der optimalen Lieferantenzahl für Beschaffungsobjekte:
Konzeptionelle Überlegungen und empirische Befunde [Determining the optimal Number of
Suppliers for Procurement objects: Conceptual Considerations and empirical Findings]. In: Hahn,
D., & Kaufmann, L. (Eds.). Handbuch Industrielles Beschaffungsmanagement [Manual Industrial
Procurement Management] (pp. 181-200). Wiesbaden: Betriebswirtschaftlicher Verlag Dr. Th.
Gabler GmbH.
Lechner, G. (2011). Internationalisierung des Einkaufs am Beispiel des Werkzeugmaschinenbaus
[Internationalization of Purchasing using the Example of Machine Tool Construction]. In: Gabath,
C. (Ed.). Innovatives Beschaffungsmanagement - Trends, Herausforderungen, Handlungsansätze
[Innovative Procurement Management - Trends, Challenges, Approaches] (pp. 133-157).
Wiesbaden: Gabler Verlag | Springer Fachmedien Wiesbaden GmbH.
Lechner, G. (2017). Personalentwicklung im Einkauf - Ein strategischer Erfolgsfaktor [Personnel
Development in Purchasing -Astrategic Success Factor]. In: Fröhlich, E., & Karlshaus, A. (Eds.).
Personalentwicklung in der Beschaffung - Best Practices aus Theorie und Praxis [Personnel
Development in Procurement - Best Practices from Theory and Practice] (pp. 171-183). Berlin:
Springer-Verlag GmbH.
Monczka, R.M., Carter, P.L., Scannell, T.V., & Carter, J.R. (2011). Innovation Sourcing: Contributing
to Company Competitiveness. Research Monograph. Tempe: Center for Advanced Purchasing
Studies (CAPS Research).
Nyhuis, P., & Eilmann, J. (2011). Schaffung kapazitiver Freiheiten für strategische Kreativarbeit
mittels Standardisierung operativer Prozesse in der Beschaffung [Creating capacious Freedoms for
strategic Creative Work by Standardizing operative Processes in Procurement]. In: Spath, D. (Ed.).
Wissensarbeit - Zwischen strengen Prozessen und kreativem Spielraum [Knowledge Work -
Between strict Processes and creative Scope] (pp. 99-112). Berlin: GITO mbH Verlag.
Roodhooft, F., & Konings, J. (1996). Vendor Selection and Evaluation: An Activity Based Costing
Approach. European Journal of Operational Research. Volume 96, pp. 97-102.
Rüdrich, G., Kalbfuß, W., & Weißer, K. (2004). Konzeption des Materialgruppenmanagements
[Concept of Material Group Management]. In: Rüdrich, G., Kalbfuß, W., & Weißer, K. (Eds.).
Materialgruppenmanagement - Quantensprung in der Beschaffung [Material Group Management -
Quantum leap in Procurement] (pp. 11-83). Wiesbaden: Betriebswirtschaftlicher Verlag Dr. Th.
Gabler | GWV Fachverlage GmbH.
Wagner, S.M. (2003). Management der Lieferantenbasis [Management of the Supplier Base]. In:
Boutellier, R., Wagner, S.M., & Wehrli, H.P. (Eds.). Handbuch Beschaffung: Strategien -
Methoden - Umsetzung[Handbook Procurement: Strategies - Methods - Implementation](pp. 691-
731). München, Wien: Carl Hanser Verlag.
Wagner, S.M. (2009). Getting Innovation from Suppliers. In: Research-Technology Management,
Volume 52, Issue 1, pp. 8-9.
Wagner, S.M., & Krause, D.R. (2009). Supplier Development: Communication Approaches, Activities
and Goals. International Journal of Production Research. Volume 47, No. 12, pp. 3161-3177.
Wannenwetsch, H. (2014). Integrierte Materialwirtschaft, Logistik und Beschaffung[Integrated
Materials Management, Logistics and Procurement]. Berlin, Heidelberg: Springer-Verlag.
Winter, S. (2014). Management von Lieferanteninnovationen - Eine gestaltungsorientierte
Untersuchung über das Einbringen und die Bewertung [Supplier Innovation Management - A
design-oriented Investigation of Placement and Evaluation]. Wiesbaden: Springer Fachmedien.
Zifkovits, H.E. (2013). Logistik [Logistics]. Konstanz, München: UKV Verlagsgesellschaft mbH.
3rd International Conference on Economic Research
24-25th October 2019, Alanya, Turkey
32
EVALUATION OF FINANCIAL PERFORMANCES OF SMES LISTED IN THE
BIST SME INDUSTRIAL INDEX BY USING TOPSIS MULTICRITERIA DECISION
MAKING METHOD
Muhammed Selcuk Kaya
Hitit University, FEAS, Banking and Finance Department, Çorum, Turkey
Selcuk Kendirli
Hitit University, FEAS, Banking and Finance Department, Çorum, Turkey Email: [email protected]
Mustafa Bilgin
Hitit University, FEAS, Department of Economics, Çorum, Turkey
Abstract
In this study, financial performances of SMEs that listed in the BIST SME Industrial Indexare
evaluated by using TOPSIS multicriteria decision making method. The datas of the study acquired
from annual financial statements that reported between 2016-2018 period. Financial performance
ranks of SMEs are determined for each year and thus comparative financial performances of SMEs are detected.
BIST SME Industrial Index is an index includes stocks of industrial SMEs traded in BIST Stars,
BIST Main and BIST Emerging Companies markets.SMEs have great importance for Turkish economy, with their dynamizing roles and with their crucial roles in the regional development and job
creation.According to the Turkey Statistical Institute data, Turkish SMEsconstitute 99.8 % of all
enterprises in Turkey.At the same time Turkish SMEs provide 72.7% of total employment, 62% of total sales and 58% of total investments of Turkish Economy.
Technique for Order Preference by Similarity to Ideal Solution (TOPSIS) is one of the multicriteria
decision making methods that commonly used in the evaluation of financial performances of firms.
The TOPSIS method is based on two main points: the positive ideal solution and the negative ideal solution.With the help of the TOPSIS method, the distances positive ideal solutions and negative ideal
solutions of all options are calculated. Options are ranked according to their proximity to the positive
ideal solution and their distance to the negative ideal solution. Keywords: SME, Financial Performance, TOPSIS, Multicriteria Decision Making, BIST SME
Industrial Index.
1. Introduction
SMEs (Small and Medium-Sized Enterprises) are among the most important elements of economic
life with their contributions to employment and their structures that can easily adapt to changes. In all national economies, more than 70% of firms are SMEs and in most countries more than 90% of firms
are SMEs (OECD,2017).As awareness of the importance of SMEs in the economy increases,
governments and international organizations are increasing their policies to support SMEs.In this context, Borsa İstanbul has decided to establish SME Industry Index and BIST SME Industry index
started to be calculated as of December 2013.
Financial performance is a result-oriented type of business performance based on the use of
financial indicators of firm, reflecting the degree of fulfillment of economic objectives of firm (Başdar, 2019).Evaluation of the financial performance of SMEs is of great importance for the owners,
investors, lenders and other stakeholders. In this respect, multi-criteria decision making methods that
allow comparative measurement of different alternatives are among the methods used extensively in the measurement of financial performance of firms.
TOPSIS was developed by Hwang and Yoon in 1980 and is a multi-criteria decision-making
method that has been applied in many different areas from firm performance measurement to car
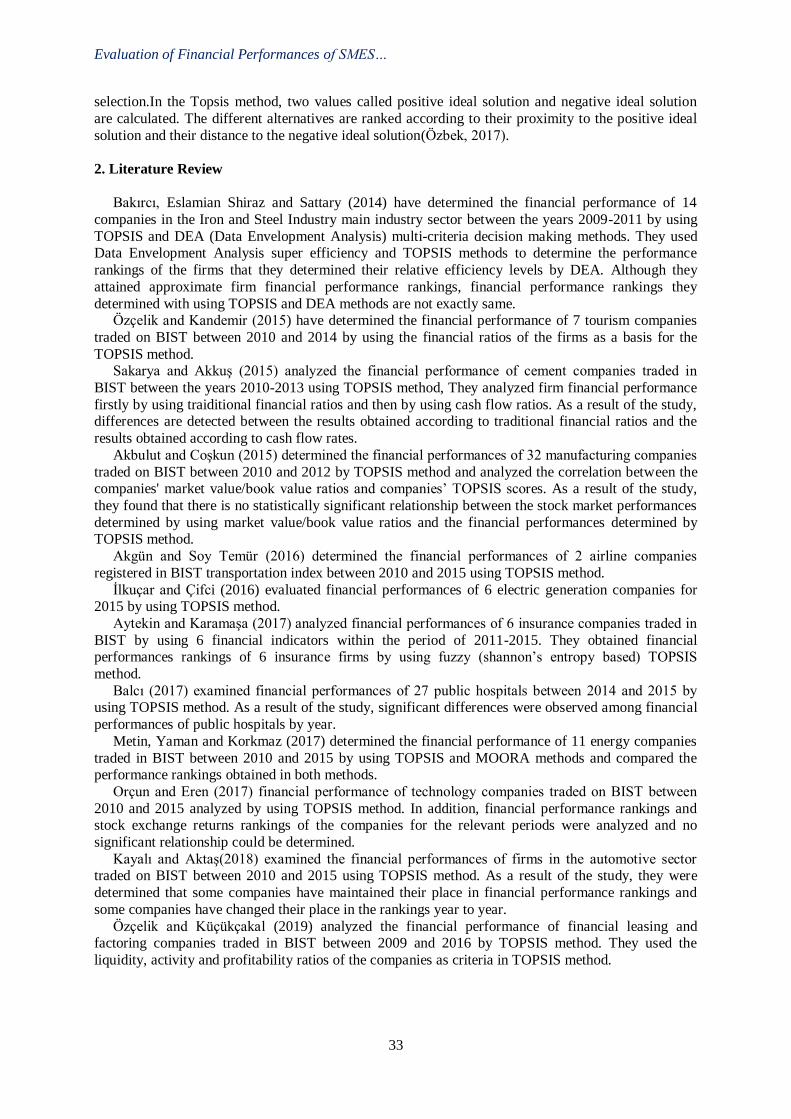
Evaluation of Financial Performances of SMES…
33
selection.In the Topsis method, two values called positive ideal solution and negative ideal solution
are calculated. The different alternatives are ranked according to their proximity to the positive ideal
solution and their distance to the negative ideal solution(Özbek, 2017).
2. Literature Review
Bakırcı, Eslamian Shiraz and Sattary (2014) have determined the financial performance of 14
companies in the Iron and Steel Industry main industry sector between the years 2009-2011 by using
TOPSIS and DEA (Data Envelopment Analysis) multi-criteria decision making methods. They used Data Envelopment Analysis super efficiency and TOPSIS methods to determine the performance
rankings of the firms that they determined their relative efficiency levels by DEA. Although they
attained approximate firm financial performance rankings, financial performance rankings they
determined with using TOPSIS and DEA methods are not exactly same. Özçelik and Kandemir (2015) have determined the financial performance of 7 tourism companies
traded on BIST between 2010 and 2014 by using the financial ratios of the firms as a basis for the
TOPSIS method. Sakarya and Akkuş (2015) analyzed the financial performance of cement companies traded in
BIST between the years 2010-2013 using TOPSIS method, They analyzed firm financial performance
firstly by using traiditional financial ratios and then by using cash flow ratios. As a result of the study, differences are detected between the results obtained according to traditional financial ratios and the
results obtained according to cash flow rates.
Akbulut and Coşkun (2015) determined the financial performances of 32 manufacturing companies
traded on BIST between 2010 and 2012 by TOPSIS method and analyzed the correlation between the companies' market value/book value ratios and companies’ TOPSIS scores. As a result of the study,
they found that there is no statistically significant relationship between the stock market performances
determined by using market value/book value ratios and the financial performances determined by TOPSIS method.
Akgün and Soy Temür (2016) determined the financial performances of 2 airline companies
registered in BIST transportation index between 2010 and 2015 using TOPSIS method.
İlkuçar and Çifci (2016) evaluated financial performances of 6 electric generation companies for 2015 by using TOPSIS method.
Aytekin and Karamaşa (2017) analyzed financial performances of 6 insurance companies traded in
BIST by using 6 financial indicators within the period of 2011-2015. They obtained financial performances rankings of 6 insurance firms by using fuzzy (shannon’s entropy based) TOPSIS
method.
Balcı (2017) examined financial performances of 27 public hospitals between 2014 and 2015 by using TOPSIS method. As a result of the study, significant differences were observed among financial
performances of public hospitals by year.
Metin, Yaman and Korkmaz (2017) determined the financial performance of 11 energy companies
traded in BIST between 2010 and 2015 by using TOPSIS and MOORA methods and compared the performance rankings obtained in both methods.
Orçun and Eren (2017) financial performance of technology companies traded on BIST between
2010 and 2015 analyzed by using TOPSIS method. In addition, financial performance rankings and stock exchange returns rankings of the companies for the relevant periods were analyzed and no
significant relationship could be determined.
Kayalı and Aktaş(2018) examined the financial performances of firms in the automotive sector traded on BIST between 2010 and 2015 using TOPSIS method. As a result of the study, they were
determined that some companies have maintained their place in financial performance rankings and
some companies have changed their place in the rankings year to year.
Özçelik and Küçükçakal (2019) analyzed the financial performance of financial leasing and factoring companies traded in BIST between 2009 and 2016 by TOPSIS method. They used the
liquidity, activity and profitability ratios of the companies as criteria in TOPSIS method.
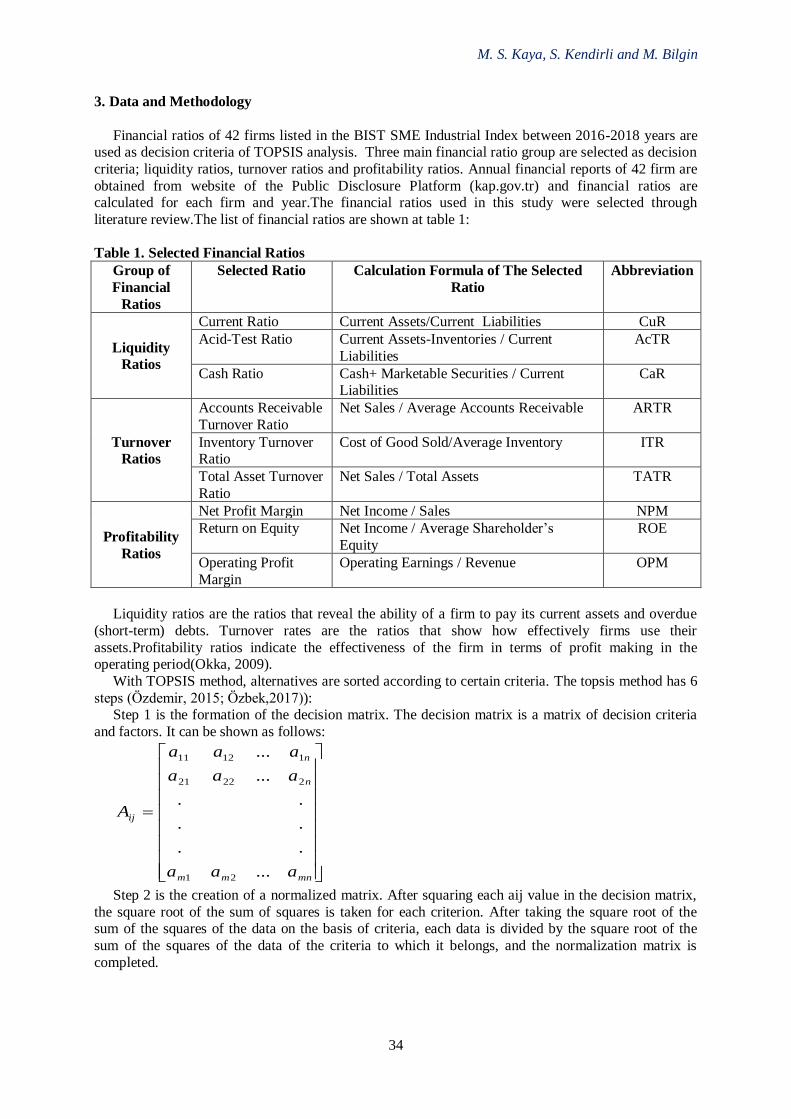
M. S. Kaya, S. Kendirli and M. Bilgin
34
3. Data and Methodology
Financial ratios of 42 firms listed in the BIST SME Industrial Index between 2016-2018 years are used as decision criteria of TOPSIS analysis. Three main financial ratio group are selected as decision
criteria; liquidity ratios, turnover ratios and profitability ratios. Annual financial reports of 42 firm are
obtained from website of the Public Disclosure Platform (kap.gov.tr) and financial ratios are calculated for each firm and year.The financial ratios used in this study were selected through
literature review.The list of financial ratios are shown at table 1:
Table 1. Selected Financial Ratios
Group of
Financial
Ratios
Selected Ratio Calculation Formula of The Selected
Ratio
Abbreviation
Liquidity
Ratios
Current Ratio Current Assets/Current Liabilities CuR
Acid-Test Ratio Current Assets-Inventories / Current
Liabilities
AcTR
Cash Ratio Cash+ Marketable Securities / Current Liabilities
CaR
Turnover
Ratios
Accounts Receivable
Turnover Ratio
Net Sales / Average Accounts Receivable ARTR
Inventory Turnover Ratio
Cost of Good Sold/Average Inventory ITR
Total Asset Turnover
Ratio
Net Sales / Total Assets TATR
Profitability
Ratios
Net Profit Margin Net Income / Sales NPM
Return on Equity Net Income / Average Shareholder’s
Equity
ROE
Operating Profit
Margin
Operating Earnings / Revenue OPM
Liquidity ratios are the ratios that reveal the ability of a firm to pay its current assets and overdue
(short-term) debts. Turnover rates are the ratios that show how effectively firms use their
assets.Profitability ratios indicate the effectiveness of the firm in terms of profit making in the operating period(Okka, 2009).
With TOPSIS method, alternatives are sorted according to certain criteria. The topsis method has 6
steps (Özdemir, 2015; Özbek,2017)): Step 1 is the formation of the decision matrix. The decision matrix is a matrix of decision criteria
and factors. It can be shown as follows:
=
mnmm
n
n
ij
aaa
aaa
aaa
A
...
..
..
..
...
...
21
22221
11211
Step 2 is the creation of a normalized matrix. After squaring each aij value in the decision matrix,
the square root of the sum of squares is taken for each criterion. After taking the square root of the sum of the squares of the data on the basis of criteria, each data is divided by the square root of the
sum of the squares of the data of the criteria to which it belongs, and the normalization matrix is
completed.
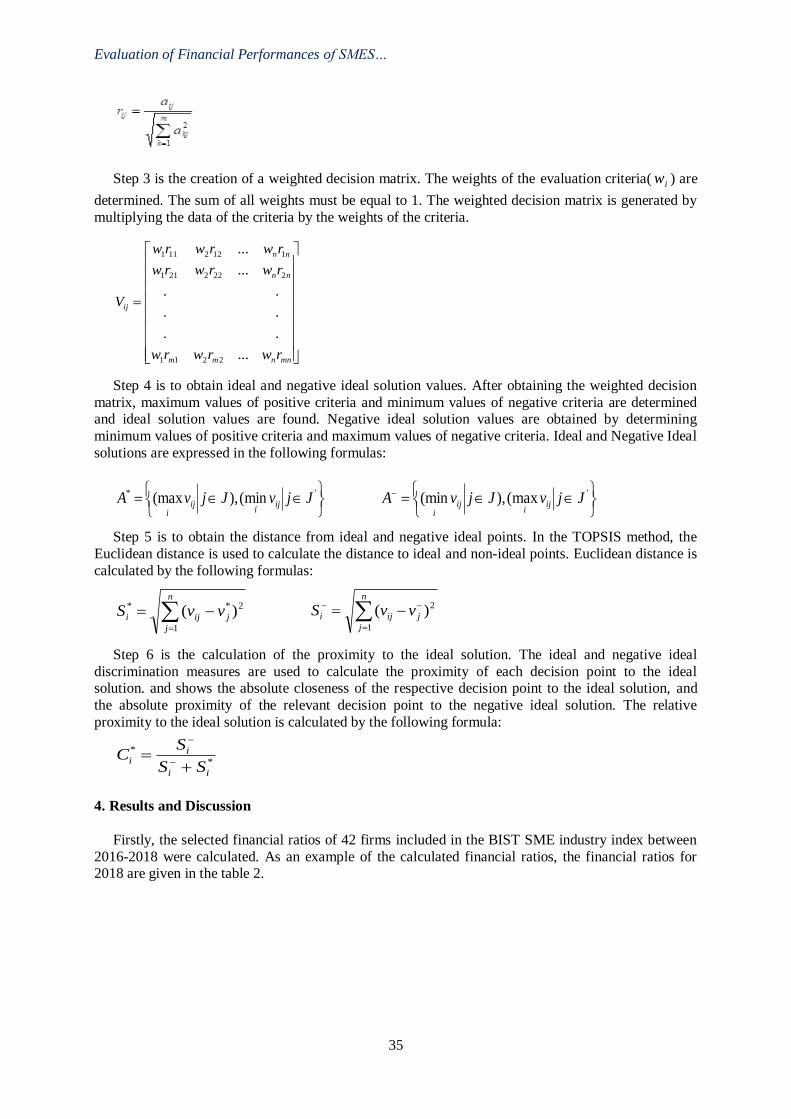
Evaluation of Financial Performances of SMES…
35
Step 3 is the creation of a weighted decision matrix. The weights of the evaluation criteria( iw ) are
determined. The sum of all weights must be equal to 1. The weighted decision matrix is generated by
multiplying the data of the criteria by the weights of the criteria.
Step 4 is to obtain ideal and negative ideal solution values. After obtaining the weighted decision
matrix, maximum values of positive criteria and minimum values of negative criteria are determined and ideal solution values are found. Negative ideal solution values are obtained by determining
minimum values of positive criteria and maximum values of negative criteria. Ideal and Negative Ideal
solutions are expressed in the following formulas:
Step 5 is to obtain the distance from ideal and negative ideal points. In the TOPSIS method, the
Euclidean distance is used to calculate the distance to ideal and non-ideal points. Euclidean distance is
calculated by the following formulas:
Step 6 is the calculation of the proximity to the ideal solution. The ideal and negative ideal
discrimination measures are used to calculate the proximity of each decision point to the ideal solution. and shows the absolute closeness of the respective decision point to the ideal solution, and
the absolute proximity of the relevant decision point to the negative ideal solution. The relative
proximity to the ideal solution is calculated by the following formula:
4. Results and Discussion
Firstly, the selected financial ratios of 42 firms included in the BIST SME industry index between
2016-2018 were calculated. As an example of the calculated financial ratios, the financial ratios for 2018 are given in the table 2.
=
mnnmm
nn
nn
ij
rwrwrw
rwrwrw
rwrwrw
V
...
..
..
..
...
...
2211
2222211
1122111
= '* min(),(max JjvJjvA iji
iji
=− 'max(),(min JjvJjvA iji
iji
=
−=n
j
jiji vvS1
2** )( =
−− −=n
j
jiji vvS1
2)(
*
*
ii
ii
SS
SC
+=
−
−
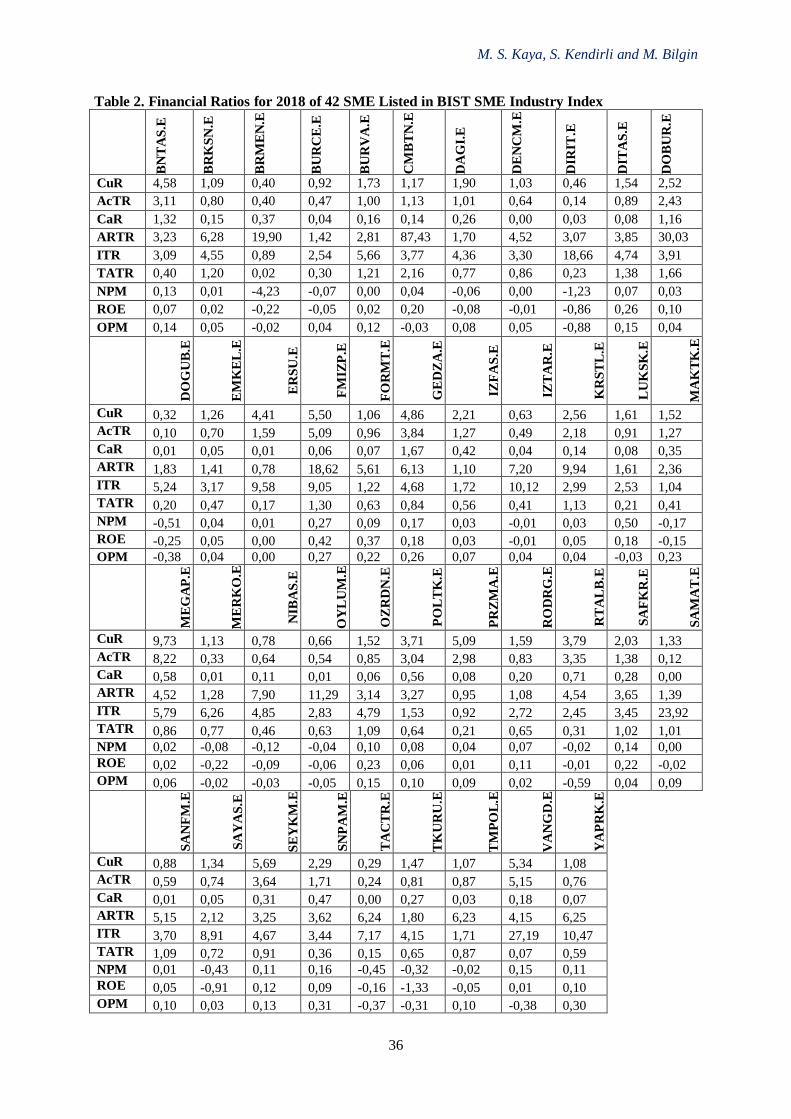
M. S. Kaya, S. Kendirli and M. Bilgin
36
Table 2. Financial Ratios for 2018 of 42 SME Listed in BIST SME Industry Index
BN
TA
S.E
BR
KS
N.E
BR
ME
N.E
BU
RC
E.E
BU
RV
A.E
CM
BT
N.E
DA
GI.
E
DE
NC
M.E
DIR
IT.E
DIT
AS
.E
DO
BU
R.E
CuR 4,58 1,09 0,40 0,92 1,73 1,17 1,90 1,03 0,46 1,54 2,52
AcTR 3,11 0,80 0,40 0,47 1,00 1,13 1,01 0,64 0,14 0,89 2,43
CaR 1,32 0,15 0,37 0,04 0,16 0,14 0,26 0,00 0,03 0,08 1,16
ARTR 3,23 6,28 19,90 1,42 2,81 87,43 1,70 4,52 3,07 3,85 30,03
ITR 3,09 4,55 0,89 2,54 5,66 3,77 4,36 3,30 18,66 4,74 3,91
TATR 0,40 1,20 0,02 0,30 1,21 2,16 0,77 0,86 0,23 1,38 1,66
NPM 0,13 0,01 -4,23 -0,07 0,00 0,04 -0,06 0,00 -1,23 0,07 0,03
ROE 0,07 0,02 -0,22 -0,05 0,02 0,20 -0,08 -0,01 -0,86 0,26 0,10
OPM 0,14 0,05 -0,02 0,04 0,12 -0,03 0,08 0,05 -0,88 0,15 0,04
DO
GU
B.E
EM
KE
L.E
ER
SU
.E
FM
IZP
.E
FO
RM
T.E
GE
DZ
A.E
IZF
AS
.E
IZT
AR
.E
KR
ST
L.E
LU
KS
K.E
MA
KT
K.E
CuR 0,32 1,26 4,41 5,50 1,06 4,86 2,21 0,63 2,56 1,61 1,52
AcTR 0,10 0,70 1,59 5,09 0,96 3,84 1,27 0,49 2,18 0,91 1,27
CaR 0,01 0,05 0,01 0,06 0,07 1,67 0,42 0,04 0,14 0,08 0,35
ARTR 1,83 1,41 0,78 18,62 5,61 6,13 1,10 7,20 9,94 1,61 2,36
ITR 5,24 3,17 9,58 9,05 1,22 4,68 1,72 10,12 2,99 2,53 1,04
TATR 0,20 0,47 0,17 1,30 0,63 0,84 0,56 0,41 1,13 0,21 0,41
NPM -0,51 0,04 0,01 0,27 0,09 0,17 0,03 -0,01 0,03 0,50 -0,17
ROE -0,25 0,05 0,00 0,42 0,37 0,18 0,03 -0,01 0,05 0,18 -0,15
OPM -0,38 0,04 0,00 0,27 0,22 0,26 0,07 0,04 0,04 -0,03 0,23
ME
GA
P.E
ME
RK
O.E
NIB
AS
.E
OY
LU
M.E
OZ
RD
N.E
PO
LT
K.E
PR
ZM
A.E
RO
DR
G.E
RT
AL
B.E
SA
FK
R.E
SA
MA
T.E
CuR 9,73 1,13 0,78 0,66 1,52 3,71 5,09 1,59 3,79 2,03 1,33
AcTR 8,22 0,33 0,64 0,54 0,85 3,04 2,98 0,83 3,35 1,38 0,12
CaR 0,58 0,01 0,11 0,01 0,06 0,56 0,08 0,20 0,71 0,28 0,00
ARTR 4,52 1,28 7,90 11,29 3,14 3,27 0,95 1,08 4,54 3,65 1,39
ITR 5,79 6,26 4,85 2,83 4,79 1,53 0,92 2,72 2,45 3,45 23,92
TATR 0,86 0,77 0,46 0,63 1,09 0,64 0,21 0,65 0,31 1,02 1,01
NPM 0,02 -0,08 -0,12 -0,04 0,10 0,08 0,04 0,07 -0,02 0,14 0,00
ROE 0,02 -0,22 -0,09 -0,06 0,23 0,06 0,01 0,11 -0,01 0,22 -0,02
OPM 0,06 -0,02 -0,03 -0,05 0,15 0,10 0,09 0,02 -0,59 0,04 0,09
SA
NF
M.E
SA
YA
S.E
SE
YK
M.E
SN
PA
M.E
TA
CT
R.E
TK
UR
U.E
TM
PO
L.E
VA
NG
D.E
YA
PR
K.E
CuR 0,88 1,34 5,69 2,29 0,29 1,47 1,07 5,34 1,08
AcTR 0,59 0,74 3,64 1,71 0,24 0,81 0,87 5,15 0,76
CaR 0,01 0,05 0,31 0,47 0,00 0,27 0,03 0,18 0,07
ARTR 5,15 2,12 3,25 3,62 6,24 1,80 6,23 4,15 6,25
ITR 3,70 8,91 4,67 3,44 7,17 4,15 1,71 27,19 10,47
TATR 1,09 0,72 0,91 0,36 0,15 0,65 0,87 0,07 0,59
NPM 0,01 -0,43 0,11 0,16 -0,45 -0,32 -0,02 0,15 0,11
ROE 0,05 -0,91 0,12 0,09 -0,16 -1,33 -0,05 0,01 0,10
OPM 0,10 0,03 0,13 0,31 -0,37 -0,31 0,10 -0,38 0,30
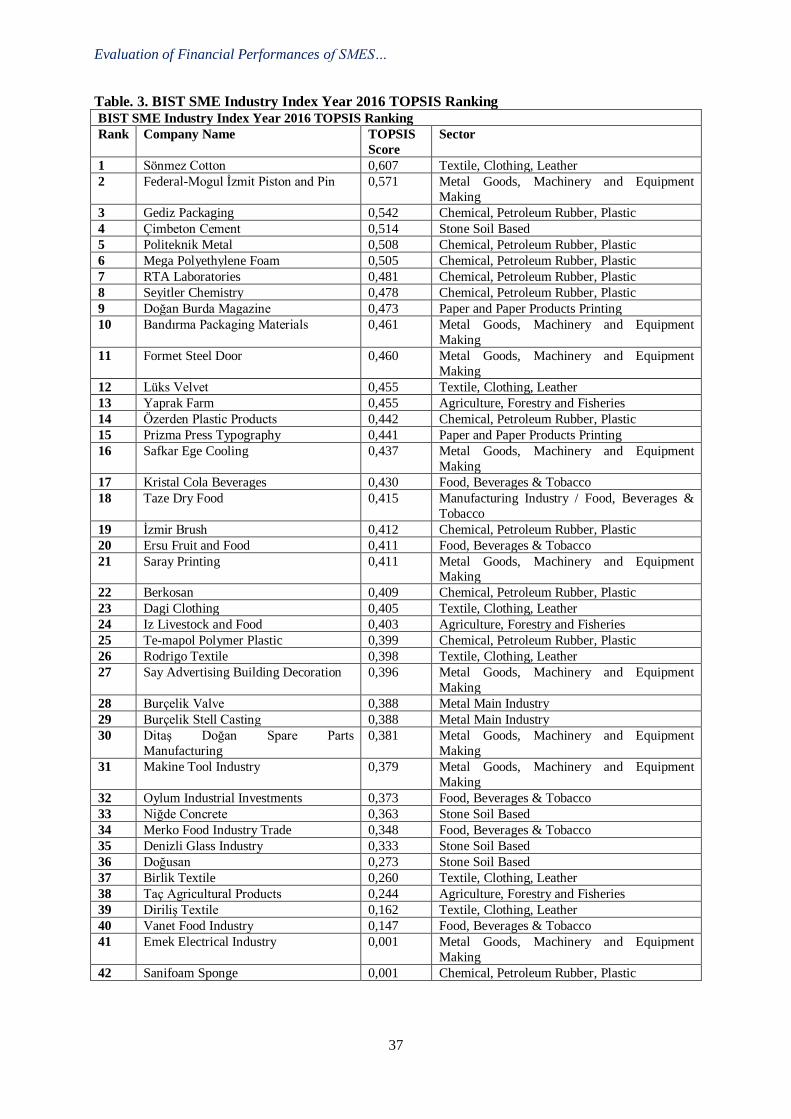
Evaluation of Financial Performances of SMES…
37
Table. 3. BIST SME Industry Index Year 2016 TOPSIS Ranking BIST SME Industry Index Year 2016 TOPSIS Ranking
Rank Company Name TOPSIS
Score
Sector
1 Sönmez Cotton 0,607 Textile, Clothing, Leather
2 Federal-Mogul İzmit Piston and Pin 0,571 Metal Goods, Machinery and Equipment
Making
3 Gediz Packaging 0,542 Chemical, Petroleum Rubber, Plastic
4 Çimbeton Cement 0,514 Stone Soil Based
5 Politeknik Metal 0,508 Chemical, Petroleum Rubber, Plastic
6 Mega Polyethylene Foam 0,505 Chemical, Petroleum Rubber, Plastic
7 RTA Laboratories 0,481 Chemical, Petroleum Rubber, Plastic
8 Seyitler Chemistry 0,478 Chemical, Petroleum Rubber, Plastic
9 Doğan Burda Magazine 0,473 Paper and Paper Products Printing
10 Bandırma Packaging Materials 0,461 Metal Goods, Machinery and Equipment
Making
11 Formet Steel Door 0,460 Metal Goods, Machinery and Equipment
Making
12 Lüks Velvet 0,455 Textile, Clothing, Leather
13 Yaprak Farm 0,455 Agriculture, Forestry and Fisheries
14 Özerden Plastic Products 0,442 Chemical, Petroleum Rubber, Plastic
15 Prizma Press Typography 0,441 Paper and Paper Products Printing
16 Safkar Ege Cooling 0,437 Metal Goods, Machinery and Equipment
Making
17 Kristal Cola Beverages 0,430 Food, Beverages & Tobacco
18 Taze Dry Food 0,415 Manufacturing Industry / Food, Beverages &
Tobacco
19 İzmir Brush 0,412 Chemical, Petroleum Rubber, Plastic
20 Ersu Fruit and Food 0,411 Food, Beverages & Tobacco
21 Saray Printing 0,411 Metal Goods, Machinery and Equipment Making
22 Berkosan 0,409 Chemical, Petroleum Rubber, Plastic
23 Dagi Clothing 0,405 Textile, Clothing, Leather
24 Iz Livestock and Food 0,403 Agriculture, Forestry and Fisheries
25 Te-mapol Polymer Plastic 0,399 Chemical, Petroleum Rubber, Plastic
26 Rodrigo Textile 0,398 Textile, Clothing, Leather
27 Say Advertising Building Decoration 0,396 Metal Goods, Machinery and Equipment
Making
28 Burçelik Valve 0,388 Metal Main Industry
29 Burçelik Stell Casting 0,388 Metal Main Industry
30 Ditaş Doğan Spare Parts
Manufacturing
0,381 Metal Goods, Machinery and Equipment
Making
31 Makine Tool Industry 0,379 Metal Goods, Machinery and Equipment
Making
32 Oylum Industrial Investments 0,373 Food, Beverages & Tobacco
33 Niğde Concrete 0,363 Stone Soil Based
34 Merko Food Industry Trade 0,348 Food, Beverages & Tobacco
35 Denizli Glass Industry 0,333 Stone Soil Based
36 Doğusan 0,273 Stone Soil Based
37 Birlik Textile 0,260 Textile, Clothing, Leather
38 Taç Agricultural Products 0,244 Agriculture, Forestry and Fisheries
39 Diriliş Textile 0,162 Textile, Clothing, Leather
40 Vanet Food Industry 0,147 Food, Beverages & Tobacco
41 Emek Electrical Industry 0,001 Metal Goods, Machinery and Equipment
Making
42 Sanifoam Sponge 0,001 Chemical, Petroleum Rubber, Plastic
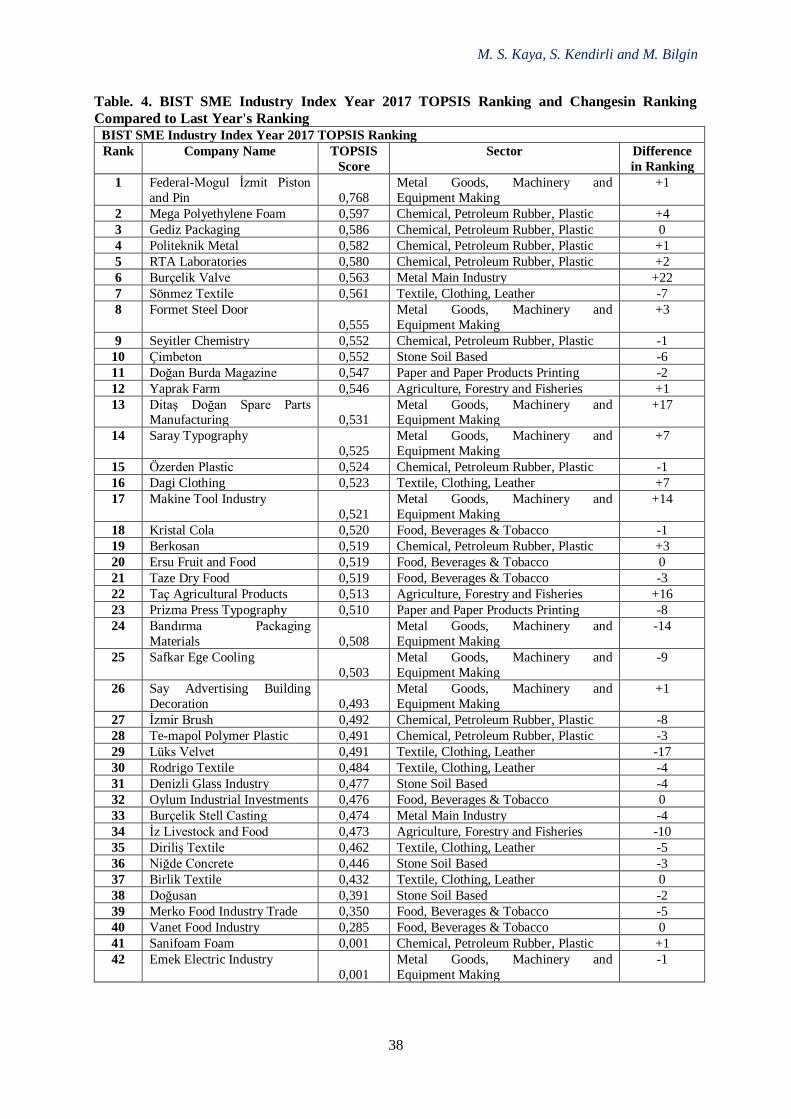
M. S. Kaya, S. Kendirli and M. Bilgin
38
Table. 4. BIST SME Industry Index Year 2017 TOPSIS Ranking and Changesin Ranking
Compared to Last Year's Ranking BIST SME Industry Index Year 2017 TOPSIS Ranking
Rank Company Name TOPSIS
Score
Sector Difference
in Ranking
1 Federal-Mogul İzmit Piston
and Pin 0,768
Metal Goods, Machinery and
Equipment Making
+1
2 Mega Polyethylene Foam 0,597 Chemical, Petroleum Rubber, Plastic +4
3 Gediz Packaging 0,586 Chemical, Petroleum Rubber, Plastic 0
4 Politeknik Metal 0,582 Chemical, Petroleum Rubber, Plastic +1
5 RTA Laboratories 0,580 Chemical, Petroleum Rubber, Plastic +2
6 Burçelik Valve 0,563 Metal Main Industry +22
7 Sönmez Textile 0,561 Textile, Clothing, Leather -7
8 Formet Steel Door
0,555
Metal Goods, Machinery and
Equipment Making
+3
9 Seyitler Chemistry 0,552 Chemical, Petroleum Rubber, Plastic -1
10 Çimbeton 0,552 Stone Soil Based -6
11 Doğan Burda Magazine 0,547 Paper and Paper Products Printing -2
12 Yaprak Farm 0,546 Agriculture, Forestry and Fisheries +1
13 Ditaş Doğan Spare Parts Manufacturing 0,531
Metal Goods, Machinery and Equipment Making
+17
14 Saray Typography
0,525
Metal Goods, Machinery and
Equipment Making
+7
15 Özerden Plastic 0,524 Chemical, Petroleum Rubber, Plastic -1
16 Dagi Clothing 0,523 Textile, Clothing, Leather +7
17 Makine Tool Industry
0,521
Metal Goods, Machinery and
Equipment Making
+14
18 Kristal Cola 0,520 Food, Beverages & Tobacco -1
19 Berkosan 0,519 Chemical, Petroleum Rubber, Plastic +3
20 Ersu Fruit and Food 0,519 Food, Beverages & Tobacco 0
21 Taze Dry Food 0,519 Food, Beverages & Tobacco -3
22 Taç Agricultural Products 0,513 Agriculture, Forestry and Fisheries +16
23 Prizma Press Typography 0,510 Paper and Paper Products Printing -8
24 Bandırma Packaging
Materials 0,508
Metal Goods, Machinery and
Equipment Making
-14
25 Safkar Ege Cooling
0,503
Metal Goods, Machinery and
Equipment Making
-9
26 Say Advertising Building
Decoration 0,493
Metal Goods, Machinery and
Equipment Making
+1
27 İzmir Brush 0,492 Chemical, Petroleum Rubber, Plastic -8
28 Te-mapol Polymer Plastic 0,491 Chemical, Petroleum Rubber, Plastic -3
29 Lüks Velvet 0,491 Textile, Clothing, Leather -17
30 Rodrigo Textile 0,484 Textile, Clothing, Leather -4
31 Denizli Glass Industry 0,477 Stone Soil Based -4
32 Oylum Industrial Investments 0,476 Food, Beverages & Tobacco 0
33 Burçelik Stell Casting 0,474 Metal Main Industry -4
34 İz Livestock and Food 0,473 Agriculture, Forestry and Fisheries -10
35 Diriliş Textile 0,462 Textile, Clothing, Leather -5
36 Niğde Concrete 0,446 Stone Soil Based -3
37 Birlik Textile 0,432 Textile, Clothing, Leather 0
38 Doğusan 0,391 Stone Soil Based -2
39 Merko Food Industry Trade 0,350 Food, Beverages & Tobacco -5
40 Vanet Food Industry 0,285 Food, Beverages & Tobacco 0
41 Sanifoam Foam 0,001 Chemical, Petroleum Rubber, Plastic +1
42 Emek Electric Industry
0,001
Metal Goods, Machinery and
Equipment Making
-1
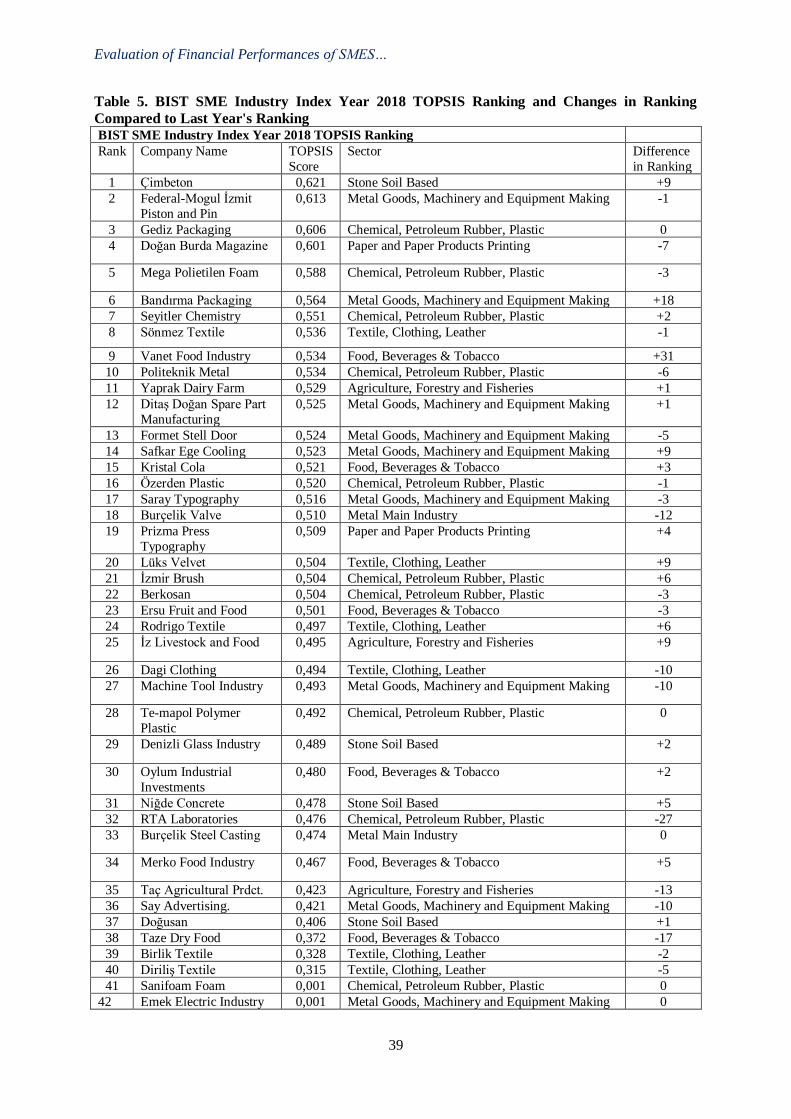
Evaluation of Financial Performances of SMES…
39
Table 5. BIST SME Industry Index Year 2018 TOPSIS Ranking and Changes in Ranking
Compared to Last Year's Ranking BIST SME Industry Index Year 2018 TOPSIS Ranking
Rank Company Name TOPSIS
Score
Sector Difference
in Ranking
1 Çimbeton 0,621 Stone Soil Based +9
2 Federal-Mogul İzmit
Piston and Pin
0,613 Metal Goods, Machinery and Equipment Making -1
3 Gediz Packaging 0,606 Chemical, Petroleum Rubber, Plastic 0
4 Doğan Burda Magazine 0,601 Paper and Paper Products Printing -7
5 Mega Polietilen Foam 0,588 Chemical, Petroleum Rubber, Plastic -3
6 Bandırma Packaging 0,564 Metal Goods, Machinery and Equipment Making +18
7 Seyitler Chemistry 0,551 Chemical, Petroleum Rubber, Plastic +2
8 Sönmez Textile 0,536 Textile, Clothing, Leather -1
9 Vanet Food Industry 0,534 Food, Beverages & Tobacco +31
10 Politeknik Metal 0,534 Chemical, Petroleum Rubber, Plastic -6
11 Yaprak Dairy Farm 0,529 Agriculture, Forestry and Fisheries +1
12 Ditaş Doğan Spare Part
Manufacturing
0,525 Metal Goods, Machinery and Equipment Making +1
13 Formet Stell Door 0,524 Metal Goods, Machinery and Equipment Making -5
14 Safkar Ege Cooling 0,523 Metal Goods, Machinery and Equipment Making +9
15 Kristal Cola 0,521 Food, Beverages & Tobacco +3
16 Özerden Plastic 0,520 Chemical, Petroleum Rubber, Plastic -1
17 Saray Typography 0,516 Metal Goods, Machinery and Equipment Making -3
18 Burçelik Valve 0,510 Metal Main Industry -12
19 Prizma Press
Typography
0,509 Paper and Paper Products Printing +4
20 Lüks Velvet 0,504 Textile, Clothing, Leather +9
21 İzmir Brush 0,504 Chemical, Petroleum Rubber, Plastic +6
22 Berkosan 0,504 Chemical, Petroleum Rubber, Plastic -3
23 Ersu Fruit and Food 0,501 Food, Beverages & Tobacco -3
24 Rodrigo Textile 0,497 Textile, Clothing, Leather +6
25 İz Livestock and Food 0,495 Agriculture, Forestry and Fisheries +9
26 Dagi Clothing 0,494 Textile, Clothing, Leather -10
27 Machine Tool Industry 0,493 Metal Goods, Machinery and Equipment Making -10
28 Te-mapol Polymer
Plastic
0,492 Chemical, Petroleum Rubber, Plastic 0
29 Denizli Glass Industry 0,489 Stone Soil Based +2
30 Oylum Industrial
Investments
0,480 Food, Beverages & Tobacco +2
31 Niğde Concrete 0,478 Stone Soil Based +5
32 RTA Laboratories 0,476 Chemical, Petroleum Rubber, Plastic -27
33 Burçelik Steel Casting 0,474 Metal Main Industry 0
34 Merko Food Industry 0,467 Food, Beverages & Tobacco +5
35 Taç Agricultural Prdct. 0,423 Agriculture, Forestry and Fisheries -13
36 Say Advertising. 0,421 Metal Goods, Machinery and Equipment Making -10
37 Doğusan 0,406 Stone Soil Based +1
38 Taze Dry Food 0,372 Food, Beverages & Tobacco -17
39 Birlik Textile 0,328 Textile, Clothing, Leather -2
40 Diriliş Textile 0,315 Textile, Clothing, Leather -5
41 Sanifoam Foam 0,001 Chemical, Petroleum Rubber, Plastic 0
42 Emek Electric Industry 0,001 Metal Goods, Machinery and Equipment Making 0
M. S. Kaya, S. Kendirli and M. Bilgin
40
Selected financial ratios are used as decision matrix. In step 2, the normalized matrix is formed by
dividing each of the proportions in the decision matrix by the square root of the sum of the squares of
the proportions. The weighted normalized matrix was obtained by weighting the normalized matrix. Equal weight was given to each decision criterion (financial ratio) while weighting process was made
and the weight given to each ratio was 1/9. After weighting, the maximum and minimum values for
each decision criterion (financial ratio) were determined as ideal solution points and negative ideal solution points.
After obtaining ideal and negative ideal solution points, the distance to ideal and non ideal points
were obtained by using 𝑆𝑖∗ = √∑ (𝑣𝑖𝑗 − 𝑣𝑗
∗)2𝑛𝑗=1 and 𝑆𝑖
− = √∑ (𝑣𝑖𝑗 − 𝑣𝑗−)2𝑛
𝑗=1 formulas. Finally,
the proximity to the ideal solution was calculated by using 𝐶𝑖∗ =
𝑆𝑖−
𝑆𝑖−+𝑆𝑖
∗ formula.
According to the results in the Table 3, the top five companies with the highest financial
performances in 2016 are; Sönmez Cotton, Federal-Mogul İzmit Piston and Pin, Gediz Packaging,
Çimbeton Cement and Polytechnic Metal. Additionally, Taç Agricultural Products, Diriliş Textile, Vanet Food Industry, Emek Electrical Industry and Sanifoam Sponge, are the ranked at the bottom of
the 2016 financial performance ranking with the lowest financial performances.
According to the results in the Table 4, the top five companies with the highest financial performances in 2016 are; Federal-Mogul İzmit Piston and Pin, Mega Polyethylene Foam, Gediz
Packaging, Politeknik Metal and RTA Laboratories.
Doğusan, Merko Food Industry Trade, Vanet Food Industry, Sanifoam Foam, Emek Electric Industry are the ranked at the bottom of the 2017 financial performance ranking with the lowest
financial performances.
According to the results in the Table 5, the top five companies with the highest financial
performances in 2018 are; Çimbeton, Federal-Mogul İzmit Piston and Pin, Gediz Packaging, Doğan Burda Magazine, Mega Polietilen Foam.
Taze Dry Food, Birlik Textile, Diriliş Textile, Sanifoam Foam and Emek Electric Industry are the
ranked at the bottom of the 2018 financial performance ranking with the lowest financial performances.
Federal-Mogul Izmit Piston and Pin company was ranked in the first two ranks every year between
2016-2018. Based on this information, it can be said that Federal-Mogul İzmit Piston and Pin
company consistently showed a high financial performance between 2016-2018. Sanifoam Foam and Emek Electric Industry are the last two companies in all years between 2016-
2018.
5. Conclusion
TOPSIS, which is one of the Multi Criteria Decision Making methods, is used in the evaluation of the past performance of companies or organizations as well as many decision making problems. In this
study, financial performance rankings of 42 firms included in BIST SME Industry index were
determined separately for each year between 2016-2018 by using TOPSIS method. The liquidity ratios
used in financial performance measurement are the ratios that show the financial performance of the firms in terms of their ability to pay their due debts, their activity ratios to show their effective use of
their assets, and their profitability ratios in terms of revealing the returns they generate as a result of
their activities. Therefore, the liquidity, efficiency and profitability of the companies were evaluated together in the financial performance measurement made with TOPSIS method.Different methods or
different financial ratios may be used in subsequent studies. In addition, the results can be compared
with the stock market performances of the firms.
References
Akbulut, R., & Coşkun, A. (2015). A Research on Financial Performance of Manufacturing Businesses That are Traded on BIST. Journal of Accounting & Finance.
Evaluation of Financial Performances of SMES…
41
Aytekin, A., & Karamaşa, Ç. (2017). Analyzing Financial Performance Of Insurance Companies
Traded In BIST via Fuzzy Shannon’s Entropy Based Fuzzy Topsis Methodology. Alphanumeric
Journal, 5(1), 71-84. Bakırcı, F., Shiraz, S. E., & Sattary, A. (2014). Financial Performance Analysis of Iron, Steel Metal
Industry Sector Companies in The Borsa Istanbul: DEA Super Efficiency and TOPSIS Methods.
Ege Akademik Bakis, 14(1), 9. Balcı, N. (2017). Financial Performance Analysis With TOPSIS Technique: A Case Study Of Public
University Hospitals in Turkey. Yönetim ve Ekonomi Araştırmaları Dergisi, 15(Özel Sayı 1), 155-
176. Başdar, C. (2019). Financial Performance Multicriteria Decision Making Methods. Bursa: Ekin
Publishing, 11.
İlkuçar, M., & Çifci, A. (2016). Performance evaluation of electricity generation companies traded on
BIST according to the financial parameters through the application of TOPSIS method. International Journal of Social Sciences and Education Research, 2(3), 1010-1021.
Kayalı,C., A. & Aktas, İ. (2018) Performance Evaluation and Analysis through the TOPSIS Method of
Firms in the Automotive Sector Trading in BIST. Karabuk University Journal of Social Sciences Institute. 8(1), 44-59.
Metin, S., Yaman, S., & Korkmaz, T. (2017). Determination of Financial Performance by TOPSIS and
MOORA Methods: A Comparative Application on BIST Energy Firms. Kahramanmaras Sutcu Imam University Journal of Social Sciences, 14 (2), 371-394.
OECD. (2017). Enhancing the Contributions of SMEs in a Global and Digitalised Economy.
Okka, O. (2009). Analytical Financial Management Theory and Problems. Ankara: Nobel Publishing,
p 104-114. Orçun, Ç., & Eren, B. S. (2017). Financial Performance Evaluation with TOPSIS Method: An
Application on XUTEK. Journal of Accounting & Finance, (75).
Özbek, A. (2017) Multicriteria Decision Making Methods and Problem Solutions with Excel Concept Theory Application. Ankara: Seçkin Publishing, p. 202-203.
Özçelik, H., & Kandemir, B. (2015). The Evaulation of the Financial Performancesof the Tourism
Enterprises Traded on BIST with TOPSIS Method. Balikesir University Journal of Social Sciences
Institute, 18(33). Özçelik, H., & Küçükçakal, Z. (2019). Analysis of Financial Performance of Financial Leasing and
Factoring Companies Traded on BIST by TOPSIS Method. Journal of Accounting and Finance,
(81). Sakarya, Ş., & Akkuş, H. T. (2015). Comperative Analysis of Traditional Ratios with Cash Flow
Ratios on Measuring Financial Performance: A Practice on BIST Cement Companies With
TOPSIS Method. Afyon Kocatepe University Economics and Administrative Sciences Journal, 17(1), 109-123.
3rdInternational Conference on Economic Research
24-25th October 2019, Alanya, Turkey
42
THE ROLE OF THE ACCIDENT INSURANCE IN AGRICULTURE FOR FARMERS
Agnieszka Parlińska
Warsaw University of Life Sciences –SGGW, Poland
Maria Parlińska
Helena Chodkowska University of Technology and Economics, Poland
Email:[email protected]
Abstract
Agriculture, in addition to mining and construction, is one of the most accident-producing branches
around the world. Such a high risk of accidents on farms arises from the complexity of the farmer's
working environment, the need to perform various activities requiring different skills, varying
atmospheric conditions, periodic stacking and numerous hazards occurring in the workplace. The
Agricultural Social Insurance Fund Act on agricultural insurance distinguishes two types of insurance
for farmers: accident, sickness and maternity insurance, and pension and disability insurance. The
provisions of this Act were aimed at: provide insured farmers with statutorily guaranteed social
assistance in connection with their old age or inability to work, promote generational rotation and
changes in the agrarian structure, shape conditions for safe work on farms, institutionally separate
social insurance for farmers.
This paper addresses aspects of the accident insurance for farmers in the agriculture in years 2010-
2018. Information and data were taken from the literature, current legal acts and from the reports of
the Ministry of Agriculture and Rural Development (MARD) as well from the Agricultural Social
Insurance Fund (KRUS) in Poland. The analysis was based on selected statistical measures which help
to answer the following questions:
1. What is a level of the accident insurance construction?
2. What trends can be observed in the number of accidents farmers reported to KRUS?
3. What are the main reasons of the most fatal accidents?
The act of social insurance for farmers defines an occupational accident as an unexpected
occurrence caused by an external factor which happened whilst conducting an activity on a farm, on
the way from the house to the farm and on the way back, as well as during usual activities conducted
away from the farm but connected with the farm.
The preventive activity of the KRUS conducted since 1993 brings visible effects. The numbers of
accidents at agricultural work are decreasing systematically. In 2018, farmers reported to KRUS 15
295 accidents, about 11 010 less than in 2010. According to statistics, most fatal accidents happened
due to ‘being run over, being struck, being caught by a moving vehicle’ and ‘falling’, ‘falling objects’,
‘sudden attack of illness’. Statistics show that there is no voivodship (territorial unit) in Poland where
there have been no recorded agricultural accident. There are still a high number of accidents in this
economic sector. This is why a detailed analysis of this particular work environment has been
conducted.
Key words: Insurance System, Evident System, Treads, Safety.
3rdInternational Conference on Economic Research
24-25th October 2019, Alanya, Turkey
43
FOOD SAFETY BEHAVIOUR OF HOUSEHOLD FOOD PREPARERS
IN AKWA IBOM STATE, NIGERIA
Ekaette S. Udoh
Akwa Ibom State University, Department of Agricultural Economics and Extension, Nigeria
Edet J. Udoh
University of Uyo, Department of Agricultural Economics and Extension, Nigeria Email: [email protected]
Abstract
Food borne illnesses still remain a public health challenge in developing countries. This study
examines the Food safety behaviour, here conceptualised simply as a wholistic measure of food safety
knowledge and practices, of household food preparers in AkwaIbom State, Nigeria. Cross-sectional data was collected, using a structured questionnaire, based on a multistage sampling procedure
resulting in a total of 457 respondents. Specifically, the study estimated the prevalence, margin and
intensity of food safety behaviour of household food preparers. As a precursor to measuring prevalence, margin and intensity, twenty nine (29) food safety knowledge items and twenty two (22)
food safety practices, a total of 41 items were used as the basis for obtaining a food safety behaviour
index, fsbi. This food safety behaviour index is, summarily, a measure of a household food preparers’
food safety knowledge and practices expressed as a proportion of all the food safety knowledge and practice items. The mean fsbi, 0.64, was used to dichotomize household food preparers into well
behaved and poorly behaved. The margin and intensity measures are based on the proportion of the
household food preparers that are poorly behaved. Additionally, a fractional probitregression was estimated to determine the factors affecting the food safety behaviour of household food preparers in
the study area. The results, of the percentage prevalence, show that, given the mean fsbi as critical
index, 52% of household food preparers are poorly behaved. A disaggregated mean, another measure of prevalence, reveals that the mean fsbifor poorly behaved and well behaved household food
preparers is 0.32 and 0.65 respectively. The mean margins, 0.07 and 0.04, are the figures by which the
fsbi of household food preparers that are poorly behaved and all households respectively could be
increased to ensure household food preparers are all well behaved. The intensity values, 0.02 and 0.01 indicate that the gap between the poorly behaved and well behaved is wider when the mean
proportionate margin is expressed as a function of the total number of households that poorly behaved
than the total number of households. Output from the fractional regression reveal that a household food preparer who is educated and confident in safety labels is 0.8% and 6% times more likely to be
well behaved than one who is not. It can be concluded based on results that even though the margin
between well behaved and poorly behaved is not so intense, much is still left to be desired as regards
the overall prevalence of food safety knowledge and practices of households in the study. Keywords:Food Safety, Prevalence, Margin, Intensity, Fractional Probit Regression.
1. Introduction
As an increasing concern on the global frontier, food safety largely sways public health across the
globe (Lam, Remais, Fung, Xu, & Sun, 2013). An approximation by World Health Organization reveals that about 600 million almost 1 in 10 people in the world get sick subsequent to the ingestion
of infected food and 420,000 die every year, resulting in the loss of 33 million promising life years
(World Health Organization, 2017). According to Mukhopadhyay et al(2012), in developing countries,
approximately 70% of cases of food-borne disease, specifically diarrhea are not unconnected with consumption of infected food. Pathogens can infect food from all stages of production to distribution
and consumption of food through contaminated equipment, food handlers and also final consumers
(Hedberg, MacDonald and Osterholm, 1994). A fair number of factors influence the occurrence of food-transmitted diseases; some of the more critical ones are contaminated food supplies,
Food Safety Behaviour of Household Food Preparers...
44
inappropriate food storage, providing food from sources of poor hygiene, and poor personal
cleanliness (Lynch et al 2006).
Most cases of food borne illness are preventable if food safety guiding rules are adhered to from production to consumption. The home food preparer is a critical link in the chain to prevent food borne
illness and needs to be aware of how to minimize the presence of pathogens or other disease causing
substances in food. Food can be mishandled at a wide rand of places running the gamut from food preparation to handling and storage. (Mederios, Hillers, Kendall, & Mason, 2001). Bas, Ersun, and
Kıvanc (2006) found that there is a dearth of information among food handlers with reference to issues
bordering on food safety (critical temperatures of hot or cold ready-to-eat foods, acceptable refrigerator temperature ranges, and cross-contamination etc.). Relatedly, more studies have examined
food hygiene knowledge and practices in Nigeria in response to the unsettling findings stemming from
various parts of the globe. In Nigeria, poor food safety practices were reported in Nigeria’s Federal
Capital Territory (Ifeadike, Ironkwe, Adogu, &Nnebue, 2014). Musa and Akande (2003) revealed that about 54 per cent of food handlers examined reuse water repeatedly for washing and cleaning without
replacing.Most studies either report food safety knowledge and practices separately, or food safety
knowledge and food safety practices only. This study, however, against the aforegoing background, wholistically conceptualises and measures food safety knowledge and practices as behaviour of
household food preparers in the study area.
2. Materials and Methods
2.1 Study Area
The study will be conducted in AkwaIbom State, located in the South-South geopolitical and South
East ecological zones of Nigeria. The State lies between 4º33” and 5º33” North latitudes, and 7º35”
and 8º25 East longitudes. With an estimated total area is put at 7,245,935km2, and a shoreline of 129km on the Atlantic Ocean to the South, it borders with Cross River State to the East, Abia State to
the North, and Rivers State to the West (Ajana 1996 and Uwatt 2000).The population of the State
according to the 1991 census was 2,359,736, out of which 1,162,430 are males while 1,197,306 are
females (National Population Commission, NPC 1991). The 2006 provisional census puts the population at 3,920,208, out of which 2,044,510 are males while 1,875,698 are females.
The major ethnic groups in the state are Ibibio, Anang and Oron with Ibibio being the main
language. The above population lives within the tropical rainforest zone with two major seasons: rainy season (May to October) and a dry season (November to April). Annual rainfall ranges between
2400mm along the coast and 2000mm.The State is divided into six (6) agricultural zones namely-
Abak, Etinan, Eket, Uyo, Oron and IkotEkpene.
2.2 Data Collection
Data for the study was cross-sectional. This primary data was obtained using a structured questionnaire that was administered to households. Furthermore, a multistage sampling procedure was
applied in this study. In the first stage, three agricultural zones were randomly selected out of the six
agricultural zones, namely: Uyo, Eket and IkotEkpene. Next, three local governments each were purposively to give urban, semi-urban and rural representation to the study. Thirdly, six communities
were randomly selected from each of the selected Local governments. In the last stage 10 households
were randomly selected, giving a total of 540 households (180 from each selected zone). However, 457 questionnaires were duly and properly completed and hence the analysis was based on this
number. Data was collected in 2018.
E. S. Udoh and E. J. Udoh
45
2.3 Estimating Prevalence, Margin and Intensity
2.3.1 Food Safety Behaviour Index
Food Safety Behaviour Index (fsbi), a compound measure of food safety knowledge and practices
expressed as a proportion of the 29 and 22 food safety knowledge and food safety practice items respectively, is obtained as follows:
fsbi= 88/117*fsps + 29/117*fsks
*88:Using a 5 point likert scale, food safety practice score, fsps, of 0,1, 2, 3 and 4 were assigned for the following responses respectively; never, not often, sometimes, most times and always. 4 multiplied
by 22 gives 88- the highest possible value of fsps.
*29: Values of 0 and 1, food safety knowledge score, fsks, were assigned to incorrect and correct
responses of household food preparers to food safety knowledge statements marked true or false. *117: Sum of 88 and 29. fsbi is expressed as a weighted function, weights of 0.75 and 0.25
assigned to fsps and fsks, of the measures of food safety practices and food safety knowledge.
2.3.2 Percentage Prevalence
The first measure is simply a percentage of households who fall below (poor) and above/equal to (good) the critical scores. This measure uses an indicator function that takes on a value of 1 poor (and
good) households in terms of food safety behaviour, alternately and expresses it as a proportion of the
total number of households. This is given as:
𝑓𝑠𝑏𝑖𝑝𝑝 =∑1(𝑓𝑠𝑏𝑖 < 0.64)1 𝑁⁄
𝑁
𝑖=1
And
𝑓𝑠𝑏𝑖𝑝𝑝 =∑1(𝑓𝑠𝑏𝑖 ≥ 0.64)1 𝑁⁄
𝑁
𝑖=1
N = total number of households (= 457)
2.3.3Disaggregated mean Prevalence: A second measure of prevalence is also obtained. This is
essentially a mean computed based on actual values of fsbi (as opposed to the use of an indicator
function that assigns 1 to households that are poor and good, alternately, in terms of food safety behaviour). This measure is obtained as follows:
𝑓𝑠𝑏𝑖 =∑(𝑓𝑠𝑏𝑖 < 0.64) 1 𝑛⁄
𝑁
𝑖=1
n = number of households with fsbi< 0.64
𝑓𝑠𝑏𝑖𝑝𝑎 =∑(𝑓𝑠𝑏𝑖 ≥ 0.64) 1 𝑛⁄
𝑁
𝑖=1
n = number of households with fsbi ≥ 0.64
2.3.3 Margin
The mean margin and the mean proportionate margin are the measures of the margin, which is basically a deviation from the threshold score by poorly behaved households in the study area,
reported in this section. These are computed based on the number of poorly behaved households and
all households in the study area -the rationale for this being that the number of poorly behaved households and all the households provide the basis for conclusion in terms of targeted interventions
(ones geared towards poorly behaved households) and untargeted ones (ones spread across all
households).
Food Safety Behaviour of Household Food Preparers...
46
2.3.4 Mean Margin
This measure of the margin is obtained as follows:
𝑓𝑠𝑏𝑖𝑚𝑚 =∑(0.64−< 0.
𝑁
𝑖=1
64)1
𝑁
N = total number of households (= 457) And
𝑓𝑠𝑏𝑖𝑚𝑚 =∑(0.64−< 0.
𝑁
𝑖=1
64)1
𝑛
n = number of households with fsbi< 0.64
2.3.6Mean Proportionate Margin: This measure of the margin, which is a deviation from the
threshold score expressed as a proportion of the threshold score, is given as follows:
𝑓𝑠𝑏𝑖𝑚𝑝𝑚 =∑(0.64−< 0.64
0.64)
𝑁
𝑖=1
1
𝑛
n = number of households with fsbi< 0.64
𝑓𝑠𝑏𝑖𝑚𝑝𝑚 =∑(0.64−< 0.64
0.64)
𝑁
𝑖=1
1
𝑁
N = total number of households (= 457)
2.3.7Intensity:This is the mean proportionate margin squared. It measures the extremity of the
deviation of the poorly behaved from the mean (the threshold score) and is obtained as follows:
𝑓𝑠𝑏𝑖𝑖𝑛 =∑(0.64−< 0.64
0.64)2𝑁
𝑖=1
1
𝑛
n = number of households with fsbi< 0.64
𝑓𝑠𝑏𝑖𝑖𝑛 =∑(0.64−< 0.64
0.64)2𝑁
𝑖=1
1
𝑁
N = total number of households (= 457)
2.4 Estimating Factors Affecting Food Safety Knowledge
The probability of a household being dietary diverse is determined essentially by socio-economic
characteristics. Probit models, as contrasted with linear probability models, have conditional probabilities that are nonlinearly related to the independent variable(s). Furthermore, probit functions
have the characteristic of approaching 0 and 1 asymptotically, hence the predicted probabilities are
always sensible. In addition, the probit model is based on the standard normal cumulative density function (CDF). This is defined basically as follows:
𝐹(𝑍) = ∫2𝜋12⁄
𝑧
−∞
𝑒−𝑧2
2⁄ 𝑑𝑧
whereZ is a standard normal variable and e is the base of the natural log. In a probit model since the standard normal CDF replaces the linear function, what is estimated is as given below:
𝐸(𝑌|𝑥𝑖)= Pr(𝑌 = 1|𝑥𝑖)= 𝐹(𝛽0 + 𝛽𝑖𝑋𝑖) = ∫ (2𝜋)1 2⁄𝛽0𝛽𝑖𝑥𝑖−𝛼
𝑒𝛽0+𝛽𝑖𝑥𝑖
2 𝑑(𝛽0 + 𝛽𝑖𝑋𝑖).
The β terms are not estimated using Ordinary Least Squares regression but a technique known as
maximum likelihood estimation. This estimation finds values for the parameters (βs) that maximize the probability of observing the Y values in the sample with the given X values. Sometimes it is more
convenient for a researcher to express the dependent variable as a fraction, percentage or proportion.
In such an instance, as is the case in this study, fractional probit regressions, a variant of the traditional
E. S. Udoh and E. J. Udoh
47
probit regression is used. In simple terms, the main difference is that in this context the dependent
variable is 0≤Y≤1.
The coefficients produced by estimating a probit model provide the change in the Z (standard normal) value for a unit change in the dependent variables. In order, therefore, to obtain the impact of
the independent variables on the probability of observing the outcome, marginal effects are further
estimated. Food safety knowledge of household food preparers is expressed as a proportion of a maximum possible value and is hence a value that lies between 0 and 1. The factors affecting the
probability of a household being dietary diverse are the explanatory variables for the fractional probit
model. These variables are: [X1] = Age, [X2] = Education, [X3] = Household size, [X4] =Monthly income of household, [X5] =Children below 5 years, [X6] =Adults above 65 years, [X7] = Confidence
in Safety labels.
3. Results and Discussion
3.1 Summary Statistics of Continuous Variables
Table 1.Summary Statistics of the Continuous Variables
Variables Mean Standard
Deviation
Minimum Maximum
Age(years) 41 11 18 78
Monthly income(figures in Naira) 94793.03 71297.76 10000 850000
Education(years) 13 4 0 23
Household Size(figures) 5 1 1 9
Children below five (5) years(figures) 1 1 0 6
Adults above 65 years(figures) 1 1 0 5
Source: Field Survey, 2018
3.2 Descriptive Statistics of Dummy Variables
Table 2 shows that over 90% of the population are married, employed females. This formed the
basis for which marital status, gender and employment status as socioeconomic characteristics of the
population were excluded from the fractional probit regression as these factors are almost completely determined.
Table 2.Descriptive Statistics of Dummy Variables
Marital Status Frequencies Percentages
Single 40 8.75
Married 417 91.25
Total 457 100
Employment Status
Unemployed 12 2.63
Employed 445 97.37
Total 457 100
Gender
Male 1 0.22
Female 456 99.78
Total 457 100
Confidence in Safety Labels
Confident 336 73.52
Not Confident 121 26.48
Total 457 100
Source: Field Survey, 2018.
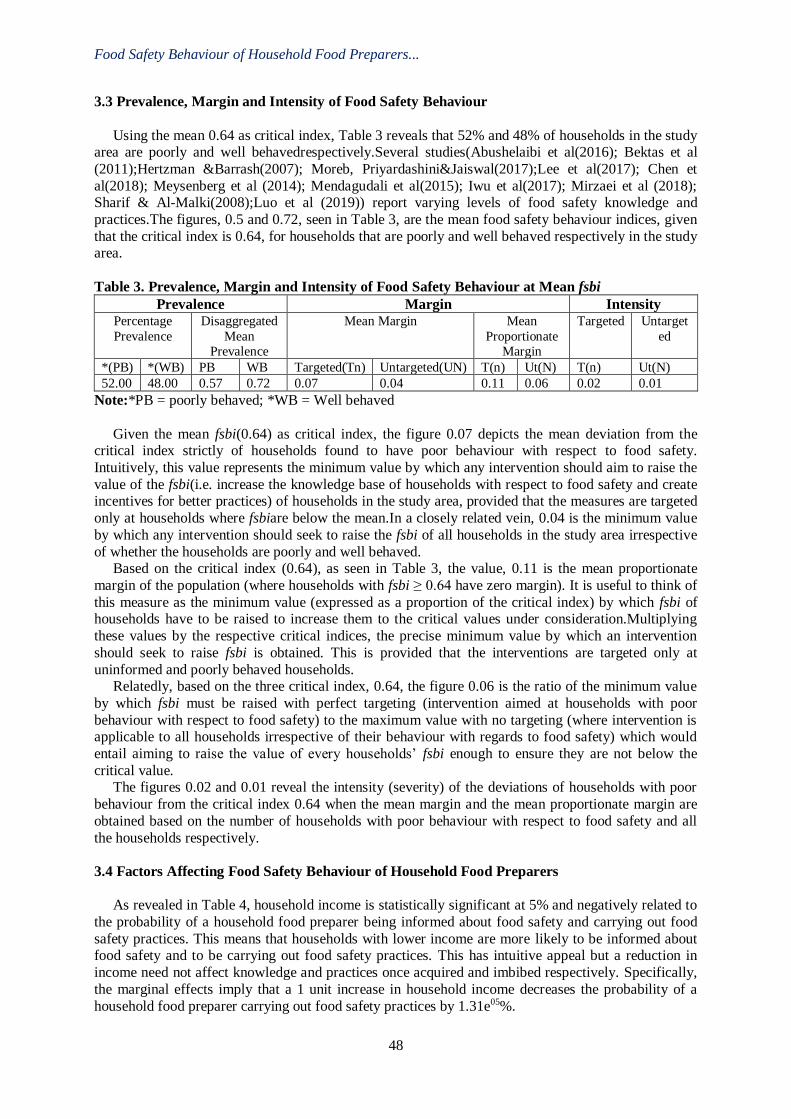
Food Safety Behaviour of Household Food Preparers...
48
3.3 Prevalence, Margin and Intensity of Food Safety Behaviour
Using the mean 0.64 as critical index, Table 3 reveals that 52% and 48% of households in the study area are poorly and well behavedrespectively.Several studies(Abushelaibi et al(2016); Bektas et al
(2011);Hertzman &Barrash(2007); Moreb, Priyardashini&Jaiswal(2017);Lee et al(2017); Chen et
al(2018); Meysenberg et al (2014); Mendagudali et al(2015); Iwu et al(2017); Mirzaei et al (2018); Sharif & Al-Malki(2008);Luo et al (2019)) report varying levels of food safety knowledge and
practices.The figures, 0.5 and 0.72, seen in Table 3, are the mean food safety behaviour indices, given
that the critical index is 0.64, for households that are poorly and well behaved respectively in the study area.
Table 3. Prevalence, Margin and Intensity of Food Safety Behaviour at Mean fsbi
Prevalence Margin Intensity Percentage
Prevalence
Disaggregated
Mean Prevalence
Mean Margin Mean
Proportionate Margin
Targeted Untarget
ed
*(PB) *(WB) PB WB Targeted(Tn) Untargeted(UN) T(n) Ut(N) T(n) Ut(N)
52.00 48.00 0.57 0.72 0.07 0.04 0.11 0.06 0.02 0.01
Note:*PB = poorly behaved; *WB = Well behaved
Given the mean fsbi(0.64) as critical index, the figure 0.07 depicts the mean deviation from the critical index strictly of households found to have poor behaviour with respect to food safety.
Intuitively, this value represents the minimum value by which any intervention should aim to raise the
value of the fsbi(i.e. increase the knowledge base of households with respect to food safety and create incentives for better practices) of households in the study area, provided that the measures are targeted
only at households where fsbiare below the mean.In a closely related vein, 0.04 is the minimum value
by which any intervention should seek to raise the fsbi of all households in the study area irrespective
of whether the households are poorly and well behaved. Based on the critical index (0.64), as seen in Table 3, the value, 0.11 is the mean proportionate
margin of the population (where households with fsbi ≥ 0.64 have zero margin). It is useful to think of
this measure as the minimum value (expressed as a proportion of the critical index) by which fsbi of households have to be raised to increase them to the critical values under consideration.Multiplying
these values by the respective critical indices, the precise minimum value by which an intervention
should seek to raise fsbi is obtained. This is provided that the interventions are targeted only at
uninformed and poorly behaved households. Relatedly, based on the three critical index, 0.64, the figure 0.06 is the ratio of the minimum value
by which fsbi must be raised with perfect targeting (intervention aimed at households with poor
behaviour with respect to food safety) to the maximum value with no targeting (where intervention is applicable to all households irrespective of their behaviour with regards to food safety) which would
entail aiming to raise the value of every households’ fsbi enough to ensure they are not below the
critical value. The figures 0.02 and 0.01 reveal the intensity (severity) of the deviations of households with poor
behaviour from the critical index 0.64 when the mean margin and the mean proportionate margin are
obtained based on the number of households with poor behaviour with respect to food safety and all
the households respectively.
3.4 Factors Affecting Food Safety Behaviour of Household Food Preparers
As revealed in Table 4, household income is statistically significant at 5% and negatively related to
the probability of a household food preparer being informed about food safety and carrying out food
safety practices. This means that households with lower income are more likely to be informed about food safety and to be carrying out food safety practices. This has intuitive appeal but a reduction in
income need not affect knowledge and practices once acquired and imbibed respectively. Specifically,
the marginal effects imply that a 1 unit increase in household income decreases the probability of a
household food preparer carrying out food safety practices by 1.31e05%.
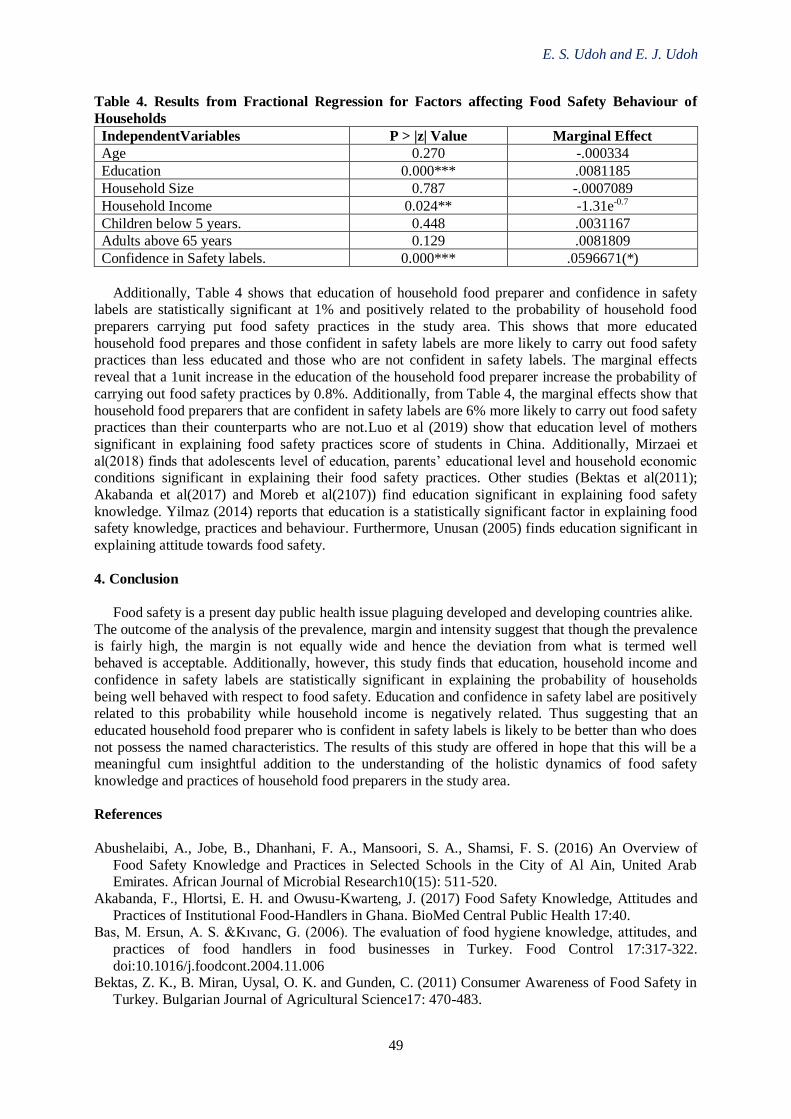
E. S. Udoh and E. J. Udoh
49
Table 4. Results from Fractional Regression for Factors affecting Food Safety Behaviour of
Households
IndependentVariables P > |z| Value Marginal Effect
Age 0.270 -.000334
Education 0.000*** .0081185
Household Size 0.787 -.0007089
Household Income 0.024** -1.31e-0.7
Children below 5 years. 0.448 .0031167
Adults above 65 years 0.129 .0081809
Confidence in Safety labels. 0.000*** .0596671(*)
Additionally, Table 4 shows that education of household food preparer and confidence in safety labels are statistically significant at 1% and positively related to the probability of household food
preparers carrying put food safety practices in the study area. This shows that more educated
household food prepares and those confident in safety labels are more likely to carry out food safety practices than less educated and those who are not confident in safety labels. The marginal effects
reveal that a 1unit increase in the education of the household food preparer increase the probability of
carrying out food safety practices by 0.8%. Additionally, from Table 4, the marginal effects show that
household food preparers that are confident in safety labels are 6% more likely to carry out food safety practices than their counterparts who are not.Luo et al (2019) show that education level of mothers
significant in explaining food safety practices score of students in China. Additionally, Mirzaei et
al(2018) finds that adolescents level of education, parents’ educational level and household economic conditions significant in explaining their food safety practices. Other studies (Bektas et al(2011);
Akabanda et al(2017) and Moreb et al(2107)) find education significant in explaining food safety
knowledge. Yilmaz (2014) reports that education is a statistically significant factor in explaining food safety knowledge, practices and behaviour. Furthermore, Unusan (2005) finds education significant in
explaining attitude towards food safety.
4. Conclusion
Food safety is a present day public health issue plaguing developed and developing countries alike.
The outcome of the analysis of the prevalence, margin and intensity suggest that though the prevalence is fairly high, the margin is not equally wide and hence the deviation from what is termed well
behaved is acceptable. Additionally, however, this study finds that education, household income and
confidence in safety labels are statistically significant in explaining the probability of households
being well behaved with respect to food safety. Education and confidence in safety label are positively related to this probability while household income is negatively related. Thus suggesting that an
educated household food preparer who is confident in safety labels is likely to be better than who does
not possess the named characteristics. The results of this study are offered in hope that this will be a meaningful cum insightful addition to the understanding of the holistic dynamics of food safety
knowledge and practices of household food preparers in the study area.
References
Abushelaibi, A., Jobe, B., Dhanhani, F. A., Mansoori, S. A., Shamsi, F. S. (2016) An Overview of
Food Safety Knowledge and Practices in Selected Schools in the City of Al Ain, United Arab Emirates. African Journal of Microbial Research10(15): 511-520.
Akabanda, F., Hlortsi, E. H. and Owusu-Kwarteng, J. (2017) Food Safety Knowledge, Attitudes and
Practices of Institutional Food-Handlers in Ghana. BioMed Central Public Health 17:40. Bas, M. Ersun, A. S. &Kıvanc, G. (2006). The evaluation of food hygiene knowledge, attitudes, and
practices of food handlers in food businesses in Turkey. Food Control 17:317-322.
doi:10.1016/j.foodcont.2004.11.006 Bektas, Z. K., B. Miran, Uysal, O. K. and Gunden, C. (2011) Consumer Awareness of Food Safety in
Turkey. Bulgarian Journal of Agricultural Science17: 470-483.
Food Safety Behaviour of Household Food Preparers...
50
Chen,Y., Ji, H., Chen,L., Jiang, R.,and Wu, Y.(2018) Food Safety Knowledge, Attitudes and Behavior
among Dairy Plant Workers in Beijing, Northern China. International Journal of Environmental
Research and Public Health 15(63): 1-9. Hertzman, J. and Barrash, D. (2007)An Assessment of food safety knowledge and practices of catering
employees. British Food Journal109(7):562-576.
Ifeadike, C. O., Ironkwe, O. C., Adogu, P. O., &Nnebue, C. C. (2014). Assessment of the food hygiene
practices of food handlers in the Federal Capital Territory of Nigeria. Tropical Journal of Medical
Research 17 (1):10-15. Iwu, A.C.,Uwakwe,K.A., Duru,C.B., Diwe,K.C., Chineke,H.N., Merenu,I.A.,Oluoha,U.R.,
Madubueze,U.C.,Ndukwu, E and Ohale, I. (2017) Knowledge, Attitude and Practices of Food
Hygiene among Food Vendors in Owerri, Imo State, Nigeria.Occupational Diseases and
Environmental Medicine,5:11-25. Lam, H. M., Remais, J., Fung, M. C., Xu, L., & Sun, S. M. (2013). Food supply and food
safety issues in China. Lancet 381(9882):2044–2053.
Luo,X., Xua, X.,Chena, H, Baie,R., Zhangf, Y.,Houg, X., Zhanga F., Zhanga,Y., Sharmah,M., Zenga,H., and Zhao, Y.(2019) Food safety related knowledge, attitudes, and practices (KAP)
among the students from nursing, education and medical college in Chongqing, China.Food
Control 99:181-188. Lynch M, Painte J, Woodruff R, Braden C. Surveillance for foodborne-disease outbreakes United
States1998-2002. MMWR SurveillSumm. (2006) 55:1-42. PMid:17093388
Mederios, L., Hillers, V., Kendall, P., & Mason, A. (2001). Evaluation of food safety education for
consumers. Journal of Nutrition Education and Behavior, 33(S1), S27–S34. Mendagudali,R.R., Akka,K.D., Swati,I.A.,Shedol,D.T., and Bendigeri1, D.N (2015) Knowledge,
attitude, and practices of food safety among women of Khaza bazar, the urban field practice area of
KBN Institute of Medical Sciences, Kalaburagi, Karnataka International Jouurnal of Medical Science and Public Health5(3): 516-520.
Meysenburg R., Albrecht J. A., Litchfield R., Ritter-Gooder P. K.(2014) Food Safety Knowledge,
Practices and Beliefs of Primary Food Preparers in Families with Young Children: A Mixed
Methods Study. Appetite, 73:121-131. Mirzaei A, Nourmoradi H, Zavareh MSAZ, Jalilian M, Mansourian M, Mazloomi S, Mokhtari N,
Mokhtari F. Food Safety Knowledge and Practices of Male Adolescents in West of Iran. Open
Access MacedJournal of Medical Sciences, 6(5):908-912. Moreb,N.A, Priyadarshini, A and Jaiswal, A.K. (2017) Knowledge of Food Safety and Food Handling
Practices amongst Food Handlers in the Republic of Ireland Food Control 80: 341-349
Mukhopadhyay, P., Joardar G.K, Bag, K, Samanta, A., Sain, S., and Koley, S. (2012). Identifying key risk behaviors regarding personal hygiene and food safety practices of food handlers working in
eating establishments located within a hospital campus in Kolkata. Al Ameen J Med Sci, 5(1):21-
28.
Musa, O. I., &Akande, T. M. (2003). Food hygiene practices of food vendors in secondary schools in Ilorin. The Nigerian Postgraduate Medical Journal, 10 (3), 192-196.
Sharif L., and Al-Malki T. (2010) Knowledge, Attitude and Practice of Taif University Students on
Food Poisoning. Food Control, 21: 55-60. Unusan N. (2005) Consumer Food Safety Knowledge and Practices in the Home in Turkey. Food
Control,18:45-51.
World Health Organization.FoodsafetyKey facts. Available online: http://www.who.int/ news-room/fact-sheets/detail/food-safety.
Yilmaz E., OramanY.,Unakitan G. and Inan I. H.,(2014) Consumer Food Safety Knowledge, Practices
and Differences in Behaviours in Thrace Region of Turkey. Journal of Agricultural Sciences, 21:
279-287.
3rd International Conference on Economic Research
24-25th October 2019, Alanya, Turkey
51
GENERAL EQUILIBRIUM IMPACTS OF TAX POLICIES ON WELFARE OF
HOUSEHOLDS IN TAJIKISTAN
Maftuna Khakimova
Tajik State Finance and Economics University, Tajikistan
Email: [email protected]
Abstract
During the last 20 years, microsimulation models have been increasingly applied inqualitative and
quantitative analysis of public policies. This paper presents an approach to bring together
microsimulation and Computable General Equilibrium (CGE) model to perform distributional analysis
of tax policy in transition country, like Tajikistan. Particular attention is paid to applications relating to
aspects of economic growth and political economy. Applications in which macro, CGE and
microsimulation models are either layered or integrated are considered. It is demonstrated that
proposed approach are appropriate for different level problems. For short-run impact analysis,
microsimulation on its own may be appropriate. For longer-run analyses, where interest is in the
interrelationship between changes in disposable income, consumption and labour supply, these models
need to be supplemented a combination of microsimulation on the one hand, and general equilibrium
price changes or changes in macro variables on the other hand. It is argued that for policy analysis,
microsimulation may adequately be combined with macro CGE models.It then discusses social
welfare analysis permitted by microsimulation techniques and points to the limits of present
approaches and some directions for future developments.
Keywords: Evaluation of Public Policies, Inequality, Microsimulation, Poverty, Redistribution.
1. Introduction
The purpose of the paper is to explore how microsimulation can be combined with CGE and
macro modelling techniques to study distributional issues in transition countries, like Tajikistan. This
is an area of great current interest. (See, for example, Agénor et al., 2006; Cockburn, 2006; Cogneau
and Robilliard, 2006; Bourguignon and Savard, 2008.) While microsimulation is essential in
modelling the distributive effects of taxes and transfers, it is limited by the fact that it is often non-
behavioural and by its inability to model prices, wages and macro variables. CGE models, on the other
hand, have in the past generally lacked the rich distributional detail found in microsimulation. The
solution that is increasingly being advocated is to combine these different forms of modelling, either
through „layering‟ the models, or through their integration.
Different combinations of models are needed when dealing with different issues. For some
purposes it is sufficient to stick with just one of the standard model types. For example, in some cases
there may be little reason to expect complex distributional impacts and standard CGE modelling, with
its representative household groups, may be enough. Conversely, if interest centres on distributional
impacts and there is reason to believe that general equilibrium price effects will be unimportant, then
conventional microsimulation may be sufficient. But there are cases where combining the approaches
is necessary to get an accurate picture. A prototypical case is that of removing agricultural protection
in developing countries. Tariff removal leads to lower food prices, benefitting poor consumers. On the
other hand, lower agricultural prices reduce the wages of agricultural labourers, many of whom are
also poor. The result is that some of the poor will benefit and others will lose. CGE is needed to
capture the wage and price effects, and microsimulation is needed to net out gains and losses for
individual households, allowing accurate distributional analysis to be performed.
Currently, in the developing world, the leading distributional issues surround the impact of factors
like trade liberalisation, adjustment policies (i.e. tax policy) and financial crises on poverty and overall
income inequality. In the transition economies similar issues are also important, but there are features
that give some of these countries important aspects in common with higher income countries. CIS and
the East European transition countries, although still poor relative to the West, are highly urbanized
General Equilibrium Impacts of Tax Policies …
52
and industrialized. The portion of the economy in the informal sector is also relatively small compared
with many developing countries. These aspects mean that food price and agricultural issues, for
example, are less important than in many developing countries. Also, the tax, benefit and pension
issues that face members of a formal-sector industrial workforce are more important. Conventional
microsimulation has been developed to analyze policy issues and distributional impacts in highly
urbanized and industrialized societies, and may therefore be more applicable and relevant in these
transition countries than in many developed countries (DCs).
While there have been a few important contributions, neither microsimulation nor CGEmodelling
are so far very advanced in most transition countries.Part of the reason may lie in data requirements
and lack of modelling resources. And part may lie in the uncertainty about how to model these
economies. But it may also be that the pace of change has been so rapid as to restrict the payoff to, and
applicability of, such modelling. CGE models in particular assume that the base year is one of
equilibrium, which is problematic. If transition begins to proceed in a more orderly way, better data
become available, and more consensus develops about how to model these economies, improved
prospects for microsimulation and CGE work will arise.
CGE and standard macro models provide static analyses. Ultimately, one is interested in the
connection between growth and other phenomena including income distribution. There has been some
interesting work in this area, but it is to be hoped that micro-macro links will extend more to dynamic
modelling in the future. Tax and benefit changes can affect growth, for example through impacts on
saving and investment, human capital formation, fertility, innovation, and incentives for the adoption
of new technology. And trade reforms can stimulate growth through the expansion of export industries
and FDI, as well as through capital accumulation/technology effects – at the same time generating
possibly complex distributional impacts.
2. Background
To date, significant effort has already been done in Tajikistan to reduce poverty. Between 2000 and
early 2015, poverty level declined from 83% to approximately 31%. Tajikistan entered the list of 10th
of the world's leading countries in terms of poverty reduction rates over the past 15 years. The
Government of the Republic of Tajikistan aims for ambitious goals by 2030 - this is Gross Domestic
Product (GDP) acceleration twice, poverty reduction by 20% and middle class expansion. Today, the
GDP rate is 6,8%, gross capital formation – 28,9% of GDP, tax revenues – 23,4% of GDP, annual
population growth – 2,4% household consumption – 84,6% of GDP, import of goods and services –
42,3% of GDP. The tax system of the Republic of Tajikistan has been changed for several times from
the beginning of independence (1991). Nowadays, it consists of 8 republican and 2 local taxes. The
main share of tax revenues are indirect taxes (VAT, excises) which accounts for 46%.
The National Development Strategy of the Republic of Tajikistan for the period 2030 sets the task
of tax administration improvement in order to increase the tax collection, reduce administrative burden
on responsible taxpayers, increase transparency and predictability of the tax system. The Strategy also
emphasizes the role of the Tajik tax system as an important component of public industrial policy,
where sets the task of improving the Tax Code of the Republic of Tajikistan in order to create
conditions for inclusive development of the country. The results of the government's measures on tax
legislation reform will inevitably affect all levels of society, all sectors of industry and regions of the
country, therefore the importance of understanding and forecasting the possible consequences of the
reforms is beyond doubt. Moreover, assessing the consequences of reforms is also important for the
formation of appropriate compensatory measures to prevent negative changes in the structure of
production and income of the population.
Three different consequences might occur and should be analyzed with regard to changes in tax
legislation:
Reducing the tax burden on taxpayers will lead to a significant reduction in budget revenues.
Compensation for losses could be achieved through the introduction of new taxes or excises, and/or on
the other hand, by expanding the tax base through exit a part of production turnover from shadow
economy
Reducing the tax burden will cause changes of production structure, export and import flows,
relative prices of goods, income from production factors, economic growth rates. Thus, this will lead
M. Khakimova
53
to changes in demand for production factors, in particular, this will affect the level and structure of
employment;
The changes described above will directly affect labor and transfer incomes of the
population. In turn, this will lead to changes in the level of inequality, poverty, welfare.
3. Research Approach
Heterogeneous agent models have become a standard tool in macroeconomics. This approach
added more richness and realism to macroeconomic models and allowed for the exploration of topics
related to distributional issues that could not be otherwise addressed. However, there often remains a
lack of detail in the way policy instruments are incorporated into dynamic general equilibrium models.
The gap between the rich heterogeneity in model agents and lack of policy detail can be especially
striking in the context of models used to evaluate tax policy. This gap is often due to the intractability
of modeling the details of realworld policy.
There are many publications devoted to various policy analysis by General Equilibrium Model
(GEM) approach both for developed and developing countries. Thus, for developed countries Drygalla
et al. (2016) used the Dynamic Stochastic General Equilibrium (DSGE) model to analyze the effects
of the stimulus packages adopted by the German government. Krueger and Ludwig (2016) examined
policy relevant questions regarding tax policy and have a rich model comprised of agents with
heterogeneous skill-levels, assets, and age. In particular they model the tax policy using linear tax
functions. Models at the frontier of the dynamic of analysis of fiscal policy, such as Nishiyama (2015),
impose tax functions that are progressive but do not allow for marginal rates on a particular income
source to be a function of other income. Recently, DeBacker et al. (2015) developed large scale
overlapping generations model with heterogeneity across the lifecycle and over earnings ability types,
where an increase in income tax rates and a progressive wealth tax have been considered. Individual
effective tax rates are integrated and marginal tax ratesare computed from a microsimulation (partial
equilibrium) model of Tax policy with a dynamic general equilibrium model of tax policy that can
provide macroeconomic analysis or dynamic scores of tax reforms (DeBacker et al., 2017).
The research in the scope of developing countries is advanced by Hauner (2008). He proposed the
DSGE model approach to analyze policy options for Pension system in Russia. Davies (2002) devoted
to tax policy implications on households income in transition economies by using Computable General
Equilibrium (CGE) model.
The research methodology proposed in this study is one of the newest in the world economic
science and has been used widely in the last years in many developing and developed countries in
order to examine the impact of various macroeconomic reforms and shocks on various components of
the economic system. One of the advantages of this methodology is usage of national accounts data,
which makes it easy to modify methodology for a specific country, as well as analyze economic
processes in dynamics.
The idea of this approach is proposition a flexible functional form for tax rates that has the
smoothness and monotonicity properties necessary for solving a Dynamic General Equilibrium (DGE)
model while retaining much of the heterogeneity found in microsimulation model tax data. The
proposed tax functions can capture progressive rates and account for the influence of income across
sources on marginal rates. That is, tax functions are multivariate, where income from one source
affects marginal rates from other sources of income. Second, we propose a methodology where one
can easily fit these tax functions using the output of a microsimulation model. The use of a
microsimulation model is important since this model is able to capture the rich detail of tax policy and
its impact on households with different economic and demographic characteristics. The tax functions
we propose then map the results of themicrosimulation model, the computed average and marginal tax
rates, into parameterizedfunctions that can be used in a macroeconomic model. We tailor our functions
here to a specificmicrosimulation model and DGE model, but the methodology we propose can be
scaled up ordown to account for models with more or less heterogeneity. A detailed analysis of
thisresearch methodology is presented in DeBacker et al.(2017).
General Equilibrium Impacts of Tax Policies …
54
4. The Model Specification
To illustrate how tax policy enters a macroeconomic dynamic general equilibrium model, we use
the overlapping generations model of DeBacker et al. (2015). In this proposal we are not able to
provide full description of the model. However, we focus specifically on the details of the model that
are relevant for describing how and where taxes enter the DGE model. The presented approach in this
research has two distinct advantages. It allows the DGE model to capture more detail of tax policy in
previously used methods. It also greatly reduces the cost to incorporating rich policy detail and
counterfactuals into macroeconomic analysis. The bridge we build between the microsimulation model
and the macroeconomic model essentially automates this process.
Second, approach uses the output of microsimulation model to estimate effective and marginal tax
rate functions that jointly vary by age, labor income, and capital income. This method is the newest to
incorporate this level of detail into the GEM model. It is also novel in the integration between the
microsimulation and the GEM models. Such integration not only allows one to estimate tax functions
for current law policy, but also to estimate the parameters of tax functions that specify counterfactual
tax policies – even those that adjust tax policy levels that are difficult to model explicitly in a general
equilibrium framework.
Due to the fact that our focus is on individual income taxes, the effect of such taxes on model
agents’ decisions is captured in three equations. First, the total income tax paid by the model agent
determines after-tax resources available for consumption and savings. This is related through the
budget constraint, that takes into account the real interest rate at time t and the stationarized wage rate
at time t. The growth rate in labor augmenting technological change is also incorporated. Furthermore,
a function representing income and payroll taxes paid, is a lump sum transfer given to all households,
which does not vary with household tax liabilities.
The effects of marginal tax rates effects on consumption, savings, and labor supply can be seen in
the necessary conditions characterizing the agent’s optimal choices of labor supply and savings. The
first order condition for the choice of labor is given by the marginal benefits to additional labor supply
at the left hand side. The right hand side relates the marginal costs from the disutility of labor supply.
In addition, we consider the coefficient of relative risk aversion from the constant relative risk
aversion utility function.
Finally, consider that many macroeconomic models assume a single composite consumption good.
Some of this composite good affects tax liability, such as the consumption of charitable contributions
or housing. To the extent that the fraction of the composite good that comes from such consumption
varies over a household’s income and age, these tax functions will capture that, since they are fitted
using microeconomic data that includes information on these taxrelevant forms of consumption.
5. Integration of Microsimulation Model with the DGE
The microsimulation model which we propose is called Tax-Calculator and is maintained by a
group of economists, software developers, and policy analysts. Using microdata on a sample of tax
filers, the Tax calculator is able to determine total tax liability and marginal tax rates by computing the
tax reporting that minimizes each filer’s total tax liability given the filer’s income and deductions
items and the parameters describing tax law.
To map the output of the microsimulation model, which is based on income reported on tax returns,
to the DGE model, where income is defined more broadly, we use the following definitions. In
computing the effective tax rates from the microsimulation model, we divided total tax liability by a
measure of “adjusted total income”. We consider adjusted total income from the microsimulation
model to be the counterpart of total income in the DGE model. Total income in the DGE model is the
sum of capital and labor income.
6. Expected Results
Thus, in the framework of the research it is supposed to construct both models and incorporate
them for the in-depth analysis of Tajik tax policy implications in the context of the equilibrium theory.
M. Khakimova
55
In addition to specifying and estimating models for transition economy, we pursue following
objectives: first, to construct the DGE model as well as microsimulation model which can be used in
integrated form as a policy simulation tool; second, to obtain some insights about tax policy
implications within estimation of distributional effects on household incomes; and develop further
scenarios for tax policy in Tajikistan.
We suggest using of the model in order to investigate effectiveness of tax policy. The model could
be used for the modeling of different scenarios in tax policy which will lead to poverty reduction.
7. Conclusion
This brief presented approach has shown that microsimulation techniques have become relevant
practically for the whole of applied economic policy analysis. Thegreater availability of large and
detailed micro-datasets and the foreseeableincrease in computing power are drastically modifying our
approach to the evaluation of policy reforms. Instead of reasoning through representative agents and
aggregate models of the economy, we now try more and more to take into account the fundamental
heterogeneity of agents. By dispensing with the verydemanding assumption necessary for perfect
aggregation of individual behaviours,such an approach greatly improves the macro analysis of
reforms. At the same time, it permits evaluating their full distributional impact. This can be donein
several instances, under the assumption of no behavioural response. Simplemicrosimulation tools are
straightforwardly developed on that basis and shouldbe used more systematically.
Extending the analysis to cover behavioural responses and the potential general equilibrium and
macro-economic effects of reforms requires investing more in micro-economic and macro-economic
modelling. Attempts in thatdirection, briefly described in this survey, show the difficulty of the
approach but also the benefits that policy-making could draw from this kind of instrument.
References
Bourguignon, F., O’Donoghue, C., Sastre, J., Spadaro, A. and Utili, F. (1997). Eur3: A prototype
European tax-benefits model, In: A. Gupta and V. Kapur (eds.), Microsimulation in Government
Policy and Forecasting, North-Holland, Amsterdam.
Orcutt, G. (2007). A new type of socio-economic system, Review of Economic and Statistics 58
(1957) 773–797.
Orcutt, G, Greenberger, M., Korbel, J. and Rivlin, A. (1961). Microanalysis of Socio-Economic
Systems: A Simulation Study, Harper and Row, New York.
Orcutt, G., Merz, J. and Quinke, H. (1986). Microanalytic Simulation Models to Support Social
andFinancial Policy, North-Holland, Amsterdam.
Ramsey, F. (1927). A contribution to the theory of taxation, Economic Journal 37 (145) 47–61.
Savard, L.: Poverty and Income Distribution in a CGE-Household Microsimulation Model:Top-
Down/Bottom-Up Approach, CIRPE´E Working Paper 03-43. Centre interuniversitairesur le
risque, les politiques e´conomiques et l’emploi, Quebec, 2003.
Tuomala, M. (1990). Optimal Income Tax and Redistribution, Oxford University Press, Oxford.
3rd International Conference on Economic Research
24-25th October 2019, Alanya, Turkey
56
AN ASSESSMENT ON THE FINANCIAL LITERACY LEVEL OF GENERATION Z
Savaş Mücteba Harputlu
Hitit University, FEAS, Department of Banking and Finance, Turkey
Email: [email protected]
Selcuk Kendirli
Hitit University, FEAS, Department of Banking and Finance, Turkey
Abstract
The ability to follow current economic events at a basic level and make decisions that best result
for them by commenting on the possible effects of these events is called financial literacy. Financial
literacy has an important place to achieving sustainable economic growth in the individual and social
sphere. For this reason, efforts are being made to increase the level of financial literacy in the world. It
is estimated that from 2020, about 40% of the worldwide consumer population will be made up of
Generation Z. The purchasing power of this young adult group, born in the United States between
2000-2015, is thought to be $ 44 billion.
Generation Z, which is the future of our society, is expected to have at least a basic level of
financial knowledge about financial literacy. In the literature, whose were born between 1925 and
1945 are named the traditional generation, whose were born between 1946 and 1964 are named the
baby boom generation, whose were born in 1965-1979 are named generation X, born between 1980
and 2001 are named generation Y, born between 2000 and 2020 are named the generation Z. Within
the scope of this study, 5 participants of Generation Z who were born after 2000 were asked questions
about measuring the level of financial literacy. During the study, recognition questions were asked to
identify the participants and to determine whether they had typical characteristics of the generation Z.
It was concluded that the participants had the basic characteristics of the generation Z. The results of
the study were compared with the results of previous researches.
Keywords: Financial Literacy, Z Generation.
1. Introduction
The importance of financial literacy has increased with fluctuations of economy in Turkey and the
world in recent years. Individuals with incomplete knowledge of financial markets that they are likely
to suffer economic losses as a result of the wrong decisions. The phenomenon of globalization,
combined with financial liberalization and technological innovations, has given the ability to invest in
real and legal persons with surplus funds independent of space and time. Indeed, these days, with the
help of intermediaries, we can buy and sell the securities we want anywhere in the world.
Although there are studies that accept different year intervals in the literature, the most accepted
generation, which was born after 2000, is called Z generation. According to TÜİK data, the Z
generation in 2018 was 25.6 million population in Turkey (Turkey Statistics Institute, Population
Projections, 2018-2080).The aim of this study is to evaluate the financial literacy levels of these
generation members who will have a say in the national economy in the near future.
2. Generation Theory
Generation theory was first proposed in 1928 by the German sociologist Karl Mannheim
(Mannheim 1952). Although it was accepted to emerge in 1928, the differences between generations
go back to ancient civilizations.
Belonging to the Sumerians and BC. In the cuneiform script thought to have been written between
3500-2000; "What about the youth?" In a poem by Hesiod, who lived in 700 BC; "Young people who
are our future, if they continue to live with today's unconcerned attitudes, I have no hope for them, and
how careless they all are. When we were young, we were taught to be sober and respectful to our
elders, but today's young people (disrespectfully) are very clever. And they are very impatient. Platoon
An Assessment on the Financial Literacy...
57
said, Today's children are fond of luxury, they are disrespectful to their elders and they talk too much.
They are not the servants of their homes, they are just bullies.When the elders enter the room, they do
not stand up. They clash with their parents, they talk before everyone else in the community, they
cross their legs, they treat their teachers badly.” is an example of intergenerational conflict (Berkup,
2015).
However, the formation of the current generation concept has been possible as a result of other
scientific studies.
Williams and Page (2011), in their study, say that the generations' expectations, lifestyles,
perspectives to the world and purchasing behaviors are different from each other.Although different
classifications have been made from the past to the present within the scope of generation theory, it
can be said that today four generations live together.These are called Baby Boomers for 1946-1964, X
for 1965-1979, Y for 1980-1999, and Z for those born after 2000 (Arslan and Staub, 2015).
2.1 Baby Boomers Generation
More than a billion babies were born worldwide during this period, which coincided with the years
after World War II.Because of this population increase, this period is called Baby Boom
Generation(Ayhün Erden 2013:99). The most prominent features of this generation are that they are
idealistic, competitive, adopting the philosophy of “living for work”, being thoughtful and emotional,
having a high sense of loyalty, and depend on authority (Aka 2018; Benlisoy 2008).Representatives of
the Baby Boom generation believe that it is only possible to spend the day very hard to live tomorrow.
2.2 X Generation
Individuals born between the years 1965-1979 are named as Generation X (AyhünErden 2013).
The X generation, which came shortly after the baby boom generation lived in prosperity, experienced
various economic crises. Because of these crises, the people of this generation have lived in a more
materialist and anxious future. When compared to the previous generation, people of Generation X are
more loyal, more considerate, think globally, have developed a sense of social responsibility and are
more respectful of authority (Aka 2018).
2.3 Y Generation
This generation, which was born between 1980-2000, is the most populous generation today. This
generation, which constantly criticizes the responsibilities imposed on it and questions life and the
system, is also called Generation Why Generation ((Aka 2018). Since they are intertwined with
technology, members of this generation are open to innovations. Growing under the supervision of the
conscious generation X, people tend to think of their parents, teachers, or other people they trust when
making decisions about their careers (Sherratt and Coggshall 2010). Generation Y members wish to be
able to express themselves well in business life, to engage in more than one job at the same time, to
understand everything and to play an active role in decision-making processes. Similarly, these
generations are not only focused on money but also take care of the social opportunities provided by
the working environment (Çetin Aydin and Başol 2015).
2.4 Z Generetion
The generation that was born after 2000 is called the Z generation. Due to their intertwined
technology, this generation is also called the “Next Generation“ (Levickaite 2010). Generation Z's
ability to access information is much higher than other generations thanks to technology. They started
their education at an early age. The sense of being an individual is more developed than other
generations. Generation Z is result-oriented, unsatisfied, unstable and innate consumer. With the
development of artificial intelligence, most decisions will be taken without question. It is predicted
that this generation will be the most educated generation throughout history (Kon 2017). It is thought
that these professions will lose their prominence due to their lack of interest in the occupational
branches requiring crafts (www.kigem.com.tr). Almost all of this generation is active social media
S. M. Harputlu and S. Kendirli
58
users. They do most of their shopping from e-commerce sites. Approximately 80% of generation Z
does price research online without shopping (www.epnext.com).
3. Literature Review
There are studies in the literature on the measurement of financial literacy levels of young adults.
In the study conducted by Gutnu and Cihangir to OsmaniyeKorkut Ata University staff in 2015,
financial literacy levels of university staff were measured. According to the study 84.7% of
respondents said the world economic and financial developments in Turkey have reached the
conclusion that they follow.
Trying to determine the financial literacy level of Gaziantep University students, Kılıç et al. (2015)
administered a questionnaire to 480 students. As a result of the study, they found the financial literacy
success level of the students as 48%. In addition to this result, it is seen that male students have higher
financial literacy level.
In a study by Beal and Delpachitra (2003) aimed at measuring the financial literacy levels of
Southern Queensland University first-year students in Australia, they concluded that students' financial
literacy levels were low and financial literacy education given in high schools was insufficient.
In the study conducted by Durmuşkaya and Kavas (2018) on 415 academicians, the male
academicians were women, the academicians working in the social sciences were working in the
health sciences, the graduate graduates of the graduate graduates, the academicians and the
academicians were more literate. . In addition, as the age of academics increases, financial literacy
levels increase.
İnce conducted a study on the entrepreneurship tendency of the Z generation in 2018 with 102
students from the Department of Tourism. According to the results of the study, it is concluded that
generation Z, which is in uncertainty about the future, can contribute to financial and economic
developments through proper guidance and education.
Silva et al. (2017) examined the financial literacy levels of high school students in Brazil. 4698
students from 14 different high schools participated in the study. As a result of the research, it was
concluded that the students have financial literacy level but they are not sufficient.
4. Research
The main reason for this study is the preliminary evaluation of the future research on financial
literacy levels of individuals who were born after 2000 and represent our future. In this context, 5 Z
generation individuals who were born after 2000 were selected and asked 6 questions that we have
compiled from previous studies in America.
4.1 Data Collection Tools
The date was collected by the surface. Surfaces made by the researcher face to face. The first 5
questions used in the study were inspired by Lewis Mandell which one study of “The Financial
Literacy of Young American Adults”.
5. Results
The following questions were asked to the participants.
Question 1. Ali and Ayşe work in the finance department of X. While Ali is on his way to a
computer course to improve himself when his out of working time, Ayşe spends time in the gyms with
his friends. In your opinion, which of the following options would you expect after 5 years?
A. Ayşe saves more money because she is more social than Ali.
B. Ayşe will be more successful. Because Ali will likely to be fired.
C. Ali will earn more money because he is more valuable for the company.
D. Ali and Ayşe will continue their work with the same salary.
An Assessment on the Financial Literacy...
59
This question was asked to measure the awareness of the concept of Human Capital. While 67.9%
of respondents answered this question correctly in 2008, this ratio was 92.1 in 1997. 11% of the
answers indicated that Ali and Ayşe would continue to work at the same salary level.
Four of the participants chose D while only one chose the correct answer.
Question 2. Today, most young people benefit from the health insurance of their parents. Which is
true about health insurance coverage?
A. I can benefit from my mother's or father's insurance until marriage without age and gender
restrictions.
B. If my mother or father becomes unemployed, my health insurance will be canceled.
A. As long as I live in the same house with my parents, my health insurance will be continued.
D. I can benefit from my mother's or father's insurance until I'm 20 if I'm in high school and 25
when I'm in college.
In the USA, in 2006 and 2008, 40% of respondents answered this question correctly.
Three of the participants selected the wrong option B, one wrong option A and one of them is
chosen correct option D.
Question 3. Ahmet receives 2000 TL salary per month. He pays 1000 Liras for home rent. He has
got 300 Liras kitchen costs. There are 200 Liras transportation costs. He gives 100 Liras pocket money
to his brother studying at the university every month. Since Ahmet has no other expenses, how much
time does he save 10,000 Liras?
A. 20
B. 25
C. 30
D. 35
In 2008, 60.2% of respondents answered this question based on simple mathematics.
All participants chose the correct option B.
Question 4. Elif and Mustafa are the same age. When Elif turned 25, she decided to save 2000
Liras per month. Meanwhile, Mustafa does not want to save. When they reach the age of 50, when
Mustafa retires, he realizes that he will not have any savings and decides to save 4000 Liras per
month. Elif is still saving 2000 Liras. Since both of these days are 75 years old, which is true for Elif
and Mustafa's savings?
A. The total amount saved by both is the same.
B. Mustafa’s saved is more because, he has saved more money every month.
C. Elif’s saved is more because she has saved the money more longer time.
D. Elif’s money is more because her money has remained at compound interest rate for a longer
time.
Two of the participants chose C which one is the wrong option. One of the participant chose A,
which one is the wrong option. One of the participant choose D, which one is the right option.
Question 5. Mehmet will start university next year. He has 10000 Liras which he has accumulated
during summer vacation. Mehmet wants to keep this 10000 Liras until he starts university. Which is
safer for Mehmet?
A. Storing in a secret place at home.
B. Take stock from the stock exchange.
C. Receive government bonds.
D. Deposit into the bank account.
In the USA, 87.7% of the respondents answered the question correctly.Three of the participants
who participated in the study chose the wrong option D and two of them chose the wrong option B. As
a result, none of the participants chose the right option.
Question 6. Match the following currency symbols to the currency units.
a. American dollars b. Kuwaiti Dinar c. Ruble d. Chinese Yuan e. Sterling f. Euro g. Turkish lira
€ ……
£ ……
¥ ……
$ ……
All the participants answered this question correctly.
S. M. Harputlu and S. Kendirli
60
6. Result and Conclusion
It was observed that the individuals of Generation Z who did not know the concept of human
capital or did not understand the importance of human capital. According to the participants, the fact
that the person has developed himself is not an advantage over his competitors.
It can be said that the participants' knowledge of health insurance is extremely limited. Insurance
policy implemented in our country is of great importance for this. Unlike the United States, young
people are not very knowledgeable in this regard because there is an insurance obligation in our
country.
The aim of the third question is the ability of simple mathematical calculation. All of the
participants answered this question correctly. This shows that basic mathematical skills have
improved.
Participants do not know the relationship between savings and interest. The reason for this is that
they have not yet started to earn income and are unfamiliar with the savings evaluation processes. It
would be wrong to say that participants have full knowledge of issues such as stocks, bonds and
interest.
All participants participated in the study, recognizing the most used currencies in the world.
References
Aka, Bahattin. 2018. “Bebek Patlaması, X Ve Y Kuşağı Yöneticilerin Örgütsel Bağlılık Düzeylerinin
Kamu Ve Özel Sektör Farklılıklarına Göre İncelenmesi: Bir Araştırma”. Süleyman Demirel
Üniversitesi Vizyoner Dergisi 9(20): 118-35.
Arslan, Aykut, ve Selva Staub. 2015. “Kuşak Teorisi ve İç Girişimcilik Üzerine Bir Araştırma”.
Kafkas Üniversitesi İktisadi ve İdari Bilimler Fakültesi Dergisi 6(11): 1-24.
Ayhün Erden, Sena. 2013. “Kuşaklar Arasındaki Farklılıklar ve Örgütsel Yansımaları”. Ekonomi ve
Yönetim Araştırmaları Dergisi 2(1): 93-112.
Beal, Diana J., ve Sarath B. Delpachitra. 2003. “Fınancıal Lıteracy Among Australıan Unıversıty
Students”. Economic Papers: A journal of applied economics and policy 22(1): 65-78.
Benlisoy, Stefo. 2008. “Mit ile Gerçeklik Arasında 68’i Hatırlamak”. Mesele Kitap Dergisi 24(1): 30-
33.
Berkup, Baysal Sezin. 2015. “Sosyal Ağlarda Bireysel Mahremiyet Paylaşımı: X Ve Y Kuşakları
Arasında Karşılaştırmalı Bir Analiz”. Doktora Tezi. Ege Üniversitesi.
Çetin Aydin, Gülşen, ve Oğuz Başol. 2015. “X Ve Y Kuşağı: Çalışmanın Anlamında Bir Değişme Var
Mı?” Ejovoc : Electronic Journal of Vocational Colleges 4(4).
http://dergipark.gov.tr/doi/10.17339/ejovoc.41369 (06 Eylül 2019).
Durmuşkaya, Sedat, ve Yusuf Kavas. 2018. “Akademik Gelişim Ve Finansal Okuryazarlık Arasındaki
İlişkinin Tespiti Üzerine Bir Araştırma”. Yönetim ve Ekonomi: Celal Bayar Üniversitesi İktisadi ve
İdari Bilimler Fakültesi Dergisi. http://dergipark.gov.tr/doi/10.18657/yonveek.441375 (31 Temmuz
2019).
Gutnu, Murat, ve Mehmet Cihangir. 2015. “Finansal Okuryazarlık: Osmaniye Korkut Ata Üniversitesi
Personeli Üzerinde Bir Araştırma”. the Journal of Academic Social Sciences 10(10): 415-415.
İnce, Fatma. 2018. “Z Kuşağının Girişimcilik Eğilimi: Üniversite Öğrencileri Üzerinde Bir
Araştırma”. Pamukkale Üniversitesi Sosyal Bilimler Enstitüsü Dergisi (32): 105-13.
Kılıç, Yunus, H. Ali Ata, ve İbrahim H.Seyrek. 2015. “Finansal Okuryazarlık: Üniversite
Öğrencilerine Yönelik Bir Araştırma”. Muhasebe ve Finansman Dergisi (66): 129-50.
Kon, Dr Barbaros. 2017. “Kuşakları Anlamak ve Yönetmek”. Humanica.
http://www.humanica.com.tr/kusaklari-anlamak-yonetmek/ (18 Eylül 2019).
Levickaite, Rasa. 2010. “Generations X Y Z: How Social Networks Form the Concept of the World
Without Borders the Case of Lithuania”. Limes 3(2): 170-83.
Mannheim, Karl. 1952. “The Problem of Generations”. Içinde Essays on the Sociology of Knowledge,
London: Routledge & Kegan, 276-322.
https://pdfs.semanticscholar.org/2e13/8af10c7c65980305c115557134fdec2659c5.pdf.
Merkezi, EPN Haber. 2017. “E-ticareti Z Kuşağı ‘Uçuracak’”. Enterprise Next. https://epnext.com/e-
ticareti-z-kusagi-ucuracak/ (18 Eylül 2019).

An Assessment on the Financial Literacy...
61
Sherratt, Ellen, ve Jane G. Coggshall. 2010. “Realizing the Promise of Generation Y”. Educational
Leadership 67(8): 28-34.
Silva, Tarcísio Pedro da, Cristian Baú Dal Magro, Marcello Christiano Gorla, ve Wilson Toshiro
Nakamura. 2017. “Financial Education Level of High School Students and Its Economic
Reflections”. Revista de Administração 52(3): 285-303.
“Türkiye İstatistik Kurumu, Nüfus Projeksiyonları, 2018-2080”.
http://www.tuik.gov.tr/PreHaberBultenleri.do?id=30567 (02 Ağustos 2019).
Williams, Kaylene C, ve Robert A. Page. 2011. “Marketing to the Generations”. Journal of Behavioral
Studies in Business: 17.
www.kigem.com/cekilin-yoldan-z-kusagi-geliyor.html "Çekilin yoldan z kuşağı geliyor!” 2013.
KİGEM. (18 Eylül 2019).
3rdInternational Conference on Economic Research
24-25th October 2019, Alanya, Turkey
62
INCENTIVES FOR SMALLHOLDERS TO BE ENTREPRENEURIAL: EMPIRICAL
EVIDENCE FROM SELECTED IRRIGATION SCHEMES
IN KWAZULU-NATAL, SOUTH AFRICA
Edilegnaw Wale Zegeye
University of KwaZulu-Natal, School of Agricultural, Earth and Environmental Sciences, South
Africa
U. Chipfupaa
University of KwaZulu-Natal, School of Agricultural, Earth and Environmental Sciences, South
Africa
Abstract
Enabling on-farm entrepreneurship is an important step to enhance the contribution of smallholder
irrigation to rural poverty reduction in South Africa. Using psychological capital as a proxy for
entrepreneurship and data collected from 458 smallholders in and around irrigation schemes in
KwaZulu-Natal, the study empirically examines the available incentives (and lack thereof) affecting
smallholder engagement in entrepreneurship activities. Findings show that access to social grants and
interaction with existing social networks provide incentives for farmers to climb the entrepreneurial
ladder. Even though social grants are meant to meet the basic needs of recipients, if used to finance
agricultural activities, they positively impact entrepreneurship. Factors inhibiting entrepreneurship in
the context of smallholder farming include experience in farming, consumption credit and land tenure
insecurity. Experienced farmers are not willing to take more risks and are frustrated due to the lack of
progress in performance. The study recommends the mentorship of young smallholders by
experienced commercial farmers to support the growth of entrepreneurship in smallholder agriculture
and succession planning. Access to credit should be directly linked to agricultural production through
input vouchers and value chain financing. Congruency in policy design is needed to ensure that social
protection and rural development policies continue to support each other. Addressing land tenure
issues and access to other complementary services will enhance on-farm entrepreneurship in the
smallholder agriculture sector. Promoting social interaction through networking and support for
mentorship programmes will also result in positive entrepreneurial behaviour.
Keywords: Smallholder Farming, On-farm Entrepreneurship, Social Grant, Access to Credit,
Psychological Capital.
3rdInternational Conference on Economic Research
24-25th October 2019, Alanya, Turkey
63
VALUE ADDED FROM SUPPLIER MANAGEMENT THROUGH THE USE OF
ADEQUATE SOURCING STRATEGIES
Gerhard Lechner
University of Sopron, Hungary, Email: [email protected]
Abstract
Manufacturing companies use suppliers to best serve the ever-shrinking innovation cycles and fast-
moving markets, as well as volatile market demands. In this way, suppliers influence the company and product strategy and, in addition, are closely or even partially involved in processes of their customers.
The selection, the development and the management of the suppliers is thus of great importance,
which focuses on purchasing in coordination with the technology. It is therefore important that there are a sufficient number of efficient supply partners who are able and willing to cover the requirements
holistically and sustainably support the strategy of the own company.The strategic use of Sourcing
Strategies opens up many possibilities and consequences with regard to targeted Supplier Management
in terms of geography, number of suppliers and vertical cooperation intensity. Therefore, the Value Added and the Success Factors as well as the limits of a holistically oriented Supplier Management are
asked in the context of expert interviews. Purchasing with suitable suppliers has to support the many
requirements of the own company for optimizing Value Added. It is important to ensure that alternatives are available as far as possible within the framework of functioning risk management.
Sourcing Strategies support this and can represent the implementation of the purchasing strategy
synchronized with material group management. In addition to the achievement of direct cost reductions, which continue to be the most important contribution from Supplier Management, the
assurance of delivery performance and delivery quality are crucial in order to fulfill the right to exist
as a supplier with a long-term focus.
Keywords: Sourcing Strategies, Success Factor, Supplier Management, Value Added, Value Contribution.
1. Introduction
The targeted and strategic use of Sourcing Strategies has become very important in recent years,
especially in connection with the application of material group management (cf. Rüdrich et al., 2004, pp. 13ff.) in order to be able to further promote and professionalize Supplier Management. The focus
of companies on core competencies and the increasing shift of Value Added-activities to suppliers or
specialists are accompanied by the expectation that suppliers will generate higher Value Contributions
for the own company in the future in order to sustainably increase the value of the company and to shift risks in parallel (Hofbauer et al., 2015, p. 3). According to information from the Federal
Statistical Office in Germany, the share of material consumption, including merchandise and wage
labor in the gross production value is on average 58.0% and in mechanical engineering 53.9% (Federal Statistical Office, 2018, p. 278 & p. 301). The largest cost block in the manufacturing industry is thus
caused by the material costs. This explains the need for efficient and systematic Supplier Management
(Jäger, 2009, p. 66; Hofbauer et al., 2012, p. 35; cf.Hofbauer et al., 2015, pp.11f .; Czaja, 2009, pp.
23f.; Carr& Pearson, 1999, p. 500; Boutellier& Wagner, 2000, p.27; Hess, 2008, pp. 261ff. &pp.418f.; Hess, 2011, pp. 77f. and various other authors; cf.Gabath, 2011, pp. 20 ff. and Koppelmann, 2004, pp.
403ff. on risk management; cf.Roodhooft&Konings, 1996, pp. 97ff. on supplier selection;cf. Van
Weele, 2009, p. 17 onsupplier integration;cf. Wagner & Krause, 2009, pp. 3161ff. on supplier development).
The objective of this study is to identify the importance of Supplier Management activities by
purchasing in order to create Value Added for the company. Contributions can be both qualitative and quantitative in nature as well as on the cost or revenue side. For this purpose, expert interviews with
involvement of purchasing representatives who have many years of experience have been conducted
in manufacturing companies. It emerged that the perception of cost responsibility by purchasing is
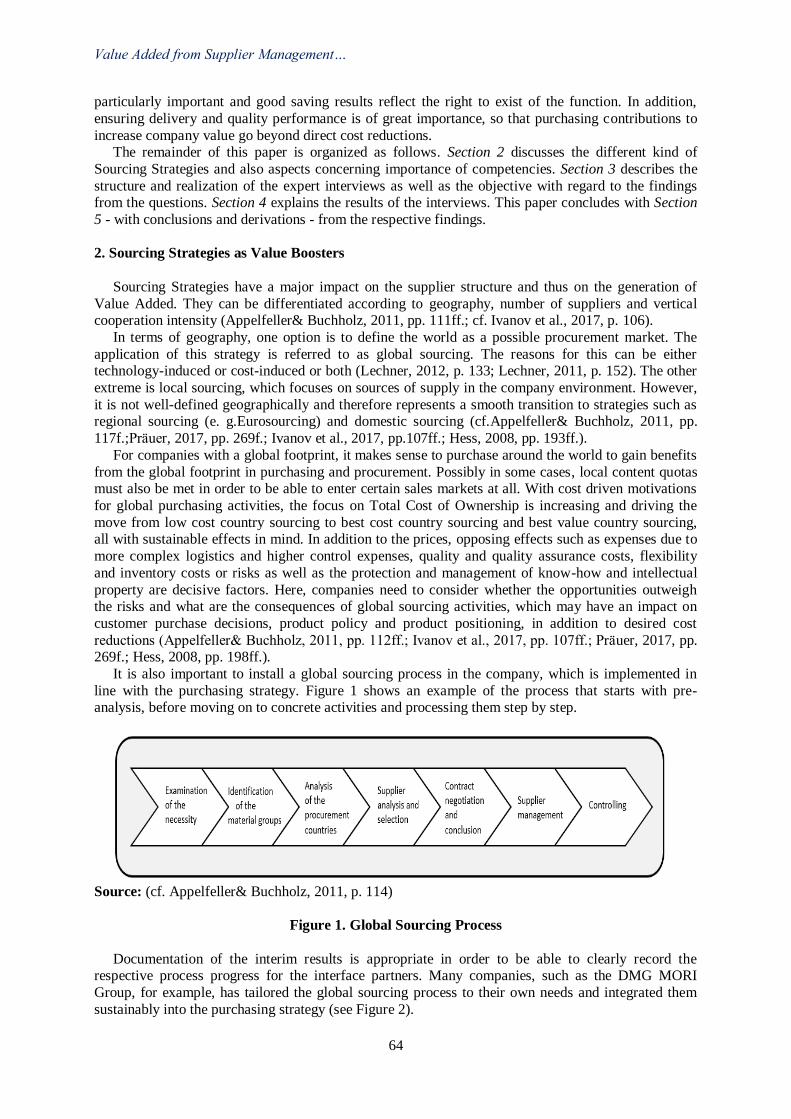
Value Added from Supplier Management…
64
particularly important and good saving results reflect the right to exist of the function. In addition,
ensuring delivery and quality performance is of great importance, so that purchasing contributions to
increase company value go beyond direct cost reductions. The remainder of this paper is organized as follows. Section 2 discusses the different kind of
Sourcing Strategies and also aspects concerning importance of competencies. Section 3 describes the
structure and realization of the expert interviews as well as the objective with regard to the findings from the questions. Section 4 explains the results of the interviews. This paper concludes with Section
5 - with conclusions and derivations - from the respective findings.
2. Sourcing Strategies as Value Boosters
Sourcing Strategies have a major impact on the supplier structure and thus on the generation of
Value Added. They can be differentiated according to geography, number of suppliers and vertical cooperation intensity (Appelfeller& Buchholz, 2011, pp. 111ff.; cf. Ivanov et al., 2017, p. 106).
In terms of geography, one option is to define the world as a possible procurement market. The
application of this strategy is referred to as global sourcing. The reasons for this can be either technology-induced or cost-induced or both (Lechner, 2012, p. 133; Lechner, 2011, p. 152). The other
extreme is local sourcing, which focuses on sources of supply in the company environment. However,
it is not well-defined geographically and therefore represents a smooth transition to strategies such as regional sourcing (e. g.Eurosourcing) and domestic sourcing (cf.Appelfeller& Buchholz, 2011, pp.
117f.;Präuer, 2017, pp. 269f.; Ivanov et al., 2017, pp.107ff.; Hess, 2008, pp. 193ff.).
For companies with a global footprint, it makes sense to purchase around the world to gain benefits
from the global footprint in purchasing and procurement. Possibly in some cases, local content quotas must also be met in order to be able to enter certain sales markets at all. With cost driven motivations
for global purchasing activities, the focus on Total Cost of Ownership is increasing and driving the
move from low cost country sourcing to best cost country sourcing and best value country sourcing, all with sustainable effects in mind. In addition to the prices, opposing effects such as expenses due to
more complex logistics and higher control expenses, quality and quality assurance costs, flexibility
and inventory costs or risks as well as the protection and management of know-how and intellectual
property are decisive factors. Here, companies need to consider whether the opportunities outweigh the risks and what are the consequences of global sourcing activities, which may have an impact on
customer purchase decisions, product policy and product positioning, in addition to desired cost
reductions (Appelfeller& Buchholz, 2011, pp. 112ff.; Ivanov et al., 2017, pp. 107ff.; Präuer, 2017, pp. 269f.; Hess, 2008, pp. 198ff.).
It is also important to install a global sourcing process in the company, which is implemented in
line with the purchasing strategy. Figure 1 shows an example of the process that starts with pre-analysis, before moving on to concrete activities and processing them step by step.
Source: (cf. Appelfeller& Buchholz, 2011, p. 114)
Figure 1. Global Sourcing Process
Documentation of the interim results is appropriate in order to be able to clearly record the respective process progress for the interface partners. Many companies, such as the DMG MORI
Group, for example, has tailored the global sourcing process to their own needs and integrated them
sustainably into the purchasing strategy (see Figure 2).
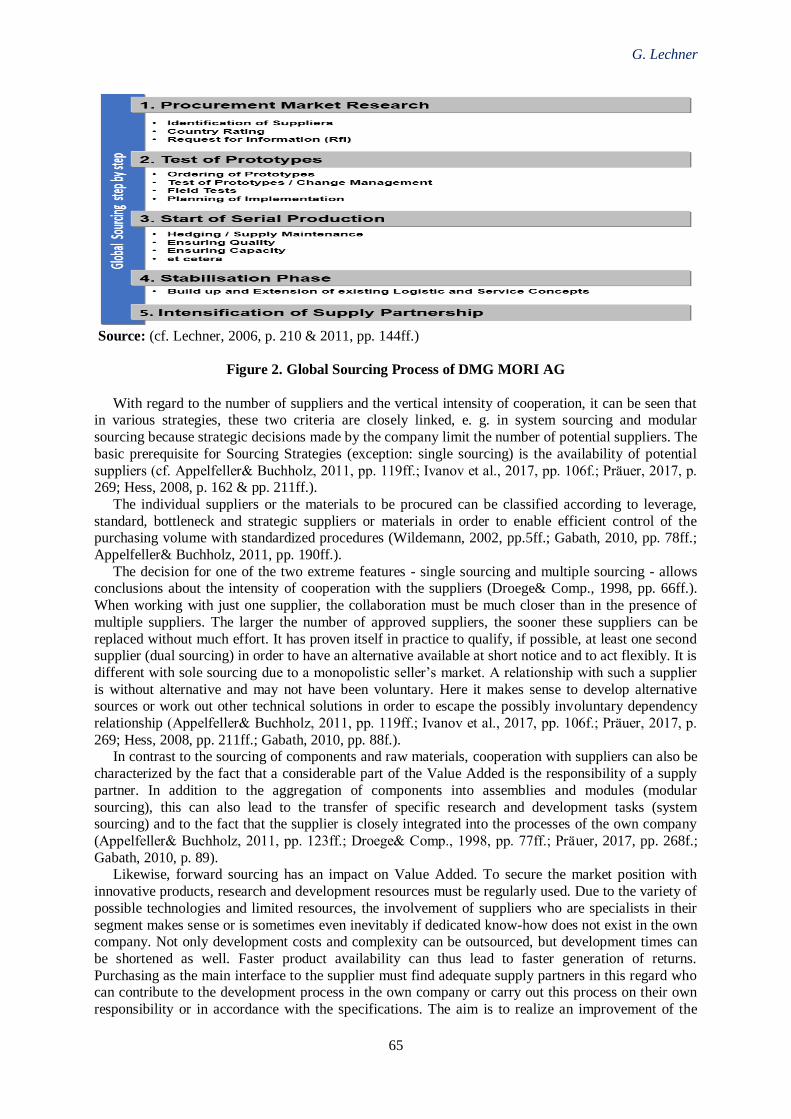
G. Lechner
65
Source: (cf. Lechner, 2006, p. 210 & 2011, pp. 144ff.)
Figure 2. Global Sourcing Process of DMG MORI AG
With regard to the number of suppliers and the vertical intensity of cooperation, it can be seen that in various strategies, these two criteria are closely linked, e. g. in system sourcing and modular
sourcing because strategic decisions made by the company limit the number of potential suppliers. The
basic prerequisite for Sourcing Strategies (exception: single sourcing) is the availability of potential
suppliers (cf. Appelfeller& Buchholz, 2011, pp. 119ff.; Ivanov et al., 2017, pp. 106f.; Präuer, 2017, p. 269; Hess, 2008, p. 162 & pp. 211ff.).
The individual suppliers or the materials to be procured can be classified according to leverage,
standard, bottleneck and strategic suppliers or materials in order to enable efficient control of the purchasing volume with standardized procedures (Wildemann, 2002, pp.5ff.; Gabath, 2010, pp. 78ff.;
Appelfeller& Buchholz, 2011, pp. 190ff.).
The decision for one of the two extreme features - single sourcing and multiple sourcing - allows conclusions about the intensity of cooperation with the suppliers (Droege& Comp., 1998, pp. 66ff.).
When working with just one supplier, the collaboration must be much closer than in the presence of
multiple suppliers. The larger the number of approved suppliers, the sooner these suppliers can be
replaced without much effort. It has proven itself in practice to qualify, if possible, at least one second supplier (dual sourcing) in order to have an alternative available at short notice and to act flexibly. It is
different with sole sourcing due to a monopolistic seller’s market. A relationship with such a supplier
is without alternative and may not have been voluntary. Here it makes sense to develop alternative sources or work out other technical solutions in order to escape the possibly involuntary dependency
relationship (Appelfeller& Buchholz, 2011, pp. 119ff.; Ivanov et al., 2017, pp. 106f.; Präuer, 2017, p.
269; Hess, 2008, pp. 211ff.; Gabath, 2010, pp. 88f.). In contrast to the sourcing of components and raw materials, cooperation with suppliers can also be
characterized by the fact that a considerable part of the Value Added is the responsibility of a supply
partner. In addition to the aggregation of components into assemblies and modules (modular
sourcing), this can also lead to the transfer of specific research and development tasks (system sourcing) and to the fact that the supplier is closely integrated into the processes of the own company
(Appelfeller& Buchholz, 2011, pp. 123ff.; Droege& Comp., 1998, pp. 77ff.; Präuer, 2017, pp. 268f.;
Gabath, 2010, p. 89). Likewise, forward sourcing has an impact on Value Added. To secure the market position with
innovative products, research and development resources must be regularly used. Due to the variety of
possible technologies and limited resources, the involvement of suppliers who are specialists in their
segment makes sense or is sometimes even inevitably if dedicated know-how does not exist in the own company. Not only development costs and complexity can be outsourced, but development times can
be shortened as well. Faster product availability can thus lead to faster generation of returns.
Purchasing as the main interface to the supplier must find adequate supply partners in this regard who can contribute to the development process in the own company or carry out this process on their own
responsibility or in accordance with the specifications. The aim is to realize an improvement of the
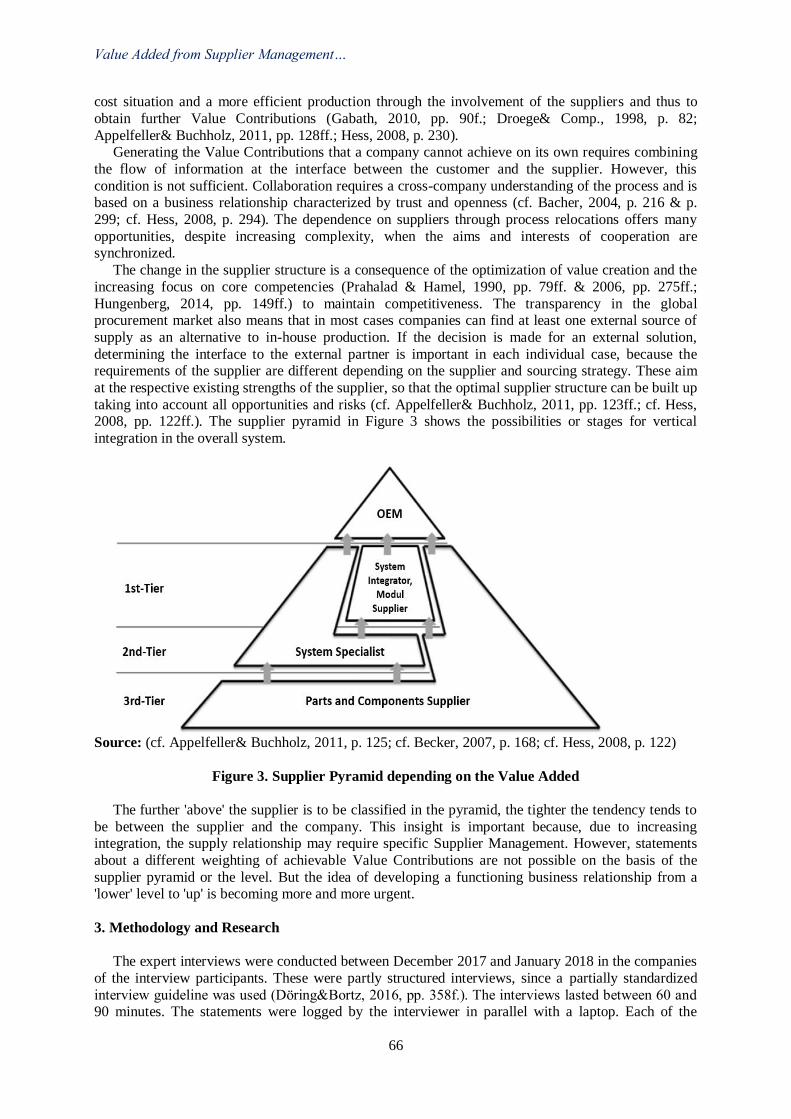
Value Added from Supplier Management…
66
cost situation and a more efficient production through the involvement of the suppliers and thus to
obtain further Value Contributions (Gabath, 2010, pp. 90f.; Droege& Comp., 1998, p. 82;
Appelfeller& Buchholz, 2011, pp. 128ff.; Hess, 2008, p. 230). Generating the Value Contributions that a company cannot achieve on its own requires combining
the flow of information at the interface between the customer and the supplier. However, this
condition is not sufficient. Collaboration requires a cross-company understanding of the process and is based on a business relationship characterized by trust and openness (cf. Bacher, 2004, p. 216 & p.
299; cf. Hess, 2008, p. 294). The dependence on suppliers through process relocations offers many
opportunities, despite increasing complexity, when the aims and interests of cooperation are synchronized.
The change in the supplier structure is a consequence of the optimization of value creation and the
increasing focus on core competencies (Prahalad & Hamel, 1990, pp. 79ff. & 2006, pp. 275ff.;
Hungenberg, 2014, pp. 149ff.) to maintain competitiveness. The transparency in the global procurement market also means that in most cases companies can find at least one external source of
supply as an alternative to in-house production. If the decision is made for an external solution,
determining the interface to the external partner is important in each individual case, because the requirements of the supplier are different depending on the supplier and sourcing strategy. These aim
at the respective existing strengths of the supplier, so that the optimal supplier structure can be built up
taking into account all opportunities and risks (cf. Appelfeller& Buchholz, 2011, pp. 123ff.; cf. Hess, 2008, pp. 122ff.). The supplier pyramid in Figure 3 shows the possibilities or stages for vertical
integration in the overall system.
Source: (cf. Appelfeller& Buchholz, 2011, p. 125; cf. Becker, 2007, p. 168; cf. Hess, 2008, p. 122)
Figure 3. Supplier Pyramid depending on the Value Added
The further 'above' the supplier is to be classified in the pyramid, the tighter the tendency tends to
be between the supplier and the company. This insight is important because, due to increasing integration, the supply relationship may require specific Supplier Management. However, statements
about a different weighting of achievable Value Contributions are not possible on the basis of the
supplier pyramid or the level. But the idea of developing a functioning business relationship from a 'lower' level to 'up' is becoming more and more urgent.
3. Methodology and Research
The expert interviews were conducted between December 2017 and January 2018 in the companies
of the interview participants. These were partly structured interviews, since a partially standardized
interview guideline was used (Döring&Bortz, 2016, pp. 358f.). The interviews lasted between 60 and 90 minutes. The statements were logged by the interviewer in parallel with a laptop. Each of the
G. Lechner
67
discussions was a four-eye conversation. The advantages of the expert interviews are above all the
short-term scheduling and feasibility. The expert discussions were conducted to verify and
complement a written survey. Through the interviews, further information on the given topics could be generated. The guidelinewas used for orientation. Due to the given structure, the free answers of the
respective interview partners can be compared. However, the interviewer had to decide by himself
how intensively he would ask for the respective answers or in which direction he wanted to direct the conversation. Ultimately, the specialist competence of the respondent is very important (cf.Döring,
&Bortz, 2016, p. 360).
Through the use of this method further valuable insights, assessments and suggestions could be brought to experience on some topics, so that the 13 expert interviews conducted on the whole proved
to be sufficient. In order to receive qualified feedback, explicitly experienced purchasing
representatives were addressed. In addition, it must be clear that the company belongs to the
manufacturing sector. This industry focus has been chosen because the requirements of different industries sometimes differ greatly. The classification or sector affiliation is carried out according to
the definition of the main industrial groups of the European Community (Commission of the European
Communities, 2007, pp. 4ff.). Furthermore, due to the query of the sales figures or the purchasing volumes, a different behaviorbetween small and medium-sized enterprises (SMEs) and groups may be
derived. The definition of SMEs is based on the Recommendation of the European Union
(Commission of the European Communities, 2003, p. L 124/39), which was also based on the Institute for SME Research Bonn in terms of turnover; the further gradations are determined on the basis of
personal experience. The purchasing volume is based on an average material quota of 50% and is
classified analogously to sales. However, it is highly industry-dependent. The question of connecting
purchasing within the organization allows conclusions to be drawn about the strategic importance and classification of the purchasing.
The 13 purchasing representatives participating in the expert interviews each have a purchasing
experience of more than ten years. 92.3% (12) have completed their studies. In each company, all stated that they held a managerial position. Of the participating companies, 76.9% (10) were from the
industrial goods sector (all mechanical engineering) and 15.4% (2) from the intermediate goods sector;
one company belongs to the consumer goods sector (7.7%). 84.6% (11) of the companies generate
sales of less than € 5.0 billion. The purchasing volume for all companies is less than € 2.5 billion. For all companies, purchasing is linked to or represented in the Executive Board, the Management Board
or C-Level.
Furthermore, it was found that none of the interview participants had fundamental difficulties in understanding the interview questions. The interviewer was able to eliminate any ambiguity arising
from additional explanations. In addition to the discussion of the individually completed
questionnaires and the presentation of the first evaluations on the topics of savings, opposing effects, supplier reduction and Sourcing Strategies, the experts were asked nine questions in the sense of a
guideline interview (Döring&Bortz, 2016, p. 360) which were individually answered or discussed and
are closely related to the research project. In the context of these expert interviews, further insights
into the Value Added, the Success Factors and the Value Contributions on the part of suppliers are to be gained, as well as the limits of a holistically oriented Supplier Management.
4. Results from the Expert Interviews
When interpreting the results, it must be taken into account that the expert interviews are the
collection of opinions and experiences of the participants. The findings gained from the expert interviews possess a high degree of subjectivity, which is incorporated into the results of the
investigation.
4.1 Kind of Value Added
The purpose of this question is to find out what are the most important points from the point of
view of purchasing, which add value to the own company when working with suppliers. What kind of Value Added does comes from suppliers in detail to increase the value of the
company?
Value Added from Supplier Management…
68
In this question, the most participants first mentioned the topic of cost reductions. It is easiest to
measure and brings short-term result effects. Expectations of supervisors or other functions to
purchasing are very high in this respect. The aims are usually redefined every year. In addition, the topics assurance of supply and quality improvement are mentioned as further important points. A high
level of delivery reliability is important, especially if the economy is good, because than it partially
takes on the highest importance. Covering through the build-up of inventories is not wanted because it does not protect against missing parts, but causes additional capital costs. Good quality on the part of
the suppliers is expected and is basically out of question. Some companies have processes in place for
reimbursement of quality costs or follow-up costs to suppliers if ‘poor deliveries’ lead to additional production costs, but this is not compulsorily demanded. The fourth point was the early involvement
of suppliers in the product development process when innovative products or contributions from
suppliers positively support in-house product development. In some cases, holding technology days or
open innovation will further consider other options to gain supplier expertise. Other issues, such as the compensation for missing internal capacities through the use of supplier services and the optimization
of payment terms as a contribution to company financing, are only mentioned on a few occasions.
4.2 Critical Success Factors
At this point, the Success Factors are asked, on the basis of which the generation of Value Added is possible in particular and which are classified as significant in the context of cooperation with
suppliers. The question is important because it may help to find clues that fundamentally influence the
generation of Value Added.
What are the critical Success Factors of Supplier Management in the context mentioned above? The critical Success Factors can be influenced by the supplier and by the own company. On the
part of the supplier, it is important to adhere to the agreed delivery dates and the agreed delivery
quality as well as to implement ideas quickly, so that advantages in terms of customer orientation also arrive at the customer. The supplier should bring in the required know-how in a targeted manner in the
business relationship and take advantage of the given opportunities. It also helps a lot if the supplier's
financial resources are good and a long-term partnership is the goal. Nevertheless, the overall cost
perspective that is expressed in supplier evaluations is important. Emerging difficulties and problems should be resolved promptly between both partners in the sense of an open communication, which
means, it's important to talk to each other. However, the own company must also make appropriate
contributions with regard to critical Success Factors. An important point was the adherence to the agreed terms of payment as well as an uncomplicated management of the supply relationship ('one
face to the supplier'). In addition, Success Factors include the purchasing volume, value creation or
own depth of Value Added, know-how and available capacities in the company, reliability, relationships and the targeted use of Sourcing Strategies. However, the greatest importance is attached
to the intensification of supply partnerships, as negotiating is becoming more difficult and due to the
increasing digitization and automation the willingness to change is decreasing.
4.3 Quantification of Value Contributions
It is important for purchasing to present successes and contributions to the company's results simply and transparently. Not only are quantitative contributions clearly understandable, but equally
important when it comes to approving investments or hiring additional employees. Therefore, the
following question is asked. How can the contributions from Supplier Management be determined as quantified as possible?
The contributions that can be quantified are diverse in nature, but not consistently financially
assessable. Similarly, some contributions in companies are not recorded. This is because key figures
may not be determinable without appropriate effort, do not play a significant role in certain companies and are deliberately not measured or have not yet been recognized as an interesting parameter.
The 'classics' among the quantifiable contributions are the direct cost reductions, which are due to
competition, standardization, equal parts or other scale effects and technical changes. In some cases, contributions are adjusted for currency or raw material price fluctuations and one-off expenses, and
price, raw material or currency developments are considered in parallel. One-off effects from bonuses
G. Lechner
69
or discounts are also taken into account as a direct cost reduction, even if they materialize only at the
end of the year or the end of the project. Cost avoidance effects against offer from negotiation as well
as effects from unexploited budgets are shown separately for some companies; however, some companies do not accept this effect as purchasing success. Another key financial indicator for some of
the companies is the interest effect of payment terms for short-term payment or extension of the net-
payment term and inventory cost changes, in order to advance inventory optimization or to transfer more stocks to supplier warehouses. With regard to ensuring the assurance of supplies, most
companies measure adherence with the agreed delivery times as well as the delivery accuracy with
regard to the time of delivery (confirmation of the supplier or desired date of the own company) and the delivered quantity. Depending on the delivery window, this results in corresponding on-time
delivery quotas, which in some cases are subject to penalties in the event of a large deviation. This can
also cause additional expenses in the own company, which may be charged to suppliers. Another
important point is the measurement of quality rates and supplier quality. Here, too, there are quotas and possibly additional expenses that allow statements about the quality performance or are the basis
for reimbursement of costs to suppliers. Some companies deliberately exclude ‘poor performer’ from
future project participation. In addition, there are various key figures that are used in individual companies to strategically
control the purchasing volume. These include, for example, the share of global sourcing on the
purchasing volume, the number of supplier reductions, the number and results of supplier audits, the development of certain cost drivers, the number of project launches without any problems, the
coverage of the purchasing volume by frame agreements or the purchasing volume, which is handled
electronically. Furthermore, the classification of suppliers in A-B-C as well as the number of
purchaser’s hours, the number of orders per week and the investments in terms of make-or-buy decisions. Regardless of these many possible key figures, however, it makes sense for every company
or purchasing department, in addition to the key performance indicators cost reductions, delivery
performance and quality performance, to select the key figures that are best suited for the strategic management of the purchasing volume in order to maximize the contribution to the sustained increase
in company value and ultimately as an overall consideration takes place.
4.4 Cost-Benefit Ratio
This question aims to identify the most important tasks of purchasing in conjunction with the
available capacities. Which cost-benefit ratio can be derived from Supplier Management activities?
The most important tasks for purchasing are the conclusion of price and conditions agreements as
well as supplier selection, qualification, development and evaluation. Close cooperation with the departments, in particular with development, and with selected suppliers with regard to joint
development projects as well as the generation of supplier innovations, is being widely implemented
as an important Supplier Management activity. Opposing effects occur, but to an extent that is
considered negligible compared to the benefits of Supplier Management. Apart from that, there are also internal expenses related to the management of resources, which are estimated to be on a similar
level. Furthermore, it is advantageous that the build-up of fixed costs does not have to occur when
suppliers are used. In part, costs such as quality costs are outsourced, which would otherwise occur internally. In addition, due to the collaboration with external partners, the way the work is done is
usually more structured and better organized, which in the medium and long term leads to further
professionalization and improved compliance with business processes. Make-or-buy decisions based on strategic or economic motivation as well as the handling of capacity peaks with suppliers and
emergency strategies characterize intelligent companies. Suppliers are also needed to developthe own
company further. However, the overall cost perspective should not be ignored.
4.5 Limits of Supplier Management
Furthermore, it is important to find out which points make Supplier Management more difficult and, as a result, it may not be possible to generate significant Value Contributions. The question thus
addresses possible restrictions that play a role in this regard.
Value Added from Supplier Management…
70
What are the limits of holistically oriented Supplier Management from the point of view of
'economic' action in relation to company value increasing?
The most frequently mentioned issues with regard to limits of Supplier Management activities are the market position and size of the supplier, the determination of specific Sourcing Strategies as well
as employee-relevant points on the part of the own company and the supplier, in particular regarding
capacity and know-how. Large suppliers have an own strategy, which deviates in part from the own company strategy, which may result in requirements that are not or not fully enforceable by the
supplier. It is also problematic if restrictions from specified sourcing stipulations rule out possible
alternatives. In addition to sole or single sourcing, this can also result from customer delivery instructions. The limits of holistically oriented Supplier Management can lie on the side of the own
company as well as on the side of suppliers. For example, the own company attaches great importance
to a high level of in-house production or provides too little capacity in terms of technology and quality
so that the opportunities in purchasing cannot be properly perceived, a second source cannot be established or a change of supplier cannot be implemented. On the contrary, suppliers, for example, do
not allow access to subcontractors, may not have a consistent compliance management system, are
unwilling or unable to make significant investments, or do not improve delivery and quality performance to the desired extent. Finally, a poor supplier relationship or inadequate communication
are other reasons for the limits of a holistic Supplier Management.
4.6 Optimal Number of Suppliers
The topic of supplier reduction has become a kind of ‘permanent issue’ because it is regularly
discussed, but adequate solutions for achieving a sustainably optimal supplier base are not available. The following question therefore refers to this complex and is intended to provide additional insights.
How can the optimal number of suppliers be determined, taking into account constant market
fluctuations? The discussion of this question varies between the interview participants: Nearly 1/3 of the
participants (4) rate the importance of the topic of optimizing the number of suppliers as high and
drive activities forward; the second group (4) sees supplier optimization as a side issue and the third
group (5) does not place any significant focus on corresponding activities. Regardless of this rating, a focus is on preferred suppliers, C-parts management, and common parts strategies. The topic of the
optimal number of suppliers is thus closely linked to material group management, but usually not a
priority goal in comparison to other tasks. The review of the supplier base in the companies takes place on an annualized basis with the adjustment of the purchasing and material group strategy. It is
important to have the right suppliers on board in order to be prepared for the future which means that
new suppliers may have to be set up, too. The implementation of phasing out strategies is sometimes difficult (active phasing out) and tedious (passive phasing out) if there is no focus on it, no capacity
available or spare parts availability has to be secured. Crucial are the status quo and the performance
level of the current supplier base as well as the ability to master the future challenges. Only one
interview participant stated that he had set a quantifiable target with regard to optimizing the number of suppliers via the proportion of A-suppliers.
4.7 Effects from a Close Customer-Supplier Relationship
Not every customer-supplier relationship is the same. Differences may arise due to close personal
contacts, due to long-term and good cooperation (more than five years without major difficulties), may involve a higher intensity and / or be characterized by intense trust. The tighter this connection is, the
lower the willingness to switch may be, although benefits are offered by other potential suppliers.
Which effects do come from a close customer-supplier relationship?
12 of the 13 interview participants (92.3%) work with at least one supplier to whom there is a close relationship. Overall, relationship management is seen as very important because ultimately the
business is done by individuals. It is also a good basis for cooperation when companies have a similar
culture. Nevertheless, even in close relationships rational decisions are the order of the day; the fundamental separation of both topics (thing vs. relationship) is absolutely necessary. Sufficient
communication with the supplier and a good internal vote is indicated. However, too close
G. Lechner
71
relationships should be avoided or, if necessary, pursued by companies. Of course, there are also
counter-transactions between the partners, but this has nothing to do with compensation transactions,
etc. The quality of a close and long-term business relationship, as with any business relationship, is also considered in terms of past performance. Nevertheless, the performance must be repeatedly
proven and provided again. Therefore, in close business relationships, decisions are deliberately made
jointly by multiple functions and, as far as possible, consensus should be the result. In particular, this is the case if commercial principles e. g. at low price differences, would be overridden. With large
price differences and in particular with large quality and logistics problems, it will be decided
independently of relations. In other words, although the tolerance limit for such suppliers is somewhat higher with regard to a change, it is always based on the overall cost perspective in order to ultimately
have the right supply partners in the portfolio.
4.8 Power of Small Suppliers
It is not always possible to easily obtain a high demand from suppliers. Especially if the available
capacities cannot cover the required demand. However, the following question does not relate to cooperation with large suppliers or exceptional situations with large suppliers, but to cooperation with
relatively small suppliers, which are important and irreplaceable solely on the basis of specific
competencies. That is, a change of supplier is not possible and you have to arrange with the supplier if necessary.
Which ,power’ do ,small suppliers’ have?
12 of the 13 interview participants (92.3%) work with at least one such supplier. All (12)
implement special measures regarding the management of these suppliers with regard to tight control, intensification of dialogue and establishment of the connection from management to management. The
biggest risk seen by such suppliers is the rapid penetration of supplier problems to the customer.
Therefore, risk management is given a high priority and, if possible, an alternative second source is built up quickly. That is not always possible; in part, for cost and capacity reasons, this is also only
considered when the business relationship no longer works. Other approaches, such as company
involvement, a formal development partnership, long-term contracts or the granting of pre-emptive
rights, if the competence of the supplier is crucial for the own company, are an option, too. In addition, purchasing must be vigilant in the context of 'daily management' so that it is involved early in all
important issues to prevent orders from bypassing purchasing.
4.9 Additional Remarks
Finally, the interview participants were asked a last question in order to obtain any insights that were not addressed in the previous interview process.
What else would you like to say about ,Supplier Management vs. company value increasing' what
we have not yet addressed?
Some participants explicitly stressed the topic of digitization or Purchasing 4.0. In addition to the use of new tools, a closer exchange of data and an expansion of networking with the larger suppliers is
expected. Likewise, the topic should also have an influence on employee development and
qualification measures. Today, Purchasing 4.0 is essentially characterized by automated processes regarding order processing and the associated follow-up processes. The significant acceleration of the
flow of information, especially between the company and its suppliers, should also increase the speed
of innovation even further. There should also be more interactions between machines. Overall, it is expected that the importance of Supplier Management will increase as specific supplier know-how
continues to be important. Strategic purchasing processes should gradually be automated and should
change the work content in purchasing accordingly. An increase in Value Added through assembly
procurement and increasing complexity should mean that the importance of availability remains just as important and suppliers may partly not deliver directly to companies. However, it is expected that
purchasing will continue to focus on 'optimizing direct material costs'.
Value Added from Supplier Management…
72
5. Conclusion
The high volume of external Value Added by the suppliers in the manufacturing industry justifies the importance of Supplier Management and underpins the importance of making a lasting
contribution to increasing the value of the company. Purchasing as the main interface to the suppliers
has this responsibility and must drive the selection and determination of the supply partners accordingly. In doing so, purchasing must ensure that the specified suppliers can meet the diverse
challenges of the own company. The targeted application of Sourcing Strategies supports these
activities. Derived from the main tasks of purchasing, the perception of price and cost responsibility comes
first. Suppliers are, however, also confronted with high demands with regard to the quality of the
products as well as the delivery performance (time-related). Fulfilling these requirements is a basic
requirement for cooperation in general. Good quality and high delivery performance of suppliers are two key parameters on which to build a supplier relationship so that further steps can be taken towards
close and long-term collaboration. In addition, it is expected that future collaboration with suppliers
will tend to become even more intense and closer, so it can be assumed that relationship management will be favored over anonymity.
The benefit or Value Added of working with suppliers exceeds the additional expense, this means
the opposing effects, obviously clear. It is therefore still very interesting for companies in the manufacturing sector to entrust suppliers with tasks in order to avoid higher structural costs on the one
hand and to generate additional Value Added on the other hand.
Furthermore, it can already be seen that a development spurt comes from Purchasing 4.0. The
increasing networking with suppliers means that process and information flow improvements not only contribute to cost efficiency, but also reduce processing times and generate faster sales. Thus,
purchasing contributes sustainably to employment protection in the own company and at the same
time is the engine for company growth in terms of gaining further market share.
References
Appelfeller, W., & Buchholz, W. (2011). Supplier Relationship Management - Strategie, Organisation und IT des modernenBeschaffungsmanagements[Supplier Relationship Management - strategy,
organization and IT of modern procurement management]. Wiesbaden: Gabler Verlag | Springer
Fachmedien Wiesbaden GmbH. Bacher, A. (2004). Instrumente des Supply Chain Controlling - TheoretischeHerleitung und
Überprüfung der Anwendbarkeit in der Unternehmenspraxis[Instruments of Supply Chain
Controlling - Theoretical derivation and verification of applicability in business practice].Wiesbaden: Deutscher Universitäts-Verlag GmbH.
Becker, H. (2007). Auf Crashkurs - Automobilindustrie im globalen Verdrängungswettbewerb [On
crashcourse - automotiveindustry in global cut-throatcompetition]. Berlin, Heidelberg: Springer-
Verlag. Boutellier, R., and Wagner, S.M. (2000). Zielgerichtetes Lieferantenmanagement durch
Lieferantenstrategien. Auch die kleinsten Lieferanten tragen zur Schöpfung von Mehrwert bei.
Neun Handlungsempfehlungen zur Pflege einer fruchtbaren Beziehung [Targetedsuppliermanagementthroughsupplierstrategies. Even the smallest suppliers contribute to
the creation of value added. Nine recommendations for nurturing a fruitful relationship]. IO
Management-Zeitschriftindustrielle Organisation, 69, pp. 27-33. Carr, A.S., & Pearson, J.N. (1999). Strategically managed buyer-seller relationships and performance
outcomes. Journal of Operations Management, 14, pp. 497-519.
Commission of the European Communities. (2003). EMPFEHLUNG DER KOMMISSION vom 6.
Mai 2003 betreffend die Definition der Kleinstunternehmen sowie der kleinen und mittleren Unternehmen [RECOMMENDATION OF THE COMMISSION of 6 May 2003
concerningthedefinitionofmicro, smallandmedium-sizedenterprises]. Amtsblatt der Europäischen
Union, 2003/361/EG. Commissionofthe European Communities. (2007). VERORDNUNG (EG) Nr. 586/2001 DER
KOMMISSION vom 26. März 2001 zur Durchführung der Verordnung (EG) Nr. 1165/98 des
G. Lechner
73
Rates über Konjunkturstatistiken: Definition der industriellen Hauptgruppen (MIGS); geändert
durch Verordnung (EG) Nr. 656/2007 der Kommission vom 14. Juni 2007 [COMMISSION
REGULATION (EC) No. 586/2001 of 26 March 2001 implementing Council Regulation (EC) No. 1165/98 concerning short-term statistics: definition of major industrial groups (MIGS); amended
by Commission Regulation (EC) No. 656/2007 of 14 June 2007]. Amtsblatt der Europäischen
Gemeinschaften, 2007/656/EG. Czaja, L. (2009). Qualitätsfrühwarnsysteme für die Automobilindustrie [Quality
warningsystemsfortheautomotiveindustry]. Wiesbaden: Gabler | GWV Fachverlage GmbH.
Döring, N., & Bortz, J. (2016). Forschungsmethoden und Evaluation in den Sozial- und Humanwissenschaften [Research methodsandevaluation in thesocialand human sciences].Berlin,
Heidelberg: Springer-Verlag.
Droege, & Comp. (1998). Gewinne einkaufen: Best Practices im Beschaffungsmanagement [Gain
Profits: Best Practices in Procurement Management]. Wiesbaden: Betriebswirtschaftlicher Verlag Dr. Th. Gabler GmbH.
Federal Statistical Office. (2018). Produzierendes Gewerbe - Kostenstruktur der Unternehmen des
Verarbeitenden Gewerbes sowie des Bergbaus und der Gewinnung von Steinen und Erden 2016 [Manufacturing industry - Coststructureofmanufacturingcompanies,
aswellasminingandquarryingofstonesanddirt in 2016]. Fachserie 4, Reihe 4.3 vom 04.06.2018.
Gabath, C. (2010). Risiko- und Krisenmanagement im Einkauf - Methoden zur aktiven Kostensenkung [Risk and Crisis Management in Purchasing - MethodsforactiveCostReduction]. Wiesbaden:
Gabler | GWV Fachverlage GmbH.
Gabath, C. (2011). Innovatives Risikomanagement im Einkauf [Innovative riskmanagement in
purchasing]. In: Gabath, C. (Ed.). Innovatives Beschaffungsmanagement - Trends, Herausforderungen, Handlungsansätze [Innovative procurementmanagement - Trends, challenges,
approaches] (pp. 15-48). Wiesbaden: Gabler Verlag | Springer Fachmedien Wiesbaden GmbH.
Hess, G. (2008). Supply-Strategien in Einkauf und Beschaffung - Systematischer Ansatz und Praxisfälle [Supply Strategies in PurchasingandProcurement -
Systematicapproachandpracticalcases]. Wiesbaden: Gabler | GWV Fachverlage GmbH.
Hess, G. (2011). Supply-Performance-Management - Den Wertbeitrag im Einkauf steuern [Supply
Performance Management - Controlling the Value Added in Purchasing]. In: Gabath, C. (Ed.). Innovatives Beschaffungsmanagement - Trends, Herausforderungen, Handlungsansätze
[Innovative Procurement Management - Trends, Challenges, Approaches] (pp. 53-88). Wiesbaden:
Gabler Verlag | Springer Fachmedien Wiesbaden GmbH. Hofbauer, G., Glazunova, A., & Hecht, D. (2015). Strategische Lieferantenauswahl [Strategic
supplierselection]. Working Paper, Heft Nr. 36. Ingolstadt: Technische Hochschule Ingolstadt.
Hofbauer, G., Mashhour, T., & Fischer, M. (2012). Lieferantenmanagement - Die wertorientierte Gestaltung der Lieferbeziehung [Suppliermanagement - The value-oriented design
ofthesupplyrelationship]. München: Oldenbourg Wissenschaftsverlag GmbH.
Hungenberg, H. (2014). Strategisches Management in Unternehmen: Ziele - Prozesse - Verfahren
[Strategic Management in Companies: Goals - Processes - Procedures]. Wiesbaden: Springer Fachmedien.
Ivanov, D., Tsipoulanidis, A., &Schönberger, J. (2017). Global Supply Chain and Operations
Management - A Decision-Oriented Introduction to the Creation of Value. Switzerland: Springer International Publishing.
Jäger, S. (2000). Instrumente des Beschaffungscontrollings: Balanced Scorecard und
LieferantenmanagementimFokus [Instruments of procurement controlling: Balanced scorecard and supplier management in focus]. Hamburg: IGEL Verlag GmbH.
Koppelmann, U. (2004). Beschaffungsmarketing [Procurementmarketing]. Berlin, Heidelberg:
Springer-Verlag.
Lechner, G. (2006). Erfolgreicher Einkauf von Baugruppen für die Werkzeugmaschinenindustrie in Polen [Successfulpurchasingofassembliesforthemachinetoolindustry in Poland]. In: BME,
&Bogaschewsky, R. (Eds.). Einkaufen und Investieren in Polen[PurchasingandInvesting in
Poland] (pp. 209-213). Würzburg: Centrum für Supply Management GmbH. Lechner, G. (2011). Internationalisierung des Einkaufs am Beispiel des Werkzeugmaschinenbaus
[InternationalizationofPurchasingusingtheExampleofMachine Tool Construction]. In: Gabath, C.
Value Added from Supplier Management…
74
(Ed.). Innovatives Beschaffungsmanagement - Trends, Herausforderungen, Handlungsansätze
[Innovative Procurement Management - Trends, Challenges, Approaches] (pp. 133-157).
Wiesbaden: Gabler Verlag | Springer Fachmedien Wiesbaden GmbH. Lechner, G. (2012). Erfolgreicher Einkauf von Baugruppen für die Werkzeugmaschinenindustrie in
China [Successfulpurchasingofassembliesforthemachinetoolindustry in China]. In: Faust, P., &
Yang, G. (Eds.). China-Sourcing - Beschaffung, Logistik und Produktion in China [China Sourcing - Procurement, Logistics and Production in China] (pp. 132-137). Berlin, Heidelberg: Springer-
Verlag.
Präuer, A. (2017). Strategisches Beschaffungsmanagement - Wertschöpfungsstrukturen in Industrieunternehmen [Strategic Procurement Management - Value CreationStructures in
Industrial Companies]. München: Verlag Franz Vahlen GmbH.
Prahalad, C.K., & Hamel, G. (1990). The Core Competence of the Corporation. In: Harvard Business
Review, Volume 68, Issue 3, pp. 79-91. Prahalad, C.K., & Hamel, G. (2006). The Core Competence of the Corporation. In: Hahn, D., &
Taylor, B. (Eds.). Strategische Unternehmensplanung - Strategische Unternehmensführung: Stand
und Entwicklungstendenzen[Strategic Corporate Planning - Strategic Company Management: Status and Development Trends] (pp. 275-292). Berlin, Heidelberg: Springer-Verlag.
Roodhooft, F., &Konings, J. (1996). Vendor Selection and Evaluation: An Activity Based Costing
Approach. European Journal of Operational Research. Volume 96, pp. 97-102. Rüdrich, G., Kalbfuß, W., &Weißer, K. (2004). Konzeption des Materialgruppenmanagements
[Concept of Material group management]. In: Rüdrich, G., Kalbfuß, W., & Weißer, K. (Eds.).
Materialgruppenmanagement - Quantensprung in der Beschaffung [Material groupmanagement -
Quantum leap in Procurement] (pp. 11-83). Wiesbaden: Betriebswirtschaftlicher Verlag Dr. Th. Gabler I GWV Fachverlage GmbH.
Van Weele, A.J. (2009). Purchasing and Supply Chain Management - Analysis, Strategy, Planning
and Practice. Andover: Cengage Learning Emea. Wagner, S.M., & Krause, D.R. (2009). Supplier Development: Communication Approaches, Activities
and Goals. International Journal of Production Research. Volume 47, No. 12, pp. 3161-3177.
Wildemann, H. (2002). Das Konzept der Beschaffungspotenzialanalyse [The conceptofprocurement
potential analysis]. München: TCW Transfer-Centrum GmbH & Co. KG.
3rd International Conference on Economic Research
24-25th October 2019, Alanya, Turkey
75
DISTINGUISHING HYPOCRITICAL ORGANIZATIONS BY SROI
Fuminobu Mizutani
Kanto Gakuin University, College of Business Administration, Japan
Email: [email protected]
Abstract
Not-for-profit organizations are nonprofit, independent organizations that promote public benefit.
Public benefit is a similar concept towelfare. In economics, it is known that not-for-profit
organizations have positive externality. Poverty, Inc.is an American film shown incinemas in 2014that
won the Templeton Freedom Award in 2015. This documentary revealed that some “not-for-profit”
organizations decrease welfare, and that this decrease inwelfare is sustained by contributions to such
“not-for-profit” organizations. Thus, in order to maximize welfare, contributors should distinguish
such hypocritical organizations from genuine not-for-profit organizations and avoid contributing to
hypocritical organizations. An accounting concept called social return on investment (SROI)
developed some decades ago in the US is widely used in the U.K. in order to evaluate the extent of the
impact ofeach not-for-profit organization onwelfare. The guide forSROI was translated from English
to many languages, including Arabic. However, traditionally SROI cannot be negative. Jevons used
the concept of disutility. Ethics in SROI are based on utilitarianism. Bentham thought that ethics had
to be constructed based on the sensations of pleasure and pain. Because the sensation of pain is in
accord with disutility, utilitarianism is in accord with the concept of disutility. Thus, introducing the
concept of disutility to SROI justifies SROI to be negative. While the concept of disutility may not be
well-known, a few contemporary economists,including at least one economist in the Middle East,use
this concept.If SROI of a “not-for-profit” organization is negative and profit-oriented, the organization
is a hypocritical organization and not actually a not-for-profit organization. One of the limitations of
this presentation is that it is not statistical, but theoretical. The claimthat SROI can be negative should
be verified statistically.
Keywords:Not-for-Profit Organizations, Hypocrisy, Accounting, SROI, Disutility.
1. Introduction
Not-for-profit organizations are nonprofit, independent organizations that promote public benefit.
Public benefit is a similar concept towelfare. In economics, it is known that not-for-profitorganizations
have positive externalityi. In Turkey, many not-for-profit organizations have contributedto welfare
using waqfs.
Poverty, Inc.is an American film shown in cinemas in 2014 that won the Templeton Freedom
Award in 2015. This documentary revealed that some “not-for-profit” organizations decrease welfare,
and that this decrease in welfare is sustained by contributions to such “not-for-profit” organizations.ii
Thus, in order to maximize welfare, contributors should distinguish such hypocritical organizations
from genuine not-for-profit organizations and avoid contributing to hypocritical organizations. The
purpose of this presentation is to find a method to help contributors to distinguish such organizations.
This presentation assumes that hypocrisy impairs welfare. Independence may not decide if an
organization that calls itself a not-for-profit organization is hypocritical or not. For an organization
that calls itself a not-for-profit organization, profit seeking is a factor of hypocrisy. It is relatively easy
to determine whether an organization is actually a profit-oriented or not if contributors check the cash
flow of the organization. If the organization makes dividends, regardless of what the organization call
them, the organization is profit-oriented. However, not all organizations that call themselves not-for-
profit organizations and are actually profit-oriented are hypocritical,because some social enterprises
that call themselves not-for-profit and actually profit-oriented may promote welfare. To be profit-
oriented is not a sufficient condition but a necessary condition for a “not-for-profit” organization.
Thus, contributors should consider whether an organization that calls itself a not-for-profit
organization promotes welfare or not, which is a little difficult.
Distinguishing Hypocritical Organizations…
76
An accounting concept called social return on investment (SROI)solves this difficulty. There is
some few prior research aimed at determining which organizations are hypocritical according to SROI.
Although McElwee and Smith (2015) advocate to use negative SROI in order to find profit-oriented
entities that impair welfare, they do not explain the existence of negative SROI from the perspective of
welfare economicsiii.
2. Negative SROI
2.1 What is SROI?
SROIis one kind of return on investment (ROI) and was developed some decades ago in the US.
SROI calculates the utility brought by each not-for-profit organization in a monetary amount. SROI is
widely used in the UK to evaluate the extent of impact by each not-for-profit organization onwelfare
and efficiency. The traditional SROI guide was translated from English to many languages including
Arabic. Traditional SROI defines the net SROI ratio as (1)iv:
Net SROI Ratio = Net Present Value / Value of Inputs (1)
There are evaluative SROI and forecast SROI. The Impact Multiple of Money (IMM) is a new
variation of forecast SROI.Unlike traditional SROI, IMM is calculated by someone outside the not-
for-profit organization. SROI is a strong tool for contributors.
However, traditionally SROI cannot be negative.The traditional SROI guide did not think SROI
can be negativev. Addy et al. (2019), which seems to be the official explanation by the developers of
IMM as three of its four authors are partners of the developers of IMMalso does not mention that IMM
can be negative.
2.2 Can Negative SROI Exist?
To determine whether negative SROI can exist in practice, two problems should be considered,
whether SROI can actually be negative, and, if so, whether negative SROI can be reported.
Historically, Jevons used the concept of disutility. Ethics in SROI arebased on utilitarianismvi
.
Utilitarianism is sometimes used in welfare economics, and total welfare in utilitarianism is defined as
(2).
W= U1(・) + U2(・) + …+ Un(・) (2)
Ui(・) represents the welfare of person i and all variables are allowed to influence his or her
welfarevii
. Bentham, in his systematic consideration of utilitarianism, thought that ethics had to be
constructed based on the sensations of pleasure and painviii
. Because the sensation of pain is in accord
with disutility, utilitarianism is in accord with the concept of disutility. Thus, introducing the concept
of disutility to SROI justifies the existence of negative SROI. When a situation with an organization
that calls itself a not-for-profit organization is 2 and a situation without the organization is 1, net
present value is as in (3):
Net Present Value = W2 – W1 (3)
If (3) is negative, the organization creates disutility. While the concept of disutility may not be
well-known, a few contemporary economists use this concept to consider labor, and at least one
economist in the Middle East usesit to consider environmental problemsix.
Most executives of organizations that call themselves not-for-profit organizations may hesitate to
announce negative SROI. However, traditional SROI has a process of assurance, and assurancegives
reliability to their SROI reports. Because the IMM is calculated by people outside the organization,
executives’ intentions do not influence to the IMM, making it reliable.
If SROI of a “not-for-profit” organization is negative and profit-oriented, the organization is
hypocritical and not actually a not-for-profit organization. Such organizations impair welfare. The
bigger the absolute value of negative SROI, the more efficiently such organizations impair welfare.
F. Mizutani
77
2.3 A Loophole
The SROI guide somehow allows an alternative calculationx, though both the numerator of return
on equity(ROE) and the numerator of return on assets (ROA) arethe net amount. This alternative can
serve as a loophole to hide negative SROI. This alternative is as in (4):
SROI Ratio = Present Value / Value of Inputs(4)
The numerator of (4) is the gross amount and is not influenced by costs. SROI ratio is higher than
the net SROI ratio, making it harder for theSROI ratio to be negative than the net SROI ratio.
This alternative should be prohibited in order to abolish loopholes to hide negative SROI, and to
prevent contributors from making contributions that impair welfare.
3. Conclusion
Negative SROI can exist from the perspective of welfare economics and the claim by McElwee and
Smith (2015) is correct. Contributors should determine which organizations are hypocritical using
SROI in order to maximize welfare.
One of the limitations of this presentation is that it is not statistical, but theoretical. The claimthat
SROI can be negative should be verify statistically.
References
Addy, C. et al. (2019). “Calculating the Value of Impact Investing: An Evidence-Based Way to
Estimate Social and Environmental Returns.”Harvard Business Review 97(1): 102-109.
Bojer, H. (2003). Distributional Justice: Theory and Measurement. Routledge, London, UK.
Farajzadeh, Z. (2018). “Emission Tax in Iran: Incorporating Pollution Disutility in a Welfare
Analysis.”Journal of Cleaner Production 186: 618-631.
Maier, F. et al. (2015). “SROI as a Method for Evaluation Research: Understanding Merits and
Limitations.”Voluntas: International Journal of Voluntary & Nonprofit Organizations 26: 1805-
1830.
Mankiw, N. G. (2016). Principles of Economics, Eighth Edition. Cengage Learning, Boston, MA.
Miller, M. M. (Director) (2014). Poverty, Inc. US.
McElwee, G., & Smith, R. (2015). “Towards a Nuanced Typology of Illegal Entrepreneurship: A
Theoretical and Conceptual Overview.” In McElwee, G. & Smith, R. (eds.). Exploring Criminal
and Illegal Enterprise: New Perspectives on Research, Policy & Practice (pp. 3-22). Emerald
Group Publishing, Bingley, UK.
Schofield, P. (2009). Bentham: A Guide for the Perplexed. Continuum, London, UK.
Spencer, D. A. (2003). “Love’s Labor’s Lost? The Disutility of Work and Work Avoidance in the
Economic Analysis of Labor Supply.”Review of Social Economy 61(2): 235-250.
SROI Network (2012). A Guide to Social Return on Investment. SROI Network, Liverpool, UK.
iMankiw (2016), p. 203.
iiMiller (2014).
iiiMcElwee and Smith (2015), p. 16.
ivSROI Network (2012), p. 68.
vSROI Network (2012), p. 97.
viMaier (2015), p. 1816.
viiBojer (2003), p. 22.
viiiSchofield (2009), p. 45.
ixSpencer (2003) and Farajzadeh (2018).
xSROI Network (2012), p. 68.
3rdInternational Conference on Economic Research
24-25th October 2019, Alanya, Turkey
78
ENTREPRENEURSHIP AND INTENTION OF ENTREPRENEURSHIP:
A CASE STUDY
Tomasz Bernat
University of Szczecin, Economics Department, Poland
Sultan Merve Çetin
University of Szczecin, Economics Department, Poland
Email: sultanmervectn @gmail.com
Abstract
Among the most important factors that affect economic improvement in today’s world there are
entrepreneurs and entrepreneurship. As the importance of entrepreneurship increased, so did the
number of researches that aims to discover the personality qualifications of entrepreneurs, and the
factors that affect entrepreneurship and intent of entrepreneurship. One of the area researched last
years is youth/young labor market participants entrepreneurship. In this paper we examine this
behavior in the area of international migration. The special stress is placed on the case where young
entrepreneurs that has migrated from one to another country have set up the company. The migration
can be point out as a method of joining the society.
In this study intention of entrepreneurship and the factors that affect entrepreneurship is tried to be
explored with existing studies and a half-structured interview that was conducted with an entrepreneur
that moved to Poland from Russia at a very young age and started his own business. The interview
showed that unlike what most studies in the literature point out, education and family does not have an
effect on intention of entrepreneurship. The research method used in the paper is semi-structured
interview with the respondent. Participant was informed about the existence of a tape-recorder, but he
was given the chance to listen to the recording and remove some points partly or completely in order
to minimize the negative effects a recorder may create. The questions were established to find out the
main motivation and determinants of his decisions.
Keywords: Entrepreneur, Factors that Affect an Entrepreneur’s Personality, Intention of
Entrepreneurship.
1. Introduction
Entrepreneurial have started to be one of the issues that have been emphasized in recent years.
Today, with competition gaining a global character, entrepreneurship has become an important
research subject within the discipline of management.For the first time in the literature, Richard
Cantillon used the word entrepreneurship in 1730s. John Stuart and the British literature is used in the
19th century. It is said to have coincided with the century (Çetindamar, 2002:33). The increasing
importance of entrepreneurship is closely related to its vital function in terms of economic and social
development. Entrepreneurship is also seen as an essential tool for the growth of developing
economies. This phenomenon is recognized on a global scale today, including developed economies.
(Zoltan vd., 2001: 23-245). Entrepreneurship is now a rising value of our age.More capital investment
has been made over the past century, and the quality of entrepreneurship increased both in terms of
quality and quantity compared to the previous century (Bozkurt and Erdurur, 2013: 58). It can be said
that entrepreneurship has gained a greater importance in the world, especially with the transition from
industrial society to Information Society. In today's information society, while the weight of human
labor on production is decreasing, the weight of knowledge-based labor on production is increasing
day by day. At this point, it can be said that the importance of entrepreneurship emerged as a
complement to innovation, creativity and management activities. In addition, today, the global
economy becoming more competitive can also be considered as other factors that increase the
importance of entrepreneurship (Özkul, 2007: 344).
Entrepreneurship, because it is a dynamic force for the development of the economy, is of vital
importance. It is not easy to set up and maintain a business. Entrepreneurs need courage, talent and
Entrepreneursiıp and Intention of Entrepreneurship…
79
creativity together. Buddha is only possible thanks to entrepreneurs who have these factors. There are
many factors that affect the intention of entrepreneurship. These include financial resources,
education, role models, work experience, beliefs, family, culture and personality traits.
In this study, in order to detect the correspondence between the literature and the practice of
intention of entrepreneurship and the factors that are effective in entrepreneurship, a half-structured
interview had been conducted with an entrepreneur that moved to Poland from Russia at a very young
age and started his own company. The results of the interview had been analyzed in detail.
2. Entrepreneur and Entrepreneurship
When the concept of entrepreneurship was first introduced, it was defined as attempting, starting a
business and taking risks in that matter. Later, the definition was widened as putting forward an idea
and transforming these ideas into products and services to be introduced to a market (Zhao, 2005:26).
Entrepreneur, on the other hand, is defined as the person that puts forward ideas, turns them into
reality and combines his/her own passion and creativity in the process (İrmiş and Barutçu, 2012:3;
Kao, 1989: 91). Seeing and seizing opportunities, risking resources to capture those opportunities,
transforming ideas into investments and creating what is desired in the end are among the features that
make a person an entrepreneur and differentiates that person from all others. With these features,
entrepreneur is defined as an innovative, creative, role model in economic growth who is a risk-taker
(İrmiş et.al. 2010:10). According to another definition, the most profitable entrepreneurs in order to
produce goods and services that brought together the production elements under the conditions of the
person. Take risks and implement the business project. The entrepreneur makes money, but also
produces economic value. It also provides employment to other people. The combination of skills,
knowledge and courage features creates the entrepreneur.
The concept of entrepreneur was first used in the literature academically in the 18th century by
economist Richard Cantillon. According to Cantillon, entrepreneur is the person who faces
indefiniteness while operating activities. In Cantillon’s entrepreneur profile, entrepreneur is the person
who buys a product for a definite price, in a specific amount. However, the price and amount the
entrepreneur would sell the product is not specified (Özden et.al., 2008).
Schumpeter, on the other hand, has embraced a perspective that focuses on innovative side of
entrepreneurship. Schumpeter, the theory of Economic Development and Capitalism, Socialism and
Democracy, and business cycles, one of the important economists of the century, tried to establish the
dynamic mechanism of the economic system, and in doing so, gave a separate importance to
innovation through entrepreneurs and entrepreneurs ( Er, 2013: 76). Joseph A. Schumpeter (1883-
1950) took a different approach, emphasizing the role of innovation. According to Schumpeter, the
entrepreneur is someone who carries out "new combinations" by such things as introducing new
products or processes, identifying new export markets or sources of supply, or creating new types of
organization. Schumpeter presented a heroic vision of the entrepreneur as someone motivated by the
"dream and the will to find a private kingdom"; the "will to conquer: the impulse to fight, to prove
oneself superior to others"; and the "joy of creating."
(https://www.econlib.org/library/Enc1/Entrepreneurship.html)
3. Factor that Affect the Personality of Entrepreneur
Human behavior is determined and shaped with the influence of many factors. Biological factors
being the factors that affect shaping of the character of a person as it is innate, behaviors that are
dictated by the society and psychological effects also play important role in shaping personality of a
person (Eroğlu, 2009: 201-202). In this sense, it has been concluded by many researches that while
there are many factors that innately push a person to be entrepreneur, external factors are also highly
effective in entrepreneur’s personality. Family, society, education and economic environment are seen
as important factors that affect the tendency of entrepreneurship (İrmisand Barutçu, 2012: 3;
ChenandLai, 2010: 10).
T. Bernat and S. M. Çetin
80
4. Intention of Entrepreneurship
Intention of entrepreneurship is said to have an important role in deciding to start a company. Many
research and studies have been conducted in this subject. Entrepreneurship usually appears in
accordance with the person’s desires and wants. Thus, it is a planned behavior that was intended in the
first place (Naktiyok and Timuroğlu, 2009:85). In the literature it is argues that there are many factors
that determine intention of entrepreneurship. Personal attitude, behavioral control, personality traits,
gender, family and environment are said to be among these factors.
There have been different opinions regarding the factors that determine entrepreneurship. When
literature is examined, it is seen that factors that determine entrepreneurship are divided into three
perspectives. These perspectives are; individual perspective (the need for success, locus of control,
tendency to take risks, behavior against indefiniteness, self-confidence, innovativeness, family,
education, values, age, work experience, role models), environmental perspectives (social, political,
cultural, economic, technological conditions, societal values and norms) and company perspective
(focusing on activities within a corporation (Özdenvd., 2008: 5-7).
Recently, the most preferred perspective is the individual perspective. This perspective aims to
explain entrepreneurship in a more psychological manner. Psychologically values, attitudes,
experiences and unconscious effects on behaviors of an individual play an essential role in
determining entrepreneurship. As psychological features self-confidence, risk-taking, motivation,
patience, etc. are important as well (Özdenvd., 2008: 336-337). Factors determining the intentions of
entrepreneurship have displayed difference with time. For many years, different approaches and study
methods have been used to explain deciding to be an entrepreneur. Some researchers have looked into
the personality traits that have a direct relationship with entrepreneurship. In other studies, different
personality traits such as age, gender, belief, education, race, work experience have been examined for
their relationship with intention of entrepreneurship (Liñán, 2004: 3).
5. Methodology
In order to detect the factors affecting entrepreneurship and intentions of entrepreneurs, a semi-
structured interview had been conducted with an entrepreneur who has established his own business in
Poland. Interview questions can be examined under three categories:“About Creation of Company”,
“About Current Activity”, “About Future Plan”. Participant was informed about the existence of a
tape-recorder, but he was given the chance to listen to the recording and remove some points partly or
completely in order to minimize the negative effects a recorder may create. Participant was invited to
an environment where he could feel peaceful and comfortable revealing his ideas and an appropriate
interaction space was provided.
6. The Study
The questions of the interview were made up of three parts. The first part was “About the Creation
of Company”, and the questions aimed to answer the following; how he decided to start his own
business, what is the effect of his current education level in starting his business, did his personality
traits have an effect on his intention to start his own business, how much did his family and friends
contribute to his decision to start his own business, how did he manage to find the financial resources,
what are the easiest and the hardest things about starting a business. He pointed out that he intended to
become an entrepreneur at an age as early as 13-14. According to his claims, he has always had an
interest in computers and dealing with computers made him happy; thus, he started an initiative in IT
when the time and place was right. He emphasized that the most important thing when he started his
own business was his personality traits. The most effective factors that helped him during his start-up
are said to be his determination, eagerness, the fact that it was his dream, that he had a vision and that
he did not want to work for anyone else but himself. While evaluating the easiest and hardest parts, he
suggested that nothing was easy other than the application to start the business after everything was set
to place. He pointed out that throughout the first years of his company, he did not have a financial
gain, but he was expecting this. He suggested that he was ready to take risks. To start his own
business, he explained that he had worked in several other companies to save money and gain
Entrepreneursiıp and Intention of Entrepreneurship…
81
experience. While he explained his financial resources, he referred to the fact that Russia was not as
helpful as Poland when it came to supporting entrepreneurs. As a part of European Union, Poland is
said to be more supportive about entrepreneurships. When asked about the effect of his education in
his intention of entrepreneurship, he said that he dropped out of high school and decided not to go to
college and he pointed out that education was not the key to success or having a business of one’s own
as it did not have a direct effect on practice. Although he did not continue his education, he kept on
improving himself by reading books and doing researches on his own in order to have enough
accumulation to start his own company.
Following interview questions were under the category of “About Current Activity”. The questions
aimed to answer the following: did he have any employees that work for him, did the company offer
innovative products or services and what are the current activities of the company. He said that he
started the company individually, but as the company grew larger, he employed more people and
eventually he formed a partnership with another company within the same area of jobs. What was
interesting about the offered products and services was that the majority of customers wanted to have
more specific, different and new products and services although classic services were also still
preferred by some. He suggested that expensive does not always correspond to quality and that his
goal is to provide quality service with a reasonable price unlike his competitors in the market. He
claimed that he had been trying to outdo himself every year with innovative and creative products and
services. He said that he was following every improvement in the market as lack of improvement
meant the death of a company especially under current circumstances.
The final part of the interview was “About Future Plan” category. The aim was to have a gist of the
participant’s future plans about his company. He mentioned that he had always planned to step up his
company’s game ever since it was built, and he created a strategy to be followed for that goal to
become reality. He also suggested that he follows the market closely for any improvement or change
and aims to globalize his company in the future.
7. Conclusion
The semi-structured interview that was conducted with the participant was examined under three
perspectives that were mentioned before with relation to factors that affect entrepreneurship and
intentions of entrepreneurship. When individual perspective is taken into consideration it can be
concluded that the need for success, tendency to take risks, behavior against indefiniteness, self-
confidence, innovativeness, work experience, etc. factors were found to be effective while family and
education remained ineffective. When environmental perspective is taken into consideration, political
environment, economical environment and technological conditions were found to be effective as
external factors. Finally, when company perspective is considered, it is found that although the firm is
now a larger-scaled partnership, the number of employees and partners seem to be irrelevant to the
entrepreneur’s intentions as he displays executive functions successfully.
As a result, it can be concluded that although the results of the interview have some similar features
with those that focus on individual perspective as well such as that of Cromie (2000) and Crant
(1996); however, it differs from some others such as Noel (2002), Balaban and Özdemir (2008),
Özdenvd (2007) and Liñán et.al. (2011) in the sense that education is not always effective in
determining the intentions of entrepreneurship. If examples are to be multiplied, it can be deducted
from Steve Jobs’ speech at Stanford University (https://www.youtube.com/watch?v=1i9kcBHX2Nw)
that education by itself is not enough. Sir Ken Robinson, who is a British speaker, educator, consultant
and writer, said the following about education in his TED Talk in 2007:
“What we do know is, if you're not prepared to be wrong, you'll never come up with anything
original -- if you're not prepared to be wrong. And by the time they get to be adults, most kids have
lost that capacity. They have become frightened of being wrong. And we run our companies like this.
We stigmatize mistakes. And we're now running national education systems where mistakes are the
worst thing you can make. And the result is that we are educating people out of their creative
capacities. Picasso once said this, he said that all children are born artists. The problem is to remain
an artist as we grow up. I believe this passionately, that we don't grow into creativity, we grow out of
it. Or rather, we get educated out of it.”
T. Bernat and S. M. Çetin
82
Conclusively, the study suggests that education and family factors do not have an irreplaceable
effect on entrepreneurship and the intentions of entrepreneurship. Regardless, more general results can
be reached with a wider range of participants.
References
Balaban, Ö., ve Özdemir, Y. (2008), “Girişimcilik Eğitiminin Girişimcilik Eğilimi Üzerindeki Etkisi:
Sakarya Üniversitesi İİBF Örneği”, Girişimcilik ve Kalkınma Dergisi, ss 133-148.
Bozkurt, Ö. Erdurur K. (2013), Girişimci Kişilik Özelliklerinin Girişimcilik Eğilimindeki Etkisi:
Potansiyel Girişimciler Üzerinde Bir Araştırma, Girişimcilik ve Kalkınma Dergisi (8:2).
Crant, J.M., (1996),“TheProactivePersonalityScale as a Predictor of EntrepreneurialIntention,
ResearchGate, Journal of Small Busıness Management, pp. 42-49.
Cromie, S. (2000),“Assessingentrepreneurialinclinations: Someapproachesandempiricalevidence”,
University of Ulster, Jordanstown, NorthernIreland, EuropeanJournal of
WorkandOrganizationalPsychology,, 9 (1), 7–30.
Çetindamar, D. (2002), Türkiye’de Girişimcilik, TÜSİAD Yayınları, İstanbul.
Er, P. H. (2013). “TheTerms of Entrepreneurshipandİnnovativeness in theEconomicThought: Joseph
A.Schumpeter.
Eroğlu, F.(2009), Davranış Bilimleri, Geliştirilmiş 9. Baskı, Beta, İstanbul.
İrmis, A.,Durak İ., Özdemir, L. (2010), Girişimcilik Kültürü, Anadolu Girişimciliğinden Örnekler,
Ekin, Bursa.
Kao, J. (1989), Entrepreneurship, Creativity&Organization, PrenticeHall, EnglewoodCliffs, New
Jersey.
Kalkan, A. (2011), “Kişisel Tutum, Öznel Norm ve Algılanan Davranış Kontrolünün Girişimcilik
Niyetini Üzerindeki Etkisi: Üniversite Öğrencileri Üzerine Bir Uygulama”, Süleyman Demirel
Üniversitesi Sosyal Bilimler Enstitüsü Dergisi, sayı 14, ss 189-206.
Liñán, F.,Rodríguez, J.C., Rueda, J.M. (2011), “Factorsaffectingentrepreneurialintentionlevels: a role
foreducation”, International Entrepreneurshipand Management Journal, pp.195–218.
Liñán, F., (2004), “Intention-basedmodels of entrepreneurshipeducation”, pp. 1-30.
Liñán, F.,Rodrıguez, J.C. (2004), “Entrepreneurialattitudes of Andalusianuniversitystudents”, Ersa
Conference, Porto (Portugal), 21-25 August.
Naktiyok, A., Timuroğlu, M.K., (2009),“Öğrencilerin Motivasyonel Değerlerinin Girişimcilik
Niyetleri Üzerine Etkisi ve Bir Uygulama”, Atatürk Üniversitesi İktisadi ve İdari Bilimler Dergisi,
Cilt: 23, Sayı: 3.
Özkul, G. (2007), “Kapitalist Sistemin Sürükleyici Aktörleri: Ekonomik Teoride Girişimciler”,
Süleyman Demirel Üniversitesi İktisadi ve İdari Bilimler Fakültesi, ss.343-366.
Özden, K.,Temurlen, M.S., Başar, S., “ Girişimcilik Eğilimi: Kırgızistan- Türkiye Manas Üniversitesi
ve Atatürk Üniversitesi Öğrencileri Üzerine Bir Araştırma”, 2. Uluslararası Girişimcilik Kongresi,
7-10 Mayıs 2008, Bişkek.
Zhao, Fang (2005), “ExploringtheSynergyBetweenEntrepreneurshipandInnovation”, International
Journal of EntrepreneurialBehaviour&Research, Vol:11, No.1, pp.25-41.
Zoltan, J.A.,Randall, K.M., Bernard, Y., “Entrepreneurship, globalization, andpublicpolicy”, Journal
of International Management, 7(2001), pp 235-251.
https://www.econlib.org/library/Enc1/Entrepreneurship.html
https://www.youtube.com/watch?v=1i9kcBHX2Nw)
https://sites.psu.edu/johngorgone/2013/09/04/jobs-commencement-address-summary/comment-page1/
https://www.ted.com/talks/ken_robinson_says_schools_kill_creativity/reading-list
3rd International Conference on Economic Research
24-25th October 2019, Alanya, Turkey
83
CUSTOMS UNION AND COMMON COMMERCIAL POLICY
Hüseyin Mahir Fisunoğlu
Çağ University, Department of International Finance and Banking, Turkey
Email: [email protected]
Abstract
Since 1995, when a Custom Union agreement has been signed between Turkey and the European
Union, a fierce debate in Turkey is going on whether customs union and following common
commercial policy are benefitial for Turkey or not. Sometimes this debate has turned to apolitical
debate. As an underlying assumption, each trade agreement should be mutually benefitial for both
sides. However, Turkey’s customs union with European Union is quite different than the other custom
unions and common commercial policies. As a rule, when countries set a customs union they
determine a common tariff policy. Secondly, they can determine some import restrictions using
quotas. Thirdly, they determine a common policy against the third countries. Outside the union other
free trade agreements covers generally the all members.
Turkey’s customs union and common comercial policy agreements have not contained these
general rules.They had lacked the common trade regime. As time goes by, mostly under non-economic
factors, the expected benefits from customs union have not seen along with expected full-
membership. In another words, despite it continued, the expected benefits have become questionable.
In general, customs union is an incomplete approach if it should seen only as an international trade
agreement. Agreement should contain the whole economic structure base on trade. Turkey’s
aggrement has covered only a limited area of industrial products and agricultural-based industry. It has
not covered agriculture and service sector.
Generally speaking decision makers analyze the benefits of customs union and common
commercial policy according to foreign trade volumes and trade ratios with respect to member
countries. In the global manner, foreign trade volumes do not decline except some extreme situations.
As long as national incomes increase, so as the foreign trade volumes. The benefits of trade in customs
union and common commercial policy calculations are performed in another way. The most important
point should be considered as“creating trade”and “managing its direction” of customs union. Creating
trade means additional trade volume as a result of a decline in tariffs within member countries.
Managing trade directions means that relatively cheaper import within member countries since
customs tariffs abolished. One another positive contribution of customs union may be “sectoral
consantration”so that the unit cost of production will be decline. This is particularly important for
manufacturing industry.
Throughout this presentation, these three concepts of customs union, “creating trade”, “managing
trade direction” and “sectoral concentration”, will be discussed for Turkey. It will be argued that
Turkey has not benefited enough from customs union, since; i) it covers a limited area of economy, ii)
external assymetry, iii) visa and transportation/logistic problems.
As long as unemployment rates are not declining, productivity gains are not enough and not
sustainable, and income increases are not satisfactory, people question the benefits of customs union
and common commercial policy in Turkey.
The outline of the presentation as follows: i) A short history of Turkey’s with European Union
which taken both sides to a customs union and common commercial policy. ii) The articles of
customs union and common commercial policy agreement between Turkey and European Union. iii)
The change in trade between Turkey and the EU in order to understand gain from trade. iv) A critical
discussion will be performed for Turkey’s customs union and common commercial policy.
Keywords: Customs Union, Common Commercial Policy, Gains from Trade, Turkey and European
Union.
3rd International Conference on Economic Research
24-25th October 2019, Alanya, Turkey
84
A NEW VISION FOR THE FINANCIAL REGULATION SYSTEM
IN MANAGING GLOBAL CHALLENGES AND CRISIS
Fouad H. Beseiso
Palestine Monetary Authority Former Founder and First Governor, Palestine Email: [email protected]
Abstract
In exploring the main determinant factors allowing the financial sector to play its decisive
contribution for the effective management of the global challenges, including future crisis while
aiming at achieving economic stability and sustained growth at the same time, our deep analysis has been dedicated to the main reasons of recent crisis and the required safe and sound strategy to be
adopted in light of the global and national economic and financial challenges. we looked into our
recent published studies and research works covering all aspects of financial crisis which resulted in two main determining developments; first related to the newly emerging revolution in economic
science which brought to our governing public policies and financial systems happiness economics
which is focusing on the human subjective as well as objective wellbeing, second related to the important financial developments represented by the emerging Islamic banking and finance system.
In exploring the main determining factors enabling the financial sector to play its resilient
contribution for the effective management of crisis, our deep analytical works concluded with the need
for adopting a new strategic vision composing of three main determining factors (Pillars). The three main pillars are composed of the adopted conceptual basis of Happiness Economics, Islamic
Economics and the required International Financial reform based upon Crisis Knowledge base,which
involve effective pursuance to the development of early warning system, and the required active response to various fields of financial technological advancement as stated by the fourth industrial
revolution, while being in a continued state of worries about its possible negative human and financial
impacts. We believe that aiming at crystallizing a new strategicvision based upon our conclusion call for
searching common understanding based upon defined pillars of our strategic vision for a new leading,
social and human role for the financial sector in preparation for global changes and challenges.
Keywords: Financial System, Happiness Economics, Islamic Finance, International Financial Reform, Managing Crisis, Fourth Industrial Revolution, Central Banks.
1. Introduction
1.1 Motivations and Objective
My paper main topic is motived by the resulting conclusions of many of my conducted studies as well as the conclusions of many other studies related to the continued periodical crisis in the global,
regional and national financial systems. All these conceptual and empirical studies and this researcher
practitioner experience created the belief on the urging need for a new financial regime to be created with ethical and human inclusion into its structure. This has been leading to explore the model on
which financial regime could approach effectively the sustained growth and stability objectives and
the management of future possible financial crisis. Many international and academic economists and financial experts and practitioners within the international and regional European economies gave
analytical prediction about serious opportunities for expected crisis within the international and
regional European economies.
Thus our main objective of this paper has been defined to formulate a a new vision for alternative financial regulation system, equipped with most effective determinants playing their effectiveness in
approaching their mission to achieving sustained growth while at the same time managing effectively
crisis. My approach is related and based directly upon my recent conducted researches about three main
conceptual as well as empirical research topics (Three Pillars for our research analysis) which have
A New Vision for the Financial Regulation System...
85
been focusing on how to manage economic, financial and banking crisis and the recent emerging
science on the economics of happiness as well as the conceptual and practical role played by Islamic
economics in managing crisis within regional and international financial systems1. Our direction objecting the Economic Happiness Science role in approaching effective financial
system management for crisis has been motivated by our deep researches and arising belief on this
science decisive role in approaching effective management of economic and financial crisis within the final aimof approaching human wellbeing. It is of direct relevance to this what was stated by Carol
Graham when questioned about the crisis impact on happiness during the first year of the last financial
crisis of 2008: Carol Graham statements based upon research surveys related to human wellbeing proved that
financial crisis would be reflected badly on the psychological status of people and creates a state of
fear about more unemployment, more business losses and uncertainty about their future standard of
living. There is also a kind of a psychological effect that affects financial markets as well. “people are risk averse and loss averse”……….” An extra dollar of income does not make people
as happy as a loss in a dollar of income makes people unhappy. So losing, or being afraid of losing,
income and security has much more negative effects on happiness than do income gains” “I think the uncertainty effects in this particular crisis are having probably quite strong effects on a lot
people’s wellbeing” (Graham , 25Nov.2008).
These conceptual conclusions which are based upon practical empirical research and surveys,
motivated our belief for initiating active research work into the economics of happiness role in managing crisis and explore how this science could be of feasible contribution to both cases related to
instituting safe and sound financial system directed to achieving sustained stability and growth, and
avoiding at the same time crisis, while minimizing their impact when happening.
Here we would shed light on the last speech presented by Mark Carney Governor of Bank of England as responding the creative thought which conducted plans towards the new financial
aspirations requiring reshaping the regulatory role of central banks and mobilizing their capacity
towards leading the required evolution and development in the financial sector, while focusing on the new financial role responding to the new economic and financial era requirements, he stressed upon
the final objective for all planned policies to be by definition Human being Welfare;
“The new finance will develop for the new economy, not in isolation from it. Over the course of this year, Bank colleagues, led by Huw van Steenis, will explore these and other themes in roundtables,
workshops and forums with a broad range of stakeholders up and down the UK.While we prepare for
great change, we will be guided by one constant: to promote our mission the good of the people we all
serve” (Carney (Governor of the Bank of England Speech), 2018). Direct focus is intended to give highlights on the internationally well realized constructive role of
Islamic Economics and Finance as proved in light of the last international financial crisis lessons.2
The ongoing revival of Islamic Banking and Finance and high annual growth in its regional and international banking activities and growing contribution have created the need for a clear, integrated
picture of the contribution that Islam has to offer to realize the kind of wellbeing that it could achieve,
and to counter the different problems now facing mankind, particularly in the economic and finance
field. Of special interest is a strategy that would help reduce to manageable limits the macroeconomic and external imbalances that most countries around the world are now experiencing, and would yet
enable them to attain full employment, remove poverty, fulfill needs, and minimize inequalities of
income and wealth (CHAPRA, 1995).
1.2 Paper Approach
Our paper will be conducting required analytical research directed to achieve its defined main
objectives including defining the main components of the required base for a new vision related to a
financial system approaching effectively sustained growth and crisis management. The base is
including the role of Happiness Economics in restructuring and managing financial crisis,Central Banks regulatory role and their new role responding to managing crisis within Human wellbeing
welfare as their final objective, also the conceptual role of Islamic Economics in managing crisis in
light of the last international crisis lessons, and the Role of International Financial Institutions with their coordinating role for managing crisis are explored.
F. H. Beseiso
86
The followed approach would be directed to respond to the following questions;
How deep Knowledge about crisis causes, impact and determining factors for managing them constitute the main prerequisite base for pragmatic approach for crisis effective management.
How the process of pouring the economics of happiness conceptions into the banking and financial
sector with the central banks as the leaders for the financial sector, and all other players within this sector could be a determining factor in approaching effective management of crisis.?
How could the new conceptual basis of the emerging Islamic Banking and finance system
contribute to restructuring the institutional and financial international role of the international financial institutions and coordination between world regulatory institutions?
How could the new conceptual approach construct a financial system achieving governance in the
regulatory system directed to effectively manage crisis.Based upon our analytical course responding to
the above mentioned questions we will determine the direction we intended to pursue towards newly born effective financial system led by Central Banks3.
1.3 Contents
1. To approach this paper objectives and respond to arising motivation it is found logic to analyze the
following factors;
2. Knowledge Base for Crisis Determinants and their Effective Management 3. Role of Happiness Economics in approaching new effective regulatory financial human system.
4. The New Required Mission for the Financial Sector with Central Banking Leading Role.
5. Managing the Ongoing Fourth Industrial Revolution. 6. The Role of Islamic Economics and Finance in Crisis Management
7. Reforming the International Financial System
8. Concluding Remarks
2. Knowledge Base for Crisis Determinants and their Effective Management
The last international crisis erupted in 2008 which emerged first within the financial sector and developed into real economic crisis with its noticeable destructive impacts on most of the world
countries’ economies This crisis has motivated a large amount of research works, surveys as well as
many workshops, expert group meetings, conferences and interviews with eminent intellectual pioneers and practitioners. Most of these works illustrated determining factors governing crisis causes,
impacts, and derived lessons on how to manage effectively economies and financial sectors in order to
neutralize their developments from falling into crisis, while mitigating their destructive and painful impacts on the human wellbeing.
Part of these scientific efforts shed lights on the impact of crisis on human wellbeing and
happiness, other part pursued the emerging Islamic finance role within the regional and international
systems as many signs emerged about its feasibility in managing effectively economies and financial systems and reflected favorably on the question of crisis.
My paper is a continuing research conducted by above mentioned circles on the crisis relation with
human being impacts and the emerging role of Islamic banking and finance while aiming at approaching the required strategic vision for financial sector effective management of crisis)Beseiso,
Op.cit.).
We can stress in the following the main important determinants of managing crisis as concluded by
the last works on crisis lessons including our works(Ibid).
• Mismanagement of the economy and financial sector.
• Fastest technological progress in the financial markets investments with some uncontrolled
financial technological activities including derivatives.
• Miss judgments by credit risks evaluating institution ( Leman Brothers example)
• Weak system about early warning system.
• Weak role played by the international financial institution whether for formulating early
warning system or for given advices to countries on how to managing the crisis.
A New Vision for the Financial Regulation System...
87
• Uncontrolled capitalistic regime as designed on the conceptual basis of for the conventional
theories of Economics since Adam Smith invisible hand of the free market.
• Uncontrolled balance between the real economy activities growth and financial sector growth.
This problem is thought to be solved within Islamic Economics and Finance system.
• Direct and indirect relations between crisis and happiness.
• Global and National Socio-Economic and Political regimes constitute a main determining
factor for periodic crisis and huge human suffering as proved by continued conflicts, economic and military wars and ethnic disasters. The arising development of our current state of affairs contradict
deeply with the human wellbeing and requiring new human socio-economic and political model4.
3. Role of Happiness Economics in Approaching Effective Regulatory Financial Human System
Recent revolution in Economic Sciences reached the methodology and approach for happiness economics through joint objective and subjective wellbeing5. This revolution gathered the tools of
analysis used in economic and psychology sciences, motivated by the emerging need to approach
human development not only through the conventional economics of Adam smith invisible hand of
free market and basing all theories on the objective of building wealth rather than socio-economic moral and political determinants for human happiness.
At the early beginning of economic science by Adam smith the science centered on how to
maximize production and consumption without directing attention to the question of poverty, distribution of income and sustained favorable environment. The main center of thought had been
directed towards building the nation strength and free market. Such thought led to motivate
imperialistic powers without caring about parts of the human society in the developing and poor countries.
"The failure of our theories at the macro and micro levels to recognize the existence of the poor
leads to numerous types of policy failures both at the theoretical and at the practical levels"6
The economic thought developed from Adam smith free market to mercantilism to socio economic development, then to human development, and most recently to the Economics of Happiness which is
defined as a historic revolution in the economic sciences which realized the integrated role of socio-
economic, moral and political aspects of the human wellbeing development.7 Considering human wellbeing not only considered to be the main objective for all governments but
also its historic approved role in the rise and fall of civilization, promoting or decline of a society.
Ibn-Khaldun the Moslem Arab Philosopher and Socio-Economic Thinker introduced a cause and
effect relationship into the discussion of historical phenomena. The Muqaddimah (his famous published scientific research) represented the result of this desire. It tried to derive the principles that
govern the rise and fall of a ruling dynasty, state (dawlah) or civilization (‘umran) (Chamlou, 2013).
Ibn-Khaldun concluded in his analysis related to the rise and fall of civilizations that the rise and fall of civilizations closely dependent on the well-being or misery of the people. This resulting thought
led the way to consider the human wellbeing as the main determining factor for approaching
civilization and seems to have had a clear vision of how all the different factors operate in an interrelated and dynamic manner over a long period to promote the development or decline of a
society.
3.1 The Economic Sciences Revolution about Happiness Economics – the Concept and
Determinant
Revolutionary developments in economics are rare. The conservative bias of the field and its enshrined knowledge make it difficult to introduce new ideas not in line with received theory.
Happiness research, however, has the potential to change economics substantially in the future. Its
findings, which are gradually being taken into account in standard economics, can be considered revolutionary in three respects: the measurement of experienced utility using psychologists' tools for
measuring subjective well-being; new insights into how human beings value goods and services and
social conditions that include consideration of such non-material values as autonomy and social
relations; and policy consequences of these new insights that suggest different ways for government to affect individual well-being.(Beseiso,2016)
F. H. Beseiso
88
In Happiness, emphasizing empirical evidence rather than theoretical conjectures,(Bruno,2007)
Bruno substantiates these three revolutionary claims for happiness research. After tracing the major developments of happiness research in economics and demonstrating that we have gained important
new insights into how income, unemployment, inflation, and income demonstration affect well-being,
Frey examines such wide-ranging topics as democracy and federalism, self-employment and volunteer work, marriage, terrorism, and watching television from the new perspective of happiness research".
Turning to policy implications, Frey describes how government can provide the conditions for people
to achieve well-being, arguing that a crucial role is played by adequate political institutions and decentralized decision making. (Ibid.).
3.2 The Happiness of People Guide Internationally Development Policies
The implication one may draw is that in countries where most people are not happy, there is
economic underperformance and loss. In July 2011, the United Nations (UN) General Assembly
proposed ‘the happiness of the people’ as a new measure to guide development policies. In April the following year, the UN launched the first meeting on happiness and wellbeing, presided over by the
Prime Minister of Bhutan. Not long after, the first World Happiness Report (Earth Institute 2012) was
published, pooling existing multi-disciplinary knowledge. This momentum, along with progress in
data standards and collection, has led to the integration of happiness components into the Sustainable Development Goals for 2015‒30, the successor to the Millennium Development Goals.
Various Socio-economic and political systems proved to have many gaps in responding to the
human wellbeing including in economic field (sustained economic growth, full employment, sustained real per capita growth and stability, in the social and cultural aspects , ensuring an adequate level of
social justice, education and higher education and ensuring basic quantitative and qualitative health
services , social care ) and moral (preservation of virtue, morality, religion and societies avoid corruption) and environmental pillar into development activities ( establishing a green development
projects committed to a clean environment requirements and preserving the rights of future
generations), and the political aspects including; democracy, Democratic institutions provide the
opportunity for the most disadvantaged groups in society to participate, institutionalize their rights, make choices, challenge public policies and hold Governments accountable,political freedom of
choice. formation of political parties, free public opinion,judicial just system, freedom of speech,
publication, and assembly; and Haqq al Karama, the duty to respect human dignity in social life.8 All mentioned existing gaps within the application of world economic systems as resulting from
the applied principles for conventional economic science and defined by the new happiness economics
science led to the same financial and banking system practices. These human wellbeing gaps should be examined and addressed by the newly born financial system and within the proposed strategic vision
based upon the leading regulating role of Central Banks.
4. The New Required Mission for the Financial Sector with Central Banking Leading Role
4.1The Role for Central Banking and Financial Sector in Approaching Happiness
The current structure and practices of the banking and financial sector are impacting human
wellbeing in a painful and noticeable suffering. Reference could be highlighted to illegal and inhuman
exercises which should attract central banks utmost care to address these practices. It should be
mentioned also that such practices exercised by the financial and banking institution were to a large extent responsible for the emerging regular crisis, particularly the last one of 2008 which reflected the
practices of the newly designed financial engineering tools called derivatives and the financing
practice directed to the real estate sector.
4.2 Effective Regulatory and Supervisory Framework
Central Banks could be playing their objected role through adapting all monetary policy tools,
including discount rate, interest rates, reserve requirements and credit policies, as well as central bank
A New Vision for the Financial Regulation System...
89
capacity as the main adviser for the government to the response in a conducive manner to the
requirements and determinants of Happiness economics and wellbeing as defined. This mission relates
to the products and polices and outputs of the Socio-economic, cultural and political system objecting human wellbeing.
This direction requires supervising and organizing the role of the financial sector towards a new
leader of socio-economic, cultural projects' priorities conforming to human development projects and building the stones for the strong base required for the takeoff towards sustained green development,
stability and wellbeing. This means a strong role to be emerging to support and encourage the green
projects including agriculture, food and water security, rural development directed to reach the poor and achieving equity among people and narrowing the Gap between the wealthy and the poor, support
social projects related to Human capital and Knowledge economy (including education, higher
education ,training, health projects ,cultural and social projects such as elderly services and needy
students in schools and universities) supporting the role of universities in the community development activities. While responding to the fourth industrial revolution necessary requirements
Particular emphasis should be directed to restructuring and reorganizing credit policies which have
been responsible with main contribution to the recent continued financial crisis including the last international economic and financial crisis of 2008.
4.3 Sustained Growth and Financing
One of the main cornerstones of effective socio-economic, political and cultural system including
the financial system is its commitment to achieve sustained human wellbeing, with environment basic
project 'component. . Environment pillar includes; poverty alleviation, social integration, Sustainable management of Natural resources, foods and water security, oand degradation and desertification. The
financial sector whether on national or regional basis is considered one of the main players for the
success of approaching sustained human development and wellbeing? Within the context of sustainable development, effective principles for the green economy already
existed, but they needed to be faithfully implemented in order to promote new jobs, markets and
technology, and to achieve sustainable development. The Deputy Secretary-General of UNCTAD, in
his closing remarks, stated that "The world may actually be in pre-crisis mode, as greater challenges could yet emerge in the form
of climate change and environmental crises. This would require countries to accelerate their transition
to a green economy. In that context, further research was needed on the issue of subsidies and incentives for industrial transformation, and on finding a commonly accepted price for carbon..
Proposals were made for a financial transaction tax to finance a climate-change adaptation fund and
for the use of public–private partnerships to leverage private-sector innovation and expertise with initial support from the State. Calls for a stronger State in developing countries was also made"9.
5. Managing the Fourth Industrial Revolution
5.1 The Fourth Industrial Revolution
The world intensive technological system are entering the new age by the fourth industrial revolution with its four main effects on business—on customer expectations, on product enhancement,
on collaborative innovation, and on organizational forms. The fourth Industrial revolution is building
on the third digital revolution which used electronic and information technology and has been emerging since the middle of the last century.
“It is characterized by a fusion of technologies that is blurring the lines between the physical,
digital, and biological spheres”.( Schwab,2016)
The fourth Industrial revolution represent as described by Klaus Schwab; “A technological revolution that will fundamentally alter the way we live, work, and relate to one another. In its scale,
scope, and complexity, the transformation will be unlike anything humankind has experienced before.
We do not yet know just how it will unfold, but one thing is clear: the response to it must be integrated and comprehensive, involving all stakeholders of the global polity, from the public and private sectors
to academia and civil society” (Ibid).
F. H. Beseiso
90
Serious plans based on rethinking the adopted conventional approach for providing products and
services should be approached by all parts of the financial sector institutions and regulators. “Overall, the inexorable shift from simple digitization (the Third Industrial Revolution) to
innovation based on combinations of technologies (the Fourth Industrial Revolution) is forcing
companies to reexamine the way they do business. The bottom line, however, is the same: business leaders and senior executives need to understand their changing environment, challenge the
assumptions of their operating teams, and relentlessly and continuously innovate.” (Ibid).
Economists such as Erik Brynjolfsson and Andrew McAfee while realizing various favorable expected impacts of the fourth industrial revolution on humans, however business community
including industrialists and governments, began to raise a key economic concerns about inequality
which represents the greatest societal concern as associated with the Fourth Industrial Revolution. This
might be resulting in unfavorable impacts on human beings. These impacts relates to inequality particularly as caused by the disruption of labor markets caused by automation substitutes for labor
across the entire economy(Ibid.).
The defined impacts of the third revolution led to income stagnation or decreasing for the majority of population in the developed high income countries. This impact resulted from the decreasing the
demand for less educated and lower skilled labor while increasing the demand for highly skilled
workers.
“This will give rise to a job market increasingly segregated into “low-skill/low-pay” and “high-skill/high-pay” segments, which in turn will lead to an increase in social tensions.” (Ibid.)
More worries has been expressed about the inexorable integration of technology in our lives on
human quintessential capacities as proved by the arising increasing relationship with smartphones as a case in point (Ibid.).
5.2 Banking Sector and Technology
Creating synergy between IT and operations to ensure sustainability will be a key driver in the
future success of the financial services sector and wellbeing.
The benefits of technology such as scale, speed and low error rate are also reflecting in the performance, productivity and profitability of banks, which have improved tremendously in the past
decade. These mentioned benefits of technology would be reflected positively on human wellbeing.
Regulatory initiatives and organizing measures from the Central Bank as illustrated in the Indian case have also played a large role in the banking sector as follows (Beseiso, 2012);
▪ To enable the finalization of a framework for the delivery of basic financial services using
mobile phones, the Cabinet Secretariat constituted an inter-ministerial group (IMG) in 2009. ▪ Banking Technology Excellence Awards were instituted in the year 2001 with a primary
objective of encouraging and recognizing the excellence in implementation of Technology for better
customer service, operational efficiency and expansion of banking services to the hitherto uncovered
sections of Society. ▪ Financial inclusion, in recent years, has emerged as a major policy initiative. The Reserve
Bank of India has significantly scaled up its efforts aimed at increasing the level of penetration of bank
financing in the economy ▪ The government has set up two funds — the Financial Inclusion Fund to meet the costs of
developmental and promotional interventions toward financial inclusion, and the Financial Inclusion
Technology Fund to meet the costs of technology adoption.
5.3 Shaping the Future
As above mentioned, financial sector and regulators should be equipped with the technological effective base, human capacity and various related requirements aiming at controlling all impacts of
the revolution which could remain under human controlled system.
A New Vision for the Financial Regulation System...
91
“Neither technology nor the disruption that comes with it is an exogenous force over which humans
have no control. All of us are responsible for guiding its evolution, in the decisions we make on a daily
basis as citizens, consumers, and investors. We should thus grasp the opportunity and power we have to shape the Fourth Industrial Revolution and direct it toward a future that reflects our common
objectives and values.” (Ibid.).
All preceding mentioned highlights on the possible impacts of the Fourth revolution motivate national and international collaboration and coordination between all financial institutions including
legislators and regulator in order to approach the blessings of the revolution related to their mission,
mainly with relation to the effective management of crisis and formulating defined plans, projects and policies to protect the financial sector from potentials of negative aspects of financial technologies, in
addition to illegal and corrupted practices within the international financial activities and markets
which was – for some views - a main contributing factor for the last international crisis. (Beseiso,
2010). Ultimately the ability for adaptation to the fourth industrial revolution developments andrelated
challenges will determine the survival of government and public authorities as well as the financial
system governing institutions.
6. The Role of Islamic Economics and Finance in Crisis Management
Islamic Economics has been developing and widely spreading from national and regional circles to
global perspective, registering sustained annual growth with about 15-20 percent in its assets. The
recent economic and financial crisis and their identified basis and reasons created the convincement of
many of the international financial system management leaders and experts about the feasible refuge to Islamic banking and finance which seems to be more qualified to prevent crisis than the traditional
banking and finance sector (Ibid.).
In light of lessons of frequent crisis which had their drastic impact on banks including Islamic Banks, central banks should be very careful within their strategic direction to run a system through
which early warning system with its required indicators should be built efficiently, approaching better
crisis and risks management (Ibid.).
The Islamic Economics school of thought and its practitioners in Banking and finance have witnessed a noticeable growing international inclusion, mainly in light of the most recent international
financial crisis of 2008 as proved, through many empirical studies, to be effective in preventing crisis
and to mitigating them when happening. Islamic Economics system based its objectives, conceptual principles and practical teachings on the
adoption of a multidisciplinary dynamic approach to human wellbeing and development. Muslim
scholars did not focus their attention primarily on economic variables. They considered overall human well-being to be the end product of interaction over a long period of time between a number of
economic, moral, social, political, demographic and historical factors in such a way that none of them
is able to make an optimum contribution without the support of the others.
Therefore the well-being of the people is not dependent just on economic variables, as conventional economics has emphasized until recently, but also on the closely interrelated role of moral,
psychological, social, economic, political, demographic and historical factors.
Justice occupied a pivotal place in this whole framework because of its crucial importance in the Islamic worldview There was an acute realization that justice is indispensable for development and
that, in the absence of justice, there will be decline and disintegration.
In light of the last international Financial Crisis and its lessons concerning Islamic banking. Dr. ZETI, Akhtar Aziz, Governor, Central Bank of Malaysia stated clearly that;
"The global crisis has in fact demonstrated the pivotal role of an efficient functioning financial
system towards achieving such a self-sustaining economic recovery. This has prompted an intensive
collaborative effort by the international community to undertake wide ranging and far reaching financial reforms. This commitment is for a solution that will evolve a financial system that will best
serve the real economy, a financial system that is sound and resilient and that is less vulnerable to
financial crisis". (Dr ZETI, Governor, Central Bank of Malaysia, 2010).
F. H. Beseiso
92
Islamic finance, as a rapidly growing form of financial intermediation, has demonstrated its
resilience during the global financial crisis and has every potential to advance the growth and development agenda.
The Islamic banking sector is reported by Ernst & Young to have grown at an annual rate of 16%
in the period 2008–2012, reaching assets of USD1.7 trillion by the year 2013. Estimates of the asset size and growth rate vary significantly (another report, for example, estimates banking assets to be
USD950 billion), but the consistent findings are that the sector is rapidly increasing in size, with assets
near or above USD1 trillion. The sustained growth of the sector throughout the financial crisis is seen as a sign of resilience and
of ongoing relevance to customers worldwide. Islamic banking remains the core of the Islamic
financial services industry. It is estimated that 73% of total Islamic finance assets worldwide are
banking assets. Nearly three-quarters of the industry’s assets, therefore, are in the banking sector (Ibid.).
On the international aspects and risk management Dr. Zeti illustrated the development of Islamic
Finance as becoming an important channel for fostering international financial linkages and in so doing is contributing to more balanced growth and development.
"The internationalization of Islamic finance has therefore not only allowed for further
diversification of risks, it has also contributed to more efficient allocation of funds across borders from
centers with surplus funds to regions with investment opportunities"(Ibid.). The importance of Islamic finance in strengthening financial linkages and rapid pouring into the
international financial markets is evident in particular with the emergence of sukuk (Islamic bonds)
instruments to prominence as an attractive new asset class for investors and a competitive form of financing for businesses.
"The global sukuk market currently stands with an average growth rate of about 40 percent annually.
Having now become the most vibrant segment in Islamic finance, the sukuk market has evolved into a truly international market, generating significant cross-border flows as funds are being raised from
beyond domestic financial markets"(Ibid.).
We should keep in our minds, while designing the new architecture and required infrastructure for
the new financial system mission, the vital role played by Islamic Banking nationally, regionally and internationally as well as the realized contributing role of Ethical considerations in the reallocation of
financial resources to more socially responsible areas and contributing to greater social well-
being.(Ibid.). The concluding Speech of Dr Zeti Akhtar Aziz, Governor, Central Bank of Malaysia, at the IDB
Group Luncheon at the IMF-World Bank Annual Meetings, in honor of the IDB Governors and other
dignitaries are here very relevant and expressive; "As we pursue with stronger vigor the agenda of balanced growth and development, we have the
potential to leverage on the increased role of Islamic finance in contributing to the global growth and
global financial stability agenda. In addition, it can also be leveraged upon to foster greater financial
flows across borders to contribute towards our agenda of enhancing a mutually reinforcing growth and the development agenda to achieve global aspiration of a self-sustaining, balanced and long lasting
economic progress and development"(Ibid.).
These conceptual conclusions which are based upon practical empirical researches and surveys, motivated our belief in new role and vision for instituting safe and sound financial system achieving
sustained stability and growth and avoiding crisis while minimizing the impact of crisis when
happening in case of adopting the human wellbeing required system.
7. Reforming the International Financial System
In light of our research work evaluating the role of the international financial system in light of lessons of the last crisis, illustrations are following on the main objectives and some important
required reform basics for the objected new global system;
(http://www.un.org/ga/president/63/letters/recommendationExperts200309.pdf).
A New Vision for the Financial Regulation System...
93
7.1 Objectives of International System Reform
The human suffering which resulted from the latest International Financial and Economic Crisis as reflected and continuing on all developing as well as developed countries necessitate reshaping the
whole world economic system to be instituted by different leadership new approach that is believing in
the main determinant role of Ethics in the new world order. Reform of the International system must have as its goal the better functioning of theworld
economic system for the global good. This entails simultaneously pursuinglong term objectives, such
as sustainable and equitable growth, the creation ofemployment in accordance with the “decent work” concept, the responsible use ofnatural resources, and reduction of greenhouse gas emissions, and more
immediate concerns, including addressing the challenges posed by the food and financial crises.
The unjust economic, financial and trade relations for the developing counties is another motivation
for the required global social solidarity if the world economic, monetary and financial system is rebuilt to immune from crisis, instability and periodic flows of capital and financial assistance and by then
world community wellbeing could be approached effectively.
Developed countries must make a renewed effort to meet the commitments made in the Millennium Declaration towards supporting the developing countries in the fields of economic, finance and trade
relations.
7.2 Required World Financial Stability
The Financial Stability Forum was created in the aftermath of the 1997-8 financial crisis in order to
promote international financial stability, improve the functioning of financial markets and reduce the tendency for financial shocks to propagate from country to country and to enhance the institutional
framework to support global financial stability.
It is now apparent that the reforms that it has proposed, although important, have not been sufficient to avoid major global financial instability. If it is to become the main instrument for the
formulation of reforms of the global financial system it must take into consideration the importance of
financial stability for the development of the real economy.
In addition it must increase the representation of developing countries to adequately reflect the views and conditions in these countries and be made accountable to a democratically representative
institution such as the Global Economic Coordination Council proposed above
)http://www.un.org/ga/president/63/letters/recommendationExperts200309.pdf).
7.3 Crisis and Confidence
The collapse in confidence in the financial system is widely recognized as central in the economic
crisis; restoration of confidence will be central in the recovery from all crisis impacts and put the
wheel on right track.
The author of this research commented on the received report published by the Independent
Evaluation Office (IEO) of IMF on “ Governance of the IMF: An Evaluation by toutching upon some required reforms as mentioned briefly in his following sent notes to IMF;
“I would like to value extensively establishing the IEO within IMF, I hope that the evaluation process
should consider all expressed views by thinkers,intellectuals and practitioners and analyses their views,I mean through external evaluation in addition to the self-evaluation. Also the views saying that
IMF is following and applying a very rigid structured consultancy proposals and advises, mainly with
relation to crisis and dept problems of the developing countries. Also I propose that IMF analyses the political input into its policies and positions.Finally it is very fruitful to train countries including
central banks to build their own self-evaluation offices”.(Beseiso commented on Thursday, October
17, 2013)
F. H. Beseiso
94
7.4 The Real Required Reform
A sense of global social solidarity within the needed reform for the international financial system is
the main determinant for presenting the defined structural deficits in the international economic,
financial and trade structure and organizations. "It is imperative that the regulatory reforms be real and substantive, and goes beyond the financial
sector to address underlying problems in corporate governance and competition policy, and in tax
structures, giving preferential treatment to capital gains, that may provide incentives for excessive leverage. While greater transparency is important, much more is needed than improving the clarity of
financial instruments". (Ibid)
References
Beseiso, F. (2008a), Conceptual Framework of Environmental Economics and Management, In Laboy,
E.N.,Schaffner,F.C.,Abdelhadi,A.&Goosen,M.F.A.(Eds),Environmental Management,Sustainable Development and Human Health, CRC Press, Taylor &Francis Group, London, England . New
York ,NY.
Beseiso,F.(2008b), Governance and Pragmatic Approach for Integrating Sustained Environment into
Human Development-Regional Case (UN-ESCWA)., In Laboy, E.N.,Schaffner, F.C., Abdelhadi,A.&Goosen,M.F.A.(Eds),Environmental Management, Sustainable Development and
Human Health,CRC Press, Taylor &Francis Group, London, England. New York, NY.
Beseiso.F.(2010a)Determinants of Economic, Financial and Banking Crisis-The Conceptual and Practical Basis for Managing Crisis. (Beirut: Arab Banks Union, 2010) In Arabic.
Beseiso,F.(2010b)The available Opportunities for Islamic Financial System as alternative for the
Current International System, a research paper presented to the InternationalConference on Recent International Economic and Financial Crisis from Islamic Perspective, Organized by the University
for International Islamic Sciences and International Institute for Islamic Thought ,Amman,1-
2/12/2010 .
Beseiso,F.(2012) Strategic Planning for Banking Technology -The Conceptual and Practical Basis, Presentation for the banking sector senior staff, Tehran Electronic Banking Event,Tehran, Iran, 18-
19November 2012.
Beseiso,F. (2013) (keynote Speaker),The Role of Central Banks in Shaping the Future of Global Islamic Banking,In the International Conference On Islamic Finance, Organized by Emerald
Publishers Group International and Abu Dhabi University Knowledge Group in Abu Dhabi on 14-
16 April 2013. Beseiso, F. (2014) (Editor) Volume on “The Developing Role of Islamic Banking and Finance: From
Local to Global Perspectives. Contemporary Studies in Economics and Financial Analysis –
Volume 95, Emerald Group Publishing Limited,U.K and U.S.A
Beseiso,F.(2016)Islamic Economics and Happiness Economics - a Case Study on the Role of Central Banks in Approaching Human Wellbeing, research paper , presented to the International Congress
on Political, Economic, and Social Studies (ICPESS-2016) held on 24-26 August, 2016 Istanbul –
Turkey, organized by Sakarya University and the Center for Political, Economic, and Social Research. His paper published in the International journal of Islamic Economics and Finance
Studies.Vol.2, No.3 (Nov. 2016) http://ijisef.org/index.php/IJISEF.
Beseiso, F. (2019) Economics of Happiness within the global Challenge - Special focus on the role of
Islamic Economics. Finalized Manuscript of Book to be published with International Publisher in 2019.
Bruno, S. Frey (Professor of Economics at the University of Zurich,
VisitingProfessor at the SwissFederal Institute of Technology, and Research Director of CREMA) (Center for Research in Economics, Management, and the Arts). He is co-editor of Economics and
Psychology: A Promising New Cross-Disciplinary Field (MIT Press, 2007).
Carney,M.(2018) (Governor of the Bank of England), New Economy, New Finance, New Bank Speech given by The Mansion House 21 June 2018.
A New Vision for the Financial Regulation System...
95
https://www.bankofengland.co.uk/-/media/boe/files/speech/2018/new-economy-new-finance-new-
bank-speech-by-mark-
carney.pdf?la=en&hash=F362C661810257FE779E3D5BCA17144EC65E8C63 Chamlou, N. (2013), The economics of happiness and anger in North Africa,
World Institute for Development Economics Research wider.unu.edu,WIDER Working Paper
2014/060. [email protected] http://www.academia.edu/1334559/Concept_of_happiness_in_the Islamic perspective
http://www.bis.org/review/r050225f.pdf
CHAPRA, M.U. (1995), Islam and the Economic Challenge, the Islamic Foundation and the International Institute of Islamic Thought 1416 – 1995, Islamic Economics Series - 17
http://ierc.sbu.ac.ir/File/Article/Islam%20and%20the%20Economic%20Challenge_93524.pdf
Hunnj,F.(2005)Encyclopedia of the social market, economic policy, from A to Z, Rolf Hussey,
Herman Schneider, Klaus Vigelt (Publishers), and the second edition was translated into Arabic in 2005 d. Yasser Sarah. Commissioned by the Konrad Adenauer Foundation.
Organization of Islamic Cooperation-OIC (2007), ISLAMIC FINANCIAL SERVICES INDUSTR
DEVELOPMENT, TEN-YEAR FRAMEWORK AND STRATEGIES, (Saudi Arabia, 2007). Schwab, K. (2016) (Founder and Executive Chairman, World Economic Forum),Fourth Industrial
Revolution. https://www.weforum.org/agenda/2016/01/the-fourth-industrial-revolution-what-it-
means-and-how-to-respond/ Unctad (2011),Making trade and finance work for people and the planet. Trade and Development
Board, Fifty-eighth session Geneva, 12–23 September 2011, Item 18 of the provisional agenda
Other business Prepared by the UNCTAD secretariat in cooperation with non-governmental
organizations participating in the Public Symposium. Speech of H.E. Dr ZETI,Akhtar Aziz, (Governor, Central Bank of Malaysia),Islamic Finance:
An Agenda for Balanced Growth and Development,Speech at the IDB Group Luncheon at the
IMF-World Bank Annual Meetings, in honor of the IDB Governors and other dignitaries. Washington, 10 October 2010.
http://www.isdb.org/irj/portal/anonymous?NavigationTarget=navurl://a60b98a8e4f1ebf3dc9fd8650
aa4617f
Notes
1Our research is heavily drawn upon the following published and pending publication books Beseiso, F. (2010)Determinants of Economic, Financial and Banking Crisis-The Conceptual and
Practical Basis for Managing Crisis. (Beirut: Arab Banks Union, 2010) In Arabic .
Fouad Beseiso, Economics of Happiness within the global Challenge - Special focus on the role of Islamic Economics. Finalized Manuscript Book to be published with International Publisher in 2019. 2I attended a Conference On” Recent International Economic and Financial Crisis from Islamic
Perspective”and presented a research paper on “The available Opportunities for Islamic Financial
System as alternative for the Current International System",Organized by the University for International Islamic Sciences and International Institute for Islamic Thought ,Amman,1-2/12/2010 . 3 I attended with a research paper on Islamic Economics and Happiness Economics - a Case Study on
the Role of Central Banks in Approaching Human Wellbeing, presented to the International Congress on Political, Economic, and Social Studies (ICPESS-2016) held on 24-26 August, 2016 Istanbul –
Turkey, organized by Sakarya University and the Center for Political, Economic, and Social Research.
His paper published in the International journal of Islamic Economics and Finance Studies.Vol.2, No.3 (Nov. 2016) http://ijisef.org/index.php/IJISEF . 4This conclusion has been documented in our mentioned research on Happiness Economics within
global challenges. Book project for publication internationally. 5 Objective wellbeing indicators capturing varied dimensions of economic, social, and environmental well-being of the targeted communities. Focusing on subjective indicators of quality of life involve
other indicators such as community residents’ satisfaction with life overall, satisfaction with various
life domains (e.g., life domains related to social, leisure, work, community, family, spiritual, financial,
F. H. Beseiso
96
etc.), as well as satisfaction with varied community services (government, nonprofit, and business services serving the targeted communities) and political system structure and practices. 6ASADZAM, A. N. In his research "Towards A New Paradigm for Economics" of the International
Institute of Islamic Economics, International Islamic University Islamabad, Pakistan 7Beseiso,F.(2016),Islamic Economics and Happiness Economics - a Case Study on the Role of Central Banks in Approaching Human Wellbeing", research paper presented to the International Congress on
Political, Economic, and Social Studies (ICPESS-2016) held in Istanbul on held on 24-26 August,
2016 .Istanbul – Turkey, organized by Sakarya University and the Center for Political, Economic, and Social Research. This paper published in the International journal of Islamic Economics and Finance
Studies.Vol.2, No.3 (Nov. 2016) http://ijisef.org/index.php/IJISEF. 8Baker, AbdelHaleem (2014)
https://www.facebook.com/search/str/%25d9%2585%25d9%2582%25d8%25a7%25d8%25b5%25d8%25af%2b%25d8%25a7%25d9%2584%25d8%
Shariaah Makased is mainly five, many Islamic thinkers including Dr. Abdel Haleem Baker added the
sixth makased which is freedom.· 999 Unctad (2011) Making trade and finance work for people and the planet. Trade and Development
Board, Fifty-eighth session Geneva, 12–23 September 2011, Item 18 of the provisional agenda Other
business Prepared by the UNCTAD secretariat in cooperation with non-governmental organizations
participating in the Public Symposium.
3rdInternational Conference on Economic Research
24-25th October 2019, Alanya, Turkey
97
INVESTIGATING THE LEVEL OF GLOBALIZATION OF
TURKISH MANUFACTURING FIRMS
Aslıhan Atabek Demirhan
CBRT Structural Economic Research Department, Turkey, Email: [email protected]
Abstract
Globalization is an ongoing process by which regional economies, societies and cultures have
become integrated through a network of communication and trade. It has been continuing its
popularity since 1990s. There are several sources of the globalization. Among them technological
advances, trade liberalization and changes in industrial structure can be classified as the principal
sources. Different sources of globalization lead to large heterogeneity in the degree of globalization
over time, across countries, industries and as well as within firms. The aim of this study is to
investigate the level of globalization for the Turkish manufacturing sector using firm-level data. Using
comprehensive and detailed firm-level data set covering 2006-2017 period and following the Makhija,
Kim and Williamson (1997) approach, globalization levels of the firms are calculated. Using those
measuresfirms are classified in four different groups according to their globalization levels as multi
domestic, multi domestic transitional, simple global and global integrated. Differences in firm
performance, such as size, profitability and labor productivity,according to the globalization levels are
investigated through descriptive analysis. Besides using panel data models, globalization premia are
estimated with panel estimation models. The most internationally integrated sectors are found to be:
Motor vehicles, other transportation, electrical equipment, machinery, plastics and tobacco sectors. On
the other hand, printing, other non-metallic minerals, leather, food and fabricated metal products
sectors are found to be the less internationally integrated sectors. To our knowledge, this is the first
and unique work which studies globalization of the Turkish manufacturing sector with firm-level data.
Keywords: Globalization Indicators, Firm-Level Analysis, Turkish Manufacturing Sector.
3rd International Conference on Economic Research
24-25th October 2019, Alanya, Turkey
98
MODEL OF GARBOLOGY MARKETING CONCEPT ON THE EXAMPLE OF
TRADE SECTOR
Izabela Sztangret
University of Economics in Katowice, Department of Entrepreneurship, Poland
Email: [email protected]
Beata Reformat
University of Economics in Katowice, Department of Marketing, Poland
Abstract
Commercial use of information, automatically registered by the readers of separators of individual municipal waste fractions by waste operators, has been the least appreciated operational sub-area of
the surveyed companies so far.The information contained in- or on the waste constituting the stream
obtained by the enterprise of the studied sectors: trade sector and waste management sector, used in an efficient way, can improve the selection process, on the level of extracting the material for processing
or sale. Furthermore it can also provide knowledge about purchasing and consumption behaviours of
waste stream producers / suppliers. Therefore, waste has a marketing value that is also useful in
market research, which is another interesting management sub-area in the company, in functional terms (Sztangret, 2016, pp. 29-44). This area seems to be especially interesting from the perspective of
cooperation with trade entities for whom information obtained from waste constitutes the basis of the
supply decision system, and on the other hand it can represent a value for suppliers, while optimizing streams of delivered goods.
Furthermore, the diffusion of information and knowledge that accompanies the flow of waste
stream promotes building and maintenance of integral relations. Municipal waste supplier becomes a prosumer and co-creator in the process of eco-value creationand an offer for the secondary market by
the enterprise in the waste management sector (Sztangret, 2016). This happens on the one hand
through conscious selection, and on the other through producing a waste stream that brings knowledge
about it. This constitutes anotherimplemented operational sub-area in subjective approach, with the features of an innovative marketing concept, that combines eco-knowledge management and its
commercial use. Garbology is therefore the main research concept of this study, and its specification
will concern its usefulness in the relation between the municipal waste sector and the trade sector. All the above-mentioned activities are implemented in the discussed sectors more or less
consciously to achieve the effect of a closed-circuit economy.
In connection with the above, the purpose of the articleis to demonstrate the value of municipal waste, as a carrier of knowledge and information about buying and consumption behaviours, and its
usefulness for decisions made by stream creators, including purchasing.Individual parts of the study
concern the definition of the category of garbology, the subject of garbology research, the usefulness
of such research for corporations and the improvement of research through cooperation. Keywords: Garbology, Waste Management, Marketing Cocncept.
1. Introduction
Commercial use of information, automatically registered by the readers of separators of individual
municipal waste fractions by waste operators, has been the least appreciated operational sub-area of
the surveyed companies so far. The information contained in- or on the waste constituting the stream obtained by the enterprise of the studied sectors: trade sector and waste management sector, used in an
efficient way, can improve the selection process, on the level of extracting the material for processing
or sale. Furthermore it can also provide knowledge about purchasing and consumption behaviours of waste stream producers / suppliers. Therefore, waste has a marketing value that is also useful in
market research, which is another interesting management sub-area in the company, in functional
terms (Sztangret, 2016, pp. 29-44). This area seems to be especially interesting from the perspective of
Model of Garbology Marketing Concept...
99
cooperation with trade entities for whom information obtained from waste constitutes the basis of the
supply decision system, and on the other hand it can represent a value for suppliers, while optimizing
streams of delivered goods. Furthermore, the diffusion of information and knowledge that accompanies the flow of waste
stream promotes building and maintenance of integral relations. Municipal waste supplier becomes a
prosumer and co-creator in the process of eco-value creation and an offer for the secondary market by the enterprise in the waste management sector (Sztangret, 2016). This happens on the one hand
through conscious selection, and on the other through producing a waste stream that brings knowledge
about it. This constitutes another implemented operational sub-area in subjective approach, with the features of an innovative marketing concept, that combines eco-knowledge management and its
commercial use. Garbology is therefore the main research concept of this study, and its specification
will concern its usefulness in the relation between the municipal waste sector and the trade sector.
All the above-mentioned activities are implemented in the discussed sectors more or less consciously to achieve the effect of a closed-circuit economy.
In connection with the above, the purpose of the articleis to demonstrate the value of municipal
waste, as a carrier of knowledge and information about buying and consumption behaviours, and its usefulness for decisions made by stream creators, including purchasing. Individual parts of the study
concern the definition of the category of garbology, the subject of garbology research, the usefulness
of such research for corporations and the improvement of research through cooperation.
2. Garbology Research - Identification of the Research Category
In recent years, an increase in the importance of socially responsible activities, combining a business approach with pro-environmental aspect that affects the company's environmental impact, i.e.
emissions, pollution, impact on biodiversity, as well as preventive actions (e.g. recycling) and repair
has been observed (Bek-Gail, Rymkiewicz, 2015). These activities contribute to building a society that is conscious and responsible for consumption (Seretny, 2016). Hence, from the point of view of the
needs of contemporary companies, garbology research is an extremely useful and thus a helpful source
of information on consumption and purchasing habits (both actual and potential) of each company's
clients. Professor William Rathje, a researcher from the University of Arizona is recognized as the world
precursor of garbology studies (Reno, 2014). He was the first to focus his attention on landfills in 1987
to find out what they contain and how materials behave in them ( Schiffer, Riecker, 2015). This project significantly contributed to the development of garbology research in the context of new needs
emerging in the environment of many companies (economic, social, marketing, logistics, etc.).
Research conducted by W. Rathje provided important knowledge about collected garbage (waste) and its value as well as possibilities in the sphere of creation of market demand1 (Rathje, et. al, 1992,
Rathje, 2011). Their results contribute to the development of a sustainable and responsible market
economy, from which extremely current postulates related to the need of processing, recovering and
disposing consumer and production waste emerge (Reno, 2014; Schiffer, 2015). As a consequence of the observations and results of long-term research W. Rathje draws attention to the urgent need to care
for the nature and the environment, in order to leave clean earth, water and air for future generations.
This is closely related to rational management of waste, which is generated by consumers on the one hand and on the other hand by big corporations.
W. Pessel, a young researcher from the University of Warsaw is the precursor of garbology
research in Poland. Similarly, to W. Rathje, he made a daring attempt to study garbage dumps (local landfills) to explore everyday life of Warsaw residents and occurring social changes [Pessel, 2008;
Pessel 2010]. Information collected in this way expanded the current knowledge about economy,
market preferences of the society and culture. The increase in the promotion of the idea of corporate
social responsibility in Poland, which is associated with respects for the natural environment and
1 In 1990, W. Rathje received the award for public recognition of science and technology granted by
the American Association for Scientific Progress, which cited "his innovative contribution to public
understanding of science and its social influence by demonstrating with his creative project"Garbage
Project" that scientific method can document problems and identify solutions.
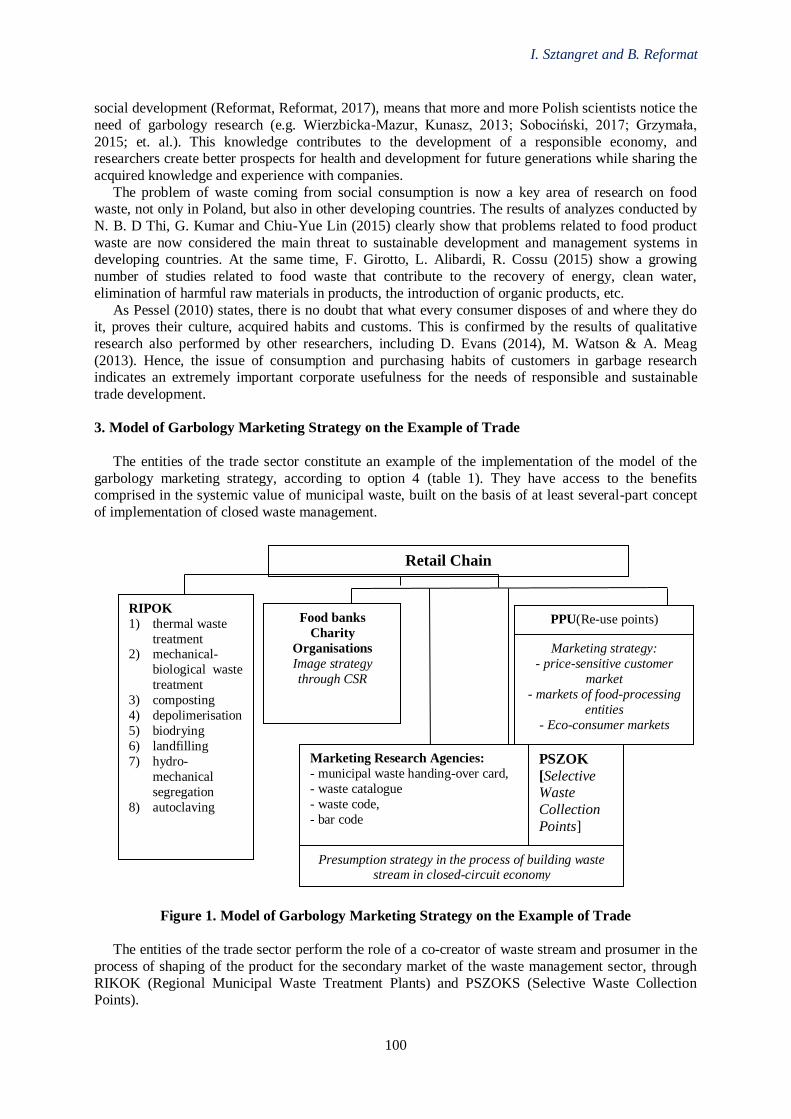
I. Sztangret and B. Reformat
100
social development (Reformat, Reformat, 2017), means that more and more Polish scientists notice the
need of garbology research (e.g. Wierzbicka-Mazur, Kunasz, 2013; Sobociński, 2017; Grzymała,
2015; et. al.). This knowledge contributes to the development of a responsible economy, and researchers create better prospects for health and development for future generations while sharing the
acquired knowledge and experience with companies.
The problem of waste coming from social consumption is now a key area of research on food waste, not only in Poland, but also in other developing countries. The results of analyzes conducted by
N. B. D Thi, G. Kumar and Chiu-Yue Lin (2015) clearly show that problems related to food product
waste are now considered the main threat to sustainable development and management systems in developing countries. At the same time, F. Girotto, L. Alibardi, R. Cossu (2015) show a growing
number of studies related to food waste that contribute to the recovery of energy, clean water,
elimination of harmful raw materials in products, the introduction of organic products, etc.
As Pessel (2010) states, there is no doubt that what every consumer disposes of and where they do it, proves their culture, acquired habits and customs. This is confirmed by the results of qualitative
research also performed by other researchers, including D. Evans (2014), M. Watson & A. Meag
(2013). Hence, the issue of consumption and purchasing habits of customers in garbage research indicates an extremely important corporate usefulness for the needs of responsible and sustainable
trade development.
3. Model of Garbology Marketing Strategy on the Example of Trade
The entities of the trade sector constitute an example of the implementation of the model of the
garbology marketing strategy, according to option 4 (table 1). They have access to the benefits comprised in the systemic value of municipal waste, built on the basis of at least several-part concept
of implementation of closed waste management.
Figure 1. Model of Garbology Marketing Strategy on the Example of Trade
The entities of the trade sector perform the role of a co-creator of waste stream and prosumer in the
process of shaping of the product for the secondary market of the waste management sector, through
RIKOK (Regional Municipal Waste Treatment Plants) and PSZOKS (Selective Waste Collection Points).
Retail Chain
RIPOK
1) thermal waste
treatment 2) mechanical-
biological waste
treatment
3) composting
4) depolimerisation
5) biodrying
6) landfilling
7) hydro-
mechanical
segregation
8) autoclaving
PPU(Re-use points)
Food banks
Charity
Organisations
Image strategy
through CSR
Marketing strategy:
- price-sensitive customer
market
- markets of food-processing
entities
- Eco-consumer markets
PSZOK
[Selective Waste
Collection
Points]
Marketing Research Agencies:
- municipal waste handing-over card,
- waste catalogue
- waste code,
- bar code
Presumption strategy in the process of building waste stream in closed-circuit economy
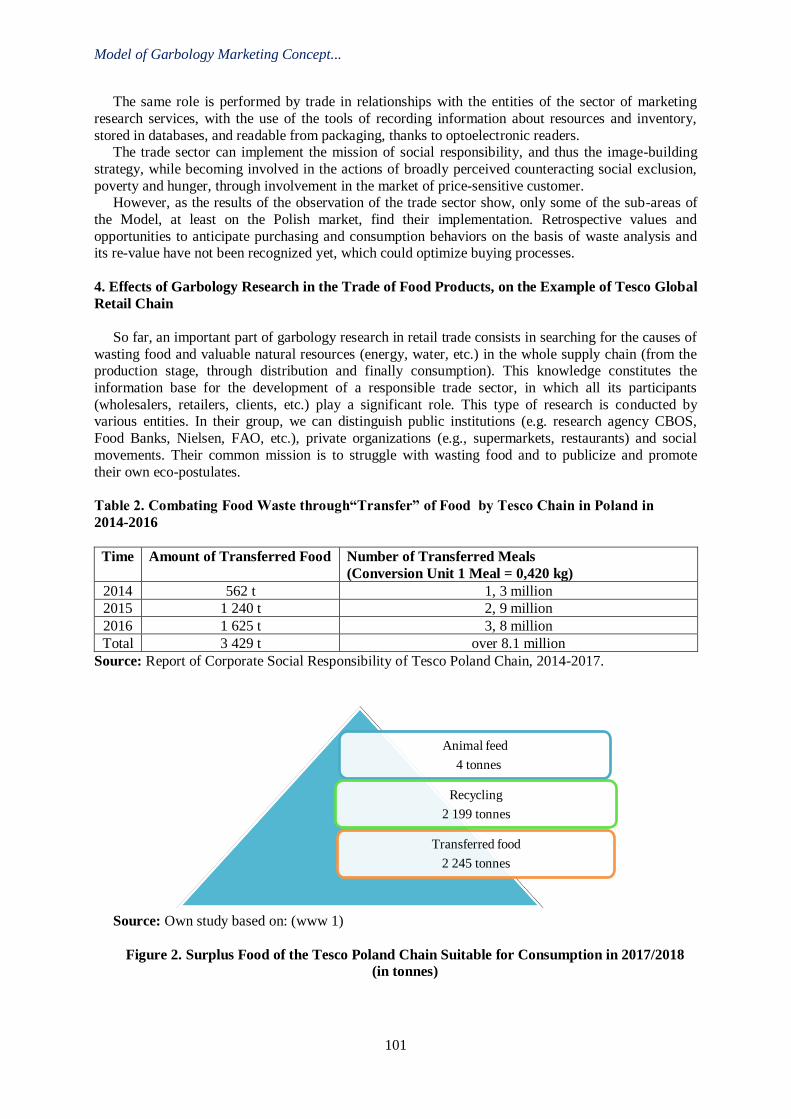
Model of Garbology Marketing Concept...
101
The same role is performed by trade in relationships with the entities of the sector of marketing
research services, with the use of the tools of recording information about resources and inventory,
stored in databases, and readable from packaging, thanks to optoelectronic readers. The trade sector can implement the mission of social responsibility, and thus the image-building
strategy, while becoming involved in the actions of broadly perceived counteracting social exclusion,
poverty and hunger, through involvement in the market of price-sensitive customer. However, as the results of the observation of the trade sector show, only some of the sub-areas of
the Model, at least on the Polish market, find their implementation. Retrospective values and
opportunities to anticipate purchasing and consumption behaviors on the basis of waste analysis and its re-value have not been recognized yet, which could optimize buying processes.
4. Effects of Garbology Research in the Trade of Food Products, on the Example of Tesco Global
Retail Chain
So far, an important part of garbology research in retail trade consists in searching for the causes of
wasting food and valuable natural resources (energy, water, etc.) in the whole supply chain (from the production stage, through distribution and finally consumption). This knowledge constitutes the
information base for the development of a responsible trade sector, in which all its participants
(wholesalers, retailers, clients, etc.) play a significant role. This type of research is conducted by various entities. In their group, we can distinguish public institutions (e.g. research agency CBOS,
Food Banks, Nielsen, FAO, etc.), private organizations (e.g., supermarkets, restaurants) and social
movements. Their common mission is to struggle with wasting food and to publicize and promote
their own eco-postulates.
Table 2. Combating Food Waste through“Transfer” of Food by Tesco Chain in Poland in
2014-2016
Time Amount of Transferred Food Number of Transferred Meals
(Conversion Unit 1 Meal = 0,420 kg)
2014 562 t 1, 3 million
2015 1 240 t 2, 9 million
2016 1 625 t 3, 8 million
Total 3 429 t over 8.1 million
Source: Report of Corporate Social Responsibility of Tesco Poland Chain, 2014-2017.
Source: Own study based on: (www 1)
Figure 2. Surplus Food of the Tesco Poland Chain Suitable for Consumption in 2017/2018
(in tonnes)
Animal feed
4 tonnes
Recycling
2 199 tonnes
Transferred food
2 245 tonnes
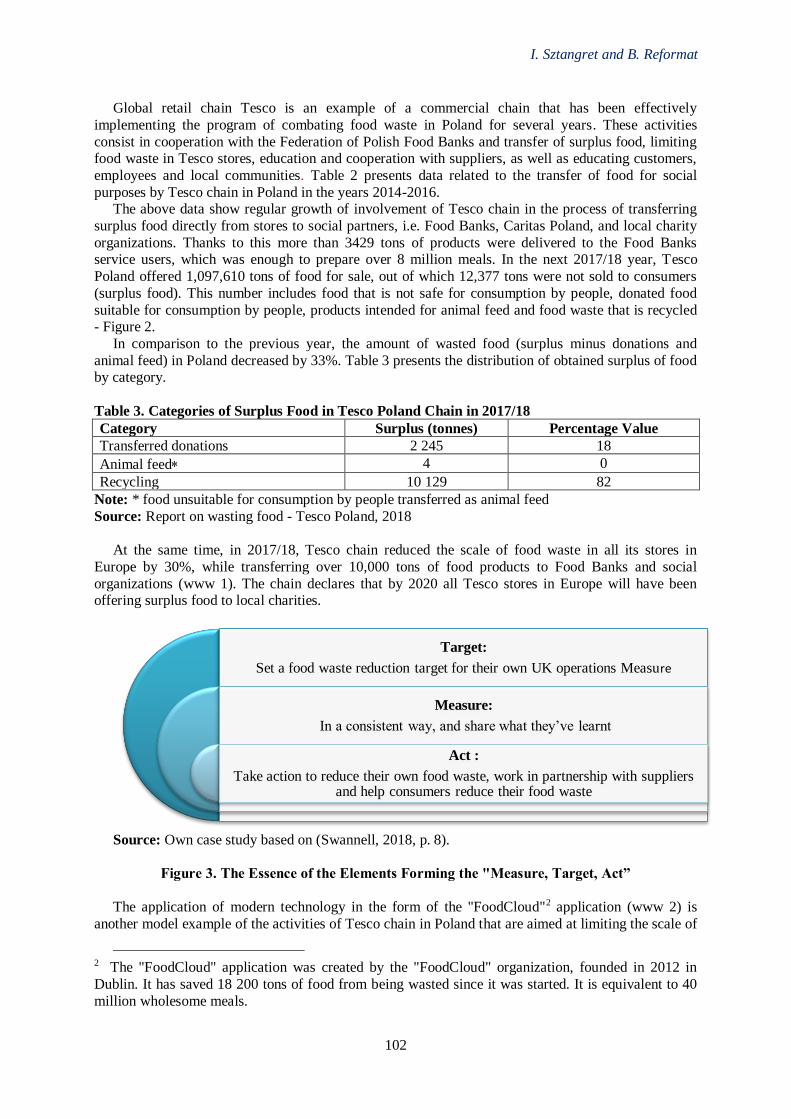
I. Sztangret and B. Reformat
102
Global retail chain Tesco is an example of a commercial chain that has been effectively
implementing the program of combating food waste in Poland for several years. These activities
consist in cooperation with the Federation of Polish Food Banks and transfer of surplus food, limiting food waste in Tesco stores, education and cooperation with suppliers, as well as educating customers,
employees and local communities. Table 2 presents data related to the transfer of food for social
purposes by Tesco chain in Poland in the years 2014-2016. The above data show regular growth of involvement of Tesco chain in the process of transferring
surplus food directly from stores to social partners, i.e. Food Banks, Caritas Poland, and local charity
organizations. Thanks to this more than 3429 tons of products were delivered to the Food Banks service users, which was enough to prepare over 8 million meals. In the next 2017/18 year, Tesco
Poland offered 1,097,610 tons of food for sale, out of which 12,377 tons were not sold to consumers
(surplus food). This number includes food that is not safe for consumption by people, donated food
suitable for consumption by people, products intended for animal feed and food waste that is recycled - Figure 2.
In comparison to the previous year, the amount of wasted food (surplus minus donations and
animal feed) in Poland decreased by 33%. Table 3 presents the distribution of obtained surplus of food by category.
Table 3. Categories of Surplus Food in Tesco Poland Chain in 2017/18
Category Surplus (tonnes) Percentage Value
Transferred donations 2 245 18
Animal feed 4 0
Recycling 10 129 82
Note: * food unsuitable for consumption by people transferred as animal feed
Source: Report on wasting food - Tesco Poland, 2018
At the same time, in 2017/18, Tesco chain reduced the scale of food waste in all its stores in
Europe by 30%, while transferring over 10,000 tons of food products to Food Banks and social
organizations (www 1). The chain declares that by 2020 all Tesco stores in Europe will have been offering surplus food to local charities.
Source: Own case study based on (Swannell, 2018, p. 8).
Figure 3. The Essence of the Elements Forming the "Measure, Target, Act”
The application of modern technology in the form of the "FoodCloud"2 application (www 2) is
another model example of the activities of Tesco chain in Poland that are aimed at limiting the scale of
2 The "FoodCloud" application was created by the "FoodCloud" organization, founded in 2012 in
Dublin. It has saved 18 200 tons of food from being wasted since it was started. It is equivalent to 40
million wholesome meals.
Target:
Set a food waste reduction target for their own UK operations Measure
Measure:
In a consistent way, and share what they’ve learnt
Act :
Take action to reduce their own food waste, work in partnership with suppliers and help consumers reduce their food waste
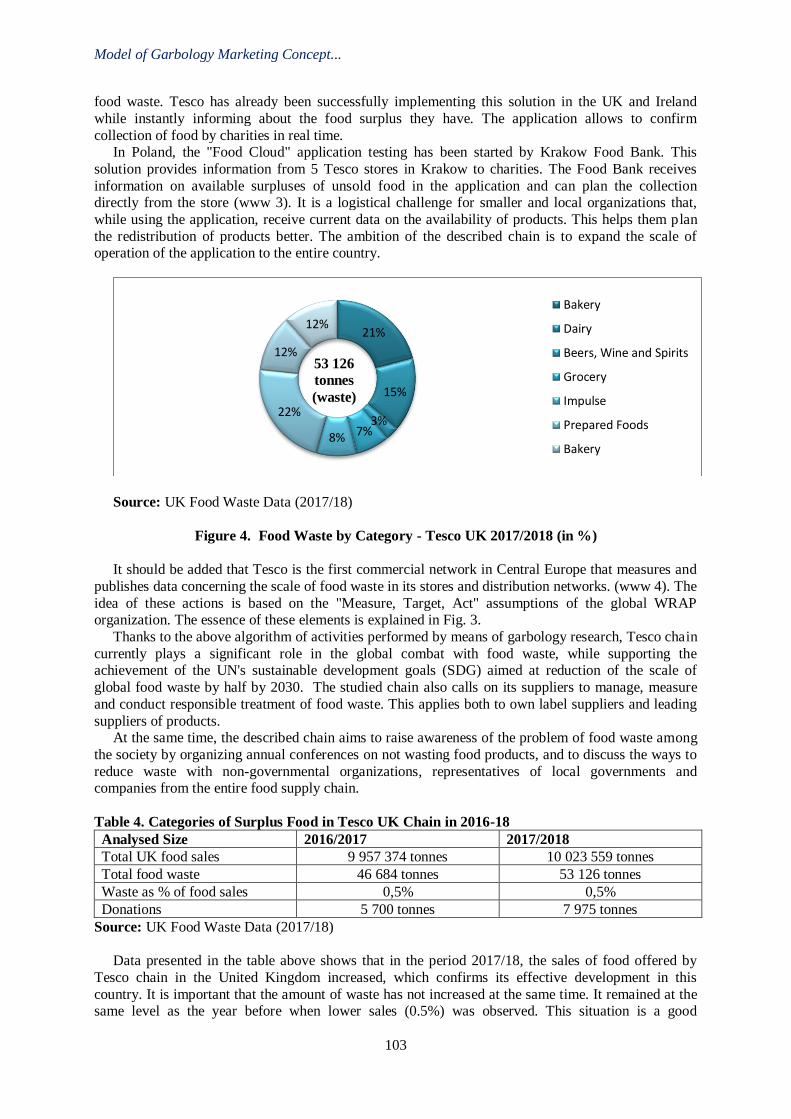
Model of Garbology Marketing Concept...
103
food waste. Tesco has already been successfully implementing this solution in the UK and Ireland
while instantly informing about the food surplus they have. The application allows to confirm
collection of food by charities in real time. In Poland, the "Food Cloud" application testing has been started by Krakow Food Bank. This
solution provides information from 5 Tesco stores in Krakow to charities. The Food Bank receives
information on available surpluses of unsold food in the application and can plan the collection directly from the store (www 3). It is a logistical challenge for smaller and local organizations that,
while using the application, receive current data on the availability of products. This helps them plan
the redistribution of products better. The ambition of the described chain is to expand the scale of operation of the application to the entire country.
Source: UK Food Waste Data (2017/18)
Figure 4. Food Waste by Category - Tesco UK 2017/2018 (in %)
It should be added that Tesco is the first commercial network in Central Europe that measures and
publishes data concerning the scale of food waste in its stores and distribution networks. (www 4). The
idea of these actions is based on the "Measure, Target, Act" assumptions of the global WRAP organization. The essence of these elements is explained in Fig. 3.
Thanks to the above algorithm of activities performed by means of garbology research, Tesco chain
currently plays a significant role in the global combat with food waste, while supporting the achievement of the UN's sustainable development goals (SDG) aimed at reduction of the scale of
global food waste by half by 2030. The studied chain also calls on its suppliers to manage, measure
and conduct responsible treatment of food waste. This applies both to own label suppliers and leading
suppliers of products. At the same time, the described chain aims to raise awareness of the problem of food waste among
the society by organizing annual conferences on not wasting food products, and to discuss the ways to
reduce waste with non-governmental organizations, representatives of local governments and companies from the entire food supply chain.
Table 4. Categories of Surplus Food in Tesco UK Chain in 2016-18
Analysed Size 2016/2017 2017/2018
Total UK food sales 9 957 374 tonnes 10 023 559 tonnes
Total food waste 46 684 tonnes 53 126 tonnes
Waste as % of food sales 0,5% 0,5%
Donations 5 700 tonnes 7 975 tonnes
Source: UK Food Waste Data (2017/18)
Data presented in the table above shows that in the period 2017/18, the sales of food offered by
Tesco chain in the United Kingdom increased, which confirms its effective development in this
country. It is important that the amount of waste has not increased at the same time. It remained at the same level as the year before when lower sales (0.5%) was observed. This situation is a good
21%
15%
3%7%8%
22%
12%
12%
Bakery
Dairy
Beers, Wine and Spirits
Grocery
Impulse
Prepared Foods
Bakery
53 126
tonnes
(waste)
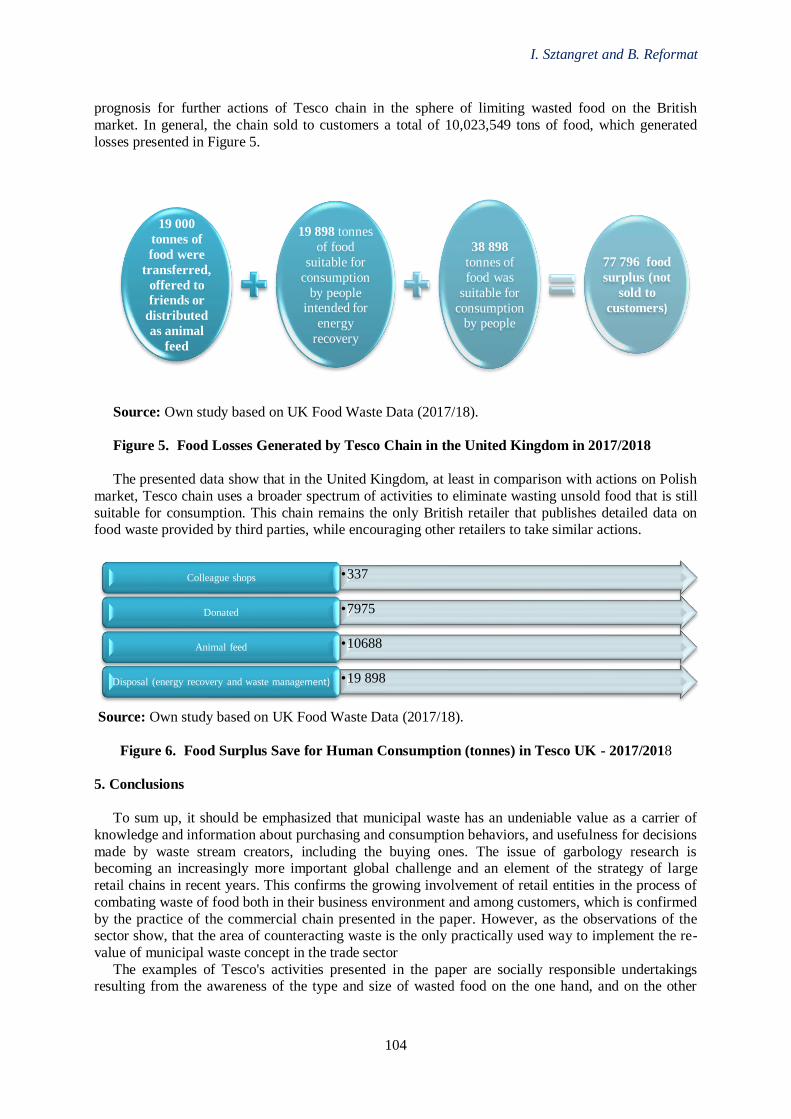
I. Sztangret and B. Reformat
104
prognosis for further actions of Tesco chain in the sphere of limiting wasted food on the British
market. In general, the chain sold to customers a total of 10,023,549 tons of food, which generated
losses presented in Figure 5.
Source: Own study based on UK Food Waste Data (2017/18).
Figure 5. Food Losses Generated by Tesco Chain in the United Kingdom in 2017/2018
The presented data show that in the United Kingdom, at least in comparison with actions on Polish
market, Tesco chain uses a broader spectrum of activities to eliminate wasting unsold food that is still
suitable for consumption. This chain remains the only British retailer that publishes detailed data on food waste provided by third parties, while encouraging other retailers to take similar actions.
Source: Own study based on UK Food Waste Data (2017/18).
Figure 6. Food Surplus Save for Human Consumption (tonnes) in Tesco UK - 2017/2018
5. Conclusions
To sum up, it should be emphasized that municipal waste has an undeniable value as a carrier of
knowledge and information about purchasing and consumption behaviors, and usefulness for decisions
made by waste stream creators, including the buying ones. The issue of garbology research is becoming an increasingly more important global challenge and an element of the strategy of large
retail chains in recent years. This confirms the growing involvement of retail entities in the process of
combating waste of food both in their business environment and among customers, which is confirmed
by the practice of the commercial chain presented in the paper. However, as the observations of the sector show, that the area of counteracting waste is the only practically used way to implement the re-
value of municipal waste concept in the trade sector
The examples of Tesco's activities presented in the paper are socially responsible undertakings resulting from the awareness of the type and size of wasted food on the one hand, and on the other
19 000
tonnes of
food were
transferred,
offered to
friends or
distributed
as animal
feed
19 898 tonnes
of food
suitable for
consumption
by people intended for
energy
recovery
38 898
tonnes of
food was
suitable for
consumption by people
77 796 food
surplus (not
sold to
customers)
•337Colleague shops
•7975Donated
•10688Animal feed
•19 898Disposal (energy recovery and waste management)
Model of Garbology Marketing Concept...
105
hand they are part of the "re-use" sub-concept. In this case it represents "effective use", which is a
method of implementation of the closed-circuit economy concept.
References
Bek-Gaik B., Rymkiewicz B. (2015), Społeczna odpowiedzialność biznesu w teorii i praktyce -wybrane problem [Corporate social responsibility in theory and practice – selected issues] [in:]
Społecznie odpowiedzialne zarządzanie w teorii i praktyce [Socially responsible management in
theory and practice], (red.) J. Kulczycka, publisher: Wydawnictwo Akademii Górniczo-Hutniczej w Krakowie, Kraków, pp. 9-22.
Evans D. (2014), Food Waste. Home Consumption, Material Culture and Everyday Life, Bloomsbury,
London, New York.
Filary marketingowej wartości odpadów komunalnych – ujęcie systemowe [Pillars of municipal waste marketing value – systemic approach]. [in:] Gospodarka zrównoważona w działaniach
przedsiębiorstw sektora usług komunalnych. Konkurencja - kooperacja – przyszłość [Sustainable
economy in operations of an enterprise in the sector of municipal services. Competition – cooperation - future], ed. I. Sztangret, K. Setlak, publisher: Infomax, Katowice 2018, pp. 29-44
Girotto F., Alibardi L., Cossu R. (2015), Food waste generation and industrial uses, “Waste
Management”, No 45, pp. 32-41. Grzymała Z. (2015), Przemiany w zarządzaniu gospodarką odpadami w Polsce w świetle zmian
ustawy o utrzymaniu czystości i porządku w gminach [Changes in waste management in Poland in
the light of the Act on Maintaining Cleanliness and Order in Communes], Prace Komisji Geografii
Przemysłu Polskiego Towarzystwa Geograficznego [Works of the Commission of Geography of Industry of Polish Geographical Society] nr 29 (3), pp. 136-146.
Humes E. (2012), Garbology: Our dirty love affair with trash. Penguin Group, USA-California
Pessel W. (2008), “Śmieciarze. Antyrecyklingowe studium z antropologii codzienności” [“Garbage collectors. Anti-recycling study of everyday anthropology”], publisher: Oficyna Wydawnicza
STOPKA, Łomża.
Pessel W. (2010), Antropologia nieczystości. Studia z kultury sanitarnej Warszawy [Anthropology of
waste. Studies in the sanitary culture of Warsaw], publisher: Wydawnictwo Trio i Collegium Civitas, Warszawa.
Report on wasting food products – Tesco Poland 2018, p.5
Rathje W. (2011), Archaeological Intervention in the Past, Present and Future Tense, “Archaeological Dialogues”, No 18 (2), pp. 176-180.
Rathje, W., Hughes W.W., Wilson D.C., Tani M. K, Archer G. H., Hunt R. G. & Jones T. W. (1992),
The Archaeology of Contemporary Landfills, “American Antiquity”, No 57, pp. 437-447. Reformat B., Reformat P. (2017), Implementacja koncepcji społecznej odpowiedzialności biznesu w
sieciach handlu detalicznego w Polsce - wybrane praktyki działań [Implementation of the concept
of corporate social responsibility in retail chains in Poland – selected practices of actions],
„Marketing i Rynek” nr 12, pp. 128--136. Reno J. (2014), Waste, In: The Oxford Handbook of the Archaeology of the Contemporary World, Ed.
Graves-Brown P., Harrison R., Paccini A, Oxford University Press, Oxford, pp. 261-271.
Schiffer M. B. (2015), William Laurens Rathje: The Garbage Project and Beyond, „Journal of Archaeological, Ethnographic and Experimental Studies “, Vol. 7, Issue 2, pp. 179-184.
Schiffer M. B., Riecker F. A. (2015), William L. Rathje, Father of Garbology, Arizona
Anthropologist Centennial Edition, Arizona, pp. 78-86. Seretny M. (2016), Odpowiedzialna konsumpcja jako podstawa Modelu of Sustainable Marketing
(modelu harmonijnego marketingu) [Responsible consumption as the basis of the Model of
Sustainable Marketing (harmonious marketing model)], „Handel Wewnętrzny”, nr 1(360), pp. 104-
121. Swannell R. (2018), Food Waste Reduction Roadmap & Food Waste Atlas, WRAP Global, online
access: https://ec.europa.eu/food/sites/food/files/safety/docs/fw_eu-platform_20181206_flw_pres-
09.pdf. [accessed: 15.12.2017 Sztangret I. (2016), Zrównoważony rozwój przez zarządzanie wiedzą w eko-systemie interesariuszy,
na przykładzie przedsiębiorstwa usług komunalnych [Sustainable development through knowledge
I. Sztangret and B. Reformat
106
management in stakeholders’ eco-system on the example of public utilities company], Publisher:
Wydawnictwo Naukowe Uniwersytetu Szczecińskiego, Studia i Prace WNEiZ US nr 43/2
Sztangret I., Sobociński S. (2017), Ekoinnowacyjne modele biznesu na przykładzie wybranych Regionalnych Instalacji Przetwarzania Odpadów Komunalnych (RIPOK) [Eco-innovative business
models on the example of selected Regional Municipal Waste Treatment Facilities (ROPOK)],
„Modern Management Review” – Volume XXII, (January-March), Research Journal 24/1 ed. K. Kud, Publishing House of Rzeszow University of Technology
Thi N. B. D , Kumar G., Chiu-Yue Lin C. L.(2015), An overview of food waste management in
developing countries: Current status and future perspective, “Journal of Environmental Management”, Vol. 157, pp. 220-229.
UK Food Waste Data 2017/18, Tesco TLC [GB],
https://sustainability.tescoplc.com/sustainability/food-waste/topics/uk-data/, [accessed: 12.02.2019].
Watson M., Meag A. (2013), Food, Waste and Safety: Negotiating Conflicts and Anxieties into the Practices of Domestic Provisioning, [w:] Waste Matters: New Perspectives of Food and
Society, Evans E., Campbell H., Murcott M. (red.), „Sociological Review”, Vol. 60, pp. 121-135.
Wierzbicka-Mazur E., Kunasz M. (2013), Gospodarka odpadami w krajach Unii Europejskiej [Waste management in the countries of European Union], in: Zróżnicowanie gospodarek unijnych :
aspekty społeczne [Diversity of economies in European Union: social aspects] (ed.) P. Zwiech,
Economicus, Szczecin, pp. 119-144. www.https://strefabiznesu.pl/tesco-bedzie-usuwac-nienadajacy-sie-do-przetworzenia-plastik-obecnie-
tylko-9-proc-odpadow-opakowaniowych-poddawanych-jest/ar/13864088, [accessed: 10.02.2019]
www.https://www.wirtualnemedia.pl/artykul/aplikacja-foodcloud-tesco-jak-zapobiegac-marnowaniu-
zywnosci, accessed: [17.02.2019] www.Tesco udostępnia aplikację zapobiegającą marnowaniu żywności [Tesco offers the application
preventing food waste], Rzeczpospolita, 30.10.2018, https://www.rp.pl/Handel/181039938-Tesco-
udostepnia-aplikacje-zapobiegajaca-marnowaniu-zywnosci.html, [accessed: 02.02.2019] www.Produkty - marnowanie żywności,Tesco Poland [Products – food waste, Tesco Poland],
http://www.tesco-polska.pl/pl/strategia-pomocnych-gestow/produkty-marnowanie-
zywnosci/walka-z-marnowaniem.html [accessed: 22.02.2019]
https://www.rp.pl/Handel/181039938-Tesco-udostepnia-aplikacje-zapobiegajaca-marnowaniu-zywnosci.html
https://www.rp.pl/Handel/181039938-Tesco-udostepnia-aplikacje-zapobiegajaca-marnowaniu-zywnosci.html
https://www.rp.pl/Handel/181039938-Tesco-udostepnia-aplikacje-zapobiegajaca-marnowaniu-zywnosci.html
3rdInternational Conference on Economic Research
24-25th October 2019, Alanya, Turkey
107
DEVELOPMENT OF A REGIONAL MARKETING SYSTEM
Andriy Mokhnenko
Kherson State University, Department of Finance, Accounting and Entrepreneurship, Ukraine
E-mail: [email protected]
Iryna Perevozova
Ivano-Frankivsk National Technical University of Oil And Gas, Department of Marketing and
Entrepreneurship,Ukraine
Abstract
The article deals with the formation and development of regional (territorial) marketing system in
conditions of competition among regions.
The place of marketing in the economic system of the region is determined, the emphasis is placed
on the study of the region as a product, the evolution of marketing, the identification of the essence of
marketing in the system of regional policy. Author's approach to the regions as a kind of competing
corporations for resources and consumers is developed.
The set of marketing methods is offered, with the help of which it is possible to assess the
rationality of the region's development and provide information for further prediction of socio-
economic development of the region. The marketing methods are understood as the set of methods and
ways of thinking, allowing on the basis of the analysis of retrospective data, exogenous (external) and
endogenous (internal) links of the object, as well as their measurements within the framework of the
phenomenon or process under consideration, to derive certain authenticity judgments regarding its
future development.
On the basis of analysis and systematization of data on the development of the region and existing
marketing strategies, a marketing strategy for the region, which consists of eight stages, is designed to
increase the region's popularity, that is, to create its positive image and improve the competitiveness of
enterprises located in the region.
Keywords: Marketing, Region, Regional Marketing, Marketing Strategy, Regional Development.
3rd International Conference on Economic Research
24-25th October 2019, Alanya, Turkey
108
ESTIMATION OF POST-HARVEST LOSSES ALONG MARKETING CHANNELS
OF NAVEL AND LEMON IN KAT RIVER VALLEY, EASTERN CAPE,
SOUTH AFRICA
Mzuyanda Christian
North-West University, Department of Agricultural Economics and Extension, South Africa
Moradeyo Adebanjo Otitoju
University of Abuja, Department of Agricultural Economics, Nigeria
Siphokuhle Nohamba University of Free State, Department of Agricultural Economics, South Africa
Email: [email protected]
Abstract
Citrus fruit produced by famers in the fields have to undergo a series of operations such as transportation, processing, storage and exchange before reaching the consumers. Within each
operation stage of the process, there is huge loss of the quantities which is referred as “post-harvest
losses”. This study examined the nature and the extent of post-harvest loses in navel and lemon. A
multistage sampling technique was used to select 30 smallholder citrus fruit farmers, 5 wholesalers and 10 retailers from Kat River Valley for the year 2016/17. Descriptive analysis has been used to
estimate the percentage post-harvest losses at different stages, and multiple linear regression analysis
has been used to assess factors influencing postharvest losses. The study revealed that the most preferred was farmer to processor to consumer. Age of respondents, level of education, total output
and the nature of storage facility significantly influence post-harvest loses. The study recommends
establishment of producer organizations, small cold storages in production areas and training of farmers.
Keywords: Citrus Farmers, Post-Harvest Losses, Marketing Channel, Multiple Regression, South
Africa.
1. Introduction
The growing importance of fruit in South Africa’s economy can be well appreciated in terms of their rising domestic demand on account of increase in population and per capita income; their
increasing export potential and the need for providing employment opportunities in the rural areas
(Citrus Growers Association, 2016a). While domestic and export demand is steadily rising, the
production and marketing of citrus fruit face tremendous uncertainties on several counts (Uys, 2016). In 2016/17 season, Department of Agriculture, Forestry and Fisheries (DAFF) (2016), reported that
citrus fruit is the second largest crop produced in South Africa and constitute about 55% of total fruit
production. The Eastern Cape being the power house of the Southern African citrus industry, accounts for 27% of citrus production in the country. However, farmers are experiencing post-harvest losses
between production centres and the final consumer. Post-harvest loss is defined as the sum quantity of
outputs lost in threshing, transportation, processing, storage and exchange (Kumar, 2006). Many studies have been conducted for estimating the post-harvest losses particularly in South Africa
(Mashau et al., 2012; Garikai, 2014; Chauke, 2014). However, much of the attention has been on the
production side rather than marketing of agricultural commodities. It is distressing to note that so
much time is being devoted to the culture of the plant, so much money is spent on irrigation, fertilisers and crop protection measures, but little attention is paid and resources devoted to the issues related
with post-harvest losses is meager resulting in failure to meet food requirement of the hungry six
million South Africans. The agricultural products, particularly fruit and vegetables are seasonal and extremely perishable in
nature which requires efficient and effective marketing (Negasi, 2015). The wide distance between
production and post-harvest management results to a large proportion of losses (Aulakh and Regmi,
Estimation of Post-Harvest Losses…
109
2012; Alidu, 2016; Kiaya, 2014). The fruits because of their moisture content are inherently more
liable for deterioration in quality and quantity especially under tropical conditions. Moreover, they are
biologically active and carry out transpiration, respiration, ripening and other biochemical activities, which contribute for deterioration in quality of the produce. Post-harvest losses in fruit during post-
harvest operations due to improper handling and storage are enormous.
Mitrannavar (2012) reported that the post-harvest loss in fruit ranges from 10 to 30 percent. Post-harvest losses can occur in the field, in packing areas, in storage, during transportation and in the
wholesale and retail markets. Severe losses occur because of poor facilities, lack of know-how, poor
management and improper market facilities or due to careless handling of the produce by farmers, market intermediaries and consumers. It is, therefore, important that the post-harvest practices be
given as much attention as production practices.
The study on post-harvest losses in fruit at various stages of handling would help in assessing the
extent and magnitude of losses and in identifying the factors responsible for such losses. This in turn would help in developing proper measures to reduce post-harvest losses at different stages from
production point to consumption point. Under the circumstances, the reduction in post-harvest losses
can help in increasing the availability of fruit to a great extent without increasing the production. In the absence of reliable and objective estimates of post-harvest losses at different stages, the ways to
evolve correct policies for minimising such losses is more difficult. As mentioned, very few studies
have attempted to assess the extent of postharvest losses in horticultural crops.
2. Objectives of the Study
The present study attempts to estimate the postharvest losses of major citrus crops in Eastern Cape. The information on the extent of losses at various stages is important not only for scientists and
technologists but it would also be useful to policy makers, administrators and industrialists. The
scientists and technologists would be guided by the findings of this study in carrying out improvements in the crop production and post-harvest technologies aimed at minimising these losses.
The specific objectives of the present study were to:
i. examine socio-economic profile of citrus farmers in Kat River Valley
ii. measure the extent of post-harvest losses in citrus fruit at different stages, and iii. assess the factors affecting post-harvest losses at the farm level.
3. Material and Methods
3.1 Description of the Study Area
The study was carried out in the Nkonkobe Local Municipality of Eastern Cape. Nkonkobe extends
over 3725.32 ha of the former magisterial districts of Alice, Balfour, Hogsback, Fort Beaufort,
Middledrift and Seymour. The municipality consists of 21 wards and 41 municipal councils
(Nkonkobe Municipality, 2004). It has an average population density of 43 persons per hectare (Stats SA, 2017).
In the North East along the wild coast, towns like Port St Johns experience long, hot, balmy
conditions and high rainfall, while Graaff Reinet in the heart of great Karoo, experiences long hot summer months and moderate winter. Up towards the Free State (at towns such as Lady Grey and
Aliwal North) the rise in altitude means the appropriate lowering in temperature and towns. The
coastal city of Port Elizabeth enjoys a daily average of +/- 8 hours of sunshine annually. In winter, the temperature ranges from 7 to 20 degrees. In summer, the temperatures range from 16 to 26 Degrees
Celsius.
3.1.1 Mean Monthly and Annual Rainfall
Projections of monthly and seasonal changes in rainfall distribution patterns over Eastern Cape are
not uniform, but can vary markedly in direction, in intensity, as well as varying spatially within the province in a given month, between different months of the year for the same statistic, and between
the intermediate future and the more distant future for the same statistic, with this last-named
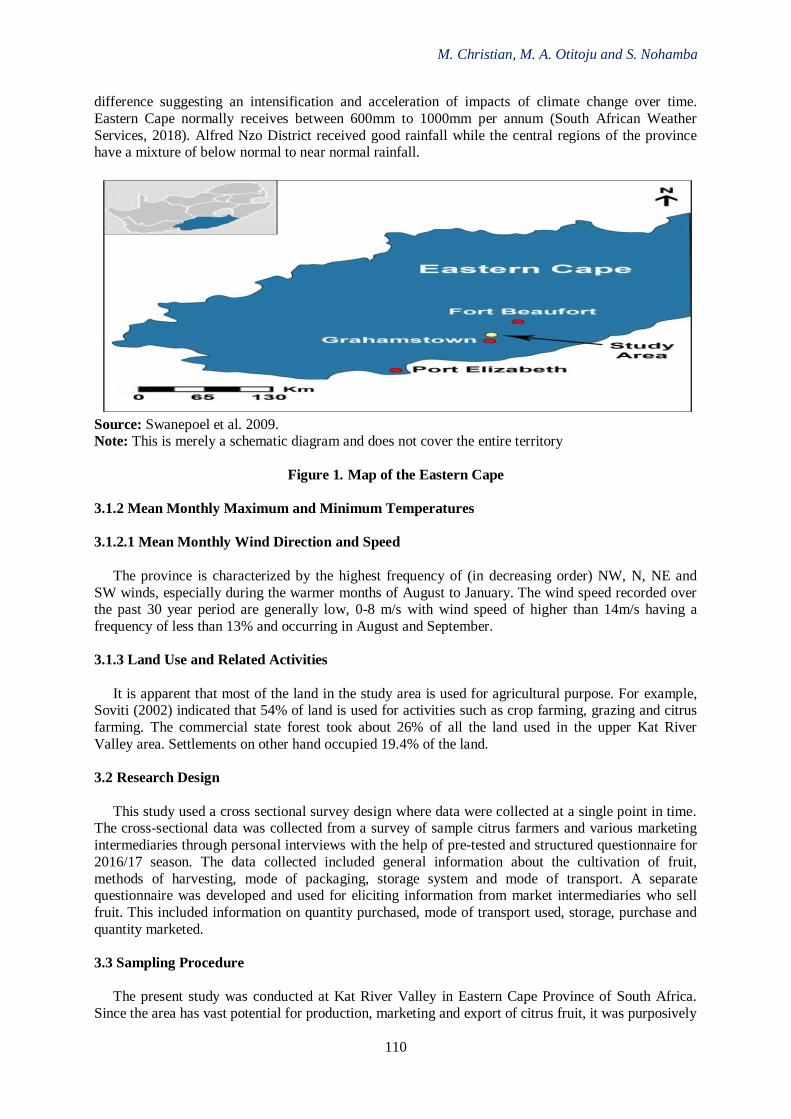
M. Christian, M. A. Otitoju and S. Nohamba
110
difference suggesting an intensification and acceleration of impacts of climate change over time.
Eastern Cape normally receives between 600mm to 1000mm per annum (South African Weather
Services, 2018). Alfred Nzo District received good rainfall while the central regions of the province have a mixture of below normal to near normal rainfall.
Source: Swanepoel et al. 2009. Note: This is merely a schematic diagram and does not cover the entire territory
Figure 1. Map of the Eastern Cape
3.1.2 Mean Monthly Maximum and Minimum Temperatures
3.1.2.1 Mean Monthly Wind Direction and Speed
The province is characterized by the highest frequency of (in decreasing order) NW, N, NE and
SW winds, especially during the warmer months of August to January. The wind speed recorded over the past 30 year period are generally low, 0-8 m/s with wind speed of higher than 14m/s having a
frequency of less than 13% and occurring in August and September.
3.1.3 Land Use and Related Activities
It is apparent that most of the land in the study area is used for agricultural purpose. For example, Soviti (2002) indicated that 54% of land is used for activities such as crop farming, grazing and citrus
farming. The commercial state forest took about 26% of all the land used in the upper Kat River
Valley area. Settlements on other hand occupied 19.4% of the land.
3.2 Research Design
This study used a cross sectional survey design where data were collected at a single point in time. The cross-sectional data was collected from a survey of sample citrus farmers and various marketing
intermediaries through personal interviews with the help of pre-tested and structured questionnaire for
2016/17 season. The data collected included general information about the cultivation of fruit,
methods of harvesting, mode of packaging, storage system and mode of transport. A separate questionnaire was developed and used for eliciting information from market intermediaries who sell
fruit. This included information on quantity purchased, mode of transport used, storage, purchase and
quantity marketed.
3.3 Sampling Procedure
The present study was conducted at Kat River Valley in Eastern Cape Province of South Africa.
Since the area has vast potential for production, marketing and export of citrus fruit, it was purposively
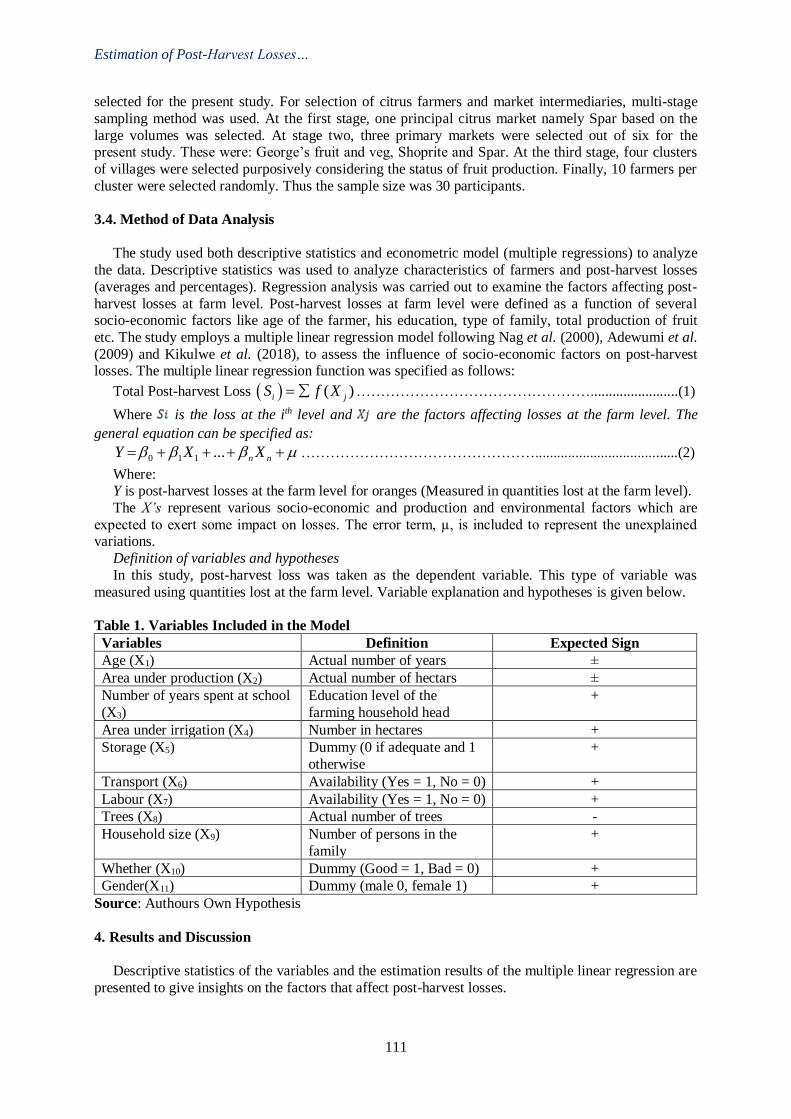
Estimation of Post-Harvest Losses…
111
selected for the present study. For selection of citrus farmers and market intermediaries, multi-stage
sampling method was used. At the first stage, one principal citrus market namely Spar based on the
large volumes was selected. At stage two, three primary markets were selected out of six for the present study. These were: George’s fruit and veg, Shoprite and Spar. At the third stage, four clusters
of villages were selected purposively considering the status of fruit production. Finally, 10 farmers per
cluster were selected randomly. Thus the sample size was 30 participants.
3.4. Method of Data Analysis
The study used both descriptive statistics and econometric model (multiple regressions) to analyze
the data. Descriptive statistics was used to analyze characteristics of farmers and post-harvest losses
(averages and percentages). Regression analysis was carried out to examine the factors affecting post-
harvest losses at farm level. Post-harvest losses at farm level were defined as a function of several socio-economic factors like age of the farmer, his education, type of family, total production of fruit
etc. The study employs a multiple linear regression model following Nag et al. (2000), Adewumi et al.
(2009) and Kikulwe et al. (2018), to assess the influence of socio-economic factors on post-harvest losses. The multiple linear regression function was specified as follows:
Total Post-harvest Loss ( ) ( )i jS f X= …………………………………………........................(1)
Where is the loss at the ith level and are the factors affecting losses at the farm level. The
general equation can be specified as:
0 1 1 ... n nY X X = + + + + ………………………………………….......................................(2)
Where: Y is post-harvest losses at the farm level for oranges (Measured in quantities lost at the farm level).
The X’s represent various socio-economic and production and environmental factors which are
expected to exert some impact on losses. The error term, µ, is included to represent the unexplained variations.
Definition of variables and hypotheses
In this study, post-harvest loss was taken as the dependent variable. This type of variable was
measured using quantities lost at the farm level. Variable explanation and hypotheses is given below.
Table 1. Variables Included in the Model
Variables Definition Expected Sign
Age (X1) Actual number of years ±
Area under production (X2) Actual number of hectars ±
Number of years spent at school
(X3)
Education level of the
farming household head
+
Area under irrigation (X4) Number in hectares +
Storage (X5) Dummy (0 if adequate and 1
otherwise
+
Transport (X6) Availability (Yes = 1, No = 0) +
Labour (X7) Availability (Yes = 1, No = 0) +
Trees (X8) Actual number of trees -
Household size (X9) Number of persons in the
family
+
Whether (X10) Dummy (Good = 1, Bad = 0) +
Gender(X11) Dummy (male 0, female 1) +
Source: Authours Own Hypothesis
4. Results and Discussion
Descriptive statistics of the variables and the estimation results of the multiple linear regression are
presented to give insights on the factors that affect post-harvest losses.
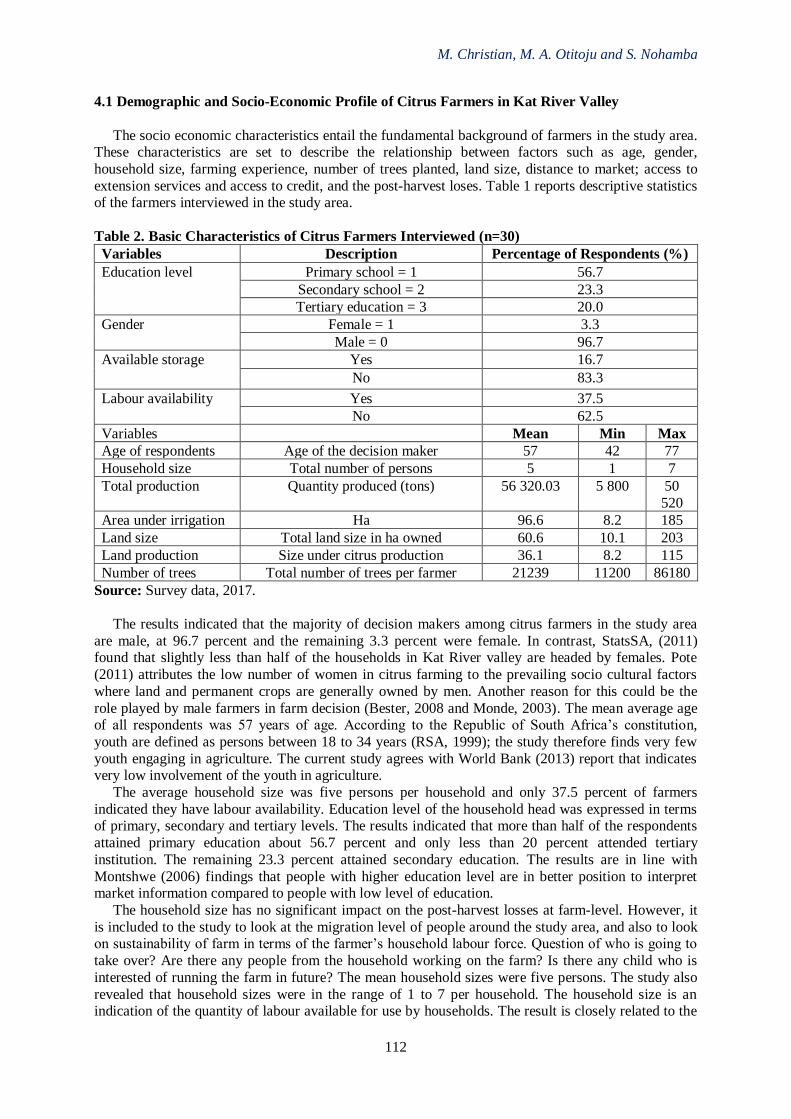
M. Christian, M. A. Otitoju and S. Nohamba
112
4.1 Demographic and Socio-Economic Profile of Citrus Farmers in Kat River Valley
The socio economic characteristics entail the fundamental background of farmers in the study area. These characteristics are set to describe the relationship between factors such as age, gender,
household size, farming experience, number of trees planted, land size, distance to market; access to
extension services and access to credit, and the post-harvest loses. Table 1 reports descriptive statistics of the farmers interviewed in the study area.
Table 2. Basic Characteristics of Citrus Farmers Interviewed (n=30)
Variables Description Percentage of Respondents (%)
Education level Primary school = 1 56.7
Secondary school = 2 23.3
Tertiary education = 3 20.0
Gender Female = 1 3.3
Male = 0 96.7
Available storage Yes 16.7
No 83.3
Labour availability Yes 37.5
No 62.5
Variables Mean Min Max
Age of respondents Age of the decision maker 57 42 77
Household size Total number of persons 5 1 7
Total production Quantity produced (tons) 56 320.03 5 800 50
520
Area under irrigation Ha 96.6 8.2 185
Land size Total land size in ha owned 60.6 10.1 203
Land production Size under citrus production 36.1 8.2 115
Number of trees Total number of trees per farmer 21239 11200 86180
Source: Survey data, 2017.
The results indicated that the majority of decision makers among citrus farmers in the study area
are male, at 96.7 percent and the remaining 3.3 percent were female. In contrast, StatsSA, (2011) found that slightly less than half of the households in Kat River valley are headed by females. Pote
(2011) attributes the low number of women in citrus farming to the prevailing socio cultural factors
where land and permanent crops are generally owned by men. Another reason for this could be the
role played by male farmers in farm decision (Bester, 2008 and Monde, 2003). The mean average age of all respondents was 57 years of age. According to the Republic of South Africa’s constitution,
youth are defined as persons between 18 to 34 years (RSA, 1999); the study therefore finds very few
youth engaging in agriculture. The current study agrees with World Bank (2013) report that indicates very low involvement of the youth in agriculture.
The average household size was five persons per household and only 37.5 percent of farmers
indicated they have labour availability. Education level of the household head was expressed in terms of primary, secondary and tertiary levels. The results indicated that more than half of the respondents
attained primary education about 56.7 percent and only less than 20 percent attended tertiary
institution. The remaining 23.3 percent attained secondary education. The results are in line with
Montshwe (2006) findings that people with higher education level are in better position to interpret market information compared to people with low level of education.
The household size has no significant impact on the post-harvest losses at farm-level. However, it
is included to the study to look at the migration level of people around the study area, and also to look on sustainability of farm in terms of the farmer’s household labour force. Question of who is going to
take over? Are there any people from the household working on the farm? Is there any child who is
interested of running the farm in future? The mean household sizes were five persons. The study also
revealed that household sizes were in the range of 1 to 7 per household. The household size is an indication of the quantity of labour available for use by households. The result is closely related to the
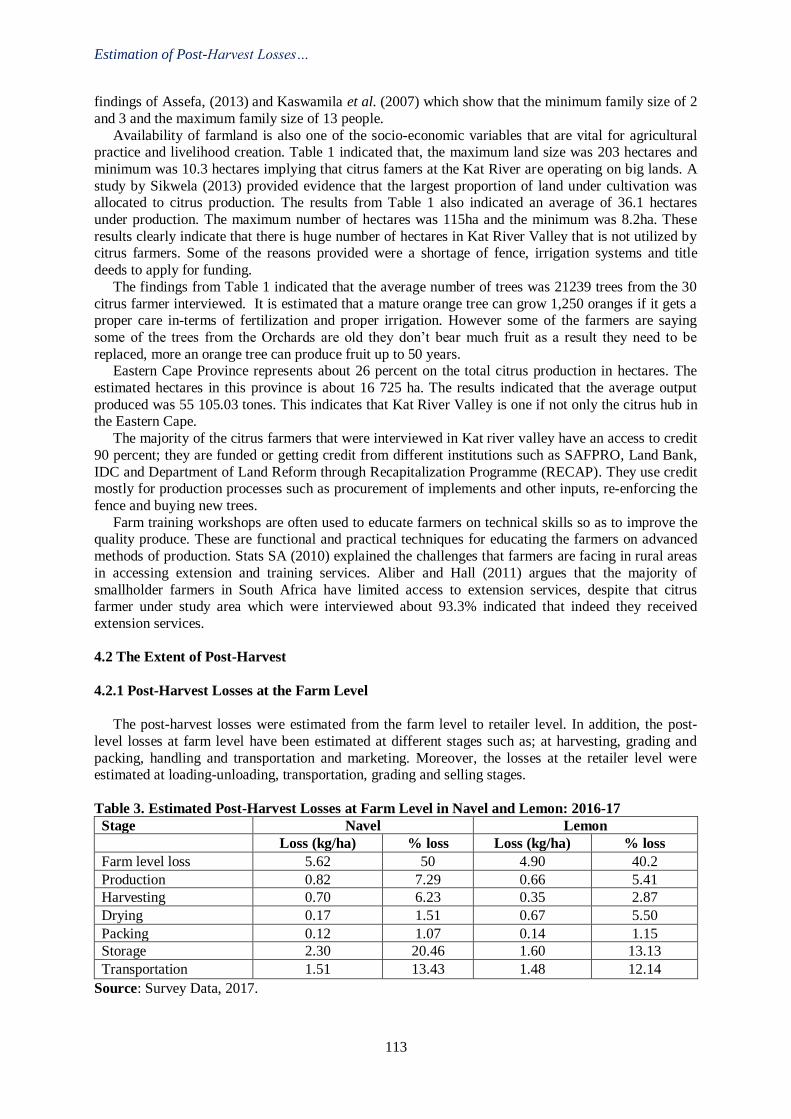
Estimation of Post-Harvest Losses…
113
findings of Assefa, (2013) and Kaswamila et al. (2007) which show that the minimum family size of 2
and 3 and the maximum family size of 13 people.
Availability of farmland is also one of the socio-economic variables that are vital for agricultural practice and livelihood creation. Table 1 indicated that, the maximum land size was 203 hectares and
minimum was 10.3 hectares implying that citrus famers at the Kat River are operating on big lands. A
study by Sikwela (2013) provided evidence that the largest proportion of land under cultivation was allocated to citrus production. The results from Table 1 also indicated an average of 36.1 hectares
under production. The maximum number of hectares was 115ha and the minimum was 8.2ha. These
results clearly indicate that there is huge number of hectares in Kat River Valley that is not utilized by citrus farmers. Some of the reasons provided were a shortage of fence, irrigation systems and title
deeds to apply for funding.
The findings from Table 1 indicated that the average number of trees was 21239 trees from the 30
citrus farmer interviewed. It is estimated that a mature orange tree can grow 1,250 oranges if it gets a proper care in-terms of fertilization and proper irrigation. However some of the farmers are saying
some of the trees from the Orchards are old they don’t bear much fruit as a result they need to be
replaced, more an orange tree can produce fruit up to 50 years. Eastern Cape Province represents about 26 percent on the total citrus production in hectares. The
estimated hectares in this province is about 16 725 ha. The results indicated that the average output
produced was 55 105.03 tones. This indicates that Kat River Valley is one if not only the citrus hub in the Eastern Cape.
The majority of the citrus farmers that were interviewed in Kat river valley have an access to credit
90 percent; they are funded or getting credit from different institutions such as SAFPRO, Land Bank,
IDC and Department of Land Reform through Recapitalization Programme (RECAP). They use credit mostly for production processes such as procurement of implements and other inputs, re-enforcing the
fence and buying new trees.
Farm training workshops are often used to educate farmers on technical skills so as to improve the quality produce. These are functional and practical techniques for educating the farmers on advanced
methods of production. Stats SA (2010) explained the challenges that farmers are facing in rural areas
in accessing extension and training services. Aliber and Hall (2011) argues that the majority of
smallholder farmers in South Africa have limited access to extension services, despite that citrus farmer under study area which were interviewed about 93.3% indicated that indeed they received
extension services.
4.2 The Extent of Post-Harvest
4.2.1 Post-Harvest Losses at the Farm Level
The post-harvest losses were estimated from the farm level to retailer level. In addition, the post-
level losses at farm level have been estimated at different stages such as; at harvesting, grading and
packing, handling and transportation and marketing. Moreover, the losses at the retailer level were estimated at loading-unloading, transportation, grading and selling stages.
Table 3. Estimated Post-Harvest Losses at Farm Level in Navel and Lemon: 2016-17
Stage Navel Lemon
Loss (kg/ha) % loss Loss (kg/ha) % loss
Farm level loss 5.62 50 4.90 40.2
Production 0.82 7.29 0.66 5.41
Harvesting 0.70 6.23 0.35 2.87
Drying 0.17 1.51 0.67 5.50
Packing 0.12 1.07 0.14 1.15
Storage 2.30 20.46 1.60 13.13
Transportation 1.51 13.43 1.48 12.14
Source: Survey Data, 2017.
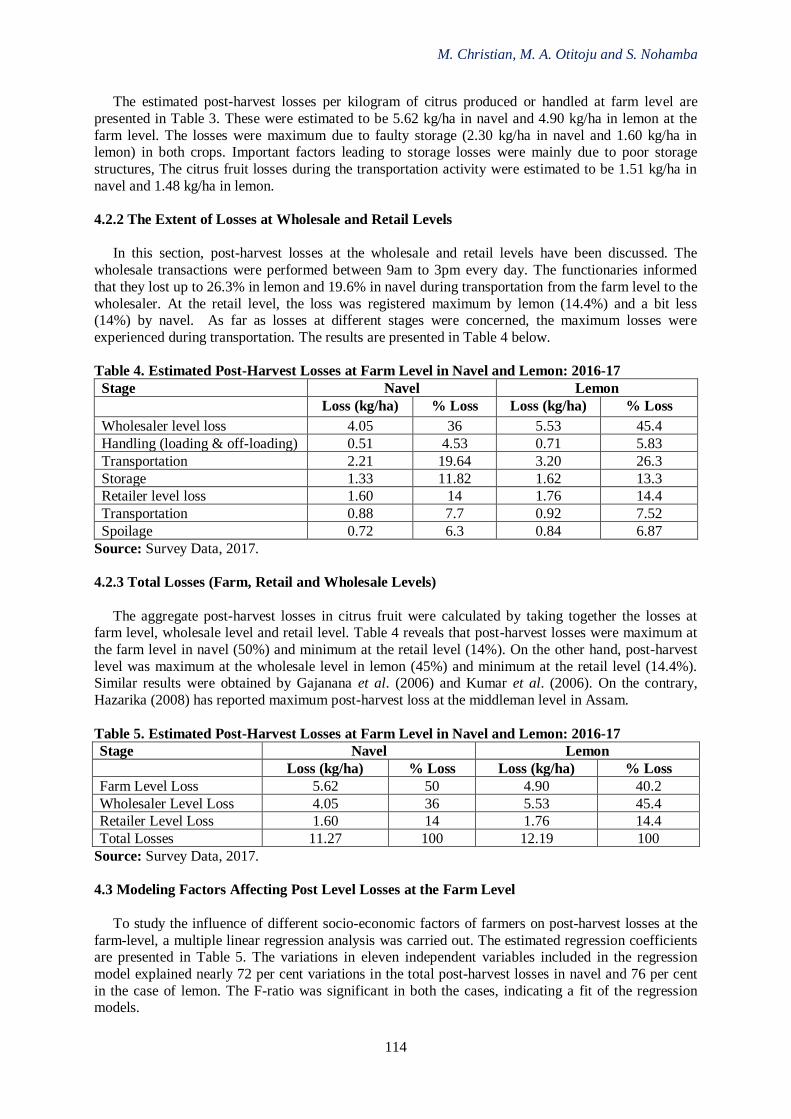
M. Christian, M. A. Otitoju and S. Nohamba
114
The estimated post-harvest losses per kilogram of citrus produced or handled at farm level are
presented in Table 3. These were estimated to be 5.62 kg/ha in navel and 4.90 kg/ha in lemon at the
farm level. The losses were maximum due to faulty storage (2.30 kg/ha in navel and 1.60 kg/ha in lemon) in both crops. Important factors leading to storage losses were mainly due to poor storage
structures, The citrus fruit losses during the transportation activity were estimated to be 1.51 kg/ha in
navel and 1.48 kg/ha in lemon.
4.2.2 The Extent of Losses at Wholesale and Retail Levels
In this section, post-harvest losses at the wholesale and retail levels have been discussed. The
wholesale transactions were performed between 9am to 3pm every day. The functionaries informed
that they lost up to 26.3% in lemon and 19.6% in navel during transportation from the farm level to the
wholesaler. At the retail level, the loss was registered maximum by lemon (14.4%) and a bit less (14%) by navel. As far as losses at different stages were concerned, the maximum losses were
experienced during transportation. The results are presented in Table 4 below.
Table 4. Estimated Post-Harvest Losses at Farm Level in Navel and Lemon: 2016-17
Stage Navel Lemon
Loss (kg/ha) % Loss Loss (kg/ha) % Loss
Wholesaler level loss 4.05 36 5.53 45.4
Handling (loading & off-loading) 0.51 4.53 0.71 5.83
Transportation 2.21 19.64 3.20 26.3
Storage 1.33 11.82 1.62 13.3
Retailer level loss 1.60 14 1.76 14.4
Transportation 0.88 7.7 0.92 7.52
Spoilage 0.72 6.3 0.84 6.87
Source: Survey Data, 2017.
4.2.3 Total Losses (Farm, Retail and Wholesale Levels)
The aggregate post-harvest losses in citrus fruit were calculated by taking together the losses at farm level, wholesale level and retail level. Table 4 reveals that post-harvest losses were maximum at
the farm level in navel (50%) and minimum at the retail level (14%). On the other hand, post-harvest
level was maximum at the wholesale level in lemon (45%) and minimum at the retail level (14.4%). Similar results were obtained by Gajanana et al. (2006) and Kumar et al. (2006). On the contrary,
Hazarika (2008) has reported maximum post-harvest loss at the middleman level in Assam.
Table 5. Estimated Post-Harvest Losses at Farm Level in Navel and Lemon: 2016-17
Stage Navel Lemon
Loss (kg/ha) % Loss Loss (kg/ha) % Loss
Farm Level Loss 5.62 50 4.90 40.2
Wholesaler Level Loss 4.05 36 5.53 45.4
Retailer Level Loss 1.60 14 1.76 14.4
Total Losses 11.27 100 12.19 100
Source: Survey Data, 2017.
4.3 Modeling Factors Affecting Post Level Losses at the Farm Level
To study the influence of different socio-economic factors of farmers on post-harvest losses at the
farm-level, a multiple linear regression analysis was carried out. The estimated regression coefficients are presented in Table 5. The variations in eleven independent variables included in the regression
model explained nearly 72 per cent variations in the total post-harvest losses in navel and 76 per cent
in the case of lemon. The F-ratio was significant in both the cases, indicating a fit of the regression models.
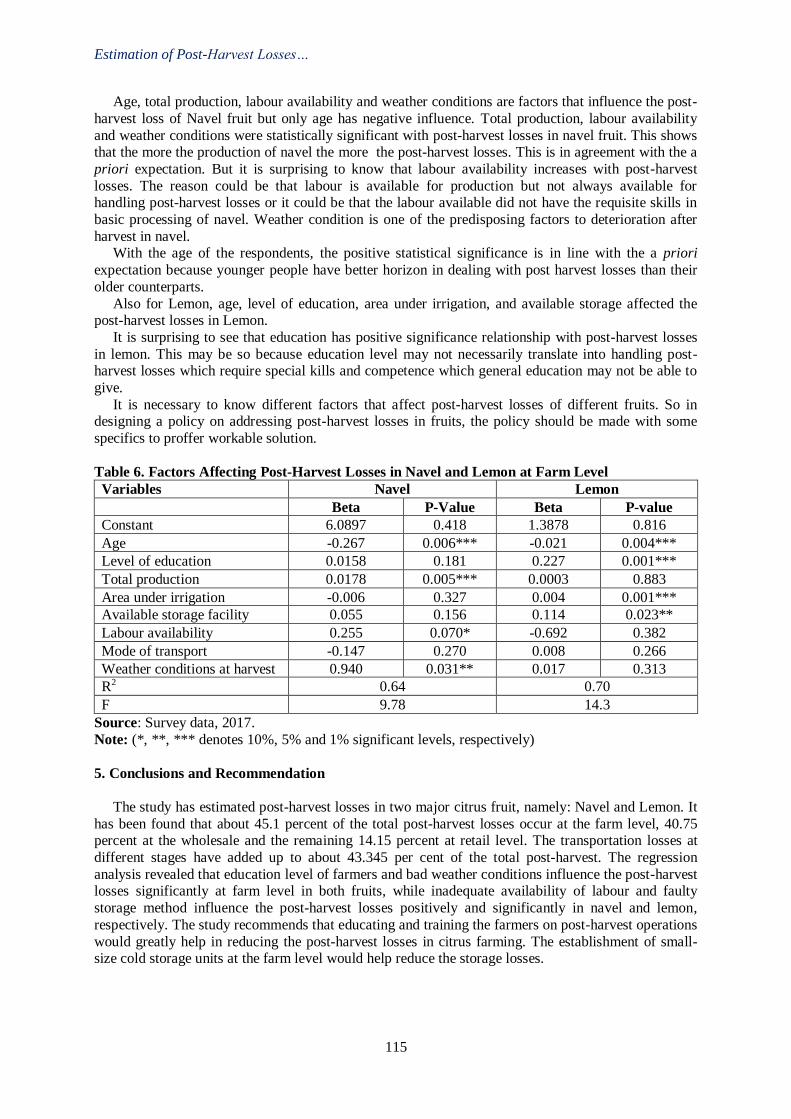
Estimation of Post-Harvest Losses…
115
Age, total production, labour availability and weather conditions are factors that influence the post-
harvest loss of Navel fruit but only age has negative influence. Total production, labour availability
and weather conditions were statistically significant with post-harvest losses in navel fruit. This shows that the more the production of navel the more the post-harvest losses. This is in agreement with the a
priori expectation. But it is surprising to know that labour availability increases with post-harvest
losses. The reason could be that labour is available for production but not always available for handling post-harvest losses or it could be that the labour available did not have the requisite skills in
basic processing of navel. Weather condition is one of the predisposing factors to deterioration after
harvest in navel. With the age of the respondents, the positive statistical significance is in line with the a priori
expectation because younger people have better horizon in dealing with post harvest losses than their
older counterparts.
Also for Lemon, age, level of education, area under irrigation, and available storage affected the post-harvest losses in Lemon.
It is surprising to see that education has positive significance relationship with post-harvest losses
in lemon. This may be so because education level may not necessarily translate into handling post-harvest losses which require special kills and competence which general education may not be able to
give.
It is necessary to know different factors that affect post-harvest losses of different fruits. So in designing a policy on addressing post-harvest losses in fruits, the policy should be made with some
specifics to proffer workable solution.
Table 6. Factors Affecting Post-Harvest Losses in Navel and Lemon at Farm Level
Variables Navel Lemon
Beta P-Value Beta P-value
Constant 6.0897 0.418 1.3878 0.816
Age -0.267 0.006*** -0.021 0.004***
Level of education 0.0158 0.181 0.227 0.001***
Total production 0.0178 0.005*** 0.0003 0.883
Area under irrigation -0.006 0.327 0.004 0.001***
Available storage facility 0.055 0.156 0.114 0.023**
Labour availability 0.255 0.070* -0.692 0.382
Mode of transport -0.147 0.270 0.008 0.266
Weather conditions at harvest 0.940 0.031** 0.017 0.313
R2 0.64 0.70
F 9.78 14.3
Source: Survey data, 2017.
Note: (*, **, *** denotes 10%, 5% and 1% significant levels, respectively)
5. Conclusions and Recommendation
The study has estimated post-harvest losses in two major citrus fruit, namely: Navel and Lemon. It
has been found that about 45.1 percent of the total post-harvest losses occur at the farm level, 40.75 percent at the wholesale and the remaining 14.15 percent at retail level. The transportation losses at
different stages have added up to about 43.345 per cent of the total post-harvest. The regression
analysis revealed that education level of farmers and bad weather conditions influence the post-harvest losses significantly at farm level in both fruits, while inadequate availability of labour and faulty
storage method influence the post-harvest losses positively and significantly in navel and lemon,
respectively. The study recommends that educating and training the farmers on post-harvest operations
would greatly help in reducing the post-harvest losses in citrus farming. The establishment of small-size cold storage units at the farm level would help reduce the storage losses.
M. Christian, M. A. Otitoju and S. Nohamba
116
6. Acknowledgements
The authors are grateful to DAAD-NRF and to the farmers, district agriculture office workers, and all those who participated in the data collection and analysis. The authors would also like to thank
MC-FNAS HDC for funding the paper to be presented at the conference.
References
Alidu, A.F., Baba, E. & Aminu, H. 2016. Determinants of Post Harvest Losses among Tomato Farmers in the Navrongo Municipality in The Upper East Region. Journal of Biology, Agriculture
and Healthcare. ISSN 2224-3208 (Paper) ISSN 2225-093X (Online) Vol.6, No.12 2016
Aulakh J. & Regmi A. 2013. Post-Harvest Food Losses Estimation-Development of Consistent
Methodology Food and Agriculture Organization of the United Nations http://www.fao.org/fileadmin/templates/ess/documents/meetings_and_workshops/GS_SAC_2013/I
mproving_methods_for_estimating_post_harvest_losses/Final_PHLs_Estimation_6-13-13.pdf
(accessed 27 October 2017) Basu, A.; Chau, N & Grote, U. 2004. On export rivalry and the greening of agriculture – The role of
eco-labels. Agricultural Economics, v. 31, issue 2-3, p. 135-147, 2004.
Bownes, A. 2003. The structure of ant communities and their impact on soil pupating pest in citrus orchards in the Grahamstown area of the Eastern Cape, Rhodes University. South Africa.
Bester, B.J. 2008. Summary: Agricultural Marketing and the Importance of Agricultural Marketing.
Unpublished Supplementary Lecture Notes for AGE121.
Citrus Growers Association (CGA). 2006. Key industry statistics. Hillcrest, South Africa. CGA (citrus Growers Association). 2010. Citrus fruit production and export data. Hillcrest:
information and Market Intelligence Division.
CGA (citrus Growers Association). 2013. Citrus fruit production and export data. Hillcrest: information and Market Intelligence Division.
CGA (citrus Growers Association). 2014. Citrus fruit production and export data. Hillcrest:
information and Market Intelligence Division.
CGA. 2016b. Annual report 2016 [Online]. Available: http://3b5dca501ee1e6d8cd7b905f4e1bf723.cdn.ilink247.com/ClientFiles/cga/CitrusGowersAssoci
ation/Company/Documents/CGA AR 2016a(2).pdf
Chadwick, J. 2008. Module 1 The South African Citrus Industry [online]. Available: https://www.citrusresourcewarehouse.org.za/home/document-home/learning-aids-andresources/ca-
citrus-av-series-learning-material/citrus-post-harvest-series/1123-cphs-learningmaterial-module-
01-south-african-citrus-industry/file. Accessed 05/ May/ 2018 Chadwick, J. 2013. Citrus black spot (CBS) commitment to compliance. The CEO’s Desk, Citrus
Growers Association (CGA) 25:13
Department of Agriculture, forestry and fisheries (DAFF). 2012. A profile of the South Africa citrus
market value chain. Pretoria: Directorate of Agricultural Statistics. Department of Agriculture, forestry and fisheries (DAFF). 2014. Local market fruit sales data.
Pretoria: Directorate of Agricultural Statistics.
DAFF (Department of agriculture, forestry and fisheries). 2016. A profile of the South African citrus market value chain [Online]. Available:
http://www.nda.agric.za/doaDev/sideMenu/Marketing/Annual%20Publications/Commodity%20Pr
o files/field%20crops/Citrus%20market%20value%20chain%202016.pdf FAO. 2003. World markets for organic fruit and vegetables – Opportunities for developing countries
in the production and export of organic horticultural products. Rome: ITC, TCARC, p.
312. http://www.fao.org/docrep/004/Y1669E/Y1669E00.htm. (Accessed February 2017)
HENSON, S. 2006. The role of public and private standards in regulating international food markets. Food regulation and trade: institutional framework, concepts of analysis and empirical evidence.
Germany.
Kiaya, V. 2014. Post-harvest losses and strategies to reduce them. https://www.actioncontrelafaim.org/wpcontent/uploads/2018/01/technical_paper_phl__.pdf
Estimation of Post-Harvest Losses…
117
Kistren, J., Stander, R. & Haankuku, C. 2010.Measuring private Research and Innovation in South
Asia and Sub-Saharan Africa: A South Africa Country Report, International Food Policy Institute
Available on http://www.asti.cgiar.org/pdf/private-sector/SouthAfrica-PS-Report.pdf (viewed 8february 2017)
Kumar, D.K., Basavaraja, H. & Mahajanshetti, S.B. 2006. An economic analysis of post-harvest losses
in vegetables in Karnataka. Ind. J. Agric. Econ. 2006, 61, 134–146. Mabiletsa, P. 2002. Republic of South Africa Citrus Annual 2002, Report: SF3 3037 Global
Agriculture Information network.
Mashau, M.E.,Moyane, J.N. & Jideani, I.A. 2012. Assessment of post harvest losses of fruits at Tshakhuma fruit market in Limpopo Province, South Africa. Afr. J. Agric. Res. 2012, 7, 4145–
4150
Ntombele, S. & Moobi, M. 2013. South Africa fruit trade flow. Pretoria, South Africa: NAMC
Montshwe, D.B. 2006. Factors affecting participation in mainstream cattle markets by smallholder cattle farmers in South Africa. MSc Thesis, University of Free State
Monde, N. 2003. Household food security in rural areas of central Eastern Cape: The case study of
Guquka in Victoria East and Koloni in Middledrift District, Unpublished PhD (Agricultural Economics) dissertation, University of Fort Hare, Alice.
Negasi, M.Y. 2015. Marketing System Analysis of Vegetables and Fruits in Amhara Regional State:
Survey Evidence from Raya Kobo and Harbu Woredas Notional Agriculture marketing council (2013) South African Fruit trade flow Issue No. 8, January
2013,http://sansor.org/wp-content/uploads/2012/08/Fruit-Trade-Flow-January-2013-Issue-No8.pdf
Paul, I. 2006. Modelling the distribution of citrus spot caused by guignardia
citricarpakiely.Viewed 8february 2017, from http://repository.up.ac.za/bitstream/handle/2263/25123/00front.pdf
PPECB. 2009. PPECB Export Directory. Cape Town, South Africa
PPECB (Perished Products Export Control Board). 2007. Perishable product inspection and shipping season data. Cape Town: PPECB.
Statistics South Africa, 2011. Strategic plan 2010/11 – 2014/15 / Statistics South Africa. Available
online: Stats SA website www.statssa.gov.za.
Uys, D. 2016. Growing South Africa’s fruit exports. Farmers Weekly, 6 June [Online]. Available: http://www.farmersweekly.co.za/opinion/by-invitation/growing-south-africas-global-fruit-exports/
[Accessed 30 August 2017].
United State Department of Agriculture, Foreign Agriculture Service. 2016. Report contains assessment of commodity and trade issues made by USDA staff and not necessarily statement of
official U.S. Government Policy Viewed 8 February 2017,
https://gain.fas.usda.gov/Recent%20GAIN%20Publications/Citrus%20Annual_Madrid_EU-28_12-9-2014.pdf
3rdInternational Conference on Economic Research
24-25th October 2019, Alanya, Turkey
118
ANALYSING THE SHORT-TERM AND THE LONG-TERM RELATIONSHIP
BETWEEN BIST FOOD BEVERAGE INDEX AND FOOD INDICES
ON GLOBAL MARKET
Ihsan Erdem Kayral
Konya Food and Agriculture University, Department of Economics, Turkey
Email: [email protected]
Nisa Sansel Tandogan
Konya Food and Agriculture University, Department of Economics, Turkey
Abstract
Within the scope of this study, the existence of short-term and long-term relationship between
BIST Food Beverage Index, which is one of the sub-indices covering food and beverage companies
listed on Borsa Istanbul, and Food Indices on global market are analysed for the period of 07.01.2013
– 07.01.2019. In this sense, the aim of this study is to determine in what degree these companies listed
in BIST Food Beverage Index are affected by the Global Food and Beverage Indices in the period at
issue. Representing the global market, the indices relating to food and beverages taking place in the
scope of Thomson Reuters/CoreCommodity CRB are used. Four foods and two beverages are
determined as cacao, corn, sugar, wheat, coffee and orange juice. Within the scope of the study using
daily closing price of stock markets, the relationship of variables is analysed with Autoregressive
Distributed Lag (ARDL) model depending on that some variables are found as stationary at the level
of I(1), some at the level of I(0). At the result of the analysis performed, the existence of a long-term
balance is determined with F test. ARDL (1, 3, 2, 1, 0, 0, 0) model is estimated in a way to include
time-lagged variables as one-lag in BIST Food and Beverage Index, three-lags in Corn Index, two-lags
in Wheat Index, one-term in Orange Juice Index. Coffee, Cacao and Sugar Indices are estimated in a
way to compose of variables without lagged. According to this, Corn Index, Wheat Index and Sugar
Index are found as significant in the long-term. Elasticity coefficients of variables are determined as -
1.5623, 1.4339 and 0.9227 respectively. These coefficients show how much 1% increase in the
indices, which is found as significant in long term, will change BIST Food and Beverage Index. The
coefficients in ARDL Model are found as consistency according to the statistics of CUSUM and
CUSUMSQ. In the period analysed (without a short term of 2008), any critical structural break is not
encountered. In our study, the short-term relationship of indices within the scope of Thomson
Reuters/CoreCommodity CRB with BIST Food and Beverage Index is estimated with Error Correction
Model (ECM). Accordingly, three indices in the different lagged values are found as correlated with
BIST index in the short-term. These indices are Wheat Index, Corn Index and Orange Juice Index. In
the short-term, it is determined that there is a positive relationship both between BIST Food and
Beverage Index and Corn Index and between BIST Food and Beverage Index and Orange Juice Index.
However, BIST Food and Beverage Index is found as a negative relationship with Wheat Index.
Within the context of the model, the error correction coefficient is found as negative and statistically
significant. On the other hand, it is found that only 1.7% of deviations which will occur in long-term
equilibrium according to the imputed value are eliminated after one-period, which means the slow
adjustment process.
Keywords: BIST Food and Beverage Index, Thomson Reuters/CoreCommodity CRB Indices, ARDL
Model, Error Correction Model, Global Financial Markets.
3rd International Conference on Economic Research
24-25th October 2019, Alanya, Turkey
119
COMPETITIVE POSITION OF POLISH DAIRY ENTERPRISES - ASSESSMENT
OF THE SUSTAINABLE DEVELOPMENT MODEL
Ewa Stawicka
Warsaw University of Life Sciences, Faculty of Economic, Poland
Email: [email protected]
Abstract
The demand for dairy products largely depends on the population and the income of consumers.
According to forecasts, the world's population by 2050 will increase by 30%, the rate of change on
individual continents will be different. The largest population growth will be in Africa, even by around
20%, while in Europe it will decrease by around 3%. Population growth will result in an increase in
global demand for food products. In Poland, the milk sector was largely influenced by EU integration.
Poland gained access to new markets. The opening of the Polish economy has also caused unfavorable
phenomena such as: the intensification of rivalry between existing companies and the entry of new,
strong competitors in this transnational corporation. Polish dairy products are widely recognized, but
mainly among domestic consumers. Given that the foreign trade of the Polish milk processing sector is
characterized by strong concentration within the EU, expansion to further markets may be limited.
Obtaining the opportunity to create a competitive advantage can only be possible in the event of
modernization, restructuring and concentration of enterprises, and above all on high-quality product
innovations. It is also worth recommending actions towards broadly understood sustainable
development. These are: linking the issue of sustainable development with the company's strategy,
offering competitive and innovative environmentally friendly products, influencing radical changes in
consumer behavior, taking into account the issue of sustainable development throughout the entire
supply chain, supporting business partners in making changes towards sustainable development,
conducting cycle analysis the life and use of production systems to reuse resources.
The article is a contribution to the search for new business solutions in the field of a sustainable
business model of innovation for the Polish dairy sector
Keywords: Sustainable Development, Milk, Market, Business Model.
1. Introduction
The concept of sustainable development consists of stable, constant progress and meeting the needs
of the present generation without diminishing the opportunities of future generations. Due to the fact
that the world and the economy are in the period of "disturbed balance" countries and even regions
bear its negative consequences. Social problems also overlap with ecological problems (Bocken,
Short, 2012).
The importance of enterprises' activity towards the implementation of the concept of sustainable
development is growing. These are: linking sustainable development with the company's strategy,
offering competitive and innovative environmentally-friendly products, influencing radical changes in
consumer behavior, integrating sustainability throughout the supply chain, supporting business
partners in making changes towards sustainable development, conducting analysis of the life cycle and
use of production systems that enable the reuse of resources (The Sustainability Leaders…, 2012).
The current demand for food products of good quality, which at the same time will be produced in
a sustainable manner. This is related to the ever more accentuated new direction referred to as the
"sustainable product philosophy", in this case for milk and dairy products. The milk market is one of
the most attractive sectors of today's economy. It is characterized by high average profitability and a
relatively large average annual growth rate. It also plays an important role in satisfying society's needs
(Mierzwa, 2011).
Research shows that in the last two decades, Polish milk processing establishments have been
modernized. Dairy plants in Poland have started to implement a sustainable business model based on
maximizing material and energy efficiency. This is evidenced by activities such as the optimal use of
resources at individual stages of production, reduction of water and energy consumption or reduction
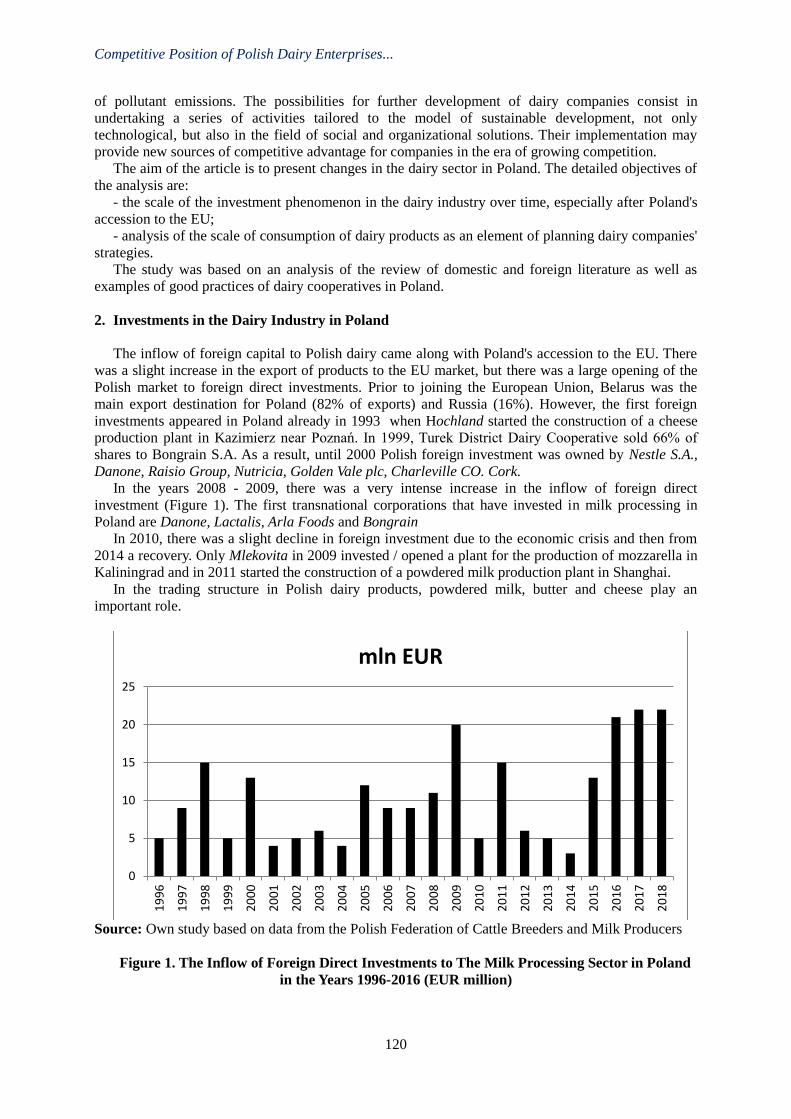
Competitive Position of Polish Dairy Enterprises...
120
of pollutant emissions. The possibilities for further development of dairy companies consist in
undertaking a series of activities tailored to the model of sustainable development, not only
technological, but also in the field of social and organizational solutions. Their implementation may
provide new sources of competitive advantage for companies in the era of growing competition.
The aim of the article is to present changes in the dairy sector in Poland. The detailed objectives of
the analysis are:
- the scale of the investment phenomenon in the dairy industry over time, especially after Poland's
accession to the EU;
- analysis of the scale of consumption of dairy products as an element of planning dairy companies'
strategies.
The study was based on an analysis of the review of domestic and foreign literature as well as
examples of good practices of dairy cooperatives in Poland.
2. Investments in the Dairy Industry in Poland
The inflow of foreign capital to Polish dairy came along with Poland's accession to the EU. There
was a slight increase in the export of products to the EU market, but there was a large opening of the
Polish market to foreign direct investments. Prior to joining the European Union, Belarus was the
main export destination for Poland (82% of exports) and Russia (16%). However, the first foreign
investments appeared in Poland already in 1993 when Hochland started the construction of a cheese
production plant in Kazimierz near Poznań. In 1999, Turek District Dairy Cooperative sold 66% of
shares to Bongrain S.A. As a result, until 2000 Polish foreign investment was owned by Nestle S.A.,
Danone, Raisio Group, Nutricia, Golden Vale plc, Charleville CO. Cork.
In the years 2008 - 2009, there was a very intense increase in the inflow of foreign direct
investment (Figure 1). The first transnational corporations that have invested in milk processing in
Poland are Danone, Lactalis, Arla Foods and Bongrain
In 2010, there was a slight decline in foreign investment due to the economic crisis and then from
2014 a recovery. Only Mlekovita in 2009 invested / opened a plant for the production of mozzarella in
Kaliningrad and in 2011 started the construction of a powdered milk production plant in Shanghai.
In the trading structure in Polish dairy products, powdered milk, butter and cheese play an
important role.
Source: Own study based on data from the Polish Federation of Cattle Breeders and Milk Producers
Figure 1. The Inflow of Foreign Direct Investments to The Milk Processing Sector in Poland
in the Years 1996-2016 (EUR million)
0
5
10
15
20
25
19
96
19
97
19
98
19
99
20
00
20
01
20
02
20
03
20
04
20
05
20
06
20
07
20
08
20
09
20
10
20
11
20
12
20
13
20
14
20
15
20
16
20
17
20
18
mln EUR
E. Stawicka
121
Polish dairying have turned many segments of the milk market into the hands of foreign
companies, among others, the segment of children's nutrients, ice cream and milk productswhich has
the highest profitability. For example, when in 1998 a German company, Zott, appeared on the Polish
market, it launched an intensive expansion on the Polish market and gained about 20% share in the
yoghurt market (Pietrzak, 2002).
Currently, Polish dairy cooperatives are very slow retakingthis market. In comparison to other
sectors of the food industry in Poland, the share of transnational corporations in revenues from sales of
the dairy industry is at a rather low level. The decline in the importance of corporations in milk
processing may also result from the fact of rebuilding a strong position by companies with domestic
capital such as Mlekowita or Mlekpol, offering consumers innovative products of high quality and
competitive prices (Wieczorkowski, 2015).
3. Production and Consumption of Milk in Poland
The relatively high milk prices on the market are due to the growing demand for milk in
developing countries. When it comes to production, the largest producers of cheese in the world are
USA, Germany, France, Italy, the Netherlands and Poland, total production in these countries
constitutes 61% of world production. In turn, the largest butter producers in the world are USA, New
Zealand, Germany, France, Russia, Turkey and Poland, together they produce over 50% of world
production. The largest producers of skimmed milk powder are USA, New Zealand, Germany, France
and Austria, which together provide 60% of world production (FAMMU/FAPA, 2019).
In the Polish milk processing sector in the years 1991-2016, the highest production dynamics
occurred in the milk drinks segment, their production increased almost 8-fold, then cheese (also
melted), over 5-fold increase, and almost a three-fold increase in the production of ripening cheeses
and curd. The total production of cheese increased in Poland from 292,000 tonnes in 1991 to 858
thousand tons in 2016, the share of Polish cheese production in global production ranged from 2 to 4%
and in European production from 4 to 7%. The share of Polish butter production in global production
in the years 1990-2016 ranged from 3 to 5% and on the European markets from 5 to 8%. In contrast,
the production of powdered milk in Poland in 1991-2016 decreased by 26%, and skimmed powdered
milk increased by 10%. In the analyzed period, the share of Polish production of skimmed powdered
milk in global production was at the level of 3 to 5% and in Europe's production from 6 to 11%
(Baran, 2019).
Global consumption of milk and its products is on the rise. In the world, North America, Europe
and Oceania have the largest per capita consumption tendency. The largest (two-fold) increase in milk
consumption per capita was recorded in Asia, where there was an improvement in income and food
standards, then in Latin America by 41%, Central America by 19% and Africa by 20% (Rynek Mleka,
2019).
According to IERiGŻ_PIB (2018) data, in comparison with other food products the dynamics of
milk consumption in the world is smaller than in comparison to meat and fish products. However, in
Europe, especially in the years 1990-2013, the situation was slightly different than in the world and the
consumption of dairy products increased from 228 kg per person to 236 kg, while the meat
consumption fell from 85 kg per person to 81 kg. Europe also has the highest consumption of butter,
both in terms of overall consumption and per capita. Despite the fact that in the years 1990-1995 there
was a more than 30-times percentage drop in butter consumption from 5.6 to 3.4 kg per capita in later
years, the consumption remained on average at 3.3 kg per capita. The reason for the smaller
consumption of butter were discussions and research results on the harm of milk fats, but by 2014 the
consumption of butter increased on all continents. In Poland, the consumption of cow's milk per capita
in liters was growing (Figure 2).
The highest consumption of milk in Poland occurred in the mid-1980s and was at a level of 260-
280 l per person. At the beginning of the 1990s, the real income of the population decreased and food
prices increased, which led to a reduction in consumption, including dairy products. However, since
2006, an increase in domestic milk consumption has been observed. As a consequence, in Poland the
consumption of milk and its products decreased from 280 liters in 1986 to 226 per person in 2018. The
current consumption of milk and its products in Poland is one of the smallest in the European Union. It
is forecasted that with the increase in consumer incomes in Poland, the demand for high processed
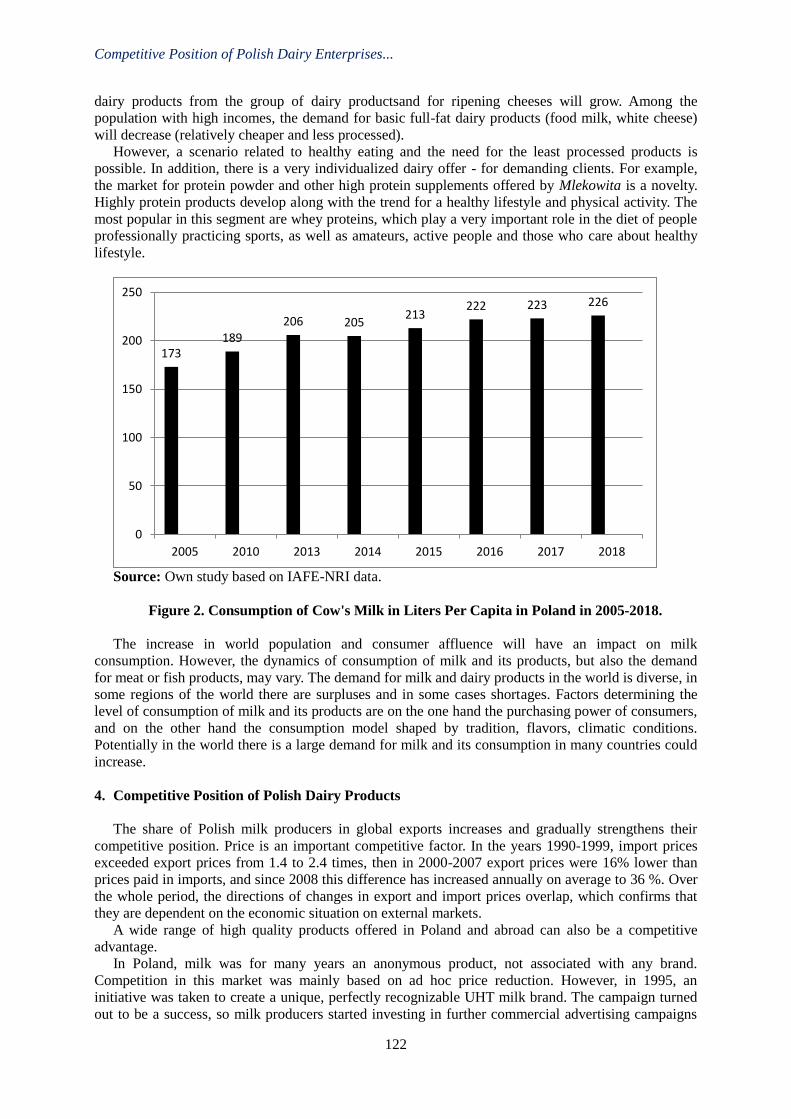
Competitive Position of Polish Dairy Enterprises...
122
dairy products from the group of dairy productsand for ripening cheeses will grow. Among the
population with high incomes, the demand for basic full-fat dairy products (food milk, white cheese)
will decrease (relatively cheaper and less processed).
However, a scenario related to healthy eating and the need for the least processed products is
possible. In addition, there is a very individualized dairy offer - for demanding clients. For example,
the market for protein powder and other high protein supplements offered by Mlekowita is a novelty.
Highly protein products develop along with the trend for a healthy lifestyle and physical activity. The
most popular in this segment are whey proteins, which play a very important role in the diet of people
professionally practicing sports, as well as amateurs, active people and those who care about healthy
lifestyle.
Source: Own study based on IAFE-NRI data.
Figure 2. Consumption of Cow's Milk in Liters Per Capita in Poland in 2005-2018.
The increase in world population and consumer affluence will have an impact on milk
consumption. However, the dynamics of consumption of milk and its products, but also the demand
for meat or fish products, may vary. The demand for milk and dairy products in the world is diverse, in
some regions of the world there are surpluses and in some cases shortages. Factors determining the
level of consumption of milk and its products are on the one hand the purchasing power of consumers,
and on the other hand the consumption model shaped by tradition, flavors, climatic conditions.
Potentially in the world there is a large demand for milk and its consumption in many countries could
increase.
4. Competitive Position of Polish Dairy Products
The share of Polish milk producers in global exports increases and gradually strengthens their
competitive position. Price is an important competitive factor. In the years 1990-1999, import prices
exceeded export prices from 1.4 to 2.4 times, then in 2000-2007 export prices were 16% lower than
prices paid in imports, and since 2008 this difference has increased annually on average to 36 %. Over
the whole period, the directions of changes in export and import prices overlap, which confirms that
they are dependent on the economic situation on external markets.
A wide range of high quality products offered in Poland and abroad can also be a competitive
advantage.
In Poland, milk was for many years an anonymous product, not associated with any brand.
Competition in this market was mainly based on ad hoc price reduction. However, in 1995, an
initiative was taken to create a unique, perfectly recognizable UHT milk brand. The campaign turned
out to be a success, so milk producers started investing in further commercial advertising campaigns
173 189
206 205 213
222 223 226
0
50
100
150
200
250
2005 2010 2013 2014 2015 2016 2017 2018
E. Stawicka
123
for their own brands.
For example, the OSM Cooperative in Koło received the HALAL certificate for milk powders and
the possibility of exporting to Muslim markets and the prize in the Ranking of the Major Cooperative
Exporters of Dairy Products in 2017 (Koło, update date 17/07/2019).
An example can be Spomlek Cooperative, which operates in the HoReCa channel, it is an offer of
cheese in the restaurant menu, on cheese boards offered in hotels. Spomlek, through his cheese, strives
for the recommendations of the best chefs. “Amber”, “Ruby” and “Sapphire” cheesesaccording to
experts, are the best long-ripening Polish cheeses that are produced in Radzyń Podlaski under the
guidance of experienced cheese makers, according to traditional recipes. Dairy Cooperative Spomlek,
emphasizes its success through cooperation with suppliers, it distinguishes the most modern and most
prosperous farms and rewards high quality milk. The annual competition of cooperatives for suppliers
selects winners in three categories: farms from 50,000. up to 200,000 liters of milk per year, up to
360,000 and above 360,000 liters of milk per year. The main prizes for winners in individual
categories are cars (Spomlek, update date 17/07/2019).
The Piątnica cooperative offers demanding consumers a new Skyr yoghurt, made according to a
traditional recipe, adored, among others, by in Europe and the United States, an Icelandic dairy
product. The product is distinguished by high protein content, it is also free from fat. The product is
particularly desirable by consumers who lead an active and healthy lifestyle (Piątnica, update date
17/07/2019).
The Mlekpol cooperative also sells a significant part of its production for export, sending its
products to almost all countries of the world. They come to the European Union countries mainly to
Italy, France, Germany, the Netherlands, Belgium, Spain, the Czech Republic and Great Britain as
well as to Africa and the Far East. The export offer includes hard cheeses, skimmed milk powder,
butter and whey protein powder (Mlekpol, update date 17/07/2019).
Mlekowita in 2017 was appreciated by the President of the Republic of Poland in the 15th edition
of the Economic Award in the category "Responsible business". The value of exports in Mlekowita,
especially to Germany, constitutes over 20% of all exports, in 2017 it sold on the German market,
among others: 2,905 tons of hard ripening cheeses, 20,615 658 l of UHT milk, 2,620 tons of milk
powders, 175 tons of butter. In 2018, during the Gala, held during the International Trade Fair of Food
Products Polagra, Mlekowita was honored with the title “Leading Polish Food Exporter”. New on the
market is the competitive Mlekovita product in 100% natural, pure whey protein concentrate in two
variants: as Hercules WPC 80 and Super Body Active WPC 80. It is a rich source of wholesome
proteins (including BCAA amino acids), which include contribute to the growth and maintenance of
muscle mass, and calcium necessary for strong bones and healthy teeth. Especially recommended to
athletes, especially representatives of body sports, strength and endurance sports, practicing
bodybuilding or fitness, in which the demand for protein increases due to increased physical effort
(Mlekowita, update date 17/07/2019).
However, in the case of Polmlek Group, exports account for 30 to 40 percent of all production, sent
mainly to Arab countries, Asia, and also European Union countries. Foreign recipients include: EU,
Great Britain, USA, Russia, Sweden, Hong Kong, Israel, Finland, South Korea, Libya, India,
Kazakhstan, Georgia, Ukraine, China, Canada. The Polish company Polmlek Group is one of the main
suppliers of dairy products to LIDL in Poland and in the world (Polmlek, update date 17/07/2019).
Unfortunately, according to analyzes, the competitive position of the Polish dairy sector in the
international arena is getting weaker. The terms of trade index oscillated around 1, which means that
the purchasing power of exports relative to imports is not higher and this is probably due to the lack of
a clear improvement in price competitiveness. The reason for the situation is the strong competitive
position of the milk processing sector in the EU, which is strengthened by protectionist agricultural
policy and an extensive export support system (Baran, 2019). Polish dairy companies must look for
new sources of competitive advantage. New business models towards sustainable development may
become an element supporting the building of competitive advantage. Strategies related to socially
responsible production and consumption.
Competitive Position of Polish Dairy Enterprises...
124
5. Summary and Conclusions
1. The Polish dairy sector has changed from being anonymous to being a serious player on the
European Union market. The milk processing sector in Poland has increased the number of foreign
expansion markets from 51 to 125 countries.
2. The milk market is influenced by factors such as food expenditure, population in Poland and in
the world, conditions for purchasing milk, self-sufficiency, labor costs, costs of raw materials, and
business environment.
3. The accession to the European Union had a great impact on changes in the milk market in
Poland. New markets were opened, but also other product policy began to shape. In Poland, consumer
preferences are choosing products manufactured in Poland by domestic enterprises, which are very
good quality and affordable.
4. The largest population growth will occur in Africa, America and Asia, the population will
decrease only in Europe. The Polish dairy sector is competitive with global markets but not with the
European market.
5. Gaining competitive advantages of the Polish milk processing sector is possible thanks to the
modernization, restructuring and concentration of enterprises, which will contribute to the scale of
production and improve the use of processing potential. More product innovations are needed that also
better meet the needs of foreign consumers. Polish enterprises must seek new sources of competitive
advantages, including efficiency and productivity gains.
References
Baran J.(2019). The intensity and geographical scope of internationalization of the milk processing
sector.Wydawnictwo SGGW, Warszawa 2019.
Bocken, N. M. P., Short S.W., Rana P., Evans S. (2014). A literature and practice review to develop
sustainable business model archetypes. Journal of Cleaner Production 65 (2014): 42-56.
Czyżewski A., Guth M. (2016).Diversification of milk production in European Union macro-regions
with the distinction of Poland. Wydawnictwo naukowe PWN, Warszawa.
Fisk P.(2009).Business genius. Creative approach to company development.Oficyna Wolters Kluwer
business, Warszawa.
Mączyńska E, Pysz. P. (2010).Ideas of ordo and social market economy. Polskie Towarzystwo
Ekonomiczne, Warszawa.
Mierzwa D. (2011). Strategic choices of small and medium enterprises on the milk market. SERiA.
Poczta W., Pawlak K. (2007). Prospects for development of trade in dairy products in Poland about
European Union countries. Roczniki Nauk Rolniczych, Seria G, Ekonomika Rolnictwa, t.93, z. 2.
Pietrzak M. (2002).Competitive strategies of leading enterprises in the milk processing
sector.Wydawnictwo SGGW, Warszawa.
Pietrzak M, Szajner P. (2006).Report on the state and development prospects of the dairy industry in
Poland (In:) Raport o stanie i perspektywach przemysłu rolno-żywnościowego, Urban R. (Ed.)
Rada Gospodarki Żywnościowej przy MRiŻ, Białystok.
Wieczorkowski R. (2015). Rekonkwista, Food Market,Nb.4.
The Sustainability Leadership Report measuring perception vs. Reality for prominent global Brands,
2012.
Polska Federacja Hodowców Bydłą i Producentów Mleka, Rynek Mleka, VI, www.pfhb.pl, 2019
FAMMU/FAPA, http://www.portalspozywczy.pl/tagi/fammu-fapa, 27.08.2019.
www.ierigz.waw.pl
www.osmkolo.pl
www.spomlek.pl/
www. mlekpol.com.pl
www.mlekovita.com.pl/pl
polmlek.com/
3rdInternational Conference on Economic Research
24-25th October 2019, Alanya, Turkey
125
MARKET INTERACTIONS OF FARMS IMPLEMENTING A BIODIVERSITY
PROGRAM: POLISH CASE1
Marta Domagalska-Gredys
Agriculture University in Krakow, Poland, Email: [email protected]
Abstract
Attitudes and behavior of breeders in the exchange of knowledge testify to the condition of social
capital that has been chosen to achieve the objectives of the Convention on Biodiversity.
Contemporary economic theories (NEI, game theory, behavioral economics) confirm the
effectiveness of having a relationship. The sources of effective and optimal relations in economic
processes are increasingly looking for.
The aim of the research was to indicative factors affecting the exchange of knowledge between
farms with conservative breeds (of cows, pigs, and sheep) with institutions. The questionnaire
(between 145 farms in south-eastern Poland) presented opinions in a scale of 1–5 points.
Multiple regression was used to indentificate factors that most affected the exchange of knowledge.
The group of independent variables included x1 farmer's education, x2 direct production costs (PLN),
x3 farm income (PLN), x4% of farm sales contracting, x5 farm area (hectares), x6 experience in
farming animals of conservative breeds (years). Farmers rated the exchange of knowledge with
institutions (industry, consultancy and local government) on a scale of 1-5.
Research results indicate that the most important institutions in the exchange of knowledge were
agricultural advisory centers and industry organizations. Local government institutions from the
immediate surroundings (municipal offices) proved to be irrelevant. The multiple regression analysis,
in turn, shows that the exchange of knowledge with institutions was most significantly influenced by
the direct costs of farms and the education of the farmer.
The condition of the breeders of conservative animal breeds does not interfere with the
development of connections but also does not motivate for greater cooperation of farmers. From an
economic point of view, knowledge-based relationships are cost-effective. "knowledge costs before it
brings income".
The program of biodiversity protection of farm animal species requires from farmers the ability to
manage economic relations. The results indicate that Polish farmers implement a biodiversity program
for the protection of farmed animal species, creating the most numerous relationships with trade
unions and advisory institutions. The basis for exchange in relations is knowledge, which indicates the
constant need to educate and adapt the training offer by institutions supporting agriculture. The role of
institutions in supporting the processes of biodiversity development is constantly growing. Market
problems faced by farms with conservative breeds of animals require institutional support.
The quality of current relations between Polish breeders of conservative animal breeds does not
generate exceptional development opportunities. The state of relations does not interfere with the
development of connections, but also does not motivate for greater cooperation between farmers.
Keywords: Inter-Organizational Relations, Indicator of Intensity of Connections with the
Environment, Animal Genetic Resources Conservation Program.
1The abstract concerns the BIOSTRATEG2 / 297267/14 / NCBR / 2016 project, funded by the
National Center for Research and Development under the Biostrateg program entitled ‘Directions for
the Use and Conservation of Livestock Genetic Resources in the Conditions of Sustainable
Development’.
3rdInternational Conference on Economic Research
24-25th October 2019, Alanya, Turkey
126
LYCIAN PENTECONTERS: ANTIQUE MESSAGES IN COINS
Serdar Aslan
Alanya Alaaddin Keykubat University, ALTSO Vocational School, Turkey
Email: [email protected]
Abstract
The well known main functions of money in economics literature have been accepted as a medium
of exchange, a unit of account, a store of value. In addition, the historical process of money has been
shown significant knowledge from past to today in terms of economic development. Especially
symbols and figures on coins have been provided visual contribution from early ages. This work is an
attempt to show technological changes on Penteconters in Lycian time by using a visual presentation
of art on money.
Penteconter representations, which are noteworthy in the coins examined within the Lycian Coins,
transmit the hydrodynamic and aerodynamic developments of B. C. 5th century Lycian penteconters
in a chronological process. The possible appearances of Lycian Penteconters of the 5th century were
shaped by ceramic material and were colored with pottery pigmented, cooked at 900 C, sized as a
result of two years of studies.
In the Lycian Coins other important examples are called the Apollo Coins. On the front of the
Apollo coins there is a man's head interpretation depicted in the profile, which contains characteristic
Apollonian elements and at the back there is a penteconter shaped from the starboard side.
In this exhibition, I have shaped the Pentecontersand human profiles which are on the coins, in a
three-dimensional form to be able to observe them. The anthropological characteristics of the sculpted
characters became clear and also they appeared to different people. The Penteconters side coins shows
the cronical changes on the ship techonolgyin Lycia time.
Keywords: Antic Coins, Lycia, Penteconters, Economics History, Economics and Arts.
3rd International Conference on Economic Research
24-25th October 2019, Alanya, Turkey
127
THE IMPACT OF SMES ON ECONOMIC GROWTH OF AZERBAIJANI
ECONOMY: ENDOGENEITY AND LATENT INSTRUMENTAL VARIABLE
Samir Orujov
ADA University, Department of Economics, Azerbaijan
Email: [email protected]
Abstract
The relationship between SMEs and economic growth has been a centerpiece of public and
scientific debates for the last several decades. There are two mainstream theories regarding the
relationship of the two phenomena one of which is so called “modern theory” of SMEs mainly due to
efforts of Berry and Mazumdar (1991) and Levy and Powell (1998). The proponents of the modern
theory emphasize the significant role of SMEs in economic development relying on the stylized facts
from European and other developed countries (Tambunan 2014). The second, so called “classical
theory” of SMEs developed mainly by Hoselitz (1959), Fisher (1967) and Anderson (1982) stresses
that SMEs are not important at all in economic development, and rather any country should assist big
enterprises with a bright future to achieve economic development because such organizations are
going to predominate in the long run (Brako 2014).This diversity of opinions regarding the
relationship of SMEs and economic growth is probably due to the endogeneity issue which arises in
the context of bidirectional flow of causality between the two variables of interest. The second issue in
determining the causal effect of SMEs on economic growth we have identified after a careful review
of the literature, is mainly due to overreliance on cross-country data of SMEs. For example, Beck,
Demirguc-Kunt, and Levine (2005) use newly constructed database onthe share of total manufacturing
employment accounted for by SMEs to examine the relationship(Ayyagari, Demirgüç-Kunt, and Beck
2003). Such cross-country regressions are criticized on the grounds of the large differences among
countries and impossibility of viewing them as being drawn from the same population (Levine and
Zervos 1993).The third issue we have identified is due to the lack of the relevant instruments to use in
instrumental variables regression as mentioned by Beck, Demirguc-Kunt, and Levine (2005).
Considering all the issues identified so far, we seek to evaluate the effect of SMEs on economic
growth of Azerbaijan using the panel data of such enterprises operating in 11 different sectors of the
economy. Azerbaijan, being a post-Soviet country has invested a lot of resources in the development
of its SME sector since its independence, and it is crucial to know whether such kind of policies are
important for economic growth at all.
Moreover, to estimate the parameters we use latent instrumental variable (LIV) approach due to
Ebbes(2004) and Ebbes, Wedel, and Böckenholt(2009) to get rid of the burden of the search for useful
instruments.More precisely, the LIV model has the following form:
𝑙𝑜𝑔(𝑝𝑐𝑔𝑑𝑝𝑖𝑡) = α0 + α1𝑙𝑜𝑔(𝑆𝑀𝐸𝑖𝑡) + Γ𝑋𝑖𝑡 + ϵ𝑖𝑡
𝑙𝑜𝑔(𝑆𝑀𝐸𝑖𝑡) = Π𝑍𝑖𝑡 + 𝑣𝑖𝑡 In the above equation, 𝑙𝑜𝑔(𝑝𝑐𝑔𝑑𝑝𝑖𝑡) is logarithmic transformation of the contribution of sector “i”
to per capita GPD at time “t”. Moreover, 𝑙𝑜𝑔(𝑆𝑀𝐸𝑖𝑡) stands for the number of employees of SMEs in
sector “i” normalized by the total labor in that sector at time “t”. Then, 𝑋𝑖𝑡 is a set of control variables
related to general business environment in sector “i” at time “t”. Finally, ϵ𝑖𝑡 is error term, α0𝑎𝑛𝑑α1 are
coefficients (α1 being the coefficient of interest) and Γ is a vector of coefficients to be estimated. The
second equation describes the relationship between the endogenous variable and set of discrete and
unobserved instruments selected according to a specific procedure described in Ebbes(2004).
We believe that this study is novel, because to the best of our knowledge, no one has investigated
SME and economic growth relationship in the context of Azerbaijan, even though there are many
studies on SME and economic growth relationship per se. Indeed, the latter studies have been
criticized on the grounds that the conclusions drawn about policy and growth relationships from cross-
country regressions are invalid because of huge differences among countries(Levine and Zervos
1993).
The Impact of SMEs on Economic Growth...
128
The second distinct feature of this study is comprised in the fact that it is the first study analyzing
the SME and economic growth relationship using LIV methodology in the framework of panel data of
11 economic sectors of Azerbaijan.
Ultimately, we would like to re-emphasize the importance of the analysis of SME and economic
growth relationship in the context of Azerbaijan economy considering the tremendous effort put in the
SME development by the latter in the last few decades.
Keywords: Small and Medium Enterprises, Economic Growth,Azerbaijan,Latent Instrumental
Variable (LIV),Economic Sectors.
References
Anderson, Dennis. 1982. “Small Industry in Developing Countries: A Discussion of Issues.” World
Development 10 (11): 913–48. https://doi.org/10.1016/0305-750X(82)90034-1.
Ayyagari, Meghana, Asli Demirgüç-Kunt, and Thorsten Beck. 2003. “Small and Medium Enterprises
Across the Globe: A New Database.” SSRN Scholarly Paper ID 636547. Rochester, NY: Social
Science Research Network. https://papers.ssrn.com/abstract=636547.
Beck, Thorsten, Asli Demirguc-Kunt, and Ross Levine. 2005. “SMEs, Growth, and Poverty.”
Working Paper 11224. National Bureau of Economic Research. https://doi.org/10.3386/w11224.
Berry, Albert, and Dipak Mazumdar. 1991. “Small-Scale Industry in the Asian-Pacific Region.”
Asian-Pacific Economic Literature 5 (2): 35–67. https://doi.org/10.1111/j.1467-
8411.1991.tb00048.x.
Brako, Evans. 2014. “ASSESSING THE CONTRIBUTIONS OF SMALL AND MEDIUM SIZED
ENTERPRISES TO GHANA’S ECONOMIC GROWTH,” 14.
Ebbes, P. 2004. “Latent Instrumental Variables: A New Approach to Solve for Endogeneity.” s.n.
https://www.rug.nl/research/portal/en/publications/latent-instrumental-variables(2bb49ff4-cfff-
4dcb-bc51-544f0ca9f823).html.
Ebbes, Peter, Michel Wedel, and Ulf Böckenholt. 2009. “Frugal IV Alternatives to Identify the
Parameter for an Endogenous Regressor.” Journal of Applied Econometrics 24 (3): 446–68.
https://doi.org/10.1002/jae.1058.
Fisher, Douglas. 1967. “Modern Small Industry for Developing Countries: A Paradox in Planning
Economics.” Edited by Eugene Staley and Richard Morse. Economic Development and Cultural
Change 15 (3): 341–46.
Hoselitz, Bert F. 1959. “Small Industry in Underdeveloped Countries.” The Journal of Economic
History 19 (04): 600–618.
Levine, Ross, and Sara J. Zervos. 1993. “What We Have Learned about Policy and Growth from
Cross-Country Regressions?” American Economic Review 83 (2): 426–30.
Levy, Margi, and Philip Powell. 1998. “SME Flexibility and the Role of Information Systems.” Small
Business Economics 11 (2): 183–96.
Tambunan, Tulus. 2014. “Micro, Small and Medium Enterprises and Economic Growth,” 25.
3rdfInternational Conference on Economic Research
24-25th October 2019, Alanya, Turkey
129
DIGITAL ECONOMY: OPPORTUNITIES AND FUTURE CHALLENGES OF
ISLAMIC ECONOMY IN INDONESIA
Shinta Maharani
The State Institute of Islamic Studies Ponorogo, Indonesia, Email: [email protected]
M. Miftahul Ulum
The State Institute of Islamic Studies Ponorogo, Indonesia
Abstract
The emergence of technological innovation and economic digitalization through social media or
shopping applications affects economics and social activities of the community. The economic system
has changed from a conventional manual to a modern one. A simple conception of a digital economy
is part of economics output that incorporates internet-based multipurpose technology applied in a
varied digital business model of goods or services. Islamic economy support for the growth of
financing through the digital economy and empowerment by the Islamic economy, it needs to be
encouraged and maximized its role in e-commerce. Principle-based regulation can be one of the roles
that can be taken in developing halal product innovations that are trending through the digital
economy platform. With this technology, it is expected to be able to improve the sector of Islamic
economy growth in Indonesian society. The Islamic economy is expected to be a bridge in the
direction of financial inclusion in the digital economy, such as; (a) platform affordability in the
unbanked segment, (b) strong collaboration between Islamic financial service providers through digital
economy, (c) widespread digitalized Islamic banking practices, and (d) media for regulators of Islamic
economy development, and (e) ladder to no longer be at the level of Small Enterprise but through
start-up.
This study uses a quantitative approach with Muslim Indonesian as populations; samples are taken
randomly using questionnaires as a research instrument, and then tested by statistical methods. Finding
of this paper show that efforts to foster entrepreneurship, innovation, and economic growth, can be an
opportunity to expand access, especially to Islamic economy inclusion. Besides, the digital economy is
also expected to be a vehicle for sharing information in improving public services, funds or social
services. The digital economy expected to have an opportunity to provide prime, fast and affordable
Islamic economy services to all levels of society and makes economy activity efficiency and
effectiveness.
Keywords: Islamic Economy, Digital Economy, Economic Growth.
1. Introduction
The emergence of technological innovation and economic digitalization through social media or
shopping applications affects the economic and social activities of the community. The economic
system has changed from a conventional manual to a more modern one. A simple conception of a
digital economy, although not yet standard, is part of economic output that incorporates internet-based
multipurpose technology applied in a varied digital business model of goods or services. Islamic
economic support for the growth of financing through the digital economy and empowerment of the
national economy by the Islamic economy needs to be encouraged and maximized its role in e-
commerce. Principle-based regulation can be one of the roles that can be taken in developing Islamic
product innovations that are trending through the digital economy platform. With this technology, it is
expected to be able to improve the sector of Islamic economic growth in Indonesian society, with
which, the Islamic economy is expected to be a bridge in the direction of financial inclusion in the
digital economy, such as; (a) platform affordability in the unbanked segment, (b) strong collaboration
between Islamic financial service providers through the digital economy, (c) widespread digitalized
Islamic banking practices, and (d) media for regulators of Islamic economic development, and (e)
ladder to no longer be at the level of MSME but through start-up. Efforts to foster entrepreneurship,
innovation, and economic growth, can be an opportunity to expand access, especially to Islamic
Digital Economy: Opportunities and Future…
130
economic inclusion. Besides, the digital economy is also expected to be a vehicle for sharing
information in improving public services, funds or social services and new technologies that are
expected to have an opportunity to provide prime, fast and affordable Islamic economic services to all
levels of society. Shopping for products by utilizing the e-commerce market is one example of the
ease of community activities in the digital economy. This activity makes the efficiency and
effectiveness of time on the side-lines of work activities that consume attention and extra energy,
however, in reality, not all people feel the convenience and are helped by using digital economic
applications or promotion of products through social media, this is due to the affordability of
economic technology digital that has not been utilized by all levels of society. To know and analyze
this phenomenon, it is deemed necessary to further research related to this, especially Islamic
economic policy based on standard classification and its application.
2. Formulation of the Problem
The formulation of the problem in this paper is described as follows:
1. How does the digital economy influence the future opportunities of the Islamic economy?
2. How does the digital economy influence the future challenges of the Islamic economy?
3. What is the effect of the digital economy on the challenges and future opportunities of the
Islamic economy simultaneously?
3. Research Purposes
The purpose of this paper is described below:
1. To analyze the effect of the digital economy on the future opportunities of Islamic economics
2. To analyze the effect of the digital economy on the future challenges of Islamic economics
3. To analyze the effect of the digital economy on the opportunities and challenges of the Islamic
economy?
4. Literature Review
Kotler argues that there are things that affect sales volume, namely the presence of online
applications that are connected through the internet network where consumers and business people can
easily interact between directly, (Philip Kotler: 2005; 2). Meanwhile, according to Basu Swastha, there
are three things, namely: type of goods, price, distribution, and promotion are factors that can affect
sales volume, (Basu Swastha: 2001; 127-128). According to Daryanto, promotion is a one-way flow of
information that directs the organization or someone intending to influence sales, (Ayu Sri Rahayu:
2018; 6). Meanwhile, according to Danang Sunyoto, promotion is a combination of advertising,
publicity, face-to-face sales, public relations, and sales promotions, intending to increase a company's
sales volume. (Danang Sunyoto: 2015; 152). This indicates that the digital economy makes
promotional media have a wider reach. The same thing was stated by Basu Swastha that the sales
volume was influenced by the giving of gifts, promotions, campaigns, and demonstrations, (Basu
Swastha: 2001; 131). Based on the theories that have been described, it can be concluded that if people
use digital applications through social media or shopping applications, economic activity will increase.
Bloomberg's global research said that by 2020 there were more than half of Indonesian people likely
involved in e-commerce activities. (Liputan6.com: 2019 at 9:35). This is in line with Ernst & Young's
analysis, in his research suggesting that in Indonesia each year, the growth in the value of sales of the
digital economy has increased by around 40%. In 2020 it will increase gross domestic income by 22%,
through the Indonesian online business revolution. (Kominfo.go.id:2019).
Based on these data, research is needed to explain the actual gap that is felt by the community in
digital economic activities, given the potential development of digital applications both through social
media and large shopping applications, the opportunity to support the development of the online
digital economic industry in Indonesia through the Islamic economy. From this, the authors submit a
paper by taking the title "Digital Economy: Future Opportunities and Challenges against Islamic
Economics in Indonesia". The standard instrument for digital economic assessment is website quality,
through several indicators used: (Ni Made Savitri and Ni Nyoman Kerti: 2012; 332)
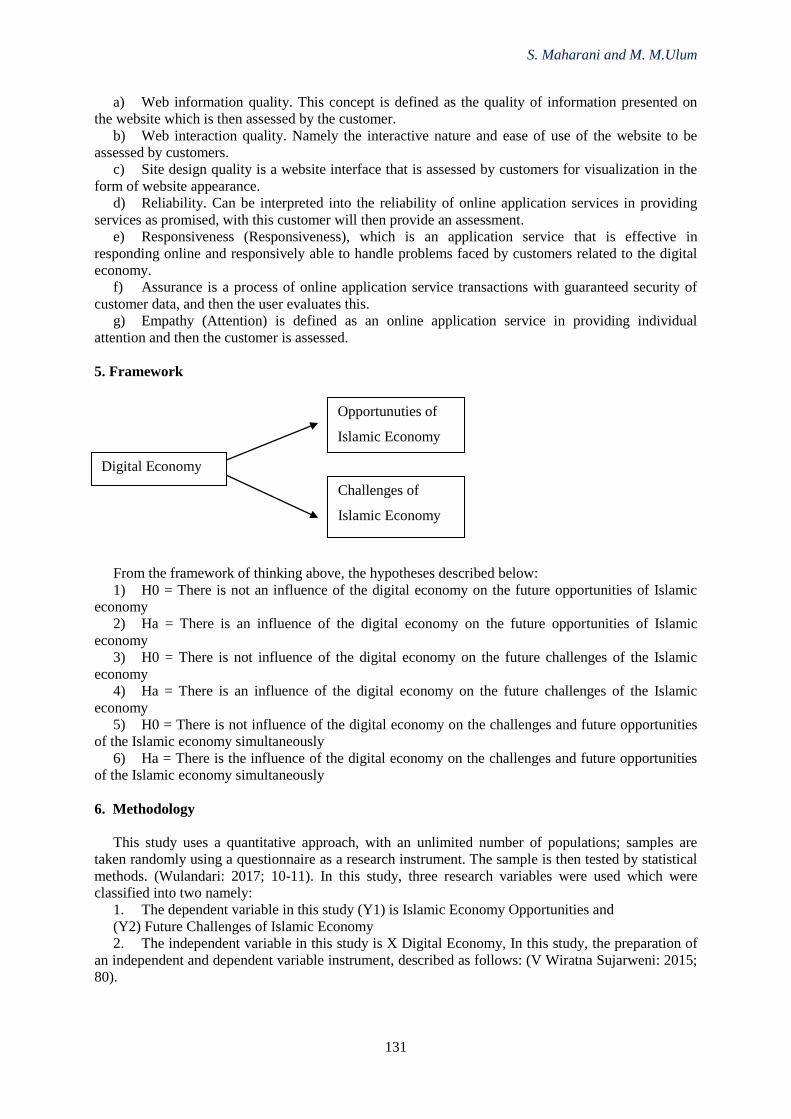
S. Maharani and M. M.Ulum
131
a) Web information quality. This concept is defined as the quality of information presented on
the website which is then assessed by the customer.
b) Web interaction quality. Namely the interactive nature and ease of use of the website to be
assessed by customers.
c) Site design quality is a website interface that is assessed by customers for visualization in the
form of website appearance.
d) Reliability. Can be interpreted into the reliability of online application services in providing
services as promised, with this customer will then provide an assessment.
e) Responsiveness (Responsiveness), which is an application service that is effective in
responding online and responsively able to handle problems faced by customers related to the digital
economy.
f) Assurance is a process of online application service transactions with guaranteed security of
customer data, and then the user evaluates this.
g) Empathy (Attention) is defined as an online application service in providing individual
attention and then the customer is assessed.
5. Framework
From the framework of thinking above, the hypotheses described below:
1) H0 = There is not an influence of the digital economy on the future opportunities of Islamic
economy
2) Ha = There is an influence of the digital economy on the future opportunities of Islamic
economy
3) H0 = There is not influence of the digital economy on the future challenges of the Islamic
economy
4) Ha = There is an influence of the digital economy on the future challenges of the Islamic
economy
5) H0 = There is not influence of the digital economy on the challenges and future opportunities
of the Islamic economy simultaneously
6) Ha = There is the influence of the digital economy on the challenges and future opportunities
of the Islamic economy simultaneously
6. Methodology
This study uses a quantitative approach, with an unlimited number of populations; samples are
taken randomly using a questionnaire as a research instrument. The sample is then tested by statistical
methods. (Wulandari: 2017; 10-11). In this study, three research variables were used which were
classified into two namely:
1. The dependent variable in this study (Y1) is Islamic Economy Opportunities and
(Y2) Future Challenges of Islamic Economy
2. The independent variable in this study is X Digital Economy, In this study, the preparation of
an independent and dependent variable instrument, described as follows: (V Wiratna Sujarweni: 2015;
80).
Digital Economy
Opportunuties of
Islamic Economy
Challenges of
Islamic Economy
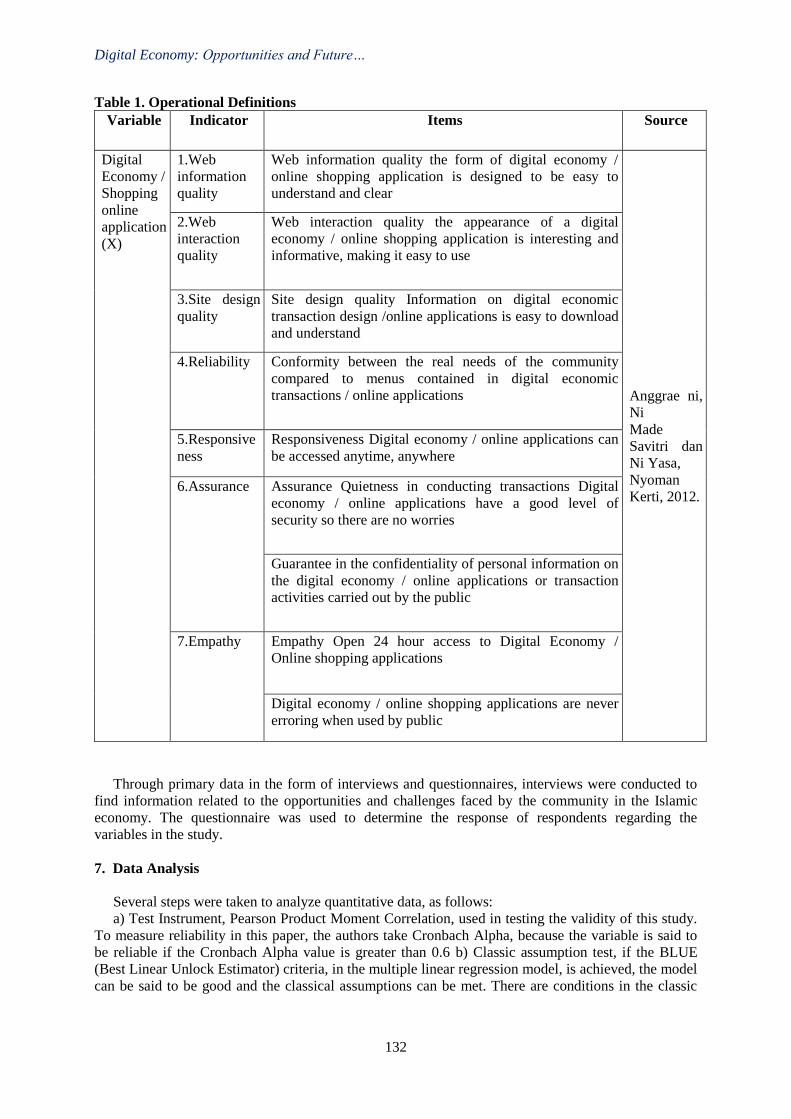
Digital Economy: Opportunities and Future…
132
Table 1. Operational Definitions
Variable Indicator Items
Source
Digital
Economy /
Shopping
online
application
(X)
1.Web
information
quality
Web information quality the form of digital economy /
online shopping application is designed to be easy to
understand and clear
Anggrae ni,
Ni
Made
Savitri dan
Ni Yasa,
Nyoman
Kerti, 2012.
2.Web
interaction
quality
Web interaction quality the appearance of a digital
economy / online shopping application is interesting and
informative, making it easy to use
3.Site design
quality
Site design quality Information on digital economic
transaction design /online applications is easy to download
and understand
4.Reliability Conformity between the real needs of the community
compared to menus contained in digital economic
transactions / online applications
5.Responsive
ness
Responsiveness Digital economy / online applications can
be accessed anytime, anywhere
6.Assurance Assurance Quietness in conducting transactions Digital
economy / online applications have a good level of
security so there are no worries
Guarantee in the confidentiality of personal information on
the digital economy / online applications or transaction
activities carried out by the public
7.Empathy Empathy Open 24 hour access to Digital Economy /
Online shopping applications
Digital economy / online shopping applications are never
erroring when used by public
Through primary data in the form of interviews and questionnaires, interviews were conducted to
find information related to the opportunities and challenges faced by the community in the Islamic
economy. The questionnaire was used to determine the response of respondents regarding the
variables in the study.
7. Data Analysis
Several steps were taken to analyze quantitative data, as follows:
a) Test Instrument, Pearson Product Moment Correlation, used in testing the validity of this study.
To measure reliability in this paper, the authors take Cronbach Alpha, because the variable is said to
be reliable if the Cronbach Alpha value is greater than 0.6 b) Classic assumption test, if the BLUE
(Best Linear Unlock Estimator) criteria, in the multiple linear regression model, is achieved, the model
can be said to be good and the classical assumptions can be met. There are conditions in the classic
S. Maharani and M. M.Ulum
133
assumption test, among others: autocorrelation test, multicollinearity test, and heteroscedasticity test,
and linearity test, normality test. (Wulandari: 2017; 55).
c) Multiple Correlation Analysis, product-moment Pearson correlation analysis is used as a
multiple correlation test in this study, the correlation is positive if Pearson correlations and r count
values are positive.
d) Coefficient of Determination, to know the percentage of the effect of e simultaneously on the
dependent variable, the coefficient of determination test is used in this study. The coefficient of
determination in this paper is seen from the value of R square and Adjust R Square in the model
summary table.
e) Hypothesis testing, the t-test in this study was used to explain whether the variable (X1) of the
Digital Economy individually influenced the dependent variables in this paper, namely: (Y1) Islamic
Economy Opportunities and whether the variable (X1) of the Digital Economy individually influenced
the other dependent variables in this paper (Y2) Future Challenges of Islamic Economy. The F test in
this paper is used to explain whether the variable (X1) Digital Economy influences the dependent
variable in this paper (Y1) Islamic Economic Opportunities and (Y2) Future Challenges of Islamic
Economy simultaneously (together).
8. Results and Discussion
1. The Effect of the Digital Economy on the Future Opportunities of the Islamic Economy
Nowadays the development of information and communication technology has made various
updates on various lines of life; Islamic banking and Islamic entrepreneurs are expected to be able to
answer these opportunities at the practical level in pioneering and managing Islamic entrepreneurial
businesses in anticipation of limited employment. Today's digital economy gives Islamic economy
opportunities to be able to take full advantage, especially in the area of Islamic banking which is
starting to show its stretch. Ease, comfort, speed, efficiency, security, and flexibility of economic
transactions are expected to be able to be obtained from the use of the digital economy so wide
community can run their business even though they have high mobility. Economic activities such as
online payment transactions are not only easy because they can be carried out by sellers/producers as
well as from buyers/consumers who are all included in Islamic entrepreneurs, but also involve Islamic
banking, so both parties have easy access to make transactions with the aim of Islamic economy
activities would increase periodically. According to the results of the previous test, the significance
value of the variable is 0.00 <0.05 and the value of t count> t table is 3.756> 1.6595 so that H_0 is
rejected and H_1 be accepted. This means that the digital economy variable partially influences the
economic opportunities of Islamic to widen and flap its wings.
Meanwhile, the digital economy has access for 24 hours, it means this can be done whenever and
wherever the usage space of digital economy applications is flexible so anyone who makes transaction
could immediately do so and also pay it. In conventional sales, systems are difficult to find it because
consumers are required to go to the market or conventional shop and if they desire a transfer system,
the buyer must come to the bank or through an ATM. In general, buyers/consumers feel reluctant,
especially if they have important activities which difficult to leave, it would increase the failure
possibility of purchase transactions. The digital economy is gradually anticipating this matter, trying to
maintain the trust of consumers/buyers by giving a good impression in trust between two parties so
that Islamic economy transactions and activities could increase and the opportunities can be utilized
optimally.
2. The influence of the digital economy on the future challenges of Islamic economy
One of the result of technological developments in the field of communication is social media. One
part of economic activity in the digital economy is sales through social media.
These economic activities include promotion through social media, and this is also one of the
challenges in the future of Islamic economy: how to make social media "work" because it has a very
wide network and access almost every time. Based on the results of previous tests stated that the
obtained variable significance value of 0.00 <0.05 obtained the value of t arithmetic> t table is 6.069>
1.6595 so that, H_0 is rejected and H_1 is accepted. This result means that the digital economy
variable partially influences the Islamic economy challenge variable. The majority of Muslim
Digital Economy: Opportunities and Future…
134
consumers currently carry out Islamic economy activities through the digital economy. The digital
economy has formed a new marketing space whose scope is very accurate, fast and broad. Personal
marketing networks can be formed by producers/sellers with Muslim consumers, while
sellers/producers could directly build and introduce their products to the "world" with a "finger"
through the digital economy. One of the promotion challenges is interesting content to getting
attention from the customer. Another challenge for Islamic economy, how to make
consumers/communities interested in carrying out with Islamic economic activities, both Islamic
entrepreneurs and Islamic banking, they must be able to prove that economic activities are worthy
transactions with quality of goods because it urgent things so Muslim consumers do not feel cheated or
disappointed. This is very important because in this digital economic system the physical form of the
product is indirect and tangible, buyers/consumers cannot see and know it
3. The influence of the digital economy on the challenges and future opportunities of the Islamic
economy simultaneously
According to Basu Swastha, other factors such as advertising, demonstration, campaign, and gift-
giving, are things that affect sales, because it is expected with these factors consumers will make
economics activities again and again, so that Islamic entrepreneurs and Islamic banking would be able
to take advantage of opportunities as well as answer the challenges and finally the wheels of Islamic
economic growth could accelerate. Based on the results of previous tests, the significance value
obtained 0.00 <0.05 and the calculated F value> F table is 63.444> 3.93. This shows that H_0 was
rejected and H_1 was accepted. This means, the digital economy simultaneously influences (together)
the challenges and opportunities of Islamic economics.
Islamic economists must be able to translate about digital economy development which also
provides new opportunities and challenges that are not easy. The ability to adapt will be able to make
Islamic entrepreneurs and Islamic banking develops rapidly, because the main key to economic
transactions both online and conventional is honesty and trust between producers/sellers and
consumers/buyers, so it should be prioritizing and maintaining Islamic economy values and principles
well. There are several important things in this paper as evaluation and improvement to be better
formulation for Islamic entrepreneurs and Islamic banking, include:
1) To increase Islamic economy activities, Islamic economists should try hard effort to answer
the challenges of the digital economy as well as opportunities itself.
2) The enormous potential possessed by the digital economy is social media expected to be able
to maximize the productivity and value of benefits that could be taken for Islamic economists through
Islamic entrepreneurs and Islamic banking.
3) One of the challenges for the Islamic economy is expected to be able to well adapt to the
digital economy today. In various lines of life and business fields, the Islamic economy is developing
rapidly along with the entry of information and communication technology that offers easy access to
various lines of life. New Islamic business sectors that have sprung up, especially those using online
systems need new business strategies so the Islamic economy could develop. Dynamic competition
also requires high adaptability so Islamic economic activities could learn and not lag behind
competition, it just because the true use of the digital economy is only a small simulation of the large
changes in economic activity out there. Based on the explanation above, an in-depth evaluation is
needed; this is related to the obstacles faced in implementing the digital economy in Indonesia.
Furthermore, Islamic entrepreneurs and Islamic banking are expected to constantly evaluate strategies
in stages to read opportunities and respond to the challenges of the digital economy. This paper has
limitations because of adoption from research with the same theme of analysing the factors that affect
sales volume consisting of two variables, use of an online banking application and promotion through
social media.
9. Conclusions
Based on the discussion above, there are important things that need to be underlined as follows:
1) The development of digital economy service features are expected to support Islamic economy
activities to increase Islamic economy transactions.
S. Maharani and M. M.Ulum
135
2) The great potential of the digital economy that supports economy activities in Islamic
entrepreneurs and Islamic banking is expected to be a solution to the general problems faced at the
practical technical level in conventional economy transactions.
3) Creativity in promoting is urgently needed, by utilizing social media optimization to increase
Islamic economy transactions.
4) Islamic Economy is expected to be able to answer challenges utilizing good management
through the use of digital economy applications with the credibility of the payment system through
promotion to increase Islamic economy transactions.
5) Islamic economy is also expected to be able to read opportunities and also respond to
challenges of internet networks, social media and their digital applications as well as devices in other
digital economy, given the enormous benefits in using the internet, applications and other social media
if they managed properly, especially in the field of Islamic entrepreneurship and Islamic banking.
6) Digital economy users should get priority trust and honesty, especially in the case of payments
using the online system, and to Islamic institutions that already trusted such as Islamic banking,
costumer should achieve data security.
References
Anggraeni, Ni Made Savitri dan Yasa, Ni Nyoman Kerti, 2012, “E-Service Quality terhadap
Kepuasan dan Loyalitas Pelanggan dalam Penggunaan Internet Banking,” Jurnal Keuangan dan
Perbankan Vol.16, Jurusan Akuntansi Fakultas Ekonomi Universitas Udayana.
Kominfo.go.id, 2019, “Indonesia Akan Jadi Pemain Ekonomi Digital Terbesar di Asia
Tenggara” dalam https://kominfo.go.id/index.php/content/
detail/6441/Indonesia+Akan+Jadi+Pemain+Ekonomi+Digital+Terbesar+di+Asia+
Tenggara/0/berita_satker, diakses pada tanggal 25 Mei 2019 jam 09.37.
Kotler, Philip, 2005 Manajemen Pemasaran Ed. 11, Jilid 1, Jakarta: PT. Indeks.
Liputan6.com, 2019, “Pertumbuhan e-Commerce Indonesia Tertinggi di Dunia” dalam
https://www.liputan6.com/tekno/read/2957050/pertumbuhan-e-commerceindonesia-tertinggi-di-
dunia, diakses pada tanggal 25 Mei 2019 jam 09.35
Rahayu, Ayu Sri Rahayu, 2018 “Pengaruh Biaya Iklan dan Biaya Promosi terhadap Volume Penjualan
Mobil Avanza pada PT. Hadji Kalla Cabang Alauddin di Kota
Makassar,” Jurnal Ekonomi, Makassar: Universitas Negeri Makassar.
Sunyoto, Danang, 2015, Perilaku Konsumen dan Pemasaran: Panduan Riset Sederhana untuk
Mengenali Konsumen, Yogyakarta: Center of Academic Publishing Service.
Swastha, Basu, 2001 Manajemen Penjualan, Yogyakarta: BPFE-Yogyakarta.
Wulandari, Andhita Dessy, 2017, Aplikasi Statistika Parametrik dalam Penelitian, Yogyakarta:
Pustaka Felicha.
3rdInternational Conference on Economic Research
24-25th October 2019, Alanya, Turkey
136
DISPROPORTIONATE GAINS: A HOME MARKET EFFECT IN AN ALMOST
ARBITRARY GEOGRAPHY1
Jordan J. Norris
Aarhus University, Department of Economics and Business Economics, Denmark
Email:[email protected]
Abstract
The Home Market Effect (HME) provides a mechanism for trade driven by demand: locations with
a comparatively large consumer base for an industry specializes in production of that industry, and
exports to the rest of the world. The theory originates with Krugman in the 1980s, yet, despite the
many iterations since, sharp theoretical predictions are only given in two-location models. As the
world has more than two locations, empirical operationalization requires, therefore, assumptions
outside of the model. By making only a single additional assumption relative to the canon — the
inverse trade freeness matrix has diagonal greater than the identity — I prove that the HME continues
to hold in many location models on average. Furthermore, the empiricist needs to make little
amendment: the HME hypothesis test valid in many-locations is almost identical to that already being
implemented using the two-location hypothesis.
Keywords: Home Market Effect, Many Locations.
1 I would like to thank Treb Allen, Gideon Bornstein, Kiminori Matsuyama and Marti Mestieri. I
would also like to thank seminar attendees for feed back at Aarhus Universityand Northwestern
University.
3rd International Conference on Economic Research
24-25th October 2019, Alanya, Turkey
137
CONSUMER CONFIDENCE AND THE HOUSING MARKET IN TURKEY
Ayhan Kapusuzoglu
Ankara Yildirim Beyazit University, Department of Banking and Finance, Turkey
Nildag Basak Ceylan
Ankara Yildirim Beyazit University, Department of Banking and Finance, Turkey
E-mail: [email protected]
Abstract
The sales amount is an important indicator for a country and the sales amount of houses depend on
the confidence of the consumers as the demand of the consumers changes according to the economic
condition of the countries’.In this direction, the purpose of this study is to examine the short term
(causality) and long term (cointegration) relationships between consumer confidence index and total
home sales, between consumer confidence index and total mortgage sales. The period that is covered
in the study is between 2003:01-2019:06 and the frequency of the data is monthly. The data of
consumer confidence index, total home sales and total mortgage based home sales are obtained from
the Electronic Data Delivery System (EVDS) of the Central Bank of the Republic of Turkey. In the
study both short term and long term relationships between the variables are concerned. The analyses
are performed by using Johansen cointegration and Granger causality teststo clarify both short term
and long term relationships. When the empirical findings of the study are evaluated, it is possible to
say that there are bi-directional short term causality and long term relationships between consumer
confidence index and total house sales, consumer confidence index and total mortgage sales. Overall,
both the results of the short and long term relationships indicate that consumers tend to buy houses
when they are more optimistic on the economy and vice versa. Moreover, as the consumers buy more
houses, their confidence on the economy increases.
Keywords: Consumer Confidence Index, Housing Market, Co-Integration, Causality, Turkey.
1. Introduction
Confidence is very important in general economy. Consumer confidence is a reflection of
consumers' perceptions related to both current and future economic conditions. For housing sales,
consumer’s confidence index data takes an important part. The consumers demand changes according
to the situation of the economy. In Turkey, consumer confidence index is formed from consumer
tendency survey results which are published by the collaboration of the organizations Turkish
Statistical Institute (TURKSTAT) and Central Bank of the Republic of Turkey (CBRT). Consumer
confidence index is composed of four sub-items which are expectation of the financial situation of the
household, overall economic situation expectation, number of unemployed expectation and probability
of saving. The index formed is seasonally adjusted. As in many other sectors, consumer confidence in
housing sector is a determinative factor in the sales of the houses.
When looked to the literature it is possible to see the studies in both directions. In some of the
studies the consumer confidence affects the buying attitudes of the consumers whereas in the others
vice versa.Among the studies that find relationship between consumer confidence and economic
variables, Celik and Ozerkek (2011) have analyzed the long run relationship between consumer
confidence and economic and financial variables for some of the European Union countries using
panel data analysis.Olowofeso and Doguwa (2012) investigate the relationship between consumer
sentiment and consumption expenditures for Nigeria. Their findings assess that the confidence index
can affect the economic performance and shows that it is good at predicting household consumption
growth in Nigeria. The study of Belessiotis (1996) examines the relationship between consumer
confidence and consumer spending in France. The results of the study indicate that consumer
confidence index has explanatory power for future consumer spending. Afshar and Zomorrodian
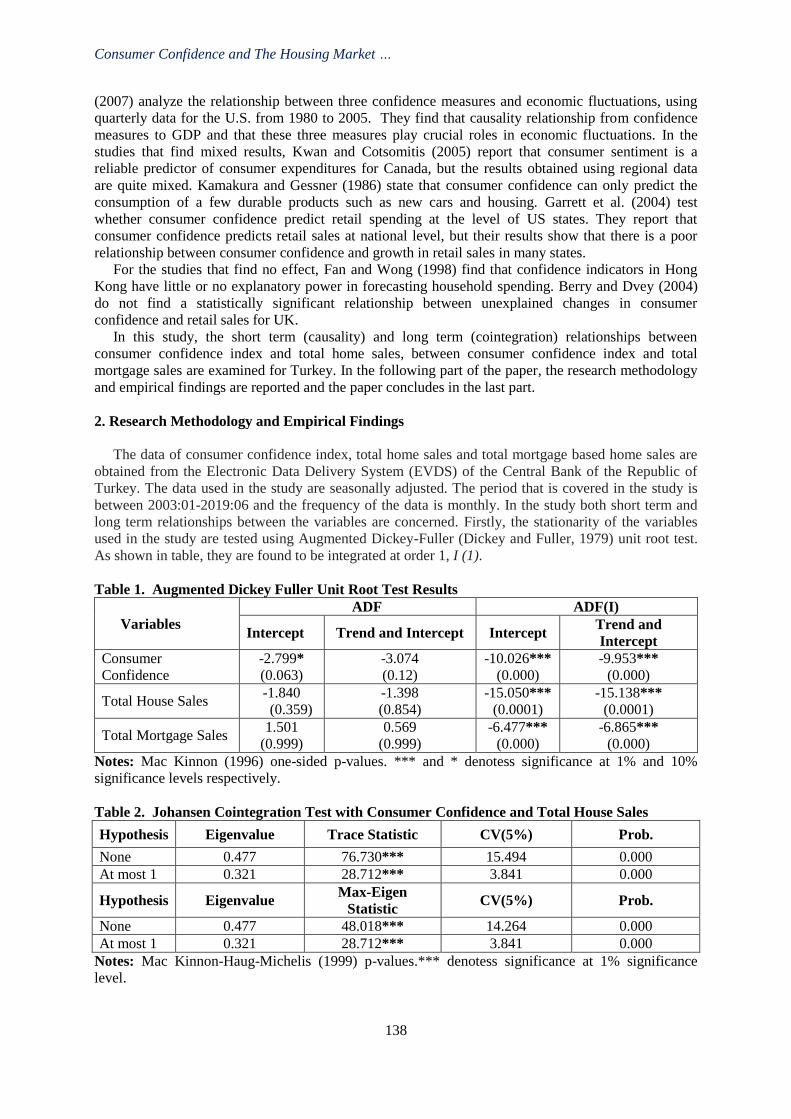
Consumer Confidence and The Housing Market …
138
(2007) analyze the relationship between three confidence measures and economic fluctuations, using
quarterly data for the U.S. from 1980 to 2005. They find that causality relationship from confidence
measures to GDP and that these three measures play crucial roles in economic fluctuations. In the
studies that find mixed results, Kwan and Cotsomitis (2005) report that consumer sentiment is a
reliable predictor of consumer expenditures for Canada, but the results obtained using regional data
are quite mixed. Kamakura and Gessner (1986) state that consumer confidence can only predict the
consumption of a few durable products such as new cars and housing. Garrett et al. (2004) test
whether consumer confidence predict retail spending at the level of US states. They report that
consumer confidence predicts retail sales at national level, but their results show that there is a poor
relationship between consumer confidence and growth in retail sales in many states.
For the studies that find no effect, Fan and Wong (1998) find that confidence indicators in Hong
Kong have little or no explanatory power in forecasting household spending. Berry and Dvey (2004)
do not find a statistically significant relationship between unexplained changes in consumer
confidence and retail sales for UK.
In this study, the short term (causality) and long term (cointegration) relationships between
consumer confidence index and total home sales, between consumer confidence index and total
mortgage sales are examined for Turkey. In the following part of the paper, the research methodology
and empirical findings are reported and the paper concludes in the last part.
2. Research Methodology and Empirical Findings
The data of consumer confidence index, total home sales and total mortgage based home sales are
obtained from the Electronic Data Delivery System (EVDS) of the Central Bank of the Republic of
Turkey. The data used in the study are seasonally adjusted. The period that is covered in the study is
between 2003:01-2019:06 and the frequency of the data is monthly. In the study both short term and
long term relationships between the variables are concerned. Firstly, the stationarity of the variables
used in the study are tested using Augmented Dickey-Fuller (Dickey and Fuller, 1979) unit root test.
As shown in table, they are found to be integrated at order 1, I (1).
Table 1. Augmented Dickey Fuller Unit Root Test Results
Variables
ADF ADF(I)
Intercept Trend and Intercept Intercept Trend and
Intercept
Consumer
Confidence
-2.799*
(0.063)
-3.074
(0.12)
-10.026***
(0.000)
-9.953***
(0.000)
Total House Sales -1.840
(0.359)
-1.398
(0.854)
-15.050***
(0.0001)
-15.138***
(0.0001)
Total Mortgage Sales 1.501
(0.999)
0.569
(0.999)
-6.477***
(0.000)
-6.865***
(0.000)
Notes: Mac Kinnon (1996) one-sided p-values. *** and * denotess significance at 1% and 10%
significance levels respectively.
Table 2. Johansen Cointegration Test with Consumer Confidence and Total House Sales
Hypothesis Eigenvalue Trace Statistic CV(5%) Prob.
None 0.477 76.730*** 15.494 0.000
At most 1 0.321 28.712*** 3.841 0.000
Hypothesis Eigenvalue Max-Eigen
Statistic CV(5%) Prob.
None 0.477 48.018*** 14.264 0.000
At most 1 0.321 28.712*** 3.841 0.000
Notes: Mac Kinnon-Haug-Michelis (1999) p-values.*** denotess significance at 1% significance
level.
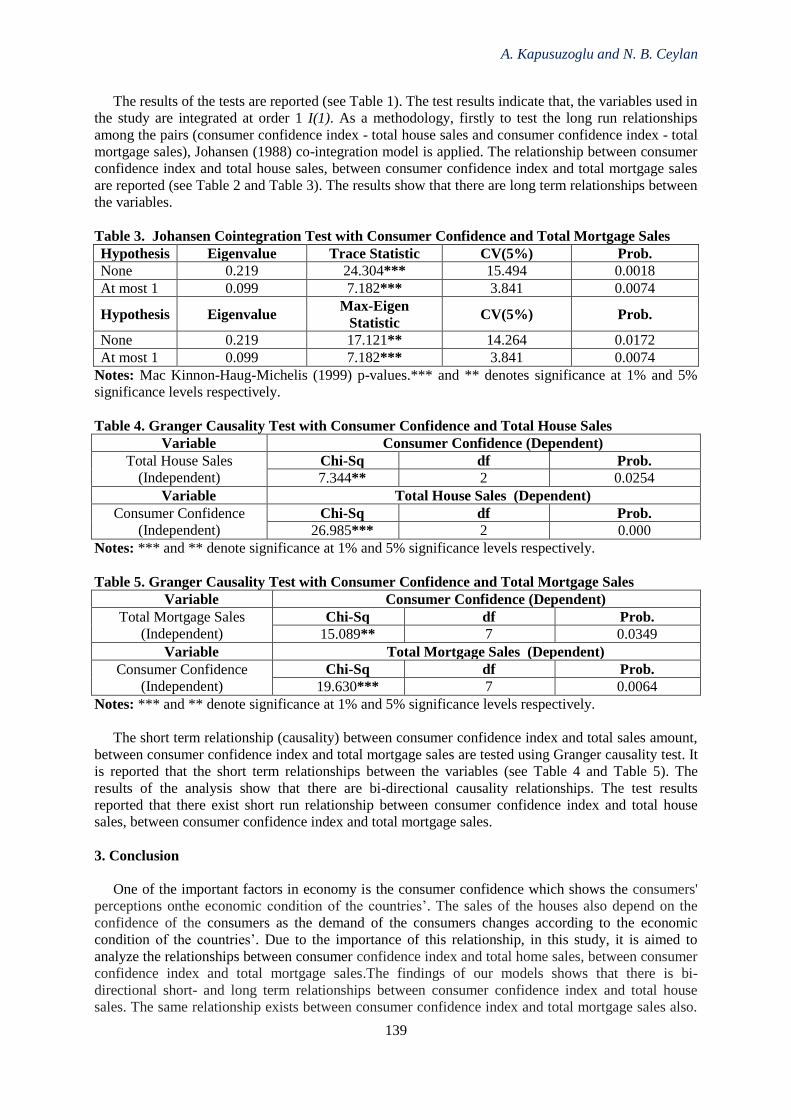
A. Kapusuzoglu and N. B. Ceylan
139
The results of the tests are reported (see Table 1). The test results indicate that, the variables used in
the study are integrated at order 1 I(1). As a methodology, firstly to test the long run relationships
among the pairs (consumer confidence index - total house sales and consumer confidence index - total
mortgage sales), Johansen (1988) co-integration model is applied. The relationship between consumer
confidence index and total house sales, between consumer confidence index and total mortgage sales
are reported (see Table 2 and Table 3). The results show that there are long term relationships between
the variables.
Table 3. Johansen Cointegration Test with Consumer Confidence and Total Mortgage Sales
Hypothesis Eigenvalue Trace Statistic CV(5%) Prob.
None 0.219 24.304*** 15.494 0.0018
At most 1 0.099 7.182*** 3.841 0.0074
Hypothesis Eigenvalue Max-Eigen
Statistic CV(5%) Prob.
None 0.219 17.121** 14.264 0.0172
At most 1 0.099 7.182*** 3.841 0.0074
Notes: Mac Kinnon-Haug-Michelis (1999) p-values.*** and ** denotes significance at 1% and 5%
significance levels respectively.
Table 4. Granger Causality Test with Consumer Confidence and Total House Sales
Variable Consumer Confidence (Dependent)
Total House Sales
(Independent)
Chi-Sq df Prob.
7.344** 2 0.0254
Variable Total House Sales (Dependent)
Consumer Confidence
(Independent)
Chi-Sq df Prob.
26.985*** 2 0.000
Notes: *** and ** denote significance at 1% and 5% significance levels respectively.
Table 5. Granger Causality Test with Consumer Confidence and Total Mortgage Sales
Variable Consumer Confidence (Dependent)
Total Mortgage Sales
(Independent)
Chi-Sq df Prob.
15.089** 7 0.0349
Variable Total Mortgage Sales (Dependent)
Consumer Confidence
(Independent)
Chi-Sq df Prob.
19.630*** 7 0.0064
Notes: *** and ** denote significance at 1% and 5% significance levels respectively.
The short term relationship (causality) between consumer confidence index and total sales amount,
between consumer confidence index and total mortgage sales are tested using Granger causality test. It
is reported that the short term relationships between the variables (see Table 4 and Table 5). The
results of the analysis show that there are bi-directional causality relationships. The test results
reported that there exist short run relationship between consumer confidence index and total house
sales, between consumer confidence index and total mortgage sales.
3. Conclusion
One of the important factors in economy is the consumer confidence which shows the consumers'
perceptions onthe economic condition of the countries’. The sales of the houses also depend on the
confidence of the consumers as the demand of the consumers changes according to the economic
condition of the countries’. Due to the importance of this relationship, in this study, it is aimed to
analyze the relationships between consumer confidence index and total home sales, between consumer
confidence index and total mortgage sales.The findings of our models shows that there is bi-
directional short- and long term relationships between consumer confidence index and total house
sales. The same relationship exists between consumer confidence index and total mortgage sales also.
Consumer Confidence and The Housing Market …
140
When the results of the analysis are evaluated, the existence of the short and long term relationships
show that consumers are more willing to buy houses when they feel more optimistic related to the
economy and vice versa. In addition, as the consumers continue buying houses, their confidence
related to the economy increases.
References
Afshar T., Arabian, G. &Zomorrodian, R. (2007). Stock return, consumer confidence, purchasing
manager’s index and economic fluctuations. Journal of Business & Economics Research 5(8): 97-
106.
Belessiotis, T. (1996). Consumer confidence and consumer spending in France. Economic Papers
Number 116. European Commission, September.
Berry, S., & Davey, M. (2004). How should we think about consumer confidence?. Bank of England
Quarterly Bulletin, Autumn: 282-290.
Celik, S., & Ozerkek, Y.(2011). Panel cointegration analysis of consumer confidence and personal
consumption in the European Union. Journal of Business Economics and Management 10: 161-
168.
Dickey, D. A., & Fuller, W. A. (1979). Distribution of the estimators for autoregressive time series
with a unit root. Journal of the American Statistical Association 74(366): 427-431.
Fan, C. S. & Wong, P. (1998). Does consumer sentiment forecast household spending?. The Hong
Kong case. Economics Letters 58: 77–84.
Garrett, A. G., Hernandez-Murillo, R. & Owyang, M. T. (2004). Does consumer sentiment predict
regional consumption?. Federal Reserve Bank of St. Louis Review, 87(2-1): 123-135.
Johansen, S. (1988). Statistical analysis of cointegration vectors. Journal of Economic Dynamics and
Control 12(2-3): 231-254.
Kamakura, W. A. & Gessner, G. (1986). Consumer sentiment and buying intentions. Journal of
Economic Psychol 7: 197-220.
Kwan, C. C.& Cotsomitis, J. A. (2005). Does consumer confidence matter for household spending?
Evidence from Japan. Retrieved from
http://www.cuhk.edu.hk/eco/staff/cckwan/ researchPaper/KC_CCI_Japan_OBES-5.pdf
MacKinnon, J. G. (1996). Numerical distribution functions for unit root and cointegration tests.
Journal of Applied Econometrics 11: 601-618.
MacKinnon, J. G., Haug, A. A. & Michelis, L. (1999). Numerical distribution functions of likelihood
ratio tests for cointegration. Journal of Applied Econometrics 14: 563-577.
Olowofeso, O. E. & Doguwa, S. (2012). Consumer sentiment and confidence indices in Nigeria: A
panel data analysis IFC Bulletin, 36: 191-216.0
3rd International Conference on Economic Research
24-25th October 2019, Alanya, Turkey
141
GROWTH GAINS FROM TRADE
Sugata Marjit
Indian Institute of Foreign Trade, India
Anwesha Basu
Indira Gandhi Institute of Development Research, India, Email: [email protected]
C.Veeramani
Indira Gandhi Institute of Development Research, India
Abstract
This paper revisits the relationship between trade openness and growth. Our objective is to show,
both theoretically and empirically, that the growth effect of trade is conditional on the type of products that are traded. Any trade openness index that includes all types of trade would lead to a measurement
error in the independent variable and may falsely predict a weak orin significant relationship between
trade and growth. Inempirical literature, traditional measures of trade openness fail to make this
distinction. We find that in order to establish a relation between trade and growth, it is important to include trade in intermediate goods and trade in final consumer goods as separate components in our
analysis. Although static gains shall accrue from trade in both these types of goods, we hypothesise
that it is openness with respect to intermediate and capital goods that matters for growth. In this paper, we measure trade openness indices separately with respect to intermediate inputs and final goods and
find that it is the former which turns out to be significant in explaining growth gains from trade at both
the sectoral level as well as the aggregate economy level. Using sectoral level data from WORLD
KLEMS (Capital, Labour, Energy, Materials and Service) Database on industrial productivity and output and global input output tables from World Input Output Database (WIOD), to construct the
measures of trade openness, our empirical analysis covering 21 countries, 30 industries and 15 years
reveals that trade openness in terms of intermediate and capital goods lead to economic growth. Employing dynamic panel estimation technique, our GMM estimates show that a 10% increase in
trade openness in terms of import of intermediate inputs leads to an increase in industrial productivity
in the range of 1.9% to 0.3%. Openness in terms of import of final consumer goods turns out to be insignificant in most specifications. We also estimate traditional cross country growth regressions
where we use highly disaggregated trade data to construct the two trade openness indices for 174
countries. Here again, we find that it is import of intermediate and capital goods that results in real
per-capita income growth. Our empirical results are in line with our theoretical model, where we show, how trade in intermediate goods in an endogenous growth framework, directly leads to growth,
as opposed to trade in final goods. We show that this occurs independent of any external structure that
is imposed on the basic model of trade. Keywords: International Trade, Endogenous Growth, Trade Openness, Intermediate Inputs, Dynamic
Panel.
3rdInternational Conference on Economic Research
24-25th October 2019, Alanya, Turkey
142
EVALUATING THE DYNAMIC FORECASTING PERFORMANCE OF BIST
ISTANBUL, ANKARA AND IZMIR INDEX VOLATILITIES
Ihsan Erdem Kayral
Konya Food and Agriculture University, Department of Economics, Turkey
Email: [email protected]
Nisa Sansel Tandogan
Konya Food and Agriculture University, Department of Economics, Turkey
Abstract
In Borsa Istanbul, volatility data is calculated as subtracting five different trading days from the
current trading day. From these calculations, the shortest-term period, the medium-term calculation
period and the longest-term period are determined as 21, 63 and 252 respectively. Within the scope of
our study, the aim is to analyse the dynamic forecasting performance of volatilities of Istanbul, Ankara
and Izmir city indices, which are the three biggest cities in our country, in the context of BIST by
subtracting these three trading days (21, 63, 252 days ) from last analysis day in 07/01/2010 –
07/01/2019 period. Before the dynamic forecasting analysis, stock market returns are calculated by
closing prices of BIST Istanbul, BIST Ankara and BIST Izmir city indices in the analysis period. It is
determined that stock market returns are applicable for ARCH/GARCH type volatility models
depending on showing ARCH effect. For each city index, return volatilities are estimated by using five
ARCH/GARCH type model as ARCH (1), GARCH (1,1), EGARCH (1,1), TARCH (1,1) and
CGARCH (1,1) models in three different periods. Based on these estimations, models through
dynamic forecasting method are compared to determine the model providing best forecasting by using
the results of the Theil inequality coefficient (TIC) and root mean squared error (RMSE). In the result
of the analysis, two models providing the best forecasting in all periods for all stock markets are
identified. These are CGARCH (1,1) model which analyse the short-term and long-term movements of
the volatilities and GARCH (1,1) model which is one of the symmetric models and generally used in
the studies. When evaluating the results based on the index, it is seen that the model providing best
forecasting is GARCH (1,1) model according to the TIC and RMSE results in the model which
subtracts 21 trading days from BIST Istanbul city index. When 63 and 252 trading days in the model
are subtracted, the best model is CGARCH according to the TIC results. However, the results of
RMSE show that while the best forecasting model is CGARCH when subtracted 63 days, three
different models (ARCH, EGARCH, TARCH) are obtained as the best forecasting model when
subtracted 252 days. The best forecasting model is found as CGARCH (1,1) in the models subtracting
21 and 63 trading days of BIST Ankara city index in terms of the two evaluation methods. In the
models subtracting 252 trading days, TARCH (1,1) model according to RMSE results and CGARCH
(1,1) model according to TIC results are determined as the model providing best forecasting. In BIST
Izmir city index, the best and the second-best model showing the forecasting performance are
determined as CGARCH (1,1) and thesymmetric models (ARCH or GARCH), respectively, in all
models.
Keywords: BIST City Indices, Dynamic Forecasting Methods, Theil Inequality Coefficient, Root
Mean Squared Error, ARCH / GARCH Models.
.
3rd International Conference on Economic Research
24-25th October 2019, Alanya, Turkey
143
FEATURES OF MANAGEMENT BY PROFESSIONAL AND PERSONAL
DEVELOPMENT OF PERSONNEL: THE CASE OF UKRAINE
Serhii Makarenko
Kherson State University, Management and Administration Department, Ukraine
Email: [email protected]
Tetiana Kazakova
Kherson State University, Management and Administration Department, Ukraine
Abstract
The purpose of the article is to study the factors of influence and provide recommendations for improving the system of management of professional and personal development of personnel of the
enterprise. It has been established that effective means of ensuring successful innovation development
are effective personnel management through promotion of professional and personal development. At enterprises where serious attention is paid to this issue, the innovative component is essential, which
ensures the appropriate success of the business entity in the real economic space. It has been found
that despite the presence of a relatively large number of scientists and engineers, Ukraine has a low
quality of research institutes and ability to innovate, which is confirmed not only by the lack of cooperation between universities and industry in research and development, the low cost of companies
for research and development and public procurement of high-tech products, but also the actual
inability to retain and attract talents for economic activity.It is substantiated that the definition of the boundary of the production load will not only establish an effective bonus system, but also increase
the level of job satisfaction among subordinates. This will contribute to reducing staff turnover,
reducing the level of waste and waste in the production of products, and the probability of injury in the workplace, etc. In order to objectively evaluate the achieved results, a methodical approach is
proposed to determine the competence coefficient of experts involved in the assessment, taking into
account their work experience, the magnitude of management activity, and the level of education.
The above will allow to maximize the effectiveness of the conducted rating assessment and coordinate efforts and resources of employees to improve the identified and relevant indicators for the
enterprise.
Keywords: Professional and Personal Development, Institutions of Higher Education, Gross Domestic Product, Coefficient of Competence, Marginal Limit of Production Load.
1. Introduction
Modern business practice has proven that the success of the business entities of all forms of
ownership directly depends on the effectiveness of personnel management. Considering that staff is
the most valuable resource, the use and development of which depends on the effectiveness of the entire production process, the formation and implementation of an effective strategy for its use and
development is a priority task for the management of enterprises, institutions and organizations of all
forms of ownership. Continuous development of the personnel is able to provide the entity with long-term competitive advantages. An important component of personnel development is the formation of a
mechanism for managing its professional career.
Research and solving contemporary problems hampering the development of professional career
personnel is one of the most urgent tasks not only for management of business entities, but also for society as a whole.We agree with the authors of Derkach AA, Zazykyn VH, MarkovaAK (2000) that
the current social situation in Ukraine not only radically changed ideas and values, but also gave rise
to an uncertain, often unreasonable, attitude to many values and norms, including values career, personal development. Therefore, ensuring compatibility of career growth and personal self-realization
is one of the key tasks for top management of enterprises. The combination of these lines of
professional and personal development is not explicit and not always harmoniously combined. This
Features of Management by Professional...
144
conflict of various components of self-realization is particularly clearly manifested in the
objectification of the driving forces of this process and the criteria for its success. The criterion for the
success of professional self-realization and the demand for the chosen profession can be career growth, which in one way or another allows us to assert that both the competence of a person and his
satisfaction are the result of his professional activities. The criterion for the success of personal self-
realization is the presence of a family, private personal life, hobbies, etc., which allows you to determine the level of happiness and the pleasure received from life.
The purpose of the article is to study the factors of influence and provide recommendations for
improving the system of management of professional and personal development of the personnel of the enterprise.
2. Methodology
The methodological basis of the study consisted of scientific works of domestic and foreign
scientists and leading specialists, statistical and analytical materials of state authorities. As a method of
data collection for the research was chosen a questionnaire. The questionnaire research was carried out in selected higher education institutions (Kherson State University), local authorities (Department of
Economic Development and Trade of Kherson Regional State Administration; Main Department of
the State Fiscal Service of Ukraine in Kherson region, Autonomous Republic of Crimea and Sevastopol), trade union organizations (Kherson regional inter-branch council of trade unions),
leading enterprises of Kherson city ("Amalteya" LLC, "Leather Plant" Platan LTD "Ltd.) and public
organizations (Business Association "MI-KHERSONTS"). The results are obtained through the use of
such methods as: expert - to identify the impact of qualitative and quantitative indicators on the socio-economic development of Ukraine; economics and mathematics - to study the impact of the main
indicators of activity and performance of institutions of higher education and purchasing power of the
population on the total volume of gross domestic product; correlation-regression analysis - to find out the relationship between the productive factor and the identified factors; abstract-logical - for
theoretical generalization and formulation of conclusions.
The study of the specifics of the training of labor resources was conducted using official statistical
reporting on the activities of institutions of higher education in Ukraine. In determining the optimal production load, the results of an empirical study on the specifics of the
operation of the plant for technical and service maintenance of LLC "Avtoplanet Plus" (Kherson,
Kherson region, Ukraine) were used.
3. Results and Discussions
3.1 Investigating the Specifics of the Training of Labor Resources in Institutions of Higher
Education of Ukraine
The success of professional career growth depends to a large extent on the effectiveness of the first steps in learning and professional activities. Education and career choices are important for further life
and professional development.
At the first stage of personal development young people are often assumed to have significant mistakes. For example, when studying in a particular profession, some people are convinced that one
day will not work in a specialty, because it is not prestigious, unprofitable or hopeless (Makarenko S.
M., Kaplina Y. O., Kazakova T. S., 2018). And this person is trained only because of the fact that in the specialty there was a place for a public order. The above leads to a low level of motivation among
students for obtaining qualitative knowledge in the chosen profession and inappropriate use of
budgetary funds for training specialists on a state-commissioned basis. This is confirmed by the
materials published by the World Economic Forum on the World Economic Ranking by the Global Economic Competitiveness Index 2017-2018 (Economic Discussion Club 2018). Thus, despite the
improvement of the position on four points, Ukraine ranked 81st among 137 countries of the world.
Most was lost due to the "Labor Market Efficiency" component, which made Ukraine the 86th place, having lost 13 points in comparison with 2016-2017 and 30 points in comparison with 2015-2016.
S. Makarenko and T. Kazakova
145
There were also lost 2 points for the component, which characterizes higher education and
professional training.
Despite the relatively high positions as part of "higher education and training" (35th place in 2017-2018 among 137 countries of the world), the quality of management schools in Ukraine is very low
(88th place), as well as the level of personnel training at the training at the place of work (88th place).
Ukraine also ranked 51st in terms of primary education. And this is despite the fact that Ukraine is 25th in the presence of scientists and engineers.
The above analysis shows that in spite of the relatively large number of scientists and engineers,
the low quality of research institutes (60th place) and innovation ability (51st place) are observed in Ukraine, which is confirmed not only by the lack of cooperation between universities and industry in
research and development (rank 73), low-cost research and development companies (76th place) and
state-owned high-tech procurement (96th place), but also the inability to retain and attract talent in
economic activities (respectively 129 and 106 places). That is, the knowledge acquired by the modern scientific community that has remained in Ukraine in most cases is theoretical and is not possible for
the effective use of business in the current conditions of an unstable internal and external business
environment. For a more detailed analysis using the knowledge and experience of the leading experts of the
educational branch, local authorities, budgeting enterprises and organizations of Kherson (Kherson
region, Ukraine) in the scientific work Makarenko S.M., Oliinyk N.M., Kazakova T.S. (2018), the influence of the main indicators of activity and efficiency of institutions of higher education and
purchasing power of the population on the total volume of gross domestic product.
According to the views of the respondents, it was found that the following indicators have the
greatest impact on the total gross domestic product (Y): - average number of economically active population aged 15-70 years (X1);
- number of graduates from higher education institutions (X2);
- number of graduates (X3); - number of people who have completed doctoral studies (X4);
- real wage index (X5).
Using the formula for calculating the pair correlation coefficients and official materials of the State
Statistics Service of Ukraine for the years 2010-2017, the following relationship was established between the indicators and the result factor:
– ryx1 = 0.9319 – according to the scale of the relationship of variables, the relationship between Y
and X1 is considered to be very high, and therefore the impact of this factor on the final result is significant;
– ryx2 = 0.839 – the relationship between Y and X2 is considered high;
– ryx3 = 0.7648 – the relationship between Y and X3 is considered above average; – ryx4 = -0.5691– the relationship between Y and X4 is considered average;
– ryx5 = 0.4334 – the relationship between Y and X5 is considered below average.
The calculations show that an increase in X4 (the number of people completing doctoral studies)
has a negative impact on the overall Y (gross domestic product at constant 2010 prices). This can be argued that in the current conditions of development of science in Ukraine, the defense of the
dissertation for the degree of Doctor of Sciences is in some cases theoretical in nature, without the
possible implementation of the results obtained in the practice of domestic economic entities of all forms of ownership. As a consequence, the rate of increase in the level of remuneration of employees
who successfully defended their dissertation far exceeds the rate of increase in their productivity and
efficiency. In some cases, when the dissertation works on obtaining a doctorate of science highlight
relevant issues for society and business and provide an effective mechanism for solving them, at the stage of preparation of the dissertation the doctoral students are attracted to foreign companies in order
to ensure the further export of their intellectual potential border.
Given the low impact of X5 (the real wage index) on Y, it may be related to the conditions of domestic business. That is, the increase in the amount of labor costs may not be related to the increase
in the quality of fulfilled functional duties, but be a consequence of the introduction at the state level
of mandatory programs for the protection of the socially vulnerable population (the availability of tax social benefits, the constant increase in the cost of living minimum and minimum wages, etc.).
Features of Management by Professional...
146
The conducted researches show that there is a negative tendency towards the deterioration of the
level of educational and scientific training of future employees of enterprises, institutions and
organizations of all forms of ownership. In order to make full use of the work potential, the management and managers of economic entities, especially enterprises engaged in the sale and after-
sales service of vehicles, must be provided not only with diplomas of higher education, scientific
degrees, etc., but also with qualitative knowledge in strategic management of enterprise and staff. including business organization and planning, risk management, and more.
This is necessary for the development and formation of a sound strategy for improving the
competitiveness of the enterprise in general and the use and development of personnel at the enterprise as the most important component in particular.
3.2 Substantiation of the Method for Determining the Optimal Production Load
In recent years, in the context of a radically changed position in the labor market, the possibilities
of attaining a professional career and understanding of it have changed. We agree with the author
(Lozovetska V. T., 2015) that, before, career conditions were dictated by the internal labor market and assumed full long-term, guaranteed employment, regularity and predictability of promotion,
dedication to the profession and organization, now conditions often determine the external market. It
has become characteristic of temporary contracts, part-time employment, partial career changes, employment in several fields of activity and in several organizations, unpredictability of work
transfers, self-management of a professional career.
Every company manager who wants to ensure efficient and cost-effective operation, not only in the
short but also in the long term, must constantly implement measures related to maximizing profitability through continuous training of staff with and without separation from economic activity,
and with the creation appropriate conditions and favorable workload for subordinate employees.
Overtime, high intensity of work, working more than 12 hours per working day, 6 days a week, intensive distance learning, etc. - in the future will necessarily lead to increased staff turnover, even if
a relatively high wage is set in the enterprise. The results of the studies (Makarenko S. M., Oliinyk N.
M., Lushchyk K. I., 2017) indicate that satisfaction with even a substantial increase in wages lasts
about 8 months on average. As a rule, in the specified period of time a person satisfies the previously formed needs for certain foodstuffs, services of a higher level of quality, and for her the main task is
finding free time resources for personal and relaxation. Also, according to some researchers (Maisiura
O. M., 2010) flexible working hours, mobility, creative character of work and comparative independence of workers with no attachment to the workplace, etc., become more important for people
than the level of income they receive. However, for a dishonest employee whose earnings are tied to
hourly wages, the provision of these opportunities will likely lead to the delayed fulfillment of the established functional duties and the decrease in productivity due to the fact that he does not organize
his own activities without constant control by management able. It is also necessary to take into
account the fact that constant work activity and the fulfillment of the set tasks will promote self-
assertion in the personality of the validity of the chosen life and production line of activity, eliminating negative thoughts, and increasing the level of satisfaction and happiness from the chosen type of
activity. At the same time, the negative consequences of the above may be the pursuit of results
without determining the validity and feasibility of obtaining them, which will allow to complete the task in time, but their performance may not bring the person closer to achieving the main mission of
life.
For the leaders of modern business structures, permanent development and implementation of a set of measures to improve the management of time resources in production is one of the main directions
of increasing the profitability of economic activity by increasing labor productivity, more efficient use
of existing production funds and minimizing fixed costs per unit of output. (works performed, services
rendered). Also, optimization of time load and determination of its limit for employees of the enterprise while ensuring compliance with production standards per hour will not only reduce the level
of injury (social effect), shortage and waste in production (economic effect), but also help more
satisfaction with the work done, normalization of the psychological climate in the team, which, as a
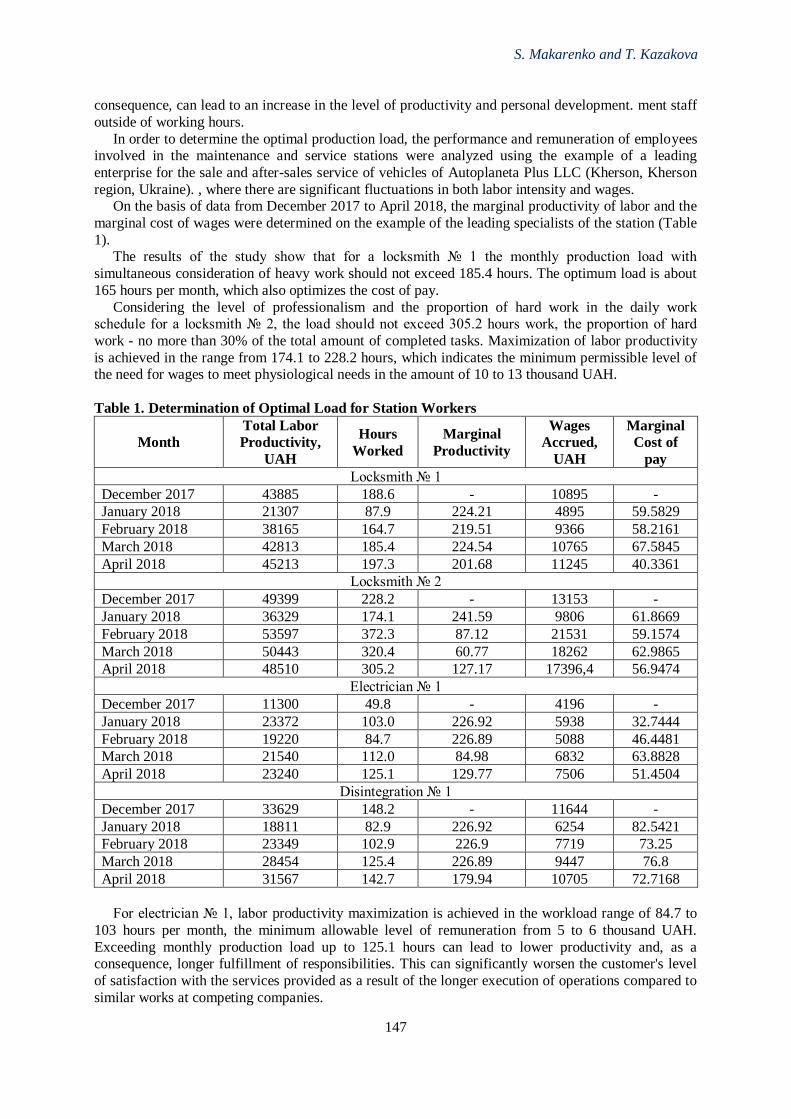
S. Makarenko and T. Kazakova
147
consequence, can lead to an increase in the level of productivity and personal development. ment staff
outside of working hours.
In order to determine the optimal production load, the performance and remuneration of employees involved in the maintenance and service stations were analyzed using the example of a leading
enterprise for the sale and after-sales service of vehicles of Autoplaneta Plus LLC (Kherson, Kherson
region, Ukraine). , where there are significant fluctuations in both labor intensity and wages. On the basis of data from December 2017 to April 2018, the marginal productivity of labor and the
marginal cost of wages were determined on the example of the leading specialists of the station (Table
1). The results of the study show that for a locksmith № 1 the monthly production load with
simultaneous consideration of heavy work should not exceed 185.4 hours. The optimum load is about
165 hours per month, which also optimizes the cost of pay.
Considering the level of professionalism and the proportion of hard work in the daily work schedule for a locksmith № 2, the load should not exceed 305.2 hours work, the proportion of hard
work - no more than 30% of the total amount of completed tasks. Maximization of labor productivity
is achieved in the range from 174.1 to 228.2 hours, which indicates the minimum permissible level of the need for wages to meet physiological needs in the amount of 10 to 13 thousand UAH.
Table 1. Determination of Optimal Load for Station Workers
Month
Total Labor
Productivity,
UAH
Hours
Worked
Marginal
Productivity
Wages
Accrued,
UAH
Marginal
Cost of
pay
Locksmith № 1
December 2017 43885 188.6 - 10895 -
January 2018 21307 87.9 224.21 4895 59.5829
February 2018 38165 164.7 219.51 9366 58.2161
March 2018 42813 185.4 224.54 10765 67.5845
April 2018 45213 197.3 201.68 11245 40.3361
Locksmith № 2
December 2017 49399 228.2 - 13153 -
January 2018 36329 174.1 241.59 9806 61.8669
February 2018 53597 372.3 87.12 21531 59.1574
March 2018 50443 320.4 60.77 18262 62.9865
April 2018 48510 305.2 127.17 17396,4 56.9474
Electrician № 1
December 2017 11300 49.8 - 4196 -
January 2018 23372 103.0 226.92 5938 32.7444
February 2018 19220 84.7 226.89 5088 46.4481
March 2018 21540 112.0 84.98 6832 63.8828
April 2018 23240 125.1 129.77 7506 51.4504
Disintegration № 1
December 2017 33629 148.2 - 11644 -
January 2018 18811 82.9 226.92 6254 82.5421
February 2018 23349 102.9 226.9 7719 73.25
March 2018 28454 125.4 226.89 9447 76.8
April 2018 31567 142.7 179.94 10705 72.7168
For electrician № 1, labor productivity maximization is achieved in the workload range of 84.7 to
103 hours per month, the minimum allowable level of remuneration from 5 to 6 thousand UAH.
Exceeding monthly production load up to 125.1 hours can lead to lower productivity and, as a consequence, longer fulfillment of responsibilities. This can significantly worsen the customer's level
of satisfaction with the services provided as a result of the longer execution of operations compared to
similar works at competing companies.
Features of Management by Professional...
148
For the worker №. 1, performing the functions of collapse, the optimal monthly load for
maximizing productivity is the interval from 82.9 to 125.4 hours. In the specified interval, the
minimization of labor costs is achieved with a monthly load of 102.9 to 125.4 hours. When the load is increased to 142.7 hours, there is a significant decrease in labor productivity, which also indicates a
longer fulfillment of duties and a decrease in the level of customer satisfaction.
The proposed approach can also be used for all employees of the vehicle maintenance and service station of Avtoplanet Plus LLC, which will allow to determine the optimum production load and
create the necessary time reserve for the proper relaxation and reproduction of employees at this
production site. This will help increase the level of productivity and satisfaction not only among the employees of the enterprise, but also among the customers of the station.
3.3 Development of Proposals for Improvement of the Personnel Management System
Among the main areas of improvement of the system of labor potential management of the station
for maintenance and servicing of motor vehicles at LLC "Avtoplaneta Plus" is to bring the system of
motivation to the level that provides the maximum self-motivation of employees to increase the efficiency of their activity, which, in turn, will lead to the improvement of the general indicators of
economic activity of the enterprise. Taking into account that at the station there is a constant
dissatisfaction among employees with the ratio of labor intensity and remuneration, the basis of the system of motivation should be based on the grading system - the scale of salaries (tariff grid) of the
company, which is developed on the basis of expert estimates of positions for predetermined factors.
The following features must be at the heart of the grading system: the qualification required for the
job; complexity of work performed; level of responsibility and independence; the need for guidance from other people; tensions and working conditions.
In developing the grading system, we propose to take the following steps: to create an appropriate
working group consisting of management and representatives of all units of the station; determine the factors of job evaluation (determine the specific weight of factors); to develop a scale for the
evaluation of positions by selected factors; to select basic (reference) positions for the first stage of
evaluation; to estimate the basic positions, the level of fluctuation of the developed scales and the
share of factors; to evaluate all positions of the company in relation to the already estimated basic ones; to divide the posts into levels (grade) agree and approve the final estimates; translate point
scores into cash; implement developed grading systems.
Given that the greatest concern of the employees of the investigated enterprise is related to the possible subjectivism of the members of the expert group in the assessment of the results of their
professional and personal development, the management of the enterprise should first of all put in
place an effective objective model of estimation of the coefficients of the involved experts. Considering that each expert of the created working group has different level of education, experience
and, as a consequence, occupies different positions, we suggest to calculate the competence
coefficients of all members of the working group, using the following formula:
К = n
nК...3
К2
К1
К ++++, (1)
К – expert competence factor;
К1 – coefficient, which is assigned depending on the available level of education, scientific degree, academic rank;
К2 – coefficient that is assigned depending on work experience (position);
К3 – coefficient that is assigned depending on the scale of the managerial activity of the expert
(number of subordinate employees); Кn – coefficient that is assigned depending on the n-factor;
n – the number of factors by which the level of expertise is assessed.
The next step is to ensure that all qualitative components that characterize the level of expertise of experts are translated into quantitative indicators. Thus, in determining the quantitative indicator
characterizing the existing level of education (K1), it is suggested to use the following scale of
assessment: persons with the lowest degree of higher education "bachelor" - get 1 point. For all other
individuals, their grade points will increase depending on the interval of study. That is: for persons
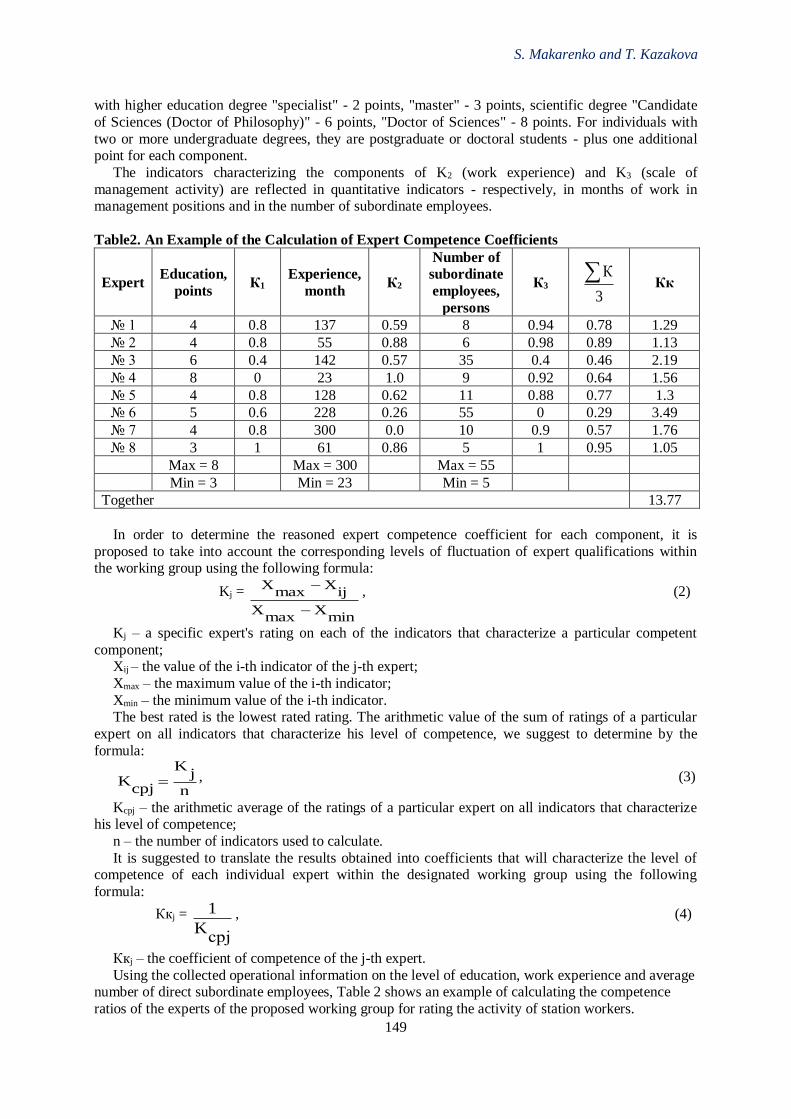
S. Makarenko and T. Kazakova
149
with higher education degree "specialist" - 2 points, "master" - 3 points, scientific degree "Candidate
of Sciences (Doctor of Philosophy)" - 6 points, "Doctor of Sciences" - 8 points. For individuals with
two or more undergraduate degrees, they are postgraduate or doctoral students - plus one additional point for each component.
The indicators characterizing the components of K2 (work experience) and K3 (scale of
management activity) are reflected in quantitative indicators - respectively, in months of work in management positions and in the number of subordinate employees.
Table2. An Example of the Calculation of Expert Competence Coefficients
Expert Education,
points К1
Experience,
month К2
Number of
subordinate
employees,
persons
К3
Кк
№ 1 4 0.8 137 0.59 8 0.94 0.78 1.29
№ 2 4 0.8 55 0.88 6 0.98 0.89 1.13
№ 3 6 0.4 142 0.57 35 0.4 0.46 2.19
№ 4 8 0 23 1.0 9 0.92 0.64 1.56
№ 5 4 0.8 128 0.62 11 0.88 0.77 1.3
№ 6 5 0.6 228 0.26 55 0 0.29 3.49
№ 7 4 0.8 300 0.0 10 0.9 0.57 1.76
№ 8 3 1 61 0.86 5 1 0.95 1.05
Max = 8 Max = 300 Max = 55
Min = 3 Min = 23 Min = 5
Together 13.77
In order to determine the reasoned expert competence coefficient for each component, it is
proposed to take into account the corresponding levels of fluctuation of expert qualifications within the working group using the following formula:
Kj =
minX
maxX
ijX
maxX
−
−, (2)
Kj – a specific expert's rating on each of the indicators that characterize a particular competent
component; Xij – the value of the i-th indicator of the j-th expert;
Xmax – the maximum value of the i-th indicator;
Xmin – the minimum value of the i-th indicator. The best rated is the lowest rated rating. The arithmetic value of the sum of ratings of a particular
expert on all indicators that characterize his level of competence, we suggest to determine by the
formula:
n
jK
cpjK = , (3)
Kcpj – the arithmetic average of the ratings of a particular expert on all indicators that characterize his level of competence;
n – the number of indicators used to calculate.
It is suggested to translate the results obtained into coefficients that will characterize the level of competence of each individual expert within the designated working group using the following
formula:
Ккj =
срjK
1 , (4)
Ккj – the coefficient of competence of the j-th expert.
Using the collected operational information on the level of education, work experience and average number of direct subordinate employees, Table 2 shows an example of calculating the competence
ratios of the experts of the proposed working group for rating the activity of station workers.
3
К
Features of Management by Professional...
150
The example of calculations presented in Table 2 will allow to consider the individual level of
practical and scientific training of each of the respondents in determining the coefficients of
competence of the experts involved and reduce the level of error when using the intuitive group of research methods.
4. Conclusion and Recommendations
Determining the limit of production load will not only establish a sound system of bonuses, but
also increase the level of job satisfaction among subordinate employees. This will help to reduce staff turnover, reduce the level of scarcity and waste in the manufacture of products, and the likelihood of
injury at work, etc. The incentive model being developed should stipulate that, if the planned
professional and personal development goals are met or exceeded, employees will be provided with
adequate financial compensation in the after-hours. A methodological approach to determining the coefficient of competence of experts involved in the
evaluation of experts, taking into account their work experience, scale of management activity, level
of education, is proposed for a reasonable and objective evaluation of the achieved results. This will maximize the effectiveness of the rating and coordinate the efforts and resources of employees to
improve defined and relevant for the company.
References
Derkach, A. A., Zazykyn, V. H., & Markova, A. K. (2000). Psychology of professional development:
a textbook. Moscow: Nauka. Economic Discussion Club (2018). The position of Ukraine in the world ranking according to the
Global Competitiveness Index 2017-2018.Retrieved from:
http://edclub.com.ua/analityka/pozyciya-ukrayiny-v-reytyngu-krayin-svitu-za-indeksom-globalnoyi-konkurentospromozhnosti-2.
Lozovetska, V. T. (2015). Professional career of the individual in modern conditions: monograph.
Kyiv: Institute of Vocational Education NAPS of Ukraine.
Maisiura, O. M. (2010). On the effectiveness of using personal time (to the issue of time management).Actual problems of economics, vol. 2, no 104, pp. 196-200.
Makarenko, S. M., Kaplina, Y. O., & Kazakova T. S. (2018). Individualization of processes for
preparation and development of workers. University Economic Bulletin: collection of scientific articles of scientists and post–graduate students, vol. 1, no 37, pp. 117-125.
Makarenko, S. M.,Oliinyk, N.M., &Kazakova, T. S. (2018).Improving the method approach to the
rating evaluation of employees as professional career development. Baltic Journal of Economic Studies, vol. 4, no. 5 December, pp. 179-187.
Makarenko, S. M.,Oliinyk, N.M., &Lushchyk, K.I. (2017). Determination of optimal production loads
as the basis of productivity growth of employees at the enterprise.Scientific Herald of the
InternationalHumanitarianUniversity. Series: "Economics and Management", vol. 2, no 26, pp. 51-54.
State Statistics Service of Ukraine (2018). Main indicators of activity of higher educational institutions
of Ukraine at the beginning of 2016/17 academic year.Retrieved from: http://ukrstat.gov.ua. Tyukhtenko, N. A., & Makarenko, S. M. (2016). Economic and mathematic models for staff planning
at enterprises of all ownership forms. Actual problems of economics, vol. 1, no 175, pp. 435-442.
3rd International Conference on Economic Research
24-25th October 2019, Alanya, Turkey
151
THE INTERCONNECTION AMONG MONEY SUPPLY, INTEREST RATE AND STOCK
EXCHANGE IN TURKEY
Ayhan Kapusuzoglu
Ankara Yildirim Beyazit University, Department of Banking and Finance, Turkey
Nildag Basak Ceylan
Ankara Yildirim Beyazit University, Department of Banking and Finance, Turkey
Email: [email protected]
Ayyuce Memis
Ankara Yildirim Beyazit University, Department of Banking and Finance, Turkey
Abstract
The fact that the monetary policies pursued by countries becomesoperational on a narrowing or
expanding basis has a significant impact on both the capital markets and the money markets of that
country. In systems with a contractionary policy, an increase in interest rates is expected to occur due
to the decrease in money supply, and in this case, it is expected the values of the firms traded in the
capital markets and the bond markets bonds will decrease. If an expansionary monetary policy is
followed, it is expected that the price formations (stock and bonds) in capital markets will increase due
to the decrease in interest rate due to the increase in the level of money offered to the market. Money
supply, interest rate and interest rate factor in the capital market relationship triangle play a role in
reflecting the changes in money supply to the capital market as a mediating variable. In some cases,
the increase or decrease in the interest rate in the market may require changes in the money supply
level. In this study, including some in Turkey; short - and long - term relationships between money
supply, interest rate and stock index are analyzed. Within the scope of the study, the data related to the
variables covering the period between January 2006 - June 2019 are firstly seasonally adjusted and are
tested whether they are stationary at the same level to examine their suitability for the econometric
analysis. In the following period, the existence of long-term co-integration relationship is analyzed by
Johansen co-integration test and the short-term causality relationship is analyzed by Granger causality
test. As a result of the study, it is found that there is a long-term relationship among variables, bi-
directional causality between money supply and interest rate and uni-directional causality from stock
exchange index to money supply.
Keywords: Money Supply, Interest Rate, Stock Exchange, Turkey.
1. Introduction
In developed economies, it is revealed that the stock market index is an indicator of the changes in
real markets. Moreover, it is considered as the determinant of the situation in economic conjuncture.
Thus, determination of macroeconomicin addition to microeconomic factors causing fluctuations in
stock markets has become an important problem in academic studies.
Hashemzadeh and Taylor (1988) suggest that the increase in interest rates reduce the present value
of the cash flows expected by the investor in the future, thus will lead to a decrease in the bond prices
and the demand for bonds will increase. Moreover, the demand to stock prices will decrease as it will
leads to a higher interest rate than the stock yield. In addition, Brigham (2012) explain the effect of
interest rates on the profit of the company in 2 items. According to the first item, since interest
expenses are considered as expense, the increase in interest rates will cause a decrease in the profits of
the company and also affect the profits of the company because the interest rates affect the economic
activity level and this has an indirect effect on the stock prices. Spirinkel (1964) and Palmer (1970)
examine the relations between money supply and stock market. In these studies, a strong relationship
is found between the changes in money supply and stock price changes. Wong et al. (2005) argue that
changes in money supply is difficult to use in estimating the stock prices, and that the expansionary
The Interconnection among Money...
152
monetary policy stimulates the economy, which will increase the demand for stocks, and that changes
in money supply will affect prices and interest rates, as well. They state that the increase in money
supply would cause inflation to fall, thus reduce the demand for stocks.
The relationship between stock market and macroeconomic variables are examined by
academicians and policy makers widely by applying different econometric techniques. The
macroeconomic variables that the researchers mostly concern involves interest rates, inflation, money
supply and GDP.
Wongbangpo and Sharma (2002) study the relationship between stock prices and nominal GNP,
M1 money supply, short term interest rates and foreign exchange in Indonesia, Malaysia, Philippines,
Singapore and Thailand markets using monthly data for the period between 1985-1996 using
cointegration and Granger causality tests. At the end of the study, they find a negative relationship
between interest rates and the stock market in the Philippines, Singapore and Thailand, while a
positive relationship in Indonesia and Malaysia; They also report a long-term relationship between
high inflation, money supply and stock prices in the Indonesian and Plippine markets, while a positive
impact of monetary expansion on stock prices in Malaysia, Singapore and Thailand are reported.Wong
et al. (2005), using the quarterly data of 1982: Q1-2002: Q3, study the relationship between short-term
interest rates money supply (M1 and M2) and short-term interest rates by applying VAR model for
Singapore and USA. At the end of the study, they report that M1 money supply and short-term interest
rate have the same effect on the Singapore stock exchange.Patra and Poshakwale (2006) investigate
the relationship between stock prices, consumer price index, money supply and exchange rate traded
in the Greek Stock Exchange using monthly data from 1990 to 1999 by applying cointegration and
Granger causality tests. At the end of the study, they find that there is a balance between inflation rate,
money supply and stock prices.Gan, Lee, Yong and Zhang (2006) examine the relationship between
the New Zealand Stock Exchange and some macroeconomic variables by applying Johansen
cointegration tests by using monthly data of 1990-2003 period. At the end of the study, they report that
there is a long-term cointegration relationship between GDP, inflation, short term and long term
interest rates, real exchange rate, money supply (M1), domestic oil prices and New Zealand stock
index (NZSE40). Moreover, they report that the stock market index is determined by GDP, short-long
term interest rates and M1 money supply.Humpe and Macmillan (2007) examine the relationship
between consumer price index, money supply and long-term interest rates in USA and Japan by
applying cointegration test. The data they use are monthly covering the period from 1965: 01 - 2005:
06. At the end of the study, they find that the relationship between money supply and stock prices is
positive but not statistically significant for the USA. On the other hand, for Japan, the relationship
between stock prices and money supply is negative.Liu and Shrestha (2008) examine the relationship
between Chinese stock market indices and money supply, industrial production, inflation, exchange
rate and interest rates by applying cointegration test by using monthly data for 1992: 01 - 2001: 12
period. At the end of the study, they report that there is no relationship between macroeconomic
variables and stock prices on the Chinese Stock Exchange.Hosseini et al. (2011) investigate the
relationship between crude oil prices, M2 money supply, industrial production, interest rates and stock
prices by using VECM model in Chinese and Indian stock exchanges using monthly data for 1999: 01
- 2009: 01 period. Their findings show that there is a short- and long-term relationship between
macroeconomic variables and stock exchanges in each of the country.
There are similar studies which are performed on Turkey. Forex: Ozcan (2012) examines the
relationship between BIST industry index and selected macroeconomic variables by applying
cointegration test for the period 2003-2010. At the end of the study, he finds that there is a long-term
relationship between macroeconomic variables and BIST index.Kaya et al. (2013) investigate the
relationship between BIST 100 index and interest rate, money supply, industrial production index and
exchange rate by applying multiple linear regression model using the monthly data for the 2002: 01 -
2012: 06 period. At the end of the study, they report positive relationship between M2 money supply
and stock returns, while there is a negative relationship with dollar exchange rate, and interest rates
and industrial production index is found to have no effect on stock returns.Alper and Kara (2017)
examine the effect of exchange rate, interest rate, inflation rate, gold prices, money supply, oil prices,
foreign trade balance and industrial production index on Borsa Istanbul stock returns for the period
between 2003: 01-2017: 02 using monthly data. As a model, they have used impulse-response analysis
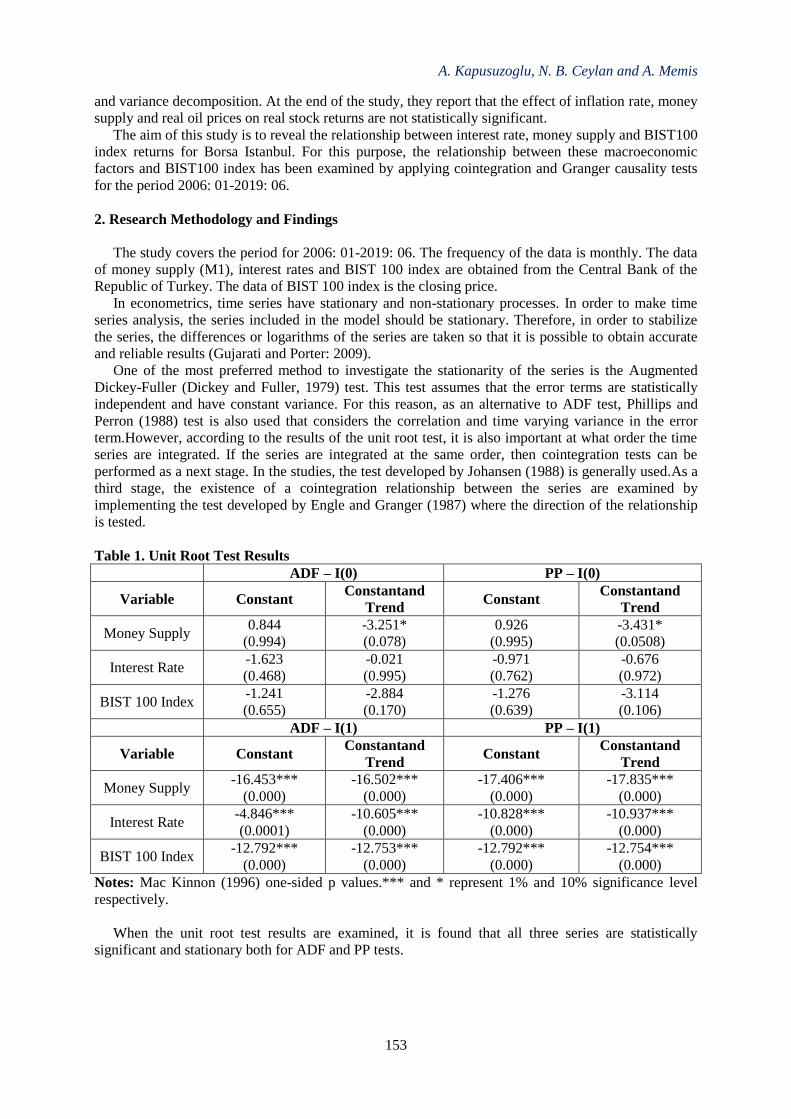
A. Kapusuzoglu, N. B. Ceylan and A. Memis
153
and variance decomposition. At the end of the study, they report that the effect of inflation rate, money
supply and real oil prices on real stock returns are not statistically significant.
The aim of this study is to reveal the relationship between interest rate, money supply and BIST100
index returns for Borsa Istanbul. For this purpose, the relationship between these macroeconomic
factors and BIST100 index has been examined by applying cointegration and Granger causality tests
for the period 2006: 01-2019: 06.
2. Research Methodology and Findings
The study covers the period for 2006: 01-2019: 06. The frequency of the data is monthly. The data
of money supply (M1), interest rates and BIST 100 index are obtained from the Central Bank of the
Republic of Turkey. The data of BIST 100 index is the closing price.
In econometrics, time series have stationary and non-stationary processes. In order to make time
series analysis, the series included in the model should be stationary. Therefore, in order to stabilize
the series, the differences or logarithms of the series are taken so that it is possible to obtain accurate
and reliable results (Gujarati and Porter: 2009).
One of the most preferred method to investigate the stationarity of the series is the Augmented
Dickey-Fuller (Dickey and Fuller, 1979) test. This test assumes that the error terms are statistically
independent and have constant variance. For this reason, as an alternative to ADF test, Phillips and
Perron (1988) test is also used that considers the correlation and time varying variance in the error
term.However, according to the results of the unit root test, it is also important at what order the time
series are integrated. If the series are integrated at the same order, then cointegration tests can be
performed as a next stage. In the studies, the test developed by Johansen (1988) is generally used.As a
third stage, the existence of a cointegration relationship between the series are examined by
implementing the test developed by Engle and Granger (1987) where the direction of the relationship
is tested.
Table 1. Unit Root Test Results
ADF – I(0) PP – I(0)
Variable Constant Constantand
Trend Constant
Constantand
Trend
Money Supply 0.844
(0.994)
-3.251*
(0.078)
0.926
(0.995)
-3.431*
(0.0508)
Interest Rate -1.623
(0.468)
-0.021
(0.995)
-0.971
(0.762)
-0.676
(0.972)
BIST 100 Index -1.241
(0.655)
-2.884
(0.170)
-1.276
(0.639)
-3.114
(0.106)
ADF – I(1) PP – I(1)
Variable Constant Constantand
Trend Constant
Constantand
Trend
Money Supply -16.453***
(0.000)
-16.502***
(0.000)
-17.406***
(0.000)
-17.835***
(0.000)
Interest Rate -4.846***
(0.0001)
-10.605***
(0.000)
-10.828***
(0.000)
-10.937***
(0.000)
BIST 100 Index -12.792***
(0.000)
-12.753***
(0.000)
-12.792***
(0.000)
-12.754***
(0.000)
Notes: Mac Kinnon (1996) one-sided p values.*** and * represent 1% and 10% significance level
respectively.
When the unit root test results are examined, it is found that all three series are statistically
significant and stationary both for ADF and PP tests.
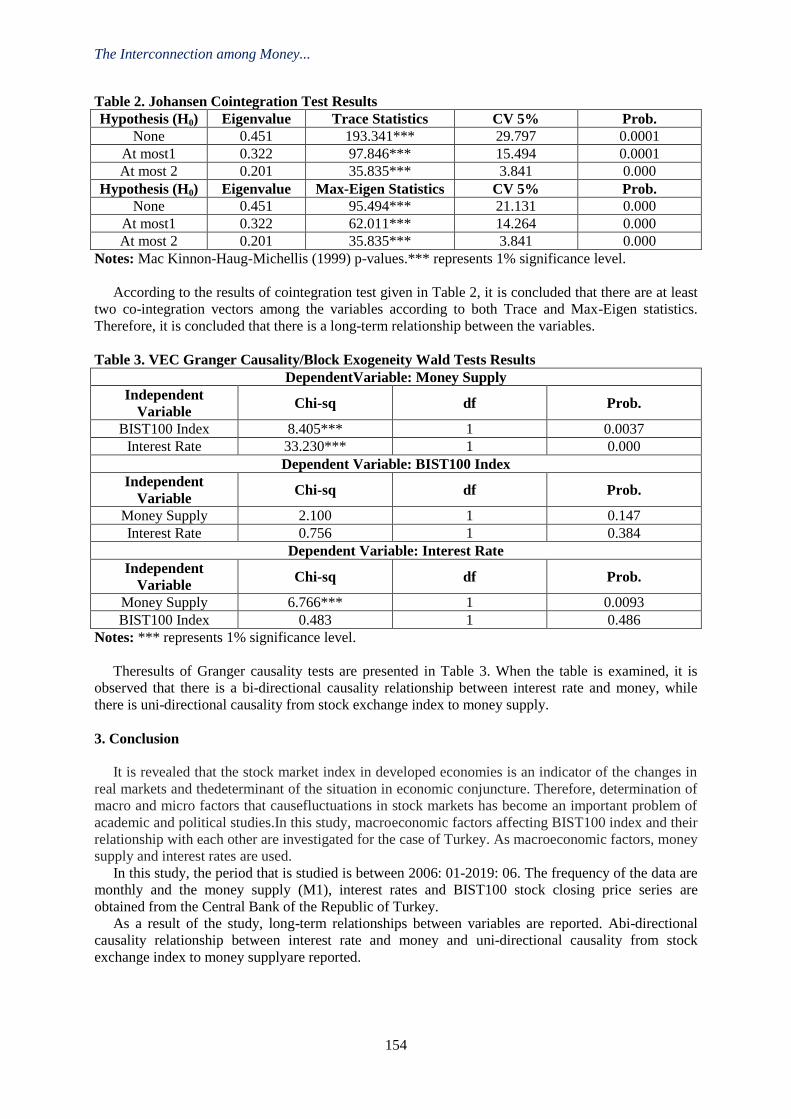
The Interconnection among Money...
154
Table 2. Johansen Cointegration Test Results
Hypothesis (H0) Eigenvalue Trace Statistics CV 5% Prob.
None 0.451 193.341*** 29.797 0.0001
At most1 0.322 97.846*** 15.494 0.0001
At most 2 0.201 35.835*** 3.841 0.000
Hypothesis (H0) Eigenvalue Max-Eigen Statistics CV 5% Prob.
None 0.451 95.494*** 21.131 0.000
At most1 0.322 62.011*** 14.264 0.000
At most 2 0.201 35.835*** 3.841 0.000
Notes: Mac Kinnon-Haug-Michellis (1999) p-values.*** represents 1% significance level.
According to the results of cointegration test given in Table 2, it is concluded that there are at least
two co-integration vectors among the variables according to both Trace and Max-Eigen statistics.
Therefore, it is concluded that there is a long-term relationship between the variables.
Table 3. VEC Granger Causality/Block Exogeneity Wald Tests Results
DependentVariable: Money Supply
Independent
Variable Chi-sq df Prob.
BIST100 Index 8.405*** 1 0.0037
Interest Rate 33.230*** 1 0.000
Dependent Variable: BIST100 Index
Independent
Variable Chi-sq df Prob.
Money Supply 2.100 1 0.147
Interest Rate 0.756 1 0.384
Dependent Variable: Interest Rate
Independent
Variable Chi-sq df Prob.
Money Supply 6.766*** 1 0.0093
BIST100 Index 0.483 1 0.486
Notes: *** represents 1% significance level.
Theresults of Granger causality tests are presented in Table 3. When the table is examined, it is
observed that there is a bi-directional causality relationship between interest rate and money, while
there is uni-directional causality from stock exchange index to money supply.
3. Conclusion
It is revealed that the stock market index in developed economies is an indicator of the changes in
real markets and thedeterminant of the situation in economic conjuncture. Therefore, determination of
macro and micro factors that causefluctuations in stock markets has become an important problem of
academic and political studies.In this study, macroeconomic factors affecting BIST100 index and their
relationship with each other are investigated for the case of Turkey. As macroeconomic factors, money
supply and interest rates are used.
In this study, the period that is studied is between 2006: 01-2019: 06. The frequency of the data are
monthly and the money supply (M1), interest rates and BIST100 stock closing price series are
obtained from the Central Bank of the Republic of Turkey.
As a result of the study, long-term relationships between variables are reported. Abi-directional
causality relationship between interest rate and money and uni-directional causality from stock
exchange index to money supplyare reported.
A. Kapusuzoglu, N. B. Ceylan and A. Memis
155
References
Alper, D.,& Kara, E. (2017). Borsa İstanbul'da hisse senedi getirilerini etkileyen makroekonomik
faktörler: BIST sınai endeksi üzerine bir araştırma. Suleyman Demirel UniversityJournal of Faculty
of Economics&AdministrativeSciences 22(3): 713-730.
Brigham, E. F.,& Houston, J. F. (2012). Fundamentals of Financial Management. Cengage Learning.
Dickey, D. A.,& Fuller, W. A. (1979). Distribution of theestimatorsforautoregressive time serieswith a
unitroot. Journal of theAmerican Statistical Association 74(366): 427-431.
Engle, R. F.,&Granger, C. W. (1987). Co-integrationanderrorcorrection: representation, estimation,
andtesting. Econometrica 55(2): 251-276.
Gan, C., Lee M., Yong, H. H. A. &Zhang, J. (2006). Macroeconomicvariablesandstockmarket
interactions: New ZealandEvidence, Investment Management and FinancialInnovations3(4): 89-
101.
Gujarati, D. N.,&Dawn, C. Porter. 2009. Basic Econometrics, 260-261.
Hashemzadeh, N. & Taylor, P. (1988). Stockprices, moneysupply, andinterestrates: Thequestion of
causality. AppliedEconomics 20(12): 1603-1611.
Hosseini S. M.,Ahmad, Z. &Lai, Y. W. (2011). The role of macroeconomicvariables on stock market
index in ChinaandIndia. International Journal of Economicsand Finance 3(6): 233-243.
Johansen, S. (1988). Statistical analysis of cointegrationvectors. Journal of Economic Dynamics and
Control 12(2-3): 231-254.
Kaya, V.,Comlekci, I. & Kara, O. (2013). Hisse senedi getirilerini etkileyen makroekonomik
değişkenler: 2002-2012 Türkiye örneği. Dumlupınar UniversityJournal of SocialSciences 35: 167-
176.
Liu, M. H. &Shrestha, K. M. (2008). Analysis of the long-term relationship between macroeconomic
variables and the Chinese stock market using heteroscedastic cointegration. Managerial Finance
34:744-755.
MacKinnon, J. G. (1996). Numerical distribution functions for unitroot and cointegration tests. Journal
of Applied Econometrics 11: 601-618.
MacKinnon, J. G., Haug, A. A. & Michelis, L. (1999). Numerical distribution functions of likelihood
ratio tests for cointegration. Journal of Applied Econometrics 14: 563-577.
Ozcan, A. (2012). The relationship between macroeconomic variables and ISE industry
index. International Journal of Economics and Financial Issues 2(2):184-189.
Palmer, M. (1970). Money supply, portfolio adjustments and stock prices. Financial Analyst Journal
26(4):19-22.
Patra, T. & Poshakwale, S. (2006). Economic variables and stock market returns: Evidence from the
Athens Stock Exchange. Applied Financial Economics 16:993-1005
Phillips, P. C. B., &Perron, P. (1988). Testing for a unitroot in time series regression. Biometrika
75(2): 335-346.
Sprinkel, B. W. (1964). Money and Stock Prices. Home wood, Illinois: Richard D Irwin, Inc.
Wong, W. K., Khan, H., &Du, J. (2005). Money, interest rate, and stock prices: New evidence from
Singapore and the United States. National University of Singapore Deparment of Economics U21
Global Working Paper, No: 007/2005.
Wongbangpoa, P., & Sharma, S. (2002). Stock market and macroeconomic fundamental dynamic
interactions: ASEAN-5 countries. Journal of Asian Economics 13(1): 27- 51.
Zivot, E. &Andrews, D.W.K. (1992). Further evidence on the great crash, the oil-price shock, and the
unit-root hypothesis. Journal of Business and Economic Statistics 10: 251-70.
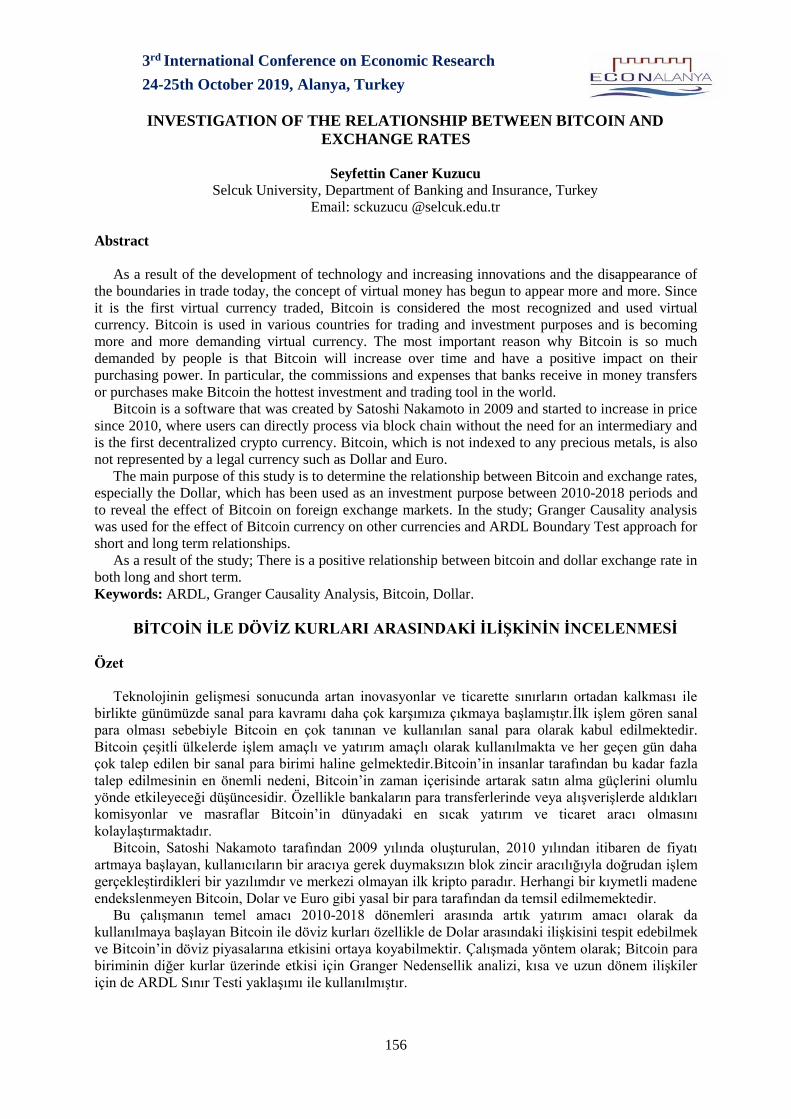
3rd International Conference on Economic Research
24-25th October 2019, Alanya, Turkey
156
INVESTIGATION OF THE RELATIONSHIP BETWEEN BITCOIN AND
EXCHANGE RATES
Seyfettin Caner Kuzucu
Selcuk University, Department of Banking and Insurance, Turkey
Email: [email protected]
Abstract
As a result of the development of technology and increasing innovations and the disappearance of
the boundaries in trade today, the concept of virtual money has begun to appear more and more. Since
it is the first virtual currency traded, Bitcoin is considered the most recognized and used virtual
currency. Bitcoin is used in various countries for trading and investment purposes and is becoming
more and more demanding virtual currency. The most important reason why Bitcoin is so much
demanded by people is that Bitcoin will increase over time and have a positive impact on their
purchasing power. In particular, the commissions and expenses that banks receive in money transfers
or purchases make Bitcoin the hottest investment and trading tool in the world.
Bitcoin is a software that was created by Satoshi Nakamoto in 2009 and started to increase in price
since 2010, where users can directly process via block chain without the need for an intermediary and
is the first decentralized crypto currency. Bitcoin, which is not indexed to any precious metals, is also
not represented by a legal currency such as Dollar and Euro.
The main purpose of this study is to determine the relationship between Bitcoin and exchange rates,
especially the Dollar, which has been used as an investment purpose between 2010-2018 periods and
to reveal the effect of Bitcoin on foreign exchange markets. In the study; Granger Causality analysis
was used for the effect of Bitcoin currency on other currencies and ARDL Boundary Test approach for
short and long term relationships.
As a result of the study; There is a positive relationship between bitcoin and dollar exchange rate in
both long and short term.
Keywords: ARDL, Granger Causality Analysis, Bitcoin, Dollar.
BİTCOİN İLE DÖVİZ KURLARI ARASINDAKİ İLİŞKİNİN İNCELENMESİ
Özet
Teknolojinin gelişmesi sonucunda artan inovasyonlar ve ticarette sınırların ortadan kalkması ile
birlikte günümüzde sanal para kavramı daha çok karşımıza çıkmaya başlamıştır.İlk işlem gören sanal
para olması sebebiyle Bitcoin en çok tanınan ve kullanılan sanal para olarak kabul edilmektedir.
Bitcoin çeşitli ülkelerde işlem amaçlı ve yatırım amaçlı olarak kullanılmakta ve her geçen gün daha
çok talep edilen bir sanal para birimi haline gelmektedir.Bitcoin’in insanlar tarafından bu kadar fazla
talep edilmesinin en önemli nedeni, Bitcoin’in zaman içerisinde artarak satın alma güçlerini olumlu
yönde etkileyeceği düşüncesidir. Özellikle bankaların para transferlerinde veya alışverişlerde aldıkları
komisyonlar ve masraflar Bitcoin’in dünyadaki en sıcak yatırım ve ticaret aracı olmasını
kolaylaştırmaktadır.
Bitcoin, Satoshi Nakamoto tarafından 2009 yılında oluşturulan, 2010 yılından itibaren de fiyatı
artmaya başlayan, kullanıcıların bir aracıya gerek duymaksızın blok zincir aracılığıyla doğrudan işlem
gerçekleştirdikleri bir yazılımdır ve merkezi olmayan ilk kripto paradır. Herhangi bir kıymetli madene
endekslenmeyen Bitcoin, Dolar ve Euro gibi yasal bir para tarafından da temsil edilmemektedir.
Bu çalışmanın temel amacı 2010-2018 dönemleri arasında artık yatırım amacı olarak da
kullanılmaya başlayan Bitcoin ile döviz kurları özellikle de Dolar arasındaki ilişkisini tespit edebilmek
ve Bitcoin’in döviz piyasalarına etkisini ortaya koyabilmektir. Çalışmada yöntem olarak; Bitcoin para
biriminin diğer kurlar üzerinde etkisi için Granger Nedensellik analizi, kısa ve uzun dönem ilişkiler
için de ARDL Sınır Testi yaklaşımı ile kullanılmıştır.
Investigation of the Relationship between...
157
Çalışmanın sonucunda; Bitcoin ile dolar kuru arasında hem uzun hem de kısa dönemde pozitif
yönlü bir ilişkinin olduğu diğer bir ifade ile her iki değişkenin de uzun dönemde birlikte hareket ettiği
ve söz konusu iki değişken arasında çift yönlü nedensellik ilişkisi tespit edilmiştir.
Anahtar Kelimeler: ARDL, Granger Nedensellik Analizi, Bitcoin, Dolar.
1. Giriş
Teknolojinin gelişmesi sonucunda artan inovasyonlar ve ticarette sınırların ortadan kalkması ile
birlikte günümüzde sanal para kavramı daha çok karşımıza çıkmaya başlamıştır. İlk işlem gören sanal
para olması sebebiyle Bitcoin en çok tanınan ve kullanılan sanal para olarak kabul edilmektedir.
Bitcoin çeşitli ülkelerde işlem amaçlı ve yatırım amaçlı olarak kullanılmakta ve her geçen gün daha
çok talep edilen bir sanal para birimi haline gelmektedir. Bitcoin’in insanlar tarafından bu kadar fazla
talep edilmesinin en önemli nedeni, Bitcoin’in zaman içerisinde artarak satın alma güçlerini olumlu
yönde etkileyeceği düşüncesidir. Özellikle bankaların para transferlerinde veya alışverişlerde aldıkları
komisyonlar ve masraflar Bitcoin’in dünyadaki en sıcak yatırım ve ticaret aracı olmasını
kolaylaştırmaktadır.
Bitcoin, Satoshi Nakamoto tarafından 2009 yılında oluşturulan, 2010 yılından itibaren de fiyatı
artmaya başlayan, kullanıcıların bir aracıya gerek duymaksızın blok zincir aracılığıyla doğrudan işlem
gerçekleştirdikleri bir yazılımdır ve merkezi olmayan ilk kripto paradır. Herhangi bir kıymetli madene
endekslenmeyen Bitcoin, Dolar ve Euro gibi yasal bir para tarafından da temsil edilmemektedir.
2. Literatür
Li ve Wang (2017, s.49), çalışmalarında ARDL modelini kullanmışlar, MtGox’un kapanmasından
önceki ve sonraki dönemi ayrı ayrı incelemişlerdir. Çalışmada elde edilen sonuçlara göre kısa
dönemde Bitcoin kuru ekonomik temellere ve piyasa koşullarına uyum sağlamaktadır. MtGox
kapandıktan sonra Bitcoin kuru uzun dönemde ekonomik temellere daha duyarlı ve teknolojik
faktörlere daha az duyarlı hale gelmiştir.
Bhattacahjee de çalışmasında (2016, s.9), Bitcoin dalgalanmalarının diğer para birimlerine kıyasla
çok daha fazla olduğunu, hesap birimi ve servet birimi olan diğer para birimleriyle Bitcoin’in hiçbir
ilişkisinin olmadığını ortaya koymuştur. Nakamoto (2008), Plassaras (2013), Beer, Beet ve Weber
(2014), Casey, Vigra (2015), Hockstein (2015), Burnett (2015) ve Tsuterman (2015) Bitcoin’in dolar
üzerindeki etkisini analiz etmiş ve söz konusu değişkenler arası bir ilişkinin varlığını tespit
edememişlerdir (Seetharaman vd., 2017, s.232-234). Szetela, Mentel ve Gedek (2016), ARMA ve
GARCH modellerini kullanarak Bitcoin, Dolar, Euro, İngiliz Pound’u, Yuan ve Polonya Zlotisinin
getiri oranları arasındaki ilişkiyi incelemişlerdir. Çalışmalarının sonucunda GARCH modeline göre
Bitcoin ile Dolar, Euro ve Yuan arasında koşullu varyans açıklamasında bir bağımlılık tespit
edilmesine rağmen, ARMA analizinde Bitcoin ile diğer değişkenler arasında bir ilişkinin varlığına
rastlanılmamıştır (Szetela, Mentel ve Gedek, 2016, s.133).
Baur, Dimplfl ve Kuck (2017), GARCH volatilite analizini uyguladıkları çalışmalarında, Bitcoin
ile Dolar arasında bir ilişki olmadığını ortaya koymuş, Bitcoin getirilerinin diğer varlık getirilerinden
bağımsız olduğunu, ancak US/İngiliz Poundu kurunun haftalık dalgalanmasıyla ufak da olsa negatif
bir ilişkinin olduğunu tespit etmiştir (Baur, Dimplfl ve Kuck, 2017, s.13).
Carrick (2016, s.2328), Bitcoin’in Çin Yuanı hariç diğer para birimleriyle istatistiki olarak negatif
ilişkili olduğunu ortaya koymuştur. Bir başka çalışma, dolaşımdaki Bitcoin miktarının artmasının
Amerikan Dolarının değerini düşürdüğünü ortaya koymuştur. Buna göre dolaşımdaki bitcoinin sayısı 1
milyon adet daha fazla olduğunda, Euro/USD kuru %6,1 daha fazla artmaktadır (Khvan, 2016, s.11).
Dyhrberg ise (2015, s.6), Bitcoin’in değerinin Pound/Dolar paritesine karşı, Euro/Dolar paritesine göre
daha duyarlı olduğu da ortaya konmuştur.
Pekkaya ve Bayramoğlu (2008) benzer bir şekilde çalışmalarında 1990-2007 arasında YTL/USD
döviz kuru, İMKB 100 ve S&P 500 endeksini kullanarak yaptıkları araştırmalarında, İMKB100 ve
S&P 500’den dolara granger nedenselliği, dolar ile İMKB100 arasında çift yönlü bir nedensellik
ilişkisi tespit edilmiştir.
Cheung, Roca ve Su (2015) tarafından yapılan çalışmada ise sağlam (robust) ekonometrik
tekniklerle Bitcoin pazarındaki balonların (bubbles) varlığı incelenmiştir. Çalışmada, 2010-2014
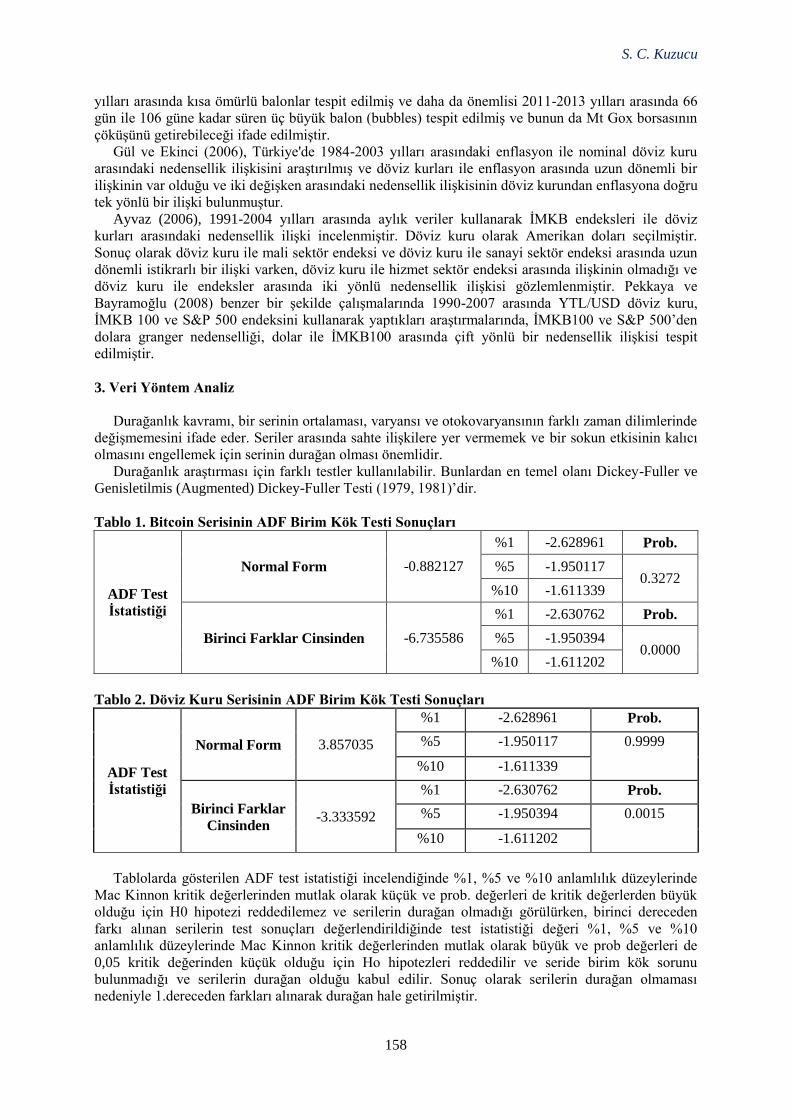
S. C. Kuzucu
158
yılları arasında kısa ömürlü balonlar tespit edilmiş ve daha da önemlisi 2011-2013 yılları arasında 66
gün ile 106 güne kadar süren üç büyük balon (bubbles) tespit edilmiş ve bunun da Mt Gox borsasının
çöküşünü getirebileceği ifade edilmiştir.
Gül ve Ekinci (2006), Türkiye'de 1984-2003 yılları arasındaki enflasyon ile nominal döviz kuru
arasındaki nedensellik ilişkisini araştırılmış ve döviz kurları ile enflasyon arasında uzun dönemli bir
ilişkinin var olduğu ve iki değişken arasındaki nedensellik ilişkisinin döviz kurundan enflasyona doğru
tek yönlü bir ilişki bulunmuştur.
Ayvaz (2006), 1991-2004 yılları arasında aylık veriler kullanarak İMKB endeksleri ile döviz
kurları arasındaki nedensellik ilişki incelenmiştir. Döviz kuru olarak Amerikan doları seçilmiştir.
Sonuç olarak döviz kuru ile mali sektör endeksi ve döviz kuru ile sanayi sektör endeksi arasında uzun
dönemli istikrarlı bir ilişki varken, döviz kuru ile hizmet sektör endeksi arasında ilişkinin olmadığı ve
döviz kuru ile endeksler arasında iki yönlü nedensellik ilişkisi gözlemlenmiştir. Pekkaya ve
Bayramoğlu (2008) benzer bir şekilde çalışmalarında 1990-2007 arasında YTL/USD döviz kuru,
İMKB 100 ve S&P 500 endeksini kullanarak yaptıkları araştırmalarında, İMKB100 ve S&P 500’den
dolara granger nedenselliği, dolar ile İMKB100 arasında çift yönlü bir nedensellik ilişkisi tespit
edilmiştir.
3. Veri Yöntem Analiz
Durağanlık kavramı, bir serinin ortalaması, varyansı ve otokovaryansının farklı zaman dilimlerinde
değişmemesini ifade eder. Seriler arasında sahte ilişkilere yer vermemek ve bir sokun etkisinin kalıcı
olmasını engellemek için serinin durağan olması önemlidir.
Durağanlık araştırması için farklı testler kullanılabilir. Bunlardan en temel olanı Dickey-Fuller ve
Genisletilmis (Augmented) Dickey-Fuller Testi (1979, 1981)’dir.
Tablo 1. Bitcoin Serisinin ADF Birim Kök Testi Sonuçları
ADF Test
İstatistiği
Normal Form -0.882127
%1 -2.628961 Prob.
%5 -1.950117 0.3272
%10 -1.611339
Birinci Farklar Cinsinden -6.735586
%1 -2.630762 Prob.
%5 -1.950394 0.0000
%10 -1.611202
Tablo 2. Döviz Kuru Serisinin ADF Birim Kök Testi Sonuçları
ADF Test
İstatistiği
Normal Form 3.857035
%1 -2.628961 Prob.
%5 -1.950117 0.9999
%10 -1.611339
Birinci Farklar
Cinsinden -3.333592
%1 -2.630762 Prob.
%5 -1.950394 0.0015
%10 -1.611202
Tablolarda gösterilen ADF test istatistiği incelendiğinde %1, %5 ve %10 anlamlılık düzeylerinde
Mac Kinnon kritik değerlerinden mutlak olarak küçük ve prob. değerleri de kritik değerlerden büyük
olduğu için H0 hipotezi reddedilemez ve serilerin durağan olmadığı görülürken, birinci dereceden
farkı alınan serilerin test sonuçları değerlendirildiğinde test istatistiği değeri %1, %5 ve %10
anlamlılık düzeylerinde Mac Kinnon kritik değerlerinden mutlak olarak büyük ve prob değerleri de
0,05 kritik değerinden küçük olduğu için Ho hipotezleri reddedilir ve seride birim kök sorunu
bulunmadığı ve serilerin durağan olduğu kabul edilir. Sonuç olarak serilerin durağan olmaması
nedeniyle 1.dereceden farkları alınarak durağan hale getirilmiştir.
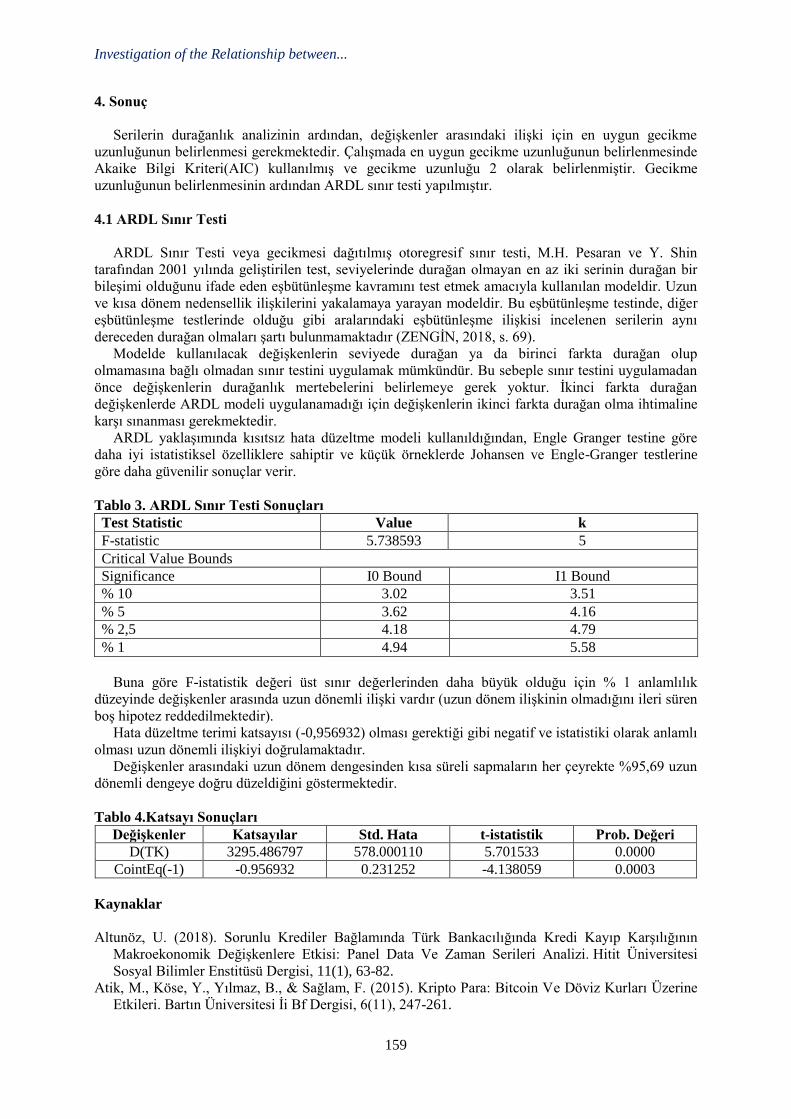
Investigation of the Relationship between...
159
4. Sonuç
Serilerin durağanlık analizinin ardından, değişkenler arasındaki ilişki için en uygun gecikme
uzunluğunun belirlenmesi gerekmektedir. Çalışmada en uygun gecikme uzunluğunun belirlenmesinde
Akaike Bilgi Kriteri(AIC) kullanılmış ve gecikme uzunluğu 2 olarak belirlenmiştir. Gecikme
uzunluğunun belirlenmesinin ardından ARDL sınır testi yapılmıştır.
4.1 ARDL Sınır Testi
ARDL Sınır Testi veya gecikmesi dağıtılmış otoregresif sınır testi, M.H. Pesaran ve Y. Shin
tarafından 2001 yılında geliştirilen test, seviyelerinde durağan olmayan en az iki serinin durağan bir
bileşimi olduğunu ifade eden eşbütünleşme kavramını test etmek amacıyla kullanılan modeldir. Uzun
ve kısa dönem nedensellik ilişkilerini yakalamaya yarayan modeldir. Bu eşbütünleşme testinde, diğer
eşbütünleşme testlerinde olduğu gibi aralarındaki eşbütünleşme ilişkisi incelenen serilerin aynı
dereceden durağan olmaları şartı bulunmamaktadır (ZENGİN, 2018, s. 69).
Modelde kullanılacak değişkenlerin seviyede durağan ya da birinci farkta durağan olup
olmamasına bağlı olmadan sınır testini uygulamak mümkündür. Bu sebeple sınır testini uygulamadan
önce değişkenlerin durağanlık mertebelerini belirlemeye gerek yoktur. İkinci farkta durağan
değişkenlerde ARDL modeli uygulanamadığı için değişkenlerin ikinci farkta durağan olma ihtimaline
karşı sınanması gerekmektedir.
ARDL yaklaşımında kısıtsız hata düzeltme modeli kullanıldığından, Engle Granger testine göre
daha iyi istatistiksel özelliklere sahiptir ve küçük örneklerde Johansen ve Engle-Granger testlerine
göre daha güvenilir sonuçlar verir.
Tablo 3. ARDL Sınır Testi Sonuçları
Test Statistic Value k
F-statistic 5.738593 5
Critical Value Bounds
Significance I0 Bound I1 Bound
% 10 3.02 3.51
% 5 3.62 4.16
% 2,5 4.18 4.79
% 1 4.94 5.58
Buna göre F-istatistik değeri üst sınır değerlerinden daha büyük olduğu için % 1 anlamlılık
düzeyinde değişkenler arasında uzun dönemli ilişki vardır (uzun dönem ilişkinin olmadığını ileri süren
boş hipotez reddedilmektedir).
Hata düzeltme terimi katsayısı (-0,956932) olması gerektiği gibi negatif ve istatistiki olarak anlamlı
olması uzun dönemli ilişkiyi doğrulamaktadır.
Değişkenler arasındaki uzun dönem dengesinden kısa süreli sapmaların her çeyrekte %95,69 uzun
dönemli dengeye doğru düzeldiğini göstermektedir.
Tablo 4.Katsayı Sonuçları
Değişkenler Katsayılar Std. Hata t-istatistik Prob. Değeri
D(TK) 3295.486797 578.000110 5.701533 0.0000
CointEq(-1) -0.956932 0.231252 -4.138059 0.0003
Kaynaklar
Altunöz, U. (2018). Sorunlu Krediler Bağlamında Türk Bankacılığında Kredi Kayıp Karşılığının
Makroekonomik Değişkenlere Etkisi: Panel Data Ve Zaman Serileri Analizi. Hitit Üniversitesi
Sosyal Bilimler Enstitüsü Dergisi, 11(1), 63-82.
Atik, M., Köse, Y., Yılmaz, B., & Sağlam, F. (2015). Kripto Para: Bitcoin Ve Döviz Kurları Üzerine
Etkileri. Bartın Üniversitesi İi Bf Dergisi, 6(11), 247-261.

S. C. Kuzucu
160
Çütcü, Ö. Ü. İ., & Kılıç, Ö. Ü. Y. Bitcoin Fiyatları İle Dolar Kuru Arasındaki İlişki: Yapısal Kırılmalı
Zaman Serisi Analizi.
Güleç, Ö. F. (2018). Bitcoin İle Finansal Göstergeler Arasindaki İlişkinin İncelenmesi. Kırklareli
Üniversitesi İktisadi Ve İdari Bilimler Fakültesi Dergisi, 7(2), 18-37.
İçellioğlu, C. Ş., & Öztürk, M. B. E. (2018). Bitcoin Ile Seçili Döviz Kurları Arasındaki Ilişkinin
Araştırılması: 2013-2017 Dönemi Için Johansen Testi Ve Granger Nedensellik Testi. Maliye Ve
Finans Yazıları, 1(109), 51-70.
Selimler, H. (2015). Sorunlu Kredilerin Analizi, Banka Finansal Tablo Ve Oranlarına Etkisinin
Değerlendirilmesi.
Zengin, B. (2018, Temmuz). Türkiye’de Bireysel Emeklilik Sistemi Ve Ekonomik Büyüme
Arasındaki İlişkinin Ampirik Analizi. Ankara: Gazi Üniversitesi Sosyal Bilimler Enstitüsü.
3rd International Conference on Economic Research
24-25th October 2019, Alanya, Turkey
161
ANALYSIS OF RELATIONSHIP BETWEEN THE INDICATORS OF MONEY
SUPPLY AND INFLATION: THE CASE OF TURKEY
Yıldız Özkök
Hasan Kalyoncu University, Turkey, Email: [email protected]
Abstract
Today, the most important objective of the Central Bank is to maintain the price stability.
Accordingly, the Central Banks intervene in the money market by using the monetary policy tools
which they have. There is close relationship between the money supply and the balance sheets of
central banks. The analytical balance sheet that is derived from the CB’s balance sheet in order to make it more understandable and simple enables monitoring of certain monetary aggregates easily.
When we look at the analytical balance sheet of the Central Bank, we see that the reserve money is
one of the most important indicators of the monetary policy of the central bank. In other words, a change in reserve money is a significant source that can be traced about money supply and thus
monetary policy. In this context, an increase in reserve money is interpreted as an expansionary
monetary policy, whereas a decrease is interpreted as a contractionary monetary policy, economically. On the other hand, open market operations are the fastest monetary policy instrument used by the
Central Bank so as to increase and decrease liquidity in the market. The Central Bank tries to control
the money supply by using the monetary base which is the sum of reserve money and open market
operations. In this study, first of all, why the reserve money is important for the economy, the items of the reserve money and the content and importance of the monetary base will be emphasized. Then,
change in reserve money, open market operations and monetary base from 2000 to the present will be
analyzed.by examining the Republic of Turkey Central Bank's analytical balance sheet. Accordingly, the relationship between the inflation and, the reserve Money and the monetary base which are the
most important indicators of money supply for the Central Bank will be analyzed after the year 2000.
As a result, the monetary policies had been applied during the economic crisis in 2001 and the global economic crisis in 2008 will be analyzed.
Keywords: Monney Supply, Reserve Money, Open Market Operations, Monetary Base, Inflation.
PARA ARZI GÖSTERGELERİ İLE ENFLASYON ARASINDAKİ İLİŞKİNİN
ANALİZİ: TÜRKİYE ÖRNEĞİ
Özet
Günümüzde, Merkez Bankası’nın en önemli hedefi fiyat istikrarını sürdürmektir. Bu doğrultuda, Merkez Bankası elindeki para politikası araçlarını kullanarak para piyasasına müdahale eder. Para arzı
ile merkez bankalarının bilançoları arasında ise çok sıkı bir ilişki vardır. Merkez bankası bilançosu
daha anlaşılabilir ve basit hale getirilerek elde edilen analitik bilanço, belirli parasal büyüklüklerin
daha kolay izlenebilmesini sağlamaktadır. Merkez Bankası analitik bilançosuna baktığımızda, rezerv paranın merkez bankasının uyguladığı para politikasının en önemli göstergelerinden biri olduğunu
görmekteyiz. Diğer yandan açık piyasa işlemleri de Merkez Bankası’nın piyasadaki likiditeyi hem
arttırmak hem de azaltmak amacıyla kullandığı en hızlı para politikası aracıdır. Bu bağlamda, iktisadi açıdan rezerv paradaki artış genişletici para politikası; azalış ise daraltıcı para politikası uygulaması
olarak yorumlanmaktadır. Diğer bir deyişle, rezerv paradaki değişim para arzı ve dolayısıyla
uygulanan para politikası ile ilgili izlenebilir önemli bir kaynaktır. Merkez Bankası, rezerv para ile açık piyasa işlemlerinin toplamından oluşan parasal tabanı kullanarak para arzını kontrol etmeye
çalışır. Bu çalışmada, öncelikle rezerv paranın ekonomi için neden önemli olduğu, rezerv paranın
hangi kalemlerden oluştuğu ve parasal tabanın içeriği ile önemi üzerinde durulacak. Daha sonra,
Türkiye Cumhuriyeti Merkez Bankası’nın analitik bilançosu incelenerek rezerv para, açık piyasa işlemleri ve parasal tabanın 2000 yılından günümüze kadar olan değişimi analiz edilecek. Bu
doğrultuda, 2000 yılı sonrasında Merkez Bankası açısında para arzının en önemli göstergeleri olan
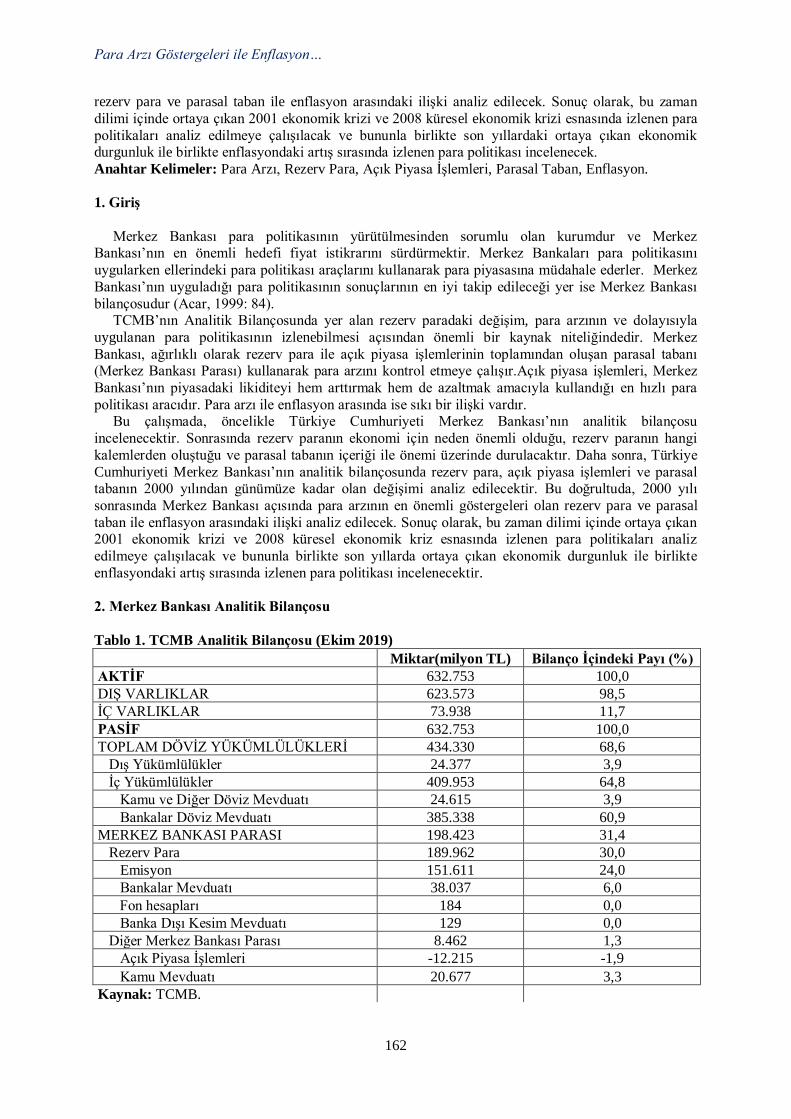
Para Arzı Göstergeleri ile Enflasyon…
162
rezerv para ve parasal taban ile enflasyon arasındaki ilişki analiz edilecek. Sonuç olarak, bu zaman
dilimi içinde ortaya çıkan 2001 ekonomik krizi ve 2008 küresel ekonomik krizi esnasında izlenen para
politikaları analiz edilmeye çalışılacak ve bununla birlikte son yıllardaki ortaya çıkan ekonomik durgunluk ile birlikte enflasyondaki artış sırasında izlenen para politikası incelenecek.
Anahtar Kelimeler: Para Arzı, Rezerv Para, Açık Piyasa İşlemleri, Parasal Taban, Enflasyon.
1. Giriş
Merkez Bankası para politikasının yürütülmesinden sorumlu olan kurumdur ve Merkez Bankası’nın en önemli hedefi fiyat istikrarını sürdürmektir. Merkez Bankaları para politikasını
uygularken ellerindeki para politikası araçlarını kullanarak para piyasasına müdahale ederler. Merkez
Bankası’nın uyguladığı para politikasının sonuçlarının en iyi takip edileceği yer ise Merkez Bankası
bilançosudur (Acar, 1999: 84). TCMB’nın Analitik Bilançosunda yer alan rezerv paradaki değişim, para arzının ve dolayısıyla
uygulanan para politikasının izlenebilmesi açısından önemli bir kaynak niteliğindedir. Merkez
Bankası, ağırlıklı olarak rezerv para ile açık piyasa işlemlerinin toplamından oluşan parasal tabanı (Merkez Bankası Parası) kullanarak para arzını kontrol etmeye çalışır.Açık piyasa işlemleri, Merkez
Bankası’nın piyasadaki likiditeyi hem arttırmak hem de azaltmak amacıyla kullandığı en hızlı para
politikası aracıdır. Para arzı ile enflasyon arasında ise sıkı bir ilişki vardır. Bu çalışmada, öncelikle Türkiye Cumhuriyeti Merkez Bankası’nın analitik bilançosu
incelenecektir. Sonrasında rezerv paranın ekonomi için neden önemli olduğu, rezerv paranın hangi
kalemlerden oluştuğu ve parasal tabanın içeriği ile önemi üzerinde durulacaktır. Daha sonra, Türkiye
Cumhuriyeti Merkez Bankası’nın analitik bilançosunda rezerv para, açık piyasa işlemleri ve parasal tabanın 2000 yılından günümüze kadar olan değişimi analiz edilecektir. Bu doğrultuda, 2000 yılı
sonrasında Merkez Bankası açısında para arzının en önemli göstergeleri olan rezerv para ve parasal
taban ile enflasyon arasındaki ilişki analiz edilecek. Sonuç olarak, bu zaman dilimi içinde ortaya çıkan 2001 ekonomik krizi ve 2008 küresel ekonomik kriz esnasında izlenen para politikaları analiz
edilmeye çalışılacak ve bununla birlikte son yıllarda ortaya çıkan ekonomik durgunluk ile birlikte
enflasyondaki artış sırasında izlenen para politikası incelenecektir.
2. Merkez Bankası Analitik Bilançosu
Tablo 1. TCMB Analitik Bilançosu (Ekim 2019)
Miktar(milyon TL) Bilanço İçindeki Payı (%)
AKTİF 632.753 100,0
DIŞ VARLIKLAR 623.573 98,5
İÇ VARLIKLAR 73.938 11,7
PASİF 632.753 100,0
TOPLAM DÖVİZ YÜKÜMLÜLÜKLERİ 434.330 68,6
Dış Yükümlülükler 24.377 3,9
İç Yükümlülükler 409.953 64,8
Kamu ve Diğer Döviz Mevduatı 24.615 3,9
Bankalar Döviz Mevduatı 385.338 60,9
MERKEZ BANKASI PARASI 198.423 31,4
Rezerv Para 189.962 30,0
Emisyon 151.611 24,0
Bankalar Mevduatı 38.037 6,0
Fon hesapları 184 0,0
Banka Dışı Kesim Mevduatı 129 0,0
Diğer Merkez Bankası Parası 8.462 1,3
Açık Piyasa İşlemleri -12.215 -1,9
Kamu Mevduatı 20.677 3,3
Kaynak: TCMB.
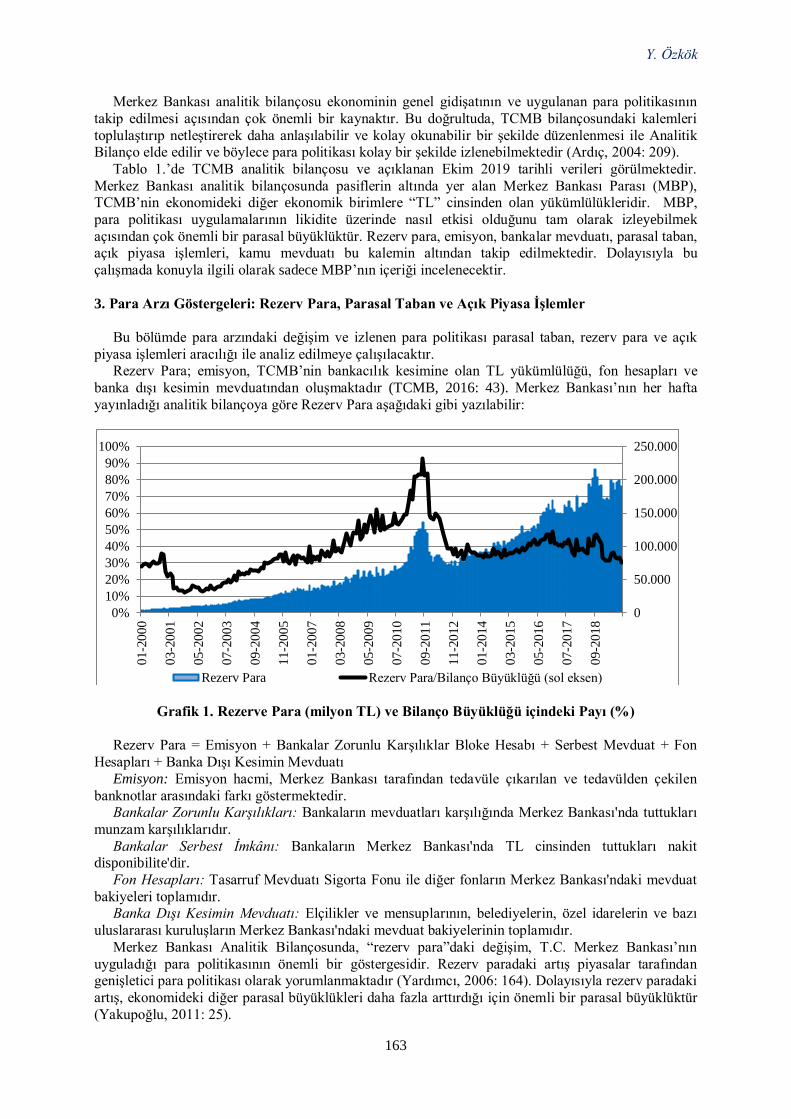
Y. Özkök
163
Merkez Bankası analitik bilançosu ekonominin genel gidişatının ve uygulanan para politikasının
takip edilmesi açısından çok önemli bir kaynaktır. Bu doğrultuda, TCMB bilançosundaki kalemleri
toplulaştırıp netleştirerek daha anlaşılabilir ve kolay okunabilir bir şekilde düzenlenmesi ile Analitik Bilanço elde edilir ve böylece para politikası kolay bir şekilde izlenebilmektedir (Ardıç, 2004: 209).
Tablo 1.’de TCMB analitik bilançosu ve açıklanan Ekim 2019 tarihli verileri görülmektedir.
Merkez Bankası analitik bilançosunda pasiflerin altında yer alan Merkez Bankası Parası (MBP), TCMB’nin ekonomideki diğer ekonomik birimlere “TL” cinsinden olan yükümlülükleridir. MBP,
para politikası uygulamalarının likidite üzerinde nasıl etkisi olduğunu tam olarak izleyebilmek
açısından çok önemli bir parasal büyüklüktür. Rezerv para, emisyon, bankalar mevduatı, parasal taban, açık piyasa işlemleri, kamu mevduatı bu kalemin altından takip edilmektedir. Dolayısıyla bu
çalışmada konuyla ilgili olarak sadece MBP’nın içeriği incelenecektir.
3. Para Arzı Göstergeleri: Rezerv Para, Parasal Taban ve Açık Piyasa İşlemler
Bu bölümde para arzındaki değişim ve izlenen para politikası parasal taban, rezerv para ve açık
piyasa işlemleri aracılığı ile analiz edilmeye çalışılacaktır. Rezerv Para; emisyon, TCMB’nin bankacılık kesimine olan TL yükümlülüğü, fon hesapları ve
banka dışı kesimin mevduatından oluşmaktadır (TCMB, 2016: 43). Merkez Bankası’nın her hafta
yayınladığı analitik bilançoya göre Rezerv Para aşağıdaki gibi yazılabilir:
Grafik 1. Rezerve Para (milyon TL) ve Bilanço Büyüklüğü içindeki Payı (%)
Rezerv Para = Emisyon + Bankalar Zorunlu Karşılıklar Bloke Hesabı + Serbest Mevduat + Fon
Hesapları + Banka Dışı Kesimin Mevduatı
Emisyon: Emisyon hacmi, Merkez Bankası tarafından tedavüle çıkarılan ve tedavülden çekilen
banknotlar arasındaki farkı göstermektedir. Bankalar Zorunlu Karşılıkları: Bankaların mevduatları karşılığında Merkez Bankası'nda tuttukları
munzam karşılıklarıdır.
Bankalar Serbest İmkânı: Bankaların Merkez Bankası'nda TL cinsinden tuttukları nakit disponibilite'dir.
Fon Hesapları: Tasarruf Mevduatı Sigorta Fonu ile diğer fonların Merkez Bankası'ndaki mevduat
bakiyeleri toplamıdır. Banka Dışı Kesimin Mevduatı: Elçilikler ve mensuplarının, belediyelerin, özel idarelerin ve bazı
uluslararası kuruluşların Merkez Bankası'ndaki mevduat bakiyelerinin toplamıdır.
Merkez Bankası Analitik Bilançosunda, “rezerv para”daki değişim, T.C. Merkez Bankası’nın
uyguladığı para politikasının önemli bir göstergesidir. Rezerv paradaki artış piyasalar tarafından genişletici para politikası olarak yorumlanmaktadır (Yardımcı, 2006: 164). Dolayısıyla rezerv paradaki
artış, ekonomideki diğer parasal büyüklükleri daha fazla arttırdığı için önemli bir parasal büyüklüktür
(Yakupoğlu, 2011: 25).
0
50.000
100.000
150.000
200.000
250.000
0%
10%
20%
30%
40%
50%
60%
70%
80%
90%
100%
01
-20
00
03
-20
01
05
-20
02
07
-20
03
09
-20
04
11
-20
05
01
-20
07
03
-20
08
05
-20
09
07
-20
10
09
-20
11
11
-20
12
01
-20
14
03
-20
15
05
-20
16
07
-20
17
09
-20
18
Rezerv Para Rezerv Para/Bilanço Büyüklüğü (sol eksen)
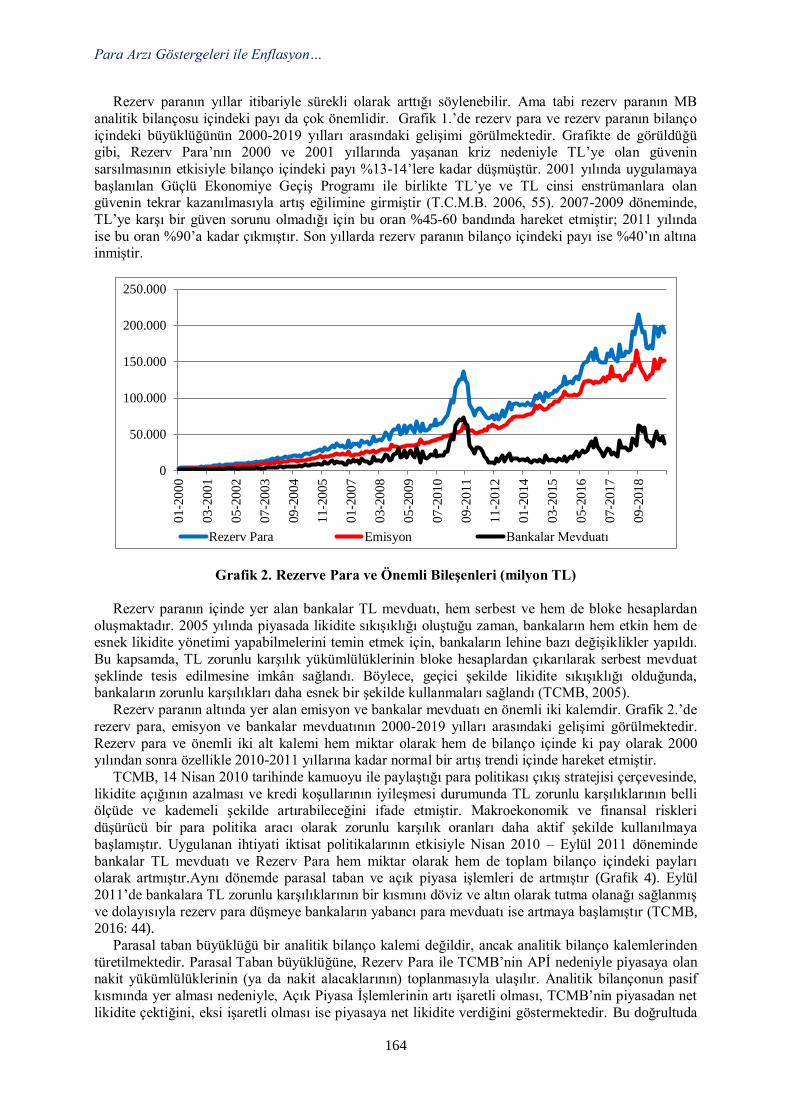
Para Arzı Göstergeleri ile Enflasyon…
164
Rezerv paranın yıllar itibariyle sürekli olarak arttığı söylenebilir. Ama tabi rezerv paranın MB
analitik bilançosu içindeki payı da çok önemlidir. Grafik 1.’de rezerv para ve rezerv paranın bilanço
içindeki büyüklüğünün 2000-2019 yılları arasındaki gelişimi görülmektedir. Grafikte de görüldüğü gibi, Rezerv Para’nın 2000 ve 2001 yıllarında yaşanan kriz nedeniyle TL’ye olan güvenin
sarsılmasının etkisiyle bilanço içindeki payı %13-14’lere kadar düşmüştür. 2001 yılında uygulamaya
başlanılan Güçlü Ekonomiye Geçiş Programı ile birlikte TL’ye ve TL cinsi enstrümanlara olan güvenin tekrar kazanılmasıyla artış eğilimine girmiştir (T.C.M.B. 2006, 55). 2007-2009 döneminde,
TL’ye karşı bir güven sorunu olmadığı için bu oran %45-60 bandında hareket etmiştir; 2011 yılında
ise bu oran %90’a kadar çıkmıştır. Son yıllarda rezerv paranın bilanço içindeki payı ise %40’ın altına inmiştir.
Grafik 2. Rezerve Para ve Önemli Bileşenleri (milyon TL)
Rezerv paranın içinde yer alan bankalar TL mevduatı, hem serbest ve hem de bloke hesaplardan
oluşmaktadır. 2005 yılında piyasada likidite sıkışıklığı oluştuğu zaman, bankaların hem etkin hem de esnek likidite yönetimi yapabilmelerini temin etmek için, bankaların lehine bazı değişiklikler yapıldı.
Bu kapsamda, TL zorunlu karşılık yükümlülüklerinin bloke hesaplardan çıkarılarak serbest mevduat
şeklinde tesis edilmesine imkân sağlandı. Böylece, geçici şekilde likidite sıkışıklığı olduğunda, bankaların zorunlu karşılıkları daha esnek bir şekilde kullanmaları sağlandı (TCMB, 2005).
Rezerv paranın altında yer alan emisyon ve bankalar mevduatı en önemli iki kalemdir. Grafik 2.’de
rezerv para, emisyon ve bankalar mevduatının 2000-2019 yılları arasındaki gelişimi görülmektedir.
Rezerv para ve önemli iki alt kalemi hem miktar olarak hem de bilanço içinde ki pay olarak 2000 yılından sonra özellikle 2010-2011 yıllarına kadar normal bir artış trendi içinde hareket etmiştir.
TCMB, 14 Nisan 2010 tarihinde kamuoyu ile paylaştığı para politikası çıkış stratejisi çerçevesinde,
likidite açığının azalması ve kredi koşullarının iyileşmesi durumunda TL zorunlu karşılıklarının belli ölçüde ve kademeli şekilde artırabileceğini ifade etmiştir. Makroekonomik ve finansal riskleri
düşürücü bir para politika aracı olarak zorunlu karşılık oranları daha aktif şekilde kullanılmaya
başlamıştır. Uygulanan ihtiyati iktisat politikalarının etkisiyle Nisan 2010 – Eylül 2011 döneminde
bankalar TL mevduatı ve Rezerv Para hem miktar olarak hem de toplam bilanço içindeki payları olarak artmıştır.Aynı dönemde parasal taban ve açık piyasa işlemleri de artmıştır (Grafik 4). Eylül
2011’de bankalara TL zorunlu karşılıklarının bir kısmını döviz ve altın olarak tutma olanağı sağlanmış
ve dolayısıyla rezerv para düşmeye bankaların yabancı para mevduatı ise artmaya başlamıştır (TCMB, 2016: 44).
Parasal taban büyüklüğü bir analitik bilanço kalemi değildir, ancak analitik bilanço kalemlerinden
türetilmektedir. Parasal Taban büyüklüğüne, Rezerv Para ile TCMB’nin APİ nedeniyle piyasaya olan nakit yükümlülüklerinin (ya da nakit alacaklarının) toplanmasıyla ulaşılır. Analitik bilançonun pasif
kısmında yer alması nedeniyle, Açık Piyasa İşlemlerinin artı işaretli olması, TCMB’nin piyasadan net
likidite çektiğini, eksi işaretli olması ise piyasaya net likidite verdiğini göstermektedir. Bu doğrultuda
0
50.000
100.000
150.000
200.000
250.000
01
-20
00
03
-20
01
05
-20
02
07
-20
03
09
-20
04
11
-20
05
01
-20
07
03
-20
08
05
-20
09
07
-20
10
09
-20
11
11
-20
12
01
-20
14
03
-20
15
05
-20
16
07
-20
17
09
-20
18
Rezerv Para Emisyon Bankalar Mevduatı
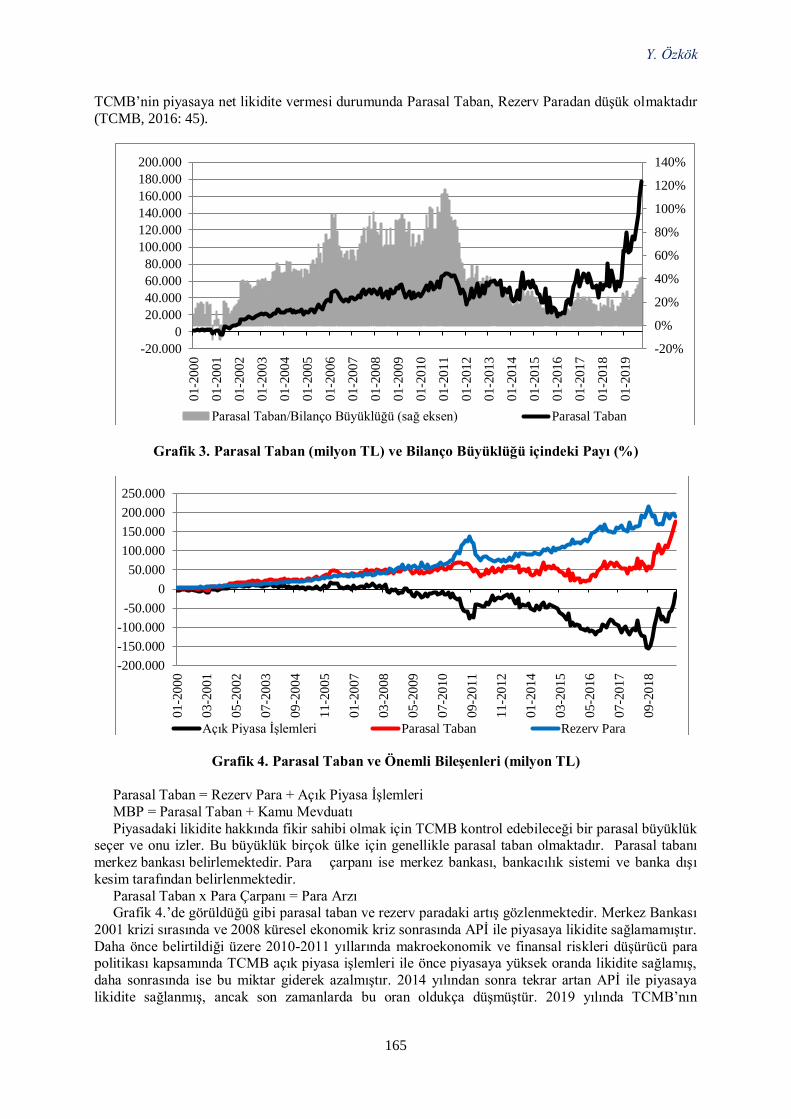
Y. Özkök
165
TCMB’nin piyasaya net likidite vermesi durumunda Parasal Taban, Rezerv Paradan düşük olmaktadır
(TCMB, 2016: 45).
Grafik 3. Parasal Taban (milyon TL) ve Bilanço Büyüklüğü içindeki Payı (%)
Grafik 4. Parasal Taban ve Önemli Bileşenleri (milyon TL)
Parasal Taban = Rezerv Para + Açık Piyasa İşlemleri
MBP = Parasal Taban + Kamu Mevduatı
Piyasadaki likidite hakkında fikir sahibi olmak için TCMB kontrol edebileceği bir parasal büyüklük seçer ve onu izler. Bu büyüklük birçok ülke için genellikle parasal taban olmaktadır. Parasal tabanı
merkez bankası belirlemektedir. Para çarpanı ise merkez bankası, bankacılık sistemi ve banka dışı
kesim tarafından belirlenmektedir.
Parasal Taban x Para Çarpanı = Para Arzı Grafik 4.’de görüldüğü gibi parasal taban ve rezerv paradaki artış gözlenmektedir. Merkez Bankası
2001 krizi sırasında ve 2008 küresel ekonomik kriz sonrasında APİ ile piyasaya likidite sağlamamıştır.
Daha önce belirtildiği üzere 2010-2011 yıllarında makroekonomik ve finansal riskleri düşürücü para politikası kapsamında TCMB açık piyasa işlemleri ile önce piyasaya yüksek oranda likidite sağlamış,
daha sonrasında ise bu miktar giderek azalmıştır. 2014 yılından sonra tekrar artan APİ ile piyasaya
likidite sağlanmış, ancak son zamanlarda bu oran oldukça düşmüştür. 2019 yılında TCMB’nın
-20%
0%
20%
40%
60%
80%
100%
120%
140%
-20.000
0
20.000
40.000
60.000
80.000
100.000
120.000
140.000
160.000
180.000
200.000
01-2
000
01-2
001
01-2
002
01-2
003
01-2
004
01
-20
05
01-2
006
01-2
007
01
-20
08
01-2
009
01-2
010
01
-20
11
01-2
012
01-2
013
01-2
014
01-2
015
01-2
016
01-2
017
01-2
018
01-2
019
Parasal Taban/Bilanço Büyüklüğü (sağ eksen) Parasal Taban
-200.000
-150.000
-100.000
-50.000
0
50.000
100.000
150.000
200.000
250.000
01
-20
00
03
-20
01
05
-20
02
07
-20
03
09
-20
04
11
-20
05
01
-20
07
03
-20
08
05
-20
09
07
-20
10
09
-20
11
11
-20
12
01
-20
14
03
-20
15
05
-20
16
07
-20
17
09
-20
18
Açık Piyasa İşlemleri Parasal Taban Rezerv Para
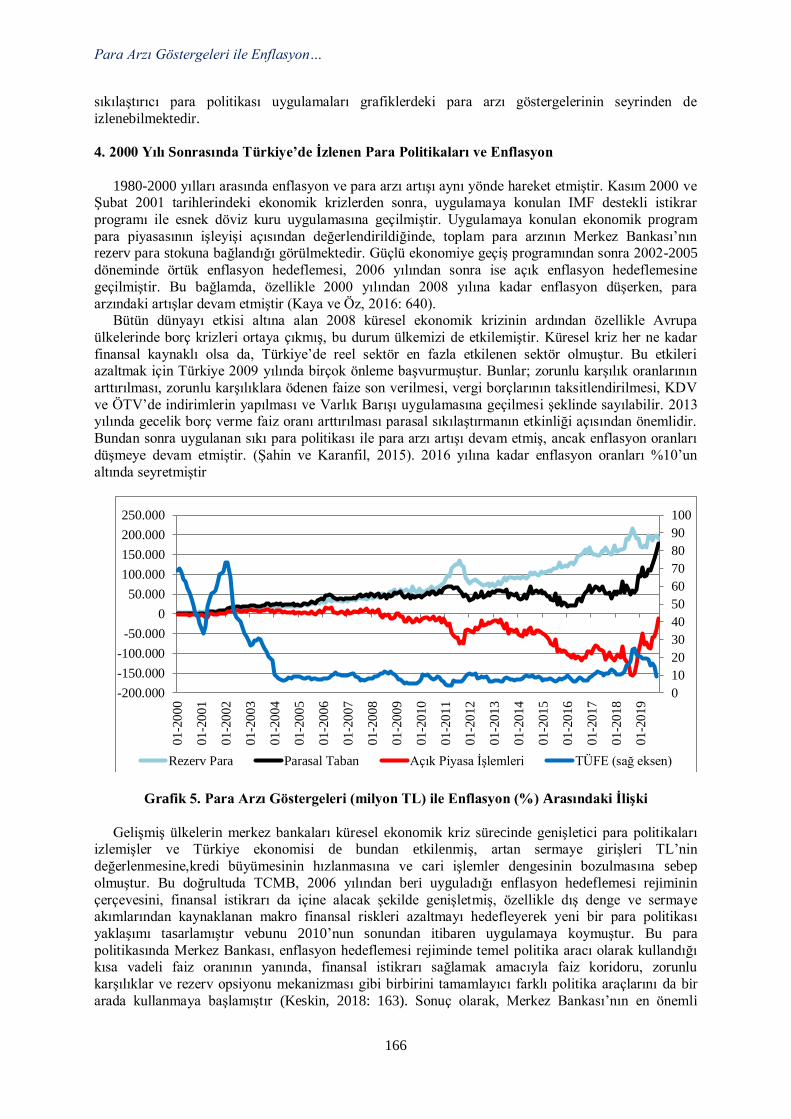
Para Arzı Göstergeleri ile Enflasyon…
166
sıkılaştırıcı para politikası uygulamaları grafiklerdeki para arzı göstergelerinin seyrinden de
izlenebilmektedir.
4. 2000 Yılı Sonrasında Türkiye’de İzlenen Para Politikaları ve Enflasyon
1980-2000 yılları arasında enflasyon ve para arzı artışı aynı yönde hareket etmiştir. Kasım 2000 ve Şubat 2001 tarihlerindeki ekonomik krizlerden sonra, uygulamaya konulan IMF destekli istikrar
programı ile esnek döviz kuru uygulamasına geçilmiştir. Uygulamaya konulan ekonomik program
para piyasasının işleyişi açısından değerlendirildiğinde, toplam para arzının Merkez Bankası’nın rezerv para stokuna bağlandığı görülmektedir. Güçlü ekonomiye geçiş programından sonra 2002-2005
döneminde örtük enflasyon hedeflemesi, 2006 yılından sonra ise açık enflasyon hedeflemesine
geçilmiştir. Bu bağlamda, özellikle 2000 yılından 2008 yılına kadar enflasyon düşerken, para
arzındaki artışlar devam etmiştir (Kaya ve Öz, 2016: 640). Bütün dünyayı etkisi altına alan 2008 küresel ekonomik krizinin ardından özellikle Avrupa
ülkelerinde borç krizleri ortaya çıkmış, bu durum ülkemizi de etkilemiştir. Küresel kriz her ne kadar
finansal kaynaklı olsa da, Türkiye’de reel sektör en fazla etkilenen sektör olmuştur. Bu etkileri azaltmak için Türkiye 2009 yılında birçok önleme başvurmuştur. Bunlar; zorunlu karşılık oranlarının
arttırılması, zorunlu karşılıklara ödenen faize son verilmesi, vergi borçlarının taksitlendirilmesi, KDV
ve ÖTV’de indirimlerin yapılması ve Varlık Barışı uygulamasına geçilmesi şeklinde sayılabilir. 2013 yılında gecelik borç verme faiz oranı arttırılması parasal sıkılaştırmanın etkinliği açısından önemlidir.
Bundan sonra uygulanan sıkı para politikası ile para arzı artışı devam etmiş, ancak enflasyon oranları
düşmeye devam etmiştir. (Şahin ve Karanfil, 2015). 2016 yılına kadar enflasyon oranları %10’un
altında seyretmiştir
Grafik 5. Para Arzı Göstergeleri (milyon TL) ile Enflasyon (%) Arasındaki İlişki
Gelişmiş ülkelerin merkez bankaları küresel ekonomik kriz sürecinde genişletici para politikaları izlemişler ve Türkiye ekonomisi de bundan etkilenmiş, artan sermaye girişleri TL’nin
değerlenmesine,kredi büyümesinin hızlanmasına ve cari işlemler dengesinin bozulmasına sebep
olmuştur. Bu doğrultuda TCMB, 2006 yılından beri uyguladığı enflasyon hedeflemesi rejiminin
çerçevesini, finansal istikrarı da içine alacak şekilde genişletmiş, özellikle dış denge ve sermaye akımlarından kaynaklanan makro finansal riskleri azaltmayı hedefleyerek yeni bir para politikası
yaklaşımı tasarlamıştır vebunu 2010’nun sonundan itibaren uygulamaya koymuştur. Bu para
politikasında Merkez Bankası, enflasyon hedeflemesi rejiminde temel politika aracı olarak kullandığı kısa vadeli faiz oranının yanında, finansal istikrarı sağlamak amacıyla faiz koridoru, zorunlu
karşılıklar ve rezerv opsiyonu mekanizması gibi birbirini tamamlayıcı farklı politika araçlarını da bir
arada kullanmaya başlamıştır (Keskin, 2018: 163). Sonuç olarak, Merkez Bankası’nın en önemli
0
10
20
30
40
50
60
70
80
90
100
-200.000
-150.000
-100.000
-50.000
0
50.000
100.000
150.000
200.000
250.000
01
-20
00
01
-20
01
01
-20
02
01
-20
03
01
-20
04
01
-20
05
01
-20
06
01
-20
07
01
-20
08
01
-20
09
01
-20
10
01
-20
11
01
-20
12
01
-20
13
01
-20
14
01
-20
15
01
-20
16
01
-20
17
01
-20
18
01
-20
19
Rezerv Para Parasal Taban Açık Piyasa İşlemleri TÜFE (sağ eksen)
Y. Özkök
167
amacı fiyat istikrarını sağlamak ve temel fonksiyonu para yaratımını kontrol etmektir. Bu doğrultuda,
çeşitli para politikası araçları kullanır. Bunlar veriler de en sağlıklı TCMB analitik bilançosundan
izlenir.
5. Sonuç ve Öneriler
Merkez Bankası 2001 krizinde, 2008 krizinden sonra bugüne kadar özellikle APİ ile piyasaya
likidite sağlamış, bu da enflasyonu olumsuz etkilemiştir.Aslında son yıllarda gelişmiş ülkelerin
çoğunda talep yetersizliği ve düşük seyreden büyüme verileri ile birlikte enflasyon da genel olarak düşük seyretmektedir ve genişletici para politikaları uygulamaya konulmaktadır. Ancak ülkemizde,
talebin düşmesine karşılık maliyet artışlarından kaynaklanan arzdaki azalma sonucunda özellikle 2018
yılı sonunda artışa geçen enflasyon verileri, 2019 yılında hem kur artışlarının daha dengeli seyretmesi
hem de Merkez Bankası’nın sıkılaştırılmış para politikası uygulamaları sonucundadüşmeye başlamıştır. Diğer yandan, özellikle yatırımları canlandırmak için düşürülen faiz oranları istenildiği
ölçüde henüz yatırım ve üretimde canlanma sağlayamamıştır. Bununla birlikte, faiz oranlarındaki
düşüş yatırımları canlandırmaz ancak elde yerli para tutma talebini azaltırsa, bu durum kur üzerinde baskı yaratabilir ve Merkez Bankası’nın sıkılaştırılmış para politikası uygulamalarını zorlaştırabilir.
Böyle bir durumda Merkez Bankası piyasaya likidite sağlamak zorunda kalabilir. Bu da talebin
canlanması yerine; döviz kurunun artması yada artan para arzı ile enflasyon üzerinde tekrar artış eğilimi yaratabilir.
Kaynaklar
Acar, O. (1999). Sermaye Hareketlerinin Serbestleşmesi ve Merkez Bankası Bilançoları,
Active:bankacılık ve finans dergisi, 10, ss. 84-90.
Ardıç, H. (2004). 1994 ve 2001 Ekonomik Krizlerinin, Türkiye Cumhuriyet Merkez Bankası Bilançosunda Yarattığı Hareketlerin İncelenmesi, Uzmanlık Yeterlilik Tezi, Ankara: T.C.M.B.
Muhasebe Genel Müdürlüğü.
Kaya G. M. ve Öz E. (2016), “Enflasyon, Bütçe Açığı ve Para Arzı İlişkisinin Türkiye Ekonomisi
Açısından Değerlendirilmesi: 1980-2014 Dönemi”, Yönetim ve Ekonomi, C: 23, S: 3, ss. 639-651. Keskin Nagehan (2018), Yönetim Bilimleri Dergisi, C: 16, S: 31, ss. 161-195.
TCMB, https://evds2.tcmb.gov.tr.
TCMB (2016), Türkiye Cumhuriyet Merkez Bankası Bilançosu ve Analitik Bilanço, https://www.tcmb.gov.tr/wps/wcm/connect/e9da357f-da90-42d6-9a54-
569587068795/Bilanco_ve_AB_Kitap.pdf?MOD=AJPERES&CACHEID=ROOTWORKSPACE-
e9da357f-da90-42d6-9a54-569587068795-m3fB7PC (erişim tarihi: 10.10.2019). T.C.M.B.. (2006). Türkiye Cumhuriyet Merkez Bankası Bilançosu, Açıklamalar, Rasyolar ve Para
Politikası Yansımaları, Ankara: T.C.M.B. Yayını.
https://www.tcmb.gov.tr/wps/wcm/connect/88fd94d3-8187-42fc-a27f-
dec9d09fd626/tcmbbilancokitabi.pdf?MOD=AJPERES&CACHEID=ROOTWORKSPACE-88fd94d3-8187-42fc-a27f-dec9d09fd626-m3fBaj6 (Erişim Tarihi: 17/10/2019).
TCMB (2005) Zorunlu Karşılık ve Umumi Disponibilite Hakkında Tebliğlere İlişkin Basın Duyurusu,
Sayı:2005-52. Şahin, İ. Ve M. Karanfil (2015). Türkiye Ekonomisinde 1980-2013 Dönemi Para Arzının
Enflasyon Üzerindeki Etkisi. Business and Economics Research Journal, V: 6,N: 4, ss. 97-113.
Yakupoğlu, A. (2011). 2002-2009 Yılları Arasında Merkez Bankası Parası ve Alt Kalemlerinin Analizi, Maliye Finans Yazıları, 25(90), ss. 23-40.
Yardımcı, P. (2006). Merkez Bankası Bilanço Kalemlerinin Para Politikalarını Yönlendirmedeki Rolü,
Selçuk Üniversitesi Karaman İ.İ.B.F. Dergisi, 11(9), ss. 156-170.
3rd International Conference on Economic Research
24-25th October 2019, Alanya, Turkey
168
THE RELATIONSHIP OF TOURISM REVENUE AND ECONOMIC GROWTH:
ARDL BOUND TEST APPROACH
Erkan Akgöz
Kyrgyzstan Turkey Manas University / Selcuk University, Turkey Email: [email protected]
Engin Tengilimoğlu
Selçuk University, Department of Tourism Management, Turkey
Abstract
The tourism sector, which has been constantly developing in recent years, has made significant
contributions to the economies of the countries. Especially developed and developing countries are
trying to improve their economic growth by concentrating on the tourism sector. Studies related to the relationship between economic growth and tourism sector has shown that tourism revenues have a
positive impact on economic growth. In this study, causality analysis between tourism revenues and
economic growth was applied. GDP data refers to economic growth were obtained from the Turkish Statistical Institute website and tourism revenues from the Ministry of Culture and Tourism. Tourism
revenue and GDP data between 2010 and 2018 was used for analyse. Result of the ARDL test has
shown that tourism revenues are causal of the economic growth.
Keywords: Economic Growth, Tourism Revenue, Causality, ARDL
TÜRKİYE’NİN EKONOMİK BÜYÜMESİ İLE TURİZM GELİRLERİ ARASINDAKİ
İLİŞKİ: ARDL SINIR TESTİ YAKLAŞIMI
Özet
Son yıllarda sürekli gelişen turizm sektörü ülkelerin ekonomilerine önemli katkılarda
bulunmaktadır. Özellikle gelişmemiş ve gelişmekte olan ülkeler turizm sektörüne yoğunlaşarak ekonomik büyümelerine katkı sağlamaya çalışmaktadırlar. Ekonomik büyüme ve turizm ilişkisini
inceleyen çalışmalar turizm gelirlerinin ekonomik büyüme üzerinde olumlu etkilerde bulunduğunu
göstermektedir. Bu çalışmada da turizm gelirleri ile ekonomik büyüme arasında nedensellik analizi uygulanmıştır. Ekonomik büyümeyi ifade eden GSMH verileri Türkiye İstatistik Kurumu sitesinden,
turizm gelirleri ise Kültür ve Turizm Bakanlığı sitesinden elde edilmiştir. 2010-2018 yılları için
derlenen veriler üzerinde yapılan ARDL testinde turizm gelirlerinin ekonomik büyümenin nedeni
olduğu tespit edilmiştir. Anahtar Kelimeler: Ekonomik Büyüme, Turizm Geliri, Nedensellik, ARDL
1. Giriş
Gelişimin hızlandığı günümüz dünyasında turizm sektörü de hızla gelişim gösteren alanlardan
birisi olmuştur. Turizm sosyal, kültürel ve ekonomik anlamda ülkelere katkı sağlayan bir sektör olarak görülmektedir. Özellikle ekonomik kazanımları göz önünde bulundurulduğunda Türkiye gibi turizm
potansiyeline sahip gelişmekte olan ülkeler turizm gelirlerini arttırarak ekonomik büyümelerine katkı
sağlamaya çalışmaktalardır.
Turizm sektörü kısaca inşaların bulundukları yerden başka bir yere gezme, görme, iş vb. amaçlarla seyahat etmeleri ve bulundukları yere geri dönmeleri esnasında ihtiyaç duydukları bütün ürün ve
hizmetleri karşılayan işletme ve kurumları ifade eden geniş bir tanıma sahiptir. Dolayısıyla birçok
farklı işletme türünü ve birçok farklı sektörü dolaylı ve doğrudan etkilediği düşünülebilir. Bu etki neticesinde ise ülkenin ekonomik büyümesinde önemli bir rol üstlendiği söylenebilir.
Turizm ve ekonomik büyüme konusunu le alan birçok çalışma bulunmaktadır (Kasman ve Kasman,
2004; Yıldırım ve Öcal, 2004; Gündüz ve Hatemi, 2005; Ongan ve Demiröz, 2005; Bahar, 2006).
Türkiye'nin Ekonomik Büyümesi ile Turizm...
169
Çalışmaların farklı sonuçlara ulaşmasına karşın genel kanı turizm gelirlerinin ekonomik büyüme
üzerinde olumlu bir etki oluşturduğu yönündedir. Turizm ve ekonomik büyüme arasında kurulan bu
ilişki temelini ihracata dayalı büyüme anlayışından almaktadır. Turizm sektöründe kazanılan gelirlerin gizli ihracat olarak değerlendirilmesi ihracata dayalı büyüme düşüncesini desteklemektedir. Bu
çalışmada da turizm gelirleri ve ekonomik büyümenin bir ölçütü olarak GSMH arasında nedensellik
analizi uygulanmıştır. Turizm gelirleri ve ekonomik büyüme arasındaki ilişkiyi eski çalışmalar ışığında güncel rakamlarla ortaya koymak bu çalışmanın temel amacadır.
2. Literatür
Dritsakis 2004 yılında yapmış olduğu çalışmada turizmin ekonomik büyümeye etkisini VAR
yöntemiyle analiz etmiş ve turizm gelirleri ile büyüme arasında nedensellik ilişkisi tespit etmiştir.
Dahası reel döviz kuru ile turizm gelirleri arasında da ilişki olduğunu bulgulamıştır. Fiji’de yapılan bir çalışmada ise Narayan ve Prasad (2003) turizm gelirleri ile GSYİH arasındaki
ilişkileri uzun dönem ve kısa dönemde ele almışlardır. Sonuç olarak iki değişken arasında uzun
dönemli bir ilişki tespit edilirken Granger nedensellik testinde uzun dönemde turizm gelirleri GSYİH’nın, kısa dönemde ise GSYİH turizm gelirlerinin nedeni olduğu anlaşılmıştır.
21 Latin Amerika devletinde gerçekleştirilen bir çalışmada panel veri kullanılarak turizm gelirleri
ve büyüme arasındaki ilişki incelenmiştir. Özellikle düşük ve orta gelirli ülkelerin ekonomik büyümesinde turizmin önemli bir yeri olduğu tespit edilmiştir (Martin vd., 2004).
Kore üzerine yapılan bir çalışmada Engle, Granger ve VAR yaklaşımı kullanılarak turizm gelirleri
ve ekonomik büyüme arasındaki ilişki incelenmiştir (Oh, 2005). Analizler sonucunda beklenenin
aksine ekonomik büyüme turizm gelirlerinin nedeni olarak tespit edilmiştir. Kore’nin ekonomik büyümesi üzerinde turizm gelirlerinin bir etkisi bulunamamıştır.
Ülkemizde yapılan birçok çalışmada ise turizm gelirlerinin ekonomik büyüme üzerinde anlamlı
etkiye sahip olduğunu göstermektedir. (Kasman ve Kasman, 2004; Yıldırım ve Öcal, 2004; Gündüz ve Hatemi, 2005; Ongan ve Demiröz, 2005; Bahar, 2006). Kasman ve Kasman (2004) turizmin
ekonomiyi olumlu yönde etkilediğini belirtmektedir. Yıldırım ve Öcal ise kısa vadede herhangi bir etki
tespi edemezken uzun vadede turizmin ekonomik büyümeyi teşvik ettiğini tespit etmiştir.
Gündüz ve Hatemi’nin (2005) gerçekleştirdiği kapsamlı bir çalışmada 1963-2000 yılları arasındaki veriler kullanılarak turizm gelirleri ve ekonomik büyüme arasında nedensellik analizleri yapmıştır.
Sonuç olarak turizm gelirlerinin ekonomik büyümeyi olumlu yönde etkilediğini tespit etmişlerdir.
Çetintaş ve Bektaş (2008) ise 1964-2006 yılları arasındaki turizm gelirleri ve ekonomik büyüme verilerini kullanarak yapmış olduğu ARDL analizinde kısa dönemli bir ilişki tespit edemezken uzun
dönemde turizm gelirlerinin ekonomik büyümenin nedeni olduğu sonucuna ulaşmışlardır.
Zortuk (2009) 1980’li yıllardan sonra hızlı turizmin hızla geliştiğini belirterek özellikle 1990 yılından sonraki turizm verilerinin ekonomik büyüme üzerindeki etkisinin daha kolay
anlaşılabileceğini belirtmiştir. 1990-2008 yılları arasında yer alan verileri kullanarak yaptığı çalışmada
turizm gelirlerinin ekonomik büyüme üzerinde önemli etkiye sahip olduğunu tespit etmiştir.
Yukarıda ifade edilen çalışmaların sonuçları dikkate alındığında turizm sektörünün ülkemiz ekonomisine önemli bir katkı sağladığı düşünülebilir. Bu fikirden yola çıkarak bu çalışmada 2010-
2018 yılları arasındaki GSYİH ve Turizm gelirlerin kullanılarak nedensellik analizi yapılmıştır.
3. Veri Yöntem Analiz
Çalışmada kullanılan veriler Tablo 1’de aktarılmıştır. Turizm gelirleri dolar kuru üzerinden hesaplandığı için dolar kuru ile birlikte verilmiştir. Yıllara ilişkin dolar kuru o yıl içerisinde kur
seyrinin aritmetik ortalaması alınarak hesaplanmıştır. Turizm gelirleri dolar kuru ile çarpılarak TL
cinsine çevrilmiştir.
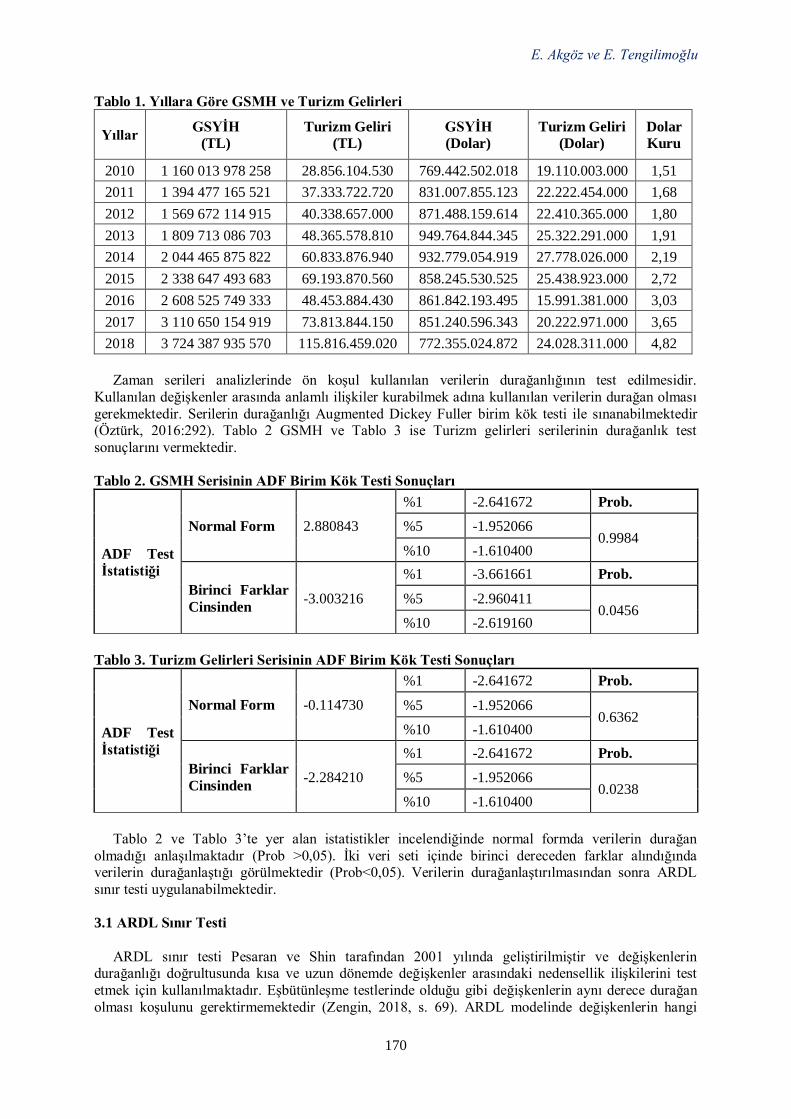
E. Akgöz ve E. Tengilimoğlu
170
Tablo 1. Yıllara Göre GSMH ve Turizm Gelirleri
Yıllar GSYİH
(TL)
Turizm Geliri
(TL)
GSYİH
(Dolar)
Turizm Geliri
(Dolar)
Dolar
Kuru
2010 1 160 013 978 258 28.856.104.530 769.442.502.018 19.110.003.000 1,51
2011 1 394 477 165 521 37.333.722.720 831.007.855.123 22.222.454.000 1,68
2012 1 569 672 114 915 40.338.657.000 871.488.159.614 22.410.365.000 1,80
2013 1 809 713 086 703 48.365.578.810 949.764.844.345 25.322.291.000 1,91
2014 2 044 465 875 822 60.833.876.940 932.779.054.919 27.778.026.000 2,19
2015 2 338 647 493 683 69.193.870.560 858.245.530.525 25.438.923.000 2,72
2016 2 608 525 749 333 48.453.884.430 861.842.193.495 15.991.381.000 3,03
2017 3 110 650 154 919 73.813.844.150 851.240.596.343 20.222.971.000 3,65
2018 3 724 387 935 570 115.816.459.020 772.355.024.872 24.028.311.000 4,82
Zaman serileri analizlerinde ön koşul kullanılan verilerin durağanlığının test edilmesidir.
Kullanılan değişkenler arasında anlamlı ilişkiler kurabilmek adına kullanılan verilerin durağan olması
gerekmektedir. Serilerin durağanlığı Augmented Dickey Fuller birim kök testi ile sınanabilmektedir (Öztürk, 2016:292). Tablo 2 GSMH ve Tablo 3 ise Turizm gelirleri serilerinin durağanlık test
sonuçlarını vermektedir.
Tablo 2. GSMH Serisinin ADF Birim Kök Testi Sonuçları
ADF Test
İstatistiği
Normal Form 2.880843
%1 -2.641672 Prob.
%5 -1.952066 0.9984
%10 -1.610400
Birinci Farklar
Cinsinden -3.003216
%1 -3.661661 Prob.
%5 -2.960411 0.0456
%10 -2.619160
Tablo 3. Turizm Gelirleri Serisinin ADF Birim Kök Testi Sonuçları
ADF Test
İstatistiği
Normal Form -0.114730
%1 -2.641672 Prob.
%5 -1.952066 0.6362
%10 -1.610400
Birinci Farklar
Cinsinden -2.284210
%1 -2.641672 Prob.
%5 -1.952066 0.0238
%10 -1.610400
Tablo 2 ve Tablo 3’te yer alan istatistikler incelendiğinde normal formda verilerin durağan
olmadığı anlaşılmaktadır (Prob >0,05). İki veri seti içinde birinci dereceden farklar alındığında verilerin durağanlaştığı görülmektedir (Prob<0,05). Verilerin durağanlaştırılmasından sonra ARDL
sınır testi uygulanabilmektedir.
3.1 ARDL Sınır Testi
ARDL sınır testi Pesaran ve Shin tarafından 2001 yılında geliştirilmiştir ve değişkenlerin durağanlığı doğrultusunda kısa ve uzun dönemde değişkenler arasındaki nedensellik ilişkilerini test
etmek için kullanılmaktadır. Eşbütünleşme testlerinde olduğu gibi değişkenlerin aynı derece durağan
olması koşulunu gerektirmemektedir (Zengin, 2018, s. 69). ARDL modelinde değişkenlerin hangi
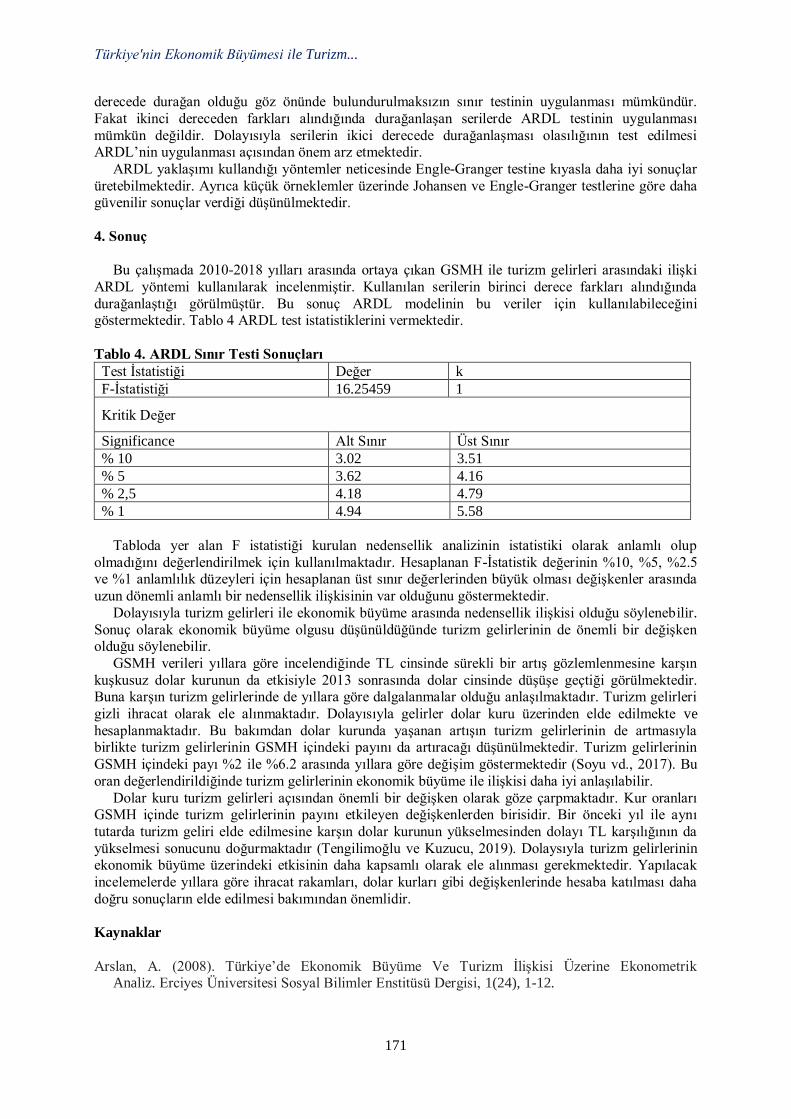
Türkiye'nin Ekonomik Büyümesi ile Turizm...
171
derecede durağan olduğu göz önünde bulundurulmaksızın sınır testinin uygulanması mümkündür.
Fakat ikinci dereceden farkları alındığında durağanlaşan serilerde ARDL testinin uygulanması
mümkün değildir. Dolayısıyla serilerin ikici derecede durağanlaşması olasılığının test edilmesi ARDL’nin uygulanması açısından önem arz etmektedir.
ARDL yaklaşımı kullandığı yöntemler neticesinde Engle-Granger testine kıyasla daha iyi sonuçlar
üretebilmektedir. Ayrıca küçük örneklemler üzerinde Johansen ve Engle-Granger testlerine göre daha güvenilir sonuçlar verdiği düşünülmektedir.
4. Sonuç
Bu çalışmada 2010-2018 yılları arasında ortaya çıkan GSMH ile turizm gelirleri arasındaki ilişki
ARDL yöntemi kullanılarak incelenmiştir. Kullanılan serilerin birinci derece farkları alındığında
durağanlaştığı görülmüştür. Bu sonuç ARDL modelinin bu veriler için kullanılabileceğini göstermektedir. Tablo 4 ARDL test istatistiklerini vermektedir.
Tablo 4. ARDL Sınır Testi Sonuçları
Test İstatistiği Değer k
F-İstatistiği 16.25459 1
Kritik Değer
Significance Alt Sınır Üst Sınır
% 10 3.02 3.51
% 5 3.62 4.16
% 2,5 4.18 4.79
% 1 4.94 5.58
Tabloda yer alan F istatistiği kurulan nedensellik analizinin istatistiki olarak anlamlı olup
olmadığını değerlendirilmek için kullanılmaktadır. Hesaplanan F-İstatistik değerinin %10, %5, %2.5 ve %1 anlamlılık düzeyleri için hesaplanan üst sınır değerlerinden büyük olması değişkenler arasında
uzun dönemli anlamlı bir nedensellik ilişkisinin var olduğunu göstermektedir.
Dolayısıyla turizm gelirleri ile ekonomik büyüme arasında nedensellik ilişkisi olduğu söylenebilir.
Sonuç olarak ekonomik büyüme olgusu düşünüldüğünde turizm gelirlerinin de önemli bir değişken olduğu söylenebilir.
GSMH verileri yıllara göre incelendiğinde TL cinsinde sürekli bir artış gözlemlenmesine karşın
kuşkusuz dolar kurunun da etkisiyle 2013 sonrasında dolar cinsinde düşüşe geçtiği görülmektedir. Buna karşın turizm gelirlerinde de yıllara göre dalgalanmalar olduğu anlaşılmaktadır. Turizm gelirleri
gizli ihracat olarak ele alınmaktadır. Dolayısıyla gelirler dolar kuru üzerinden elde edilmekte ve
hesaplanmaktadır. Bu bakımdan dolar kurunda yaşanan artışın turizm gelirlerinin de artmasıyla birlikte turizm gelirlerinin GSMH içindeki payını da artıracağı düşünülmektedir. Turizm gelirlerinin
GSMH içindeki payı %2 ile %6.2 arasında yıllara göre değişim göstermektedir (Soyu vd., 2017). Bu
oran değerlendirildiğinde turizm gelirlerinin ekonomik büyüme ile ilişkisi daha iyi anlaşılabilir.
Dolar kuru turizm gelirleri açısından önemli bir değişken olarak göze çarpmaktadır. Kur oranları GSMH içinde turizm gelirlerinin payını etkileyen değişkenlerden birisidir. Bir önceki yıl ile aynı
tutarda turizm geliri elde edilmesine karşın dolar kurunun yükselmesinden dolayı TL karşılığının da
yükselmesi sonucunu doğurmaktadır (Tengilimoğlu ve Kuzucu, 2019). Dolaysıyla turizm gelirlerinin ekonomik büyüme üzerindeki etkisinin daha kapsamlı olarak ele alınması gerekmektedir. Yapılacak
incelemelerde yıllara göre ihracat rakamları, dolar kurları gibi değişkenlerinde hesaba katılması daha
doğru sonuçların elde edilmesi bakımından önemlidir.
Kaynaklar
Arslan, A. (2008). Türkiye’de Ekonomik Büyüme Ve Turizm İlişkisi Üzerine Ekonometrik Analiz. Erciyes Üniversitesi Sosyal Bilimler Enstitüsü Dergisi, 1(24), 1-12.
E. Akgöz ve E. Tengilimoğlu
172
Çetintaş, H., & Bektaş, Ç. (2008). Türkiye'de Turizm Ve Ekonomik Büyüme Arasındaki Kısa Ve
Uzun Dönemli İlişkiler. Anatolia: Turizm Araştırmaları Dergisi, 19(1), 37-44.
Çoban, O., & Özcan, C. C. (2013). Türkiye’de Turizm Gelirleri-Ekonomik Büyüme İlişkisi: Nedensellik Analizi (1963-2010). Eskişehir Osmangazi Üniversitesi İktisadi Ve İdari Bilimler
Dergisi, 8(1), 243-261.
Dritsakis, N. (2004) Cointegration Analysis Of German And British Tourism Demand For Greece , Tourism Management, 25, 111-119.
Gündüz, L.,Ve Hatemi-J,A. (2005) Is The Tourism-Led Growth Hypothesis Valid For Turkey? ,
Applied Economics Letters, 12(8), 499-504. Güven, S., & Mert, M. (2016). Uluslararası Turizm Talebinin Eşbütünleşme Analizi: Antalya İçin
Panel Ardl Yaklaşımı. Cumhuriyet Üniversitesi İktisadi Ve İdari Bilimler Dergisi, 17(1), 133-152.
Karamelikli, H., & Erkus, S. (2016). Turızm Sektörünün Türkıye'nın Büyüme Oranı Üzerındekı
Asımetrık Etkısı/Asymmetrıc Effect Of Tourısm Sector On Turkey's Growth Rate. International Journal Of Management Economics & Business, 12(29), 1.
Kırbaş-Kasman, S. Ve A. Kasman (2004), Turizm Gelirleri Ve Ekonomik Buyume Arasındaki
Eşbutunleşme Ve Nedensellik İlişkisi, İktisat, İşletme Ve Finans Dergisi,220, 122-131. Kızılkaya, O., Sofuğlu, E., & Karaçor, Z. (2016). Türkiye'de Turizm Gelirleri-Ekonomik Büyüme
İlişkisi: Ardl Sınır Testi Yaklaşımı.
Narayan, P.K. (2004) Fiji Tourism Demand: The Ardl Approach To C Integration , Tourism Economics, 10(2), 193-206.
Oh, C. (2005). The Contribution Of Tourism Development To Economic Growth In The Korean
Economy, Tourism Management, 26, 39-44.
Öztürk A. ve Kuzucu S.. (2016). Ekonomi ve Yönetim Bilimleri Kapsamında Stratejik Araştırmalar: Türk Bankacılık Sektöründe Şube ve Personel Sayısının Karlılık ile İlişkisi. Lambert Academic
Publishing
Solu, E., Karaçor, S., Altınok, S. ve Fırat, E. (2017). Türkiye’de Turizm Gelirlerinin Ekonomideki Yeri ve Önemi Üzerine Bir Değerlendirme. International Conference on Eurasian Economies. 442.
Tengilimoğlu, E. ve Kuzucu, C. (2019). Döviz kuru oynaklıkları turist başına düşen ortalama
harcamayı etkiler mi? 2003-2018 yılları arasında bir nedensellik analizi. V Human & Cıvılızatıon
Congress From Past To Future. 148. Terzi, H., & Pata, U. K. (2016). Türkiye’nin İktisadi Büyümesinde Turizm Sektörünün
Katkısı. Erciyes Üniversitesi İktisadi Ve İdari Bilimler Fakültesi Dergisi, (48), 45-64.
Yıldırım, J., Ve N. Ocal (2004), Tourism And Economic Growth In Turkey, Ekonomik Yaklaşım, 15 (52-53), 131-141.
Zengin, B. (2018, Temmuz). Türkiye’de Bireysel Emeklilik Sistemi Ve Ekonomik Büyüme
Arasındaki İlişkinin Ampirik Analizi. Ankara: Gazi Üniversitesi Sosyal Bilimler Enstitüsü.
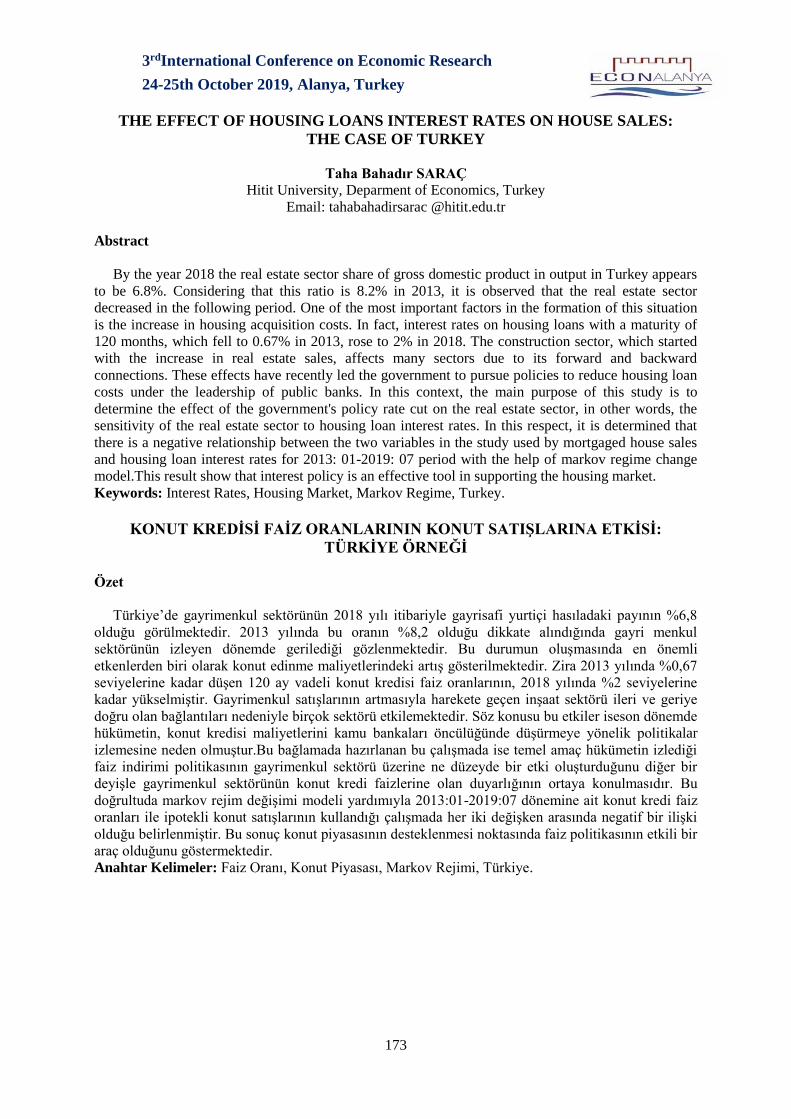
3rdInternational Conference on Economic Research
24-25th October 2019, Alanya, Turkey
173
THE EFFECT OF HOUSING LOANS INTEREST RATES ON HOUSE SALES:
THE CASE OF TURKEY
Taha Bahadır SARAÇ
Hitit University, Deparment of Economics, Turkey
Email: [email protected]
Abstract
By the year 2018 the real estate sector share of gross domestic product in output in Turkey appears
to be 6.8%. Considering that this ratio is 8.2% in 2013, it is observed that the real estate sector
decreased in the following period. One of the most important factors in the formation of this situation
is the increase in housing acquisition costs. In fact, interest rates on housing loans with a maturity of
120 months, which fell to 0.67% in 2013, rose to 2% in 2018. The construction sector, which started
with the increase in real estate sales, affects many sectors due to its forward and backward
connections. These effects have recently led the government to pursue policies to reduce housing loan
costs under the leadership of public banks. In this context, the main purpose of this study is to
determine the effect of the government's policy rate cut on the real estate sector, in other words, the
sensitivity of the real estate sector to housing loan interest rates. In this respect, it is determined that
there is a negative relationship between the two variables in the study used by mortgaged house sales
and housing loan interest rates for 2013: 01-2019: 07 period with the help of markov regime change
model.This result show that interest policy is an effective tool in supporting the housing market. Keywords: Interest Rates, Housing Market, Markov Regime, Turkey.
KONUT KREDİSİ FAİZ ORANLARININ KONUT SATIŞLARINA ETKİSİ:
TÜRKİYE ÖRNEĞİ
Özet
Türkiye’de gayrimenkul sektörünün 2018 yılı itibariyle gayrisafi yurtiçi hasıladaki payının %6,8
olduğu görülmektedir. 2013 yılında bu oranın %8,2 olduğu dikkate alındığında gayri menkul
sektörünün izleyen dönemde gerilediği gözlenmektedir. Bu durumun oluşmasında en önemli
etkenlerden biri olarak konut edinme maliyetlerindeki artış gösterilmektedir. Zira 2013 yılında %0,67
seviyelerine kadar düşen 120 ay vadeli konut kredisi faiz oranlarının, 2018 yılında %2 seviyelerine
kadar yükselmiştir. Gayrimenkul satışlarının artmasıyla harekete geçen inşaat sektörü ileri ve geriye
doğru olan bağlantıları nedeniyle birçok sektörü etkilemektedir. Söz konusu bu etkiler iseson dönemde
hükümetin, konut kredisi maliyetlerini kamu bankaları öncülüğünde düşürmeye yönelik politikalar
izlemesine neden olmuştur.Bu bağlamada hazırlanan bu çalışmada ise temel amaç hükümetin izlediği
faiz indirimi politikasının gayrimenkul sektörü üzerine ne düzeyde bir etki oluşturduğunu diğer bir
deyişle gayrimenkul sektörünün konut kredi faizlerine olan duyarlığının ortaya konulmasıdır. Bu
doğrultuda markov rejim değişimi modeli yardımıyla 2013:01-2019:07 dönemine ait konut kredi faiz
oranları ile ipotekli konut satışlarının kullandığı çalışmada her iki değişken arasında negatif bir ilişki
olduğu belirlenmiştir. Bu sonuç konut piyasasının desteklenmesi noktasında faiz politikasının etkili bir
araç olduğunu göstermektedir.
Anahtar Kelimeler: Faiz Oranı, Konut Piyasası, Markov Rejimi, Türkiye.
3rdInternational Conference on Economic Research
24-25th October 2019, Alanya, Turkey
174
FUEL PRICE FORMATION IN TURKISH DOWNSTREAM OIL INDUSTRY
Mustafa Düzgün
Energy Market Regulatory Authority of Turkey, Email: [email protected]
Abstract
This paper aims to identify the particular constituents effecting the Turkish domestic fuel prices,for
the period from 2005 to 2019.
Fuel prices in Turkey are formed by three main components: product cost, taxes and gross industry
margin. The changes in product prices are reflected to domestic fuel prices after certain formulations,
and also taking the exchange rate into considiration. The products from local refineries and imported
through terminals are delivered to the market after taxation including special consumption and value
added taxes.
The first component is product costwhich iscalculated using Platts European Market Scan CIF
MED (Genova/Lavera) prices ($/tonne), taking exchange rate and densities of fuels into account. The
impact of oil prices into economies of oil importing countries is significant and therefore represents a
great deal of attention from both governments and the consumers. International oil prices have shown
significant fluctuations over the last years due to dependencies on the supply demand balances,
production capacities of oil suppliers, political and social instabilities in oil producing countries, effect
of new technologies and developments in the global economy. There is a strong correlation between
CIF MED product prices, which are taken into consideration in Turkey and Brent crude oil prices.
Changes in Brent prices are reflected to CIF MED prices depending upon available stock and demand
in the region and they are reflected to list prices in Turkey issued in Turkish Liras considering changes
in exchange rates. So, Brent is an important indicator for domestic fuel prices, but in calculations
Platts CIF MED product prices are used. In recent years, especially due to uptrend in US Dollar/TL
exchange rate, the share of product cost in pump price is going up.
The second component is tax thatis the sum of Special Consumption Tax (SCT) (differs across the
fuels) and Value Added Tax (VAT) determined by Ministry of Treasury and Finance.Until May 2018,
the VAT was %18 and the Special Consumption Tax was constant and it was 2,3765 TL/lt for
unleaded gasoline 95 octane and 1,7945 TL/lt for diesel, respectively. But with the Pursuant to the
Resolution of the Council of Ministers dated 14/05/2018, the SCT amounts changedepanding on
refinery prices. On the other hand, the VAT is still %18. Although the share of tax is decreasing in
recent years, traditionally the tax component has the most share in pump price.
The third component is gross industry margin which is the sum of refinery, distributor and retailer
margin added to the product price by national refineries for refinery part and then including costs from
the procurement of the products to delivery to the end-consumer for the distributor and retailer
part.With this margin, the companies finance their operations which includes their operational profits.
The margin of companies has the least share in pump price.
According to the results, tax has the most share in pump price, but in recent years due to an uptrend
in exchange rates, the share of product cost is increasing.
Keywords: Fuel Price Formation, Product Cost, Tax, Gross Industry Margin, Pump Price.
3rd International Conference on Economic Research
24-25th October 2019, Alanya, Turkey
175
TOURISM ECONOMY IN SUSTAINABILITY CONCEPT- PERSPECTIVES AND
CHALLENGES
Barbara Pabian
University of Economics in Katowice, Department of Management, Poland
Email: [email protected]
Abstract
Progress in the area of sustainable development is still insufficient despite many initiatives being
taken at the global as well as the local scale. This insufficient progress also applies to sustainable
tourism. In fact, it is only partially sustainable because not all of its components meet the criteria of
sustainable development. The degree of sustainability in tourism can be greatly increased by
transforming conventionally operating manufacturers of tourist services into sustainable enterprises.
This requires revolutionary changes in the structure of resources that they have. All the resources of
this type of enterprises should be sustainable. Sustainable human resources play the key role in the
area; sustainable staff consists of managers and operational employees engaging in sustainable
development. They guarantee effective realization of ecological and social objectives. The article is
conceptual in its nature. The main aim of this article is to present model solutions for the structure of
resources of sustainable producers of tourist services and their attributes. With the solutions being
proposed, tourism will contribute to a greater extent to balance intergenerational needs. The research
methodology used in the preparation of this study has been subordinated to its guiding purpose. Non-
reactive methods are mainly used, i.e. critical analysis of scientific literature and internet query. The
implementation of the model solutions presented in the article will contribute to increase pro-
ecological and pro-social activities of enterprises, which will have a positive impact on balancing the
intergenerational needs.
Keywords: Sustainable Tourism, Sustainable Development, Sustainable Manufacturers of Tourist
Services, Sustainable Resources.
1. Introduction
The era of sustainable development began already in the ‘60s of the twentieth century, but the
assumptions undertaken this area have not significantly affected the improvement of our planet.
Analysis of the data contained in Living Planet Report 2018 leads to the conclusion that our "demand
for nature" is still unbalanced, and the exploitation of the Earth has already exceeded the limits of
nature’s tolerance. This situation does not improve the elemental, often dysfunctional, development of
postmodern tourism. In the context of these disturbing phenomena, the aim of the article is to present
solutions regarding the resource structure of tourism service providers in the aspect of sustainability,
the essence of which is to achieve economic, social and ecological goals as well as the idea of
satisfying the needs of humanity without harming future generations.
Creating sustainable tourism products is only a part of pro-ecological and pro-social activities. An
important complement to it should be the transformation of conventional business entities operating on
the tourist market into those that, taking up this challenge, would conduct their activities in accordance
with the spirit of sustainable development. What researchers emphasize, the point is to manage the
existing resources of the environment, space and infrastructure economically, thus avoiding
destructive changes in the natural and socio-cultural environment [Pabian A., Bylok F., Kucęba R.,
Zawada M., 2013, p. 41]. Learning how to live and work in accordance with the concept of sustainable
development is, according to L. Thiele, the greatest challenge of our time [L. Thiele, 2016, p. 2-3].
Bearing this in mind, in this article I try to present some specific solutions, hoping that this elaboration
will be an inspiration for further scientific discussion and in the practical sphere an incentive to create
modern tourism enterprises, which are the part of sustainability idea.
Tourism Economy in Sustainability...
176
2. Sustainable Tourism
Mass tourism, referred to as the 3S formula (sun, sea, sand), began to develop intensively in the
‘60s of the twentieth century, which was supported by the dominant and already developed
mainstream of Fordism. At that time, the forms of work organization were adapted to the needs of
production focused on mass recipients and the distribution of band products and serial goods. In
tourism, this has been translated not only into the development of the hotel industry, tourism offices
and modern means of transport, as well as on spatial development covered by mass tourism in areas.
Such conventional mass tourism due to its passive nature, institutionalization and standardization of
the offer is now called hard. It is opposed to its more ambitious 3E tourism (education, excitement,
entertainment), which is associated with the change of tourism and recreational behavior as well as
travel motivation. The guiding idea and the sense of 3E tourism is the active way of spending time by
tourists, acquiring or expanding knowledge, enriching personality, satisfying emotional needs,
protecting the natural and cultural environment of tourism destinations. Optionally for the 3E model
there is a similar tourism formula in 3L (leisure, landscape, learning). Over the last dozen years or so,
probably one of the most important concept of tourism development has been taken, which is
sustainable tourism, also referred to as soft tourism or environmentally sensible tourism. It is based on
the sustainable development model, which was first defined in the UN Declaration (1972) and finally
clarified in 1987 by the World Environment and Development Committee in the "Our common future"
report. Four years later during the "Earth Summit" in Rio de Janeiro representatives of various
countries of the world signed the so-called: The Earth Charter, in which 27 priorities of sustainable
development were formulated.
Genetically sustainable tourism is derived from the concept of alternative (intelligent) tourism,
which in the mid-1980s was a response to the negative effects of the development of mass tourism. In
1975, the term "green tourism" was used in France, which was understood as agro-, ecotourism and
hunting. The term "served German researchers to introduce a few years later the term: soft tourism"
(German: sanfter Tourismus), which began to be treated as synonymous with the term alternative
tourism and the increasingly popular: sustainable tourism. (umweltvertragliche Tourismus)" [A.
Kowalczyk, 2010, p. 10]. Some scholars, in their bold interpretations, look for the origin of
sustainable tourism in antiquity, deriving it from Aristotle idea of phronesis understood as the virtue of
practical wisdom, which should be contrasted with theoretical wisdom (sophia) and technical wisdom
(techne). Phronesis deals with the truth related to the finding and place of man in the world and with
his responsibility for the environment.
It is a fact that sustainable tourism has recently gained more and more recognition among
researchers and tourists. It is understood as the broad concept of "environmentally friendly tourism
development in rural regions and cities, in small tourist centers as well as large entertainment and
leisure centers, etc., a concept that applies to all known types of tourism after having made it greenery
appropriate" [D. Zaręba, 2000, p. 35]. It means respecting the cultural, social and natural values of the
area in which tourists reside, respecting and protecting natural and cultural resources, also respecting
identity, tradition and a way of life of local communities with simultaneous use (mainly by the local
community, to a lesser extent by external investors) of the economic chance that tourism brings for the
economic development of the region. The concept is much narrower ecotourism, understood as one of
the forms of travel, closely related to the nature and indigenous culture of areas with high natural
values.
Sustainable tourism, however, is not about limiting the number of tourists, because tourism is now,
as Lesley Pender emphasizes: “the largest branch of the global economy" [L. Pender, 2008, p. 24]. It is
about its harmonious development on a global scale in the most environment-friendly, socio-cultural
and economic way that is possible. Sustainable action in the field of tourism will lead to many positive
effects, among which D. Fogel mentions: the balance between the resources used and the resources
subject to regeneration, purity of resources, restoration and maintenance of the ability to live, integrity
and diversity of natural systems, maintaining societies and cultures of the place [D. Fogel, 2016, p. 7].
R. Brinkmann emphasizes an important feature of sustainable business: in this sphere, profit is just as
important as the impact of activities on people and the planet [R. Brinkmann 2016, p. 1].
The key challenge in sustainability is to strive to transform traditionally operating tourism
enterprises into sustainable organizations. The concept of a sustainable producer of tourist services
B. Pabian
177
should be understood as an organization whose resources and activities are subordinated to the
principles of sustainability. Conventional resources, which in the first place should be subject to pro-
ecological and prosocial transformation, can be divided into the following types:
a) people (employees in managerial and non-managerial positions),
b) building infrastructure (buildings or rented rooms only),
c) equipment of buildings and rooms,
d) transport machines,
e) falling goods, what means products that are used in current operations.
The essence of the concept of a sustainable producer of tourist services is based on two pillars, i.e.
on sustainable resources and on sustainable services’ activities. Usually, this are the resources that
determine whether the service activity is sustainable or not. It can be exemplified on the basis of a
tourism transport service, which performed using conventional coaches, will not be balanced until the
rolling stock is replaced, for example, by electric vehicles.
Sustainable resources in the form of staff, buildings and their equipment, means incoming goods
which constitute a key factor for enabling service activities in a responsible manner. However, the
most important factors in the process of sustainable development are the people themselves, and
among them - the top management managers, whose genuine personal commitment depends on the
effectiveness of accepting change. They decide about the implementation of sustainability principles
in professional practice, specifying, among other things, what resources and to what extent should be
used. Top managers undertake and approve the most important decisions regarding the resources and
operations of the economic entity both in the short and long term perspective. It depends on them
whether the tasks of a socio-ecological nature, and to what extent, will be taken into account in the
strategic, tactical and operational plans. They can assign priority to these tasks or marginalize them.
They may require genuine implementation or only creation of the appearance of a tourism company's
involvement in sustainable development.
2.1 Human Resources with Sustainability Features
Human resources with sustainability features are both executive managers as well as line
employees. The factors that favour their involvement in sustainable development include:
a) knowledge of sustainability,
b) socio-ecological sensitivity,
c) openness to new solutions,
d) personal creativity and ability to innovation.
Employees’ knowledge must refer to the state and effects of socio-ecological threats occurring
inside and outside tourism entity in considerations and the possibilities of counteracting them. On its
basis, managers and employees will undertake more or less effective operational activities for
sustainable development and set further directions for the development of a tourist company. In turn,
socio-ecological sensitivity means care, sharpened attention and the ability to respond to problems
occurring in ecological area, while openness to new solutions is associated with ability to acceptance
and implementation in particular areas of the company's operations. The innovation of human
resources is also very important. Competent and creative managers and contractors will search for new
technical, technological and organizational solutions or improve existing ones, contributing to the
protection of the natural environment and elimination of social problems.
The acquisition by the staff of the above mentioned characteristics (points a to d) is the basis for
undertaking effective actions in the area of sustainability. In the case of managers and contractors, the
forms and directions of this activity will, however, differ as they perform different functions in the
organization of tourism service providers. Company managers work with people, making different
decisions. Therefore, their main task should be to convince and motivate subordinate personnel in
order to implement sustainability principles at workplaces, including care for development and
formalization of activities in this area. Executive employees cooperating with their managers may
contribute to the improvement of the natural environment and to the elimination of social problems by
initiating changes concerning:
a) equipping workstations, e.g. applying for the purchase of ecological computers, furniture, etc. to
the travel agency,
Tourism Economy in Sustainability...
178
b) the way of work, e.g. economically using office supplies,
c) work environment, for example, suggesting the replacement of bulbs with energy-saving ones.
It is also important from the managers and contractors point of view to engage in public campaigns
aimed at counteracting social pathological phenomena or these which are aimed at helping vulnerable
people, for example people with disabilities, patients or those injured in natural disasters.
2.2 Construction Infrastructure with Sustainability Features
The construction infrastructure of tourism service providers is in practice very diverse. Its size and
structure depend, for example, on the profile or scale of business operations. However, one can point
out two extreme cases. The first one concerns such producers, who have a large building base, e.g.
hotel chain, while the second one includes single, small tourist entities located in premises rented by
them.
In accordance with the idea of sustainable development, each producer of tourist services should
however, regardless of the type of business and the amount of revenue generated, strive to locate their
business in facilities that meet sustainability criteria. To achieve this goal, he can use the following
options:
a) erect new buildings with such features,
b) transfer the activity to this type of construction works,
c) modernize existing ones in this respect.
In accordance with the principles of sustainable development, such buildings are erected as a result
of the so-called: clean production based on natural, renewable and healthy materials of local origin
(e.g. wood, brick, clay). It means that they do not disturb the landscape, they are durable, they have a
simple and light construction and after usage circle they can be recycled. They use harmless
construction and finishing materials. They also shapes the appropriate microclimate inside the rooms
(temperature, humidity, filtration and air ventilation), also protects the interior against noise, and
finally provides the right lighting. Such buildings are therefore friendly to people staying there and do
not harm the natural environment. A very important feature of architecture with sustainability features
is also energy efficiency. The benchmark solution in this area is so-called an autonomous building,
which is a construction to which no external energy is supplied. It is possible thanks to the use of
modern wall, window and roof insulation systems and the use of renewable energy: solar, wind, and
also from the inside of the Earth. Collectors and solar cells (solartermia) allow the transformation of
sunlight into heat, which is used for heating utility water and the operation of central heating. Wind
turbines or photovoltaic cells that convert solar energy into electricity can be used to generate
electricity. One can also use geothermal energy sources and biogas plants. Another important element
is also natural indoor and outdoor lighting, powered by solar energy. The reduction of artificial
lighting allows innovative design solutions that ensure maximum use of daylight inside the facility.
The rational use of water is also important for sustainability canon. Therefore, modern solutions
should take into account equipping buildings with rainwater tanks (use of rainwater) and at water
purification and treatment stations (used water is recycled again). Water, coming from these sources,
is usually used for irrigation of plants and flushing toilets. It is also advisable that the building has
biologically active surfaces (e.g. green roofs, elevations). In its interiors should be green places with
vegetation, which does not require intensive watering.
The costs associated with the construction of ecological buildings are about 5% higher than the
traditional way of building, but this investment returns within five to 15 years. Green buildings save
30 to 50% of energy, consume about 30% less water, about 40% of CO2 emission to the atmosphere is
reduced. Finally, these buildings produce as much as 70% less waste compared to standard buildings
[www 1]. In some countries, modern eco-certified buildings are being surrendered today.
2.3 Sustainable Equipment of Touristic Facilities
Another important issue is the adequate furnishing of buildings in which business activity is carried
out. It is important that it should consists of durable, safe and health objects. An example may be so-
called sustainable / ecological furniture, which is produced from renewable materials of national
origin. Ecological character should also have fillers (e.g. sheep's wool, rubber latex, shredded straw),
B. Pabian
179
upholstery fabrics (e.g. organic cotton, flax, silk) as well as glues used to join parts forming the
furniture (natural instead of synthetic).
Another important element of building equipment are various types of devices, e.g. computers,
printers, scanners, which are located in offices, hotel rooms, restaurants, cafes, recreational and sports
facilities. Producing one unit of desktop computer requires consumption of over 240 kg of fossil fuels,
22 kg of chemicals and 1500 kg of water. Over 1000 various types of materials, including toxic ones,
are used in their production. Computer integrated circuits contain lead and cadmium, computer
monitors - mercury and bar, and batteries - lithium, nickel-cadmium. Therefore, the tourist service
provider should not use conventional but only sustainable computer equipment that is already on the
market. An example is the Lenovo ThinkCentre M57 / M57P Eco Desktop, which has been awarded
the Greenguard Ecological Certificate, as it contains components made of recyclable materials. Has
successfully passed tests for 2000 different chemical emissions [www 2]. The sustainable electronics
group also includes EIZO FlexScan Eco View monitors equipped with the EcoView Optymizer 2
function, which allows you to reduce energy consumption by up to 30%. These monitors are
characterized by high durability, as evidenced by a five-year manufacturer's warranty. Equally
important from the point of view of the degree of sustainability is the type of peripheral devices used.
2.4 Transport with Sustainability Features
Different means of communication are used not only for the carriage of tourists (air, car, rail, sea
and inland transport), but also for ongoing activities related to the management of tourism entities.
From the point of view of sustainable development, pro-ecological and pro-social communication
should be used. However, there are two major barriers to achieving this status. The first of these is the
fact that there is insufficient access to sustainable modes of transport. The tourist services
manufacturer can build a building with sustainability features for his own needs, but he will not design
and produce such aircraft, coach, car or ship. The most modern means of transport can only buy or
charter. Finance is another major barrier to sustainable tourism transport. In order to reduce costs, and
hence also prices, the manufacturers of tourist services sometimes use means of transport that cannot
be counted among the most modern. For example, planes are not chartered from the leaders of the
aviation market, but from low-budget carriers. The degree of sustainability of such means of transport
is lower, which certainly does not contribute to the development of tourism in the aspect of
sustainability.
There are already large-scale transport means on the market that should be used in tourism. Let the
coach Iveco Magelys (Coach of the Year) use as the exemplification. It was awarded the first place in
the European competition for the best coach in 2016. The competitions have been held since 1989 and
their organizer is the Association of Commercial Vehicle Editors. This coach is equipped with a 9-liter
Cursor FPT engine, which has a 10% lower fuel consumption than its predecessor. Thanks to modern
solutions, such as the use of the latest generation of Common Rain injection and the HI-SCR catalytic
reduction system, the power unit of this coach has a lower mass and high reliability. Passengers' lives
and health are guarded by modern, technical active and passive safety systems, including: ABS, ASR,
EBS (electronic stability program), ACC (adaptive cruise control, keeping a safe distance from the
vehicle in front) and LDWS (warning system against leaving the lane). Balance features have also
electric communication means.
2.5 Sustainable Falling Goods
Falling goods cover all durable and unstable products that the tourist service provider purchases in
order to conduct ongoing operations. They include both products consumed during the performance of
services (e.g. groceries purchased by restaurants) as well as intended for administration and service
needs, including office supplies (including catalogs in paper versions, hotel information brochures
about services, tourist folders and advertising leaflets, disposable packaging in gastronomy). A lot of
paper is consumed by the administration.
The most common raw material in paper production is wood, the sourcing of which reduces the
size of forest areas and destroys natural ecosystems. In addition to this raw material in the factories of
paper and printing houses consumes energy, water and many other components, it also uses
Tourism Economy in Sustainability...
180
technological lines, performs transport and storage operations. All this creates ecological and social
problems. The tourist service producer should not only buy products made of ecological paper, but
also minimize its consumption. It is also advisable to purchase all goods from local producers and
suppliers that are characterized by high ecological and social sensitivity, and their products have been
manufactured in accordance with the principles of sustainable development and awarded with
appropriate certificates.
3. Conclusion
Sustainable tourism requires a holistic approach based on comprehensive solutions. Sustainable
tourism can only be implemented by economic entities that are characterized by a systemic approach
to the principles of sustainability, i.e. organizations whose managers and employees understand these
principles and try to implement them in all functional areas of their operation.
Sustainable features must be demonstrated not only by tourists, but also by all tourism service
providers. A systematic approach that brings together economic, social and environmental goals must
be accompanied by a systematic functional approach in all areas of tourism companies' activities at the
stage from the area of emission to the tourist reception area.
Further development of sustainable tourism requires adding to the system - sustainable tourism
services and tourists respecting the principles of sustainability - yet another important element, which
is the producers of tourist services observing the principles of sustainability. And this is not about
sporadic or apparent activities for sustainable development, aimed at improving one's image, but about
a comprehensive transformation that will make all resources and activities of a tourist service provider
contribute to the balancing of intergenerational needs and the development of sustainable tourism.
References
Brinkmann R. (2016). Introduction to Sustainability, J. Wiley& Sons Ltd, Chister.
Fogel D. (2016). Strategic Sustainability, Routlege, Taylor& Francis, New York.
Kowalczyk A. (2010).Sustainable tourism.PWN. Warsaw.
Pabian A., Bylok F., Kucęba R., Zawada M. (2013). Sustainable Organisations of the future in the
European Union Structure, International Journal of Management& Computing Sciences 3, 1: 41-
51.
Pender L. (2008).Tourism management. English language edition published by Sage Publications of
London, Copyright for the Polish edition by PWE, Warsaw 2008.
Thiele L. (2016). Sustainability, Polity Press. Cambridge.
Zaręba D. (2000). Ecotourism. Challenges and hopes. PWN. Warsaw.
[www 1] Climate protection: in 2020, Bosch will be neutral in terms of CO2 emissions on a global
scalehttps://www.inteligentnybudynek.eu/ochrona-klimatu-w-2020-roku-bosch-bedzie-neutralny-
pod-wzgledem-emisji-co2-w-skali-globalnej/(15.05.2019).
[www 2] Medi 2 Technologyhttp://media2.pl/technologie (06.07.2019).
3rdInternational Conference on Economic Research
24-25th October 2019, Alanya, Turkey
181
ANALYSIS OF SMALLHOLDER FARMERS’ INFORMATION NEEDS ON
CLIMATE-SMART AGRICULTURE
Koketso Letlhogonolo Setshedi
North West University, Department of Agricultural Economics and Extension, South Africa
Email: [email protected]
Sinah Madikapi Modirwa North West University, Department of Agricultural Economics and Extension, South Africa
Abstract
Climate change affects agricultural productivity – especially of poor small-holder farmers. In the
coming years, majority of the world’s major crops, such as maize, rice etc, will experience reduced or
stagnant growth rates as a result of extreme temperatures and highly variable rainfall patterns brought
by climate change. This variation in climatic conditions poses serious threat to the sustainable
development of small-holder farmers who depend on rain-fed agriculture for their livelihoods. It is
therefore essential that farmers are supported with innovative agricultural and scientific solutions to
sustainably assist them in combatingthethreatsposedbyclimatechange.
Climate-Smart Agriculture (CSA) is a viable option, it offers farmers the opportunity to sustainably
increase agricultural productivity by supporting the incorporation of adaptation and mitigation. CSA is
an approach needed to transform agricultural systems to effectively support development and ensure
food security under climate change. CSA gives farmers a framework for achieving increases in
agricultural production despite the increasing climate variability being caused by climate change. This
helps to secure both individual livelihoods and global food security scaling up or growing a farming
enterprise, within an enabling policy environment. The transformation of smallholder farmers in to
climate-smart farmers has to begin with the identification of their specific information needs with
regard to CSA. This step is crucial because information assists farmers in reducing daily farming
uncertainties and enhances their decision-making in crucial times of the agricultural production cycle.
The primary purpose of this study is to analyse information needs of smallholder farmer with
regard to CSA in Mahikeng Local Municipality, North West Province, South Africa. A simple random
sampling technique was used to select a sample of 170 participants from a total of 1449 smallholder
farmers provided by the North West Department of Rural, Environment and Agricultural
Development. A structured questionnaire was used to elicit information from the participants.
Descriptive and inferential statistics were used to analyse data.
Results obtained from the descriptive analysis revealed that the average age of respondents was 49
years. A majority of the respondents were male, married, had an average farming experience of 20
years and, an average household size of 5 members and were in possession of highschool level of
education. Most respondents were involved in livestock farming, had inefficient access to public
extension officers, climate information, off-farm income and credit. The main source of information
was from fellow farmers and members of the family.
A majority of the farmers had a high need for information on CSA, their knowledge level on CSA
was low, while their attitude towards CSA was positive. Age (p< 0.05), farming experience (p< 0.05)
and farm income per month (p< 0.05) had statistically significant relationships with smallholder
farmers’ information needs on CSA. It is, therefore, concluded that an enabling environment should be
created by the Government of South Africa for the timely and accurate provision of the much-needed
information on CSA by smallholder farmers.
Keywords: Climate Change, Climate-Smart Agriculture, Climatic Variations, Small-Holder Farmers,
Information Needs.
3rd International Conference on Economic Research
24-25th October 2019, Alanya, Turkey
182
DEVELOPMENT OF OUTSOURCING IN UKRAINE AND THE WORLD
Anna Chmut
Kherson State University, Economics and Management Department, Ukraine
Email: [email protected]
Artem Lahoiskyi
Kherson State University, Economics and Management Department, Ukraine
Abstract
Searching for effective forms of business process organization and relationships between
companies with partners in international markets increasingly leads to the use of outsourcing. The
analysis of approaches of American, Western European, Russian and Ukrainian scientists to determine
the definition of "outsourcing" made possible to classify them having distinguished the nature of the
phenomenon, which is: the process of transfer, transmission of internal functions or business
processes to external contractor; the process of acquiring of resources and services which ensures
functioning of the main activities from external contractors; modern methodology or strategy of
business organization, which is based on a decision to restructure the business model.
Globalization of the world economy became the basis for the formation of the world market of
outsourcing services. There was analyzed the dynamics of the market of outsourcing services
including its types, determined leader countries which provide outsourcing services. Among the major
trends in outsourcing services we can include growing competition, involving new countries and
regions, the emergence of new market players and increased demand for high-tech services.
There was formed a summarizing of all possible approaches and their own understanding of the
concept of "outsourcing". It is determined that the main objective of outsourcing is to get the
competitive advantages by improving economic activity, retention of key competencies,
transformation of business models, creation of strategic alliances and business networks. At present
outsourcing is presented in many areas of business.
The article defines countries-leaders specializing in outsourcing, explores the features of
outsourcing development in Ukraine.
Keywords: Outsourcing, Market Outsourcing Services, IT Outsourcing, IT Industry.
1. Introduction
To date the development of the world economy is characterized by increased processes of
globalization, competition, the active dissemination of information technology. All these tendencies
lead to the strengthening of the role of such forms of interaction between enterprises in the domestic
and foreign markets, which ensure reduction of costs, strengthening of competitive items, expansion of
markets. Outsourcing is widely used in international business practice and is a modern methodology
for creating highly effective and competitive companies. Outsourcing is an alternative to vertical
integration and provides the formation of a system of long-term relationships between companies
(horizontal and vertical), and the result is in economies on a scale, integration of production processes
of various forms, innovative development of the company.
2. Literature Review and Research Methods
In the practice of international business, the concept of outsourcing has been known since the 30's
of the 20th century. Accordingly, the study of the topic of outsourcing is more fully disclosed in the
works of Western European and American scholars (Clements and Donelan, 2004; Heywood, 2001;
Abramovsky, Griffith, & Sako, 2004). In Ukraine, theoretical and methodological principles of
outsourcing are considered fragmentarily in the light of international experience (Zozuliov, Mikalo,
2009). The essence of outsourcing, its advantages and goals are devoted to the author's previous
scientific works (Chmut, Osadchiy, 2017, Bilan, Ushkarenko & Chmut, 2017, Koshkarova, 2016).In
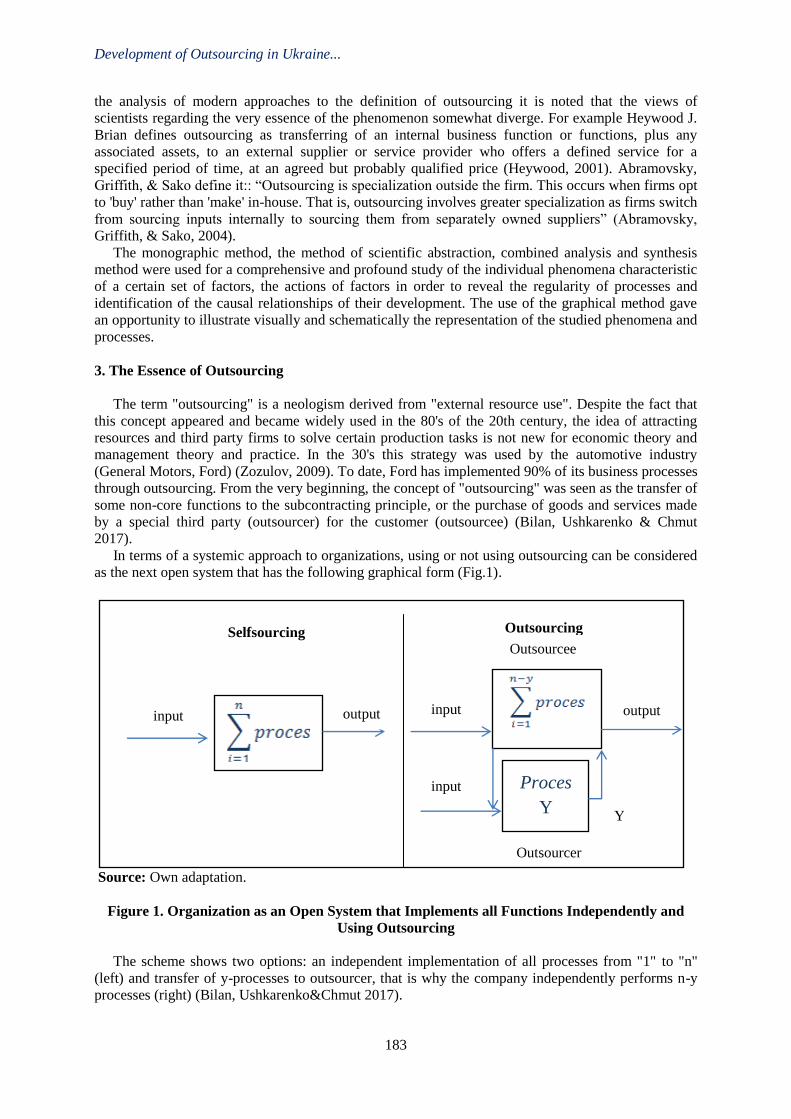
Development of Outsourcing in Ukraine...
183
the analysis of modern approaches to the definition of outsourcing it is noted that the views of
scientists regarding the very essence of the phenomenon somewhat diverge. For example Heywood J.
Brian defines outsourcing as transferring of an internal business function or functions, plus any
associated assets, to an external supplier or service provider who offers a defined service for a
specified period of time, at an agreed but probably qualified price (Heywood, 2001). Abramovsky,
Griffith, & Sako define it:: “Outsourcing is specialization outside the firm. This occurs when firms opt
to 'buy' rather than 'make' in-house. That is, outsourcing involves greater specialization as firms switch
from sourcing inputs internally to sourcing them from separately owned suppliers” (Abramovsky,
Griffith, & Sako, 2004).
The monographic method, the method of scientific abstraction, combined analysis and synthesis
method were used for a comprehensive and profound study of the individual phenomena characteristic
of a certain set of factors, the actions of factors in order to reveal the regularity of processes and
identification of the causal relationships of their development. The use of the graphical method gave
an opportunity to illustrate visually and schematically the representation of the studied phenomena and
processes.
3. The Essence of Outsourcing
The term "outsourcing" is a neologism derived from "external resource use". Despite the fact that
this concept appeared and became widely used in the 80's of the 20th century, the idea of attracting
resources and third party firms to solve certain production tasks is not new for economic theory and
management theory and practice. In the 30's this strategy was used by the automotive industry
(General Motors, Ford) (Zozulov, 2009). To date, Ford has implemented 90% of its business processes
through outsourcing. From the very beginning, the concept of "outsourcing" was seen as the transfer of
some non-core functions to the subcontracting principle, or the purchase of goods and services made
by a special third party (outsourcer) for the customer (outsourcee) (Bilan, Ushkarenko & Chmut
2017).
In terms of a systemic approach to organizations, using or not using outsourcing can be considered
as the next open system that has the following graphical form (Fig.1).
Source: Own adaptation.
Figure 1. Organization as an Open System that Implements all Functions Independently and
Using Outsourcing
The scheme shows two options: an independent implementation of all processes from "1" to "n"
(left) and transfer of y-processes to outsourcer, that is why the company independently performs n-y
processes (right) (Bilan, Ushkarenko&Chmut 2017).
output
output input
Proces
Y
input
Y
Outsourcee
Outsourcer
Selfsourcing Outsourcing
input
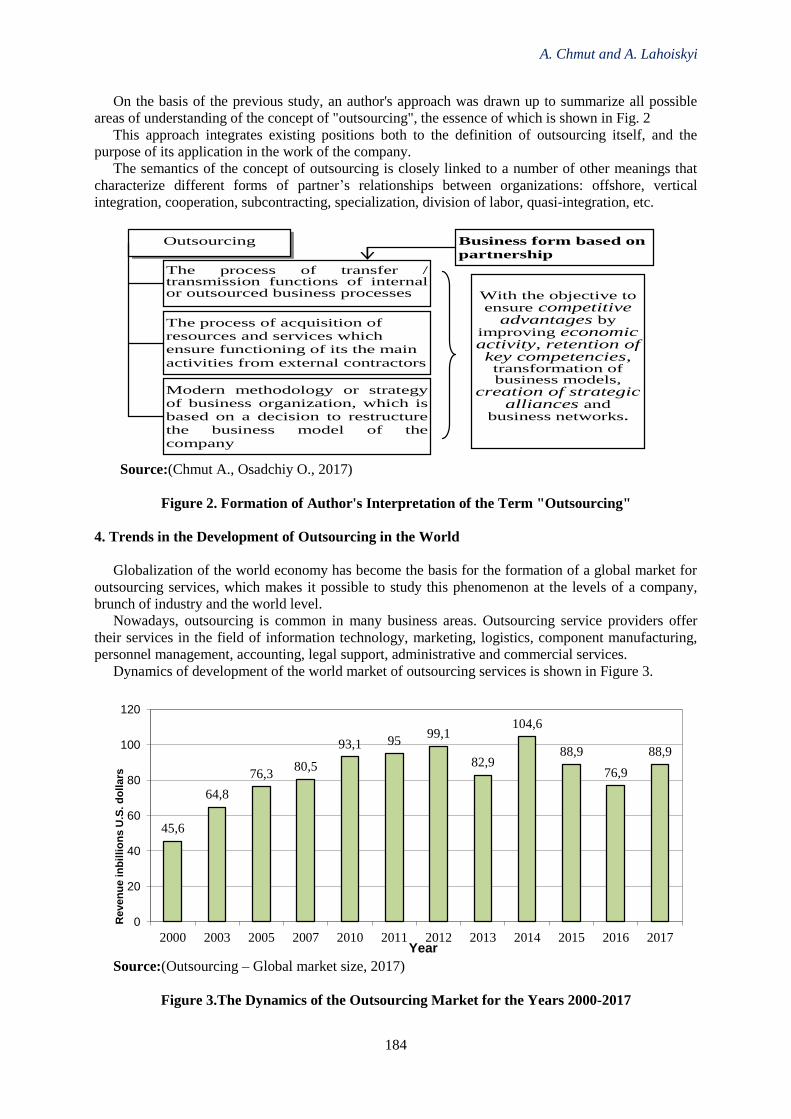
A. Chmut and A. Lahoiskyi
184
On the basis of the previous study, an author's approach was drawn up to summarize all possible
areas of understanding of the concept of "outsourcing", the essence of which is shown in Fig. 2
This approach integrates existing positions both to the definition of outsourcing itself, and the
purpose of its application in the work of the company.
The semantics of the concept of outsourcing is closely linked to a number of other meanings that
characterize different forms of partner’s relationships between organizations: offshore, vertical
integration, cooperation, subcontracting, specialization, division of labor, quasi-integration, etc.
Outsourcing
With the objective to ensure competitive
advantages by improving economic activity, retention of key competencies, transformation of business models,
creation of strategic alliances and
business networks.
The process of transfer / transmission functions of internal or outsourced business processes
Modern methodology or strategy
of business organization, which is
based on a decision to restructure
the business model of the
company
The process of acquisition of
resources and services which
ensure functioning of its the main
activities from external contractors
Business form based on
partnership
Source:(Chmut A., Osadchiy O., 2017)
Figure 2. Formation of Author's Interpretation of the Term "Outsourcing"
4. Trends in the Development of Outsourcing in the World
Globalization of the world economy has become the basis for the formation of a global market for
outsourcing services, which makes it possible to study this phenomenon at the levels of a company,
brunch of industry and the world level.
Nowadays, outsourcing is common in many business areas. Outsourcing service providers offer
their services in the field of information technology, marketing, logistics, component manufacturing,
personnel management, accounting, legal support, administrative and commercial services.
Dynamics of development of the world market of outsourcing services is shown in Figure 3.
Source:(Outsourcing – Global market size, 2017)
Figure 3.The Dynamics of the Outsourcing Market for the Years 2000-2017
45,6
64,8
76,3 80,5
93,1 95 99,1
82,9
104,6
88,9
76,9
88,9
0
20
40
60
80
100
120
2000 2003 2005 2007 2010 2011 2012 2013 2014 2015 2016 2017
Reven
ue
in
bil
lio
ns
U.S
. d
oll
ars
Year
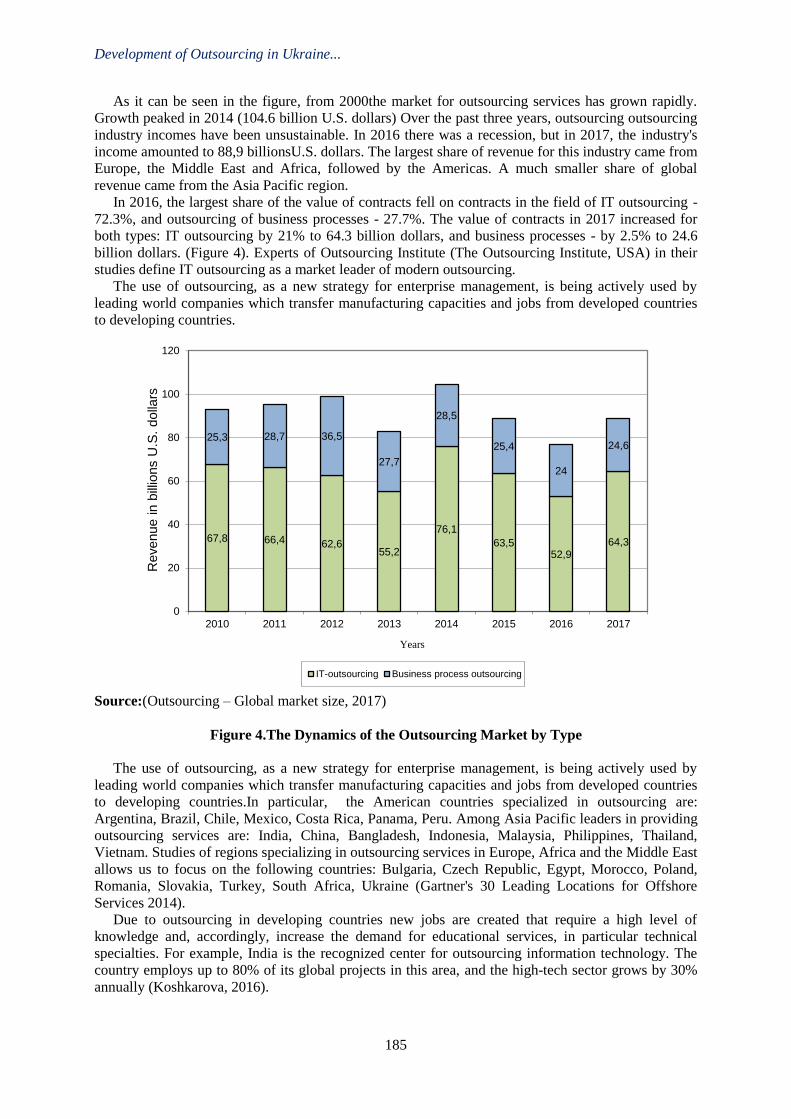
Development of Outsourcing in Ukraine...
185
As it can be seen in the figure, from 2000the market for outsourcing services has grown rapidly.
Growth peaked in 2014 (104.6 billion U.S. dollars) Over the past three years, outsourcing outsourcing
industry incomes have been unsustainable. In 2016 there was a recession, but in 2017, the industry's
income amounted to 88,9 billionsU.S. dollars. The largest share of revenue for this industry came from
Europe, the Middle East and Africa, followed by the Americas. A much smaller share of global
revenue came from the Asia Pacific region.
In 2016, the largest share of the value of contracts fell on contracts in the field of IT outsourcing -
72.3%, and outsourcing of business processes - 27.7%. The value of contracts in 2017 increased for
both types: IT outsourcing by 21% to 64.3 billion dollars, and business processes - by 2.5% to 24.6
billion dollars. (Figure 4). Experts of Outsourcing Institute (The Outsourcing Institute, USA) in their
studies define IT outsourcing as a market leader of modern outsourcing.
The use of outsourcing, as a new strategy for enterprise management, is being actively used by
leading world companies which transfer manufacturing capacities and jobs from developed countries
to developing countries.
Source:(Outsourcing – Global market size, 2017)
Figure 4.The Dynamics of the Outsourcing Market by Type
The use of outsourcing, as a new strategy for enterprise management, is being actively used by
leading world companies which transfer manufacturing capacities and jobs from developed countries
to developing countries.In particular, the American countries specialized in outsourcing are:
Argentina, Brazil, Chile, Mexico, Costa Rica, Panama, Peru. Among Asia Pacific leaders in providing
outsourcing services are: India, China, Bangladesh, Indonesia, Malaysia, Philippines, Thailand,
Vietnam. Studies of regions specializing in outsourcing services in Europe, Africa and the Middle East
allows us to focus on the following countries: Bulgaria, Czech Republic, Egypt, Morocco, Poland,
Romania, Slovakia, Turkey, South Africa, Ukraine (Gartner's 30 Leading Locations for Offshore
Services 2014).
Due to outsourcing in developing countries new jobs are created that require a high level of
knowledge and, accordingly, increase the demand for educational services, in particular technical
specialties. For example, India is the recognized center for outsourcing information technology. The
country employs up to 80% of its global projects in this area, and the high-tech sector grows by 30%
annually (Koshkarova, 2016).
67,8 66,4 62,6 55,2
76,1
63,5 52,9
64,3
25,3 28,7 36,5
27,7
28,5
25,4
24
24,6
0
20
40
60
80
100
120
2010 2011 2012 2013 2014 2015 2016 2017
Revenue in
bill
ions U
.S.
dolla
rs
Years
IT-outsourcing Business process outsourcing
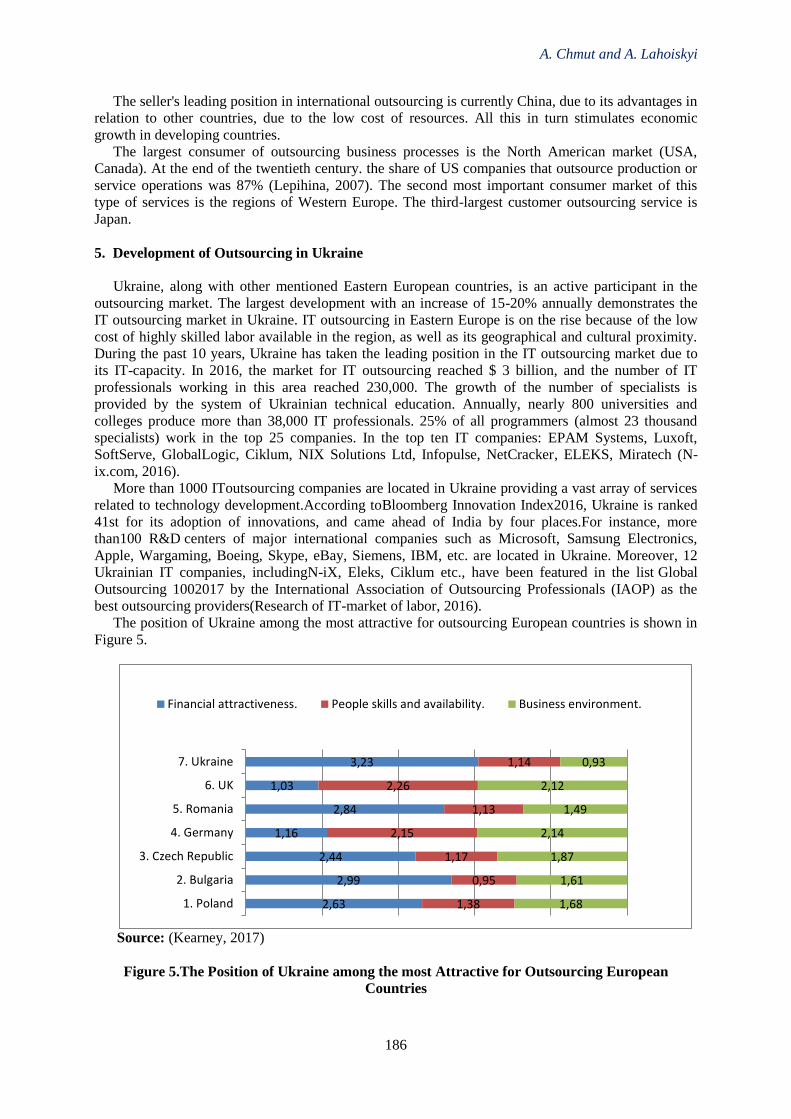
A. Chmut and A. Lahoiskyi
186
The seller's leading position in international outsourcing is currently China, due to its advantages in
relation to other countries, due to the low cost of resources. All this in turn stimulates economic
growth in developing countries.
The largest consumer of outsourcing business processes is the North American market (USA,
Canada). At the end of the twentieth century. the share of US companies that outsource production or
service operations was 87% (Lepihina, 2007). The second most important consumer market of this
type of services is the regions of Western Europe. The third-largest customer outsourcing service is
Japan.
5. Development of Outsourcing in Ukraine
Ukraine, along with other mentioned Eastern European countries, is an active participant in the
outsourcing market. The largest development with an increase of 15-20% annually demonstrates the
IT outsourcing market in Ukraine. IT outsourcing in Eastern Europe is on the rise because of the low
cost of highly skilled labor available in the region, as well as its geographical and cultural proximity.
During the past 10 years, Ukraine has taken the leading position in the IT outsourcing market due to
its IT-capacity. In 2016, the market for IT outsourcing reached $ 3 billion, and the number of IT
professionals working in this area reached 230,000. The growth of the number of specialists is
provided by the system of Ukrainian technical education. Annually, nearly 800 universities and
colleges produce more than 38,000 IT professionals. 25% of all programmers (almost 23 thousand
specialists) work in the top 25 companies. In the top ten IT companies: EPAM Systems, Luxoft,
SoftServe, GlobalLogic, Ciklum, NIX Solutions Ltd, Infopulse, NetCracker, ELEKS, Miratech (N-
ix.com, 2016).
More than 1000 IToutsourcing companies are located in Ukraine providing a vast array of services
related to technology development.According toBloomberg Innovation Index2016, Ukraine is ranked
41st for its adoption of innovations, and came ahead of India by four places.For instance, more
than100 R&D centers of major international companies such as Microsoft, Samsung Electronics,
Apple, Wargaming, Boeing, Skype, eBay, Siemens, IBM, etc. are located in Ukraine. Moreover, 12
Ukrainian IT companies, includingN-iX, Eleks, Ciklum etc., have been featured in the list Global
Outsourcing 1002017 by the International Association of Outsourcing Professionals (IAOP) as the
best outsourcing providers(Research of IT-market of labor, 2016).
The position of Ukraine among the most attractive for outsourcing European countries is shown in
Figure 5.
Source: (Kearney, 2017)
Figure 5.The Position of Ukraine among the most Attractive for Outsourcing European
Countries
2,63
2,99
2,44
1,16
2,84
1,03
3,23
1,38
0,95
1,17
2,15
1,13
2,26
1,14
1,68
1,61
1,87
2,14
1,49
2,12
0,93
1. Poland
2. Bulgaria
3. Czech Republic
4. Germany
5. Romania
6. UK
7. Ukraine
Financial attractiveness. People skills and availability. Business environment.
Development of Outsourcing in Ukraine...
187
As can be seen from the figure among the European countries, Ukraine ranks 7th in the
attractiveness of outsourcing. In the overall ranking of countries of the world, Ukraine ranks 24th.
Thus Ukraine has great prospects for IT outsourcing compared to outsourcing in general. Owing to
the large number of highly skilled and efficient employees, which grows rapidly each year,
outsourcing companies become more attractive for inflow of foreign capital and investments from the
EU and the USA.
6. Conclusions
Taking into account the above study, it can be affirmed that the search for effective forms of
organization of business processes and the relationship between companies with their partners in
international markets increasingly determines the use of outsourcing. The main advantages of
outsourcing are the provision of competitive advantages by improving the economic efficiency of
operations, maintaining key competencies, improving the business models, creating strategic alliances
and business networks. The global outsourcing market is developing rapidly. The main segments of
this market are outsourcing information technology and outsourcing business processes.
Among the main trends in the development of the market we can include the growth and
strengthening of competition, the attraction of new countries and regions, the emergence of new
market participants, as well as increased demand for science intensive services.
References
Abramovsky, L., Griffith, R., & Sako, M.(2004). Offshoring of business services and its impact on the
UK economy, Advanced Institute Management (AIM) Research, November.
A.T.Kearney, Global services location index(2017), Retrived from:
https://www.atkearney.com/documents/20152/793366/The+Widening+Impact+of+Automation.pdf
/42b06cf4-e5f9-d8ec-a30c-a82dd26d4953.
Bilan Y., Nitsenko V., Ushkarenko I., Chmut A., (2017).Outsourcing in International Economic
Relations, Montenegrin Journal of Economics, Vol. 13, No. 3, pp.175-185.
Gartner's 30 Leading Locations for Offshore Services, (2014),Retrived
from:https://www.gartner.com/doc/2667522/gartners--leading-locations-offshore;
Heywood J. Brian (2001), The Outsourcing Dilemma: The Search for Competitiveness, Financial
Times/Prentice Hall, London.
KoshkarovaE. L.,2016. SuchasnitendentsiyisvitovogorinkuIT-autsorsingu,
VisnikHarkivskogonatsionalnogouniversitetuImeniKarazina, vip. 91, p.p.153-160.
Outsourcing – Global market size, (2017),Retrived from: http://www.statista.com.
Chmut A., OsadchiyO.,(2017).Sutnist' autsorsyngu ta tendencii' jogo rozvytku na mizhnarodnyh
rynkah,Global'ni ta nacional'ni problemy ekonomiky. Retrived from: http://global-
national.in.ua/issue-17-2017.
Lepihina S.N., (2007) Rol autsorsinga v mirovoy ekonomike, Vestnik Tomskogo gosudarstvennogo
universiteta, No. 300 (II), p.p. 49–53.
Research of IT-market of labor,(2016).Retrived from: http://news.finance.ua/ua/news/-/361504/skilky-
v-ukrayini-programistiv-ide-vony-pratsyuyut-doslidzhennya-it-rynku-pratsi.
Top IT Outsourcing Destinations: Ukraine vs. India.Retrived from: https://www.n-ix.com/top-
outsourcing-destinations-ukraine-vs-india/
Zozulov O., Mikalo O., (2009) Autsorsing yak Instrument pidvischennya konkurentospromozhnosti
vitchiznyanih pidpriEmstv v umovah globalizatsiyi, Ekonomika Ukrayini, No. 8(573), p.p. 16-25.
3rdInternational Conference on Economic Research
24-25th October 2019, Alanya, Turkey
188
THE IMPACT OF TECHNOLOGY ON REGIONAL
PRICE DISPERSION IN THE US
Ismail H. Genc
American University of Sharjah, Department of Economics,UAE, Email:[email protected]
Abstract
In this paper, we analyze the behavior of prices (inflation) in the era of fast information dispersion made possible advances in technology in particular the internet. With the help of readily available
information, prices, and by extension inflation, should quickly converge in a perfectly competitive
market structure, generating a zero economic profit for companies. Thus, we explore the possibility of a price convergence in the form of a reduction in regional inflation in the United States. Related to
that, we examine the permanency of such a phenomenon if observed, as it is a concern for the
monetary policy makers. We do so, by analyzing the behavior of the standard deviation of inflation in a number of regions over time in the USA by employing univariate as well as multivariate models. A
particular attention in the multivariate model is devoted to the role of technology. In sum, we show
that the standard deviation of inflation is not constant over time, but we do not necessarily observed an
ever-declining pattern Keywords: Inflation, Technology, Central Bank Policies.
3rdInternational Conference on Economic Research
24-25th October 2019, Alanya, Turkey
189
REGIONAL DIFFERENCES IN HUMAN CAPITAL AND OCCUPATIONAL
CHOICE: EVIDENCE FROM MEXICO
Kanat Abdulla
Graduate School of Public Policy, Nazarbayev University, Kazakhstan
Email: [email protected]
Abstract
This paper attempts to explain the productivity differences across regions in Mexico. The choice of
the country is motivated both by reasons of data availability and by differences in the occupational
distributions across regions in Mexico. The primary data source of the study is micro-level survey data
available at the Integrated Public Use Microdata Series (IPUMS). The data includes detailed
information on individual socio-economic and occupational characteristics. The analysis is performed
on individuals aged between 25 and 60 and includes samples for which sufficient data is available
(1990, 2000, and 2010). The variable names, coding schemes, and documentation are consistent for
most samples, which makes the analysis comparable across the periods.
The data shows that there are differences in education quality, school attendance, and the
occupational choices across regions in Mexico. These affect the aggregate productivity of the regions.
I build a general equilibrium model with frictions in the labor markets, quality of education, and
school attendance to quantify their impact on regional economic development. The quality of
education proxied by the test scores and school attendance help explain the substantial regional
productivity differences in Mexico. I find that regions with a higher quality of education and schooling
attendance have higher productivity: the model predicts that these explain 10-25% of the difference in
the observed regional productivity. The regional differences in occupational choice caused by frictions
in the labor markets contribute to productivity differences as well. Regions with occupational
distribution skewed towards higher-skill occupations are, on average, 3-4% more productive than the
lowest-productive regions.
It is shown that the regional differences in school attendance and the quality of education are
essential factors in explaining regional productivities. The analysis also indicates that occupational
choice can explain some of the differences in productivity observed across regions. This result has
important policy implications, suggesting that policies and regulations designed to improve education
and improve ways for people to move to highly productive occupations can have high social returns
and increase the overall well-being of the population.
Keywords: Occupational Distribution, Regional Productivity, Human Capital, Friction, Roy Model.
3rdInternational Conference on Economic Research
24-25th October 2019, Alanya, Turkey
190
CAPITAL ASSET PRICING MODEL; A CATASTROPHIC THEORY APPROACH
Galo Adolfo Farfán Pacheco
University of Alicante, Spain
Plamen Neytchev Netchev
Private Communication, Email: [email protected]
Abstract
From the moment of its creation, the CAPM has played a very important role in the quantitative
methods of the financial studies of the capital market. But the standard Global CAPM rates, are
directly inapplicably to the majority of cases regarded to “risky” economies called emergent ones too. In this presentation, based on the Theory of Elementary Catastrophes,it shows, how the risk factors as
i.e.“Country”, etc. can be quantified and addedto the classical CAPM in order to obtain more
objectivity in the respective applications.The result of applying an abstract mathematical theory using the technique of (pseudo)embedding (similar to the manipulations in the differential topology) to
obtain concrete results in a specific area of knowledge, without considering details, should not
generate surprise if we contemplate as a fundamental illustration the indisputable case of the statistics – said mathematical formalism explains any phenomenon, where the uncertainty is a predominant
factor. So, the shift towards lower values of expected returns is considered as the effect of change in
behaviour (the “catastrophe”) of the function describing the influence of risk factors. For now, our
proposal is restricted to unimodal distributions where the risk perturbations are (up to infinitesimally)
small but with considerable consecutions. The corrections to the CAPM can be calculated based on Γ–
type distributions that would approximate the probability densities in the risk environments if we knew
them beforehand. Keywords: CAPM, Elementary Catastrophes, Expected Return, Emerging Economy Risks.
1. Introduction
According to the literature1,2 the Capital Asset Pricing Model (CAPM) “is a model that describes
the relationship between the systematic risk and expected return for assets” in order “to make
decisions about adding assets to a well-diversified portfolio”. But it is well-knowthe standard Global CAPM rates are directly inapplicably to the majority of cases regarded to “risky” economiescalled
emergent ones too.This is, for example, the case of the Latin America3 where, each country has its
own specific characteristics which introduce additional risks (if as reference point we take the application of the CAPM to the economy of the EE.UU.).The objective of this work is:to quantify the
most important risk factors in order to be applied through the Theory of Elementary Catastrophes to
the calculation of the risk "country" 4,5,6 et al.Right away, in the second part of the introduction, are
exposed without proof some generally known definitions and facts, but restructured with a view to our objective. Further, we propose a mode of calculating certain corrections with respect to the “classical”
CAPM. The presentation finishes with several conclusions about the proposed method.
In the present article, we shall consider the concepts of return and risk as the most relevantnotions with respect to an asset. The return is the total amount obtained when the provided regulativetime for
an asset is over. The risk is the probability for the occurrence of an unfavourable event namely, when
the total returnedmonetary value after the finish of the financial operation is less than the investment
(thesis7and contrathesis8). It is clear, that the return basically depends on risks split in two types: systematics ones and
diversifiable ones9. Although the risks of the first type can unfortunately be both unpredictable and
impossible to completely avoid, in some sense these may be taken into account by dint of analytical methods of description. On the other hand, the risks of the second type are evaluated by statistical
method applications as well as anticipated through simulations based on the random processes theory,
for example, applying the Monte Carlo algorithms10,11,12 et al.
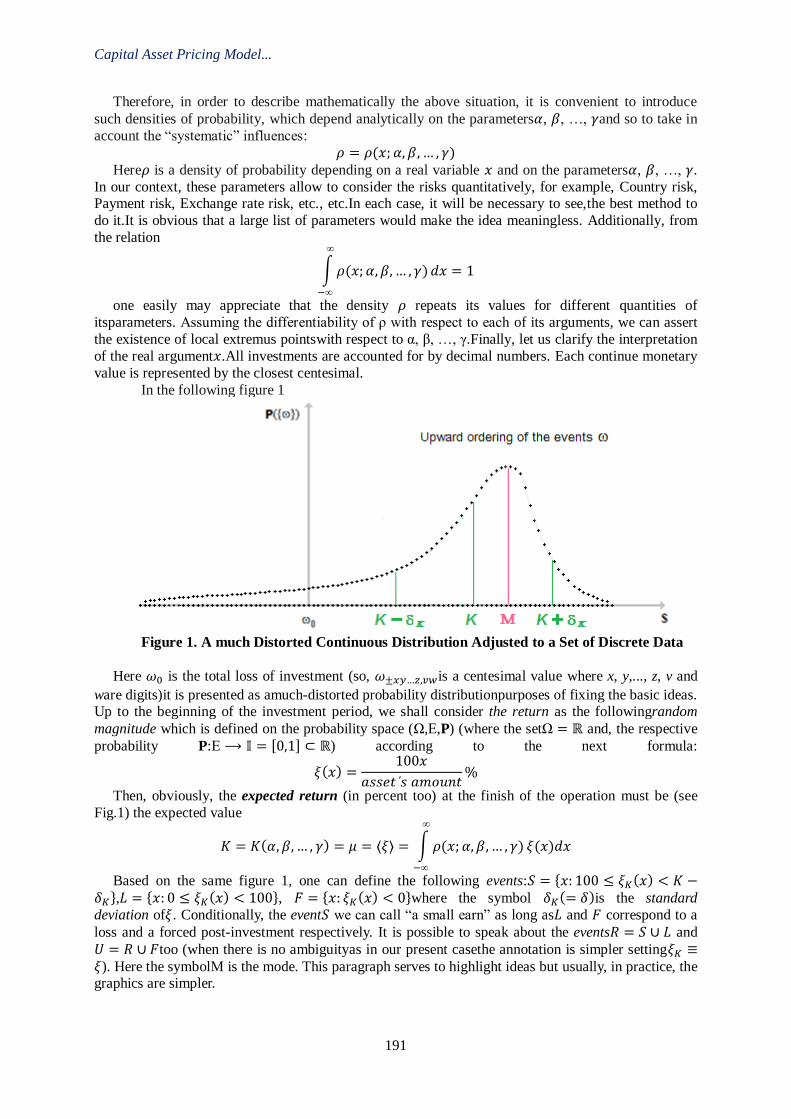
Capital Asset Pricing Model...
191
Therefore, in order to describe mathematically the above situation, it is convenient to introduce
such densities of probability, which depend analytically on the parameters𝛼, 𝛽, …, 𝛾and so to take in
account the “systematic” influences:
𝜌 = 𝜌(𝑥; 𝛼, 𝛽, … , 𝛾)
Here𝜌 is a density of probability depending on a real variable 𝑥 and on the parameters𝛼, 𝛽, …, 𝛾.
In our context, these parameters allow to consider the risks quantitatively, for example, Country risk, Payment risk, Exchange rate risk, etc., etc.In each case, it will be necessary to see,the best method to
do it.It is obvious that a large list of parameters would make the idea meaningless. Additionally, from
the relation
∫ 𝜌(𝑥; 𝛼, 𝛽, … , 𝛾)
∞
−∞
𝑑𝑥 = 1
one easily may appreciate that the density 𝜌 repeats its values for different quantities of
itsparameters. Assuming the differentiability of ρ with respect to each of its arguments, we can assert
the existence of local extremus pointswith respect to α, β, …, γ.Finally, let us clarify the interpretation
of the real argument𝑥.All investments are accounted for by decimal numbers. Each continue monetary
value is represented by the closest centesimal.
In the following figure 1
Figure 1. A much Distorted Continuous Distribution Adjusted to a Set of Discrete Data
Here 𝜔0 is the total loss of investment (so, 𝜔±𝑥𝑦…𝑧,𝑣𝑤is a centesimal value where x, y,..., z, v and
ware digits)it is presented as amuch-distorted probability distributionpurposes of fixing the basic ideas. Up to the beginning of the investment period, we shall consider the return as the followingrandom
magnitude which is defined on the probability space (Ω,Ε,P) (where the setΩ = ℝ and, the respective
probability P:Ε ⟶ 𝕀 = [0,1] ⊂ ℝ) according to the next formula:
𝜉(𝑥) =100𝑥
𝑎𝑠𝑠𝑒𝑡´𝑠 𝑎𝑚𝑜𝑢𝑛𝑡%
Then, obviously, the expected return (in percent too) at the finish of the operation must be (see
Fig.1) the expected value
𝐾 = 𝐾(𝛼, 𝛽, … , 𝛾) = 𝜇 = ⟨𝜉⟩ = ∫ 𝜌(𝑥; 𝛼, 𝛽, … , 𝛾)
∞
−∞
𝜉(𝑥)𝑑𝑥
Based on the same figure 1, one can define the following events:𝑆 = {𝑥: 100 ≤ 𝜉𝐾(𝑥) < 𝐾 −𝛿𝐾},𝐿 = {𝑥: 0 ≤ 𝜉𝐾(𝑥) < 100}, 𝐹 = {𝑥: 𝜉𝐾(𝑥) < 0}where the symbol 𝛿𝐾(= 𝛿)is the standard
deviation of𝜉. Conditionally, the event𝑆 we can call “a small earn” as long as𝐿 and 𝐹 correspond to a
loss and a forced post-investment respectively. It is possible to speak about the events𝑅 = 𝑆 ∪ 𝐿 and
𝑈 = 𝑅 ∪ 𝐹too (when there is no ambiguityas in our present casethe annotation is simpler setting𝜉𝐾 ≡𝜉). Here the symbolΜ is the mode. This paragraph serves to highlight ideas but usually, in practice, the graphics are simpler.
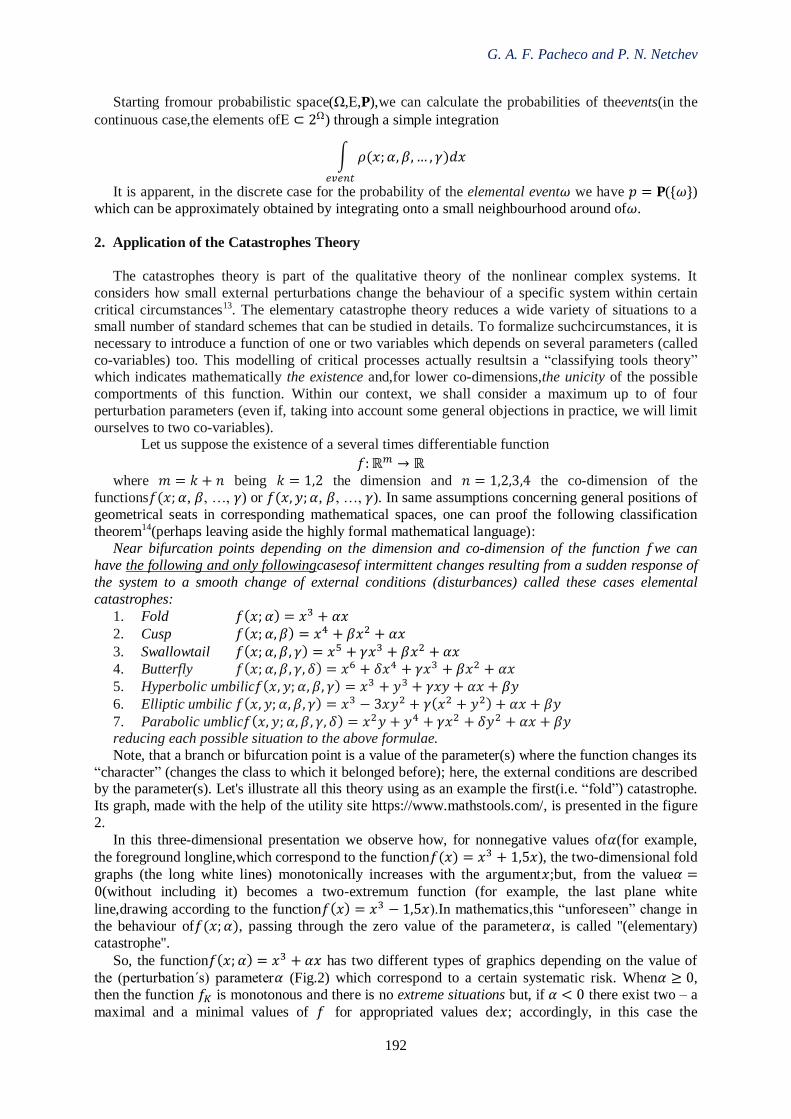
G. A. F. Pacheco and P. N. Netchev
192
Starting fromour probabilistic space(Ω,Ε,P),we can calculate the probabilities of theevents(in the
continuous case,the elements ofΕ ⊂ 2Ω) through a simple integration
∫ 𝜌(𝑥; 𝛼, 𝛽, … , 𝛾)𝑑𝑥
𝑒𝑣𝑒𝑛𝑡
It is apparent, in the discrete case for the probability of the elemental event𝜔 we have 𝑝 = P({𝜔})
which can be approximately obtained by integrating onto a small neighbourhood around of𝜔.
2. Application of the Catastrophes Theory
The catastrophes theory is part of the qualitative theory of the nonlinear complex systems. It
considers how small external perturbations change the behaviour of a specific system within certain
critical circumstances13. The elementary catastrophe theory reduces a wide variety of situations to a small number of standard schemes that can be studied in details. To formalize suchcircumstances, it is
necessary to introduce a function of one or two variables which depends on several parameters (called
co-variables) too. This modelling of critical processes actually resultsin a “classifying tools theory” which indicates mathematically the existence and,for lower co-dimensions,the unicity of the possible
comportments of this function. Within our context, we shall consider a maximum up to of four
perturbation parameters (even if, taking into account some general objections in practice, we will limit
ourselves to two co-variables). Let us suppose the existence of a several times differentiable function
𝑓: ℝ𝑚 → ℝ
where 𝑚 = 𝑘 + 𝑛 being 𝑘 = 1,2 the dimension and 𝑛 = 1,2,3,4 the co-dimension of the
functions𝑓(𝑥; 𝛼, 𝛽, …, 𝛾) or 𝑓(𝑥, 𝑦; 𝛼, 𝛽, …, 𝛾). In same assumptions concerning general positions of
geometrical seats in corresponding mathematical spaces, one can proof the following classification
theorem14(perhaps leaving aside the highly formal mathematical language):
Near bifurcation points depending on the dimension and co-dimension of the function 𝑓we can
have the following and only followingcasesof intermittent changes resulting from a sudden response of
the system to a smooth change of external conditions (disturbances) called these cases elemental
catastrophes:
1. Fold 𝑓(𝑥; 𝛼) = 𝑥3 + 𝛼𝑥
2. Cusp 𝑓(𝑥; 𝛼, 𝛽) = 𝑥4 + 𝛽𝑥2 + 𝛼𝑥
3. Swallowtail 𝑓(𝑥; 𝛼, 𝛽, 𝛾) = 𝑥5 + 𝛾𝑥3 + 𝛽𝑥2 + 𝛼𝑥
4. Butterfly 𝑓(𝑥; 𝛼, 𝛽, 𝛾, 𝛿) = 𝑥6 + 𝛿𝑥4 + 𝛾𝑥3 + 𝛽𝑥2 + 𝛼𝑥
5. Hyperbolic umbilic𝑓(𝑥, 𝑦; 𝛼, 𝛽, 𝛾) = 𝑥3 + 𝑦3 + 𝛾𝑥𝑦 + 𝛼𝑥 + 𝛽𝑦
6. Elliptic umbilic 𝑓(𝑥, 𝑦; 𝛼, 𝛽, 𝛾) = 𝑥3 − 3𝑥𝑦2 + 𝛾(𝑥2 + 𝑦2) + 𝛼𝑥 + 𝛽𝑦
7. Parabolic umblic𝑓(𝑥, 𝑦; 𝛼, 𝛽, 𝛾, 𝛿) = 𝑥2𝑦 + 𝑦4 + 𝛾𝑥2 + 𝛿𝑦2 + 𝛼𝑥 + 𝛽𝑦 reducing each possible situation to the above formulae.
Note, that a branch or bifurcation point is a value of the parameter(s) where the function changes its
“character” (changes the class to which it belonged before); here, the external conditions are described by the parameter(s). Let's illustrate all this theory using as an example the first(i.e. “fold”) catastrophe.
Its graph, made with the help of the utility site https://www.mathstools.com/, is presented in the figure
2.
In this three-dimensional presentation we observe how, for nonnegative values of𝛼(for example,
the foreground longline,which correspond to the function𝑓(𝑥) = 𝑥3 + 1,5𝑥), the two-dimensional fold
graphs (the long white lines) monotonically increases with the argument𝑥;but, from the value𝛼 =0(without including it) becomes a two-extremum function (for example, the last plane white
line,drawing according to the function𝑓(𝑥) = 𝑥3 − 1,5𝑥).In mathematics,this “unforeseen” change in
the behaviour of𝑓(𝑥; 𝛼), passing through the zero value of the parameter𝛼, is called "(elementary)
catastrophe".
So, the function𝑓(𝑥; 𝛼) = 𝑥3 + 𝛼𝑥 has two different types of graphics depending on the value of
the (perturbation´s) parameter𝛼 (Fig.2) which correspond to a certain systematic risk. When𝛼 ≥ 0,
then the function 𝑓𝐾 is monotonous and there is no extreme situations but, if 𝛼 < 0 there exist two – a
maximal and a minimal values of 𝑓 for appropriated values de𝑥; accordingly, in this case the
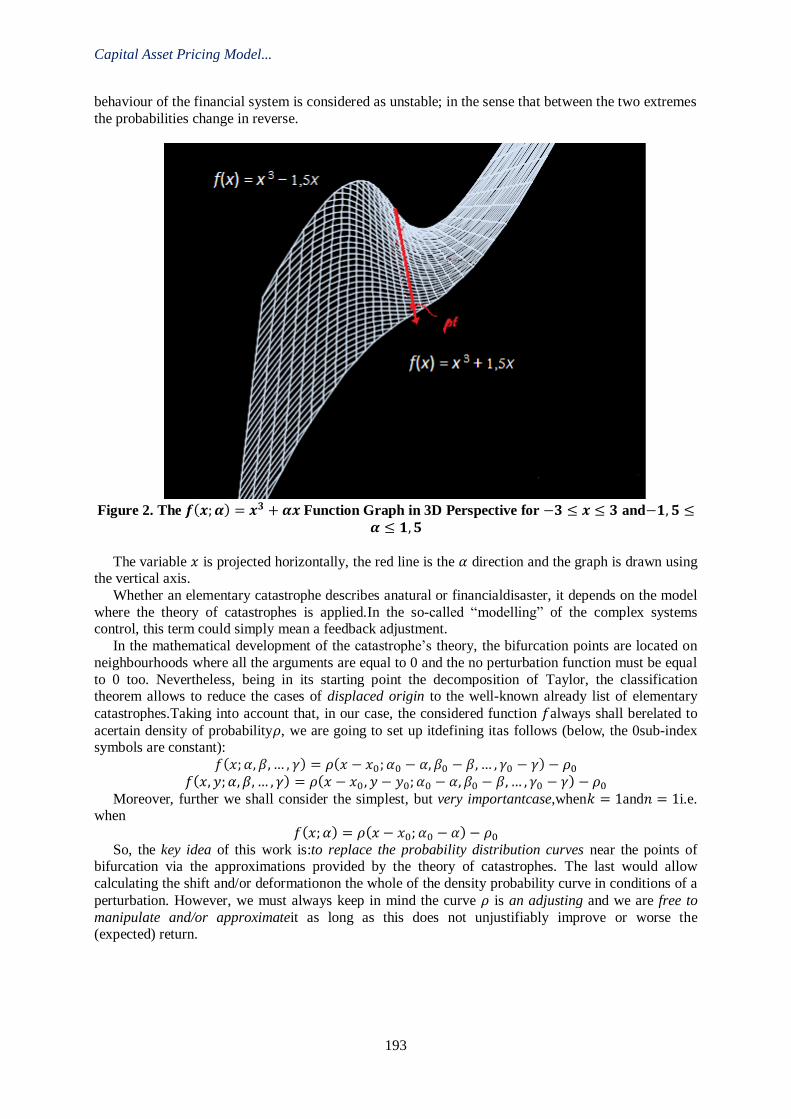
Capital Asset Pricing Model...
193
behaviour of the financial system is considered as unstable; in the sense that between the two extremes
the probabilities change in reverse.
Figure 2. The 𝒇(𝒙; 𝜶) = 𝒙𝟑 + 𝜶𝒙 Function Graph in 3D Perspective for −𝟑 ≤ 𝒙 ≤ 𝟑 and−𝟏, 𝟓 ≤
𝜶 ≤ 𝟏, 𝟓
The variable 𝑥 is projected horizontally, the red line is the 𝛼 direction and the graph is drawn using the vertical axis.
Whether an elementary catastrophe describes anatural or financialdisaster, it depends on the model
where the theory of catastrophes is applied.In the so-called “modelling” of the complex systems control, this term could simply mean a feedback adjustment.
In the mathematical development of the catastrophe’s theory, the bifurcation points are located on
neighbourhoods where all the arguments are equal to 0 and the no perturbation function must be equal
to 0 too. Nevertheless, being in its starting point the decomposition of Taylor, the classification theorem allows to reduce the cases of displaced origin to the well-known already list of elementary
catastrophes.Taking into account that, in our case, the considered function 𝑓always shall berelated to
acertain density of probability𝜌, we are going to set up itdefining itas follows (below, the 0sub-index symbols are constant):
𝑓(𝑥; 𝛼, 𝛽, … , 𝛾) = 𝜌(𝑥 − 𝑥0; 𝛼0 − 𝛼, 𝛽0 − 𝛽, … , 𝛾0 − 𝛾) − 𝜌0
𝑓(𝑥, 𝑦; 𝛼, 𝛽, … , 𝛾) = 𝜌(𝑥 − 𝑥0 , 𝑦 − 𝑦0; 𝛼0 − 𝛼, 𝛽0 − 𝛽, … , 𝛾0 − 𝛾) − 𝜌0
Moreover, further we shall consider the simplest, but very importantcase,when𝑘 = 1and𝑛 = 1i.e. when
𝑓(𝑥; 𝛼) = 𝜌(𝑥 − 𝑥0; 𝛼0 − 𝛼) − 𝜌0
So, the key idea of this work is:to replace the probability distribution curves near the points of bifurcation via the approximations provided by the theory of catastrophes. The last would allow
calculating the shift and/or deformationon the whole of the density probability curve in conditions of a
perturbation. However, we must always keep in mind the curve 𝜌 is an adjusting and we are free to
manipulate and/or approximateit as long as this does not unjustifiably improve or worse the (expected) return.
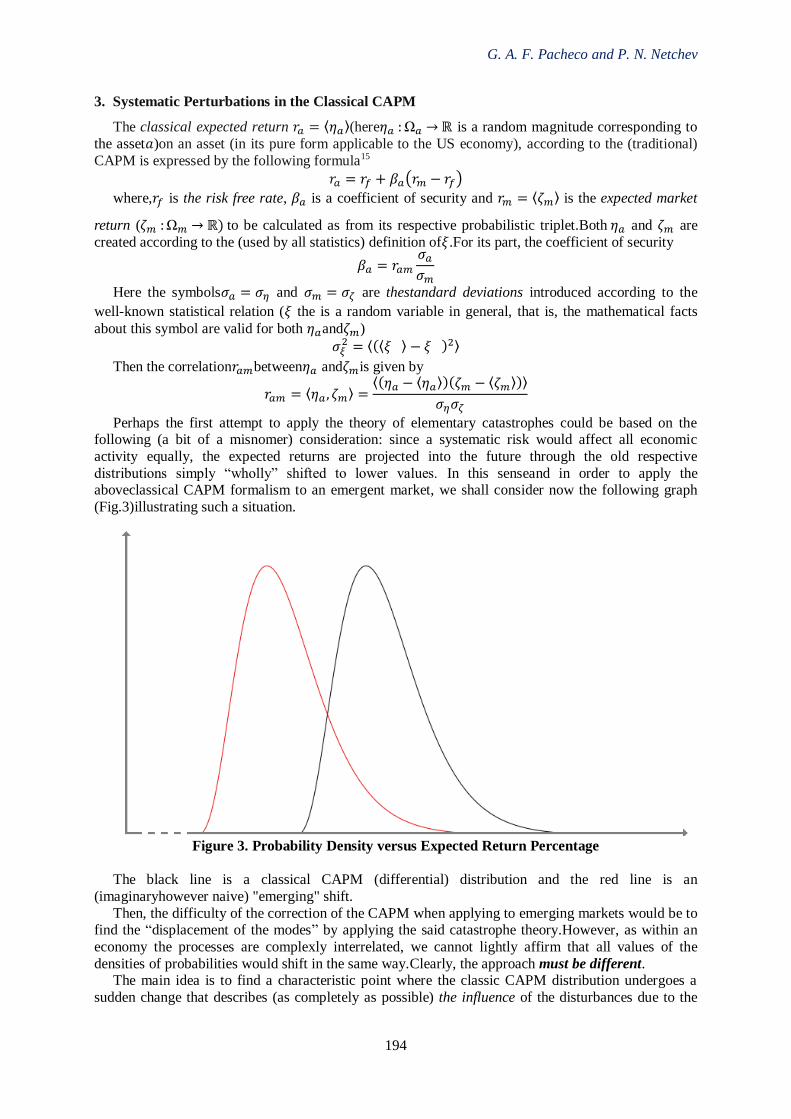
G. A. F. Pacheco and P. N. Netchev
194
3. Systematic Perturbations in the Classical CAPM
The classical expected return 𝑟𝑎 = ⟨휂𝑎⟩(here휂𝑎 : Ω𝑎 → ℝ is a random magnitude corresponding to
the asset𝑎)on an asset (in its pure form applicable to the US economy), according to the (traditional)
CAPM is expressed by the following formula15
𝑟𝑎 = 𝑟𝑓 + 𝛽𝑎(𝑟𝑚 − 𝑟𝑓)
where,𝑟𝑓 is the risk free rate, 𝛽𝑎 is a coefficient of security and 𝑟𝑚 = ⟨휁𝑚⟩ is the expected market
return (휁𝑚 : Ω𝑚 → ℝ) to be calculated as from its respective probabilistic triplet.Both 휂𝑎 and 휁𝑚 are
created according to the (used by all statistics) definition of𝜉.For its part, the coefficient of security
𝛽𝑎 = 𝑟𝑎𝑚
𝜎𝑎
𝜎𝑚
Here the symbols𝜎𝑎 = 𝜎𝜂 and 𝜎𝑚 = 𝜎𝜁 are thestandard deviations introduced according to the
well-known statistical relation (𝜉 the is a random variable in general, that is, the mathematical facts
about this symbol are valid for both 휂𝑎and휁𝑚)
𝜎𝜉2 = ⟨(⟨𝜉 ⟩ − 𝜉 )2⟩
Then the correlation𝑟𝑎𝑚between휂𝑎 and휁𝑚is given by
𝑟𝑎𝑚 = ⟨휂𝑎 , 휁𝑚⟩ =⟨(휂𝑎 − ⟨휂𝑎⟩)(휁𝑚 − ⟨휁𝑚⟩)⟩
𝜎𝜂𝜎𝜁
Perhaps the first attempt to apply the theory of elementary catastrophes could be based on the following (a bit of a misnomer) consideration: since a systematic risk would affect all economic
activity equally, the expected returns are projected into the future through the old respective
distributions simply “wholly” shifted to lower values. In this senseand in order to apply the aboveclassical CAPM formalism to an emergent market, we shall consider now the following graph
(Fig.3)illustrating such a situation.
Figure 3. Probability Density versus Expected Return Percentage
The black line is a classical CAPM (differential) distribution and the red line is an
(imaginaryhowever naive) "emerging" shift.
Then, the difficulty of the correction of the CAPM when applying to emerging markets would be to find the “displacement of the modes” by applying the said catastrophe theory.However, as within an
economy the processes are complexly interrelated, we cannot lightly affirm that all values of the
densities of probabilities would shift in the same way.Clearly, the approach must be different. The main idea is to find a characteristic point where the classic CAPM distribution undergoes a
sudden change that describes (as completely as possible) the influence of the disturbances due to the
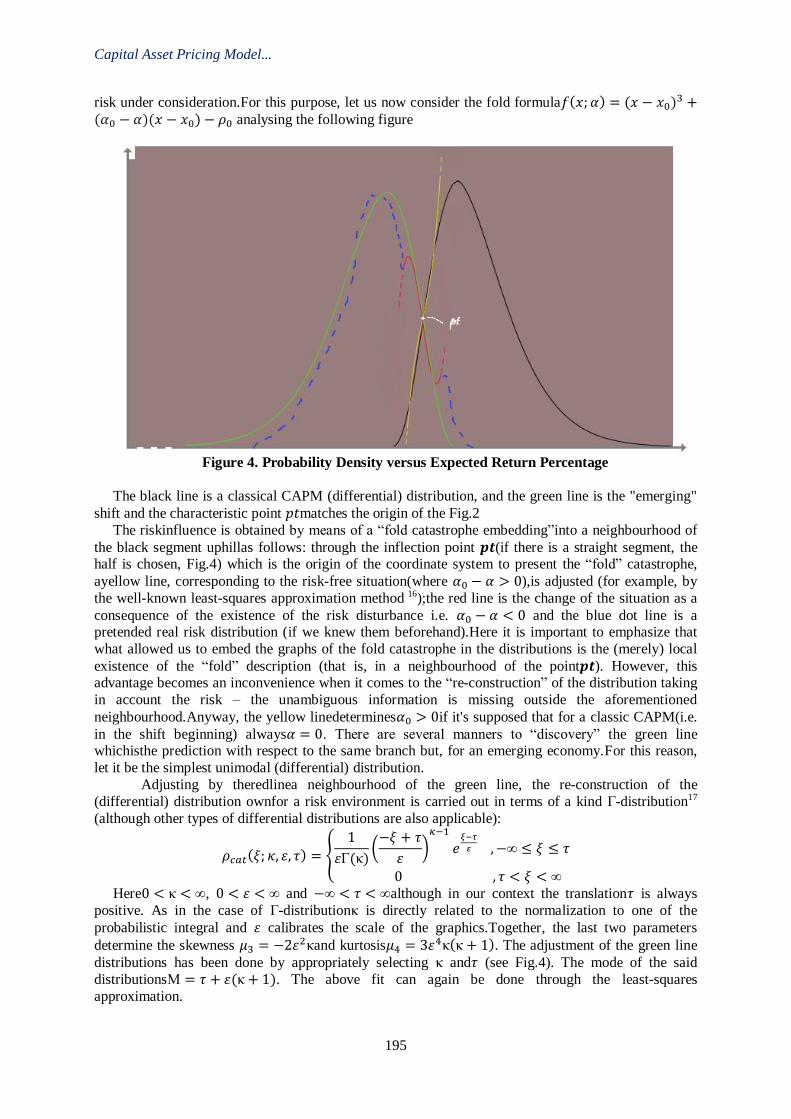
Capital Asset Pricing Model...
195
risk under consideration.For this purpose, let us now consider the fold formula𝑓(𝑥; 𝛼) = (𝑥 − 𝑥0)3 +(𝛼0 − 𝛼)(𝑥 − 𝑥0) − 𝜌0 analysing the following figure
Figure 4. Probability Density versus Expected Return Percentage
The black line is a classical CAPM (differential) distribution, and the green line is the "emerging"
shift and the characteristic point 𝑝𝑡matches the origin of the Fig.2
The riskinfluence is obtained by means of a “fold catastrophe embedding”into a neighbourhood of
the black segment uphillas follows: through the inflection point 𝒑𝒕(if there is a straight segment, the half is chosen, Fig.4) which is the origin of the coordinate system to present the “fold” catastrophe,
ayellow line, corresponding to the risk-free situation(where 𝛼0 − 𝛼 > 0),is adjusted (for example, by
the well-known least-squares approximation method 16);the red line is the change of the situation as a
consequence of the existence of the risk disturbance i.e. 𝛼0 − 𝛼 < 0 and the blue dot line is a pretended real risk distribution (if we knew them beforehand).Here it is important to emphasize that
what allowed us to embed the graphs of the fold catastrophe in the distributions is the (merely) local
existence of the “fold” description (that is, in a neighbourhood of the point𝒑𝒕). However, this advantage becomes an inconvenience when it comes to the “re-construction” of the distribution taking
in account the risk – the unambiguous information is missing outside the aforementioned
neighbourhood.Anyway, the yellow linedetermines𝛼0 > 0if it's supposed that for a classic CAPM(i.e.
in the shift beginning) always𝛼 = 0. There are several manners to “discovery” the green line whichisthe prediction with respect to the same branch but, for an emerging economy.For this reason,
let it be the simplest unimodal (differential) distribution.
Adjusting by theredlinea neighbourhood of the green line, the re-construction of the
(differential) distribution ownfor a risk environment is carried out in terms of a kind Γ-distribution17
(although other types of differential distributions are also applicable):
𝜌𝑐𝑎𝑡(𝜉; 𝜅, 휀, 𝜏) = {1
휀Γ(κ)(
−𝜉 + 𝜏
휀)
𝜅−1
𝑒𝜉−𝜏
𝜀 , −∞ ≤ 𝜉 ≤ 𝜏
0 , 𝜏 < 𝜉 < ∞
Here0 < κ < ∞, 0 < 휀 < ∞ and −∞ < 𝜏 < ∞although in our context the translation𝜏 is always
positive. As in the case of Γ-distributionκ is directly related to the normalization to one of the
probabilistic integral and 휀 calibrates the scale of the graphics.Together, the last two parameters
determine the skewness 𝜇3 = −2휀2κand kurtosis𝜇4 = 3휀4κ(κ + 1). The adjustment of the green line
distributions has been done by appropriately selecting κ and𝜏 (see Fig.4). The mode of the said
distributionsΜ = 𝜏 + 휀(κ + 1). The above fit can again be done through the least-squares
approximation.
G. A. F. Pacheco and P. N. Netchev
196
In the figures 3 and 4, we have omitted/neglectedthose parts where the values of the density of
probability𝜌 are sufficientlysmall, naming the effective density𝜌´.We shall note the expected
returnvalue including the additional systematic risk by 𝐾𝑎´ .Then
𝐾𝑎´ = 𝐾𝑎
´ (𝛼) = ∫ 휂𝑎(𝑥)𝜌 (𝑥; 𝛼)
∞
−∞
𝑑𝑥 ≅ ∫ 휂𝑎(𝑥)𝜌´(𝑥; 𝛼)
b´
−a´
𝑑𝑥
If we assume,according to the fig. 3, that a risk factor cannot increase the financial returns and that
the systematic nature of the risk has to affect all the possible developments of the investment in the
same way, we can write (∆> 0 is the shift of the initial probability 𝜌)
𝜌´(𝑥) = 𝜌(𝑥 + ∆)
Consequently, if we integrate this equation (without above approximation), we can write the
following:
𝐾𝑎´ = ∫ 휂𝑎(𝑥)𝜌 (𝑥 + ∆; 𝛼)
∞
−∞
𝑑𝑥 = ∫ 휂𝑎(𝑥 − ∆)𝜌(𝑥; 𝛼)
∞
−∞
𝑑𝑥 = ∫100(𝑥 − ∆)
𝑎𝑠𝑠𝑒𝑡´𝑠 𝑎𝑚𝑜𝑢𝑛𝑡𝜌(𝑥; 𝛼)
∞
−∞
𝑑𝑥
The next step is compute the last integral.The result is: 𝐾𝑎´ = 𝐾𝑎 −
100∆
𝑎𝑠𝑠𝑒𝑡´𝑠𝑎𝑚𝑜𝑢𝑛𝑡%.Now, from
figure 3 it is seen that an investor placing his resources in the same branch in the United States could
expect, with the same probability, a return with 100∆
𝑎𝑠𝑠𝑒𝑡´𝑠𝑎𝑚𝑜𝑢𝑛𝑡% greater than in a country of risk.In
this way, in order for the investment offer to become competitive (at risk conditions), the expected
return should be compensated for by this difference.
Hence, as a correction to the classical CAPM we add the said term obtaining
𝑟𝑎´ = 𝑟𝑓 + 𝛽𝑎(𝑟𝑚 − 𝑟𝑓) +
100∆
𝑎𝑠𝑠𝑒𝑡´𝑠 𝑎𝑚𝑜𝑢𝑛𝑡%
But we already know from the reflections made at the beginning of this chapter that, the assumption of translation of the density curve is unreliable.For this reason, we propose that the
additional risk premium inherent to emerging economies should be calculated as a difference between
the expected value obtained from the density 𝜌𝑐𝑎𝑡(𝜉; 𝜅, 휀, 𝜏)and the expected return value according
to the respective branch using the classical CAPM.
Initially, in order to quantify the risk parameter𝛼, we can use one of several risk qualification
systems. For example, Euromoney18. The last problem to solve now is how to calibrate the Euromoney
points.We propose the following: after each exercise period, comparing the results of the US market
with those of the risk market we could establish a gauge coefficient 휃which multiplies𝛼; let the
repetition of the process described in this chapter fine-tunethe value𝛼 of the additional risk according
to thereal emerging markets.Using the different values of 𝛼corresponding to the diverse periods of
exercise, adjusting by the least-squares approximation, we can obtain the“gauge” function휃 = 휃(𝛼).
Now, it misses just to do the replace𝛼 → 𝛼휃(𝛼).
4. Some Considerations and Conclusions
The first thing we would like to note is the shift of the potential returns is guided by the densities´
(of the probabilities) inclines and not directly according to the expected values. But we believe that
this is not a problem because the intervals of credibility are sufficiently thin to do not generate significant errors in the predictions.
In the second place, our calculation could be similar to the operating principle of a “black box”–
inputdata (some numbers that determine the risk) and output information (the percentage of the expected profit shift). Provisionally as a place of departure we have adopted the euromoney rating risk
valorisation.However, when debugging this process, based on future predictions and comparing them
with the results obtained later, we believe that it is possible to arrive at a modification (for use within
our model) of the euromoney (inputdata) system. In order to obtain a clearer image with respect to some practical aspects, which can impact the
future applications. It is worth it to take into account that there exist several important steps. Once we
have developed our “own methodology” to quantify the input data for only one co-variable, we should go to the option of studying, for example, the Country risk in a deferred way as a compound risk -
Capital Asset Pricing Model...
197
each of the components could be considered directly affecting a function𝑓 of several co-variables.
First, one must introduce in an appropriate way the perturbation parameters𝛼, 𝛽, …, 𝛾. This means to
determine the number of the significant ones – in a given situation, not every risk (or its “components”) has the same importance.Second, they must be correctly ordered and quantized. For
example, the parameter corresponding to the Exchange rate risk is easily quantifiable. On the contrary,
the introduction of aPayment risk parameter shall be a lot more difficult, even if we believe in the“assistance” which the classification theorem can provide. Starting, there could be ambiguities
regarding the parameters order. However, depending on the context of the problem, we are
confidentthat in every situationafter an in-depth analysis,the formulation of the problemcan be
adaptedand, in this way,solved univocally. Thus, it is possible to obtain indications from the same parameters’ ordering.
Finally, we believe in the future corrective function of anupcoming methodology. Since the mode
of obtaining of our output information, from the input risk data, is totally objective, it can be assumed that by analysingthe past data, supplied in the context of the results obtained later, it will be possible to
weigh if these were reliableand consequently continually improve predictions.
Acknowledgements
This research article was partially supported by M&M INTERNATIONAL- Consultores
Tecnológicos.
References
Investopedia. https://www.investopedia.com/terms/c/capm.asp.
Wikipedia. https://en.wikipedia.org/wiki/Capital_asset_pricing_model.
Hamard Alfonso, Lamothe Prosper. https://www.researchgate.net/publication/ 28290159_A_Modified_CAPM_Valuation_Model_for_Latin_American_Emerging_Markets,
January 2009.
Valladares Mayra Rodriguez. Latin American Markets Look In 2019 And Beyond.
https://www.forbes.com/sites/mayrarodriguezvalladares/2018/12/10/latin-american-markets-look-promising-in-2019-and-beyond/#72f92ab35724.Dec. 10, 2018.
MSCI Emerging Markets Latin America Index (Usd). Https://Www.Msci.Com/Documents/
10199/5b537e9c-Ab98-49e4-88b5-Bf0aed926b9b. Walker Eduardo. Cost of Capital In Emerging Markets: Bridging Gaps Between Theory And Practice.
Lat. Am. J. Econ. Vol. 53. No. 1 Santiago Dec. 2016.
Eberlein Ernst et al.Mathematics in Financial Risk Management. Institut f¨ur Mathematische
Stochastik, Universit¨at Freiburg.March 31, 2007. Holton Glyn A. Defining Risk.Financial Analysts Journal. Volume 60 • Number 6 ©2004, CFA
Institute.
https://www.wallstreetmojo.com/systematic-risk-vs-unsystematic-risk/.
García‐Sánchez Javier et al. Valuation in Emerging Markets: A Simulation Approach. IAE Business
School – Universidad Austral.
Hodgson Douglas J.et al. Testing The Capital Asset Pricing Model Efficiently Under Elliptical Symmetry: A Semiparametric Approach. Discussion Paper, No.EM/00/398, July 2000.
Zhi Da et al. CAPM for estimating the cost of equity capital: Interpreting the empirical evidence.
Journal of Financial Economics 103 (2012) 204–220.
René Tohm. Modèles mathématiques de la morphogenèse : Recueil de textes sur la théorie des catastrophes et ses applications (10-18). 1974
Encyclopedia of Applied Physics vol.3, p.p. 85-119: Catastrophe Theory. Robert Gilmore. Drexel
University, Philadelphia, Pennsylvania, USA, VCH Publishers, 1992 Sharpe William F. Selected Works. World Scientific Pub Co Inc., 2011.
NealenAndrew. An As-Short-As-Possible Introduction to the Least Squares, Weighted Least Squares
and Moving Least Squares Methods for Scattered Data Approximation and Interpolation.
http://www.nealen.de/projects/mls/asapmls.pdf

G. A. F. Pacheco and P. N. Netchev
198
Abramowitz Milton, Stegun Irene A. Handbook of Mathematical Functions (with Formulas, Graphs
and Mathematical Tables). National Bureau of Standards, Applied Mathematics Series 55, Tenth
printing with corrections, Dec. 1972. Euromoney site https://www.euromoney.com/.
3rdInternational Conference on Economic Research
24-25th October 2019, Alanya, Turkey
199
PROJECTS OF LOCAL MUNICIPALITIES AS A TOOL FOR REGIONAL
DEVELOPMENT IN LATVIA
Elita Jermolajeva
Latvia University of Life Sciences and Technologies,
Institute of Entrepreneurship and Business Management, Jelgava, Latvia
Email: [email protected]
Abstract
The most important problem of regional development in Latvia, which has been affected by
globalization and demographic changes in recent decades, is significant differences in the level of
socio-economic development in the regions of the country - they are the third highest among OECD
countries. GDP per capita in Riga region (capital city of Latvia) was 17213 EUR in year 2016 or 135% of the national average (12760 EUR). In Kurzeme region (Western part of the country) it was
74% of the average, but in Latgale region (Eastern part) – only 51%.
Structural changes create the new jobs, mainly in cities, while in rural and remote areas employment is declining and rural areas are no longer attractive to young people – it applies to all
spheres: work, culture and entertainment. Differences in economic activity have a direct impact on the
size of municipal budgets, as municipalities with lower economic activity (higher unemployment, etc.) have lower tax revenues (especially income tax). The income disproportion in Latvia is partially
reduced by grants from the Municipal Finance Equalization Fund to municipalities with lower tax
revenues, however municipal budgets are very different in what they can invest in development and
service delivery to the population. Significant differences make some municipalities much less attractive for housing choices than others, so one of the solutions is to attract finances through various
funds, programmes, etc. Latvian municipalities are trying to do it, especially with European Union
(EU) co-financing. According to Latvian Ministry of Finance 2016 data on impact of EU Structural and Cohesion Funds on economic growth in Latvia it was on overage 1-2% per year during period
2007-2013 which can be considered as a significant contribution to the development of the country.
The aim of the study is to analyse Preili County as one of the local rural municipalities of Latgale region placed in the Eastern part of Latvia and to identify the factors contributing to the development
of territory. During the National Research Programme 5.2. ‘Economic Transformation, smart growth,
governance and legal framework for the state and society for sustainable development - a new
approach to the creation of a sustainable learning community/ EKOSOC-LV’ (2014-2018) it was concluded that sustainability is based on smart specialization using the potential of the territory. The
study created a Smart Development Index for each municipality (included resources, population,
economy, governance). Preili County was on the 3rd place between 19 rural communities of Latgale region: 53 projects (about 22 million EUR) were implemented during the period 2007-2013 and more
than 60 projects (about 25 million EUR) in 2014-August 2019, including 32 projects with co-financing
of EU.
The study makes several proposals to local authorities, also emphasizing that effective mutual cooperation and partnership will play an important role in the development of rural areas as well as the
prudent use of public investment, carefully assessing the long-term prospects for smart development in
each area. Keywords: Regional Development, Local Community, Co-Financing of European Union.
1. Introduction
Structural changes based on globalization and demographic processes not only creates socio-
economic disparities between countries, but also creates disparities within countries, including
changing the role and outlook for urban and rural areas. Cities have become very important in generating national economic success because the cities attract and focus resources on growth, which
have become very mobile as a result of globalization - human resources (citizens, students, tourists,
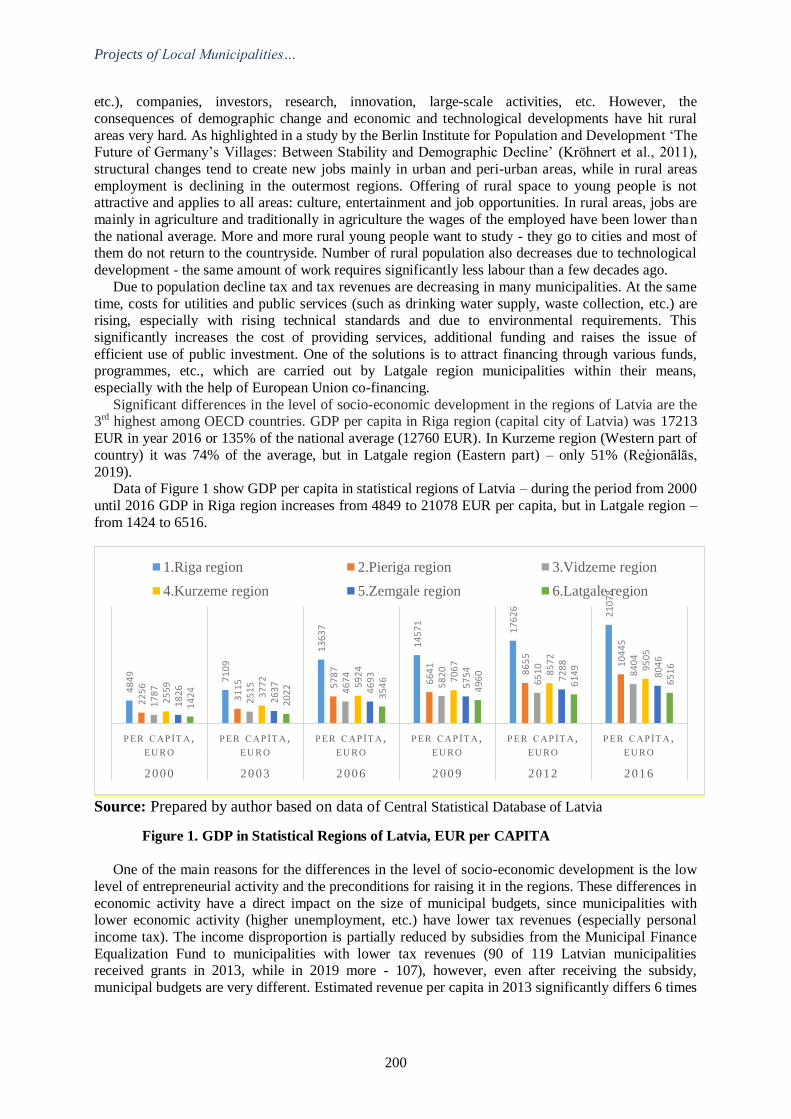
Projects of Local Municipalities…
200
etc.), companies, investors, research, innovation, large-scale activities, etc. However, the
consequences of demographic change and economic and technological developments have hit rural
areas very hard. As highlighted in a study by the Berlin Institute for Population and Development ‘The Future of Germany’s Villages: Between Stability and Demographic Decline’ (Kröhnert et al., 2011),
structural changes tend to create new jobs mainly in urban and peri-urban areas, while in rural areas
employment is declining in the outermost regions. Offering of rural space to young people is not attractive and applies to all areas: culture, entertainment and job opportunities. In rural areas, jobs are
mainly in agriculture and traditionally in agriculture the wages of the employed have been lower than
the national average. More and more rural young people want to study - they go to cities and most of them do not return to the countryside. Number of rural population also decreases due to technological
development - the same amount of work requires significantly less labour than a few decades ago.
Due to population decline tax and tax revenues are decreasing in many municipalities. At the same
time, costs for utilities and public services (such as drinking water supply, waste collection, etc.) are rising, especially with rising technical standards and due to environmental requirements. This
significantly increases the cost of providing services, additional funding and raises the issue of
efficient use of public investment. One of the solutions is to attract financing through various funds, programmes, etc., which are carried out by Latgale region municipalities within their means,
especially with the help of European Union co-financing.
Significant differences in the level of socio-economic development in the regions of Latvia are the 3rd highest among OECD countries. GDP per capita in Riga region (capital city of Latvia) was 17213
EUR in year 2016 or 135% of the national average (12760 EUR). In Kurzeme region (Western part of
country) it was 74% of the average, but in Latgale region (Eastern part) – only 51% (Reģionālās,
2019). Data of Figure 1 show GDP per capita in statistical regions of Latvia – during the period from 2000
until 2016 GDP in Riga region increases from 4849 to 21078 EUR per capita, but in Latgale region –
from 1424 to 6516.
Source: Prepared by author based on data of Central Statistical Database of Latvia
Figure 1. GDP in Statistical Regions of Latvia, EUR per CAPITA
One of the main reasons for the differences in the level of socio-economic development is the low
level of entrepreneurial activity and the preconditions for raising it in the regions. These differences in
economic activity have a direct impact on the size of municipal budgets, since municipalities with lower economic activity (higher unemployment, etc.) have lower tax revenues (especially personal
income tax). The income disproportion is partially reduced by subsidies from the Municipal Finance
Equalization Fund to municipalities with lower tax revenues (90 of 119 Latvian municipalities received grants in 2013, while in 2019 more - 107), however, even after receiving the subsidy,
municipal budgets are very different. Estimated revenue per capita in 2013 significantly differs 6 times
48
49
71
09
13
63
7
14
57
1
17
62
6
21
07
8
22
56
31
15 57
87
66
41
86
55
10
44
5
17
87
25
15
46
74
58
20
65
10
84
04
25
59
37
72
59
24
70
67
85
72
95
05
18
26
26
37
46
93
57
54
72
88
80
46
14
24
20
22
35
46
49
60
61
49
65
16
P ER C AP İT A , EU R O
P ER C AP İT A , EU R O
P ER C AP İT A , EU R O
P ER C AP İT A , EU R O
P ER C AP İT A , EU R O
P ER C AP İT A , EU R O
2 0 0 0 2 0 0 3 2 0 0 6 2 0 0 9 2 0 1 2 2 0 1 6
1.Riga region 2.Pieriga region 3.Vidzeme region
4.Kurzeme region 5.Zemgale region 6.Latgale region
E. Jermolajeva
201
from the lowest level of 202 EUR in Riebini County (Latgale region) to the highest – 1207 EUR in
Garkalne County, which is located near Riga - the capital city of Latvia.
In 2019, the difference is no longer so significant – the lowest level is 380 EUR in Aglona County (Latgale region) and the highest is 584 EUR in the same - Garkalne municipality. So municipalities
have very different levels of resources to invest in developing and providing services to citizens –
most municipalities lack the means to ensure quality services and their development - this applies to both development centres and other areas. Significant differences in service provision make some
municipalities much less attractive for housing choices than others.
The aim of the study is to analyse Preili County as one of the local rural municipalities of Latgale region placed in the Eastern part of Latvia and to identify the factors contributing to the development
of territory.
2. Data and Methodology
Research on regional development issues is increasingly appearing in contemporary economic
literature and scientists try to find different ways and instruments as tools for the territorial development. Renewing the successful European economic growth model depends on its ability to
reduce the increasing productivity gap between ‘frontier regions’ and other parts of the EU (Bachtler
et.al., 2017). There are huge differences in technological potential between countries and between regions in Europe (Balland et.al., 2019). Structural changes in innovation patterns have longer term
consequences on economic dynamics – it is necessary to progress and to renew regional economic and
innovative structures, as advocated by the smart specialization strategy (Capello, Lenzi, 2019).
Reasons and impact of Smart Specialization Strategy is analysed in coherences of regional innovative capabilities (D’Adda et.al., 2019). These and other scientific studies can be the basis for development
decisions.
During the Latvian National Research Programme 5.2. ‘Economic Transformation, smart growth, governance and legal framework for the state and society for sustainable development - a new
approach to the creation of a sustainable learning community/ EKOSOC-LV’ (2014-2018) it was
concluded that sustainability is based on smart specialization using the potential of the territory. One
of today’s regional development paradigms - the most important driver of the development is the human being. Using data on economically active statistical units of counties, all municipalities of
Latvia were divided into groups. The main conclusion was – a smart and sustainable territory
development takes place in the areas with: 1) an innovative and knowledge-based economy; 2) educated, active, creative population; 3) sustainable use of natural resources; 4) high-quality local
management, which actively involves inhabitants; 5) developed IT infrastructure and skills (Šipilova
et.al., 2017; Jermolajeva et.al., 2018). A quantitative assessment was based on scientific and practical experience, taking into account the
spatial and socio-economic specifics of development of the regions and rural municipalities of Latvia
that demonstrated development levels and growth rates of the municipalities in combination with
regional socio-economic disparities. A smart development index (SDI) was created, included four dimensions: Resources, Population, Economy, Governance (Administration or Management).
SDI shows the special features of smart development of rural municipalities. Resources: effective
use (tended agricultural lands, Rural Support Service expenditures); available resources (forestland, the amount of mineral resources); infrastructure (road network density). Population: knowledgeable
(higher education, primary sector employees); skillful (the long-term unemployed); active (the number
of NGOs). Economy: innovative (the proportion of enterprises in the total number of companies, turnover, the number of employees); active (the number of the self-employed). Governance:
competent (the amount of funding attracted); inclusive (electoral activity); modern (e-index changes
and next generation network).
SDI divided 19 municipalities of Latgale region into two similar groups: 10 municipalities had positive index values and 9 municipalities – negative index values. In 2014, 62.31% of the population
lived in the group of municipalities with positive index values.
Latgale region is the least developed region in Latvia. The EKOSOC-LV research results identified a resident-focused scenario as the most important factor for sustainable development, the attraction
and retention of residents and the use of their potential in municipalities and in the entire region.
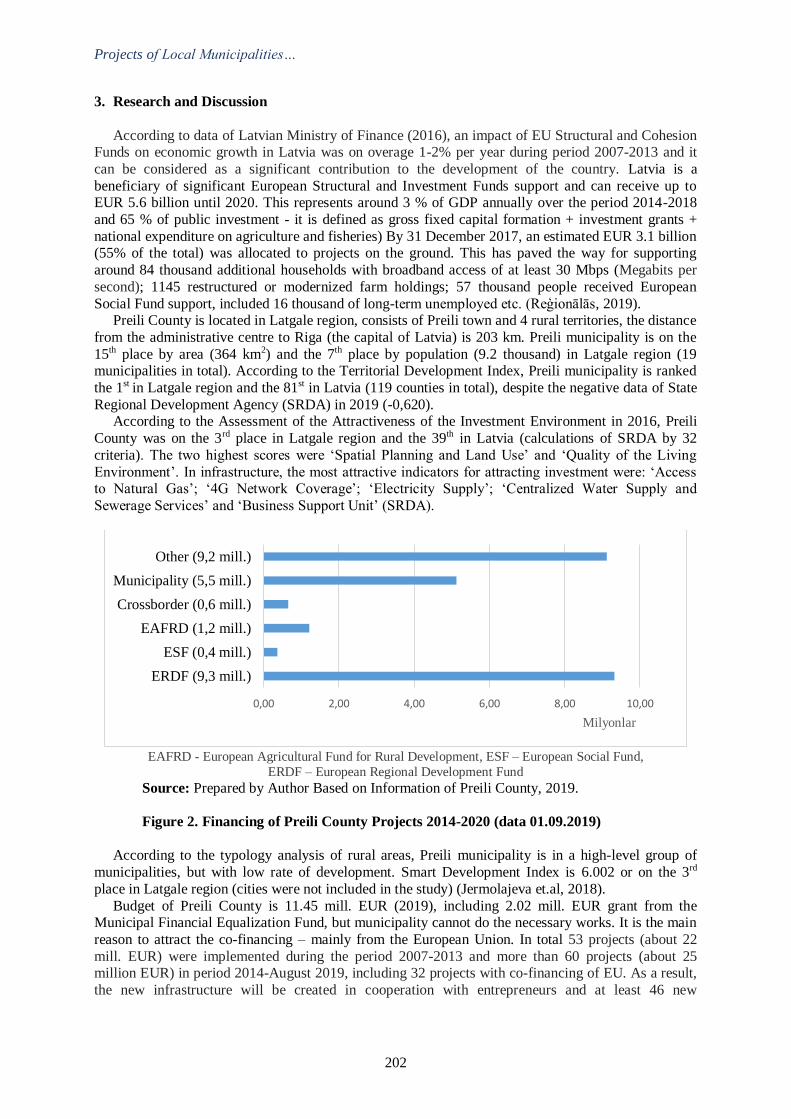
Projects of Local Municipalities…
202
3. Research and Discussion
According to data of Latvian Ministry of Finance (2016), an impact of EU Structural and Cohesion Funds on economic growth in Latvia was on overage 1-2% per year during period 2007-2013 and it
can be considered as a significant contribution to the development of the country. Latvia is a
beneficiary of significant European Structural and Investment Funds support and can receive up to EUR 5.6 billion until 2020. This represents around 3 % of GDP annually over the period 2014-2018
and 65 % of public investment - it is defined as gross fixed capital formation + investment grants +
national expenditure on agriculture and fisheries) By 31 December 2017, an estimated EUR 3.1 billion (55% of the total) was allocated to projects on the ground. This has paved the way for supporting
around 84 thousand additional households with broadband access of at least 30 Mbps (Megabits per
second); 1145 restructured or modernized farm holdings; 57 thousand people received European
Social Fund support, included 16 thousand of long-term unemployed etc. (Reģionālās, 2019). Preili County is located in Latgale region, consists of Preili town and 4 rural territories, the distance
from the administrative centre to Riga (the capital of Latvia) is 203 km. Preili municipality is on the
15th place by area (364 km2) and the 7th place by population (9.2 thousand) in Latgale region (19 municipalities in total). According to the Territorial Development Index, Preili municipality is ranked
the 1st in Latgale region and the 81st in Latvia (119 counties in total), despite the negative data of State
Regional Development Agency (SRDA) in 2019 (-0,620). According to the Assessment of the Attractiveness of the Investment Environment in 2016, Preili
County was on the 3rd place in Latgale region and the 39th in Latvia (calculations of SRDA by 32
criteria). The two highest scores were ‘Spatial Planning and Land Use’ and ‘Quality of the Living
Environment’. In infrastructure, the most attractive indicators for attracting investment were: ‘Access to Natural Gas’; ‘4G Network Coverage’; ‘Electricity Supply’; ‘Centralized Water Supply and
Sewerage Services’ and ‘Business Support Unit’ (SRDA).
EAFRD - European Agricultural Fund for Rural Development, ESF – European Social Fund,
ERDF – European Regional Development Fund
Source: Prepared by Author Based on Information of Preili County, 2019.
Figure 2. Financing of Preili County Projects 2014-2020 (data 01.09.2019)
According to the typology analysis of rural areas, Preili municipality is in a high-level group of
municipalities, but with low rate of development. Smart Development Index is 6.002 or on the 3rd
place in Latgale region (cities were not included in the study) (Jermolajeva et.al, 2018).
Budget of Preili County is 11.45 mill. EUR (2019), including 2.02 mill. EUR grant from the Municipal Financial Equalization Fund, but municipality cannot do the necessary works. It is the main
reason to attract the co-financing – mainly from the European Union. In total 53 projects (about 22
mill. EUR) were implemented during the period 2007-2013 and more than 60 projects (about 25 million EUR) in period 2014-August 2019, including 32 projects with co-financing of EU. As a result,
the new infrastructure will be created in cooperation with entrepreneurs and at least 46 new
0,00 2,00 4,00 6,00 8,00 10,00
ERDF (9,3 mill.)
ESF (0,4 mill.)
EAFRD (1,2 mill.)
Crossborder (0,6 mill.)
Municipality (5,5 mill.)
Other (9,2 mill.)
Milyonlar
E. Jermolajeva
203
workplaces will be created in 2020-2021, schools will be modernized, the streets and roads will be
renovated etc. (Unpublished, 2019).
The data in Figure 2 shows the financing of projects in Preili municipality for the period 2014-2020 (situation as at 01.09.2019). The main projects are: (1) Development of business environment
infrastructure in Preili County - construction of new street and construction of industrial territory (5.54
mill. EUR); (2) Development of the business environment infrastructure of the Preili County and surrounding areas - street rebuilding and rotation circle construction (1.58 mill. EUR); (3) Improving
the business environment and stimulating investment in Preili County - construction of storage,
industrial building, square and utilities (3.47 mill. EUR); (4) Reconstruction of municipal roads in rural territories (1.71 mill. EUR); (5) Improving the energy efficiency of two municipal buildings
(2 mill. EUR); (6) Improving and modernizing the learning environment in two schools of general
education (2.42 mill. EUR); (7) Reconstruction of Preili Castle (0.6 mill. EUR; (9) Measures to
promote local community health and prevent disease in Preili County (0.12 mill. EUR). Preili municipality is also an active participant of several cross-border cooperation projects, for example,
‘Creation of network of family Digital Activity Hubs for wellbeing and education support in Eastern
Aukštaitja and Southern Latgale’ and ‘Conservation of biodiversity in open wetland habitats of the LV-LT cross-border region applying urgent and long-term management measures’ (Interreg V-A
Latvia-Lithuania).
The attracted finances are used both - in Preili town as a county centre (urban territory) and in rural areas, it shows also the high level of knowledge, interest, activity and capacity of municipal
specialists. The result of the projects implemented in Preili municipality could be the fact that 24
children started attending educational institutions in September, 2019 - the increase in the number of
children is the first time in recent years. As the birth rate is very low, the increase has actually occurred at the expense of families moving from other areas to live in Preili or attending schools in
this territory.
The SWOT analysis of the Development Programme of Preili County 2018-2024, shows that in overall there are more strengths and opportunities than weaknesses and threats. The Municipality has a
good chance of attracting investment and setting up new production units that will create jobs and
people will have good possibilities for education, social security and general well-being.
4. Conclusion
Overcoming regional disparities as a key issue for regional development requires active, knowledgeable and creative people capable of finding and effectively using financial resources. This
is in line with today’s regional development paradigm - the most important driver of the development
is the human being. Latgale region is the least developed region in Latvia, but a resident-focused scenario is the most important for sustainable development, the attraction and retention of residents
and the use of their potential in municipalities and in the entire region.
The effective urban-rural interaction will be crucial for the development of rural areas and a
prudent use of public investment, with careful consideration of the long-term prospects for each territory’s development.
There is a need for a broader territorial approach to the allocation of EU funds in investment
planning and delivery to local governments - to base investments on identified needs in the region, allowing for complex, cross-sectoral and time-coordinated investments, with a more accurate
assessment of the ability of specific territories (professionals) to implement projects.
References
Bachtler, J, Martins, J. O, Wostner, P., Zuber, P. (2017). Towards Cohesion Policy 4.0: Structural
Transformation and Inclusive Growth RSA Europe. Brussels: 86. Balland, P-A., Boshma, R., Crespo, J., Rigby, D.L. (2019) Smart specialization policy in the European
Union: relatedness, knowledge complexity and regional diversification. Regional Studies, Vol. 53,
Nr. 9, September 2019: 1252-1268. Capello, R., Lenzi, C. (2019) Regional innovation evolution and economic performance. Regional
Studies, Vol. 53, Nr. 9, September 2019: 1240-1251.
Projects of Local Municipalities…
204
Centrālās statistikas pārvaldes datu bāze (Central Statistical Database of Latvia). Retrieved from
https://data.csb.gov.lv/pxweb/lv/
Commission Staff Working Dokument. Country Report Latvia 2018. Assessment of progress on structural reforms, prevention and correction of macroeconomic imbalances, and results of in-
depth reviews under Regulation (EU) No 1176/2011{COM(2018)120 final}, Brussels, 18.4.2018
SWD(2018)212 final/2: 65 D’Adda, D., Guzzini, E., Iacobucci, D., Palloni, R. (2019) Is Smart Specialization Strategy coherent
with regional innovative capabilities? Regional Studies, Vol. 53, Nr. 7, July 2019: 1004-1016.
Preiļu novada Attīstības programma 2018.-2024. gadam (Development Program of Preili County, 2018-2024, Latvian) Retrieved from https://preili.lv/attistiba/pasvaldibas-attistibas-
dokumenti/attistibas-programma/
Reģionālās politikas pamatnostādnes 2013.-2019. gadam (Regional Policy Guidelines for 2013-2019,
Latvian), 2013: 94. Reģionālās politikas pamatnostādnes 2021.-2027. gadam, 1.pielikums (Regional Policy Guidelines for
2021-2027, Latvian), 2019: 19.
State Regional Development Agency Republic (SRDA) of Latvia. Retrieved from http://www.vraa.gov.lv/en/
Šipilova, V., Ostrovska I., Aleksejeva, L., Jermolajeva, E., Oļehnovičs, D. (2017). A Review of the
Literature on Smart Development: Lessons for Small Municipalities. International Journal of Economics and Financial Issues, 2017, 7(1): 460-469.
Jermolajeva, E., Aleksejeva, L., Ostrovska, I., Šipilova V. (2018) Economic transformation processes
and results in regions of Latvia. Latgale region. In Monograph ‘Knowledge economy for the
viability of rural and rural areas of Latvia (Latvian) B.Rivža (chief ed.): 72-126. Kröhnert, S., Kuhn, E., Karsch, M., Klingholz, R., Bennert, W. (2011). The Future of Germany’s
Villages: Between stability and demographic decline. Retrieved from https://www.berlin-
institut.org/en/publications/studies-in-english/the-future-of-germanys-villages.html
3rdInternational Conference on Economic Research
24-25th October 2019, Alanya, Turkey
205
DETERMINANTS OF THE PROFITABILITY AND POSTHARVEST LOSSES
ENCOUNTERED BY FRESH TOMATO TRADERS IN LAGOS STATE
Crystal Nwabuogo Aghadi
University of Nairobi, Department of Agricultural and Applied Economics, Kenya
Email:[email protected]
John Irungu Mburu
University of Nairobi, Department of Agricultural and Applied Economics, Kenya
Mmatlou Kalaba
University of Pretoria, Department of Agricultural Economics and Rural Development, South Africa
Abstract
Nigeria is the largest producer of fresh tomato in Sub-Saharan African but also the second largest
importer of tomato-based products due to the demand gap and low supply of fresh tomato which
mostly due to the high postharvest losses encountered in the tomato market. Therefore, the study looks
at the profitability and the postharvest losses encountered by the fresh tomato traders in Lagos State,
Nigeria. Specifically, the work analyzes the socio-economic characteristics of the traders, the average
level of losses encountered by the traders, their profitability as well as factors affecting both the
profitability and level of tomato losses. Also, the challenges encountered by the fresh tomato
traderswere highlighted in the study. A multi-stage sampling technique was employed. In the first
stage, Lagos State was purposively selected due to its possession of the largest fresh tomato markets
and 245 traders were randomly selected in the second stage. This included 82 wholesalers and 163
retailersfrom fourteen major markets in the state. Gross margin, regression analysis and descriptive
statistics were employed based on the objectives to make useful inferences. The findings revealed that
72% of the respondents were between 30-49years old and only 9%had access to access to credit
services. Also, the overall monthly income of 66.5% of the traders were below N40,000 and only 44%
had access to the media. Tomato marketing was observed to be a profitable venture with an overage
profit percentage of 105% of the total cost gained per month. However, the tomato losses faced was
averagely 22% for those who made use of woven baskets in packaging their produce and 9% for those
who made use of Returnable Plastic Crates (RPCs). Also, the sex, years of schooling, years of tomato
learning, number of income sources and packaging container used significantly affected the level of
profitability in tomato marketing.Furthermore, the number of associations belonged to, the efficiency
of current container in reducing losses, the distance to source of tomatoes, household size and the use
of plastic crates significantly affected the level of tomato losses faced by the trader. The major
challenges encountered by the tomato traders includes low capital, high competition, inability to
access adequate market, high tomato losses and poor knowledge and training on the tomato business.
In conclusion, the tomato trade in Nigeria is highly profitable but constrained by the level of losses as
well as other challenges highlighted in the study. Therefore, the study recommends that private and
public institutions should help in providing accessible credit services to the traders and reducing
tomato losses through the provision of adequate packaging containers. Also, an inclusion of a multi-
stake holder approach that brings together major stakeholder including the leaders of the market
associations to develop policies that would help the tomato traders as a whole.
Keywords: Fresh Tomato Traders, Profitability, Tomato Losses.
3rdInternational Conference on Economic Research
24-25th October 2019, Alanya, Turkey
206
ANALYSIS OF SMALLHOLDER BEEF FARMERS’ PARTICIPATION IN FORMAL
MARKETS IN NGAKA MODIRI MOLEMA DISTRICT, NORTH WEST PROVINCE,
SOUTH AFRICA
Bongani Lawrence Kwebulane
North West University, Department of Agricultural Economics, South Africa
Thato Narjorie Moagi
North West University, Department of Agricultural Economics, South Africa
Email: [email protected]
Abstract
Agriculture plays a crucial role in developing countries as it is a major source of income in rural
households. Small scale farmers are often located in rural areas and they can be defined in diverse
ways depending on perspective, nation and ecological zone and this explains interchangeable use of
the term smallholder with small-scale, resource poor and peasantf armers. Smallholder farmers have
cattle numbers that are significant and if they manage them well, they can contribute to the nutrition
and food security at a household level and, add to the national economies. However a number of
authors expressed the concern over the limited contribution of livestock that the smallholder farmers
own, especially cattle towards their household and economies of the nation. These farmers often
struggle to improve their standards of living because they lack access to formal markets and therefore
end up selling their cattle to the buyer at whatever price dictates. Access to markets is an imperative
requirement for small scale farmers thus having access to inputs is not of much benefit if they are
unable to access profitable markets. In order to increase market participation by small-scale farmers,
it is essential to identify variables that influence market access. This paper aims to identify factors that
influence smallholder beef farmers’ participation toformal markets in Ngaka Modiri Molema District,
North West Province, South Africa. The smallholder beef producers in the study area do not make use
of output markets efficiently due to a number of factors thus marketing constraints that limit their
involvement in formal markets are identified in this paper. Simple random sampling was used to select
109 smallholder beef farmers in the District. A structured questionnaire was used to collect data from
respondents. Data was analyzed with SPSS version 25 using frequency count percentages, mean and
standard deviations. A logistic regression model was used to investigate constraints that influence
smallholder farmers’ participation to formal markets.
Empirical results show that farmers’ participation in formal markets is significantly influenced by
age of farmers, contact with extension agents, access to market information, infrastructure, contact
with extension agents, formal contractual agreements and training. This paper recommends that
Government should (in collaboration with relevant stakeholders) design, implement and, improve
existing initiatives to fosteren try into formal markets by smallholder beef farmers.
Keywords: Smallholder, Beef Farmers, Formal Markets, Participation, Market Access.
3rd International Conference on Economic Research
24-25th October 2019, Alanya, Turkey
207
IMPACT OF AGRIBUSINESS TRAINING PROGRAMMES ON YOUTH
EMPOWERMENT IN NIGERIA: THE CASE OF FADAMA GUYS PROGRAMME
Dolapo Folasade Adeyanju
University of Nairobi, Department of Agricultural Economics, Kenya
Email: [email protected]
John Mburu
University of Nairobi, Department of Agricultural Economics, Kenya
Djana Mignouna
International Institute of Tropical Agriculture, Nigeria
Abstract
Among the potential strategies to reduce the high dependency of young people on white-collar jobs
as well as create employment opportunities in the non-formal sector, agripreneurship is increasingly
been recognised as a valuable meansof creating sustainable employment and improving the livelihood
of young people. Based on this, stakeholders have come to support agripreneurship in recent times by
organizing agribusiness training programmes which specifically targets young people. Despite the
numerous existing agricultural interventions, there is a dearth of empirical evidence on what worked
well or what did not. It is for this reason that this study investigated the impact of agribusiness training
programmes on youth empowerment in Nigeria taking the case of Fadama Graduate Unemployed
Youths and women Support (GUYS) programme conducted in 2017.Empowerment was measured
with 15 indicators extracted from the scanty literature found on youth empowerment(see International
Labour Office, 2018 and; Muiruri, 2015). The indicators were subjected to Principal Component
Analysis (PCA) in order to extract the essential components required to construct a non-standardized
index which became the outcome variable. A total of 977 respondents comprising of 455 participants
and 522 non-participants were sampled across three states in Nigeria. Data were analysed using the
Propensity score matching (PSM) procedure. Model results show that age, years of formal education,
ownership of agribusiness venture, intention, youth perception about agribusiness training were factors
which positively and significantly influenced youth participation in the programme while gender,
household size had a negative and significant influence on participation.For the purpose of
comparison, this study adopted the nearest neighbour (NN), kernel-based (KB) and caliper matching
estimators in matching the treated and the control units. However, the best matching algorithm based
on our analysis was the NN estimator which has the lowest pseudo r-squared of 0.005 after matching,
mean standardized bias of 4.1 percent and large number of matched sample with only 4 percent lost to
common support restriction, indicatingenough overlap for the matching exercise.
After controlling for all confounding factors, the impact estimate showed that participation in the
programme led to about 11.28 per cent increase in the youth empowerment index score which implies
a positive change in the economic status and livelihoods of the youths who participated in the
programme. Also, the result of the sensitivity analysis on hidden bias showed that the critical level of
gamma (γ) was between 2.90 and 2.95 which implies that for the impact estimates to be nullified, the
unobservable variable would have to increase the odds ratio of participation by up to 195 per cent.
This led to the conclusion that even large amounts of unobserved heterogeneity would not alter the
inference about the impact estimate. On this note, the study recommends that programmes such as the
case study should be encouraged and invested in as it can inspire youths to engage in agribusiness
thereby, reducing the rate of youth unemployment as well as contributing to empowerment.
Keywords: Agribusiness, Youth Empowerment, Youth Unemployment, Agribusiness Training.
3rdInternational Conference on Economic Research
24-25th October 2019, Alanya, Turkey
208
THE IMPACT OF R&D INCENTIVES ON R&D OUTPUT: A PANEL COUNT DATA
ANALYSIS
Ipek Akad Bitlis Eren University, Department of Economics, Turkey, Email:[email protected]
Cagacan Deger Ege University, Department of Economics, Turkey
Abstract
This study aims to explain the effects of R&D incentives on patents, assuming an innovation
output. Five high-tech, five low-tech sector data were included in this study according to the NABS
2007 sector classification. Since the data used in this study is classified in different structures (eg Nace
Rev.2 for R&D expenditures data and IPC V.8 forpatents data), a conversion table has been created by
authors for Nace Rev.2 and IPC V.8 codes corresponding to the NABS 2007 classification. According
to the conversion table of the sectors wecreated, we applied the Panel Count Data model as the
econometric method for 11 European countries in which we can access their data. As a result of the
analysis for 11 European countries, we conclude that public R&D incentives have different effects on
high-tech and low-tech sectors. For example, in the space research sector, which is one of the high-
tech sectors, public R&D incentives at the current level has a positive effect on patents; other three
high-tech sectors (transport and communication, energy, industry and technology) are negatively
affected by public R&D incentives. But what are the consequences if public R&D incentives, which
have a negative impact on patents, are increased? To answer this question, we constructed the
econometric equation as a polynominal equation. The results showed us that these 3 high-tech sectors,
which are negatively affected by the current public R&D incentives, will be positively affected by
these incentive sifthese incentives are increased. In addition, another finding is that in low-tech
sectors, the effect on patents is mostly come from R&D expenditures.
Keywords: Government Policy, R&D Incentives, Innovation, Patent, Panel Data Analysis.
3rd International Conference on Economic Research
24-25th October 2019, Alanya, Turkey
209
ECONOMIC OUTLOOK OF UNMANNED AERIAL VEHICLES IN TURKEY AND
THE WORLD: “DRONE ECONOMIES”
Rustem Baris Yesilay
Ege University, Aviation Higher Vocational School, Turkey Email: [email protected]
Armagan Macit
Ege University, Aviation Higher Vocational School, Turkey
Abstract
In the early 2000s the potential benefits of unmanned aerial vehicles, which were first tested at the
beginning of the 1900s but whose effectiveness was not understood, were discovered and major
technological advances were made in this field in the world. After the 1980s, the production of UAVs with different characteristics such as imaging, transportation and disinfection by various countries has
achieved a great growth in the UAV sector. With the widespread use in different sectors, Drone
production has achieved a significant growth momentum. Market research shows that the UAV sector will grow by 15-20% every year in the next decade. This growth will have a significant and positive
impact on the national economies. The UAV sector, evaluating separately from the aviation sector, has
created its own economy and it affects the national economy positively. The research starts with
explaining the development of the UAV sector, indicators of UAV economy in the world and Turkey were investigated. After, the development of UAVs and the status of the UAV sector in United States,
European Union, Britain, China, Japan, Russia, India and Turkey is discussed separately. The main
aim of this research is to contribute to the literature in Turkey about the economic outlook of unmanned aerial vehicles called as “Drone economy” in the international literature. It has been found
out that diversification of usage areas of UAVs and adoption of technological development by
commercial enterprises contribute to the formation of “Drone economy”. The cost-effective purchase and use of UAVs has triggered large companies such as Tesla and Google to invest in this area. At the
same time, many small and large enterprises are registered with national aviation organizations to
obtain business authorization in this field. The activities in the UAV sector can contribute to the GDP
of all countries, because Drones create and continue to create new employment areas. In many countries research and development activities are directed to the UAV sector and thus Drones will
contribute to the development of robot systems. The use of UAVs will lead to systematic changes in
different sectors and armament of UAVs has great international importance in military terms. Keywords: Drone Economies, Unmanned Aerial Vehicles.
1. Introduction
Small aircraft, in terms of size and weight, which has no people in it for control or travel purposes
andcan fly via remote control or a pre-loaded flight program, is called unmanned aircraft. International
Civil Aviation Organization classifies unmanned aerial vehicles into two categories as military and civilian.According to this classification; UAVs used as armed for reconnaissance and assault purposes
are military; UAVs used for scientific, imaging or hobby purposes are considered civil(ICAO,
2011).In international literature, the name “Drone”, which is given to remotely controlled aircrafts used in the military, has been named as UAV “Unmanned Aerial Vehicle” with the increasing use of
civil unmanned aircrafts(Kahveci& Can, 2017:512).In the aviation sector, the increase in the
production and sales enterprises in the UAV area and the investments made by large companies led to
the formation of the UAVs and the economic activities in this sector to be called “Drone Economy”. In this study; the development of UAV sector is explained, and indicators of “Drone Economy” in
the world and Turkey were investigated. The current status of UAVs market in the world,by terms of
the production and use of UAVs,in leading countries such as United States, European Union, Britain, China, Japan, Russia, India, Malaysia and Turkey has been investigated separately. However, due to
Economic Outlook of Unmanned Aerial Vehicles...
210
the fact that the shared reports and sources about countries cover different years and different data, a
standard order could not be followed in the data used in the study.
2. Development of Unmanned Aerial Vehicles
The importance of UAVs, whose inventions are considered to be in the middle of the 19th century,played an active role by advancing in World War II, and by their contribution to issues such as
reducing pilot losses, exploration and intelligence during the Cold Warwas recognized widely.In
addition to understanding its military importance, UAVs, which are also used in hobby flights and civil aviation activities, have also been used by NASA in space studies.As UAVs develop, usage areas
have diversified and diversified usage areas have increased the use of UAVs, leading to significant
developments in the UAV sector (Torun A.,2017:2).
Advancing technology has made it easier to control UAVs and modern design of UAVs enabled them to be used by everyone as easily accessible aircraft in daily life.Due to the technological
advancement, the use of smart phones and tablets instead of the control units in UAVs and the fact that
flight operations can be provided with GPS and Wi-Fi receivers have reduced the UAV production costs considerably(Colomina et.al, 2014).Thus, the production of low-cost, functionally available
UAVs has increased, and its use has become widespread.
3. UAV Sectoral Outlook
Nowadays, the majority of the investments usually made for UAVs are for military activities.UAVs
are utilized in audit, surveillance, intelligence, chemical, biological, nuclear and radiological activities.Other areas where UAVs are used in the military field are screening, instantaneous general
target setting, general surveillance in peace time, surveillance of enemy activities in wartime, instant
weather forecasting, routing in indoor weather, direction finding, enemy tracking, radio signal transmission, aircraft runway security, damage detection studies, if necessary, can be specified as the
use of radar(Gupta etc.., 2013).
In addition to the development of UAVs in the military field, there has been a development in the
field of civil aviation also.The UAV industry has developed rapidly, especially with the US law, which can be considered as deregulation in the field of UAV, allowing for the use of UAVs in civil aviation
as well as in military areas. The use of UAV in many areas is becoming widespread; commercial use,
scientific studies, university-laboratory research, search and rescue activities, applications related to public safety, meteorology studies, film industry, environmental-nature studies, aviation photography,
mining activities, the use in agricultural fields and so on(Yiğit etc., 2018:11).
The top five sectors where UAVs are found to be the most common application areas on a global scale are; real estate and construction, photogrammetry (aerial measurement), film / aerial
photography, agriculture and aerial monitoring (tracking) activities (Torun A., 2017: 2).
3.1 Economic Outlook of the UAV Sector
It is stated that UAV sales in the rapidly growing UAV sector have not yet reached the expected
level according to some scientific studies in the literature. According to the estimates made by FAA, it is stated that UAV sales in the global market will reach 2.7 billion in 2020 and civil UAV production
will increase from 2.7 billion to 10.9 billion in 2025 (Turza, 2014: 334).In the light of these data, it is
estimated that the UAV sector will grow between 15-20% annually on average and more than 100% growth over a 10-year period.
3.2 Economic Outlook of UAV Sector in the World
Public concern about the use of UAVs is subdued as benefits from UAV use are seen.Thus, the
global UAV market continues to experience explosive growth every year.With this growth at the
moment, 47% of the world UAV market is classified as civilian UAV, 24% is used for commercial purposes and the rest is classified as UAV for consumer purposes.With the gradual decline in UAV
production costs and the inclusion of new players in the global market, including the minimum
A. Macit and R. B. Yesilay
211
segment, UAV costs are expected to fall between 7-27%.This will have a catalyst effect on market
growth (J’son& Partners, 2017).
The countries which are active in the production of UAV and Unmanned Combat Aerial Vehicle (UCAV) in the world and the European Union have been evaluated in terms of economic outlook and
expectations.USA, UK, China, Japan, Russia, India, Malaysia and Turkey are the only leader countries
in the UAV and UCAVby terms of production and investments in this area.
3.2.1 USA
In 2012, the federal government commissioned the Federal Aviation Administration (FAA) to
integrate UAVs into the National Airspace System (NAS).In the research conducted by FAA, it is
stated that 90% of UAVs used in USA are used for agriculture and public safety and these two markets
are potential markets for UAVs (Jenkins &Vasigh, 2013: 2). The economic impact associated with the integration of UAVs into NAS was more than $13.6
billion in the first three years of integration.According to forecasts, the economic impact will grow and
may be more than $82.1 billion between 2015-2025.Integration into NAS has created more than 34,000 production jobs in the first three years and is expected to create more than 70,000 new jobs.By
2025, total job creation is estimated to be 103,776.It is estimated that the US tax revenue from UAVs
will be more than $ 482 million in the first 11 years (2015-2025) of integration (Jenkins &Vasigh, 2013: 4).
3.2.2 European Union
The use of UAVs in many sectors creates significant economic benefits and this should be taken in
consideration. If the market of all countries in the European Union is taken into account, the growing
UAV market represents approximately EUR 2 billion in annual turnover.The UAV market is expected to represent approximately EUR 10 billion by the end of 2030 and EUR 15 billion by the end of 2050.
The increase in the use of UAVs has also been influenced by their use in different areas.According
to the estimates, 100,000 UAVs are expected to be used in sensitive agricultural activities, 10,000
UAVs are used in the energy sector within the scope of infrastructure works,100,000 UAVs are used for transportation of emergency medical supplies and medical services, and 50.000 UAVs are used by
public security agencies such as police and fire brigade.In addition to these, with the developing
technology, the studies for the use of UAVs in border and maritime safety, international airspace, cargo transportation and long-term passenger transportation are continuing rapidly.
With the development of the UAV sector and the use of it in different sectors, the European air
traffic is expected to increase by 50% in 20 years.In addition, it is expected that by 2035, UAVs will directly create employment for 100,000 people and will have an economic impact in excess of 10
billion euros annually by providing support to indirect employment for 100,000 people (SESAR,
2016).
3.2.3 United Kingdom
The UAV sector is expected to grow steadily in the UK by 2030.It is estimated that the use of UAV will lower costs and all sectors that use UAV will achieve significant savings.The UAV sector is
expected to contribute £ 16 billion in net cost savings to the UK economy.
It is anticipated that the resulting savings will contribute to the GDP growth for many sectors by causing a 3.2% increase in multi-factor productivity.According to these estimates, the increase in the
sectoral basis will be £ 8.6 billion in construction and manufacturing; it is expected to be £ 7.7 billion
in wholesale, retail trade and food services, £ 11.4 billion in the public sector (including defense,
health and education), and £ 4.8 billion in the media and telecommunications sectors.In general, the UAV sector is expected to generate £ 42 billion in GDP by 2030.
The increase in the use of UAVs in daily and commercial life may initially make some workforce
tasks unnecessary, but over time, the cost savings, efficiency and gains in consumer demand will generate new jobs.This shows that UAVs will have a transformational effect on the way we work and
Economic Outlook of Unmanned Aerial Vehicles...
212
live.It is expected that in 2030 a total of 76,000 UAVs, 27,500 of them is expected publicly owned,are
expected to operate in the UK's airspace, will generate 628,000 employees (Pwc UK, 2018).
3.2.4 China
In 2017, the UAV sector in China generated $ 2.7 billion in revenue, demonstrating that it is an important country in this sector.The UAV sector is driven by a single company in China.Da Jiang
Innovations has more than 70% of the global market share, and in the meantime is also the largest
UAV producing company in the world.Apart from DJI, there are 1200 enterprises operating in the UAV sector in China (FAI, 2018).The low-cost hardware and software design, production and
logistics chain are key elements, which comes to mind while considering the Chinese economy, make
a major contribution in order to make China leader in the UAV industry.
One of the main reasons for the growth in the UAV sector in China is the widespread use of UAVs for hobby purposes as well as the creation of logistics and supply chains.In 2017, 3 million hobby
UAVs were launched with a 67% growth jump (FAI, 2017).
By 2025, the total UAV market in China is expected to reach 75 billion yuan.This market is also expected to be divided into 30 billion yuan for consumer commercial activities, 20 billion yuan for
agricultural and forestry activities, 15 billion yuan for security.In the 10-year period, a 300% increase
is expected in UAV sales (SCMP, 2017).
3.2.5 Japan
In Japan, the size of the UAV market is estimated to increase from 3 billion yen to 100 billion yen in 2030.In Japan, UAV software and services production are mainly targeted instead of hardware.5%
of the estimated revenue is expected from the hardware and the rest is expected to turn up from
software and services. Although there are 20 major UAV manufacturers in Japan, there are only a few businesses that can
operate commercially.Japan's commercial UAV market is estimated to reach 18.6 billion yen by
2020.With the occurrence of expected growth, the market is estimated to be 44 billion yen in 2025 and
100 billion yen in 2030 (EU Japan, 2016).
3.2.6 Russia
At the end of 2018, Russia's share of the UAV sector in the world market was 2%. But, in military
terms, this share increases to 15%.The Russian UAV sector is characterized by military UAV
manufacturers dominating the market.With its technological infrastructure and investments in Russia, the UAV sector, which is very suitable for development, is being blocked due to legal restrictions.
In 2018, the Russian UAV market was realized as 163 million dollars, and it is expected that the
market will grow 1.5 times by 2020 (J‘son& Partners, 2018).
3.2.7 India
The growth of the UAV sector in India has achieved a similar acceleration with other countries and global scale.The Indian UAV market is projected to have a combined growth rate of 18% in terms of
revenues in the period between 2017-2023.Although India has focused on the long-range segment in
UAV production, it has been trying to grow in the field by producing medium-range and small UAVs in recent years.
India holds 22.5% of the world's UAV imports and ranks highest among the importing
countries.Although India's current priority in UAV production is armed military UAVs, it is estimated
that by 2021, the civilian market will reach an equal level with the military market and reach a total volume of 900 million dollars (Pwc India, 2017).
A. Macit and R. B. Yesilay
213
3.2.8 Malaysia
In 2018, Malaysia's UAV industry grew by 30% with $ 500 million in 2018 due to positive acceptance of consumers' use of UAVs and increasing market interest.The compound annual growth
rate is expected to be over 50% in 10 years by 2028.
The use of UAVs in agriculture increased by 2000% between 2015-2018 and has played an active role in recognizing the potential for several billion dollars of estimated sectoral capacity in Malaysia
(Theedgemarkets, 2017).
3.2.9 Economic Outlook of UAV Sector in Turkey
Considering the UAV market worldwide, the occurrence of sectoral growth with the increase in
usage areas of UAVs also applies to Turkey. The use of UAVs in Turkey especially in mining, mapping, construction, energy, agriculture and real estate sectors has become widespread.In Turkey,
by the year 2018 the UAV market size has reached $ 30 million.With the technological acceptance, it
is known that the number of devices registered to the DGCA is 25 thousand.The use of UAVs in Turkey has come to the fore in terms of both hobbies use and for commercial purposes.As UAVs are
finding more space in corporate and industrial applications, the corporate market size is expected to
grow by 2-3 times in 2019. While the developing sector creates structural changes in many commercial purposes, it leads to the
emergence of new professions such as UAV piloting and UAV technology software.While UAV pilots
become particularly popular in job advertisements, it is known that there are 33,000 UAV pilots
licensed out of 50,000individuals registered to DGCA.According to the 10-year forecasts, this number is expected to be increased and higher employment will be provided by the sector (DGCA, 2018).
4. Conclusion and Evaluation
The discovery of the functional benefits of UAVs paved the way for its use in many areas. The
functions of such UAVs such as transportation, imaging, measurement and analysis can help many
sectors.Especially with the low cost of UAV production and usage of it creates significant cost savings in the sectors it is operated, UAVhaswidely become an integral part of commercial life.With the large-
scale use of UAV, positive economic consequences and effects have emerged.Thus, UAVs formed a
sector economy.Economic impacts of UAVs have been investigated in many areas such as costs, commercial uses and sectoral returns.
The UAV sector, which had an economic impact in the 2000s, continues to increase its growth
momentum so far.The expected growth rate in the global UAV market according to 2015-2025 expectations is more than 100%.Although it varies from country to country, its growth rate is not
expected to fall below 10% and is expected to be in the range of 15-25%on an annual basis.The results
that can be drawn with this research are as follows;
• Activities in the UAV sector can contribute to the GDP of countries,
• The UAV sector has created and will continue to create new employment areas in countries,
• Many countries have increased their investments in the UAV sector,
• Usage areas of UAVs become widespread,
• UAVs create cost savings in different sectors,
• Unlike aircraft production, China is the leading country in UAV production,
• Activities of Turkey's domestic UAV production is continuous.
In the literature studies conducted in our country, it is seen that there are studies on the technical features and legal processes of UAVs. This study will be able to give an idea about the future UAV
economy studies.
Economic Outlook of Unmanned Aerial Vehicles...
214
References
Colomina, I., P. Molina (2014), Unmanned Aerial System for Photogrammetry and Remote Sensing, Isprs Journal of Photogrammetry and Remote Sensing, June 2014
Darryl Jenkins, Dr. BijanVasigh (2013), The Economic Impact of Unmanned Aircraft Systems
Integrationin The United States, AUVSI EU Japan (2016), E.T.:08/08/2019
https://www.eubusinessinjapan.eu/sites/default/files/Dron_market_in_japan.pdf
FAI.(2017), E.T.:01/08/2019 https://www.fai.org/news/shenzhen-heart-Dron-economy FAI.(2018), E.T.:01/08/2019 https://www.fai.org/news/shenzhen-heart-Dron-economy
Gupta S.G., Ghonge M.M., Jawandhiya Dr. P. M., (2013), “Review of Unmanned Aircraft System
(Uas)”, International Journal of Advanced Research in Computer Engineering & Technology
(Ijarcet) Volume 2, Issue 4 J’son& Partners (2017), E.T.:15/07/2019 http://json.tv/en/ict_telecom_analytics_view/the-market-of-
unmanned-aerial-vehicles-uav-Drons-in-russia-and-in-the-world-2017
J’son& Partners (2018), E.T.:17/08/2019 http://json.tv/en/ict_telecom_analytics_view/the-market-of-unmanned-aerial-vehicles-uav-Drons-in-russia-and-in-the-world-2017
Pwc Indıa (2017), E.T.:20/08/2019 https://www.pwc.in/consulting/financial services/fintech/fintech-
insights/data-on-wings-a-close-look-at-Drons-in-india.html Pwc UK. (2018), E.T.:16/07/2019 https://www.pwc.co.uk/intelligent-digital/Drons/Drons-impact-on-
the-UK-economy FINAL.pdf
SCMP.(2017), E.T.:01/08/2019 https://www.scmp.com/tech/china-tech/article/2093475/chinas-
consumer-Dron-makers-shift-focus-commercial-sector-growth SESAR. (2016), European Drons Outlook Study Unlocking the value for Europe
SHGM (2018), SivilHavacılıkGenelMüdürlüğü 2018 YılıFaaliyetRaporu
The Edge Markets (2017), E.T.:24/08/2019 https://www.theedgemarkets.com/article/aerodyne-sees-30-growth-local-Dron-industry
Torun, A. İnsansızHavaAracı (İHA) Sektörü ve İHA Fotogrametrisinin Ölçme Bağlamında
Konumlandırılması The Sector of Unmanned Aerial Systems and Positioning UAS
Photogrammetry Regarding Surveying Discipline.2017 Turza, N. (2014). Dr. Dronlove: How We Should All Learn Stop Worrying and Love Commercial
Drons, North Carolina Journal of Law & Technology, 15, S.319- 361
Yiğit E., Yazar I., Karakoç H. T., (2018), İnsansız Hava Araçları (İHA)’nın Kapsamlı Sınıflandırması ve Gelecek Perspektifi, SÜHAD, s.10-19.
3rd International Conference on Economic Research
24-25th October 2019, Alanya, Turkey
215
INDUSTRY 4.0 AND TURKEY AWARENESS
Eren Kamber
Alanya Alaaddin Keykubat University, Department of Management Engineering, Turkey
Email: eren.kamber @alanya.edu.tr
Gülin İdil Sönmeztürk Bolatan
Alanya Alaaddin Keykubat University, Department of Management Engineering, Turkey
Email: gulin.bolatan @alanya.edu.tr
Abstract
After the three major industrial revolutions that radically changed understanding of production today, digitalization in production has begun with the fourth industrial revolution, with the great
change effect of technology on production systems. Fourth industrial revolution or Industry 4.0
referring to literature, is aimed to integrate products, machines and production systems. This
integration will be provided with the use of the Internet and new information technologies in production, and also with the implementation of Cyber Physical Systems (CPS), Internet of Things
(IoT), Smart Factories and other Industry 4.0 components. For Industry 4.0, where developed
countries started, it appears that goverment and industry collaborators have quickly prepared road maps and are beginning to apply some of the leading companies in their sector. If it is considered that
strategic issues such as technological infrastructure, human resource policies, production digitization,
technology levels of production systems, it can be said that implementing Industry 4.0 in our industry
may be difficult by this time. However, the problems need to be resolved quickly and the manufacturing industry's Industry 4.0 pilot applications must begin. In this context, within the scope of
the study, answers to the following questions will be taken in the questionnaire study conducted by our
country's manufacturing companies; “What is the use of technology in the process from product and service design to production?”, “What is the use of information systems in processes such as planning,
production, estimation, supply chain?”, “What is the intensity of analyzing and evaluating customer
data in design, engineering and manufacturing processes?” and “What is the intensity of technology use in the process from production to delivery of products and services to the customer?”. The results
will be interpreted as whether the country's manufacturing industry is ready for transition to Industry
4.0.
Keywords: Industry 4.0, Fourth Industrial Revolution, Cyber Physical Systems, Internet of Things, Smart Factories.
1. Introduction
Nowadays, production systems and technologies are in a rapid change. This change leads to the
change of traditional production as well as physical change. Technology has become the most important topic of modern production systems. By this way, enterprises, governments and production
policy makers have great roles in the development or renewal of existing production technologies.
All industrial revolutionshave begun with technological developmentsin history. The discovery of
water and steam powered machines, the division of work and the transition to mass production, the introduction of software and programmable logic control (PLC) into the production systems triggered
the industrial revolutions before fourth industrial revolution. The new industrial revolution is triggered
by the Internet and its rapid development. The Internet provides the communication between people and machines (Brettel et al. 2014). The widespread use of the Internet provides digitalization in all
areas. Therefore, production systems also enter the digitalization process.
New technological systems, which have been used in production in recent years, change the
industrial appearance. Beyond the traditional industrial systems, smart factories and smart machines reveal the concept of Industry 4.0.The concept of Industry 4.0 is a set of technological developments
that affect and change products and processes, integrate the digital and physical world in production
and enable the production of smart products. Product demands are changing rapidly, more functional
Industry 4.0 and Turkey Awareness… .
216
and comprehensive products are being demanded by customers together with producing smart
products (Nunes et al. 2017).
New emerging technologies also change the education system. Only the well-educated labors acoording to new production systems can use these technologies, so the human factor plays an
important a<cfrole in future production systems.For this reason, companies should pay attention to
human resources management and strategies, and focus on the development of the qualified workforce
(Benesova and Tupa, 2017). Increasing data volume with new technologies also rise demand for the cloud system. If it is
analyzed in information technology, there will be a need for expert personnel who will implement the
cloud system in the enterprises. Also, cloud system engineers and experts providing technological integration for companies will be working in the management staff. It means that, after the transition
to the cloud system, information systems personnel qualificationswill change and they will have to be
more qualified (Benesova and Tupa, 2017).
2. Literature
2.1 Definition of Industry 4.0
Announcing its name at the Hannover Fair in Germany for the first time in 2011, Industry 4.0 has
been a considered subject by academics, practitioners, politicians and government officials worldwide since then. Kagermann (2013) defines Industry 4.0 as a new trend for automation and data transfer in
manufacturing technologies. Cyber physical systems (CPS), internet of things (IoT), cloud systems
and smart factories are the main components that make up the concept of Industry 4.0. To summarize
the industry 4.0 system briefly; by using cyber physical systems in smart factories, digital copies of real objects are created in the virtual world. Products are in communication with each other and with
users with internet of things. Also, they are coordinated. Thus, production and process monitoring in
the cyber physical system will be made using the internet (Sung, 2017). Industry 4.0 is seen as the most comprehensive industrial revolution. Because starting from the
economic issues, including social and environmental issues that affect our daily life takes the field of
new industrial revolutions influence (Garbie, 2016). Industry 4.0 can also be defined as a combine of every stage of production in enterprises in the traditional production processes with internet and
information communication technology (Bortoloni et al. 2017). In other words, industry 4.0 is the
linking of people and objects with any communication technology or service in every platform at all
times (Wagner et al. 2017). In 2013, Acatech defined Industry 4.0 as “The technical integration of production and logistics
activities with the use of cyber physical systems, internet of things and internet of services”
(Bartodziej, 2017). After the application of Industry 4.0, the enterprises will be changed in accordance with the
relevant articles:
• Functional and smart products will be produced by using internet of things and cyber physical
systems.
• It will be ensured that customer oriented productions can be realized instead of mass productions.
• Real-time information and data transfer will be realized with smart factoris and smart
products.
• As raw materials and resources are optimized, efficiency will be increased and alternative
energy sources will be able to use.
• Smart systems, machines and robots will have more important roles in production.
• The need for unskilled labor will be reduced.
• Production errors will be reduced nearly to zero.
• Development of occupational health and safety practices will be considered.
• Flexibility of working hours with Industry 4.0 will change shift strategies.
• Customer requests that are individualized can be realized with 3D printers outside the factory
with simple production processes.
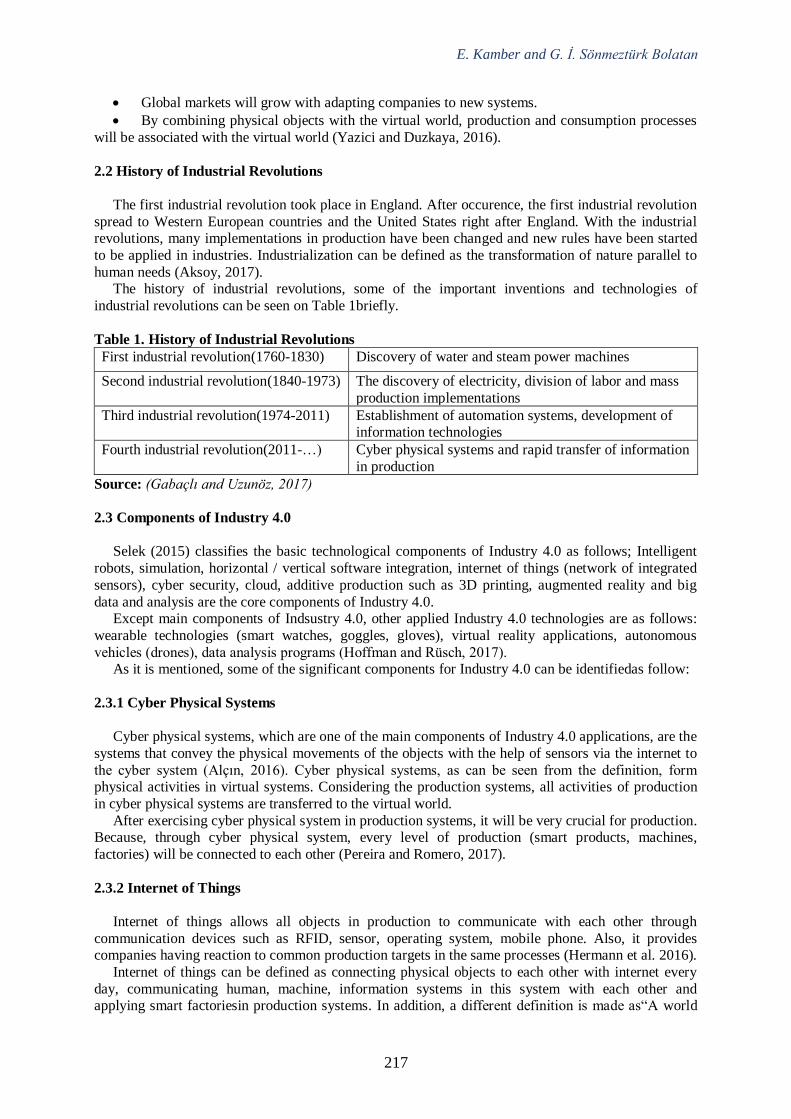
E. Kamber and G. İ. Sönmeztürk Bolatan
217
• Global markets will grow with adapting companies to new systems.
• By combining physical objects with the virtual world, production and consumption processes
will be associated with the virtual world (Yazici and Duzkaya, 2016).
2.2 History of Industrial Revolutions
The first industrial revolution took place in England. After occurence, the first industrial revolution
spread to Western European countries and the United States right after England. With the industrial revolutions, many implementations in production have been changed and new rules have been started
to be applied in industries. Industrialization can be defined as the transformation of nature parallel to
human needs (Aksoy, 2017). The history of industrial revolutions, some of the important inventions and technologies of
industrial revolutions can be seen on Table 1briefly.
Table 1. History of Industrial Revolutions
First industrial revolution(1760-1830) Discovery of water and steam power machines
Second industrial revolution(1840-1973) The discovery of electricity, division of labor and mass
production implementations
Third industrial revolution(1974-2011) Establishment of automation systems, development of information technologies
Fourth industrial revolution(2011-…) Cyber physical systems and rapid transfer of information
in production
Source: (Gabaçlı and Uzunöz, 2017)
2.3 Components of Industry 4.0
Selek (2015) classifies the basic technological components of Industry 4.0 as follows; Intelligent
robots, simulation, horizontal / vertical software integration, internet of things (network of integrated
sensors), cyber security, cloud, additive production such as 3D printing, augmented reality and big
data and analysis are the core components of Industry 4.0. Except main components of Indsustry 4.0, other applied Industry 4.0 technologies are as follows:
wearable technologies (smart watches, goggles, gloves), virtual reality applications, autonomous
vehicles (drones), data analysis programs (Hoffman and Rüsch, 2017). As it is mentioned, some of the significant components for Industry 4.0 can be identifiedas follow:
2.3.1 Cyber Physical Systems
Cyber physical systems, which are one of the main components of Industry 4.0 applications, are the
systems that convey the physical movements of the objects with the help of sensors via the internet to
the cyber system (Alçın, 2016). Cyber physical systems, as can be seen from the definition, form physical activities in virtual systems. Considering the production systems, all activities of production
in cyber physical systems are transferred to the virtual world.
After exercising cyber physical system in production systems, it will be very crucial for production. Because, through cyber physical system, every level of production (smart products, machines,
factories) will be connected to each other (Pereira and Romero, 2017).
2.3.2 Internet of Things
Internet of things allows all objects in production to communicate with each other through
communication devices such as RFID, sensor, operating system, mobile phone. Also, it provides companies having reaction to common production targets in the same processes (Hermann et al. 2016).
Internet of things can be defined as connecting physical objects to each other with internet every
day, communicating human, machine, information systems in this system with each other and applying smart factoriesin production systems. In addition, a different definition is made as“A world
Industry 4.0 and Turkey Awareness… .
218
where physical objects are integrated with information technologies in the internet network and
actively participate in business processes” (Pereira and Romero, 2017).
2.3.3 Smart Factories
Smart factories are a solution that is based on the principles of production to be able to respond
quickly to the ever-changing customer expectations and to adapt to the required changes. When smart factories are installed, the complexities experienced in production are solved and production efficiency
is increasing. Smart factory environment and scope are formed by the connection of the enterprise
with human resources, machinery and smart products (Nunes et al. 2017). Smart factories have smart devices and smart products that are integrated with IoT and CPS
concepts. Smart devices have onboard processing, data storage, communication technology, sensors
and actuators. Intelligent products can identify themselves, define their status, history and approaching processes (Mehami et al. 2018).
Production sequence is known systematically in smart factories. Also, machines and people are
automatically directed according to production work plans (Hermann et al. 2016). Smart products can
determine their production planning. By this way, production can be achieved automatically by smart production systems.
2.4 Advantages and Disadvantages of Industry 4.0
Industry 4.0 is precisely one of the most major subjects for the manufacturing industry in the years
to come. Schmitt (2015) declared why Industry 4.0 is critical and revolutionizing information
technology, marketing and sales processes with five items: 1. Industry 4.0 will decrease the responsibility of companies to adapt to new business trends. The
rapid demand risings in the market, short life time products, complicated product structures, and
supply chains working international are the subjects in which companies are thought to be forced. 2.Companies will be more innovative with Industry 4.0, and thus productivity will rise up. New
trend technologies usage in production systems with digital and smart systems will rise the internet
innovation speed in production systems and new business models will be achieved more quickly in production systems.
3.Customers are oriented at the center of production with Industry 4.0. The customization of the
products will be made possible by digital systems, customerrequestswill be more critical in product
designs. 4. The labor factor becomes themost criticalsubject with Industry 4.0. Productions can be done
without labor, in the case of need in automation systems, workers will be in process, and employee
will be needed mostly to solve complicatedduties in production systems. 5. Important earnings in non-production subjects such as energy, raw materials and enterprise
sources will be ensured. Environmental solutions, social and economic problems will be solved faster
by using modern technologies in smart systems, and creative solutions will be introduced for production lines (Morrar et al., 2017).
With the application of Industry 4.0, it is necessary to mention the advantages that will be provided
to the customers as well as the advantages that will be provided to the enterprises. Customers are an
important part of the system in the supply chain.Industry 4.0 offers many advantages to customers. First of all, it will be easier for customers to communicate with every part of the supply chain in the
digitalizing system. With the help of integrated technological systems and automations, customer
requirements and additional requests will be delivered to the system instantly and appropriate solutions will be produced. Customer requests will be met quickly. Finally, open production and
product information provided by smart products to customers will ensure more accurate usage
information about the product and will be important in terms of tracking the life cycle of the product
(Pereira and Romero, 2017). In addition to the positive aspects of the implementation of Industry 4.0, there will be negative
effects on the enterprises. It is important to identify and evaluate the economic impacts of digitalized
production processes. Changes lead to significant difficulties in the enterprise. The challenges that businesses face when implementing Industry 4.0 are:
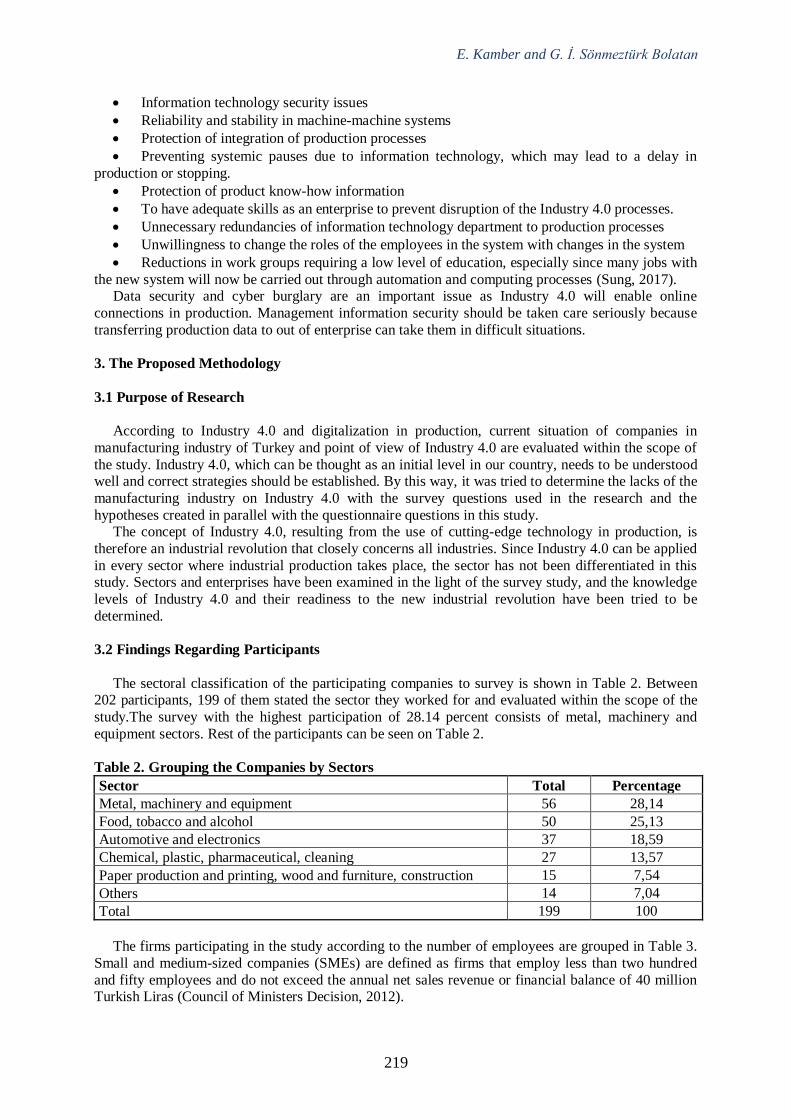
E. Kamber and G. İ. Sönmeztürk Bolatan
219
• Information technology security issues
• Reliability and stability in machine-machine systems
• Protection of integration of production processes
• Preventing systemic pauses due to information technology, which may lead to a delay in
production or stopping.
• Protection of product know-how information
• To have adequate skills as an enterprise to prevent disruption of the Industry 4.0 processes.
• Unnecessary redundancies of information technology department to production processes
• Unwillingness to change the roles of the employees in the system with changes in the system
• Reductions in work groups requiring a low level of education, especially since many jobs with
the new system will now be carried out through automation and computing processes (Sung, 2017). Data security and cyber burglary are an important issue as Industry 4.0 will enable online
connections in production. Management information security should be taken care seriously because
transferring production data to out of enterprise can take them in difficult situations.
3. The Proposed Methodology
3.1 Purpose of Research
According to Industry 4.0 and digitalization in production, current situation of companies in
manufacturing industry of Turkey and point of view of Industry 4.0 are evaluated within the scope of
the study. Industry 4.0, which can be thought as an initial level in our country, needs to be understood well and correct strategies should be established. By this way, it was tried to determine the lacks of the
manufacturing industry on Industry 4.0 with the survey questions used in the research and the
hypotheses created in parallel with the questionnaire questions in this study. The concept of Industry 4.0, resulting from the use of cutting-edge technology in production, is
therefore an industrial revolution that closely concerns all industries. Since Industry 4.0 can be applied
in every sector where industrial production takes place, the sector has not been differentiated in this study. Sectors and enterprises have been examined in the light of the survey study, and the knowledge
levels of Industry 4.0 and their readiness to the new industrial revolution have been tried to be
determined.
3.2 Findings Regarding Participants
The sectoral classification of the participating companies to survey is shown in Table 2. Between 202 participants, 199 of them stated the sector they worked for and evaluated within the scope of the
study.The survey with the highest participation of 28.14 percent consists of metal, machinery and
equipment sectors. Rest of the participants can be seen on Table 2.
Table 2. Grouping the Companies by Sectors
Sector Total Percentage
Metal, machinery and equipment 56 28,14 Food, tobacco and alcohol 50 25,13 Automotive and electronics 37 18,59 Chemical, plastic, pharmaceutical, cleaning 27 13,57
Paper production and printing, wood and furniture, construction 15 7,54
Others 14 7,04
Total 199 100
The firms participating in the study according to the number of employees are grouped in Table 3.
Small and medium-sized companies (SMEs) are defined as firms that employ less than two hundred
and fifty employees and do not exceed the annual net sales revenue or financial balance of 40 million Turkish Liras (Council of Ministers Decision, 2012).
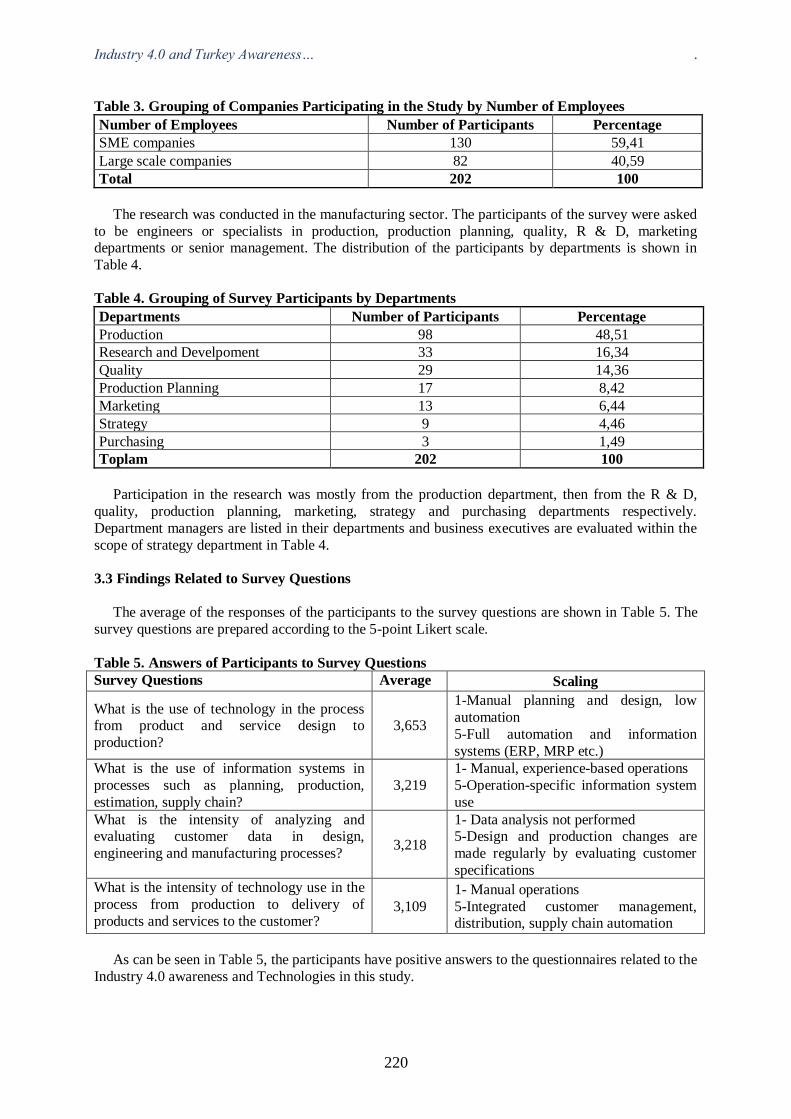
Industry 4.0 and Turkey Awareness… .
220
Table 3. Grouping of Companies Participating in the Study by Number of Employees
Number of Employees Number of Participants Percentage
SME companies 130 59,41
Large scale companies 82 40,59 Total 202 100
The research was conducted in the manufacturing sector. The participants of the survey were asked
to be engineers or specialists in production, production planning, quality, R & D, marketing departments or senior management. The distribution of the participants by departments is shown in
Table 4.
Table 4. Grouping of Survey Participants by Departments
Departments Number of Participants Percentage
Production 98 48,51 Research and Develpoment 33 16,34 Quality 29 14,36 Production Planning 17 8,42 Marketing 13 6,44 Strategy 9 4,46 Purchasing 3 1,49 Toplam 202 100
Participation in the research was mostly from the production department, then from the R & D,
quality, production planning, marketing, strategy and purchasing departments respectively.
Department managers are listed in their departments and business executives are evaluated within the
scope of strategy department in Table 4.
3.3 Findings Related to Survey Questions
The average of the responses of the participants to the survey questions are shown in Table 5. The
survey questions are prepared according to the 5-point Likert scale.
Table 5. Answers of Participants to Survey Questions
Survey Questions Average Scaling
What is the use of technology in the process from product and service design to
production?
3,653
1-Manual planning and design, low
automation
5-Full automation and information
systems (ERP, MRP etc.)
What is the use of information systems in
processes such as planning, production,
estimation, supply chain?
3,219
1- Manual, experience-based operations
5-Operation-specific information system
use
What is the intensity of analyzing and evaluating customer data in design,
engineering and manufacturing processes? 3,218
1- Data analysis not performed 5-Design and production changes are
made regularly by evaluating customer
specifications
What is the intensity of technology use in the
process from production to delivery of
products and services to the customer? 3,109
1- Manual operations
5-Integrated customer management, distribution, supply chain automation
As can be seen in Table 5, the participants have positive answers to the questionnaires related to the
Industry 4.0 awareness and Technologies in this study.
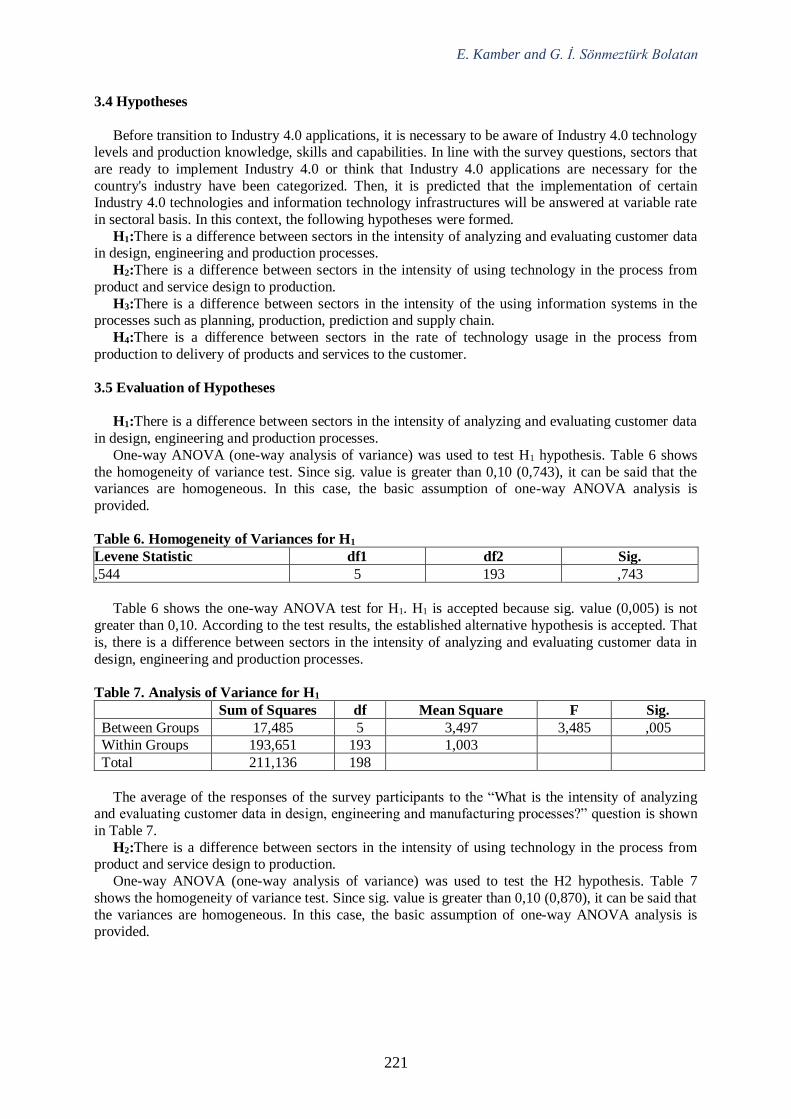
E. Kamber and G. İ. Sönmeztürk Bolatan
221
3.4 Hypotheses
Before transition to Industry 4.0 applications, it is necessary to be aware of Industry 4.0 technology levels and production knowledge, skills and capabilities. In line with the survey questions, sectors that
are ready to implement Industry 4.0 or think that Industry 4.0 applications are necessary for the
country's industry have been categorized. Then, it is predicted that the implementation of certain Industry 4.0 technologies and information technology infrastructures will be answered at variable rate
in sectoral basis. In this context, the following hypotheses were formed.
H1:There is a difference between sectors in the intensity of analyzing and evaluating customer data in design, engineering and production processes.
H2:There is a difference between sectors in the intensity of using technology in the process from
product and service design to production.
H3:There is a difference between sectors in the intensity of the using information systems in the processes such as planning, production, prediction and supply chain.
H4:There is a difference between sectors in the rate of technology usage in the process from
production to delivery of products and services to the customer.
3.5 Evaluation of Hypotheses
H1:There is a difference between sectors in the intensity of analyzing and evaluating customer data
in design, engineering and production processes.
One-way ANOVA (one-way analysis of variance) was used to test H1 hypothesis. Table 6 shows
the homogeneity of variance test. Since sig. value is greater than 0,10 (0,743), it can be said that the variances are homogeneous. In this case, the basic assumption of one-way ANOVA analysis is
provided.
Table 6. Homogeneity of Variances for H1
Levene Statistic df1 df2 Sig. ,544 5 193 ,743
Table 6 shows the one-way ANOVA test for H1. H1 is accepted because sig. value (0,005) is not
greater than 0,10. According to the test results, the established alternative hypothesis is accepted. That
is, there is a difference between sectors in the intensity of analyzing and evaluating customer data in
design, engineering and production processes.
Table 7. Analysis of Variance for H1
Sum of Squares df Mean Square F Sig.
Between Groups 17,485 5 3,497 3,485 ,005
Within Groups 193,651 193 1,003
Total 211,136 198
The average of the responses of the survey participants to the “What is the intensity of analyzing and evaluating customer data in design, engineering and manufacturing processes?” question is shown
in Table 7.
H2:There is a difference between sectors in the intensity of using technology in the process from product and service design to production.
One-way ANOVA (one-way analysis of variance) was used to test the H2 hypothesis. Table 7
shows the homogeneity of variance test. Since sig. value is greater than 0,10 (0,870), it can be said that
the variances are homogeneous. In this case, the basic assumption of one-way ANOVA analysis is provided.
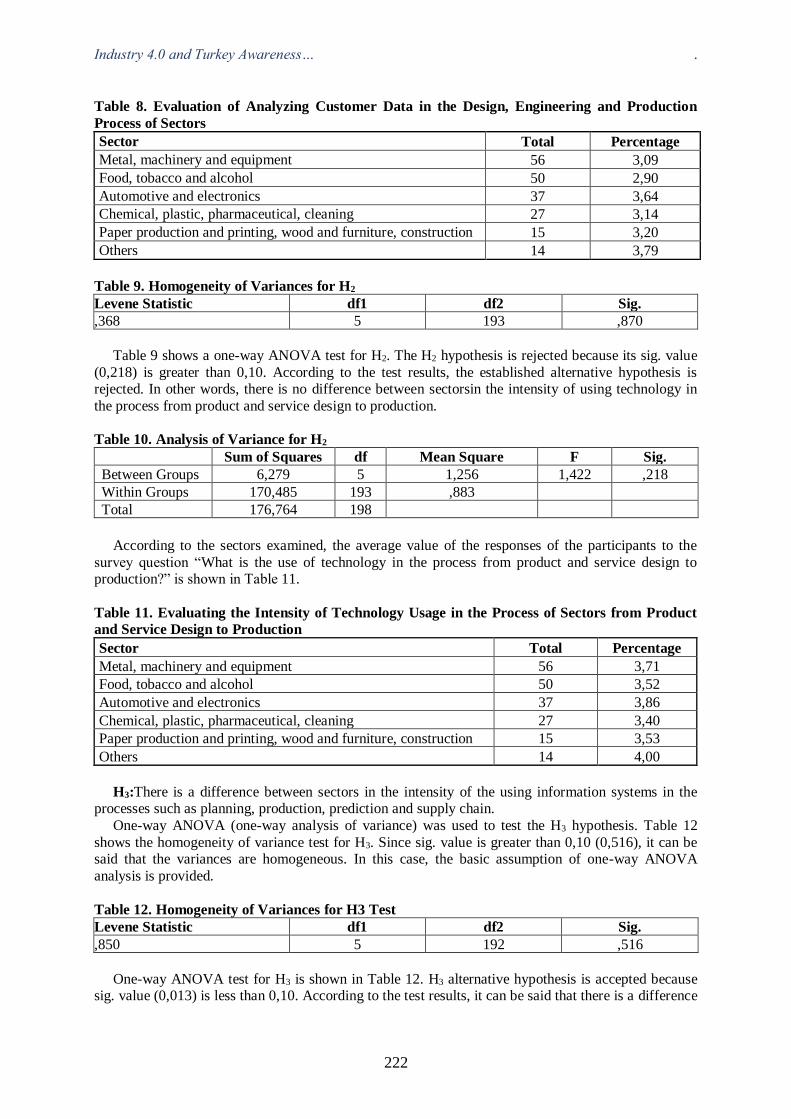
Industry 4.0 and Turkey Awareness… .
222
Table 8. Evaluation of Analyzing Customer Data in the Design, Engineering and Production
Process of Sectors
Sector Total Percentage
Metal, machinery and equipment 56 3,09 Food, tobacco and alcohol 50 2,90 Automotive and electronics 37 3,64 Chemical, plastic, pharmaceutical, cleaning 27 3,14 Paper production and printing, wood and furniture, construction 15 3,20 Others 14 3,79
Table 9. Homogeneity of Variances for H2
Levene Statistic df1 df2 Sig. ,368 5 193 ,870
Table 9 shows a one-way ANOVA test for H2. The H2 hypothesis is rejected because its sig. value
(0,218) is greater than 0,10. According to the test results, the established alternative hypothesis is rejected. In other words, there is no difference between sectorsin the intensity of using technology in
the process from product and service design to production.
Table 10. Analysis of Variance for H2
Sum of Squares df Mean Square F Sig.
Between Groups 6,279 5 1,256 1,422 ,218
Within Groups 170,485 193 ,883
Total 176,764 198
According to the sectors examined, the average value of the responses of the participants to the
survey question “What is the use of technology in the process from product and service design to production?” is shown in Table 11.
Table 11. Evaluating the Intensity of Technology Usage in the Process of Sectors from Product
and Service Design to Production
Sector Total Percentage
Metal, machinery and equipment 56 3,71 Food, tobacco and alcohol 50 3,52
Automotive and electronics 37 3,86
Chemical, plastic, pharmaceutical, cleaning 27 3,40 Paper production and printing, wood and furniture, construction 15 3,53
Others 14 4,00
H3:There is a difference between sectors in the intensity of the using information systems in the processes such as planning, production, prediction and supply chain.
One-way ANOVA (one-way analysis of variance) was used to test the H3 hypothesis. Table 12
shows the homogeneity of variance test for H3. Since sig. value is greater than 0,10 (0,516), it can be said that the variances are homogeneous. In this case, the basic assumption of one-way ANOVA
analysis is provided.
Table 12. Homogeneity of Variances for H3 Test
Levene Statistic df1 df2 Sig. ,850 5 192 ,516
One-way ANOVA test for H3 is shown in Table 12. H3 alternative hypothesis is accepted because sig. value (0,013) is less than 0,10. According to the test results, it can be said that there is a difference
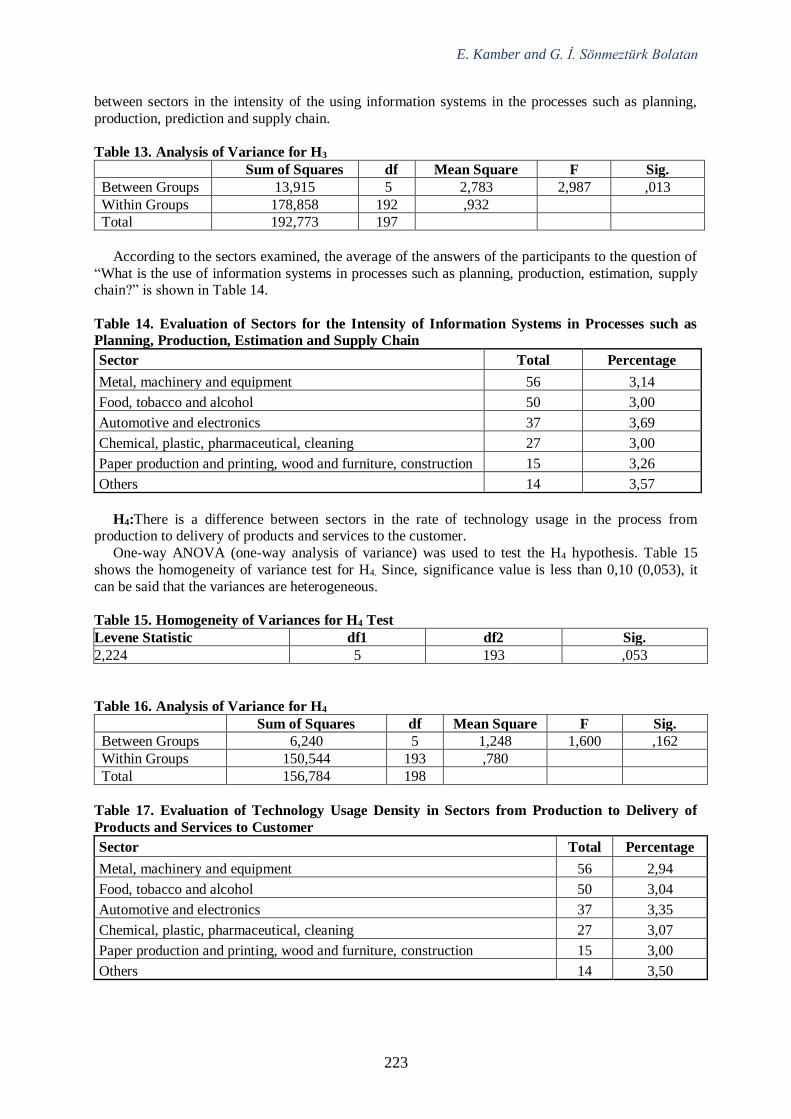
E. Kamber and G. İ. Sönmeztürk Bolatan
223
between sectors in the intensity of the using information systems in the processes such as planning,
production, prediction and supply chain.
Table 13. Analysis of Variance for H3
Sum of Squares df Mean Square F Sig.
Between Groups 13,915 5 2,783 2,987 ,013
Within Groups 178,858 192 ,932
Total 192,773 197
According to the sectors examined, the average of the answers of the participants to the question of
“What is the use of information systems in processes such as planning, production, estimation, supply chain?” is shown in Table 14.
Table 14. Evaluation of Sectors for the Intensity of Information Systems in Processes such as
Planning, Production, Estimation and Supply Chain
Sector Total Percentage
Metal, machinery and equipment 56 3,14
Food, tobacco and alcohol 50 3,00
Automotive and electronics 37 3,69
Chemical, plastic, pharmaceutical, cleaning 27 3,00
Paper production and printing, wood and furniture, construction 15 3,26
Others 14 3,57
H4:There is a difference between sectors in the rate of technology usage in the process from production to delivery of products and services to the customer.
One-way ANOVA (one-way analysis of variance) was used to test the H4 hypothesis. Table 15
shows the homogeneity of variance test for H4. Since, significance value is less than 0,10 (0,053), it
can be said that the variances are heterogeneous.
Table 15. Homogeneity of Variances for H4 Test
Levene Statistic df1 df2 Sig. 2,224 5 193 ,053
Table 16. Analysis of Variance for H4
Sum of Squares df Mean Square F Sig.
Between Groups 6,240 5 1,248 1,600 ,162
Within Groups 150,544 193 ,780
Total 156,784 198
Table 17. Evaluation of Technology Usage Density in Sectors from Production to Delivery of
Products and Services to Customer
Sector Total Percentage
Metal, machinery and equipment 56 2,94
Food, tobacco and alcohol 50 3,04
Automotive and electronics 37 3,35
Chemical, plastic, pharmaceutical, cleaning 27 3,07
Paper production and printing, wood and furniture, construction 15 3,00
Others 14 3,50
Industry 4.0 and Turkey Awareness… .
224
One-way ANOVA test for H4 hypothesis is shown in Table 16. H4 alternative hypothesis is rejected
because sig. value (0,162) is less than 0,10. According to the test results, it can be said that there is not
difference between sectors in the rate of technology usage in the process from production to delivery of products and services to the customer.
According to the sectors examined, the average of the answers of the participants to the question of
“What is the intensity of technology use in the process from production to delivery of products and
services to the customer?” is shown in Table 17.
4. Conclusıon
The concept of Industry 4.0 is becoming increasingly popular today. The technological revolution,
which started under the leadership of developed countries, undoubtedly makes itself felt in every field
of society as well as the production sector. It is not possible to follow this process as a country and not to take the necessary steps and to realize the technological transformations. It is seen that the state
policies developed for the transition to the fourth industrial revolution in our country industry have
been developed. In addition to the state policies, the aim of the study was to create an awareness of
Industry 4.0 in the private sector. In this respect, a questionnaire study was conducted and hypotheses were prepared and examined in parallel with the questionnaire questions.
In the H1 hypothesis, in the intensity of analyzing and evaluating customer data in design,
engineering and production processes between sectors were examined. One-way ANOVA test was performed for H1 hypothesis. According to the results, H1 hypothesis was accepted. In this respect, it is
said that there is a difference between sectors in the intensity of analyzing and evaluating customer
data in design, engineering and production processes.
In the H2 hypothesis, the differences in the intensity of using technology in the process from product and service design to production were examined. One-way ANOVA test was performed for H2
hypothesis. According to the evaluation results, H2 hypothesis was rejected. According to the data, it
can be said that there is no difference in the intensity of technology usage in the process from product and service design to production.
In the H3 hypothesis, the differences in the intensity of using information systems in the processes
such as planning, production, estimation and supply chain between sectors were examined. One-way ANOVA test was used for H3 hypothesis. According to the evaluation results, H3 hypothesis was
accepted. In other words, it can be said that there is a difference in the intensity of using information
systems in sectors such as planning, production, estimation and supply chain.
In the H4 hypothesis, the differences in the rate of technology usage in the process from production to delivery of products and services to customers were examined. One-way ANOVA test was
performed for H4 hypothesis. According to the evaluation results, hypothesis H4 was rejected. In other
words, there is no difference between the sectors in the rate of technology usage in the process from production to delivery of products and services to the customer.
References
Aksoy, S. (2017). Değişen teknolojiler ve Endüstri 4.0: Endüstri 4.0’ı anlamaya dair bir giriş. Sosyal
Araştirma Vakfı Katkı, sayı. 4, ss. 34-44.
Alçın, S. (2016). Üretim İçin Yeni Bir İzlek: Sanayi 4.0. Journal of Life Economics, sayı. 8, ss. 19-30, http://dx.doi.org/10.15637/jlecon.129 (Erişim tarihi: 22.04.2018)
Bakanlar Kurulu Kararı. Küçük ve orta büyüklükteki işletmelerin tanımı,
Nitelikleri ve Sınıflandırılması Hakkında yönetmelik. 19/10/2005, No: 2005/9617, Değişik: 10/9/2012-2012/3834 K.
Bartodziej, C. J. (2017). The Concept Industry 4.0 An Empirical Analysis of Technologies and
Applications in Production Logistics. http://www.springer.com/gp/book/
Benesova, A. and Tupa, J. (2017). Requirements for Education and Qualification of People in Industry 4.0. Procedia Manufacturing, pp. 2195 – 2202.
Bortolini, M., Ferrari, E., Gamberi, M., Pilati, F. and Faccio M. (2017). Assembly system design in the
Industry 4.0 era: a general framework. IFAC PapersOnLine, 50-1, 5700–5705.
E. Kamber and G. İ. Sönmeztürk Bolatan
225
Brettel, M., Friederichsen, N., Keller, M. and Rosenberg, M. (2014). How Virtualization,
Decentralization and Network Building Change the Manufacturing Landscape: An Industry 4.0
Perspective. World Acad. Sci. Eng. Technol. Int. J. Mech. Aerospace, Ind. Mechatron, Manuf. Engineering, 8(1), pp. 37–44.
Gabaçlı, N. ve Uzunöz, M. (2017). IV. Sanayi Devrimi: Endüstri 4.0 ve Otomotiv Sektörü.
Uluslararası Politik, Ekonomik ve Sosyal Araştırmalar Kongresi, Bildiriler Kitabı, Cilt:2 Ekonomik Araştırmalar, ss. 149-174.
Garbie, I. (2016). Sustainability in Manufacturing Enterprises: Concepts, Analyses and Assessments
for Industry 4.0. [Adobe Acrobat Reader sürümü], http://www.springer.com/series/8059 Hermann, M., Pentek, T. and Otto B. (2016). Design Principles for Industrie 4.0 Scenarios. System
Sciences (HICSS), 49th Hawaii International Conference
Hofmann, E. and Rüsch, M. (2017). Industry 4.0 And The Current Status As Well As Future Prospects
On Logistics. Computers in Industry, pp. 23–34, http://dx.doi.org/10.1016/j.compind.2017.04.002, (Erişim tarihi: 17.04.2018)
Kagermann, H., Wahlster, W. and Helbig J. (2013). Recommendations for Implementing the Strategic
Initiative Industrie 4.0. Industrie 4.0 Çalışma Grubu, Almanya Mehami, J., Nawi, M. and Zhong, R. Y. (2018). Smart automated guided vehicles for manufacturing in
the context of Industry 4.0. Procedia Manufacturing, 26, pp. 10077-1086.
Morrar, R., Arman, H. and Mousa S. (2017). The Fourth Industrial Revolution (Industry 4.0): A Social Innovation Perspective. Technology Innovation Management Review, 7(11).
Nunes, M. L., Pereira, A.C. and Alves, A.C. (2017). Smart products development approaches for
Industry 4.0. Procedia Manufacturing, 13, pp. 1215–1222.
Pereira, A.C. and Romero, F. (2017). A review of the meanings and the imlications of the Indusrty 4.0 concept. Procedia Manufacturing, 13, pp. 1206–1214.
Schmitt, K. (2013). Top 5 Reasons Why Industry 4.0 Is Real And Important, Digitalist Magazine.
https://www.digitalistmag.com/industries/manufacturingindustries/2013/10/ 15/top-5-reasons-industry-4-0-real-important-0833970 (Erişim tarihi: 26.03.2018)
Selek, A. (2015). Endustri Tarihine Kısa Bir Yolculuk. http://www.endustri40.com/endustri-tarihine-
kisa-bir-yolculuk/, (Erişim tarihi: 26.02.2018)
Sung, T.K. (2017). Technological Forecasting & Social Change. http://dx.doi.org/10.1016/j.techfore.2017.11.005
Wagner, T., Herrmann, C. and Thiede S. (2017). Industry 4.0 impacts on lean production systems.
Procedia CIRP, 63, pp. 125 – 131. Yazıcı, E. ve Düzkaya, H. (2016). Endüstri devriminde dördüncü dalga ve eğitim: Türkiye dördüncü
dalga endüstri devrimine hazır mı?.Eğitim ve İnsani Bilimler Dergisi: Teori ve Uygulama [Journal
of Education and Humanities: Theory and Practice], 7 (13), ss. 49-88.
3rd International Conference on Economic Research
24-25th October 2019, Alanya, Turkey
226
ACTUAL ISSUES OF COOPERATIVE PROPERTY’S TRANSACTION ANALYSIS
Soloviov Andrii
Kherson State University, Department of Management and Administration, Ukraine
Email: [email protected]
Ushkarenko Iuliia
Kherson State University, Departmentof Economics and International Economic Relations, Ukraine
Abstract
The activity of cooperative enterprises that occurs in a certain institutional environment and is
defined as a set of basic social, political, legal and economic norms as part of human behavior is
considered. It has been established that institutions influence the functioning of cooperatives by
influencing the costs of exchange and production. Together with technology, they determine the
transaction and transformation costs that make up the total costs. The research focuses on cooperative
enterprises, as targeted entities designed to maximize income or achieve a goal defined by the
opportunities created by the institutional structure.
The study proved the existence of cooperatives advantages in competitiveness in comparison with
enterprises of other forms of ownership. It has been established that the advantages of cooperative
ownership over other forms of ownership are not in technology, in technology, or
in the qualifications of cooperators.The main advantage of cooperatives over traditional
capitalist firms is the increased motivation of the members of the cooperative. To establish
this, a transactional analysis of cooperative ownership was carried out.
Keywords: Transaction, Transaction Charges, Opportunism, Co-operative Ideology, Co-operative
Property.
1. Introduction
Transactions are strategic relations in the course of economic activity, without which there could be
no production, consumption, purchase, sale, investment. The concept of the transaction was introduced
into the economy by J.R. Commons, who considered the problem of economic organization in close
connection with the problems of conflict, interdependence and order (Tkach,2007).During the
transaction the legal control is realized and the conflicts of interest of the dependent individuals are
resolved in such a way that a social need arises.
Therefore, property, the essence of which is the legitimate right to retain whatever it needs, is the
basis of the institutional economy, and transaction is an elemental part of economic activity and,
therefore, the basic unit of economic analysis. Transactions are not about exchange of goods, but
alienation and assignment of property rights. Cooperatives can only be genuine and successful if the
economic basis of their operation is cooperative ownership.
2. Status of Problem Study
The theoretical basis for conducting a transactional analysis of cooperative ownership was the work
of scientists, who began separate directions of institutional theory of developed market systems:
transactions − D. Bromley, J. Commons; transaction costs − R. Coase, D. North; contracts − O.
Williamson, B. Klein; the theory of property rights − S. Peyovich, E. Furubotn. The ideologist of
property theory is considered by A. Alcian, and its developers are recognized by such economists as
R. Coase, G. Demets, R. Poser, D. North and some others. The general idea is that it is not the
resource that embodies the property, but «the bundle or share of the rights to use the resource is what
constitutes the property»(Tkach,2007).However, complex research on the features of transactional
analysis of cooperative ownership is essentially absent. All this determines the relevance of the
problems for further study.
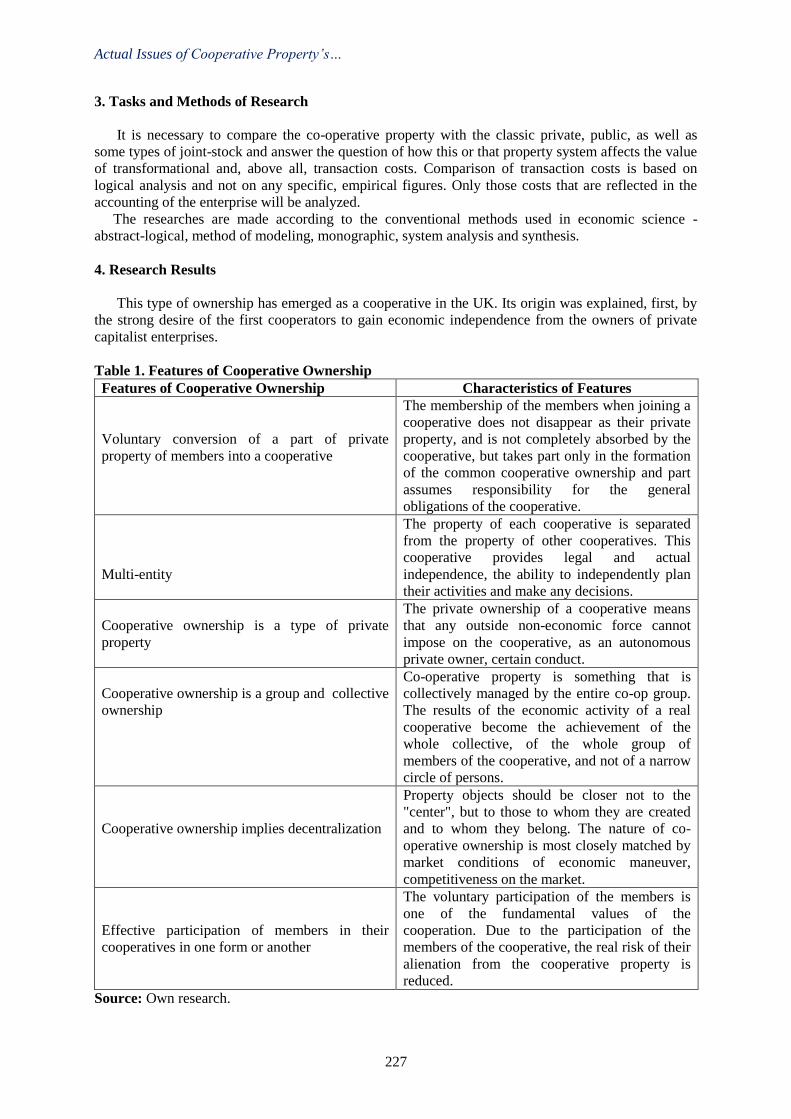
Actual Issues of Cooperative Property’s…
227
3. Tasks and Methods of Research
It is necessary to compare the co-operative property with the classic private, public, as well as
some types of joint-stock and answer the question of how this or that property system affects the value
of transformational and, above all, transaction costs. Comparison of transaction costs is based on
logical analysis and not on any specific, empirical figures. Only those costs that are reflected in the
accounting of the enterprise will be analyzed.
The researches are made according to the conventional methods used in economic science -
abstract-logical, method of modeling, monographic, system analysis and synthesis.
4. Research Results
This type of ownership has emerged as a cooperative in the UK. Its origin was explained, first, by
the strong desire of the first cooperators to gain economic independence from the owners of private
capitalist enterprises.
Table 1. Features of Cooperative Ownership
Features of Cooperative Ownership Characteristics of Features
Voluntary conversion of a part of private
property of members into a cooperative
The membership of the members when joining a
cooperative does not disappear as their private
property, and is not completely absorbed by the
cooperative, but takes part only in the formation
of the common cooperative ownership and part
assumes responsibility for the general
obligations of the cooperative.
Multi-entity
The property of each cooperative is separated
from the property of other cooperatives. This
cooperative provides legal and actual
independence, the ability to independently plan
their activities and make any decisions.
Cooperative ownership is a type of private
property
The private ownership of a cooperative means
that any outside non-economic force cannot
impose on the cooperative, as an autonomous
private owner, certain conduct.
Cooperative ownership is a group and collective
ownership
Co-operative property is something that is
collectively managed by the entire co-op group.
The results of the economic activity of a real
cooperative become the achievement of the
whole collective, of the whole group of
members of the cooperative, and not of a narrow
circle of persons.
Cooperative ownership implies decentralization
Property objects should be closer not to the
"center", but to those to whom they are created
and to whom they belong. The nature of co-
operative ownership is most closely matched by
market conditions of economic maneuver,
competitiveness on the market.
Effective participation of members in their
cooperatives in one form or another
The voluntary participation of the members is
one of the fundamental values of the
cooperation. Due to the participation of the
members of the cooperative, the real risk of their
alienation from the cooperative property is
reduced.
Source: Own research.
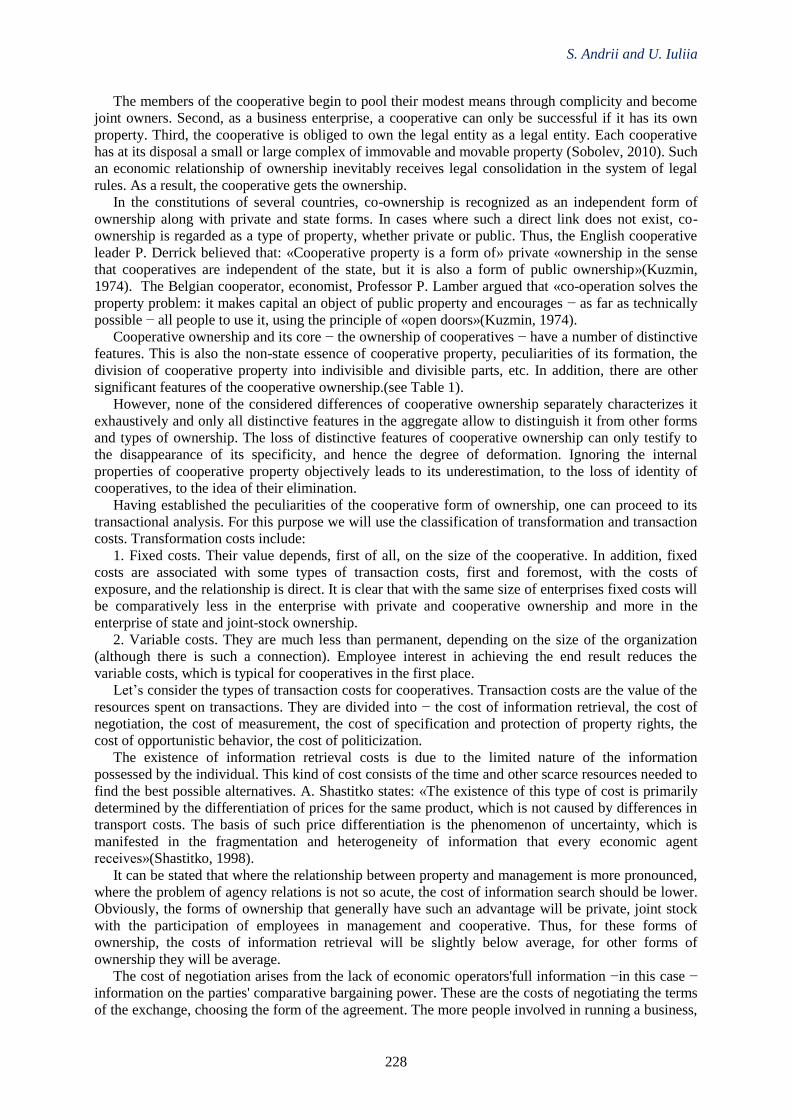
S. Andrii and U. Iuliia
228
The members of the cooperative begin to pool their modest means through complicity and become
joint owners. Second, as a business enterprise, a cooperative can only be successful if it has its own
property. Third, the cooperative is obliged to own the legal entity as a legal entity. Each cooperative
has at its disposal a small or large complex of immovable and movable property (Sobolev, 2010). Such
an economic relationship of ownership inevitably receives legal consolidation in the system of legal
rules. As a result, the cooperative gets the ownership.
In the constitutions of several countries, co-ownership is recognized as an independent form of
ownership along with private and state forms. In cases where such a direct link does not exist, co-
ownership is regarded as a type of property, whether private or public. Thus, the English cooperative
leader P. Derrick believed that: «Cooperative property is a form of» private «ownership in the sense
that cooperatives are independent of the state, but it is also a form of public ownership»(Kuzmin,
1974). The Belgian cooperator, economist, Professor P. Lamber argued that «co-operation solves the
property problem: it makes capital an object of public property and encourages − as far as technically
possible − all people to use it, using the principle of «open doors»(Kuzmin, 1974).
Cooperative ownership and its core − the ownership of cooperatives − have a number of distinctive
features. This is also the non-state essence of cooperative property, peculiarities of its formation, the
division of cooperative property into indivisible and divisible parts, etc. In addition, there are other
significant features of the cooperative ownership.(see Table 1).
However, none of the considered differences of cooperative ownership separately characterizes it
exhaustively and only all distinctive features in the aggregate allow to distinguish it from other forms
and types of ownership. The loss of distinctive features of cooperative ownership can only testify to
the disappearance of its specificity, and hence the degree of deformation. Ignoring the internal
properties of cooperative property objectively leads to its underestimation, to the loss of identity of
cooperatives, to the idea of their elimination.
Having established the peculiarities of the cooperative form of ownership, one can proceed to its
transactional analysis. For this purpose we will use the classification of transformation and transaction
costs. Transformation costs include:
1. Fixed costs. Their value depends, first of all, on the size of the cooperative. In addition, fixed
costs are associated with some types of transaction costs, first and foremost, with the costs of
exposure, and the relationship is direct. It is clear that with the same size of enterprises fixed costs will
be comparatively less in the enterprise with private and cooperative ownership and more in the
enterprise of state and joint-stock ownership.
2. Variable costs. They are much less than permanent, depending on the size of the organization
(although there is such a connection). Employee interest in achieving the end result reduces the
variable costs, which is typical for cooperatives in the first place.
Let’s consider the types of transaction costs for cooperatives. Transaction costs are the value of the
resources spent on transactions. They are divided into − the cost of information retrieval, the cost of
negotiation, the cost of measurement, the cost of specification and protection of property rights, the
cost of opportunistic behavior, the cost of politicization.
The existence of information retrieval costs is due to the limited nature of the information
possessed by the individual. This kind of cost consists of the time and other scarce resources needed to
find the best possible alternatives. A. Shastitko states: «The existence of this type of cost is primarily
determined by the differentiation of prices for the same product, which is not caused by differences in
transport costs. The basis of such price differentiation is the phenomenon of uncertainty, which is
manifested in the fragmentation and heterogeneity of information that every economic agent
receives»(Shastitko, 1998).
It can be stated that where the relationship between property and management is more pronounced,
where the problem of agency relations is not so acute, the cost of information search should be lower.
Obviously, the forms of ownership that generally have such an advantage will be private, joint stock
with the participation of employees in management and cooperative. Thus, for these forms of
ownership, the costs of information retrieval will be slightly below average, for other forms of
ownership they will be average.
The cost of negotiation arises from the lack of economic operators'full information −in this case −
information on the parties' comparative bargaining power. These are the costs of negotiating the terms
of the exchange, choosing the form of the agreement. The more people involved in running a business,
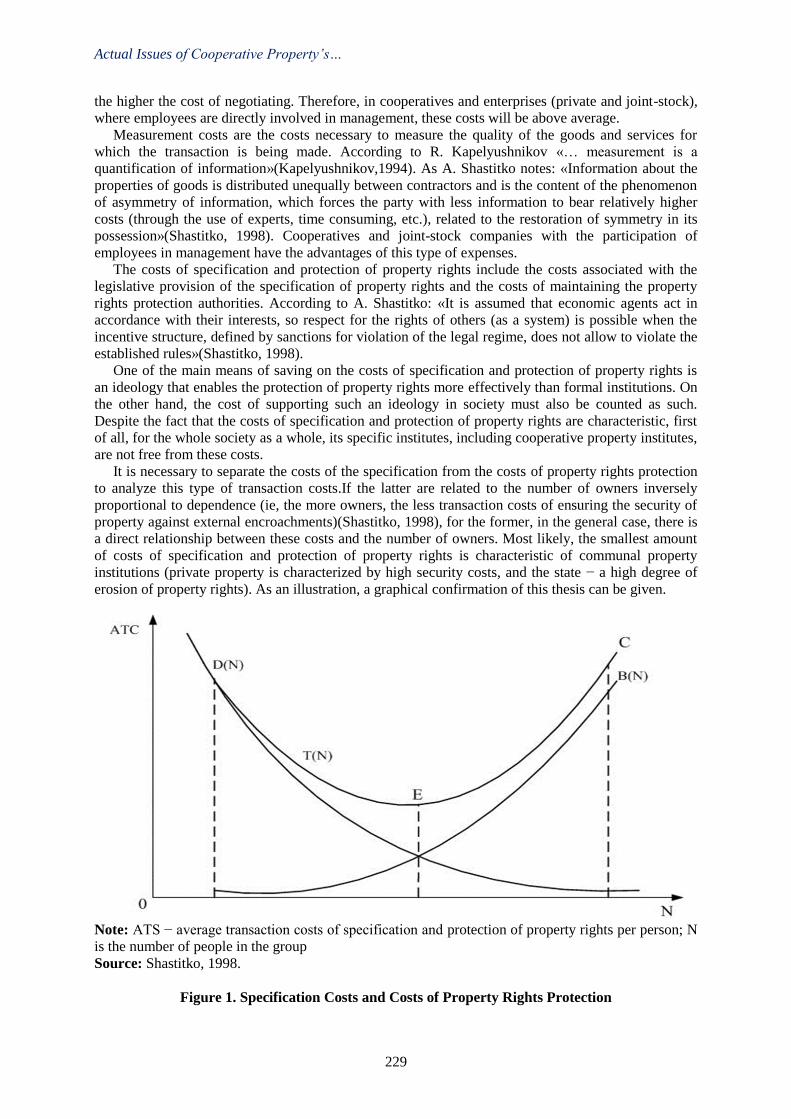
Actual Issues of Cooperative Property’s…
229
the higher the cost of negotiating. Therefore, in cooperatives and enterprises (private and joint-stock),
where employees are directly involved in management, these costs will be above average.
Measurement costs are the costs necessary to measure the quality of the goods and services for
which the transaction is being made. According to R. Kapelyushnikov «… measurement is a
quantification of information»(Kapelyushnikov,1994). As A. Shastitko notes: «Information about the
properties of goods is distributed unequally between contractors and is the content of the phenomenon
of asymmetry of information, which forces the party with less information to bear relatively higher
costs (through the use of experts, time consuming, etc.), related to the restoration of symmetry in its
possession»(Shastitko, 1998). Cooperatives and joint-stock companies with the participation of
employees in management have the advantages of this type of expenses.
The costs of specification and protection of property rights include the costs associated with the
legislative provision of the specification of property rights and the costs of maintaining the property
rights protection authorities. According to A. Shastitko: «It is assumed that economic agents act in
accordance with their interests, so respect for the rights of others (as a system) is possible when the
incentive structure, defined by sanctions for violation of the legal regime, does not allow to violate the
established rules»(Shastitko, 1998).
One of the main means of saving on the costs of specification and protection of property rights is
an ideology that enables the protection of property rights more effectively than formal institutions. On
the other hand, the cost of supporting such an ideology in society must also be counted as such.
Despite the fact that the costs of specification and protection of property rights are characteristic, first
of all, for the whole society as a whole, its specific institutes, including cooperative property institutes,
are not free from these costs.
It is necessary to separate the costs of the specification from the costs of property rights protection
to analyze this type of transaction costs.If the latter are related to the number of owners inversely
proportional to dependence (ie, the more owners, the less transaction costs of ensuring the security of
property against external encroachments)(Shastitko, 1998), for the former, in the general case, there is
a direct relationship between these costs and the number of owners. Most likely, the smallest amount
of costs of specification and protection of property rights is characteristic of communal property
institutions (private property is characterized by high security costs, and the state − a high degree of
erosion of property rights). As an illustration, a graphical confirmation of this thesis can be given.
Note: ATS − average transaction costs of specification and protection of property rights per person; N
is the number of people in the group
Source: Shastitko, 1998.
Figure 1. Specification Costs and Costs of Property Rights Protection
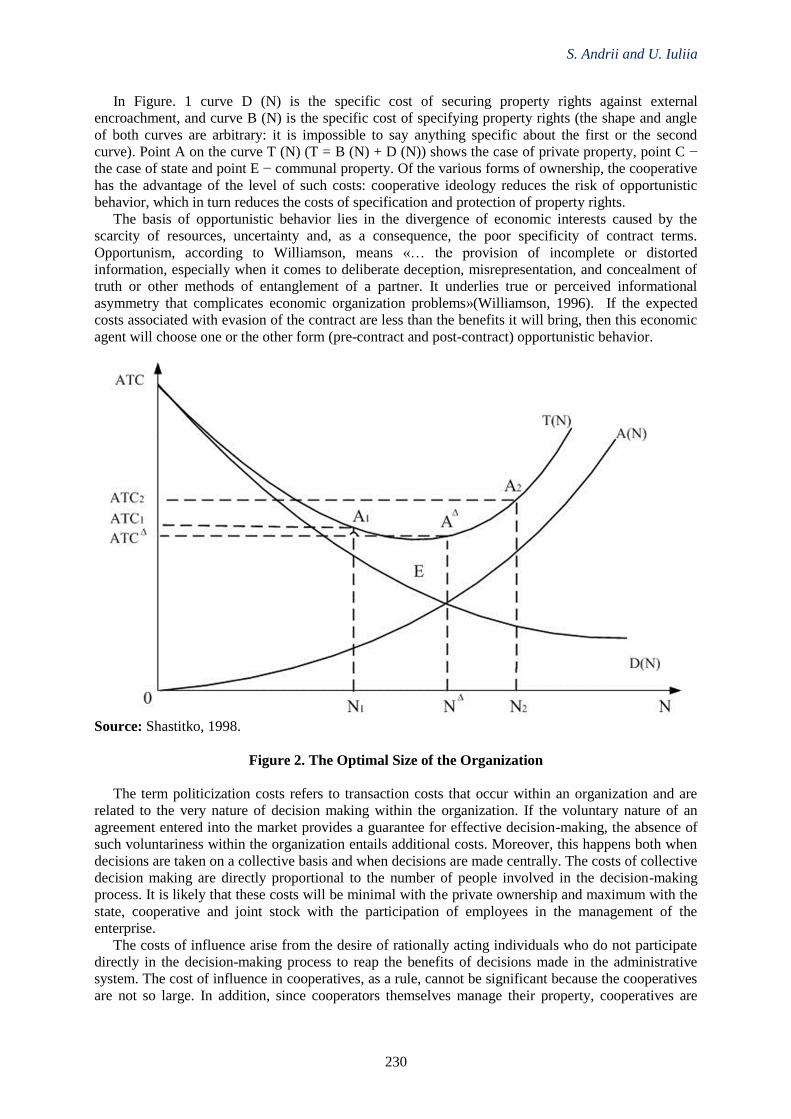
S. Andrii and U. Iuliia
230
In Figure. 1 curve D (N) is the specific cost of securing property rights against external
encroachment, and curve B (N) is the specific cost of specifying property rights (the shape and angle
of both curves are arbitrary: it is impossible to say anything specific about the first or the second
curve). Point A on the curve T (N) (T = B (N) + D (N)) shows the case of private property, point C −
the case of state and point E − communal property. Of the various forms of ownership, the cooperative
has the advantage of the level of such costs: cooperative ideology reduces the risk of opportunistic
behavior, which in turn reduces the costs of specification and protection of property rights.
The basis of opportunistic behavior lies in the divergence of economic interests caused by the
scarcity of resources, uncertainty and, as a consequence, the poor specificity of contract terms.
Opportunism, according to Williamson, means «… the provision of incomplete or distorted
information, especially when it comes to deliberate deception, misrepresentation, and concealment of
truth or other methods of entanglement of a partner. It underlies true or perceived informational
asymmetry that complicates economic organization problems»(Williamson, 1996). If the expected
costs associated with evasion of the contract are less than the benefits it will bring, then this economic
agent will choose one or the other form (pre-contract and post-contract) opportunistic behavior.
Source: Shastitko, 1998.
Figure 2. The Optimal Size of the Organization
The term politicization costs refers to transaction costs that occur within an organization and are
related to the very nature of decision making within the organization. If the voluntary nature of an
agreement entered into the market provides a guarantee for effective decision-making, the absence of
such voluntariness within the organization entails additional costs. Moreover, this happens both when
decisions are taken on a collective basis and when decisions are made centrally. The costs of collective
decision making are directly proportional to the number of people involved in the decision-making
process. It is likely that these costs will be minimal with the private ownership and maximum with the
state, cooperative and joint stock with the participation of employees in the management of the
enterprise.
The costs of influence arise from the desire of rationally acting individuals who do not participate
directly in the decision-making process to reap the benefits of decisions made in the administrative
system. The cost of influence in cooperatives, as a rule, cannot be significant because the cooperatives
are not so large. In addition, since cooperators themselves manage their property, cooperatives are
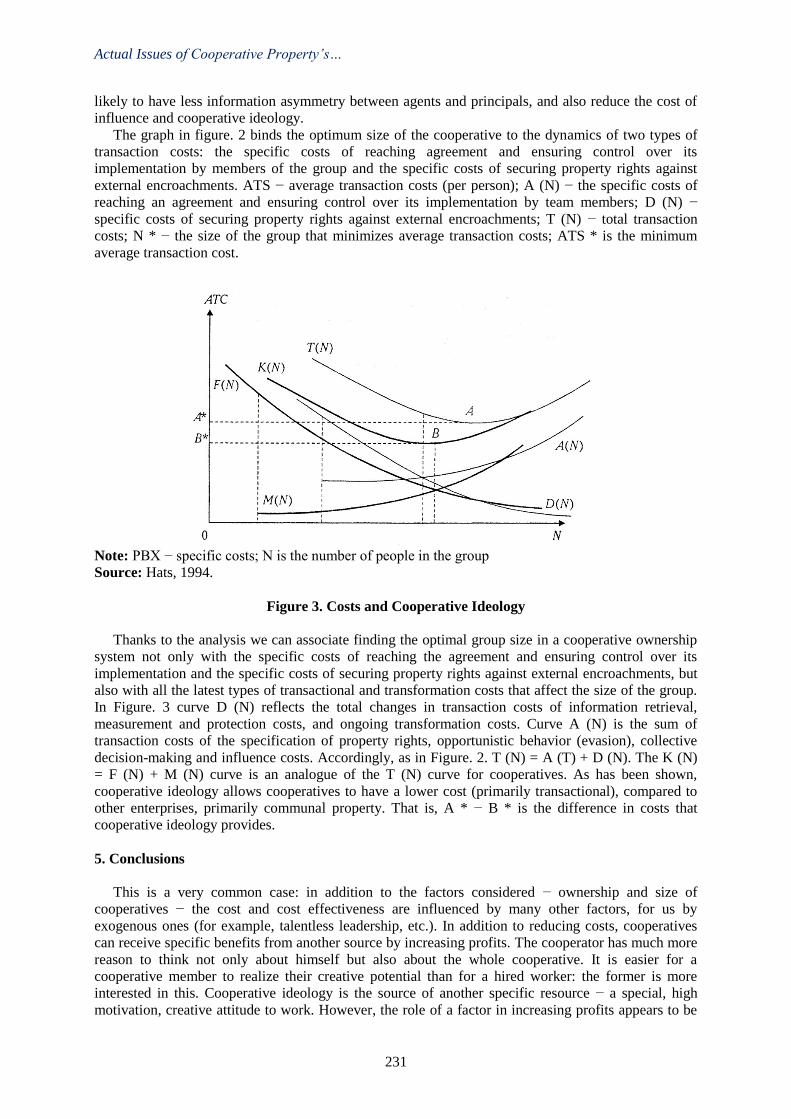
Actual Issues of Cooperative Property’s…
231
likely to have less information asymmetry between agents and principals, and also reduce the cost of
influence and cooperative ideology.
The graph in figure. 2 binds the optimum size of the cooperative to the dynamics of two types of
transaction costs: the specific costs of reaching agreement and ensuring control over its
implementation by members of the group and the specific costs of securing property rights against
external encroachments. ATS − average transaction costs (per person); A (N) − the specific costs of
reaching an agreement and ensuring control over its implementation by team members; D (N) −
specific costs of securing property rights against external encroachments; T (N) − total transaction
costs; N * − the size of the group that minimizes average transaction costs; ATS * is the minimum
average transaction cost.
Note: PBX − specific costs; N is the number of people in the group
Source: Hats, 1994.
Figure 3. Costs and Cooperative Ideology
Thanks to the analysis we can associate finding the optimal group size in a cooperative ownership
system not only with the specific costs of reaching the agreement and ensuring control over its
implementation and the specific costs of securing property rights against external encroachments, but
also with all the latest types of transactional and transformation costs that affect the size of the group.
In Figure. 3 curve D (N) reflects the total changes in transaction costs of information retrieval,
measurement and protection costs, and ongoing transformation costs. Curve A (N) is the sum of
transaction costs of the specification of property rights, opportunistic behavior (evasion), collective
decision-making and influence costs. Accordingly, as in Figure. 2. T (N) = A (T) + D (N). The K (N)
= F (N) + M (N) curve is an analogue of the T (N) curve for cooperatives. As has been shown,
cooperative ideology allows cooperatives to have a lower cost (primarily transactional), compared to
other enterprises, primarily communal property. That is, A * − B * is the difference in costs that
cooperative ideology provides.
5. Conclusions
This is a very common case: in addition to the factors considered − ownership and size of
cooperatives − the cost and cost effectiveness are influenced by many other factors, for us by
exogenous ones (for example, talentless leadership, etc.). In addition to reducing costs, cooperatives
can receive specific benefits from another source by increasing profits. The cooperator has much more
reason to think not only about himself but also about the whole cooperative. It is easier for a
cooperative member to realize their creative potential than for a hired worker: the former is more
interested in this. Cooperative ideology is the source of another specific resource − a special, high
motivation, creative attitude to work. However, the role of a factor in increasing profits appears to be
S. Andrii and U. Iuliia
232
much smaller compared to a reduction in costs. First, even a significant increase in motivation can
only in exceptional cases be advantageous in a particular struggle: in modern conditions, specific
resource number one is knowledge, information, and knowledge cannot be replaced by any
motivation. Secondly, it is more difficult for people who have some specific resources (the same
knowledge) to co-opt than for people who do not have the resources. Third, such an advantage may be
characteristic only of industrial cooperation.
References
Lyubava, D.S. (2001) Institutional Economics: Textbook. Allowance. At hand. Mоscow: INFRA-M,
274-318.
Kapelyushnikov, R. (1994) Transaction Cost Category. http://www.libertarium.ru/libertarium/L_Libsb
3_1-2.
Kuzmin, A.A. (1974) Petty bourgeois cooperative socialism. Mоscow, 97-208.
Dzub,I. (2000) North, Douglas Institutions, Institutional Change, and the Functioning of the Economy.
Trans. from English. Kiev: Fundamentals, 115-164.
Sobolev, K. (2010) The theory of cooperation. Mоscow, 61-205.
Tkach,A.A. (2007) Institutional Economics. A New Institutional Economic Theory Tutorial. Kiev:
Center for Educational Literature, 197-263.
Williamson, O.I. (1996) Economic institutions of capitalism. Leninisdate.
Shastitko, A.E.(1998) Neoinstitutional economic theory. Mоscow: TEIS.
3rd International Conference on Economic Research
24-25th October 2019, Alanya, Turkey
233
POLITICAL AWARENESS OF SUSTAINABLE DEVELOPMENT
IN UNIVERSITIES
Hasan Bilgehan Yavuz
Adana Alparslan Türkeş Science and Technology University, Adana, Turkey
Email: [email protected]
Abstract
The concept of Sustainable Development is a concept that requires a holistic understanding of
society, the environment and the economy. In order to implement the policy framework to be
established within this integrity, it must be integrated horizontally and vertically. In order to achieve
this integration, universities that train future leaders and decision-makers and who have social
responsibilities towards the society are key position.
Sustainable Development is discussed in three dimensions. Economic, social and environmental
dimension. In order to integrate the policies in these three dimensions, they must have three
characteristics. These characteristics; policies are consistent with each other, policies are formed in a
way to combine the three dimensions and the policies to be created to cover these three dimensions
together.
As the driving force of the society, universities have important duties to achieve the Millennium
Development Goals. Within this scope, universities can include sustainable development courses in
their undergraduate and graduate education, organize graduate programs, organize training programs
for internal and external stakeholders and develop collaborative projects.
Considering world-class practices, while developing complex political networks and developing
important studies on sustainable development in developed countries, it has been observed that a
policy framework has not yet been developed in less developed and developing countries. Again, it is
seen that not all of the sustainable development targets are handled with integrity and some specific
areas of interest, especially the environment, come to the forefront.
This study explores the awareness of the millennium development goals in the universities that are
accepted as the driving force of the society. In the literature review, it is seen that the millennium
development goals are mostly addressed in the environmental dimension and the subject is evaluated
for university students. However, the attitudes of the policy-making institutions are also important for
the implementation of the policies established. In order to demonstrate these attitudes, it is necessary
to measure the awareness of managers and academicians who form curricula in universities and are in
institutional decision-making positions.
As a result, it is important to develop policy awareness and achieve policy integration by
considering the issue of sustainable development in universities, not only in environmental sciences
but in all disciplines.
Keywords: Sustainable Development, Political Integration, Sustainable Development for Education,
Universities.
3rd International Conference on Economic Research
24-25th October 2019, Alanya, Turkey
234
ECONOMETRIC ANALYSIS OF GRAVITY MODEL: THE CASE OF TURKEY
AFRICAN COUNTRIES
İbrahim Çütcü
Hasan Kalyoncu University, Faculty of Economics, Administrative and Social Sciencies
Department of Economics, Gaziantep / Turkey, Email: [email protected]
Turgut Songur
Hasan Kalyoncu University, Faculty of Economics, Administrative and Social Sciencies
Department of Economics, Gaziantep / Turkey
Abstract
The countries on the African continent constitute an important part of the world foreign trade
volume.Today,size of the share of the continental countries in foreign trade shows the power to
increase its share in foreign trade in coming years.Therefore,Turkey's foreign trade with the African
continent countries,will become even more important in coming years.
In this study, determinants of trade potential between selected African countries and Turkey were
analyzed by Gravity Model.The analyzes were estimated by panel data method using annual data
between 1989-2017.The factors affecting Turkey's and African countries foreign trade were
determined and reviewed.Main hypothesis of the study was “Between Turkey and selected African
countries the Gravity Model is eligible”.
In the analysis,the model was established with the data of foreign trade volume,population
densities,distance between countries and growth rate,and cointegration and causality relationships
between variables were tried to be determined. In addition Augmented Dickey-Fuller(CADF) unit root
test was applied to determine whether the series contain unit root or not.Since the variables were
stationary at the level values, the relationship between medium and long term cointegration was not
examined.The Dumitrescu-Hurlin causality test was used to test the causality relationships between
variables.A one-way causality relationship was determined from foreign trade volume to growth
rate.When the estimation results are analyzed,it is seen that the population variable has a positive
effect on foreign trade.As the coefficients of the growth rate and distance variables were statistically
insignificant,it was concluded that the direction of their effects on foreign trade could not be
interpreted.
Key Words: Gravity Model, Africa, Foreign Trade, Population, Growth
ÇEKİM MODELİNİN EKONOMETRİK ANALİZİ: TÜRKİYE-AFRİKA
ÜLKELERİ ÖRNEĞİ
Özet
Afrika Kıtasında yer alan ülkeler, dünya dış ticaret hacminin önemli bir kısmını oluşturmaktadır.
Günümüzde kıta ülkelerinin dış ticaretten aldığı payın büyüklüğü, gelecek yıllarda da dış ticarette
sahip olacağı payını arttırma gücünü göstermektedir. Bu nedenle, Türkiye’nin Afrika Kıtası ülkeleri ile
yaptığı dış ticaret, gelecek yıllarda daha da önem kazanacaktır.
Çalışmada analizler, 1989-2017 dönemini kapsayan yıllık veriler kullanılarak panel veri yöntemi
ile tahmin edilmiştir. Türkiye ile seçili Afrika ülkeleri dış ticaretini etkileyen faktörler belirlenerek
yorumlanmış ve çalışmanın temel hipotezi “Türkiye ile seçili Afrika ülkeleri arasında Çekim Modeli
geçerlidir” şeklinde oluşturulmuştur.
Analizlerde dış ticaret hacmi, nüfus yoğunlukları, mesafe ve büyüme oranı verileri ile model
kurulmuş ve değişkenler arasındaki eşbütünleşme ve nedensellik ilişkileri tespit edilmeye çalışılmıştır.
Analizlerde öncelikli olarak serilerin birim kök tespiti için durağanlık testlerinden Augmented Dickey-
Çekim Modelinin Türkiye-Afrika Ülkeleri…
235
Fuller (CADF) birim kök testi uygulanmıştır. Değişkenler düzey değerlerinde durağan olduğu için orta
ve uzun dönemli eşbütünleşme ilişkisine bakılmamıştır. Değişkenler arasındaki nedensellik ilişkileri
için Demitrescu-Hurlin nedensellik testinden faydalanılmıştır.
Anahtar Kelimeler: Çekim Modeli, Afrika, Dış Ticaret, Nüfus, Büyüme
1. Giriş
Dünya genelinde olduğu gibi 1980’li yıllar küresel ticaretin ve ihracatçı büyüme politikalarının en
yoğun yaşandığı yıllar olarak bilinmektedir. Türkiye öznelinde düşünüldüğünde ithal ikameci
politikalardan daha liberal ve piyasa odaklı bir modele geçilmesi ekonomi tarihinde önemi bir odak
noktası oluşturmuştur. Ekonomide ana hedef, net ihracatı arttırarak ekonomik büyüme olarak
belirlenmiştir. Bu dönem, ekonomi ve dış politikada ilişkilerin artırılması anlayışını da doğurmuştur.
İlişkilerin artırılması, Türkiye ekonomisinin dışarıya açılma sürecini hızlandırmıştır. Bu durum ise,
Türkiye’yi yeni pazar arayışına veya pazar çeşitlendirmesine yönlendirmiştir.
Küresel rekabetin yarattığı yeni bir olgu Pazar çeşitlendirmesidir. Bu kapsamda 1980’li yıllardan
sonra gelişen ihracatçı büyüme stratejileri Türkiye’yi yeni pazar arayışlarına yöneltmiştir. Çalışmanın
da örneklemini oluşturan Afrika pazarı bu anlamda oldukça önem arz etmekte olup Türkiye-Afrika
ilişkilerinin 1999 yılına kadar ihmal edildiği fakat 2002 yılından sonra ilişkiler, iktisadi ve siyasi
anlamda daha ciddi bir hal almıştır.
Türkiye’nin seçili Afrika ülkeleri ile olan dış ticaret hacminde, 1989 yılından 2017 yılına
gelindiğinde ciddi artışların meydana geldiği görülmektedir. Bu durum, Afrika bölgesinin Türkiye için
ticaret yapılabilir bir potansiyele sahip olduğunu göstermektedir. Bu süreçte, Türkiye dış ticaretinde
köklü değişimler söz konusu olmamış olup, sadece farklılaşan ve oransal değişimlerin olduğu
görülmüştür. Bu çalışmada, Türkiye ile seçili Afrika ülkeleri arasındaki dış ticaretin artmasında önemli
olan nedenler, çekim modeli yardımıyla açıklanmaya çalışılacaktır. Yöntem olarak panel veri
analizinin kullandığı çalışmada Çekim Modelinin Türkiye-Afrika ülkeleri arasında geçerli olduğu
hipotezi ekonometrik modeller ile test edilmektedir. Çalışmada öncelikle Türkiye-Afrika ilişkileri ile
Çekim Modeli teorik ve kavramsal çerçevede incelenmekte olup literatür araştırmasının ardından
ekonometrik analizler ile kurulan hipotez test edilecektir. Analizlerden elde edilen bulgular sonrası
politika önermeleri ile çalışma sonlandırılmaktadır.
2. Teorik ve Kavramsal Çerçeve
Dış ticaret, ülkeler açısından ekonomik ve politik anlamda önemli bir yere sahiptir. Ticari olarak
ekonomisini sağlam temellere oturtan ülkeler, politik anlamda da varlıklarını sağlam temellere
dayandırdığı söylenebilmektedir (Gülen, 2014: 5). Ülkelerin bazıları kendilerine yetebilecek
üretimleri, gelişmişlik düzeyleri ve üretim teknolojilerinin farklılıkları nedeniyle
gerçekleştirememektedir. Gelişmekte olan birçok ülke, yeterli düzeyde sermaye ve teknolojik bilgi
birikimine sahip olmadıklarından, üretemedikleri malları ithal etmektedirler. Gelişmiş ülkeler ise,
hammadde ihtiyacını gelişmekte olan ülkelerden karşılamaktadırlar. Belli bir alanda uzmanlaşan
ülkeler, kaliteli mallar üretirken fiyat avantajını da elinde bulundurmaktadır. Kalite bakımından düşük
ve fiyat bakımından yüksek mallar üreten ülkeler, bir alanda uzmanlaşan ülkelerin daha kaliteli ve
ucuz mallarını ithal ederek dış ticareti gerçekleştirmektedir (Grossman ve Helpman, 1990: 42).
Türkiye’nin dış ticaretinin genel bir değerlendirmesi yapıldığında; korumacı ve müdahaleci Dış
Ticaret Politikalarının uzun bir zaman benimsendiği ve temel ekonomik politikalarının ise, kendi
kendine yeterli olabilecek bir ekonomik yapı hedeflediği görülmektedir. Ayrıca dış ticaret dengesinin
ithalattaki değişimlere göre belirlenmekte olduğu görülmektedir. Bunun sebeplerine bakıldığında
genel olarak ithalatın parasal olarak ihracatın parasal değerinden yaklaşık olarak iki katı olduğudur.
Devalüasyon dönemleri haricinde ihracatta ciddi artışların olmaması, ithalattaki değişim oranlarının
ihracatın değişim oranlarına göre yüksek olması, ihracatın ithalatı karşılama oranındaki ciddi bir
artışın olmaması, dış ticaret açığının artma eğiliminde olduğunu göstermektedir (Aksoy ve Çoşkun,
2014: 398).
Türkiye'nin 1989-2017 yılları arasındaki dış ticaret değerlerini Tablo 1’de İhracat, İthalat, Dış
Ticaret Hacmi ve Dış Ticaret Dengesi dönem ortalama değerleri ABD doları cinsinden verilmiştir. Söz
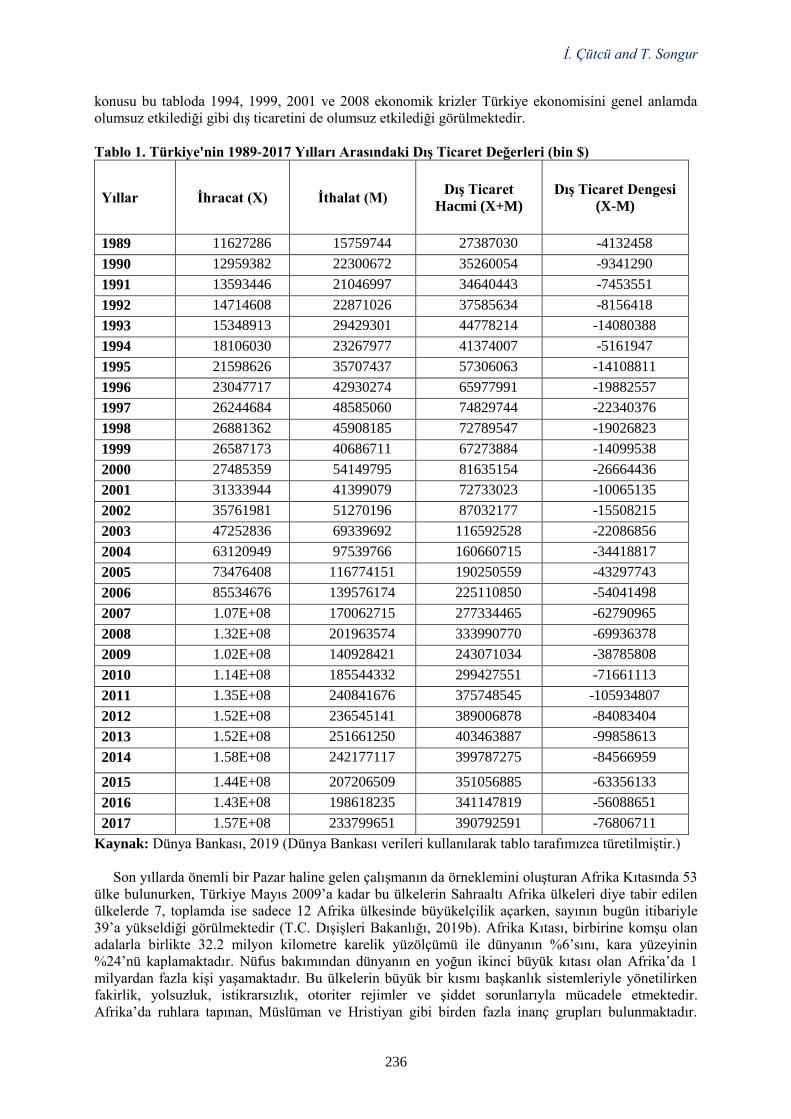
İ. Çütcü and T. Songur
236
konusu bu tabloda 1994, 1999, 2001 ve 2008 ekonomik krizler Türkiye ekonomisini genel anlamda
olumsuz etkilediği gibi dış ticaretini de olumsuz etkilediği görülmektedir.
Tablo 1. Türkiye'nin 1989-2017 Yılları Arasındaki Dış Ticaret Değerleri (bin $)
Yıllar İhracat (X) İthalat (M) Dış Ticaret
Hacmi (X+M)
Dış Ticaret Dengesi
(X-M)
1989 11627286 15759744 27387030 -4132458
1990 12959382 22300672 35260054 -9341290
1991 13593446 21046997 34640443 -7453551
1992 14714608 22871026 37585634 -8156418
1993 15348913 29429301 44778214 -14080388
1994 18106030 23267977 41374007 -5161947
1995 21598626 35707437 57306063 -14108811
1996 23047717 42930274 65977991 -19882557
1997 26244684 48585060 74829744 -22340376
1998 26881362 45908185 72789547 -19026823
1999 26587173 40686711 67273884 -14099538
2000 27485359 54149795 81635154 -26664436
2001 31333944 41399079 72733023 -10065135
2002 35761981 51270196 87032177 -15508215
2003 47252836 69339692 116592528 -22086856
2004 63120949 97539766 160660715 -34418817
2005 73476408 116774151 190250559 -43297743
2006 85534676 139576174 225110850 -54041498
2007 1.07E+08 170062715 277334465 -62790965
2008 1.32E+08 201963574 333990770 -69936378
2009 1.02E+08 140928421 243071034 -38785808
2010 1.14E+08 185544332 299427551 -71661113
2011 1.35E+08 240841676 375748545 -105934807
2012 1.52E+08 236545141 389006878 -84083404
2013 1.52E+08 251661250 403463887 -99858613
2014 1.58E+08 242177117 399787275 -84566959
2015 1.44E+08 207206509 351056885 -63356133
2016 1.43E+08 198618235 341147819 -56088651
2017 1.57E+08 233799651 390792591 -76806711
Kaynak: Dünya Bankası, 2019 (Dünya Bankası verileri kullanılarak tablo tarafımızca türetilmiştir.)
Son yıllarda önemli bir Pazar haline gelen çalışmanın da örneklemini oluşturan Afrika Kıtasında 53
ülke bulunurken, Türkiye Mayıs 2009’a kadar bu ülkelerin Sahraaltı Afrika ülkeleri diye tabir edilen
ülkelerde 7, toplamda ise sadece 12 Afrika ülkesinde büyükelçilik açarken, sayının bugün itibariyle
39’a yükseldiği görülmektedir (T.C. Dışişleri Bakanlığı, 2019b). Afrika Kıtası, birbirine komşu olan
adalarla birlikte 32.2 milyon kilometre karelik yüzölçümü ile dünyanın %6’sını, kara yüzeyinin
%24’nü kaplamaktadır. Nüfus bakımından dünyanın en yoğun ikinci büyük kıtası olan Afrika’da 1
milyardan fazla kişi yaşamaktadır. Bu ülkelerin büyük bir kısmı başkanlık sistemleriyle yönetilirken
fakirlik, yolsuzluk, istikrarsızlık, otoriter rejimler ve şiddet sorunlarıyla mücadele etmektedir.
Afrika’da ruhlara tapınan, Müslüman ve Hristiyan gibi birden fazla inanç grupları bulunmaktadır.
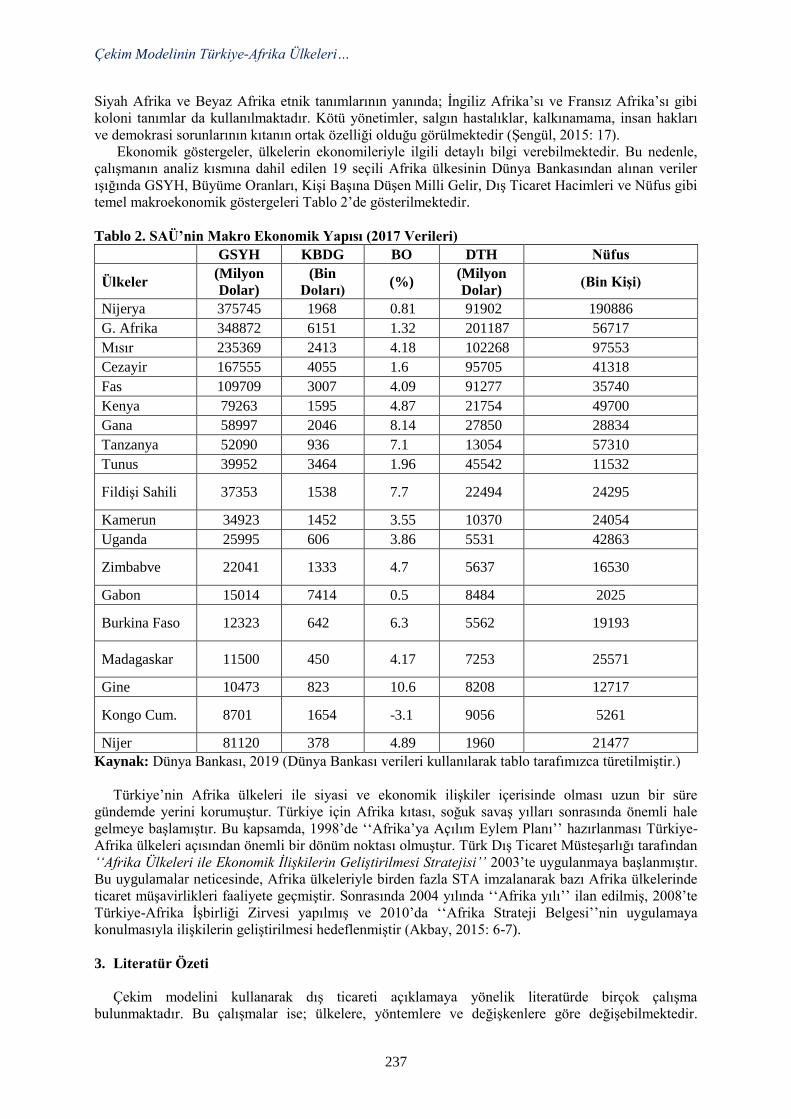
Çekim Modelinin Türkiye-Afrika Ülkeleri…
237
Siyah Afrika ve Beyaz Afrika etnik tanımlarının yanında; İngiliz Afrika’sı ve Fransız Afrika’sı gibi
koloni tanımlar da kullanılmaktadır. Kötü yönetimler, salgın hastalıklar, kalkınamama, insan hakları
ve demokrasi sorunlarının kıtanın ortak özelliği olduğu görülmektedir (Şengül, 2015: 17).
Ekonomik göstergeler, ülkelerin ekonomileriyle ilgili detaylı bilgi verebilmektedir. Bu nedenle,
çalışmanın analiz kısmına dahil edilen 19 seçili Afrika ülkesinin Dünya Bankasından alınan veriler
ışığında GSYH, Büyüme Oranları, Kişi Başına Düşen Milli Gelir, Dış Ticaret Hacimleri ve Nüfus gibi
temel makroekonomik göstergeleri Tablo 2’de gösterilmektedir.
Tablo 2. SAÜ’nin Makro Ekonomik Yapısı (2017 Verileri)
GSYH KBDG BO DTH Nüfus
Ülkeler (Milyon
Dolar)
(Bin
Doları) (%)
(Milyon
Dolar) (Bin Kişi)
Nijerya 375745 1968 0.81 91902 190886
G. Afrika 348872 6151 1.32 201187 56717
Mısır 235369 2413 4.18 102268 97553
Cezayir 167555 4055 1.6 95705 41318
Fas 109709 3007 4.09 91277 35740
Kenya 79263 1595 4.87 21754 49700
Gana 58997 2046 8.14 27850 28834
Tanzanya 52090 936 7.1 13054 57310
Tunus 39952 3464 1.96 45542 11532
Fildişi Sahili 37353 1538 7.7 22494 24295
Kamerun 34923 1452 3.55 10370 24054
Uganda 25995 606 3.86 5531 42863
Zimbabve 22041 1333 4.7 5637 16530
Gabon 15014 7414 0.5 8484 2025
Burkina Faso 12323 642 6.3 5562 19193
Madagaskar 11500 450 4.17 7253 25571
Gine 10473 823 10.6 8208 12717
Kongo Cum. 8701 1654 -3.1 9056 5261
Nijer 81120 378 4.89 1960 21477
Kaynak: Dünya Bankası, 2019 (Dünya Bankası verileri kullanılarak tablo tarafımızca türetilmiştir.)
Türkiye’nin Afrika ülkeleri ile siyasi ve ekonomik ilişkiler içerisinde olması uzun bir süre
gündemde yerini korumuştur. Türkiye için Afrika kıtası, soğuk savaş yılları sonrasında önemli hale
gelmeye başlamıştır. Bu kapsamda, 1998’de ‘‘Afrika’ya Açılım Eylem Planı’’ hazırlanması Türkiye-
Afrika ülkeleri açısından önemli bir dönüm noktası olmuştur. Türk Dış Ticaret Müsteşarlığı tarafından
‘‘Afrika Ülkeleri ile Ekonomik İlişkilerin Geliştirilmesi Stratejisi’’ 2003’te uygulanmaya başlanmıştır.
Bu uygulamalar neticesinde, Afrika ülkeleriyle birden fazla STA imzalanarak bazı Afrika ülkelerinde
ticaret müşavirlikleri faaliyete geçmiştir. Sonrasında 2004 yılında ‘‘Afrika yılı’’ ilan edilmiş, 2008’te
Türkiye-Afrika İşbirliği Zirvesi yapılmış ve 2010’da ‘‘Afrika Strateji Belgesi’’nin uygulamaya
konulmasıyla ilişkilerin geliştirilmesi hedeflenmiştir (Akbay, 2015: 6-7).
3. Literatür Özeti
Çekim modelini kullanarak dış ticareti açıklamaya yönelik literatürde birçok çalışma
bulunmaktadır. Bu çalışmalar ise; ülkelere, yöntemlere ve değişkenlere göre değişebilmektedir.
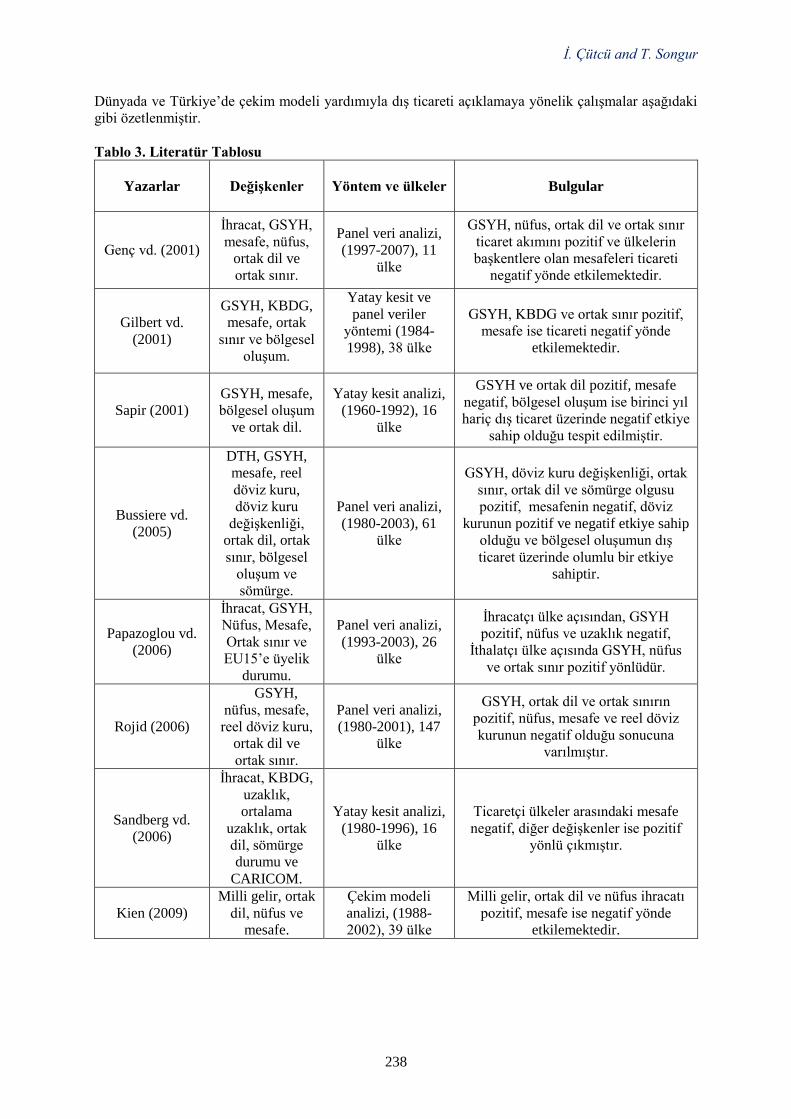
İ. Çütcü and T. Songur
238
Dünyada ve Türkiye’de çekim modeli yardımıyla dış ticareti açıklamaya yönelik çalışmalar aşağıdaki
gibi özetlenmiştir.
Tablo 3. Literatür Tablosu
Yazarlar
Değişkenler Yöntem ve ülkeler
Bulgular
Genç vd. (2001)
İhracat, GSYH,
mesafe, nüfus,
ortak dil ve
ortak sınır.
Panel veri analizi,
(1997-2007), 11
ülke
GSYH, nüfus, ortak dil ve ortak sınır
ticaret akımını pozitif ve ülkelerin
başkentlere olan mesafeleri ticareti
negatif yönde etkilemektedir.
Gilbert vd.
(2001)
GSYH, KBDG,
mesafe, ortak
sınır ve bölgesel
oluşum.
Yatay kesit ve
panel veriler
yöntemi (1984-
1998), 38 ülke
GSYH, KBDG ve ortak sınır pozitif,
mesafe ise ticareti negatif yönde
etkilemektedir.
Sapir (2001)
GSYH, mesafe,
bölgesel oluşum
ve ortak dil.
Yatay kesit analizi,
(1960-1992), 16
ülke
GSYH ve ortak dil pozitif, mesafe
negatif, bölgesel oluşum ise birinci yıl
hariç dış ticaret üzerinde negatif etkiye
sahip olduğu tespit edilmiştir.
Bussiere vd.
(2005)
DTH, GSYH,
mesafe, reel
döviz kuru,
döviz kuru
değişkenliği,
ortak dil, ortak
sınır, bölgesel
oluşum ve
sömürge.
Panel veri analizi,
(1980-2003), 61
ülke
GSYH, döviz kuru değişkenliği, ortak
sınır, ortak dil ve sömürge olgusu
pozitif, mesafenin negatif, döviz
kurunun pozitif ve negatif etkiye sahip
olduğu ve bölgesel oluşumun dış
ticaret üzerinde olumlu bir etkiye
sahiptir.
Papazoglou vd.
(2006)
İhracat, GSYH,
Nüfus, Mesafe,
Ortak sınır ve
EU15’e üyelik
durumu.
Panel veri analizi,
(1993-2003), 26
ülke
İhracatçı ülke açısından, GSYH
pozitif, nüfus ve uzaklık negatif,
İthalatçı ülke açısında GSYH, nüfus
ve ortak sınır pozitif yönlüdür.
Rojid (2006)
GSYH,
nüfus, mesafe,
reel döviz kuru,
ortak dil ve
ortak sınır.
Panel veri analizi,
(1980-2001), 147
ülke
GSYH, ortak dil ve ortak sınırın
pozitif, nüfus, mesafe ve reel döviz
kurunun negatif olduğu sonucuna
varılmıştır.
Sandberg vd.
(2006)
İhracat, KBDG,
uzaklık,
ortalama
uzaklık, ortak
dil, sömürge
durumu ve
CARICOM.
Yatay kesit analizi,
(1980-1996), 16
ülke
Ticaretçi ülkeler arasındaki mesafe
negatif, diğer değişkenler ise pozitif
yönlü çıkmıştır.
Kien (2009)
Milli gelir, ortak
dil, nüfus ve
mesafe.
Çekim modeli
analizi, (1988-
2002), 39 ülke
Milli gelir, ortak dil ve nüfus ihracatı
pozitif, mesafe ise negatif yönde
etkilemektedir.
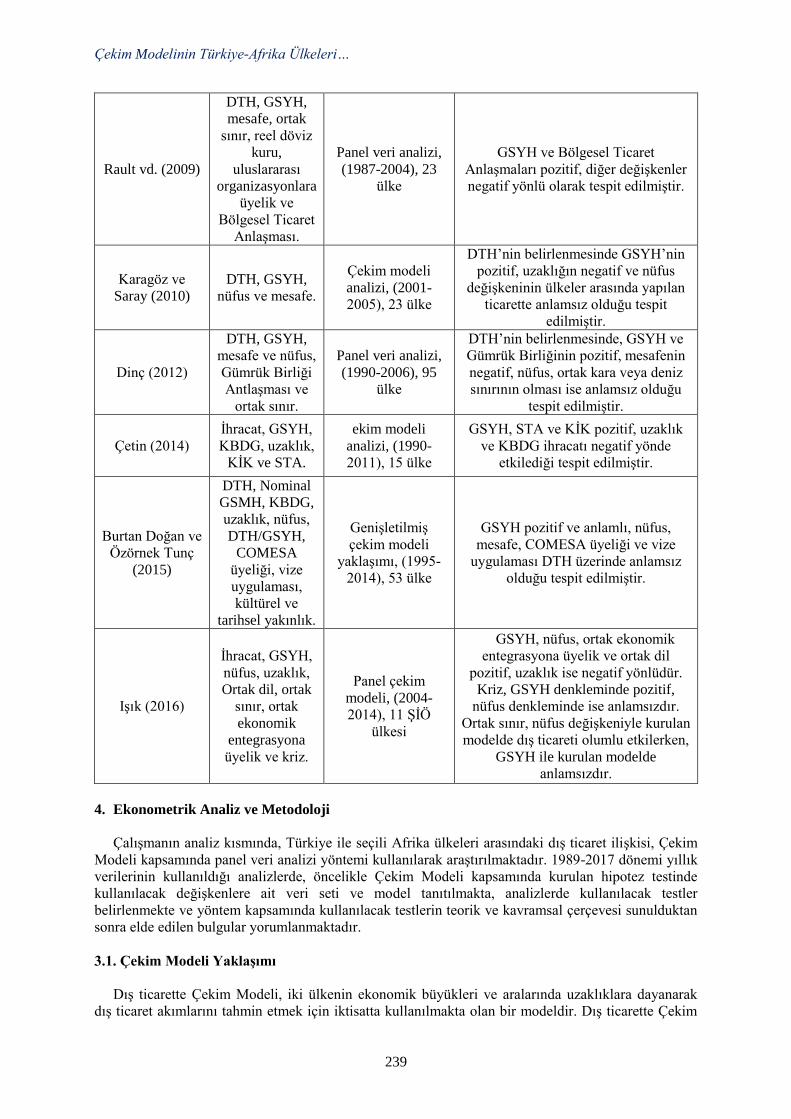
Çekim Modelinin Türkiye-Afrika Ülkeleri…
239
Rault vd. (2009)
DTH, GSYH,
mesafe, ortak
sınır, reel döviz
kuru,
uluslararası
organizasyonlara
üyelik ve
Bölgesel Ticaret
Anlaşması.
Panel veri analizi,
(1987-2004), 23
ülke
GSYH ve Bölgesel Ticaret
Anlaşmaları pozitif, diğer değişkenler
negatif yönlü olarak tespit edilmiştir.
Karagöz ve
Saray (2010)
DTH, GSYH,
nüfus ve mesafe.
Çekim modeli
analizi, (2001-
2005), 23 ülke
DTH’nin belirlenmesinde GSYH’nin
pozitif, uzaklığın negatif ve nüfus
değişkeninin ülkeler arasında yapılan
ticarette anlamsız olduğu tespit
edilmiştir.
Dinç (2012)
DTH, GSYH,
mesafe ve nüfus,
Gümrük Birliği
Antlaşması ve
ortak sınır.
Panel veri analizi,
(1990-2006), 95
ülke
DTH’nin belirlenmesinde, GSYH ve
Gümrük Birliğinin pozitif, mesafenin
negatif, nüfus, ortak kara veya deniz
sınırının olması ise anlamsız olduğu
tespit edilmiştir.
Çetin (2014)
İhracat, GSYH,
KBDG, uzaklık,
KİK ve STA.
ekim modeli
analizi, (1990-
2011), 15 ülke
GSYH, STA ve KİK pozitif, uzaklık
ve KBDG ihracatı negatif yönde
etkilediği tespit edilmiştir.
Burtan Doğan ve
Özörnek Tunç
(2015)
DTH, Nominal
GSMH, KBDG,
uzaklık, nüfus,
DTH/GSYH,
COMESA
üyeliği, vize
uygulaması,
kültürel ve
tarihsel yakınlık.
Genişletilmiş
çekim modeli
yaklaşımı, (1995-
2014), 53 ülke
GSYH pozitif ve anlamlı, nüfus,
mesafe, COMESA üyeliği ve vize
uygulaması DTH üzerinde anlamsız
olduğu tespit edilmiştir.
Işık (2016)
İhracat, GSYH,
nüfus, uzaklık,
Ortak dil, ortak
sınır, ortak
ekonomik
entegrasyona
üyelik ve kriz.
Panel çekim
modeli, (2004-
2014), 11 ŞİÖ
ülkesi
GSYH, nüfus, ortak ekonomik
entegrasyona üyelik ve ortak dil
pozitif, uzaklık ise negatif yönlüdür.
Kriz, GSYH denkleminde pozitif,
nüfus denkleminde ise anlamsızdır.
Ortak sınır, nüfus değişkeniyle kurulan
modelde dış ticareti olumlu etkilerken,
GSYH ile kurulan modelde
anlamsızdır.
4. Ekonometrik Analiz ve Metodoloji
Çalışmanın analiz kısmında, Türkiye ile seçili Afrika ülkeleri arasındaki dış ticaret ilişkisi, Çekim
Modeli kapsamında panel veri analizi yöntemi kullanılarak araştırılmaktadır. 1989-2017 dönemi yıllık
verilerinin kullanıldığı analizlerde, öncelikle Çekim Modeli kapsamında kurulan hipotez testinde
kullanılacak değişkenlere ait veri seti ve model tanıtılmakta, analizlerde kullanılacak testler
belirlenmekte ve yöntem kapsamında kullanılacak testlerin teorik ve kavramsal çerçevesi sunulduktan
sonra elde edilen bulgular yorumlanmaktadır.
3.1. Çekim Modeli Yaklaşımı
Dış ticarette Çekim Modeli, iki ülkenin ekonomik büyükleri ve aralarında uzaklıklara dayanarak
dış ticaret akımlarını tahmin etmek için iktisatta kullanılmakta olan bir modeldir. Dış ticarette Çekim
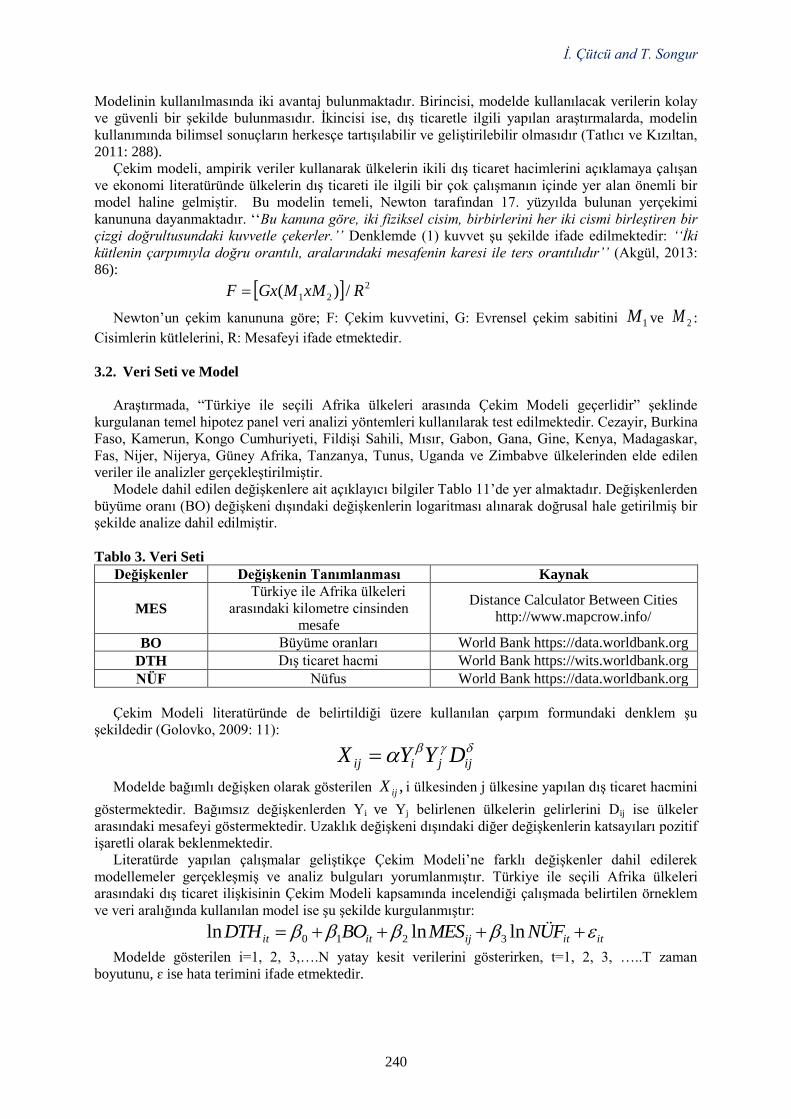
İ. Çütcü and T. Songur
240
Modelinin kullanılmasında iki avantaj bulunmaktadır. Birincisi, modelde kullanılacak verilerin kolay
ve güvenli bir şekilde bulunmasıdır. İkincisi ise, dış ticaretle ilgili yapılan araştırmalarda, modelin
kullanımında bilimsel sonuçların herkesçe tartışılabilir ve geliştirilebilir olmasıdır (Tatlıcı ve Kızıltan,
2011: 288).
Çekim modeli, ampirik veriler kullanarak ülkelerin ikili dış ticaret hacimlerini açıklamaya çalışan
ve ekonomi literatüründe ülkelerin dış ticareti ile ilgili bir çok çalışmanın içinde yer alan önemli bir
model haline gelmiştir. Bu modelin temeli, Newton tarafından 17. yüzyılda bulunan yerçekimi
kanununa dayanmaktadır. ‘‘Bu kanuna göre, iki fiziksel cisim, birbirlerini her iki cismi birleştiren bir
çizgi doğrultusundaki kuvvetle çekerler.’’ Denklemde (1) kuvvet şu şekilde ifade edilmektedir: ‘‘İki
kütlenin çarpımıyla doğru orantılı, aralarındaki mesafenin karesi ile ters orantılıdır’’ (Akgül, 2013:
86):
2
21 /)( RxMMGxF
Newton’un çekim kanununa göre; F: Çekim kuvvetini, G: Evrensel çekim sabitini 1M ve 2M :
Cisimlerin kütlelerini, R: Mesafeyi ifade etmektedir.
3.2. Veri Seti ve Model
Araştırmada, “Türkiye ile seçili Afrika ülkeleri arasında Çekim Modeli geçerlidir” şeklinde
kurgulanan temel hipotez panel veri analizi yöntemleri kullanılarak test edilmektedir. Cezayir, Burkina
Faso, Kamerun, Kongo Cumhuriyeti, Fildişi Sahili, Mısır, Gabon, Gana, Gine, Kenya, Madagaskar,
Fas, Nijer, Nijerya, Güney Afrika, Tanzanya, Tunus, Uganda ve Zimbabve ülkelerinden elde edilen
veriler ile analizler gerçekleştirilmiştir.
Modele dahil edilen değişkenlere ait açıklayıcı bilgiler Tablo 11’de yer almaktadır. Değişkenlerden
büyüme oranı (BO) değişkeni dışındaki değişkenlerin logaritması alınarak doğrusal hale getirilmiş bir
şekilde analize dahil edilmiştir.
Tablo 3. Veri Seti
Değişkenler Değişkenin Tanımlanması Kaynak
MES
Türkiye ile Afrika ülkeleri
arasındaki kilometre cinsinden
mesafe
Distance Calculator Between Cities
http://www.mapcrow.info/
BO Büyüme oranları World Bank https://data.worldbank.org
DTH Dış ticaret hacmi World Bank https://wits.worldbank.org
NÜF Nüfus World Bank https://data.worldbank.org
Çekim Modeli literatüründe de belirtildiği üzere kullanılan çarpım formundaki denklem şu
şekildedir (Golovko, 2009: 11):
ijjiij DYYX
Modelde bağımlı değişken olarak gösterilen ,ijX i ülkesinden j ülkesine yapılan dış ticaret hacmini
göstermektedir. Bağımsız değişkenlerden Yi ve Yj belirlenen ülkelerin gelirlerini Dij ise ülkeler
arasındaki mesafeyi göstermektedir. Uzaklık değişkeni dışındaki diğer değişkenlerin katsayıları pozitif
işaretli olarak beklenmektedir.
Literatürde yapılan çalışmalar geliştikçe Çekim Modeli’ne farklı değişkenler dahil edilerek
modellemeler gerçekleşmiş ve analiz bulguları yorumlanmıştır. Türkiye ile seçili Afrika ülkeleri
arasındaki dış ticaret ilişkisinin Çekim Modeli kapsamında incelendiği çalışmada belirtilen örneklem
ve veri aralığında kullanılan model ise şu şekilde kurgulanmıştır:
ititijitit NÜFMESBODTH lnlnln 3210
Modelde gösterilen i=1, 2, 3,….N yatay kesit verilerini gösterirken, t=1, 2, 3, …..T zaman
boyutunu, ɛ ise hata terimini ifade etmektedir.
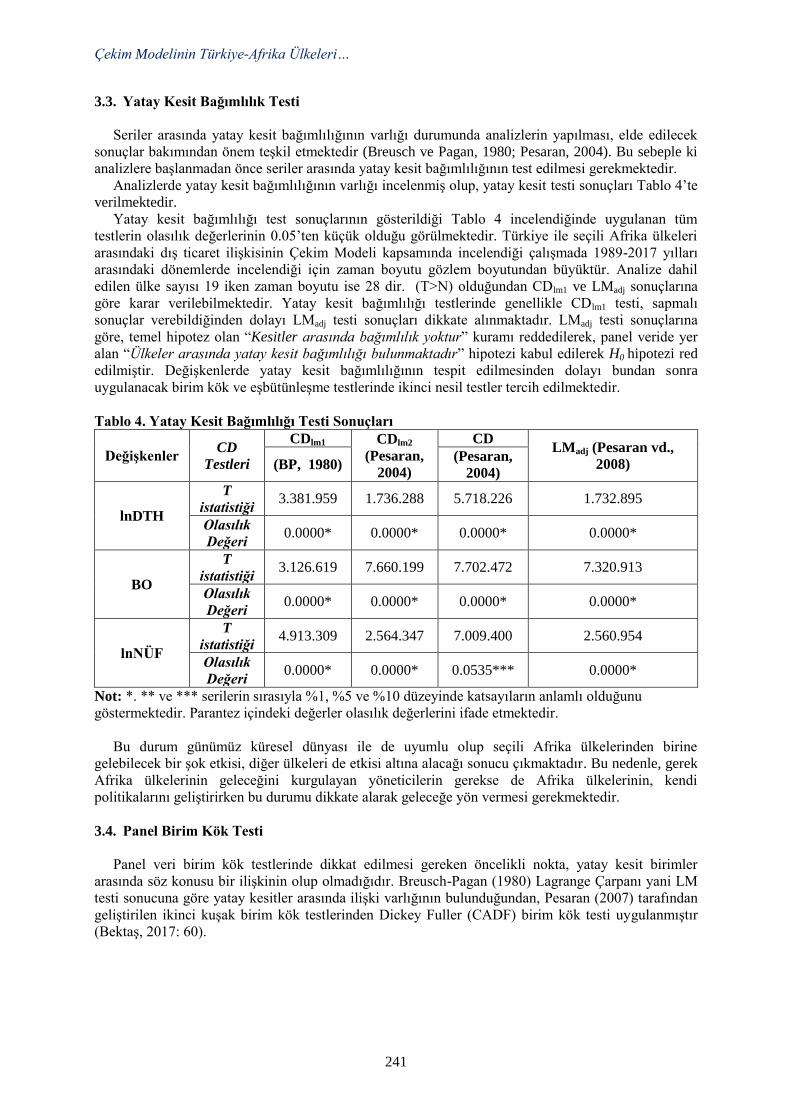
Çekim Modelinin Türkiye-Afrika Ülkeleri…
241
3.3. Yatay Kesit Bağımlılık Testi
Seriler arasında yatay kesit bağımlılığının varlığı durumunda analizlerin yapılması, elde edilecek
sonuçlar bakımından önem teşkil etmektedir (Breusch ve Pagan, 1980; Pesaran, 2004). Bu sebeple ki
analizlere başlanmadan önce seriler arasında yatay kesit bağımlılığının test edilmesi gerekmektedir.
Analizlerde yatay kesit bağımlılığının varlığı incelenmiş olup, yatay kesit testi sonuçları Tablo 4’te
verilmektedir.
Yatay kesit bağımlılığı test sonuçlarının gösterildiği Tablo 4 incelendiğinde uygulanan tüm
testlerin olasılık değerlerinin 0.05’ten küçük olduğu görülmektedir. Türkiye ile seçili Afrika ülkeleri
arasındaki dış ticaret ilişkisinin Çekim Modeli kapsamında incelendiği çalışmada 1989-2017 yılları
arasındaki dönemlerde incelendiği için zaman boyutu gözlem boyutundan büyüktür. Analize dahil
edilen ülke sayısı 19 iken zaman boyutu ise 28 dir. (T>N) olduğundan CDlm1 ve LMadj sonuçlarına
göre karar verilebilmektedir. Yatay kesit bağımlılığı testlerinde genellikle CDlm1 testi, sapmalı
sonuçlar verebildiğinden dolayı LMadj testi sonuçları dikkate alınmaktadır. LMadj testi sonuçlarına
göre, temel hipotez olan “Kesitler arasında bağımlılık yoktur” kuramı reddedilerek, panel veride yer
alan “Ülkeler arasında yatay kesit bağımlılığı bulunmaktadır” hipotezi kabul edilerek H0 hipotezi red
edilmiştir. Değişkenlerde yatay kesit bağımlılığının tespit edilmesinden dolayı bundan sonra
uygulanacak birim kök ve eşbütünleşme testlerinde ikinci nesil testler tercih edilmektedir.
Tablo 4. Yatay Kesit Bağımlılığı Testi Sonuçları
Değişkenler CD
Testleri
CDlm1 CDlm2
(Pesaran,
2004)
CD LMadj (Pesaran vd.,
2008) (BP, 1980) (Pesaran,
2004)
lnDTH
T
istatistiği 3.381.959 1.736.288 5.718.226 1.732.895
Olasılık
Değeri 0.0000* 0.0000* 0.0000* 0.0000*
BO
T
istatistiği 3.126.619 7.660.199 7.702.472 7.320.913
Olasılık
Değeri 0.0000* 0.0000* 0.0000* 0.0000*
lnNÜF
T
istatistiği 4.913.309 2.564.347 7.009.400 2.560.954
Olasılık
Değeri 0.0000* 0.0000* 0.0535*** 0.0000*
Not: *. ** ve *** serilerin sırasıyla %1, %5 ve %10 düzeyinde katsayıların anlamlı olduğunu
göstermektedir. Parantez içindeki değerler olasılık değerlerini ifade etmektedir.
Bu durum günümüz küresel dünyası ile de uyumlu olup seçili Afrika ülkelerinden birine
gelebilecek bir şok etkisi, diğer ülkeleri de etkisi altına alacağı sonucu çıkmaktadır. Bu nedenle, gerek
Afrika ülkelerinin geleceğini kurgulayan yöneticilerin gerekse de Afrika ülkelerinin, kendi
politikalarını geliştirirken bu durumu dikkate alarak geleceğe yön vermesi gerekmektedir.
3.4. Panel Birim Kök Testi
Panel veri birim kök testlerinde dikkat edilmesi gereken öncelikli nokta, yatay kesit birimler
arasında söz konusu bir ilişkinin olup olmadığıdır. Breusch-Pagan (1980) Lagrange Çarpanı yani LM
testi sonucuna göre yatay kesitler arasında ilişki varlığının bulunduğundan, Pesaran (2007) tarafından
geliştirilen ikinci kuşak birim kök testlerinden Dickey Fuller (CADF) birim kök testi uygulanmıştır
(Bektaş, 2017: 60).
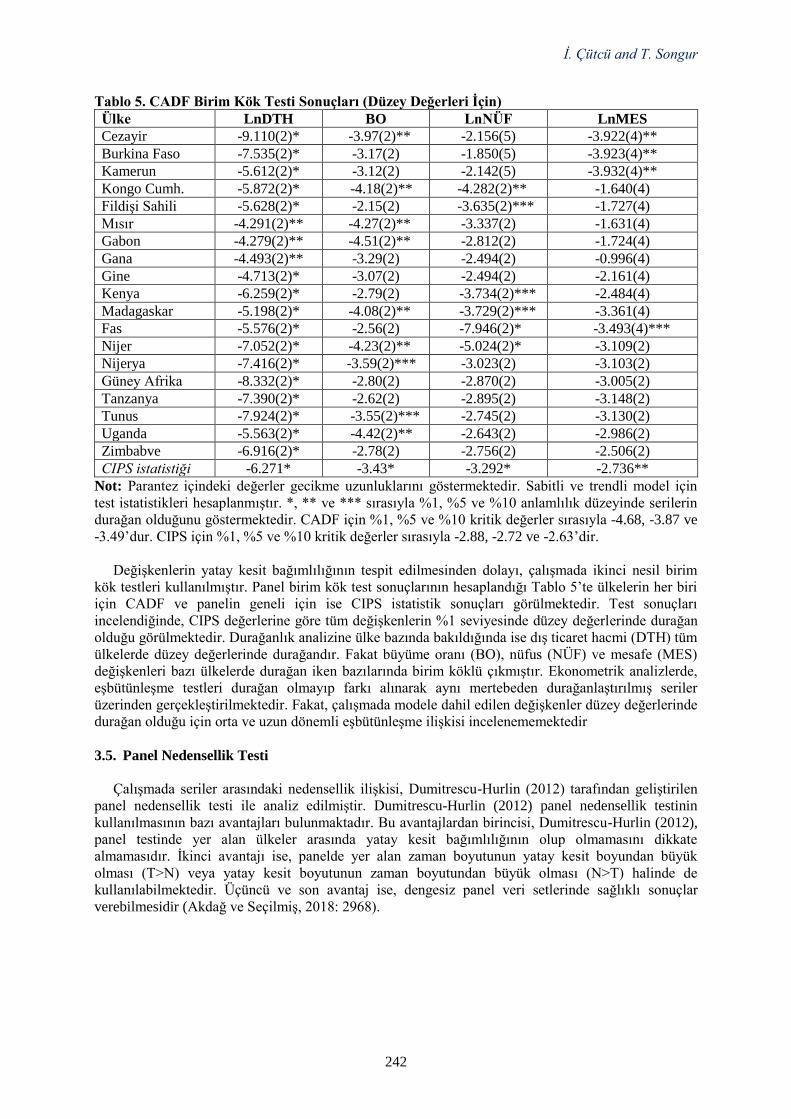
İ. Çütcü and T. Songur
242
Tablo 5. CADF Birim Kök Testi Sonuçları (Düzey Değerleri İçin)
Ülke LnDTH BO LnNÜF LnMES
Cezayir -9.110(2)* -3.97(2)** -2.156(5) -3.922(4)**
Burkina Faso -7.535(2)* -3.17(2) -1.850(5) -3.923(4)**
Kamerun -5.612(2)* -3.12(2) -2.142(5) -3.932(4)**
Kongo Cumh. -5.872(2)* -4.18(2)** -4.282(2)** -1.640(4)
Fildişi Sahili -5.628(2)* -2.15(2) -3.635(2)*** -1.727(4)
Mısır -4.291(2)** -4.27(2)** -3.337(2) -1.631(4)
Gabon -4.279(2)** -4.51(2)** -2.812(2) -1.724(4)
Gana -4.493(2)** -3.29(2) -2.494(2) -0.996(4)
Gine -4.713(2)* -3.07(2) -2.494(2) -2.161(4)
Kenya -6.259(2)* -2.79(2) -3.734(2)*** -2.484(4)
Madagaskar -5.198(2)* -4.08(2)** -3.729(2)*** -3.361(4)
Fas -5.576(2)* -2.56(2) -7.946(2)* -3.493(4)***
Nijer -7.052(2)* -4.23(2)** -5.024(2)* -3.109(2)
Nijerya -7.416(2)* -3.59(2)*** -3.023(2) -3.103(2)
Güney Afrika -8.332(2)* -2.80(2) -2.870(2) -3.005(2)
Tanzanya -7.390(2)* -2.62(2) -2.895(2) -3.148(2)
Tunus -7.924(2)* -3.55(2)*** -2.745(2) -3.130(2)
Uganda -5.563(2)* -4.42(2)** -2.643(2) -2.986(2)
Zimbabve -6.916(2)* -2.78(2) -2.756(2) -2.506(2)
CIPS istatistiği -6.271* -3.43* -3.292* -2.736**
Not: Parantez içindeki değerler gecikme uzunluklarını göstermektedir. Sabitli ve trendli model için
test istatistikleri hesaplanmıştır. *, ** ve *** sırasıyla %1, %5 ve %10 anlamlılık düzeyinde serilerin
durağan olduğunu göstermektedir. CADF için %1, %5 ve %10 kritik değerler sırasıyla -4.68, -3.87 ve
-3.49’dur. CIPS için %1, %5 ve %10 kritik değerler sırasıyla -2.88, -2.72 ve -2.63’dir.
Değişkenlerin yatay kesit bağımlılığının tespit edilmesinden dolayı, çalışmada ikinci nesil birim
kök testleri kullanılmıştır. Panel birim kök test sonuçlarının hesaplandığı Tablo 5’te ülkelerin her biri
için CADF ve panelin geneli için ise CIPS istatistik sonuçları görülmektedir. Test sonuçları
incelendiğinde, CIPS değerlerine göre tüm değişkenlerin %1 seviyesinde düzey değerlerinde durağan
olduğu görülmektedir. Durağanlık analizine ülke bazında bakıldığında ise dış ticaret hacmi (DTH) tüm
ülkelerde düzey değerlerinde durağandır. Fakat büyüme oranı (BO), nüfus (NÜF) ve mesafe (MES)
değişkenleri bazı ülkelerde durağan iken bazılarında birim köklü çıkmıştır. Ekonometrik analizlerde,
eşbütünleşme testleri durağan olmayıp farkı alınarak aynı mertebeden durağanlaştırılmış seriler
üzerinden gerçekleştirilmektedir. Fakat, çalışmada modele dahil edilen değişkenler düzey değerlerinde
durağan olduğu için orta ve uzun dönemli eşbütünleşme ilişkisi incelenememektedir
3.5. Panel Nedensellik Testi
Çalışmada seriler arasındaki nedensellik ilişkisi, Dumitrescu-Hurlin (2012) tarafından geliştirilen
panel nedensellik testi ile analiz edilmiştir. Dumitrescu-Hurlin (2012) panel nedensellik testinin
kullanılmasının bazı avantajları bulunmaktadır. Bu avantajlardan birincisi, Dumitrescu-Hurlin (2012),
panel testinde yer alan ülkeler arasında yatay kesit bağımlılığının olup olmamasını dikkate
almamasıdır. İkinci avantajı ise, panelde yer alan zaman boyutunun yatay kesit boyundan büyük
olması (T>N) veya yatay kesit boyutunun zaman boyutundan büyük olması (N>T) halinde de
kullanılabilmektedir. Üçüncü ve son avantaj ise, dengesiz panel veri setlerinde sağlıklı sonuçlar
verebilmesidir (Akdağ ve Seçilmiş, 2018: 2968).
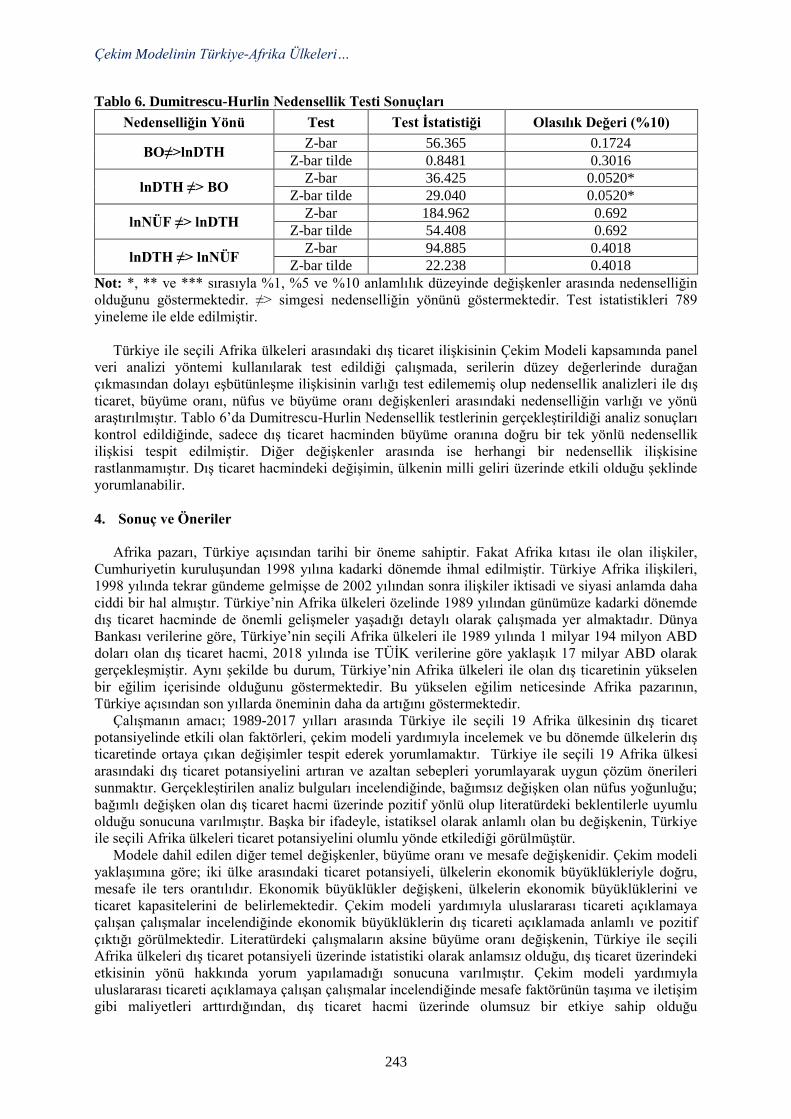
Çekim Modelinin Türkiye-Afrika Ülkeleri…
243
Tablo 6. Dumitrescu-Hurlin Nedensellik Testi Sonuçları
Nedenselliğin Yönü Test Test İstatistiği Olasılık Değeri (%10)
BO≠>lnDTH Z-bar 56.365 0.1724
Z-bar tilde 0.8481 0.3016
lnDTH ≠> BO Z-bar 36.425 0.0520*
Z-bar tilde 29.040 0.0520*
lnNÜF ≠> lnDTH Z-bar 184.962 0.692
Z-bar tilde 54.408 0.692
lnDTH ≠> lnNÜF Z-bar 94.885 0.4018
Z-bar tilde 22.238 0.4018
Not: *, ** ve *** sırasıyla %1, %5 ve %10 anlamlılık düzeyinde değişkenler arasında nedenselliğin
olduğunu göstermektedir. ≠> simgesi nedenselliğin yönünü göstermektedir. Test istatistikleri 789
yineleme ile elde edilmiştir.
Türkiye ile seçili Afrika ülkeleri arasındaki dış ticaret ilişkisinin Çekim Modeli kapsamında panel
veri analizi yöntemi kullanılarak test edildiği çalışmada, serilerin düzey değerlerinde durağan
çıkmasından dolayı eşbütünleşme ilişkisinin varlığı test edilememiş olup nedensellik analizleri ile dış
ticaret, büyüme oranı, nüfus ve büyüme oranı değişkenleri arasındaki nedenselliğin varlığı ve yönü
araştırılmıştır. Tablo 6’da Dumitrescu-Hurlin Nedensellik testlerinin gerçekleştirildiği analiz sonuçları
kontrol edildiğinde, sadece dış ticaret hacminden büyüme oranına doğru bir tek yönlü nedensellik
ilişkisi tespit edilmiştir. Diğer değişkenler arasında ise herhangi bir nedensellik ilişkisine
rastlanmamıştır. Dış ticaret hacmindeki değişimin, ülkenin milli geliri üzerinde etkili olduğu şeklinde
yorumlanabilir.
4. Sonuç ve Öneriler
Afrika pazarı, Türkiye açısından tarihi bir öneme sahiptir. Fakat Afrika kıtası ile olan ilişkiler,
Cumhuriyetin kuruluşundan 1998 yılına kadarki dönemde ihmal edilmiştir. Türkiye Afrika ilişkileri,
1998 yılında tekrar gündeme gelmişse de 2002 yılından sonra ilişkiler iktisadi ve siyasi anlamda daha
ciddi bir hal almıştır. Türkiye’nin Afrika ülkeleri özelinde 1989 yılından günümüze kadarki dönemde
dış ticaret hacminde de önemli gelişmeler yaşadığı detaylı olarak çalışmada yer almaktadır. Dünya
Bankası verilerine göre, Türkiye’nin seçili Afrika ülkeleri ile 1989 yılında 1 milyar 194 milyon ABD
doları olan dış ticaret hacmi, 2018 yılında ise TÜİK verilerine göre yaklaşık 17 milyar ABD olarak
gerçekleşmiştir. Aynı şekilde bu durum, Türkiye’nin Afrika ülkeleri ile olan dış ticaretinin yükselen
bir eğilim içerisinde olduğunu göstermektedir. Bu yükselen eğilim neticesinde Afrika pazarının,
Türkiye açısından son yıllarda öneminin daha da artığını göstermektedir.
Çalışmanın amacı; 1989-2017 yılları arasında Türkiye ile seçili 19 Afrika ülkesinin dış ticaret
potansiyelinde etkili olan faktörleri, çekim modeli yardımıyla incelemek ve bu dönemde ülkelerin dış
ticaretinde ortaya çıkan değişimler tespit ederek yorumlamaktır. Türkiye ile seçili 19 Afrika ülkesi
arasındaki dış ticaret potansiyelini artıran ve azaltan sebepleri yorumlayarak uygun çözüm önerileri
sunmaktır. Gerçekleştirilen analiz bulguları incelendiğinde, bağımsız değişken olan nüfus yoğunluğu;
bağımlı değişken olan dış ticaret hacmi üzerinde pozitif yönlü olup literatürdeki beklentilerle uyumlu
olduğu sonucuna varılmıştır. Başka bir ifadeyle, istatiksel olarak anlamlı olan bu değişkenin, Türkiye
ile seçili Afrika ülkeleri ticaret potansiyelini olumlu yönde etkilediği görülmüştür.
Modele dahil edilen diğer temel değişkenler, büyüme oranı ve mesafe değişkenidir. Çekim modeli
yaklaşımına göre; iki ülke arasındaki ticaret potansiyeli, ülkelerin ekonomik büyüklükleriyle doğru,
mesafe ile ters orantılıdır. Ekonomik büyüklükler değişkeni, ülkelerin ekonomik büyüklüklerini ve
ticaret kapasitelerini de belirlemektedir. Çekim modeli yardımıyla uluslararası ticareti açıklamaya
çalışan çalışmalar incelendiğinde ekonomik büyüklüklerin dış ticareti açıklamada anlamlı ve pozitif
çıktığı görülmektedir. Literatürdeki çalışmaların aksine büyüme oranı değişkenin, Türkiye ile seçili
Afrika ülkeleri dış ticaret potansiyeli üzerinde istatistiki olarak anlamsız olduğu, dış ticaret üzerindeki
etkisinin yönü hakkında yorum yapılamadığı sonucuna varılmıştır. Çekim modeli yardımıyla
uluslararası ticareti açıklamaya çalışan çalışmalar incelendiğinde mesafe faktörünün taşıma ve iletişim
gibi maliyetleri arttırdığından, dış ticaret hacmi üzerinde olumsuz bir etkiye sahip olduğu
İ. Çütcü and T. Songur
244
görülmektedir. Bu çalışmaların aksine mesafe değişkeninin, Türkiye ile seçili Afrika ülkeleri dış
ticaret potansiyeli üzerinde istatistiki olarak anlamsız olduğu, dış ticaret üzerindeki etkisinin yönü
hakkında yorum yapılamadığı sonucuna varılmıştır.
Çalışmada, “Türkiye ile seçili Afrika ülkeleri arasında Çekim Modeli geçerlidir” şeklinde hipotez
oluşturulmuştur. Bu hipoteze göre, Türkiye ile seçili Afrika ülkeleri arasında çekim modeli geçerli
değildir. Böylece çekim modelinin, tüm ülkeler için aynı sonucu vermeyeceği belirlenmiş olup,
çalışmanın konusu ve analizleri bakımından literatüre önemli bir katkı sağlayacağı düşünülmektedir.
Çalışmada elde edilen sonuçlar, literatürdeki çalışmalarla birebir uyuşmadığı gibi aynı zamanda da
birebir çelişmemektedir. Bu nedenle çalışmada kullanılan değişkenler özelinde kıyaslama yapılmıştır.
Çalışmada ekonomik büyüme, dış ticaret hacmi üzerinde anlamsız çıkmıştır. Literatürdeki, Aitken
(1973), Genç vd. (2001), Gilbert vd. (2001), Hassan (2001), Sapir (2001), Bussiere vd. (2005),
Papazoglou vd. (2006), Rahman vd. (2006), Rojid (2006), Sandberg vd. (2006), Nitsch (2007), Kien
(2009), Rault vd. (2009), Tatlıcı (2009), Karagöz ve Saray (2010), Dinç (2012), Ata (2013), Çetin
(2014), Golovko (2014), Burtan Doğan ve Özörnek Tunç (2015), Mohmand vd. (2015), Işık (2016)’ın
çalışmalarıyla uyumlu olmadığı sonucuna varılmıştır.
Çalışmada nüfus değişkeni, dış ticaret hacmi üzerinde pozitif ve uyumlu çıkmıştır. Literatürdeki,
Genç vd. (2001), Sandberg vd. (2006), Kien (2009) ve Işık (2016)’ın çalışmalarıyla uyumlu olduğu
tespit edilirken, Aitken (1973), Rahman vd. (2006), Rojid (2006), Tatlıcı (2009), Karagöz ve Saray
(2010), Dinç (2012), Ata (2013) ve Burtan Doğan ve Özörnek Tunç (2015)’un çalışmalarıyla çelişkili
sonuçlar verdiği tespit edilmiştir.
Çalışmada mesafe, dış ticaret hacmi üzerinde anlamsız çıkmıştır. Literatürdeki, Burtan Doğan ve
Özörnek Tunç (2015)’un çalışmalarıyla uyumlu olduğu görülmektedir. Ancak, Aitken (1973), Genç
vd. (2001), Gilbert vd. (2001), Hassan (2001), Bussiere vd. (2005), Papazoglou vd. (2006), Rahman
vd. (2006), Rojid (2006), Sandberg vd. (2006), Nitsch (2007), Kien (2009), Rault vd. (2009), Tatlıcı
(2009), Karagöz ve Saray (2010), Dinç (2012), Ata (2013), Çetin (2014), Golovko (2014), Mohmand
vd. (2015) ve Işık (2016)’ın çalışmalarıyla uyumlu olmadığı görülmektedir.
Yapılan çalışma ile literatürdeki çalışmalar karşılaştırıldığında, nüfus yoğunluğu değişkenin diğer
çalışmalarla genel itibariyle uyumlu olduğu görülürken, özellikle büyüme oranı ve mesafe değişkenin
diğer değişkenlere göre fazla uyumsuz sonuçlar verdiği görülmektedir.
Çalışmanın bulgularına göre; Türkiye ile Afrika ülkeleri dış ticaret potansiyeli, nüfus
yoğunluklarıyla pozitif yönlü olduğu görülmektedir. Bu nedenle ilk olarak, nüfus yoğunlukları
bakımından fazla olan ülkeler ile ilişkiler yoğunlaştırılmalıdır. Türkiye ile Afrika ülkeleri arasındaki
ekonomik işbirliği ve ticari ilişkilerin artırılmasında serbest ticaret anlaşmaları son derece önemlidir.
Yapılacak olan serbest ticaret anlaşmaları, Türkiye ile Afrika ülkeleri arasındaki ticaret ve yatırımları
kolaylaştıracak, ilişkilerin geliştirilmesiyle dış ticaret potansiyeli artıracaktır.
Çekim modeli kullanılarak yapılan çalışmalar incelendiğinde mesafe faktörünün, dış ticaret
üzerinde negatif bir etkiye sahip olduğu görülmektedir. Ancak literatürdeki çalışmaların aksine,
mesafe faktörü Türkiye ile seçili Afrika ülkelerinin dış ticaret potansiyeli üzerinde istatistiki olarak
anlamsız olduğu sonucuna ulaşılmıştır. Türkiye ile Afrika ülkeleri ticaret potansiyelinin geliştirilmesi,
iletişim ve ulaşım ağlarının iyileştirilmesi, yük taşımacılığı maliyetlerinin düşürülmesi gibi faaliyetlere
bağlıdır.
Kaynakça
Akbay, O. S. (2015). Türkiye-Afrika Ticari İlişkileri: 2009-2014 Dönemi, Balkan Sosyal
BilimlerDergisi, 4(8), 4-12.
Akdağ, S. ve Seçilmiş, C. (2018). OECD Ülkelerinde Turizm Gelirleri ile GSYH Arasındaki İlişki:
Dinamik Panel ve Panel Nedensellik Analizi, İnsan ve Toplum Bilimleri Araştırmaları Dergisi,
7(4), 2960-2977.
Akgül, M. S. (2013). Çekim Modeli Bulguları Işığında Türkiye’nin İslam İşbirliği Teşkilatı İle
İlişkileri ve Ticari Potansiyeli, ADAM Akademi Dergisi, 3(2), 83-110.
Aksoy, B. ve Çoşkun, M. (2014). Türkiye’nin Yakın Dönem Dış Ticaretindeki Değişmeler, Gazi
Eğitim Fakültesi Dergisi, 24(3), 397-415.
Bektaş, V. (2017). Gelişmekte Olan Ülkelerde Cari Açıkların Sürdürülebilirliği: Bir Panel Veri
Analizi, AİBÜ Sosyal Bilimler Enstitüsü Dergisi, 17(1), 51-66.
Çekim Modelinin Türkiye-Afrika Ülkeleri…
245
Breush, T. S. and A. R. Pagan. (1980). The Lagrange Multiplier Test and its Applications to Model
Specification in Econometrics , The Review of Economic Studies, 47(1), 239-253.
Bussière, M., Fidrmuc, J. And Schnatz, B. (2005). “Trade Integration of Central and Eastern
EuropeanCountries Lessons from a Gravity Model”, European Central Bank (ECB) Working Paper
Series, (545), 1-39.
Burtan Doğan, B. ve Özörnek Tunç, Ş. (2015). "Türkiye'nin Afrika Ülkeleri ile Olan Dış Ticaretinin
Belirleyicileri: Panel Çekim Modeli Yaklaşımı". Akademik Araştırmalar ve Çalışmalar Dergisi,
7(12), 01-17.
Çetin, B. (2014). Türkiye’nin Ortadoğu ve Kuzey Afrika Bölgesine İhracatını Etkileyen İç ve Dış
Dinamikler: Çekim Modeli Uygulaması. Yayınlanmamış yüksek lisans tezi, Marmara Üniversitesi,
İstanbul.
Dinç, T. (2012). “Türkiye’nin Dış Ticaret Akımlarını Belirleyen Etmenler: Panel Çekim Modeli
Yaklaşımı”, Finans Politik & Ekonomik Yorumlar, 49(565), 5-12.
Dumitrescu, Elena-Ivona and Christophe Hurlin (2012). Testing for Granger non-causality in
Heterogeneous Panels. Economic Modelling (29), 1450-1460.
Dünya Bankası, (2019). Turkey Import in thousand US$ all countries and regions between 1989 and
2017.
https://wits.worldbank.org/CountryProfile/en/Country/TUR/StartYear/1989/EndYear/2017/TradeFl
ow/Import/Partner/ALL/Indicator/MPRT-TRD-VL# , 16.03.2019.
Genç, M., Artan A. ve Berber M. (2011). Karadeniz Ekonomik İşbirliği Bölgesinde Ticaret
Akımlarının Belirleyicileri: Çekim Modeli Yaklaşımı. Atatürk Üniversitesi İktisadi ve İdari
Bilimler Dergisi, 25(2), 207-224.
Gilbert, J., Scollay, R. and Bora, B. (2001). “Assessing Regional Trading Arrangements in the Asia-
Pacific”, UNCTAD Policy Issues in International Trade and Commodities Study Series, (15), 1-29.
Golovko, A. (2009). Çekim Modeli: Avrasya Ülkelerinin Dış Ticareti. Anadolu Üniversitesi İktisat
Kongresi EconAnadolu Bildiri Kitapçığı, Eskişehir.
Grossman, G.M. ve Helpman, E. (1990). “Quality Ladders in the Theory of Growth”, Review of
Economic Studies, (58), 43-61.
Gülen, A. (2014). Serbest Ticaret Anlaşmalarının Türkiye’nin Dış Ticaretine Etkisi: Panel Veri
Analizi, Yayınlanmamış doktora tezi, Bülent Ecevit Üniversitesi, Zonguldak.
Işık, N. (2016). Türkiye İle Şanghay İşbirliği Örgütü Arasındaki Ticaret Akımlarının Panel Çekim
Modeli İle Analizi, Uluslararası İktisadi ve İdari İncelemeler Dergisi, (17), 151-174.
Karagöz, K. ve Saray, M. O. (2010). "Trade Potential of Turkey with Asia-Pasific Countries: Evidence
from Panel Gravity Model", International Economic Studies, 36(1), 19-26.
Kien, N. T. (2009). "Gravity Model by Panel Data Approach: An Empirical Application with
Implications for the ASEAN Free Trade Area". ASEAN Economic Bulletin, 26 (3), 266-277.
Papazoglou, C., Pentecost, E. J. And Marques, H. (2006), “A Gravity Model Forecast of the Potential
Trade Effects of EU Enlargement: Lessons from 2004 and Path-dependency in Integration”, The
World Economy, 29 (8), 1077-1089.
Pesaran, M. H. (2007), A Simple Panel Unit Root Test in the Presence of Crosssection Dependence.
Journal of Applied Economics, 22(2), 265-312.
Rault, C. ve diğerleri (2009). “Modelling International Trade Flows between CEEC and OECD
Countries”, Applied Economics Letters, 16 (15), 1547-1554.
Rojid, S. (2006). “COMESA Trade Potential: A Gravity Approach” Applied Economics Letters, (13),
947–951.
Sandberg, H. M. Seale, J. L and Taylor, T. G (2006). “History, Regionalism, and CARICOM Trade: A
Gravity Model Analysis”, The Journal of Development Studies, 42(5), 795-811.
Sapir, A. (2001). “Domino Effects in Western European Regional Trade, 1960–1992”, European
Journal of Political Economy, 17(2), 377-388.
Şengül, B. (2015). 21. Yüzyılda Afrika ve Türkiye-Afrika İlişkileri (2005-2015). Yayınlanmamış
yüksek lisans tezi, İstanbul Ticaret Üniversitesi, İstanbul.
Tatlıcı, Ö. (2009). Çekim Modeli: Türkiye’nin İhracatı Üzerine Bir Uygulama. Yayınlanmamış yüksek
lisans tezi, Atatürk Üniversitesi, Erzurum.
T.C. Dışişleri Bakanlığı (2019a). Türkiye Afrika İlişkileri. http://www.mfa.gov.tr/turkiye-afrika-
iliskileri.tr.mfa (23.03. 2019).
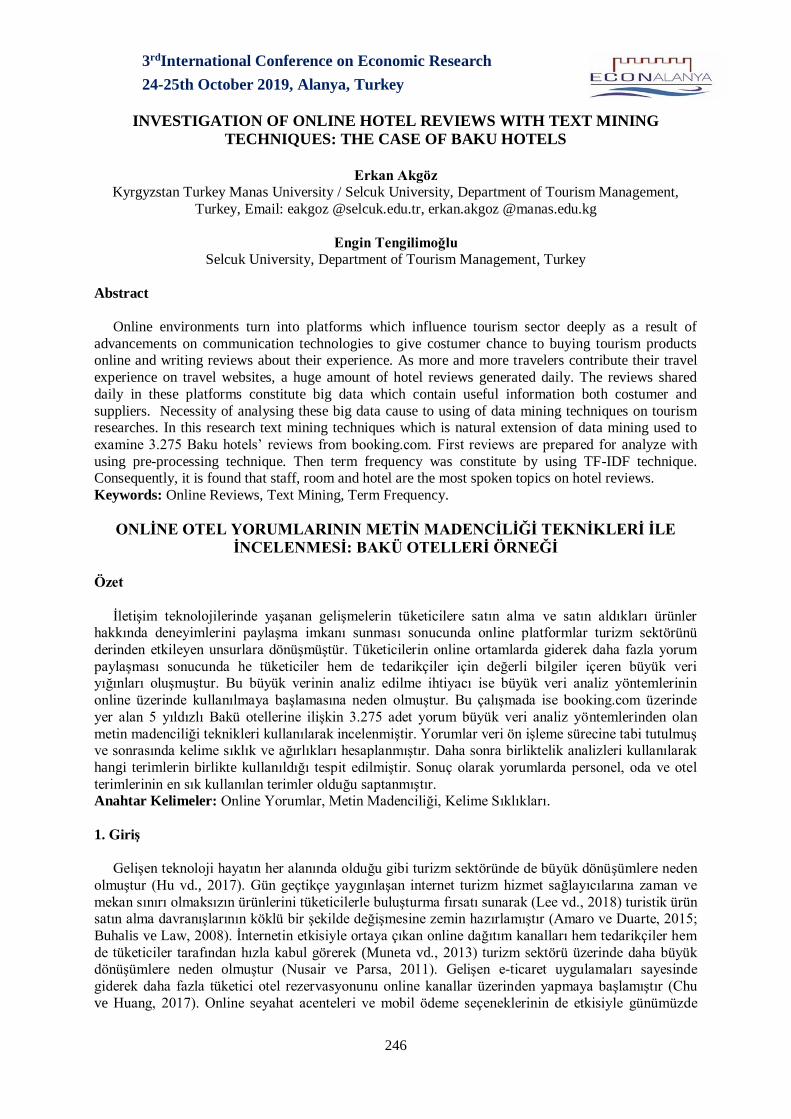
3rdInternational Conference on Economic Research
24-25th October 2019, Alanya, Turkey
246
INVESTIGATION OF ONLINE HOTEL REVIEWS WITH TEXT MINING
TECHNIQUES: THE CASE OF BAKU HOTELS
Erkan Akgöz
Kyrgyzstan Turkey Manas University / Selcuk University, Department of Tourism Management,
Turkey, Email: [email protected], [email protected]
Engin Tengilimoğlu
Selcuk University, Department of Tourism Management, Turkey
Abstract
Online environments turn into platforms which influence tourism sector deeply as a result of
advancements on communication technologies to give costumer chance to buying tourism products online and writing reviews about their experience. As more and more travelers contribute their travel
experience on travel websites, a huge amount of hotel reviews generated daily. The reviews shared
daily in these platforms constitute big data which contain useful information both costumer and
suppliers. Necessity of analysing these big data cause to using of data mining techniques on tourism researches. In this research text mining techniques which is natural extension of data mining used to
examine 3.275 Baku hotels’ reviews from booking.com. First reviews are prepared for analyze with
using pre-processing technique. Then term frequency was constitute by using TF-IDF technique. Consequently, it is found that staff, room and hotel are the most spoken topics on hotel reviews.
Keywords: Online Reviews, Text Mining, Term Frequency.
ONLİNE OTEL YORUMLARININ METİN MADENCİLİĞİ TEKNİKLERİ İLE
İNCELENMESİ: BAKÜ OTELLERİ ÖRNEĞİ
Özet
İletişim teknolojilerinde yaşanan gelişmelerin tüketicilere satın alma ve satın aldıkları ürünler hakkında deneyimlerini paylaşma imkanı sunması sonucunda online platformlar turizm sektörünü
derinden etkileyen unsurlara dönüşmüştür. Tüketicilerin online ortamlarda giderek daha fazla yorum
paylaşması sonucunda he tüketiciler hem de tedarikçiler için değerli bilgiler içeren büyük veri yığınları oluşmuştur. Bu büyük verinin analiz edilme ihtiyacı ise büyük veri analiz yöntemlerinin
online üzerinde kullanılmaya başlamasına neden olmuştur. Bu çalışmada ise booking.com üzerinde
yer alan 5 yıldızlı Bakü otellerine ilişkin 3.275 adet yorum büyük veri analiz yöntemlerinden olan
metin madenciliği teknikleri kullanılarak incelenmiştir. Yorumlar veri ön işleme sürecine tabi tutulmuş ve sonrasında kelime sıklık ve ağırlıkları hesaplanmıştır. Daha sonra birliktelik analizleri kullanılarak
hangi terimlerin birlikte kullanıldığı tespit edilmiştir. Sonuç olarak yorumlarda personel, oda ve otel
terimlerinin en sık kullanılan terimler olduğu saptanmıştır. Anahtar Kelimeler: Online Yorumlar, Metin Madenciliği, Kelime Sıklıkları.
1. Giriş
Gelişen teknoloji hayatın her alanında olduğu gibi turizm sektöründe de büyük dönüşümlere neden
olmuştur (Hu vd., 2017). Gün geçtikçe yaygınlaşan internet turizm hizmet sağlayıcılarına zaman ve
mekan sınırı olmaksızın ürünlerini tüketicilerle buluşturma fırsatı sunarak (Lee vd., 2018) turistik ürün satın alma davranışlarının köklü bir şekilde değişmesine zemin hazırlamıştır (Amaro ve Duarte, 2015;
Buhalis ve Law, 2008). İnternetin etkisiyle ortaya çıkan online dağıtım kanalları hem tedarikçiler hem
de tüketiciler tarafından hızla kabul görerek (Muneta vd., 2013) turizm sektörü üzerinde daha büyük dönüşümlere neden olmuştur (Nusair ve Parsa, 2011). Gelişen e-ticaret uygulamaları sayesinde
giderek daha fazla tüketici otel rezervasyonunu online kanallar üzerinden yapmaya başlamıştır (Chu
ve Huang, 2017). Online seyahat acenteleri ve mobil ödeme seçeneklerinin de etkisiyle günümüzde
Online Otel Yorumlarının Metin Madenciliği Teknikleri...
247
online seyahat satın alımları 694 milyar dolara ulaşmıştır (Emarketer, 2018). Turizm ürünleri internet
üzerinde satılan ürünler arasında tüketiciler tarafından en çok kabul gören ürünler arasına girmiştir
(Bilgihan, 2012). Küresel gezginlerin %86’sı konaklama için online kaynakları tercih etmektedir (TripBarometer, 2016). Tüketicilerin artan bir eğilimle turizm ürünleri satın alımlarında online
kaynakları tercih etmeleri (Chu ve Huang, 2017) turizm işletmelerinin online ortamlarda paylaşılan
tüketici kaynaklı içeriklerden daha yüksek düzeyde etkilenmelerine neden olmaktadır (Phillips vd., 2015; Liu vd., 2019). Birçok çalışma online yorumların tüketici karar sürecini önemli ölçüde
etkilediğini göstermektedir (Balouchi vd., 2017; Lee vd., 2017; Fazzolari ve Petrocchi, 2018; Hu ve
Lu, 2018). Tüketicilerin %95’i otel rezervasyonu yapmadan önce online yorumları incelerken 3’te 1’inden fazlası ise otel seçiminde en önemli unsurlardan birinin online yorumlar olduğunu
belirtmektedir (Hu vd., 2017; Tengilimoğlu ve Öztürk, 2019). Zhang ve Verma (2017) ise online
yorumların otel seçiminde fiyattan sonra ikinci önemli faktör olduğunu belirtmektedir. Online
yorumlara tüketiciler tarafından verilen önem neticesinde sayıca artan seyahat web siteleri (Hu vd., 2017) internetin turizm ile ilgili bilgi arayışında önemli bir kaynak haline gelmesini sağlamıştır
(Balouchi vd., 2017; Lee vd., 2018; Liu vd., 2019).
Oteller hakkında online ortamlarda paylaşılan yorumların artan önemini fark eden online kuruluşlar, tüketicilere satın alma dışında deneyimlerini de paylaşabilecekleri platformlar sağlayarak
hem kendi popülaritelerini arttırmayı hem de turizm ve konaklama alanında önemli bir bilgi kaynağı
haline gelmeyi amaçlamaktadırlar (Tengilimoğlu vd., 2017). Bu tür platformlar tüketicilerin turizm ürünleri hakkındaki bilgilere hızlı ve kolay bir şekilde ulaşmalarına olanak tanırken (Balouchi vd.,
2017) aynı zamanda tüketicilerin ürünler hakkındaki deneyim ve düşüncelerini paylaşmalarına da
imkan sağlamaktadır (Hu vd., 2017; Liu vd., 2019). Son yıllarda tüketicilerin turizm ürünleri
hakkındaki deneyim ve düşüncelerini online ortamlarda paylaşmaları global bir trend halini almıştır (Wong ve Qi, 2017). Bu trend sayesinde günlük olarak büyük miktarlarda online yorum seyahat web
siteleri üzerinde tüketiciler tarafından oluşturulmakta (Hu vd., 2017) ve bu sayede hem tüketiciler hem
de tedarikçiler açısından önemli bilgiler içeren (Zhang ve Verma, 2017) büyük veri yığınları oluşmaktadır (Dirsehan, 2016). Dolayısıyla online ortamlarda tüketiciler tarafından oluşturulan bu
büyük veri yığınları beraberinde büyük verilerin değerlendirilmesi sorununu da gündeme
getirmektedir (Fang vd., 2016).
Özetle yaşanan teknolojik gelişmeler neticesinde online ortamlar, tüketicilerin satın alma dışında deneyim ve düşüncelerini de paylaştığı (Liu vd., 2019) turizm sektörünü derinden etkileyen
platformlara dönüşmüştür (Phillips vd., 2015). Bu platformlarda her geçen gün daha fazla tüketicinin
yorum paylaşması (Hu vd, 2017) neticesinde büyük miktarlarda veri oluşmuş (Dirsehan, 2016) ve hem tüketiciler hem de tedarikçiler için değerli bilgileri içeren büyük veri yığınlarının (Zhang ve Verma,
2017) analiz edilmesi ihtiyacı ortaya çıkmıştır (Fang vd., 2016). Oluşan ihtiyaç neticesinde büyük veri
analiz yöntemleri online yorumlar üzerinde de kullanılmaya başlanmış (Fazzolari ve Petrocchi, 2018) ve milyonlarca yorumun farklı tekniklerle analiz edilerek faydalı bilgilere dönüşmesi mümkün hale
gelmiştir (Ertek vd., 2013). Bu çalışmada da büyük veri analiz yöntemlerinden veri madenciliğinin
doğal bir uzantısı olan metin madenciliği (Dirsehan, 2016) tekniklerinden faydalanılarak booking.com
üzerinde yer alan 5 yıldızlı Bakü otellerine ilişkin 3.275 adet İngilizce yorum incelenmiştir. Yorumlar paket program aracılığı ile indirilerek veri ön işleme sürecine tabi tutulmuş ve sonrasında TF-IDF
kelime ağırlık hesaplaması, kelime sıklıkları, N-Gram analizleri uygulanmıştır. Kullanılan tekniklerle
online yorumlarda sık konuşulan konular belirlenmiş, hangi kelimelerin birlikte kullanıldığı tespit edilmiştir. Ayrıca olumlu ve olumsuz yorumlarda geçen terimler kıyaslanarak Bakü otellerine ilişkin
olumlu ve olumsuz durumlar tespit edilip önerilere yer verilmiştir.
2. Yöntem
Çalışmanın amacı online ortamlarda oteller hakkında hangi konuların daha sık konuşulduğunun
tespit edilmesi ve sık konuşulan konuların olumlu ve olumsuz yorumlara göre farklılaşıp farklılaşmadığının belirlenmesidir. Ayrıca müşterileri olumlu ve olumsuz yorum bırakma konusunda
teşvik eden otel deneyim unsurlarının anlaşılması da amaçlanmaktadır.
Metin madenciliği tekniklerinin kullanıldığı çalışmalarda sonuçların daha anlaşılır olması için incelenen yorumların aynı dilde yazılmış olması önemli bir konudur (Ertek, vd., 2013). Bununla
birlikte doğal dil işleme (Natural Language Process), durdurucu kelimeler (Stopwords) ve gövdeleme
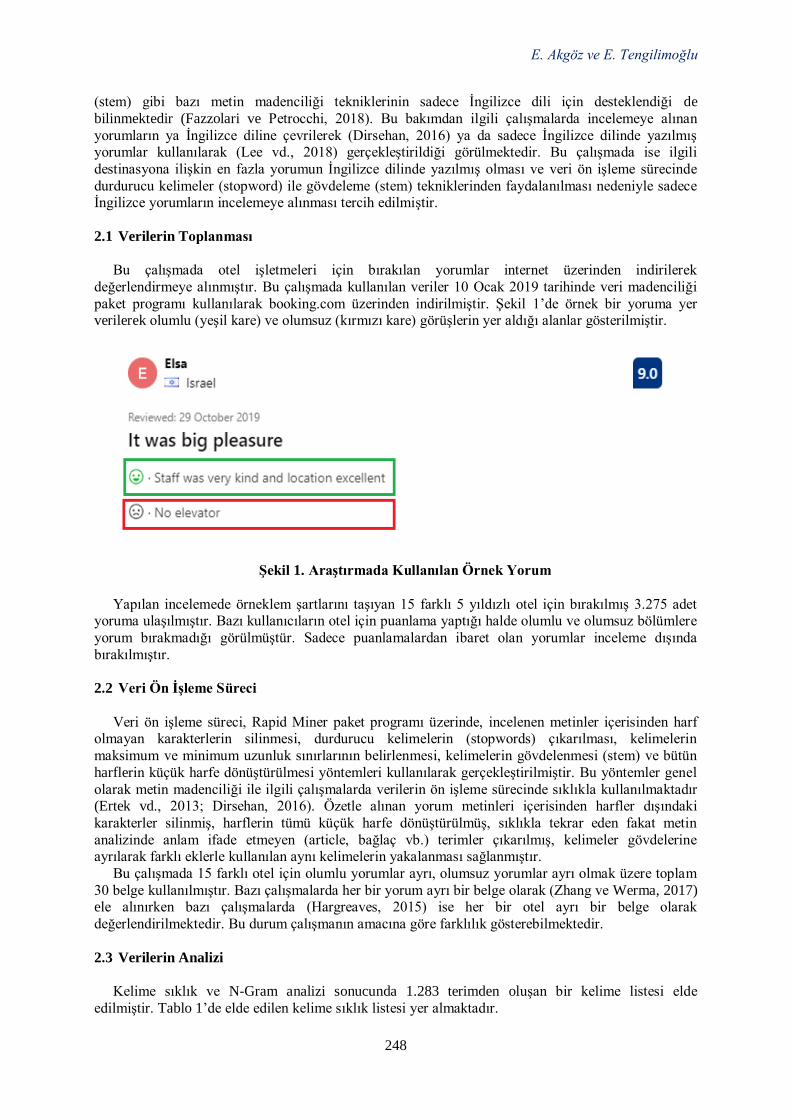
E. Akgöz ve E. Tengilimoğlu
248
(stem) gibi bazı metin madenciliği tekniklerinin sadece İngilizce dili için desteklendiği de
bilinmektedir (Fazzolari ve Petrocchi, 2018). Bu bakımdan ilgili çalışmalarda incelemeye alınan
yorumların ya İngilizce diline çevrilerek (Dirsehan, 2016) ya da sadece İngilizce dilinde yazılmış yorumlar kullanılarak (Lee vd., 2018) gerçekleştirildiği görülmektedir. Bu çalışmada ise ilgili
destinasyona ilişkin en fazla yorumun İngilizce dilinde yazılmış olması ve veri ön işleme sürecinde
durdurucu kelimeler (stopword) ile gövdeleme (stem) tekniklerinden faydalanılması nedeniyle sadece İngilizce yorumların incelemeye alınması tercih edilmiştir.
2.1 Verilerin Toplanması
Bu çalışmada otel işletmeleri için bırakılan yorumlar internet üzerinden indirilerek
değerlendirmeye alınmıştır. Bu çalışmada kullanılan veriler 10 Ocak 2019 tarihinde veri madenciliği
paket programı kullanılarak booking.com üzerinden indirilmiştir. Şekil 1’de örnek bir yoruma yer verilerek olumlu (yeşil kare) ve olumsuz (kırmızı kare) görüşlerin yer aldığı alanlar gösterilmiştir.
Şekil 1. Araştırmada Kullanılan Örnek Yorum
Yapılan incelemede örneklem şartlarını taşıyan 15 farklı 5 yıldızlı otel için bırakılmış 3.275 adet yoruma ulaşılmıştır. Bazı kullanıcıların otel için puanlama yaptığı halde olumlu ve olumsuz bölümlere
yorum bırakmadığı görülmüştür. Sadece puanlamalardan ibaret olan yorumlar inceleme dışında
bırakılmıştır.
2.2 Veri Ön İşleme Süreci
Veri ön işleme süreci, Rapid Miner paket programı üzerinde, incelenen metinler içerisinden harf olmayan karakterlerin silinmesi, durdurucu kelimelerin (stopwords) çıkarılması, kelimelerin
maksimum ve minimum uzunluk sınırlarının belirlenmesi, kelimelerin gövdelenmesi (stem) ve bütün
harflerin küçük harfe dönüştürülmesi yöntemleri kullanılarak gerçekleştirilmiştir. Bu yöntemler genel
olarak metin madenciliği ile ilgili çalışmalarda verilerin ön işleme sürecinde sıklıkla kullanılmaktadır (Ertek vd., 2013; Dirsehan, 2016). Özetle alınan yorum metinleri içerisinden harfler dışındaki
karakterler silinmiş, harflerin tümü küçük harfe dönüştürülmüş, sıklıkla tekrar eden fakat metin
analizinde anlam ifade etmeyen (article, bağlaç vb.) terimler çıkarılmış, kelimeler gövdelerine ayrılarak farklı eklerle kullanılan aynı kelimelerin yakalanması sağlanmıştır.
Bu çalışmada 15 farklı otel için olumlu yorumlar ayrı, olumsuz yorumlar ayrı olmak üzere toplam
30 belge kullanılmıştır. Bazı çalışmalarda her bir yorum ayrı bir belge olarak (Zhang ve Werma, 2017) ele alınırken bazı çalışmalarda (Hargreaves, 2015) ise her bir otel ayrı bir belge olarak
değerlendirilmektedir. Bu durum çalışmanın amacına göre farklılık gösterebilmektedir.
2.3 Verilerin Analizi
Kelime sıklık ve N-Gram analizi sonucunda 1.283 terimden oluşan bir kelime listesi elde
edilmiştir. Tablo 1’de elde edilen kelime sıklık listesi yer almaktadır.
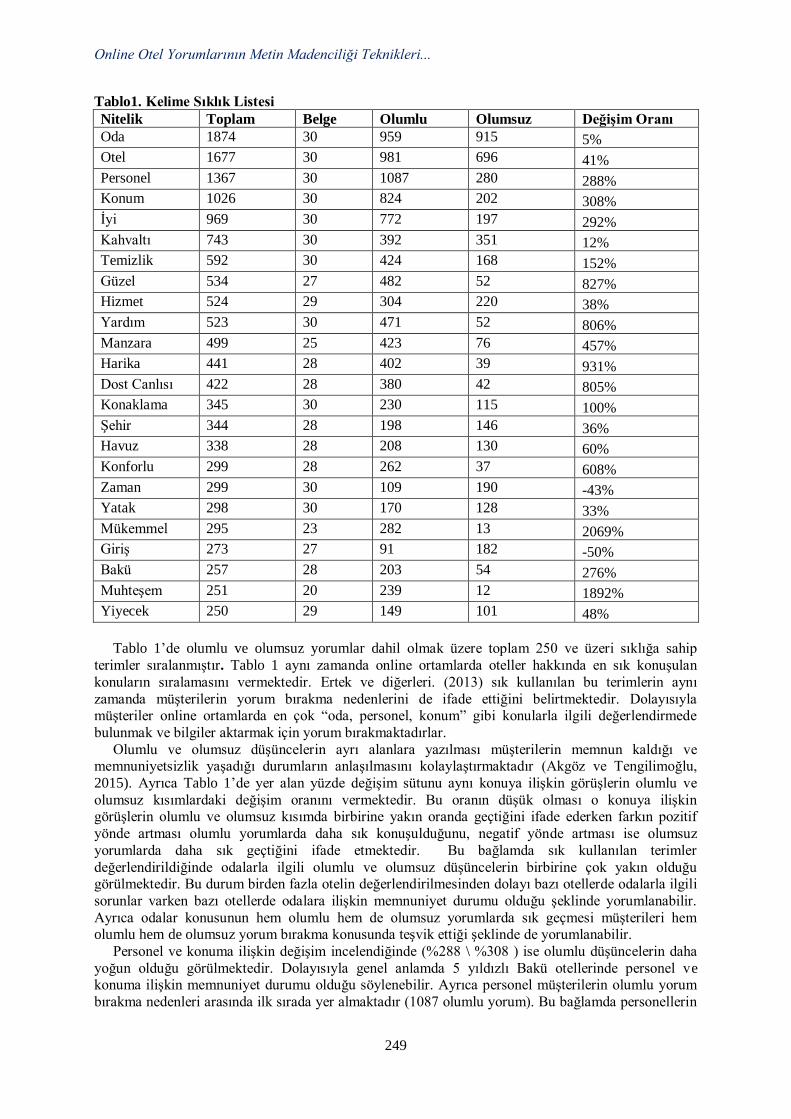
Online Otel Yorumlarının Metin Madenciliği Teknikleri...
249
Tablo1. Kelime Sıklık Listesi
Nitelik Toplam Belge Olumlu Olumsuz Değişim Oranı
Oda 1874 30 959 915 5%
Otel 1677 30 981 696 41%
Personel 1367 30 1087 280 288%
Konum 1026 30 824 202 308%
İyi 969 30 772 197 292%
Kahvaltı 743 30 392 351 12%
Temizlik 592 30 424 168 152%
Güzel 534 27 482 52 827%
Hizmet 524 29 304 220 38%
Yardım 523 30 471 52 806%
Manzara 499 25 423 76 457%
Harika 441 28 402 39 931%
Dost Canlısı 422 28 380 42 805%
Konaklama 345 30 230 115 100%
Şehir 344 28 198 146 36%
Havuz 338 28 208 130 60%
Konforlu 299 28 262 37 608%
Zaman 299 30 109 190 -43%
Yatak 298 30 170 128 33%
Mükemmel 295 23 282 13 2069%
Giriş 273 27 91 182 -50%
Bakü 257 28 203 54 276%
Muhteşem 251 20 239 12 1892%
Yiyecek 250 29 149 101 48%
Tablo 1’de olumlu ve olumsuz yorumlar dahil olmak üzere toplam 250 ve üzeri sıklığa sahip
terimler sıralanmıştır. Tablo 1 aynı zamanda online ortamlarda oteller hakkında en sık konuşulan
konuların sıralamasını vermektedir. Ertek ve diğerleri. (2013) sık kullanılan bu terimlerin aynı
zamanda müşterilerin yorum bırakma nedenlerini de ifade ettiğini belirtmektedir. Dolayısıyla müşteriler online ortamlarda en çok “oda, personel, konum” gibi konularla ilgili değerlendirmede
bulunmak ve bilgiler aktarmak için yorum bırakmaktadırlar.
Olumlu ve olumsuz düşüncelerin ayrı alanlara yazılması müşterilerin memnun kaldığı ve memnuniyetsizlik yaşadığı durumların anlaşılmasını kolaylaştırmaktadır (Akgöz ve Tengilimoğlu,
2015). Ayrıca Tablo 1’de yer alan yüzde değişim sütunu aynı konuya ilişkin görüşlerin olumlu ve
olumsuz kısımlardaki değişim oranını vermektedir. Bu oranın düşük olması o konuya ilişkin görüşlerin olumlu ve olumsuz kısımda birbirine yakın oranda geçtiğini ifade ederken farkın pozitif
yönde artması olumlu yorumlarda daha sık konuşulduğunu, negatif yönde artması ise olumsuz
yorumlarda daha sık geçtiğini ifade etmektedir. Bu bağlamda sık kullanılan terimler
değerlendirildiğinde odalarla ilgili olumlu ve olumsuz düşüncelerin birbirine çok yakın olduğu görülmektedir. Bu durum birden fazla otelin değerlendirilmesinden dolayı bazı otellerde odalarla ilgili
sorunlar varken bazı otellerde odalara ilişkin memnuniyet durumu olduğu şeklinde yorumlanabilir.
Ayrıca odalar konusunun hem olumlu hem de olumsuz yorumlarda sık geçmesi müşterileri hem olumlu hem de olumsuz yorum bırakma konusunda teşvik ettiği şeklinde de yorumlanabilir.
Personel ve konuma ilişkin değişim incelendiğinde (%288 \ %308 ) ise olumlu düşüncelerin daha
yoğun olduğu görülmektedir. Dolayısıyla genel anlamda 5 yıldızlı Bakü otellerinde personel ve konuma ilişkin memnuniyet durumu olduğu söylenebilir. Ayrıca personel müşterilerin olumlu yorum
bırakma nedenleri arasında ilk sırada yer almaktadır (1087 olumlu yorum). Bu bağlamda personellerin
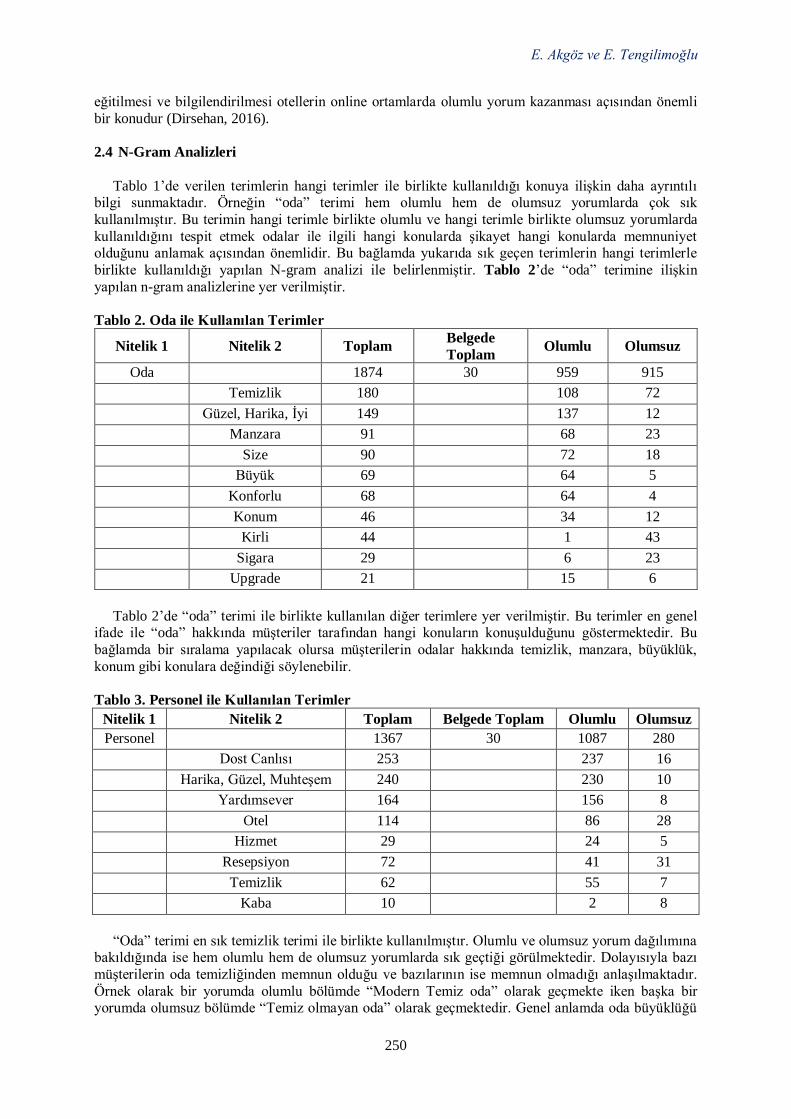
E. Akgöz ve E. Tengilimoğlu
250
eğitilmesi ve bilgilendirilmesi otellerin online ortamlarda olumlu yorum kazanması açısından önemli
bir konudur (Dirsehan, 2016).
2.4 N-Gram Analizleri
Tablo 1’de verilen terimlerin hangi terimler ile birlikte kullanıldığı konuya ilişkin daha ayrıntılı bilgi sunmaktadır. Örneğin “oda” terimi hem olumlu hem de olumsuz yorumlarda çok sık
kullanılmıştır. Bu terimin hangi terimle birlikte olumlu ve hangi terimle birlikte olumsuz yorumlarda
kullanıldığını tespit etmek odalar ile ilgili hangi konularda şikayet hangi konularda memnuniyet olduğunu anlamak açısından önemlidir. Bu bağlamda yukarıda sık geçen terimlerin hangi terimlerle
birlikte kullanıldığı yapılan N-gram analizi ile belirlenmiştir. Tablo 2’de “oda” terimine ilişkin
yapılan n-gram analizlerine yer verilmiştir.
Tablo 2. Oda ile Kullanılan Terimler
Nitelik 1 Nitelik 2 Toplam Belgede
Toplam Olumlu Olumsuz
Oda
1874 30 959 915
Temizlik 180
108 72
Güzel, Harika, İyi 149
137 12
Manzara 91
68 23
Size 90
72 18
Büyük 69
64 5
Konforlu 68
64 4
Konum 46
34 12
Kirli 44
1 43
Sigara 29
6 23
Upgrade 21
15 6
Tablo 2’de “oda” terimi ile birlikte kullanılan diğer terimlere yer verilmiştir. Bu terimler en genel ifade ile “oda” hakkında müşteriler tarafından hangi konuların konuşulduğunu göstermektedir. Bu
bağlamda bir sıralama yapılacak olursa müşterilerin odalar hakkında temizlik, manzara, büyüklük,
konum gibi konulara değindiği söylenebilir.
Tablo 3. Personel ile Kullanılan Terimler
Nitelik 1 Nitelik 2 Toplam Belgede Toplam Olumlu Olumsuz
Personel
1367 30 1087 280
Dost Canlısı 253
237 16
Harika, Güzel, Muhteşem 240 230 10
Yardımsever 164
156 8
Otel 114
86 28
Hizmet 29
24 5
Resepsiyon 72
41 31
Temizlik 62
55 7
Kaba 10
2 8
“Oda” terimi en sık temizlik terimi ile birlikte kullanılmıştır. Olumlu ve olumsuz yorum dağılımına bakıldığında ise hem olumlu hem de olumsuz yorumlarda sık geçtiği görülmektedir. Dolayısıyla bazı
müşterilerin oda temizliğinden memnun olduğu ve bazılarının ise memnun olmadığı anlaşılmaktadır.
Örnek olarak bir yorumda olumlu bölümde “Modern Temiz oda” olarak geçmekte iken başka bir yorumda olumsuz bölümde “Temiz olmayan oda” olarak geçmektedir. Genel anlamda oda büyüklüğü
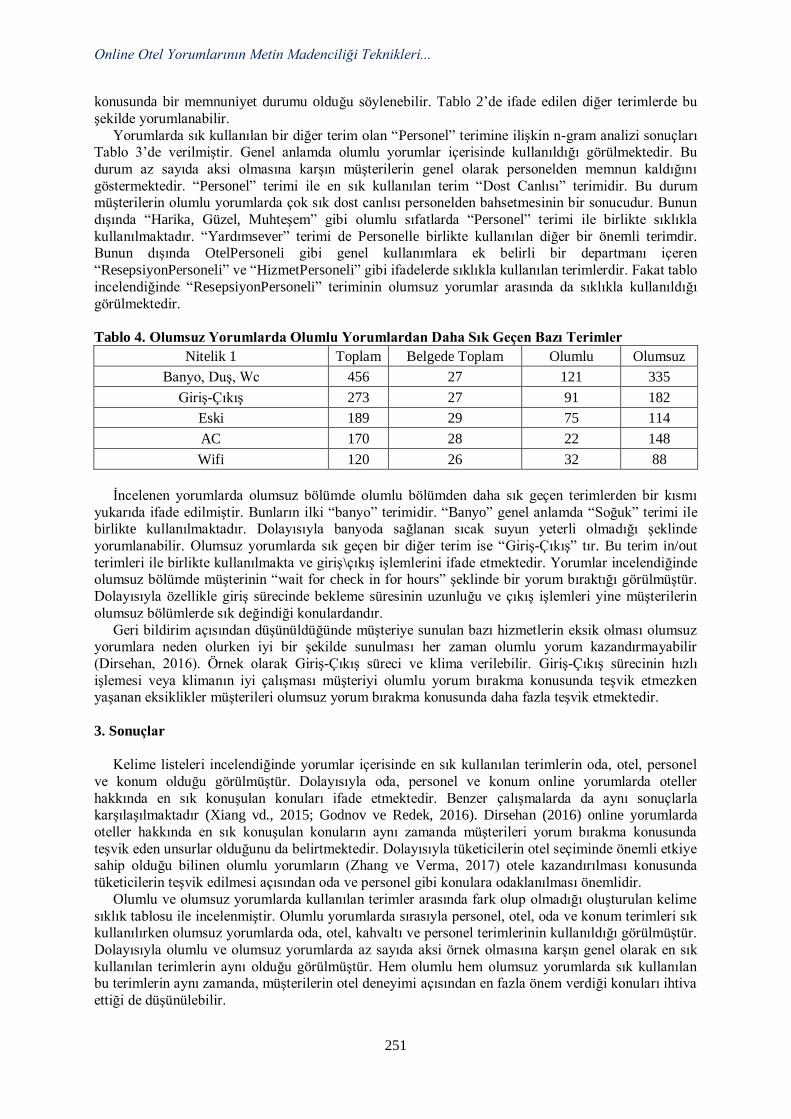
Online Otel Yorumlarının Metin Madenciliği Teknikleri...
251
konusunda bir memnuniyet durumu olduğu söylenebilir. Tablo 2’de ifade edilen diğer terimlerde bu
şekilde yorumlanabilir.
Yorumlarda sık kullanılan bir diğer terim olan “Personel” terimine ilişkin n-gram analizi sonuçları Tablo 3’de verilmiştir. Genel anlamda olumlu yorumlar içerisinde kullanıldığı görülmektedir. Bu
durum az sayıda aksi olmasına karşın müşterilerin genel olarak personelden memnun kaldığını
göstermektedir. “Personel” terimi ile en sık kullanılan terim “Dost Canlısı” terimidir. Bu durum müşterilerin olumlu yorumlarda çok sık dost canlısı personelden bahsetmesinin bir sonucudur. Bunun
dışında “Harika, Güzel, Muhteşem” gibi olumlu sıfatlarda “Personel” terimi ile birlikte sıklıkla
kullanılmaktadır. “Yardımsever” terimi de Personelle birlikte kullanılan diğer bir önemli terimdir. Bunun dışında OtelPersoneli gibi genel kullanımlara ek belirli bir departmanı içeren
“ResepsiyonPersoneli” ve “HizmetPersoneli” gibi ifadelerde sıklıkla kullanılan terimlerdir. Fakat tablo
incelendiğinde “ResepsiyonPersoneli” teriminin olumsuz yorumlar arasında da sıklıkla kullanıldığı
görülmektedir.
Tablo 4. Olumsuz Yorumlarda Olumlu Yorumlardan Daha Sık Geçen Bazı Terimler
Nitelik 1 Toplam Belgede Toplam Olumlu Olumsuz
Banyo, Duş, Wc 456 27 121 335
Giriş-Çıkış 273 27 91 182
Eski 189 29 75 114
AC 170 28 22 148
Wifi 120 26 32 88
İncelenen yorumlarda olumsuz bölümde olumlu bölümden daha sık geçen terimlerden bir kısmı
yukarıda ifade edilmiştir. Bunların ilki “banyo” terimidir. “Banyo” genel anlamda “Soğuk” terimi ile birlikte kullanılmaktadır. Dolayısıyla banyoda sağlanan sıcak suyun yeterli olmadığı şeklinde
yorumlanabilir. Olumsuz yorumlarda sık geçen bir diğer terim ise “Giriş-Çıkış” tır. Bu terim in/out
terimleri ile birlikte kullanılmakta ve giriş\çıkış işlemlerini ifade etmektedir. Yorumlar incelendiğinde olumsuz bölümde müşterinin “wait for check in for hours” şeklinde bir yorum bıraktığı görülmüştür.
Dolayısıyla özellikle giriş sürecinde bekleme süresinin uzunluğu ve çıkış işlemleri yine müşterilerin
olumsuz bölümlerde sık değindiği konulardandır.
Geri bildirim açısından düşünüldüğünde müşteriye sunulan bazı hizmetlerin eksik olması olumsuz yorumlara neden olurken iyi bir şekilde sunulması her zaman olumlu yorum kazandırmayabilir
(Dirsehan, 2016). Örnek olarak Giriş-Çıkış süreci ve klima verilebilir. Giriş-Çıkış sürecinin hızlı
işlemesi veya klimanın iyi çalışması müşteriyi olumlu yorum bırakma konusunda teşvik etmezken yaşanan eksiklikler müşterileri olumsuz yorum bırakma konusunda daha fazla teşvik etmektedir.
3. Sonuçlar
Kelime listeleri incelendiğinde yorumlar içerisinde en sık kullanılan terimlerin oda, otel, personel
ve konum olduğu görülmüştür. Dolayısıyla oda, personel ve konum online yorumlarda oteller
hakkında en sık konuşulan konuları ifade etmektedir. Benzer çalışmalarda da aynı sonuçlarla karşılaşılmaktadır (Xiang vd., 2015; Godnov ve Redek, 2016). Dirsehan (2016) online yorumlarda
oteller hakkında en sık konuşulan konuların aynı zamanda müşterileri yorum bırakma konusunda
teşvik eden unsurlar olduğunu da belirtmektedir. Dolayısıyla tüketicilerin otel seçiminde önemli etkiye sahip olduğu bilinen olumlu yorumların (Zhang ve Verma, 2017) otele kazandırılması konusunda
tüketicilerin teşvik edilmesi açısından oda ve personel gibi konulara odaklanılması önemlidir.
Olumlu ve olumsuz yorumlarda kullanılan terimler arasında fark olup olmadığı oluşturulan kelime
sıklık tablosu ile incelenmiştir. Olumlu yorumlarda sırasıyla personel, otel, oda ve konum terimleri sık kullanılırken olumsuz yorumlarda oda, otel, kahvaltı ve personel terimlerinin kullanıldığı görülmüştür.
Dolayısıyla olumlu ve olumsuz yorumlarda az sayıda aksi örnek olmasına karşın genel olarak en sık
kullanılan terimlerin aynı olduğu görülmüştür. Hem olumlu hem olumsuz yorumlarda sık kullanılan bu terimlerin aynı zamanda, müşterilerin otel deneyimi açısından en fazla önem verdiği konuları ihtiva
ettiği de düşünülebilir.
E. Akgöz ve E. Tengilimoğlu
252
Olumlu ve olumsuz yorumlarda sık kullanılan terimlere ilişkin n-gram analizi uygulanarak hangi
terimlerle hangi alanda kullanıldığı tespit edilmiştir. Örneğin oda terimi olumlu alanda en sık temiz
terimi ile birlikte kullanılırken olumsuz alanda genel olarak kirli ve koku terimleri ile birlikte kullanıldığı görülmüştür. Dolayısıyla odaların temizlik durumu hem olumlu hem de olumsuz yorum
bırakma konusunda tüketicilerin önemsediği bir konudur.
3.1 Bakü Otellerine İlişkin Sonuçlar
Tüketicilerin rezervasyon öncesinde online yorumları incelemeleri (Hu vd., 2017) ve karar süreçlerinde yorumlardan faydalanmaları (Zhang ve Verma, 2017) konaklama sektörünün online
yorumlardan önemli ölçüde etkilenmesine neden olmaktadır (Liu vd., 2018). Dolayısıyla otellerin
online ortamlardaki yorumları yönetmesi (Hargreaves, 2015) ve bu yorumlardan müşterilerinin
deneyimleri hakkında çıkarımlar yaparak sunduğu ürünleri geliştirmesi önemli bir konudur Dirsehan (2016) bu konuda başarısız olan işletmelerin yaşamlarını sürdürmeleri konusunda sorunlarla karşı
karşıya kalabileceklerini belirtmektedir. Bu bağlamda Bakü’nün 5 yıldızlı otellerine ilişkin online
yorumlardan yapılacak olan çıkarımlar hem işletmelere rekabet avantajı sağlama konusunda (He vd., 2017) hem de yönetim ve pazarlamaya ait kararların alınmasında (Zhang ve Verma, 2017) faydalı
bilgiler sağlayacaktır.
Yapılan kelime sıklık analizlerinde ilgili terimlerin olumlu ve olumsuz alanlardaki değişim yüzdeleri de hesaplanmıştır. Hesaplanan değişim yüzdeleri 5 yıldızlı Bakü otellerine ilişkin hangi
konularda olumlu hangi konularda olumsuz düşüncelerin var olduğunu göstermektedir. Özetle
Personel (Değişim %288) ve konum (Değişim %308) ile ilgili konularda olumlu düşüncelerin ağır
bastığı fakat odalar (Değişim %5) ile ilgili konularda neredeyse olumlu ve olumsuz düşüncelerin eşit olduğu görülmektedir. Dolayısıyla odalarla ilgili hangi konuların olumsuz yorumlara yansıdığının
araştırılması önem arz etmektedir. Yapılan incelemede odalarla ilgili yaşanan en temel sorunun
temizlik olduğu görülmektedir. İncelemeye alınan 15 otelin büyük bir kısmında temizlik temelli oda sorunlarının yaşandığı söylenebilir. Bu sorunun giderilmesi aynı zamanda oteller hakkında oluşturulan
olumsuz yorumlarında önüne geçebilir. Ayrıca Kahvaltıda müşterilerin yoğun olarak olumsuz yorum
bıraktığı konulardandır. Burada ortaya çıkan problemin ise genel olarak çeşit ve ek ücret talep
edilmesi ile ilişkili olduğu yapılan n-gram analizi sonuçlarından anlaşılmaktadır. 5 yıldızlı Bakü otellerine ilişkin olumsuz yorumlarda sıklıkla geçen bir diğer terim banyodur.
Müşteriler tarafından koku, sıcak su eksikliği gibi konulardan dolayı sürekli olumsuz yorumlara konu
olmaktadır. Ek olarak giriş çıkış işlemlerinin uzun sürmesi, klima ve Wifi de 5 yıldızlı Bakü otellerine ilişkin online yorumlarda sık konuşulan olumsuz durumlardandır. Özellikle otellerin birbirlerine
ilişkin rekabet üstünlüğü sağlamaları genel anlamda müşterilerin olumsuz deneyim yaşadığı bu
konularda yapacakları iyileştirmelerle mümkün olacaktır.
Kaynaklar
Akgöz, E., ve Tengilimoğlu, E. (2015) Online müşteri değerlendirmelerinin, tesis özellikleri açısından incelenmesi; booking.com örneği. 16. Ulusal Turizm Kongresi Bildiriler Kitabı, 145.
Amaro, S. and Duarte P. (2015). An integrative model of consumers' intentions to purchase travel
online. Tourism Management, 46(2015):64-79. Balouchi, M., Aziz, Y., A., Rahman, A., Hasangholipour, T., Khanlari, A., Rahmani A., A. and Raja-
Yusof, R., N. (2017). Explaining and predicting online tourists’ behavioural intention in accepting
consumer generated contents, Journal of Hospitality and Tourism Technology, 8(2):168-189. Bilgihan, A. (2012). The role of flow in creatıng e-loyalty: the case of online hotel booking websites.
Doctor of Philosophy Dissertation, University of Central Florida, Orlando, Florida.
Buhalis, D. and Law, R. (2008). Progress in information technology and tourism management: 20
years on and 10 years after the Internet-The state of eTourism research. Tourism Management, 29(2008):609-623.
Chu, W., T. and Huang, W., H. (2017). Cultural difference and visual information on hotel rating
prediction. World Wide Web, 20(2017):595–619.
Online Otel Yorumlarının Metin Madenciliği Teknikleri...
253
Dirsehan, T. (2016). An Application of Text Mining to Capture and Analyze eWOM: A Pilot Study on
Tourism Sector. In Rathore, S. and Panwar, A. (Ed.) Capturing, Analyzing, and Managing Word of
Mouth in the Digital Marketplace.(pp. 168-186). IGI Global, USA. Emarketer (2018). Global digital travel sales 2018. https://www.emarketer.com/content/global-digital-
travel-sales-2018. Access Date; 10.12.2018.
Ertek, G., Tapucu, D., and Arın, I. (2013). Text Mining with RapidMiner. In: Markus Hofmann, Ralf Klinkenberg (Eds.) RapidMiner: Data Mining Use Cases and Business Analytics Applications.
Chapman & Hall/CRC Data Mining and Knowledge Discovery Series. Chapman and Hall/CRC.
Fang, B., Ye, Q., Kucukusta, D. and Law, R. (2016). Analysis of the perceived value of online tourism reviews: Influence of readability and reviewer characteristics. Tourism Management,
52(2016):498-506.
Fazzolari, M. and Petrocchi, M. (2018). A study on online travel review through intelligent data
analysis. Information Technology & Tourism, 20(1–4): 37–58. Godnov, U. and Redek, T. (2016). Application of text mining in tourism: Case of Croatia. Research
Notes and Reports / Annals of Tourism Research, 58(2016):156–170.
Hu, Y., H., Chen, Y., L. and Chou, H., L. (2017). Opinion mining from online hotel reviews –A text summarization approach. Information Processing and Management, 53(2017):436-449.
Lee, P. J., Hu, Y. H. and Lu, K. T. (2018). Assessing the helpfulness of online hotel reviews: A
classification-based approach. Telematics and Informatics, 35(2018):436–445. Liu, Z., Zhang, Z., Law, R. and Zhang, A. (2019). Posting reviews on OTAs: Motives, rewards and
effort. Tourism Management, 70(2019):230–237.
Muneta, A. & Elena, M. & Andrea, O. L. (2013). ICT Impact on tourism industry. International
Journal of Management Cases, 15(2), 2013, 87-98. Nusair, K. & Parsa, H.G. (2011). Introducing flow theory to explain the interactive online shopping
experience in a travel context. International Journal of Hospitality Tourism Administration 121, 1–
20. Phillips, P., Zigan, K., Silva, M.M.S. and Schegg, R. (2015). The interactive effects of online reviews
on the determinants of Swiss hotel performance: a neural network analysis. Tourism Management,
50(2015):130-141
Tengilimoğlu, E., Göral, R. ve Akgöz, E. (2017) Olumlu ve olumsuz geri bildirimlerin memnuniyet düzeylerine göre incelenmesi: Booking.com örneği. 18. Ulusal Turizm Kongresi Bildiriler Kitabı,
556.
Tengilimoğlu, E. ve Öztürk, Y. (2019) online yorumların faydalı bulunma durumunun incelenmesi: Konaklama işletmeleri üzerine bir araştırma. 20. Ulusal Turizm Kongresi Bildiriler Kitabı, 659.
TripAdvisor (2016). TripBarometer, Traveler Trends & Motivations Global Findings.
Wong, C. U. I and Qi, S. (2017). Tracking the evolution of a destination's image by text-mining online reviews - the case of Macau. Tourism Management Perspectives, 23(2017):19-29.
Xiang, Z., Schwartz, A., Gerdes, J., H. and Uysal, M. (2015). What can big data and text analytics tell
us about hotel guest experience and satisfaction? International Journal of Hospitality Management,
44(2015):120–130. Zhang, J. J., and Verma, R. (2017). What matters most to your guests: An exploratory study of online
reviews. Cornell Hospitality Report, 17(4):3-13.
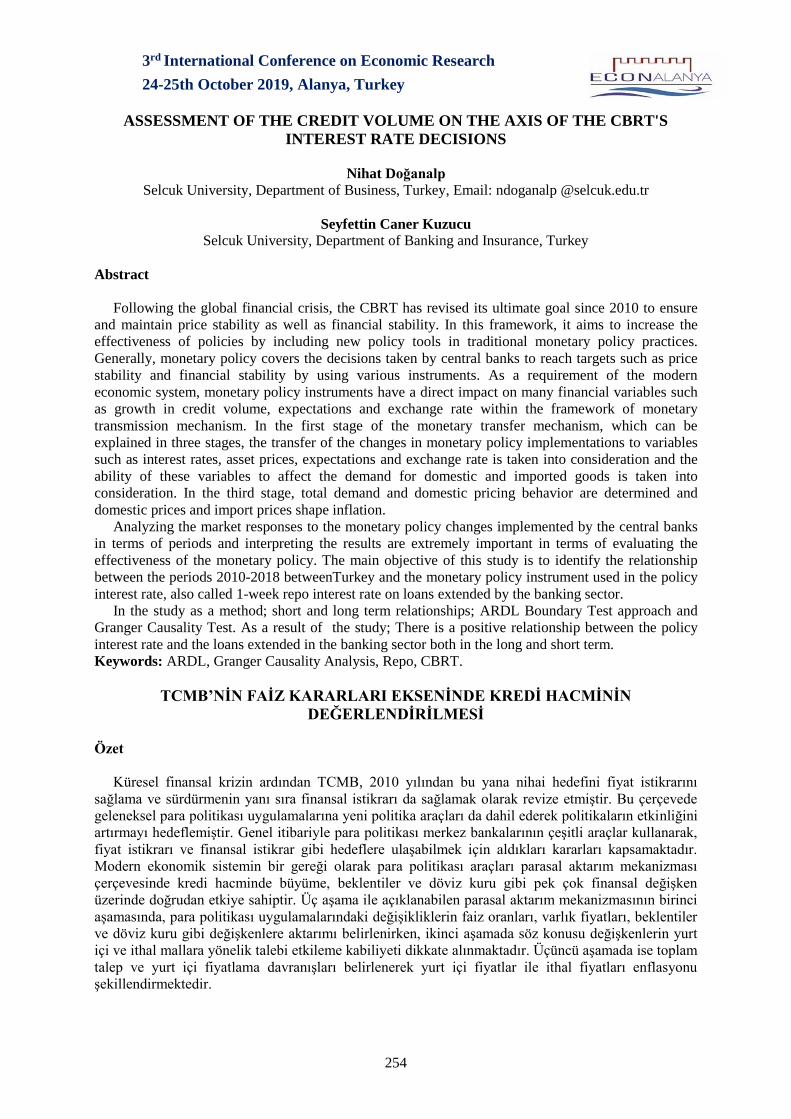
3rd International Conference on Economic Research
24-25th October 2019, Alanya, Turkey
254
ASSESSMENT OF THE CREDIT VOLUME ON THE AXIS OF THE CBRT'S
INTEREST RATE DECISIONS
Nihat Doğanalp
Selcuk University, Department of Business, Turkey, Email: [email protected]
Seyfettin Caner Kuzucu
Selcuk University, Department of Banking and Insurance, Turkey
Abstract
Following the global financial crisis, the CBRT has revised its ultimate goal since 2010 to ensure
and maintain price stability as well as financial stability. In this framework, it aims to increase the
effectiveness of policies by including new policy tools in traditional monetary policy practices.
Generally, monetary policy covers the decisions taken by central banks to reach targets such as price
stability and financial stability by using various instruments. As a requirement of the modern
economic system, monetary policy instruments have a direct impact on many financial variables such
as growth in credit volume, expectations and exchange rate within the framework of monetary
transmission mechanism. In the first stage of the monetary transfer mechanism, which can be
explained in three stages, the transfer of the changes in monetary policy implementations to variables
such as interest rates, asset prices, expectations and exchange rate is taken into consideration and the
ability of these variables to affect the demand for domestic and imported goods is taken into
consideration. In the third stage, total demand and domestic pricing behavior are determined and
domestic prices and import prices shape inflation.
Analyzing the market responses to the monetary policy changes implemented by the central banks
in terms of periods and interpreting the results are extremely important in terms of evaluating the
effectiveness of the monetary policy. The main objective of this study is to identify the relationship
between the periods 2010-2018 betweenTurkey and the monetary policy instrument used in the policy
interest rate, also called 1-week repo interest rate on loans extended by the banking sector.
In the study as a method; short and long term relationships; ARDL Boundary Test approach and
Granger Causality Test. As a result of the study; There is a positive relationship between the policy
interest rate and the loans extended in the banking sector both in the long and short term.
Keywords: ARDL, Granger Causality Analysis, Repo, CBRT.
TCMB’NİN FAİZ KARARLARI EKSENİNDE KREDİ HACMİNİN
DEĞERLENDİRİLMESİ
Özet
Küresel finansal krizin ardından TCMB, 2010 yılından bu yana nihai hedefini fiyat istikrarını
sağlama ve sürdürmenin yanı sıra finansal istikrarı da sağlamak olarak revize etmiştir. Bu çerçevede
geleneksel para politikası uygulamalarına yeni politika araçları da dahil ederek politikaların etkinliğini
artırmayı hedeflemiştir. Genel itibariyle para politikası merkez bankalarının çeşitli araçlar kullanarak,
fiyat istikrarı ve finansal istikrar gibi hedeflere ulaşabilmek için aldıkları kararları kapsamaktadır.
Modern ekonomik sistemin bir gereği olarak para politikası araçları parasal aktarım mekanizması
çerçevesinde kredi hacminde büyüme, beklentiler ve döviz kuru gibi pek çok finansal değişken
üzerinde doğrudan etkiye sahiptir. Üç aşama ile açıklanabilen parasal aktarım mekanizmasının birinci
aşamasında, para politikası uygulamalarındaki değişikliklerin faiz oranları, varlık fiyatları, beklentiler
ve döviz kuru gibi değişkenlere aktarımı belirlenirken, ikinci aşamada söz konusu değişkenlerin yurt
içi ve ithal mallara yönelik talebi etkileme kabiliyeti dikkate alınmaktadır. Üçüncü aşamada ise toplam
talep ve yurt içi fiyatlama davranışları belirlenerek yurt içi fiyatlar ile ithal fiyatları enflasyonu
şekillendirmektedir.
TCMB’nin Faiz Kararları Ekseninde...
255
Merkez bankalarının dönemler itibariyle uyguladığı para politikası değişikliklerine piyasaların
verdiği tepkileri analiz etmek ve sonuçlarını yorumlayabilmek uygulanan para politikasının etkinliğini
değerlendirmek açısından son derece önemlidir.Bu çalışmanın temel amacı 2010-2018 dönemleri
arasında Türkiye’de para politikası aracı olarak kullanılan politika faiz oranı olarak da adlandırılan 1
haftalık repo faiz oranı ile bankacılık sektöründe kullandırılan krediler arasındaki ilişkiyi tespit
edebilmektir.
Yöntem olarak çalışmada; kısa ve uzun dönem ilişkiler; ARDL Sınır Testi yaklaşımı ve Granger
Nedensellik Testi ile analiz edilmiştir. Çalışmanın sonucunda; politika faiz oranı ile bankacılık
sektöründe kullandırılan krediler arasında hem uzun hem de kısa dönemde pozitif yönlü bir ilişkinin
olduğu diğer bir ifade ile her iki değişkenin de uzun dönemde birlikte hareket ettiği ve söz konusu iki
değişken arasında çift yönlü nedensellik ilişkisi tespit edilmiştir.
Anahtar Kelimeler: ARDL, Granger Nedensellik Analizi, Repo, TCMB.
1. Giriş
Küresel finansal krizin ardından TCMB, 2010 yılından bu yana nihai hedefini fiyat istikrarını
sağlama ve sürdürmenin yanı sıra finansal istikrarı da sağlamak olarak revize etmiştir. Bu çerçevede
geleneksel para politikası uygulamalarına yeni politika araçları da dahil ederek politikaların etkinliğini
artırmayı hedeflemiştir. Genel itibariyle para politikası merkez bankalarının çeşitli araçlar kullanarak,
fiyat istikrarı ve finansal istikrar gibi hedeflere ulaşabilmek için aldıkları kararları kapsamaktadır.
Modern ekonomik sistemin bir gereği olarak para politikası araçları parasal aktarım mekanizması
çerçevesinde kredi hacminde büyüme, beklentiler ve döviz kuru gibi pek çok finansal değişken
üzerinde doğrudan etkiye sahiptir. Üç aşama ile açıklanabilen parasal aktarım mekanizmasının birinci
aşamasında, para politikası uygulamalarındaki değişikliklerin faiz oranları, varlık fiyatları, beklentiler
ve döviz kuru gibi değişkenlere aktarımı belirlenirken, ikinci aşamada söz konusu değişkenlerin yurt
içi ve ithal mallara yönelik talebi etkileme kabiliyeti dikkate alınmaktadır. Üçüncü aşamada ise toplam
talep ve yurt içi fiyatlama davranışları belirlenerek yurt içi fiyatlar ile ithal fiyatları enflasyonu
şekillendirmektedir.
Merkez bankalarının dönemler itibariyle uyguladığı para politikası değişikliklerine piyasaların
verdiği tepkileri analiz etmek ve sonuçlarını yorumlayabilmek uygulanan para politikasının etkinliğini
değerlendirmek açısından son derece önemlidir. Bu çalışmanın temel amacı 2010-2018 dönemleri
arasında Türkiye’de para politikası aracı olarak kullanılan politika faiz oranı olarak da adlandırılan 1
haftalık repo faiz oranı ile bankacılık sektöründe kullandırılan krediler arasındaki ilişkiyi tespit
edebilmektir.
2. Literatür
Son yıllarda parasal aktarım mekanizması konusunda yapılan çalışma sayısında bir artış
gözlenmekle birlikte, sadece faiz kanalını ele alıp inceleyen çalışma sayısının az olduğu
görülmektedir.
Kuttner (2000) çalışmasında, Fed para politikası sürprizlerinin tahvil faiz oranları vegetirisi
üzerindeki etkisini Haziran 1989 – Şubat 2000 arası dönemde VAR modeli kullanarakincelemiştir.
Kuttner çalışmada, Fed tarafından beklenmeyen para politikası şokları karşısındatahvil faizlerinin hızlı
ve önemli bir tepki verdiği, beklenen para politikası şokları karşısında isetahvil faizlerinin yanıt
vermediği sonucuna ulaşmıştır.
Ellingsen ve Soderstrom (2001) çalışmalarında, 2001 krizi öncesi dönemde para
politikasıdeğişiklikleri ile piyasa faiz oranları arasındaki ilişkiyi VAR modeli kullanarak
incelemişlerdir.Buna göre merkez bankaları tarafından uygulanan sıkı para politikasının enflasyon
beklentilerinidüşürmesi sebebiyle kısa dönem faiz oranlarını yükselttiği ancak uzun dönem faiz
oranlarınıdüşürdüğü sonucuna ulaşılmıştır.
Butzenvd. (2001), para politikasının firma yatırım davranışları üzerindeki etkilerini incelemiş ve
faiz kanalına ilişkin çıkarım yapmıştır. 1985-1998dönemi için Belçika firmalarını içeren bu çalışmanın
kapsamlı bir veri setinedayanması konunun sektörel ve firma büyüklüğü açısından ayırım yapılarak
araştırılmasını mümkün kılmıştır. Sonuçlar genel olarak Belçika’da faiz kanalının işleyişi ile ilgili
hipotezi desteklemiştir. Küçük firmaların büyük firmalaragöre para politikasına daha duyarlı olduğu
N. Doğanalp ve S. C. Kuzucu
256
görülmüş, faiz kanalının küçük firmalar için daha güçlü olduğu sonucu çıkarılmıştır. Ayrıca parasal bir
daralmanın ardından sermaye yoğun sektörlerin sermaye stoklarını daha fazla azaltması ve hizmet
sektörünün önemli ölçüde etkilenmemesi faiz kanalının sermaye yoğun sektörler için daha önemli
olduğunu göstermiştir.
Peersman (2001: 1-48), Euro bölgesi için 1980-1998 dönemini kapsayansentetik verileri kullanarak
VAR modeli ile para politikasındaki beklenmeyen değişmelerin makroekonomik etkilerini
incelemiştir. Elde edilen sonuçlar parasalaktarım kanalları içerisinde geleneksel faiz kanalının en
önemli kanal olduğunu göstermiştir. Ayrıca ürün taleplerinin faize duyarlılıklarındaki
farklılıklardandolayı para politikasının etkisinin önemi ve zamanına ilişkin endüstrilerarasında
farklılık görülmektedir. Nitekim dayanıklı mallar üreten endüstrilerin ve sermaye yoğun endüstrilerin
para politikası sokuna büyük ölçüde daha fazla tepki gösterdiği yönünde güçlü ampirik bulgu elde
edilmiştir. Bu noktadan hareketlefaiz kanalının Hollanda, Belçika ve İrlanda’da daha zayıf, Almanya
vePortekiz’de nispeten daha güçlü olabileceği ileri sürülmüştür.
Sellon (2002), finansal sistemdeki değişmelerin faiz kanalının işleyişini nasıl etkilediğini
incelemiştir. Bu çerçevede deregülasyon, sermaye piyasasının gelişmesi, yeni finansal araçların ortaya
çıkması ve para politikasının şeffaflığınınartması gibi ABD finansal sisteminin yapısında ortaya çıkan
değişmelerinparasal aktarım mekanizmasında meydana getirdiği değişiklikler açısından önemli olup
olmadığına bakılmıştır. Söz konusu gelişmeler neticesinde parapolitikası uygulamalarının faiz oranları
üzerinde daha hızlı ve daha büyük tepki meydana getirdiği sonucuna ulaşılmıştır. Bu durum faiz
kanalının güçlendiği seklinde yorumlanmıştır.
Coffinet (2005), Avrupa Birliği ülkeleri arasında, ortak para politikası uygulaması ile birlikte,
özellikle Fransa’da, parasal aktarım mekanizmasının hızı ve önemi ile ilgili nasıl değişmelerin ortaya
çıktığı ve faiz kanalının Euro alanında önemli ölçüde bir homojenliğeyol açıp açmadığı sorularına
cevap aramış- tır. Çalışmanın temel bulguları; ortak para politikası uygulamasının ardından parasal
birlik içerisinde artan rekabetten dolayı para piyasası faizlerinin banka faizlerine daha hızlı yansıdığı
ve bunun özellikle Fransa’da daha belirgin olduğu, parasal aktarım mekanizmasının homojenlik
derecesinde ise önemli artışortaya çıktığı şeklinde sıralanmıştır.
Yue ve Zhou (2007) ise çalışmalarında, Granger nedensellik testini kullanarakÇin’de parasal
aktarım mekanizmasının geleneksel faiz kanalı üzerinden işlemediği sonucuna ulaşmışlardır. Sonuçlar
ne yatırım harcamaları ve piyasafaiz oranı arasında ne de tüketim harcamaları ve piyasa faiz oranı
arasında bir nedenselliğin olmadığını göstermiştir. Çin’de para politikasının aktarımını engellediği
düşünülen nedenlerden üç tanesi; faizlerin liberalizasyonu, varlığa dayalı menkul kıymetleştirme ve
hane halkı tüketim davranışıdır. Faiz sisteminde liberalizasyonun tamamlanmamış olmasının ve
varlığa dayalı menkulleşmeninfinansal piyasalarda kaos meydana getirmesinin, para politikasının
etkinliğini zayıflattığı ve Çin kent sakinlerinin tüketim davranışında değişmelere yol açan iktisadi
değişimin, para politikasının aktarımına engel olan önemli bir unsur olduğu sonucuna ulaşılmıştır.
Mehrotra (2007), parasal rejimleri farklı ancak birbirine sıkı bağlı üç ekonomiolan Japonya, Hong
Kong ve Çin’de deflasyon dönemlerini kapsayacak şekilde, açık ekonomi yapısal vektör otoregresif
(SVAR) modellerini tahminederek, döviz ve faiz oranı kanalının rolünü incelemiştir. Faiz oranı ve
döviz kuru şoklarının her üç ekonomide de fiyat hareketlerini kontrol etmede önemli olup olmadığının
tespiti, analizin odak noktasını oluşturmuştur. Bu çerçevedefaiz şoklarının fiyatlar üzerindeki etkisinin
Japonya ve Hong Kong’da son derece güçlü olduğu bulunmuştur. Çin’de ise faiz oranlarının önemli
bir para politikası aracı olmadığı ve ne döviz ne de faiz şoklarının fiyatların gelişimini önemli ölçüde
etkilemediği sonucuna ulaşılmıştır.
Türkiye üzerine yapılan değerlendirmelere bakıldığında ise; Şahinbeyoğlu(2001), Gündüz (2001),
Çiçek (2005) ve Basçı vd.(2007)’nın çalışmaları dikkatiçekmektedir.
Şahinbeyoglu (2001), Türkiye’de ücretler ve fiyatların hızlı bir şekilde ayarlandığını ve daha
istikrarlı ekonomilerle karşılaştırıldığında yüksek enflasyonluülkelerde fiyatların belirlenmesinde
enflasyon beklentilerinin önemli rol oynadığını ileri sürmektedir. Çalışmada yüksek düzeylerde
gerçeklesen reel faiz oranlarının Türkiye’de yaşanan yüksek enflasyonun hem nedeni hem de sonucu
olduğu ve dolayısıyla parasal aktarım mekanizmasının işleyişini zayıflattığı tespit edilmiştir.
Gündüz (2001), VAR modelini kullanarak Türkiye’de banka kredi kanalınınrolünü makro veriler
yardımıyla incelemiştir. Aylık verilerin kullanıldığı çalışma 1986-1998 dönemini kapsamıştır. Kredi
ve üretimin etki tepkilerindeki zamanlama ile varyans ayrıştırması sonuçları banka kredi kanalını
destekler birgörüntü arz etmiştir. Ancak söz konusu desteğin sınırlı olduğu ifade edilmiştir.Banka
TCMB’nin Faiz Kararları Ekseninde...
257
kredi kanalına sınırlı destek veren bulgular geleneksel faiz kanalının işlediğini de ortaya koymuştur.
Zira analiz sonuçlarının sıkı para politikasının para arzında bir düşüşe ve ardından da nominal gelirde
azalmaya yol açmasıseklinde ifade edilen para görüsü veya faiz kanalı ile de uyum içerisinde olduğu
gözlemlenmiştir.
Çiçek (2005), VAR modelini kullanarak 1995Q1- 2003Q2 dönemi içinTürkiye’de parasal aktarım
mekanizmasını incelemiştir. Çalışmada yatırım harcamalarının parasal şoklara önemli ölçüde duyarlı
olduğu gözlemlenmiştir. Parasalbir sok karsısında yatırımların düşmesinin parasal aktarım
mekanizmasınıngeleneksel faiz kanalı ile tutarlı olduğu seklinde yorumlanmıştır. Çiçek, ayrıcafaiz
kanalının parasal aktarımda en iyi isleyen kanal olduğu sonucuna ulaşmıştır.
Basçı vd. (2007), Türkiye’de parasal aktarım kanallarına ilişkin hem nitelhem de nicel bulgulara
dayanarak aktarım mekanizmasındaki değişmeleri incelemiştir. Şubat 2001 krizi öncesinde yaşanan
yüksek ve değişken enflasyon veartan kamu borcu nedeniyle faizlerin yüksek düzeylerde seyretmesi,
ekonomik ajanların faizlere duyarlılığını azaltmıştır. Ancak kriz sonrasında uygulamaya konulan güçlü
ekonomiye geçiş programının hem enflasyon hem de faiz oranlarını makul düzeylere indirmede
başarılı olması, faiz ile harcama kararları arasındaki bağlantıyı önemli ölçüde güçlendirmiştir. Ayrıca
enflasyon hedeflemesi stratejisine geçiş ve bunun temel politika aracı olarak kısa vadeli faizlerin
kullanımınıgerektirmesi ve parasal otoritenin faizleri kullanarak enflasyon beklentileriniyönlendirme
imkanı elde etmesi gibi politika değişikliklerinin faiz kanalınıgüçlendireceği yorumu yapılmıştır.
Özetle 2001 krizi sonrasında faiz kanalının öneminin giderek arttığı sonucuna ulaşılmıştır.
Duran ve diğerleri (2010) çalışmalarında, TCMB faiz kararlarının hisse senedi fiyatlarıüzerindeki
etkisini incelemişlerdir. Bu çalışmada, para politikasının Türkiye’deki hisse senedifiyatları üzerindeki
etkisi, eşzamanlılık sorununa etkili bir çözüm olan değişen oynaklığa dayalıbelirleme yöntemi ile
2004-2008 dönemi verileri kullanılarak tahmin edilmiştir. Çalışmadapolitika faizlerindeki artışların
başta mali sektör endeksi olmak üzere hisse senedi fiyatlarınıdüşürdüğü sonucuna ulaşılmıştır.
Başçı ve Kara (2011) gözleme dayalı çalışmalarında, TCMB tarafından uygulanan düşükpolitika
faiz oranı, yüksek zorunlu karşılıklar ve geniş bir faiz koridorundan oluşan yeni para politikası
bileşimini değerlendirmişlerdir. Türkiye’de faiz koridorunun henüz uygulanmayabaşladığı dönemde
yapılan çalışmanın sonucunda, yeni para politikası stratejisinin etkilerinideğerlendirmek için erken
olduğu düşünülse de, yeni politika bileşiminin, özellikle yüksek cariaçık veren ülkelerde kısa vadeli
sermaye hareketlerinin makroekonomik dengesizlikler üzerindekietkisini hafifletmek için etkili bir
strateji olabileceğini ifade etmişlerdir.
Küçük ve diğerleri (2013) gözleme dayalı çalışmalarında, gecelik piyasa faizi dinamiklerinindaha
iyi anlaşılması amacıyla BIST faiz farkının belirleyicilerini araştırmışlar ve likidite yönetimiile faiz
koridorunun söz konusu faiz farkı üzerinde etkili olduğu sonucuna ulaşmışlardır. AyrıcaTCMB
politikalarıyla doğrudan veya dolaylı yoldan ilişkili diğer birçok faktörün de bu faiz farkıüzerinde
etkili olduğunu belirtmişlerdir.
Tokucu (2013) gözleme dayalı çalışmasında, Türkiye’de para politikası uygulanmasında
örnekmerkez bankaları deneyimlerini incelemiştir. Tokucu çalışmasının sonucunda; bir para
politikasıstratejisi olarak koridor uygulamasının, merkez bankalarının karmaşık bir finansal ve
ekonomiksistem içerisinde aynı anda hem fiyat istikrarına hem de finansal istikrara
odaklanmalarınımümkün kılan bir sistem olduğunu ifade etmiştir.
Vural (2013) gözleme dayalı çalışmasında, enflasyon hedeflemesi uygulayan ülkeler olanAmerika
Birleşik Devletleri, İngiltere, Çin, Japonya ve AMB’nin 2009-2012 yılları arasındauyguladıkları
geleneksel olmayan para politikalarını incelemiştir. Son olarak da TCMB’nin 2008küresel krizi
sonrası dönemde uyguladığı geleneksel olmayan para politikaları ve bu politikalarınperformansını
değerlendirmiştir. Vural, geleneksel olmayan para politikaları genel olarak küreselkriz sonrası
dönemde uygulanmaya başlandığından bu politikaların etkinliğini ölçmek içinyeterli araç ve veri
bulunmadığını, hangi durumda hangi politikanın uygulanması gerektiği yada hangi politikanın daha
başarılı olacağı konusunda belirsizlikler bulunduğunu ifade etmiştir.
3. Veri Yöntem Analiz
Durağanlık kavramı, bir serinin ortalaması, varyansı ve otokovaryansının farklı zaman dilimlerinde
değişmemesini ifade eder. Seriler arasında sahte ilişkilereyer vermemek ve bir sokun etkisinin kalıcı
olmasını engellemek için serinin durağan olması önemlidir.
N. Doğanalp ve S. C. Kuzucu
258
Durağanlık araştırması için farklı testler kullanılabilir. Bunlardan en temelolanı Dickey-Fuller ve
Genisletilmis (Augmented) Dickey-Fuller Testi (1979,1981)’dir.
Tablo 1. Faiz Kararları Serisinin ADF Birim Kök Testi Sonuçları
ADF Test İstatistiği
Normal Form 1.661546
%1 -2.632688 Prob.
%5 -1.950687 0.9742
%10 -1.611059
Birinci Farklar Cinsinden -4.099906
%1 -2.634731 Prob.
%5 -1.951000 0.0002
%10 -1.610907
Tablo 2. Kredi Hacmi Serisinin ADF Birim Kök Testi Sonuçları
ADF Test İstatistiği
Normal Form 4.466702
%1 -2.634731 Prob.
%5 -1.951000 1.0000
%10 -1.610907
Birinci Farklar Cinsinden -2.892157
%1 -2.634731 Prob.
%5 -1.951000 0.0051
%10 -1.610907
Tablolarda gösterilen ADF test istatistiği incelendiğinde %1, %5 ve %10 anlamlılık düzeylerinde
Mac Kinnon kritik değerlerinden mutlak olarak küçük ve prob. değerleri de kritik değerlerden büyük
olduğu için H0 hipotezi reddedilemez ve serilerin durağan olmadığı görülürken, birinci dereceden
farkı alınan serilerin test sonuçları değerlendirildiğinde test istatistiği değeri %1, %5 ve %10
anlamlılık düzeylerinde Mac Kinnon kritik değerlerinden mutlak olarak büyük ve prob değerleri de
0,05 kritik değerinden küçük olduğu için Ho hipotezleri reddedilir ve seride birim kök sorunu
bulunmadığı ve serilerin durağan olduğu kabul edilir. Sonuç olarak serilerin durağan olmaması
nedeniyle 1.dereceden farkları alınarak durağan hale getirilmiştir.
Serilerin durağanlık analizinin ardından, değişkenler arasındaki ilişki için en uygun gecikme
uzunluğunun belirlenmesi gerekmektedir. Çalışmada en uygun gecikme uzunluğunun belirlenmesinde
Akaike Bilgi Kriteri(AIC) kullanılmış ve gecikme uzunluğu 2 olarak belirlenmiştir. Gecikme
uzunluğunun belirlenmesinin ardından ARDL sınır testi yapılmıştır.
4. ARDL Sınır Testi
ARDL Sınır Testi veya gecikmesi dağıtılmış otoregresif sınır testi, M.H. Pesaran ve Y. Shin
tarafından 2001 yılında geliştirilen test, seviyelerinde durağan olmayan en az iki serinin durağan bir
bileşimi olduğunu ifade eden eşbütünleşme kavramını test etmek amacıyla kullanılan modeldir. Uzun
ve kısa dönem nedensellik ilişkilerini yakalamaya yarayan modeldir. Bu eşbütünleşme testinde, diğer
eşbütünleşme testlerinde olduğu gibi aralarındaki eşbütünleşme ilişkisi incelenen serilerin aynı
dereceden durağan olmaları şartı bulunmamaktadır (ZENGİN, 2018, s. 69).
Tablo 3. ARDL Sınır Testi Sonuçları
Test Statistic Value k
F-statistic 5.938040 1
Critical Value Bounds
Significance I0 Bound I1 Bound
% 10 3.02 3.51
% 5 3.62 4.16
% 2,5 4.18 4.79
% 1 4.94 5.58
Modelde kullanılacak değişkenlerin seviyede durağan ya da birinci farkta durağan olup
olmamasına bağlı olmadan sınır testini uygulamak mümkündür. Bu sebeple sınır testini uygulamadan
TCMB’nin Faiz Kararları Ekseninde...
259
önce değişkenlerin durağanlık mertebelerini belirlemeye gerek yoktur. İkinci farkta durağan
değişkenlerde ARDL modeli uygulanamadığı için değişkenlerin ikinci farkta durağan olma ihtimaline
karşı sınanması gerekmektedir.
Tablo 4. Granger Nedensellik Tablosu
Hipotezler Veri All Prob. Değeri
Krediler, faiz kararlarının nedenidir 34
7.062770 0.0293
Faiz kararları, kredilerin nedenidir 16.06830 0.0003
ARDL yaklaşımında kısıtsız hata düzeltme modeli kullanıldığından, Engle-Granger testine göre
daha iyi istatistiksel özelliklere sahiptir ve küçük örneklerde Johansen ve Engle-Granger testlerine
göre daha güvenilir sonuçlar verir.
5. Sonuç
Para politikası kararlarındaki değişikliğin reel ekonomiyi hangi kanallar ile nasıl etkilediğine ilişkin
bulgular politika belirleme sürecinde kullanılan önemli parametrelerden biridir.
Bu çalışmada, Türkiye için parasal aktarım kanallarından biri olan faiz kanalı, Granger Nedensellik
Testi ve ARDL sınır testi kullanılarak analiz edilmiştir.
F-istatistik değeri üst sınır değerlerinden daha büyük olduğu için % 1 anlamlılık düzeyinde
değişkenler arasında uzun dönemli ilişki vardır (uzun dönem ilişkinin olmadığını ileri süren boş
hipotez reddedilmektedir).
Hata düzeltme terimi katsayısı (-0.839126) olması gerektiği gibi negatif ve istatistiki olarak anlamlı
olması uzun dönemli ilişkiyi doğrulamaktadır.
Değişkenler arasındaki uzun dönem dengesinden kısa süreli sapmaların her çeyrekte %83,91 uzun
dönemli dengeye doğru düzeldiğini göstermektedir.
Kredi hacmi ile faiz oranları arasında çift yönlü nedensellik ilişkisi tespit edilmiştir
Kaynaklar
Alp, H. Ve S. Elekdağ. 2010. The Role Of MonetaryPolicy İn An EmergingEconomyDuringThe
Global Financial Crisis. TCMB Çalışma Tebliği (Yayımlanma Aşamasında).
Alper, K. Ve S. T. Tiryaki. 2011. Zorunlu Karşılıkların Para Politikasındaki Yeri. TCMB Ekonomi
Notları No. 11/08.
Başçı, E., & Kara, H. (2011). Finansal İstikrar Ve Para Politikası. İktisat İşletme Ve Finans, 26(302),
9-25.
Büyükakin, F., Bozkurt, H., & Cengiz, V. (2009). Türkiye’de Parasal Aktarimin Faiz Kanalinin
Granger Nedensellik ve Toda-Yamamota Yöntemleri İle Analizi. Erciyes Üniversitesi İktisadi Ve
İdari Bilimler Fakültesi Dergisi, (33), 101-118.
Yücememiş, B. T., Alkan, U., & Dağıdır, C. (2015). Yeni Bir Para Politikası Aracı Olarak Faiz
Koridoru: Türkiye'de Para Politikası Kurulu Faiz Kararlarının Enflasyon Üzerindeki Etkisi. Journal
Of Financial Researches&Studies/Finansal Arastirmalar Ve Calismalar Dergisi, 7(13).
Zengin, B. (2018, Temmuz). Türkiye’de Bireysel Emeklilik Sistemi ve Ekonomik Büyüme Arasındaki
İlişkinin Ampirik Analizi. Ankara: Gazi Üniversitesi Sosyal Bilimler Enstitüsü.
3rdInternational Conference on Economic Research
24-25th October 2019, Alanya, Turkey
260
THE RELATIONSHIP BETWEEN LABOR FORCE PARTICIPATION AND
EMPLOYMENT: SECTORAL FINDINGS
Altan Aldan Central Bank of the Republic of Turkey
Email: altan.aldan @tcmb.gov.tr
H. Burcu Gürcihan Yüncüler
Central Bank of the Republic of Turkey
Abstract
Analysis of the Turkish labor market data reveals a strong correlation between labor force
participation and employment. The magnitude of this correlation differs with respect to the industry that leads the change in employment. This study aims to address these sectoral differences using time
series and microeconometric analysis. Time series analysis uses quarterly data on employment and
labor force participation available on Turkish Statistical Institute online database and estimates models
of quarter-on-quarter difference using seasonally adjusted data. Empirical evidence indicates that, in the short-run, compared with employment in industry and services sectors, employment in the
construction sector exhibits a weaker (stronger) association with labor force (unemployment). In other
words, to the extent that pick-up (slow down) in economic activity is led by the construction sector, its positive (adverse) impact on unemployment is more pronounced. Microeconometric analysis uses
annual labor force survey micro datasets and models new employees’ labor market situation in the
previous year and current labor market situation of individuals who were employed last year but not currently employed. Empirical results indicate that majority of new employees in the construction
sector were unemployed in the previous year whereas half of new employees in industry and services
sectors were out of labor force. Similar sectoral differences are found among individuals who leave
their jobs. The fact that the relation between employment and labor force participation is stronger for women and that the share of males in construction employment is very high amplifies the sectoral
differences. However, similar differences are also found among male employees.
Keywords: Employment, Labor Force.
İŞGÜCÜNE KATILIM VE İSTİHDAM İLİŞKİSİ: SEKTÖREL BULGULAR
Özet
Türkiye işgücü piyasası verileri incelendiğinde işgücüne katılım ve istihdam arasındaki güçlü bağıntı dikkat çekmektedir. Bu bağıntı istihdamdaki değişimin sektörel kaynağına göre farklılık
gösterebilmektedir. Bu çalışmada istihdam ve işgücüne katılım arasındaki ilişki, sektörler bazında
zaman serisi analizi ve mikro ekonometrik analizler ile incelenmektedir. Zaman serisi analizinde Türkiye İstatistik Kurumu işgücü veri tabanında bulunan istihdam ve işgücü verileri kullanılmıştır. Üç
aylık veriler mevsimsellikten arındırılmış ve çeyreklik değişim modelleri tahmin edilmiştir. Analiz
sonuçları kısa dönemde inşaat sektöründeki istihdam değişiminin, hizmet ve sanayi sektörlerine
kıyasla, işgücündeki değişim ile daha zayıf ve dolayısıyla işsizlikteki değişim ile daha güçlü bir ilişki içinde olduğuna işaret etmektedir. Diğer bir ifadeyle, iktisadi faaliyetteki hızlanma (yavaşlama) inşaat
sektöründen geldiği ölçüde işsizliği azaltan (arttıran) etkisi daha belirgin olmaktadır. Mikro
ekonometrik analiz Türkiye İstatistik Kurumu tarafından yıllık frekansta yayınlanan hane halkı işgücü anketi mikro veri setleri kullanılarak yapılmıştır. Analizde yeni işe başlayanların önceki yıl işgücü
dışında ya da işsiz olma olasılığı ile önceki yıl istihdamda iken mevcut yılda çalışmayanların işgücü
dışında ya da işsiz olma olasılığı modellenmiştir. Bulgular inşaat sektöründe yeni işe başlayanların
çoğunluğunun önceki yıl işsiz olduğuna buna karşılık sanayi ve hizmet sektörlerinde yeni işe başlayanların yarısının önceki yıl işgücü piyasası dışında olduğunu göstermektedir. Benzer şekilde
inşaat sektöründe işten ayrılanların büyük çoğunluğu işsiz olarak işgücü piyasasında kalmaya devam
etmekte, sanayi ve hizmet sektörlerinde işten ayrılanların ise yarısı işgücü piyasasından ayrılmaktadır.

The Relationship Between Labor Force…
261
Kadınlardaki istihdam gelişmelerinin daha yüksek bir oranda işgücü ile ilgili olması ve inşaat sektörü
çalışanlarının büyük çoğunlukla erkek olması söz konusu sektörel farklılığı artırmakla birlikte,
erkekler arasında da benzer bir sektörel fark bulunmaktadır. Anahtar Kelimeler: İstihdam, İşgücü.
3rd International Conference on Economic Research
24-25th October 2019, Alanya, Turkey
262
ECONOMIC IMPACTS OF AIRLINE DEREGULATION: AN EVALUATION FOR
THE E7 COUNTRY GROUP
Deniz Macit
Alanya Alaaddin Keykubat University, Department of Aviation Management, Turkey Email: deniz.macit @alanya.edu.tr
Begüm Buse Özsavaner
Alanya Alaaddin Keykubat University, Department of Transportation Services, Turkey
Abstract
The government and the market share an optimal combination of limited resources, roles in the
economic system to increase social welfare. There may be changes in the role of government and market in the provision of goods and services. The public sector may completely abandon the
production of certain goods and services by intervening in the functioning of the market over time or
under certain regulations through regulation, deregulation and privatizations. The aviation sector has become increasingly competitive with developments such as deregulation, liberalization, privatization
and open skies agreements, particularly in globalization. The effects of deregulation from these
developments are the basis of this study. The element intended by deregulation, which can be simply
expressed as reducing or completely eliminating public restrictions; decreasing legal regulations and increasing productivity in the sector. Airway deregulation is known to achieve significant benefits in
the sector. Following the liberalization movements in the airline transport sector, global growth,
passenger capacity increases and ticket prices decreased. The main objective of the study in Turkey also found that E-7 (emerging 7) deregulation of the
airline industry group in the country context, it is to make an assessment outlining the economic
impacts of the industry. In 1980s, after the influence in the USA, they started deregulation for aviation in different countries. The effect in Turkey in 2003, the largest air transport deregulation that began to
be felt in the ratio has changed the structure of the Turkish aviation industry has gained positive
momentum and growth increasing competition in the sector. In this study, air transport deregulation
and the sectoral economic indicators of all countries in the E-7 country group were evaluated and cross-country comparisons were made. As a result, the structural reform brought by deregulation; it
has been shown that many companies can enter this sector and have positive effects in many areas
such as competition, pricing, service quality, number of aircraft, number of flights, use of airports, number of targets and employment.
Keywords: Air Transport Deregulation, Liberalization, E-7 Countries.
HAVAYOLU TAŞIMACILIĞI DEREGÜLASYONLARININ EKONOMİK
ETKİLERİ: E7 ÜLKE GRUBUNA YÖNELİK BİR DEĞERLENDİRME
Özet
Hükümet ve piyasa, sınırlı kaynaklardan optimal bir bileşimi, sosyal refahı artırmak için ekonomik
sistemdeki rolleri paylaşmaktadır. Mal ve hizmet sunumunda devlet ve piyasanın rollerinde
değişiklikler olabilir. Kamu sektörü regülasyon, deregülasyon ve özelleştirmeler ile zaman içerisinde ya da belirli düzenlemelerle piyasanın işleyişine müdahale ederek bazı mal ve hizmetlerin üretiminden
tamamen vazgeçebilir. Havacılık sektörü başta küreselleşme olmak üzere deregülasyon, liberalleşme,
özelleştirme ve açık semalar anlaşmaları gibi gelişmeler ile artan bir rekabet içerisine girmiştir. Bu çalışmanın temelinde bu gelişmelerden deregülasyonun etkileri yer almaktadır. Kamu kısıtlamalarının
azaltılması ya da tamamen ortadan kaldırılması şeklinde basitçe ifade edilebilecek deregülasyon ile
amaçlanan unsur; azalan yasal düzenlemeler ile sektörel verimlilikte artış yaşanmasıdır. Havayolu
Havayolu Taşımacılığı Deregülasyonlarının Ekonomik…
263
deregülasyonu ile sektörde önemli faydalar elde edildiği bilinmektedir. Havayolu ulaştırma
sektöründeki serbestleşme hareketlerinden sonra küresel anlamda sektör büyümesinde, yolcu
kapasitelerinde artışlar, bilet fiyatlarında azalışlar gündeme gelmiştir. Çalışmanın temel amacı, Türkiye’nin de içinde bulunduğu E-7 (gelişmekte olan 7) ülke grubu
bağlamında havayolu taşımacılığı sektöründeki deregülasyonun, sektördeki ekonomik etkilerini ortaya
koyan bir değerlendirmesini yapmaktır. 1980’li yıllarda ABD’de etkisi görüldükten sonra farklı ülkeler de havacılığa yönelik deregülayon çalışmalarını başlatmışlardır. Türkiye’de 2003 yılında etkisi
büyük oranda hissedilmeye başlanan havayolu taşımacılığı deregülasyonu Türk havacılık sektörünün
yapısını değiştirmiş ve rekabeti arttırarak sektörel büyümeye pozitif bir ivme kazandırmıştır. Bu çalışmada, E-7 ülke grubunda yer alan tüm ülkelerin havayolu taşımacılığı deregülasyonları ve
sonucundaki sektörel ekonomik göstergeleri değerlendirilerek, ülkeler arası kıyaslama yapılmıştır.
Sonuç olarak, kuralsızlaştırmanın getirdiği yapısal reformun; piyasaya girişi serbest bıraktığı ve bu
sayede birçok firmanın bu sektöre girebildiği ve rekabet, fiyatlandırma, hizmet kalitesi, uçak sayısı, uçuş sayısı, hava alanlarının kullanımı, hedeflerin sayısı ve istihdam gibi birçok alanda olumlu etki
yaptığı ortaya konmuştur.
Anahtar Kelimeler: Havayolu Deregülasyonu, Liberalleşme, E7 Ülkeleri.
1. Giriş
Devletin ekonomiye müdahalesi konusundaki tartışmalar iktisadi doktrinlerin başlangıcından
günümüze kadar süregelmektedir. İktisadi sistem içerisinde kamu müdahalesine rol verenler olduğu
gibi bu müdahalelerin kısıtlı olmasını savunanlar ve hatta kamunun iktisadi hayata müdahalesini
başarısızlık olarak gören fikirler ortaya atılmıştır. Birbirlerine bu zıt görüşler eleştirilen durumlar olsa da piyasaya kamunun müdahalesi kaçınılmaz bir durum olarak ortaya çıkmaktadır. Farklı politik
sistemlerde devletin ekonomideki rolü değişebilse de sosyal devlet anlayışı ile birlikte kamu
müdahalesi iktisadi hayatta yerini almıştır. Kamunun piyasaya olan müdahaleleri teorik çerçevede piyasa başarısızlıkları argümanı
çerçevesinde şekillenmektedir. Bu başarısızlıklar ise piyasaların dengesiz işlemesine neden olabilen;
ölçek ekonomileri, tam rekabet şartlarının gerçekleşmemesi, kamusal mallar ve doğal tekeller gibi
sorunlardır. Bu problemlerle baş edebilmek adına regülasyon gibi çeşitli yöntemlerle kamu müdahalesi gerekli görülmektedir. Ekonomik ve sosyal amaçlar için devletin uygulamaya koyduğu yasal, anayasal
ve kurumsal düzenlemeleri ve diğer her türlü kamusal uygulama ve politikaları ifade eden regülasyon
kavramı ekonomik açıdan; piyasanın yapısını düzenlemek için yapılan uygulamaları belirtmek için kullanılmaktadır. Bu anlamda fiyat kontrolleri, piyasaya giriş-çıkışların düzenlenmesi vb. uygulamalar
ekonomik regülasyonlara yönelik örnek müdahalelerdir (Aktan, 2016). Hükümet düzenlemelerinin
temelinde görüldüğü gibi piyasa başarısızlıkları yatmaktadır. Bu konuda literatürde çok çeşitli tartışmalar olsa da genel olarak değerlendirildiğinde regülasyonların tüm sistem açısından ekonomik
etkinliği artırmada kısıtlı bir imkana sahip olduğu kabul edilmektedir.
Regülasyonlar sonucu birçok ülkede ekonomik verim azalınca bu uygulamalara yönelik
düzenlemelerin kaldırılmasına yönelik görüşler ortaya çıkmıştır. Regülasyonların pozitif yönde etkileri olsa da genel olarak değerlendirildiğinde maliyetlerin artmasından dolayı fiyat artışları ve hizmet
kalitesinde azalmalar ortaya çıkarmaktadır (Uzun, 2019, s. 476). Bundan dolayı da devletin uyguladığı
regülasyonların kaldırılması ya da azaltılması anlamında deregülasyon uygulamaları gündeme gelmiştir.
Literatür incelendiğinde deregülasyon sürecinin sektörlere olan etkisinin incelenmesi konusunda
yeterince araştırma bulunmadığı görülmektedir. Liberalizasyon, iktisadi sektörlerin yabancı piyasalara açılmasını ifade etmektedir ve sektörlere yönelik yapılan düzenlemeler ile rekabete karşı koruma
sağlanmaktadır. Bu doğrultuda liberalizasyon kavramı için deregülasyon ifadesi sıklıkla
kullanılmaktadır (İnan, 2018: 170). Liberalleşmenin yararları konusunda uluslararası literatürde çeşitli
çalışmalar bulunsa da havacılık sektörü kapsamında özellikle ülkemizde mevcut çalışmalar çok kısıtlıdır.
Sayısız imalat ve hizmet endüstrisinde ve havayolu şirketlerinde çok belirgin bir şekilde
kanıtlanmış olan dünya ekonomisinin küreselleşmesi, ABD ve diğer hükümetleri korumacı duruştan uzak ve açık pazarlara yönelmeye zorlamıştır. Havacılık sektörü açısından deregülasyon uygulamaları
değerlendirildiğinde tarihsel süreç içerisinde başta ABD olmak üzere küresel boyutta birçok ülkede
D. Macit ve B. B. Özsavaner
264
önemli gelişmeler yaşandığı görülmektedir. Havacılık sektöründe güvenlik, emniyet, trafik kontrolü
gibi unsurlar hava serbestliği açısından incelendiğinde iktisadi faaliyetler gibi herhangi bir kısıtlama
olmadan yararlanılan unsurlar olmaktadır. Ülkeler içinde ve arasında uzun mesafe taşımacılığının birincil modu olan hava taşımacılığı,
ekonomik aktivitenin çok önemli bir kolaylaştırıcısı haline gelmiştir. Bu nedenle, ulusal ekonomilerin
gelişmesinde ve buna bağlı olarak küresel ekonominin sağlıklı gelişiminde önemli bir rol oynamaktadır.
Bu çalışmanın amacı, havacılık sektörü açısından liberalleşme ya da deregülasyon olarak ifade
edilen süreç ve bu süreçteki çeşitli uygulamaların ekonomik anlamdaki etkilerini ortaya koymaktır. Türkiye’nin de aralarında bulunduğu E7 ülke grubu çerçevesinde, ülkeler arası sonuçlara yönelik
kıyaslamalar ile regülasyonların olumsuzluklarına vurgu yapılarak deregülasyonların ekonomiye olan
etkilerinin neler olduğunun ortaya konması amaçlanmaktadır. Çalışmanın temel odak noktası E7 ülke
grubu (Türkiye, Brezilya, Çin, Hindistan, Rusya, Meksika, Endonezya) bağlamında çeşitli makro iktisadi ve sektörel büyüklüklerden yararlanılarak havacılık sektöründeki deregülasyon
uygulamalarının ekonomik etkileri ortaya konmasıdır.
2. Havayolu Deregülasyonu
Havayollarına göre özelleştirme, genellikle gevşek bir şekilde uygulanan bir terimdir. Ölçülebilir bir amaç veya sonuçtan çok bir süreç olma eğilimindedir. Süreç, devlete ait veya kontrol edilen öz
kaynakların çeşitli yöntemlerle elden çıkarılmasıdır ve zaman içinde aşamalı bir şekilde
gerçekleştirilebilir. Bazı hükümetler küçük bir hisse satışını “özelleştirme” olarak görebilir. Terimin
bu kullanımına bağlı olarak, devlete ait havayollarının özelleştirilmesi, uluslararası hava taşımacılığındaki en önemli dönüşümlerden biri olmuştur.
Özelleştirme amaçları, tamamen ekonomik hususlardan, işletme verimliliğini ve rekabetçiliğini
arttırmaya, yeni ekipmanlara sermaye yatırımını finanse etmek için hükümetlerin ağır mali yükünü azaltmaya yönelik çeşitli unsurlar içermektedir. Sebepleri ne olursa olsun, havayollarının
özelleştirilmesi giderek daha rekabetçi bir ortamda daha ticari odaklı bir bakış açısına eşlik etmiştir.
1977’den itibaren ABD hava taşımacılığı pazarının hızla serbest bırakılması hem yük hem de yolcu
hava taşımacılığı hizmetlerinde uluslararası reform için bir ivme kazanmıştır. Uluslararası hava taşımacılığının serbestleştirilmesinde o zamandan bu yana önemli ilerlemeler kaydedilmiştir. ABD’de
Havayolu Deregülasyon Kanunu’nun yürürlüğe girmesi ile başlayan liberalleşme hareketi diğer
ülkelerde de benimsenmiş ve farklı tarihlerde liberalleşme hareketleri havacılık sektörlerinde etkilerini göstermeye başlamıştır.
Özelleşmeyle Amerika'da başlayan deregülasyon hareketi daha sonra çeşitli ülkelerde de
uygulamaya başlamıştır. Serbestleşme, küreselleşme ve ticarileşme eğilimlerinin bir sonucu olarak hava taşımacılığında yolcu istek ve ihtiyaçları artmış ve bunun sonucunda hizmet çeşitliliğinin
gelişimi önemli hale gelmiştir. Bu durum havayolu işletmelerinin hizmetlerini, rakiplerine göre
farklılaştırma yoluna götürmeye zorlamıştır.
2.1 Havayolu Deregülasyonu Tarihsel Gelişimi
Havayolu taşımacılığının ortaya çıkmasıyla birlikte başlangıçtan beri havacılık sektörü regülasyon uygulamaları ile gelişimini devam ettirmiştir. Ancak sektör ilerlemeler gösterince çeşitli düzenlemeler
meydana gelmeye başlamıştır. Deregülasyon, ilk olarak ABD’de 1970’lerde ve daha sonra diğer
Anglo Sakson ekonomilerinde savunulmuştur. O dönemde düşük uçak bileti ücretleri, daha yüksek rekabet, daha yüksek güvenilirlik ve daha kaliteli havayolu hizmetlerini elde etmenin bir yolu olarak
görülüyordu (Jiaoe, David, & David , 2016, s. 12).
1938-1978 arası dönemde, uluslararası hava taşımacılığı olağanüstü bir büyümeye şahit olmuştur.
Bu dönemde ABD havayolları, yurt içi ve yurt dışında birçok yeni güzergâh izni almıştır. Uluslararası olarak, sınırlı sayıda hizmet 1938'de az sayıda tarifeli ABD havayoluyla ve yarım düzine kadar önemli
yabancı havayollarıyla sağlanmıştır. 1978 ise bu rakamlar 21 ABD ve 73 yabancı havayolu şirketine
yükselmiştir (Wensveen, 2007: 44).1940-1978 yılları arasındaki dönemde ticari uçuşlara yönelik olarak yapılan düzenlemeler kamu tarafından gerçekleştirilmiştir. Bu dönemin sonundan itibaren
ABD’de Havayolu Deregülasyon Kanunu yürürlüğe girmiştir ve bunun sonucunda liberal bir düzene
Havayolu Taşımacılığı Deregülasyonlarının Ekonomik…
265
geçilerek kamu eliyle yapılan düzenlemeler sonlandırılmıştır. Bu kapsamdaki temel uygulamalar uçuş
tarifelerinin, ücretlerin ve güzergâhların belirlenmesi olarak sayılabilir. Bu sektörün kamu hizmeti
sunması, ülkelerin savunmalarını direkt olarak ilgilendirmesi ve uçuş emniyet gerekliliklerinin uygulanması gibi sebepler ile sektöre giriş, fiyatları belirleme, yeni hat oluşturma gibi temel konularda
ülkeler düzenlemeler yapmaktadır (Wensveen, 2007: 54).
Avrupa'da ise serbestleşme birden gerçekleşmemiştir. Uygulanabilir ve kabul edilebilir serbestleşme önlemlerine ulaşmak, uzun yıllar süren ve çok fazla müzakereden sonra
gerçekleşebilmiştir (ICAO, 2003, s. 1).1985-2013 arası dönemde, yaklaşık 130 hükümet özelleştirme
planlarını açıklamıştır ve yaklaşık 180 devlete ait havayolu için özelleştirme niyetleri açıklanmıştır. Bu dönemde, hedeflenen bu taşıyıcıların 86'sı özelleştirme hedeflerine ulaşmıştır (Commercialızation
And Liberalization, 2003, s. 2).
3. E7 Ülkelerinde Havacılık Deregülasyon Uygulamalarına Genel Bakış
Brezilya. 1990'ların sonu, Brezilya havalimanlarının ticarileşmesine yönelik belirleyici bir tarih
olarak gösterilmektedir. 1999 yılında, Infraero havalimanı bölge şubelerinden havaalanlarını ticari olarak işletmeleri istenerek özelleştirme süreci başlatılmıştır. Brezilya Hükümeti, 2011'de bazı büyük
havaalanlarının yönetimi için imtiyaz teklifleri verme planlarını onaylamıştır. İmtiyazların, imtiyaz
sahiplerinin %51'inin sahip olacağı kamu-özel ortaklıkları şeklinde olması planlanmıştır. 2012 yılında imtiyazlar için yapılan açık arttırmalar ile 3 adet havalimanı özelleştirilmiştir. Bu 3 havalimanı
Brezilya’da sivil havacılık trafiğinin %30'unu, uluslararası yolcuların %65'ini ve Brezilya'daki tüm
hava kargolarının %57'sini oluşturan bir yapıya sahip bulunmaktaydı (ICAO, 2013a). Bu tarihten
itibaren Brezilya’da hükümet çeşitli imtiyaz sözleşmeleri ile havalimanlarının özelleştirilmelerine devam etmiştir.
Türkiye. Ülkemizdeki bazı havalimanları, 1990'lı yıllarda kapasite sorunu olasılığı ile karşı karşıya
kalmaya başlamıştır. 1994 yılında hükümet, Yap-İşlet-Devret Model’ine (YİP) yönelik kanunu kabul etmiştir ve Devlet Hava Meydanları İşletmesi (DHMI) hava yolu operasyonlarını devlet kontrolü
altında tutarken, 6 özel terminalin işletme haklarını özel şirketlere devretmiştir. 2004 yılından
başlayarak çeşitli tarihlerde; İstanbul-Atatürk Uluslararası Havalimanı, Antalya Havalimanı, Ankara-
Esenboğa Uluslararası Havalimanı, İzmir-Adnan Menderes Uluslararası Havalimanı, Uluslararası Dalaman Havalimanı, İstanbul-Sabiha Gökçen Uluslararası Havalimanı, Milas-Bodrum
havaalanındaki uluslararası terminallerinin işletilmesi, özel işletmelere bırakılmıştır. Diğer ticari
havalimanları, uzun vadeli kiralama imtiyaz sözleşmeleriyle işletmeleri özel şirketlere verilen birkaç havaalanı dışında, DHMI tarafından yönetilmektedir. Türkiye'deki havalimanlarının özel işletmecileri
ile ilgili olarak, DHMI, havalimanı işletmecileri için asgari düzeyde işletme geliri sağlayacak belirli
sayıda yolcuya garanti vermiştir. Trafik önceden belirlenmiş hacmin altındaysa, DHMI havaalanı işletmecilerine ekstra ödemeler yapacaktır. Tersine, eğer hacim garanti edilenden daha büyükse,
DHMI havaalanı operatörlerinden daha büyük bir paylaşılan gelir elde eder. Tüm detaylar imtiyaz
sözleşmelerinde belirtilmiştir ve her bir havalimanının özelliğine özgüdür (ICAO, 2013b).
Meksika. 1965'ten önce tüm Meksika havalimanlarının idaresinden, işletilmesinden ve bakımından hükümete ait Dirección de Aeronáutica Civil (Sivil Havacılık Dairesi Başkanlığı) sorumluydu. 1995
yılında ise Hava Meydanları Kanunu yürürlüğe girince havalimanı yönetimi için özel imtiyaz
verilmesi olasılığını gündeme gelmeye başlamıştır. Bu tarihten itibaren özel sektörün Meksika Hava Meydanları Sistemine katılımını sağlamak için özel bir komite kurulmuştur ve havalimanlarına
yönelik özel imtiyazlar verilmeye başlanmıştır (ICAO, 2013c).
Çin.1970'lerin sonuna kadar, Çin'de sivil havacılık organizasyonu, yarı askeri bir organizasyon olan Çin Sivil Havacılık İdaresi (CAAC) tarafından denetlenmiştir. Bu idare regülatör işlevini üstlenerek
uçuş operasyonu, havaalanı yönetimi ve hava seyrüsefer hizmetleri gibi Çin'in sivil havacılık
sisteminin birçok yönüne doğrudan dahil olmuştur. Çin’de havacılık sisteminin yeniden örgütlenişi
1970’lerin sonlarında ekonomik yönelimlerin yeniden tanımlanmasıyla başlamıştır. Çin Hükümeti sivil ve askeri havacılık arasında açık bir ayrım yapmış ve CAAC 1984'te tamamen sivil bir yapıya
dönüştürülmüştür. Çin Hükümeti, 1993 yılında havaalanı yatırım ortamını gevşeterek yeni bir ticaret
dalgası başlatmıştır. Özellikle havayolları için havaalanı sektöründeki yatırımlar kolaylaştırılmıştır. Çin Hükümeti 2003 yılında yeni önlemler almıştır. Hükümet hem havalimanı işletmeciliğinde hem de
havalimanı tesislerinde yatırım açısından yurtiçi havalimanlarında özel yatırım yapmayı
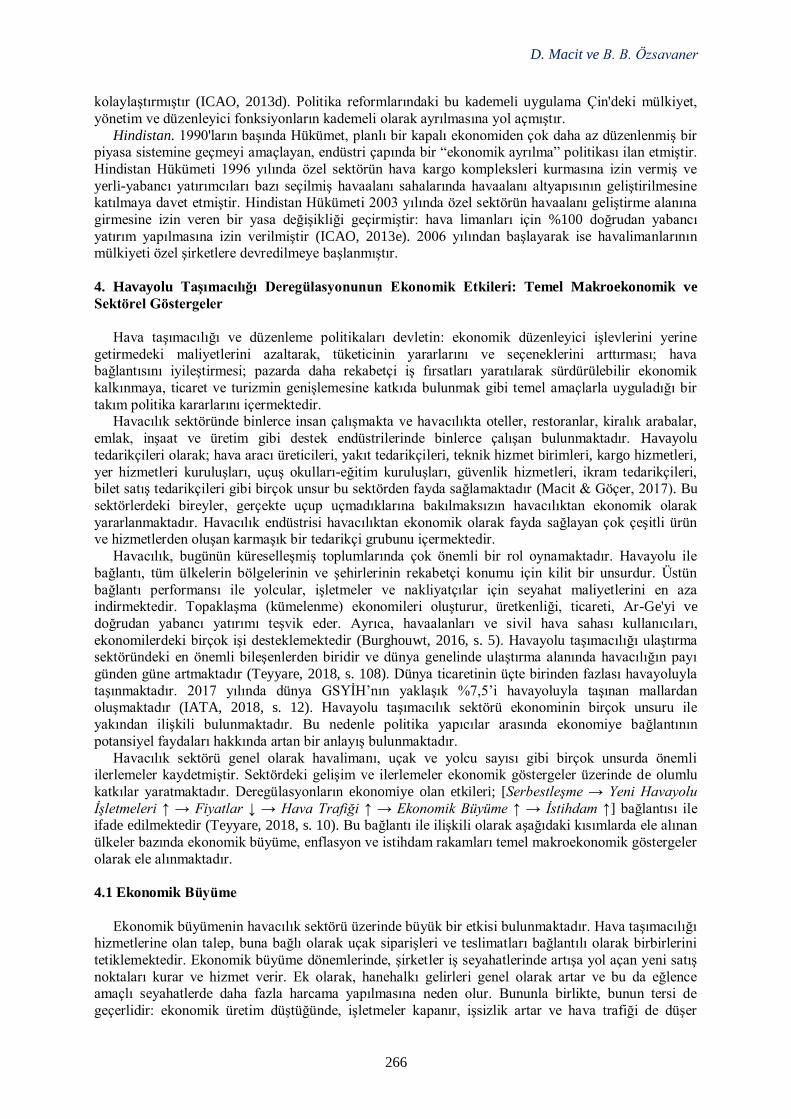
D. Macit ve B. B. Özsavaner
266
kolaylaştırmıştır (ICAO, 2013d). Politika reformlarındaki bu kademeli uygulama Çin'deki mülkiyet,
yönetim ve düzenleyici fonksiyonların kademeli olarak ayrılmasına yol açmıştır.
Hindistan. 1990'ların başında Hükümet, planlı bir kapalı ekonomiden çok daha az düzenlenmiş bir piyasa sistemine geçmeyi amaçlayan, endüstri çapında bir “ekonomik ayrılma” politikası ilan etmiştir.
Hindistan Hükümeti 1996 yılında özel sektörün hava kargo kompleksleri kurmasına izin vermiş ve
yerli-yabancı yatırımcıları bazı seçilmiş havaalanı sahalarında havaalanı altyapısının geliştirilmesine katılmaya davet etmiştir. Hindistan Hükümeti 2003 yılında özel sektörün havaalanı geliştirme alanına
girmesine izin veren bir yasa değişikliği geçirmiştir: hava limanları için %100 doğrudan yabancı
yatırım yapılmasına izin verilmiştir (ICAO, 2013e). 2006 yılından başlayarak ise havalimanlarının mülkiyeti özel şirketlere devredilmeye başlanmıştır.
4. Havayolu Taşımacılığı Deregülasyonunun Ekonomik Etkileri: Temel Makroekonomik ve
Sektörel Göstergeler
Hava taşımacılığı ve düzenleme politikaları devletin: ekonomik düzenleyici işlevlerini yerine
getirmedeki maliyetlerini azaltarak, tüketicinin yararlarını ve seçeneklerini arttırması; hava bağlantısını iyileştirmesi; pazarda daha rekabetçi iş fırsatları yaratılarak sürdürülebilir ekonomik
kalkınmaya, ticaret ve turizmin genişlemesine katkıda bulunmak gibi temel amaçlarla uyguladığı bir
takım politika kararlarını içermektedir. Havacılık sektöründe binlerce insan çalışmakta ve havacılıkta oteller, restoranlar, kiralık arabalar,
emlak, inşaat ve üretim gibi destek endüstrilerinde binlerce çalışan bulunmaktadır. Havayolu
tedarikçileri olarak; hava aracı üreticileri, yakıt tedarikçileri, teknik hizmet birimleri, kargo hizmetleri,
yer hizmetleri kuruluşları, uçuş okulları-eğitim kuruluşları, güvenlik hizmetleri, ikram tedarikçileri, bilet satış tedarikçileri gibi birçok unsur bu sektörden fayda sağlamaktadır (Macit & Göçer, 2017). Bu
sektörlerdeki bireyler, gerçekte uçup uçmadıklarına bakılmaksızın havacılıktan ekonomik olarak
yararlanmaktadır. Havacılık endüstrisi havacılıktan ekonomik olarak fayda sağlayan çok çeşitli ürün ve hizmetlerden oluşan karmaşık bir tedarikçi grubunu içermektedir.
Havacılık, bugünün küreselleşmiş toplumlarında çok önemli bir rol oynamaktadır. Havayolu ile
bağlantı, tüm ülkelerin bölgelerinin ve şehirlerinin rekabetçi konumu için kilit bir unsurdur. Üstün
bağlantı performansı ile yolcular, işletmeler ve nakliyatçılar için seyahat maliyetlerini en aza indirmektedir. Topaklaşma (kümelenme) ekonomileri oluşturur, üretkenliği, ticareti, Ar-Ge'yi ve
doğrudan yabancı yatırımı teşvik eder. Ayrıca, havaalanları ve sivil hava sahası kullanıcıları,
ekonomilerdeki birçok işi desteklemektedir (Burghouwt, 2016, s. 5). Havayolu taşımacılığı ulaştırma sektöründeki en önemli bileşenlerden biridir ve dünya genelinde ulaştırma alanında havacılığın payı
günden güne artmaktadır (Teyyare, 2018, s. 108). Dünya ticaretinin üçte birinden fazlası havayoluyla
taşınmaktadır. 2017 yılında dünya GSYİH’nın yaklaşık %7,5’i havayoluyla taşınan mallardan oluşmaktadır (IATA, 2018, s. 12). Havayolu taşımacılık sektörü ekonominin birçok unsuru ile
yakından ilişkili bulunmaktadır. Bu nedenle politika yapıcılar arasında ekonomiye bağlantının
potansiyel faydaları hakkında artan bir anlayış bulunmaktadır.
Havacılık sektörü genel olarak havalimanı, uçak ve yolcu sayısı gibi birçok unsurda önemli ilerlemeler kaydetmiştir. Sektördeki gelişim ve ilerlemeler ekonomik göstergeler üzerinde de olumlu
katkılar yaratmaktadır. Deregülasyonların ekonomiye olan etkileri; [Serbestleşme → Yeni Havayolu
İşletmeleri ↑ → Fiyatlar ↓ → Hava Trafiği ↑ → Ekonomik Büyüme ↑ → İstihdam ↑] bağlantısı ile ifade edilmektedir (Teyyare, 2018, s. 10). Bu bağlantı ile ilişkili olarak aşağıdaki kısımlarda ele alınan
ülkeler bazında ekonomik büyüme, enflasyon ve istihdam rakamları temel makroekonomik göstergeler
olarak ele alınmaktadır.
4.1 Ekonomik Büyüme
Ekonomik büyümenin havacılık sektörü üzerinde büyük bir etkisi bulunmaktadır. Hava taşımacılığı hizmetlerine olan talep, buna bağlı olarak uçak siparişleri ve teslimatları bağlantılı olarak birbirlerini
tetiklemektedir. Ekonomik büyüme dönemlerinde, şirketler iş seyahatlerinde artışa yol açan yeni satış
noktaları kurar ve hizmet verir. Ek olarak, hanehalkı gelirleri genel olarak artar ve bu da eğlence amaçlı seyahatlerde daha fazla harcama yapılmasına neden olur. Bununla birlikte, bunun tersi de
geçerlidir: ekonomik üretim düştüğünde, işletmeler kapanır, işsizlik artar ve hava trafiği de düşer
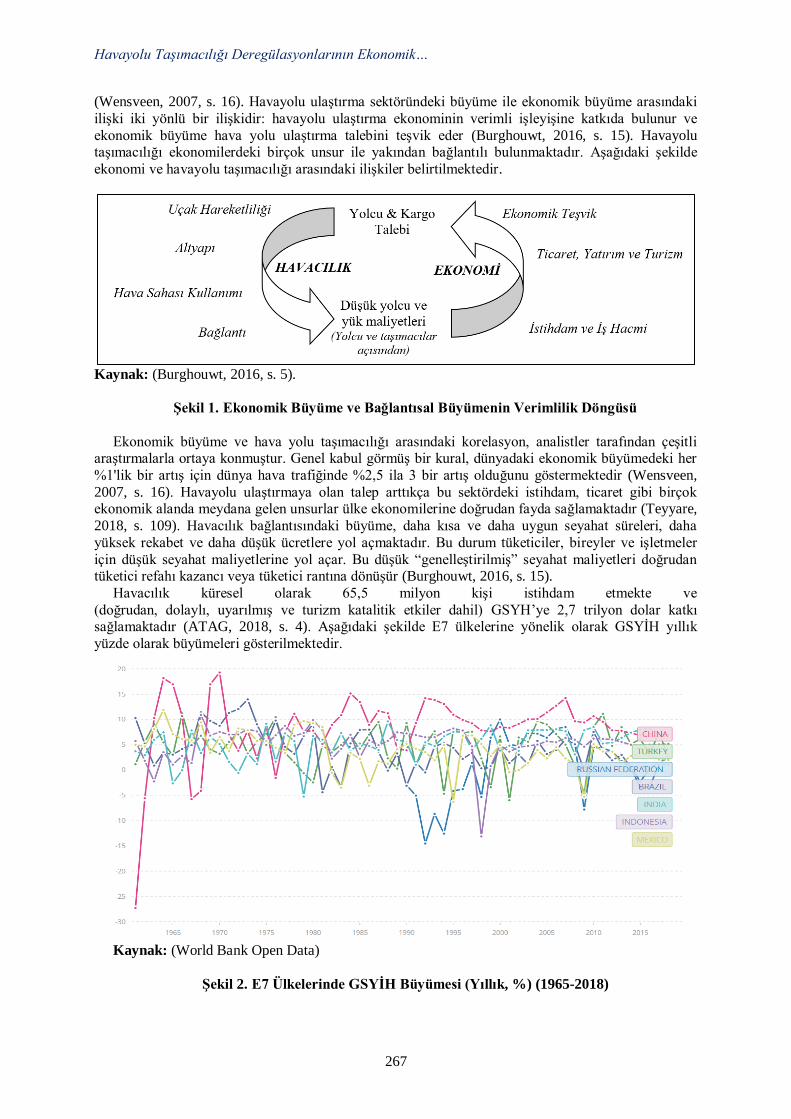
Havayolu Taşımacılığı Deregülasyonlarının Ekonomik…
267
(Wensveen, 2007, s. 16). Havayolu ulaştırma sektöründeki büyüme ile ekonomik büyüme arasındaki
ilişki iki yönlü bir ilişkidir: havayolu ulaştırma ekonominin verimli işleyişine katkıda bulunur ve
ekonomik büyüme hava yolu ulaştırma talebini teşvik eder (Burghouwt, 2016, s. 15). Havayolu taşımacılığı ekonomilerdeki birçok unsur ile yakından bağlantılı bulunmaktadır. Aşağıdaki şekilde
ekonomi ve havayolu taşımacılığı arasındaki ilişkiler belirtilmektedir.
Kaynak: (Burghouwt, 2016, s. 5).
Şekil 1. Ekonomik Büyüme ve Bağlantısal Büyümenin Verimlilik Döngüsü
Ekonomik büyüme ve hava yolu taşımacılığı arasındaki korelasyon, analistler tarafından çeşitli araştırmalarla ortaya konmuştur. Genel kabul görmüş bir kural, dünyadaki ekonomik büyümedeki her
%1'lik bir artış için dünya hava trafiğinde %2,5 ila 3 bir artış olduğunu göstermektedir (Wensveen,
2007, s. 16). Havayolu ulaştırmaya olan talep arttıkça bu sektördeki istihdam, ticaret gibi birçok ekonomik alanda meydana gelen unsurlar ülke ekonomilerine doğrudan fayda sağlamaktadır (Teyyare,
2018, s. 109). Havacılık bağlantısındaki büyüme, daha kısa ve daha uygun seyahat süreleri, daha
yüksek rekabet ve daha düşük ücretlere yol açmaktadır. Bu durum tüketiciler, bireyler ve işletmeler
için düşük seyahat maliyetlerine yol açar. Bu düşük “genelleştirilmiş” seyahat maliyetleri doğrudan tüketici refahı kazancı veya tüketici rantına dönüşür (Burghouwt, 2016, s. 15).
Havacılık küresel olarak 65,5 milyon kişi istihdam etmekte ve
(doğrudan, dolaylı, uyarılmış ve turizm katalitik etkiler dahil) GSYH’ye 2,7 trilyon dolar katkı sağlamaktadır (ATAG, 2018, s. 4). Aşağıdaki şekilde E7 ülkelerine yönelik olarak GSYİH yıllık
yüzde olarak büyümeleri gösterilmektedir.
Kaynak: (World Bank Open Data)
Şekil 2. E7 Ülkelerinde GSYİH Büyümesi (Yıllık, %) (1965-2018)
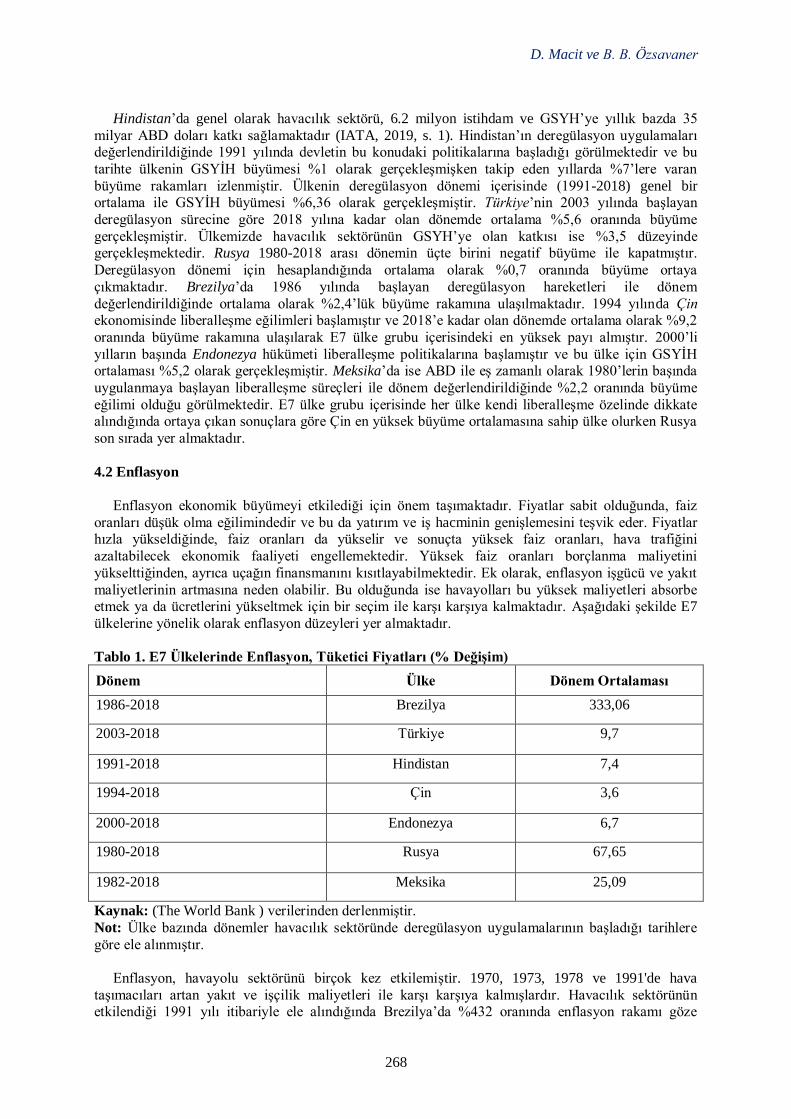
D. Macit ve B. B. Özsavaner
268
Hindistan’da genel olarak havacılık sektörü, 6.2 milyon istihdam ve GSYH’ye yıllık bazda 35
milyar ABD doları katkı sağlamaktadır (IATA, 2019, s. 1). Hindistan’ın deregülasyon uygulamaları değerlendirildiğinde 1991 yılında devletin bu konudaki politikalarına başladığı görülmektedir ve bu
tarihte ülkenin GSYİH büyümesi %1 olarak gerçekleşmişken takip eden yıllarda %7’lere varan
büyüme rakamları izlenmiştir. Ülkenin deregülasyon dönemi içerisinde (1991-2018) genel bir ortalama ile GSYİH büyümesi %6,36 olarak gerçekleşmiştir. Türkiye’nin 2003 yılında başlayan
deregülasyon sürecine göre 2018 yılına kadar olan dönemde ortalama %5,6 oranında büyüme
gerçekleşmiştir. Ülkemizde havacılık sektörünün GSYH’ye olan katkısı ise %3,5 düzeyinde gerçekleşmektedir. Rusya 1980-2018 arası dönemin üçte birini negatif büyüme ile kapatmıştır.
Deregülasyon dönemi için hesaplandığında ortalama olarak %0,7 oranında büyüme ortaya
çıkmaktadır. Brezilya’da 1986 yılında başlayan deregülasyon hareketleri ile dönem
değerlendirildiğinde ortalama olarak %2,4’lük büyüme rakamına ulaşılmaktadır. 1994 yılında Çin ekonomisinde liberalleşme eğilimleri başlamıştır ve 2018’e kadar olan dönemde ortalama olarak %9,2
oranında büyüme rakamına ulaşılarak E7 ülke grubu içerisindeki en yüksek payı almıştır. 2000’li
yılların başında Endonezya hükümeti liberalleşme politikalarına başlamıştır ve bu ülke için GSYİH ortalaması %5,2 olarak gerçekleşmiştir. Meksika’da ise ABD ile eş zamanlı olarak 1980’lerin başında
uygulanmaya başlayan liberalleşme süreçleri ile dönem değerlendirildiğinde %2,2 oranında büyüme
eğilimi olduğu görülmektedir. E7 ülke grubu içerisinde her ülke kendi liberalleşme özelinde dikkate alındığında ortaya çıkan sonuçlara göre Çin en yüksek büyüme ortalamasına sahip ülke olurken Rusya
son sırada yer almaktadır.
4.2 Enflasyon
Enflasyon ekonomik büyümeyi etkilediği için önem taşımaktadır. Fiyatlar sabit olduğunda, faiz
oranları düşük olma eğilimindedir ve bu da yatırım ve iş hacminin genişlemesini teşvik eder. Fiyatlar hızla yükseldiğinde, faiz oranları da yükselir ve sonuçta yüksek faiz oranları, hava trafiğini
azaltabilecek ekonomik faaliyeti engellemektedir. Yüksek faiz oranları borçlanma maliyetini
yükselttiğinden, ayrıca uçağın finansmanını kısıtlayabilmektedir. Ek olarak, enflasyon işgücü ve yakıt
maliyetlerinin artmasına neden olabilir. Bu olduğunda ise havayolları bu yüksek maliyetleri absorbe etmek ya da ücretlerini yükseltmek için bir seçim ile karşı karşıya kalmaktadır. Aşağıdaki şekilde E7
ülkelerine yönelik olarak enflasyon düzeyleri yer almaktadır.
Tablo 1. E7 Ülkelerinde Enflasyon, Tüketici Fiyatları (% Değişim)
Dönem Ülke Dönem Ortalaması
1986-2018 Brezilya 333,06
2003-2018 Türkiye 9,7
1991-2018 Hindistan 7,4
1994-2018 Çin 3,6
2000-2018 Endonezya 6,7
1980-2018 Rusya 67,65
1982-2018 Meksika 25,09
Kaynak: (The World Bank ) verilerinden derlenmiştir.
Not: Ülke bazında dönemler havacılık sektöründe deregülasyon uygulamalarının başladığı tarihlere
göre ele alınmıştır.
Enflasyon, havayolu sektörünü birçok kez etkilemiştir. 1970, 1973, 1978 ve 1991'de hava
taşımacıları artan yakıt ve işçilik maliyetleri ile karşı karşıya kalmışlardır. Havacılık sektörünün etkilendiği 1991 yılı itibariyle ele alındığında Brezilya’da %432 oranında enflasyon rakamı göze
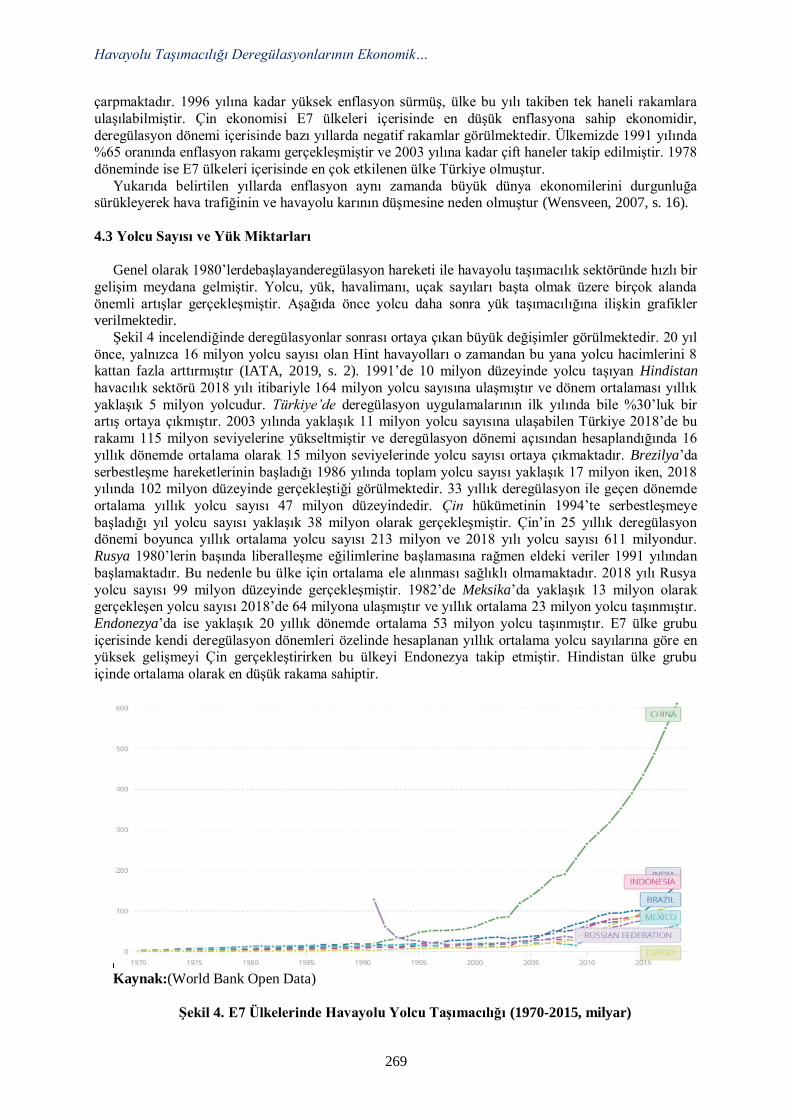
Havayolu Taşımacılığı Deregülasyonlarının Ekonomik…
269
çarpmaktadır. 1996 yılına kadar yüksek enflasyon sürmüş, ülke bu yılı takiben tek haneli rakamlara
ulaşılabilmiştir. Çin ekonomisi E7 ülkeleri içerisinde en düşük enflasyona sahip ekonomidir,
deregülasyon dönemi içerisinde bazı yıllarda negatif rakamlar görülmektedir. Ülkemizde 1991 yılında %65 oranında enflasyon rakamı gerçekleşmiştir ve 2003 yılına kadar çift haneler takip edilmiştir. 1978
döneminde ise E7 ülkeleri içerisinde en çok etkilenen ülke Türkiye olmuştur.
Yukarıda belirtilen yıllarda enflasyon aynı zamanda büyük dünya ekonomilerini durgunluğa sürükleyerek hava trafiğinin ve havayolu karının düşmesine neden olmuştur (Wensveen, 2007, s. 16).
4.3 Yolcu Sayısı ve Yük Miktarları
Genel olarak 1980’lerdebaşlayanderegülasyon hareketi ile havayolu taşımacılık sektöründe hızlı bir
gelişim meydana gelmiştir. Yolcu, yük, havalimanı, uçak sayıları başta olmak üzere birçok alanda
önemli artışlar gerçekleşmiştir. Aşağıda önce yolcu daha sonra yük taşımacılığına ilişkin grafikler verilmektedir.
Şekil 4 incelendiğinde deregülasyonlar sonrası ortaya çıkan büyük değişimler görülmektedir. 20 yıl
önce, yalnızca 16 milyon yolcu sayısı olan Hint havayolları o zamandan bu yana yolcu hacimlerini 8 kattan fazla arttırmıştır (IATA, 2019, s. 2). 1991’de 10 milyon düzeyinde yolcu taşıyan Hindistan
havacılık sektörü 2018 yılı itibariyle 164 milyon yolcu sayısına ulaşmıştır ve dönem ortalaması yıllık
yaklaşık 5 milyon yolcudur. Türkiye’de deregülasyon uygulamalarının ilk yılında bile %30’luk bir artış ortaya çıkmıştır. 2003 yılında yaklaşık 11 milyon yolcu sayısına ulaşabilen Türkiye 2018’de bu
rakamı 115 milyon seviyelerine yükseltmiştir ve deregülasyon dönemi açısından hesaplandığında 16
yıllık dönemde ortalama olarak 15 milyon seviyelerinde yolcu sayısı ortaya çıkmaktadır. Brezilya’da
serbestleşme hareketlerinin başladığı 1986 yılında toplam yolcu sayısı yaklaşık 17 milyon iken, 2018 yılında 102 milyon düzeyinde gerçekleştiği görülmektedir. 33 yıllık deregülasyon ile geçen dönemde
ortalama yıllık yolcu sayısı 47 milyon düzeyindedir. Çin hükümetinin 1994’te serbestleşmeye
başladığı yıl yolcu sayısı yaklaşık 38 milyon olarak gerçekleşmiştir. Çin’in 25 yıllık deregülasyon dönemi boyunca yıllık ortalama yolcu sayısı 213 milyon ve 2018 yılı yolcu sayısı 611 milyondur.
Rusya 1980’lerin başında liberalleşme eğilimlerine başlamasına rağmen eldeki veriler 1991 yılından
başlamaktadır. Bu nedenle bu ülke için ortalama ele alınması sağlıklı olmamaktadır. 2018 yılı Rusya
yolcu sayısı 99 milyon düzeyinde gerçekleşmiştir. 1982’de Meksika’da yaklaşık 13 milyon olarak gerçekleşen yolcu sayısı 2018’de 64 milyona ulaşmıştır ve yıllık ortalama 23 milyon yolcu taşınmıştır.
Endonezya’da ise yaklaşık 20 yıllık dönemde ortalama 53 milyon yolcu taşınmıştır. E7 ülke grubu
içerisinde kendi deregülasyon dönemleri özelinde hesaplanan yıllık ortalama yolcu sayılarına göre en yüksek gelişmeyi Çin gerçekleştirirken bu ülkeyi Endonezya takip etmiştir. Hindistan ülke grubu
içinde ortalama olarak en düşük rakama sahiptir.
Kaynak:(World Bank Open Data)
Şekil 4. E7 Ülkelerinde Havayolu Yolcu Taşımacılığı (1970-2015, milyar)
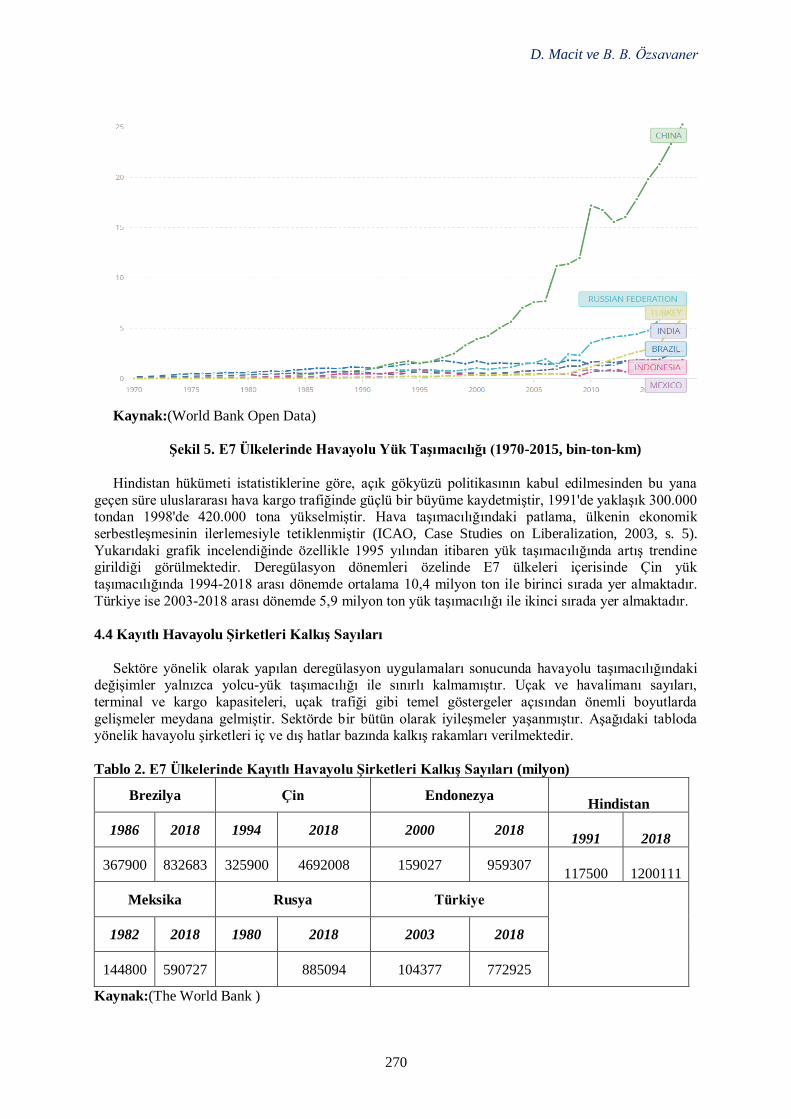
D. Macit ve B. B. Özsavaner
270
Kaynak:(World Bank Open Data)
Şekil 5. E7 Ülkelerinde Havayolu Yük Taşımacılığı (1970-2015, bin-ton-km)
Hindistan hükümeti istatistiklerine göre, açık gökyüzü politikasının kabul edilmesinden bu yana
geçen süre uluslararası hava kargo trafiğinde güçlü bir büyüme kaydetmiştir, 1991'de yaklaşık 300.000 tondan 1998'de 420.000 tona yükselmiştir. Hava taşımacılığındaki patlama, ülkenin ekonomik
serbestleşmesinin ilerlemesiyle tetiklenmiştir (ICAO, Case Studies on Liberalization, 2003, s. 5).
Yukarıdaki grafik incelendiğinde özellikle 1995 yılından itibaren yük taşımacılığında artış trendine girildiği görülmektedir. Deregülasyon dönemleri özelinde E7 ülkeleri içerisinde Çin yük
taşımacılığında 1994-2018 arası dönemde ortalama 10,4 milyon ton ile birinci sırada yer almaktadır.
Türkiye ise 2003-2018 arası dönemde 5,9 milyon ton yük taşımacılığı ile ikinci sırada yer almaktadır.
4.4 Kayıtlı Havayolu Şirketleri Kalkış Sayıları
Sektöre yönelik olarak yapılan deregülasyon uygulamaları sonucunda havayolu taşımacılığındaki değişimler yalnızca yolcu-yük taşımacılığı ile sınırlı kalmamıştır. Uçak ve havalimanı sayıları,
terminal ve kargo kapasiteleri, uçak trafiği gibi temel göstergeler açısından önemli boyutlarda
gelişmeler meydana gelmiştir. Sektörde bir bütün olarak iyileşmeler yaşanmıştır. Aşağıdaki tabloda yönelik havayolu şirketleri iç ve dış hatlar bazında kalkış rakamları verilmektedir.
Tablo 2. E7 Ülkelerinde Kayıtlı Havayolu Şirketleri Kalkış Sayıları (milyon)
Brezilya Çin Endonezya Hindistan
1986 2018 1994 2018 2000 2018 1991 2018
367900 832683 325900 4692008 159027 959307 117500 1200111
Meksika Rusya Türkiye
1982 2018 1980 2018 2003 2018
144800 590727 885094 104377 772925
Kaynak:(The World Bank )
Havayolu Taşımacılığı Deregülasyonlarının Ekonomik…
271
Yukarıdaki tablo incelendiğinde en yüksek kalkış sayısına sahip ülkenin Çin olduğu görülmektedir.
Çin’in dönem ortalaması 1,8 milyar olarak gerçekleşmiştir. İkinci sırada ise Brezilya 623 milyon
kalkış ortalamasına sahip bulunmaktadır. Türkiye ise 416 milyon kalkış rakamı ile E7 ülke grubu içerisinde beşinci sırada yer almaktadır.
5. Sonuç
Havayolları, hava limanları ve hava seyrüsefer hizmet sağlayıcılarının özelleştirilmesi ve
ticarileştirilmesi adına hükümetler birçok devlet kuruluşunun mülkiyetini ve yönetimini azalttıkça, tüm ekonomik sektörlerde küreselleşme ve serbestleşme ile ilgili daha geniş etkiler meydana gelmiştir.
Ancak, özelleştirmenin başarılmasının kolay olmadığı da belirtilmelidir. İlk özelleştirme planlarının
birçoğu, süreçte karşılaşılan karmaşıklıklar veya havayollarının ekonomik durumu veya yerel şartlar
nedeniyle ertelenmek zorunda kalmıştır. Ancak çoğu durumda özelleştirme niyeti devam etmektedir. Uluslararası hava taşımacılığının sürekli serbestleştirilmesinin sektördeki paydaşların ve
ekonominin genel yararına etkin bir şekilde sürdürülmesi önem taşımaktadır. Bu anlamda ICAO da
uluslararası hava taşımacılığı hizmetlerinin serbestleştirilmesine odaklanan çeşitli faaliyetler yürütmektedir (ICAO, Air Transport Policy and Regulation, 2018). Özellikle 1990’ların başından
itibaren havayolları, havaalanları ve hava seyrüsefer hizmeti sağlayıcıları giderek daha rekabetçi bir
ortamda daha ticarileştirilmiştir. Ticarileşmenin dinamik gelişimi ve liberalleşmenin yayılması etkileşime devam edecek ve birbirleri üzerinde etkileri olacaktır.
Ulusal bayrak taşıyıcıların bir kısmı, bir yandan daha büyük rakiplere karşı, diğer yandan da
faaliyetlerine başlayan yeni katılımcılara karşı rekabet etmeyi çok zor bulmaktadır. Bundan dolayı da
temel bir takım liberalleşme sorunları gündeme gelmektedir. Ancak birçok havayolu, havayolu şirketlerinin düzenleyici bir koruma olmadan serbest bir ortamda kendi yerini bulmasının ve başarılı
faaliyetlerin gerçekleştirilmesinin mümkün olduğunu kanıtlamıştır. Özetle, sektörün liberalleşme
deneyimi olumlu bir tablo sergilemiştir ve sürecin başında ortaya çıkan endişelerin çoğuna çözüm yolları üretilerek üstesinden gelinmiştir.
Çalışmada E7 ülkelerine yönelik olarak, kamu yönetiminde bulunan havayolu ulaştırma sektörünün
deregülasyonlar ile rekabete açılması ile yaşanan sonuçları havacılık sektörü ve ekonomi açısından ele
alınarak değerlendirilmiştir. Çalışmada, E7 ülkelerinin genelinde havacılık sektörünün serbestleşmesinin etkilerini açıklanmaktadır. Serbestleşmenin hem tüketiciler hem de havayolları için
olumlu bir deneyim olduğu ortaya konmaktadır. E7 ülkelerinin her biri için serbestleşme
politikalarının uygulanmaya başlandığı dönem farklı olduğu için veriler ele alınırken buna dikkat edilmiştir. Grup içerisinde değerlendirildiğinde hem yük hem yolcu taşımacılığında Çin birinci sırada
yer alırken, yük taşımacılığında Türkiye, yolcu taşımacılığında ise Endonezya ikinci sırada yer
almaktadır. Bu sıralamalar temel makroekonomik göstergeler ile de uyumludur. GSYH açısından da Çin birinci sırada yer alırken bu ülkeyi Hindistan takip etmektedir. Ortaya konan veriler ışığında
değerlendirildiğinde en düşük enflasyon rakamına sahip olan Çin ekonomisi aynı zamanda grup
içerisinde en iyi sektör ortalamalarına da sahiptir. Endonezya ise Çin’den sonra en düşük enflasyon
ortalamasına sahip bulunmaktadır ve sektör gelişmişliği açısından grubun diğer üyelerinden daha iyi konumda bulunmaktadır.
Özetle, liberalleşme süreçleri ile sektör rekabete açık hale gelmiştir ve temel sektörel büyüklüklerin
birçoğunda önemli artışlar ortaya çıkmıştır. Sektörün her geçen gün büyümesi hizmet kalitesini arttırmanın yanı sıra bilet fiyatlarının azalmasını sağlamıştır. Fiyatlardaki azalış ise doğal olarak
havayolu taşımacılığına olan talebi arttırmıştır. Havacılık sektöründeki büyüme ivmesi arttıkça
ekonomiye olan doğrudan ve dolaylı katkıları da artmıştır. Kapsamı sınırlı olmakla birlikte, serbestleşme politikalarına yönelik yapılan çalışmalar, çeşitli ülke deneyimleri hakkındaki bilgilerin
ülke/ülke grupları bağlamında incelenmesi ve bu bağlamda hükümetlerin serbestleşme yaklaşımlarını
ve politika seçeneklerini daha da geliştirmelerine yardımcı olabilecektir.
D. Macit ve B. B. Özsavaner
272
Kaynaklar
Aktan. (2016). 08 05, 2019 tarihinde http://www.canaktan.org/ekonomi/regulasyon/kavram.htm
adresinden alındı Atag. (2018). Avıatıon Benefıts Beyond Borders.
Burghouwt, G. B. (2016). Economic Benefits Of Reducing Aviation Taxes İn Latin America And The
Caribbean. Seo Amsterdam Economics. 09 22, 2019 Tarihinde Https://Www.Narcis.Nl/Publication/Recordıd/Oai:Dare.Uva.Nl:Publications%2f622f27f0-28cb-
42bc-Ae2e-797dc40e2fb4 Adresinden Alındı
Commercialızation And Liberalization. (2003). Worldwide Air Transport Conference: Challenges And
Opportunıties Of Liberalization (At Conf/5) (S. 1-5). Montreal, 24-29 March: Icao. 8 15, 2019 Tarihinde Https://Www.İcao.İnt/Meetings/Atconf5/Documents/Atconf5_Wp020_En.Pdf
Adresinden Alındı
Iata. (2018). Iata. (2019). Indıa’s Aır Transport Sector. International Air Transport Association (Iata).
Icao. (2003). European Experıence Of Aır Transport Lıberalızatıon, (S. 1-9). 08 2019, 22 Tarihinde
Https://Www.İcao.İnt/Sustainability/Casestudies/Statesreplies/Europeliberalization_En.Pdf Adresinden Alındı
Icao. (2003). Case Studies On Liberalization. Worldwıde Aır Transport Conference: Challenges And
Opportunıtıes Of Lıberalızatıon.
ICAO. (2013a). 08 15, 2019 tarihinde Air Transport Bureau, Economic Analysis and Policy (EAP) Section: https://www.icao.int/sustainability/CaseStudies/Brazil.pdf adresinden alındı
ICAO. (2013b). 08 21, 2019 tarihinde Air Transport Bureau, Economic Analysis and Policy (EAP)
Section, Case Study on Commercialization, Privatization and Economic Oversight of Airports and Air Navigation Services Provider, Turkey.:
https://www.icao.int/sustainability/CaseStudies/Turkey.pdf adresinden alındı
ICAO. (2013c). 08 16, 2019 tarihinde Air Transport Bureau, Economic Analysis and Policy (EAP)
Section, Case Study on Commercialization, Privatization and Economic Oversight of Airports and Air Navigation Services Provider, Mexico. :
https://www.icao.int/sustainability/CaseStudies/Mexico.pdf adresinden alındı
ICAO. (2013d). 08 10, 2019 tarihinde Air Transport Bureau, Economic Analysis and Policy (EAP) Section, Case Study on Commercialization, Privatization and Economic Oversight of Airports and
Air Navigation Services Provider, China. :
https://www.icao.int/sustainability/CaseStudies/China.pdf adresinden alındı ICAO. (2013e). 08 28, 2019 tarihinde Air Transport Bureau, Economic Analysis and Policy (EAP)
Section, Case Study on Commercialization, Privatization and Economic Oversight of Airports and
Air Navigation Services Provider, China.: https://www.icao.int/sustainability/CaseStudies
adresinden alındı ICAO. (2018). Air Transport Policy and Regulation. 08 20, 2019 tarihinde ICAO:
https://www.icao.int/sustainability/Pages/economic-policy.aspx adresinden alındı
Jiaoe, W., David, B., & David , B. (2016). Air deregulation in China and its impact on airline competition 1994–2012. Journal of Transport Geography, 12–23.
Macit, A., & Göçer, S. G. (2017). Havayolu tedarikçilerinin havayolu ve havayolu müşterileri ile
ilişkileri: balık-kılçık modeli. Journal Of Emerging Economies And Policy (JOEEP), 1-14. https://dergipark.org.tr/tr/pub/joeep/issue/35720/398216 adresinden alındı
Teyyare, E. (2018). Devlet mi? Piyasa mı? Türkiye'de Havayolu Taşımacılığı Deregülasyonu. E.
Teyyare, & Z. Y. İsmail Şiriner (Dü.) içinde, Institutions, Development & Economic Growth.
IJOPEC Publication: London. The World Bank . (tarih yok). 08 20, 2019 tarihinde https://datacatalog.worldbank.org/public-
licenses#cc-by adresinden alındı
Uzun, A. M. (2019). Deregülasyon Ve Ekonomik Etkileri: Abd Ve Türkiye Havayolu Taşımacılığı Deneyimi Üzerine Bir İnceleme. Kafkas Üniversitesi İktisadi Ve İdari Bilimler Fakültesi Kaüiibfd,
10(19), 476-491.

Havayolu Taşımacılığı Deregülasyonlarının Ekonomik…
273
Wensveen, J. G. (2007). Air Transportation A Management Perspective. England: Ashgate
Publishing. World Bank Open Data. (tarih yok). 09 24, 2019 tarihinde Worl Bank: https://data.worldbank.org/
adresinden alındı
3rd International Conference on Economic Research
24-25th October 2019, Alanya, Turkey
274
INSTITUTIONAL QUALITY AND INTERNATIONAL TOURISM REVENUES:
PANEL CAUSALITY ANALYSIS IN THE CASE OF FIVE MEDITERRANEAN
COUNTRIES
Seymur Ağazade
Alanya Alaaddin Keykubat University, Department of Tourism Management, Turkey
Email: [email protected]
Abstract
Institutional quality is expected to have a positive impact on tourism flows as it reduces transaction
costs and uncertainty for decision-making units in the tourism sector.In addition, institutional quality
in a country can support the risein brand value of tourism destinations. The tourism demand for the
respective destination may therefore increase. Furthermore, brand value can be expressed as an
indication of the capability of tourism firms to gain market power, that is, their ability to apply high
prices. On the other hand, international tourism flowsmayalso affect the formal and informal
institutional structure of the host country. In this study, using fairly comprehensive indicators related
to the institutional structure and panel data methods, the relationship between institutional quality and
international tourism revenues was examined for France, Italy, Spain, Greece and Turkey. It is known
that these countries compete in maritime tourism and have strong cultural tourism potential due to
many reasons, especially their historical background. In the study, three different measures of
institutional quality were used. These are institutions, public institutions and private institutions
indexes published by World Economic Forum. For tourism revenues, two different indicators are
taken into consideration: total international tourism revenues and the value of this variable per tourist.
The research period was limited to 2006-2017, the period in which data on institutional quality is
available. In the analysis, firstly the cross-sectional dependence of the data was examined by Breusch
and Pagan (1980) LM and Pesaran (2004) CD tests and in accordance with the findings of these tests
second generation panel unit root tests were applied.Considering the heterogeneity of parameters of
the model, the causality relationship between institutional quality and tourist revenue variables was
examined by Dumitrescu and Hurlin (2012) heterogeneous panel causality test.Findings of the
causality analysis indicate that there is a unidirectional causalrelationshiprunning from all three
variables of institutional quality to international tourism revenue and international tourism revenueper
tourist. Additionally, individual effects of countries in the predicted panel VAR model were found to
be different. As a conclusion, the findings of the study show that besides the supply and demand
factors countries need to improve their institutional quality in order to increase tourism revenues.
Keywords: Institutional Quality, International Tourism Revenues, Heterogeneous Panel, Causality
Analysis, Five Mediterranean Countries.
KURUMSAL KALİTE VE ULUSLARARASI TURİZM GELİRLERİ İLİŞKİSİ: BEŞ
AKDENİZ ÜLKESİ ÖRNEĞİNDE PANEL NEDENSELLİK ANALİZİ
Özet
Turizm sektöründe yer alan karar birimleri açısından işlem maliyetlerini ve belirsizliği
azalttığından dolayı kurumsal kalitenin turizm akımlarını olumlu yönde etkilemesi beklenir. Bunun
yanı sıra, kurumsal kalite turizm destinasyonlarının marka değeri kazanmalarına veya bunun artmasına
katkı sağlayabilir. İlgili destinasyona yönelik turizm talebi bu nedenle artış gösterebilir. Marka değeri
turizm firmalarının piyasa gücü kazanmalarınınyani yüksek fiyat uygulayabilme kabiliyetlerinin bir
göstergesi olarak da düşünülebilir. Diğer yandan,uluslararası turizm akımları da ev sahibi ülkelerde
formel ve enformel kurumsal yapının değişmesine etki edebilir. Bu çalışmada kurumsal yapıya ilişkin
oldukça kapsayıcı göstergeler ve panel veri yöntemleri kullanılarak kurumsal kalite ve uluslararası
turizm gelirleri arasındaki ilişki Fransa, İtalya, İspanya, Yunanistan ve Türkiye örneğinde
incelenmiştir. Çalışmada ele alınan ülkeler deniz turizminde önemli derecede rekabet halinde
Kurumsal Kalite ve Uluslararası Turizm Gelirleri İlişkisi...
275
olmalarının yanı sıra köklü tarihi geçmişleri başta olmak üzere birçok nedenden kaynaklanan güçlü
kültür turizmi potansiyeline sahip oldukları da bilinmektedir. Çalışmada kurumsal kalite göstergeleri
olarak Dünya EkonomikForumu’nun kurumlar, kamu kurumları ve özel sektör kurumları endeksleri
kullanılmıştır. Turizm gelirleri için ise uluslararası toplam turizm gelirleri ve bu değişkenin turist
başına düşen değeri olmak üzere iki farklı gösterge dikkate alınmıştır. Araştırma dönemi kurumsal
kaliteye ilişkin verinin mevcut olduğu 2006-2017 yılları ile sınırlandırılmıştır. Analizlerde öncelikli
olarak veride yatay kesit bağımlılığı Breusch ve Pagan (1980) LM ve Pesaran (2004) CD testleri
aracılığı ile incelenmiş ve bu inceleme bulgularına uygun olarak ikinci kuşak panel birim kök testleri
kullanılmıştır. Ardından nedensellik analizi için oluşturulan modele ait parametrelerinin homojen
olmadıkları dikkate alınarak Dumitrescu ve Hurlin (2012) heterojen panel nedensellik testi
uygulanmıştır. Nedensellik analizi bulgularıher üç kurumsal kalite değişkeninden hem uluslararası
turizm geliri hem de turist başına düşen uluslararası turizm geliri değişkenine doğru tek yönlü
nedensellik ilişkisinin olduğunu göstermiştir. Ayrıca tahmin edilen panel VAR modelinde ülkelere
ilişkin bireysel etkilerin farklılık gösterdiği görülmüştür.Elde edilen bulgular ülkelerin turizm
gelirlerini artırmaları için arz ve talep faktörlerinin yanı sıra kurumsal kalitelerini de geliştirmeleri
gerektiğini ortaya koymaktadır.
Anahtar Kelimeler: Kurumsal Kalite, Uluslararası Turizm Gelirleri, Heterojen Panel, Nedensellik
Analizi, Beş Akdeniz Ülkesi.
1. Giriş
Kurumlar, insanlar arasında etkileşimin sınırlarını belirleyen, bu etkileşimin teşvik unsurlarına belli
bir yapı kazandıran ya da bireylerin tercih kümelerini belirleyen ve sınırlayan formel ve enformel
kısıtlar şeklinde tanımlanabilir. Ekonomik birimler arasındaki etkileşim için istikrarlı bir yapı
oluşturmakla kurumlar belirsizliğin ve işlem maliyetlerinin azalmasına katkı sağlamakta ve ekonomik
performansı etkilemektedir. Bu çerçeveden bakıldığında uzun zaman dilimlerinde ekonomilerin
birbirinden farklı performans göstermesi de önemli ölçüde üretken faaliyetlerde bulunmayı teşvik
edenkurumların veya bunun aksine yeniden dağıtım faaliyetlerini geliştiren kurumların varlığından
kaynaklanmaktadır (North, 2010: 9-19).
Kurumsal kalitenin, nihayetinde bir ekonomik faaliyet olan turizmi de belirsizliğe ve işlem
maliyetlerine ilişkin sonuçları üzerinden etkilemesi beklenir. Şöyle ki yüksek kurumsal kalite turizm
sektöründe yer alan firmalar, aracılar, tedarikçiler ve turistler olmak üzere karar birimleri için
belirsizliğive işlem maliyetlerini azaltmaktadır. Bu durumun turizm firmaları, aracılar ve tedarikçiler
açısından sektörün daha rekabetçi bir yapıya kavuşmasına, maliyetlerde azalmaya, etkinlikte ve hizmet
kalitesinde ise artışa katkı sağlaması beklenir. Mülkiyet haklarının korunmasını, yargının
bağımsızlığını, uyuşmazlıkların hızlı ve etkin şekilde çözülmesini, kamu kararlarında şeffaflığı,
yolsuzluk, suç ve şiddetin düşük olmasını sağlayan bir kurumsal yapının diğer sektörlerde olduğu gibi
turizm sektörüne yönelik yatırımlar için de daha olumlu bir ortam hazırlaması ve sektörün büyümesini
desteklemesi muhtemeldir. Bunun yanı sıra karar verme sürecinde belirsizliği ve işlem maliyetlerini
azaltmakla yüksek kurumsal kalitenin turizme yönelik talebi de pozitif yönde etkilemesi beklenir.
İlave olarakkurumsal faktörler turizm firmalarının marka değeri kazanmalarını da olumlu yönde
etkileyebilir. Bunun aksine düşük kurumsal kalite örneğin temel hak ve özgürlüklere, mülkiyet
haklarına, yolsuzluklara ve güvenliğe ilişkin sorunlar genel olarak ülkenin görünümüne ilişkin negatif
algıyaneden olabilmekle birlikteözellikle turizm ve diğer hizmet firmalarının marka değerlerini de
olumsuz yönde etkileyebilir. Bu durum turizm sektörü açısından ilgili ülkeye veya destinasyona
yönelik talebin zayıflaması ile sonuçlanabilir. Bunun aksine turizm firmalarının marka değeri
kazanması bunlara yönelik talebin artmasının yanı sıra bunun daha esnek olmayan bir yapıya
kavuşmasına neden olabilir. Bu durumun ise firmalara maliyetlerin üzerinde yüksek fiyatlar
uygulayabilme gücü veya rekabet üstünlüğükazandırması beklenir (Kim vd. 2018: 536-537).
Diğer yönden ülkeye yönelik yurtdışı turizm akımları da kurumsal kaliteyietkileyebilir. Ülkeye
gelen turistler mevcut formel kurumlarda etkin olmayan ekonomik sonuçlara neden olan sorunların
fark edilmesine ve bunları değiştirmek için daha güçlü motivasyona katkı sağlayabilir. Enformel
kurumlar ise doğrudan yerleşik olanların yoğun bir şekilde ülkeye gelen turistlerle giriştikleri her türlü
ekonomik ve sosyal değişimin sonucunda etkilenebilir.
S. Ağazade
276
Bu çalışmada panel veri yöntemleri kullanılarak beş Akdeniz ülkesinde kurumsal kalite ve turizm
gelirleri ilişkisi nedensellik analizi kapsamında araştırılmıştır. Araştırmayı kapsayan ülkeler Fransa,
İtalya, İspanya, Yunanistan ve Türkiye olup analizler 2006-2017 yıllarına ait verilere dayanmaktadır.
Çalışmada ele alınan ülkelerin deniz turizmine göre dünya ülkeleri arasında üst sıralarda ve
birbirileriyle rekabet halinde olmanın yanı sıra kültür turizmi bakımından da hayli zengin
potansiyellerinin olduğu bilinmektedir. Ayrıca çalışmada kurumsal kaliteyi sadece belirli yönleri ile
değil çok sayıda farklı yönleri ile ele alan göstergeler kullanılmıştır.
2. Veri Seti
Yukarıda da ifade edildiği gibi bu çalışmada kurumsal kalite ve uluslararası turizm gelirleri
arasındaki ilişkinin incelenmesinde Fransa, İtalya, İspanya, Yunanistan ve Türkiye’nin2006-2017
yıllarına ait veri setikullanılmıştır. Çalışmada kullanılan kurumsal kalite göstergelerinin 2006 öncesi
yıllara ait verileri bulunmadığından dolayı araştırma dönemi belirtilen yıllarla
sınırlandırılmıştır.Kurumsal kaliteye ilişkin yapılan çalışmalarda ağırlıklı olarak örneğin mülkiyet
hakları, yolsuzluklar veya hukukun üstünlüğü gibi kurumsal kalitenin sadece belirli bir boyutunuölçen
göstergelerin dikkate alındığı görülmektedir. Bu çalışmada ise kurumsal kalite göstergesi olarakDünya
Ekonomik Forumu’nun ülkelerin kurumsal yapılarını çok sayıda farklı açıdan değerlendiren endeksleri
kullanılmıştır. Forum kurumsal kaliteye ilişkin 21 endeks ile bunların tamamının veya bazı gruplarının
ortalamaları şeklinde hesaplanan kurumsal kalite endeksleri yayınlamaktadır. Dünya Ekonomik
Forumu’nun 21 kurumsal kalite endeksi aşağıda faktörlere ilişkindir:
1. Mülkiyet haklarının korunması
2. Fikri mülkiyetin korunması
3. Kamu kaynaklarının kanunsuz şekilde tahsisi
4. Politikacılara yönelik kamuoyu güveni
5. Kuralsız ödemeler ve rüşvetin yaygınlığı
6. Yargı bağımsızlığı
7. Kamu görevlilerinin karar alma süreçlerinde bazı kesimlere iltimas geçmeleri
8. Kamu harcamalarında etkinlik
9. Kamu düzenlemelerinin ağırlığı
10. Uyuşmazlıkların çözümünde yasal sistemin etkinliği
11. Hükümet eylem ve düzenlemelerine karşı yasal sistemin etkinliği
12. Kamu politikaları oluşturma süreçlerinde şeffaflık
13. Terörizmin iş/ticaret üzerinde neden olduğu yük
14. Suç ve şiddetin iş/ticaret üzerinde neden olduğu yük
15. Organize suçların iş/ticaret üzerinde neden olduğu yük
16. Polis tarafından sağlanan güvenlik hizmetlerinin güvenilirliği
17. Firmaların etik davranış derecesi
18. Denetleme ve raporlama standartlarında sağlamlık
19. Şirket kurullarının etkinliği
20. Küçük hissedarların çıkarlarının korunması
21. Yatırımcıların korunma derecesi
Yukarıda yer alan kurumsal kalite göstergelerden ilk 20’sine ait endeksler 1 ile 7 arasında,
21.göstergeye ait endeks ise 0 ile 10 arasında değerler almaktadır. Endeks değerinin düşük olması
ilgili kurumsal gösterge bakımından ülke durumunun zayıf veya sorunlu olduğunu gösterir. Endeksin
yüksek değer alması ise ilgili gösterge bakımından ülkenin iyi durumda olduğuna işaret etmektedir.
Dünya Ekonomik Formunun kurumlar endeksi yukarıda sıralanan 21 göstergeye ilişkin endeksin
ortalaması şeklinde hesaplanmaktadır. Ayrıca bunların ilk 16’sı ile kamu kurumlarının kalitesine
ilişkin bir gösterge türetilmektedir. Diğer 5 göstergenin dikkate alınması ile ise özel sektöre ilişkin
kurumsal kalite göstergesi oluşturulmaktadır.
Bu çalışmada turizm gelirleri göstergesi olarak ise ülkelerin ABD doları cinsinden toplam turizm
gelirleri ve ayrıca turist başına düşen turizm gelirleri değişkenleri kullanılmıştır. Turizm gelirlerine
ilişkin veriler Dünya Bankası Dünya Kalkınma Göstergeleri veri tabanından alınmıştır. Çalışmada
kullanılan değişkenlere ait grafikler Panel 1’de verilmiştir.
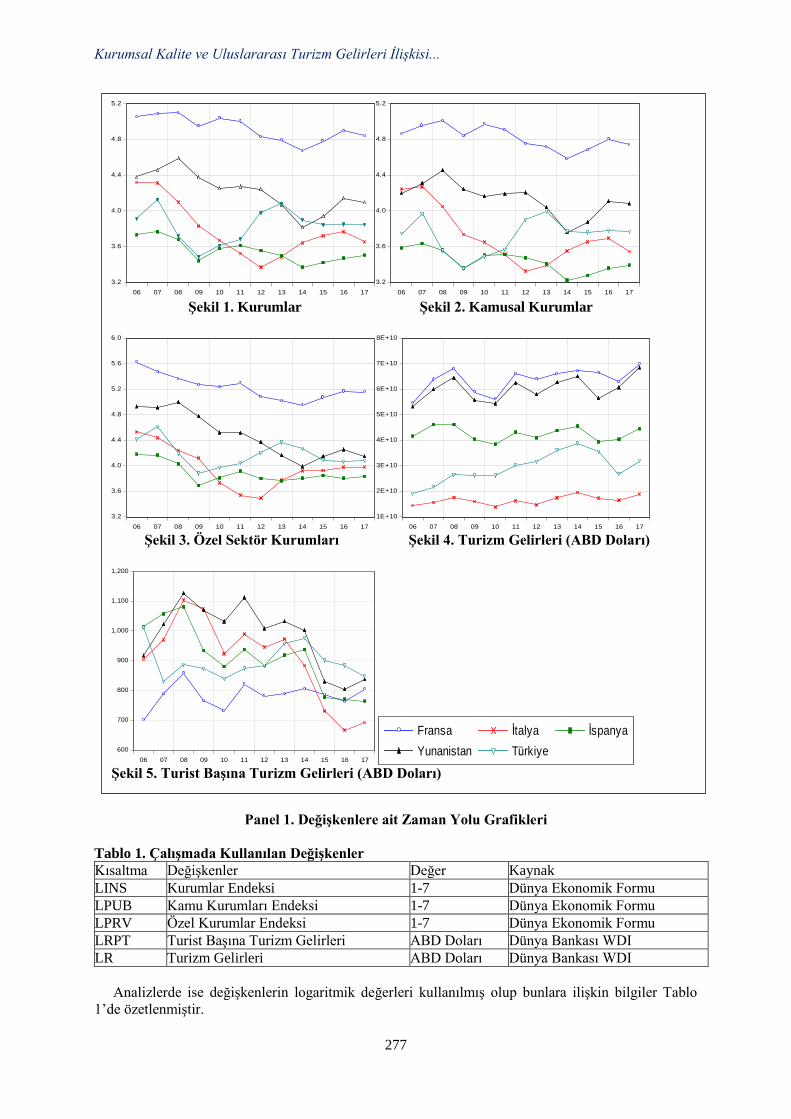
Kurumsal Kalite ve Uluslararası Turizm Gelirleri İlişkisi...
277
Panel 1. Değişkenlere ait Zaman Yolu Grafikleri
Tablo 1. Çalışmada Kullanılan Değişkenler
Kısaltma Değişkenler Değer Kaynak
LINS Kurumlar Endeksi 1-7 Dünya Ekonomik Formu
LPUB Kamu Kurumları Endeksi 1-7 Dünya Ekonomik Formu
LPRV Özel Kurumlar Endeksi 1-7 Dünya Ekonomik Formu
LRPT Turist Başına Turizm Gelirleri ABD Doları Dünya Bankası WDI
LR Turizm Gelirleri ABD Doları Dünya Bankası WDI
Analizlerde ise değişkenlerin logaritmik değerleri kullanılmış olup bunlara ilişkin bilgiler Tablo
1’de özetlenmiştir.
3.2
3.6
4.0
4.4
4.8
5.2
06 07 08 09 10 11 12 13 14 15 16 17
3.2
3.6
4.0
4.4
4.8
5.2
06 07 08 09 10 11 12 13 14 15 16 17 Şekil 1. Kurumlar Şekil 2. Kamusal Kurumlar
3.2
3.6
4.0
4.4
4.8
5.2
5.6
6.0
06 07 08 09 10 11 12 13 14 15 16 17
1E+10
2E+10
3E+10
4E+10
5E+10
6E+10
7E+10
8E+10
06 07 08 09 10 11 12 13 14 15 16 17 Şekil 3. Özel Sektör Kurumları Şekil 4. Turizm Gelirleri (ABD Doları)
600
700
800
900
1,000
1,100
1,200
06 07 08 09 10 11 12 13 14 15 16 17
600
700
800
900
1,000
1,100
1,200
06 07 08 09 10 11 12 13 14 15 16 17
Fransa İtalya İspanya
Yunanistan Türkiye
Şekil 5. Turist Başına Turizm Gelirleri (ABD Doları)
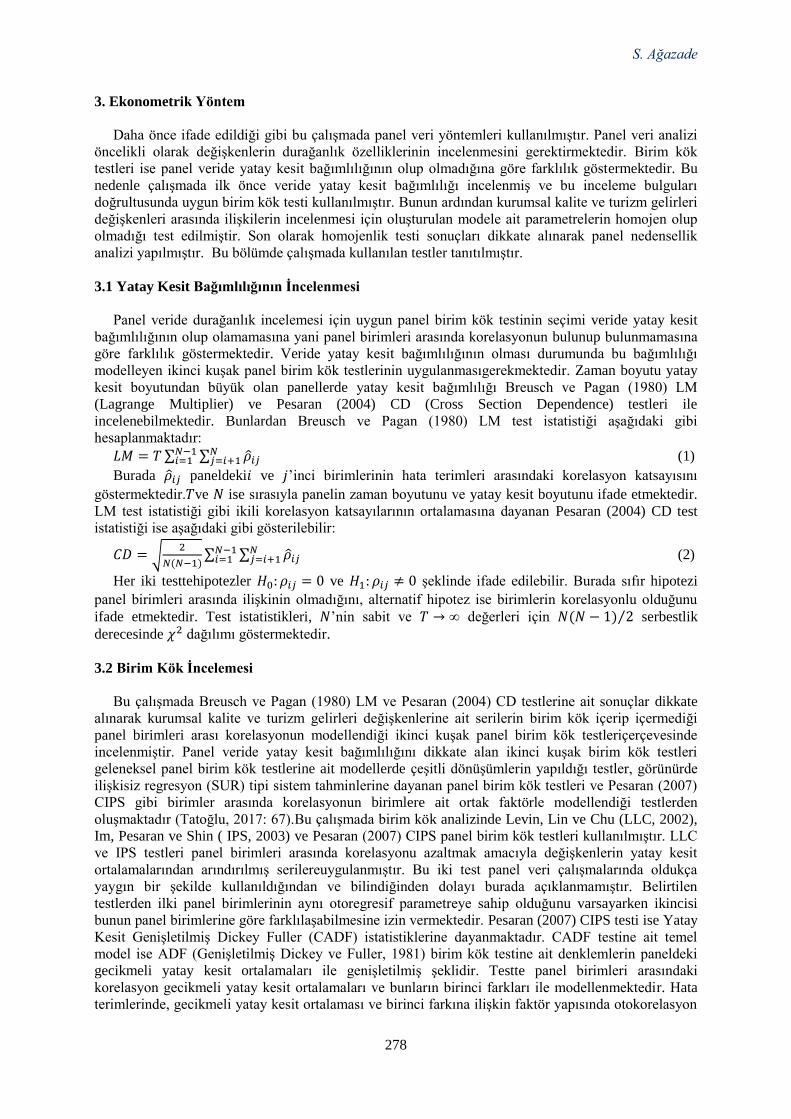
S. Ağazade
278
3. Ekonometrik Yöntem
Daha önce ifade edildiği gibi bu çalışmada panel veri yöntemleri kullanılmıştır. Panel veri analizi
öncelikli olarak değişkenlerin durağanlık özelliklerinin incelenmesini gerektirmektedir. Birim kök
testleri ise panel veride yatay kesit bağımlılığının olup olmadığına göre farklılık göstermektedir. Bu
nedenle çalışmada ilk önce veride yatay kesit bağımlılığı incelenmiş ve bu inceleme bulguları
doğrultusunda uygun birim kök testi kullanılmıştır. Bunun ardından kurumsal kalite ve turizm gelirleri
değişkenleri arasında ilişkilerin incelenmesi için oluşturulan modele ait parametrelerin homojen olup
olmadığı test edilmiştir. Son olarak homojenlik testi sonuçları dikkate alınarak panel nedensellik
analizi yapılmıştır. Bu bölümde çalışmada kullanılan testler tanıtılmıştır.
3.1 Yatay Kesit Bağımlılığının İncelenmesi
Panel veride durağanlık incelemesi için uygun panel birim kök testinin seçimi veride yatay kesit
bağımlılığının olup olamamasına yani panel birimleri arasında korelasyonun bulunup bulunmamasına
göre farklılık göstermektedir. Veride yatay kesit bağımlılığının olması durumunda bu bağımlılığı
modelleyen ikinci kuşak panel birim kök testlerinin uygulanmasıgerekmektedir. Zaman boyutu yatay
kesit boyutundan büyük olan panellerde yatay kesit bağımlılığı Breusch ve Pagan (1980) LM
(Lagrange Multiplier) ve Pesaran (2004) CD (Cross Section Dependence) testleri ile
incelenebilmektedir. Bunlardan Breusch ve Pagan (1980) LM test istatistiği aşağıdaki gibi
hesaplanmaktadır:
𝐿𝑀 = 𝑇 ∑ ∑ �̂�𝑖𝑗𝑁𝑗=𝑖+1
𝑁−1𝑖=1 (1)
Burada �̂�𝑖𝑗 paneldeki𝑖 ve 𝑗’inci birimlerinin hata terimleri arasındaki korelasyon katsayısını
göstermektedir.𝑇ve 𝑁 ise sırasıyla panelin zaman boyutunu ve yatay kesit boyutunu ifade etmektedir.
LM test istatistiği gibi ikili korelasyon katsayılarının ortalamasına dayanan Pesaran (2004) CD test
istatistiği ise aşağıdaki gibi gösterilebilir:
𝐶𝐷 = √2
𝑁(𝑁−1)∑ ∑ �̂�𝑖𝑗
𝑁𝑗=𝑖+1
𝑁−1𝑖=1 (2)
Her iki testtehipotezler 𝐻0: 𝜌𝑖𝑗 = 0 ve 𝐻1: 𝜌𝑖𝑗 ≠ 0 şeklinde ifade edilebilir. Burada sıfır hipotezi
panel birimleri arasında ilişkinin olmadığını, alternatif hipotez ise birimlerin korelasyonlu olduğunu
ifade etmektedir. Test istatistikleri, 𝑁’nin sabit ve 𝑇 → ∞ değerleri için 𝑁(𝑁 − 1) 2⁄ serbestlik
derecesinde 𝜒2 dağılımı göstermektedir.
3.2 Birim Kök İncelemesi
Bu çalışmada Breusch ve Pagan (1980) LM ve Pesaran (2004) CD testlerine ait sonuçlar dikkate
alınarak kurumsal kalite ve turizm gelirleri değişkenlerine ait serilerin birim kök içerip içermediği
panel birimleri arası korelasyonun modellendiği ikinci kuşak panel birim kök testleriçerçevesinde
incelenmiştir. Panel veride yatay kesit bağımlılığını dikkate alan ikinci kuşak birim kök testleri
geleneksel panel birim kök testlerine ait modellerde çeşitli dönüşümlerin yapıldığı testler, görünürde
ilişkisiz regresyon (SUR) tipi sistem tahminlerine dayanan panel birim kök testleri ve Pesaran (2007)
CIPS gibi birimler arasında korelasyonun birimlere ait ortak faktörle modellendiği testlerden
oluşmaktadır (Tatoğlu, 2017: 67).Bu çalışmada birim kök analizinde Levin, Lin ve Chu (LLC, 2002),
Im, Pesaran ve Shin ( IPS, 2003) ve Pesaran (2007) CIPS panel birim kök testleri kullanılmıştır. LLC
ve IPS testleri panel birimleri arasında korelasyonu azaltmak amacıyla değişkenlerin yatay kesit
ortalamalarından arındırılmış serilereuygulanmıştır. Bu iki test panel veri çalışmalarında oldukça
yaygın bir şekilde kullanıldığından ve bilindiğinden dolayı burada açıklanmamıştır. Belirtilen
testlerden ilki panel birimlerinin aynı otoregresif parametreye sahip olduğunu varsayarken ikincisi
bunun panel birimlerine göre farklılaşabilmesine izin vermektedir. Pesaran (2007) CIPS testi ise Yatay
Kesit Genişletilmiş Dickey Fuller (CADF) istatistiklerine dayanmaktadır. CADF testine ait temel
model ise ADF (Genişletilmiş Dickey ve Fuller, 1981) birim kök testine ait denklemlerin paneldeki
gecikmeli yatay kesit ortalamaları ile genişletilmiş şeklidir. Testte panel birimleri arasındaki
korelasyon gecikmeli yatay kesit ortalamaları ve bunların birinci farkları ile modellenmektedir. Hata
terimlerinde, gecikmeli yatay kesit ortalaması ve birinci farkına ilişkin faktör yapısında otokorelasyon
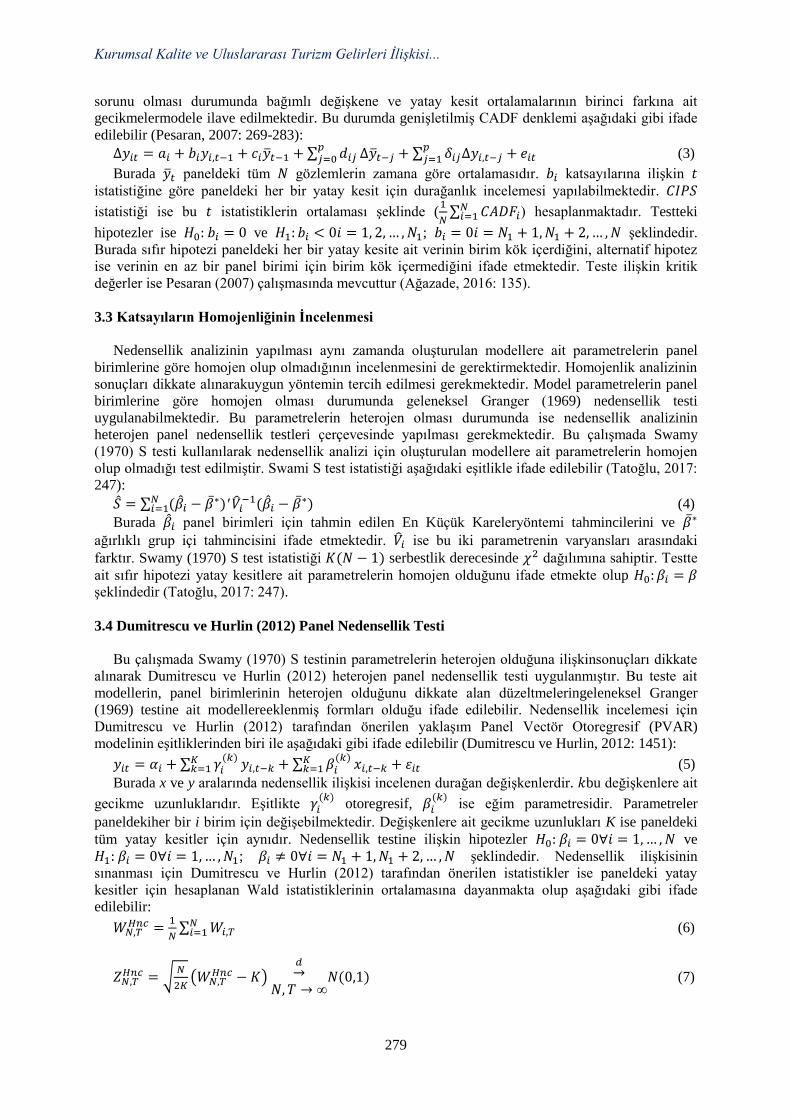
Kurumsal Kalite ve Uluslararası Turizm Gelirleri İlişkisi...
279
sorunu olması durumunda bağımlı değişkene ve yatay kesit ortalamalarının birinci farkına ait
gecikmelermodele ilave edilmektedir. Bu durumda genişletilmiş CADF denklemi aşağıdaki gibi ifade
edilebilir (Pesaran, 2007: 269-283):
∆𝑦𝑖𝑡 = 𝑎𝑖 + 𝑏𝑖𝑦𝑖,𝑡−1 + 𝑐𝑖�̅�𝑡−1 + ∑ 𝑑𝑖𝑗𝑝𝑗=0 ∆�̅�𝑡−𝑗 + ∑ 𝛿𝑖𝑗∆𝑦𝑖,𝑡−𝑗
𝑝𝑗=1 + 𝑒𝑖𝑡 (3)
Burada �̅�𝑡 paneldeki tüm 𝑁 gözlemlerin zamana göre ortalamasıdır. 𝑏𝑖 katsayılarına ilişkin 𝑡
istatistiğine göre paneldeki her bir yatay kesit için durağanlık incelemesi yapılabilmektedir. 𝐶𝐼𝑃𝑆
istatistiği ise bu 𝑡 istatistiklerin ortalaması şeklinde (1
𝑁∑ 𝐶𝐴𝐷𝐹𝑖
𝑁𝑖=1 ) hesaplanmaktadır. Testteki
hipotezler ise 𝐻0: 𝑏𝑖 = 0 ve 𝐻1: 𝑏𝑖 < 0𝑖 = 1, 2, … , 𝑁1; 𝑏𝑖 = 0𝑖 = 𝑁1 + 1, 𝑁1 + 2, … , 𝑁 şeklindedir.
Burada sıfır hipotezi paneldeki her bir yatay kesite ait verinin birim kök içerdiğini, alternatif hipotez
ise verinin en az bir panel birimi için birim kök içermediğini ifade etmektedir. Teste ilişkin kritik
değerler ise Pesaran (2007) çalışmasında mevcuttur (Ağazade, 2016: 135).
3.3 Katsayıların Homojenliğinin İncelenmesi
Nedensellik analizinin yapılması aynı zamanda oluşturulan modellere ait parametrelerin panel
birimlerine göre homojen olup olmadığının incelenmesini de gerektirmektedir. Homojenlik analizinin
sonuçları dikkate alınarakuygun yöntemin tercih edilmesi gerekmektedir. Model parametrelerin panel
birimlerine göre homojen olması durumunda geleneksel Granger (1969) nedensellik testi
uygulanabilmektedir. Bu parametrelerin heterojen olması durumunda ise nedensellik analizinin
heterojen panel nedensellik testleri çerçevesinde yapılması gerekmektedir. Bu çalışmada Swamy
(1970) S testi kullanılarak nedensellik analizi için oluşturulan modellere ait parametrelerin homojen
olup olmadığı test edilmiştir. Swami S test istatistiği aşağıdaki eşitlikle ifade edilebilir (Tatoğlu, 2017:
247):
�̂� = ∑ (�̂�𝑖 − �̅�∗)′𝑁𝑖=1 �̂�𝑖
−1(�̂�𝑖 − �̅�∗) (4)
Burada �̂�𝑖 panel birimleri için tahmin edilen En Küçük Kareleryöntemi tahmincilerini ve �̅�∗
ağırlıklı grup içi tahmincisini ifade etmektedir. �̂�𝑖 ise bu iki parametrenin varyansları arasındaki
farktır. Swamy (1970) S test istatistiği 𝐾(𝑁 − 1) serbestlik derecesinde 𝜒2 dağılımına sahiptir. Testte
ait sıfır hipotezi yatay kesitlere ait parametrelerin homojen olduğunu ifade etmekte olup 𝐻0: 𝛽𝑖 = 𝛽
şeklindedir (Tatoğlu, 2017: 247).
3.4 Dumitrescu ve Hurlin (2012) Panel Nedensellik Testi
Bu çalışmada Swamy (1970) S testinin parametrelerin heterojen olduğuna ilişkinsonuçları dikkate
alınarak Dumitrescu ve Hurlin (2012) heterojen panel nedensellik testi uygulanmıştır. Bu teste ait
modellerin, panel birimlerinin heterojen olduğunu dikkate alan düzeltmeleringeleneksel Granger
(1969) testine ait modellereeklenmiş formları olduğu ifade edilebilir. Nedensellik incelemesi için
Dumitrescu ve Hurlin (2012) tarafından önerilen yaklaşım Panel Vectör Otoregresif (PVAR)
modelinin eşitliklerinden biri ile aşağıdaki gibi ifade edilebilir (Dumitrescu ve Hurlin, 2012: 1451):
𝑦𝑖𝑡 = 𝛼𝑖 + ∑ 𝛾𝑖(𝑘)𝐾
𝑘=1 𝑦𝑖,𝑡−𝑘 + ∑ 𝛽𝑖(𝑘)𝐾
𝑘=1 𝑥𝑖,𝑡−𝑘 + 휀𝑖𝑡 (5)
Burada x ve y aralarında nedensellik ilişkisi incelenen durağan değişkenlerdir. 𝑘bu değişkenlere ait
gecikme uzunluklarıdır. Eşitlikte 𝛾𝑖(𝑘)
otoregresif, 𝛽𝑖(𝑘)
ise eğim parametresidir. Parametreler
paneldekiher bir i birim için değişebilmektedir. Değişkenlere ait gecikme uzunlukları K ise paneldeki
tüm yatay kesitler için aynıdır. Nedensellik testine ilişkin hipotezler 𝐻0: 𝛽𝑖 = 0∀𝑖 = 1, … , 𝑁 ve
𝐻1: 𝛽𝑖 = 0∀𝑖 = 1, … , 𝑁1; 𝛽𝑖 ≠ 0∀𝑖 = 𝑁1 + 1, 𝑁1 + 2, … , 𝑁 şeklindedir. Nedensellik ilişkisinin
sınanması için Dumitrescu ve Hurlin (2012) tarafından önerilen istatistikler ise paneldeki yatay
kesitler için hesaplanan Wald istatistiklerinin ortalamasına dayanmakta olup aşağıdaki gibi ifade
edilebilir:
𝑊𝑁,𝑇𝐻𝑛𝑐 =
1
𝑁∑ 𝑊𝑖,𝑇
𝑁𝑖=1 (6)
𝑍𝑁,𝑇𝐻𝑛𝑐 = √
𝑁
2𝐾(𝑊𝑁,𝑇
𝐻𝑛𝑐 − 𝐾)𝑑→
𝑁, 𝑇 → ∞𝑁(0,1) (7)
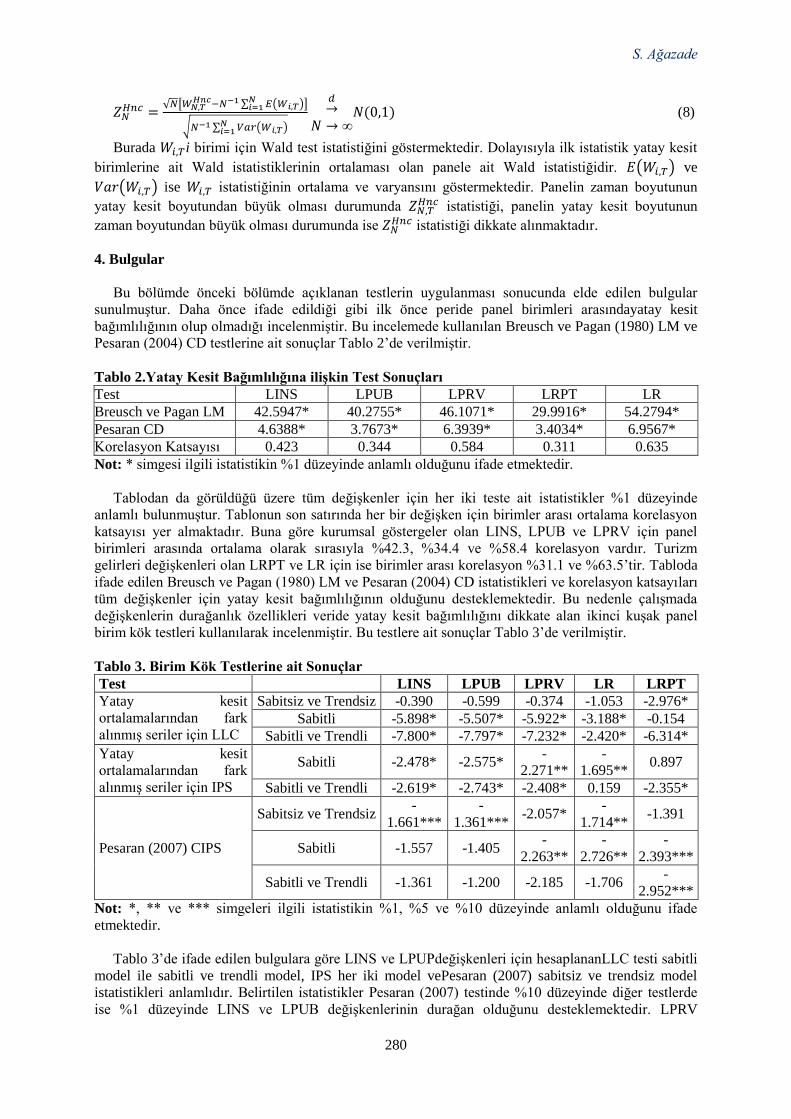
S. Ağazade
280
𝑍𝑁𝐻𝑛𝑐 =
√𝑁[𝑊𝑁,𝑇𝐻𝑛𝑐−𝑁−1 ∑ 𝐸(𝑊𝑖,𝑇)𝑁
𝑖=1 ]
√𝑁−1 ∑ 𝑉𝑎𝑟(𝑊𝑖,𝑇)𝑁𝑖=1
𝑑→
𝑁 → ∞𝑁(0,1) (8)
Burada 𝑊𝑖,𝑇i birimi için Wald test istatistiğini göstermektedir. Dolayısıyla ilk istatistik yatay kesit
birimlerine ait Wald istatistiklerinin ortalaması olan panele ait Wald istatistiğidir. 𝐸(𝑊𝑖,𝑇) ve
𝑉𝑎𝑟(𝑊𝑖,𝑇) ise 𝑊𝑖,𝑇 istatistiğinin ortalama ve varyansını göstermektedir. Panelin zaman boyutunun
yatay kesit boyutundan büyük olması durumunda 𝑍𝑁,𝑇𝐻𝑛𝑐 istatistiği, panelin yatay kesit boyutunun
zaman boyutundan büyük olması durumunda ise 𝑍𝑁𝐻𝑛𝑐 istatistiği dikkate alınmaktadır.
4. Bulgular
Bu bölümde önceki bölümde açıklanan testlerin uygulanması sonucunda elde edilen bulgular
sunulmuştur. Daha önce ifade edildiği gibi ilk önce peride panel birimleri arasındayatay kesit
bağımlılığının olup olmadığı incelenmiştir. Bu incelemede kullanılan Breusch ve Pagan (1980) LM ve
Pesaran (2004) CD testlerine ait sonuçlar Tablo 2’de verilmiştir.
Tablo 2.Yatay Kesit Bağımlılığına ilişkin Test Sonuçları
Test LINS LPUB LPRV LRPT LR
Breusch ve Pagan LM 42.5947* 40.2755* 46.1071* 29.9916* 54.2794*
Pesaran CD 4.6388* 3.7673* 6.3939* 3.4034* 6.9567*
Korelasyon Katsayısı 0.423 0.344 0.584 0.311 0.635
Not: * simgesi ilgili istatistikin %1 düzeyinde anlamlı olduğunu ifade etmektedir.
Tablodan da görüldüğü üzere tüm değişkenler için her iki teste ait istatistikler %1 düzeyinde
anlamlı bulunmuştur. Tablonun son satırında her bir değişken için birimler arası ortalama korelasyon
katsayısı yer almaktadır. Buna göre kurumsal göstergeler olan LINS, LPUB ve LPRV için panel
birimleri arasında ortalama olarak sırasıyla %42.3, %34.4 ve %58.4 korelasyon vardır. Turizm
gelirleri değişkenleri olan LRPT ve LR için ise birimler arası korelasyon %31.1 ve %63.5’tir. Tabloda
ifade edilen Breusch ve Pagan (1980) LM ve Pesaran (2004) CD istatistikleri ve korelasyon katsayıları
tüm değişkenler için yatay kesit bağımlılığının olduğunu desteklemektedir. Bu nedenle çalışmada
değişkenlerin durağanlık özellikleri veride yatay kesit bağımlılığını dikkate alan ikinci kuşak panel
birim kök testleri kullanılarak incelenmiştir. Bu testlere ait sonuçlar Tablo 3’de verilmiştir.
Tablo 3. Birim Kök Testlerine ait Sonuçlar
Test
LINS LPUB LPRV LR LRPT
Yatay kesit
ortalamalarından fark
alınmış seriler için LLC
Sabitsiz ve Trendsiz -0.390 -0.599 -0.374 -1.053 -2.976*
Sabitli -5.898* -5.507* -5.922* -3.188* -0.154
Sabitli ve Trendli -7.800* -7.797* -7.232* -2.420* -6.314*
Yatay kesit
ortalamalarından fark
alınmış seriler için IPS
Sabitli -2.478* -2.575* -
2.271**
-
1.695** 0.897
Sabitli ve Trendli -2.619* -2.743* -2.408* 0.159 -2.355*
Pesaran (2007) CIPS
Sabitsiz ve Trendsiz -
1.661***
-
1.361*** -2.057*
-
1.714** -1.391
Sabitli -1.557 -1.405 -
2.263**
-
2.726**
-
2.393***
Sabitli ve Trendli -1.361 -1.200 -2.185 -1.706 -
2.952***
Not: *, ** ve *** simgeleri ilgili istatistikin %1, %5 ve %10 düzeyinde anlamlı olduğunu ifade
etmektedir.
Tablo 3’de ifade edilen bulgulara göre LINS ve LPUPdeğişkenleri için hesaplananLLC testi sabitli
model ile sabitli ve trendli model, IPS her iki model vePesaran (2007) sabitsiz ve trendsiz model
istatistikleri anlamlıdır. Belirtilen istatistikler Pesaran (2007) testinde %10 düzeyinde diğer testlerde
ise %1 düzeyinde LINS ve LPUB değişkenlerinin durağan olduğunu desteklemektedir. LPRV
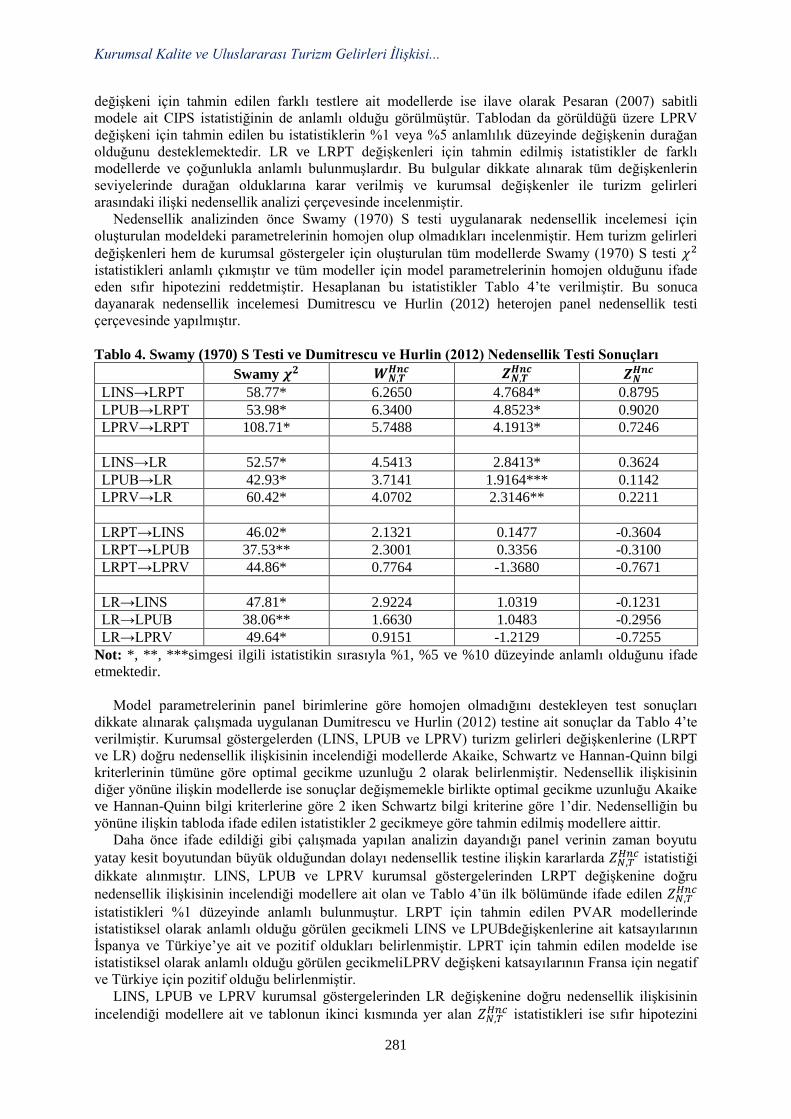
Kurumsal Kalite ve Uluslararası Turizm Gelirleri İlişkisi...
281
değişkeni için tahmin edilen farklı testlere ait modellerde ise ilave olarak Pesaran (2007) sabitli
modele ait CIPS istatistiğinin de anlamlı olduğu görülmüştür. Tablodan da görüldüğü üzere LPRV
değişkeni için tahmin edilen bu istatistiklerin %1 veya %5 anlamlılık düzeyinde değişkenin durağan
olduğunu desteklemektedir. LR ve LRPT değişkenleri için tahmin edilmiş istatistikler de farklı
modellerde ve çoğunlukla anlamlı bulunmuşlardır. Bu bulgular dikkate alınarak tüm değişkenlerin
seviyelerinde durağan olduklarına karar verilmiş ve kurumsal değişkenler ile turizm gelirleri
arasındaki ilişki nedensellik analizi çerçevesinde incelenmiştir.
Nedensellik analizinden önce Swamy (1970) S testi uygulanarak nedensellik incelemesi için
oluşturulan modeldeki parametrelerinin homojen olup olmadıkları incelenmiştir. Hem turizm gelirleri
değişkenleri hem de kurumsal göstergeler için oluşturulan tüm modellerde Swamy (1970) S testi 𝜒2
istatistikleri anlamlı çıkmıştır ve tüm modeller için model parametrelerinin homojen olduğunu ifade
eden sıfır hipotezini reddetmiştir. Hesaplanan bu istatistikler Tablo 4’te verilmiştir. Bu sonuca
dayanarak nedensellik incelemesi Dumitrescu ve Hurlin (2012) heterojen panel nedensellik testi
çerçevesinde yapılmıştır.
Tablo 4. Swamy (1970) S Testi ve Dumitrescu ve Hurlin (2012) Nedensellik Testi Sonuçları
Swamy 𝝌𝟐 𝑾𝑵,𝑻𝑯𝒏𝒄 𝒁𝑵,𝑻
𝑯𝒏𝒄 𝒁𝑵𝑯𝒏𝒄
LINS→LRPT 58.77* 6.2650 4.7684* 0.8795
LPUB→LRPT 53.98* 6.3400 4.8523* 0.9020
LPRV→LRPT 108.71* 5.7488 4.1913* 0.7246
LINS→LR 52.57* 4.5413 2.8413* 0.3624
LPUB→LR 42.93* 3.7141 1.9164*** 0.1142
LPRV→LR 60.42* 4.0702 2.3146** 0.2211
LRPT→LINS 46.02* 2.1321 0.1477 -0.3604
LRPT→LPUB 37.53** 2.3001 0.3356 -0.3100
LRPT→LPRV 44.86* 0.7764 -1.3680 -0.7671
LR→LINS 47.81* 2.9224 1.0319 -0.1231
LR→LPUB 38.06** 1.6630 1.0483 -0.2956
LR→LPRV 49.64* 0.9151 -1.2129 -0.7255
Not: *, **, ***simgesi ilgili istatistikin sırasıyla %1, %5 ve %10 düzeyinde anlamlı olduğunu ifade
etmektedir.
Model parametrelerinin panel birimlerine göre homojen olmadığını destekleyen test sonuçları
dikkate alınarak çalışmada uygulanan Dumitrescu ve Hurlin (2012) testine ait sonuçlar da Tablo 4’te
verilmiştir. Kurumsal göstergelerden (LINS, LPUB ve LPRV) turizm gelirleri değişkenlerine (LRPT
ve LR) doğru nedensellik ilişkisinin incelendiği modellerde Akaike, Schwartz ve Hannan-Quinn bilgi
kriterlerinin tümüne göre optimal gecikme uzunluğu 2 olarak belirlenmiştir. Nedensellik ilişkisinin
diğer yönüne ilişkin modellerde ise sonuçlar değişmemekle birlikte optimal gecikme uzunluğu Akaike
ve Hannan-Quinn bilgi kriterlerine göre 2 iken Schwartz bilgi kriterine göre 1’dir. Nedenselliğin bu
yönüne ilişkin tabloda ifade edilen istatistikler 2 gecikmeye göre tahmin edilmiş modellere aittir.
Daha önce ifade edildiği gibi çalışmada yapılan analizin dayandığı panel verinin zaman boyutu
yatay kesit boyutundan büyük olduğundan dolayı nedensellik testine ilişkin kararlarda 𝑍𝑁,𝑇𝐻𝑛𝑐 istatistiği
dikkate alınmıştır. LINS, LPUB ve LPRV kurumsal göstergelerinden LRPT değişkenine doğru
nedensellik ilişkisinin incelendiği modellere ait olan ve Tablo 4’ün ilk bölümünde ifade edilen 𝑍𝑁,𝑇𝐻𝑛𝑐
istatistikleri %1 düzeyinde anlamlı bulunmuştur. LRPT için tahmin edilen PVAR modellerinde
istatistiksel olarak anlamlı olduğu görülen gecikmeli LINS ve LPUBdeğişkenlerine ait katsayılarının
İspanya ve Türkiye’ye ait ve pozitif oldukları belirlenmiştir. LPRT için tahmin edilen modelde ise
istatistiksel olarak anlamlı olduğu görülen gecikmeliLPRV değişkeni katsayılarının Fransa için negatif
ve Türkiye için pozitif olduğu belirlenmiştir.
LINS, LPUB ve LPRV kurumsal göstergelerinden LR değişkenine doğru nedensellik ilişkisinin
incelendiği modellere ait ve tablonun ikinci kısmında yer alan 𝑍𝑁,𝑇𝐻𝑛𝑐 istatistikleri ise sıfır hipotezini
S. Ağazade
282
sırasıyla %1, %10 ve %5 anlamlılık düzeyinde reddetmiştir. PVAR modellerinde ülkelerin bireysel
etkilerine bakıldığında ise LR için tahmin edilen modellerde anlamlı olduğu görülen gecikmeli LINS
ve LPUB değişkeni katsayılarının Yunanistan için negatif, LPRV ideğişkeni katsayılarının ise Türkiye
için negatif ve Yunanistan için farklı işaretli (pozitif ve negatif) olduğu belirlenmiştir.
Tablo 4’ün son iki bölümünde ise nedensellik ilişkisinin diğer yönüne ilişkin Dumitrescu ve Hurlin
(2012) panel nedensellik testi sonuçları verilmiştir. Görüldüğü üzere 𝑍𝑁,𝑇𝐻𝑛𝑐 istatistikleri hiçbir durumda
anlamlı değildir. Bu modellerde turizm gelirleri değişkenlerinden kurumsal göstergelere doğru
nedensellik ilişkisinin olmadığı şeklinde ifade edilebilen sıfır hipotezi reddedilememektedir.
5. Sonuç ve Değerlendirme
Kurumsal kalitenin iyileştirilmesi belirsizliği ve işlem maliyetleriniazaltmak ve turizm firmalarının
marka değerlerini artırmak üzerindenturizm gelirlerinietkileyebilir. Diğer yandan turizm akımları da
ülkede kurumsal kalitenin iyileştirilmesi için daha güçlü bir motivasyon sağlayabilir. Bu çalışmada
kurumsal kaliteye ilişkin oldukça kapsayıcı göstergeler dikkate alınarak kurumsal kalite ve turizm
gelirleri arasındaki ilişki Fransa, İtalya, İspanya, Yunanistan ve Türkiye örneğinde panel veri
yöntemleri aracılığıyla nedensellik yaklaşımı çerçevesinde incelenmiştir. Çalışmada kullanılan
kurumsal kaliteye ilişkin göstergeler Dünya Ekonomik Formu tarafından yayınlanmakta olup ülkelerin
kurumsal gelişmişlik düzeyini mülkiyet haklarının korunması, yargı bağımsızlığı, yolsuzlukların
yaygınlığı, kamu kaynaklarının etkin kullanımı, uyuşmazlıkların etkin şekilde çözümü başta olmak
üzere çok sayıda farklı yönleriyle ele alan endekslerin ortalaması şeklinde hesaplanmaktadır.
Çalışmada genel kurumsal göstergenin yanı sıra kamusal ve özel sektör olmak üzere iki kurumsal
kalite endeksi de kullanılmıştır.
Nedensellik analizine geçmeden önce uygulanan Breusch ve Pagan (1980) LM ve Pesaran (2004)
CD testlerine ait bulgular kurumsal kalite ve turizm gelirleri değişkenleri için panel birimleri yani ele
alınan ülkeler arasında yatay kesit bağımlılığı olduğunu göstermiştir. Bu sonuç araştırma
kapsamındaki ülkelerde hem kurumsal kalite düzeyinin hem de turizm gelirlerinin birbirinden veya
ortak başka faktörlerden etkilendiğini göstermektedir. Yatay kesit bağımlılığına ilişkin elde edilen
bulgular doğrultusunda çalışmada değişkenlerin durağanlık özellikleri ikinci kuşak panel birim kök
testleri aracılığı ile incelenmiştir. Panel birim kök testlerine ait sonuçlar değişkenlerin seviye
değerlerinde durağan olduğunu desteklemiştir. Bu nedenle nedensellik analizi değişkenlerin sevi
değerleri kullanılarak yapılmıştır. Nedensellik analizi için oluşturulan modellere ait parametrelerin
heterojen olduğuna ilişkin Swamy (1970) S testi sonuçları dikkate alınarak çalışmada Dumitrescu ve
Hurlin (2012) testi kullanılmıştır. Dumitrescu ve Hurlin (2012) testi panelin geneli için kurumsal kalite
değişkenlerinden hem turizm gelirleri değişkeni hem de turist başına düşen turizm gelirleri
değişkenine doğru tek yönlü nedensellik ilişkisi olduğunu göstermiştir. PVAR modellerinde ülkelere
ait bireysel etkilerin farklılaştığı görülmekle birlikte özellikle genel kurumsal ve kamu ile ilgili
kurumsal göstergelerin turist başına düşen turizm gelirlerini pozitif yönde etkilediği görülmüştür.
Günümüzde turizm sektörünü geliştirmeyi ve turizm gelirlerini artırmayı amaçlayan ülkelerin ağırlıklı
olarak turizme dair arz faktörlerine ve talep faktörlerine yoğunlaştıkları görülmektedir. Çalışma
bulguları belirtilen amacın gerçekleştirilmesi için ülkelerin aynı zamanda kurumsal kalitelerini de
iyileştirmeleri gerektiğini göstermektedir.
Kaynaklar
Ağazade, S. (2016). Doğu Avrupa geçiş ekonomilerinde rekabet ve gelir düzeyi ilişkisi, Rekabet
Dergisi 66: 120-146.
Breusch, T. S. & Pagan, A. (1980).The Lagrange multiplier test and its applications to model
specification in econometrics.Review of Economic Studies 47(1): 239-253.
Dickey, D. A. & Fuller, W. A. (1981). Likelihood ratio statistics for autoregressive time series with
aunit root. Econometrica 49(4): 1057-1072.
Dumitrecu, E-I.& Hurlin, C. (2012). Testing for Granger non-causality in heterogeneous panels.
Economic Modelling 29(4): 1450–1460.
Granger, C. W. J. (1969). Investigating causal relations by econometric modelsand cross spectral
method. Econometrica 37: 424–438.
Kurumsal Kalite ve Uluslararası Turizm Gelirleri İlişkisi...
283
Johansen, S. (1988). Statistical analysis of cointegration vectors. Journal of Economic Dynamics and
Control12(213): 231-254.
Kim, Y. R., Saha, S.,Vertinsky, I. &Park, C. (2018) The Impact of national institutional quality on
international tourism inflows: a cross-country evidence. Tourism Analysis 23: 533-551.
Levin, A., Lin, C. F. & Chu, C. S. J. (2002). Unit root tests in panel data: asymptotic and finite-sample
properties. Journal of Econometrics 108(1): 1-24.
Im, K. S., Pesaran, M. H. & Shin, Y. (2003). Testing for unit roots in heterogeneous panels. Journal Of
Econometrics 115(1): 53-74.
North, D. C. (2010). Kurumlar, Kurumsal Değişim ve Ekonomik Performans, Sabancı Üniversitesi
Yayınları, İkinci Basım, İstanbul.
Pesaran, M. H. (2004).General diagnostic tests for cross section dependence in panels. University of
Cambridge Faculty of Economics, Cambridge WP 0435 in Economics.
Pesaran, M. H. (2007). A sample panel unit root test in the presence of cross section dependence.
Journal of Applied Econometrics 22(2): 265-312.
Swamy, P. (1970). Efficient inference in a random coefficient regression model. Econometrica 38(2):
311-323.
Tatoğlu, F. Y. (2017). Panel Zaman Serileri Analizi Stata Uygulamalı. Beta Yayıncılık, İstanbul.
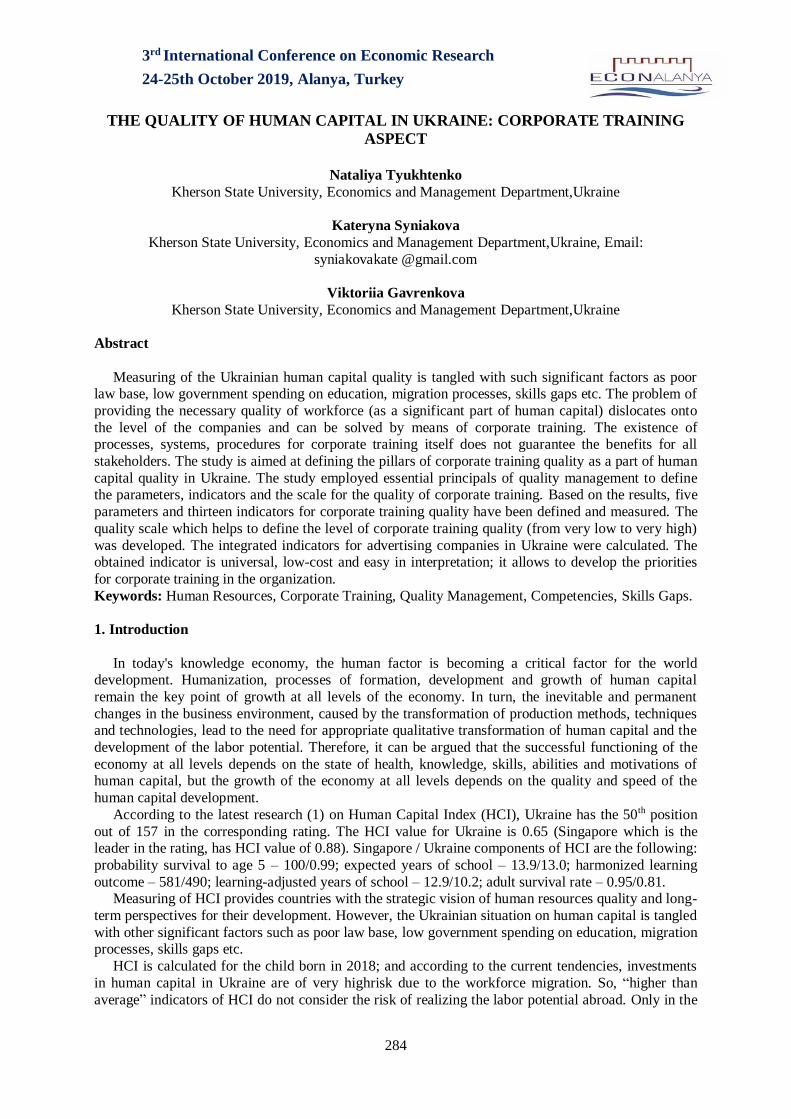
3rd International Conference on Economic Research
24-25th October 2019, Alanya, Turkey
284
THE QUALITY OF HUMAN CAPITAL IN UKRAINE: CORPORATE TRAINING
ASPECT
Nataliya Tyukhtenko
Kherson State University, Economics and Management Department,Ukraine
Kateryna Syniakova
Kherson State University, Economics and Management Department,Ukraine, Email:
Viktoriia Gavrenkova
Kherson State University, Economics and Management Department,Ukraine
Abstract
Measuring of the Ukrainian human capital quality is tangled with such significant factors as poor law base, low government spending on education, migration processes, skills gaps etc. The problem of
providing the necessary quality of workforce (as a significant part of human capital) dislocates onto
the level of the companies and can be solved by means of corporate training. The existence of processes, systems, procedures for corporate training itself does not guarantee the benefits for all
stakeholders. The study is aimed at defining the pillars of corporate training quality as a part of human
capital quality in Ukraine. The study employed essential principals of quality management to define the parameters, indicators and the scale for the quality of corporate training. Based on the results, five
parameters and thirteen indicators for corporate training quality have been defined and measured. The
quality scale which helps to define the level of corporate training quality (from very low to very high)
was developed. The integrated indicators for advertising companies in Ukraine were calculated. The obtained indicator is universal, low-cost and easy in interpretation; it allows to develop the priorities
for corporate training in the organization.
Keywords: Human Resources, Corporate Training, Quality Management, Competencies, Skills Gaps.
1. Introduction
In today's knowledge economy, the human factor is becoming a critical factor for the world development. Humanization, processes of formation, development and growth of human capital
remain the key point of growth at all levels of the economy. In turn, the inevitable and permanent
changes in the business environment, caused by the transformation of production methods, techniques and technologies, lead to the need for appropriate qualitative transformation of human capital and the
development of the labor potential. Therefore, it can be argued that the successful functioning of the
economy at all levels depends on the state of health, knowledge, skills, abilities and motivations of human capital, but the growth of the economy at all levels depends on the quality and speed of the
human capital development.
According to the latest research (1) on Human Capital Index (HCI), Ukraine has the 50th position
out of 157 in the corresponding rating. The HCI value for Ukraine is 0.65 (Singapore which is the leader in the rating, has HCI value of 0.88). Singapore / Ukraine components of HCI are the following:
probability survival to age 5 – 100/0.99; expected years of school – 13.9/13.0; harmonized learning
outcome – 581/490; learning-adjusted years of school – 12.9/10.2; adult survival rate – 0.95/0.81. Measuring of HCI provides countries with the strategic vision of human resources quality and long-
term perspectives for their development. However, the Ukrainian situation on human capital is tangled
with other significant factors such as poor law base, low government spending on education, migration processes, skills gaps etc.
HCI is calculated for the child born in 2018; and according to the current tendencies, investments
in human capital in Ukraine are of very highrisk due to the workforce migration. So, “higher than
average” indicators of HCI do not consider the risk of realizing the labor potential abroad. Only in the
The Quality of Human Capital…
285
year 2016 significant number of Ukrainians got the permission for living abroad (2): in Poland
(512,552 people), Czech Republic (24,223 people), Slovakia (3,016 people), Denmark (2,727 people),
Hungary (2,375 people) and many other countries. According to the recent survey (3), only 28.6% of Ukrainians have jobs that correspond to their
educational specialization. That indicates the deep skills gaps: the educational system in Ukraine is not
flexible enough to react on accelerated changes in business environment and in the society at a whole. Thus, the problem of providing the necessary quality of workforce (as a significant part of human
capital) dislocates onto the level of the companies and can be solved by means of corporate training.
2. Background and Purpose of the Research
On the international level, aspects of corporate training are actualized within the concept of
humanization throughout the human life; its importance is stated in the number of documents of global and regional importance: the ILO Decent Work Concept, the Millennium Development Goals, the
Europe 2020 Strategy, the Lifelong Learning Concept, the Sustainable Development Goals and others.
M. Magura(2002) explores the basic prerequisites for increasing the role of corporate training for enhancing the competitiveness and organizational development. These prerequisites include the
achievement of strategic goals of the enterprise, increasing the value of human resources, conducting
constant organizational changes in response to changes in the business environment. Complementing the research of Magura, it is important to note that all parties of labor relationship gain from corporate
training. Thus, the extension of human capital and releasing of human potential are providing.
In particular, the extension of individual human capital by means of corporate training can be
achieved through increasing of professional and competence levels, expanding career prospects (both internally and externally), potential increase in remuneration, higher job satisfaction, growth self-
estimation.The development of human capital at the microeconomic level is in line with the benefits
that an enterprise receives from implementing corporate training procedures; they are: increase in profitability, rapid adaptation changes and quick implementation of new directions of business
activity, maintaining and increasing competitiveness by improving labor productivity, reducing
injuries and other similar indicators, increasing the loyalty of human resources etc. Human capital
extension at higher economic levels (macro- and megaeconomic) also occurs through corporate training activities. They are reflected in the increasing of the employment rate, national income, GDP
and the human development index, improving of the living standards, weakening of social tensions in
society etc. Modern socio-economic realities are the result of objectively existing circumstances
whichconstrain the evolution of the corporate training on Ukrainian enterprises. These circumstances
include the following: 1) lack of understanding of the importance of corporate training among top-managers;
2) unwillingness to make long-term investments;
3) low quality level of the supply of educational services for staff;
4) lack of standards in the field of corporate training; 5) unsystematic character of corporate training, etc.
Over the last 6 years theNational gathereddata onthe forms and methods of corporate training are
absent. However there are solid observations, reports and researches have been conducting by international organizations. For example, the noteworthy World Bank's research “The Skills for a
Modern Ukraine” (2017) outlines the five key messages:
1. Workers need a mix of skills: they include competencies, attitudes, beliefs, and behaviors that are modifiable across the life cycle and can be learned and improved through specific programs and
policies.
2. Postsecondary education and training lack relevance for today’s labor market: Ukrainians have
high levels of basic cognitive skills, but the higher education and training system does not produce enough skills relevant for today’s labor market. Ukrainian firms in key sectors report that the lack of
adequate skills is one of themost important constraints to hiring.
3. Institutional factors are hindering the efficient allocation of labor and skills development: the formal education and training system is not providing students with the skills employers need, skills
training outside the formal education system has very low take-up rates, employers see payroll taxes
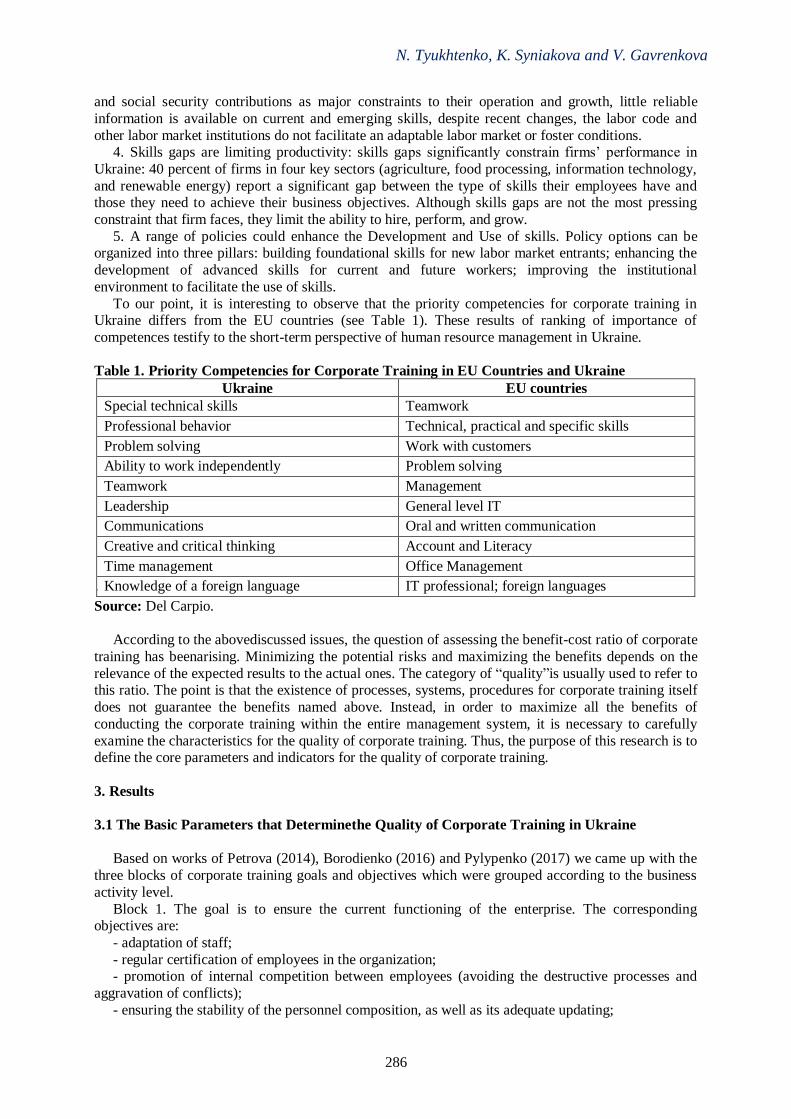
N. Tyukhtenko, K. Syniakova and V. Gavrenkova
286
and social security contributions as major constraints to their operation and growth, little reliable
information is available on current and emerging skills, despite recent changes, the labor code and
other labor market institutions do not facilitate an adaptable labor market or foster conditions. 4. Skills gaps are limiting productivity: skills gaps significantly constrain firms’ performance in
Ukraine: 40 percent of firms in four key sectors (agriculture, food processing, information technology,
and renewable energy) report a significant gap between the type of skills their employees have and those they need to achieve their business objectives. Although skills gaps are not the most pressing
constraint that firm faces, they limit the ability to hire, perform, and grow.
5. A range of policies could enhance the Development and Use of skills. Policy options can be organized into three pillars: building foundational skills for new labor market entrants; enhancing the
development of advanced skills for current and future workers; improving the institutional
environment to facilitate the use of skills.
To our point, it is interesting to observe that the priority competencies for corporate training in Ukraine differs from the EU countries (see Table 1). These results of ranking of importance of
competences testify to the short-term perspective of human resource management in Ukraine.
Table 1. Priority Competencies for Corporate Training in EU Countries and Ukraine
Ukraine EU countries
1. Special technical skills 1. Teamwork
2. Professional behavior 2. Technical, practical and specific skills
3. Problem solving 3. Work with customers
4. Ability to work independently 4. Problem solving
5. Teamwork 5. Management
6. Leadership 6. General level IT
7. Communications 7. Oral and written communication
8. Creative and critical thinking 8. Account and Literacy
9. Time management 9. Office Management
10. Knowledge of a foreign language 10. IT professional; foreign languages
Source: Del Carpio.
According to the abovediscussed issues, the question of assessing the benefit-cost ratio of corporate
training has beenarising. Minimizing the potential risks and maximizing the benefits depends on the
relevance of the expected results to the actual ones. The category of “quality”is usually used to refer to this ratio. The point is that the existence of processes, systems, procedures for corporate training itself
does not guarantee the benefits named above. Instead, in order to maximize all the benefits of
conducting the corporate training within the entire management system, it is necessary to carefully
examine the characteristics for the quality of corporate training. Thus, the purpose of this research is to define the core parameters and indicators for the quality of corporate training.
3. Results
3.1 The Basic Parameters that Determinethe Quality of Corporate Training in Ukraine
Based on works of Petrova (2014), Borodienko (2016) and Pylypenko (2017) we came up with the
three blocks of corporate training goals and objectives which were grouped according to the business
activity level.
Block 1. The goal is to ensure the current functioning of the enterprise. The corresponding objectives are:
- adaptation of staff;
- regular certification of employees in the organization; - promotion of internal competition between employees (avoiding the destructive processes and
aggravation of conflicts);
- ensuring the stability of the personnel composition, as well as its adequate updating;
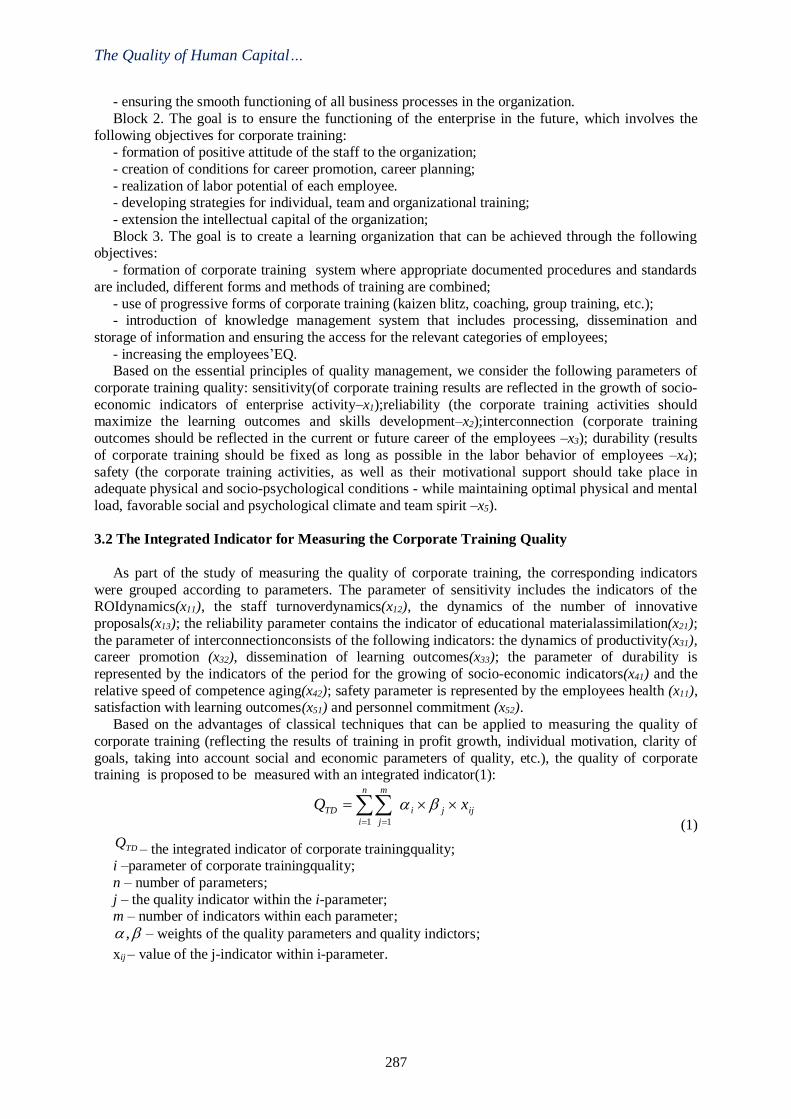
The Quality of Human Capital…
287
- ensuring the smooth functioning of all business processes in the organization.
Block 2. The goal is to ensure the functioning of the enterprise in the future, which involves the
following objectives for corporate training: - formation of positive attitude of the staff to the organization;
- creation of conditions for career promotion, career planning;
- realization of labor potential of each employee. - developing strategies for individual, team and organizational training;
- extension the intellectual capital of the organization;
Block 3. The goal is to create a learning organization that can be achieved through the following objectives:
- formation of corporate training system where appropriate documented procedures and standards
are included, different forms and methods of training are combined;
- use of progressive forms of corporate training (kaizen blitz, coaching, group training, etc.); - introduction of knowledge management system that includes processing, dissemination and
storage of information and ensuring the access for the relevant categories of employees;
- increasing the employees’EQ. Based on the essential principles of quality management, we consider the following parameters of
corporate training quality: sensitivity(of corporate training results are reflected in the growth of socio-
economic indicators of enterprise activity–x1);reliability (the corporate training activities should maximize the learning outcomes and skills development–x2);interconnection (corporate training
outcomes should be reflected in the current or future career of the employees –x3); durability (results
of corporate training should be fixed as long as possible in the labor behavior of employees –x4);
safety (the corporate training activities, as well as their motivational support should take place in adequate physical and socio-psychological conditions - while maintaining optimal physical and mental
load, favorable social and psychological climate and team spirit –x5).
3.2 The Integrated Indicator for Measuring the Corporate Training Quality
As part of the study of measuring the quality of corporate training, the corresponding indicators
were grouped according to parameters. The parameter of sensitivity includes the indicators of the ROIdynamics(x11), the staff turnoverdynamics(x12), the dynamics of the number of innovative
proposals(x13); the reliability parameter contains the indicator of educational materialassimilation(x21);
the parameter of interconnectionconsists of the following indicators: the dynamics of productivity(x31), career promotion (x32), dissemination of learning outcomes(x33); the parameter of durability is
represented by the indicators of the period for the growing of socio-economic indicators(x41) and the
relative speed of competence aging(x42); safety parameter is represented by the employees health (x11), satisfaction with learning outcomes(x51) and personnel commitment (x52).
Based on the advantages of classical techniques that can be applied to measuring the quality of
corporate training (reflecting the results of training in profit growth, individual motivation, clarity of
goals, taking into account social and economic parameters of quality, etc.), the quality of corporate training is proposed to be measured with an integrated indicator(1):
= =
=n
i
ijji
m
j
TD xQ1 1
(1)
TDQ – the integrated indicator of corporate trainingquality; i –parameter of corporate trainingquality;
n – number of parameters;
j – the quality indicator within the i-parameter; m – number of indicators within each parameter;
, – weights of the quality parameters and quality indictors;
xij – value of the j-indicator within i-parameter.
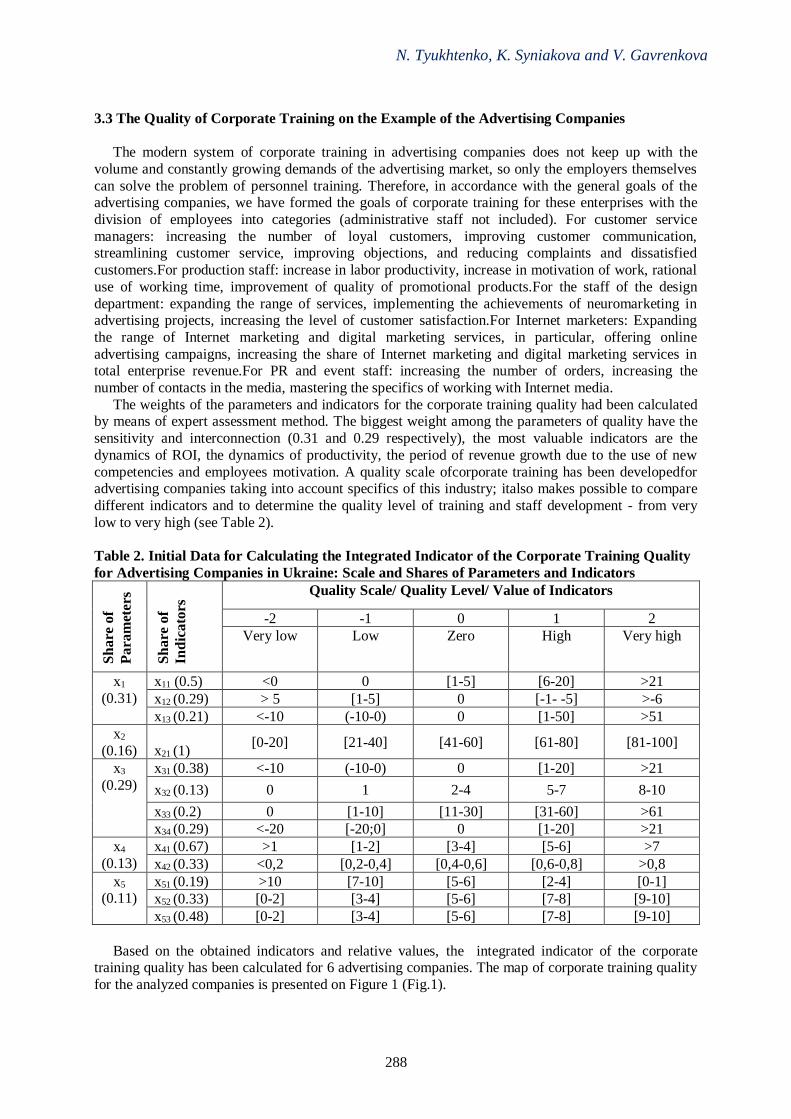
N. Tyukhtenko, K. Syniakova and V. Gavrenkova
288
3.3 The Quality of Corporate Training on the Example of the Advertising Companies
The modern system of corporate training in advertising companies does not keep up with the
volume and constantly growing demands of the advertising market, so only the employers themselves
can solve the problem of personnel training. Therefore, in accordance with the general goals of the advertising companies, we have formed the goals of corporate training for these enterprises with the
division of employees into categories (administrative staff not included). For customer service
managers: increasing the number of loyal customers, improving customer communication, streamlining customer service, improving objections, and reducing complaints and dissatisfied
customers.For production staff: increase in labor productivity, increase in motivation of work, rational
use of working time, improvement of quality of promotional products.For the staff of the design
department: expanding the range of services, implementing the achievements of neuromarketing in advertising projects, increasing the level of customer satisfaction.For Internet marketers: Expanding
the range of Internet marketing and digital marketing services, in particular, offering online
advertising campaigns, increasing the share of Internet marketing and digital marketing services in total enterprise revenue.For PR and event staff: increasing the number of orders, increasing the
number of contacts in the media, mastering the specifics of working with Internet media.
The weights of the parameters and indicators for the corporate training quality had been calculated by means of expert assessment method. The biggest weight among the parameters of quality have the
sensitivity and interconnection (0.31 and 0.29 respectively), the most valuable indicators are the
dynamics of ROI, the dynamics of productivity, the period of revenue growth due to the use of new
competencies and employees motivation. A quality scale ofcorporate training has been developedfor advertising companies taking into account specifics of this industry; italso makes possible to compare
different indicators and to determine the quality level of training and staff development - from very
low to very high (see Table 2).
Table 2. Initial Data for Calculating the Integrated Indicator of the Corporate Training Quality
for Advertising Companies in Ukraine: Scale and Shares of Parameters and Indicators
Sh
are
of
Para
met
ers
Sh
are
of
Ind
icato
rs Quality Scale/ Quality Level/ Value of Indicators
-2 -1 0 1 2
Very low Low Zero High Very high
x1
(0.31)
x11 (0.5) <0 0 [1-5] [6-20] >21
x12 (0.29) > 5 [1-5] 0 [-1- -5] >-6
x13 (0.21) <-10 (-10-0) 0 [1-50] >51
x2
(0.16) x21 (1) [0-20] [21-40] [41-60] [61-80] [81-100]
x3
(0.29)
x31 (0.38) <-10 (-10-0) 0 [1-20] >21
x32 (0.13) 0 1 2-4 5-7 8-10
x33 (0.2) 0 [1-10] [11-30] [31-60] >61
x34 (0.29) <-20 [-20;0] 0 [1-20] >21
x4
(0.13)
x41 (0.67) >1 [1-2] [3-4] [5-6] >7
x42 (0.33) <0,2 [0,2-0,4] [0,4-0,6] [0,6-0,8] >0,8
x5
(0.11) x51 (0.19) >10 [7-10] [5-6] [2-4] [0-1]
x52 (0.33) [0-2] [3-4] [5-6] [7-8] [9-10]
x53 (0.48) [0-2] [3-4] [5-6] [7-8] [9-10]
Based on the obtained indicators and relative values, the integrated indicator of the corporate training quality has been calculated for 6 advertising companies. The map of corporate training quality
for the analyzed companies is presented on Figure 1 (Fig.1).
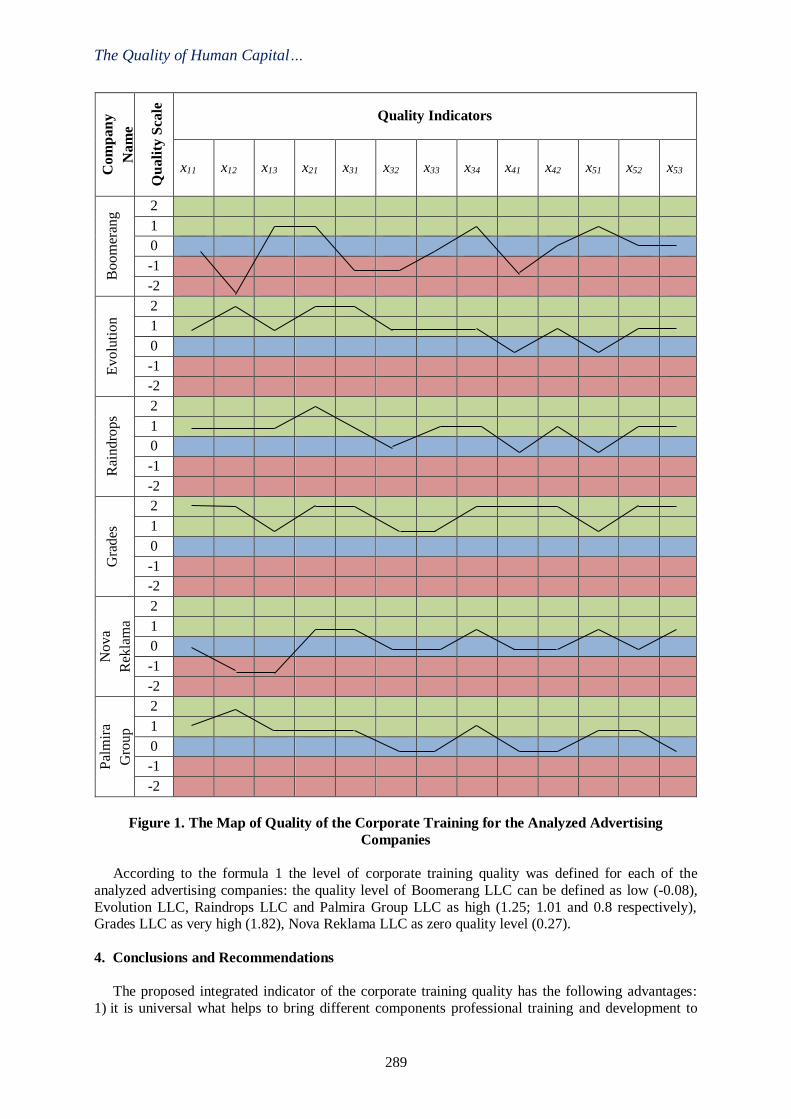
The Quality of Human Capital…
289
Co
mp
an
y
Na
me
Qu
ali
ty S
cale
Quality Indicators
x11 x12 x13 x21 x31 x32 x33 x34 x41 x42 x51 x52 x53
Bo
om
eran
g 2
1
0
-1
-2
Ev
olu
tio
n
2
1
0
-1
-2
Rai
ndro
ps
2
1
0
-1
-2
Gra
des
2
1
0
-1
-2
Nova
Rek
lam
a
2
1
0
-1
-2
Pal
mir
a
Gro
up
2
1
0
-1
-2
Figure 1. The Map of Quality of the Corporate Training for the Analyzed Advertising
Companies
According to the formula 1 the level of corporate training quality was defined for each of the
analyzed advertising companies: the quality level of Boomerang LLC can be defined as low (-0.08),
Evolution LLC, Raindrops LLC and Palmira Group LLC as high (1.25; 1.01 and 0.8 respectively), Grades LLC as very high (1.82), Nova Reklama LLC as zero quality level (0.27).
4. Conclusions and Recommendations
The proposed integrated indicator of the corporate training quality has the following advantages:
1) it is universal what helps to bring different components professional training and development to
N. Tyukhtenko, K. Syniakova and V. Gavrenkova
290
the quality assessment; 2) is low-cost both in terms of the need to raise funds and in terms of the use of
time and human resources required to spend it; 3) it provides ease and unambiguous interpretation for
the findings of the evaluation; 4) it provides an opportunity to carry out quality assessment at the level of a separate training and development program, as well as a general quality assessment of the whole
system of corporate training; 5) it is easy to interpret, it is visible and understandable.Thus, measuring
the quality of corporate training complements the assessment on human capital quality and appears to be the useful tool for providing the effective lifelong learning at different economic levels.
References
World Development Report 2019: The Changing Nature of Work (2019). doi: 10.1596/978-1-4648-
1328-3.
Residence permits statistics. – Eurostat [online]. — Available at:https://ec.europa.eu/eurostat/statistics-explained/index.php/Residence_permits_statistics.
Pyschulina, O, Yurochko, T., Mischenko, M., Zhalilo, Y. (2018). Human capital development:
Towards quality reforms. Analytical report. Publishing house “Zapovit”. ISBN 978-966-2050-17-2. Europe-2020 Strategy [online]. — Available at: https://ec.europa.eu/info/business-economy-
euro/economic-and-fiscal-policy-coordination/eu-economic-governance-monitoring-prevention-
correction/european-semester/framework/europe-2020-strategy_en European Commission. 2000. Memorandum on lifelong learning. [online]. — Available at:
http://arhiv.acs.si/dokumenti/ Memorandum_on_Lifelong_Learning.pdf
Global Sustainable Development Goals - 2030. [online]. – Available at:
http://www.un.org.ua/images/documents/3615/%D1%86%D1%96%D0%BB%D1%96_web(2).pdf. Magura M. I., Kurbatova M. B. (2002). Organization of personnel training of the company. M.: ZAO
Biznes-shkola ”Intel-sintez”.
Del Carpio, Ximena, Olga Kupets, Noël Muller, and Anna Olefir (2017). Skills for a Modern Ukraine. Directions in Development. Washington, DC: World Bank. doi:10.1596/978-1-4648-0890-6.
License: Creative Commons Attribution CC BY 3.0 IGO
Petrova, I. L (2014). Strategic Management of Personnel Development. Naukovyy visnyk PUET:
Economic Sciences, 1(5 (50)). Borodienko, О. V. (2016). Quality assurance system for professional training of company personnel:
foreign experience. Vocational education: problems and perspectives,11. p. 120-125.
Pylypenko, О. V., &Shats’ka, Z. Ya. (2017). Improvement of the Personnel Management System of the Enterprise on the Basis of Advanced Training Programs. Electronic scientific journal, 207.
Tyukhtenko, N., Syniakova, K. Havrenkova, V. (2018). The quality of training and development of
enterprise personnel as the attribute of effective human resource management. Modern Science Modernívěda. Praha. Českárepublika, Nemoros. № 6. Р. 55-62.
3rdInternational Conference on Economic Research
24-25th October 2019, Alanya, Turkey
291
THE IMPACT OF FISCAL DECENTRALIZATION ON ECONOMIC GROWTH IN
THE BALTIC COUNTRIES
Neringa Slavinskaitė
Vilniaus kolegija/University of Applied Sciences, Economics Faculty
Lithuania, Email: [email protected]
Abstract
Fiscal decentralization has always been an interesting topic because researchers about fiscal
decentralization consider not only the economic future, but also other perspectives such as geographic,
politic, and other subjects. In the scientific world, the effect of fiscal decentralization on economic
growth of the country has been analyzed by many scientists. The paper analyses the fiscal
decentralization effects on economic growth in Baltic countries for the period 2007–2017. The Baltic
countries (Estonia, Latvia and Lithuania) are often considered as one region with similar economic
profiles and common political and social values. They are geographically and historically closely
related, particularly during the Soviet era. The empirical analysis was based on the multiple regression
method. The article object is fiscal decentralization effect on economic growth in the Baltic countries.
The aim of this article is to investigate the theoretical aspect of the effect of fiscal decentralization on
economic growth, calculate the index of fiscal decentralization and evaluate the effect of fiscal
decentralization on economic growth in the Baltic countries.
Lithuania has the lowest fiscal decentralization index (0.28) of the Baltic countries. The research has
proved that the effect of fiscal decentralization on economic growth of Baltic countries is statistically
significant and positive.The originality of this article – introduced the theoretical model for estimating
of fiscal decentralization effect on economic growth and evaluated the fiscal decentralization effect on
economic growth in Baltic countries.
Keywords: Effect of the Fiscal Decentralization, Economic Growth, Baltic Countries, Index of Fiscal
Decentralization.
3rdInternational Conference on Economic Research
24-25th October 2019, Alanya, Turkey
292
FINANCIAL DEVELOPMENT, STABILITY AND ITS EFFECT ON ECONOMIC
GROWTH: AN EMPIRICAL ANALYSIS IN THE CONTEXT OF SOUTH ASIA
Souvik Banerjee
Management Development Institute Murshidabad, India, Email: [email protected]
Abstract
Hitherto most of the analysis of the financial crisis of 2008 are done with respect to the developed
countries (like Organization of Economic Development (OECD) countries).
In 2007, the financial crisis had first hit the United States. Subsequently this crisis subsequently
engulfed financial institutions predominantly in the developed OECD countries. Gradually the crisis
turned into a global economic recession when it affected even emerging market economies,
predominantly through the trade channel, and in some cases through falling inward remittances. In
many emerging market economies, the economic consequences of this event were quite severe, and
the scale of impact is comparable to the effects felt by developed countries. In the aftermath of the
2008 global financial crisis, the implications of financial liberalisation for stability and economic
growth have come under increased scrutiny. One school of economic thought posits a positive
relationship between financial liberalisation and economic growth and development. However, there is
a view that financial liberalisation is intrinsically associated with financial instability which may be
harmful to economic growth and development. This study assesses linkages between financial
instability, financial liberalisation, financial development and economic growth in 7 South Asian
countries for the period 2000–2016. The empirical results suggest that financial development and
financial liberalisation have positive effects on financial instability. The findings also reveal that
economic growth reduces financial instability and the magnitude of reduction is higher in the pre-
liberalisation period compared to post-liberalisation period.
Keywords: Financial Development, Economic Growth, Financial Liberalisation, Stability.
3rdInternational Conference on Economic Research
24-25th October 2019, Alanya, Turkey
293
DEMOGRAPHIC CHALLENGES TO NATIONAL PENSION SYSTEMS OF
UKRAINE AND POLAND
Agnieszka Parlińska
Warsaw University of Life Science, Department of Finance, Poland Email: [email protected]
Volodymyr Rudyk
Podilsky State Agrarian Technical University, Department of Finance, Banking and Insurance,
Ukraine
Abstract
Demographic processes in Europe in the second half of the 20th century and the beginning of the
21st century are characterized by significant changes in the ratio between age groups of the population. There is an increase in the proportion of older people and the change in the ratio between
generations. The above problems are also faced in Poland and Ukraine and their lead to necessary the
reforms of the national pension systems. The aim of paper was to estimate the demographic processes in Ukraine and Poland and influence
the functioning of national pension systems. Also the level of salaries and pensions as well as selected
indicators of Poland and Ukraine were compared with data for Germany.The applicable literatures,
legal acts, the Pension Funds, Central Statistical Offices, World Bank and Eurostat were the sources of used data and information. The descriptive and comparative statistical methods were used to analyse
the analysis of the demographic aging process involves analysis of main demographic indicators
within 2005-2017. The demographic load factor (for Ukraine is 41.2% and for Poland is 39.6%) for both countries
shows that the number of able-bodied population is more than twice the size of the population of the
working age. In the same time the potential replacement rate in Poland is 0.8 points higher than in Ukraine and in 2017 it is 20.6%. While the ratio of the retirement burden, in Ukraine exceeds by 2.7
points the same indicator in Poland and equates to 21.8% respectively.The response of society to the
rapid increase in the number of retirement age people has been accelerated development and further
transformation of pension systems. The national pension systems of Poland and Ukraine in recent years and still have also undergone significant changes.
Keywords:National Pension System, Pension Reform, Demographic Sphere, Population Aging,
Retirement Age, Pension.
1. Introduction
The demographic situation in most European countries for a long period has a tendency to increase the number of older people and reduce fertility. There are processes associated with changes in the
ratio between age groups in the direction of increasing the proportion of elder people. Similar
processes in the demographic sphere are also taking place in Poland and Ukraine. The main feature of the current demographic situation is the aging of the population, which is
considered to be the result of a decrease in childbearing activity of the population and the achievement
of humanity in the success of life expectancy. It is a logical and irreversible process and a consequence of civilizational progress. It is aging of the population and its consequences to a large extent determine
the socio-demographic portrait of contemporary and future society. According to experts in the field of
demography, if the twentieth century can be called "century of growth", then the twenty first can be
characterized as "century aging" (World Population Prospects, 2009; World Population to 2300, 2004; Lutz. W.; Sanderson. W.; Scherbov. S.,2008)Demographic processes, together with economic, socio-
economic, require constant reform and improvement of the national pension systems of Poland and
Ukraine in order to address the issue of decent living for people of retirement age. Taking into account today's realities in the demographic sphere, it can be noted that the formation of optimal pension
models is a rather difficult task and requires a long and hard work from the side of society as a whole.
Demographic Challenges to National Pension...
294
The aim of research was to estimate the demographic processes in Ukraine and Poland, analyse
their features, and influence the functioning of national pension systems, as well as identify the
priorities at the present stage of their reform.At the same time, to highlight the problems of the pension systems of the analysed countries the level of salaries and pensions as well as selected indicators of
Poland and Ukraine were compared with data for Germany.
The data and information were taken from the official sources: the applicable literatures, legal acts, the Pension Funds, Central Statistical Offices, World Bank and Eurostat. The descriptive and
comparative statisticalmethods were used in the research paper in order to analyse the problem from
the economic point of view. Analysis of the demographic aging process involves analysis of basic demographic indicators as: the demographic load factor, the potential replacement rateand the
retirement load factor within 2005-2017.
2. Literature Review
The demographic processes that have taken place in recent decades have aroused interest in the
research of many scientists as well as international financial institutions and institutions. Particularly important is to clarify the issue of the impact of demographic factors on changes in the financing of
national pension systems in European countries, including Poland and Ukraine. The issue of
population aging has been raised during many international forums that have adopted action plans on demographic issues.(Madrid International Plan of Action on the Challenges of Aging 2002)
Consideration and resolution of the problems of demography in modern conditions have always been
and are among the priorities for the International Labour Organization, as well as for the specialized
financial institutions of the European Union (Social Security Programs Through the World;EU's Mutual Information System for Social Protection).
The demographic situation in Poland and in Ukraine, as well as in other Eastern European
countries, has also been analysed and taken into account in the development of general measures to address these problems.In addition, the World Bank conducted significant work on analyzing
demographic processes in those countries that focused on the impact of demographic factors on the
state of national pension systems and the need for their reform.(World Bank Office in Ukraine)The
research institutes of both countries have devoted many scientific works to the analyses of demographic processes in them and their influence on the development of national pension systems.
According to the results of their research, a particular issue that needs to be addressed in connection
with the escalation of aging processes and its consequences for the financial stability of the state is the reform of national pension systems. (LibanovaE. M. 2010). During the last two decades in Ukraine
and Poland pension system reforms aimed at improving their parameters in order to increase the
effectiveness of the social and economic tasks of the development of both countries are being implemented. However, demographic trends require further reform of the pension sector, as the
financial support of retirement age citizens remains insufficient. As scientists today point out, the
world (and not only Ukraine and Poland) faces the need for a comprehensive reform of the pension
system, which will involve the creation of new schemes, on the one hand, and on the other adaptation to the new demographic conditions of traditional schemes.
3. Main Research Results
The aging of the population is considered to be the main characteristic feature of the demographic
sphere of modern European society, including Ukraine and Poland. According to most experts, the process of aging of the population in its essence is positive, which indicates a rather high level of
social development and should be perceived as an accomplishment, and the skills, experience and
resources of older age groups - as a growth factor. The World Assembly's Second World Assembly on
Aging Report states that "in today's world, unprecedented wealth and technological potential have been accumulated, and that there are extremely favourable conditions for men and women to be able
to live up to the elderly by being healthier and more secure; to achieve a more complete integration of
the full participation in society; give them an opportunity to make a more meaningful contribution to the lives of their communities and the development of society; and to steadily increase the quality of
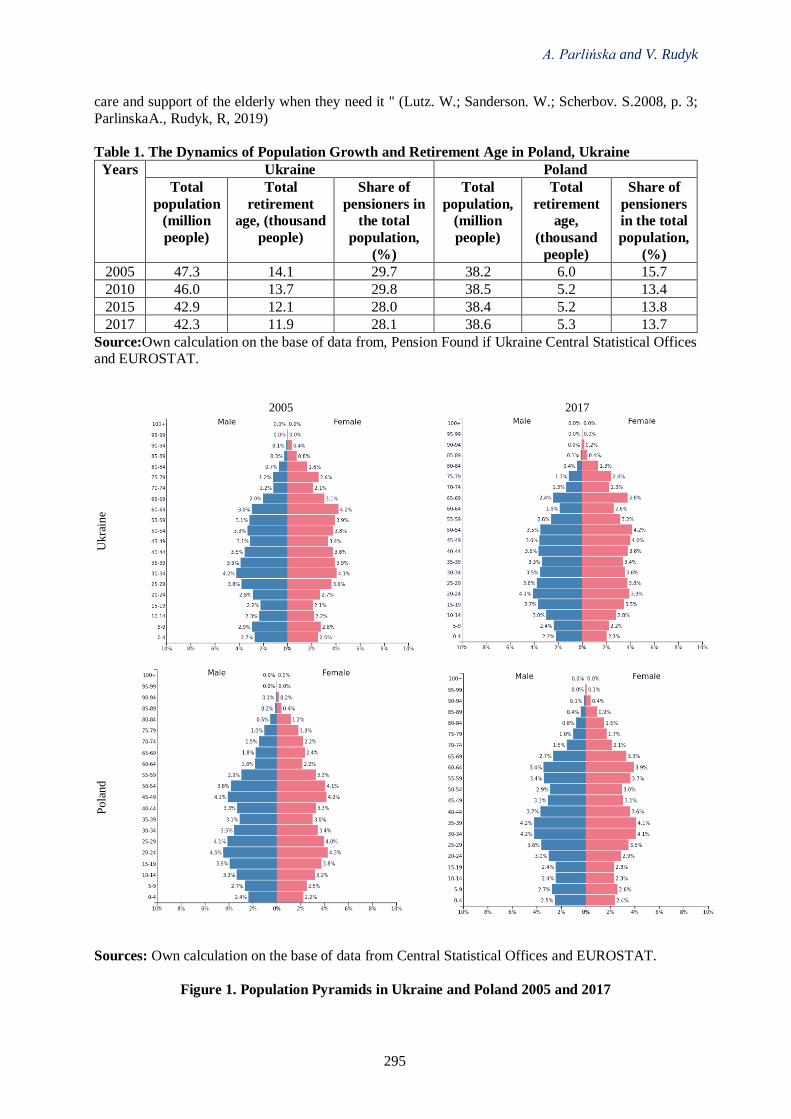
A. Parlińska and V. Rudyk
295
care and support of the elderly when they need it " (Lutz. W.; Sanderson. W.; Scherbov. S.2008, p. 3;
ParlinskaA., Rudyk, R, 2019)
Table 1. The Dynamics of Population Growth and Retirement Age in Poland, Ukraine
Years Ukraine Poland
Total
population
(million
people)
Total
retirement
age, (thousand
people)
Share of
pensioners in
the total
population,
(%)
Total
population,
(million
people)
Total
retirement
age,
(thousand
people)
Share of
pensioners
in the total
population,
(%)
2005 47.3 14.1 29.7 38.2 6.0 15.7
2010 46.0 13.7 29.8 38.5 5.2 13.4
2015 42.9 12.1 28.0 38.4 5.2 13.8
2017 42.3 11.9 28.1 38.6 5.3 13.7
Source:Own calculation on the base of data from, Pension Found if Ukraine Central Statistical Offices and EUROSTAT.
2005 2017
Ukra
ine
Pola
nd
Sources: Own calculation on the base of data from Central Statistical Offices and EUROSTAT.
Figure 1. Population Pyramids in Ukraine and Poland 2005 and 2017
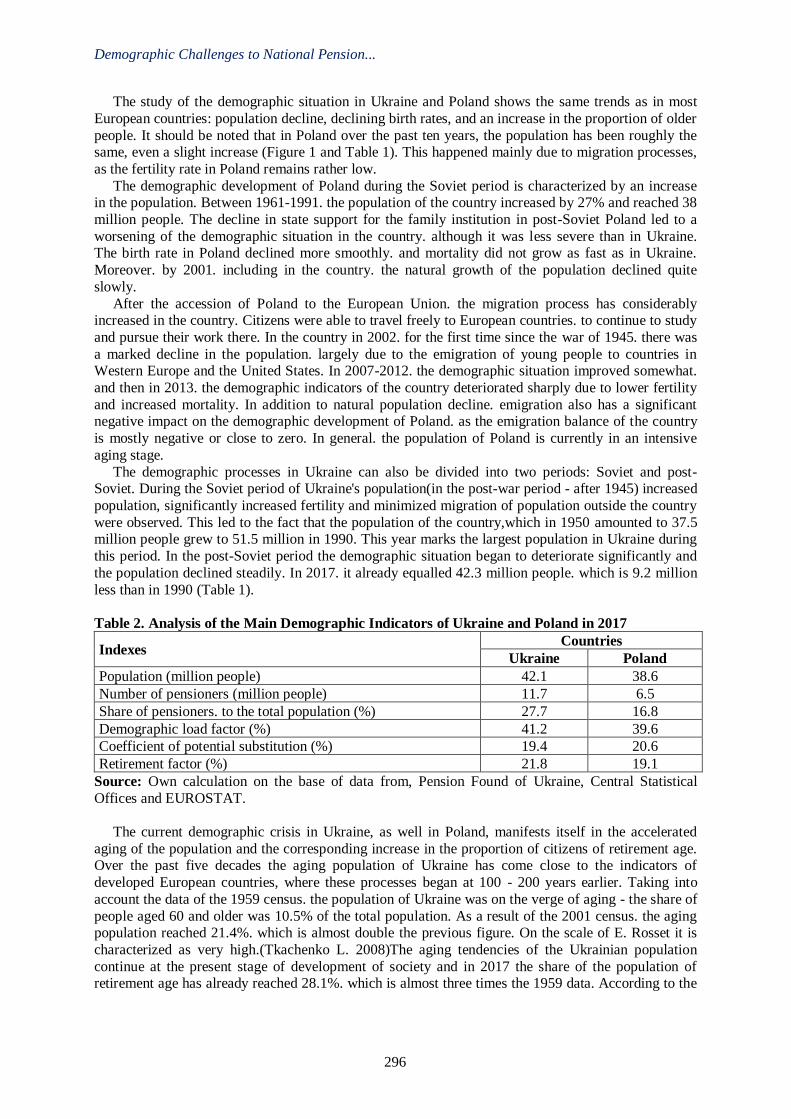
Demographic Challenges to National Pension...
296
The study of the demographic situation in Ukraine and Poland shows the same trends as in most
European countries: population decline, declining birth rates, and an increase in the proportion of older
people. It should be noted that in Poland over the past ten years, the population has been roughly the same, even a slight increase (Figure 1 and Table 1). This happened mainly due to migration processes,
as the fertility rate in Poland remains rather low.
The demographic development of Poland during the Soviet period is characterized by an increase in the population. Between 1961-1991. the population of the country increased by 27% and reached 38
million people. The decline in state support for the family institution in post-Soviet Poland led to a
worsening of the demographic situation in the country. although it was less severe than in Ukraine. The birth rate in Poland declined more smoothly. and mortality did not grow as fast as in Ukraine.
Moreover. by 2001. including in the country. the natural growth of the population declined quite
slowly.
After the accession of Poland to the European Union. the migration process has considerably increased in the country. Citizens were able to travel freely to European countries. to continue to study
and pursue their work there. In the country in 2002. for the first time since the war of 1945. there was
a marked decline in the population. largely due to the emigration of young people to countries in Western Europe and the United States. In 2007-2012. the demographic situation improved somewhat.
and then in 2013. the demographic indicators of the country deteriorated sharply due to lower fertility
and increased mortality. In addition to natural population decline. emigration also has a significant negative impact on the demographic development of Poland. as the emigration balance of the country
is mostly negative or close to zero. In general. the population of Poland is currently in an intensive
aging stage.
The demographic processes in Ukraine can also be divided into two periods: Soviet and post-Soviet. During the Soviet period of Ukraine's population(in the post-war period - after 1945) increased
population, significantly increased fertility and minimized migration of population outside the country
were observed. This led to the fact that the population of the country,which in 1950 amounted to 37.5 million people grew to 51.5 million in 1990. This year marks the largest population in Ukraine during
this period. In the post-Soviet period the demographic situation began to deteriorate significantly and
the population declined steadily. In 2017. it already equalled 42.3 million people. which is 9.2 million
less than in 1990 (Table 1).
Table 2. Analysis of the Main Demographic Indicators of Ukraine and Poland in 2017
Indexes Countries
Ukraine Poland
Population (million people) 42.1 38.6
Number of pensioners (million people) 11.7 6.5
Share of pensioners. to the total population (%) 27.7 16.8
Demographic load factor (%) 41.2 39.6
Coefficient of potential substitution (%) 19.4 20.6
Retirement factor (%) 21.8 19.1
Source: Own calculation on the base of data from, Pension Found of Ukraine, Central Statistical
Offices and EUROSTAT.
The current demographic crisis in Ukraine, as well in Poland, manifests itself in the accelerated
aging of the population and the corresponding increase in the proportion of citizens of retirement age. Over the past five decades the aging population of Ukraine has come close to the indicators of
developed European countries, where these processes began at 100 - 200 years earlier. Taking into
account the data of the 1959 census. the population of Ukraine was on the verge of aging - the share of
people aged 60 and older was 10.5% of the total population. As a result of the 2001 census. the aging population reached 21.4%. which is almost double the previous figure. On the scale of E. Rosset it is
characterized as very high.(Tkachenko L. 2008)The aging tendencies of the Ukrainian population
continue at the present stage of development of society and in 2017 the share of the population of retirement age has already reached 28.1%. which is almost three times the 1959 data. According to the
A. Parlińska and V. Rudyk
297
UN projected calculations on the demographic situation in Ukraine confirm further processes of aging
of the population.
Complex analysis of the demographic aging process involves the study and analysis of such basic demographic indicators as: the demographic load factor, the potential replacement rate and the
retirement load factor. Using data presented in Table 2. let's look at their significance in Ukraine and
Poland. In 2017 the population in Ukraine and Polandrespectively amounted to 42.1 million and 38.6
million people. The share of citizens of retirement age was at the level of 27.7% and 16.8%
respectively. In Ukraine the share of pensioners in the general structure of the population is 10.9% higher than the corresponding figure in Poland. The demographic load factor shows the burden on
society and the economy on the part of the population that does not belong to the able-bodied
population. This category of population includes the population younger than 15 years of age and the
population of retirement age. It is defined as the ratio of a dependent part of the population to an able-bodied or productive part of the population. For Ukraine it equals 41.2% and for Poland 39.6%. This
indicator for both countries shows that the number of able-bodied population is more than twice the
size of the population of the working age. This attitude creates a relatively low social burden for society. However it should be noted that Ukraine has a fairly high share of the "shadow economy" and
not all able-bodied population pays insurance pension contributions to the Pension Fund of Ukraine.
This is a very significant problem for the economy as a whole and especially for the national pension system.
The potential replacement rate, which is calculated as the ratio of the population below the working
age to the number of able-bodied population. In Poland is 0.8 points higher than in Ukraine and in
2017 it is 20.6%. While the ratio of the retirement burden, which is determined by the ratio of the population of retirement age to the number of able-bodied population in Ukraine exceeds by 2.7 points
the same indicator in Poland and equates to 21.8% respectively.
Researches show that the demographic processes of the second half of the 20th and first half of the 21st century primarily resulting from low birth rates and agingcaused a change in the ratio of the
number of retired and working people and thus the rise in the value of the pension system. Given the
rising life expectancy at retirement age, which is characteristic of both women and men in the vast
majority of economically developed European countries, this naturally led to an increase in retirement age. In most European Union countries the retirement age is set at 65 and in advanced Western Europe
it is projected to increase to 67 years. In Poland today the retirement age for men is 65 years and for
women - 60 years. In Ukraine. the retirement age is lower and is 60 years for men and 58.5 years for women.
However increasing the life expectancy at retirement age as well as increasing the number of
people who are already receiving a pension or expecting it in the near future, contribute to an increase in retirement spending. This leads to an increase in the financial burden on national pension systems as
well as on the economy as a whole. The national pension systems of Poland and Ukraine like most
European countries have a tendency to increase costs. Retirement models that were created as quite
effective requiring only the payment of insurance premiums for their funding gradually turned into a significant burden for the economy. Funds from the payment of insurance pension contributions are no
longer sufficient to ensure an acceptable level of pensions therefore, it is necessary to increase the
share of pension expenditures from the State Budget. Most scholars have come to the conclusion that traditional pension schemes that have been successful for decades have been on the verge of a
financial collapse and have global threats to the financial security of public obligations (LibanovaE.
M.2010). The national pension systems of Ukraine and Poland are multilevel. They provide for the use of
redistributive and accumulative pension programs. In the Pension legislation of both countries can be
noted that the formation of the national pension model includes the functioning of the joint pension
system -the mandatory accumulation pension system and voluntary accumulative pension insurance. The all the foreseen levels are in force in Poland for a long period of time but mandatory retirement
insurance in Ukraine has not yet been introduced.
According to experts in the field of pensions, the greatest problems with the social protection of retirement age citizens will arise and will continue to aggravate in those countries where the
population is aging and decreasing (When should the state pension …). In modern conditions aging is
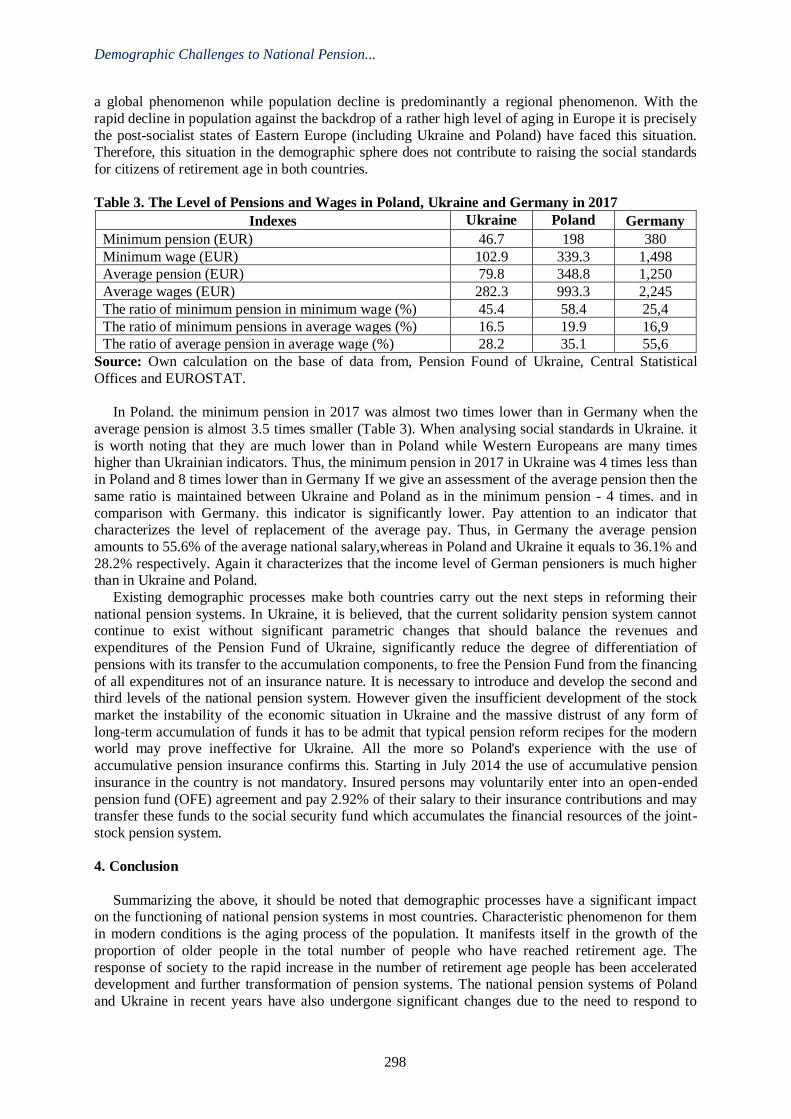
Demographic Challenges to National Pension...
298
a global phenomenon while population decline is predominantly a regional phenomenon. With the
rapid decline in population against the backdrop of a rather high level of aging in Europe it is precisely
the post-socialist states of Eastern Europe (including Ukraine and Poland) have faced this situation. Therefore, this situation in the demographic sphere does not contribute to raising the social standards
for citizens of retirement age in both countries.
Table 3. The Level of Pensions and Wages in Poland, Ukraine and Germany in 2017
Indexes Ukraine Poland Germany
Minimum pension (EUR) 46.7 198 380
Minimum wage (EUR) 102.9 339.3 1,498
Average pension (EUR) 79.8 348.8 1,250
Average wages (EUR) 282.3 993.3 2,245
The ratio of minimum pension in minimum wage (%) 45.4 58.4 25,4
The ratio of minimum pensions in average wages (%) 16.5 19.9 16,9
The ratio of average pension in average wage (%) 28.2 35.1 55,6
Source: Own calculation on the base of data from, Pension Found of Ukraine, Central Statistical
Offices and EUROSTAT.
In Poland. the minimum pension in 2017 was almost two times lower than in Germany when the
average pension is almost 3.5 times smaller (Table 3). When analysing social standards in Ukraine. it
is worth noting that they are much lower than in Poland while Western Europeans are many times higher than Ukrainian indicators. Thus, the minimum pension in 2017 in Ukraine was 4 times less than
in Poland and 8 times lower than in Germany If we give an assessment of the average pension then the
same ratio is maintained between Ukraine and Poland as in the minimum pension - 4 times. and in
comparison with Germany. this indicator is significantly lower. Pay attention to an indicator that characterizes the level of replacement of the average pay. Thus, in Germany the average pension
amounts to 55.6% of the average national salary,whereas in Poland and Ukraine it equals to 36.1% and
28.2% respectively. Again it characterizes that the income level of German pensioners is much higher than in Ukraine and Poland.
Existing demographic processes make both countries carry out the next steps in reforming their
national pension systems. In Ukraine, it is believed, that the current solidarity pension system cannot continue to exist without significant parametric changes that should balance the revenues and
expenditures of the Pension Fund of Ukraine, significantly reduce the degree of differentiation of
pensions with its transfer to the accumulation components, to free the Pension Fund from the financing
of all expenditures not of an insurance nature. It is necessary to introduce and develop the second and third levels of the national pension system. However given the insufficient development of the stock
market the instability of the economic situation in Ukraine and the massive distrust of any form of
long-term accumulation of funds it has to be admit that typical pension reform recipes for the modern world may prove ineffective for Ukraine. All the more so Poland's experience with the use of
accumulative pension insurance confirms this. Starting in July 2014 the use of accumulative pension
insurance in the country is not mandatory. Insured persons may voluntarily enter into an open-ended
pension fund (OFE) agreement and pay 2.92% of their salary to their insurance contributions and may transfer these funds to the social security fund which accumulates the financial resources of the joint-
stock pension system.
4. Conclusion
Summarizing the above, it should be noted that demographic processes have a significant impact on the functioning of national pension systems in most countries. Characteristic phenomenon for them
in modern conditions is the aging process of the population. It manifests itself in the growth of the
proportion of older people in the total number of people who have reached retirement age. The
response of society to the rapid increase in the number of retirement age people has been accelerated development and further transformation of pension systems. The national pension systems of Poland
and Ukraine in recent years have also undergone significant changes due to the need to respond to
A. Parlińska and V. Rudyk
299
demographic challenges and increase the average life expectancy of the population. Such trends in the
demographic sphere have affected the growth of the number of pensioners.
Governments are trying to find solutions to the problem of filling pension funds to avoid risks in the future. Along with the task of stimulating childbearing the main emphasis should be placed on
minimizing the current and future socio-economic consequences of aging populations. The level of
pensions in both countries does not fully satisfy citizens of retirement age. Against the backdrop of Western European countries, in particular Germany, the level of pensions in Poland is several times
lower. But comparing it with similar indicators in Ukraine, it is several times higher.
Thus Poland and Ukraine face the need for a comprehensive reform of the pension system, which envisages the creation of new schemes, on the one hand and adaptation to the new demographic
conditions of traditional pension models - on the other.
References
Convention of the International Labor Organization No. 102 "On Minimum Social Security
Provisions" of 18.06.1952. http://www.liga.net Access: 12.12.2018 EU Statistical Office (EUROSTAT) http://epp.eurostat.ec.europa.euAccess; 10.12.2018
EU's Mutual Information System for Social Protection (MISSOC) / EU
http://ec.europa.eu/employment_social/missoc/db/public/compareTables.do?lang=enAccess: 20.01.2019
EU's Mutual Information System for Social Protection (MISSOC) / EU Database
http://ec.europa.eu/employment_social/missoc/db/public/compareTables.do?lang=en.Access:
01.12.2018 LibanovaE. M.(Ed.). (2010). Pension reform in Ukraine: directions of realization. Institute of
Demography and Social Studies named after MV Studs of the National Academy of Sciences of
Ukraine. p.270. Lutz. W.; Sanderson. W.; Scherbov. S. (2008) The forthcoming acceleration of global population
aging. Nature 451.
Madrid International Plan of Action on the Challenges of Aging;
www.un.org/Russian/document/declarat/ageing_progr.pdf. Access; 10.12.2018 ParlinskaA., Rudyk, R, (2019) Features of the functioning of national pension systems of Eastern
Europe and Ukraine in the modern conditions, Economic Science for Rural Development, ISSN
1691-3078 ; nr 52, p. 182-187 Pension Fund of Ukraine. https://www.pfu.gov.ua/Access; 20.01.2019
Social Security Programs Through the World (SSPTW) / ILO Database [Electronic Resource] -
Access Mode http://www.ilo.org/dyn/sesame/ifpses.socialdatabaseAccess: 01.12.2018 Social Security Programs Through the World (SSPTW) / ILO
http://www.ilo.org/dyn/sesame/ifpses.socialdatabase.Access: 20.12.2018
State Statistics Committee of Ukraine. http://www.ukrstat.gov.ua. Access: 10.12.2018
Svenchicki M.. Tkachenko L.. Chapko I. (2010) Demographic and financial background of pension reform in Ukraine: forecast - 2050. - K. Blue Ribbon Analytical and Advisory Center.- p. 72.
The Law of Ukraine of October 3. 2017 No. 6614-VІІ. 2017. "On Amendments to Certain Legislative
Acts of Ukraine Regarding the Increase of Pensions" // www.rada.gov.ua Tkachenko L. (2008) Impact of Demographic Processes on the Development of the Pension System in
Ukraine / L. Tkachenko // Bulletin of the Pension Fund of Ukraine. - 2008. - No. 4. - p. 24-27.
When should the state pension age increase to 66 / Experts on age and employment. Recourseshttp://www.taen.org.uk Access; 12.12.2018
World Bank Office in Ukraine www.worldbank.org.ua Access; 10.01.2019
World Population Prospects. The 2008 revision. Volume II: Sex and Age Distribution of the World
Population. - New York: UN. (2009) –p 965. World Population to 2300. - New York: UN. (2004) –p. 240.