
Proceedings book - International Consortium for Electronic ...
342
-
Upload
khangminh22 -
Category
Documents
-
view
0 -
download
0
Transcript of Proceedings book - International Consortium for Electronic ...

Proceedings of The Seventeenth
International Conference on Electronic Business
"Smart Cities"
Edited by
Eldon Y. Li National Chengchi University and
Asia University, Taiwan
Kathy Ning Shen University of Wollongong in Dubai, UAE
4-8 December 2017Novotel Dubai, Al Barsha, Dubai, UAE
ISSN: 1683-0040Indexed by EI and SCOPUS since 2005
COMMITTEES
Organizers: International Consortium for Electronic BusinessFaculty of Business, University of Wollongong in Dubai, UAE. International Journal of Electronic Business
Conference Chair: Kathy Ning Shen, Associate Professor, University of Wollongong in Dubai, UAE
Program Chairs:Jim Janson, Qatar Computing Research Institute, HBKU, Doha, Qatar Dr. Dongming Xu, University of Queensland, Australia
International Program Committee Abbas Tarhini, Lebanese American University, Lebanon Albert Huang, University of the Pacific, USA Baoding Liu, Tsinghua University, China Balan Sundarakani, University of Wollongong in Dubai, UAE Benjamine Yen, University of Hong Kong, China Eldon Y. Li, National Chengchi University, Taiwan Gatautis Rimantas, Kaunas University of Technology, Lithuania Hsin-Lu Chang, National Chengchi University, Taiwan Ibrahim M. Al-Jabri, King Fahd University of Petroleum and Minerals, Saudi Arabia Jao-Hong Cheng, National Yulin U. of Science and Technology, Taiwan Jashen Chen, Yuan Ze University, Taiwan Jinwu Gao, Renmin University, China John Guo, James Madison University, USA John Hamilton, James Cook University, Australia Key Pousttchi, University of Potsdam, Germany Kwok Kee Wei, Natinoal University of Singapore, Singapore Michel De Rougemont, University Paris II, France Mika Hannula, Tampere University of Technology, Finland Naoum Jamous, Otto-Von-Guericke University of Magdeburg, Germany Patrick Y.K. Chau, University of Hong Kong, ChinaPei-Lee Teh, Monash University, Malaysia Qi Li, Xi’an Jiaotong University, China Qiang Ye, Harbin Institute of Technology, China Ravi Sharma, University of Canterbury, New Zealand Robert Luo, University of New Mexico, USA Sim Kim Lau, University of Wollongong, Australia Siriluck Rotchanakitumnuai, Thammasat University, Thailand Soly Mathew Biju, University of Wollongong in Dubai, UAE Timon C. Du, Chinese University of Hong Kong, China Waiman Cheung, Chinese University of Hong Kong, China Wenshin Chen, RMIT Vietnam, Vietnam Yan Li, ESSEC Business School Asia Pacific, SingaporeZhang Xi, Tianjing University, China
The 17th International Conference on Electronic Business, Dubai, UAE, December 4-8, 2017ii
PREFACE
Welcome to the 17th International Conference on Electronic Business (ICEB) in Dubai, UAE. The theme of this year’s Conference is “Smart Cities.” We had received 81submissions and 51 papers were accepted into the final program that consisted of 11 sessions. Among them, 34 full papers, 8 work-in-progress papers, and 7 abstracts areincluded in this Proceedings. To avoid copyright issue, those papers whose authors intend to submit them to journal outlets are published in work-in-progress or abstract format only. The topic areas of the papers in this conference include Big data analytics and smart cities, Blockchain technology and applications, FinTech technologies and applications, Smart hotels and buildings, Social and cross-border e-commerce, eHealth and smart tourism, Internet and e-business, IoT technologies and applications, Online consumer behavior, Supply chain and logistics, Design science and service designs, Social media and multimedia designs, and other e-business research issues.
On the opening day, we had scheduled two keynote speakers: Prof. Patrick Y.K. Chau, Padma and Hari Harilela Professor in Strategic Information Management and former Director of School of Business from University of Hong Kong; and Prof. Eldon Y. Li, University Chair Professor from National Chengchi University in Taiwan. They presented their recent perspectives in smart cities and multilevel research design. In addition, we were fortunate to visit Smart Dubai Project Office and warmly welcomed by the project team leaders. They gave us several lively presentations and showcases. All the participants found their achievements in this project very impressive and admirable.
A special event occurred during the conference this year we broke ground in using communication software to conduct
two virtual presentations regarding data science and web mining. The two research projects were headed by Prof. Jim Jansen at Hamad Bin Khalifa University, Qatar. Because of the QatarBlockade, His research team was not able to travel to Dubai for the physical presentations.
The annual conference of ICEB is an excellent opportunity for the scholars like you and me to share research ideas and get informed about the latest development in the fields. We could meet leading scholars from around the world so as to establish a research network and engage in future collaborations. In this conference, there were 66 scholars from 14 countries, including Australia, China, Hong Kong, Lebanon, Macau, Netherlands, Philippine, Portugal, Qatar, Singapore, South Korea, Taiwan, Thailand, and U.S.A.

The 17th International Conference on Electronic Business, Dubai, UAE, December 4-8, 2017iii
In closing, we would like to thank you for your participation in this conference, without which it will not be successful. We also thank all the speakers, presenters, reviewers, the program committee members, and session chairs, who all have contributed their efforts and support to this conference. Special thanks go to our conference staffs, especially Ms. Jane Yu, Director of Sun Light Tourism, who had planned and executed the conference events tirelessly and effectively. Finally, on behalf of the entire Conference Committee and the Novotel Al Barsha staffs, we sincerely wish that the experience during your stay in Dubai was very delightful and memorable and we look forward to seeing you again in ICEB 2018.
Cordially yours,
Eldon Y. Li Eldon Y. LiProceedings Co-Editor, ICEB 2017University Chair ProfessorNational Chengchi University and Asia University, Taiwan
Kathy N. Shen Kathy Ning ShenProceedings Co-Editor, ICEB 2017Associate ProfessorUniversity of Wollongong in Dubai, UAE
December 2017 in Dubai, UAE
The 17th International Conference on Electronic Business, Dubai, UAE, December 4-8, 2017iv
TABLE OF CONTENTSTITLE PAGEPreface ……………………………………………………………………………………………….Eldon Y. Li and Kathy Ning Shen
i
PART 1: Full Research Papers1. A Co-Citation Bibliometric Analysis of Crowdsourcing Research ………….………………....
Xiaobei Liang and Minghua He1 f20
2. A Crowdsourcing Mode of Tourism Customization Based on Sharing Economy …….……….Zihao Wang, Zhenlong Peng, Gui Xiaolin and Chong Ding
13 f40
3. A Historical Perspective on Decentralisation and Service Delivery for Socioeconomic Development in Papua New Guinea ………….……...………………………………….……...George Bopi-Kerepa, John Hamilton and Murray Prideaux
20 f70
4. A Study of Conflict and Resistant Behaviors in the Implementation of the Ecosystem Platform ………………………………………………………………………………………....Wei-Hsi Hung and Yen Sheng Tsai
29 f43
5. Adopting IoT Technology to Optimize Intelligent Water Management …...…………….…..…Eldon Y. Li, Wen-Hsin Wang and Ying-Sung Hsu
38 f74
6. Analysing Big Data Projects Using Github and JavaScript Repositories ….…………………...John Hamilton, Singwhat Tee, Jason Holdsworth and Mohammad Azeez Alshomali
47 f68
7. Blockchain Technology Acceptance in Electronic Medical Record System …………….….….Lakkana Wanitcharakkhakul and Siriluck Rotchanakitumnuai
53 f46
8. Constructing Media-based Enterprise Networks for Stock Market Risk Analysis ………..……Rong Xing, Shengxin Dong, Qinyu Wang and Qing Li
59 f22
9. Constructing the Smart Hotel Architecture – A Case Study in Taiwan ……….………………..Wen-Chi Lai and Wei-Hsi Hung
67 f73
10. Deciding Fast and Slow in Risk Decision Making: An Experimental Study ……….....…….….Xiaorui Wang, Ronggang Zhou and Renqian Zhang
72 f11
11. Digital Multimedia Design Integration Model based on Experience Design ….………….……Kai-Ju Chuang
79 f38
12. Drivers of eHealth Adoption: Linking eHealth Adoption to Service Concept …….………..….Hsinlu Chang, Weiwen Szu and Yuju Tu
85 f25
13. Emergency Management System Design for Accurate Data: A Case Study …………….……..Abbas Tarhini, F. Jordan Srourand Nabil Badr
93 f47
14. FinTech Trends Relationships Research: A Bibliometric Citation Meta-Analysis ….….…..….Pei-Shan Wu
99 f45
15. Gender Effect on E-Commerce Sales of Experience Gifts: Preliminary Empirical Findings ………………………………………………………………………………………....Joni Salminen, Sarem Seitz, Bernard J. Jansen and Tommi Salenius
106 f15
16. GitHub: Factors Influencing Project Activity Levels ………………………………….……….Mohammad Azeez Alshomali, John Hamilton, Jason Holdsworth and Singwhat Tee
116 f69
17. Graph Transformation Based Guidance for Web Navigation ………………………….………. 125 f21
The 17th International Conference on Electronic Business, Dubai, UAE, December 4-8, 2017v
Benjamin Yen, Kevin Ni and Lk Chu18. Industrie 4.0 and Leadership ……………………….……..…………………………………….
Kylie Prince132 f76
19. Inferring Social Media Users’ Demographics from Profile Pictures: A Face++ Analysis on Twitter Users …………………………………………………………………………………...Soon-Gyo Jung, Bernard Jim Jansen, Joni Salminen, Jisun An and Haewoon Kwak 140 f27
20. Measuring the Quality of Financial Electronic Payment System: Combined with Fuzzy AHP and Fuzzy TOPSIS ……………………………………………………………………......…….Li-Ru Chen, Kai-Hao Liu, Fang-Pin Lai, Shao-Shiun Chang and Kou-Yi Lee
146 f05
21. Modelling and Analysis of E-Health Ecosystems: A Case Study of the United States …...……Lena Stephanie Felix
161 f13
22. Predicting the Mobile Consumer Purchase Behavior using Quantified Visual Preferences ……Young-Joon Yu and Jae-Hyeon Ahn
173 f50
23. Principles of Increasing the Interactivity of Mobile Applications of Smart Parking ……...……Wei-Hsi Hung, Kai-Ju Chuang and Yen-Chieh Liao
186 f37
24. Problems of Data Science in Organizations: An Explorative Qualitative Analysis of Business Professionals’ Concerns …………….……………………………..……………………………Joni Salminen, Bernard J. Jansen and Milica Milenkovic
192 f14
25. Real Money Trading in Virtual Worlds …………….………………………...………………...Mohamed Nazir, John Hamilton and Singwhat Tee
202 f71
26. Replication Attack Detection in Mobile Wireless Sensor Network with Leach-Me Routing Protocol …………………………………………………….……………………………...……Da-Chun Chien, Cheng-Yuan Ku and Shu-Rong Huang
208 f44
27. Research On Multifunctional Integrated Internet Platforms …..………………………...……...Zhang Guoyou, Jiang Wenlong, Wang Ying and Liu Shang
215 f52
28. Research on the Development of Measurement Scale for the Synergy of College Technological and Creative Team …………………………………...………………………….Chuanhao Fan, Ting Wen, Buchao Xu, Jigan Wang and Kaiyuan He
222 f57
29. Research on Transforming Capability of Economic System and Its Impact on Urban Competitiveness ………………………………………………………………………..……….Li Shi, Sheng-Yu He and Song Chong
228 f33
30. Senior Citizens’ Self-efficacy for ICT Use: The Influence of Gender, Social Influence and Social Support .……………….……………………………………………………………...….Chong Guan, Joicey Jie Wei, Calvin M. L. Chan and Allan Beng Hock Chia
234 f62
31. Senior Population’s Acceptance and Expectance of Wearable Medical Devices in China ….....Bo Zhang and Yan Li
241 f54
32. The Acceptance of the Application of Blockchain Technology in the Supply Chain Process of the Thai Automotive Industry …….…………………...……………...…………………….......Sowichaya Supranee and Siriluck Rotchanakitumnuai
252 f10
33. The Antecedents and Outcomes of Identifiability in Online Brand Communities …….………....... Stephanie Meek and Kathy Ning Shen
258 f32
34. The Multi-Channel E-Service Quality for Thai Electronic Tourism……………….…………...Siriluck Rotchanakitumnuai
264 f31
35. The Nature of IT Firms: A Systemic Literature Review and Analysis ……………...…………. 272 f34
The 17th International Conference on Electronic Business, Dubai, UAE, December 4-8, 2017vi
Sha Huang and Dongming Xu
PART 2: Work-in-Progress Papers36. How Consumers’ Perceived Importance of Music, Identity, Personal Experience, Internet Use,
and Social Media Influence Their Music Preference, Consumption Satisfaction, and Loyalty ..Raymond Liu and Jurui Zhang
287 w19
37. Impacts of Users’ Extra-Role Behaviors on Bright Internet Policy Adoption ………….…..….Yujuan Zheng, Wei Huang, Jae Kyu Lee and Helen Xiaohui Bao
291 w51
38. Improving the Performance of Lumpy Demand Forecasting – Taking W Company As AnExample ………………….…………………………………………………..…………………Hao-Chun Chuang, Hsin-Lu Chang and Po-Chun Hsu
295 w23
39. Integrating Innovation Diffusion Theory and the Technology Acceptance Model: the adoption of blockchain technology from business managers’ perspective ……………………………….Antonio T.F. Lou and Eldon Y. Li
299 w30
40. Progress of FinTech Industry from Venture Capital Point of View ……………………...…….Ku-Hsien Hsieh and Eldon Y. Li
303 w36
41. RegTech Evolution: The Trustchain ……………………………………..………………….….Grant K.J. Huang and Kuo-Huie Chiang
308 w28
42. Study on the Influence Mechanism of Knowledge Inertia on The Adoption of Innovative Medical Equipment …,……………………………………………………………………….…Xun Zhang and Biao Xu.
312 w64
43. The Impact of Product Variety and Product Diversification on Inventory Levels: From ADistributor Perspective ………………………………………………………………………….Hsin-Lu Chang, Yen-Chun Chou and Hui-Ching Yang
317 w39
PART 3: Abstracts44. Blockchain Technology Adoption: Implications and Challenges ……………………………....
Soumaya Ben Dhaou, Tatiana Zalan and Elissar Toufaily321 a72
45. Curbing Shopping Cart Abandonment in C2C Markets — An Uncertainty Reduction Approach ………..........................................................................................................…...…….Heng Tang and Xiaowan Lin
322 a41
46. Customer Satisfaction with E-Service Recovery: Roles of Perceived Justice and Customer Emotions ……………………………………………………………………………...….….….Babak Hayati
325 a12
47. Do Security Breaches Matter to Consumers? ……………………………..………………...….Noury Janse, Carol Ou, Spyros Angelopoulos, Robert Davison and Jelly Jia
327 a17
48. Exploring How Conflict and Uncertainty Affect Repurchase Intention in Social Commerce ---The Mediating Effect of Perceived Deceptiveness………………………..…………………….Jao-Hong Cheng, Ren-Gui Liu and Timon C. Du
328 a16
49. Spillover Effect of Consumer Awareness on Third-Party Sellers’ Selling Strategies on Retail Platforms ………………………………………………………………………………………..Wen Song, Jianqing Chen and Wenli Li
329 a56
50. The Development Situation and Strategies of Cross Border E-commerce in China ……………Lifan Yang
330 a61

The 17th International Conference on Electronic Business, Dubai, UAE, December 4-8, 2017vii
51. The Study on Cross Border E-Commerce Startup ……………………………...……...……….Tzu Shan Tseng
332 a35
������� � �� � �� �� ������� �� ������������ ������� �������������� �!� ���"#��$������ � � ���%� &�� Proceedings of The 17th International Conference on Electronic Business� �''�������&*/<��=$�����>�/��= � �� ��@�[�
Liang & He
The17th International Conference on Electronic Business, Dubai, UAE, December 4-8, 2017���
��������������� ���������� ������������������������������
���� ���������\���]��>��^ �������_%���%����*%����������`���� �{����]� #$�������%$��� |��\���]��>��^ ��������#�}��������%���>��^ �������*%�����%�%����{�~�����
����������
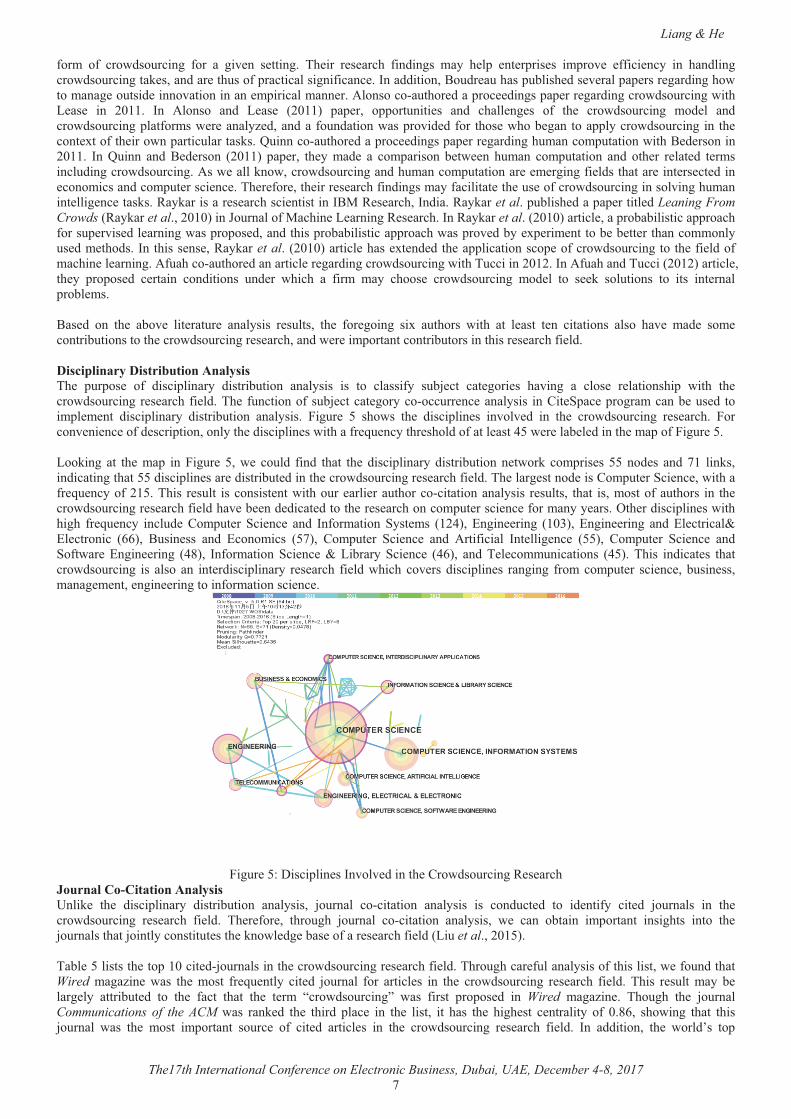
*��"#��$������%������� #����� ��������� ������!������%���������������#����� ��!�!� �#���$�%�������'$� ����� �� �� ���� ��������!��������� ���� ��� �$��� ���� ��#� ��������� ��" ^ ��� ! "� ���"#��$������ ��$#� �� �� � ���#$�� #� !���� �% � ������� �����' ��' ���^ �\%���'�' �����#$����#��$� �����������������$�%����������������]�$��������������������#�� �"��#����"��#������������� �% ����"#��$������� � ���%�!� �#����$�����*�� _'�� ���#�Web of Science TM Core Collection�#������ ������������ �# ���!��%��%������ #������� ����#�]�$��������#���!�$ �������$�%��������% ����"#��$������� � ���%�!� �#�#$������% ���� ��'���!�������[�������~���#����!��#��$���$�� ���%���� � ���%���'������#�!$�$� �#�� �����������% ����"#��$������� � ���%�!� �#� ��Keywords: *��"#��$��������������������������� ������������������������������������|*��� �'��#�����$�%����
�����!"������_��� ���" �����~������ #��% �� �������"#��$����������Wired Magazine�����"#��$������%������� #����� ��������� ������!������%���������!� �#���$�%�������'$� ����� �� ���$��� ���� ������������� �� ���#����� ������������!���%������%�^ ����#$�� #�������#����� ��!���$#� ��������"#��$�������� ^��$����$#� ��'��#��������!���� ������������^�����% ��$ ��������$�%����"%��� `���������"#��$������ ���� %�"� �% � ���"#��$������'���!���� �' ��� ��� ��#� "%���#�!! � �� � `����� � �" �� ����$���$������ ����� ��#� �����"#��$�����������_ ^ �����$�%����� �' �������*%�� � ��$�%����%�^ ����#$�� #������ ���$� �� ^� "�������"#��$������� � ���%��� ��� ��#� ���� ������ �%���� et al�� ������ �� ���"#��$������ ��� ���$� � � ^� "� "��� ����� ���#$�� #� !���� �% � %$���� � ��$�� ������ � ���' ��' ���^ ��<$ ��� ������������#������� ��������''������$#��������"#��$������"������#$�� #������ ����et al����������" ^ ���! "����"#��$��������$#� ���� ����#$�� #�!�����% �������� �����' ��' ���^ ��<������ �����������������������������������������!�"���� ��'$�������������$�%������������������� ��\% �'$�'�� ��!��$����$#�����������#$������������ �����������������$�����*�� _'�� ����# � �����#�^��$���� ���'������������� ��� ��!�$ �������$�%������$�� ���%���� � ���%���'��������" ������ ^��^������ �#������% ����"#��$������� � ���%�\% �������� ��������������� �$����"����� �'� � �� #�������$��������^ ���#�^��$���� #����� �����$�����*�� _'�� �<��������'%���� �%���$ ���� �#��������^ �!$���������!�*�� _'�� ����#��� �$�$�����$� #� ������#$��������������������������#�� �"��#����"��#���������� ����� � � ���%� !� �#� ���$�et al�������� &�� �%���'�' ���" �"�����''����% �!����"�������������'%���� �%���$ ��'��^�# #����*�� _'�� �� ���� #��$� �������������������������*% ����������� �# �#��!!���������� �$�%�������������������������*% ����#�*������������� �$��et al�����[���%�� ��������������[���� ]�$����������������������������$�et al����������$��������\����et al���������� � �"��#����"��#�����������*������et al��������� ��������� ���_$���������=��$� ������������������������ ��� ��� �# #� ���!��#��$�� ��'������������� ��"��%���%��%����������!� �$ ���� ��� �% ����"#��$������� � ���%� !� �#�� �$�%��� ������������� �"���� ��� ��� �# #� ��� !��#��$�� �% � ��'������� ��#� ��!�$ ������ �$�%���� ��� �% ����"#��$������� � ���%� !� �#�� ]�$����� ������������� �"���� ��� ��� �# #� ��� !��#��$��"%��%� ]�$������ �� �#�������� ��$�� ���!� ������ �� � ���#�������"#��$���������#�� �"��#����"��#����������� ��$� ���% �!� �$ �����!�� �"��#�����#���� ������# ���!���$�� ���� � ���%�!�������#� ^��^������ �#������% ����"#��$������� � ���%�!� �#� ��&���$��������%���'�' ���������$� ������# ���!��"%��%������� ����$�%�������#�]�$������'���������'���������� �����% � ^��$������!��% � ���"#��$������ � � ���%� ��#� ��� !��#��$�� %��� ��'���� ��� �% � � � ���%� !� �#� ��� � � ��� � ����� ��� �%��� ��� � ������ ��%������ ��#�'��������� �������%���!� �#�����# ^ ��'������#������%��������% ��$�� ���%���� � ���%���'������#�!$�$� �� � ���%�#�� ��������!��% ����"#��$������� � ���%�!� �#��\%���'�' ��������$��$� #����!����"���������" �#���$����% �� �%�#���#�#����!���������� ��������������_ ���#����������# ����'������!����"#��$������� � ���%����'��^�# #��"%��%�����$# ���% ��$�� ���!������� ����% ��$�� ���!��������������'�'��#$���^ ��$�%�������#� ��'� ]�$������ ��� �% ����"#��$������ � � ���%� !� �#�#$����� �% � ��� ��'��� !�������[� ������~�\%��#��" �# ����� � �'�������� �$�����!��% �������� �����������������# ������"%��%�����$# �� �$�����!�#��$� ��������������������������$�%�������������������������#����'������� #������$����� ���������� ]�$����� ������������ ���������� ��#� � �"��#� ���"��#� ��������� ��� �% � ���"#��$������ � � ���%�!� �#���������" ������$# ��$������������ �$����������� ��������������!��$����$#�����#�#���$����$��!$�$� �� � ���%�"�����
#$�%�!���!�!����&���$����$#���" � �'��� #��% �}�^����� #�*�� _'�� �'�����������% ���������������\% �^ �������!�*�� _'�� �$� #�����$����$#�����*�� _'�� �������_/��% � ���!� ��� ! �� #�������*�� _'�� ����
� Liang & He
The17th International Conference on Electronic Business, Dubai, UAE, December 4-8, 2017 ��
�\%�$�%���" ����" �����~������ #��% �� �������"#��$�����������"���������[��%����% �!�������%�������� � ���%�$������% �"��#����"#��$������"���'$����% #�\% � !�� ��" �� ��� ^ #���� ���$� �� ���#��!�����% �� ���!�_�� �� �\��*�� �*��� ������#������ ����$��������"#��$����������% �� �"��#���#�� �������% ���� ��'���!�������[�������~������!������ ���������~�����������!������'$����������� " � � � ��� ^ #� ��#� ������!� #� ����� � ^ �� #��$� ��� ��' �� ������ ���� �% � ����� '$������������ �% � � " � � ����'��� #�����'�' ��������$������!���@�[�����!��% ��������!����" #����]�$����������� ����@�[��@������� #����������� ��������@��@�[������ ����� ��������� ������������ ��#� � ^� "� ������������� ��#�'� #� �% �@�[� ]�$����� ������ �� ��� �% � ��'$��#���� !���!$��% ����������� ��
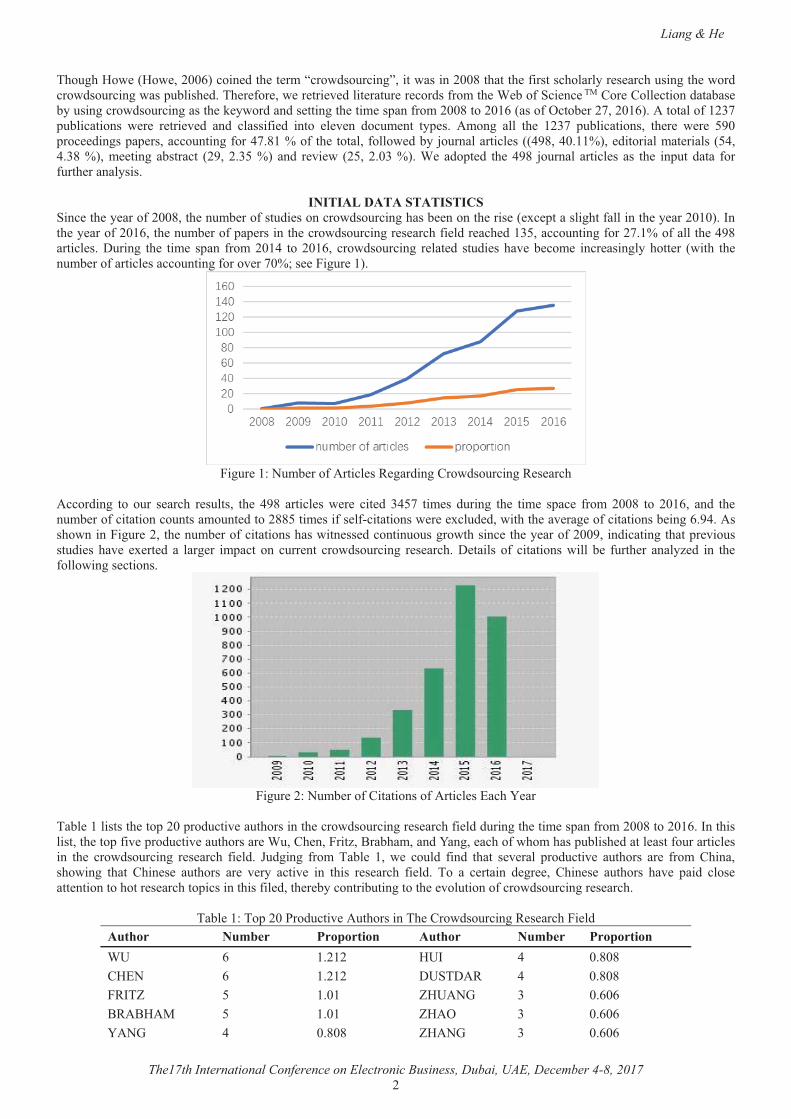
������&�!���������������_��� ��% �� ����!����[���% ��$�� ���!���$#� ��������"#��$������%���� ������% ���� �� `� '��������%��!��������% �� ���������&���% �� ����!����~���% ��$�� ���!�'�' �������% ����"#��$������� � ���%�!� �#�� ��% #����������$������!���������!������% �@�[������� ��=$����� �% � ��� � �'��� !�������@� ������~�� ���"#��$������ � ��� #� ��$#� ��%�^ �� ��� � ���� ��������%��� �� �"��%� �% ��$�� ���!������� ������$������!����^ �������� ����$� ���� �
����$� �����$�� ���!������� ��� ���#����*��"#��$������� � ���%�
������#���� ��� �$�� � ���%� � �$����� �% � @�[� ������ �� " � � ��� #� �@��� ��� �� #$����� �% � ��� � �'�� � !���� ���[� ��� ���~�� ��#� �% ��$�� ���!������������$�������$�� #�����[[����� ���!�� �!�����������" � � `��$# #��"��%��% ��^ ��� ��!������������ ����~�@�����%�"��������$� �����% ��$�� ���!�����������%���"��� �� #�������$�$�����"�%����� ��% �� ����!���������#���������%���'� ^��$����$#� �� %�^ � ` �� #� �� ���� �� ��'���� ��� �$�� ��� ���"#��$������ � � ���%� = ������ �!� ���������� "���� � � !$��% �� ������ #� ��� �% �!����"����� ������� �
����$� �����$�� ���!�*����������!������� ��/��%�� ���
�\��� ����������% ���'����'��#$���^ ��$�%��������% ����"#��$������� � ���%�!� �#�#$������% ���� ��'���!�������[�������~�&���%����������% ���'�!�^ �'��#$���^ ��$�%������ ��$��*% ����������<���%������#������� ��%��!�"%���%���'$����% #����� ����!�$�������� ����� �% � ���"#��$������ � � ���%� !� �#� }$#����� !���� \��� � ��� " � ��$�#� !��#� �%��� � ^ ���� '��#$���^ � �$�%���� �� � !���� *%������%�"���� �%��� *%�� � � �$�%���� �� � ^ ��� ����^ � ��� �%��� � � ���%� !� �#� \�� �� � ������ # �� �� *%�� � � �$�%���� %�^ � '��#� ���� ���� ���������%���� � ���%���'��������%���!�� #���% � ����������$���������% � ^��$������!����"#��$������� � ���%��
\��� ����\�'�������#$���^ ��$�%�������\% �*��"#��$������� � ���%��� �#�������� ������� '��(������ ������� ������� '��(�������>� ~� ����� �>&� @� �[�[�*�/�� ~� ����� =>_\=��� @� �[�[���&\�� �� ���� ��>���� �� �~�~�<��<���� �� ���� ����� �� �~�~������ @� �[�[� ������ �� �~�~�
� Liang & He
The17th International Conference on Electronic Business, Dubai, UAE, December 4-8, 2017 ��
����� @� �[�[� ������ �� �~�~�_\����&\���� @� �[�[� ������ �� �~�~�_//� @� �[�[� ����� �� �~�~��/��/�� @� �[�[� _�/=� �� �~�~��>� @� �[�[� _>� �� �~�~�
������% �@�[�]�$����������� ��" � �'$����% #��������]�$�������"%��%�" � ��������$� #����������%������!���������$���� ��>_��"����% ���'�'��#$���^ ���$������'$����%�������������!��@�������� ���!����" #�����% �� �'� ���� '$������!�*%�����'$����%�����~������� ����/�����#��'$����%������������� �����#�� �������'$����%������������� ���\% ���'�!�$��'��#$���^ �������$������������� �!�����% �>_������ ����>��^ �������!����%������>��^ �������!�����%�*���������_��#!��#�>��^ ���������#����^��#�>��^ ������&�����"���%�������� �%���*%������\����%$��>��^ ��������#��$%���>��^ ������" � ����� ������ �% � ������!� �% � � �������'��#$���^ �������$������ ��\��� �����������'����]�$������'$����%���������� ������% ����"#��$������� � ���%�!� �#���#��% ���� �' ���^ ���'����!��������������\% ����_���/�]�$�����'$����% #��% ������'�' �������% �!� �#��!����"#��$��������[�����������\%���]�$���������% �"���#���!������$���#����'��������' ����� ���]�$��������^ �����'�������� � ���%�!��������#����'��� �"��%������ �� ���#�� #���� �< ��$� ��% ����� '���!����"#��$������"�������������# !�� #������������ �'���� �����^������# �����" �����~����% ����"#��$������!� �#����$�$��������� �� #�"��%�" ��� �%�����������'$� ����� �� �� ���� ��������#���!������������� ��\% � !�� �������������$�'��������%��� � ��� #� ������ �� �� � $�$����� '$����% #� ��� ]�$������ �$�%� ��� }�$����� �!� � #����� &�� �� �� � � ���%� ���� ��� �������� &///�\������������������"� #� ���#�=����/���� �����_�� �� �����������������#�&///�&�� �� ��*��'$������[����������� ��
\��� ����\�'����}�$���������\% �*��"#��$������� � ���%��� �#����� ������� ��(������������_���/� �[� �����}�>���������/=&*���&�\/��/\��/_/��*�� ��� @����&///�\���_�*\&��_���������/=�/���=�=�\��/��&�//�&��� �� �@�~�
&///�&�\/��/\�*���>\&��� [� �@��*��\���_�*\&��_����&�\/��&�/�\�_�_\/�_���=�\/*�������� [� �@�@�
&///�\���_�*\&��_����&�\/��&�/�\�\���_���\�\&���_�_\/�_� �� ���@�
=/*&_&���_>����\�_�_\/�_� �� �~�@�*���>\/���/\����_� �� �@@~�&������\&����/\�&/���� ~� �����&///�*���>�&*�\&��_������&�/� ~� �����=�\�<�_/�\�/�}�>��������<&����&*���=�\�<�_/_���=�*>��\&��� ~� �~���
_/�_��_� �� �����}�>��������&������\&���_*&/�*/� �� �[�[�&///�\���_�*\&��_����������/����=�=&_\�&<>\/=�_�_\/�_� �� �~~��
*�/�&*���/��&�//�&����/�_� �� ����_*&/�\&�&*��/���\_� @� ���[�&������\&���*���>�&*�\&���_�*&/\�� @� �����&///�\���_�*\&��_������<&�/�*���>\&��� @� �@�~�/�/�\�_�_\/�_��&\������&*�\&��_� @� ��[��\���_���\�\&����/_/��*���/*��=� �� �����
����������������&)�����$�"&���
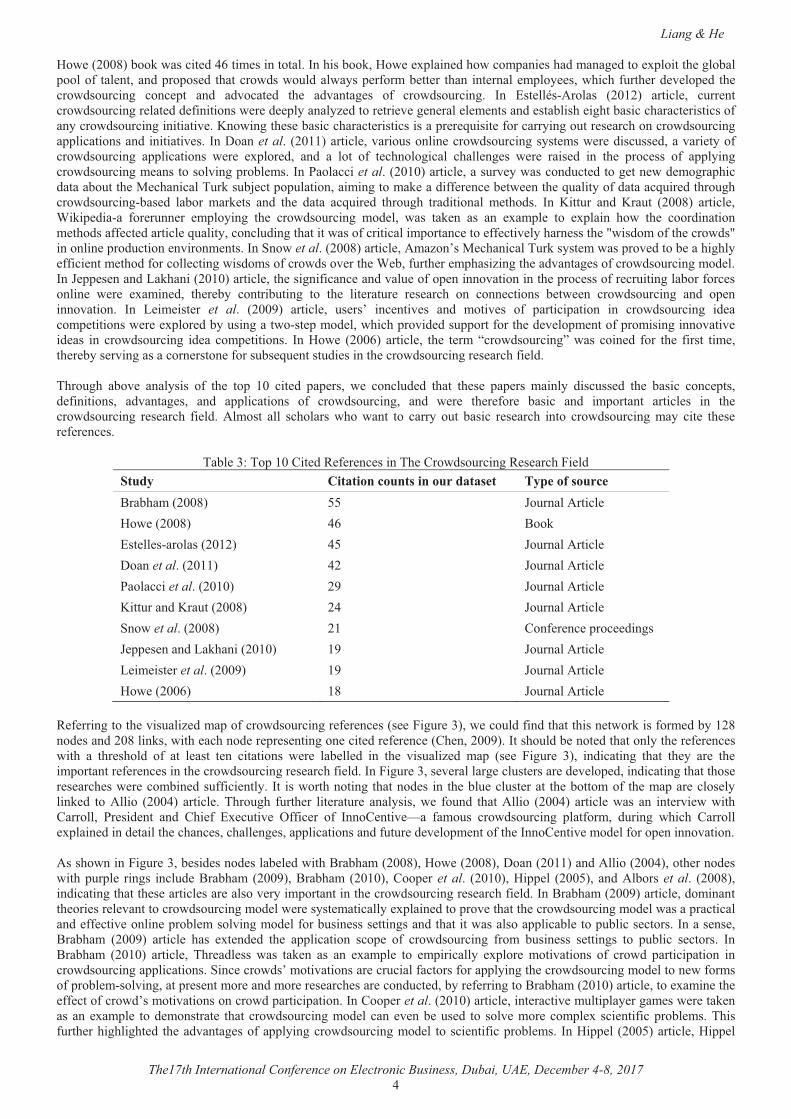
!������������������ ������ ������� #�� ! � �� ���!��% �� ��� ^ #�'�' ������$�����*�� _'�� ������#��%�� ��% ���'����� ! � �� ����� ��%���� ����� �!���# ���� #����������<��$�����*�� _'�� ����" ������� #��% ���'������� #�� ! � �� ������ �����!����������!� �$ ����#$������% ���� ��'��� !���� ���~� ��� ���~� �� � \��� � ��� ������ ���� �% � ��� #� � ! � �� ��� <���%��� ����[�� ������ � "��� ��� #� �% � ����� ��� �$��#������ � &�� !����� <���%��� ����[�� ������ � "��� ����� �% � !����� ��%������� � � ���%� $����� �% � "��#� ���"#��$������ ��� �%��� !� �#�<���%�������[�������#$� #����"#��$������!�����% �' ��' ���^ ��!��% �� ���������$�#������#� ` �'������� ����#� `'��� #��% �'���������� ��!����% ����"#��$��������# �����# �����&����������$�'��������%���<���%�������[�������� �� �^ #���������'�������������!��� ���� �$�� �$ ��� � � ���% �� ��� �% � ���"#��$������ � � ���%� !� �#� ��% �� '�' ��� ��� �% � ��'� ��� " � � ����� ���� #� ���� ��� ���<���%�������[�������� � �
� Liang & He
The17th International Conference on Electronic Business, Dubai, UAE, December 4-8, 2017 @�
��" �����[�������"������ #�@~���� �����������&��%�����������" � `'���� #�%�"����'��� ��%�#������ #���� `'������% ��������'�����!� ��� ������#�'��'�� #� �%������"#��"�$�#���"����' �!����� �� �� �%��� ��� ����� �'��� ���"%��%�!$��% ��# ^ ��' #� �% ����"#��$������ ���� '�� ��#� �#^���� #� �% � �#^����� �� �!� ���"#��$������ &�� /�� ������������ ������� ������ �� �$�� ������"#��$������� ��� #�# !���������" � �# '��������� #����� ��� ^ �� � ���� � � ������#� �������%� ��%���������%����� ���������!��������"#��$��������������^ ����"�����% � ��������%����� �������������'� � �$���� �!�������������$��� � ���%�������"#��$�������''������������#���������^ ��&��=����et al�������������� ��^����$������� ����"#��$���������� ���" � �#���$�� #����^��� ����!����"#��$������ �''���������� " � � `'��� #�� ��#� �� ���� �!� � �%���������� �%��� �� �� " � � ���� #� ��� �% � '��� ��� �!� �''���������"#��$������� ����������^����'���� ���&�����������et al�������������� �����$�^ ��"������#$�� #����� ��� "�# �����'%���#�������$���% �� �%�������\$����$�] ���'�'$��������������������� ���#�!! � �� �� �" ���% ��$�������!�#�������$�� #��%��$�%����"#��$��������� #� ������ ���� ��� ��#� �% � #���� ���$�� #� �%��$�%� ���#�������� � �%�#�� &�� ����$�� ��#� ���$�� ����[�� ������ ������' #����� !�� �$�� �� �'������� �% � ���"#��$������ ��# ��� "��� ��� �� ��� ��� `��'� � ��� `'����� %�"� �% � ����#��������� �%�#���!! �� #������� ��$������������$#�����%������"����!������������'������ ���� !! ���^ ���%��� ����% ��"��#����!��% ����"#����������� �'��#$������ �^����� ����&��_��"�et al�����[�������� ������������ �%�������\$������� ��"���'��^ #����� ���%��%��� !!��� ���� �%�#�!������� ������"��#�����!����"#���^ ���% �� ���!$��% �� �'%���������% ��#^����� ���!����"#��$��������# ��&��} '' � ����#����%����������������� ���% ������!����� ���#�^��$ ��!��' ������^����������% �'��� ����!�� ��$������������!��� ������� � " � � `���� #�� �% � ��� �������$����� ��� �% � ��� ���$� � � � ���%� ��� ���� ������� � �" �� ���"#��$������ ��#� �' ������^������ &�� � �� ��� �� et al� ������� ������ �� $� ���� ��� ���^ �� ��#� ����^ �� �!� '������'������ ��� ���"#��$������ �# �����' ��������" � � `'��� #����$��������"���� '���# ���"%��%�'��^�# #��$''����!����% �# ^ ��'� ����!�'�������������^���^ ��# ��� ��� ���"#��$������ �# �� ���' �������� &����" � ����~�� ������ �� �% � � ��� ����"#��$������� "��� ���� #� !��� �% � !����� ��� ���% � ���� �^������������� ����� �!����$�� �$ �����$#� ������% ����"#��$������� � ���%�!� �#� ��\%��$�%� ���^ � ��������� �!� �% � ��'� ��� ��� #� '�' ���� " � �����$# #� �%��� �% � � '�' ��� ������� #���$�� #� �% � ������ ���� '����# !���������� �#^����� ��� ��#� �''���������� �!� ���"#��$������� ��#� " � � �% � !�� � ������ ��#� ��'������� ������ �� ��� �% ����"#��$������ � � ���%� !� �#� ������� ���� ��%������ "%�� "���� ��� ������ �$�� ������ � � ���%� ����� ���"#��$������ ���� ��� � �% � �� ! � �� �� ��
\��� ����\�'����*�� #�� ! � �� �����\% �*��"#��$������� � ���%��� �#������� ������������������������� ��(������������<���%�������[�� ��� }�$����������� ���" �����[�� @~� <����/�� �� ���������������� @�� }�$����������� �=����et al�������� @�� }�$����������� ����������et al�������� ��� }�$����������� �����$����#����$������[�� �@� }�$����������� �_��"�et al�����[�� ��� *��! � �� �'��� #�����} '' � ����#����%����������� ��� }�$����������� �� �� ��� ��et al�������� ��� }�$����������� ���" �����~�� �[� }�$����������� �
�� ! ����������% �^��$���� #���'��!����"#��$������� ! � �� ���� ����$� �����" ���$�#�!��#��%����%���� �"�������!��� #������[���# ����#���[��������"��%� ��%���# �� '� � �������� ���� #�� ! � �� ��*% ���������&���%�$�#�� ���� #��%���������% �� ! � �� ��"��%� �� �%� �%��#� �!� ��� � ���� � �� ���������� " � � ��� �� #� ��� �% � ^��$���� #� ��'� �� � ���$� � ���� ��#�������� �%��� �% �� �� � �% ���'�������� ! � �� ������% ����"#��$������� � ���%�!� �#�&�����$� ����� ^ �������� ���$�� ����� �# ^ ��' #����#���������%����%�� �� � ���% ��" � ������� #��$!!��� �����&�� ���"���%���������%�����# ����� �% ���$ ���$�� ����� �% ���������!� �% ���'��� ����� ������� #� ��� ������ ����@�� ������ � \%��$�%� !$��% �� ��� ���$� � ���������� " � !�$�#� �%��������� ����@�� ������ � "��� ��� ��� �^� "� "��%�*�������� �� ��# ��� ��#� *%� !� /` �$��^ � �!!�� �� �!� &���* ���^ ��� !���$�� ���"#��$������ '���!����� #$����� "%��%� *������� `'���� #����# ������% ��%��� ����%��� �� ����''������������#�!$�$� �# ^ ��'� ����!��% �&���* ���^ ���# ��!����' ������^������ ������%�"��������$� ����� ��# ����# ����� � #�"��%�<���%�������[�����" �����[���=�������������#�����������@�����% ����# ��"��%�'$�'� � ������ ����$# �<���%�����������<���%�����������*��' ��et al� ����������'' �� �������� ��#��������et al� ����[�����#���������%����% � ������� ���� ������^ �����'�����������% ����"#��$������� � ���%�!� �#�&��<���%���������������� ��#���������% ��� ��� � ^����������"#��$��������# ��" � ����� ���������� `'���� #����'��^ ��%����% ����"#��$��������# ��"�����'�����������#� !! ���^ ������ �'���� �����^������# ��!����$��� ���� ���������#��%������"���������''������ ����'$������ ������&����� �� ��<���%��� ������� ������ � %��� `� �# #� �% � �''��������� ���' � �!� ���"#��$������ !���� �$��� ��� � ������� ��� '$����� � ������ &��<���%��� ������� ������ �� \%� �#� ��� "��� ��� �� ��� ��� `��'� � ��� �'��������� `'��� � ����^������� �!� ���"#� '������'������ ������"#��$�������''����������_��� ����"#�������^��������� ���$�����!�������!����''�������% ����"#��$��������# ������ "�!������!�'���� �����^��������'� � ������ ���#���� �� � ���% ���� ����#$�� #������ ! ���������<���%���������������� ����� `���� ��% � !! ����!����"#�������^�������������"#�'������'������&��*��' ��et al�������������� ����� �����^ ��$���'��� ����� ��" � ���� �������� `��'� � ���# �������� � �%������"#��$��������# ������ ^ ��� �$� #� ��� ���^ ���� ����'� `���� ���!���'���� ���\%���!$��% ��%��%���%� #� �% ��#^����� ���!��''���������"#��$��������# �� ������ ���!���'���� ��� &����'' �� ������������� ����'' ��
� Liang & He
The17th International Conference on Electronic Business, Dubai, UAE, December 4-8, 2017 ��
`'���� #� ��� # ����� %�"� �% � � ������ '��� ��� �!� $� ��� �� � #�� # �������� #� ����^������ "��� #� ��#� %�"� $� �� ����^������'��^�# #���^ ���� � ���������'� � ��������#�! #������!������$!���$� ������^������\%���'��^�# #�$������]���'���#�����%�!���������^��������%�������$� ���" � ���������% �'��� ��!����$!���$� ������� ��� ��% �� �#����!��� ��!�����^��������������!� �#��&��������� et al� ����[�� ������ �� � "� � ������� � �"���� �������������� '������ ��� ��� ���� ���"#��$������� "������ ��#� �' �� ��$�� ��" � �# '��������� #���#� �% �������^����������� �$ �� ������" ������ !�������#��^���� �% ���# ^ ��'� ���" � ������#���$�� #��"��%�����������# !�� ��% � �'������ ���� �������#��''����% � �'������ ����� � !!��� ����� ��&���$������������% ����^ �'�' ����� ������� '� � �����^ ���� ���$� ������% ����"#��$������� � ���%�!� �#����#������ ������# � #���'���������#�������������� ���$� ������%���!� �#� �
����$� ����=��$� ���*��*��������� �"����
������������������ ������ ������� �'��� #�*�� _'�� �������%���'�������� � ��� ����������^ ����� ���#�����'��!��$�%���������������� �"�����\��� �@������������� #� �$�%���� ��� �% � ���"#��$������ � � ���%� !� �#� &�� �� �� � ���#� #�$��� �%��� ��" � "��� �% � '��� ����� �$�%��� ��� �% ����"#��$������� � ���%�!� �#���" �"������ #����������!�������� ���"��%���� ����������!��������#���������%���% �"����% ��������!�$ ������ �$�%��� ��� �%��� !� �#� <���%��� "��� ��� #� ��@� ��� ��� "��%� �� � ��������� �!� ����� ��#�������� �%��� % � "��� �% � �������'��������$�%�������%���!� �#�\%���"���������� ���"��%��$�� ���� ��#��$� ������������������������� �$������%�������<���%���%���'$����% #�� ^ ������'�������'�' �������%���!� �#� ��\%��$�%����'�������� �" ��\��� �����#�\��� �@��" � !�$�#� �%�������� !�$�� �$�%�������� �� ���� ���� &' ��������_$��"� ��������������#������#�#������'' ������\��� �������% ��� �%��#�������% � ��$�%������ �!� �$ �������� #�����%���!� �#��'��^�����%����% ���� ���'���������#���!�$ �������$�%��������% ����"#��$������� � ���%�!� �#�����% ���% ��%��#�������! "��$�%������% ���%����%�� �����% ������%�^ ������ #��$�����$�#��� ������"��������%���� � ���%�!� �#�#$������% �'����# ��# �\%��$�%���� ���$� �����������" �!�$�#��%����% �!�$���$�%���������'' �� #����\��� �@������%�#���# ��� ����������$����������% ����"#��$������� � ���%� ��< ��# ���% �'�' ������$�%�� #�"��%�����������&' �������%���'$����% #�� ^ ����'�' ���� ���#������������ �%�������\$������� `��'� ��&' �������et al�������������� �'��'�� #�����������%��!������������#�����$�������!����"#��$������� �^�� ������$#������������ �%�������\$�����#������ #��$����� `' ��� ������# � ���� �"% �% ���% ��������%��"��� !! ���^ ����^����$���� �������\% � !�� �� &' ��������� '� ^��$�� � � ���%� !��#����� " � � ^ ��� $� !$�� ��#� ��$�#� % �'� $�� � �� �� $�# �����#� %�"� ���"#��$������'���!����"����' ��� #�����������!�$�#������!����$�� �$ �����$#� ������% ����"#��$������� � ���%�!� �#�_$��"� �������������� ��!���!�$ �������$�%��������% ����"#��$������!� �#�&��_$��"� ��������~�������� ��_$��"� ����'���� #��$���%���# ����������# ���������$'�" � ��!� ��� �� ���%����%�� ���# ���� `' �������������� �� �� ������% ����$'�������%������ �����'������ ����"��#�����!����"#��&���##�������_$��"� ��������~�������� �'��^�# #���������!�!�$������ ����!���# !��������"�� ����"#���#��$������ #��%� ���' ���!���������"#�"��#��������������$�%�� #���'�' ��� ���#������������ �%�������\$���"��%�_$�����������&����������#�_$���������������� ���% ���$������ #�� � !�����!��% ��������� �%�������\$���'���!����!������"#��$������'$�'�� ����#����$����� #����# �����%�"�������#$������"#��$����������% ��������� �%�������\$���'���!����&�����"���%����%�����%�����������#�_$���������������� ������ `'��� #�%�"�����������$��� %�^������� � ���% �����$������% ����"#��$������'���!����&����� �� �������� ��#� _$��� ������� ������ � %��� `� �# #� �% � �''��������� ���' � �!� ���"#��$������ !���� �$��� ��� �� ������ ��� � %�^������� � ���%�#��������������� ��!����"#��$������'��� ������#�% �%���� ��������� #����� � ���%����%$�������'$���������#�
� Liang & He
The17th International Conference on Electronic Business, Dubai, UAE, December 4-8, 2017 ~�
*��\*���� ���� �%�� et al� ����[�� `'��� #� %�"� ��� ��'� � ��� %$������� #� �%����� �� � ���������� �%��$�%� *��\*���������������# �������� ��%���*��\*������ �'���������" ��� �$������ ��$� �� �
\�<�/�@��\�'����*��*�� #��$�%�������\% �*��"#��$������� � ���%�������� *��+����� ���� ���� ����������
��" � ���� ���� ����% ��� ���>��^ �������>_��<���%��� ��@� ���� >��^ �������!�_�$�% ���*���!�������>_������$�� ~�� ���� *��� �� �� �����>��^ �������>_��&' ������� ��� �~�� � "������>��^ �������>_��_$��"� ���� ��� ���� \% �� "����� ���>_��=���� @�� ���� >��^ �������!������������>_�������� @@� ���� ��� ������>_��/�� ������������ @�� �� \ �%������>��^ �������!���� ������_'���������%�� ��� �� *��� �� �� �����>��^ �������>_��_��"� ��� ���� _���!��#�>��^ �������>_��
�����������\��� ������� ��!��% ���'������� #��$�%����" � �!����>_����%�"�����%����� �������$�%����'��� #��% �#����������� �����% ����"#��$������� � ���%�!� �#������/�� ������������"���!����/$��' ��"%�������"����%=����"#��$������� � ���% ������% �\ �%������>��^ �������!���� ������_'����&�� ���"���%�������� �%��� �%�$�%� �% � ��� ��� �����!�'��#$���^ �*%�� � ���%������ ��� �% ����"#��$������� � ���%�!� �#����� ��!��% ��������� #�����% ���'�������������� �����!����������!� �$ ������%�"�����%��������! "�*%�� � ���%�������� ���!�$ �������� ������%���!� �#� ��<�� � ���%���� !��� �% ��� #$����������������$�#���" � !�$�#� �%��� ���� �% � ��'� � �������� #��$�%����%�^ ����� ��#������� �# �� ����#���������%����% ��%�^ �� � �^ #���� �� ���!����������#����� ���������# �������������&���##�������������!��% � ��$�%����%�^ �� ��# #���� #����� � ���%�����% �!� �#���!����'$� ����� �� ���#����"#��$������!��������� ���� �
����$� �@���$�%���*��*��������� �"����
���$� @� ���$����� �� �� ��'� �!� �% � �$�%��� ������������ � �"���� /`��$#���� �% � �������$�� �$�%����� �%��� � �"���� ���'��� ��������# ����#���@���������$��������$�%����"��%����%� �%��#��!����� ����� �������������$������ ���� � #�����% ���'� ��� ! ����������% ���'�������$� �@��" ���$�#�!��#��%���������$�%������ ����� #����� ��������" ���#�<���%�����%�"�����%�����" ���#�<���%���" � ��% ��������!�$ �������$�%��������% ����"#��$������� � ���%�!� �#�&���##���������# ����" ��<���%������#�_$��"� ���� �� � ���� #� ��%� ��% ��� �%�"���� �%��� �% ��� � � ���%� � �$���� ���%�� %�^ � � �� ������ #� #$����� '���� � ���� �% �����'���������$� �����#����$� �@��" �!�$�#��%����% � �"�������$ ���$�� ��"% � ���# ��" � ����� ������� #������'' ����'' ��%���� ��������� #����� � ���%����!� �����^��������#�$� ������^��������'' ��������������� �%���� �������#$� #�����% �#��$� ��������������� ��������� ��� " � ���� ���"�� ���"#��$������ ��� �� !���� �!� $� ��#��^ �� ����^������ &�� �%��� � �� �� ��'' ��� � ���� �% ������������!�$� ������^������������ ��!���'���������#���!�$ �������������$���������% ����"#��$������� � ���%�!� �#���% ���$�%����"��%� ��� � ���� � �� ��������� ��$���� ����$# � ������ <�$#� �$�� �������� $����� �������� ��#� �!$�%� ����� et al� ������� "��� ��'��� #����� '�' �� � ���#���� ���"#"��� ��. &�� ����� et al� ������� '�' ��� �% � # �����'%���� �!� ������� � �%������� \$���"��� ���" � ���^ ������ #���#����"���!�$�#��%���'�'$��������!��������� �%�������\$���"��� ���%�#�� ��� ���� ��������� #���#� �%�!� #� !���� �� '� ^��$�� >_�#�������� ��# ��� ������ � "���!��� � ��� ��� &�#���#�������� ��$��� ��#� " ��� #$��� #���� ���������� "���!��� � \% ��� � � ���%� !��#����� ��#���� #� �%��� �% � ���"#� "���!��� � � ��� � ��� � ��� ���������� ��#� �% ����"#��$��������# ��"�$�#��%��� �' �'� ���!$�$� �"������#���^�������� �� ���# ^ ��'������$���� ��<�$#� �$�����$�%�� #������"#��$������� ��� #�'�' ��"��%����%������������&��<�$#� �$���#����%����������������� ���% ���# ���!� #�"% �����"#��" � ������� #� ���' �!���� � �� �� �%��� �'��� �� ��� �% � ��� ����� �������������� ��#� ����� '��^�# #� �����$������� !��� � � ������ �% �� ���
� Liang & He
The17th International Conference on Electronic Business, Dubai, UAE, December 4-8, 2017 ��
!���� �!� ���"#��$������ !��� �� ��^ �� � ������ \% ��� � � ���%� !��#����� ���� % �'� �� �'��� �� ��'��^ � !!��� ���� ��� %��#��������"#��$��������� �����#��� ��%$���!�'��������������!����� �&���##�������<�$#� �$�%���'$����% #�� ^ ����'�' ���� ���#����%�"��������� ��$���# �����^������������ �'����������� �������������$�%�� #���'��� #�����'�' ��� ���#�������"#��$������"��%�� �� � ��� ����� &�� ������� ��#� � �� � ������� '�' ��� �''���$���� �� ��#� �%��� �� �� �!� �% � ���"#��$������ ��# �� ��#����"#��$������'���!�����" � ������� #����#���!�$�#������"���'��^�# #�!��� �%�� �"%��� ���� ����''������"#��$������ ��� �% ����� `���!��% ����"��'�����$���������� $��������$�%�� #���'��� #�����'�' ��� ���#����%$�������'$�������"��%�< # ������������� &�� $���� ��#� < # ����� ������� '�' ��� �% �� ��# � �� ���'������� � �" �� %$���� ���'$������� ��#� ��% �� � ��� #� � ��������$#�������"#��$���������" ��������"�����"#��$��������#�%$�������'$��������� � � ������!� �#���%����� ���� �� �� #���� �����������#����'$� ����� �� �\% � !�� ���% ���� � ���%�!��#���������!�������� ��% �$� ��!����"#��$������������^����%$������� ���� �� �������������������� � ���%���� ���������&<��� � ���%��&�#����������et al�'$����% #���'�' ������ #�Leaning From Crowds���������et al�����������}�$������!����%�� �� �������� � ���%�&���������et al�������������� ����'��������������''����%�!����$' �^�� #�� �������"���'��'�� #����#��%���'��������������''����%�"���'��^ #���� `' ��� ������� �� �� ���%������������$� #�� �%�#��&���%���� �� ���������et al�������������� �%��� `� �# #��% ��''������������' ��!����"#��$����������% �!� �#��!����%�� �� ��������!$�%�����$�%�� #���������� �� ���#�������"#��$������"��%�\$������������&���!$�%���#�\$����������������� ���% �� '��'�� #� � ������ ���#������� $�# �� "%��%� �� !���� ���� �%��� � ���"#��$������ ��# �� ��� � �� ���$������ ��� ���� ��� �����'���� ��� ��<�� #� ��� �% � ���^ � ��� ���$� � ��������� � �$����� �% � !�� ������ ��`� �$�%���� "��%� ��� � ���� � �� ���������� ����� %�^ � ��# � ��� ��������$����������% ����"#��$������� � ���%����#�" � ���'��������������$���������%���� � ���%�!� �#� ��!����( ����!������������ �����\% � '$�'�� � �!� #����'������� #������$����� ��������� ��� ��� ������!�� �$�] ��� ��� ���� �� %�^���� �� ���� � � �������%�'� "��%� �% ����"#��$������ � � ���%� !� �#�\% � !$��������!��$�] ������ �����������$�� �� ���������� ���*�� _'�� �'������������ �$� #� �����'� � ��� #����'������� #������$����� ��������� ���$� � �� �%�"�� �% � #����'��� �� ��^��^ #� ��� �% � ���"#��$������ � � ���%� �������^ �� �� ��!�# ����'������������% �#����'��� ��"��%���!� �$ �����%� �%��#��!����� ����@��" � ���� � #�����% ���'��!����$� ��� ���������� ��� �% � ��'� ��� ���$� � ��� " � ��$�#� !��#� �%��� �% �#����'�������#������$������ �"���� ���'��� �������# �� ��#���� ���������#���������%������#����'��� ���� �#������$� #�����% ����"#��$������� � ���%�!� �#�\% ����� �����# ����*��'$� ��_�� �� ��"��%���!� �$ �����!�����\%��� � �$��� ���������� ���"��%��$�� ���� ���$�%������������������������ � �$����� �%��� ����������!��$�%���� ��� �% ����"#��$������� � ���%�!� �#�%�^ �� ��# #���� #�����% �� � ���%�������'$� ����� �� �!��������� ������% ��#����'��� ��"��%�%��%� !� �$ ���� ����$# � *��'$� �� _�� �� � ��#� &�!��������� _��� ��� ���@��� /���� ����� ������� /���� ����� ��#� /� ���������/� �������� �~~��� <$��� ��� ��#� /��������� ������ *��'$� �� _�� �� � ��#� ����!������ &�� ���� �� � ������ *��'$� �� _�� �� � ��#�_�!�"�� � /���� ����� �@[��� &�!��������� _�� �� � �� �������� _�� �� � �@~��� ��#� \ � ����$���������� �@��� \%��� ��#���� �� �%������"#��$������ ��� ����� ��� ��� �#����'������� � � ���%� !� �#�"%��%� ��^ ���#����'��� �� �������� !�������'$� �� ��� �� �� �$��� ��������� � ���� ���� ����������!������������ �� � �
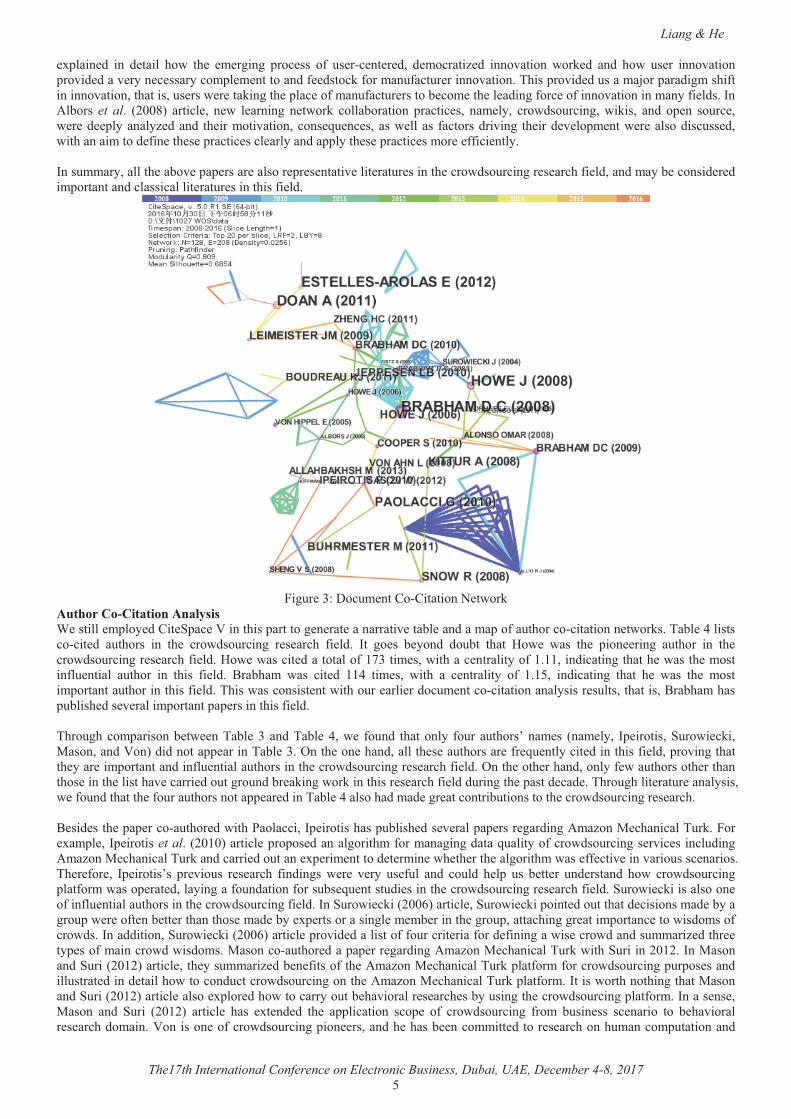
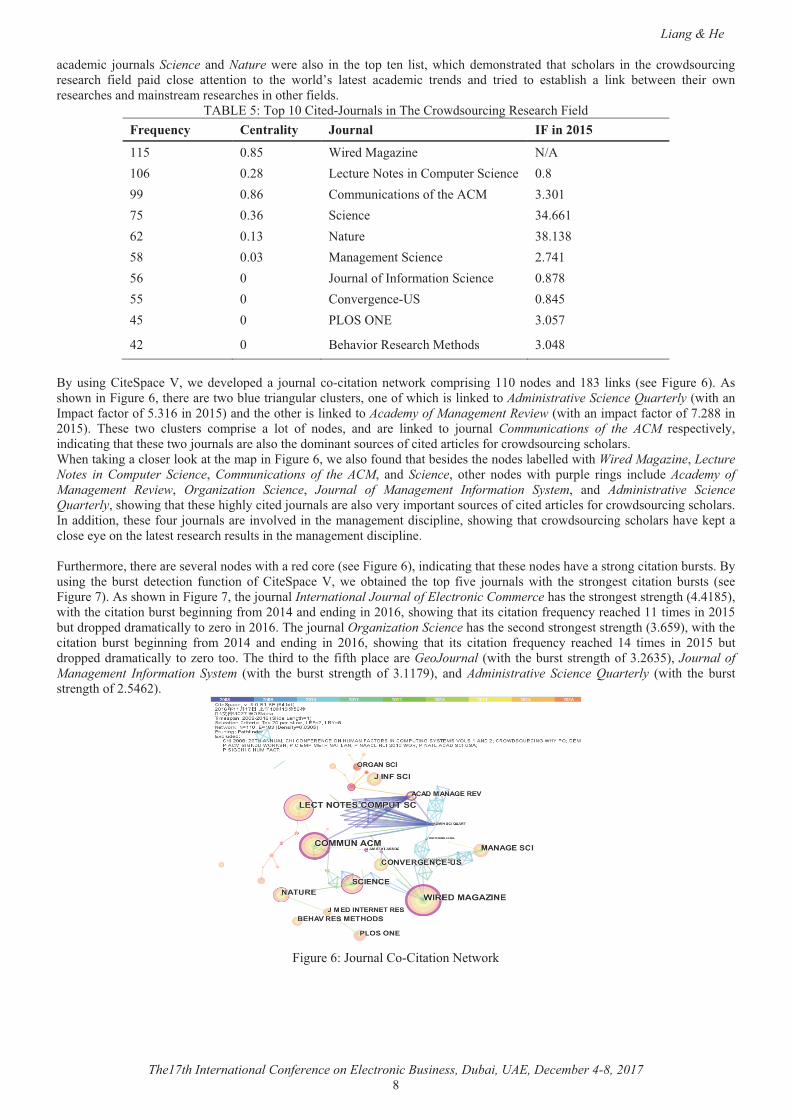
����$� ����=����'��� ��&�^��^ #�����% �*��"#��$������� � ���%�
,��� ������������ �����>���� � �% � #����'������� #������$����� ���������� ]�$����� ������������ ��������� ��� ���#$�� #� ��� �# ���!�� ��� #� ]�$������ ��� �% ����"#��$������ � � ���%� !� �#� \% � !�� �� �%��$�%� ]�$����� ������������ ���������� " � ���� ������� ��'������� �����%��� ����� �% �]�$�������%���]��������������$� ���% ����"� #� ���� ��!���� � ���%�!� �#����$�et al�������� ��\��� ����������% ���'������� #�]�$����������% ����"#��$������� � ���%�!� �#�\%��$�%���� !$������������!��%���������" �!�$�#��%���Wired� ������� � "��� �% � ����� !� �$ ����� ��� #� ]�$����� !��� ������ �� ��� �% � ���"#��$������ � � ���%� !� �#� \%��� � �$��� ���� � ����� ��� ������$� #� ��� �% � !���� �%��� �% � � ��� ����"#��$������� "��� !����� '��'�� #� ��� Wired� ������� � \%�$�%� �% � ]�$�����Communications of the ACM� "��� ���� #� �% � �%��#� '��� � ��� �% � ������ ��� %��� �% � %��% ��� � ��������� �!� �[~�� �%�"���� �%��� �%���]�$����� "��� �% � ����� ��'������� ��$�� � �!� ��� #� ������ �� ��� �% � ���"#��$������ � � ���%� !� �#� &�� �##������� �% � "���#��� ��'�
� Liang & He
The17th International Conference on Electronic Business, Dubai, UAE, December 4-8, 2017 [�
���# ���� ]�$������Science� ��#�Nature�" � � ����� ��� �% � ��'� � �� ������"%��%�# �������� #� �%��� ��%������ ��� �% � ���"#��$������� � ���%� !� �#� '��#� ���� � ��� ������ ��� �% � "���#��� ��� ��� ���# ���� �� �#�� ��#� ��� #� ��� �������%� �� ����� � �" �� �% ��� �"��� � ���% ����#�������� ���� � ���% �������% ��!� �#�� �
\�<�/����\�'����*�� #�}�$���������\% �*��"#��$������� � ���%��� �#�*��+����� ���� ���� ,��� � �*���/257�
���� �[�� ��� #�������� � �¡����~� ��[� � ��$� ���� �����*��'$� ��_�� �� �[���� �[~� *���$�����������!��% ��*�� �������� ��~� _�� �� � �@~~��~�� ���� ���$� � �[��[��[� ���� ����� � ���_�� �� � ��@���~� �� }�$������!�&�!���������_�� �� � �[�[���� �� *��^ �� �� �>_� �[@��@�� �� ���_���/� �����
@�� �� < %�^����� � ���%�� �%�#�� ��@[�
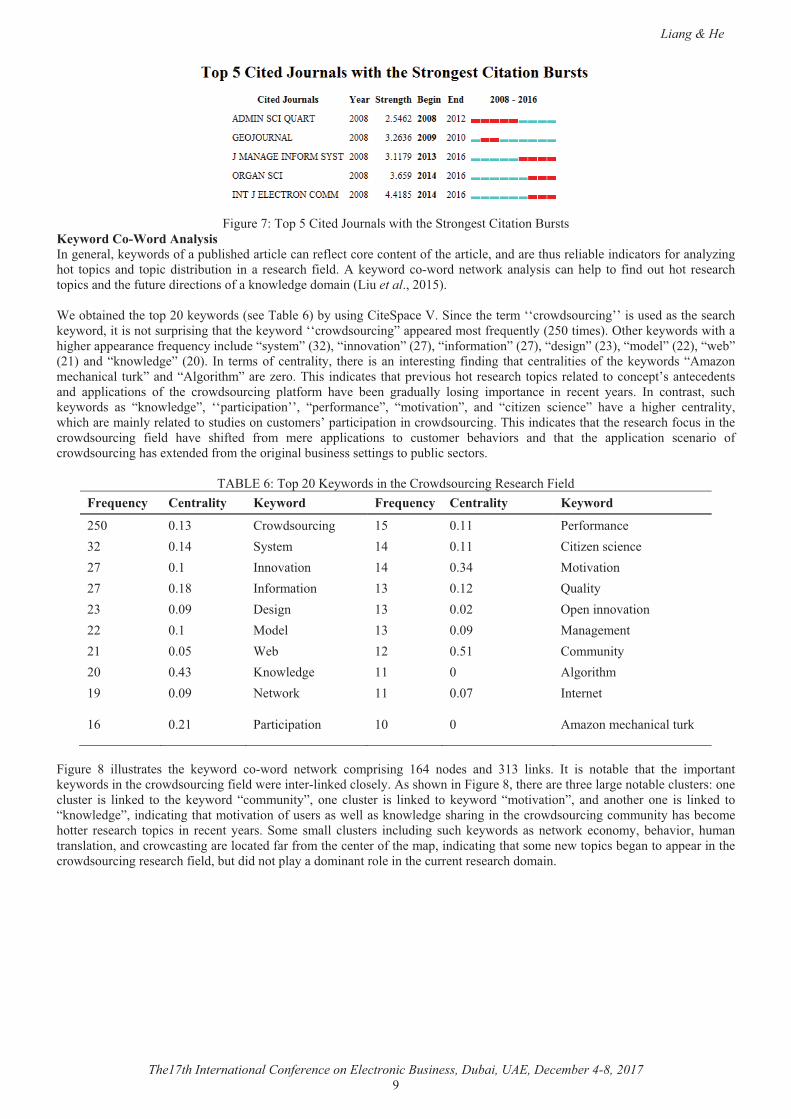
�<��$�����*�� _'�� ����" �# ^ ��' #��� ]�$����� ������������� �"�������'�������������# ����#��[�� ������ �� ����$� �~������%�"��������$� �~���% � ��� ��"����$ �������$������$�� ������ ��!�"%��%�������� #����Administrative Science Quarterly��"��%����&�'����!�������!����~������������#��% ���% ��������� #����Academy of Management Review �"��%������'����!�������!���[[���������� \% � � �"�� ��$�� ��� ���'��� � �� ���� �!� ��# ��� ��#� �� � ���� #� ��� ]�$����� Communications of the ACM� � �' ���^ ������#���������%����% � ��"��]�$�������� �������% �#����������$�� ���!���� #������� ��!������"#��$��������%������ ��% ��������������� �����������% ���'�������$� �~��" ������!�$�#��%���� ��# ���% ���# ����� �� #�"��%�Wired Magazine��Lecture Notes in Computer Science�� Communications of the ACM�� ��#� Science�� ��% �� ��# �� "��%� '$�'� � ������ ����$# � Academy of Management Review�� Organization Science�� Journal of Management Information System�� ��#� Administrative Science Quarterly���%�"�����%����% � �%��%������ #�]�$�������� ������^ �����'���������$�� ���!���� #������� ��!������"#��$��������%������&���##��������% � �!�$��]�$�������� ���^��^ #�����% ������ � ���#����'��� ���%�"�����%������"#��$��������%������%�^ �� '�������� � � �����% ���� ���� � ���%�� �$��������% ������ � ���#����'��� � ���$��% ���� ���% � ��� �� ^ ������# ��"��%���� #���� ��� ����$� �~�����#���������%����% � ���# ��%�^ ��������������������$�����<��$����� �% � �$���� # � ������ !$������� �!� *�� _'�� � ��� " � ������ #� �% � ��'� !�^ � ]�$������ "��%� �% � ������ ��� ��������� �$����� �� ����$� ��������%�"��������$� �����% �]�$�����International Journal of Electronic Commerce�%����% ������� ������ ���%��@@�[����"��%��% �����������$����� ��������!�������@���#� �#����������~���%�"�����%����������������!� �$ ����� ��% #������� �����������$��#��'' #�#���������������� ���������~�\% �]�$�����Organization Science�%����% �� ���#������� ������ ���%���~�����"��%��% ���������� �$���� � �������� !���� ���@� ��#� �#���� ��� ���~�� �%�"���� �%��� ���� ��������� !� �$ ���� � ��% #� �@� ��� �� ��� ����� �$��#��'' #�#������������ ���� �������\% ��%��#���� �% �!�!�%�'��� ��� �GeoJournal��"��%��% ��$������� ���%��!���~���� Journal of Management Information System� �"��%� �% � �$���� ��� ���%� �!� �������� ��#� Administrative Science Quarterly� �"��%� �% � �$������� ���%��!���@~���
����$� �~��}�$�����*��*��������� �"����
��
� Liang & He
The17th International Conference on Electronic Business, Dubai, UAE, December 4-8, 2017 ��
����$� ����\�'���*�� #�}�$������"��%��% �_����� ���*��������<$�����
9����������;����� �����&��� � ������ �"��#���!���'$����% #������� ������ !� ������ ����� ����!��% ������� ����#��� ��%$��� ����� ���#��������!�������������%��� ��'������#� ��'���#������$����� ����� � � ���%� !� �#���� �"��#����"��#�� �"������������� ����% �'� ��� !��#��$��%��� � � ���%���'������#��% �!$�$� �#�� ��������!������"� #� �#���������$�et al�������� ��� ������� #��% ���'����� �"��#���� �\��� �~�����$�����*�� _'�� ���_��� ��% �� ���¢¢���"#��$�����������$� #�����% �� ���%�� �"��#�������������$�'��������%����% �� �"��#�¢¢���"#��$��������'' �� #������!� �$ ������������� �����% ��� �"��#��"��%���%��% ���'' ����� �!� �$ ��������$# ������ ��������������^����������������!�����������������# ���������������# ����������" ����������#�����"� #� �� ����� &�� � �����!�� ���������� �% � � ������ ��� � ������ !��#���� �%���� �������� ���!� �% �� �"��#����������� �%������� �$������#���������%����� �� ���\%��� ��#���� �� �%���'� ^��$��%���� � ���%���'����� ��� #�������� '������� � # ������#� �''���������� �!� �% � ���"#��$������ '���!���� %�^ � � �� ���#$����� ������� ��'������ � ��� � � ��� � ���� &�� ���������� �$�%�� �"��#�� ��� ����"� #� ��� ¢¢'������'��������� �' �!������ ��� �����^�������� ��#� ������ �� ��� �� �� %�^ � �� %��% �� � ����������"%��%��� ��������� ��� #������$#� ������$���� ����'������'������������"#��$������\%�����#���� ���%����% �� � ���%�!��$������% ����"#��$������ !� �#� %�^ � �%�!� #� !���� � � � �''���������� ��� �$���� �� � %�^����� ��#� �%��� �% � �''��������� �� ������ �!����"#��$������%��� `� �# #�!�����% �����������$��� ���� ����������'$������ ������ ��
\�<�/�~��\�'����� �"��#������% �*��"#��$������� � ���%��� �#�*��+����� ���� ���� 9������� *��+���� ���� ���� 9�������
���� ���� *��"#��$������ ��� ���� � �!������ ���� ��@� _��� �� �@� ���� *���� ����� �� ���� ��� &���^������ �@� ��@� ����^��������� ��[� &�!��������� ��� ���� $��������� ���� = ����� ��� ���� �' ������^��������� ��� ��# �� ��� ���� ����� � ������ ���� � �� ��� ���� *���$�������� �@�� ���"� #� � ��� �� �������%����� ���� � �"���� ��� ���� &�� �� ��
�~� ���� �������'������ ��� �� �������� �%��������$���
����$� � [� ���$����� �� �% � � �"��#� ���"��#� � �"���� ���'������� �~@� ��# �� ��#� ���� ������ &�� ��� ������ � �%��� �% � ��'�������� �"��#������% ����"#��$������!� �#�" � ���� ������ #����� �������%�"��������$� �[���% � ��� ��%� ����� ������� ���$�� ������ ���$�� �� ��� ���� #� ��� �% �� �"��#� �����$������� �� � ��$�� �� ��� ���� #� ���� �"��#� �����^�������� ��#� ����% �� �� � ��� ���� #� �������"� #� �����#���������%�������^�������!�$� ������" ���������"� #� ��%����������% ����"#��$����������$�����%���� ��� �%��� �� � � ���%� ��'���� ��� � � ���� ����_�� � ������ ��$�� ��� ����$#���� �$�%�� �"��#�� ���� �"���� ��������� %�^�����%$�������������������#����"���������� ������ #�!���!�����% �� �� ���!��% ���'����#���������%������ �� "���'����� ��������'' �������% ����"#��$������� � ���%�!� �#���$��#�#�����'������#����������� �����% ��$�� ���� � ���%�#������ �
� Liang & He
The17th International Conference on Electronic Business, Dubai, UAE, December 4-8, 2017 ���
����$� �[��� �"��#�*�����#�� �"����
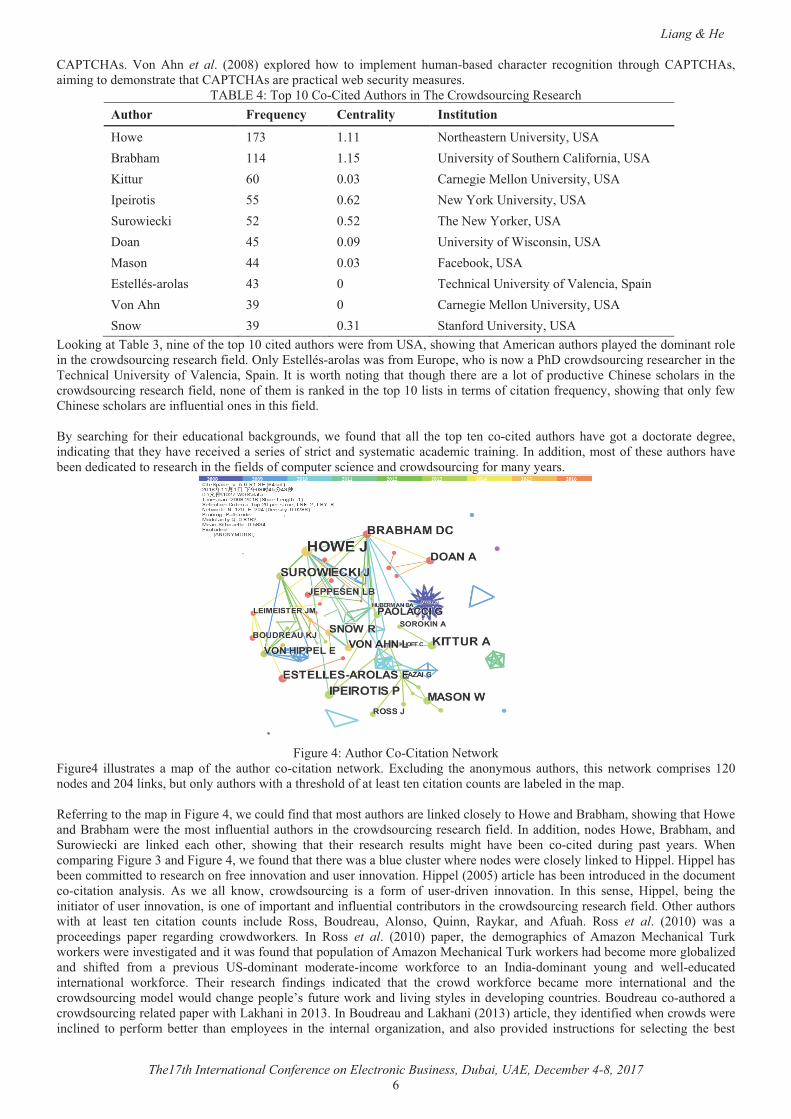
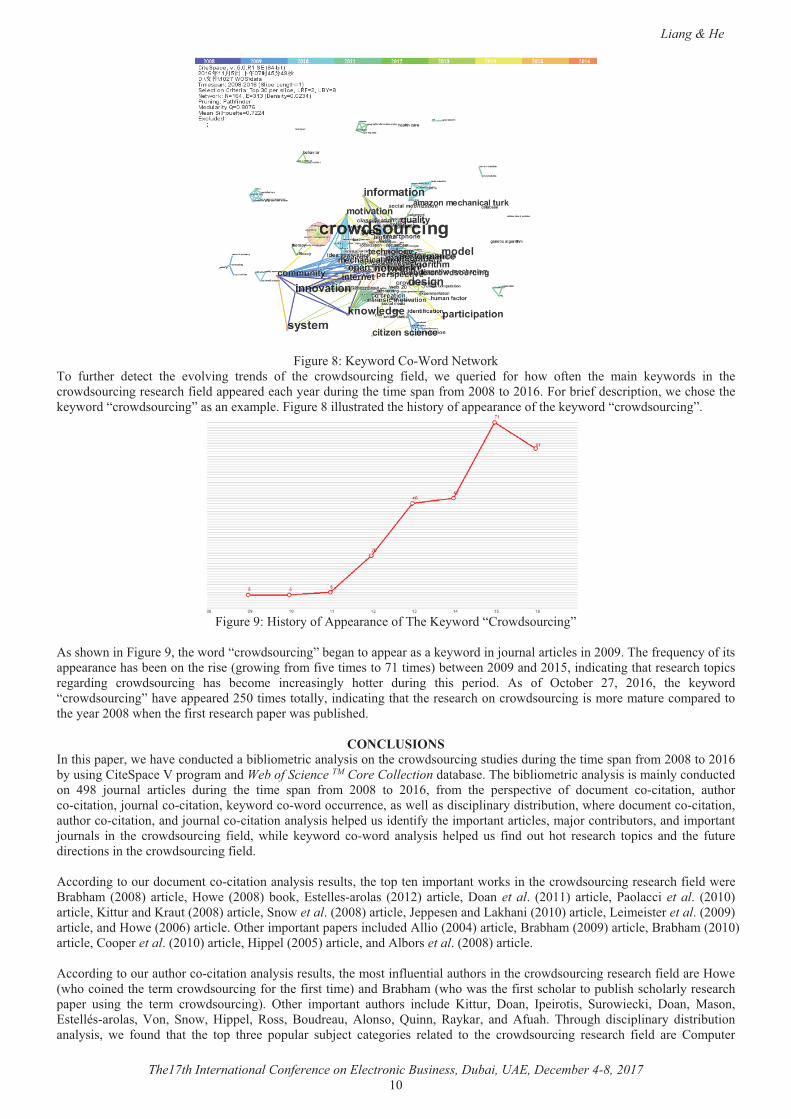
\�� !$��% �� # � ��� �% � ^��^���� �� �#�� �!� �% � ���"#��$������ !� �#�� " � �$ �� #� !��� %�"� �!� �� �% � ����� � �"��#�� ��� �% ����"#��$������� � ���%�!� �#��'' �� #� ��%�� ���#$������% ���� ��'���!�������[�������~�������� !�# ����'������" ��%�� ��% �� �"��#�����"#��$������������� `��'� ����$� �[����$����� #��% �%��������!��'' ����� ��!��% �� �"��#�����"#��$������� �
����$� �������������!��'' ����� ��!�\% �� �"��#��*��"#��$�������
�����%�"��������$� �����% �"��#�����"#��$�������� ��������'' ��������� �"��#����]�$����������� ����������\% �!� �$ �����!������'' ����� �%���� ������% ���� �����"����!����!�^ ���� ����������� ���� �" ���������#���������#���������%���� � ���%���'����� ���#���� ���"#��$������ %��� � ��� � ���� �������� %��� �� #$����� �%��� ' ���#� ��� �!� ����� �� ���� ���~�� �% � � �"��#�����"#��$�������%�^ ��'' �� #�������� �������������#���������%����% �� � ���%�������"#��$������������ ����$� ����'�� #�����% �� ������[�"% ���% �!������ � ���%�'�' ��"���'$����% #� ��
����&"������&���%���'�' ���" �%�^ ����#$�� #���������� ������������������% ����"#��$��������$#� ��#$������% ���� ��'���!�������[�������~����$�����*�� _'�� ���'���������#�Web of Science TM Core Collection�#������ �\% �������� ���������������������������#$�� #���� @�[� ]�$����� ������ �� #$����� �% � ��� � �'��� !���� ���[� ��� ���~�� !���� �% � ' ��' ���^ � �!� #��$� ��� ������������� �$�%����������������]�$������������������� �"��#����"��#����$�� �� �����" ������#����'�������#������$������"% � �#��$� �����������������$�%������������������#�]�$��������������������������% �' #�$���# ���!���% ���'������������� �����]����������$��������#���'�������]�$������ ��� �% � ���"#��$������ !� �#�� "%�� � � �"��#� ���"��#� ��������� % �' #� $�� !��#� �$�� %��� � � ���%� ��'���� ��#� �% � !$�$� �#�� �����������% ����"#��$������!� �#� �������#��������$��#��$� ������������������������� �$������% ���'�� ����'�������"���������% ����"#��$������� � ���%�!� �#�" � �<���%��� ����[�� ������ ����" � ����[�� ������/�� �� ��������� ������� ������ ��=����et al� ������� ������ �����������et al� ������������� ������$����#����$������[�������� ��_��"�et al�����[�������� ��} '' � ����#����%����������������� ��� �� ��� ��et al�������������� ����#���" �����~�������� ���% ����'�������'�' �������$# #�����������@�������� ��<���%���������������� ��<���%���������������� ��*��' ��et al�������������� ����'' ��������������� ����#��������et al�����[�������� �������#��������$���$�%������������������������� �$������% ��������!�$ �������$�%��������% ����"#��$������� � ���%�!� �#��� ���" ��"%������ #��% �� ������"#��$������!����% �!�������� ����#�<���%����"%��"����% �!�������%��������'$����%���%�������� � ���%�'�' �� $����� �% � � ��� ���"#��$������� ��% �� ��'������� �$�%���� ����$# � ����$��� =����� &' �������� _$��"� ����� =����� �������/�� ������������� ����� _��"�� ��'' ��� ������ <�$#� �$�� �������� $����� �������� ��#� �!$�%� \%��$�%� #����'������� #������$��������������� " � !�$�#� �%��� �% � ��'� �%� � '�'$���� �$�] ��� ��� ���� �� � ��� #� ��� �% � ���"#��$������ � � ���%� !� �#� �� � *��'$� ��

� Liang & He
The17th International Conference on Electronic Business, Dubai, UAE, December 4-8, 2017 ���
_�� �� �� *��'$� �� _�� �� � ��#� &�!��������� _��� ���� ��#� /���� ����� ��#� �%��� ���"#��$������ "��� ��� ��� �#����'�������� � ���%� !� �#� "%��%� ��^ ��� #����'��� �� �������� !���� ���'$� �� ��� �� �� �$��� ���� ����� � ���� ���� ����� ��� ��!������������ �� � \% � ]�$����� ������������ ��������� � �$���� �% "� �%��� Wired magazine�� Lecture Notes in Computer Science�� ��#�Communications of the ACM� " � � �% � �%� � #�������� ��$�� �� !��� ��� #� ������ �� ��� �% � ���"#��$������ � � ���%� !� �#� \% �� �"��#����"��#����������� �$����'��^�# #�$�������%���������% � ^��^������ �#���!��% ����"#��$������� � ���%�!� �#���%�"�����%��� �% � � � ���%� ��� ���"#��$������ %��� � ��� � ��� � ���$� � ��#� �%��� �% � � � ���%� !��$�� ��#� �''��������� ���' � �!����"#��$������%�^ �� ��� ���� � `� ���^ ���#�#�^ ���!� #�������!��$������������ �$����" � �'� � �� #������^��$���� #���#��$��������^ ����� �����$������% �!$���������!�*�� _'�� ����"%��%�����'��^�# ���^��$��� �� ! � �� �!����$�� �$ ���� � ���% ������% ����"#��$������!� �#� ����" ^ ��� ��� ��� "���%� ������� �%��� �$�� � � ���%� %��� ��� � ������������ ������� �$�� #���� ���'��� �� ����� ]�$����� ������ �� "��%�$�������# ����� ��% �� #��$� ��� ��' ��� "%��%� ���� ����%���� �!! ��� �% � �^ ����� ��������� � �$���� _ ���#�� �$�� ��������� � �$���� �� �����������$�� #�����% ��������!�� �������$�%�������������!� �$ ������#�� ����������"��%�$�������# ����������������% ����'���������#�����������% �*�� _'�� �\%��#��!������ �� ��^��$��� !! ����" ���� �� #��������# ��"��%���%��% ���%� �%��#�����% ���'����# ����*�� _'�� ����"%��%����� � �$��� ��� ������!� ��� �������# ������ &���$�� !$�$� � � � ���%��" �"���� ������$ � ��� !��$����� � � ���%���'����� ���#�������"#��$����������� ��%���� � ���%�!� �#������!������� "��� ����#��������!�� � ���%���'��������� �!$��% �� `'��� #�&���##�������" �"�������#$���������� �������������������% ��� � ���%�!� �#�����$�������� �!$���������!�*�� _'�� ��� ��
��9��;&$!<#$���\%��� "���� ��� �$''��� #� ��� ������ ���}�~������ �!� �% � �$������ �� ��#� _������ _�� �� � �$�#� �!� �% � ��������� �!� /#$��������*%�����
�$*$�$��$��£�¤� �!$�%�����\$����*����������*��"#��$��������������$��������#�������� ���%�Academy of Management Review���������
��������£�¤� ������� }�� ������ }� *�� �� � �^��� }� �� ����[�� � "� � ������� � �"���� '���#������ *���$���� �� �!� ��] ���^ ���
���"#��$�������"�������#��' ����$�� �International Journal of Information Management���[�������@�����£�¤� ��������}�����@��* ����� �^� "��\% ������ ���^ ���# ���!��' ������^������Strategy & Leadership�����@���@���£@¤� ������������ �� ����������*��"#��$������������$�������% �"�#���!����"#�����"����!�����$�&��Proceedings of the
ACM International Conference on Web Search and Data Mining��''�������*��������������*%������ ��$���������£�¤� <�$#� �$���}������%���������������>������% ����"#�����������^������'���� ��Harvard Business Review�����@���~��£~¤� <���%��� =� *� ����[�� *��"#��$������ ��� �� ��# �� !��� '���� �� ���^����� ��� �����#$������ ��#��� �� Convergence the
International Journal of Research Into New Media Technologies���@�����������£�¤� <���%��� =� *� ������� *��"#��$������ �% � '$����� '������'������ '��� ��� !��� '�������� '��] ���� Planning Theory�� [�����
�@���~��£[¤� <���%���=�*����������^�����% ����"#�����%� �#� ���Information Communication & Society�����[����������@��£�¤� <$ ��� �� �� ������� �� ���� ������ ��� ���$� � � ^� "� �!� ���"#��$������ � � ���%� !���� �� %$���� � ��$�� � ����� � ���
' ��' ���^ � &�� Proceedings of the Hawaii International Conference on System Sciences� �''� @~���@~�[�� �&*_*����"�����>_���}��$������[� �
£��¤� *������ ��� *�$������ }� ��� �� ��^��� � �� ������� *��"��#� ��������� ��� �� ����� !��� # ��������� �% � � �"���� �!� ��� ���������� �" ����������#�� �%����������� � ���%��\% ���� ��!�'���� ���% �������Scientometrics�����������������
£��¤� *% �� *� ������� *�� �'�� � ���� = � ������ ��#� ^��$�������� � ������ �� �#�� ��#� ������ ��� '��� ���� ��� ��� ���!��� ��� ���$� �Journal of the China Society for Scientific & Technical Information�����������������
£��¤� *% �� *� �� *���� �� ������� \������������ �% � ��� ���$� � �!� %�' �� `��� �$�%��� ������������ ��������� ���[�¥���[�� &��Proceedings of the Tenth ACM Conference on Hypertext and Hypermedia: Returning To Our Diverse Roots: Returning To Our Diverse Roots��''����~����*���=������#���� �������� ��$���������� �
£��¤� *��' �� _�� �%����� ��� \� $��� � ��� <��� ��� }�� � � }�� < � �� ��� � �^ �!��� ��� <�� �� =�� ��'�^�¦� ��� �� ���� ��� ����������� #�������'��� ������$��$� ��"��%����$���'��� ������� ���� �Nature��@~~����������~�~��
£�@¤� =���� �� ��� ��������%���� ��� �� ��� ^�� �� �� ������� *��"#��$������ ���� ��� ��� �% � "���#�"�# � " ��Communications of the Acm���@�@���[~��~�
£��¤� /�� ������������ /� ������� \�"��#�� ��� ��� ���� #� ���"#��$������ # !�������� Journal of Information Science�� �[������[������
£�~¤� � ���}����������������������$�^ ��������"#��$������Chinese Journal of Computers���[�������������~�£��¤� � � �����������"� #� �#����^ ����%��$�%����"��#����������Library Trends��@[������������£�[¤� ��'' �� /� �� ������� = ������������ ����^������� \% � ^��^���� '% ��� ���� �!� $� �� ����^������ Journal Für
Betriebswirtschaft���������~���[�£��¤� ���� ���� ��� _%�%��� ��� �%��'� ��� \������ }�� �� ���� �� ������� *��"#��$������� �� ��`������ ��#� ���� ������ ��''����
��$#��Computer Science Review��17��@��~��£��¤� ��" �}�����[��Crowdsourcing: Why the power of the crowd is driving the future of business��*��"��<$��� �������£��¤� ��" �}�����~��\% ���� ��!����"#��$������Wired���@�~�����~��[��£��¤� �$�*�����$�}��������������%�����������������]�$���������������������������!�����������#���!������������ �� ����
�%����Scientometrics��[~�����~���~���£��¤� &' �����������������������������% ��������� �%��������$������� �'��� �XRDS����������~����
� Liang & He
The17th International Conference on Electronic Business, Dubai, UAE, December 4-8, 2017 ���
£�@¤� &' ���������������^��������������}�������� $����������� � �������������� �%��������$���&��Proceedings of the ACM SIGKDD Workshop on Human Computation��''�~@�~����*������%�������=*��>_���}$���������
£��¤� } '' � �� �� <� �� ���%���� �� �� ������� ������������ ��#� '���� �����^���� !! ���^ � ��� ��� ����#����� � ���%�Organization Science����������������~������
£�~¤� ����$�� �� �� ���$�� �� /� ����[�� ���� ������ �% � "��#��� �!� ���"#�� ��� "���' #��� $������ �%��$�%� ����#�������� &��Proceedings of the ACM Conference on Computer Supported Cooperative Work� �''����@~���*���_���=� ����>_�����^ �� ��[���� �
£��¤� � � �� *� �� _$� �� �� ������� &�^ ���������� �% � ���$��$� � �!� � ������� ����^������ ���� �� � � ���%� �%��$�%� � �"��#�������$�� �� ���#��������� �"�������������Innovation Management Policy & Practice����������~�@��
£�[¤� � �� ��� ��}�����$� �����<� ���%� �# ��>��������������������� ^ ����������"#��$�����������^�������$''����������'�� ����!��������� #��# ������' �������Journal of Management Information Systems���~�����������@�
£��¤� � �# �#��!!����������_����������� ��$� ����$�%��������������������������#���!����������% ����Journal of the American Society for Information Science & Technology���~������~������
£��¤� ��$� �� ������� ���$�������� �% � ��� �� ��$��� ���$��$� � ��� $����� ��$#� ��� �� ]�$����� ������������ ��������� ������������Scientometrics��~�������[��@���
£��¤� ��$�������������$������=$�!��#�������������$���������% ���� �� ��$������$��$� ���#� ^��$������!�����^���������� ���� � ���%����������� ��������������Scientometrics����������������[�
£��¤� ����������_$���_��������*��#$������� %�^������� � ���%�������������� �%��������$���Behavior Research Methods��@@����������
£��¤� � �$�� _� ��� ���% #� �� ��� �� ������]��� �� ����[�� \% � ��� �� ��$��� ���$��$� � �!� �% � ����� ���� ����� � ��� !� �#�� ����$�%�����§������������������Strategic Management Journal���������������~�
£�@¤� ������������*%��#� �� }���� &' ����������� ��������$������ `' ��� ����$����� �������� �%������� �$��� Judgment & Decision Making��������@���@���
£��¤� $������}���< # �����<�<���������$�������'$����������$�^ ����#���`�������!������"����!� �#�&��Proceedings of the International Conference on Human Factors in Computing Systems�� �''� �@����@�����*��������$^ ��� *���#������������ �
£�~¤� ���������*���$�_���%������������# ��������������*��<������������������������� �������!�������"#��Journal of Machine Learning Research�������������������
£��¤� ����� }�� &����� ��� _��� ����� �� _�� ���#�^��� ��� �� \��������� <� ������� �%�� �� � �% � ���"#"��� ��¨�� _%�!�����# �����'%���� ��� � �%������� �$��� &�� Proceedings of the International Conference on Human Factors in Computing Systems��''��[~���[�����*���� �������>_����'���������� �
£�[¤� _��"� ��� �©*������ <�� }$��!���� =�� �� ��� �� �� ����[�� *% �'� ��#� !�������$�� ��� ��� ���#¨�� /^��$������ ���� `' ��������������� !������$���� ����$�� � ������ &��Proceedings of the Conference on Empirical Methods in Natural Language Processing��''���@��~����*�����"�����>_�������� �������� �
£��¤� _$��"� ����}�����~��\% �"��#����!����"#����%���% �������� ������ ���%����% �! "���#�%�"����� ���^ �"��#����%�' ���$��� ���� ������ ������� �� �����#���������Personnel Psychology�����@����[���[��
£@�¤� \���������$�������$�*����������}�$���������������������������!�� �����#$�������� ���$� �Scientometrics��������������
£@�¤� �����������$� ��<�������� ��*������%���=����<�$��������[��� ��'��%����$������� #��%����� ��� ����������^���" ��� �$������ ��$� ��Science�������[������@~��
£@�¤� �%�� ���=�������������� ����[�����$����������#����'��� ������$�%�������������������������!� ��!������������ �� ������¥�����Journal of the Association for Information Science and Technology��@��@�����������
£@�¤� �%��������%���������\$������������� � ���%�� ^� "�������"#��$������Science & Technology Progress & Policy�����~�����@��~��
��
Wang, Z.H., Peng, Z.L., Gui, X.L. & Ding, C. (2017). Acrowdsourcing mode of tourism customization based on sharing economy. In Proceedings of The 17th International Conference on Electronic Business (pp. 13-19). ICEB, Dubai, UAE, December 4-8.
Wang, Peng, Gui & Ding
The 17th International Conference on Electronic Business, Dubai, UAE, December 4-8, 201713
A Crowdsourcing Mode of Tourism Customization Based on Sharing Economy
Zihao Wang, Quanzhou Normal University, Quanzhou China, [email protected] Peng*, Quanzhou Normal University, Quanzhou China, [email protected]
Xiaolin Gui, Quanzhou Normal University, Quanzhou China, [email protected] Ding, Quanzhou Normal University, Quanzhou China, [email protected]
ABSTRACTChina’s latest innovations of Internet Economy are partly reflected in video living broadcast, shared bicycles etc. In recent years, tourism industry in China obtains rapid development by utilizing Internet. However, it is still difficult to meet the growing tourist demands. In order to solve this problem, in this paper, we put forward a Tourism Crowdsourcing Model (TCM), which utilizes the public creativity to meet the increasing demands for personalized tourism. Firstly, the main problems of thetourism industry are analyzed. Secondly, the pattern of TCM is elaborated, and a matching algorithm between the tourist requirements and the workers’ abilities is well designed to find the qualified service providers efficiently and accurately. Finally, an example is given to verify the feasibility and effectiveness of the TCM based on shared economy. The results shows that TCM has some significant advantages to satisfy the tourism personalized needs by motivating the public to participate in the tourism industry initiatively.
Keywords: Sharing Economy, Crowdsourcing, Tourism Customization, Best-Matched._____________________*Corresponding author
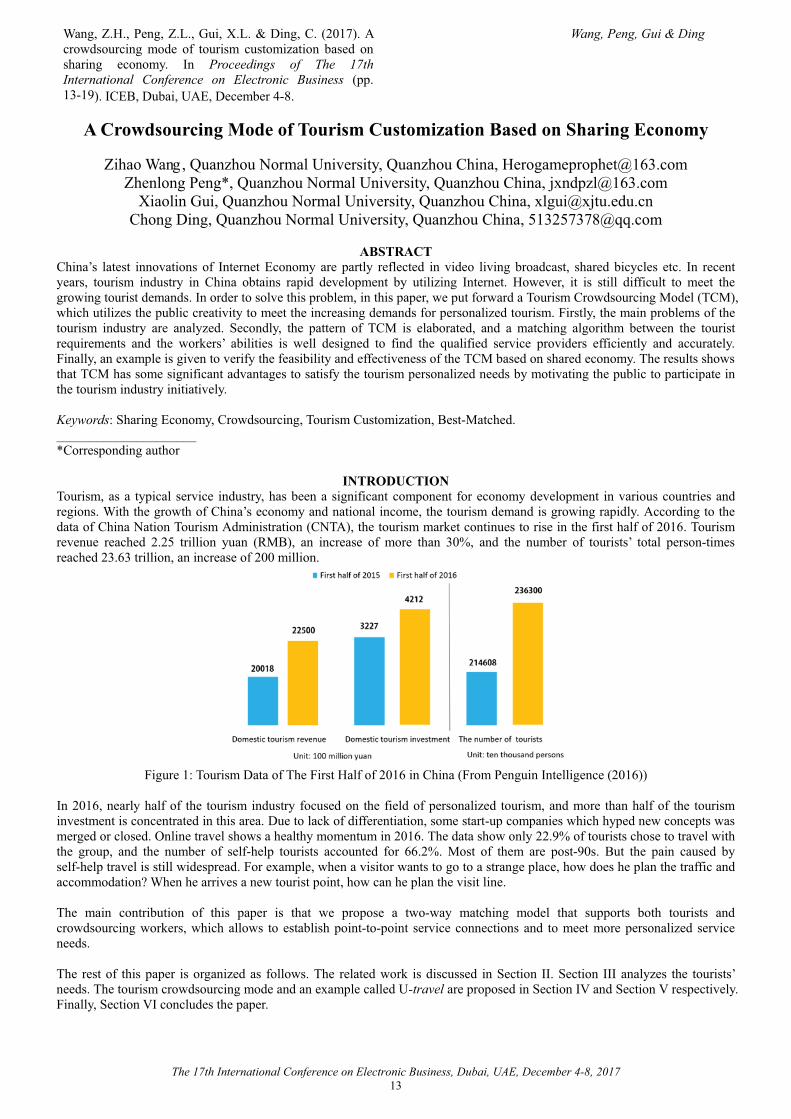
INTRODUCTIONTourism, as a typical service industry, has been a significant component for economy development in various countries and regions. With the growth of China’s economy and national income, the tourism demand is growing rapidly. According to the data of China Nation Tourism Administration (CNTA), the tourism market continues to rise in the first half of 2016. Tourism revenue reached 2.25 trillion yuan (RMB), an increase of more than 30%, and the number of tourists’ total person-times reached 23.63 trillion, an increase of 200 million.
Figure 1: Tourism Data of The First Half of 2016 in China (From Penguin Intelligence (2016))
In 2016, nearly half of the tourism industry focused on the field of personalized tourism, and more than half of the tourism investment is concentrated in this area. Due to lack of differentiation, some start-up companies which hyped new concepts was merged or closed. Online travel shows a healthy momentum in 2016. The data show only 22.9% of tourists chose to travel with the group, and the number of self-help tourists accounted for 66.2%. Most of them are post-90s. But the pain caused by self-help travel is still widespread. For example, when a visitor wants to go to a strange place, how does he plan the traffic andaccommodation? When he arrives a new tourist point, how can he plan the visit line.
The main contribution of this paper is that we propose a two-way matching model that supports both tourists and crowdsourcing workers, which allows to establish point-to-point service connections and to meet more personalized service needs.
The rest of this paper is organized as follows. The related work is discussed in Section II. Section III analyzes the tourists’needs. The tourism crowdsourcing mode and an example called U-travel are proposed in Section IV and Section V respectively. Finally, Section VI concludes the paper.

Wang, Peng, Gui & Ding
The 17th International Conference on Electronic Business, Dubai, December 4-8, 201714
RELATED WORKCrowdsourcing, which was proposed in 2006 by Howe, J. (2006), has been a significant way to solve some problems thatcomputers have trouble with, such as image labeling/classification, natural language processing, or document writing.Individuals can play two different roles within Crowdsourcing: task requester or task worker. There exist an increasing number of researchers studying reviews and ratings behavior in tourism markets based on crowdsourcing. Wu and Wei (2010) proposea system called Opinion Seer, which enables an interactive visualization by analyzing large volumes data of hotel reviews.Cresci and D’Errico (2015) present a review model which can analyze tourists’ opinions and provide a map-based visualizationof sentiments expressed, thus, enables tourists to identify areas of interest. Leal and González–Vélez (2017) present a model, which extracts meaningful information from textual reviews based on Semantic Similarity to identify relevant recommendations. And then a data mining method is employed to automatically discover an interesting destination for thetourists. Borras and Moreno (2014) and Gavalas and Kasapakis (2013) present an intelligent tourism recommender survey about the tourism resources. A questionnaire/form-based approach was employed by Tiwari and Kaushik (2015) to collectcrowd-sourced information, in which, the method specifically relies on updated information to enrich the list of recommendations. Gabr and Abdennadher (2015) propose a game to provide useful information to tourists, which motivates locals to share their historical sceneries with the tourists. When the participators play the game, the information and data about the visited places is collected. Leal and Dias (2016) propose a tourist-centered off-line and on-line analysis system by utilizing positive and negative ratings and reviews, which discovers relevant trends of tourists. At the same time, Multiple Linear Regression is employed to identify the most significant factors that influence tourists’ behaviors. Tiwari and Kaushik (2014)explore a recommender prototype system to predict interesting locations by using crowdsourcing approach. The information in the system include right time to visit, weather conditions, traffic condition, right mode of transport, crowdedness, security alerts, etc.
These related works mainly focus on the recommendation method by analyzing the reviews and ratings collected by crowd individuals. However, these studies do not take full account of the tourists’ activities. In order to find tourists’ trends and patterns more precisely, we, in this paper, combine both the tourists’ requirements and the workers’ abilities, and enable the tourists and the workers to achieve the best match.
ANALYSIS OF TOURISTS’ NEEDSAlthough the output value of China's internet tourism industry has gradually improved in recent years, there still exists a lot of deficiencies such as asymmetric information, market disorder without standard, market no-equilibrium, and loss of culture etc.We analyze the problems as follows.
Poor Tourists’ Experience Market disorder (e.g., high commission rebate and virulent price war), and market non-equilibrium lead to many problems.Prawns with high price in Qingdao sparked a bitter public debate on social media. The root cause is lack of government supervision and high-quality tourism products. Moreover, team tour must strictly control the time and range of activities.
Other applications, which are based on knowledge payment such as Zhihu and Fenda, are becoming more and more popular.The confusion of information influences the tourisms’ demands and behaviors. Professionals, who have a great mastery on specific skill, are badly needed to help people in need.
Finally, it is travel enthusiast that need to pay attention the problem How to play influence of travel experience. We share ourtravel experiences through photos and travel notes at present. Diversified travel experience sharing path promote the user’s next travel decision and enhance travel experience. If we can gain profits through past travel experience, it can be beneficial to develop the tourism industry.
TuNiu (2015) released The 2017 online travel market trends forecast report, which pointed out that the domestic tourist attractions will deepen the thematic trends, including honeymoon tours, family tours, study tours and so on. With the 2022 Winter Olympics approaching, Snow tour is becoming the trend during the Spring Festival of 2017. Wang Qingsheng saidtourism enterprises should pay attention to the participation, innovation and challenge of the project, and provided high quality and innovative service for tourists.
Insufficient Business ResponseAt present, most national A-class scenic spots rely on ticket receipts, and they are lack of shocking entertain project. It is unable to meet the demand of visitor, and it can’t get a part of value-added profits. The following table is a survey about the independent travel, the samples come from a college student tourism club.
TABLE 1: RESULTS OF A SURVEY ON THE INDEPENDENT TRAVELReasons for independent travel Question for independent travelFree choice route 42% Safety risk 50%Time free adjustment 38% Unable to resolve product order issues 18%Avoid transactional disputes 16% Difficult planning 28%Convenient travel with friend 4% No travel companion 4%

Wang, Peng, Gui & Ding
The 17th International Conference on Electronic Business, Dubai, December 4-8, 201715
The enterprise makes little innovation in the E-travel business model. Relying on pattern innovation can improve tourist experience and promote industry reformation more or less, and the innovation will break the traditional profit model and introduce a diversified development mechanism. On the other hand, different industrial standard and the lack of professionals are also the reasons that the customized tourism industry cannot develop rapidly. Generally speaking, there is still a great prospect for this industry.
A report from YiGuan (2016) called “Topic analysis of China's online Independent travel trends 2017” shows that highdemand service begins from customized travel such as travel agency service, intelligent tools, customization by travel master, and planner + route tour etc.
Strong Needs of Tourism PersonalizationThe travel purpose has changed from fixed travel lines and scenic spots to customization pattern. As a result, numerouscustomized travel applications appeared to help users complete the travel. Especially, the year of 2016 was called "the first year of customized travel". However, customized tourism in the perspective, some experts point out that there are still problems such as asymmetric information, fuzzy personality and high cost. Among them, the weight of customized function of Ctrip is still low. But in sharing economy, customized services enable tourists to reduce cost and obtain better experience, the pattern is accepted by more and more people.
Tourism Socialization TrendsOver the past few years, the UGC (User Generated Content) community has been fully developed, such as China’s “Ma fengwo” and “Baidu tourism”. Self-media channel is the first pipe-line for most people to share photos and experiences. Takemicro-blog as an example, topic "Traveling with micro-blog" has reached over 60 million of the reading amount. Thus, the development of Online Community has gradually influenced the idea of consumers.
TOURISM CROWDSOURCING MODE ANALYSISModel Design of Tourism CrowdsourcingCrowdsourcing, the concept originally proposed by the American Jeff Howe, is an activity that distributes tasks to non-experts, and in the past these tasks were done by internal staff. Tourism Crowdsourcing Model is a route planning service based on Internet Crowdsourcing. It fully mobilizes the Master who has the ability to plan a trip to help complete the route planning for user. There are two reasons for the development of custom crowdsourcing mode. First, the age of content paying arrived. Logic Show, a network program directed by Luo Zhenyu, has benefitted from content paying model. Meanwhile, its success is counterproductive to the development of the content paying industry. Second, the sharing economy is growing rapidly, it makes each Internet users involved in sharing line.
The sharing economy was proposed by Marcus Felson and Joe L.Spaeth in 1978. Robin Chase points out “everyone shares the best ability to integrate individuals and businesses, and the essence is the efficient use of each resource and each stakeholder. "Organization" can bring advantages to the industry (Need a larger scale and a lot of resources), and "individual" can bring individual advantages (localization, specialization and customization)” in the Peers Inc.: How People and Platforms Are Inventing.
Unlike intelligent route planning, Tourism Custom Crowdsourcing Model will make enterprises to help users maximize the experience of urban folk cultures in minimized costs (reduce the cost of data accumulation). Zhang Ping, the founder of the World State, said that the key to reducing the cost of customized tourism is the sharing economy "Big Data+ Master Crowdsourcing".
Given the characteristics of youngsters who pursue freedom, seek challenges and make friends extensively, it becomes a reasonwhy users choose the custom platform in the future to expand social relationships through customized travel platforms. And custom crowdsourcing mode, mutual travel, and local guides have provided young people a channel to communicate with each other. We have reasons to believe that models are bound to be welcomed by the crowd.
Optimizing the Evaluation MechanismSince the model requires an objective evaluation of human ability, it is crucial that we optimize the existing evaluation system.For the same type of product exist drawbacks, "U-travel" will get comprehensive evaluation with a combination of factors(include service levels, platform interviews, and district capabilities). Then, based on the Analytic Hierarchy Process (AHP proposed by T.L. Saaty of University of Pittsburgh, is a multi-objective decision-making analysis method of combination of qualitative and quantitative analysis), the final score is determined. Hence the platform has been evaluated in a comprehensiveand relatively objective way. The final score is a function which takes AHPcoefficientT and BaseS as variables. A variety of correspondence rules can be considered, we present a simplest method here.
tS ( , )� � �otal AHPcoefficient Base AHPcoefficient Basef T S T S (1)

Wang, Peng, Gui & Ding
The 17th International Conference on Electronic Business, Dubai, December 4-8, 201716
Where _ _ _ _ _ _1AHPcoefficient
( )5
nS Speed S Speed S attitude S attitude S quality S qualityi
S k S k S kT
n�
� � � � �� � (2)
1S speed S attitude S qualityk k k� � �� � � (3)
AHPcoefficientT - represent the overall level of service, Allk - represent the weight of the index and assign by the rule of AHP, S-
give a mark by user(S ranges from 0~5, hereinafter the same), n- the number of users participating, AHPcoefficientT and Allk will be normalized, ranges from 0~1.Where
Base Activity Activity System System Regional RegionalS S k S k S k� � � � � � (4)
1activity System Regionalk k k� � � (5)
BaseS - represent the basic indicator of ability, Allk - the same as above, ActivityS , SystemS and RegionalS - represent the base score for each part: Self-media Activity is evaluated by the system according to the ranking ratio (factors include the number of fans, visitors and like), system score reference video interviews and online test scores(video interviews tested people's practical ability and service attitude, online testing focuses on the basic capabilities of some people's route planning), regional scores are determined by factors such as residence and local travel days divided into 1-5 grades and given grades.We assign values based on the T.L. Saaty's 1~9 scaling. As the matrix shows, service quality is more important than service speed etc.
TABLE 2. JUDGMENT MATRIX
1.0000 0.3333 0.14293.0000 1.0000 0.20007.0000 5.0000 1.0000
Speed Attitude Quality
Speed
Attitude
Quality
S S SSSS
1.0000 0.1429 0.20007.0000 1.0000 3.00005.0000 0.3333 1.0000
Activity System RegionalActivitySystem
Regional
Then, according to the matrix calculation method, the corresponding weight values are as follow.
TABLE 3. RESULT OF WEIGHT VALUE
_S speedk 0.0810 Activityk 0.0719
_S attitudek 0.1884 Systemk 0.6491
_S qualityk 0.7306 Regionalk 0.2790
EXAMPLE—U-TRAVELWe design a tourism application to reflect the final conclusion of the paper.
"U-travel" is a mobile Internet product which helps tourists enjoy personalized travel in low cost by sharing-economy model. The Service of Customization by travel master is the core function of U-travel, and the local tour guide and mutual travel patterns is the direction of subsequent versions. On the other hand, we will promote user's actual communication between usersand travel masters through the self-media platform, and reduce travel costs by integrating internet shared-product.
User login
Select custom services Post Your WANT
Master accept Initial communication
Satisfied Confirm order and pay
Second communication Finished Service accessorial service
Travel plan
Remodify
User evaluationtermination
YESNO
FIGURE 2: User Operating Flowchart
The matching process is as follows,1 Fill in travel places, dates, and select the rank of Travel Master,2 Match the Master through the system (Travel Master's information has been previously recorded in the database),3 Screen out qualified Master (factor: class and region),

Wang, Peng, Gui & Ding
The 17th International Conference on Electronic Business, Dubai, December 4-8, 201717
4 Complete the customized services.
Project CorePersonalized TravelAccording to the foregoing analysis, we have come up with this view: "U-travel" is a requirement-oriented product, instead of product-orientation. Through excavations of tourist demand, we adjust the route planning as the core. The platform assigns the customized task to the travel masters, and they will complete the customization task, as well as guide users to purchase the traveling products and to use comprehensive sharing-service. In the profit model, the platform gains a commission on the service charge.
In addition, local guides and mutual travel are personalized tours model based on the F2F (Face-to-Face) way. The model of locals guides, which led by a tour guide, go deep into the local lanes and experiences different urban cultures. Mutual travel pays more attention to the social intercourse, and how to facilitate the willingness of both sides to travel is the practical problem for the platform.
Sharing PlatformNowadays, a lot of sharing platforms, such as live platform and content sharing platform, gradually accumulated paid users for the core service. "U-travel" is an operation pattern of information sharing. Masters earn money by sharing information. For users, core service means low-cost customization trips. And it will try to integrate a variety of sharing platforms, such as housing sharing and car sharing. Users can enjoy the entire sharing service on a single platform. "U-travel" also includes sharing life skills, for example, local people cooked the featured local food for tourists. A long-term project is skill paid courses, such as the ZhiHu’s paid column.
Tourism Social ContactThe self-media platform is a way for masters to show themselves, it will help Masters to improve their influence. Fan economy attracts users to attempt the function and enhance user stickiness. Users can publish their own travel tips, travel raiders, anti-cheat guidelines, and establish relationships with other travel enthusiasts. Social networks between users and users, users and Masters will meet their basic social needs.
Data Preparing and ExperimentWe simulated a case which based on a custom trip to Xiamen: A user submitted custom requirements of Xiamen, and there are five Masters involved in the matching activity. For example, we chose Master A to calculate the final score. The all K value in the case is derived from the preceding part of the paper. We analyzed the data from 10 users, and the results are as following(all data are simulated):
TABLE 4: THE CASE ABOUT THE SERVICE COEFFICIENT
Master ASpeed Score Attitude score Quality score
Score_S speedk = 0.0810 _S attitudek = 0.1884 _S qualityk = 0.7306
User No.1 4 4 5 4..731User No.2 3 3 4 3.731User No.3 4 4 4 4.000User No.4 4 4 3 3.269User No.5 3 4 4 3.919User No.6 4 3 4 3.812User No.7 2 3 5 4.380User No.8 4 4 5 4.731User No.9 4 5 3 3.458User No.10 3 4 5 4.650Final score 4.068standardization 0.814
The same approach applies to other masters, and we calculate the final score according to the model.
TABLE 5: THE CASE ABOUT THE FINAL SCORE
Master Servicecoefficient
Activityk =0.0719 Systemk =0.6491
Regionalk =0.2790 Final scoreFans Visitors Like Video
InterviewsOnline Testing
0.7306 0.0810 0.1884 0.8750 0.1250A 0.814 4 4 5 4 5 5 3.56
Wang, Peng, Gui & Ding
The 17th International Conference on Electronic Business, Dubai, December 4-8, 201718
B 0.760 4 5 4 4 5 4 3.11C 0.822 3 5 3 3 4 3 2.54D 0.741 2 2 4 2 3 2 1.56E 0.682 2 3 2 3 4 1 1.68
Finally, we got the final score about the five Master. If we define the intermediate Master with standard score ranging from 3-4, the Master A and B will be intermediate Master. However, according to the experimental situation, there are many deficiencies. The coefficient has a substantial effect on the base score, so that the deviation is too large to ignore. In the worst case, all results are not up to the standard of Senior Master. Maybe, some additional parameters should be included to build a better evaluation model in the future.
SUMMARYIn this paper, we propose a best matched model between tourists’ requirements and workers’ abilities based on crowdsourcing mechanism. On one hand, the model collects the workers’ historical records such as location, specialty, and historical reviewsetc. On the other hand, the model enables a tourist to distribute his tourism demands. In this paper, a two-way interactive system is constructed, which finds out the most suitable tourism worker for the tourism requestor, and then gives the best information or advice such as right time to visit, weather conditions, traffic condition, right mode of transport, crowdedness, security alerts, etc. The experiment results demonstrate that our model can work efficiently. In the future, the integration of multi-dimensional data will be introduced, thus, the recommendations can be achieved more accurately. At the same time, incentives and privacy protection mechanism also need to be seriously considered in the following researches.
ACKNOWLEDGMENTThis research was supported partly by the following fund projects:
1 Natural Science Foundation of China (No. 61172090,61472316,61502380)2 Key projects of science and technology plan in Fujian province, "Key techniques of task assignment and results
collection on mobile crowd sensing based on trustable interaction "(No.2016H0029)3 Projects for Young Teacher in Fujian province 2015: “Research on Integration development of Mobile E-commerce and
Inner location based on iBeacon” (No. JA15401). 4 Key Projects of Quanzhou Technology Bureau in 2012 and 2013: “High Educational Engineering Research Center of
Fujian Province for E-Commerce Intelligent Based on Cloud Computing and Internet of Things” (No. 2012Z102, 2013Z123)
5 Quanzhou Federation of Social Science Circles, Fujian China, under Grant 2017D07.6 College Students Innovation and Entrepreneurship Training Program of Fujian Province (No. 201610399042)
REFERENCE[1] Analysys (2017). Topic analysis of China's online Independent travel trends 2017. Retrieved from
https://www.analysys.cn/analysis/8/detail/1000 (September 17, 2017).[2] Borras, J., Moreno, A., and Valls, A. (2014). Intelligent tourism recommender systems: A survey. Expert Systems with
Applications, 41(16), 7370-7389.[3] Gabr, F. M. and Abdennadher S. (2015). Walk like an Egyptian: A serious, pervasive mobile game for tourism. In
Proceedings of the 11th International Conference on Mobile Learning, ML 2015, (pp. 104-108). IADIS, Madeira, Portugal, March 14-16.
[4] Gavalas, D., Kasapakis, V., Konstantopoulos, C., Mastakas, K., & Pantziou, G. (2013, June). A survey on mobile tourism recommender systems. In 2013 Third International Conference on Communications and Information Technology (ICCIT), (pp. 131-135). IEEE, Beirut, Lebanon, June 19-21.
[5] Howe, J. (2006). The rise of crowdsourcing. Wired Magazine, 14(6), 1-4.[6] Leal F, Dias, J. M., Malheiro, B., and Burguillo, J. C. (2016). Analysis and visualisation of crowd-sourced tourism data. In
Proceedings of the 9th International Conference on Computer Science and Software Engineering, C3S2E 2016, (pp. 98-101). CINDI, Porto, Portugal, July 20-22.
[7] Leal, F., González–Vélez, H., Malheiro, B., and Burguillo, J. C. (2017). Semantic profiling and destination recommendation based on crowd-sourced tourist reviews. In Proceedings of the14th International Symposium on Distributed Computing and Artificial Intelligence, DCAI 2017 (pp. 140-147). Springer Verlag, Porto, Portugal, June 21-23.
[8] Cresci, S., D’Errico, A., Gazzé, D., Duca, A. L., Marchetti, A., and Tesconi, M. (2015). Tour-pedia: a web application for sentiment visualization in tourism domain. Eurasian Journal of Forest Research, 29(2), 193-199.
[9] Penguin Intelligence (2016). Tourism data about the first half of 2016 in China. Retrieved from http://tech.qq.com/a/20160918/005483.htm#p=1 (September 27, 2017).
[10] Tiwari, S., Kaushik, S (2015). Crowdsourcing based fuzzy information enrichment of tourist spot recommender systems. In ICCSA 2015 (pp. 559-574). LNCS, 9158.
[11] Tiwari, S., and Kaushik S. (2014). Information enrichment for tourist spot recommender system using location aware crowdsourcing. Proceedings of the 15th IEEE International Conference on Mobile Data Management, IEEE MDM 2014(pp. 11-14). IEEE, Brisbane, QLD, Australia, July 15-18.

Wang, Peng, Gui & Ding
The 17th International Conference on Electronic Business, Dubai, December 4-8, 201719
[12] TuNiu (2017). The 2017 online travel market trends forecast report. Retrieved from http://b2b.toocle.com/detail--6385248.html (September 27, 2017).
[13] Wu Y., Wei F., Liu S., Au N., Cui W., Zhou H., and Qu H. (2010). Opinionseer: interactive visualization of hotel customer feedback. Visualization and Computer Graphics, IEEE Transactions on Visualization & Computer Graphics, 16(6), 1109-1118.
<�'��� � '����������������}��������# �$`���� ���������%����������' ��' ���^ ����# � ���������������#�� �^�� �# ��^ ���!��� ����� �������� # ^ ��'� ��� ��� ��'$�� � "� �$�� �� &��Proceedings of The 17th International Conference on Electronic Business� �''� ����[�� &*/<�� =$����� >�/��= � �� ��@�[��
Bopi-Kerepa, Hamilton & Prideaux
�
The 17th International Conference on Electronic Business, Dubai, UAE, December 4-8, 2017����
��%������� �'���(����>����!����� �����������>����!� �>���������������������!�>� �(������'(������<����
�� ��� �<�'��� � '���}�� ��*����>��^ �������\�"��^��� ���$���������� ��� ��'�� � '�{��]�$ #$�$�
}�%������������|��}�� ��*����>��^ �������*��������$���������}�%���������{]�$ #$�$��$��������# �$`��}�� ��*����>��^ �������\�"��^��� ���$����������$�������# �$`{]�$ #$�$�
����������
��'$��� "��$�� ��������%����^ ��[���#�!! � �������$�� ����$'��= � ��������������������������$ �����# ^��^ �!����� ��������^ ��� ���\%���'�' �������# �����^ ��� ���� �^�� �# ��^ ����%��$�%�# � �������������� �%��������������'��^���������#�������� ^ �� ��^ ��� ���� %�^ � �!� �� ���# �$�� ��� !�������� #� � �^�� � # ��^ ��� \% � ���@� =�������� = ^ ��'� ��� �$�%����� �� ���� #�'��^���������^ ��� ���� ���� ���'��� #�� �%$�� � #$������$� �$���������#��#����������^ �"����� �� ������� ��$��$������#� �������'�����������#�# ��^ ���������������� ��������� �^�� ��#�� ���������% �#��������� ^ ���
Keywords�� ��'$�� � "� �$�� ��� ������ � ^ �� ��^ ��� ���� � �^�� � # ��^ ���� #�������� # ^ ��'� ��� �$�%������� ����� ��������# ^ ��'� �������������������������|*��� �'��#�����$�%����
�����!"������_��� �'�����������# ' �# �� ������������'$��� "��$�� ����������# ^ ��'� ���� ������!��$� #��������' �'� ���#������'��^��������� #$�������� ����% ���%�� ���� � ������#���^ ����� ����� ���� �@�� ��!�����$��$� �� ���� �����'����� ��#� �~�� ����$���������� �������������\% �����#�<�������#�>��� #���������= ^ ��'� ������������>�=������~�� '������������������% �¢� ����# ^ ��' #������������� ���������������� ��"�����'���!��������#��������� ��%��$��������������� ��� ����������#�����#�^ �� ����$����� ��$�� ����!������� ������������������"��#���% ���##� ����#����^ ������$���$�#����'���!��������#��������� ��%��$�����\% ���� �^�������!�/��������*��'� `������ ��# ' �# ��� ����������� �^ ��� ���� #�������� �% �"���#���[��%� ���� ��� `'���� ���������/*����������'�������������^ �<���^����}��#����� �����&� ���#����� #�������#�����'���!��������#���������/��%���' ��� ����!��% �'�'$�������� ��# ���������� #���$�� #���'����'%� �������������� ����� ������#�����#��� ������ '� � �����^ ����$�^ � #�� �� �� ������ ����������� �^������� � ����� `��� ��� #��$��% ��� �$�%� �������� !��$� ��� ��� #�� �� %�^ � ���� �����'�� #� �������%� ^������������� �� #������� ���������$�'$�����#������$���� ��!������������ �����#����������'��^ #����������'������������� ��� '����������� # � ������� #� ��� !�$�� � ����'%����� � ������ ����'������� �" ���� '��^��� ��� �� � �$������$�� � ������<�$����^��� �� ��#� �% � ��������� *�'����� =�������� ���^������� ��^ ��� ���� ����� �'�" �� ��%� �$��$������#�^ �� � ��#�� ����'%�������#�^ �� �'�'$�������� ������������� ��% ����"���������������� �#�������� ���������� �#�����#�����������$�������/#�����������������&�� ���@�� ������ � %��%���%� #� �%��� �% � ��� ��# �� ���# �$�� ��� !�������� #� � �^�� �� ^��$ � # ��^ ��� � �� �� ������� ^ ����^ ��� ����������� ��� � �������% #����#��% ���� ��!��������^ #���"��#��� ������!������������!�^��$ �� �^�� ��# ��^ ���!���� �' ���^ ��������< �" ���������#��������������$����= ^ ��'� ���&�# `���=&�� ��������! ��� !������~�%� �������%� ��$����= ^ ��'� ���� '��������������$� ����%�"���%���'��������%���������'��^ #������!���������%��$�%�������~��>�# ������� ������ ��"� �=&�� '�'$������� ���"�%� ��� ���� ���$����� ��[� �������� ��� ����� ��� �~� �������� �'��] �� #�� ��� ����������������_�����������!!�� ��������\% � �� �����������������������!��$���!� #�%$����� ��$�� ������$#���������� ��% ��������% ���%�"��� �������� ���� ������#��@������� #����������&���� ����������������� �����#�������� �^�� ��������'�$�# #����������!��# �$�� ���!�����$��$� �� �#������"������ ������������^��� ���������% ����� ����$����'�'$��������$����������"��%���������������� ���� ���� �'�����$������#���#^����� #����'��^�# �������� �^�� ����&������#����� �$�� ����% �������$�$��# ���� �����=&���% �=��������= ^ ��'� ����$�%�������==���"��� �������% #�������@��==����������@��\% �==����������# ��^ ��� �^�� ��#�� ������%��$�%� �'�" ����� ��%�#������������% ���$�������\%���'�' ��'� � �������%����������' ��' ���^ ������������� �'������# ��^ ��������� �^�� ���%��$�%��% �'��� ����!�# � �������������

Bopi-Kerepa, Hamilton & Prideaux
The 17th International Conference on Electronic Business, Dubai, UAE, December 4-8, 2017����
���� ���# ' �# �� �&�������� �# #����#��"���� ����������% ���$���������� �'��������'��^����� �^�� ��^��$ �# ��^ ����%��$�%��% �==��� �%�������
����$� �����������=&�"���#�����������# `����$�� �� ?� ��
���
�$�@��$�@�&"$�!$&�@$�)�_ �^�� �# ��^ ��� ��$� �����#����#�� �^�� ��� ��%�' �'� �"��%������ �$����� �� �'���������!��� "�����%��$�%��
���� �������%�������������#� ��������������$��������#��$''���������!�����$��$� ������ �$��#����������$���������'��������#� �'�" ������% ������� � ��$�������% � �������$���������#��#�� ��$������ �������^ �'����� ��!�������� ������'�� ���!��"���!����#����#�� �^�� ����� �#�$� ����
��% � �� �^�� �# ��^ ����' ��� ������������'�� ���!��"�'��� ����%��$�%�����% � �#�$� ������ ��� ����� �^�� �̂ ��$ �� �"������$��%����������\�����$��������\%���� �^�� �^��$ �# ��^ ������� ������ ���# ��^ �����^��$ ���%����% ���#�^�#$��� �#�$� ��� �$�� ���&�� ����� � �^�� � # ��^ ��� ��� �� '��������� '��� ��� ������$���� "%��%� ���� � � ^� " #� ��� �� ���� �� ���� � �^�� � ^��$ � � �"����� ����'��������% �# ��^ ���� �%���������#��% ����������� #�� �^�� #�������$��������
!$�$����&��������&��# ^ ��'������$���� ��# � ����������������$���"% ������������ ������� #���^ ����� ����$��$� ����#����� ����� �#��' �� #������" ��� ^ ���$�%����� ��� � �# � �������������� #������$� ����� �� ��������^ ��� ���!$����������#�'�" ��������" ��� ^ ����������^ �������$�%����� ��\%���#��' ������!�!$����������#�'�" ������������� �^�� �̂ ��$ �� �"�������� �%��� ��% �'��� �� �����"%��%��' ��!���� �^�� ����^ ����#�$������ ���� ��%��% ����%�� �� �#�$� �����\% �����#�<���� ��$�#��������@����� ��� ���� � �% ����������^ �����# ^ ��'������������%�^ � ��� �'� #� ���# � ������� � ��� �'�" �����#�� �'���������� �������" ��� ^ ����!���^ ��� ���&���������� ������# � �������������� ��!��� #����������������"��#��# ������������^������%��#���<��#�����[��&��_�$�%��!������_�����������#�&�#�� ����# � �������������"������ �'��� ������������ �%���� ��#¡��� � ������� ���!������ &�� /��� ��� /$��' � ��#� �% � !��� �� _�^� �� >������ # � ������������� ��^ #� �������� ��"��#��'�����������#� �������� �����!�����������#��$�������&��*%�� ��>���#����#�*�� �#�&^��� ��# � ������������� � �$�� #� ������ ���'��^ � ������� �^�� �# ��^ ����_%�%���\%��'��������@��&���������� ��# � ���������������� #���� ��$�����# ����������������#��"� ��%�'��!�� �^�� �# ��^ ���� �� #�"��%� �#�$� �������% �������� ^ ����" ^ ������%�$�%�# � ���������������'����������$�� #��%��$�%� � �� #�'�������������#�'���������'��� �� ����#����������^ ���#�!������'��� ���'���� ���� �������$�#��������@����% ���������� #�� �!���^ ����������$������������% �/����� "�<�����������$������������������"%��%�����$# #�'������!�� "�&� ���#����#�<�$����^��� ���$�%����# ' �# �� ������� ��$���������%�������������! ����������&�# ' �# �� �������������� � #��% ����������������"�������^���������^ ��� �����������$�# ���% �����������!�# � ��������������"%��%� �������% #��" ������ �����\% �����" � ����� #�"��%�'��^�#��������� �%������#��������� �!�# � ����������������% �# ��^ ����!������������� ��������� �^�� �����#�!���<�$����^��� �������� �� �� ��������'������'��������#�������� �$��������% �<�$����^��� �*�'' ����� �����! �����������!����� ������!������*% �����#����#�� ����# !�� �# � ����������������¢�% ������! �����# � ��������!��% �� ������#�'����������$�%���������'�������� �# ����������#������ �'$�����!$��������!�����% �� ��������^ ��� �����#������� ��� �����!� �#����������������!��%�� ��� ��� ����$���#���� �$������!���^ ��� ����� ����$������$��'$��������'������������� �������# ^ ��'� ����$�%����� ����$������$����������^ ��� �������� ^ ���������^ ��� ������������������������^ ��� ���� # � ������� � !��� � ����'%������ �������� '���������� �������� ��#� �#����������^ � �#^����� �� �%��$�%� ������ ����$������������ ^ ����^ ��� ������#��#��������������&��# ^ ��'������$���� ����������" ���� ��� ������� ����'%�����! ��$� ���$�%������� ���#�$�# ��# ^ ��' #��������������$�����������#���!�����$��$� �!������� ��������$��#���# ���#�!���# � ���������������
Bopi-Kerepa, Hamilton & Prideaux
The 17th International Conference on Electronic Business, Dubai, UAE, December 4-8, 2017����
= � ������������� ����� !�������� �� �% � �#������������� �!� ���� �� �� "��%� �$��$���� ��#� ������� % � ��� � ����� ��#� ��� ���� '����� ���������� $����� ��� �������#������ # ���#�� !���� #�^ �� � ���$'�� !��� '��������� '������'������� ��#� ��� '��^�#���� ����� #�� �!���^ ��� ��� �%������� � ��� �^ �� �%��� �%��$�%� # � �������������� ��������� # ^ ��'� ��� '����� ���� ��^ � �#����������^ ������� ����� �#�$� ��� #���'���� ������#�'������� �����#����������^ �# � ���������������� ����% ����� ����������!��$�%������"��%����% �� ��������^ ��� ����'���������# ���� �������!�����^��� �� !���� �% � � ������ �$� �$������ ��� �% � �$����������� ������ �$�%����� �� &�� ����� �% ���� ��#� ������ �� `� ���^ � � ������#�� ���^ ���� #$� ��# ��������#������#$� ��!��� ��# ����������������" ^ ���*% �����#����#�� ������� ��%���"%�� ��% �� ��������^ ��� ���# � ��� ����� ��!������$�%��������#� ���$��� ���% ��$��������!��������$�%����� ������� ������� �'���������� ��� �������������������#�� ��������$' �^��������#��$�#��� �¥�'�����$������#$������% � ��������� ���!�# ^ ��'� ������$�#��������$�%����� ��\%������� ���!�# ���������# � ������������� ��$� ���% �� ��������� �" ��� ��������#��$�������������������^ ��� ���� !� ����������� �� �" ��� ���������������#�# � ��������������!��$�%��������#��!�# � ��� #�!$�������������#��������%�# ��# � ����������������_��� ���#����������������� ^ �������% �#������$������!��#����������^ �!$�����������'�" ����!���� �������$�%������#�"������''���� #��������$�%����� �����# '���� ������&�� # ^ ��'� ��� ��������� ����� �������� _% '��#� ��#� �����"���� # !�� � # � ������������� ��� �� '��� ��� �!� � #������$����� ��#�� ����������� ��#$����� ��#� $����� '�'$�������� ��� �$���� �� ��� &�� ��# ��� � ������������ ���������� # � ������������� � ���� �% ������! ���!���^ ��� ���# ������������������% �!� �'�����!����� ����%��$�%�# � �������� �$���������#�� ^ �$ ����� ������'�" �������$������������$�%����� ����&�������������# � �������������# ��� ���������'��� �� ��"% � �'�'$���������#���#$������'� �#���$��!����$������ ��� ������$�������#��������� = � ������������� ��� ����� $� #� ��� �� ��� � � � ���� � �� � ��� # ��� � �% � #��' ����� �!� �� � ��� � �!� ���� ��������� �$�%� ���# � ����������� ��% �������������# ��������������'��� ��������� ����������� ���&�� '$����� ����� � ��� # � ������������� �����! ��� '�" �� �"��� !���� �% � � ������ ��^ ��� ��� ��� ������ ��� � ������� ��^ ��� ���� ��� �� \%$��� # � ������������� ��� ���� '�$���� #� ��� ��� �%�!�� �!� �$�%������ ��"��#�� ������ ��^ ��� ���� ��#� �"��� !���� � ��������^ ��� ����"��%���������^ ��� ����$�%�������^ ������ �����#� ������������� #����!�` #�����## ������@������(�����!����� ������= � ���������������� `'� �� #����#�!! � ���!�������#�����%�' #����%����������!��������'����������$��$������#������ ��������!���������#� `' �� �� ���!� ��%���$�����\%���'��^�# �������' �!���$�# �����#��������'��� ����!�# � ��������������
Deconcentration\��#����������������% �'�" ��"���^ �� #�����% �� ��������^ ��� ������� ��\%���¢� ����������������#����� ����������!�'�" �������������� ��'������ �!! � #� ����� � ��� �% � # ^ ��'� ��� �!� ������ � �# ��%�'� ��#� ������ ��������^ �� _��� � �% � _ ���#� ����#� �����# � �����������������% �!�����!�# ���� ���������%���� ���''�� #�������������# ^ ��'������$���� ����= � ��������������!! ���# �� ���!�# ���� ����� #��$�%��������#�� �'�������������$��#� ��������������# ^��^ �'�" ��!����� ��������#������� ������$�%����� ��#�"������% �������� ^ ������#�� ������ �������*% ������[�����" ^ ���# ���� ���������#� ���%�!��"������#��!����� ������������� #��!!��������������!!�����!!�� ���$���# ��!��% �� ��������^ ��� ������#������^ ����� �#���� ��������!� �#��� �������'������#]$�����#���'� � ���� ������#�� ���^ �������� �"��%����������#���������#�"��%����$�# ��� ��� ������ ��������^ ��� ����������� ������� ��� ����Delegation = � �����������������������# � ��������%��������! �������� ������ �'���������� ��!����' ��!�������# !�� #�!$��������#�"��������������������������$���# ��% �� �$�����$� �$����������$��$� �\% � ���������������������� �������#�� ������������� #�����% �� ��������^ ��� �������#�� ������ �������*% ������[������%�$�%��% �# � ��� #��� ��������^ ������#�#���� ���������������$��� �������' ��!���!$����������% �$������ �� �'������������� ��"��%��% ���^ � ����� ��������^ ��� ����$�%��������&�� # ^ ��'���� ��$���� ��� � �'���������� �� �� � # � ��� #� #�"�� ��� #�!! � ��� �$�%����� �� �$�%� ��� '$����� ���'���������� � �������# ^ ��'� ����� ��� ����' �����!$��������$�%����� ���� ����$������$��'��] �����'� � ��������$�������#���^��� ����!�'���������������������������#�� ������ �������*% �������#�� ������ �������*% ������[������ �^ #��%����% �# � ��������!�� �'���������� ����� �% � � �������������� ��� $�$����� ^� " #� ��� �� "��� !���� ���� � ��^���� ��'������� !$�������� !���� �� !!��� ��� ��^ ��� ����$� �$����� �������!����% �� ��������^ ��� ������'��^�# ���#�� ���������#����#�� �^�� ������ !! ���^ ���'��^�# #�����% �� ��������^���� �^�� ����#�����������������'$��������������^ ��%��%���'��!����� ����^��$��� �� ��$�� ���Privatisation = � ��������������%��$�%�'��^��������������"���% ������! ���!�� � ���� ��������^ ��� ���!$�����������^��$�����������������������'��^�� � �� �'��� ��\%���'��^�����������''����%����� ��� !! ���^ �� �^�� �^��$ �# ��^ ���= � ������� #�'��^�������������# ^ ��'������$���� �� ��^ ��� ���� � �'����������� ��� �������������� �$�%� ��� ��������� ��#$������� ��#� ���# � �������������� '��! �������� ���$'���� �����$�����������������'���������'���� ������ ���' ����^ ��� ��#� ���� � �'����������� !���'��#$��������#�� ��#� �$''������ � �^�� ���'� ^��$�����!! � #����'�������������'$��������'�������������^��$���������'��^�� ����������� #� �� �'��� ��
Bopi-Kerepa, Hamilton & Prideaux
The 17th International Conference on Electronic Business, Dubai, UAE, December 4-8, 2017����
����^�������������# ^ ��'������$���� ������"����^ ��� ������������! ��� �'���������� ��������������������%���#��� '� � ���^����$����� � ����������� �������#�� ������ �������*% ������[��������������# �������#�*��������� �^ #����$�� ���!������������������# ^ ��'������$���� ���!��� ��©����' ����^ ����� #������������������$�$�����#����� �� ���^����� �# ^ ��'� ���������������������# �$���������"�� �©����#���$�%����$'���#��� �'��#����'��^����������'������� �������^ ��� ����Devolution of Power and Authority \% �# ^��$������!�'�" ����#��$�%����������% ��� ������������ ���% ������!�!�����������#¡���� ����'�" �������$�����������$������!���^ ��� ������% �����^��� ���!�"%��%��� ��$�������������$���# ��% �#�� ������������!��% �� ��������^ ��� �������#�� ������ �������*% ������[���_% �"��#�'������##�����% ��������������������� �" ��# ^��$�������#� ����������#�� �%����������!�������� �#�����̂ ���#�� ��% �� � ������% �#�'���������%���#�^ �� ����$��$� ��"��%��������� ������� ���� ��� #������"% ���% ���� �������!��% ����� ����� �!������������$ ������\%����������������$������ ������� ���� � ������'� ���#������!���# ^��$����������#�� ������#�*% �����#�_���%��$�� ����%���# ^��$������!��$�%���������������� ^ ���$�%����� ��� �$�� ��������� �����#�� ������� ������ #�� ����'%������� ����!� `��$��^ ��$�%���������' �!���� `'������������� #����� �^ #�!$����������������'���� ¡����$������$�%������������� �� ^ �$ ����#� `' �#��$� ������_$�������������^ ��� ���� �^�������������������� ���' �� �^ #���������!������������ #�¡��'������������#��@��� ��'��������#��$�$������ � !������� �������%�'��"��%�� ��������^ ��� ������" ^ ����% �# �� ��!�# ^��$�����# ' �#�����������% ����� ��!�� �^�� �� ���� �# � ������� #������ �% ����#��!�����^��� �� ���� �$�# ���� ������������$�%���������!!����#������% �'�������������������������#���! ������ �# ^ ��' #�����% ��������$�%�������� ���Decentralisation Summation &�� �$������� # � ������������� ��'��^ �� � �^�� � ^��$ � # ��^ ��� �$�� "���#"�# � � ������ �� "�������'���� ��� = � ������������� ����'��� ��# ���� ����������# � ��������'��^������������#�'�" ��# ^��$�����&��# ^ ��'������$���� ��"��%�� ��������^ ��� ����� ��������!������� ��$�� ���������# � ���������������'� � ��������%���� ���� #������"�'��� ��������# ^ ��'������$���� ���� �������!����������'��^�# �������� �^�� ��$�%����% ���%�� #$��������"�� ����#����������������% �^����$��� ^ �������� ����!���# � ������� #�'������������� ���!���^ ����� ���$�#��������@�������%�!$�#�����!�������� �^�� ���������� #��������������#�" ���������������!�'$������' �#�����$���� ��� ������� ^ ��'��] ����� � �^ � ����� � �!� �% � !��������� �$''���� ������� #� ����� ��� ���� �� �� �����% ���� ������ ���� �� �� �����% ���� ������� ������� ����������� ��*���� ����������#�� �����������%�"��%������������ ��������^ ��� ������� �� �����'$������' �#�������% ���%�� ��������� � �����!����� � ��� � #$����� �%��#¡��!��������������� ��#� �%��� '$����� �' �#������� #$�������%��� ��^ ���" ��� � �������%�'� ���'���������%�������'� �������� ������(�����!����� ��������'�<�������# � �����������������%����� ��� #��%��$�%��% �# ^��$������!�'�" ����#��$�%����������# ^��^ ��# �� ���!���# ' �# ����$�%������!����$�����������# ^ ��'� ���������^���������#�������� ^ ����^ ��� ����\% � ��$������������ ^ ����!���^ ��� �����#��$�%����� ����$�%�����% �==��� `' �� �� ����� �� #�'�" ����#�� �'�����������!���# ^ ��'�����������$�����������������$�������$�%������������%���� #$���������#�������'�������% ���%���% ��!������!�# � �������������� �' �������'��^������������������� �'��������% ��$������������ ^ �����\��#�!!����[����$�� ����� ��������^ ��� ���'� ��$� ����# � ������� ��� ���!�����% �� #���������#��' �� ������ � ����!����� �!$���������%��$�%�$����� �"�����!���������#�� ��������!!�� �����#������������#�� �#�!! � ���# ���#���!�#�!! � ����� ���"��%������ ���������!���_��� �\%���# ^��$������!��#�������������!��� ���������#����������^ �$���������$������$���$�%����� ����#�"��%���� �� ���� ����$�� � '�������� �% �� !���� � ������ ��^ ��� ��� ��" ^ ��� # ^ ��'���� ������� ��$#� �� �$�� ��� � ������ ��^ ��� ����!� �$ �����������$ ���� ` ���� ���#�� ��¡�$' �^���������������^ ������������ ��������$�������������^ ��� ����#����������^ �$�������= ^��$������ ������' ���� ���!������������� �'�" ���������� ^ ���#�������������������� ������ ��'�����������������% ��� ^ ����!���^ ��� ���"��%����% �����'������������� ���%�# ����� �^ ���%���©'���� ��%�'���# �©��!�� ������������� ���������!���^ ��� ��� ������� �%��� ������ �$�%����� �� ��#� � ������ ��^ ��� ��� �� � ��� �$���� $�# �� '������ ��� _$�%� ��� ����^ ��� ����� � �������%�'���'' ������� �'����� �������% �'��� ����!�# ^��$������!�'�" ������$�������������^ ��� ������#�������� ^ ���#��������������
PNG Brief historical perspective ���������&�# ' �# �� �����!����" #���� ������� ������ ���!���^ ��� ���¥�"��%���$����� ������$� ��!�������� ���=$���������!�����������$� ��!���� ��������~@���~[����% ��$�������������������#�������������� ���� #� ` �$��^ ���������&����~[���% ���'$����#�� "��$�� ������� � ����^ ������ ������$�������!� �% �\ ����������#�����" #� ��#�� ��$��� �� ����!� �% ���$� � ���� ��� ���^ ��� ��������� ���*��� �$ ������ � ^ �������� ��� ��#� � �� ���������������� ���" � � �''���� #� <�� ������ ����� �$����������!!���������$�%���% �� ������� ������ ���!���^ ��� ���!���������� # �������� ��"���� ] �� #����#���$����������� ���#�'� #�¥�� ��$� ��������� ��������^ ��� ���%�#�'��^ ��$� !$��������^�������������� �'���� ���#$�����*���������$� �\% �!����������!�� �!���^ ��� �������������"��$����������#���� �����#������#����#����������^ �� �'���������� ����" ^ ����% �*%� !������� ��"��������� � �'������ � ��� �$���������� ������ �� !��� /`� ����� \ ������� �� ��� ��� � �����!������ ���� ��� &�� ������'������ �!� !$��� ����������&�# ' �# �� �����������$�����%�#����� �# ���� #��%���# !�� ��% ��# �������!���#�^ �� �'�'$�������"��%������������� #�� �� ��!�

Bopi-Kerepa, Hamilton & Prideaux
The 17th International Conference on Electronic Business, Dubai, UAE, December 4-8, 2017��@�
������������� ��#� "%�� � ������ ��� �� $��!� #� ��������� %������� "��� # ��^ #� !���� # ^ ��'� ���� ������� �"�� � '���� � ���������� ������� ���Devolution to Provincial Governments < �" �����~���#����[������# ^��^ #�������������# ��"��%�!$���� �������^ ���#������ � ���� �'���������� ��&�� ��%����^��� ���� � �� #���� �������#� ` �$��^ ���$������% �# #�������� �� ���" � ���^ �����������^ ����"�# ����� ��!����� ��������$#�����% �'�" ������ ^����#����� �����` ��������� � �^ #�!�����% ������������^ ��� ���� !$�# #�� ^ �$ ��!������� �� ���! ���������� ������ �� #�����% �'��^��� �����#���©# ��^���^ ������©� �$�^�� ����������' ��� ����!��% �^��$ ��!� `'�������#��'��#$� #�����% �'��^��� ����������� � �^ #�������$���$����#��������������!�����% ������������^ ��� �������!!� ���% ��#��������������������!�# ^��^ #�� ��������^ ��� ���!$��������>����#�������� ������� �� � ������� $� #� ��� ������$��� ��#� ��������� '$����� "����� *��#�������� ���^������� ��^ ��� ����� �������'� ^��$����$�# ���% �]$���#��������!��% ������������^ ��� ��������$#����� � ����%��'��������#�� �������'������� �����% ���%���#� #$��������" � ������'��^�# #��_$�%�# ^��$������������#� "�������������� �� #�'������'�����������^ ��� ���&��'��^�# #���������^ ��� ���# ���������������''���$���� �� !��� #�^ �� � ���$'�� �!� ������ ' �'� � &�� ����� ���� ��� ������� ���� " � � �� �� #� \%��� ��'��^ #� ������ '�������������� � ������#�����#����������'����� ��"��%������^��� ��&�������������� #������ #�'��! ���������"%���%�� ����� �$�����#�"����"��%����% ������^��� ���Provincial Government Issues \% �'��� ����!�# ^��$�����%������� ������� #����^��������� �$����� ����#�#��'����� ���������� ^ ����!�# ^ ��'� ��������%��!! ����[��� = � ������������� %��� " �� � #� �% � � ������ ��^ ��� ��©�� �������� ��� ����$��� � �% � ��$����©�� �������� ���"�%� \% �'��^��� ���������������$�� ���!�� ^ �$ ����#�' ����'�����#����������^ �������� ���� #��$�������^ ����'����� ��$� ��!��% �� #������ �� ��##��������'$������ �^�� �� ������\��#�!!����[������ #�!����������������� � ���"��%����% �'��^��� ��¥���#����������������� �����" � ��$�' �# #����\��#�!!����[����������#��%�����#�� ������� #����$������!����������%��% � `������������� � ��������������� ���^������� ' �!������ �� ��#� �% � ������ � ���� % �'���� '��^��� �� ��� ��'��^ � !��������� ����� � ���� '��] ���'�������¡'� '��������� ��#� � � ���� �#������������� ��������� �� ��� �� %�^ � ��� ��� �� �!! � #� ���# �$�� � ����$�������� ������^���������^ ��� ����� ���#����� "�'��] ����� ����$�# ���� ������% �'��^��� ����<��"���� �������#����" �� `'��� ����� ������#�������$���������' �����!���^ ����� ����� �^�� �# ��^ ������� ^� "����������� ������� �� ������� ������ _��� �� \% �� ��� � �$� �$������� ���!!� �%����� �¡���������� '���� !��������� ����� � ���� ��#�����$���������� `����\% ��� ^� "��% �%��������!��$�������������^ ����� ������������$#����������% �����������"�������^���������^ ��� ����������������% ��������� ^��$������!��% �����������"�������^���������#�������� ^ ����^ ��� ��������������#������% ��$������$��� ������!�<�$����^��� ������� � ����\% �� `'��� �'�� ��������� �����^ �������^ ����� ������� � ��������$#���������'� ��# ��������������! # ���������#���������� �������= � ��������������# ^��$�������#��$�������������^ ����� ���� ���$� ��$''������% � ����%����#�������^ ����� ���� �����^ ����� ���������� `���� �����^���������^ ��� ����' �#������������% ���%���#� #$���������� ��$� ��� ��$���� ��¥�������� �%���'��' �� � ��$������ ��#� ���$� � $� � �!� � ��$�� �� �!! ��� !!��� ���� � � !���� �%��� �� � � ��$���� � $����� �� _���%������ ���#$������������ ���_�����''����%�� �������������$ ���!��� `��'� ��%�������� �<������^��� ���#��% �� "��$�� ��&����#��� ����������� ������ !!��� ��������`���������$�'$�����������% ���%���#� #$���������'$������ ������� �^ ���% �� ����^ ���!�$ �� ���!�������� ��� ����#����$ ���%���# � ��������������%��$�%��% �'��^���������#�������� ^ ����^ ��� ��� ���� ��� %��� �������� #� � �^�� � # ��^ ��� # ������� ������� � � ��� �� !��� ������� � "% � � ¢���� ����� ��� � �� ������%���#�����^��� ��!� ����� ��#�^ �� #�� ��$�� ��� ����!���#���������' ��'% ��������% �'��^���������'����������% ��¢'������� ���_ �^�� �# ��^ ���� ^ ��������������� ��� ������������!�!��������#�%$����� ��$�� ���'���������������!�� �^�� �# ��^ ���� �%��������_���#��%�����������! ����������� ����$'����� ��������� ������� '������^ ����� � ��#���������������� ���$��$� � �_ �'�� ������ ��#�'���������_���#��%��������\% � ���' #�� ������ ������������������^���������#�������� ^ ����^ ��� ������� ��������! ��� ���������#�=$������*��������#�<�������� � �%��� � �^�� �# ��^ ���# ^��$����� ������ � ������ ��'�#�"��� ��#� �$�] ��� ����������¡����'$����������^ �� #���� � �����'�" �!$����#�^�#$������#�'��������� ��� ��==���# ���� #������'����������#�# ��^ ��� �^�� ��#�� ���������% �������� ^ ���� �����# ' �# �����������% �������# � ������� #���^ ����� ����� ������' ����������#������% �'��' �¡�# �$�� �!�����������#�%$����� ��$������'��^�# #��!����� �����������>����!� �>������'�<�\�� #�� � ���^������� ��#� ������� ^ �� ��^ ��� ��� ���� ��� %�^ � ���� !! ���^ ��� # ��^ � #� � �^�� �� �� '� �%���� �!� � �������^ ���#����������^ ���#�!������������������ ����%�^ ��� �� #���¢�$##������%��$�%��������������������� �^�� �# ��^ ������� ������$� ���%��%���%����% ��$##������%��$�%�'��%"�����%�����$� ��$�%�"����� ���������� � �����#�#$'����������!���� �¡!$���������"%��%���'%������������ � ��$�� ��� ��'��$� �$������� � �������#��� �� � �� !!��� ��� ��\%��� � �#�� ���� !��� `��'� �� ������!�������� #���� ����#��$����$�$����� ����������������$����% ���%�'�������#���%�������
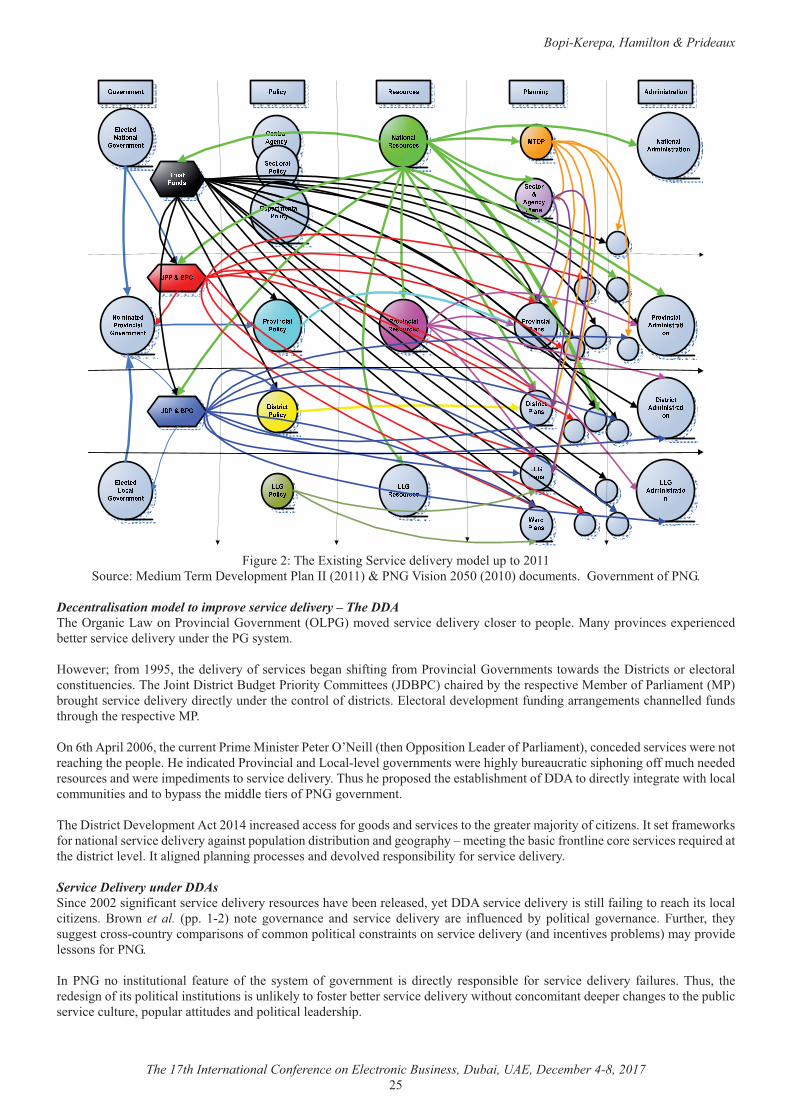
Bopi-Kerepa, Hamilton & Prideaux
The 17th International Conference on Electronic Business, Dubai, UAE, December 4-8, 2017����
����$� ����\% �/`�������_ �^�� �# ��^ �����# ��$'���������
_�$�� ��� #�$��\ ���= ^ ��'� ��������&&���������������������������������#��$� �������^ ��� ����!������Decentralisation model to improve service delivery – The DDA \% �����������"�������^���������^ ��� ������������^ #�� �^�� �# ��^ ������� �����' �'� ������'��^��� �� `' �� �� #�� �� ��� �^�� �# ��^ ���$�# ���% �������� ������" ^ ���!�����������% �# ��^ ����!�� �^�� ��� �����%�!�����!�������^���������^ ��� ������"��#���% �=������������ � ��������������$ ��� ��\% �}�����=��������<$#� �����������*������ ���}=<�*���%��� #�����% �� �' ���^ �� �� ���!�������� �����������$�%��� �^�� �# ��^ ���#�� �����$�# ���% ����������!�#���������/� �������# ^ ��'� ���!$�#���������� � �����%��� �� #�!$�#���%��$�%��% �� �' ���^ ���������~�%��'�������~���% ��$�� ������� ������� ��� � ����� ������% ���''��������� �# ���!�������� ��������� # #�� �^�� ��" � ������ ��%�����% �' �'� �� ���#���� #����^���������#�������� ^ ����^ ��� ����" � �%��%����$� �$���������'%�������!!��$�%�� # #�� ��$�� ����#�" � ���' #�� �������� �^�� �# ��^ ���\%$��% �'��'�� #��% � �������%� ����!�==�����#�� �������� ���� �"��%�����������$���� ����#������'�����% ���##� ��� ����!�������^ ��� �����\% �=��������= ^ ��'� ����������@����� �� #���� ���!������#����#�� �^�� ������% ��� �� ����]�������!������ ���&��� ��!��� "�����!������������� �^�� �# ��^ �����������'�'$�������#������$�������#�� ����'%��¥�� ������% �������!������� ���� �� �^�� ��� �$�� #�����% �#��������� ^ ��&������� #�'��������'��� �� ����#�# ^��^ #�� �'�����������!���� �^�� �# ��^ ����Service Delivery under DDAs _��� �����������!������� �^�� �# ��^ ���� ��$�� ��%�^ �� ��� � �� #��� ��==��� �^�� �# ��^ ������������!����������� ��%���������������� ��� <��"�� et al.� �''� ����� ��� � ��^ ����� � ��#� � �^�� � # ��^ ��� �� � ��!�$ �� #� ��� '��������� ��^ ����� � �$��% ��� �% ���$�� �����������$��������'���������!��������'������������������������� �^�� �# ��^ ������#���� ���^ ��'���� ��������'��^�# �� ������!���������&�� ���� ��� ������$������� ! ��$� � �!� �% � ���� �� �!� ��^ ��� ��� ��� #�� ����� � �'������ � !��� � �^�� � # ��^ ��� !���$� �� \%$��� �% �� # ������!�����'���������������$���������$���� ������!��� ��� �� ��� �^�� �# ��^ ���"��%�$��������������# ' ���%��� ������% �'$������ �^�� ��$��$� ��'�'$���������$# ����#�'���������� �# ��%�'��

Bopi-Kerepa, Hamilton & Prideaux
The 17th International Conference on Electronic Business, Dubai, UAE, December 4-8, 2017��~�
/�'���������� ���$� ��������� �^�� �# ��^ ������������� �� ��% �������� �" �����#��#����������^ ������� � �����#�� �# ��%�'��'������ ����#�� �^�� �# ��^ ����$���� ��"��%����% �!��� "������!��% �# ���������� �^�� �# ��^ �����# ���� �������'������� #���" ^ ����$��#������$�����������% �� �^�� �# ��^ ������� ����� �����������"% �������# ������ �^�� ��# ��^ � #��%��$�%�"%�� ^ ������ ����� �������% #��\�$��� �$��#�� !! ���^ � ��� ��� � �^�� � # ��^ ��� ���%� ���� �� #� �����'�� ���� ��#� ���#� ��^ ����� �� '$����� �!!������� � �������� ����� ��������� �����#�� �^�� �# ��^ ����� ��� ��� �����" �������� #����%����$��#����$����������� �����#�� �#����� !! ���^ �� �^�� �# ��^ ����<������������������ #����<��"��et al.����� !! ���^ ��������� ����� �� �^�� �# ��^ ���$�# ���� ����$����������]$�����^ ��� ����$�� ��� �% � � ����������!� �% � ���� �'��������� ���� ���\%$�� ������!���$��� �������$� �� ��� �� !! ���^ � ��� ��� � �^�� �# ��^ �����/!! ���^ �� �# ��%�'����� �����#������ � ���'��� �� �������##� �����������!����#���^ ����� �"��%����% ������ �^�� �# ��^ ���� �%������_$�%�'��� �� ������ �$�'��% �==��"��%��������'��^ #������'�� ������#�� �# ��%�'���������#���^ ����� ���#������ '����������� ���%�^������ �� ������$�����������_ �'�������� `���� ���% �==��������������������$��$� ��!��$����������##� ����$�=�������������#�������^��� ����#������$# ���������$��$� ����%��%���� ������� #����������� �� ^ ����!�%� ����%�� ��%�"��%�%��%�# �� ���!�!�������������*�$'� #�"��%�'����� ��$��������#����# �$�� �������� #����!!���%���==�����$��$� �%�����" �����!�$ �� ��������' �!������ ��$�'$�����#��$���� ���_���#��%����������� ����'����������#���^ ����� ��"��%�� �^�� �# ��^ ������������� ����#�� ���'�������� ��� �^�� �# ��^ ����������� ������ ��� �������� ��#���% ��� � �'����������� ��� �%���' ������ �!� ==��� �% �� $�$�'���� ������ �$� �$������� ��� ��� � �������'��] �������� ������#��!� ���!! �����'��] ������#�� �^�� ������% ����$''��� ���"��%����% ��� � ������ ���>��� ��� `' �� �� � "��%� =����� *���$����� ��^ ��� ��� ��� }�"���� '��^��� � # �������� �� �%���� "% �� ����$���� �� �� � �'�" � #�� �% �� ��� � �"� ��%�'� �!� �% ��� �"�� # ^ ��'� ��� '������� �� ��#� � #�� \%��� ��� ¢����$�����#��^ ��# ^ ��'� �����% ���# �$�� ���� ��$�� #���#������ #��==����� ���� �# #����!�������� ��$�%�����$�����#��^ ��# ^ ��'� �����\% � ==�� !��� "���� ��� �� ## #� ��� �% � � #�$�� \ ��� = ^ ��'� ��� ������ ��\=��� =�������� _ �^�� �� &�'��^ � ����������� ��=_&���# ^ ��'� ����������#�� �����!$�#�#���������'��] ����¥����$��������� ����������������������' ��#��������\%���#��������!$�#������'��� ���% �������� ��\% ����������� � �^ ��!�^ ��������������������' ��#��������"��%����% �'��^��� �$�# ���% ����^�������_ �^�� ��&�'��^ � �������������_&������$�����'��^��� ����#�#���������� � �^ �� �" �����������' ��� ����!��% ����$���# ^ ��'� ����$#� ���Mixed Results ��������@��% �= '���� ����!����� ������� �������$������! � �� �%���#������������� ����'� � ���#��������# ^ ��'� ���� '�����_�� � #��������� $� #� �% ��� ����� =_&�� !$�#�� ��� #�������� ��'���� '��] ���� ���� ������� � ��� �% � #�������� �!� &����$� �������� ��������� �� ����]������#�� �"�����" � �$'���# #��&����$���������==��� '����������� &�������$�#�������� �"����]��� ���#��" � �������$�� #�������� ���������������$���� ������% ���'�����'�$���$�� ���!�] ��� ��!�����������^����� ��������$�==��� '�������������" ^ ��������#���������#�#�����$� ��% ���!$�#���''��'���� ���\% � ���` #�� �$�����������$� ������������"��=&���
�"<<$�������*���*"��%$���#'��@$#$������$�H"��)�*���*"��%$����"!)�\% �==�� �������% ���% ����$��$� ���#����� ���"��%����% � `�������'������������� ����� ��$� �� �^�� �^��$ �!��"���$��% �� ��$�������� `'��� ��% ���$�������#�^ �� ��$��$� ����'����'%�����'���������$ �����#��% �� � ���������� �����������#�'����������� ����� ����#����#���' �$�# �'�������� �^�� ��^��$ �# ��^ ���������������'��^ �����# ^ ��'� �����#��������/`' �� �� �� �� "% � ���#���� ���$� �'��^�# ��$� !$�������%�����#��$�#��� ������'��^�����% �� �^�� ��^��$ �# ��^ �����������%��$�%��% �==������� ��$�� ��!��"��''����%���'�$� ����#�'��^�# ����$� �!��� "��������$� ����!���������� �^�� �# ��^ ����%��$�%�����% �==��&����'�$� �� �% � ��������� !$�#�� ������� #�� ��#� �$��#�� �� �% � ' �� ���� � �!� !$�#�� ���$����� # '��� #� ����� �% � ==���� ���� � #�������� ^ �� '��] ���� \%��� !$��% �� �����!� �� �% � ==���� �������� ��� ' �!���� ��#� �$�� ��!$���� # ��^ �� �$�������!$�# #� ������� ^ ��'��] �����
����$� �����$�#��#������$� #����������� ^ ��'��] ����
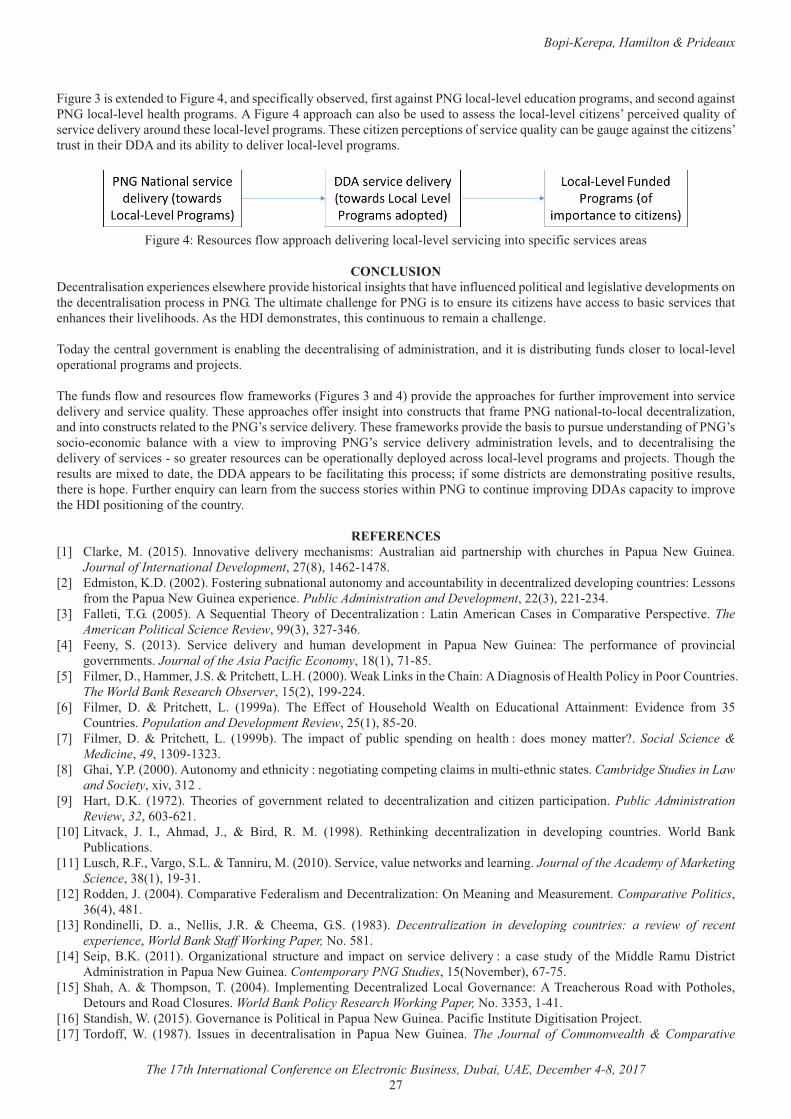
Bopi-Kerepa, Hamilton & Prideaux
The 17th International Conference on Electronic Business, Dubai, UAE, December 4-8, 2017����
����$� ������ `� �# #�������$� �@����#��' ��!���������� �^ #��!������������������������ ^ �� #$�������'�����������#�� ���#�������������������� ^ ��% ���%�'�������������$� �@��''����%����������� �$� #������� ����% �������� ^ ������� ����' �� �^ #��$�������!�� �^�� �# ��^ ������$�#��% � �������� ^ ��'��������\% � ������ ��' �� '�������!�� �^�� ��$����������� ���$� ����������% ������ ������$�������% ���==����#����������������# ��^ ��������� ^ ��'����������
����$� �@��� ��$�� ��!��"��''����%�# ��^ ������������ ^ ��� �^������������' ��!���� �^�� ���� ���
�����&"�����
= � ������������� `' �� �� �� �� "% � �'��^�# �%���������������%����%���%�^ ���!�$ �� #�'�����������#�� �������^ �# ^ ��'� ��������% �# � �������������'��� ����������\% �$������ ��%��� �� �!������������� ��$� ���������� ���%�^ ���� ������������� �^�� ���%��� �%��� ���% �����^ ��%��#������% ��=&�# �������� ����%���������$�$������ ��������%��� �� ��\�#����% �� ��������^ ��� ������ ���������% �# � ������������!��#����������������#�������#������$�����!$�#������ ������������ ^ ���' ���������'����������#�'��] ������\% �!$�#��!��"���#�� ��$�� ��!��"�!��� "���������$� ������#�@��'��^�# ��% ��''����% ��!���!$��% ����'��^ � ��������� �^�� �# ��^ �����#�� �^�� ��$������\% � ��''����% ���!! �������%�������������$�����%���!��� �����������������������# � ����������������#������������$����� ��� #�����% �������� �^�� �# ��^ ���\% � �!��� "�����'��^�# ��% ����������'$��$ �$�# �����#�����!������������� �������� ������ � "��%� �� ^� "� ��� ��'��^���� ������ � �^�� � # ��^ ��� �#������������� � ^ ���� ��#� ��� # � ����������� �% �# ��^ ����!�� �^�� ��������� �� ��� ��$�� ������� ��' �����������# '��� #��������������� ^ ��'����������#�'��] ����\%�$�%��% �� �$������ ���` #����#�� ���% �==���'' �������� �!�������������%���'��� �����!���� �#����������� �# ������������'�����^ �� �$������% � ����%�' ��$��% �� ��$��������� ����!�����% ��$�� �������� ��"��%����������������$ ���'��^����==�����'�����������'��^ ��% ��=&�'������������!��% ���$������
�$*$�$��$��£�¤� *���� �� �� ������� &���^���^ � # ��^ ��� � �%�������� �$��������� ��#� '���� ��%�'� "��%� �%$��% �� ��� ��'$�� � "� �$�� ��
Journal of International Development�����[����@~���@�[�£�¤� /#���������=������������ ������$�����������$���������#�����$�������������# � ������� #�# ^ ��'������$���� ���� ������
!�����% ���'$��� "��$�� �� `' �� �� �Public Administration and Development���������������@�£�¤� ���� ����\�� ���������_ �$ ������\% �����!�= � ������������·���������� ������*�� �� ���*��'�����^ �� ��' ���^ � The
American Political Science Review��������������@~�£@¤� � ���� _� ������� _ �^�� � # ��^ ��� ��#� %$���� # ^ ��'� ��� ��� ��'$�� � "� �$�� ��� \% � ' �!������ � �!� '��^�������
��^ ��� ����Journal of the Asia Pacific Economy���[��������[��£�¤� ���� ���=������ ���}_��������% ��������������� �������������% �*%�������=����������!�� ���%����������������*�$���� ��
The World Bank Research Observer���������������@�£~¤� ���� ��� =� �� �����% ���� �� �������� \% � /!! ��� �!� ��$� %��#� � ���%� ��� /#$��������� ������� ���� /^�# �� � !���� ���
*�$���� ��Population and Development Review���������[�����£�¤� ���� ��� =� �� �����% ���� �� �������� \% � ��'���� �!� '$����� �' �#���� ��� % ���%·�� #� �� ��� �� ���� �¨� Social Science &
Medicine��49������������£[¤� �%���������������$���������#� �%������·��� �������������' ����������������$���� �%�������� ��Cambridge Studies in Law
and Society��`� �̂������£�¤� ������ =�� ������� \% ��� �� �!� ��^ ��� ��� � ��� #� ��� # � ������������� ��#� ����� �� '������'������ Public Administration
Review��32��~���~���£��¤����^����� }� &�� �%��#�� }�� �� <��#�� �� �� ����[�� � �%������� # � ������������� ��� # ^ ��'���� ��$���� �� ����#� <����
�$�����������£��¤��$��%�������������_����\�����$�����������_ �^�� ��^��$ �� �"�������#�� �������Journal of the Academy of Marketing
Science���[�����������£��¤���## ���}�����@��*��'�����^ �� # ���������#�= � ������������������ ��������#�� ��$� � ���Comparative Politics��
�~�@���@[��£��¤����#�� ����� =� ��� � ������ }�� �� *% ���� �_� ���[��� Decentralization in developing countries: a review of recent
experience��World Bank Staff Working Paper, ����[��£�@¤�_ �'��<�� ���������������������� ���$��$� ���#� ��'������� � �^�� �# ��^ ��·�� �� ��� � ��$#���!� �% ���##� ����$�=��������
�#������������������'$��� "��$�� ��Contemporary PNG Studies�������^ �� ����~�����£��¤�_%�%������\%��'�����\� ����@�� &�'� � ������= � ������� #���������^ ����� ����\� ��% ��$�����#�"��%����%�� ���
= ��$�����#����#�*���$� ��World Bank Policy Research Working Paper, �����������@��£�~¤�_���#��%�������������^ ����� �������������������'$��� "��$�� ������!���&�����$� �=���������������] ���£��¤�\��#�!!�� �� ���[��� &��$ �� ��� # � ������������� ��� ��'$�� � "� �$�� �� The Journal of Commonwealth & Comparative

Bopi-Kerepa, Hamilton & Prideaux
The 17th International Conference on Electronic Business, Dubai, UAE, December 4-8, 2017��[�
Politics���������@@����£�[¤�������������������&����������$'�����#��!$��������¨�� �� '�������!�����$'�������#��������� �$ �� �����'�'$��� "��$�� ��
Public Administration and Development�����������������£��¤����! ����/���������<�$����^��� ��$����������&�'����������!�����^ ����� ���#�= � �������������Contemporary PNG
Studies��~���������£��¤��$�#����� <� ����@�� ����#� # ^ ��'� ��� � '���� ���@�� ������� � �^�� �� "���� !��� '���� ' �'� � <���$ � ���#��� ��
���%��������=*���
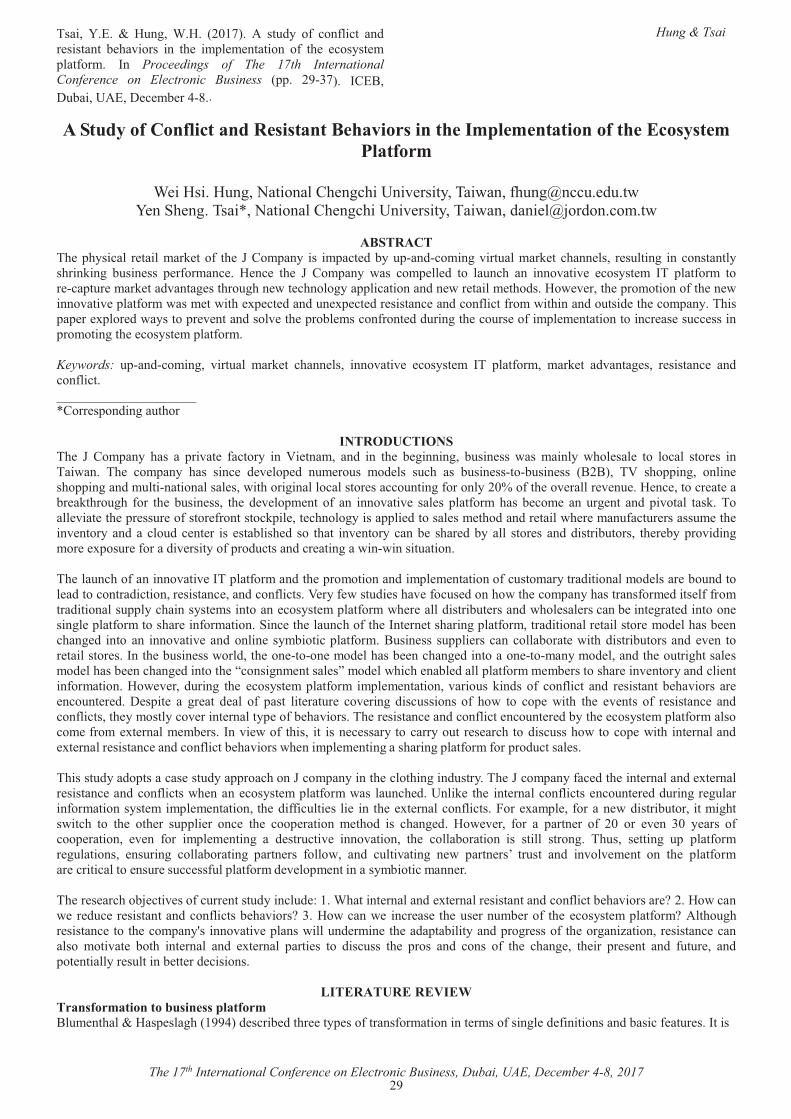
\����� �/� �� �$���� ��� ������� �� ��$#�� �!� ���!����� ��#�� �������� � %�^����� ��� �% � ��'� � �������� �!� �% � ������ ��'���!���� &� Proceedings of The 17th International Conference on Electronic Business� �''� ������� &*/<��=$�����>�/��= � �� ��@�[�
Hung & Tsai
�
The 17th International Conference on Electronic Business, Dubai, UAE, December 4-8, 2017 ���
�������������� �����������������>�������������( ���������������$���������' ������
�� �������$�������������*% ���%��>��^ �������\��"����!%$��{���$ #$�"�
� ��_% ���\���|�����������*% ���%��>��^ �������\��"����#��� �{]��#������"��
���������\% �'%������� � ��������� ���!� �% � }�*��'���� ��� ��'��� #����$'���#��������^���$������� ���%��� ���� � �$������ ���������������%�������� �$��� ��� ' �!������ � � �� � �% � }� *��'���� "��� ���' �� #� ��� ��$��%� ��� ����^���^ � ������ �� &\� '���!���� ���� ���'�$� ����� ���#^����� ���%��$�%�� "�� �%��������''�����������#�� "�� ������ �%�#����" ^ ����% �'����������!��% �� "�����^���^ �'���!����"���� ��"��%� `' �� #���#�$� `' �� #�� ������� ���#����!�����!����"��%�����#��$���# ��% ����'����\%���'�' �� `'��� #�"�������'� ^ �����#����^ ��% �'���� ������!���� #�#$������% ���$�� ��!���'� � ��������������� �� ��$�� ������'����������% � ������ ��'���!�����Keywords: $'���#��������� ^���$��� ���� �� �%��� ���� ����^���^ � ������ �� &\� '���!����� ���� �� �#^����� ��� � ������� � ��#����!���������������������������|*��� �'��#�����$�%����
�����!"�������\% � }� *��'���� %��� �� '��^�� � !������� ��� �� ������ ��#� ��� �% � � ��������� �$��� ��� "��� ������� "%�� ��� � ��� ������ ���� �� ���\��"��� \% � ���'���� %��� ���� � # ^ ��' #� �$� ��$�� ��# ��� �$�%� ��� �$��� �������$��� ��� �<�<��� \�� �%�''����� ����� ��%�''������#��$���������������� ���"��%�������������������� ������$������!�������������!��% ��^ ������ ^ �$ �� �� ������� �� ����� ���%��$�%� !��� �% � �$��� ���� �% � # ^ ��'� ��� �!� ��� ����^���^ � ��� �� '���!���� %��� � ��� � ��� $�� ��� ��#� '�^����� ����� \����� ^��� ��% �'� ��$� ��!����� !����������'�� ��� �%�����������''�� #������� ��� �%�#���#�� �����"% � ����$!���$� ������$� ��% ���^ ��������#������$#�� �� �� ��� �������% #� ��� �%��� ��^ ����������� � �%�� #�������� ���� ����#�#������$������ �% � ���'��^�#������� � `'��$� �!�����#�^ �������!�'��#$������#��� ��������"���"������$������ ��\% ���$��%��!��������^���^ �&\�'���!������#��% �'�����������#���'� � ���������!��$�����������#����������# ����� ���$�#����� �#����������#��������� ������� ����#����!������� ���! "���$#� ��%�^ �!��$� #����%�"��% ����'����%��������!��� #���� �!�!�������#���������$''����%�������� ����������� ������ ��'���!����"% � �����#������$� �����#�"%�� ��� �������� ���� ���� #�������� ������ �'���!��������%�� ���!���������_��� ��% ���$��%��!��% �&�� �� ���%������'���!��������#��������� ��������� ���# ��%���� ���%��� #� ����� ��� ����^���^ ���#� ����� �����������'���!����<$��� ��� �$''�� ����������������� �"��%� #������$�������#� ^ �� ���� ��������� ��&���% ��$��� ���"���#���% ��� ������ ���# ��%���� ���%��� #���������� �����������# �����#��% ��$����%����� ����# ��%���� ���%��� #�������% ���������� ������ �����# ��"%��%� ���� #�����'���!����� �� �������%�� ���^ ��������#���� �����!�����������" ^ ���#$����� �% � ������ ��'���!������'� � ���������^����$�� ���#���!� ���!����� ��#� � ��������� %�^����� �� � ���$�� � #�= �'�� � �� �� ��� # ��� �!� '���� ��� ���$� � ��^ �����#���$��������!� %�"� ��� ��' � "��%� �% � ^ ���� �!� � ������� � ��#����!��������% �����������^ ����� �������' ��!�� %�^�����\% �� ������� ���#����!����� ���$�� � #�����% � ������ ��'���!������������ �!���� `� ������ �� ���&��^� "��!� �%���� ��� ���� � ����������������$�� � � ���%����#���$���%�"������' �"��%� ��� �������#� `� ������ ������� ���#����!������ %�^�����"% ����'� � ���������%������'���!����!���'��#$������ ���\%�����$#���#�'�������� ���$#���''����%����}����'��������% �����%������#$�����\% �}����'����!�� #��% ���� �������#� `� ������ ������� ���#����!������"% ����� ������ ��'���!����"��� ��$��% #�>���� � �% � ��� ��������!������ ���$�� � #�#$������ �$������!������������� ����'� � ����������% �#�!!��$��� ���� � ��� �% � `� ��������!���������� `��'� ��!������ "�#������$�����������%���"���%� ��� �% � ��% �� �$''�� �� ��� � �% � ���' ������� � �%�#� ��� �%��� #� ��" ^ ��� !��� �� '���� �� �!� ��� ��� ^ �� ��� � ���� �!����' �������� ^ �� !��� ��'� � ������ �� # ���$���^ � ����^������� �% � �������������� ��� ������ ������� \%$��� � ������ $'� '���!����� �$��������� ��$����� �������������� '���� ��� !����"�� ��#� �$���^������ � "� '���� ���� ��$��� ��#� ��^��^ � ��� ��� �% � '���!������ ������������� ��$� ��$�� ��!$��'���!����# ^ ��'� ���������������������� ���\% �� � ���%���] ���^ ���!��$�� �����$#������$# �����%������ �������#� `� ������ ����������#����!������ %�^������� ¨�����"�����" � � #$� �� ����������#����!������� %�^����¨�����"�����" � ���� �� ��% �$� ���$�� ���!� �% � ������ ��'���!���¨����%�$�%�� ������� �����% ����'���©������^���^ �'�����"����$�# ���� ��% ��#�'�����������#�'���� ����!��% ���������������� ������� ���������� ����^�� � ���%� ��� ����� ��#� `� ����� '���� �� ��� #���$��� �% � '���� ��#� ����� �!� �% � �%��� �� �% ��� '� � ��� ��#� !$�$� �� ��#�'�� ��������� �$������� �� ��# ���������
&��$���"�$��$@�$;�����������������������( ������<�$� ��%��������' ����%�����@��# ����� #��%� ���' ���!������!������������� �����!������ �# !�����������#�������! ��$� ��&����� �
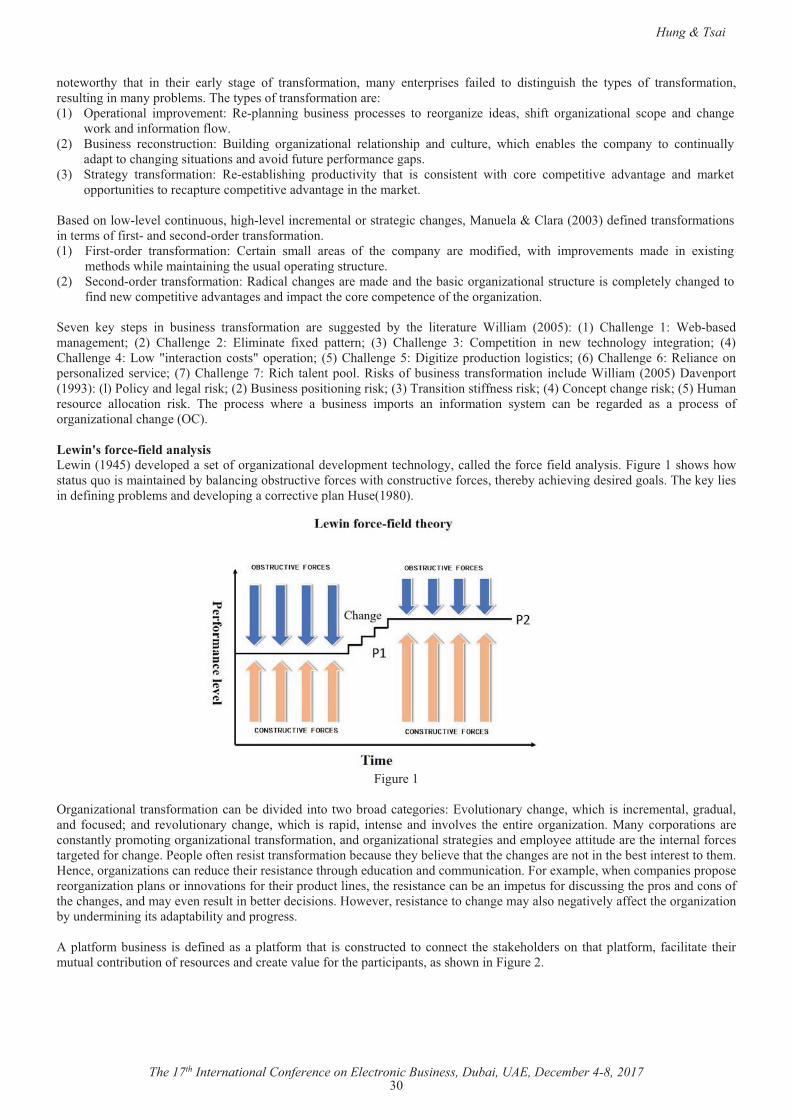
� Hung & Tsai�
The 17th International Conference on Electronic Business, Dubai, UAE, December 4-8, 2017 ���
��� "���%�� �%��� ��� �% ��� ����� ���� � �!� �����!���������� ����� �� �'��� �� !��� #� ��� #������$��%� �% � ��' �� �!� �����!����������� �$��������������'���� ���\% ���' ���!������!����������� ������ �' ��������� ��'��^ � ���� � �'�������� �$��� ��� '��� �� �� ��� � ������� � �# ���� �%�!�� ��������������� ���' � ��#� �%��� �
"������#���!���������!��"����� <$��� ��� � ������$������� <$��#���� ��������������� � �������%�'� ��#� �$��$� �� "%��%� ���� �� �% � ���'���� ��� ������$�����
�#�'������%����������$���������#��^��#�!$�$� �' �!������ ���'������ _���� ��� �����!���������� � � �������%���� '��#$���^���� �%��� ��� ������� ��� "��%� ��� � ���' ����^ � �#^����� � ��#� ���� ��
�''���$���� ������ ��'�$� ����' ����^ ��#^����� �����% ����� ���<�� #������"�� ^ ��������$�$���%��%�� ^ ������ � ������������� �����%��� ������$ �����*������������# !�� #������!�������������� �����!�!��������#�� ���#���# �������!��������� ����� ��������# �� �����!���������� * ������ ������ �� ��� �!� �% � ���'���� �� � ��#�!� #�� "��%� ��'��^ � ���� ��# � ��� `�������
� �%�#��"%�� ��������������% �$�$����' ����������$��$� ����� _ ���#���# �������!������������#������%��� ���� ���# ���#��% �������������������������$��$� �������'� � ����%��� #����
!��#�� "����' ����^ ��#^����� ����#���'�����% ���� ����' � �� ��!��% ���������������_ ^ �� � �� �� '�� ��� �$��� ��� �����!��������� �� � �$�� �� #� ��� �% � ��� ���$� � �������� �������� ���� *%��� �� � ��� � ����� #������ � ���� ���� *%��� �� � ��� /������� � !�` #� '��� ���� ���� *%��� �� � ��� *��' ������� ��� � "� � �%������� ��� ��������� �@��*%��� �� �@����"����� ����������������' �������� ����*%��� �� ����=������ �'��#$������ ����������� �~��*%��� �� �~��� ����� ����' �������� #�� �^�� �� ����*%��� �� �������%� ��� ���'�����������!��$��� ��� �����!��������� ����$# ��������������� =�^ �'�������������������������#�� ��������������<$��� ���'���������������������\�������������!!� ����������@��*��� '���%��� ������������$����� ��$�� � ����������� ����� \% � '��� ��� "% � � �� �$��� ��� ��'����� ��� ��!��������� ���� �� ���� � � � ���# #� ��� �� '��� ��� �!�����������������%��� ���*���&���J����������� �� ������ "������@���# ^ ��' #���� ���!����������������# ^ ��'� ���� �%������������ #��% �!��� �!� �#�������������$� ����%�"��%�"�����$���$������������� #�������������������$���^ �!��� ��"��%�������$���^ �!��� ����% � �����%� ^����# ��� #�������\% �� ���� �����# !������'���� �����#�# ^ ��'���������� ���^ �'�����$� ���[���
����$� ���
���������������������!�������������� �#�^�# #�������"������#���� ���� ���/^��$���������%��� ��"%��%�������� � ���������#$������#� !��$� #�� ��#� � ^��$�������� �%��� ��"%��%� ��� ��'�#�� ��� �� ���#� ��^��^ �� �% � ���� ����������������������'��������� �� ������������'�����������������������������!������������#��������������������� �� ����#� �'��� ������$# ��� ��% ���� �����!��� ������ � #�!����%��� �� �'� ��!� ��� ����������!���������� ��$� ��% ��� �� ^ ��%����% ��%��� ���� ���������% �� ������ � �������% ��� �� ��������������������� #$� ��% ���� ������� ��%��$�%� #$���������#�����$������������� `��'� ��"% �����'��� ��'��'�� �� �������������'������������^�������!����% ���'��#$������ ����% �� ������� ������ ������' �$��!���#���$�������% �'������#�������!��% ��%��� �����#����� ^ ��� �$������� �� ��# ����������" ^ ���� ������� �����%��� ����������� ����^ ����!! ����% �����������������$�# �������������#�'�����������#�'���� ������'���!�����$��� ��� ���# !�� #������'���!�����%��� ���������$�� #� ������� ��� �% ����� %��# ������ �%���'���!����� !�������� � �% ����$�$����������$������!�� ��$�� ����#��� �� �^��$ �!����% �'������'����������%�"��������$� ��� �
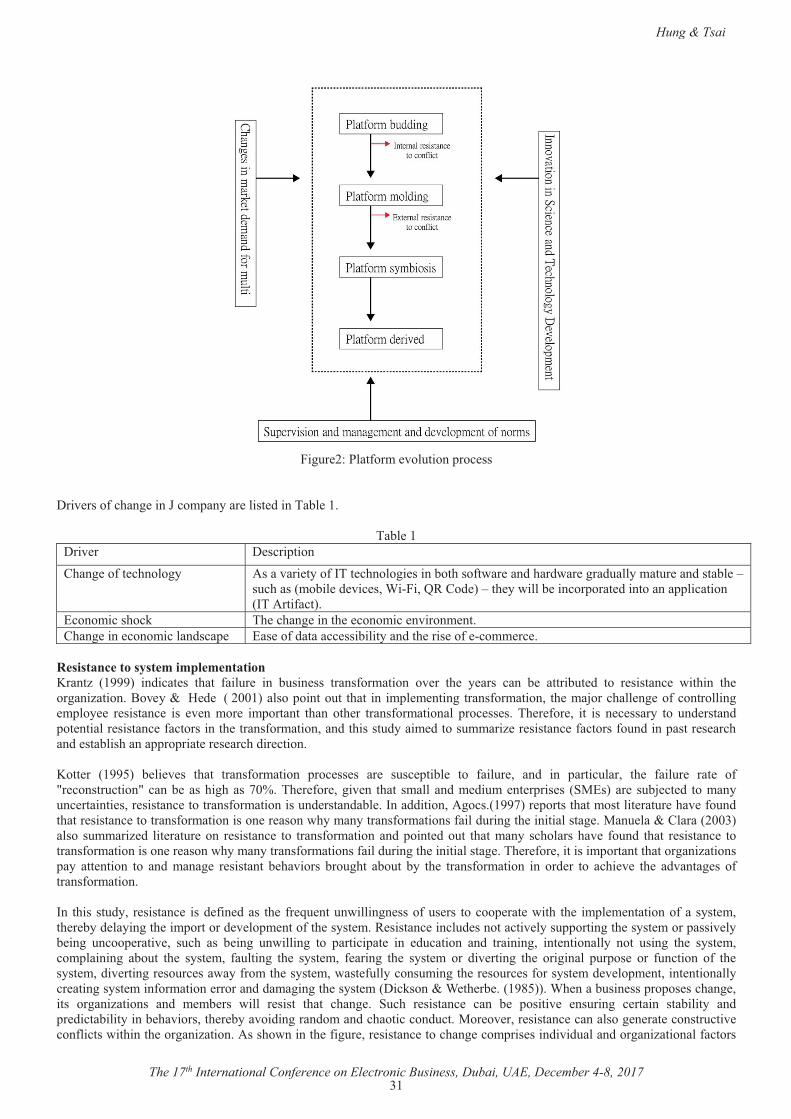
� Hung & Tsai�
The 17th International Conference on Electronic Business, Dubai, UAE, December 4-8, 2017 ���
����$� �������!���� ^��$�����'��� ���
��=��^ ����!��%��� ����}����'������ ����� #����\��� ����
\��� ���=��^ �� = ����'�����*%��� ��!�� �%������� � �����^��� ����!�&\�� �%������ ��������%���!�"�� ���#�%��#"�� ����#$��������$� ���#������ �¥�
�$�%���������� �# ^�� ���������� ��*�# ��¥��% ��"����� ������'���� #����������''����������&\�����!�����
/���������%���� \% ��%��� �����% � �������� �^����� ���*%��� ���� �����������#���' � /�� ��!�#������� ������������#��% ���� ��!� ����� �� �
����������������������( ��������������� ������� ��#���� �� �%��� !���$� � ��� �$��� ��� �����!��������� �^ �� �% � � ���� ���� � � ������$� #� ��� � ������� � "��%��� �% ��������������<�^ ���� � # � � �����������'������$�� �%��� ��� ��'� � �����������!���������� �% ���]����%��� �� ��!������������� �'��� � � ������� � ��� ^ �� ��� � ��'������� �%��� ��% �� �����!����������� '��� �� �� \% � !�� �� ��� ��� � � ������ ��� $�# �����#�'�� ������� ������� �!�����������% ������!������������#��%�����$#����� #�����$������ �� ������� �!�������!�$�#����'����� � ���%���#� �������%�����''��'���� �� � ���%�#�� ����������� �� ������� � �� ^ �� �%��� �����!��������� '��� �� �� �� � �$�� '���� � ��� !���$� �� ��#� ��� '�����$����� �% � !���$� � ��� � �!��� ������$������������ ����%��%��������\% � !�� ����^ �� �%��� ��������#�� #�$�� �� �'��� �� �_�/����� � �$�] �� #� ��������$�� ������� ���� ������� ���������!������������$�# �����#��� �&���##�������������������� '������%����������� ���$� �%�^ �!�$�#��%���� ������� ���������!�������������� �� �����"%������������!����������!����#$������% ������������� ����$ �����*����������������� �$������ #� ��� ���$� ���� � ������� � ��� �����!�����������#�'���� #��$�� �%�������� ��%������%�^ � !�$�#� �%��� � ������� � ��������!�������������� �� �����"%������������!����������!����#$������% ������������� �\% � !�� ����������'��������%�����������������'��� ��� ������ ��� ��#� ����� � � �������� � %�^����� ���$�%�� ���$�� ��� �% � �����!��������� ��� ��# �� ��� ��%� ^ � �% � �#^����� �� �!������!��������� ��&�� �%�����$#��� � ������� � ���# !�� #���� �% �!� �$ ���$�"������� ����!�$� ��� ������' ��� �"��%� �% � ��'� � ���������!������� ����% � ���# ��������% ���'�������# ^ ��'� ����!��% ����� ��� ������� �����$# ����������^ ����$''��������% ����� �����'����^ ���� ���� $����' ����^ �� �$�%� ��� � ���� $�"������� ��� '������'�� � ��� #$������� ��#� ���������� ��� ���������� ���� $����� �% � ���� ������'�������� ���$�� �% � ���� ��� !�$������ �% � ���� ��� ! ������ �% � ���� �� ��� #�^ ������ �% � ��������� '$�'�� � ��� !$������� �!� �% ����� ���#�^ ������� ��$�� ���"���!�����% ����� ���"��� !$��������$������% �� ��$�� ��!������� ��# ^ ��'� ������� ������������ ���������� ����!��������� �������#�#���������% ����� ���=���������� �% �� ����[�����% �����$��� ���'��'�� ���%��� ������ �������������� ��#� � �� ��� "���� � ����� �%��� �%��� � _$�%� � ������� � ���� � � '�����^ � ��$����� � ������ ���������� ��#�'� #��������������� %�^�������% � ����^��#�������#�����#��%���������#$������ �^ ���� ������� ����������� � ��� �������$���^ ����!������"��%����% ������������������%�"������% �!��$� ��� ������� �����%��� ����'��� ����#�^�#$�����#����������������!�������
� Hung & Tsai�
The 17th International Conference on Electronic Business, Dubai, UAE, December 4-8, 2017 ���
�_� '% ����\����%����������� � � � � � � � � � �
\��� �����&�#�^�#$���� ������� �����%��� �!�������
�����$����������
�% ��' �'� ��� ����$���� #�����% ���� �%�#���!�#������%�������% � �!��� #�%������� ��� �������� ������%��� ���#���!�������!�� ������� �
_ �� ��!�� �$����� �% ��' �'� �! ���%����% ���� �$���������%� �� � #�����"����'��#$� �� ������� �
/��������!�������� �% ���% ����� ����!�"�������'��������%��� ��� �'��� ���!� ��"��������$���% ���������������#�'��
� ����!�$����"���
*%��� ��!� ��� �#��������!$�������#�$�� ��������
_ � ���^ �'��� ��������!���������
� �'� �"����� � ���^ ���# ���"��%���!����������������������% ���% ������!��% ���$�# �����#����\% ���������������% ���!����������%���!�����% ���"���#�^� "��"%�� ��$������������#� � ������% ���
�
��
\��� �������������������������� ������%��� �!�������
�����$����������
�% ������������������ ����$���� #�����% ���� �%�#���!�#������%������ ��% � �!��� #�%�������� �������� ������%��� ���#���!�������!�� ������� �
_��$��$������ ����� �% ����������������%�^ ��$�������$�� ���!�� �%���������������������������������� ��$�%����!��������������% � ����$��$������# ���"���������'��������$�� ����� ���#� �� ��� ���� ������������%��� �
\ �# ���������� '��'��������%��� �
���������������� ���# �$'��!��������� �����^ ��$����� ����% ��� ^��$���������� ��� ��!��% ������������% ��"����� ��!! �� #�� �� ��������� !! ���^ ������� �'������� �� �$��������������%��� ��
���$'���� ������
/^ ���!��% ���#�^�#$���"���������%��� ��% �� %�^������% ����$'�������"����������'��#$� ���!�` #� !! ���
\%� ������'��! ����������
�
*%��� ������������������������%� �� ���' ��!���'��! ����������# ' �#��������% ���� �
\%� ������ `�������'�" ��� �������%�'��
� #������$������!�# ��������������'�" ��"�����%� �� ���% � `�������'�" ��� ������������% ��������������
\%� ������ `�������� ��$�� ������������
\%�� �"%��%��#������# ���� �� ��$�� ������% ���������������"�����!� ��^� "� ��%��� ��������]����%� ���\% ���!� ��"�������� '��% ��� `�������� ��$�� ��
�
� � � � � � � � � � � � � �� �
���$� ������$� @�&�#�^�#$������#������������������� ������%��� ������% �!��������� ������!���� ���������%��� ��� ������\% ��%��� ��%� �� ������#����������������#�^��$ ���]������������#�� �%�#�����#��$��� ������ � ����� ������� ������ ��^ �����#���� #��� ���$�%�������'���������"%��%������ � ����������� #�������'��������#�# ! �� #���$�%����# ������������������#������ ��"%��%��� ���� �#�!!��$�������# ���!����#������ ��_���� �� ��!���� #$�������� ������ ������� �����$# �� �
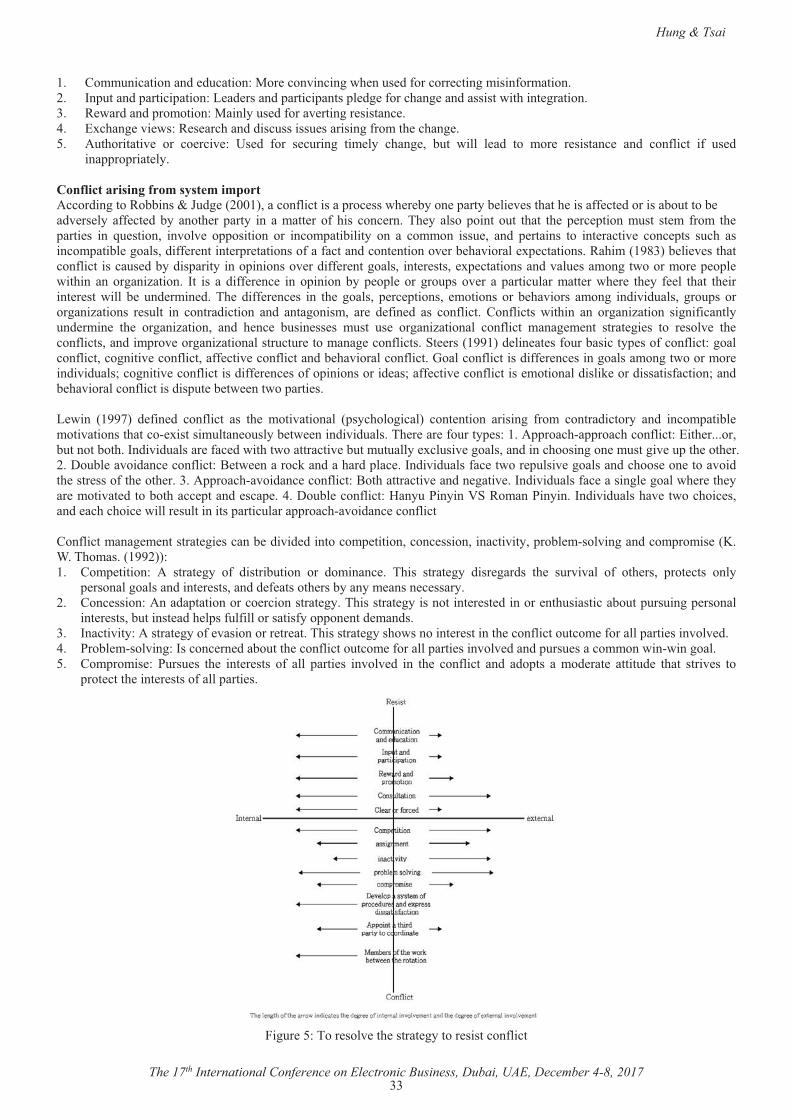
� Hung & Tsai�
The 17th International Conference on Electronic Business, Dubai, UAE, December 4-8, 2017 ���
�� *���$�����������#� #$����������� ����^�������"% ��$� #�!������� �����������!��������� ��� &�'$����#�'������'�������� �# �����#�'������'�����'� #� �!����%��� ���#��������"��%���� ���������� � "��#���#�'�����������������$� #�!����^ ������� ������� �@� /`�%��� �^� "���� � ���%���#�#���$������$ ����������!�����% ��%��� ��� �$�%�������^ � ��� �� ���^ �� >� #� !��� � �$����� ��� ��� �%��� �� �$�� "���� � �#� ��� ��� � � ������� � ��#� ���!����� �!� $� #�
���''��'���� ������� ������������������������(���� ������#�����������������}$#� ��������������!����������'��� ���"% � ����� �'������ �� ^ ���%���% �����!! �� #����������$������ � ��#^ �� ��� �!! �� #���� ����% ��'����� ��� �� ���� �� �!� %��� ���� ��� \% �� �����'����� �$�� �%��� �% �' �� '����� �$��� �� �� !���� �% �'���� �� ��� �$ ������� ��^��^ � �''�������� ��� �����'���������� ��� �� ������� ���$ �� ��#� ' ������� ��� ��� �����^ � ���� '��� �$�%� ��������'����� ��������#�!! � ������ �'� ���������!���!������#����� �������^ ��� %�^������ `' �����������%������[���� �� ^ ���%������!����� �����$� #����#��'����������'��������^ ��#�!! � ���������� ��� � ����� `' �����������#�^��$ ���������"�������� �' �'� �"��%��� ���������������� &�� ��� �� #�!! � �� � ��� �'��������� ' �'� ���� ���$'�� �^ �� ��'�����$���� ���� �� "% � � �% �� ! �� �%��� �% ������ � ��� "���� � � $�# ���� #� \% � #�!! � �� �� ��� �% �������� ' �� '������� ������������ %�^����� ������ ��#�^�#$����� ���$'������������������� � �$��� ��� ������#������� ��#� ������������ �� � # !�� #� ��� ���!����� *��!������ "��%��� ��� ������������� �����!��������$�# ���� � �% � �������������� ��#� % �� � �$��� �� �� �$��� $� � ��������������� ���!����� ����� � ��� ����� �� �� ��� � ���^ � �% ����!���������#���'��^ �������������������$��$� ��������� ����!������_� ����������# ��� �� ��!�$����������' ���!����!��������������!�������������^ ����!�������!! ���^ ����!�������#�� %�^���������!�������������!��������#�!! � �� ������������������"�������� ���#�^�#$������������^ ����!��������#�!! � �� ���!��'�����������# �����!! ���^ ����!�������� ���������#����� ����#�������!����������#�� %�^���������!��������#��'$� �� �" ���"��'���� ���� "��� ������� # !�� #� ���!����� ��� �% � ����^�������� �'���%���������� ���� ������ �������� !���� ������#������� ��#� �����'����� �����^��������%������ `�������$���� �$����� �" ����#�^�#$����\% � ��� �!�$����' ������''����%��''����%����!������/��% ������$���������%�&�#�^�#$������ �!�� #�"��%��"����������^ ��$���$�$����� `��$��^ ����������#�����%��������� ��$�����^ �$'��% ���% ����=�$�� ��^��#��� ����!������< �" �����������#���%��#�'��� �&�#�^�#$����!�� ��"��� '$���^ ���������#��%��� ��� �����^��#��% ���� ����!��% ���% �����''����%��^��#��� ����!������<��%���������^ ���#�� ����^ �&�#�^�#$����!�� �������� ������"% � ��% ���� �����^�� #�������%���� '����#� ���' �@�=�$�� ����!����������$���������_��������������&�#�^�#$����%�^ ��"���%��� �����#� ��%��%��� �"����� �$����������'�����$�����''����%��^��#��� ����!����� ��*��!���������� � �������� �� ������� �#�^�# #���������' ������������ �������������^�����'���� �����^������#����'����� ������\%���������������� *��' �������� �� ����� ��� �!� #������$����� ��� #������� � \%��� ����� ��� #��� ���#�� �% � �$�^�^��� �!� ��% ���� '��� ���� �����
' ���������������#���� � �������#�# ! ������% ����������� ����� � �������� *��� �����������#�'������������ ����������� ���\%�������� ������������� � �� #������� ��%$�����������$��'$��$����' �������
��� � ������$������ �#�% �'��!$�!������������!���''�� ���# ���#�� ��� &�����^������������ ����!� ^���������� �� ���\%�������� ����%�"�������� � �������% ����!������$���� �!�������'���� ����^��^ #� �@� ����� �����^�����&������ �� #����$���% ����!������$���� �!�������'���� ����^��^ #���#�'$��$ �����������"���"�������� ��� *��'����� �� �$��$ �� �% � ��� � ���� �!� ���� '���� �� ��^��^ #� ��� �% � ���!����� ��#� �#�'��� �� ��# ��� � �����$# � �%��� ����^ �� ���
'��� ����% ���� � �����!�����'���� ��
����$� ����\��� ���^ ��% ������ ������� ��������!�����
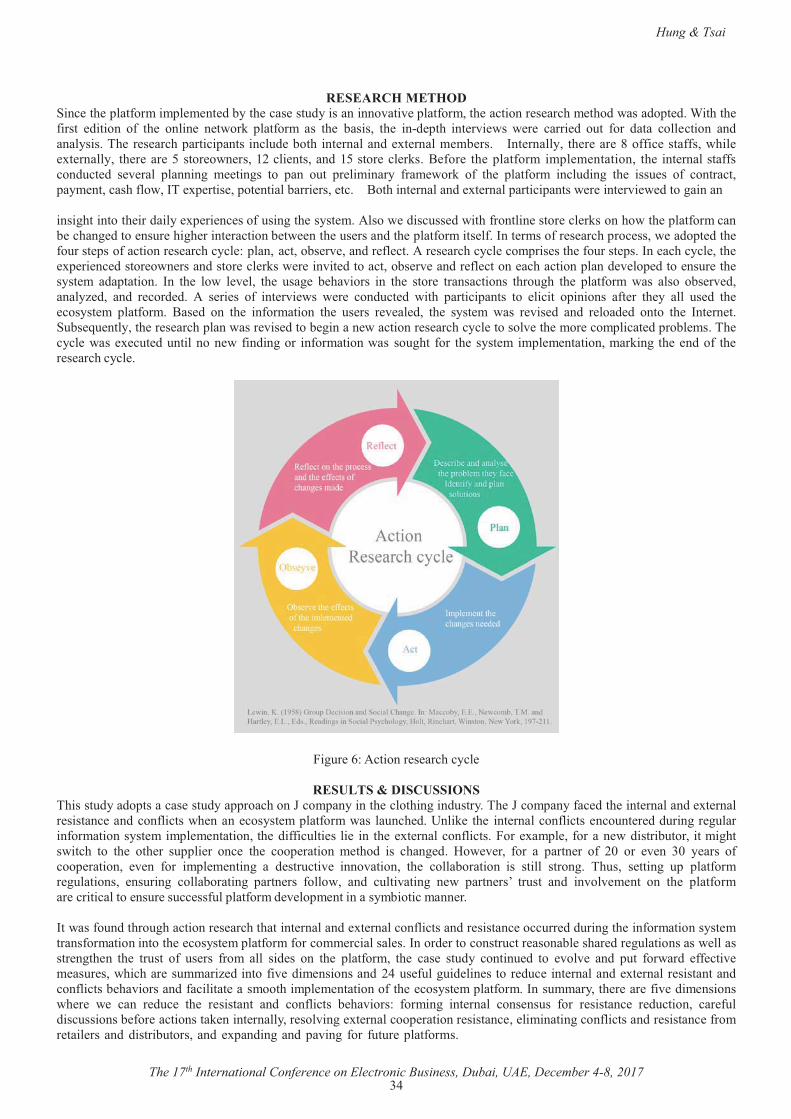
� Hung & Tsai�
The 17th International Conference on Electronic Business, Dubai, UAE, December 4-8, 2017 �@�
��$�$���%�#$�%�!�
_��� ��% �'���!������'� � �� #�����% ���� ���$#������������^���^ �'���!������% ��������� � ���%�� �%�#�"����#�'� #����%��% �!����� #������ �!� �% � ����� � � �"���� '���!���� ��� �% � ������� �% � ���# '�%� ��� �^� "�� " � � ����� #� �$�� !��� #���� ���� ������ ��#����������\% �� � ���%�'������'���������$# ����%���� �������#� `� ������ �� ��� � &�� �������� �% � ��� �[��!!�� ����!!���"%�� � `� �������� �% � ��� ������� �"� ���������� �������#�������� ��� ����< !�� � �% �'���!���� ��'� � ��������� �% ���� ��������!!�����#$�� #� � ^ ���� '�������� � ������ ��� '��� �$�� '� ��������� !��� "���� �!� �% � '���!���� ����$#���� �% � ���$ �� �!� ����������'��� �������%�!��"��&\� `' ���� ��'�� ����������� ���� ��� � <��%���� �������#� `� �����'������'�����" � ���� �^� " #������������ �������%��������% ���#����� `' �� �� ���!�$������% ����� �������" �#���$�� #�"��%�!������� ����� ��� �������%�"��% �'���!��������� ��%��� #���� ��$� �%��% ����� ��������� �" ���% �$� �����#��% �'���!������� �!�&��� �����!�� � ���%�'��� ����" ��#�'� #��% �!�$���� '���!��������� � ���%����� ��'������������� �^ ����#�� !� ������ � ���%����� ����'��� ���% �!�$���� '��&�� ��%����� ���% � `' �� �� #����� �"� �����#����� ��� ����" � ���^�� #������������ �^ ���#�� !� ������ ��%��������'����# ^ ��' #���� ��$� ��% ����� �� �#�'������� &�� �% � ��"� � ^ ��� �% � $��� � � %�^����� ��� �% � ���� � ������������� �%��$�%� �% � '���!���� "��� ����� ��� �^ #�������� #�� ��#� � ���# #� �� � �� �� �!� ��� �^� "�� " � � ���#$�� #� "��%� '������'����� ��� ������ �'������� �!� �� �% �� ���� $� #� �% � ������ �� '���!���� <�� #� ��� �% � ��!��������� �% � $� ��� � ^ �� #�� �% � ���� �� "��� � ^�� #� ��#� � ���# #� ����� �% � &�� �� ��_$�� �$ �������% �� � ���%�'����"���� ^�� #����� ������� "��������� � ���%����� �������^ ��% ���� ����'����� #�'���� ���\% ����� �"��� ` �$� #�$��������� "�!��#������� ��!���������"��� ��$�%�� !��� �% � ���� ����'� � ������������������% � �#��!� �% �� � ���%����� ��
��
���$� �~���������� � ���%����� ��
�$�"&���Z�!���"�������\%�����$#���#�'�������� ���$#���''����%����}����'��������% �����%������#$�����\% �}����'����!�� #��% ���� �������#� `� ������ ������� ���#����!������"% ����� ������ ��'���!����"��� ��$��% #�>���� � �% � ��� ��������!������ ���$�� � #�#$������ �$������!������������� ����'� � ����������% �#�!!��$��� ���� � ��� �% � `� ��������!���������� `��'� ��!������ "�#������$�����������%���"���%� ��� �% � ��% �� �$''�� �� ��� � �% � ���' ������� � �%�#� ��� �%��� #� ��" ^ ��� !��� �� '���� �� �!� ��� ��� ^ �� ��� � ���� �!����' �������� ^ �� !��� ��'� � ������ �� # ���$���^ � ����^������� �% � �������������� ��� ������ ������� \%$��� � ������ $'� '���!����� �$��������� ��$����� �������������� '���� ��� !����"�� ��#� �$���^������ � "� '���� ���� ��$��� ��#� ��^��^ � ��� ��� �% � '���!������ ������������� ��$� ��$�� ��!$��'���!����# ^ ��'� ���������������������� ���&��"���!�$�#��%��$�%��������� � ���%��%������ �������#� `� ��������!��������#�� ������� ����$�� #�#$������% ���!������������� �������!���������������% � ������ ��'���!����!������� ��������� ��&����# �����������$���� ������� ��%�� #�� �$�����������" ��������� ���% �� �% � ��$��� �!� $� ��� !���� ���� ��# �� ��� �% � '���!����� �% � ��� � ��$#�� ������$ #� ��� ^��^ � ��#� '$�� !��"��#� !! ���^ �� ��$� ���"%��%��� ��$������ #������!�^ �#�� ���������#� �@�$� !$���$�# ��� ����� � #$� ���� �������#� `� ������ ����������#����!������� %�^�������#�!�������� ��������%���'� � ���������!��% � ������ ��'���!����&���$��������% � ��� �!�^ �#�� �������"% � � " � ���� � #$� � �% � � �������� ��#� ���!������ � %�^������ !������� ��� ����� ���� ��$�� !��� � ������� � � #$������� ��� !$��#���$�������� !�� ������������ ����� ��������� ���^���� `� ��������' �������� ������� �� ��������������!��������#�� ������� �!����� ���� �����#�#������$��������#� `'��#������#�'�^���� !��� !$�$� �'���!�����
� Hung & Tsai�
The 17th International Conference on Electronic Business, Dubai, UAE, December 4-8, 2017 ���
�&�� ��� � "��%� �% � � #�� ������� �% � � �� � !����"���� '�����'� �� ��� !����"�� ��� �����!�� �% � � � ������ �!� �%��� �� # ���$���^ �����^������ �$��� � � �$''���� ��� �������� ��� $�# �����#� �% � ���'������ ��'������� ��� ��� � �� ��� ����� ���!!� ��� '� #���� �% ���'� � ��������'��%�����'� #�����% ��" �� ����!��$�� �����#��% �'�����!�!���$� �� ���$��� � �% ����� ��$������ � ^� "�' ����� ���$���^ ��#$ � ��� �%��� � ��#� � �� �!� �' ����� � ��� !��� �%��� ���� ��� &\� ���!!� ����������# �������� �������$� �'���!�������������% ���� ����� ��#� `� ����� � ������� � ������� # ^ ��'���� �% � � ���� ���������� ��������� ��#� �' ��!�������� ����� � ���� ��!�"�� � ��#�%��#"�� � �%��� � ����� � ���� !��$����� ��� �% � # �� ��%�'� ��#� ��^���� � ��$�� �� ��� �$�$��� ����$����������� � ������ �% �� �'��� � ���� � !��� � ��� ��� �� ��� ������� `� �� ��� ���� ����� `' �� �� �� ������ ��#� ���������� '��^�# ��� ��^��^ � ���� �����%���^��� ����#�!���������!��"��������# ��������#������#���`�� %�^��������� #$� ���"����!������������ ���� �^� "�� ����������������� ������ `' ����#^�� ������ �^� "������#�^�#$�������� #$� �'�� ���������!��������$��#����# '����� ��#� ��$��� � �%������� "%��%��� ��� �����# !�� #�����% �'���!�����' ��!����������#^ ��������'���!������� �������%��% ���� �������������� ���$��� ��$���� �����������#$� ��% �'���!�������#�# ^ ��'������� �����^ �'��#$���������������'�� �������$''�� ���
�\% �!�^ �#�� ���������#��@��� ����� �# ����� #�� ��"�� ��� �������� ��������� ��$���\��� #$� �� ������� �� `'�������� �'��� ���%���� "�'��%"����!���� "���#����^ � #� `'�������
��#�'��!�����%�$�#���^��^ ����%�!���������^���^ ���#�#�!! � ����� #�'��#$���������� ���������� ������!�������"�������� ���!����% ��$�^�^����!��% ��$��� ���
���� \% ��' �������'�����'� ���!��% ����'�����$����%��� ����#���'� � ���������!�#���$'��^ �����^������� �$�� ����� ������$''����\���^��#��%��������$���� ��^��$ ��� "���� ����' ���������$���� �������$�$���� �������% #����#��%��������$���� ��� #���$���� �'� #��� #���#������!� #�
���� /^��$�� ��% ����'���©���$��� �����'����������#���!���� �'��� ���!� `' �� #���'� � ��������#�� ���������� <��#���'� #�����$�� �����#�!���$� �������� ����� ��������� ��$���@�� � ^� "� ' ����� �� �%��� � !��� �'��� �� "%�� � !$� � �%��� � _ �� $'� �� � �'������ ����� ���$'� ��� �^ ���� � �% �
������������ �!� �% � ��������� ��������������� !���� ��#� ��%� ^ � �� $����� �%��� ��� !� `��� � ��#� #�^ �� � ��� �%��� � �% ����'���©���#�'������������ `� ����� �^����� ���
���� \%��$�%� ����$��������� � �"���� � �%�������� ���� ��� ���"� #� �� ��!��������� ��#� ��� ���� � # #� ��� ��%� ^ ��$��� ��� ������ ����� �� #������� ��#� ��� ���� #� $���� !��� �% � ���'���©�� � ��$�� � $����������� <� ��� �%��$�%� ������� ������������������$�#��� ����#�$����� �� ������ `� ������ ��$�� ������ ���� ��$��� ���������
��� �!� ����� !$��#���$�������!���� ��������������$� �� ������� � ������ ������� �!�` #�'��� ������#�$� �� "�� �%������ �����
��� ���� ����' ����^ � ������� *��#$���&\����!!�������������� = ����� �������$� �'���!������#���� ����������$������ �������#� `� ������ ������� ����� *��'� � ���$#���!�� ��������������@�� ����$��� ������������#�����#��#���'������'�����$������� ���������� ��������#���� ��� ����� ��� ���!�"�� ���#�%��#"�� ��%��� ���%����� ����'����� �"��%����� ��*�����' �������� ���'%�� ���!�� ����� �'��� �� �
��� � ���^ � `� ��������' �������� ������� ���#� �������%���!�^����� ����' ������� �^����� ���_���^ �!���������� ����� �" ��
�% ��������!�'���� �����#��% ����'���©������������ ��������� � ��� �^� "�� ��#� ����$��������� "��%� � �� #������$����� ���� � �%��� �� ��� ��� �� '��� ���� ��#� � �$ ��� ��� $� �
����� �# ^�� ��!�������$�������������� �$���������� ������������!����$�!��������������� \ ����$������ ������$�� ��������������� �� `' �� �� ����� �� ������� ������������� ����$���� #�����% ��%��� ������% �
��� ����# ���$�%������� #��� ���$'���#�����% �'��#$���&=��!��% ���� ���� ���������� ������� ������� #��� ���'����$'�� ��%��#�� �
���� ���^�# ���������#�����������'��^�# ���"��%���!�"�� �������� �� �'���!�������^ �� �� ���" ^ ������%�!��"����� ��� �����������^ �� �����#�������� �$�� ���% �$� ��!��\����������! ��
�@�� \����������� %������ ��#� ��`� ��"�� �� � ��� �� ����� ����$��� ��� ��^��� �� ��#� ���%� !��"� ��� �^��#� ^��������� ��`� ��"���%�" ^ ���� ���� ����� ��������$���� #������� #��� ���� ���#������^��� ��$�� ���
�@� /������� ����!��������#�� ������� �� �" ��� ���� �����#�#������$�����
���� *��#$��� !��$�� ��� �^� "�� ��#� ������� `' ��� �'������ *��#$��� � ����� � �" �� �$''�� ��� ��#� '������� # ���� ����� ���� �����$��� �������� ����"�� %�$� ����$'�� �# �����#����� ��������!!����!��#����$������
���� *��#$�����#�^�#$������ �^� "������ #$� �!$�$� �������#����������#����!���������#�� ���% ��#^�� ��!�����$���������#���"� ���
���� *� �����# !�� �# '�������#���$���� �%�����������% �'���!�����' ��!���������@�� /�������%����� �����^ �������$#������� ���^�# � ��������� ����� �����������!���������
��� \��'�^ � �% �"��� !��� !����"�$'�'���!����# ^ ��'� �����#��� ����"��� !���� ���#����������# ��!����' �������� ���� �#��!�
���!������������#�'�����' �����������' ����^ ����' ���������#����' ����^ ����' �����������%����%��$�%���� ������# �� ��!����' ���������#�� ��$�� ��%������������' ����^ ��#^����� ������ �!�$�#���% � �����%� ^������"���"������$������
���� >� �#�� ���� ��������$����������% �'�� "��� ������' ��� ���� ����!�# ��������� �#^ ���� ���#�'����� ��% � �������%� ����!��% �'���!�������% �
� Hung & Tsai�
The 17th International Conference on Electronic Business, Dubai, UAE, December 4-8, 2017 �~�
���� ����������#������#$� ��$���� �����$�%����� "��$���� ��^�$�% �����#���� ���^ �'�������� ��@�� ����$��� �� �%�#��!����##������% ��'��#$������#��$''�� ��� ��� ���$��� �'�� �������$''�� ���"%������� �% �������
&�^ ������ ��% �'��#$���# ���#��!�'���!�������� �����#������#������!��#���% ����' ���!�'��#$����!����% �'���!�������� /`' ���� �� �������%�� ��% ���� �' ���^ �'���!����������%� ^ �� ��$�� ��%��������#�'��#$�������$�����������%����% �
'���!��������� ��$�� ��!$������'� � �� #���% �����$��� ���'��'�� �������!�����������������������������#�� �� ���"����� �����\%���� ������� �%���'�����^ ������!����� �����������������������# ���� �# �� ��!�� %�^������������������#�'� #�������������#�'� ^ �������%���������#���� %�^����&���������������$��� �� ��������!�����"��%����% ������������������ `��'� ��"% �����$��� ���'��'�� ����� �������������'�����������^�������!�������'��#$������ ���% �� ������� �����%��� �"����'���'��#���$��������!��% �'������#�������!��%��� ��"%��%������ �$������� �� ��# ����������" ^ ���� ������� �����%��� ����������� �� ����^ ����$�# ������������������������#�'�����������#�'���� ����\% � !�� �� ��� ��$� � �% � �$''�����!� ���' �������'���� �����#�# ^ ��'� ��$��� ��#�'������'�������!�� "�'���� ���� ��� ��� ��$����� ���# ^ ��'� '���!���� ��"�� ��#� � �$�������� ��� � �$� � �$�� ��!$�� ]����� # ^ ��'� ��� �!� �% � '���!���<$��� �� �� ��#��� �$��� $� �������������� ���!����� ����� � ��� ����� �� �� ��� � ���^ � ��� ����� ��#� `� ����� ���!������� ��#� ����� � �% � ���!������ �%��$�%���'��^����������������������$��$� �\%������� ��$� ����!��������� ��!������� �# ' �# �� ���#�#�!! � �� ��������� ����� � ������#�% �� � ���� � � ����� #� ��� �#]$������ ��������������� ���$��$� � ��� �^ ��� `������� �$�%������ ���$��$� � ���� � � `���� #� ���# � ���� � ���� ���'���������� "��%� ��������������� � #�� &!� ��� ������������� %��� ����� ���� %� ����%����� �������� #$ � ��� ���"�%� ��#�#�!! � ���������� �$�%������ �$��� � � !$��% �� �� ����� # � ������� #� !��� ���!����� ����� � ��� &�� ��'� � ������ �%��� ��� ���!���������� � ��� ���� � � �''����% #� ���� ���= ^ ��'���� �� '��� #$� � !��� `'� ������ #�������!������� ��#� $�# �����#���� �''���������# �������/���$�������� �%��#�'����� ���� ������ � ��#� � ���^ ����!������� �" �� �$��$�������� ���� %��# ���� ������������� �$��$����� �� ������ ���� ���� � `�%��� ���#��$�$���� ������� � ��
����&"������������^���^ � ������ ��'���!��������% �� ����%��� �!������ ������$��� ���\% ��$�� ��!$���!���'���!����# ���#���% �!$����$''�����!� �$��� ��� �' ������� ��#� � #�� ��� ���� � '���!���� � �� ��� ��� �� `���� ��� %������� ������� � ���!������ ��#� � ������� � �� �!�� � ��� �� �' ������� � ������� � ������� !���� �% � �$���# �� "%��%� � ����� ����� ��� ��$#� #� ��� �% � '���� ��� ���$� � \% � !�^ �#�� ���������#��@�'�����'� ��!�$�#� ��� �%�����$#������% �'������ ����!��������#� � ������� ��%��� ��� �#$����� �% �� "����� ����'� � ��������� �% � ��� �%������� �% � �$''���� ��#� ��$��� �!� ��� ����� ��#� `� ����� '���!���� � �� ��� ��#� ��`���������''���$���� ��� �#�������'���!�����$�� ���
����%��% �# ^ ��'� ����!�&\�����!��������$!���$� �����#�����$� �����������#���� ��������% #���!������������$������ ������ ���!�����������#� !! ���^ �#����������������#�� �������#����$��� ������� ����$''�����#�# ���#����#������!���% �������%����������� ��� #�������� �$�����% ��$��"%�'� !! ������ ������� #��"%��%�#�� �������" ����' ���������������#� ���� ���# ���� ������ �� �'��� �����$���� ��� #��<$��� ��������!������������\��"����%�$�#������# ���$���� ������$���� ���*�*����#��$��� �������$��� ����������$� ���<�<�*������� �� �����#�� �����$!���$���������^���������� #�����$���� ��� #����" ^ ����% �!���$� ���� ��!� ����^���^ �'���!����� ��� `�� � ���%��%�� ��#� �%��� ��$#����� #� ���% �'�'� ^ ���������� ����� ������ ��#� � #$� �'�� ���������!��������#�� ������� �������� �� ��% ��%��� ��!����$�� ��!$����'� � ���������!��% � ������ ���
�$*$�$��$�£�¤� �������*��������&�����$�������� #�� ������� ��������������������%��� ��# �����������������#�� '� ������Journal of Business Ethics��
�~������������� �£�¤� <�$� ��%����<������' ����%��������@��\�"��#���# !���������!����'���� ������!���������Sloan Management Review��
�������������~�£�¤� <�^ ��� ����� � # ���������� � � ������� � ��� ��������������� �%��� �� �% � ��� � �!�# ! �� �� �%������� Journal of
Managerial Psychology���~�������@��@[�£@¤� =�^ �'�����\���������Process Innovation: Reengineering Work through Information Technology.�<��������������^��#�
<$��� ���_�%������ ���£�¤� =��������������� �% �� ��}�*����[���The Management of Information Systems�� "������������"�����.�£~¤� �$� ��/�����[���Organization Development and Change ���#� #��_����$�������� ����$����%����£�¤� ���� ���}��������� �#�����%��� ��"%�������!��������� !!�����!����Harvard Business Review������������~��£[¤� �������� }� � ������*��� ��� � � � �%��� ������� ������� � ��� �%��� �Journal of Applied Behavioral Sciences���������@��@@�£�¤� � "���� �� ������� Resolving Social Conflicts & Field Theory in Social Science.� ���%�������� =*�� �� ������
����%���������������������£��¤� ���$ ���� ��/���*������ �� �� ������ �� ������� � ��� �%��� ���� ��� ���$� � � ^� "���#� �'���������$#� Management
Decision��@�������@[�����£��¤� ��%�����������[���� ��$� � ����!�������������������!�����The Journal of General Psychology�����������[������£��¤� ��������� _�� ������� ��������������� �%��� � ��#� ��� ��� ����� � ��� &�� _�� �������� �� \�� }$#� � �������
Organizational Behavior�>'' ��_�##� ���^ ����}���� ���� ������£��¤� ���������_�����}$#� ��\���������Organizational Behavior: Concepts, Controversies, and Application��[�%� #��>'' ��
_�##� ���^ ����}���� ���� ������&�� ���������� � � � � � � � � � � � � � � � � � � � � � � � � � � � � � � � � � � � � � � � � � � � � � � � � � � � � � � � � � � � � � � � � � � � �£�@¤� _� ���������������Organizational Behavior��@�%� #���� "����������' ��*��������$����% ��

� Hung & Tsai�
The 17th International Conference on Electronic Business, Dubai, UAE, December 4-8, 2017 ���
£��¤� \%�����������������*��!�������#����!���������� � ����� !� ���������#�$'#�� �Journal of Organizational Behavior����������~����@� �
£�~¤� ��$� ����<�����������% �����!� �� �'��� ������!���������Systems Engineering��[�@�������������
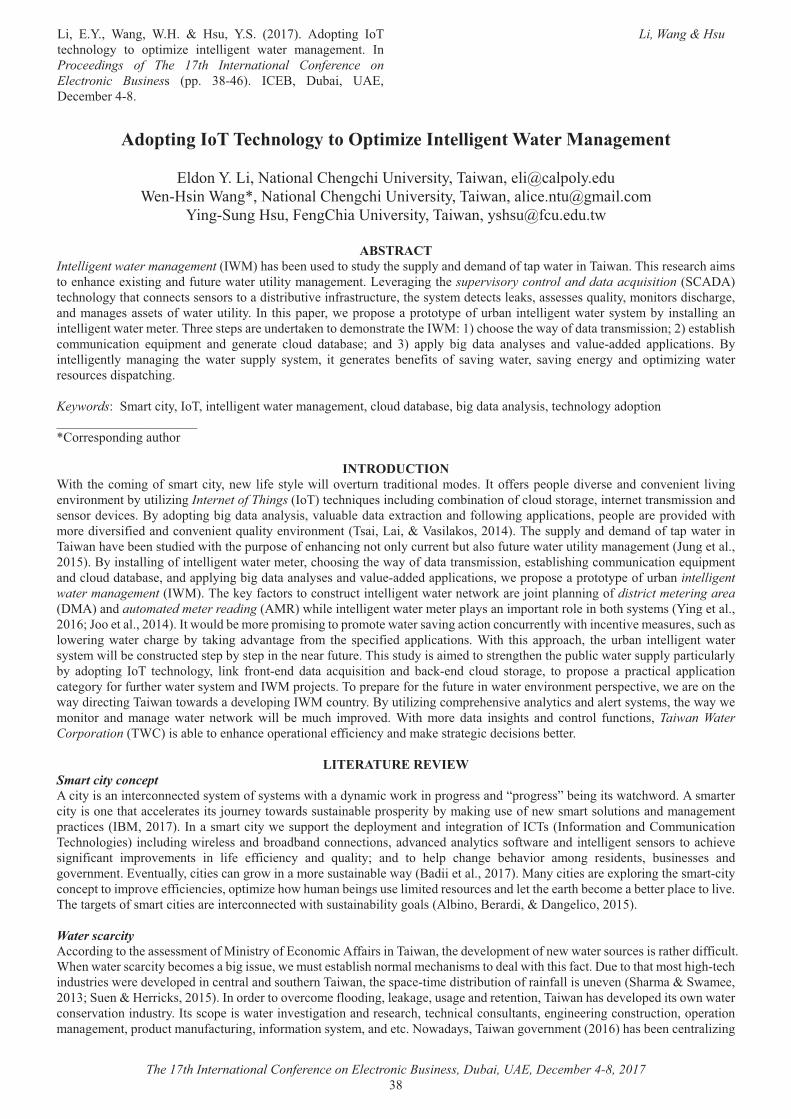
���� /��� ������ ��� �� ��$�� �_� ������� �#�'����� &�\�� �%������� ��� �'����� � ��� ���� ��� "�� �� ����� � ��� &��Proceedings of The 17th International Conference on Electronic Busines�� �''� �[�@~�� &*/<�� =$����� >�/��= � �� ��@�[��
Li, Wang & Hsu
�
�
The 17th International Conference on Electronic Business, Dubai, UAE, December 4-8, 2017 �[�
���(������������� ��������(����[����� �����;����#�������
/�#������������������*% ���%��>��^ �������\��"���� ��{���'��� #$�� �����������|�����������*% ���%��>��^ �������\��"�������� ��${���������
�����_$�����$��� ��*%���>��^ �������\��"������%�${!�$ #$�"��
���������Intelligent water management��&����%���� ��$� #������$#���% ��$''�����#�# ���#��!���'�"�� �����\��"���\%���� � ���%��������� �%��� � `���������#�!$�$� �"�� ��$������������ � ���� ^ ��������% �supervisory control and data acquisition��_*�=���� �%��������%������� ����� �����������#������$��^ ���!�����$��$� ���% ����� ��# � ����� �������� �� ���$����������������#���%��� ����#������ ����� ����!�"�� ��$�������&�� �%���'�' ���" �'��'�� ���'������' ��!�$�������� ���� ���"�� ������ ����� ����������������� ���� ���"�� ��� � ��\%� ��� '���� �$�# ���� �����# �������� ��% �&��������%��� ��% �"����!�#��������������������� �������%�����$��������� �$�'� ��� ��#� � � ��� � ���$#� #������ �� ��#� ��� �''��� ���� #���� ������ �� ��#� ^��$ ��## #� �''���������� <����� ���� ����� ��������� �% � "�� �� �$''��� ���� ��� ��� � � ��� �� � � !���� �!� ��^���� "�� ��� ��^���� � ���� ��#� �'��������� "�� ��� ��$�� ��#��'���%�����Keywords���_�����������&�\����� ���� ���"�� ������� � �������$#�#������ ������#��������������� �%��������#�'���������������������������|*��� �'��#�����$�%���
������!"������
���%��% ���������!�������������� "���! ����� �"�����^ ��$��� ���#����������# �� &���!! ���' �'� �#�^ �� ���#����^ �� ��� ��^���� �^����� ������$���������Internet of Things��&�\��� �%���$ ������$#�����������������!����$#������� ����� �� �����������������#�� �����# ^�� ��<���#�'���������#��������������^��$��� �#���� `�����������#�!����"�����''�����������' �'� ��� �'��^�# #�"��%���� �#�^ ���!� #���#����^ �� ����$������ �^����� ����\��������������������������@��\% ��$''�����#�# ���#��!���'�"�� �����\��"���%�^ �� ����$#� #�"��%��% �'$�'�� ��!� �%�����������������$�� ����$�������!$�$� �"�� ��$������������ � ����}$��� ������������<��������������!���� ���� ���"�� ��� � ����%��������% �"����!�#������������������ �������%��������$��������� �$�'� �����#����$#�#������ ����#��''����������#���������� ����#�^��$ ��## #��''�����������" �'��'�� ���'������' ��!�$�����intelligent water management��&����\% �� ��!����������������$������ ���� ���"�� ��� �"������ �]�����'���������!�district metering area��=������#�automated meter reading�������"%�� ���� ���� ���"�� ��� � ��'����������'���������� �������%����� ��������� ���������~��}��� ���������@��&��"�$�#�� ���� �'������������'����� �"�� ����^���������������$�� �����"��%���� ���^ �� ��$� ����$�%������" �����"�� �� �%��� ���� ��������#^����� � !���� �% � �' ��!� #� �''�������������%� �%��� �''����%�� �% �$����� ��� ���� ��� "�� ������ ��"����� �������$�� #��� '������ '�����% �� ���!$�$� �\%�����$#�������� #������� ���% ���% �'$�����"�� ���$''���'�����$��������� �#�'����� &�\� � �%�������� ����� !����� �#� #���� ���$�������� ��#� ����� �#� ���$#� ������ �� ��� '��'�� � �� '��������� �''������������ �����!���!$��% ��"�� ������ ����#�&���'��] ����\��'� '�� �!����% �!$�$� ����"�� �� �^����� ���' ��' ���^ ��" ��� �����% �"���#�� ������\��"�����"��#����# ^ ��'����&�����$�����<��$������������'� % ���^ �������������#��� ������� �����% �"���" ��������� ��#� ����� � "�� �� � �"���� "���� � � �$�%� ��'��^ #� ���%� ��� � #���� �����%��� ��#� �������� !$��������� Taiwan Water Corporation �\�*�������� ���� �%��� ��' ��������� !!��� ������#���� ������ ����# ��������� �� ���
&��$���"�$��$@�$;�Smart city concept ���������������� ����� �� #����� ���!����� ���"��%���#�������"�������'���� �����#��'���� ����� ��������"���%"��#�������� ������������ ��%������ � ��� ������]�$�� ����"��#���$�������� �'���' ���������������$� ��!�� "����������$��������#������ � ���'������ ���&<���������&���������������" ��$''�����% �# '���� �����#���� ���������!�&*\���&�!�����������#�*���$���������\ �%������ �������$#����"�� � �����#�����#���#����� ���������#^��� #�������������!�"�� ���#���� ���� ���� ������ �����%� ^ ������!������ ��'��^ � ���� ��� ��! � !!��� ���� ��#� �$������� ��#� ��� % �'� �%��� � � %�^���� ������ � ��# ����� �$��� �� �� ��#���^ ��� ���/^ ��$���������� ���������"��������� ��$�������� �"����<�#��� ��������������������� ���� � `'��������% ���������������� '�������'��^ � !!��� ��� ����'����� �%�"�%$����� �����$� ������ #�� ��$�� ����#�� ���% � ���%�� ��� ���� �� ��'��� ������^ �\% ����� ����!����������� ���� ���� ����� �� #�"��%��$����������������������������< ���#�����=��� ��������������Water scarcity �����#��������% ���� ��� ����!�����������!�/���������!!��������\��"�����% �# ^ ��'� ����!�� "�"�� ����$�� ��������% ��#�!!��$����% ��"�� ������������ ��� �����������$ ��" ��$��� �������%��������� �%����������# ���"��%��%���!����=$ �����%��������%��%�� �%���#$���� ��" � �# ^ ��' #����� ��������#���$�% ���\��"�����% ��'�� ���� �#������$������!�����!�������$� ^ ���_%�������_"�� ��������_$ ����� ��������������&����# ������^ ���� �!���#������ ���� ��$��� ���#�� � �������\��"���%���# ^ ��' #������"��"�� ������ �^��������#$�����&������' ����"�� ����^ ������������#�� � ���%��� �%����������$�������� ���� �����������$��������' ������������ � ����'��#$������$!���$��������!������������� �����#� �����"�#�����\��"�����^ ��� �������~��%���� ��� �����������

Li, Wang & Hsu
�The 17th International Conference on Electronic Business, Dubai, UAE, December 4-8, 2017
���
� ��$�� �����'����� ������%�!$����!�����$��$� �'��] ����&��"�� �� �^����� ���������$������'�����������'���� #�����$��#���������!���#��������� � �"����� � ������� #����������$�#"�� �� ��� ���� ����' ������� ��#������ � ��������������� �"����� ��'� "�� ����� ���� ��� "�� �� � �"����� ��� ���� ��� ��^ �� �$� � ���� ��� ��� ���� ��� �' ������� ����� � ��� �!� �$�������� �� � � �^����� ��#���'%������� #������������"�� ����^������#���% ����� ���� ���"�� �� �^����� ���� ���������� ������" �������% �������$�������!�&������� ��&������$����'���� #���#� `' �� #������� ��% �#�� �����"�� ��� ��$�� �$���������#�!���#������������ � !! ���^ ���$�������@���������������IoT development \% �&�\��������^ ��'���#�����%�!�� ���&\��� ���&�\�� �%������ ������� ��� �������� ���� ������������ �"�����"��%�� �"��� #������$� ������#�# ^�� ��&��%���� ��'���������� �� ��������� � ^ ������ �����'' ����"%��%���^ ���!�������#�������� �$�'� ������� � ����%�$� %��#���] �����}���� ���������@��\% �&�� �� ������������������ ���!���� ����� �� #����'$� ��� �"������%���$� ��% �����#��#� &�� �� �� '�������� �$�� � �\*�¡&��� ��� � �^ � ��������� �!�$� ��� "���#"�# � &�� ��� �� � �"���� �!� � �"����� �%��� ��������� �!�����������!�'��^�� ��'$���������# ������$��� ������#���^ ��� ���� �"�������!��������������������' ���%����� ����� #����������#��������!� � ���������"�� � �����#��'������� �"�������� �%������ ���%�� ������� ������%�������% ������� �������] �������' ������"%��%������ �#������$��%��� �����% �� ���"���#�/^ ��#�����] ��������$# ���������� � ��������# ^�� ��" � ���$�� ����#�$� �#������$�������� �%�������������#^��� #�'��#$�����$�%���� �$�'� �����#���#� ����<�##� ���� ��������&�������� "�&*\������� ���% ��� �^�� ���������#�!! � ���� ��������#�����$��#������� ���� ���#�������� $�������� ���$''�������$������' ��������\% �&�\���������$��!�� ^ ���%��������$��"���#�$�# �������������!�����$��$� ����^����$��������������������!��%��������$�#�$����$�������� '����$����!��� #��!��% ����� ��!��% ��%�������$�� �����������$���� �������������District Meter Areas District Meter Area��=�������# !�� #��������� ���!��% ��$''���� �"����%�^�����# ��������$�������'��' ��� ���$''�� #�'� ! ������!������������� �����'�����"%��%����� � � #�� ���"�� �� �� ��������� �^����'��������#�'� ��$� ��������� #�����=����#������ ���������\% ��������] ���^ ��!� �������%������=���������� #$� �� ������� �������� ��������������� '���� �� ^ ����#�����������%���� ^ ���%��$�%��% ��''����������!�'������^ ������ �� ����$�%��������^ �� ���� �*�������\% �� �%���$ ��!�� ���� ����������������% ���]��� �������$���� ��� ����� !! ���^ � ��#� !!��� ��� � ���� � ����� � ��� �_�$��� �� \%�������� ������ \% � �''��������� �!� =������� '��%���$��^ ������''����������������� �"������#��%���� �%���$ ����� ����� �!���� ���� �� #$��������#����������������� ����\��"���������Intelligent water management \% �&�� ������������� ���������������&����"�� ��� �%�#����������������$������$������������#������� ���� #��''����%����"�� ���������������\% � ����������#��#�"�� �������� ������'��� �!��� ^ ���%��������%�"�����\��� ���������� ������������������� ���������\% � �" � ��$� ��$�� `��'� ���!��% �$� ��!��&�� �%�#��!����% ������ � ����!�� � �� #�������"��%����% �"�� ���$''������� ������!������� $����� �"������# ��"��%�� � �����������%��"���$� #������ �� �'� ��$� ������ � �����# ��!���$�����"�� ��#������$����� � �"����� �� � �%���$ � $� #� !��� � ���� � � #$������ ��� '� ��$� � ����� � ���� "%��%� ��� �� �% � #�� ��� � �������%�'�� �" ��� ���� ���#�'� ��$� ����������$������$���������_�^��������' ��������[������!� ������������\% ��' ����������������������#�����������^��^ �# � �������!�'�' �� ���� ���
\��� ���&���_���#��#���� ��<����� �_��� ��&�'$��
���$� �
�$�%���� #�*���$�'�����
<��� #��$�%���� #*���$�'�����
<��� #�� � � #�*���$�'����� � ^ �$ ��� ��<��� #�>�� � � #�*���$�'�����
>����� #��$�%���� #�*���$�'�����
>����� #�� � � #�*���$�'����� ����� ^ �$ �
��� ��>����� #�>�� � � #�*���$�'�����
��� ������ �� �''�� ������� �� >��$�%���� #�*���$�'�����*$���� ��� � ��&����$���� ��
� ������� �� � ���� ����\��������������=������$������������ ���� ���#��^ �!��"����� � �^������ ���� ����_ �^�� �*��� �������$'����� � ��'�����
��$�$���%�#$�%�!��
\% ���$�� ���!��%�����$#���� ���� #�����% ��' ��#����� � �� #�����% �" ���� ��!�\�*���#�_*�=������ ���$���� ���=����!�=�������������� �����\���%$����$�� ���#���������\��"���\% �� ����'%����������������#�=����!��%���� � ���%�"����%�"��������$� ���\% ��������$�� ���!�"�� ��$� ������@[��%�$� %��#����% ��^ ������ ���%��!�'�' ��� �����@������ � ������#��% ���]�������!�� ��# ��������%����� ���� �%�$� %��#����#�'$�����!������� ���\% ��^ �������� ���� ���"�� �����$��$� ������ �#�^�# #������!�$��'������!����� �#�#�������$���������� �"���������������������$#������� ����#�����������''������������������������% �� �������� ��\% �� ������ �$�'� ����!��% ���'�"�� ������������$� #�!����% �'���������!��% �!����� �#�"�� ����� ���!� ��'��������=��������%�"��������$� ���\% �$� ��!��% �� ����� �$�'� �������$# ��"�� ��� � ����"�� ��'� ��$� ���$� �� ���� ���#����"�� ��� � ������%�� �%���������#� � ��������"�� ��� � ��%�^ �� ��$� #��%��$�%������"�� �$������� ��������'$� �� !$������� \% � *������� � ����� �%������� ��� ���� #� "�� �� � � �� ��������� �� �$����!$������������ � ��� ���� �� ��#� � ���#� !$������� ��'��� � �!� � �����^ � � � ����� ��#� ��������� "�� �� � ��$�� �� ��� ��� ���"�� ��� �% �
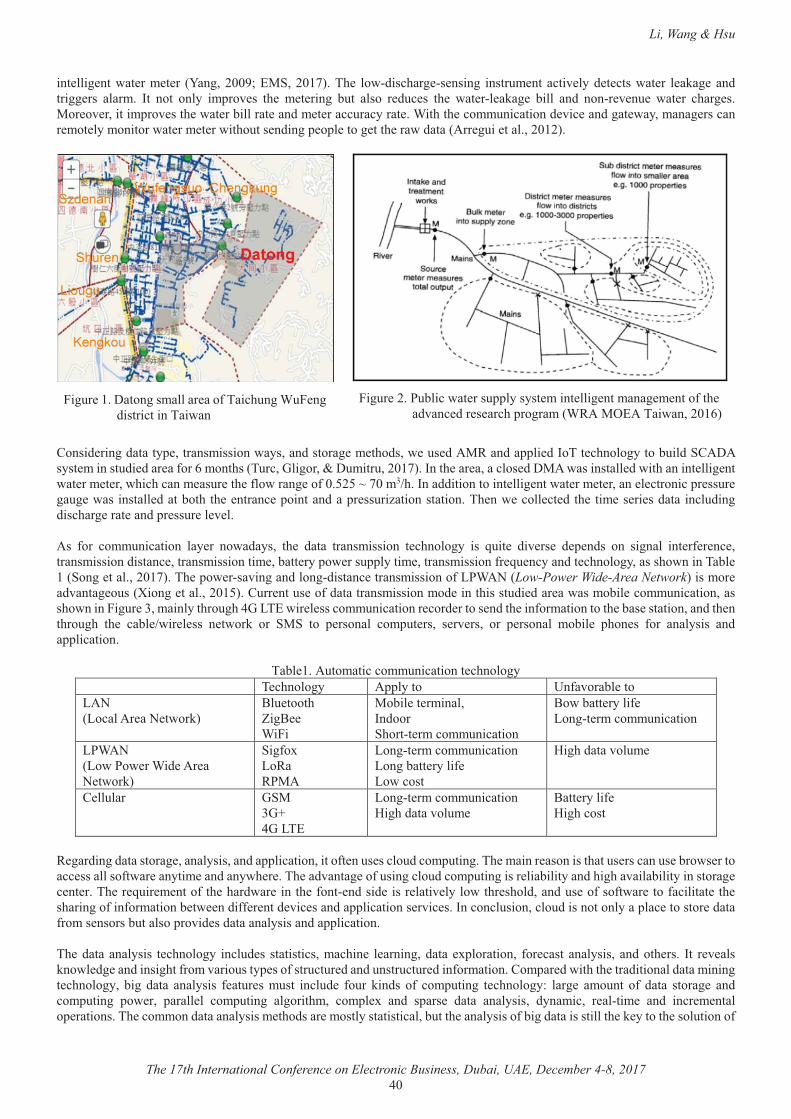
Li, Wang & Hsu
�The 17th International Conference on Electronic Business, Dubai, UAE, December 4-8, 2017
@��
��� ���� ���"�� ��� � �� �������������/�_��������\% � ��"�#���%��� �� ������ �����$� �������^ ���# � ����"�� �� � ���� ���#������ ��� ������ &�� ���� ����� ��'��^ �� �% � � � ����� �$�� ����� � #$� �� �% � "�� ��� ���� � ����� ��#� ����� ^ �$ � "�� �� �%��� ����� �^ ��������'��^ ���% �"�� ���������� ���#�� � �����$�������� ����%��% �����$���������# ^�� ���#���� "��������� �������� ��� �����������"�� ��� � ��"��%�$��� �#����' �'� ����� ���% ���"�#�������� �$�� �������������
��� �����*����# �����#������' ���������������"�������#������� �� �%�#���" �$� #�������#��''�� #�&�\�� �%�����������$��#�_*�=������ �������$#� #��� ��!���~�����%���\$��������������=$����$��������&���% ��� ��������� #�=���"���������� #�"��%������� ���� ���"�� ��� � ���"%��%������ ��$� ��% �!��"����� ��!������¸������¡%�&���##������������ ���� ���"�� ��� � ������ � ��������'� ��$� ���$� �"���������� #�������%��% � ������ �'�������#���'� ��$�����������������\% ��" ����� �� #��% ���� �� �� ��#���� ����$#����#���%��� ���� ���#�'� ��$� �� ^ ������� !��� ����$��������� ��� �� ��"�#����� �% � #���� ������������� � �%������� ��� �$�� � #�^ �� � # ' �#�� ��� ������� ��� �! � �� ���������������#������ ������������������ ������ ���'�" ���$''������ ���������������!� �$ ������#�� �%������������%�"�����\��� ����_���� ������������\% �'�" ����^������#������#������ ���������������!��������Low-Power Wide-Area Network�������� ��#^����� �$�������� ������������*$�� ���$� ��!�#�������������������# �����%�����$#� #��� ��"�������� �����$��������������%�"��������$� ������������%��$�%�@���\/�"�� � �������$���������� ���# ������ �#��% ���!�������������% ���� ������������#��% ���%��$�%� �% � ���� ¡"�� � ��� � �"���� ��� _�_� ��� ' ������� ���'$� ���� � �^ ���� ��� ' ������� ����� � '%�� �� !��� ��������� ��#��''����������
\��� ���$������������$���������� �%�������� \ �%������� �''������ >�!�^����� ������������������ ��� �"�����
<�$ ����%����< ������
����� �� ���������&�#����_%����� �������$���������
<�"����� �����! ������� �������$����������
���������"���" ����# ��� ��� �"�����
_��!�`�����������
������ �������$������������������ �����! ���"������
���%�#����^��$� �
* ��$���� �_����¹�@���\/�
������ �������$������������%�#����^��$� �
<��� �����! ����%������
�� ���#����#���������� ��������������#��''��������������!� ��$� �����$#����'$�����\% ������� ���������%���$� �������$� ����"� �������� ���������!�"�� ������� ���#����"% � �\% ��#^����� ��!�$��������$#����'$��������� ������������#�%��%��^�������������������� �� �� ��\% �� �$�� � ����!��% �%��#"�� �����% �!���� �#���# ����� ����^ �����"��%� �%��#����#�$� ��!���!�"�� ����!�������� ��% ��%�������!���!���������� �" ��#�!! � ���# ^�� ����#��''���������� �^�� ��&�������$���������$#���������������'��� �������� �#����!����� �������$�������'��^�# ��#���������������#��''����������\% �#������������� � �%������� ����$# �� ���������������%�� � � ��������#���� `'���������� !�� ����� ���������� ��#���% ��� &�� � ^ �������"� #� ���#������%��!����̂ ����$����' ���!����$��$� #���#�$����$��$� #���!���������*��'�� #�"��%��% ����#��������#������������ �%�������� ���� #���� ��������� ! ��$� �� �$��� ����$# � !�$�� ���#�� �!� ���'$����� � �%�������� ���� � ���$��� �!� #���� ������ � ��#����'$����� '�" ��� '����� �� ���'$����� �������%��� ���'� `� ��#� �'��� � #���� ���������� #�������� � ������ � ��#� ���� � ������' ��������\% ��������#�������������� �%�#���� ����������������������$���% �����������!�����#��������������% �� ������% ����$������!�
���$� ���=�������������� ���!�\���%$����$� ���#�����������\��"���
���$� ����$�����"�� ���$''������� ����� ���� �������� � ����!��% ��#^��� #�� � ���%�'��������������/��\��"�������~��
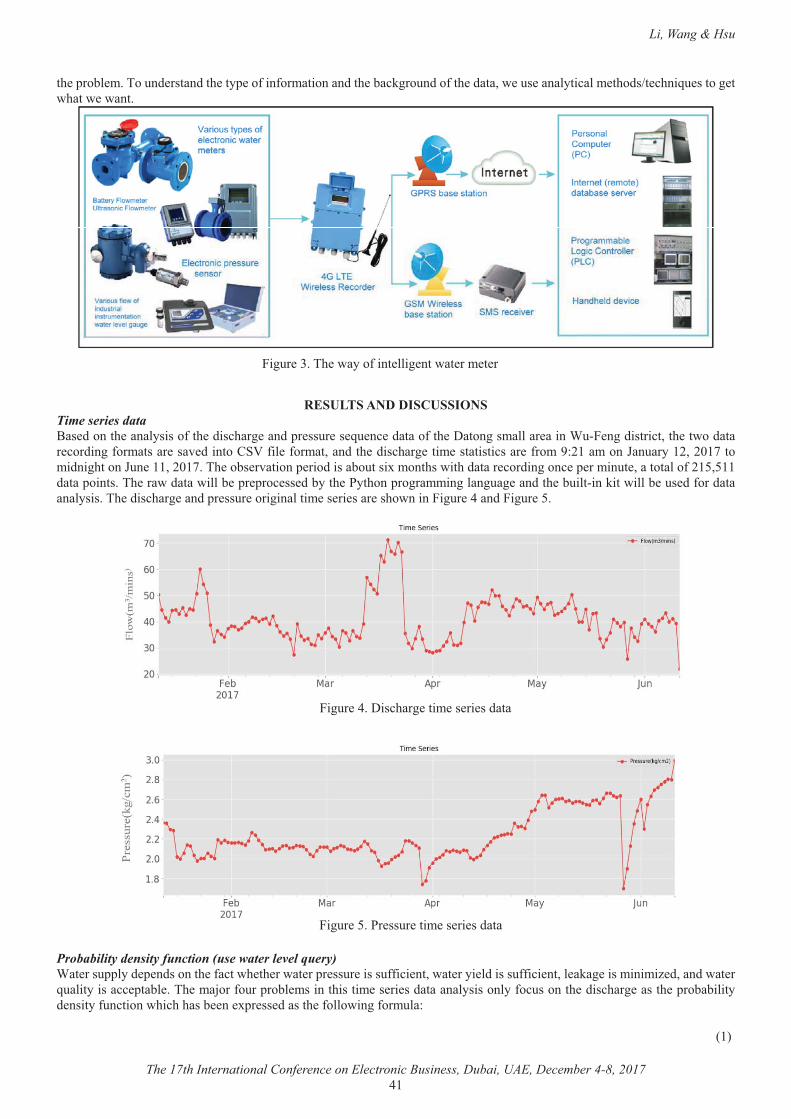
Li, Wang & Hsu
�The 17th International Conference on Electronic Business, Dubai, UAE, December 4-8, 2017
@��
�% �'���� ��\��$�# �����#��% ���' ��!���!�����������#��% ��������$�#��!��% �#�����" �$� ������������� �%�#�¡� �%���$ ������ ��"%���" �"����
���
��$�"&�����!�!���"�������
Time series data <�� #�����% �����������!��% �#���%��� ���#�'� ��$� �� �$ �� �#�����!��% �=�������������� ������$�� ���#����������% ��"��#����� ���#����!��������� ���^ #������*_��!�� �!���������#��% �#���%��� ���� �������������� �!���������������}��$������������������#���%�����}$� ����������\% ���� �^������' ���#�������$����`�����%��"��%�#����� ���#������� �' �����$� �����������!���������#����'������\% ���"�#����"����� �'� '��� �� #�����% ����%���'���������������$�� ���#��% ��$�����������"����� �$� #�!���#�������������\% �#���%��� ���#�'� ��$� ������������� �� �� ���� ��%�"��������$� �@���#����$� ����
��
�
�
Probability density function (use water level query) ��� ���$''���# ' �#������% �!����"% �% ��"�� ��'� ��$� �����$!!��� ����"�� ���� �#�����$!!��� ����� ���� ����������� #����#�"�� ���$������������ '���� �\% ���]���!�$��'���� �������%������ �� �� ��#������������������!��$������% �#���%��� �����% �'�����������# ������!$�������"%��%�%���� �� `'� �� #�����% �!����"����!���$�����
���$� �@�=���%��� ���� �� �� ��#����
���$� ����� ��$� ���� �� �� ��#���
����
���$� ���\% �"����!���� ���� ���"�� ��� � ��
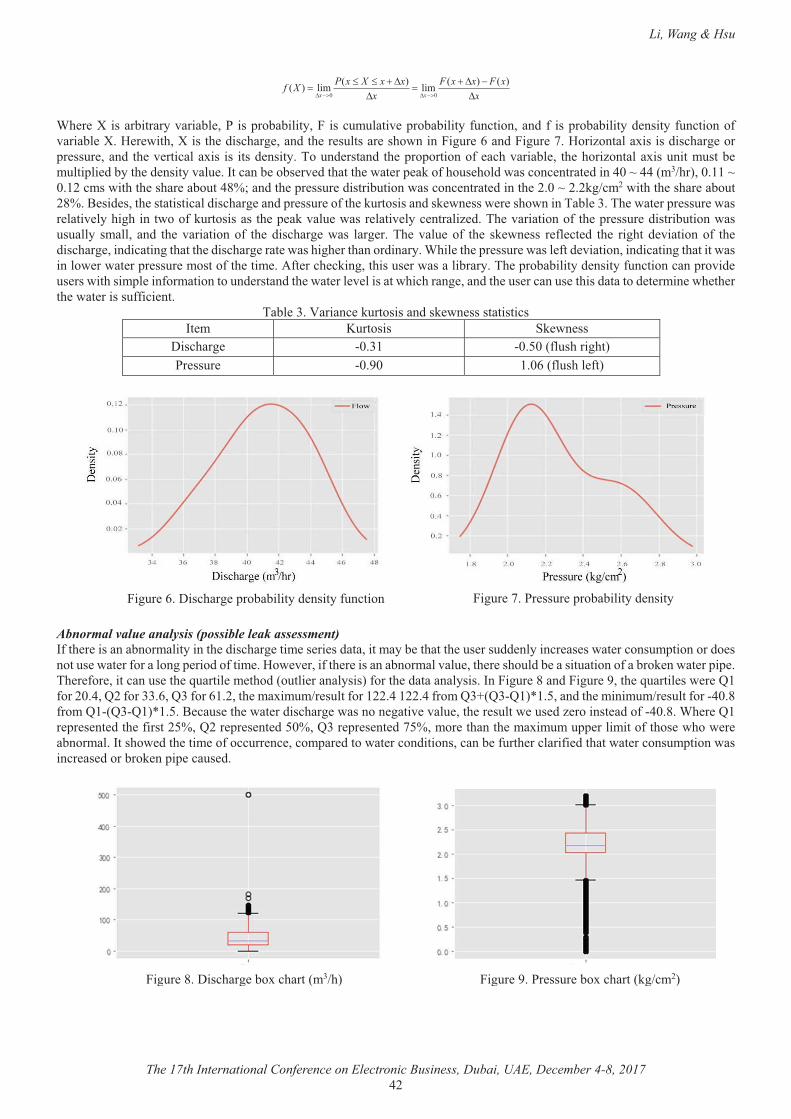
Li, Wang & Hsu
�The 17th International Conference on Electronic Business, Dubai, UAE, December 4-8, 2017
@��
xxFxxF
xxxXxPXf
xx ����
��
�����
����
����������������
�
��% � ���������������^������ �������'������������������$�$����^ �'�����������!$����������#�!� ���'�����������# ������!$��������!�^������ ��� � "��%�������% �#���%��� ����#��% �� �$������ ��%�"��������$� �~���#����$� ���������������`������#���%��� ����'� ��$� ����#��% �^ ��������`��� ��� ����# ������\��$�# �����#��% �'��'��������!� ��%�^������ �� �% �%�����������`���$�����$���� ��$���'�� #�����% �# ������^��$ �&������� ���� �^ #��%����% �"�� ��' ����!�%�$� %��#�"������� ����� #����@��¸�@@����¡%��������¸���������"��%��% ��%�� ����$��@[�����#��% �'� ��$� �#������$�����"������� ����� #�����% ����¸�����¡����"��%��% ��%�� ����$���[��< ��# ����% �������������#���%��� ���#�'� ��$� ��!��% ��$���������#��� "� ���" � ��%�"�����\��� ���\% �"�� ��'� ��$� �"���� ����^ ���%��%�����"���!��$�����������% �' ���^��$ �"���� ����^ ���� ������� #�\% �^����������!��% �'� ��$� �#������$�����"���$�$����� ������� ��#� �% �^����������!� �% �#���%��� �"��� ���� ��\% �^��$ ��!� �% � �� "� ��� � !� �� #� �% � ���%�� # ^��������!� �% �#���%��� ����#���������%����% �#���%��� ���� �"���%��% ���%�����#�������%�� ��% �'� ��$� �"���� !��# ^����������#���������%������"��������" ��"�� ��'� ��$� �������!��% ���� ��!� ���% ��������%���$� ��"�������������\% �'�����������# ������!$�����������'��^�# �$� ���"��%����'� ���!������������$�# �����#��% �"�� ��� ^ ��������"%��%����� ����#��% �$� ������$� ��%���#�������# � ���� �"% �% ���% �"�� ������$!!��� ���
\��� ���������� ��$���������#��� "� ��������������&� �� �$������� _� "� ���
=���%��� � ����� ������!�$�%����%����� ��$� � ����� ��~��!�$�%�� !���
Abnormal value analysis (possible leak assessment) &!��% � �����������������������% �#���%��� ���� �� �� ��#������������� ��%����% �$� ���$## �������� �� ��"�� ������$�'��������#� ������$� �"�� ��!����������' ���#��!���� ���" ^ ����!��% � ����������������̂ ��$ ���% � ��%�$�#�� ������$�������!������� ��"�� ��'�' �\% � !�� ���������$� ��% ��$����� �� �%�#���$��� ������������!����% �#�������������&�����$� �[���#����$� �����% ��$����� ��" � � ��!�����@�� ��!�����~�� ��!���~�����% ���`��$�¡� �$���!������@����@�!���� �¹� �� ��|������#��% ������$�¡� �$���!����@�[�!���� ��� �� ��|���< ��$� ��% �"�� ��#���%��� �"������� ����^ �^��$ ���% �� �$���" �$� #�� ������� �#��!��@�[��% � � ��� '� � �� #��% �!���������� ��� '� � �� #������ ��� '� � �� #��������� ��%����% ���`��$��$'' ���������!��%�� �"%��" � ����������&���%�" #��% ���� ��!����$�� �� �����'�� #����"�� �����#������������� �!$��% �������!� #��%���"�� ������$�'�����"������� �� #�������� ��'�' ���$� #��
���
���$� �~�=���%��� �'�����������# ������!$������� ���$� ����� ��$� �'�����������# ������
���$� �[�=���%��� ���`��%�������¡%� ���$� ����� ��$� ���`��%�������¡����
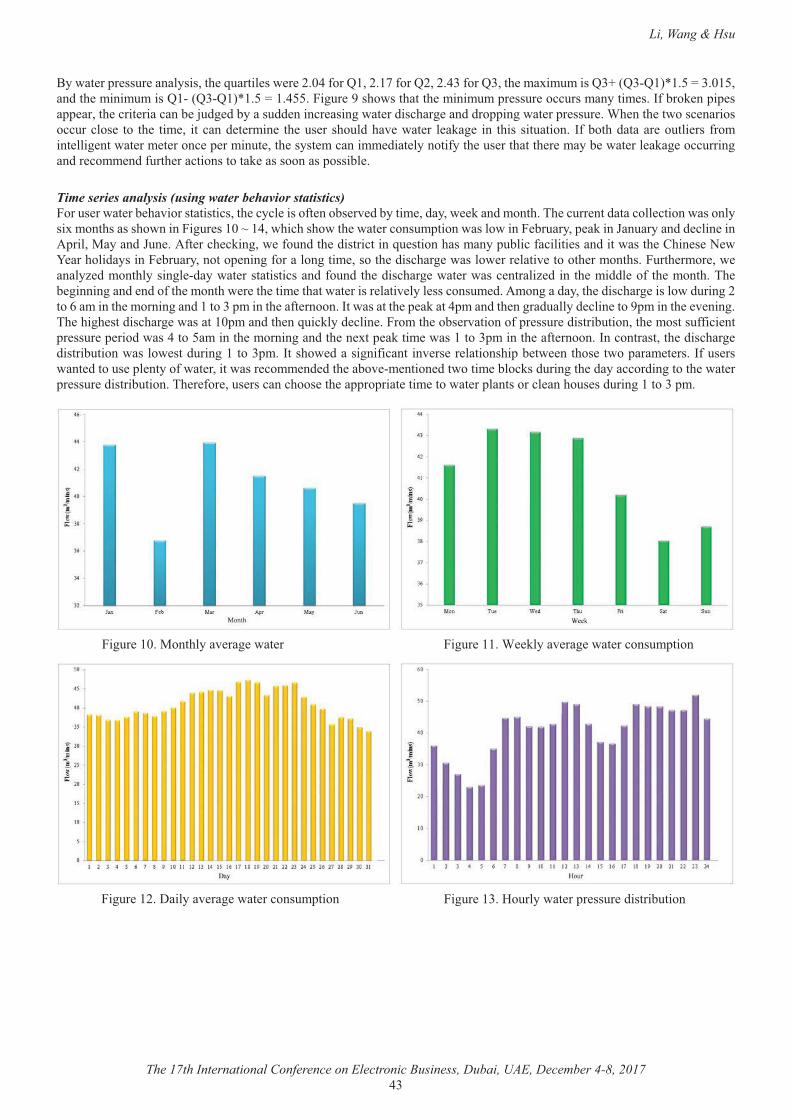
Li, Wang & Hsu
�The 17th International Conference on Electronic Business, Dubai, UAE, December 4-8, 2017
@��
<��"�� ��'� ��$� ������������% ��$����� ��" � ���@�!��� �������!��� ����@��!��� ����% ���`��$����� �¹�� �� ��|���º���������#��% ������$����� ���� �� ��|���º��@������$� ����%�"���%����% ������$��'� ��$� ����$����������� ��&!����� ��'�' ���'' �����% ����� ��������� �]$#� #�������$## ������ ������"�� ��#���%��� ���#�#��''����"�� ��'� ��$� ��% ���% ��"���� ����������$������ � ��� �% � ��� �� �������# � ���� � �% �$� ���%�$�#�%�^ �"�� �� � ���� � ��� �%������$������ &!����%�#������ ��$��� ��� !������� ���� ���"�� ��� � ����� �' �����$� ���% ����� ��������� #��� �������!���% �$� ���%����% � ������ �"�� ��� ���� ����$��������#�� ���� �#�!$��% ���������������� ������������'������ �
�Time series analysis (using water behavior statistics) ����$� ��"�� ��� %�^�����������������% ����� �����!� ����� �^ #������� ��#����" ����#�����%�\% ��$�� ���#�������� ������"����������`�����%������%�"��������$� �����¸��@��"%��%��%�"��% �"�� ������$�'�����"�����"����� ��$�����' ������}��$������#�# ���� �����'�����������#�}$� ��!� ���% �������" �!�$�#��% �#������������$ ������%��������'$�����!������� ����#����"����% �*%�� � �� "�� ���%���#�������� ��$����������' �����!������������� ������% �#���%��� �"�����" ��� ����^ ������% ������%���$��% ���� ��" ������� #�����%�������� �#���"�� ���������������#�!�$�#��% �#���%��� �"�� ��"���� ������� #�����% ���##� ��!��% �����%�\% �� ����������#� �#��!��% �����%�" � ��% ���� ��%���"�� ������ ����^ ���� �������$� #���������#�����% �#���%��� ������"�#$����������~��������% �����������#��������'������% ��!� ������&��"�������% �' ������@'����#��% �����#$�����# ���� �����'������% � ^ �����\% �%��% ���#���%��� �"��������'����#��% ���$������# ���� �������% ���� �^�������!�'� ��$� �#������$�������% �������$!!��� ���'� ��$� �' ���#�"���@������������% �����������#��% �� `��' ������ �"���������'������% ��!� ������&�������������% �#���%��� �#������$�����"�����" ���#$�����������'��&���%�" #��������!��������^ �� �� �������%�'�� �" ���%�� ��"��'���� � ���&!�$� ���"��� #����$� �'� �����!�"�� ������"���� ���� �# #��% ����^ �� ����� #��"����� ��������#$������% �#��������#��������% �"�� ��'� ��$� �#������$�����\% � !�� ��$� ��������%��� ��% ��''��'���� ���� ����"�� ��'����������� ���%�$� ��#$������������'���
���
���
���$� ��������%����^ ��� �"�� �� ���$� ����� �����^ ��� �"�� ������$�'�����
���$� ����=������^ ��� �"�� ������$�'����� ���$� ������$����"�� ��'� ��$� �#������$�����
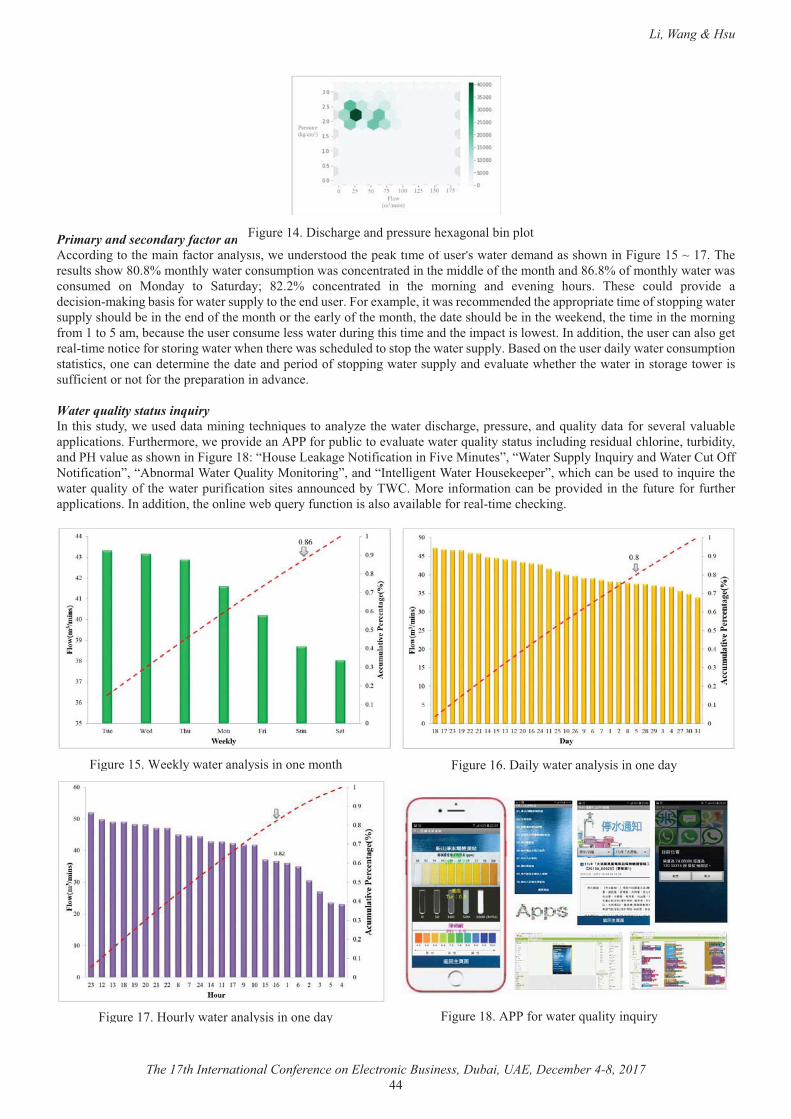
Li, Wang & Hsu
�The 17th International Conference on Electronic Business, Dubai, UAE, December 4-8, 2017
@@�
��
Primary and secondary factor analysis (proposed in the absence of water) �����#��������% ������!����������������" �$�# �����#��% �' ������ ��!�$� �©��"�� ��# ���#�����%�"��������$� ����¸����\% �� �$�����%�"�[�[������%���"�� ������$�'�����"������� ����� #�����% ���##� ��!��% �����%���#�[~[���!�����%���"�� ��"�������$� #� ��� ���#��� ��� _��$�#���� [���� ���� ����� #� ��� �% � �������� ��#� ^ ����� %�$��� \% � � ��$�#� '��^�# � ��# ��������������������!���"�� ���$''�������% � �#�$� ������ `��'� �����"���� ���� �# #��% ��''��'���� ���� ��!����''����"�� ���$''����%�$�#�� �����% � �#��!��% �����%�����% � ������!��% �����%���% �#�� ��%�$�#�� �����% �" � �#���% ���� �����% ���������!���������������� ��$� ��% �$� ������$� �� ���"�� ��#$������%������ ���#��% ���'���������" ���&���##��������% �$� ������������ ��� ������ ������ �!�����������"�� ��"% ���% � �"�����% #$� #�������'��% �"�� ���$''���<�� #�����% �$� ��#�����"�� ������$�'������������������� �����# � ���� ��% �#�� ���#�' ���#��!����''����"�� ���$''�����#� ^��$�� �"% �% ���% �"�� ����������� ���" ������$!!��� ����������!����% �'� '������������#^��� ��Water quality status inquiry�&���%�����$#���" �$� #�#������������ �%���$ ����������� ��% �"�� ��#���%��� ��'� ��$� ����#��$������#����!���� ^ ����^��$��� ��''�����������$��% ���� ��" �'��^�# ��������!���'$�������� ^��$�� �"�� ���$����������$������$#����� ��#$����%����� ���$���#�������#����^��$ �����%�"��������$� ��[�����$� �� ���� �����!�������������^ ����$� �������� ��_$''���&��$������#���� ��*$���!!�����!����������������������� �� $���������������������#��&�� ���� ������ ����$� � ' ����"%��%������ �$� #�������$�� ��% �"�� ���$�������!��% �"�� ��'$��!����������� ������$�� #����\�*���� ���!�������������� �'��^�# #�����% �!$�$� �!���!$��% ���''����������&���##��������% ������ �" ���$ ���!$����������������^������ �!���� ������ ��% �������
���
��
���$� ����� ����"�� ���������������� �����% ���$� ��~�=�����"�� ���������������� �#���
���$� ������$����"�� ���������������� �#�� ���$� ��[�����!���"�� ���$���������$�����
���$� ��@�=���%��� ���#�'� ��$� �% `�����������'����
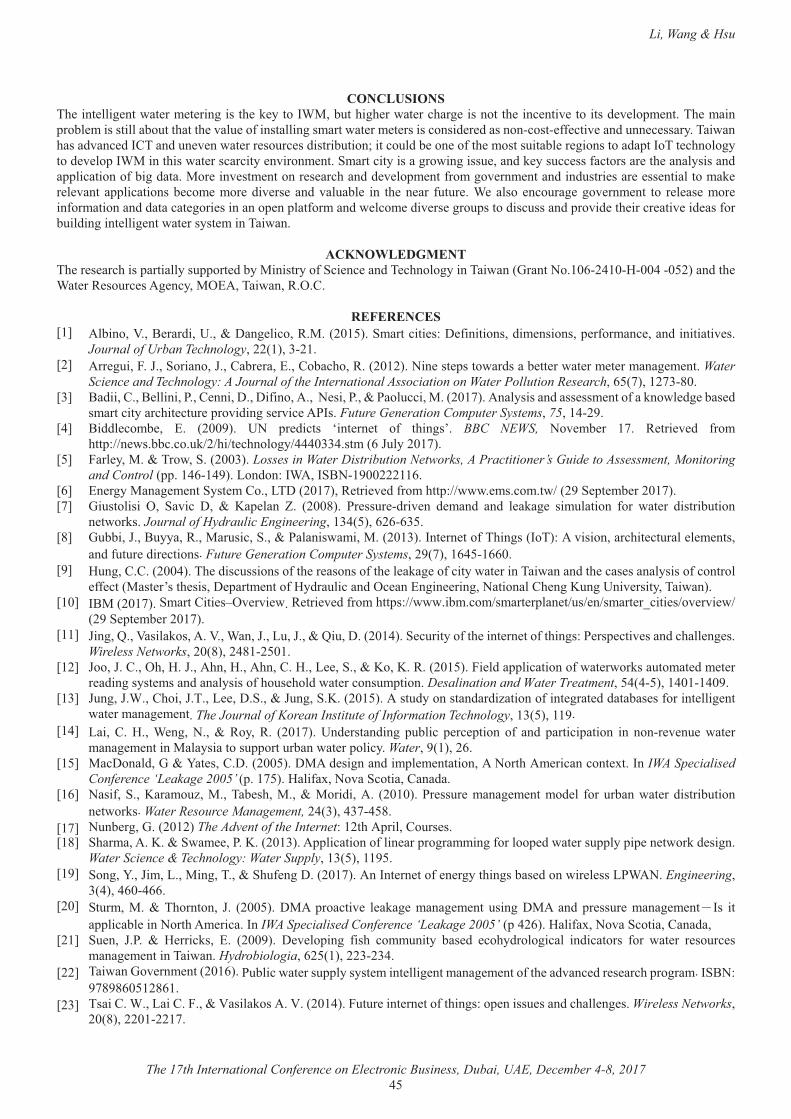
Li, Wang & Hsu
�The 17th International Conference on Electronic Business, Dubai, UAE, December 4-8, 2017
@��
�����&"������
\% ���� ���� ���"�� ��� � ���������% �� �����&�����$��%��% ��"�� ���%��� ���������% ���� ���^ ��������# ^ ��'� ���\% ������'���� ��������������$���%����% �^��$ ��!������������������"�� ��� � �����������# � #������������� !! ���^ ���#�$�� � ������\��"���%����#^��� #�&*\���#�$� ^ ��"�� ��� ��$�� ��#������$�����������$�#�� ��� ��!��% �������$����� �� ����������#�'��&�\�� �%����������# ^ ��'�&�������%���"�� ����������� �^����� ���_������������������"�������$ ����#�� ���$�� ���!��������� ��% ������������#��''����������!�����#������� ���^ ��� ������� � ���%���#�# ^ ��'� ���!������^ ��� �����#���#$���� ���� � �� ������������ �� � ^�����''����������� ��� ���� �#�^ �� ���#�^��$��� � ��� �% �� ��� !$�$� �� ������ ���$��� ���^ ��� ��� ��� � � �� ���� ���!�����������#�#������� ���� ���������' ��'���!������#�" ���� �#�^ �� ����$'�����#���$�����#�'��^�# ��% ����� ���^ ��# ���!����$��#������� ���� ���"�� ������ �����\��"����
��9��;&$!<#$���\% �� � ���%����'����������$''��� #��������������!�_�� �� ���#�\ �%����������\��"��������������~��@�������@���������#��% ���� ��� ��$�� ���� �������/���\��"������*��
�$*$�$��$��£�¤� �����������< ���#���>����=��� ����������������_��������� ���= !����������#�� ��������' �!������ ����#���������^ ��
Journal of Urban Technology���������������£�¤� ��� �$�����}��_��������}��*��� ����/��*����%��������������� ��� '����"��#����� �� ��"�� ��� � ������� � �� Water
Science and Technology: A Journal of the International Association on Water Pollution Research��~�����������[���£�¤� <�#����*��< ����������* �����=��=�!���������� �������������$�������������������������#���� ��� ����!������"� #� ���� #�
��������������%�� ��$� �'��^�#����� �^�� ���&��Future Generation Computer Systems��75���@���£@¤� <�##� ���� �� /� ������� >�� '� #����� ¢��� �� �� �!� �%������ BBC NEWS, ��^ �� �� ��� � ��� ^ #� !����
%��'�¡¡� "������$�¡�¡%�¡� �%������¡@@@���@�����~�}$��������£�¤� ���� �������\��"��_��������Losses in Water Distribution Networks, A Practitioner’s Guide to Assessment, Monitoring
and Control �''��@~��@������#����&����&_<�����������~�£~¤� /� ��������� � ���_��� ��*����\=���������� ��� ^ #�!����%��'�¡¡""" ������"¡�����_ '� �� ��������£�¤� ��$�������� ��� _�^��� =�� �� ��' ���� �� ����[�� �� ��$� �#��^ �� # ���#� ��#� � ���� � ���$������� !��� "�� �� #������$�����
� �"�����Journal of Hydraulic Engineering����@�����~�~�~��£[¤� �$�����}��<$�����������$�����_�����������"��������������&�� �� ���!�\%������&�\�����^����������%�� ��$���� � � �����
��#�!$�$� �#�� �������Future Generation Computer Systems����������~@���~~��£�¤� �$����**�����@��\% �#���$��������!��% �� �������!��% �� ���� ��!������"�� �����\��"�����#��% ���� ������������!���������
!! �������� �����% �����= '���� ����!���#��$������#��� ���/���� ���������������*% ����$���>��^ �������\��"����£��¤� &<���������_�����*��� �¥�^ �^� "�� ��� ^ #�!����%��'��¡¡"""������¡����� �'��� �¡$�¡ �¡����� ������ �¡�^ �^� "¡�
����_ '� �� ��������£��¤� }����� �����������������������}���$��}���� �$��=�����@��_ �$������!��% ���� �� ���!��%������� ��' ���^ ����#��%��� �� ��
Wireless Networks�����[����@[�������£��¤� }����}�*���%����}���%�������%���*����� ��_��������������������� �#��''����������!�"�� �"������$����� #�� � ��
� �#�������� �����#�����������!�%�$� %��#�"�� ������$�'�����Desalination and Water Treatment���@�@������@����@����£��¤� }$����}���*%����}\��� ��=_����}$����_�������������$#���������#��#���������!���� ���� #�#������ ��!������ ���� ���
"�� ������� � ���The Journal of Korean Institute of Information Technology�������������£�@¤� ����� *� ��� � ���� ��� �� ����� �� ������� >�# �����#���� '$����� ' �� '����� �!� ��#� '������'������ ��� ����� ^ �$ � "�� ��
����� � �������������������$''����$�����"�� ��'������Water���������~�£��¤� ���=����#��������� ���*=��������=���# �������#���'� � ���������������%��� ���������� `��&��IWA Specialised
Conference ‘Leakage 2005’ �'����������!�`����^��_�������*���#��£�~¤� ����!��_��������$������\�� �%�����������#����� ��������� ��$� ������ � �����# �� !���$�����"�� ��#������$�����
� �"�����Water Resource Management, �@�����@���@�[£��¤� �$�� ������������ The Advent of the Internet�����%��'�����*�$�� ��£�[¤� _%������������_"�� ��������������''����������!���� ���'�����������!������' #�"�� ���$''���'�' �� �"����# �����
Water Science & Technology: Water Supply��������������£��¤� _��������}�������������\����_%$! ���=�����������&�� �� ���!� � �����%�������� #����"�� � ���������Engineering��
��@���@~��@~~�£��¤� _�$��������\%�������� }� �������=���'������^ � � ���� ������ � ��� $����� =��� ��#� '� ��$� � ����� � �� &�� ���
�''������ ��������%��� �����&��IWA Specialised Conference ‘Leakage 2005’��'�@�~������!�`����^��_�������*���#����£��¤� _$ ��� }�� �� � �������� /� ������� = ^ ��'���� !��%� ����$����� ��� #� ��%�#���������� ��#�������� !��� "�� �� � ��$�� ��
����� � ������\��"���Hydrobiologia��~�������������@�£��¤� \��"�����^ ��� �������~���$�����"�� ���$''������� ����� ���� �������� � ����!��% ��#^��� #�� � ���%�'�������&_<���
��[�[~����[~��£��¤� \����*��������*������������������������@���$�$� ���� �� ���!��%�������' �����$ ����#��%��� �� ��Wireless Networks��
���[�������������

Li, Wang & Hsu
�The 17th International Conference on Electronic Business, Dubai, UAE, December 4-8, 2017
@~�
£�@¤� \$����\���������������=$����$��*�=� �������� ����� #�"�� � ���� ��������� ��!���_*�=�� �^����� ���Procedia Engineering��181���@~�����
£��¤� ������*������������ � ���%�����% ����� ���������� ����!��% �!��"�� � ������$!���$�������#$����������� ���$#���!��% �/�_����'��������� �����% �����/` �$��^ ��<���/�<���'���������_�_>��\��"����
£�~¤� ����������������/`'����������!�\��"���"�� ��� ��$�� ������� � ���'���� ����''����%��!�������#����������� � ������� �����% �����= '���� ����!���#��$������#��� ���/���� �������*�>��\��"����
£��¤� ��� ���*=� ���������� �� ����$��������� �% �� "�"��� &� IWA Specialized Conference ‘Leakage 2005’� �''� �����������!�`����^��_�������*���#�
£�[¤� �$��������$��_����$������$���������$�����_�����~��<$����# � ���������#��������� � ������� ���$�������#����#��^ ����$�� ������������%�. Water Research��100���[���
£��¤� ���������% �������$����������������*%�����������������������"�'�" ��"�# ��� �����%�� �������%�� �� �"������� ��� �%���$ ����#�'������' �IEEE Communications Magazine���������~@����
�
�
�
�
�
�
�
�
�
� �
Hamilton, J.R., Tee, S.W., Holdsworth, J. & Alshomali, M.A.(2017). Analysing big data projects using Github and JavaScript repositories. In Proceedings of The 17th International Conference on Electronic Business (pp. 47-52). ICEB, Dubai, UAE, December 4-8.
Hamilton, Tee, Holdsworth & Alshomali
The 17th International Conference on Electronic Business, Dubai, UAE, December 4-8, 201747
Analysing Big Data Projects Using Github and JavaScript Repositories
John R. Hamilton*, James Cook University, Australia, [email protected] Tee, James Cook University, Australia, [email protected]
Jason Holdsworth, James Cook University, Australia, [email protected] Azeez Alshomali, James Cook University, Australia,
ABSTRACTGitHub open source software developers remain in short supply. Successful GitHub projects offer multiple pathways for developers to contribute into their repositories. This study’s GitHub JavaScript big data is path modelled to provide understanding of the different significant developer contribution pathways towards raising the project’s activity level. Itssignificant pathways offer the project’s creator benchmark decision making capabilities that can be used to trigger faster project software development through to its next completion point. This approach has behavioural consumptive value connotations that may provide a future pathway towards tapping big data sources and to also delivering real business values.
Keywords: Open source software (OSS), GitHub software development, popularity, activity level, value, consumption._____________________*Corresponding author
INTRODUCTIONThe online open source software version control system GitHub (Firestine, 2017) is large. It currently enlists around twenty million developers who have delivered over one hundred million pull requests (Firestine, 2017). Github’s repositories (around fifty seven million (Firestine, 2017) outnumber the available open source software developers by nearly three-to-one. Hence open source developers remain in short supply. Also new software projects often need skilled external open source software developer support to quickly advance (and complete) their coding requirements (GitHub, 2017b). Thus, this study considers first how developers contribute towards a project, and second what may trigger the speeding of project’s software development through to its next completion point.
GITHUBGitHub is the faster growing online software version control system (Yu et al., 2014). GitHub allows the professional developers of companies like Facebook and Google to enlist global help, and to rapidly solve complex software coding. Such substantive GitHub projects house a conglomeration software development components each held within their specific project’s big data repository. GitHub Repositories extend beyond such major project developments. They also capture projects involving independent developers, or teams of developers seeking specific open source assistance to solve specific software project tasks. GitHub repositories also encompass individual repositories where specific student projects seek individual open source assistance.
A GitHub project creator forms a repository, This GitHub repository houses the source code, and a master (production development) branch. The project creator and a core development team use GitHub, social media, other web/mobile sites, and personal connections to promote their project. They encourage open source developers to fork the project (copy and adapt the master branch) and to work independently. Theses open source software developers then make direct changes to the repository content and feedback (pull request) changes that can advance the master branch code and/or contribute in some indirect supportive way into this project’s repository.
Over time each repository modifies as: developer contributions add and/or delete content, explanations are added, code is tested by others, and the original creator and core team accept pull-requests as commits (content changes) into the master branch. Thus the repository grows as a collection of: source code, a master (production development) branch, other branches (including experimental, developmental, internal clones, and test site components), support materials (including text description, audio, video and other multi-dimensional clarifications), ad hoc contributions and information advice updates.
From time-to-time GitHub’s repository ecosystem may suffer developer and knowledge losses - which can retard the project’s software development. For example, a specific developer may choose to externally clone the repository’s master branch and create a unique (and/or alternate) software development pathway outside the original repository’s ecosystem. This loss of developer capabilities likely negatively impacts the project’s development, and may move other developers to follow this unique
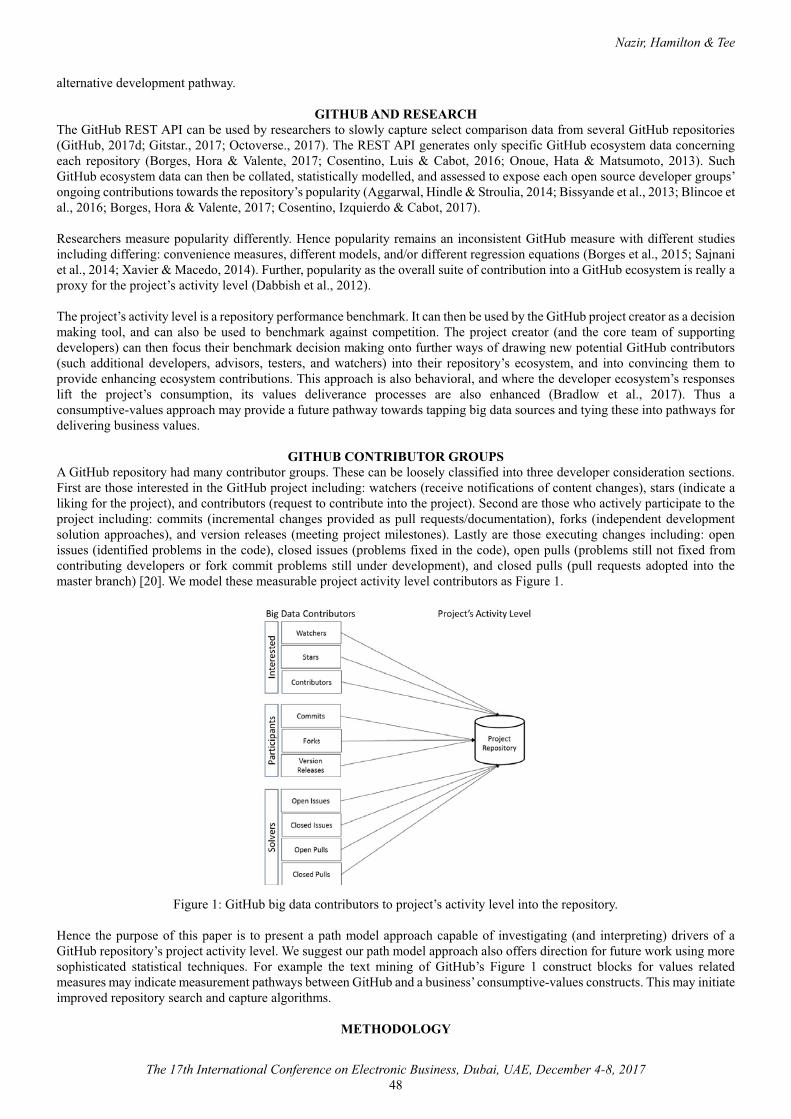
Nazir, Hamilton & Tee
The 17th International Conference on Electronic Business, Dubai, UAE, December 4-8, 201748
alternative development pathway.
GITHUB AND RESEARCHThe GitHub REST API can be used by researchers to slowly capture select comparison data from several GitHub repositories (GitHub, 2017d; Gitstar., 2017; Octoverse., 2017). The REST API generates only specific GitHub ecosystem data concerning each repository (Borges, Hora & Valente, 2017; Cosentino, Luis & Cabot, 2016; Onoue, Hata & Matsumoto, 2013). Such GitHub ecosystem data can then be collated, statistically modelled, and assessed to expose each open source developer groups’ongoing contributions towards the repository’s popularity (Aggarwal, Hindle & Stroulia, 2014; Bissyande et al., 2013; Blincoe et al., 2016; Borges, Hora & Valente, 2017; Cosentino, Izquierdo & Cabot, 2017).
Researchers measure popularity differently. Hence popularity remains an inconsistent GitHub measure with different studies including differing: convenience measures, different models, and/or different regression equations (Borges et al., 2015; Sajnani et al., 2014; Xavier & Macedo, 2014). Further, popularity as the overall suite of contribution into a GitHub ecosystem is really a proxy for the project’s activity level (Dabbish et al., 2012).
The project’s activity level is a repository performance benchmark. It can then be used by the GitHub project creator as a decision making tool, and can also be used to benchmark against competition. The project creator (and the core team of supporting developers) can then focus their benchmark decision making onto further ways of drawing new potential GitHub contributors (such additional developers, advisors, testers, and watchers) into their repository’s ecosystem, and into convincing them to provide enhancing ecosystem contributions. This approach is also behavioral, and where the developer ecosystem’s responses lift the project’s consumption, its values deliverance processes are also enhanced (Bradlow et al., 2017). Thus a consumptive-values approach may provide a future pathway towards tapping big data sources and tying these into pathways for delivering business values.
GITHUB CONTRIBUTOR GROUPSA GitHub repository had many contributor groups. These can be loosely classified into three developer consideration sections. First are those interested in the GitHub project including: watchers (receive notifications of content changes), stars (indicate a liking for the project), and contributors (request to contribute into the project). Second are those who actively participate to theproject including: commits (incremental changes provided as pull requests/documentation), forks (independent development solution approaches), and version releases (meeting project milestones). Lastly are those executing changes including: open issues (identified problems in the code), closed issues (problems fixed in the code), open pulls (problems still not fixed from contributing developers or fork commit problems still under development), and closed pulls (pull requests adopted into the master branch) [20]. We model these measurable project activity level contributors as Figure 1.
Figure 1: GitHub big data contributors to project’s activity level into the repository.
Hence the purpose of this paper is to present a path model approach capable of investigating (and interpreting) drivers of a GitHub repository’s project activity level. We suggest our path model approach also offers direction for future work using more sophisticated statistical techniques. For example the text mining of GitHub’s Figure 1 construct blocks for values related measures may indicate measurement pathways between GitHub and a business’ consumptive-values constructs. This may initiate improved repository search and capture algorithms.
METHODOLOGY
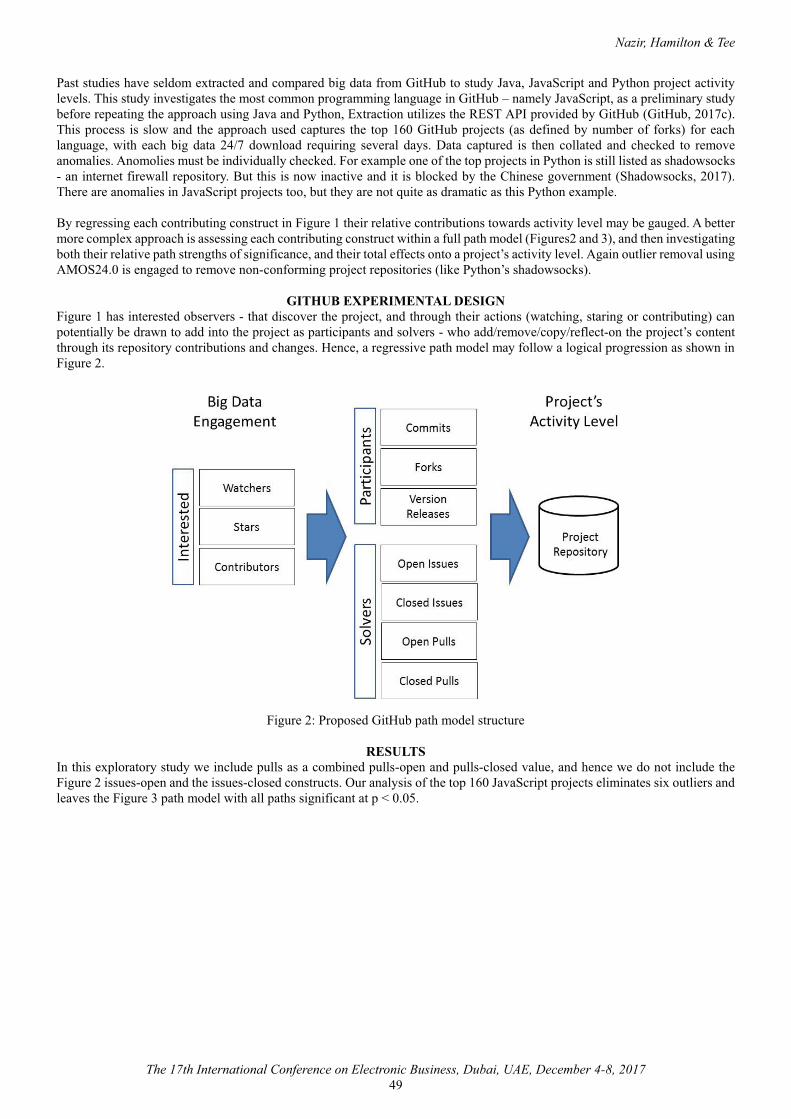
Nazir, Hamilton & Tee
The 17th International Conference on Electronic Business, Dubai, UAE, December 4-8, 201749
Past studies have seldom extracted and compared big data from GitHub to study Java, JavaScript and Python project activity levels. This study investigates the most common programming language in GitHub – namely JavaScript, as a preliminary study before repeating the approach using Java and Python, Extraction utilizes the REST API provided by GitHub (GitHub, 2017c). This process is slow and the approach used captures the top 160 GitHub projects (as defined by number of forks) for each language, with each big data 24/7 download requiring several days. Data captured is then collated and checked to remove anomalies. Anomolies must be individually checked. For example one of the top projects in Python is still listed as shadowsocks - an internet firewall repository. But this is now inactive and it is blocked by the Chinese government (Shadowsocks, 2017). There are anomalies in JavaScript projects too, but they are not quite as dramatic as this Python example.
By regressing each contributing construct in Figure 1 their relative contributions towards activity level may be gauged. A better more complex approach is assessing each contributing construct within a full path model (Figures2 and 3), and then investigating both their relative path strengths of significance, and their total effects onto a project’s activity level. Again outlier removal using AMOS24.0 is engaged to remove non-conforming project repositories (like Python’s shadowsocks).
GITHUB EXPERIMENTAL DESIGNFigure 1 has interested observers - that discover the project, and through their actions (watching, staring or contributing) can potentially be drawn to add into the project as participants and solvers - who add/remove/copy/reflect-on the project’s content through its repository contributions and changes. Hence, a regressive path model may follow a logical progression as shown in Figure 2.
Figure 2: Proposed GitHub path model structure
RESULTSIn this exploratory study we include pulls as a combined pulls-open and pulls-closed value, and hence we do not include the Figure 2 issues-open and the issues-closed constructs. Our analysis of the top 160 JavaScript projects eliminates six outliers and leaves the Figure 3 path model with all paths significant at p < 0.05.
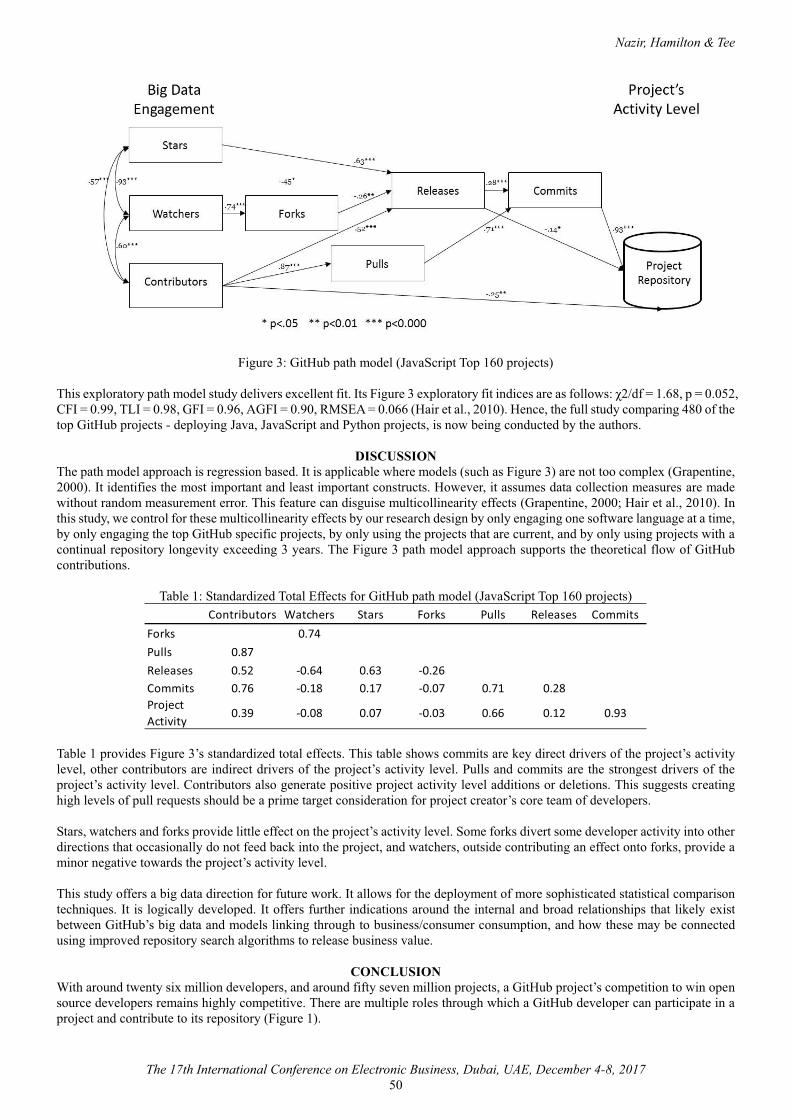
Nazir, Hamilton & Tee
The 17th International Conference on Electronic Business, Dubai, UAE, December 4-8, 201750
Figure 3: GitHub path model (JavaScript Top 160 projects)
This exploratory path model study delivers excellent fit. Its Figure 3 exploratory fit indices are as follows: ���������� ��������� �CFI = 0.99, TLI = 0.98, GFI = 0.96, AGFI = 0.90, RMSEA = 0.066 (Hair et al., 2010). Hence, the full study comparing 480 of the top GitHub projects - deploying Java, JavaScript and Python projects, is now being conducted by the authors.
DISCUSSIONThe path model approach is regression based. It is applicable where models (such as Figure 3) are not too complex (Grapentine, 2000). It identifies the most important and least important constructs. However, it assumes data collection measures are made without random measurement error. This feature can disguise multicollinearity effects (Grapentine, 2000; Hair et al., 2010). In this study, we control for these multicollinearity effects by our research design by only engaging one software language at a time, by only engaging the top GitHub specific projects, by only using the projects that are current, and by only using projects with a continual repository longevity exceeding 3 years. The Figure 3 path model approach supports the theoretical flow of GitHub contributions.
Table 1: Standardized Total Effects for GitHub path model (JavaScript Top 160 projects)Contributors Watchers Stars Forks Pulls Releases Commits
Forks 0.74Pulls 0.87Releases 0.52 -0.64 0.63 -0.26Commits 0.76 -0.18 0.17 -0.07 0.71 0.28Project Activity
0.39 -0.08 0.07 -0.03 0.66 0.12 0.93
Table 1 provides Figure 3’s standardized total effects. This table shows commits are key direct drivers of the project’s activity level, other contributors are indirect drivers of the project’s activity level. Pulls and commits are the strongest drivers of the project’s activity level. Contributors also generate positive project activity level additions or deletions. This suggests creating high levels of pull requests should be a prime target consideration for project creator’s core team of developers.
Stars, watchers and forks provide little effect on the project’s activity level. Some forks divert some developer activity into other directions that occasionally do not feed back into the project, and watchers, outside contributing an effect onto forks, provide a minor negative towards the project’s activity level.
This study offers a big data direction for future work. It allows for the deployment of more sophisticated statistical comparison techniques. It is logically developed. It offers further indications around the internal and broad relationships that likely exist between GitHub’s big data and models linking through to business/consumer consumption, and how these may be connected using improved repository search algorithms to release business value.
CONCLUSIONWith around twenty six million developers, and around fifty seven million projects, a GitHub project’s competition to win opensource developers remains highly competitive. There are multiple roles through which a GitHub developer can participate in a project and contribute to its repository (Figure 1).
Nazir, Hamilton & Tee
The 17th International Conference on Electronic Business, Dubai, UAE, December 4-8, 201751
This GitHub study engages a staged behavioral approach. The sequencing of three developer consideration sections is considered in line with Hamilton and Tee (2013) three stage behavioral approach using the project’s overall activity level as the outcomes driver. This delivers a new approach to investigate project developments, and to understand projects against varying sizes, software languages, degrees-of-complexity and varying longevities.
The project’s activity level of JavaScript created developer and other contributions is successfully measured through repository-collated addition and deletion measures. Pulls, commits and contributors are the strongest OSS drivers of the project’s activity level – suggesting the pursuit of OSSDs in an ongoing requirement in the rapid progression of any OSS project’s completion, stage completion or release.
GitHub’s JavaScript big data is path modelled to provide understanding of the different significant developer contribution pathways towards raising the project’s activity level (Figures 2 and 3). The significant pathways offer the project’s creator decision making capabilities that can be used to trigger faster project software development through to its next completion point.
The project’s activity level is a performance benchmark that is now available to the GitHub project creator. This approach can benchmark against competition. This approach is also behavioral and where the developer ecosystem’s responses lift the project’s consumption, its values deliverance processes are also enhanced. Thus a consumptive-values approach may provide a future pathway towards tapping big data sources and to also delivering real business values.
Although a path model approach is applied, and not structural equation modeling, all factors affecting multicollinearity effects are not captured in this research design. Hence this study holds some weaknesses. It remains impossible to get a perfect snapshot of real-time data as it takes many days to access and combine the GitHub data using the REST API. The selection of the top 160 JavaScript repositories (and sample size) is guided first by each repository being operable for over three years, and second by the top 160 projects being selected based on their level of forking - a common, and widely-accepted approach (an alternative is the project selection based on watchers).
The GitHub project’s activity level deployed herein can be further investigated by (1) randomly sampling all GitHub JavaScript projects, by (2) monitoring and comparing the differences in releases, pulls, forks and commits, and by (3) using API’s to monitor and show where OSSD can offer further improvement opportunities.
REFERENCES[1] A Aggarwal, K., Hindle, A., & Stroulia, E. (2014, May). Co-evolution of project documentation and popularity within
GitHub. In Proceedings of the 11th Working Conference on Mining Software Repositories (pp. 360-363). ACM.[2] Bissyandé, T. F., Thung, F., Lo, D., Jiang, L., & Réveillere, L. (2013, July). Popularity, interoperability, and impact of
programming languages in 100,000 open source projects. In IEEE 37th Annual Computer Software and Applications Conference (COMPSAC) (pp. 303-312). IEEE.
[3] Blincoe, K., Sheoran, J., Goggins, S., Petakovic, E. & Damian, D. (2016). Understanding the popular users: Following, affiliation influence and leadership on GitHub. Information and Software Technology, 70, 30-39.
[4] Borges, H., Hora, A., & Valente, M. T. (2016, October). Understanding the factors that impact the popularity of GitHub repositories. In IEEE International Conference on Software Maintenance and Evolution (ICSME) (pp. 334-344). IEEE.
[5] Borges, H., Valente, M. T., Hora, A., & Coelho, J. (2015). On the popularity of GitHub applications: A preliminary note. arXiv preprint arXiv:1507.00604.
[6] Bradlow, E.T., Gangwar, M., Kopalle, P. & Voleti, S. (2017). The role of big data and predictive analytics in retailing.Journal of Retailing, 93(1), 79-95.
[7] Cosentino, V., Izquierdo, J. L. C., & Cabot, J. (2017). A Systematic Mapping Study of Software Development with GitHub. IEEE Access, 5, 7173-7192.
[8] Cosentino, V., Izquierdo, J. L. C., & Cabot, J. (2016, May). Findings from GitHub: methods, datasets and limitations. In IEEE/ACM 13th Working Conference on Mining Software Repositories (MSR) (pp. 137-141). IEEE.
[9] Dabbish, L., Stuart, C., Tsay, J., & Herbsleb, J. (2012, February). Social coding in GitHub: transparency and collaboration in an open software repository. In Proceedings of the ACM 2012 conference on Computer Supported Cooperative Work (pp. 1277-1286). ACM.
[10] Firestine, B. (2017). Celebrating nine years of GitHub with an anniversary sale. GitHub, Inc. Retrieved from https://github.com/blog/2345-celebrating-nine-years-of-github-with-an-anniversary-sale (1 October 2017).
[11] GitHub, I. (2017a). A small place to discover languages in GitHub. GitHub, Inc. http://githut.info/ (1 October 2017).[12] GitHub, I. (2017b). Bring GitHub to work GitHub, Inc. Retrieved from https://github.com/business (1 October 2017).[13] GitHub, I. (2017c). GitHub REST API v3. GitHub, Inc. Retrieved from https://developer.github.com/v3/ (1 October
2017).[14] GitHub, I. (2017d). Trending in open source. GitHub, Inc. Retrieved from https://github.com/trending (1 October 2017).[15] Gitstar. (2017). Gitstar ranking. Gitstar. Retrieved from https://gitstar-ranking.com/ (1 October 2017).[16] Grapentine, T. (2000). Path analysis vs. structural equation modeling. Marketing Research, 12(3), 13-29.
Nazir, Hamilton & Tee
The 17th International Conference on Electronic Business, Dubai, UAE, December 4-8, 201752
[17] Hair, J.F., Anderson, R.E., Tatham, R.L. & Black, W.C. (2010). Multivariate Data Analysis (7th ed.). Uppersaddle River, New Jersey: Pearson Education International.
[18] Hamilton, J.R. & Tee, S. (2013). Understanding social network site consumer engagements. In Proceedings of the 24th Australasian Conference on Information Systems, Melbourne, VIC, Australia, December 4-6. Retrieved from https://researchonline.jcu.edu.au/31031/1/402.pdf (1 October 2017).
[19] Octoverse. (2017), The state of the Octoverse 2016. Octoverse. Retrieved from https://octoverse.github.com/ (1 October 2017).
[20] Onoue, S., Hata, H. & Matsumoto, K.I. (2013). A study of the characteristics of developers’ activities in GitHub. In Software Engineering Conference (APSEC) (Vol. 2, pp. 7-12). IEEE, Bangkok, Thailand, December 2-5.
[21] Sajnani, H., Saini, V., Ossher, J. & Lopes, C. V. (2014). Is popularity a measure of quality? An analysis of maven components. In IEEE International Conference on Software Maintenance and Evolution (ICSME) (pp. 231-240). IEEE. Victoria, British Columbia, Canada, September 29 - October 3.
[22] Shadowsocks. (2017). Meet Shadowsocks, the underground tool that China’s coders use to blast through the Great Firewall, Shadowsocks. Retrieved from https://qz.com/1072701/meet-shadowsocks-the-underground-tool-that-chinas-coders-use-to-blast-through%0A-the-great-firewall/%0A (19 September 2017).
[23] Xavier, J. & Macedo, A. (2014). Understanding the popularity of reporters and assignees in the Github. In Proceedings of the 26th International Conference on Software Engineering and Knowledge Engineering (pp. 484-489). SEKE, Hyatt Regency, Vancouver, Canada, July 1-3.
[24] Yu, Y., Yin, G., Wang, H. & Wang, T. (2014). Exploring the Patterns of Social Behavior in GitHub. In Proceedings of the 1st International Workshop on Crowd-based Software Development Methods and Technologies (pp. 31-36). ACM: Hong Kong, China, November 16-22.

������%�����%��$�����������%������$��$����_��������<�����%����� �%���������� '���� ���� � ��������� #������ ���#����� ��&��Proceedings of The 17th International Conference on Electronic Business��'' ����[��&*/<��=$�����>�/��= � �� ��@�[
Wanitcharakkhakul & Rotchanakitumnuai
�
The 17th International Conference on Electronic Business, Dubai, UAE, December 4-8, 2017����
� ��^��������� ��������(������$ ��������#���� ����������������
��������������%�����%��$�|��\%��������>��^ �������\%�����#��"��������{���������_����$�������%������$��$����\%��������>��^ �������\%�����#�������$��{����$���%�
����������
<�����%����\ �%�����������% ��#^��� ���!���������� �%����������� #������ ������%���� #�� �$� �#�����%������������� ��� #�'���� ������% �� �"����\% ���^ ����������!�������%�^ ���'�������� � ��������� #������ ���#�<�����%����� �%��������#�'���������� ��$ ��������� �"���# ^ ��' #�!������� ���$� �"��%�' �!������ � `' �����������$������#���������� '�������� ��$�^ ��� ������'��� ������#�� #�����' ����� ��\% �! #������ �'��# ����" � ��@��\% �� � ���%�� �$�����%�" #��%����% ��������!�$ ������!�������!! �������% ���� '���� ����' �!������ � `' ��������"%��%�����$# ���% �� �����������!�� �%����������� � !������#�� ����^ ��#^����� ��\�$���!������%�����'���������� '���� ���#���"������%���'�����^ ���'�����!��% �<�����%����� �%���������Keywords:�<�����%����� �%�������� � ��������� #������ ���#����� ���% ���%���!�������������������������������|*��� �'��#�����$�%����
�����!"���������� ������ #������ ���#���������'���������!���������!����% �'��� ����!�� #������� ��� ����!�'��� ��������$#������' �������#�����' �������� #�����'��!�� ����� ��� ��� ����_ ^ ����%��'�������#�'����!�������������$�����������#�� �%��������������� �'��� ���� #������ ���#����������� #�/� ��������� #������ ���#�_��� ��\% �'��� ���#��������� ����� #�"��%����% �%��'���������# ����������� � ��� �^ ��� #������� ���� #������ � ���'����� '� ��� ��� !���� �% � '���� � #����� �� ��� ���� ��#� '%���������� ���� �$''���� #���� ������ �������#����$��� ���!�����% �'� ����'�������%��$�%��% ����� ����������#��et al.���������&�������������$''������������ !���# ������������� � &������� �$� #� ���� �#���"��������!�'��%���� #�#�$�����#���� ���� �^��� ���������''�������������% ���%���!���������� �" ��'��� ������#�� �^�� �'��^�# ������ ���$��� �'��� ���������� ���� ��% �� �^ �������� ��!��% ���� �� ��!� #������ � � < ��# ��� ��� ���� '��^�# � �% � ��!��������� ���$��� ��� ��#� ��� ��� !��� ����� ���� '�������� �!� �% � % ���%��� � � �^�� �'��^�# ������ � !! ���^ ����<�����et al���������\% ��$�� ��� � ��������� #������ ���#����� ���������^ ��� !! ���^ �����%��'������%�^ �$� #�#�!! � ���'��������\% � � ��������� #����� � ���#� ���� ��� ��� %��'������ �� � '��^�� � ��#� # ^ ��' #� ��� $� � "��%��� �% � ������������� ���� � _�� � %��'������ %�^ �# ^ ��' #� �% ����"������ ���"%�� ���� �%�^ �'$��%�� #�� �#�����$� ��''�����������!�"�� � &���������� ����� �� #� �����% ��%��'������&!�'��� ����� �������"%�� ��% ���� ����^ ��������� ! �� #������% ��%��'������������ ���������% �'��� ������ #�����'��!�� �!���� �% ���%��'����� ��$�#������ �#�� � ������ � �$���� '��� ���� � � �^ � ����� #�� � !���� !���� �% �#���� ��� �% �'��^�� � � ��������� #������ ���#����� ���_$�%�'���� ������ �%��'������$���� ���������! ����'���������!���������� �" ���% ����� %��# �������% � ���� ��"��%� ���!�# �� ���� �^ ��� '��� ���� �� ����� ���!�# ��� ���$�� �% � � �$�������#�'��^�����!� �% ���#��� � �\% �% ���%�� �^�� �'��^�# ���'��^�# ���#� ���# �$�� ��$#� �� !��� �% ������ ���� � �\% � � ���$ ���� �# ��^ #� !���� �% � �%� �� �� !�����������$#���� ���'� � � ��� �!� #����� ��$�� �� ��#� ����$�� �!� ��!��������� ��#� #���� � �$����� ��� �%����� � � &�� ��� � ������� � �%��� ���%����� ��� �����#����'� � � ����!��% �#����%�^ ���'�������'��� �����% ���%�� ���#������%��% ��#^��� � ����!�<�����%����� �%�����������%����% �'�� ����������������#�� ���� `�%��� ��!� `�������#������! ��\% ��' ������� �!� <�����%���� ���'��� �� ��!��������� ���!�# ������� ���$����� ��#� � �#�����$� � ��!��������� ������ �� ����� ���~��\%�� ���^��^ #�����%���� �"���� �$�����%�^ ��% ����%������ � �^ ���#�� �#��% ���!��������� �<�����%����%������ �%������������ ���������% ����� ����#���!���������"��%�����# �!����% �� �$������!��% �#����&!��% � ��� ������%��� ������% ���!��������������� �� ����!� �% �� �"��������^ ��!�� �% ����$������!� �% � ��!�������� � �=�^�#��������������������#�������"% �� �% �#������ ��%��� #���% �� �� ����!��% �� �"����"�������"���#���^ ��% �������% �� ����� �����% �'�����'� � �^ ��% �'��^�����!�'��� ������#��% ����'� � � ����!��% �#�������" ����\% �'��� �������!�����������#��%�� #�� #�������!���������� ���# #�����% �� #������ ���#����� ���������� �# � � #���� #�� #�� ��$� �������� ���!� #����#�����������' ���������"%���� �'�����!��% ����� ���\%������!����������$�� �! ��������!������������#���������������������� #����<�����%������ ���� �����' #�����% ����� �������������$�� �! ���������'����� #� ��#� #�!!��$��� �*������ et al�� ������ /� � et al.�� ����� � \%��� <�����%���� � #����� � ���#� ����� � ��� "���� ����"�'��� ���������� ����% ����"��� #������ ���#����#����������% �'��^�������" ������ ��$� ��% �� �$������!�� #������ ���#���!��% �'��� ������ �!��&�����������% �'����#������$��%��% �'��� ��©�������%�������'��� ��������� ��#���� #������% ��� #������ �� �����#�� ��������$�$���� ��� ����\%����������������$����$����!�'��� ��������% ��� ��� ���'������#��% �� �$�������� �� � �^ #���������'��������������������������� ����% �'��� �������!����������%��$�%��% ��''���������������������&�� �!�� ����&����&���������� ��������� `�%��� ��% �#����� �" ���% �/�� #������ ���#���#�<�����%�������� ��% ���!���������� ��� #�����% �'��� �����������������&�"����������_�����*���������%��������'��������!����������������^������'$� ���$�# �������#���������# �� �� �����% �� #����$� �����$�� #���� �� #������ �" ���% �������������'���� �������"� ��et al.�����~��&������� ����#��%���<�����%���������#��^ ����� �����$��������� `�%��� ��!�^��$��� ���!��������� `�%��� �"��%�$�������� �� #��������^ ��!���% ���!����������*%�����#�����= ^ ��������������~������ ��% � �������������$#������%����$�] ������\%�����#���%�����$#��!��$� ������% ���� '���� ��!��#�'������!�
Wanitcharakkhakul & Rotchanakitumnuai
The 17th International Conference on Electronic Business, Dubai, UAE, December 4-8, 2017��@�
<�����%����� �%�����������% � � ��������� #������ ���#����� �����%��'�������\%�����$#��"�������������$����'��^ � �����!��% � � ��������� #������ ���#����� ����#�� ��$�# ��� �����'��^�#����� #������ �^�� ��!���'��� ��������% �!$�$� ��
&��$���"�$��$@�$;����%��� �!������ ���#�������� !�������!�� #����� � ���#��$�����'�' �� ��������'$� ����!�"�� ���$� ���������������#��$�������� ���'��������% �% ���%��� �� �^�� ����� ������% ���$�������� ��!��% �� #������ ���#����� ��%������ !! �������������� %��# ��� ���� �����!�'��^������ �$�������#� !! ���^ � ����&���% �� ����� ��� ^ ������$���������# ���% ���"��%�����^ ������ �� �� `� ������$ ����� '��^���� �!� �% � � #����� � ���#� ���� �� ���������� �� � � ��}�%�� �� ������ &�� � ���#� �!� � �������%�'� � �" �� #������� ��#�'��� ���������%��� �������'��� ���� �� � #���������< ��$� ��!��% ���'�#��%��� ���#��% �������!� #$��������%���� "�� �'������������'��� ���� %�^ � ���� ���� ���$�� �% � � �'����������� ��� ��'��^ � �% ��� % ���%�� ��#� ��� ��� ����� !�$�#� �%��� �% � � �������%�'� � �" ��#���������#�'��� ����� �$���#�� ���������% ��$�������!���� ���#��� ��� ����\% �# ^ ��'� ����!��$�%�� ��������"����% �'�'��� ��������%�� ��% �' ���������!���������"��%��% ���#��������������! ���#�!�� �#��� �^����� ����*% ���!!�������������'��� ���� �� � #��������'��� ����"����� �����!� #��!� �% �� #����� ��!�����������#�%�^ ���� �'������'������"��%� �% ���������� ��!� �% � `' ���� ������ �'� ���% �#�������"�#������% � ��� ������� �%������ ���^������ ��%���% �'����� ���#����% ���%���!���������!���% ���%�#�����������#��� ��� ����� � �����et al.�����~����" ^ ���������$�������� ���'�������% �����������%�� ���!���������� ��$� ��!�'��^�������� ������#�! �����%����% ���������������!���!���������������$� �#����� ����/^ ���%�$�%���� �� �%������ ���������^ ��% � �'���� ��������������"���%��% ���^ ��� ����&������ � ���������%�^ ��������$�# �����#�����!��% ����$��$� ��!��% �#����!����%��������!���������������������$����� � � \% � � '���� ��� �� � ������ ��'������� ������� � � � <�����%���� ��� �� � �!� �% � '�'$���� � �%������ �� ��� ����� �� ���� ��$� �������� �$� ���#�%����#]$����� ������� ����# ���"��%�'��^�������� �������#��%�� ���!����������������% ���%��� ��<�����%����� �%�������"����% �'�����������^������#����� ������'��#$���^���������!���������"%��%��� �"%����% ���#$����� � #�� ��� ��# �� ��� �� �� � � "� ^��$ ��� �%��� � `' �� �� �� ��� % ���%��� � ��#� �$��#� '��� ���� �� � #� % ���%� ���� ���!�����������������������^ �' �!������ � ��� �����! ����#���� � !! ���^ ���*���#������ �� #�������^ ��� ������/�� #������ ���#���/�������#���$#� #����$����'������!��% � � ��������� #������ ���#����� ������% �#��������' �!������ ��%���� #�����% �� ^� "��!��% ����� ����� `���� ���'������!��% � � ��������� #������ ���#����� ��"��%����% �#�����©���!!�� ���\% �� ^� "�!�$�#��%����% � !������� �%��� ��!�$ �� � �% � �$�� ��� �!� � �������� � #����� � ���#� ���� ��� ����$# � �% � !! ���^ � ! ��$� �� �!� �% � � ��������� #������ ���#����� ���$''��������% �����������''�����������% �# ������!��% � � ��������� #������ ���#����� ����% �!$���������!�� "� � ��������� #������ ���#��� �% �"���%��!� �% � � ��������� #������ ���#����� ����% � `' ���������!��� �% ��' ��������!� �% ����� ����#�'��� ��� ���� � ������$�et al.��������\% �� ^� "������#������ #��%���% ���%��� ���!��������������^��$��� ���$�� ��!�% ���%���!���������_%�������!�% ���%��� ���!������������� � ������������ ��% �% ���%��� ����� ���' ��� �" �����#������'��^ ��% ��$�������!�% ���%��� �� �^�� ���� ���%���!��������������' ���������� ���!�'��� ������#��%�$�#�� ��"� #���#��������� #����'��� �����&���%�$�#������ �� '��"�# �'� �#����^����$��� #������� ��� ������� ������'� ^ ���#�����%��������#�'��^�����<�����%���� # �������� �� �� # � ������� #� � �"���� �!� �% � '$����� � #� ��� ��� '��� ���� �� � ��� � ��� �������� ��#� �%�� � �% ��� �"����!��������� ��������#�� �$� ���"��%�$��^���������'��^��������� ����"%���� ��% �#�����"� ������� ����$� #��%����% �����������!��% ����"��% ���%���!�����������$ �et al.�����~���<�����%����� �%�������% �'������ #$������% �% ���%���!���������'��� �� ������% ����� ���!�"���������� �% ��"��%���% �����#�^���#�������#���� ��������#������ ���� ����������#���'��^�����% ����$������!��% ���!���������!���� �$������_���������������\%$���<�����%����� �%����������^ ���% �'���� ���!��% �� �$�������#�'��^�����!� � ��������% ���%� � ���#� � ����� ����"���� � � �^ ���'��^�� �� �� �%��� ��� ���!�# �������� ����'� #����%��% #�#������$����� ��#� ��� ���# #��##� ������$�������% ���!�������������%�$�%��% �'��� �����!���������"��������� ����� #����<�����%������������ �$�� #�����$�%���������� ��� �� ������ %��% �� � �$����������$� �� ��� �$��������� � ��� ��� ��� �% � ��!��������� "��%� ��� �# ���!�������� ��#��$�% ��������������% �#����� �$ �� #�������% �� �^�� �'��^�# �����% ��%�^ ���� '���� �'$�������# ���% ���% ���# ���!�'��� ������#� � �^�� � '��^�# ��� �� � $� #� ��� �% ��� �% � ^ ��!�������� �!� ' ��������� "���� � � � �$�� #� ��� $������ �% � #���� �!� �% � '��� ��������� ���� �� � ��� � ��� # � ���� � ��� ��� ��� �$� � ��� $������ �% ��� � #����� � ���#� � � &�� � ���#� �!� ��� ��� ��� ����� �% � ���� ��� ���$��$�%���� #� ��� ��� � ��� �� ^ ��� #�!!��$��� !��� �% � #�!! � ��� �' ������� ���� ���� ��� ��� "�$�#�� � ��'������ � �%��� �% � '��� ��©����!��������� "��� ���'����� #� !��� ��� $��$�%���� #� ��� �� � � &�� � ���� �!� �% � �$#���� #���� ^���#������ ��#� ��� '���� � ��� �%�� ���^��^ #����<�����%����"����� �#�� ������� �������% �%��%��!��% �#������#��% �� ! � �� �����% ������%���������\% � � ��������� #������ ���#��"����� ��$����� #�!������$��������#������ #������ ���#����#�#��$� ����"����� ����� #���#�� ���!� #��� � �� tal.�� ���~�� <����� et al.�� ������ *$�� ������ � #� �� ��� �% � ��]��� � �^�� � '��^�# �� �!� <�����%���� !��� � #����� #���� ��� �������$���� ��� #� ��%������� '������'��^ ��%����% �'�����'� ���!�# � ���������������#��% ��������!��% ��_����$��$� ������ �#����� �$�������#��% � � ��������� #������ ���#����� ������"���������%���"��%�<�����%�������" �������% �$� ��!�/�% � $�������� ����% ����� �������% ������� ���� ���#��% ���� ��!�� �^�� �'��^�# ����%�$�#�%�^ ��% �� '���� ��$#������%����<�����%����"������������������ ��� ��� �% � � #����� � ���#��� "%�� � '��� ���� %�^ � �% � ���%��� ��� �% ��� �% � '��!�� �� �� ��� ��� ��!���������� ��#� �%������ �% ���!���������\%���# �������� ����� "�� �%�#�!������ ���������% � `����������� ����!�� �^�� �'��^�# ����'��������������&���#��% ������'�� �����!��% �� �"�������$��$� ���������et al.�����~��<�����%����� �%�������%���� �� �'��� #����%��'�����������$���� ���������� ���#��%�� ��% � � ��������� #������ ���#��!������� ��'��� �����\% ����� �� ��$� ���% �'��^������ �$�������^�������������#� �������� ��� ��� ��� �% � #���� ���� � � � &�� � #$� �� �% � #$������� ��#� '��� #$� �� �!� ����������� ��#� �%������ �% � � #�������!��������� ��#� �$''����� �% � # ������� ������� ��� � #����� �� ��� ��� ��� " ��� ��� � #$� �� �^ ����� ������ �=$��^�������� et al.�������������(�� �*������^�
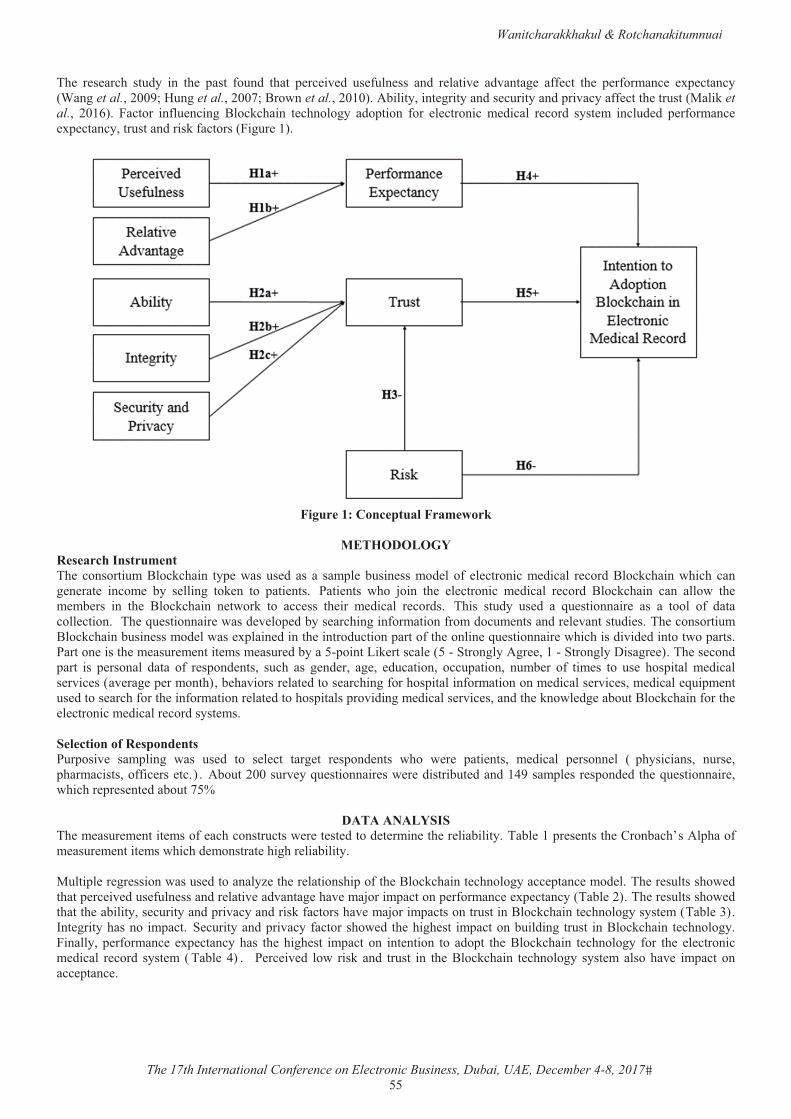
Wanitcharakkhakul & Rotchanakitumnuai
The 17th International Conference on Electronic Business, Dubai, UAE, December 4-8, 2017����
\% � � � ���%� ��$#�� ��� �% � '���� !�$�#� �%��� ' �� �^ #� $� !$�� ��� ��#� � ����^ � �#^����� � �!! ��� �% � ' �!������ � `' �������������et al.���������$���et al.��������<��"��et al.�������������������� ��������#�� �$�������#�'��^�����!! ����% ���$����������etal.�� ���~�� ������� ��!�$ ������ <�����%���� � �%������� �#�'����� !��� � �������� � #����� � ���#� ���� �� ����$# #� ' �!������ � `' ����������$�����#������!�����������$� �����
�*������5_�����(�� �*������^�
�#$�%�!�&�<)�
�����������������\% ���������$��<�����%���� ��' �"���$� #� ��� �� ���'� � �$��� �����# ���!� � ��������� #����� � ���#�<�����%����"%��%� ����� � ��� � ����� � ��� � ������ ��� �� ��� '��� ��� � ���� ���� "%�� ]���� �% � � �������� � #����� � ���#� <�����%���� ���� ����"� �% �� �� ��� ��� �% � <�����%���� � �"���� ��� ��� ��� �% ��� � #����� � ���#� � \%��� ��$#�� $� #� �� �$ ��������� � ��� �� ����� �!� #�������� �������\% ��$ ��������� �"���# ^ ��' #����� ���%������!���������!����#��$� ������#�� � ^������$#� ��\% ���������$��<�����%�����$��� �����# ��"��� `'���� #�����% ������#$������'�����!��% ������ ��$ ��������� �"%��%����#�^�# #�������"��'������������� �����% �� ��$� � ����� ���� ��$� #��������'�������� ������� ������_����������� ������_��������=����� ��\% �� ���#�'���� ��� ' ������� #���� �!� � �'��# ����� �$�%� ��� � �# ��� �� �� #$�������� ���$'������� �$�� �� �!� ��� �� ��� $� � %��'����� � #������ �^�� ����^ ��� �' ������%���� %�^������ ��� #����� ���%����!���%��'�������!������������� #������ �^�� ���� #����� �$�'� ���$� #����� ���%�!����% ���!���������� ��� #����%��'������'��^�#����� #������ �^�� �����#��% ����"� #� ����$��<�����%����!����% � � ��������� #������ ���#����� ������� ������������(�������$�'���^ � ���'����� "��� $� #� ��� � � ��� ���� �� � �'��# ���� "%�� " � � '��� ����� � #����� ' ����� �� � '%���������� �$�� ��'%������������!!�� ��� ��� ����$�������$�^ ���$ ��������� ��" � �#������$� #���#��@�����'� ��� �'��# #��% ��$ ��������� ��"%��%�� '� � �� #����$�������
!�������&)����\% �� ��$� � ����� ����!� ��%�������$����" � �� �� #����# � ���� ��% �� ����������\��� ���'� � �����% �*������%�����'%���!�� ��$� � ����� ���"%��%�# �������� �%��%�� �������������$���'� �� �� ������"���$� #���������� ��% �� �������%�'��!��% �<�����%����� �%���������� '���� ���# ��\% �� �$�����%�" #��%���' �� �^ #�$� !$�� �����#�� ����^ ��#^����� �%�^ ���]�����'�������' �!������ � `' ��������\��� ����\% �� �$�����%�" #��%����% ����������� �$�������#�'��^������#������!�������%�^ ���]�����'����������$������<�����%����� �%����������� ���\��� ����&�� ������%������ ��'��� �_ �$�������#�'��^����!�������%�" #��% �%��% ��� ��'��������$��#���� ��$��� ���<�����%���� � �%���������������� ' �!������ � `' �������%��� �% � %��% ��� ��'���� ��� ��� ������ ��� �#�'�� �% � <�����%���� � �%������� !��� �% � � ��������� #����� � ���#� ���� �� � \��� � @� � � � �� �^ #� ��"� ����� ��#� ��$��� ��� �% � <�����%���� � �%������� ���� �� �����%�^ � ��'���� ������ '���� �����
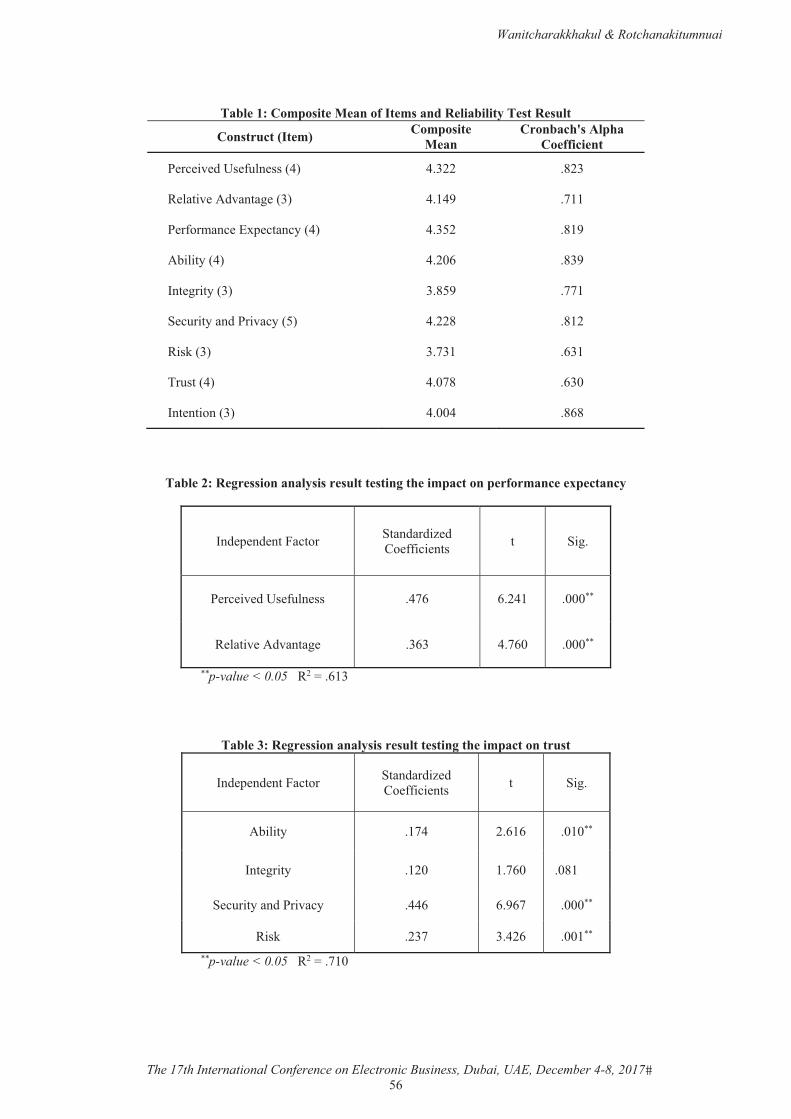
Wanitcharakkhakul & Rotchanakitumnuai
The 17th International Conference on Electronic Business, Dubai, UAE, December 4-8, 2017��~�
��
�� ��5_����(������#��������������� ��� ������������� ��
���������`����k� ���(�������#��
������J��� (�������������
� �� �^ #�>� !$�� ����@�� @���� [���
� ����^ ��#^����� ����� @�@�� ����
� �!������ �/`' ��������@�� @���� [���
���������@�� @��~� [���
&�� ���������� �[��� ����
_ �$�������#����^�������� @��[� [���
��������� ����� ~���
\�$����@�� @��[� ~���
&�� ���������� @��@� [~[�
���
�� ��/_����������� ��������� ���������������(�����(����������q(�������
&�# ' �# ���������� _���#��#�� #�*� !!��� ���� �� _���
� �� �^ #�>� !$�� ��� @�~� ~�@�� ���||�
� ����^ ��#^����� � �~�� @�~�� ���||�
**p-value < 0.05������º�~������
�
�� ��{_����������� ��������� ���������������(�����������
&�# ' �# ���������� _���#��#�� #�*� !!��� ���� �� _���
�������� ��@� �~�~� ���||�
&�� ������ ���� ��~�� �[��
_ �$�������#����^���� @@~� ~�~�� ���||�
����� ���� �@�~� ���||�**p-value < 0.05 ���º������
�
���
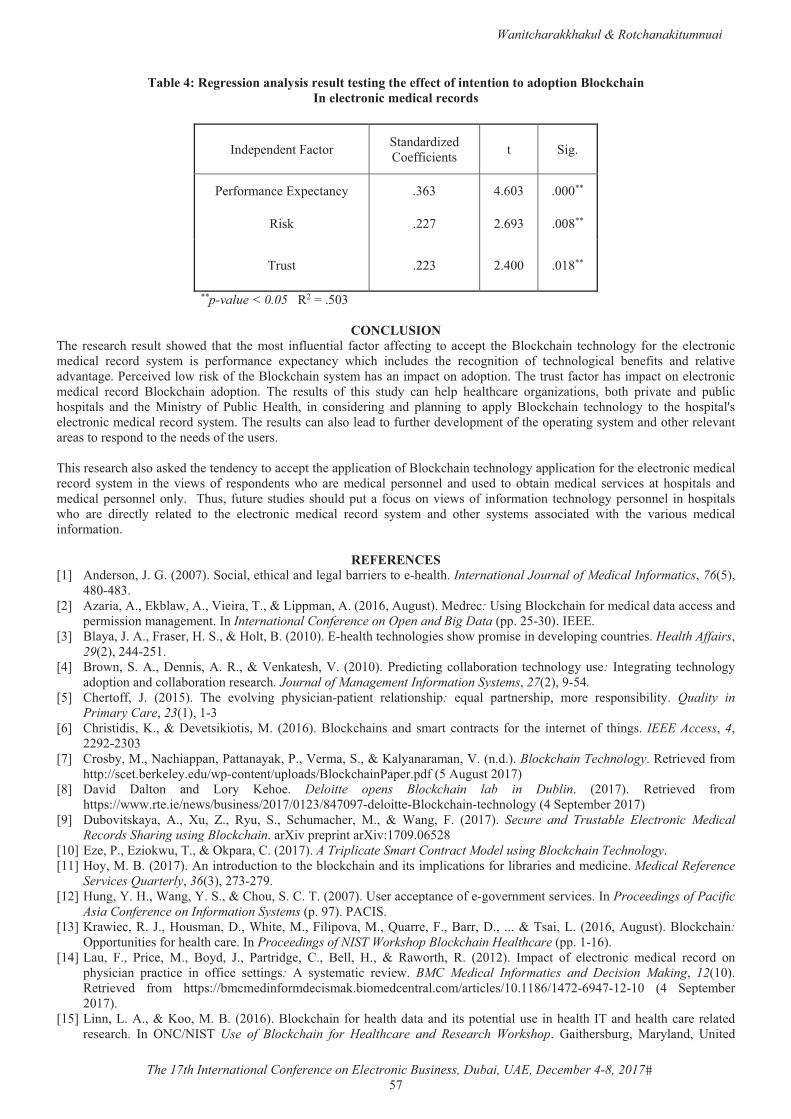
Wanitcharakkhakul & Rotchanakitumnuai
The 17th International Conference on Electronic Business, Dubai, UAE, December 4-8, 2017����
�� ��|_����������� ��������� �����������������������������������(����� ��^�������� ������������� ���������
�
&�# ' �# ���������� _���#��#�� #�*� !!��� ���� �� _���
� �!������ �/`' ������� �~�� @~��� ���||�
����� ���� �~��� ��[||�
\�$��� ���� �@��� ��[||�
**p-value < 0.05������º������
����&"�����\% � � � ���%� � �$��� �%�" #� �%��� �% ������ ��!�$ ������ !������ �!! ������ ��� ��� '�� �% �<�����%���� � �%������� !��� �% � � ��������� #����� � ���#� ���� �� ��� ' �!������ � `' ������� "%��%� ����$# �� �% � � ���������� �!� � �%���������� � � !���� ��#� � ����^ ��#^����� �� �� �^ #���"�������!��% �<�����%�������� ��%��������'��������#�'�����\% ���$���!������%�����'������� � ��������� #����� � ���#� <�����%���� �#�'����� \% � � �$���� �!� �%��� ��$#�� ���� % �'� % ���%��� � ��������������� ���%� '��^�� � ��#� '$�����%��'������ ��#� �% � ��������� �!� �$����� � ���%�� ��� �����# ����� ��#� '�������� ��� �''��� <�����%���� � �%������� ��� �% � %��'����©�� � ��������� #������ ���#����� ��\% �� �$�������������� �#����!$��% ��# ^ ��'� ����!��% ��' ����������� ����#���% ��� � ^������ ������� �'��#�����% �� #���!��% �$� �����\%���� � ���%��������� #��% �� �# ���������� '���% ��''����������!�<�����%����� �%��������''���������!����% � � ��������� #������ ���#� ���� �� ��� �% �^� "���!� � �'��# ����"%�� �� � � #����� ' ����� �� ��#�$� #� ��� ������� � #����� � �^�� �� ��� %��'������ ��#�� #�����' ����� ������� �\%$��� !$�$� ���$#� �� �%�$�#�'$���� !��$�����^� "���!� ��!��������� � �%�������' ����� �� ���%��'������"%�� �� � #�� ����� � ��� #� ��� �% � � �������� � #����� � ���#� ���� �� ��#� ��% �� ���� ��� �������� #� "��%� �% � ^����$�� � #�������!����������
�$*$�$��$��£�¤� ��# ������}����������_������� �%�������#�� ��������� ������ -% ���%�International Journal of Medical Informatics��76�����
@[��@[��£�¤� �����������/����"������� �����\������''�����������~���$�$����� #� �: >�����<�����%����!���� #�����#������� �����#�
' �������������� � ���&��International Conference on Open and Big Data �''�������� &///£�¤� <������}�������� �����_����������<��������/-% ���%�� �%������ ���%�"�'����� ����# ^ ��'������$���� ��Health Affairs��
29������@@�����£@¤� <��"���_����= �������������� ���� �%���� ������ �� #��������������������� � �%�������$� : &�� �������� � �%�������
�#�'�������#���������������� � ���%. Journal of Management Information Systems��27��������@.£�¤� *% ���!!�� }� ������� \% � ^��^���� '%�������-'��� ��� � �������%�': �$��� '���� ��%�'�� ��� � � �'����������� Quality in
Primary Care��23���������£~¤� *%�����#���������= ^ ������������� ����~��<�����%�������#� ������ ���������� !��� �% � ��� �� ���!� �%����� IEEE Access��4��
����������£�¤� *�������������%��''�������������������� �����_����������������������#��Blockchain Technology�� ��� ^ #�!����
%��'�¡¡�� �� �� � � #$¡"'����� ��¡$'���#�¡<�����%�����' �'#!�����$�$���������£[¤� =�^�#� =������ ��#� ����� � %� � Deloitte opens Blockchain lab in Dublin� ������� � ��� ^ #� !����
%��'��¡¡"""�� � ¡� "�¡�$��� ��¡����¡����¡[@�����# ����� �<�����%����� �%��������@�_ '� �� ��������£�¤� =$��^��������� ��� $�� ��� ��$�� _�� _�%$���% ��� ��� �� ������ �� ������� Secure and Trustable Electronic Medical
Records Sharing using Blockchain����^�'� '��������^������~��[£��¤�/� �����/����"$��\������'�����*��������A Triplicate Smart Contract Model using Blockchain Technology�£��¤��������<����������������#$����������% �������%������#�������'����������!���������� ����#�� #���� �Medical Reference
Services Quarterly��36�������������£��¤��$�����������������_����*%�$��_�*�\������� >� ����� '���� ��!� -��^ ��� ���� �^�� ��&��Proceedings of Pacific
Asia Conference on Information Systems �'�������*&_�£��¤����"� �����}����$������=���%�� ���������'�^������ $��� �����<�����=�� ���\������� ����~���$�$����<�����%���:
�''���$���� ��!���% ���%���� �&��Proceedings of�NIST Workshop Blockchain Healthcare��''����~��£�@¤���$�� ��� ���� �� ��� <��#�� }�� ������#� �� *�� < ���� ��� �� ��"���%�� �� ������� &�'���� �!� � �������� � #����� � ���#� ���
'%�������� '������ � ��� �!!�� � � ������: �� ���� ������ � ^� "� BMC Medical Informatics and Decision Making�� 12������ ��� ^ #� !���� %��'��¡¡���� #��!���# ���������� #� ��������¡������ �¡����[~¡�@���~�@�������� �@� _ '� �� ��������
£��¤���������������������<� ����~��<�����%����!���% ���%�#������#� ����'�� ������$� � ���% ���%�&\���#�% ���%���� �� ��� #�� � ���%� &�� ��*¡�&_\� Use of Blockchain for Healthcare and Research Workshop� ����% ���$���� �������#�� >��� #�
Wanitcharakkhakul & Rotchanakitumnuai
The 17th International Conference on Electronic Business, Dubai, UAE, December 4-8, 2017��[�
_��� �����*¡�&_\�£�~¤�������<�# ��������������_���#�������<���������_�_��&���%�������������������������������������~��\�$������
���� #�#�������/������� '���� ��!�� #��������!!: $�����>\�>\��International Journal of Applied Engineering Research��11�@����������@[
£��¤�� � ��<����%����<���#���}�����~��Co-Creation of Trust for Healthcare: The Cryptocitizen Framework for Interoperability with Blockchain
£�[¤�� � ������ ��� = #$^��$�� ��� ���]������� ��� �� <�� ��� �� ����~�� �� ������%������� #� �''����%� ��� % ���%� ��!��������� `�%��� �� �"�����&��Proceedings of NIST Workshop Blockchain Healthcare���������''�������
£��¤��������#��� ��� ������%����� ��� �$�'%��� }�� =��� ��� }� ��� �� _���� ����� /� �� ������� �� ��������� ������� '���� ��� �$''��������$� �� ���� � ���^��� -% ���%�Health Affairs�����������~��[@�
£��¤�_���������*���������%�� ���' ���Innovative Blockchain Uses in Health Care.�� ��� ^ #�!������ ��������� ��" ���� ��%��'��¡¡"""!� #�������� ����¡"'����� ��¡$'���#�¡����¡�[¡<�����%�����%�� ���' �'#!��@�_ '� �� ��������
£��¤������� �. �.� ����[� = � ��������� �!! ������ ����$� �� �#�'����� �!� �������� ��� �� #��� ���#: ��� �'������� ��$#�. Cyber Psychology & Behavior�����~���~[�-~[�.�
£��¤���������_���$����*��������������������� &�^ ���������� �% �# � �����������#��� ���#�� �# ��#�!! � �� �� ��� �% ���� '���� ��!������ �� ������. British journal of educational technology��40����������[
£��¤�����������}�<����� � ��}�%�� ��}����������� �$����������#����� �������� � ���_�!�"�� .£�@¤��$ �� �� ������ ��� }���� =�� ���� ��� �� }������ �� ����~�� � ���%��� � #���� ��� "���: !�$�#� % ���%��� � ��� ���� �� � ���
<�����%���� "��%� ��^ �� '��^���� ����� �������� Journal of Medical Systems�� 40���[�� � ��� ^ #� !����%��'��¡¡�����'���� ����¡���� ��¡'#!¡��������������~���~����@�~'#!��@�_ '� �� ��������
�
Xing, R., Dong, S.X., Wang, Q.Y., Li, Q., Luo, X.B. & Duan, J. (2017). Constructing media-based enterprise networks for stock market risk analysis. In Proceedings of The 17thInternational Conference on Electronic Business (pp. 59-66). ICEB, Dubai, UAE, December 4-8.
Xing, Dong, Wang, Li, Luo & Duan
The 17th International Conference on Electronic Business, Dubai, UAE, December 4-8, 201759
Constructing Media-based Enterprise Networks for Stock Market Risk Analysis
Rong Xing*, Southwestern University of Finance and Economics, China, [email protected] Dong, Southwestern University of Finance and Economics, China, [email protected] Wang, Citigroup Services and Technology (China) Limited, China, [email protected]
Qing Li, Southwestern University of Finance and Economics, China, [email protected] Luo, Southwestern University of Finance and Economics, China, [email protected]
Jiang Duan, Southwestern University of Finance and Economics, China, [email protected]
ABSTRACTStock comovement analysis is essential to understand the mechanism of stock markets. Previous studies focus on the comovement from the perspectives of fundamentals or preferences of investors. In this article, we propose a framework to explore the comovements of stocks in terms of their relationships in Web media. This is achieved by constructing media-based enterprise networks in terms of the co-exposure in news reports of stocks and mutual attentions among them. Our experiments based on CSI 300 listed firms show the significant comovements of stocks brought out by their behaviors in Web media. Furthermore, utilizing media based enterprise networks can help us identify the most influential firms which can stir up the stock markets.
Keywords: Social media, stock comovement, social network analysis._____________________*Corresponding author
INTRODUCTIONStock comovement, a covariant phenomenon that stocks have similar movement of prices, is crucial to market risk premium and capital cost, portfolio management, style investing and economic resource allocation (Roll , 1989; Han & Xiao, 2005; Chelley-Steeley, Lambertides, & Savva, 2013; Dong, Liu, Hu, & Zhang, 2013). It is also an important signal to understand the market crisis. Specifically, the higher the frequency of comovements, the higher opportunity of market collapse (Hutton, Marcus, & Tehranian, 2009).
Earlier studies focused on the stock comovement from the perspectives of fundamentals, such as firm size and market characteristics (Adler & Dumas, 1983; McQueen & Roley, 1993). This is supported by the Efficient Market Hypothesis (EMH) theory that states that a stock price is always driven by “unemotional” investors to equal the firm’s rational present value of expected future cash flows. However, recent behavioral finance studies have attributed the non-randomness of stock movements such as overreactions to unfavorable news to investors’ cognitive and emotional biases (Long, Shleifer, Summers, & Waldmann, 1990). Realizing such “irrational” investors, researchers have begun to study stock comovements from the view of investors’ preferences. For examples, Rashes and Li found that there was a highly abnormal positive correlation between the stock prices of firms with only similar names but nothing in common (Rashes, 2001; Li, Tang, & Liu, 2011). Kumar discovered that the mental activities and behaviors of investors contributed to stock comovement, especially, the preference difference between retail investors and institutional investors would lead to different return comovements (Kumar & Lee, 2006). This phenomenon is regarded as the habitat-based comovement suggested by Barberis et al. (Barberis, Shleifer, & Wurgler, 2005).
Besides the perspectives of fundamentals and preferences, recent studies show that uneven information diffusion affects stockcomovements as well (King & Wadhwani, 1990; Connolly & Wang, 2002). Li et al. pointed out that Web media plays an important role in affecting stock fluctuations as a powerful information diffusion intermediate (Li, Wang, & Li, 2014). Because of the easy accessibility of their public information for investors provided by Claessons and Yaleh (2012), Vijh (1994) found that listed firms in S&P 500 have a priority of price increase. Liu et al. showed the comovements of the stocks which have a strong connection among enterprise blogs (Liu, Wu, Li, & Li, 2015).
In this article, we follow the track of information diffusion to study stock comovements occurred by their behaviors in Web information. Especially, we first construct media-based enterprise networks in terms of the behaviors of listed firms in public media and study the stock comovements, in particular, the wave effect caused by influential firms, with the networks. Our uniquecontributions include:
� To the knowledge of our best, it is the first attempt to study stock comovements utilizing the graph topology of relevant stocks which provides a visual approach to understand the complicated mechanism of stock comovements.
� This is achieved by constructing media-based enterprise networks in terms of the co-exposure in news reports of stocks and mutual attentions among different listed firms.
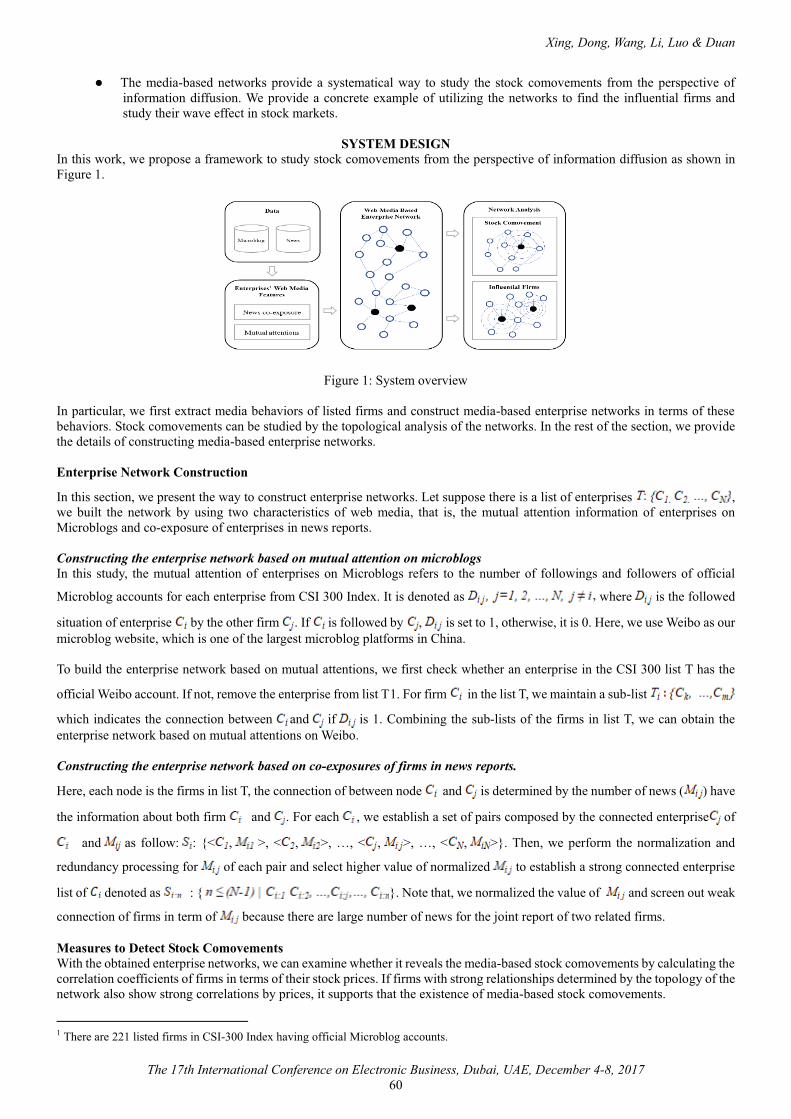
Xing, Dong, Wang, Li, Luo & Duan
The 17th International Conference on Electronic Business, Dubai, UAE, December 4-8, 201760
� The media-based networks provide a systematical way to study the stock comovements from the perspective of information diffusion. We provide a concrete example of utilizing the networks to find the influential firms and study their wave effect in stock markets.
SYSTEM DESIGNIn this work, we propose a framework to study stock comovements from the perspective of information diffusion as shown in Figure 1.
Figure 1: System overview
In particular, we first extract media behaviors of listed firms and construct media-based enterprise networks in terms of these behaviors. Stock comovements can be studied by the topological analysis of the networks. In the rest of the section, we provide the details of constructing media-based enterprise networks.
Enterprise Network Construction
In this section, we present the way to construct enterprise networks. Let suppose there is a list of enterprises , we built the network by using two characteristics of web media, that is, the mutual attention information of enterprises on Microblogs and co-exposure of enterprises in news reports.
Constructing the enterprise network based on mutual attention on microblogsIn this study, the mutual attention of enterprises on Microblogs refers to the number of followings and followers of official
Microblog accounts for each enterprise from CSI 300 Index. It is denoted as , where is the followed
situation of enterprise by the other firm . If is followed by , is set to 1, otherwise, it is 0. Here, we use Weibo as our microblog website, which is one of the largest microblog platforms in China.
To build the enterprise network based on mutual attentions, we first check whether an enterprise in the CSI 300 list T has the
official Weibo account. If not, remove the enterprise from list T1. For firm in the list T, we maintain a sub-list
which indicates the connection between and if is 1. Combining the sub-lists of the firms in list T, we can obtain the enterprise network based on mutual attentions on Weibo.
Constructing the enterprise network based on co-exposures of firms in news reports.
Here, each node is the firms in list T, the connection of between node and is determined by the number of news ( ) have
the information about both firm and . For each , we establish a set of pairs composed by the connected enterprise of
and as follow: : {< , >, < , >, …, < , >, …, < , >}. Then, we perform the normalization and
redundancy processing for of each pair and select higher value of normalized to establish a strong connected enterprise
list of denoted as : { }. Note that, we normalized the value of and screen out weak
connection of firms in term of because there are large number of news for the joint report of two related firms.
Measures to Detect Stock ComovementsWith the obtained enterprise networks, we can examine whether it reveals the media-based stock comovements by calculating the correlation coefficients of firms in terms of their stock prices. If firms with strong relationships determined by the topology of the network also show strong correlations by prices, it supports that the existence of media-based stock comovements.
1 There are 221 listed firms in CSI-300 Index having official Microblog accounts.
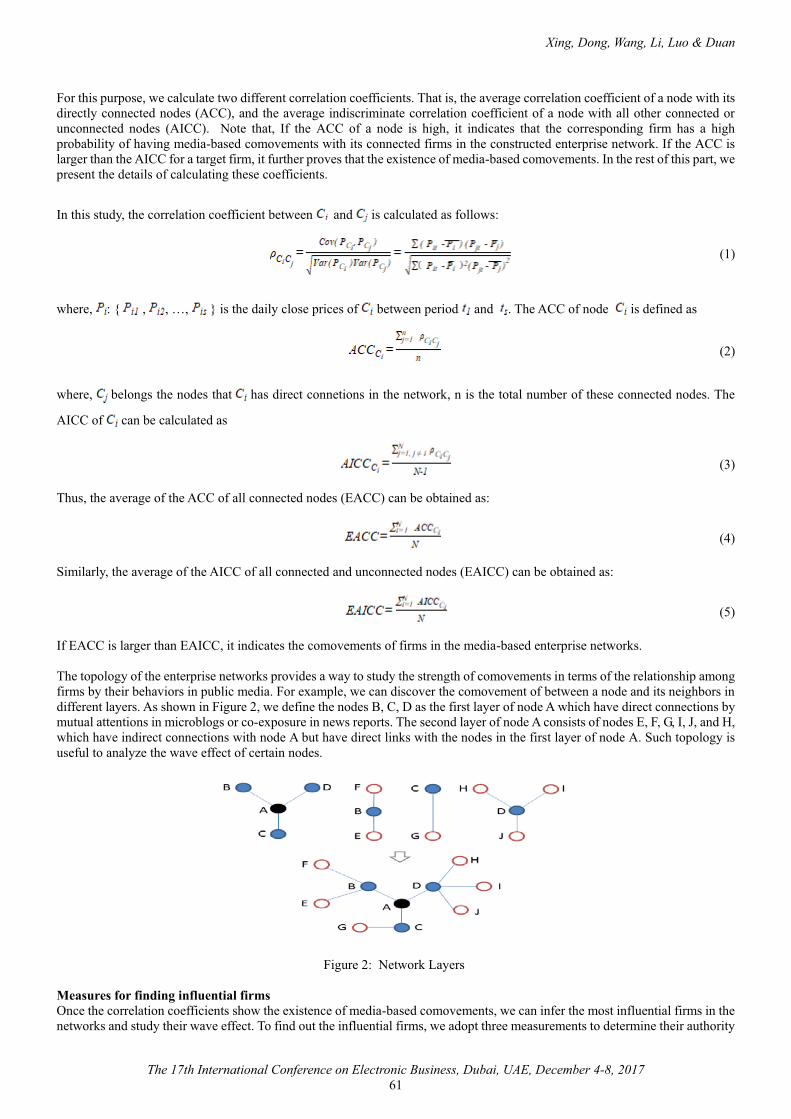
Xing, Dong, Wang, Li, Luo & Duan
The 17th International Conference on Electronic Business, Dubai, UAE, December 4-8, 201761
For this purpose, we calculate two different correlation coefficients. That is, the average correlation coefficient of a node with its directly connected nodes (ACC), and the average indiscriminate correlation coefficient of a node with all other connected or unconnected nodes (AICC). Note that, If the ACC of a node is high, it indicates that the corresponding firm has a high probability of having media-based comovements with its connected firms in the constructed enterprise network. If the ACC is larger than the AICC for a target firm, it further proves that the existence of media-based comovements. In the rest of this part, we present the details of calculating these coefficients.
In this study, the correlation coefficient between and is calculated as follows:
(1)
where, : { , , …, } is the daily close prices of between period and . The ACC of node is defined as
(2)
where, belongs the nodes that has direct connetions in the network, n is the total number of these connected nodes. The
AICC of can be calculated as
(3)
Thus, the average of the ACC of all connected nodes (EACC) can be obtained as:
(4)
Similarly, the average of the AICC of all connected and unconnected nodes (EAICC) can be obtained as:
(5)
If EACC is larger than EAICC, it indicates the comovements of firms in the media-based enterprise networks.
The topology of the enterprise networks provides a way to study the strength of comovements in terms of the relationship among firms by their behaviors in public media. For example, we can discover the comovement of between a node and its neighbors in different layers. As shown in Figure 2, we define the nodes B, C, D as the first layer of node A which have direct connections by mutual attentions in microblogs or co-exposure in news reports. The second layer of node A consists of nodes E, F, G, I, J, and H, which have indirect connections with node A but have direct links with the nodes in the first layer of node A. Such topology is useful to analyze the wave effect of certain nodes.
Figure 2: Network Layers
Measures for finding influential firmsOnce the correlation coefficients show the existence of media-based comovements, we can infer the most influential firms in the networks and study their wave effect. To find out the influential firms, we adopt three measurements to determine their authority
Xing, Dong, Wang, Li, Luo & Duan
The 17th International Conference on Electronic Business, Dubai, UAE, December 4-8, 201762
in the networks. That is, individual centrality, closeness centrality, and betweenness centrality. Table 1 shows the detailed definition of these measures. In particular,
Individual centralityThe individual centrality of an enterprise is denoted as the number of the lines which directly connect with other nodes by mutual
attentions or co-exposure in news. Let denotes the connection between nodes and , the individual centrality of is defined as
(8)
where, n is the maximum degree of any node in the network which denotes the maximum number of the lines directly
connected nodes with node
g
The higher the individual centrality, the greater the impact of the node. As shown in Table 1,
NrmDegree, denoted by (8), is the standardized individual centrality of
g
. NrmDegree is used to compare the centrality of the
no0tes in the same network. Degree means the absolute individual centrality which actually equals to the sum of . And Share denotes the proportion of the individual centrality of a corresponding node in the whole network, which is used to characterize the core of any point in the entire network.
Closeness centralityThe closeness centrality of a node is a measure of centrality in a network, calculated as the sum of the length of the shortest paths
between the node and all other nodes in the graph. Thus the more central a node is, the closer it is to all other nodes. Let g
be the number of shortest paths between nodes. g is used to measure the value of the closeness centrality of one node.The normalized closeness centrality is calculated as follow
(10)
where, is the maximum value of the closeness centrality of a target node which is the core node in the network. The larger thecloseness centrality of an enterprise, the faster the speed of spreading its price changes to other firms. Similarly, inCloseness in
Table 1, which is denoted by (10), is the closeness extent between node and the other directly connected notes which are
towards it. The outCloseness denotes the closeness extent of node towards to others. The inFarness and outFarness denote the
extent that node is far away from other directly connected notes.
Betweenness centralityThe betweenness centrality of an enterprise refers to the degree to which nodes in the network participate in the connection path of the remaining nodes. It calculated by
(11)
Where, is the number of shortest paths between node j and k, is the number of paths that the node i on the shortest paths between node j and k. The higher the betweenness centrality is, the more often this enterprise becomes the betweenness of the remaining two connected enterprises, and the more vulnerable this enterprise is impacted by stock comovement. It also indicates the importance of the node because a part of stock comovement will spread out via this node. In Table 1, Betweenness and nBetweenness are the measures of the betweenness centrality. Betweenness is the absolute betweenness centrality and nBetweenness are the standardized betweenness centrality which is denoted by (11).
Table 1: The Evaluation criterias about centrality analysisMeasures Explanation
Individual centrality
Degree Absolute individual centralityNrmDegree Relative individual centralityShare The proportion of a target node in network
Closeness centrality
inFarness Farness extent of the in-degree for one nodeoutFarness Farness extent of the out-degree for one nodeinCloseness Closeness extent of the in-degree for one node outCloseness Closeness extent of the out-degree for one node
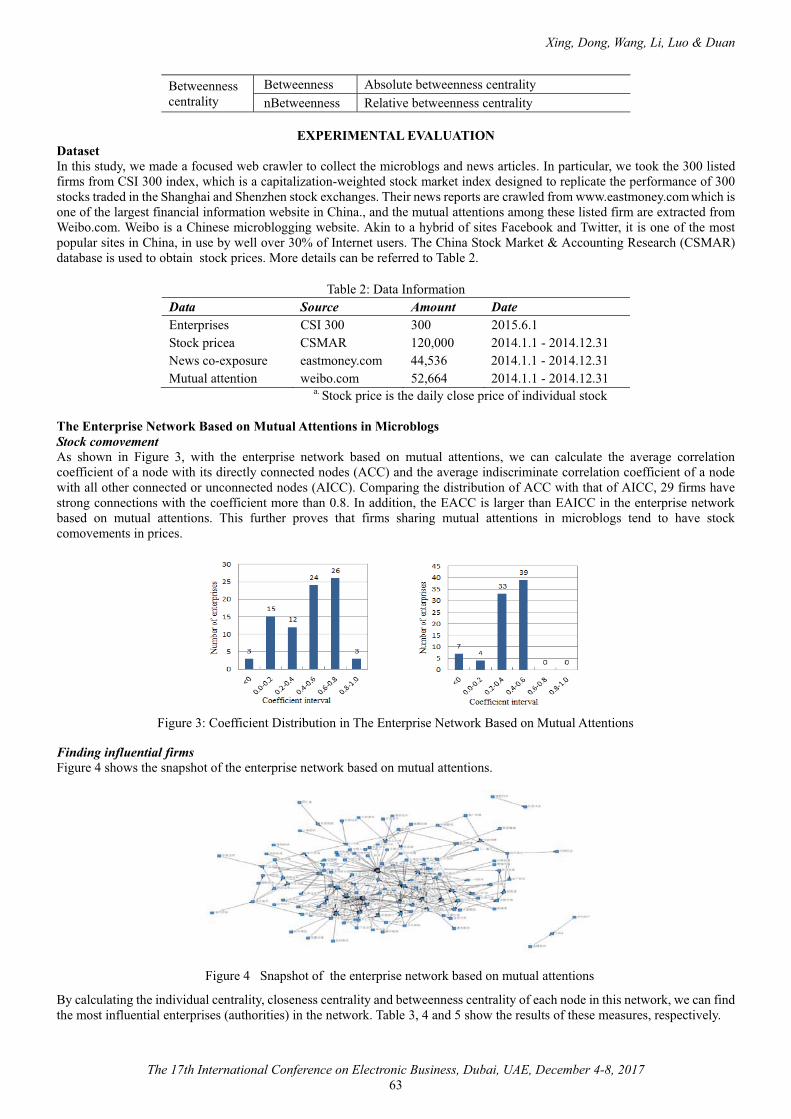
Xing, Dong, Wang, Li, Luo & Duan
The 17th International Conference on Electronic Business, Dubai, UAE, December 4-8, 201763
Betweenness centrality
Betweenness Absolute betweenness centralitynBetweenness Relative betweenness centrality
EXPERIMENTAL EVALUATIONDatasetIn this study, we made a focused web crawler to collect the microblogs and news articles. In particular, we took the 300 listed firms from CSI 300 index, which is a capitalization-weighted stock market index designed to replicate the performance of 300 stocks traded in the Shanghai and Shenzhen stock exchanges. Their news reports are crawled from www.eastmoney.com which is one of the largest financial information website in China., and the mutual attentions among these listed firm are extracted from Weibo.com. Weibo is a Chinese microblogging website. Akin to a hybrid of sites Facebook and Twitter, it is one of the most popular sites in China, in use by well over 30% of Internet users. The China Stock Market & Accounting Research (CSMAR)database is used to obtain stock prices. More details can be referred to Table 2.
Table 2: Data InformationData Source Amount DateEnterprises CSI 300 300 2015.6.1Stock pricea CSMAR 120,000 2014.1.1 - 2014.12.31News co-exposure eastmoney.com 44,536 2014.1.1 - 2014.12.31Mutual attention weibo.com 52,664 2014.1.1 - 2014.12.31
a. Stock price is the daily close price of individual stock
The Enterprise Network Based on Mutual Attentions in MicroblogsStock comovementAs shown in Figure 3, with the enterprise network based on mutual attentions, we can calculate the average correlation coefficient of a node with its directly connected nodes (ACC) and the average indiscriminate correlation coefficient of a node with all other connected or unconnected nodes (AICC). Comparing the distribution of ACC with that of AICC, 29 firms have strong connections with the coefficient more than 0.8. In addition, the EACC is larger than EAICC in the enterprise network based on mutual attentions. This further proves that firms sharing mutual attentions in microblogs tend to have stock comovements in prices.
Figure 3: Coefficient Distribution in The Enterprise Network Based on Mutual Attentions
Finding influential firms Figure 4 shows the snapshot of the enterprise network based on mutual attentions.
Figure 4 Snapshot of the enterprise network based on mutual attentions
By calculating the individual centrality, closeness centrality and betweenness centrality of each node in this network, we can find the most influential enterprises (authorities) in the network. Table 3, 4 and 5 show the results of these measures, respectively.
Xing, Dong, Wang, Li, Luo & Duan
The 17th International Conference on Electronic Business, Dubai, UAE, December 4-8, 201764
Table 3: Individual centrality of Enterprise Network Analysis Results Based on Web Mutual Attention
Enterprise Degree NrmDegree SharePeople.cn 49.000 36.296 0.075CMB 27.000 20.000 0.041Sinopec Group 23.000 17.037 0.035CMS 16.000 11.852 0.025ABC 16.000 11.852 0.025Zijin Mining 14.000 10.370 0.021China Unicom 13.000 9.630 0.020Pingan Insurance 12.000 8.889 0.018Kweichow Moutai 12.000 8.889 0.018CCB 11.000 8.148 0.017Table 4: Closeness Centrality of Enterprise Network Analysis Results Based on Weibo
Mutual AttentionEnterprise In-Farness Out-Farness inCloseness outClosenessSWHY Security 3185.000 18360.000 4.239 0.735People.cn 3322.000 10079.000 4.064 1.339CMB 3405.000 9983.000 3.965 1.352Sany Group 3408.000 18360.000 3.961 0.735CJ Securities 3415.000 18360.000 3.953 0.735CITS 3417.000 18360.000 3.951 0.735CS Air 3420.000 9967.000 3.947 1.354GS Railway 3433.000 10017.000 3.932 1.348Bank of China 3436.000 18360.000 3.929 0.735Sinopec Group 3440.000 9942.000 3.924 1.358
Table 5: Betweenness Centrality of Enterprise Network Analysis Results Based on Weibo Mutual Attention
Enterprise Betweenness nBetweennessSinopec Group 2375.623 13.132CS Air 2077.621 11.485CMS 1776.716 9.822People.cn 1629.961 9.010Guangshen Railway 1580.961 8.739CMB 872.640 4.824ABC 816.772 4.515China Unicom 767.896 4.245Kweichow Moutai 727.549 4.022CCB 681.857 3.769
In Table 3, People's Daily Online (People.cn) has the highest individual centrality, which is tightly followed by several enterprises in banking and energy industrial field including China Merchants Bank (CMB), Sinopec Group, China Merchants Securities (CMS), and Agricultural Bank of China (ABC). Top companies in Table 3 indicate that their price fluctuations have the most influential power to shake the prices of others. In Table 4, the enterprises in banking, securities, and transportation generally have a high closeness centrality. This means that the path of these enterprises to the rest of the nodes connected with them in the network is generally short, and their price fluctuations can quickly spread over in this network. Table 5 shows that, the enterprises, such as Sinopec Group, China Southern Airlines Company Limited (CS Air), CMS, People.cn, Guangshen Rail-way, have high betweenness centralities, which indicates such enterprises tend to become the intermediate nodes to participate in the stock comovement of other enterprises. Controlling the fluctuations of such stock prices in time helps to limit the spread of stock fluctuations.
The Enterprise Network Based on Co-exposure in NewsAnalysis of stock comovementDifferent with the network based on mutual attentions where the connection is indicated by Boolean value 0 or 1, the connections in news based network are weighted by the number of news articles which have the content about both firms (nodes). To construct the enterprise network, we set a threshold and if the number of common news is large than the threshold, we set the edge of these two firms to 1, otherwise 0. Figure 5 shows the relationship between the threshold for the normalized news numbers and the EACC of the network. It shows that the optimal threshold is 0.6. Therefore, we can construct an enterprise network based on news co-exposure as shown in Figure 6.
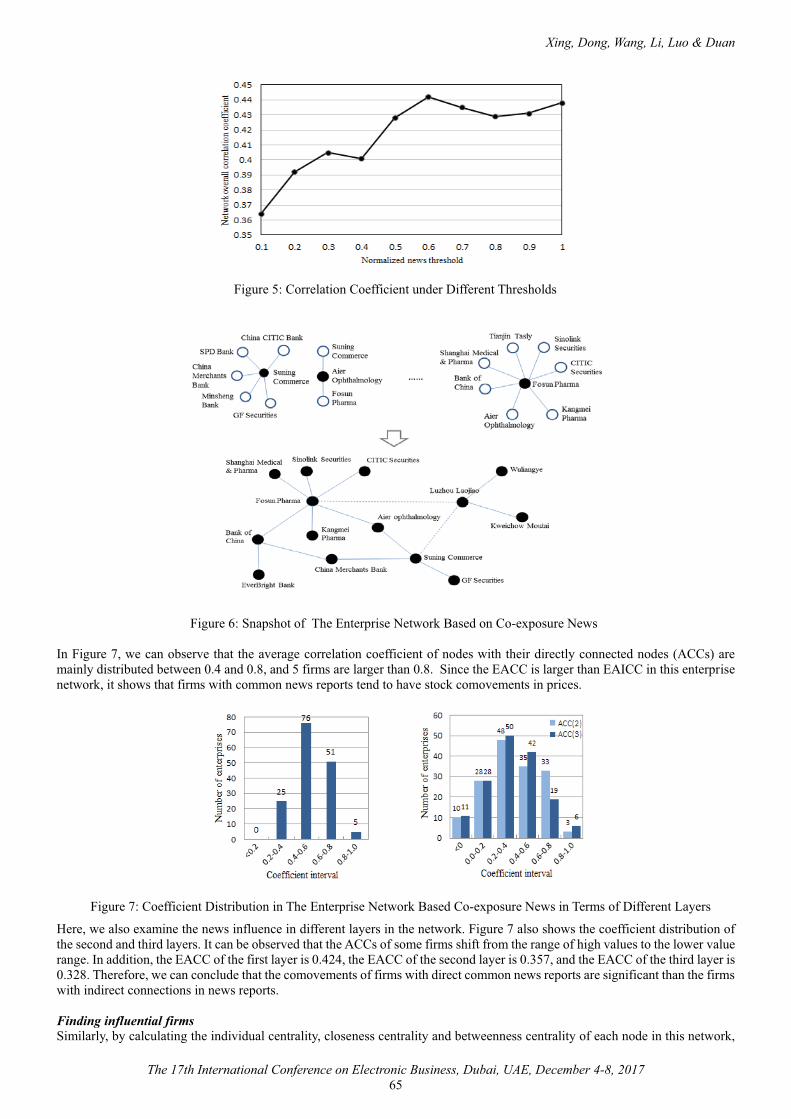
Xing, Dong, Wang, Li, Luo & Duan
The 17th International Conference on Electronic Business, Dubai, UAE, December 4-8, 201765
Figure 5: Correlation Coefficient under Different Thresholds
Figure 6: Snapshot of The Enterprise Network Based on Co-exposure News
In Figure 7, we can observe that the average correlation coefficient of nodes with their directly connected nodes (ACCs) are mainly distributed between 0.4 and 0.8, and 5 firms are larger than 0.8. Since the EACC is larger than EAICC in this enterprise network, it shows that firms with common news reports tend to have stock comovements in prices.
Figure 7: Coefficient Distribution in The Enterprise Network Based Co-exposure News in Terms of Different Layers
Here, we also examine the news influence in different layers in the network. Figure 7 also shows the coefficient distribution of the second and third layers. It can be observed that the ACCs of some firms shift from the range of high values to the lower value range. In addition, the EACC of the first layer is 0.424, the EACC of the second layer is 0.357, and the EACC of the third layer is 0.328. Therefore, we can conclude that the comovements of firms with direct common news reports are significant than the firmswith indirect connections in news reports.
Finding influential firms Similarly, by calculating the individual centrality, closeness centrality and betweenness centrality of each node in this network,
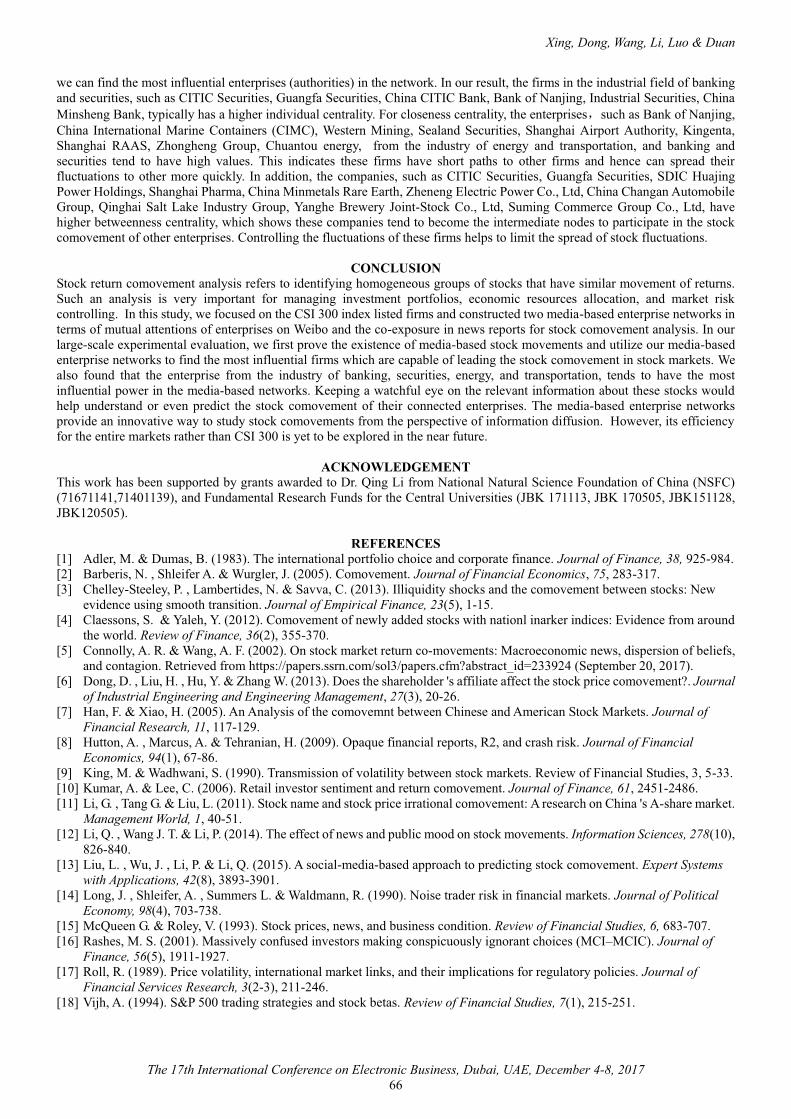
Xing, Dong, Wang, Li, Luo & Duan
The 17th International Conference on Electronic Business, Dubai, UAE, December 4-8, 201766
we can find the most influential enterprises (authorities) in the network. In our result, the firms in the industrial field of banking and securities, such as CITIC Securities, Guangfa Securities, China CITIC Bank, Bank of Nanjing, Industrial Securities, ChinaMinsheng Bank, typically has a higher individual centrality. For closeness centrality, the enterprises such as Bank of Nanjing, China International Marine Containers (CIMC), Western Mining, Sealand Securities, Shanghai Airport Authority, Kingenta, Shanghai RAAS, Zhongheng Group, Chuantou energy, from the industry of energy and transportation, and banking and securities tend to have high values. This indicates these firms have short paths to other firms and hence can spread their fluctuations to other more quickly. In addition, the companies, such as CITIC Securities, Guangfa Securities, SDIC Huajing Power Holdings, Shanghai Pharma, China Minmetals Rare Earth, Zheneng Electric Power Co., Ltd, China Changan Automobile Group, Qinghai Salt Lake Industry Group, Yanghe Brewery Joint-Stock Co., Ltd, Suming Commerce Group Co., Ltd, have higher betweenness centrality, which shows these companies tend to become the intermediate nodes to participate in the stock comovement of other enterprises. Controlling the fluctuations of these firms helps to limit the spread of stock fluctuations.
CONCLUSIONStock return comovement analysis refers to identifying homogeneous groups of stocks that have similar movement of returns. Such an analysis is very important for managing investment portfolios, economic resources allocation, and market risk controlling. In this study, we focused on the CSI 300 index listed firms and constructed two media-based enterprise networks in terms of mutual attentions of enterprises on Weibo and the co-exposure in news reports for stock comovement analysis. In our large-scale experimental evaluation, we first prove the existence of media-based stock movements and utilize our media-based enterprise networks to find the most influential firms which are capable of leading the stock comovement in stock markets. Wealso found that the enterprise from the industry of banking, securities, energy, and transportation, tends to have the most influential power in the media-based networks. Keeping a watchful eye on the relevant information about these stocks would help understand or even predict the stock comovement of their connected enterprises. The media-based enterprise networks provide an innovative way to study stock comovements from the perspective of information diffusion. However, its efficiency for the entire markets rather than CSI 300 is yet to be explored in the near future.
ACKNOWLEDGEMENTThis work has been supported by grants awarded to Dr. Qing Li from National Natural Science Foundation of China (NSFC) (71671141,71401139), and Fundamental Research Funds for the Central Universities (JBK 171113, JBK 170505, JBK151128, JBK120505).
REFERENCES[1] Adler, M. & Dumas, B. (1983). The international portfolio choice and corporate finance. Journal of Finance, 38, 925-984. [2] Barberis, N. , Shleifer A. & Wurgler, J. (2005). Comovement. Journal of Financial Economics, 75, 283-317. [3] Chelley-Steeley, P. , Lambertides, N. & Savva, C. (2013). Illiquidity shocks and the comovement between stocks: New
evidence using smooth transition. Journal of Empirical Finance, 23(5), 1-15. [4] Claessons, S. & Yaleh, Y. (2012). Comovement of newly added stocks with nationl inarker indices: Evidence from around
the world. Review of Finance, 36(2), 355-370. [5] Connolly, A. R. & Wang, A. F. (2002). On stock market return co-movements: Macroeconomic news, dispersion of beliefs,
and contagion. Retrieved from https://papers.ssrn.com/sol3/papers.cfm?abstract_id=233924 (September 20, 2017). [6] Dong, D. , Liu, H. , Hu, Y. & Zhang W. (2013). Does the shareholder 's affiliate affect the stock price comovement?. Journal
of Industrial Engineering and Engineering Management, 27(3), 20-26. [7] Han, F. & Xiao, H. (2005). An Analysis of the comovemnt between Chinese and American Stock Markets. Journal of
Financial Research, 11, 117-129. [8] Hutton, A. , Marcus, A. & Tehranian, H. (2009). Opaque financial reports, R2, and crash risk. Journal of Financial
Economics, 94(1), 67-86. [9] King, M. & Wadhwani, S. (1990). Transmission of volatility between stock markets. Review of Financial Studies, 3, 5-33. [10] Kumar, A. & Lee, C. (2006). Retail investor sentiment and return comovement. Journal of Finance, 61, 2451-2486. [11] Li, G. , Tang G. & Liu, L. (2011). Stock name and stock price irrational comovement: A research on China 's A-share market.
Management World, 1, 40-51. [12] Li, Q. , Wang J. T. & Li, P. (2014). The effect of news and public mood on stock movements. Information Sciences, 278(10),
826-840. [13] Liu, L. , Wu, J. , Li, P. & Li, Q. (2015). A social-media-based approach to predicting stock comovement. Expert Systems
with Applications, 42(8), 3893-3901. [14] Long, J. , Shleifer, A. , Summers L. & Waldmann, R. (1990). Noise trader risk in financial markets. Journal of Political
Economy, 98(4), 703-738. [15] McQueen G. & Roley, V. (1993). Stock prices, news, and business condition. Review of Financial Studies, 6, 683-707. [16] Rashes, M. S. (2001). Massively confused investors making conspicuously ignorant choices (MCI–MCIC). Journal of
Finance, 56(5), 1911-1927. [17] Roll, R. (1989). Price volatility, international market links, and their implications for regulatory policies. Journal of
Financial Services Research, 3(2-3), 211-246. [18] Vijh, A. (1994). S&P 500 trading strategies and stock betas. Review of Financial Studies, 7(1), 215-251.
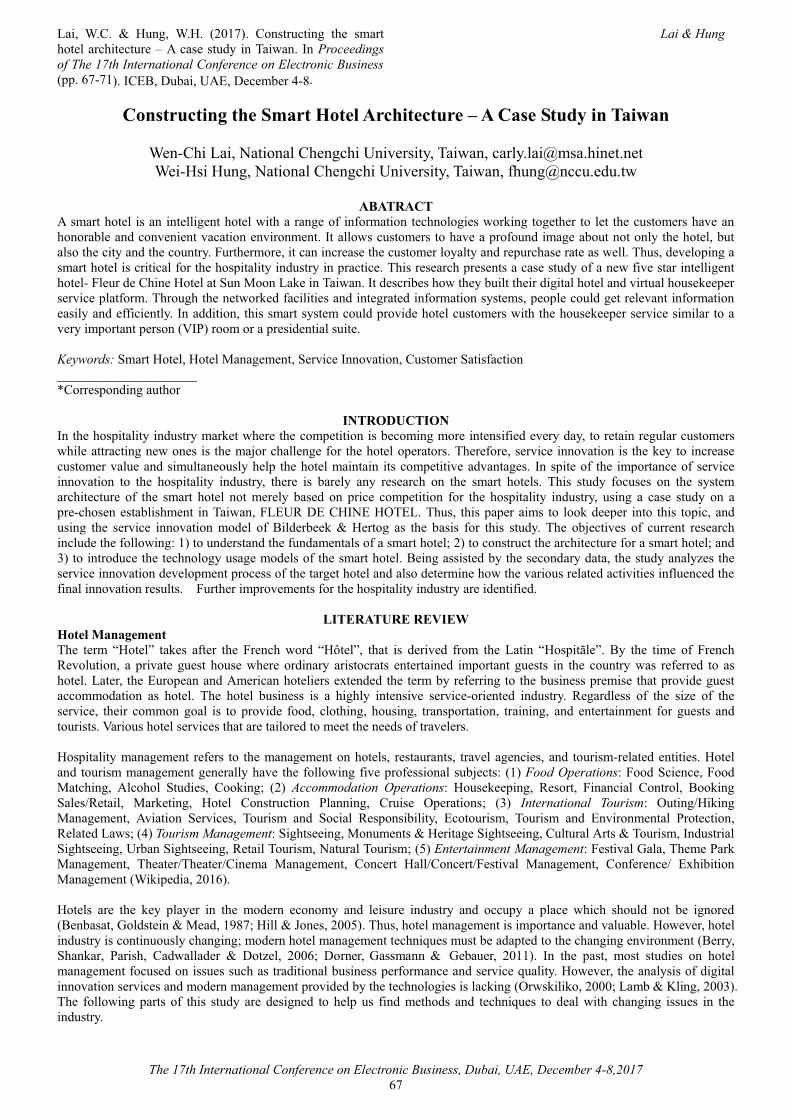
Lai, W.C. & Hung, W.H. (2017). Constructing the smart hotel architecture – A case study in Taiwan. In Proceedings of The 17th International Conference on Electronic Business(pp. 67-71). ICEB, Dubai, UAE, December 4-8.
Lai & Hung
The 17th International Conference on Electronic Business, Dubai, UAE, December 4-8,201767
Constructing the Smart Hotel Architecture – A Case Study in Taiwan
Wen-Chi Lai, National Chengchi University, Taiwan, [email protected] Hung, National Chengchi University, Taiwan, [email protected]
ABATRACTA smart hotel is an intelligent hotel with a range of information technologies working together to let the customers have anhonorable and convenient vacation environment. It allows customers to have a profound image about not only the hotel, but also the city and the country. Furthermore, it can increase the customer loyalty and repurchase rate as well. Thus, developing a smart hotel is critical for the hospitality industry in practice. This research presents a case study of a new five star intelligent hotel- Fleur de Chine Hotel at Sun Moon Lake in Taiwan. It describes how they built their digital hotel and virtual housekeeper service platform. Through the networked facilities and integrated information systems, people could get relevant information easily and efficiently. In addition, this smart system could provide hotel customers with the housekeeper service similar to a very important person (VIP) room or a presidential suite.
Keywords: Smart Hotel, Hotel Management, Service Innovation, Customer Satisfaction_____________________*Corresponding author
INTRODUCTIONIn the hospitality industry market where the competition is becoming more intensified every day, to retain regular customers while attracting new ones is the major challenge for the hotel operators. Therefore, service innovation is the key to increase customer value and simultaneously help the hotel maintain its competitive advantages. In spite of the importance of service innovation to the hospitality industry, there is barely any research on the smart hotels. This study focuses on the system architecture of the smart hotel not merely based on price competition for the hospitality industry, using a case study on a pre-chosen establishment in Taiwan, FLEUR DE CHINE HOTEL. Thus, this paper aims to look deeper into this topic, and using the service innovation model of Bilderbeek & Hertog as the basis for this study. The objectives of current research include the following: 1) to understand the fundamentals of a smart hotel; 2) to construct the architecture for a smart hotel; and3) to introduce the technology usage models of the smart hotel. Being assisted by the secondary data, the study analyzes the service innovation development process of the target hotel and also determine how the various related activities influenced the final innovation results. Further improvements for the hospitality industry are identified.
LITERATURE REVIEWHotel ManagementThe term “Hotel” takes after the French word “Hôtel”, that is derived from the Latin “Hospitãle”. By the time of French Revolution, a private guest house where ordinary aristocrats entertained important guests in the country was referred to as hotel. Later, the European and American hoteliers extended the term by referring to the business premise that provide guest accommodation as hotel. The hotel business is a highly intensive service-oriented industry. Regardless of the size of the service, their common goal is to provide food, clothing, housing, transportation, training, and entertainment for guests and tourists. Various hotel services that are tailored to meet the needs of travelers.
Hospitality management refers to the management on hotels, restaurants, travel agencies, and tourism-related entities. Hotel and tourism management generally have the following five professional subjects: (1) Food Operations: Food Science, Food Matching, Alcohol Studies, Cooking; (2) Accommodation Operations: Housekeeping, Resort, Financial Control, Booking Sales/Retail, Marketing, Hotel Construction Planning, Cruise Operations; (3) International Tourism: Outing/Hiking Management, Aviation Services, Tourism and Social Responsibility, Ecotourism, Tourism and Environmental Protection, Related Laws; (4) Tourism Management: Sightseeing, Monuments & Heritage Sightseeing, Cultural Arts & Tourism, IndustrialSightseeing, Urban Sightseeing, Retail Tourism, Natural Tourism; (5) Entertainment Management: Festival Gala, Theme Park Management, Theater/Theater/Cinema Management, Concert Hall/Concert/Festival Management, Conference/ Exhibition Management (Wikipedia, 2016).
Hotels are the key player in the modern economy and leisure industry and occupy a place which should not be ignored(Benbasat, Goldstein & Mead, 1987; Hill & Jones, 2005). Thus, hotel management is importance and valuable. However, hotelindustry is continuously changing; modern hotel management techniques must be adapted to the changing environment (Berry,Shankar, Parish, Cadwallader & Dotzel, 2006; Dorner, Gassmann & Gebauer, 2011). In the past, most studies on hotel management focused on issues such as traditional business performance and service quality. However, the analysis of digital innovation services and modern management provided by the technologies is lacking (Orwskiliko, 2000; Lamb & Kling, 2003). The following parts of this study are designed to help us find methods and techniques to deal with changing issues in the industry.
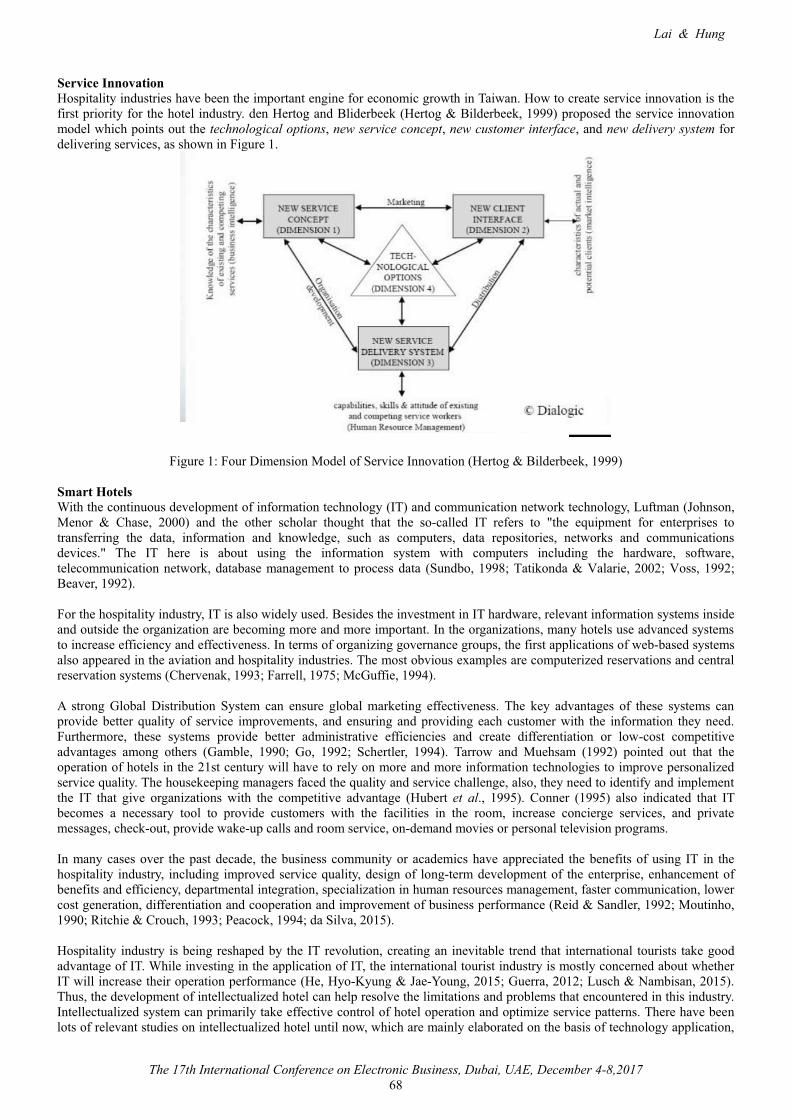
Lai & Hung
The 17th International Conference on Electronic Business, Dubai, UAE, December 4-8,2017
68
Service InnovationHospitality industries have been the important engine for economic growth in Taiwan. How to create service innovation is the first priority for the hotel industry. den Hertog and Bliderbeek (Hertog & Bilderbeek, 1999) proposed the service innovation model which points out the technological options, new service concept, new customer interface, and new delivery system for delivering services, as shown in Figure 1.
Figure 1: Four Dimension Model of Service Innovation (Hertog & Bilderbeek, 1999)
Smart HotelsWith the continuous development of information technology (IT) and communication network technology, Luftman (Johnson, Menor & Chase, 2000) and the other scholar thought that the so-called IT refers to "the equipment for enterprises to transferring the data, information and knowledge, such as computers, data repositories, networks and communications devices." The IT here is about using the information system with computers including the hardware, software, telecommunication network, database management to process data (Sundbo, 1998; Tatikonda & Valarie, 2002; Voss, 1992; Beaver, 1992).
For the hospitality industry, IT is also widely used. Besides the investment in IT hardware, relevant information systems inside and outside the organization are becoming more and more important. In the organizations, many hotels use advanced systems to increase efficiency and effectiveness. In terms of organizing governance groups, the first applications of web-based systems also appeared in the aviation and hospitality industries. The most obvious examples are computerized reservations and centralreservation systems (Chervenak, 1993; Farrell, 1975; McGuffie, 1994).
A strong Global Distribution System can ensure global marketing effectiveness. The key advantages of these systems can provide better quality of service improvements, and ensuring and providing each customer with the information they need. Furthermore, these systems provide better administrative efficiencies and create differentiation or low-cost competitive advantages among others (Gamble, 1990; Go, 1992; Schertler, 1994). Tarrow and Muehsam (1992) pointed out that the operation of hotels in the 21st century will have to rely on more and more information technologies to improve personalized service quality. The housekeeping managers faced the quality and service challenge, also, they need to identify and implementthe IT that give organizations with the competitive advantage (Hubert et al., 1995). Conner (1995) also indicated that ITbecomes a necessary tool to provide customers with the facilities in the room, increase concierge services, and private messages, check-out, provide wake-up calls and room service, on-demand movies or personal television programs.
In many cases over the past decade, the business community or academics have appreciated the benefits of using IT in the hospitality industry, including improved service quality, design of long-term development of the enterprise, enhancement of benefits and efficiency, departmental integration, specialization in human resources management, faster communication, lower cost generation, differentiation and cooperation and improvement of business performance (Reid & Sandler, 1992; Moutinho, 1990; Ritchie & Crouch, 1993; Peacock, 1994; da Silva, 2015).
Hospitality industry is being reshaped by the IT revolution, creating an inevitable trend that international tourists take good advantage of IT. While investing in the application of IT, the international tourist industry is mostly concerned about whether IT will increase their operation performance (He, Hyo-Kyung & Jae-Young, 2015; Guerra, 2012; Lusch & Nambisan, 2015). Thus, the development of intellectualized hotel can help resolve the limitations and problems that encountered in this industry. Intellectualized system can primarily take effective control of hotel operation and optimize service patterns. There have beenlots of relevant studies on intellectualized hotel until now, which are mainly elaborated on the basis of technology application,
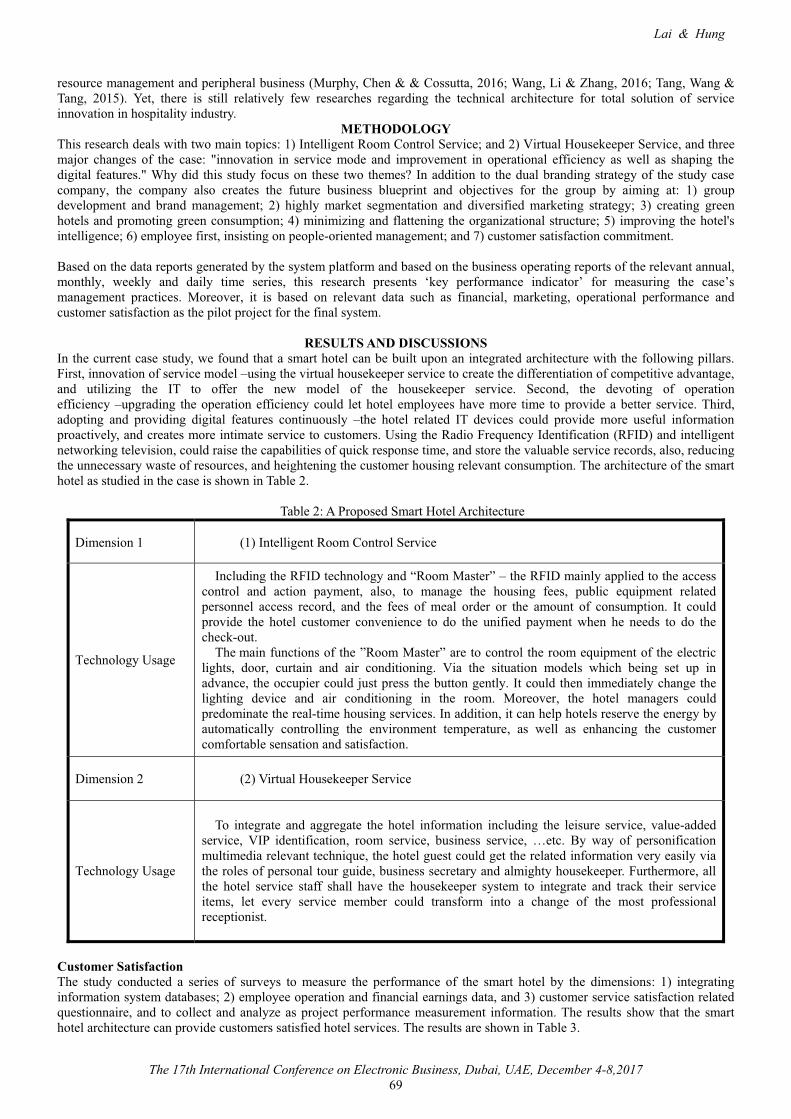
Lai & Hung
The 17th International Conference on Electronic Business, Dubai, UAE, December 4-8,2017
69
resource management and peripheral business (Murphy, Chen & & Cossutta, 2016; Wang, Li & Zhang, 2016; Tang, Wang & Tang, 2015). Yet, there is still relatively few researches regarding the technical architecture for total solution of service innovation in hospitality industry.
METHODOLOGYThis research deals with two main topics: 1) Intelligent Room Control Service; and 2) Virtual Housekeeper Service, and threemajor changes of the case: "innovation in service mode and improvement in operational efficiency as well as shaping the digital features." Why did this study focus on these two themes? In addition to the dual branding strategy of the study case company, the company also creates the future business blueprint and objectives for the group by aiming at: 1) group development and brand management; 2) highly market segmentation and diversified marketing strategy; 3) creating green hotels and promoting green consumption; 4) minimizing and flattening the organizational structure; 5) improving the hotel's intelligence; 6) employee first, insisting on people-oriented management; and 7) customer satisfaction commitment.
Based on the data reports generated by the system platform and based on the business operating reports of the relevant annual, monthly, weekly and daily time series, this research presents ‘key performance indicator’ for measuring the case’s management practices. Moreover, it is based on relevant data such as financial, marketing, operational performance and customer satisfaction as the pilot project for the final system.
RESULTS AND DISCUSSIONSIn the current case study, we found that a smart hotel can be built upon an integrated architecture with the following pillars. First, innovation of service model –using the virtual housekeeper service to create the differentiation of competitive advantage, and utilizing the IT to offer the new model of the housekeeper service. Second, the devoting of operation efficiency –upgrading the operation efficiency could let hotel employees have more time to provide a better service. Third, adopting and providing digital features continuously –the hotel related IT devices could provide more useful information proactively, and creates more intimate service to customers. Using the Radio Frequency Identification (RFID) and intelligent networking television, could raise the capabilities of quick response time, and store the valuable service records, also, reducing the unnecessary waste of resources, and heightening the customer housing relevant consumption. The architecture of the smart hotel as studied in the case is shown in Table 2.
Table 2: A Proposed Smart Hotel Architecture
Dimension 1 (1) Intelligent Room Control Service
Technology Usage
Including the RFID technology and “Room Master” – the RFID mainly applied to the access control and action payment, also, to manage the housing fees, public equipment related personnel access record, and the fees of meal order or the amount of consumption. It could provide the hotel customer convenience to do the unified payment when he needs to do the check-out.
The main functions of the ”Room Master” are to control the room equipment of the electric lights, door, curtain and air conditioning. Via the situation models which being set up in advance, the occupier could just press the button gently. It could then immediately change the lighting device and air conditioning in the room. Moreover, the hotel managers could predominate the real-time housing services. In addition, it can help hotels reserve the energy by automatically controlling the environment temperature, as well as enhancing the customer comfortable sensation and satisfaction.
Dimension 2 (2) Virtual Housekeeper Service
Technology Usage
To integrate and aggregate the hotel information including the leisure service, value-added service, VIP identification, room service, business service, …etc. By way of personification multimedia relevant technique, the hotel guest could get the related information very easily via the roles of personal tour guide, business secretary and almighty housekeeper. Furthermore, all the hotel service staff shall have the housekeeper system to integrate and track their service items, let every service member could transform into a change of the most professional receptionist.
Customer SatisfactionThe study conducted a series of surveys to measure the performance of the smart hotel by the dimensions: 1) integrating information system databases; 2) employee operation and financial earnings data, and 3) customer service satisfaction related questionnaire, and to collect and analyze as project performance measurement information. The results show that the smart hotel architecture can provide customers satisfied hotel services. The results are shown in Table 3.
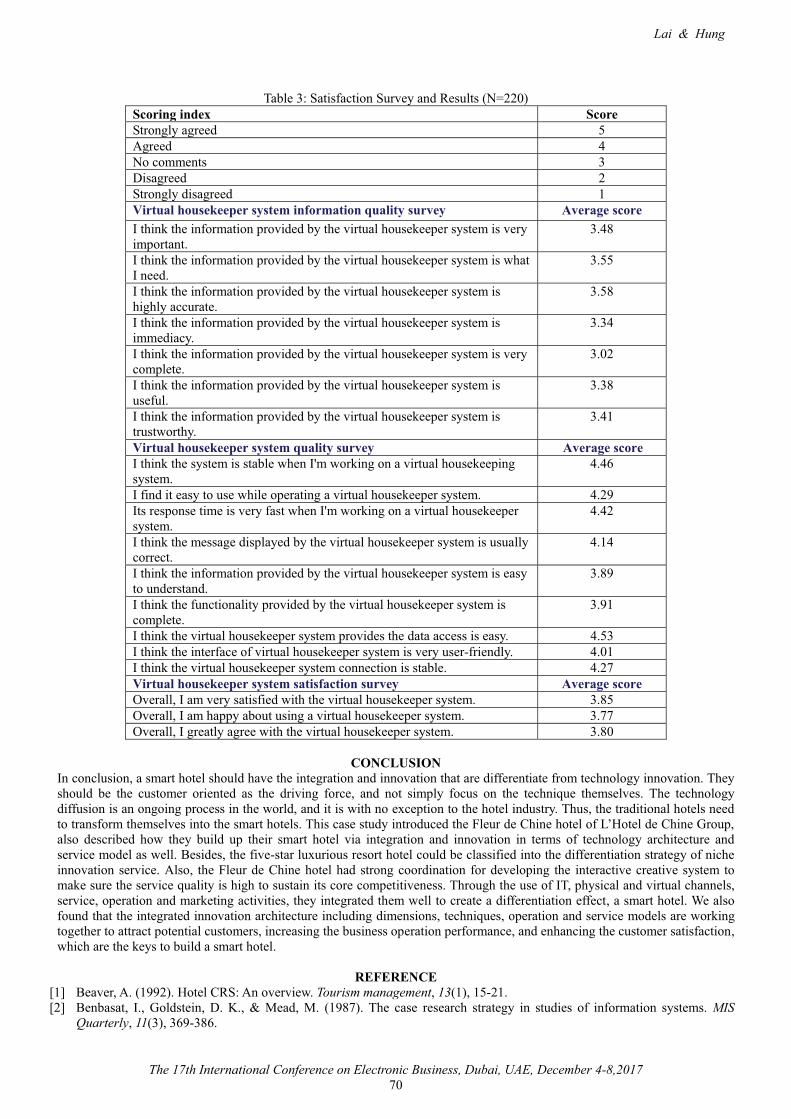
Lai & Hung
The 17th International Conference on Electronic Business, Dubai, UAE, December 4-8,2017
70
Table 3: Satisfaction Survey and Results (N=220)Scoring index ScoreStrongly agreed 5Agreed 4No comments 3Disagreed 2Strongly disagreed 1Virtual housekeeper system information quality survey Average scoreI think the information provided by the virtual housekeeper system is very important.
3.48
I think the information provided by the virtual housekeeper system is what I need.
3.55
I think the information provided by the virtual housekeeper system is highly accurate.
3.58
I think the information provided by the virtual housekeeper system is immediacy.
3.34
I think the information provided by the virtual housekeeper system is very complete.
3.02
I think the information provided by the virtual housekeeper system is useful.
3.38
I think the information provided by the virtual housekeeper system is trustworthy.
3.41
Virtual housekeeper system quality survey Average scoreI think the system is stable when I'm working on a virtual housekeeping system.
4.46
I find it easy to use while operating a virtual housekeeper system. 4.29Its response time is very fast when I'm working on a virtual housekeeper system.
4.42
I think the message displayed by the virtual housekeeper system is usually correct.
4.14
I think the information provided by the virtual housekeeper system is easy to understand.
3.89
I think the functionality provided by the virtual housekeeper system is complete.
3.91
I think the virtual housekeeper system provides the data access is easy. 4.53I think the interface of virtual housekeeper system is very user-friendly. 4.01I think the virtual housekeeper system connection is stable. 4.27Virtual housekeeper system satisfaction survey Average scoreOverall, I am very satisfied with the virtual housekeeper system. 3.85Overall, I am happy about using a virtual housekeeper system. 3.77Overall, I greatly agree with the virtual housekeeper system. 3.80
CONCLUSIONIn conclusion, a smart hotel should have the integration and innovation that are differentiate from technology innovation. They should be the customer oriented as the driving force, and not simply focus on the technique themselves. The technology diffusion is an ongoing process in the world, and it is with no exception to the hotel industry. Thus, the traditional hotels need to transform themselves into the smart hotels. This case study introduced the Fleur de Chine hotel of L’Hotel de Chine Group, also described how they build up their smart hotel via integration and innovation in terms of technology architecture and service model as well. Besides, the five-star luxurious resort hotel could be classified into the differentiation strategy of niche innovation service. Also, the Fleur de Chine hotel had strong coordination for developing the interactive creative system to make sure the service quality is high to sustain its core competitiveness. Through the use of IT, physical and virtual channels, service, operation and marketing activities, they integrated them well to create a differentiation effect, a smart hotel. We also found that the integrated innovation architecture including dimensions, techniques, operation and service models are working together to attract potential customers, increasing the business operation performance, and enhancing the customer satisfaction, which are the keys to build a smart hotel.
REFERENCE[1] Beaver, A. (1992). Hotel CRS: An overview. Tourism management, 13(1), 15-21.[2] Benbasat, I., Goldstein, D. K., & Mead, M. (1987). The case research strategy in studies of information systems. MIS
Quarterly, 11(3), 369-386.
Lai & Hung
The 17th International Conference on Electronic Business, Dubai, UAE, December 4-8,2017
71
[3] Berry, L. L., Shankar, V., Parish, J. T., Cadwallader, S., & Dotzel, T. (2006). Creating new markets through service innovation. MIT Sloan Management Review, 47(2), 56-63.
[4] Chervenak L. (1993). Hotel technology at the start of the new millennium. Hospitality Research Journal, 17(1), 113-120.[5] Conner, F. (1995). Westin Room 2000. Cornell Hotel and Restaurant Administration Quarterly, 36(4), 14-15.[6] da Silva, L. C. (2015). Hotel industry: An answer to the emerging trends on the global demand side of tourism (Doctoral
dissertation, NOVA–School of Business and Economics)[7] Dorner, N., Gassmann, O. & Gebauer, H. ( 2011). Service innovation: why is it so difficult to accomplish? Journal of
Business Strategy, 32(3), 37-46.[8] Farrell, M.J. (1975). The measurement of productive efficiency. Journal of Royal Statistical Society, Series A, General, 120,
Part 3, 253-281.[9] Frison-Roche, P. (1992). Systemes de gestion: les d`es d’un bon choix. L’Echo Touristique, 2165, 62-65.[10] Gamble, P.R. (1990). El efecto de la tecnologia como ventaja comptitiva. Papers de Turisme, 4, 25-47.[11] Go,F.M. (1992). The role of computerized reservation systems in the hospitality Industry. Tourism Management, 13, 22-26.[12] Guerra, D. A. G. (2012). The internet of things: developing a sustainable competitive advantage in the Hotel Industry
(Doctoral dissertation, Catolica Lisbon School of Business and Economics, Portugal).[13] He, Z., Hyo-Kyung, K., & Jae-Young, M. (2015). A study on the effect of hotel intelligent fusion system on hotel strategy,
work process, employee satisfaction, and hotel performance. Multimedia Tools and Applications,74(10), 3377-3385.[14] Hertog, P. den & R. Bilderbeek (1999). Conceptualising service innovation and service innovation patterns. Research
Programme on Innovation in Services (SIID) for the Ministry of Economic Affairs, Dialogic, Utrecht.[15] Hill, Charles W.L. & Jones, Gareth R. (2005). Strategic Management Theory: An Integrated Approach, Boston, MA:
Houghton Mufflin Company.[16] Hubert B. Van Hoof, Calen R. Combrink,and Marja J. Verbeeten. (1995). Technology needs and perceptions. Cornell Hotel
and Restaurant Administration Quarterly, 35(2), 64-69.[17] Lamb, R. & Kling, R. (2003). Reconceptualizing users as social actors in information systems research. MIS Quarterly, 27
(2), 197-235.[18] Johnson, S. P., Menor L. J., & Chase R. B. (2000). A critical evaluation of the new service development process:
Integrating service innovation and service design. In J. A. Fitzsimmons, & M. J. Fitzsimmons (Ed.) New Service Development-Creating Memorable Experience (pp. 154-172). Los Angeles: Sage Publications.
[19] Lusch, R. F., & Nambisan, S. (2015). Service innovation: A service-dominant logic perspective. MIS Quarterly, 39(1), 155-175
[20] McGuffie, J. (1994). CRS development in the hotel sector. EIU Travel Analyst, 2, 53-68.[21] Moutinho, L. (1990) Strategies for tourism destination development: An exploratory investigation of the role of small
businesses. In G.J. Ashworth & B. Goodall (Eds.) Marketing Tourism Places (pp. 104-122). London, UK: Routlege. [22] Murphy, H. C., Chen, M. M., & Cossutta, M. (2016). An investigation of multiple devices and information sources used in
the hotel booking process. Tourism Management, 52, 44-51.[23] Orwskiliko, W.J. (2000). Using technology and constituting structures: a practice lens for studying technology in
organization. Organization Science, 11(4), 404-428.[24] Peacock, M. (1994). Dear Doctor Ludd: Some questions on the hospitality industry and advanced technological change.
International Journal of Hospitality Management, 13(1), 19-24. [25] Ritchie, J. B., & Crouch, G. I. (1993). Competitiveness in international tourism: A framework for understanding and
analysis. World Tourism Education and Research Centre, University of Calgary. [26] Schertler, W. (1994). Impact of new information technologies on tourism industry and businesses. The Tourist Review,
49(2), 2-8. [27] Sundbo, Jon (1998). Standardization vs. Customization in Service Innovation. Topical paper, STEP Group.[28] Tang, T. W., Wang, M. C. H., & Tang, Y. Y. (2015). Developing service innovation capability in the hotel industry. Service
Business, 9(1), 97-113.[29] Tarrow P. and Muehsam M. (1992). Wide horizons: Travel and tourism in the coming decades. The Futurist,
September-October, 28-29.[30] Tatikonda, Mohan & Valarie A. Zeithaml (2002). Managing the new service development process: Synthesis of
multi-disciplinary literature and directions for future research. In T. Boone & R. Ganeshan (2002). New Directions in Supply Chain Management: Technology, Strategy, & Implementation. AMACOM Div American Mgmt Assn.
[31] Voss, C. A., (1992). Measurement of innovation and design performance in services. Design Management Journal, Winter, 40-46.
[32] Wang, Y. S., Li, H. T., Li, C. R., & Zhang, D. Z. (2016). Factors affecting hotels' adoption of mobile reservation systems: A technology-organization-environment framework. Tourism Management, 53, 163-172
���������%�$�������%��������������= ��#����!������#����"� ��� ����� # ������� �������� ��� `' ��� ����� ��$#�� &��Proceedings of The 17th International Conference on Electronic Business� �''� ������� &*/<�� =$����� >�/��= � �� ��@�[�
Wang, Zhou & Zhang
�
The 17th International Conference on Electronic Business, Dubai, UAE, December 4-8,2017 ���
!�������*������ ��������^�!�������#^��_���$q(������ ��������
����$��������< �%����>��^ �������*%������ �����"���{��~��������������%�$|��< �%����>��^ �������*%������%��{�$�� #$����
� �������%�����< �%����>��^ �������*%������%���� �����{�$�� #$����
���������\% � �$�� ��� ��$#�� '� � ���� !��#����� �!� ��� `' ��� ��� � �'��� � ��� � "��� $� #� ��� ��^ ������ � !���� # ��# ���� ��=�� ��#� ���"�# ��# ���� �_=��� %�^������#�!! � �� ��_=��" � � !�$�#� ���� ���� ��������^ � �%����=����#� �%�����$�#� ��#$� ���� ���� �� � ����^ ��� �� �'��� ���� �<��%��=����#�_=���%�" #��^ ��������� `�� � ��'��������$���% ��� %�^ #�#�!! � �����"��%��'�����¢_��� �������! ������������$'����� �^ ����=��� �'��# #���� ����������^ ������� ����^ �! #������
Keywords���� �'��� ���� ��# ���������� �������# ��������# ������������������������������������|*��� �'��#�����$�%����
�����!"������&��� � ���� ������% � �%���� ������^ ���# ��� ����$���% �$� !$�� ����!������%��� �#�������# ���������_�%��� ����\� ^��������@���� ����#��!������%��� ����'��#$���#����"%��%������% #����%������% �# ���������� ����# ��� �������'��� ������� �'��� ���� ���\��������������% ������������� ���������^ ������� �����Á����������$����� ��� ������������% ������������� �������$����� ������������$����� ������������$����� �������~������� ��!��% �!������ � ���% ���"%����$#� #�� %�^�����$������$�] ������\����#�!�$�#��� ��� � �������%�'� � �" �� � %�^����� ��#� �\�� ����^ ���� �� � �����Á��� ������ _�%��� �� �� \� ^����� ���@�� ����� �!� �% � �� � ���% ���� ���� #�����% ����$�'������%������������^ �# ����������!��� ���%������� �'����^ �# ���������<�������������� ����������� ����������$����� �����������$����� �����������_�%��� ����\� ^��������@��� ��#��\� ���# �������������� ��� ��� �� �����!���������������������� �� ����������\%��������$�����%���� ��#��"�� !�����������$#� �� � �����^ ������� �����Á����������$����� ����������/������������'����������'�������'�������%$����# �������� �'� ��� ���� ��'������ %�^ ������������"% ���% ���� ���^��^ #����� ������ �����������#��^ ���������% � � �����������# �������"������� ��% ������ ����� ���� � �et al.��������\% ������$�����%���� �����!��� #����# �������� $����� �� �� � ���% ������ `��'� ����� �'��������% �!$������������� ����� ������ � �������� �!�&��� � �%�#�� _��! �� et al.� ������� ��$#� #� � �'��# ���� � %�^���� ��� ��� $������$�� ��� � \% �� !�$�#�� ] ��������%��%���$�!�����!! ��� ���� #�����% � �������'�����!��% ���������#���� '������% ��!! ��� ���� #�����% �����������'����\% ����! �� #���� '������% ��!! ��"�$�#���� ����� ����� ��%���� ] �������� �!����"�����������'��%�����%�����$#����#�������� `'��� �%$������# �������� %�^�����$������\��\% ��$�� �����$#��'� � �����% �!��#������!���# ���������� �� �������!���$�] ���������#��������% ����^ ��� �� �'��� ���� ����\����#���^ ������ �� %�^������#�!! � �� ��<��%�!����# ��# �����=�����#����"�# ��# ����_=����%�" #���� ��^ ��������� `�� � ��'���������#�"% ���'�����¢_��� ���� ���! ��� ������ ���$'��� �% �� � %�^ #� #�!! � ����� � � !��#� �%��� _=�� �� � ��� � �������^ � �%��� �=��� � ��$� � �% � !������ �$�� �� ��!��% �����$�$����#$� ��������� �� ����_=�����\���� �^ ������'�� #����_=����=��� %�^ #��$�� ����������^ ������� ����^ �! #��������#�� �# #����� �� ��������������!����"����# ��������
�%$�$�'$��#$���\% � `' ��� ���"������#$�� #����< �%����>��^ ������"��%����������!������$# ����������� ����% ��^ ��� ��� ���������_=º���������'������'�����'��^�# #�"���� ������ �����#��% �����'� � #���# ���������� �������'$� ��\% � `' ��� ���"���'������� #���#����#$�� #�"��%��% ���!�"�� �/�'��� ���������% �� ���������!��% ���� ���% �'������'�����" � ����$� #����� �� ���� ����!���� ����#��!�'��#$���&�� ��%�' ���#��# ���#�!����% �'��#$��������!����"�����$��� ��"��� ������ #� �$�'������������ ��� ��!��% �!�$��'� ��' ��!� #��'�������������"%��%��% �'������'�����" � �� ������ #�������%��� �����% �� �����'$��%�� ��^��$� �&�� ��%�' ���#����'��!������� ��%�"�����% �'���!!��$�# �� ��%� ������ #�# ���#��'' �� #�����% ���� ������ �"%�������%�"��������$� ���������'�����%�#������� ���# ���������� ��%�' ���#����'� ������������ �'��#����� ���¢��¢_�¢=����¢��������% �� �����#����������% �����$�$� ������������¢���"����% ������ ����%��� ��!����" #����¢=���#��% ��¢_��\% ������������^ �������%��� �"���¢���\% � �" � ����#�!! � �����������#��% ��" � �'� � �� #����#�����������%��!��% ��"����$�#��\%���������������% �# ���������� ����� #�!������' ���#���"��%����' ���#��������%���$�#����� ���# �������"�����# ������' ���#����! #�����"��%����$���# ���#���% �'��!���$������%����% �# ����������$�%�����%��¡% �����#��% ����$�$��� #�'��!���$�����" � �'� � �� #�����% ���� �����\�"���� ��$� #�!��� ��%��!��% �# ��������� '���� �����#�"���# !�� #�����% ���� ������ ���#���� �" ���% ���� ����% ���� ��"��%���'��!��� ���� ��'' �� #���#��% ���� ����% ��$�] ���'� �� #���� �������� ���# ��������������'�������$�#���� ��$!!��� ���'������ � ���$�# �����#� �% ���� �� !�� � �% ��� ���� �% � � ��� ��� �<$�� ��� �^��#� ^������ ��������"%��%�"�$�#� �!! ��� �% ���
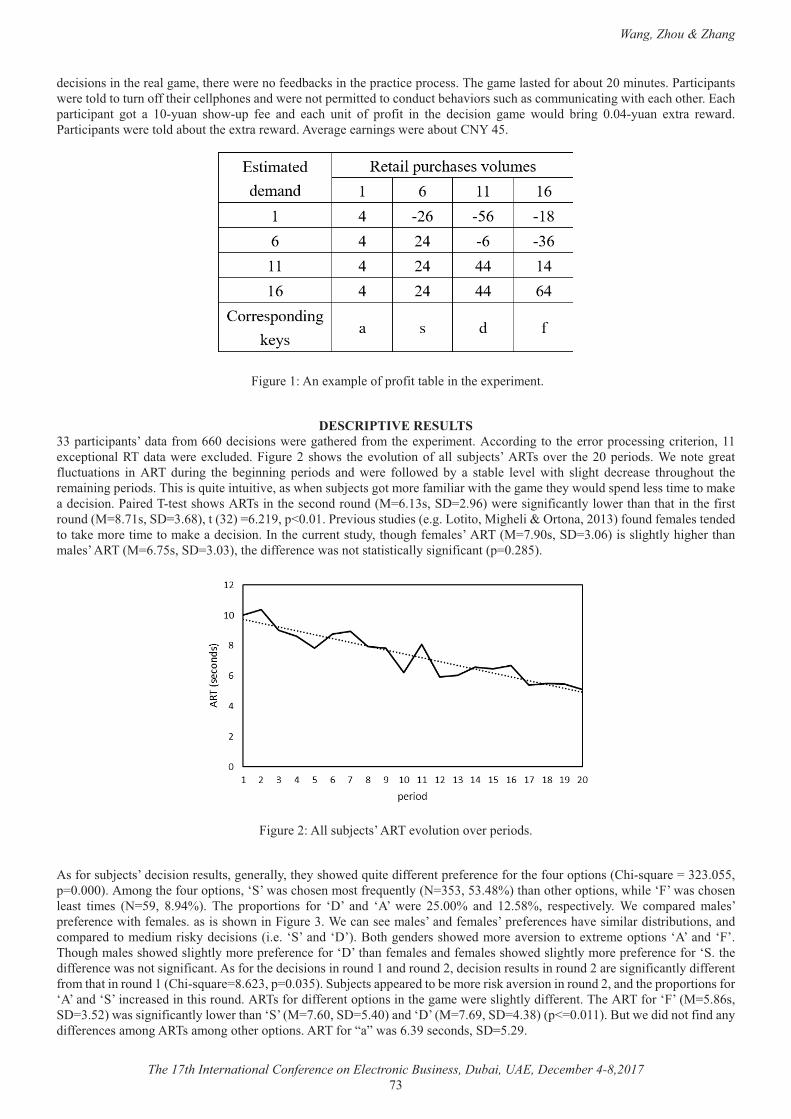
Wang, Zhou & Zhang
The 17th International Conference on Electronic Business, Dubai, UAE, December 4-8,2017 ���
# ������������% �� ������ ���% � �" � ����! #����������% �'������ �'��� ���\% ���� ����� #�!������$��������$� ���������'�����" � ����#�����$����!!��% ���� ��'%�� ����#�" � �����' ����� #�������#$���� %�^������$�%��������$���������"��%� ��%���% ��/��%�'������'���� ���� �� ����$��� �%�"�$'� ! � ��#� ��%� $���� �!� '��!��� ��� �% � # ������� ��� � "�$�#� ������ ��@��$��� `���� � "��#��������'�����" � ����#����$���% � `����� "��#��^ ��� � ��������" � ����$��*���@���
��
����$� ������� `��'� ��!�'��!������� �����% � `' ��� ���
�!$����'��@$��$�"&���
���'������'������#����!����~~��# ��������" � ����% � #�!�����% � `' ��� ��������#������� �% � �����'��� ���������� ��������� `� '��������\�#����" � � `��$# #����$� ��� �%�"�� �% � ^��$������!����� �$�] �������\���^ �� �% ����' ���#��� ���� ��� ���!�$��$������� ��� ��\� #$����� �% � � �������� ' ���#�� ��#� " � � !����" #� ��� �� ����� � � ^ �� "��%� ����%�� # �� �� � �%��$�%�$�� �% �� ��������' ���#��\%�������$�� ����$���^ �����"% ���$�] ����������� �!��������"��%��% ���� ��% ��"�$�#��' �#�� ������ ������� ���# ����������� #�\�� ����%�"����\������% �� ���#���$�#���º~�����_=º��~��" � ������!����������" ���%����%�������% �!�������$�#���º[�����_=º�~[����������º~�����'Â������ ^��$����$#� ��� �������������% �������������������!�$�#�! ��� ��� �# #������� ���� ���� ������� ���# �������&���% ��$�� �����$#����%�$�%�! ��� �����\���º������_=º��~���������%����%��% ���%������ �����\���º~�����_=º�������% �#�!! � �� �"��������������������������!�������'º��[����
����$� ���������$�] �������\� ^��$������^ ��' ���#��
����!����$�] �����# �������� �$������ � ��������% ���%�" #��$�� �#�!! � ���'� ! � �� �!����% �!�$���'�������*%����$�� �º���������'º�������������% �!�$���'�������¢_��"����%�� �������!� �$ �������º�������@[����%�����% ���'�������"%�� �¢���"����%�� ��� ���� ��� �� ��º���� [�@��� \% � '��'�������� !��� ¢=�� ��#� ¢��� " � � ������ ��#� ���[��� � �' ���^ ��� � � ���'�� #� ��� ���'� ! � �� �"��%�! ��� ���������%�"��������$� ���� ������ ���� �����#�! ��� ���'� ! � �� ��%�^ ���������#������$���������#����'�� #����� #�$��������# ���������� �¢_����#�¢=���<��%�� �# ����%�" #���� ��^ ��������� `�� � ��'������¢�����#�¢���\%�$�%���� ���%�" #�����%������� �'� ! � �� �!���¢=���%���! ��� ����#�! ��� ���%�" #�����%������� �'� ! � �� �!���¢_��% �#�!! � �� �"������������!���������!����% �# �������������$�#�����#���$�#����# �������� �$���������$�#����� ������!��������#�!! � ���!�����%��������$�#����*%����$�� º[~����'º������_$�] �����'' �� #����� ���� �������^ �����������$�#������#��% �'��'��������!���¢�����#�¢_������ �� #�����%�����$�#���\��!���#�!! � ����'����������% ���� �" � �����%����#�!! � ���\% ���\�!���¢�����º�[~���_=º�����"��������!����������" ���%���¢_����º�~���_=º�@�����#�¢=����º�~���_=º@�[���'º������<$��" �#�#�����!��#�����#�!! � �� ����������\����������% ���'��������\�!�������"���~���� ���#���_=º����
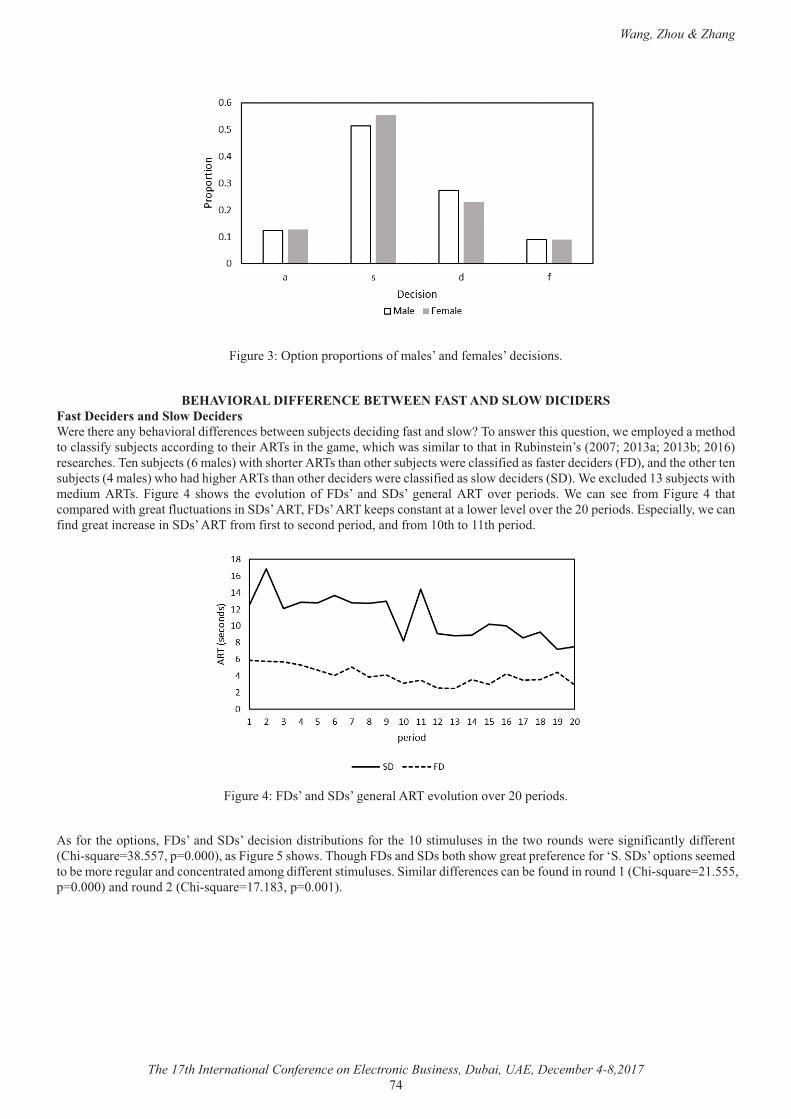
Wang, Zhou & Zhang
The 17th International Conference on Electronic Business, Dubai, UAE, December 4-8,2017 �@�
�
����$� �����'�����'��'���������!���� �����#�! ��� ���# ���������
��$%�@����&�!�**$�$��$��$�;$$��*������!��&�;�!���!$���
*���!����������� ���!��������� � ��% � ������ %�^������#�!! � �� ��� �" ���$�] ����# ��#����!������#����"¨�\�����" ���%����$ �������" � �'��� #���� �%�#����������!���$�] ���������#��������% �����\������% ���� ��"%��%�"���������������%�������$����� �����������������������������~��� � ���% ��\ ���$�] �����~���� ���"��%��%��� ����\���%�����% ���$�] ����" � �������!� #����!��� ��# ��# �����=�����#��% ���% ��� ���$�] �����@���� ���"%��%�#�%��% ����\���%�����% ��# ��# ���" � �������!� #�������"�# ��# ����_=��� � `��$# #�����$�] ����"��%�� #�$�� ��\�� ���$� � @� �%�"�� �% � ^��$����� �!� �=��� ��#� _=��� � � ���� ��\� �^ �� ' ���#�� � � ���� � � !���� ���$� � @� �%������'�� #�"��%��� ���!�$��$����������_=�����\���=�����\�� '������������������" ��� ^ ���^ ���% ����' ���#��/�' ��������" �����!��#��� ������� �� ����_=�����\�!����!��������� ���#�' ���#����#�!�������%�������%�' ���#��
����$� �@���=�����#�_=���� � ������\� ^��$������^ �����' ���#��
����!����% ��'��������=�����#�_=���# �������#������$������!����% ��������$�$� ������% ��"����$�#��" � ������!��������#�!! � ����*%����$�� º�[�����'º�������������$� ����%�"��\%�$�%��=����#�_=�����%��%�"��� ���'� ! � �� �!���¢_�_=����'������� � #����� ���� �� �$������#����� ����� #�������#�!! � �������$�$� ��_�������#�!! � �� ������� �!�$�#������$�#����*%����$�� º�������'º��������#���$�#����*%����$�� º���[���'º�������
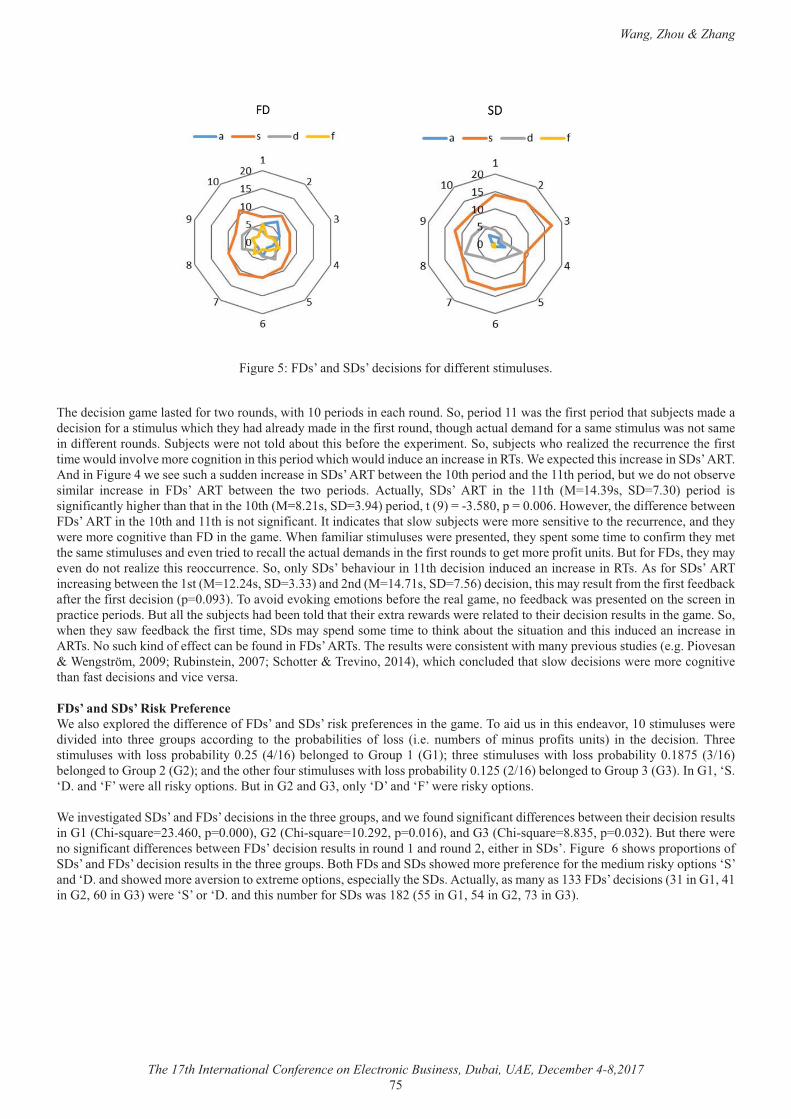
Wang, Zhou & Zhang
The 17th International Conference on Electronic Business, Dubai, UAE, December 4-8,2017 ���
�
��
���$� �����=�����#�_=���# ��������!���#�!! � �������$�$� ��
�\% �# ���������� ����� #�!����"����$�#���"��%����' ���#����� ��%���$�#�_���' ���#����"����% �!�����' ���#��%����$�] ������# ���# �������!���������$�$��"%��%��% ��%�#���� �#����# �����% �!�������$�#���%�$�%����$���# ���#�!�������� �����$�$��"���������� ����#�!! � �����$�#��_$�] ����" � ��������#����$���%���� !�� ��% � `' ��� ���_����$�] ����"%��� ���� #��% �� �$�� �� ��% �!�������� �"�$�#���^��^ ���� ���������������%���' ���#�"%��%�"�$�#���#$� �������� �� �����\��� � `' �� #��%������� �� ����_=�����\���#�������$� �@�" �� ��$�%����$## ������ �� ����_=�����\�� �" ���% ����%�' ���#���#��% ����%�' ���#���$��" �#��������� �^ ��������� ���� �� � ��� �=��� ��\� � �" �� �% � �"�� ' ���#�� ���$������ _=��� ��\� ��� �% � ���%� ��º�@����� _=º����� ' ���#� ��������!��������%��% ���%����%�������% ����%���º[�����_=º��@��' ���#��������º����[���'�º����~���" ^ ����% �#�!! � �� �� �" ���=�����\�����% ����%���#����%�������������!������&����#���� ���%������"��$�] ����" � ���� �� �����^ �����% �� �$�� �� ����#��% ��" � ���� ��������^ ��%����=�����% ���� ��% ��!������������$�$� ��" � �'� � �� #���% ���' ������ ���� �������!�����% ��� ���% ���� �����$�$� ����#� ^ ����� #����� ������% ����$���# ���#������% �!�������$�#������ ����� �'��!���$�����<$��!����=����% ������ ^ ��#������� ���� ��%���� ���$�� �� �_��������_=���� %�^��$��������%�# ���������#$� #�������� �� �����\�����!���_=�����\����� ������� �" ���% �������º���@���_=º�������#���#���º�@�����_=º��~��# ���������%�������� �$���!�����% �!�����! #������!� ���% �!�����# ��������'º������\���^��#� ^������ ��������� !�� ��% �� ������ �����! #�����"���'� � �� #�����% ���� �����'������ �' ���#��<$�������% ��$�] ����%�#�� �����#��%����% ��� `����� "��#��" � �� ��� #�����% ���# �������� �$��������% ���� �_���"% ���% ����"�! #������% �!�������� ��_=�������' �#���� ���� �����%�������$���% ����$��������#��%�����#$� #�������� �� ������\������$�%����#��!� !! �������� �!�$�#�����=�����\��\% �� �$����" � �������� ���"��%������'� ^��$����$#� ��� �����^ ������� �����Á����������$����� ����������_�%��� ����\� ^��������@���"%��%������$# #��%������"�# ��������" � ���� ��������^ ��%���!����# ����������#�^�� �^ �����*!������!������^�'���������� ������ `'��� #��% �#�!! � �� ��!��=�����#�_=��������'� ! � �� ������% ���� �\����#�$������%��� �# �^�����������$�$� ��" � �#�^�# #� ����� �%� � ���$'�� �����#���� ��� �% � '���������� �� �!� ����� �� � �$�� ��� �!� ���$�� '��!���� $������ ��� �% � # ������� \%� �����$�$� ��"��%� �����'����������������@¡�~��� ���� #� ������$'��������� �%� �����$�$� ��"��%� �����'�������������[�����¡�~��� ���� #�������$'�����������#��% ���% ��!�$������$�$� ��"��%������'������������������¡�~��� ���� #�������$'��������&������¢_�¢=���#�¢���" � ������������'������<$����������#����������¢=����#�¢���" � ��������'�������� ���^ ������ #�_=�����#��=���# ������������% ��%� ����$'�����#�" �!�$�#������!������#�!! � �� ��� �" ���% ���# �������� �$�����������*%����$�� º��@~���'º�����������*%����$�� º�������'º���~�����#�����*%����$�� º[[����'º������<$���% � �" � ���������!������#�!! � �� ��� �" ���=���# �������� �$���������$�#�����#���$�#���� ��% �����_=������$� ��~��%�"��'��'���������!�_=�����#��=���# �������� �$��������% ��%� ����$'��<��%��=����#�_=���%�" #���� �'� ! � �� �!����% �� #�$���������'������¢_����#�¢=���#��%�" #���� ��^ ��������� `�� � ��'������� �' ��������% �_=�����$����������������������=���# �������������������@���������~���������" � �¢_�����¢=���#��%����$�� ��!���_=��"����[��������������@�������������������
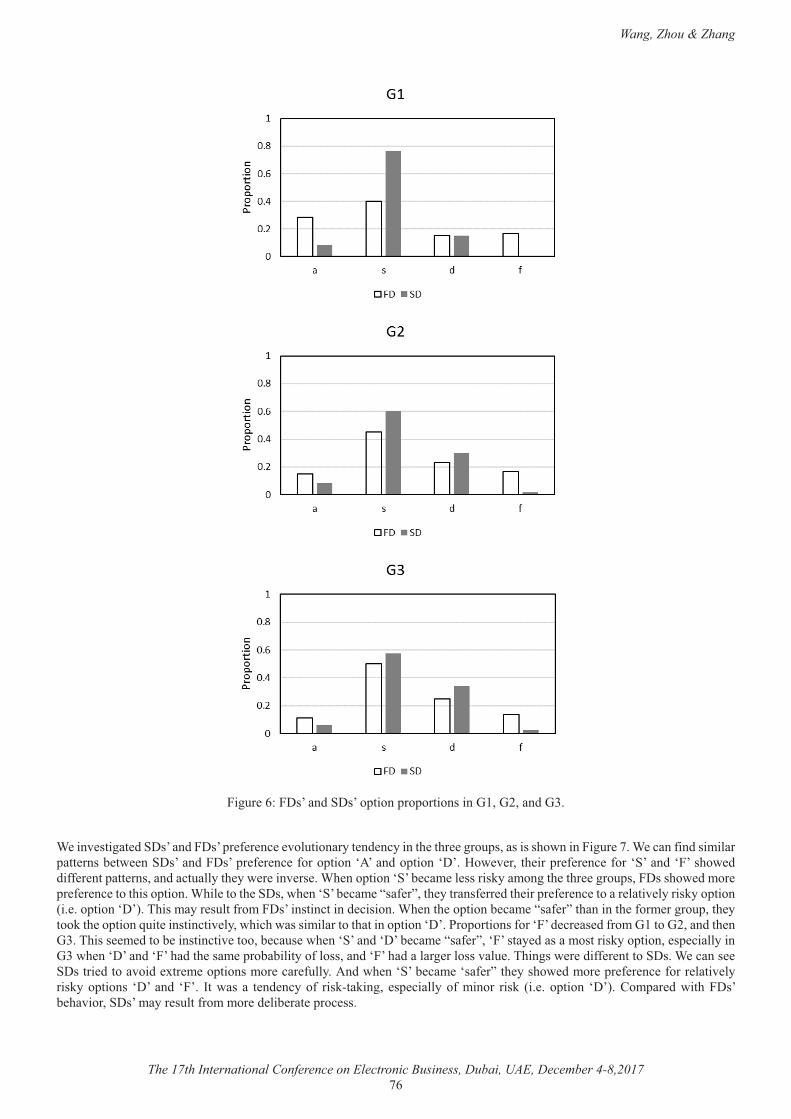
Wang, Zhou & Zhang
The 17th International Conference on Electronic Business, Dubai, UAE, December 4-8,2017 �~�
�
�
����$� �~���=�����#�_=����'�����'��'���������������������#����
�� ���^ ������ #�_=�����#��=���'� ! � �� � ^��$��������� �# ��������% ��%� ����$'����������%�"��������$� ���� �����!��#���������'��� ����� �" ��_=�����#��=���'� ! � �� �!����'�����¢�����#��'�����¢=����" ^ ��� �% ���'� ! � �� �!���¢_����#�¢����%�" #�#�!! � ���'��� �������#����$������% ��" � ���^ �� ��% ���'�����¢_��� ��� �� ����������������% ��%� ����$'����=���%�" #���� �'� ! � �� �����%����'������%�� �����% �_=���"% ��¢_��� ��� ����! �����% �������! �� #��% ���'� ! � �� ������� ����^ ����������'������� ��'�����¢=���\%�������� �$���!�����=���������������# ��������% ���% ��'������ ��� ����! ����%�������% �!��� �����$'���% ��������% ��'������$�� ����������^ ����"%��%�"���������������%�������'�����¢=�����'��������!���¢���# �� �� #�!����������������#��% �����\%���� � #����� ����������^ ������� ��$� �"% ��¢_����#�¢=��� ��� ����! ����¢������� #������������������'������ �' �������������"% ��¢=����#�¢���%�#��% ���� �'������������!���������#�¢���%�#������� �������^��$ �\%�����" � �#�!! � ������_=��� ������ �_=����� #�����^��#� `�� � ��'��������� ���� !$������#�"% ��¢_��� ��� �¢��! ����% ���%�" #���� �'� ! � �� �!���� ����^ ����������'������ ¢=����#� ¢��� &��"����� � �# �����!� ������������� �' ��������!������� ����� �� � �'����� ¢=���*��'�� #�"��%��=���� %�^�����_=�������� �$���!������� �# ��� ��� �'��� ���
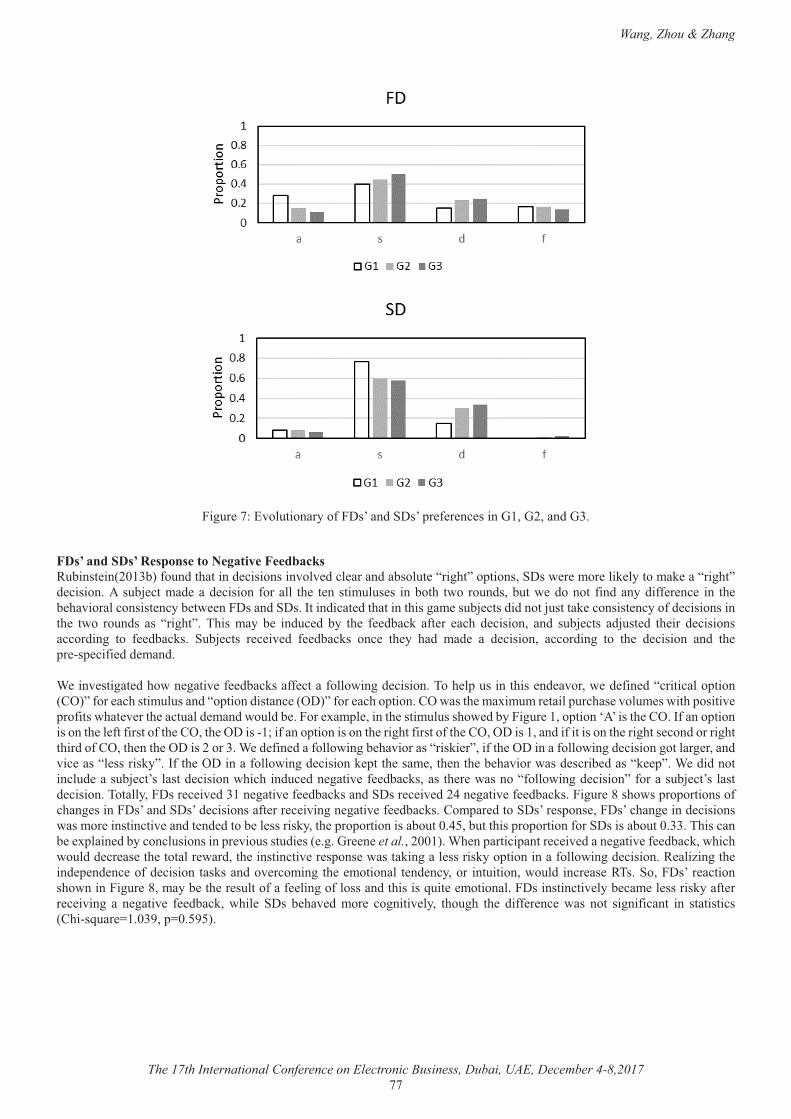
Wang, Zhou & Zhang
The 17th International Conference on Electronic Business, Dubai, UAE, December 4-8,2017 ���
�
����$� ����/^��$���������!��=�����#�_=���'� ! � �� ���������������#����
�*!������!������(������������>��*�����^��$����� ����������!�$�#��%������# ����������^��^ #��� �����#������$� �����%����'�������_=��" � ���� ���� ��������� �������%���# ����������$�] �����# ���# ������� !������� �% � � ������$�$� �� ������%� �"����$�#����$��" �#������ !��#�����#�!! � �� � ��� �% �� %�^������������� ����� �" ���=����#�_=��&����#���� #��%�������%������ ��$�] ����#�#�����]$������ �������� �����!�# ������������% � �"�� ��$�#�� ��� ����%��� \%��� ���� � � ��#$� #� ��� �% � ! #����� �!� �� ��%� # �������� ��#� �$�] ���� �#]$�� #� �% ��� # �������������#���� ��� ! #������ _$�] ���� � � �^ #� ! #������ ��� � �% �� %�#� ��# � �� # �������� �����#���� ��� �% � # ������� ��#� �% �'� ��' ��!� #�# ���#���� ���^ ������ #�%�"�� ����^ �! #�������!! �����!����"����# �������\��% �'�$������%��� �# �^����" �# !�� #������������'������*����!��� ��%�����$�$����#���'�����#������ ���=���!��� ��%��'�����*��"����% ���`��$��� �����'$��%�� �̂ ��$� ��"��%�'�����^ �'��!����"%�� ^ ���% ����$���# ���#�"�$�#�� ����� `��'� ������% �����$�$���%�" #�������$� �����'�����¢�������% �*��&!�����'������������% �� !��!������!��% �*����% ��=���������!�����'������������% ����%��!������!��% �*����=���������#��!�����������% ����%��� ���#�������%���%��#��!�*����% ���% ��=������������ �# !�� #���!����"����� %�^������������� �����!��% ��=������!����"����# ��������������� �����#�^�� ������ ����������&!��% ��=������!����"����# �������� '���% ���� ���% ���% �� %�^����"���# ����� #������ '��� �#�#���������$# ����$�] ����������# �������"%��%���#$� #�� ����^ �! #�����������% � �"�������!����"����# ��������!������$�] ����������# �������\���������=��� � �^ #����� ����^ �! #��������#�_=��� � �^ #��@�� ����^ �! #���������$� �[��%�"��'��'���������!��%��� ������=�����#�_=���# ���������!� ��� � �^����� ����^ �! #������*��'�� #����_=���� �'��� ���=����%��� ����# ��������"������ ����������^ ���#�� �# #����� �� �����������% �'��'�������������$���@����$���%���'��'�������!���_=��������$������\%�������� � `'���� #���������$���������'� ^��$����$#� ��� ���� � �et al.���������% ��'������'����� � �^ #���� ����^ �! #������"%��%�"�$�#�# �� �� ��% �������� "��#���% ����������^ �� �'��� �"������������� ����������'����������!����"����# �������� ���������% ���# ' �# �� ��!�# ���������������#��^ ���������% � ��������� � �# �������� ���$�������"�$�#����� �� ��\��_����=���� ��������%�"��������$� �[������� ��% �� �$����!���! ������!��������#��%�������$�� � ����������=�����������^ ���� ��� �� ����������!� ��� � �^���� �� � ����^ � ! #������ "%�� � _=�� � %�^ #� ��� � �������^ ���� �%�$�%� �% � #�!! � �� � "��� ���� �����!������ ��� ������������*%����$�� º������'º�������
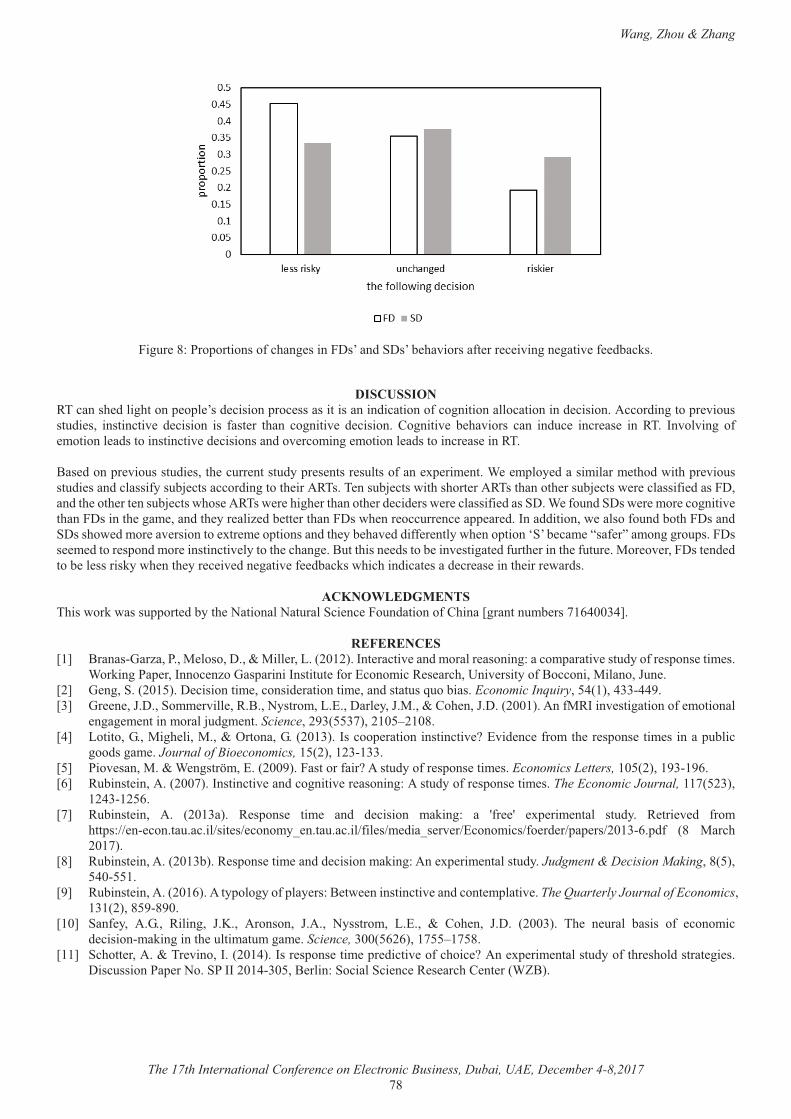
Wang, Zhou & Zhang
The 17th International Conference on Electronic Business, Dubai, UAE, December 4-8,2017 �[�
����$� �[�����'���������!��%��� ������=�����#�_=���� %�^������!� ��� � �^����� ����^ �! #�������
�!���"������
�\������% #����%�����' �'� ���# �������'��� �����������������#���������!�������������������������# ������������#�������'� ^��$����$#� ��� ���������^ � # ������� ��� !��� �� �%��� �������^ � # ������� *������^ � � %�^����� ���� ��#$� � ���� �� � ��� �\� &�^��^���� �!� �������� �#��������������^ �# ����������#��^ �������� �������� �#��������� �� �����\���<�� #����'� ^��$����$#� ����% ��$�� �����$#��'� � ����� �$�����!���� `' ��� ���� � �'��� #������������ �%�#�"��%�'� ^��$����$#� ����#�������!���$�] ���������#��������% �����\��\ ���$�] ����"��%��%��� ����\���%�����% ���$�] ����" � �������!� #�����=����#��% ���% ��� ���$�] ����"%�� ���\��" � �%��% ���%�����% ��# ��# ���" � �������!� #����_=�� �!�$�#�_=��" � ���� ��������^ ��%����=������% ���� ����#��% ��� ���� #�� �� ���%����=��"% ��� ���$�� �� ��'' �� #�&���##�������" ������!�$�#����%��=����#�_=���%�" #���� ��^ ��������� `�� � ��'��������#��% ��� %�^ #�#�!! � �����"% ���'�����¢_��� ��� ����! ������������$'���=��� � #����� �'��#���� ����������^ �������% ��%��� �<$���%���� #������ ���^ ������ #�!$��% ������% �!$�$� ���� �^ ����=��� �# #����� �� ���������"% ���% ��� � �^ #�� ����^ �! #������"%��%���#���� ����# �� �� �����% ���� "��#���
��9��;&$!<#$����\%���"����"����$''��� #�����% �������������$����_�� �� ���$�#�������!�*%����£�������$�� �����~@���@¤��
�$*$�$��$��£�¤� <����������������� ������=�������� ������������&�� �����^ ���#�������� ��������������'�����^ ���$#���!�� �'��� ���� ��
����������' ���&���� �������'������&�����$� �!���/��������� � ���%��>��^ �������!�<����������������}$� �£�¤� � ����_��������= ���������� �������# ���������� ����#�����$���$�������Economic Inquiry���@�����@���@@��£�¤� �� � ��}=��_��� �^��� ���<������������/��=��� ���}�����*�% ���}=�����������!��&���^ �����������!� ���������
���� � ������������]$#�� ���Science�����������������¥���[�£@¤� ��������������% ��������������������������&�����' ����������������^ ¨�/^�# �� �!�����% �� �'��� ���� �������'$�����
���#����� �Journal of Bioeconomics,����������������£�¤� ���^ ���������� �����Á���/����������������!���¨�����$#���!�� �'��� ���� ��Economics Letters,���������������~�£~¤� �$����� �������������&��������^ ���#��������^ �� �������������$#���!�� �'��� ���� ��The Economic Journal,�����������
��@�����~�£�¤� �$����� ���� �� �������� � �'��� � ��� � ��#� # ������� �������� �� ©!� ©� `' ��� ����� ��$#�� � ��� ^ #� !����
%��'��¡¡ �� �����$����¡��� �¡ ������� ���$����¡!�� �¡� #���� �^ �¡/��������¡!� �# �¡'�' ��¡�����~'#!� �[� ����%�������
£[¤� �$����� ��������������� �'��� ���� ���#�# ������������������ `' ��� �������$#��Judgment & Decision Making��[������@������
£�¤� �$����� ����������~������'�������!�'��� ����< �" �����������^ ���#����� �'����^ �The Quarterly Journal of Economics����������[���[����
£��¤� _��! ��� ���� �������� }��� ��������� }��� ���������� �/�� �� *�% ��� }=� ������� \% � � $���� ������ �!� ��������# ������������������% �$������$����� �Science, �����~�~�������¥���[�
£��¤� _�%��� �������\� ^�����&�����@��&��� �'��� ���� �'� #����^ ��!��%��� ¨���� `' ��� �������$#���!��%� �%��#������ �� ��=���$��������' �����_��&&����@������< ������_������_�� �� �� � ���%�* �� �����<��
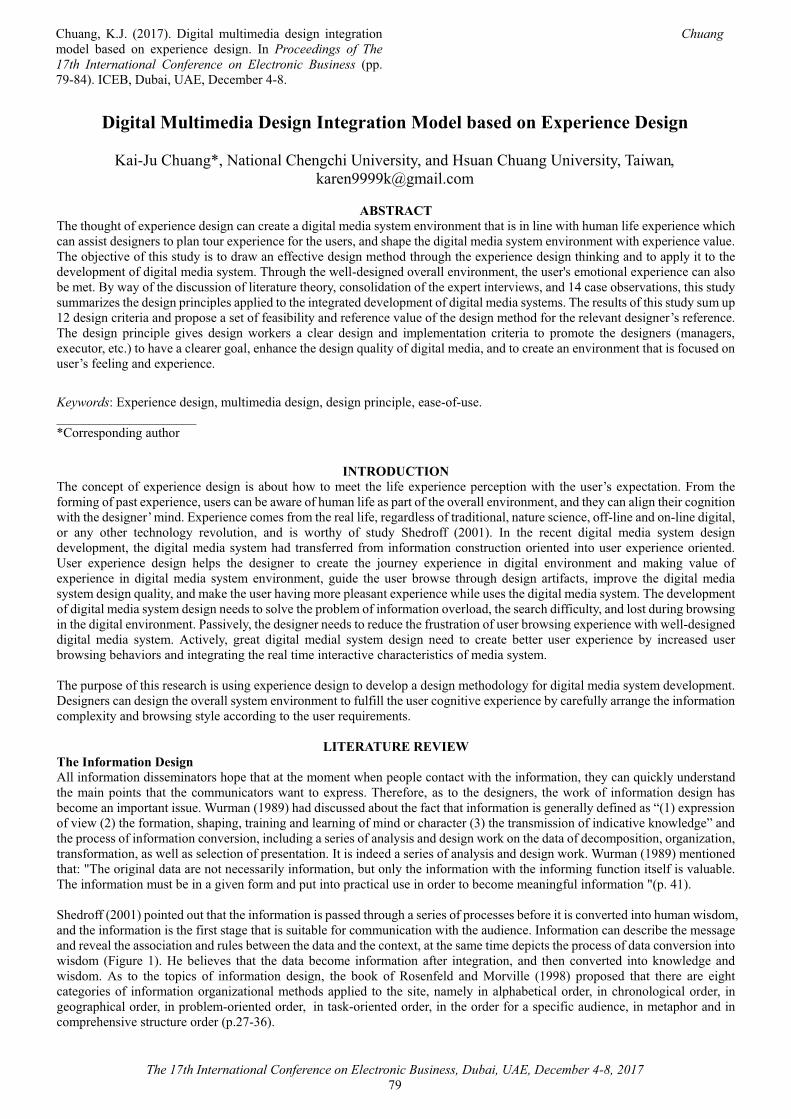
Chuang, K.J. (2017). Digital multimedia design integration model based on experience design. In Proceedings of The 17th International Conference on Electronic Business (pp. 79-84). ICEB, Dubai, UAE, December 4-8.
Chuang
The 17th International Conference on Electronic Business, Dubai, UAE, December 4-8, 201779
Digital Multimedia Design Integration Model based on Experience Design
Kai-Ju Chuang*, National Chengchi University, and Hsuan Chuang University, Taiwan,[email protected]
ABSTRACTThe thought of experience design can create a digital media system environment that is in line with human life experience which can assist designers to plan tour experience for the users, and shape the digital media system environment with experience value. The objective of this study is to draw an effective design method through the experience design thinking and to apply it to the development of digital media system. Through the well-designed overall environment, the user's emotional experience can also be met. By way of the discussion of literature theory, consolidation of the expert interviews, and 14 case observations, this study summarizes the design principles applied to the integrated development of digital media systems. The results of this study sum up12 design criteria and propose a set of feasibility and reference value of the design method for the relevant designer’s reference. The design principle gives design workers a clear design and implementation criteria to promote the designers (managers, executor, etc.) to have a clearer goal, enhance the design quality of digital media, and to create an environment that is focused on user’s feeling and experience.
Keywords: Experience design, multimedia design, design principle, ease-of-use._____________________*Corresponding author
INTRODUCTIONThe concept of experience design is about how to meet the life experience perception with the user’s expectation. From the forming of past experience, users can be aware of human life as part of the overall environment, and they can align their cognition with the designer’ mind. Experience comes from the real life, regardless of traditional, nature science, off-line and on-line digital, or any other technology revolution, and is worthy of study Shedroff (2001). In the recent digital media system design development, the digital media system had transferred from information construction oriented into user experience oriented. User experience design helps the designer to create the journey experience in digital environment and making value of experience in digital media system environment, guide the user browse through design artifacts, improve the digital media system design quality, and make the user having more pleasant experience while uses the digital media system. The development of digital media system design needs to solve the problem of information overload, the search difficulty, and lost during browsing in the digital environment. Passively, the designer needs to reduce the frustration of user browsing experience with well-designeddigital media system. Actively, great digital medial system design need to create better user experience by increased user browsing behaviors and integrating the real time interactive characteristics of media system.
The purpose of this research is using experience design to develop a design methodology for digital media system development. Designers can design the overall system environment to fulfill the user cognitive experience by carefully arrange the information complexity and browsing style according to the user requirements.
LITERATURE REVIEWThe Information DesignAll information disseminators hope that at the moment when people contact with the information, they can quickly understand the main points that the communicators want to express. Therefore, as to the designers, the work of information design has become an important issue. Wurman (1989) had discussed about the fact that information is generally defined as “(1) expression of view (2) the formation, shaping, training and learning of mind or character (3) the transmission of indicative knowledge” and the process of information conversion, including a series of analysis and design work on the data of decomposition, organization, transformation, as well as selection of presentation. It is indeed a series of analysis and design work. Wurman (1989) mentionedthat: "The original data are not necessarily information, but only the information with the informing function itself is valuable. The information must be in a given form and put into practical use in order to become meaningful information "(p. 41).
Shedroff (2001) pointed out that the information is passed through a series of processes before it is converted into human wisdom, and the information is the first stage that is suitable for communication with the audience. Information can describe the message and reveal the association and rules between the data and the context, at the same time depicts the process of data conversion into wisdom (Figure 1). He believes that the data become information after integration, and then converted into knowledge and wisdom. As to the topics of information design, the book of Rosenfeld and Morville (1998) proposed that there are eightcategories of information organizational methods applied to the site, namely in alphabetical order, in chronological order, in geographical order, in problem-oriented order, in task-oriented order, in the order for a specific audience, in metaphor and in comprehensive structure order (p.27-36).
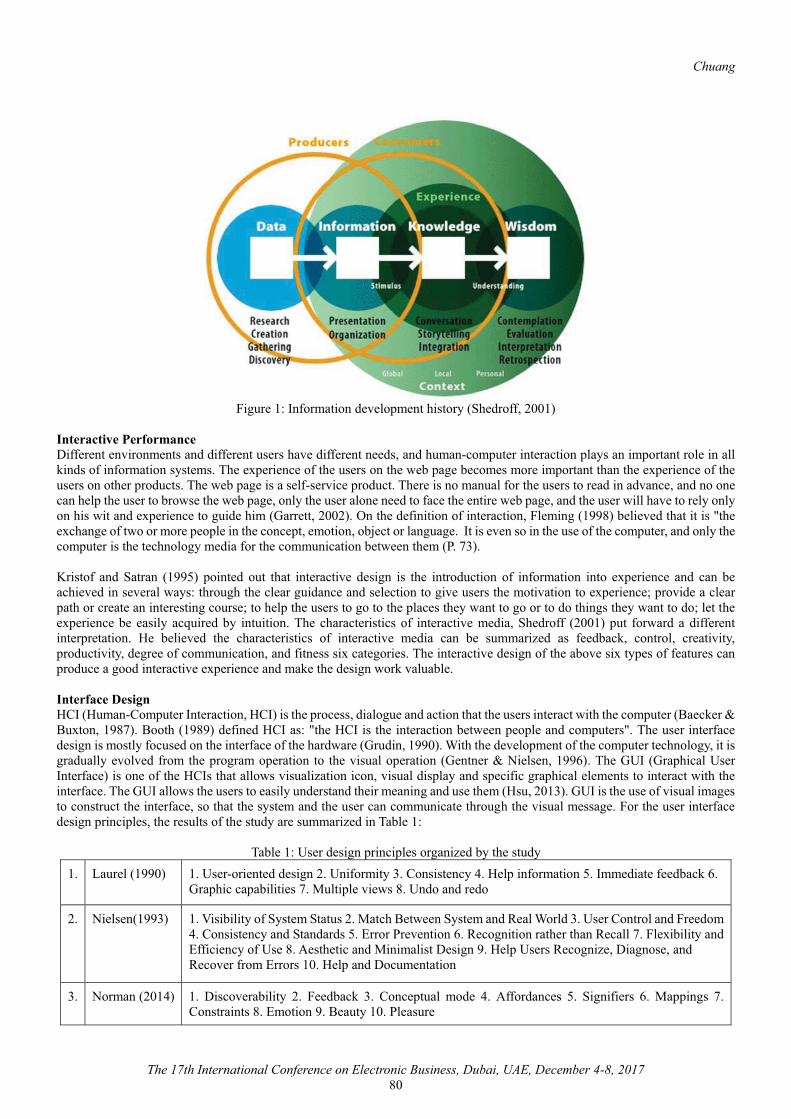
Chuang
The 17th International Conference on Electronic Business, Dubai, UAE, December 4-8, 201780
Figure 1: Information development history (Shedroff, 2001)
Interactive PerformanceDifferent environments and different users have different needs, and human-computer interaction plays an important role in all kinds of information systems. The experience of the users on the web page becomes more important than the experience of the users on other products. The web page is a self-service product. There is no manual for the users to read in advance, and no onecan help the user to browse the web page, only the user alone need to face the entire web page, and the user will have to rely only on his wit and experience to guide him (Garrett, 2002). On the definition of interaction, Fleming (1998) believed that it is "the exchange of two or more people in the concept, emotion, object or language. It is even so in the use of the computer, and only the computer is the technology media for the communication between them (P. 73).
Kristof and Satran (1995) pointed out that interactive design is the introduction of information into experience and can be achieved in several ways: through the clear guidance and selection to give users the motivation to experience; provide a clear path or create an interesting course; to help the users to go to the places they want to go or to do things they want to do; let the experience be easily acquired by intuition. The characteristics of interactive media, Shedroff (2001) put forward a different interpretation. He believed the characteristics of interactive media can be summarized as feedback, control, creativity, productivity, degree of communication, and fitness six categories. The interactive design of the above six types of features can produce a good interactive experience and make the design work valuable.
Interface DesignHCI (Human-Computer Interaction, HCI) is the process, dialogue and action that the users interact with the computer (Baecker & Buxton, 1987). Booth (1989) defined HCI as: "the HCI is the interaction between people and computers". The user interface design is mostly focused on the interface of the hardware (Grudin, 1990). With the development of the computer technology, it is gradually evolved from the program operation to the visual operation (Gentner & Nielsen, 1996). The GUI (Graphical User Interface) is one of the HCIs that allows visualization icon, visual display and specific graphical elements to interact with the interface. The GUI allows the users to easily understand their meaning and use them (Hsu, 2013). GUI is the use of visual images to construct the interface, so that the system and the user can communicate through the visual message. For the user interface design principles, the results of the study are summarized in Table 1:
Table 1: User design principles organized by the study1. Laurel (1990) 1. User-oriented design 2. Uniformity 3. Consistency 4. Help information 5. Immediate feedback 6.
Graphic capabilities 7. Multiple views 8. Undo and redo
2. Nielsen(1993) 1. Visibility of System Status 2. Match Between System and Real World 3. User Control and Freedom4. Consistency and Standards 5. Error Prevention 6. Recognition rather than Recall 7. Flexibility and Efficiency of Use 8. Aesthetic and Minimalist Design 9. Help Users Recognize, Diagnose, and Recover from Errors 10. Help and Documentation
3. Norman (2014) 1. Discoverability 2. Feedback 3. Conceptual mode 4. Affordances 5. Signifiers 6. Mappings 7.Constraints 8. Emotion 9. Beauty 10. Pleasure
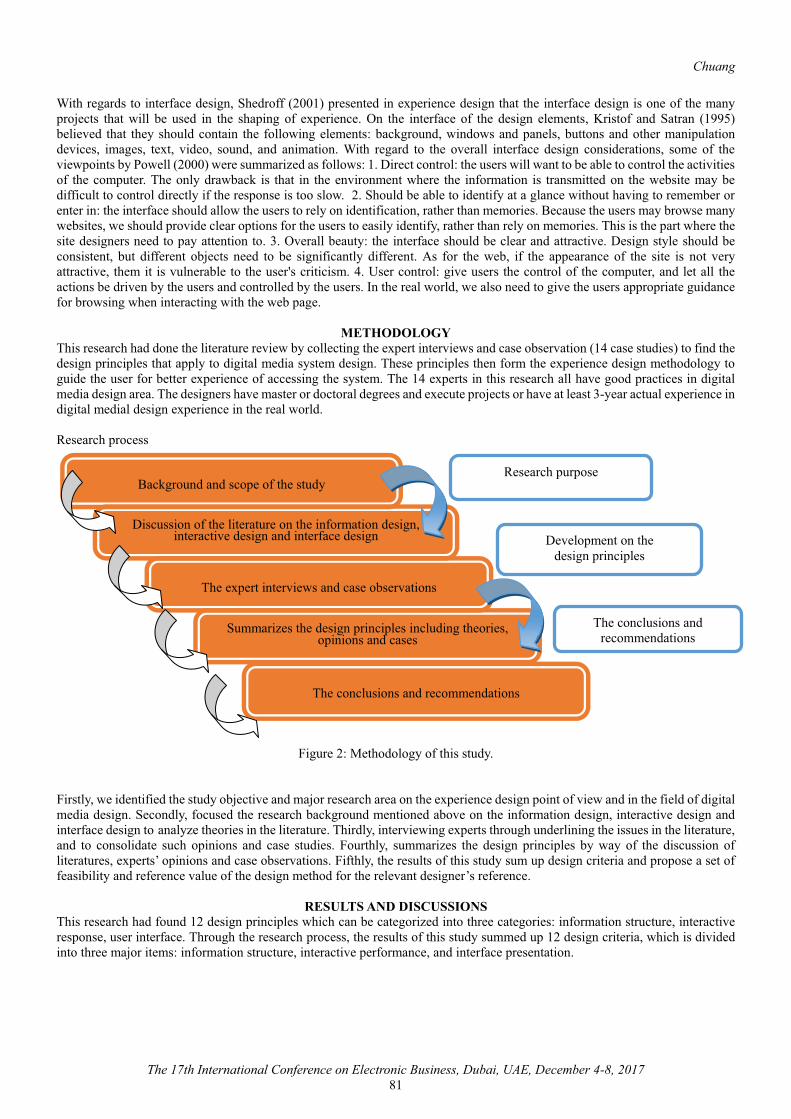
Chuang
The 17th International Conference on Electronic Business, Dubai, UAE, December 4-8, 201781
With regards to interface design, Shedroff (2001) presented in experience design that the interface design is one of the many projects that will be used in the shaping of experience. On the interface of the design elements, Kristof and Satran (1995) believed that they should contain the following elements: background, windows and panels, buttons and other manipulation devices, images, text, video, sound, and animation. With regard to the overall interface design considerations, some of the viewpoints by Powell (2000) were summarized as follows: 1. Direct control: the users will want to be able to control the activities of the computer. The only drawback is that in the environment where the information is transmitted on the website may be difficult to control directly if the response is too slow. 2. Should be able to identify at a glance without having to remember orenter in: the interface should allow the users to rely on identification, rather than memories. Because the users may browse many websites, we should provide clear options for the users to easily identify, rather than rely on memories. This is the part where the site designers need to pay attention to. 3. Overall beauty: the interface should be clear and attractive. Design style should be consistent, but different objects need to be significantly different. As for the web, if the appearance of the site is not veryattractive, them it is vulnerable to the user's criticism. 4. User control: give users the control of the computer, and let all the actions be driven by the users and controlled by the users. In the real world, we also need to give the users appropriate guidancefor browsing when interacting with the web page.
METHODOLOGYThis research had done the literature review by collecting the expert interviews and case observation (14 case studies) to find the design principles that apply to digital media system design. These principles then form the experience design methodology to guide the user for better experience of accessing the system. The 14 experts in this research all have good practices in digital media design area. The designers have master or doctoral degrees and execute projects or have at least 3-year actual experience in digital medial design experience in the real world.
Research process
Figure 2: Methodology of this study.
Firstly, we identified the study objective and major research area on the experience design point of view and in the field of digital media design. Secondly, focused the research background mentioned above on the information design, interactive design and interface design to analyze theories in the literature. Thirdly, interviewing experts through underlining the issues in the literature, and to consolidate such opinions and case studies. Fourthly, summarizes the design principles by way of the discussion of literatures, experts’ opinions and case observations. Fifthly, the results of this study sum up design criteria and propose a set of feasibility and reference value of the design method for the relevant designer’s reference.
RESULTS AND DISCUSSIONSThis research had found 12 design principles which can be categorized into three categories: information structure, interactive response, user interface. Through the research process, the results of this study summed up 12 design criteria, which is divided into three major items: information structure, interactive performance, and interface presentation.
The expert interviews and case observations
Discussion of the literature on the information design,interactive design and interface design
Background and scope of the study
The conclusions and recommendations
Development on the design principles
Research purpose
Summarizes the design principles including theories, opinions and cases
The conclusions and recommendations

Chuang
The 17th International Conference on Electronic Business, Dubai, UAE, December 4-8, 201782
Table 2: The 12 design principles
A. Information structure: this is the prerequisite of the overall design. A series of analysis and design work, including the decomposition of information, organization, conversion, and the choice of presentation can only become meaningful information after given a form and put it into practical information.
1. to achieve communication objective:
convert the data into valuable information, and then convert again into knowledge and wisdom. When passing the message, the less the error, the more it is able to achieve the communication purpose between the designer and the one he tries to communicate with.
2. to promote easy understanding:
the design should try to improve the interpretation and absorption ability of information by the recipients of the information. It should pass the information to the users in a way that is systematic and easy to read so as to allow the users to have better understanding.
3. a well-constructed site organizational structure:
it is proposed to use "the organizational approach" and "the structural approach" thesetwo methods to achieve information composition. In terms of practical experience, it may be having the structure of the site first and then build the information according to such structure, or in the process of reorganizing the data, gradually forming a digital media structure. The organizational approach and the structural approach should have overlapping parts in the implementation of the two.
4. to use and manage: we should pay attention to the correctness of information and the legitimacy of use, the expansion and the management of the site information, the user surveys and test feedback, update the information with timeliness etc.
B. Interactive response: digital media interactive design on the computer technology applications is developed from the real world experience, so that ideas, emotions, objects, or languages are exchanged in an interactive way. The design criteria are as follows:
5. it should be user-centered:
which means it should give users the rights of choice, control and autonomy. During their process of the information searching, it should also create an interesting process to help the users to have the motivation to experience more, and at the same time make the experience easy to be obtained by simply following their intuition.
6. sceneries oriented: which should include media features, use of hardware and software technologies, performance arrangements, as well as the users operating sequence and other factors.
7. proper interactivity: the interactive design in the digital media design field has an important advantage, which is very different from the printing, film ... etc. one-way transmission media. Moderate use of interactivity will not only make the users to enter the system more quickly through their own intuition, but also the familiar mode of the operation will also accelerate the user’s absorption of the content, while the excessive interactive will easily make the users to be confused, due to too many excessive stimulations are offered to them.
8. easy to operate: the interactivity is a considerable help to the users during their operation and browsing of the system which is in line with the needs of users for facilitating the operation and thereceiving of the message that the digital media tries to present, especially in the configuration of color presentation which can achieve the functions of information distinction and highlight focus. It will also affect the user’s willingness to click if the environment meets the circumstance of easy to operate.
C. User interface: user interface is the visual presentation of information design and interactive design. It is also the most direct and important browsing experience of the visual impression when the users access to the digital media. The design criteria are as follows:

Chuang
The 17th International Conference on Electronic Business, Dubai, UAE, December 4-8, 201783
9. the overall designpresentation:
through the integration of design elements in the interface, it can promote positive contact between the users and the system.
10. User acceptance: The design should consider the practicality, beauty, and also to be in line with the user's convenience as well as fluency in order to obtain more users approval.
11. intuition and consistency:
this will help the users to remember and operate easily, without having to spend much time in learning.
12. to provide the right and easy operation:
which will help the users to identify the location, get the information they want to browse, and when the content is rich, clear navigation planning and clear tips are particularly important.
CONCLUSIONThe objective of this research is to propose a workable and referable design methodology for designers, based on the experiencedesign point of view and in the field of digital media design. In this study, the selected experts we interviewed are professional designers (a total of fourteen designers), who all have a wealth of experience in the digital media design field. The designers all received a master's degree or above in the related field and all have the project implementation capacity, or senior in a high-level position with practical digital media design experience for more than 3 years. Through the discussion of literature theory, the experts’ interview, and the case study (14 cases), this paper summarizes the experience design applied to the design principles of digital media system integration and development, and sums up the design method of "shaping the experience environment and guiding the users to obtain information".
In the process of summarizing the literature, it is found that some of the concepts of the scholars are similar. Therefore, trying to reorganize and then merged the repetitions or similarities in the literatures. After choosing the rest important points of view and summarizing three major directions as follow: (1) information composition, (2) interactive performance, (3) interface presentation, we then once again collected and integrated these directions and case observation, as well as the expert advices.
Through the above research methods, the results of this study summarize a total of 12 design criteria as follow: (1) The information composition aspect:
1. To achieve the purpose of communication. 2. Promote understanding.3. Organizational structure. 4. To use and manage.
(2) The interactive performance aspect:1. User-centric.2. Situation considerations. 3. Proper interactivity. 4. Easy to operate.
(3) The interface presentation aspect:1. Presents the overall design. 2. Obtain the user’s approval. 3. Intuition and consistency.4. Provide the right and easy operation.
This study also found that such a design principle gives the design staff a clear design and implementation guideline to enhance the designer (the managers and/or the executors) to have a clearer goal which will help the smooth execution of design workflow, and enhance the quality of digital media design, to guide the users to easily obtain information, create the environment which focus on user feeing and user experience thus promote the user experience in their tour experience. It is also easy for the users to absorb the digital media information during their operation, and can also feel the experience that digital media tries to convey.
The limitations of this study are several as follow:(1) When access to the design guidelines of this study, it should be based on a comprehensive and complete design
considerations with careful planning so that the design quality of the digital media system can be guaranteed. Therefore, it requires a longer execution time and cost in the process period, thus time and quality will be the trade-offs of designers or managers.
(2) As a result of the proposed design approach, it is our choice to choose the digital media sites as presentation media. As forother digital media forms, the follow-up researchers can target different digital media carriers for further discussion.
(3) For future research, it is recommended that this set of design methods be available as inference to other features of presentation in response to different modular production according to different themes, or different types of design, for example: to apply in the digital museum design, the medical system design, the urban map design ... and so on. After more
Chuang
The 17th International Conference on Electronic Business, Dubai, UAE, December 4-8, 201784
empirical researches are produced, the digital media design can pay more attention to user experience, and to guide users tour smoothly in a digital media surrounding.
REFERENCES[1] Baecker, R.M. & Buxton, W.A.S. (Eds.) (1987). Readings in Human-Computer Interaction: A Multi-Disciplinary Approach.
San Mateo, CA: Morgan Kaufmann.[2] Booth, P. A. (1989). An Introduction to Human-Computer Interaction. Hove, East Sussex, UK: Lawrence Erlbaum
Associates.[3] Fleming, J. (1998). Web Navigation: Designing the User Experience. Sebastopol, CA: O'Reilly & Associates.[4] Garrett, J. J. (2002). The Elements of User Experience: User-Centered Design for the Web and Beyond. Berkeley, CA: New
Riders.[5] Gentner, D. & Nielsen, J. (1996). The anti-mac interface. Communications of the ACM, 39(8), 70-82. [6] Grudin, J. (1990). The computer reaches out: the historical continuity of interface design. In Proceedings of the SIGCHI
Conference on Human Factors in Computing Systems (pp. 261-268). ACM, Seattle, WA, USA, April 01 – 05.[7] Hsu, Y. C. (2013). Affective interfaces of embodied conversational agents. International Journal of Affective Engineering,
12(2), 71-78.[8] Kristof, R. & Satran, A. (1995). Interactivity by Design. Mountain View, CA: Adobe Press.[9] Laurel, B. (1990). The Art of Human-Computer Interface Design. Boston, MA: Adison-Wesley.[10] Nielsen, J. (1993). Usability Engineering. London, UK: Academic Press.[11] Norman, D. (2014). Reflections on design. In Proceedings of CHI'14 Extended Abstracts on Human Factors in Computing
Systems (ACM 2014) (pp. 1053-1054). ACM, Toronto, Ontario, Canada, April 26 - May 01.[12] Powell, T. (2000). Web Design: The Complete Reference. New York: McGraw-Hill.[13] Rosenfeld, L. & Morville, P. (1998). Information Architecture for the World Wide Web. Sebastopol, CA: O’Reilly &
Associates.[14] Shedroff, N. (2001). Experience Design. Berkeley, CA: New Riders.[15] Wurman, R. S. (1989). Information Anxiety. New York: Doubleday.

Chang, H.L., Szu, W.W. & Tu, Y.J. (2017). Drivers of eHealth adoption: Linking eHealth adoption to service concept. InProceedings of The 17th International Conference on Electronic Business (pp. 85-92). ICEB, Dubai, UAE, December 4-8.
Chang, Szu & Tu
The 17th International Conference on Electronic Business, Dubai, UAE, December 4-8, 201785
Drivers of eHealth Adoption: Linking eHealth Adoption to Service Concept
Hsin-Lu Chang, National Chengchi University, Taipei City, Taiwan, [email protected] Szu*, National Chengchi University, Taipei City, Taiwan, wei-wen [email protected]
Yu-Ju Tu, National Chengchi University, Taipei City, Taiwan, [email protected]
ABSTRACTResearchers and practitioners are keenly interested in understanding what drives eHealth adoption in recent years. This is largely because, while eHealth can lead to cost-effective and quality health care, the actual adoption rate of eHealth remains low across countries. In prior literature, it was clearly indicated that well-designed eHealth services are critical to eHealth adoption. In this study, our findings further show that, what may motivate patients’ adoption is more strongly associated with the design of eHealth caring service, and the design of eHealth IT service is more likely to be associated with patients’ continual use.
Keywords: e-Health, service concept, caring service portfolio, IT service portfolio, initial adoption, continual use_____________________*Corresponding author
INTRODUCTION“eHealth is the use of information and communication technologies for health” (World Health Organization, 2015). In other words, eHealth is mainly focused on the health care service and health information service that are delivered or enhanced through information and communication technologies, such as the Internet or telecommunication (Eysenbach, 2001). Convinced that eHealth may enable a quality health care with lower cost, many countries and their governments have increased their spending for promoting eHealth. However, actual adoption of eHealth is still very limited across countries. Thus, researchers and practitioners are keenly interested in understanding what drives a sustainable eHealth adoption.
Prior literature has shown that well-designed eHealth services are very crucial to eHealth adoption (Tsiknakis & Kouroubali, 2009; Goldstein et al., 2002). Designing eHealth services is not a trivial task. The factors that organizations need to consider in designing eHealth offerings involve both of IT options and care options. In other words, designing eHealth services means determining an appropriate mix of IT and care service components. According to one well-established principle in service industry, people adopt a service only when they perceive the value from the consistent components in the service, i.e., the “service concept” (Goldstein et al., 2002). This denotes that eHealth adoption is mainly due to the perceived value from IT, or from care service offerings. Among the studies of eHealth adoption, there are basically two parallel streams of research directions. One stream is focused on only IT components, such health IT (HIT) (Rajiv & Tan, 2016), while the other stream considers only healthcare components (Dort, 2015). In this study, we thus have the following research questions.
Research Question 1: Do customers treat IT and care service offerings equally when adopting eHealth?Research Question 2: If not, how can eHealth organizations (i.e., eHealth service providers) make the right mix of IT
and care components in their eHealth offerings?
In this study, we seek to answer such questions from a perspective of portfolio management. According to one main implication in Modern Portfolio Theory (MPT) (Markowitz, 1991) management aims to help maintain the most suitable set of investment targets, rather than a set of the best investment targets, under uncertainty (Markowitz, 1991). We thus propose to view the overall eHealth offerings by an eHealth organization (e.g., a hospital) as a portfolio. In other words, the portfolio is an aggregate management unit, referring to a set of eHealth elements which a hospital must have in order to provide healthcare services remotely and electronically. Grounded in the perspective of service concept, we further classify these elements into two sub sets: eHealth care and IT service components. Whereas care service components depict what care options are available to improve customers’ health conditions, IT service components characterize how these care options should be implemented and delivered via a range of IT solutions. In this paper, we adopted a user-oriented perspective to define quality eHealth portfolio. Moreover, the constantly-optimal portfolio rarely exists in practice. Thus, for example, funding managers have to adjust their recommending portfolio compositions contingently. This denotes that, the portfolio composition of eHealth for maximally satisfying customers’ needs would vary with different contexts.
RESEARCH BACKGROUNDSThe Concept of IT and Care Components in eHealthIn this study, we view the overall eHealth offerings by a hospital as a portfolio to manage. In other words, the portfolio is an aggregate management unit, referring to a set of eHealth elements which a hospital must have in order to provide healthcare services remotely and electronically. We further classify these elements into two sub sets. One is the set of eHealth care service
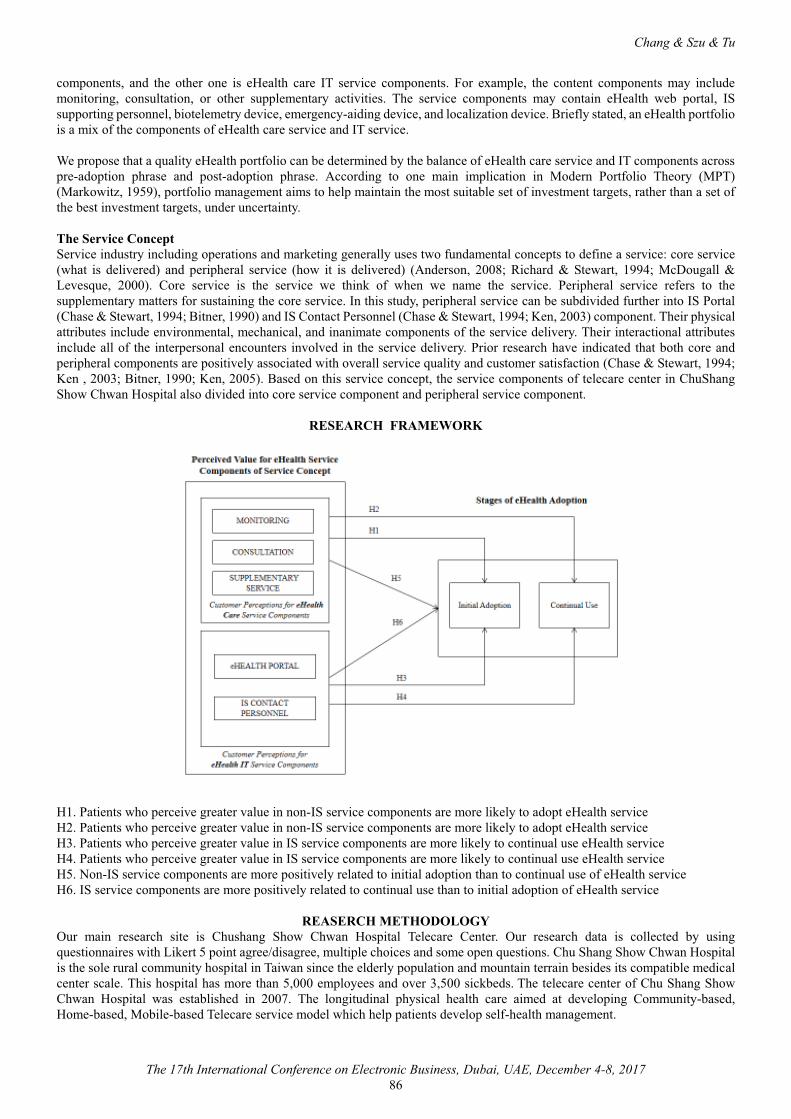
Chang & Szu & Tu
The 17th International Conference on Electronic Business, Dubai, UAE, December 4-8, 201786
components, and the other one is eHealth care IT service components. For example, the content components may include monitoring, consultation, or other supplementary activities. The service components may contain eHealth web portal, IS supporting personnel, biotelemetry device, emergency-aiding device, and localization device. Briefly stated, an eHealth portfolio is a mix of the components of eHealth care service and IT service.
We propose that a quality eHealth portfolio can be determined by the balance of eHealth care service and IT components across pre-adoption phrase and post-adoption phrase. According to one main implication in Modern Portfolio Theory (MPT) (Markowitz, 1959), portfolio management aims to help maintain the most suitable set of investment targets, rather than a set of the best investment targets, under uncertainty.
The Service ConceptService industry including operations and marketing generally uses two fundamental concepts to define a service: core service (what is delivered) and peripheral service (how it is delivered) (Anderson, 2008; Richard & Stewart, 1994; McDougall & Levesque, 2000). Core service is the service we think of when we name the service. Peripheral service refers to the supplementary matters for sustaining the core service. In this study, peripheral service can be subdivided further into IS Portal(Chase & Stewart, 1994; Bitner, 1990) and IS Contact Personnel (Chase & Stewart, 1994; Ken, 2003) component. Their physical attributes include environmental, mechanical, and inanimate components of the service delivery. Their interactional attributes include all of the interpersonal encounters involved in the service delivery. Prior research have indicated that both core and peripheral components are positively associated with overall service quality and customer satisfaction (Chase & Stewart, 1994; Ken , 2003; Bitner, 1990; Ken, 2005). Based on this service concept, the service components of telecare center in ChuShang Show Chwan Hospital also divided into core service component and peripheral service component.
RESEARCH FRAMEWORK
H1. Patients who perceive greater value in non-IS service components are more likely to adopt eHealth serviceH2. Patients who perceive greater value in non-IS service components are more likely to adopt eHealth serviceH3. Patients who perceive greater value in IS service components are more likely to continual use eHealth serviceH4. Patients who perceive greater value in IS service components are more likely to continual use eHealth serviceH5. Non-IS service components are more positively related to initial adoption than to continual use of eHealth serviceH6. IS service components are more positively related to continual use than to initial adoption of eHealth service
REASERCH METHODOLOGYOur main research site is Chushang Show Chwan Hospital Telecare Center. Our research data is collected by using questionnaires with Likert 5 point agree/disagree, multiple choices and some open questions. Chu Shang Show Chwan Hospital is the sole rural community hospital in Taiwan since the elderly population and mountain terrain besides its compatible medical center scale. This hospital has more than 5,000 employees and over 3,500 sickbeds. The telecare center of Chu Shang Show Chwan Hospital was established in 2007. The longitudinal physical health care aimed at developing Community-based, Home-based, Mobile-based Telecare service model which help patients develop self-health management.
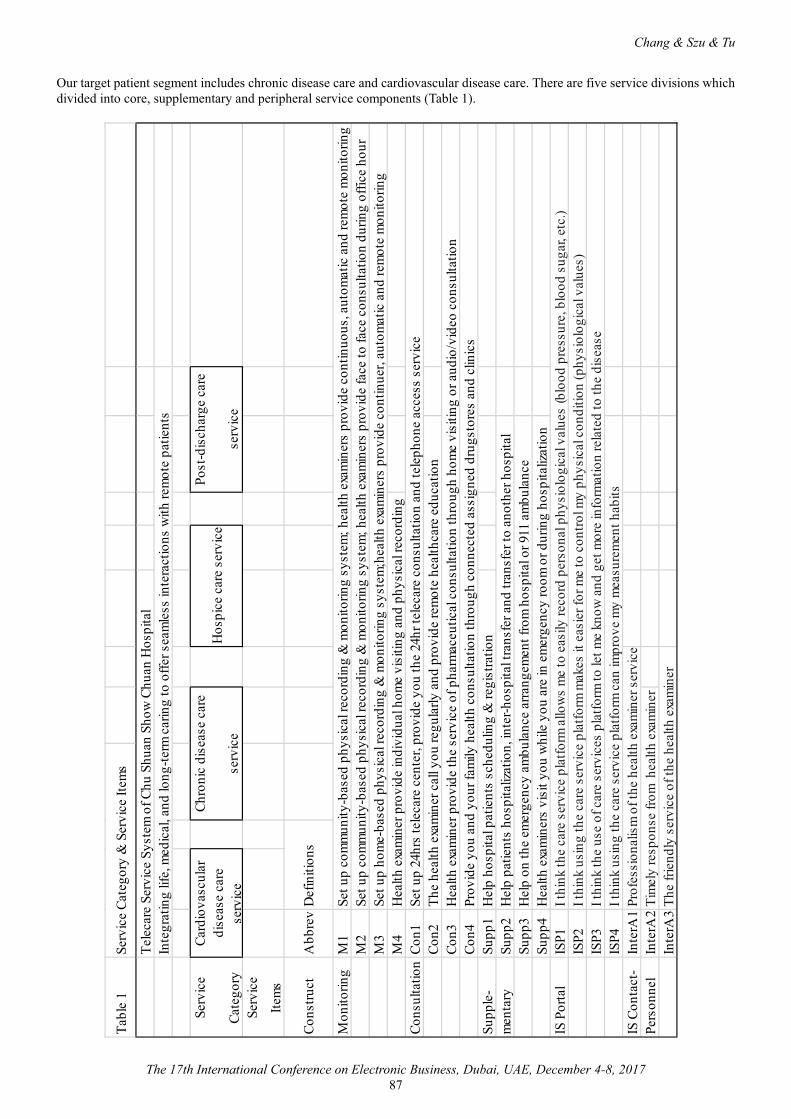
Chang & Szu & Tu
The 17th International Conference on Electronic Business, Dubai, UAE, December 4-8, 201787
Our target patient segment includes chronic disease care and cardiovascular disease care. There are five service divisions which divided into core, supplementary and peripheral service components (Table 1).
Tabl
e 1
Serv
ice
Cate
gory
& S
ervi
ce It
ems
Tele
care
Ser
vice
Sys
tem
of C
hu S
huan
Sho
w C
huan
Hos
pita
lIn
tegr
atin
g lif
e, m
edic
al, a
nd lo
ng-te
rm c
arin
g to
offe
r sea
mle
ss in
tera
ctio
ns w
ith re
mot
e pa
tient
s
Serv
ice
Cate
gory
Hos
pice
car
e se
rvic
e
Serv
ice
Item
s
Cons
truct
Abb
rev .
Def
initi
ons
Mon
itorin
gM
1Se
t up
com
mun
ity-b
ased
phy
sica
l rec
ordi
ng &
mon
itorin
g sy
stem
; hea
lth e
xam
iner
s pr
ovid
e co
ntin
uous
, aut
omat
ic a
nd re
mot
e m
onito
ring
M2
Set u
p co
mm
unity
-bas
ed p
hysi
cal r
ecor
ding
& m
onito
ring
syst
em; h
ealth
exa
min
ers
prov
ide
face
to fa
ce c
onsu
ltatio
n du
ring
offic
e ho
ur
M3
Set u
p ho
me-
base
d ph
ysic
al re
cord
ing
& m
onito
ring
syst
em;h
ealth
exa
min
ers
prov
ide
cont
inue
r, au
tom
atic
and
rem
ote
mon
itorin
gM
4H
ealth
exa
min
er p
rovi
de in
divi
dual
hom
e vi
sitin
g an
d ph
ysic
al re
cord
ing
Cons
ulta
tion
Con1
Set u
p 24
hrs
tele
care
cen
ter,
prov
ide
you
the
24hr
tele
care
con
sulta
tion
and
tele
phon
e ac
cess
ser
vice
Con2
The
heal
th e
xam
iner
cal
l you
regu
larly
and
pro
vide
rem
ote
heal
thca
re e
duca
tion
Con3
Hea
lth e
xam
iner
pro
vide
the
serv
ice
of p
harm
aceu
tical
con
sulta
tion
thro
ugh
hom
e vi
sitin
g or
aud
io/v
ideo
con
sulta
tion
Con4
Prov
ide
you
and
your
fam
ily h
ealth
con
sulta
tion
thro
ugh
conn
ecte
d as
sign
ed d
rugs
tore
s an
d cl
inic
sSu
pple
-Su
pp1
Hel
p ho
spita
l pat
ient
s sc
hedu
ling
& re
gist
ratio
nm
enta
rySu
pp2
Hel
p pa
tient
s ho
spita
lizat
ion,
inte
r-hos
pita
l tra
nsfe
r and
tran
sfer
to a
noth
er h
ospi
tal
Supp
3H
elp
on th
e em
erge
ncy
ambu
lanc
e ar
rang
emen
t fro
m h
ospi
tal o
r 911
am
bula
nce
Supp
4H
ealth
exa
min
ers
visi
t you
whi
le y
ou a
re in
em
erge
ncy
room
or d
urin
g ho
spita
lizat
ion
IS P
orta
lIS
P1I t
hink
the
care
ser
vice
pla
tform
allo
ws
me
to e
asily
reco
rd p
erso
nal p
hysi
olog
ical
val
ues ��������
��������� ������
����
�� �����
ISP2
I thi
nk u
sing
the
care
ser
vice
pla
tform
mak
es it
eas
ier f
or m
e to
con
trol m
y ph
ysic
al c
ondi
tion
(phy
siol
ogic
al v
alue
s)IS
P3I t
hink
the
use
of c
are
serv
ices
pla
tform
to le
t me
know
and
get
mor
e in
form
atio
n re
late
d to
the
dise
ase
ISP4
I thi
nk u
sing
the
care
ser
vice
pla
tform
can
impr
ove
my
mea
sure
men
t hab
itsIS
Con
tact
-In
terA
1Pr
ofes
sion
alis
m o
f the
hea
lth e
xam
iner
ser
vice
Pers
onne
lIn
terA
2Ti
mel
y re
spon
se fr
om h
ealth
exa
min
er
Inte
rA3
The
frien
dly
serv
ice
of th
e he
alth
exa
min
er
Card
iova
scul
ardi
seas
e ca
rese
rvic
e
Chro
nic
dise
ase
care
serv
ice
Post
-dis
char
ge c
are
serv
ice
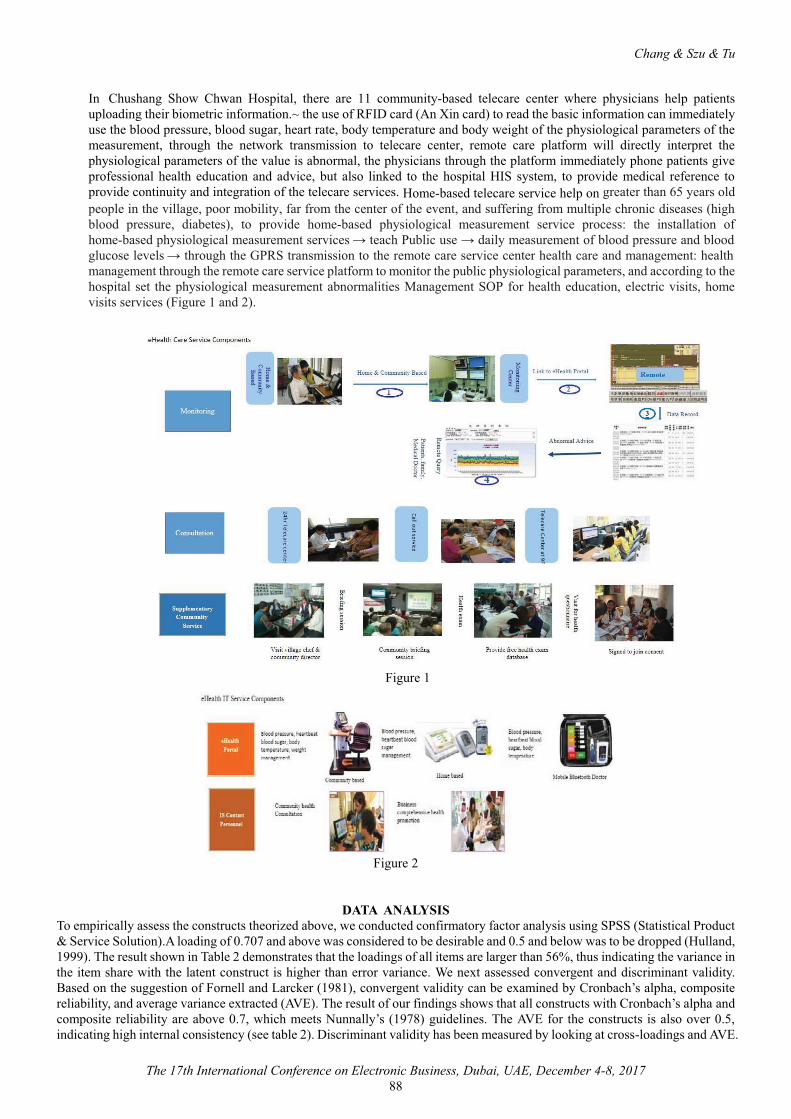
Chang & Szu & Tu
The 17th International Conference on Electronic Business, Dubai, UAE, December 4-8, 201788
In Chushang Show Chwan Hospital, there are 11 community-based telecare center where physicians help patients uploading their biometric information.~ the use of RFID card (An Xin card) to read the basic information can immediatelyuse the blood pressure, blood sugar, heart rate, body temperature and body weight of the physiological parameters of the measurement, through the network transmission to telecare center, remote care platform will directly interpret the physiological parameters of the value is abnormal, the physicians through the platform immediately phone patients give professional health education and advice, but also linked to the hospital HIS system, to provide medical reference to provide continuity and integration of the telecare services. Home-based telecare service help on greater than 65 years old people in the village, poor mobility, far from the center of the event, and suffering from multiple chronic diseases (high blood pressure, diabetes), to provide home-based physiological measurement service process: the installation of home-based physiological measurement services ������ �!���"����������"�#�$������$�%���������������������%��������glucose levels ��� ���� �� ��&!'(����%�$"��"�%����� ����$������������)"�����%���� ���� �������%��$�%���$�%�*� ���� �management through the remote care service platform to monitor the public physiological parameters, and according to the hospital set the physiological measurement abnormalities Management SOP for health education, electric visits, home visits services (Figure 1 and 2).
Figure 1
Figure 2
DATA ANALYSISTo empirically assess the constructs theorized above, we conducted confirmatory factor analysis using SPSS (Statistical Product & Service Solution).A loading of 0.707 and above was considered to be desirable and 0.5 and below was to be dropped (Hulland,1999). The result shown in Table 2 demonstrates that the loadings of all items are larger than 56%, thus indicating the variance in the item share with the latent construct is higher than error variance. We next assessed convergent and discriminant validity. Based on the suggestion of Fornell and Larcker (1981), convergent validity can be examined by Cronbach’s alpha, composite reliability, and average variance extracted (AVE). The result of our findings shows that all constructs with Cronbach’s alpha andcomposite reliability are above 0.7, which meets Nunnally’s (1978) guidelines. The AVE for the constructs is also over 0.5, indicating high internal consistency (see table 2). Discriminant validity has been measured by looking at cross-loadings and AVE.
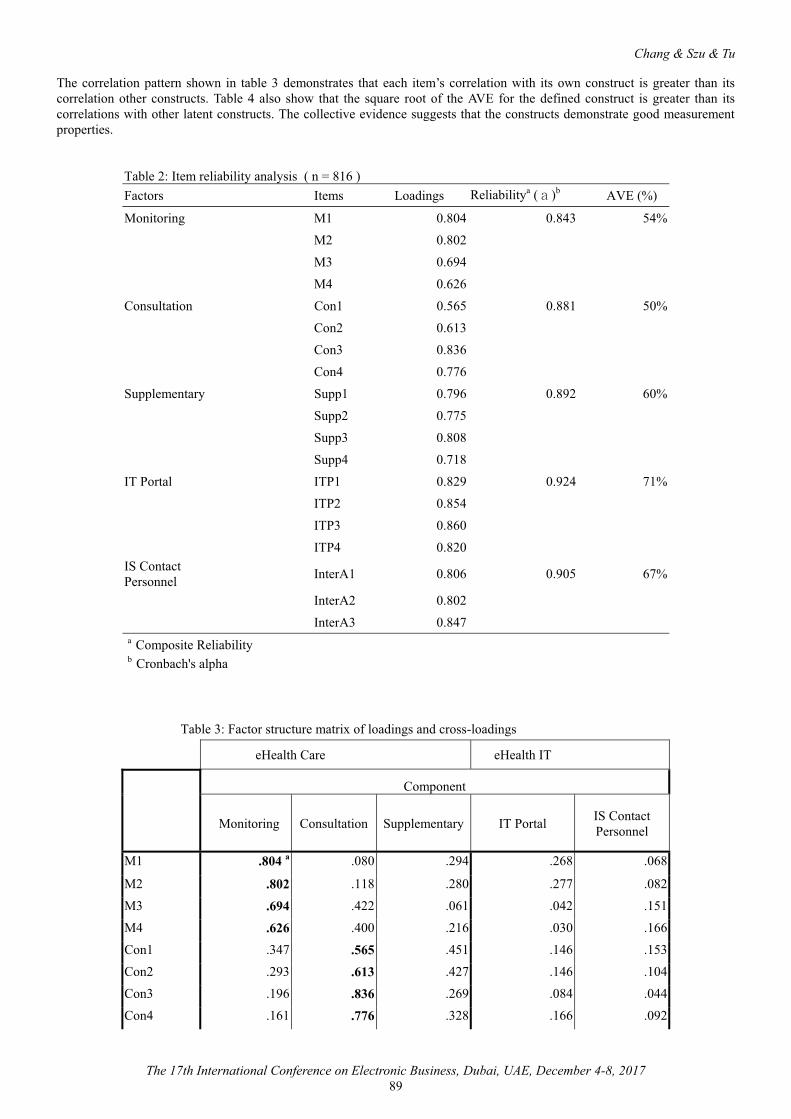
Chang & Szu & Tu
The 17th International Conference on Electronic Business, Dubai, UAE, December 4-8, 201789
The correlation pattern shown in table 3 demonstrates that each item’s correlation with its own construct is greater than its correlation other constructs. Table 4 also show that the square root of the AVE for the defined construct is greater than itscorrelations with other latent constructs. The collective evidence suggests that the constructs demonstrate good measurement properties.
Table 2: Item reliability analysis ( n = 816 )Factors Items Loadings Reliabilitya ( )b AVE (%)
Monitoring M1 0.804 0.843 54%
M2 0.802
M3 0.694
M4 0.626
Consultation Con1 0.565 0.881 50%
Con2 0.613
Con3 0.836
Con4 0.776
Supplementary Supp1 0.796 0.892 60%
Supp2 0.775
Supp3 0.808
Supp4 0.718
IT Portal ITP1 0.829 0.924 71%
ITP2 0.854
ITP3 0.860
ITP4 0.820IS ContactPersonnel InterA1 0.806 0.905 67%
InterA2 0.802
InterA3 0.847a Composite Reliabilityb Cronbach's alpha
Table 3: Factor structure matrix of loadings and cross-loadings
eHealth Care eHealth IT
Component
Monitoring Consultation Supplementary IT Portal IS ContactPersonnel
M1 .804 a .080 .294 .268 .068
M2 .802 .118 .280 .277 .082
M3 .694 .422 .061 .042 .151
M4 .626 .400 .216 .030 .166
Con1 .347 .565 .451 .146 .153
Con2 .293 .613 .427 .146 .104
Con3 .196 .836 .269 .084 .044
Con4 .161 .776 .328 .166 .092
Chang & Szu & Tu
The 17th International Conference on Electronic Business, Dubai, UAE, December 4-8, 201790
Supp1 .250 .133 .796 .012 .192
Supp2 .154 .342 .775 .098 .140
Supp3 .145 .302 .808 .139 .132
Supp4 .225 .311 .718 .225 .094
ITP1 .170 .135 .077 .829 .177
ITP2 .144 .115 .082 .854 .225
ITP3 .131 .095 .108 .860 .264
ITP4 .097 .068 .165 .820 .326
InterA1 .113 .077 .226 .365 .806InterA2 .130 .142 .087 .359 .802InterA3 .128 .074 .196 .297 .847a The bold values demonstrate each item's correlation with its own construct
Table 4: Correlations of constructs
ConstructMonitoring Consultancy Supplementary IT Portal
IS ContactPersonnel
M 0.735 a
Con 0.63 0.706
Supp 0.566 0.714 0.775
ITP 0.402 0.362 0.35 0.841
InterA 0.382 0.371 0.415 0.634 0.819a The bold values are the square roots of AVE for the defined constructs
Discriminant Function AnalysisThe research model and hypotheses are analyzed using the discriminant function analysis (DA), an appropriate technology for classifying cases into the values of a categorical dependent, usually a dichotomy (Hair, 1995). The interpretation and application of DA is considerably similar to that in logistic regression analysis. However, DA is preferred when the populations are normal with identical covariance matrices since the DA has greater statistical power than logistic regression (Press and Wilson, 1978). Box’s M test is conduced to test the assumption of the homogeneity of covariance matrices. The result indicates that the test is not significant (p > 0.01). Therefore, we conclude that the groups do not differ in their covariance matrices, thus meeting an assumption of DA (Table 5).
Discriminant analysis involves the following two steps: (1) an F test (Wilks’ lambda) is used to test whether the discriminant model as a whole is significant, and (2) if the F test shows significance, independent variables are assessed to point our those that contribute significantly to the model. To analyze the data, two discriminant models are formed. The first model (i.e., Model 1) is to test hypotheses relating core, core-supplementary and peripheral elements to the symbolic adoption of eHealth service. The sample include eHealth client that have symbolically reject (SJ status; n = 216) and symbolically accept (SA status; n = 442 eHealth service. The total sample size is 653. The second model (i.e., Model 2) is to determine which service elements are important in discriminating adopters and continual user. The samples include clients that have adopted. However, this is working in progress paper, we are still linking to explore more.
The 17th International Conference on Electronic Business, Dubai, December 4-8, 201791
Table 5: Summary of discriminant analysis
Independent variable Model 1 : (dependable variable : adoption reject and adoption )
Standardized Discriminant Univariate P level
coefficient loadings F ratio
Value Value Rank Value Value
Monitoring 0.853 0.924 1 64.887 0.000
Consultancy 0.237 0.707 2 37.988 0.000
Supplementary 0.157 0.609 3 28.13 0.000
IT Portal -0.147 0.150 4 1.719 0.190
IS Contact -0.255 0.119 5 1.071 0.301
Wilks' Lambda = 0.896; p = 0.000; Canonical R2 = 0.104,
Chi-square = 71.571 ; df = 5 Box's M = 4.645 (p=0.031)
Independent variable Model 2 : (dependable variable : usage and continue used )
Standardized Discriminant Univariate P level
coefficient loadings F ratio
Value Value Rank Value Value
Monitoring 0.567 0.873 1 26.974 0.000
Consultancy -0.112 0.655 4 15.180 0.000
Supplementary 0.463 0.792 2 22.217 0.000
IT Portal -0.041 0.541 5 10.378 0.001
IS Contact 0.348 0.673 3 16.035 0.000
Wilks' Lambda = 0.943; p = 0.000; Canonical R2 = 0.057,
Chi-square = 34.241 ; df = 5 Box's M = 6.536 (p=0.011 )
RESEARCH CONTRIBUTIONS AND CONCLUDING REMARKSIn this study, our contributions are twofold. Based upon our assessment in extant IS literature, this study is one of the first toanalyze eHealth service offerings at the portfolio level. In particular, we look into patients’ ex-ante and post adoption phrases, and distinguish caring components from IT components in eHealth service. We are thus able to ascertain that which eHealth service components may weigh more at which adoption phrase. In prior literature, while several studies have provided great insight into electronic service design, most of them pertain to IT artifact or system design, such as the desired functionality in electronic government websites and electronic health records (Tan et al., 2013; Rajiv & Tan, 2016). In addition, their focused outcomes were either in the pre-adoption phrase only or the post-adoption phrase only, instead of the comparison between the
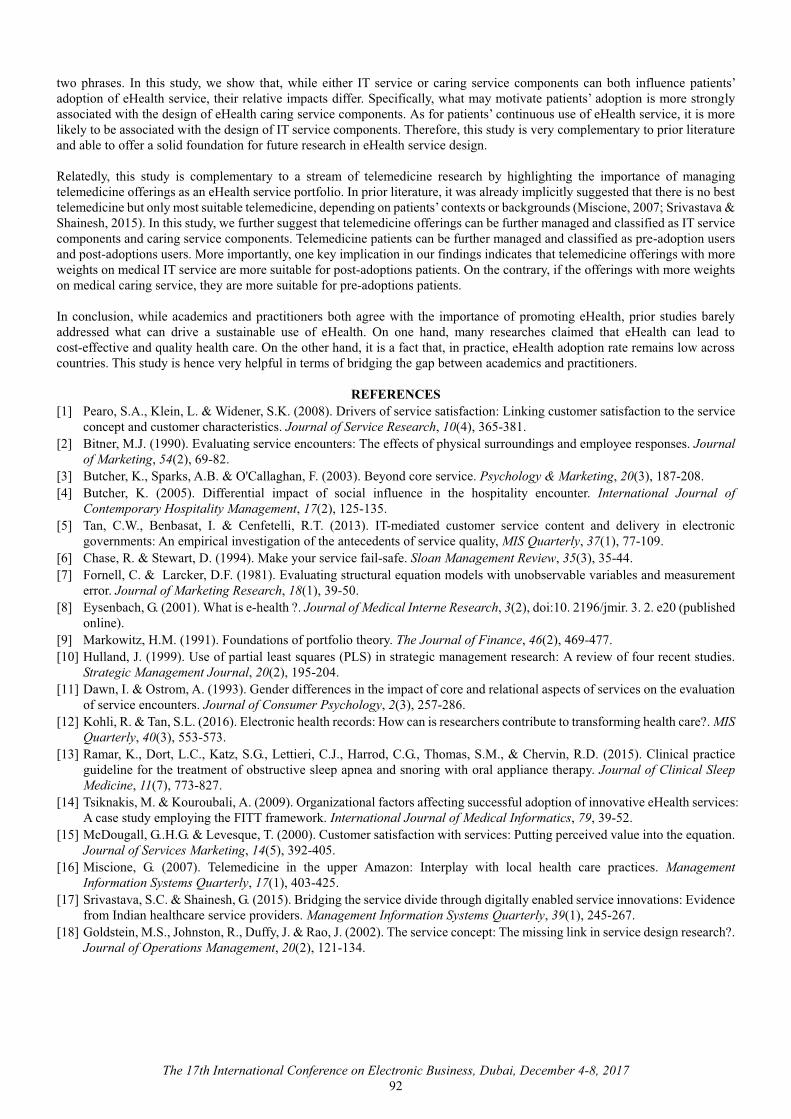
The 17th International Conference on Electronic Business, Dubai, December 4-8, 201792
two phrases. In this study, we show that, while either IT service or caring service components can both influence patients’ adoption of eHealth service, their relative impacts differ. Specifically, what may motivate patients’ adoption is more stronglyassociated with the design of eHealth caring service components. As for patients’ continuous use of eHealth service, it is more likely to be associated with the design of IT service components. Therefore, this study is very complementary to prior literature and able to offer a solid foundation for future research in eHealth service design.
Relatedly, this study is complementary to a stream of telemedicine research by highlighting the importance of managing telemedicine offerings as an eHealth service portfolio. In prior literature, it was already implicitly suggested that there is no best telemedicine but only most suitable telemedicine, depending on patients’ contexts or backgrounds (Miscione, 2007; Srivastava & Shainesh, 2015). In this study, we further suggest that telemedicine offerings can be further managed and classified as IT service components and caring service components. Telemedicine patients can be further managed and classified as pre-adoption users and post-adoptions users. More importantly, one key implication in our findings indicates that telemedicine offerings with more weights on medical IT service are more suitable for post-adoptions patients. On the contrary, if the offerings with more weights on medical caring service, they are more suitable for pre-adoptions patients.
In conclusion, while academics and practitioners both agree with the importance of promoting eHealth, prior studies barely addressed what can drive a sustainable use of eHealth. On one hand, many researches claimed that eHealth can lead to cost-effective and quality health care. On the other hand, it is a fact that, in practice, eHealth adoption rate remains low across countries. This study is hence very helpful in terms of bridging the gap between academics and practitioners.
REFERENCES[1] Pearo, S.A., Klein, L. & Widener, S.K. (2008). Drivers of service satisfaction: Linking customer satisfaction to the service
concept and customer characteristics. Journal of Service Research, 10(4), 365-381.[2] Bitner, M.J. (1990). Evaluating service encounters: The effects of physical surroundings and employee responses. Journal
of Marketing, 54(2), 69-82.[3] Butcher, K., Sparks, A.B. & O'Callaghan, F. (2003). Beyond core service. Psychology & Marketing, 20(3), 187-208. [4] Butcher, K. (2005). Differential impact of social influence in the hospitality encounter. International Journal of
Contemporary Hospitality Management, 17(2), 125-135.[5] Tan, C.W., Benbasat, I. & Cenfetelli, R.T. (2013). IT-mediated customer service content and delivery in electronic
governments: An empirical investigation of the antecedents of service quality, MIS Quarterly, 37(1), 77-109. [6] Chase, R. & Stewart, D. (1994). Make your service fail-safe. Sloan Management Review, 35(3), 35-44. [7] Fornell, C. & Larcker, D.F. (1981). Evaluating structural equation models with unobservable variables and measurement
error. Journal of Marketing Research, 18(1), 39-50. [8] Eysenbach, G. (2001). What is e-health ?. Journal of Medical Interne Research, 3(2), doi:10. 2196/jmir. 3. 2. e20 (published
online). [9] Markowitz, H.M. (1991). Foundations of portfolio theory. The Journal of Finance, 46(2), 469-477. [10] Hulland, J. (1999). Use of partial least squares (PLS) in strategic management research: A review of four recent studies.
Strategic Management Journal, 20(2), 195-204. [11] Dawn, I. & Ostrom, A. (1993). Gender differences in the impact of core and relational aspects of services on the evaluation
of service encounters. Journal of Consumer Psychology, 2(3), 257-286. [12] Kohli, R. & Tan, S.L. (2016). Electronic health records: How can is researchers contribute to transforming health care?. MIS
Quarterly, 40(3), 553-573. [13] Ramar, K., Dort, L.C., Katz, S.G., Lettieri, C.J., Harrod, C.G., Thomas, S.M., & Chervin, R.D. (2015). Clinical practice
guideline for the treatment of obstructive sleep apnea and snoring with oral appliance therapy. Journal of Clinical Sleep Medicine, 11(7), 773-827.
[14] Tsiknakis, M. & Kouroubali, A. (2009). Organizational factors affecting successful adoption of innovative eHealth services: A case study employing the FITT framework. International Journal of Medical Informatics, 79, 39-52.
[15] McDougall, G..H.G. & Levesque, T. (2000). Customer satisfaction with services: Putting perceived value into the equation. Journal of Services Marketing, 14(5), 392-405.
[16] Miscione, G. (2007). Telemedicine in the upper Amazon: Interplay with local health care practices. Management Information Systems Quarterly, 17(1), 403-425.
[17] Srivastava, S.C. & Shainesh, G. (2015). Bridging the service divide through digitally enabled service innovations: Evidence from Indian healthcare service providers. Management Information Systems Quarterly, 39(1), 245-267.
[18] Goldstein, M.S., Johnston, R., Duffy, J. & Rao, J. (2002). The service concept: The missing link in service design research?. Journal of Operations Management, 20(2), 121-134.

Tarhini, A. & Srour, J.F. & Badr, N.G. (2016). Emergency management system design for accurate data: A case study. In Proceedings of The 17th International Conference on Electronic Business (pp. 93-98). ICEB, Dubai, UAE, December 4-8.
Tarhini, Srour & Badr
The 17th International Conference on Electronic Business, Dubai, UAE, December 4-8, 201793
Emergency Management System Design for Accurate Data: A Case Study
Abbas Tarhini*, Department of Information Technology and Operations Management, Adnan Kassar School of Business, Lebanese American University, Beirut, Lebanon, [email protected]
F. Jordan Srour, Department of Information Technology and Operations Management, Adnan Kassar School of Business, Lebanese American University, Beirut, Lebanon, [email protected]
Nabil Georges Badr, Grenoble Graduate School of Business, Grenoble, France, [email protected]
ABSTRACT In any city – smart or not – emergency response is a critical service. In smart cities, the use of technology to manage access to and dispatching of emergency vehicles is particularly important. However, when a system must manage processes spanning multiple computers, clock drift becomes a prominent issue. We show the impact that clock drift can have in a prototype emergency management dispatch system along with a case-study illustrating design techniques that can remedy this issue.
Keywords: Emergency management dispatch; time synchronization; clock drift._____________________*Corresponding author
INTRODUCTIONCurrently, 54% of the world’s population lives in cities. According to the UN’s World Urbanization Prospects report, 66% of the world’s population is expected to reside in urban areas, representing an additional 2.5 Billion residents of cities, by 2050 (United Nations, 2014). With numbers as staggering as these the need for smart cities that exploit IT services to connect communities with the goal of improving life is all too apparent (Washburn, 2010). A chief tenet of smart city design is the connection of citizens to city services and infrastructure. One such service is emergency response. With the growth of urban populations, the growth of emergency response must also keep pace.
Emergency medical services are about saving people's lives and reducing the rate of mortality and morbidity from accidents in civilian settings. The onus remains on Emergency Management Systems (EMS) to provide effective urgent medical care. An EMS is expected to observe each of the six “points” of “the star of life” (Zatz et al., 1992). This requires capturing data from (1)the point of detection of an incident, (2) the report of the incident to professional dispatch; (3) the response of the first responders; (4) the on scene care; (5) both the transportation and care in transit; and finally (6) the transfer to definitive care, such as a hospital, clinic or other facility. If any one of the time stamps associated with the star of life is made incorrectly, the EMS loses visibility into the performance of this critical smart city service.
This paper highlights lessons learned from a case study within a densely populated urban environment. In this setting we identify the impact of time synchronization issues in the Emergency Management Dispatch (EMD) system design on the ability to accurately record time related data. Through this case study we show how specific changes to an EMD system correlate to improvements in capturing time related data.
BACKGROUNDAlthough there are a number of design principles guiding EMD system design, few highlight basic principles of software engineering and user interface design methodologies (Miller, 2017; Salasznyk et al., 2006). In fact, several researchers argue that no universal guidelines on EMD System design exist as emergency management systems depend on the local situation(Chumer et al., 2004). Nevertheless, a well-designed EMD system must coexist with smart city requirements and be capable of providing efficient and effective communication and coordination of emergency response actions (Alazawi et al., 2014; Chen et al., 2007).
In their work, Chumer et al. (2004), propose a framework for system design and development and present eight general design principles for emergency management systems that are essential for an effective EMD system design. However, taking into consideration the EMS stakeholders and the context of their operations, the dynamic development of such systems must be coupled with methodological approaches (Chen et al., 2008; Van de Walle & Turoff, 2008; Voss & Wagner, 2010). These researchers specify a set of phases to be included in the design of any emergency management system. In these phases, that are much like the arms in the “star of life”, the response phase is a critical phase where work may be delayed because of limited or contradictory information. Thus, the authors call for integrating information from different sources, using several types of media. Bringing together multiple sources heightens the need to accurately record time. This need is echoed by Salasznyk and Lee (2006), who were concerned with the time needed for each of the phases of the response trajectory as this affects the response time overall. Admittedly, there is controversy regarding the use of response time as a metric, nevertheless a recent

Tarhini, Srour & Badr
The 17th International Conference on Electronic Business, Dubai, UAE, December 4-8, 201794
study by White et al. (2011) indicates that reducing the response time by one minute can increase the number of lives saved by six percent.
As response time is ultimately specified as the difference between two time stamps, this calculation will only be as accurate as the time stamps themselves. Even when initially set accurately, real clocks will differ after some amount of time due to clock drift or skew, caused by clocks counting time at slightly different rates. Thus, clocks in a distributed system must synchronize to the same “global” time.
In general, there are two popular methods for physical clock synchronization (Barroso et al., 2011). The first is the internal clock synchronization, where all computer clocks in a system are synchronized with one another away from the global reference clock time. The second method is the external clock synchronization, where all computer clocks in a system are synchronized with an external reference clock, like the Coordinated Universal Time (UTC) signal.
Furthermore, as physical time is not perfectly synchronized, the Lamport logical time clocks (Lamport, L. (1978) is another mechanism for synchronization based on the causal order of events occurring at different machines (“happened-before relation” ). Two events occurring at the same machine happen in the order in which they are observed by the machine. A Lamport logical clock is a monotonically increasing software counter which is not referenced to any physical clock. Each process keeps its own logical clock which it uses to apply so-called Lamport timestamps to events. Finally, the oldest technique for time synchronization in a network is the Network Time Protocol (NTP) which has been under continual development and updating since 1979 (Mills et al., 2010). The NTP is suitable for externally synchronizing machines to UTC via the internet. It works based on a hierarchical, peer-to-peer structure of computers and servers organized into strata with the top level strata containing a set of high-precision reference clocks. Further, it enables clients to resynchronize sufficiently frequently to offset typical hardware drift rates and provides a reliable service tolerating lengthy losses of connectivity.
To ensure the integrity of time stamps within EMD systems, synchronizing all computers to the same clocks using the same synchronization protocols is a must. The remainder of this paper uses a prototype EMD system to understand the extent of timesynchronization related data corruption in response time data under two different time synchronization protocols.
CASE STUDY SYSTEMThe ambulance response service at the heart of this case study was conceived to provide insight on vital system information including emergency response times by time of day, region, and type of emergency. Relying mostly on paper based record keeping, the EMD management team was not equipped to rapidly analyze the data for timely decisions. In 2011, the system was overhauled to include a centralized dispatch center functionality with an information system designed to provide data entry for call taking protocols, mission management and patient care records (Badr, 2016). One of the objectives of this solution was to build a source of reliable data for performance reporting and decision making for operations improvement.
As implemented, the component of mission management comprises a dashboard for tracking mission progress. The dashboard represents data input by the dispatcher showing mission progress timing milestones that are loosely mapped to the stages of the blue star of life. Those milestones are: record creation, scheduling of ambulance services, notification to the ambulance station, departure of the ambulance, arrival at the scene, departure from the scene, arrival at the hospital or care facility, patient hand over, and ambulance available again.
The basic architecture of the system consists of a web-based interface that emphasizes principles of access security, resiliency and ease of use expected to support input, reporting and user interface in both English and the native language of the system locale. The call center infrastructure consists of 12-14 workstations taking calls and logging them into a system.
The workstations for data entry at the call center are physically in a different location than the corresponding application anddatabase servers. The workstations and servers are separated by a set of firewalls and connected via a Virtual Private Network (VPN). These two end points may incur delay in synchronizing their time. To achieve time synchronization over the network, our case used the NTP. As a time source, the Global Positioning System (GPS) is used for central clock synchronization. Although GPS time signals are accurate, clock skew still introduces time stamp issues into database records. The more computers involved in a system, the more likely that skew will be reflected in the data.
When first established, the EMD system followed the process of time stamping and synchronization as depicted in Table 1. The table specifies the component, the time reference to which that component is synched, and a time stamp ID associated with the component. As shown in Table 1, at regular intervals, the application and database servers set their clock to the referencetime tS1 of the NTP Time Server. When a user/agent logs into a workstation session, the time stamp is reset to the Application Server time, thus at the workstation t = tS3. When opening a new call on the system, a key database record is created with a time stamp of tR1 which is equal to the database clock time at that instance, tS2. In this case, if the server clock is skewed when the record is created, but gets reset subsequently, then a timing error could be introduced. As the call progresses, allstatuses and subsequent records are stamped with the workstation time tRn as it is the workstation that initiates the data entry request, tRn = t\*.
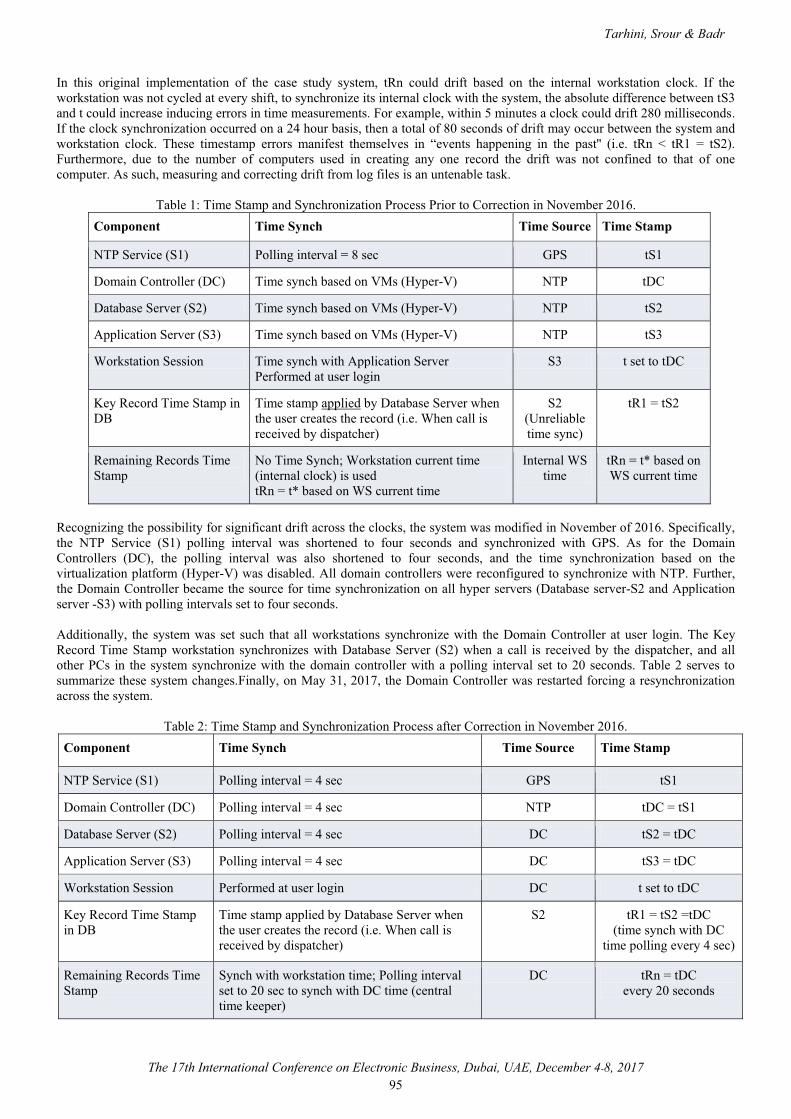
Tarhini, Srour & Badr
The 17th International Conference on Electronic Business, Dubai, UAE, December 4-8, 201795
In this original implementation of the case study system, tRn could drift based on the internal workstation clock. If the workstation was not cycled at every shift, to synchronize its internal clock with the system, the absolute difference between tS3 and t could increase inducing errors in time measurements. For example, within 5 minutes a clock could drift 280 milliseconds. If the clock synchronization occurred on a 24 hour basis, then a total of 80 seconds of drift may occur between the system and workstation clock. These timestamp errors manifest themselves in “events happening in the past'' (i.e. tRn < tR1 = tS2). Furthermore, due to the number of computers used in creating any one record the drift was not confined to that of one computer. As such, measuring and correcting drift from log files is an untenable task.
Table 1: Time Stamp and Synchronization Process Prior to Correction in November 2016.Component Time Synch Time Source Time Stamp
NTP Service (S1) Polling interval = 8 sec GPS tS1
Domain Controller (DC) Time synch based on VMs (Hyper-V) NTP tDC
Database Server (S2) Time synch based on VMs (Hyper-V) NTP tS2
Application Server (S3) Time synch based on VMs (Hyper-V) NTP tS3
Workstation Session Time synch with Application Server Performed at user login
S3 t set to tDC
Key Record Time Stamp in DB
Time stamp applied by Database Server when the user creates the record (i.e. When call is received by dispatcher)
S2 (Unreliable time sync)
tR1 = tS2
Remaining Records Time Stamp
No Time Synch; Workstation current time (internal clock) is usedtRn = t* based on WS current time
Internal WS time
tRn = t* based on WS current time
Recognizing the possibility for significant drift across the clocks, the system was modified in November of 2016. Specifically, the NTP Service (S1) polling interval was shortened to four seconds and synchronized with GPS. As for the Domain Controllers (DC), the polling interval was also shortened to four seconds, and the time synchronization based on the virtualization platform (Hyper-V) was disabled. All domain controllers were reconfigured to synchronize with NTP. Further, the Domain Controller became the source for time synchronization on all hyper servers (Database server-S2 and Application server -S3) with polling intervals set to four seconds.
Additionally, the system was set such that all workstations synchronize with the Domain Controller at user login. The KeyRecord Time Stamp workstation synchronizes with Database Server (S2) when a call is received by the dispatcher, and all other PCs in the system synchronize with the domain controller with a polling interval set to 20 seconds. Table 2 serves to summarize these system changes.Finally, on May 31, 2017, the Domain Controller was restarted forcing a resynchronization across the system.
Table 2: Time Stamp and Synchronization Process after Correction in November 2016.Component Time Synch Time Source Time Stamp
NTP Service (S1) Polling interval = 4 sec GPS tS1
Domain Controller (DC) Polling interval = 4 sec NTP tDC = tS1
Database Server (S2) Polling interval = 4 sec DC tS2 = tDC
Application Server (S3) Polling interval = 4 sec DC tS3 = tDC
Workstation Session Performed at user login DC t set to tDC
Key Record Time Stamp in DB
Time stamp applied by Database Server when the user creates the record (i.e. When call is received by dispatcher)
S2 tR1 = tS2 =tDC(time synch with DC
time polling every 4 sec)
Remaining Records Time Stamp
Synch with workstation time; Polling interval set to 20 sec to synch with DC time (central time keeper)
DC tRn = tDCevery 20 seconds
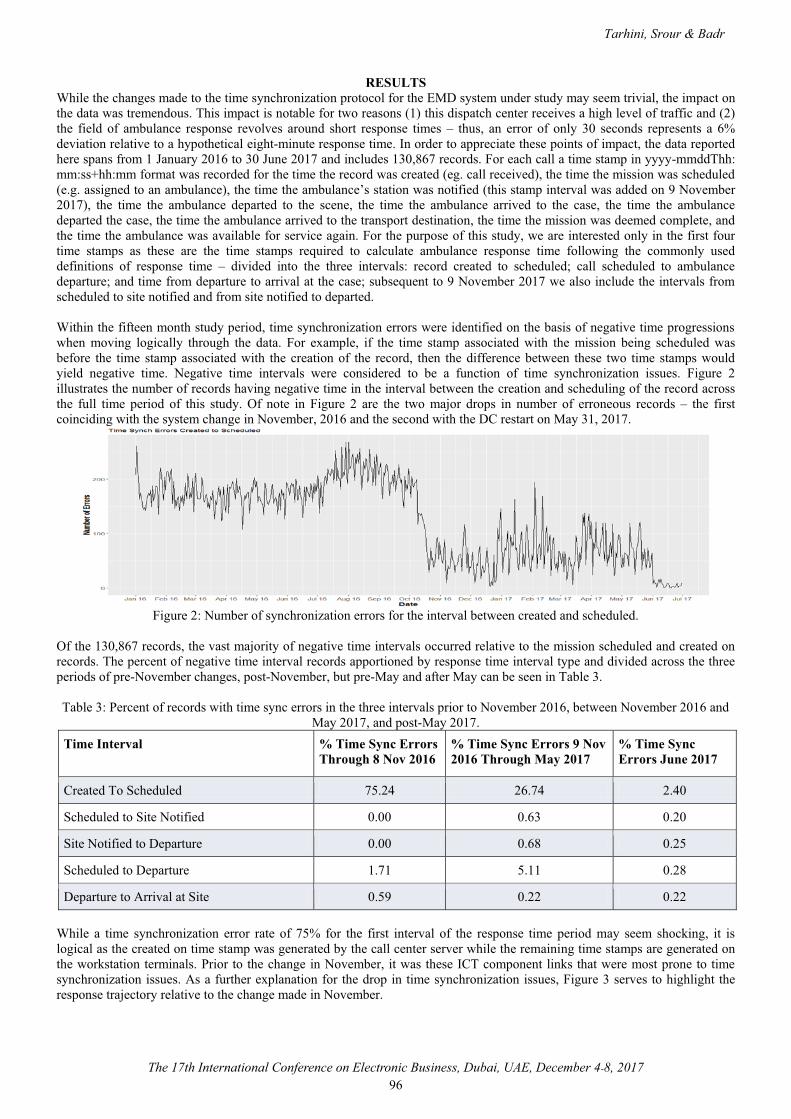
Tarhini, Srour & Badr
The 17th International Conference on Electronic Business, Dubai, UAE, December 4-8, 201796
RESULTSWhile the changes made to the time synchronization protocol for the EMD system under study may seem trivial, the impact on the data was tremendous. This impact is notable for two reasons (1) this dispatch center receives a high level of traffic and (2)the field of ambulance response revolves around short response times – thus, an error of only 30 seconds represents a 6% deviation relative to a hypothetical eight-minute response time. In order to appreciate these points of impact, the data reported here spans from 1 January 2016 to 30 June 2017 and includes 130,867 records. For each call a time stamp in yyyy-mmddThh: mm:ss+hh:mm format was recorded for the time the record was created (eg. call received), the time the mission was scheduled (e.g. assigned to an ambulance), the time the ambulance’s station was notified (this stamp interval was added on 9 November 2017), the time the ambulance departed to the scene, the time the ambulance arrived to the case, the time the ambulance departed the case, the time the ambulance arrived to the transport destination, the time the mission was deemed complete, andthe time the ambulance was available for service again. For the purpose of this study, we are interested only in the first four time stamps as these are the time stamps required to calculate ambulance response time following the commonly used definitions of response time – divided into the three intervals: record created to scheduled; call scheduled to ambulance departure; and time from departure to arrival at the case; subsequent to 9 November 2017 we also include the intervals from scheduled to site notified and from site notified to departed.
Within the fifteen month study period, time synchronization errors were identified on the basis of negative time progressionswhen moving logically through the data. For example, if the time stamp associated with the mission being scheduled was before the time stamp associated with the creation of the record, then the difference between these two time stamps would yield negative time. Negative time intervals were considered to be a function of time synchronization issues. Figure 2illustrates the number of records having negative time in the interval between the creation and scheduling of the record across the full time period of this study. Of note in Figure 2 are the two major drops in number of erroneous records – the first coinciding with the system change in November, 2016 and the second with the DC restart on May 31, 2017.
Figure 2: Number of synchronization errors for the interval between created and scheduled.
Of the 130,867 records, the vast majority of negative time intervals occurred relative to the mission scheduled and created on records. The percent of negative time interval records apportioned by response time interval type and divided across the three periods of pre-November changes, post-November, but pre-May and after May can be seen in Table 3.
Table 3: Percent of records with time sync errors in the three intervals prior to November 2016, between November 2016 and May 2017, and post-May 2017.
Time Interval % Time Sync Errors Through 8 Nov 2016
% Time Sync Errors 9 Nov 2016 Through May 2017
% Time Sync Errors June 2017
Created To Scheduled 75.24 26.74 2.40
Scheduled to Site Notified 0.00 0.63 0.20
Site Notified to Departure 0.00 0.68 0.25
Scheduled to Departure 1.71 5.11 0.28
Departure to Arrival at Site 0.59 0.22 0.22
While a time synchronization error rate of 75% for the first interval of the response time period may seem shocking, it is logical as the created on time stamp was generated by the call center server while the remaining time stamps are generated onthe workstation terminals. Prior to the change in November, it was these ICT component links that were most prone to time synchronization issues. As a further explanation for the drop in time synchronization issues, Figure 3 serves to highlight the response trajectory relative to the change made in November.

Tarhini, Srour & Badr
The 17th International Conference on Electronic Business, Dubai, UAE, December 4-8, 201797
Figure 3: Time trajectory for ambulance response mapped against changes in time synching protocol made in November 2016.
DISCUSSION AND CONCLUSIONA dependable time keeper is a key component of any system that relies on data for decision making. In our case the time keeper is the NTP server that keeps time with a GPS source. The system time synchronization agent has been designated as the “Domain Controller” that makes sure it is closely tracking to the NTP. The downstream servers participating in the domain are then updated through a polling mechanism initiated by each of the components.
Before the changes were made, the polling mechanism was not deterministic and was left up to each server to update their time based on how busy they were in processing other computing requests. Additionally, the virtual machines within the EMDsystem were synchronizing via software synchronization (Hyper-V) which is based on logical clock synchronization. As a result, we often saw ambiguous event ordering where time values assigned to events were not necessarily the same as theactual times at which they occurred. Since the actual time is important in EMD systems, the system components must synchronize with a physical clock. Accordingly, the system synchronization was based on the GPS timing through the NTP Service. Once the changes were performed and the server configuration changed to poll at a specific interval of 4 seconds, the errors reduced by 70%. Hence, a robust time keeping protocol is one that is definitive and based on an architecture that dependably polls the time source for time keeping that is as accurate as possible.In our case, once the time keeping was adjusted, the system did not converge to a low error state until the end of May when the Domain controller (system time synchronization agent) reset the system back to the same starting point.
The sharp decrease (from 75% to 2%) in erroneous records is critical when considering the impact of reporting data from anEMD system. There are two outcomes that such inaccurate data might yield: 1) an analyst reporting response time may choose to exclude all records that exhibit a non-logical negative time interval or 2) the analyst may unwittingly include all records with a negative time interval. If the first outcome is realized then the response times reported will be consistently biased and may skew the decision making of city managers. If the second outcome is realized then the reported average response timeswill be artificially low leading ambulance service providers to ignore potentially important response time improvements that may be necessary. As our case illustrates, the polling intervals for synchronization have a vital impact on keeping the correct clock time and reducing drift. We also show that distributed subsystems are more vulnerable to time keeping errors. The persistence of some errors in the system despite the changes made to the time synchronization protocols serves to highlight the scope of possible errors within a highly networked smart city system. Smart city ecosystems clearly require a robust architecture with a complex time keeping protocol to maintain synchronization between systems and subsystems to minimizethe effect of clock drift. Hence, on a macro level, this paper supports an essential role for central time keeping in smart cities especially where systems and subsystems are to be integrated, exchanging vital, time sensitive data.
ACKNOWLEDGEMENTThe authors gratefully acknowledge the Lebanese Red Cross for their interpretation of and comments on the findings in this paper
REFERENCES[1] Alazawi, Z., Alani, O., Abdljabar, M. B., Altowaijri, S., & Mehmood, R. (2014). A smart disaster management system for
future cities. In Proceedings of the 2014 ACM international workshop on Wireless and Mobile Technologies for Smart Cities (pp. 1-10). ACM.
Tarhini, Srour & Badr
The 17th International Conference on Electronic Business, Dubai, UAE, December 4-8, 201798
[2] Badr, N. G. (2016). Could ICT be harnessed for prehospital emergency medical services? In Proceedings of the International Joint Conference on Biomedical Engineering Systems and Technologies (pp. 269-276). SCITEPRESS-Science and Technology Publications, Lda.
[3] Barroso, L.A., Clidaras, J., Hölzle, U, (2013). The datacenter as a computer: An introduction to the design of warehouse-scale machines. Synthesis Lectures on Computer Architecture, 8(3), 1-154.
[4] Chen, R., Sharman, R., Rao, H. & Upadhyaya, S. (2007). Design principles for critical incident response systems. Information Systems and E-Business Management, 5(3), 201-227.
[5] Chen, R., Sharman, R., Rao, H. & Upadhyaya, S. (2008). Coordination in emergency response management. Communications of the ACM, 51(5), 66–73.
[6] Turoff, M., Chumer, M., van de Walle, B., & Yao, X. (2004). The design of a dynamic emergency response management information system (DERMIS). Journal of Information Technology Theory and Applications, 5(4), 1.-35
[7] Lamport, L. (1978). Time, clocks, and the ordering of events in a distributed system. Communications of the ACM, 21(7), 558–565. doi:10.1145/359545.359563.
[8] Miller, A. N., Sellnow, T., Neuberger, L., Todd, A., Freihaut, R., Noyes, J., & Gamhewage, G. (2017). A systematic review of literature on effectiveness of training in emergency risk communication. Journal of Health Communication, 22(7), 612-629.
[9] Mills, D., Martin, J., Burbank, J., & Kasch, W. (2010). Network time protocol version 4: Protocol and algorithms specification (No. RFC 5905). DOI 10.17487/RFC5905, June 2010. Retrieved from https://www.rfc-editor.org/info/rfc5905 (October 8, 2017).
[10] Salasznyk, P. P. & Lee, E. E. (2006). A systems view of data integration for emergency response. International Journal of Emergency Management, 3(4), 313-331.
[11] United Nations (2015). World urbanization prospects: The 2014 revision. Department of Economic and Social Affairs, Population Division (ST/ESA/SER.A/366). Retrieved from https://esa.un.org/unpd/wup/publications/files/wup2014-report.pdf (October 8, 2017).
[12] Van de Walle, B. & Turoff, M. (2008). Decision support for emergency situations. Information Systems and E- Business Management, 6, 295-316.
[13] Voss, M., & Wagner, K. (2010). Learning from (small) disasters. Natural Hazards, 55(3), 657-669.[14] Washburn, D., Sindhu, U., Balaouras, S., Dines, R. A., Hayes, N. M., & Nelson, L. E. (2010). Helping CIOs Understand
“Smart City” Initiatives: Defining the Smart City, Its Drivers, and the Role of the CIO. Cambridge, MA: Forrester Research. Inc.
[15] White, J., Thompson, C., Turner, H., Dougherty, B. & Schmidt, D.C. (2011). WreckWatch: Automatic Traffic accident detection and notification with smartphones. Mobile Networks and Applications, 16, 285-303.
[16] Zatz, A. (1992). Star of life. Rescue-EMS Magazine, July/August. Retrieved from www.angelfire.com/co/fantasyfigures/staroflife.html (October 8, 2017).
Wu, P.S. (2017). Fintech trends relationships research: Abibliometric citation meta-analysis. In Proceedings of The 17th International Conference on Electronic Business (pp. 99-105). ICEB, Dubai, UAE, December 4-8.
Wu
The 17th International Conference on Electronic Business, Dubai, UAE, December 4-8, 201799
Fintech Trends Relationships Research: A Bibliometric Citation Meta-Analysis
Pei-Shan Wu*, National Chengchi University, Taiwan, [email protected]
ABSTRACTThis paper presents a review among how scholarly research on Fintech trends relationships has evolved over the past years by conducting a bibliometric citation. This literature analysis was based on the publication journals and articles in the ISI Web of Science databases. We show the impact of cited journals, key articles and outline possible future research avenues. Also, we map how the top publications are related in terms of their citation relationships and identify six different research fields, or lines of enquiry: (1) Payments, (2) Insurance, (3) Deposit & Lending, (4) Capital Raising, (5) Investment Management, (6) MarketProvisioning. The study explores rankings of fintech-related journals list the first six journals had contributed eighty percentage of published papers, and concerned with the roles of information and communication technologies in the economy and society. Focusing on the research frontiers in finance, our paper identifies emerging research trends. We highlight possible pathways for researchers to build on existing knowledge and pursue opportunities for innovative and exciting new research contributing to an expansion of the research frontiers.
Keywords: Bibliometric, Fintech, Financial technology, Digitization, Innovation, Financial services industry._____________________*Corresponding author
INTRODUCTIONAlong with more and faster accumulation of digitization on financial services industry impact, financial technology and the newer “Fintech” issues are attracting more attention (WEF, 2015). One major reason is that financial service and products are almost based on information, and the other reason is that most processes are almost entirely implemented without any physicalinteraction such as for example online payment or stock trading. Due to the recent development in the ongoing process of digitization, the fundamental reorganization of the financial services value chain with new business models (e.g., robo-advisors). The term ‘‘Fintech’’ is a contraction of ‘‘financial technology’’ and was most probably first mentioned in the early 1990s by Citicorp’s chairman John Reed in the context of a newly founded ‘‘Smart Card Forum’’ (Kutler, 1993). There are three areas of recent Fintech applications in the financial services industry can be differentiated which reflect the development along five phases over the last decades. The first area of internal digitization (phases 1-3) use was focused on internal processes, such as payment transactions, or portfolio management. In the fourth phase of provider-oriented digitization (phase 4), financial service providers focused on the integration of standardize processes and application functions. Especially forward to the fifth phase of customer-oriented digitization (phase 5), Fintech application redefine today’s product-centered logic towards new ecosystems. Individual channels may become obsolete with hybrid and overlapping forms of interaction based customer processes as the center of financial services design (Nüesch et al., 2015). Today omni-channel is a cross-channel that contends customer values the ability to be in constant contact with a company through multiple avenues at the same time. For example, electronic wallets which including not only payment, but also the option to collect, store and spend loyalty points and other personal data. The evolution of the financial services included the peer-to-peer business development as nonfinancial service providers from outside the industry. Table 1 summarizes the evolution of the digitization of the financial services industry (Arner, 2015).
Table 1: Financial services industry digitization versus Financial technologyPhases
characteristicsPhase 1: until
1960Phase 2:
1960-1980Phase 3:
1980-2010Phase 4:
2010-2020Phase 5:
from 2020Strategy focus Single customer
channelTwo customerchannels
Multi customerchannels
Cross customer channels
Hybrid customer channels
Organizationfocus
Support processes Back-officeprocesses
Front-officeprocesses
Provider processes Customer processes
Systems focus No systemsintegration
Partial internalsystems integration
Internal systemsintegration
External financial services provider systems integration
External non-financial services provider systems integration
The term of bibliometric was first coined by Fairthorne (1969) and Pritchard (1969). Bibliometric is one of the most systematic measures for analyzing literature, and most often use quantitative approaches but not exclusively. Like many fields of research, bibliometric methods have been widely applied to assess in the field of finance has been reported although in limited numbers. However, publications citation is related to the categories of payments, insurance, deposit and Lending, capital raising, investment management and market provisioning, but no bibliometric analysis has focused on Fintech trends literature. By looking at Fintech relative publication metadata, linked between publications, and even the publication texts themselves, we can extract information about the characteristics, potential impact and offer multiple, different perspectives on a set of publications.

Wu
The 17th International Conference on Electronic Business, Dubai, UAE, December 4-8, 2017100
How is the distribution of the subject-specific journals and articles revealed in the literature? What are the most popular author countries, research areas, journal names, type and citation count of published journal articles? Does the literature analysis of the newly developed Fintech trend subject reveal something related to the Fintech subject? These are research questions to be addressed in this paper.
The aim of this study was to use bibliometric citation analysis to answer the following questions: (1) which journal contribute the most to the Fintech trend literature and how has the output evolved over the 3-year period between 2015 and 2017, (2) which WEF categories have higher journal paper after the articles mapping the WEF category.
METHODMany scholars (Hood & Wilson, 2001; Osareh, 1996a, 1996b; Tsay, 2005) have recognized three major laws in bibliometrics. According to Hood and Wilson (2001), the earliest of these is Lotka’s Law (Lotka, 1926) which provides a relationship between authors and papers. Bradford’s Law (Bradford, 1934) deals with the problem of the scatter of papers on a scientific subject through the scientific journals. Zipf’s Law (Zipf, 1949) is concerned with the word frequency or occurrences.
Therefore, articles with keyword of Fintech-related (in the title, abstract and author keywords of the article) from databases of SSCI (Social Sciences Citation Index) databases were collected for analysis. Since the first article found was published in 2015, the time span for the literature analysis is set to 2015-2017.
There were two major sources of databases for bibliometric studies, Web of Science (WoS) and Scopus. For more than 40 years, the Institute for Scientific Information (ISI, now part of Thomson Reuters) produced the only available bibliographic databases from which bibliometricians could compile large-scale bibliometric indicators. Thomson’s databases - the SCI (Expanded), the SSCI and the AHCI, then regrouped under the WoS - were the major sources of bibliometric data until 2004, when Scopus was launched by the publisher Reed Elsevier (Archambault, Cambell, Gingras & Larivière, 2009). A lot of scholars compared with these two databases for several papers (Bosman, Mourik, Rasch, Sieverts & Verboeff, 2006; Falagas, 2008; Gavel & Iselid, 2008).
These two sources of databases also offer robust tools for measuring science at the country level. Due to its representation, this paper uses the older one - WoS - as the major source of bibliometric databases to study the literature distribute in financial technology. The collected literature data were analyzed based on dimensional analyses of article count by cited journal, keyword, research area and journal name were conducted to observe various aspects of the literature analyses.
For the fintech subject, the compliance examination was not conducted because of the lack of enough journals and articles to reveal a meaningful mathematical pattern. Only short-term analyses were conducted and part of them were compared with those for fintech subject to observe their literature linkage.
RESULTSFintech is an economic industry composed of companies that use technology to make financial services more efficient. Financial technology companies are generally startups founded with the purpose of disrupting incumbent financial systems and corporations that rely less on software.
Rankings of fintech-related journals on total citations Table 2 lists the fourteen journals in ISI Web of Science with the greatest number of total citations, ranked from highest to lowest. The first six journals had contributed eighty percentage of published papers, with 96; 72; 70; 51; 50 and 42 total citations, respectively. Approximately one-third of the total citations for first two journals are Environment and Planning A and Telecommunications Policy, which focuses on urban and regional issues, and concerned with the roles of information and communication technologies (ICT) in the economy and society.
Overall citations of Fintech-related papers are all in business and information engineering fields. The few field on the journal of financial studies and financial analysis. Most of Fintech-related papers is emerging financial application and uses in the actual service, and has started to be used for broader applications of technology in the space - to front-end consumer products, to new entrants competing with existing players, and even to new paradigms such as Bitcoin. The term is used starting from 2014, andthe National Digital Research Centre in Dublin, Ireland defines financial technology as innovation in financial services.
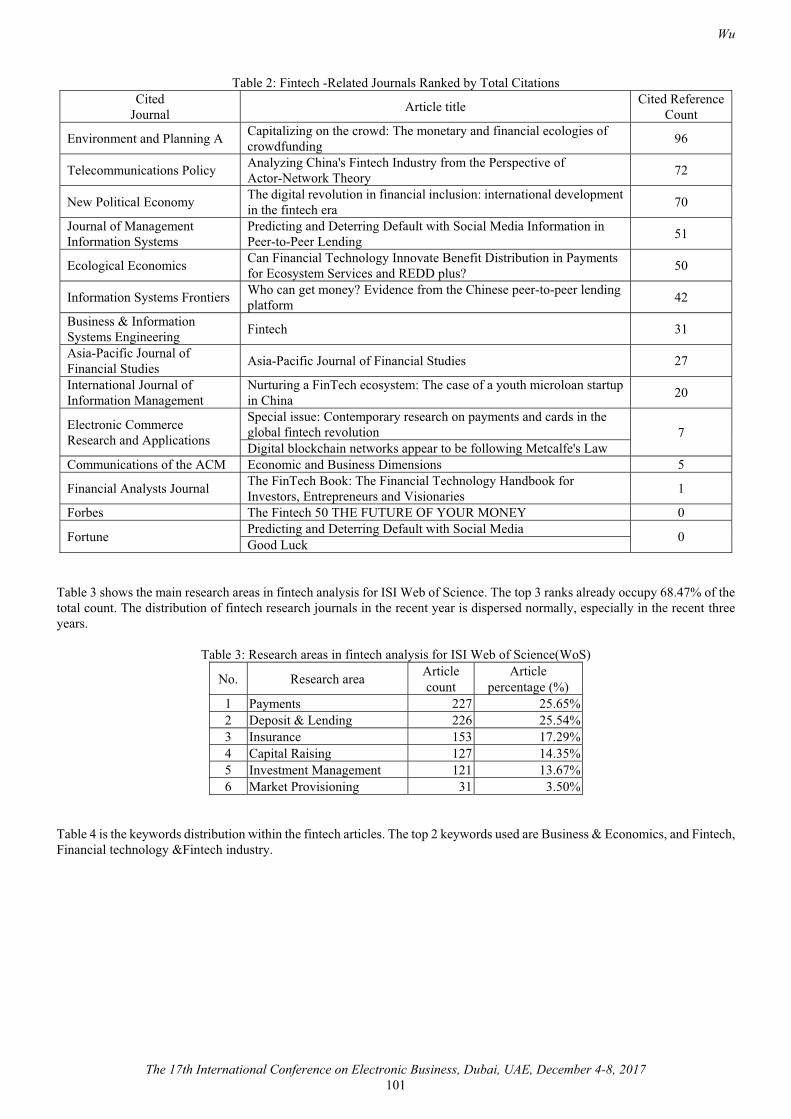
Wu
The 17th International Conference on Electronic Business, Dubai, UAE, December 4-8, 2017101
Table 2: Fintech -Related Journals Ranked by Total CitationsCited
Journal Article title Cited Reference Count
Environment and Planning A Capitalizing on the crowd: The monetary and financial ecologies of crowdfunding 96
Telecommunications Policy Analyzing China's Fintech Industry from the Perspective of Actor-Network Theory 72
New Political Economy The digital revolution in financial inclusion: international development in the fintech era 70
Journal of Management Information Systems
Predicting and Deterring Default with Social Media Information in Peer-to-Peer Lending 51
Ecological Economics Can Financial Technology Innovate Benefit Distribution in Payments for Ecosystem Services and REDD plus? 50
Information Systems Frontiers Who can get money? Evidence from the Chinese peer-to-peer lending platform 42
Business & Information Systems Engineering Fintech 31
Asia-Pacific Journal of Financial Studies Asia-Pacific Journal of Financial Studies 27
International Journal of Information Management
Nurturing a FinTech ecosystem: The case of a youth microloan startup in China 20
Electronic Commerce Research and Applications
Special issue: Contemporary research on payments and cards in the global fintech revolution 7Digital blockchain networks appear to be following Metcalfe's Law
Communications of the ACM Economic and Business Dimensions 5
Financial Analysts Journal The FinTech Book: The Financial Technology Handbook for Investors, Entrepreneurs and Visionaries 1
Forbes The Fintech 50 THE FUTURE OF YOUR MONEY 0
Fortune Predicting and Deterring Default with Social Media 0Good Luck
Table 3 shows the main research areas in fintech analysis for ISI Web of Science. The top 3 ranks already occupy 68.47% of the total count. The distribution of fintech research journals in the recent year is dispersed normally, especially in the recent three years.
Table 3: Research areas in fintech analysis for ISI Web of Science(WoS)
No. Research area Articlecount
Articlepercentage (%)
1 Payments 227 25.65%2 Deposit & Lending 226 25.54%3 Insurance 153 17.29%4 Capital Raising 127 14.35%5 Investment Management 121 13.67%6 Market Provisioning 31 3.50%
Table 4 is the keywords distribution within the fintech articles. The top 2 keywords used are Business & Economics, and Fintech, Financial technology &Fintech industry.
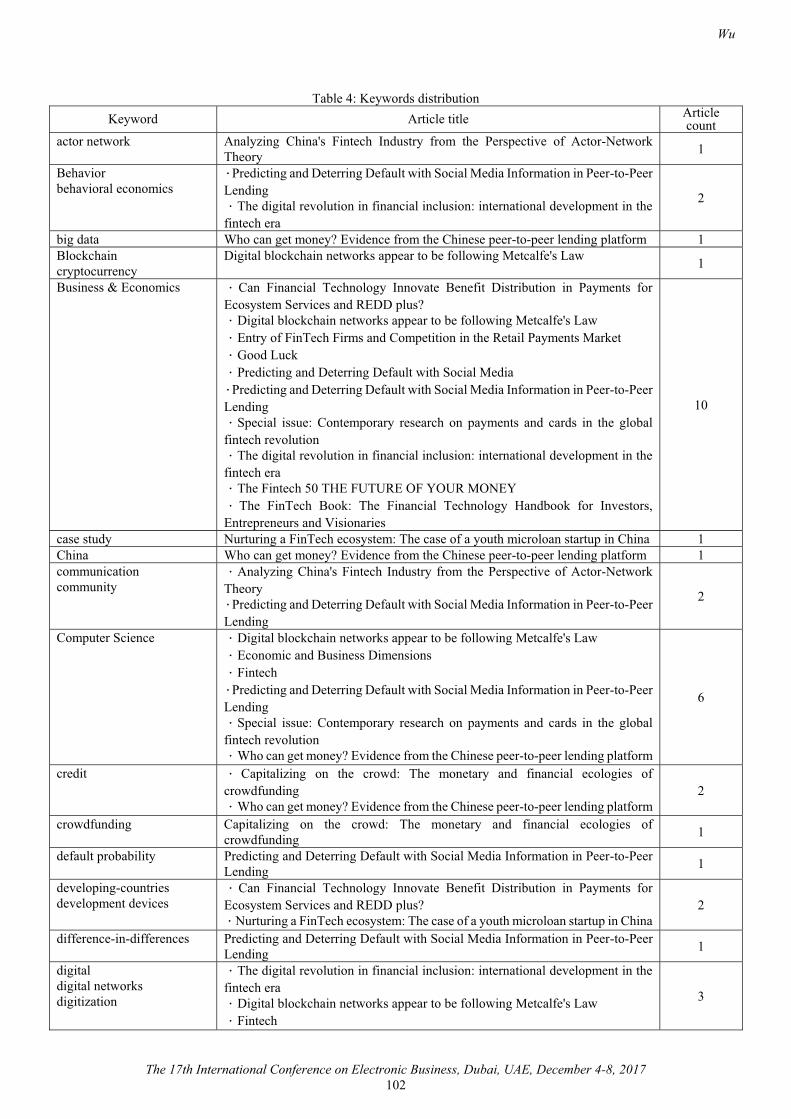
Wu
The 17th International Conference on Electronic Business, Dubai, UAE, December 4-8, 2017102
Table 4: Keywords distributionKeyword Article title Article
countactor network Analyzing China's Fintech Industry from the Perspective of Actor-Network
Theory 1
Behaviorbehavioral economics
Predicting and Deterring Default with Social Media Information in Peer-to-Peer Lending
The digital revolution in financial inclusion: international development in the fintech era
2
big data Who can get money? Evidence from the Chinese peer-to-peer lending platform 1Blockchaincryptocurrency
Digital blockchain networks appear to be following Metcalfe's Law 1
Business & Economics Can Financial Technology Innovate Benefit Distribution in Payments for Ecosystem Services and REDD plus?
Digital blockchain networks appear to be following Metcalfe's LawEntry of FinTech Firms and Competition in the Retail Payments MarketGood LuckPredicting and Deterring Default with Social Media
Predicting and Deterring Default with Social Media Information in Peer-to-Peer Lending
Special issue: Contemporary research on payments and cards in the global fintech revolution
The digital revolution in financial inclusion: international development in the fintech era
The Fintech 50 THE FUTURE OF YOUR MONEYThe FinTech Book: The Financial Technology Handbook for Investors,
Entrepreneurs and Visionaries
10
case study Nurturing a FinTech ecosystem: The case of a youth microloan startup in China 1China Who can get money? Evidence from the Chinese peer-to-peer lending platform 1communicationcommunity
Analyzing China's Fintech Industry from the Perspective of Actor-Network Theory
Predicting and Deterring Default with Social Media Information in Peer-to-Peer Lending
2
Computer Science Digital blockchain networks appear to be following Metcalfe's LawEconomic and Business DimensionsFintech
Predicting and Deterring Default with Social Media Information in Peer-to-Peer Lending
Special issue: Contemporary research on payments and cards in the global fintech revolution
Who can get money? Evidence from the Chinese peer-to-peer lending platform
6
credit Capitalizing on the crowd: The monetary and financial ecologies of crowdfunding
Who can get money? Evidence from the Chinese peer-to-peer lending platform2
crowdfunding Capitalizing on the crowd: The monetary and financial ecologies of crowdfunding 1
default probability Predicting and Deterring Default with Social Media Information in Peer-to-Peer Lending 1
developing-countriesdevelopment devices
Can Financial Technology Innovate Benefit Distribution in Payments for Ecosystem Services and REDD plus?
Nurturing a FinTech ecosystem: The case of a youth microloan startup in China2
difference-in-differences Predicting and Deterring Default with Social Media Information in Peer-to-Peer Lending 1
digitaldigital networksdigitization
The digital revolution in financial inclusion: international development in the fintech era
Digital blockchain networks appear to be following Metcalfe's LawFintech
3
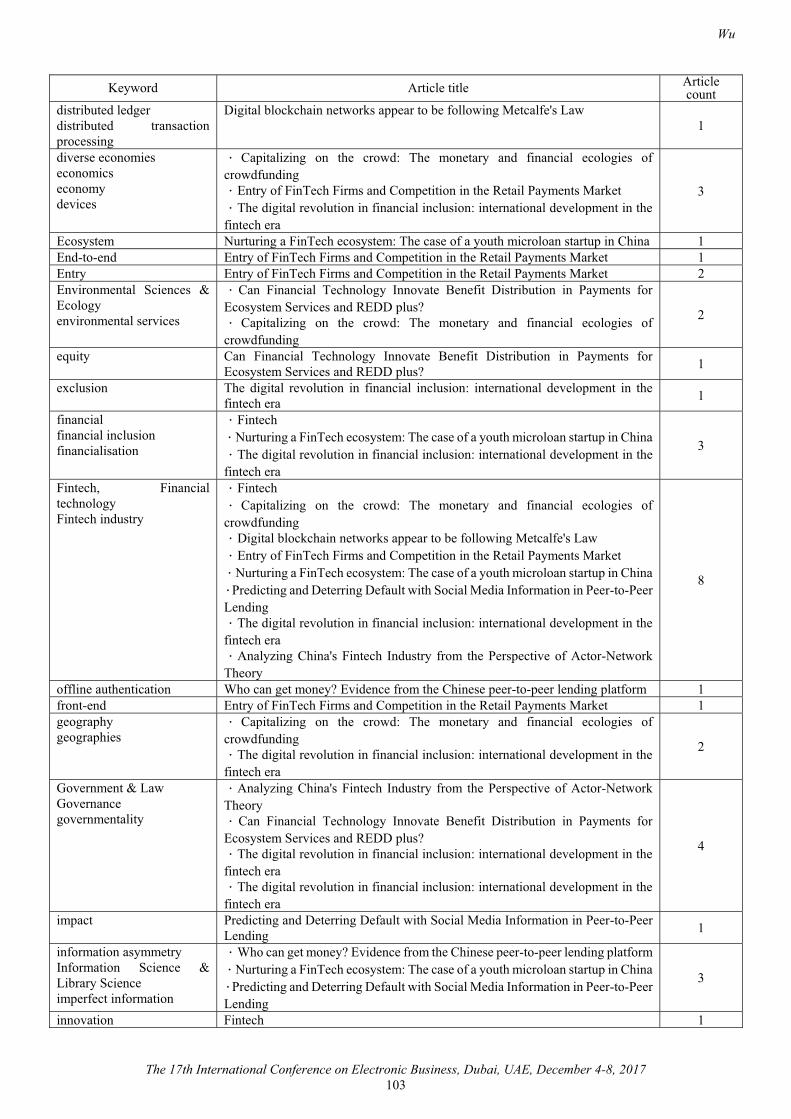
Wu
The 17th International Conference on Electronic Business, Dubai, UAE, December 4-8, 2017103
Keyword Article title Articlecount
distributed ledgerdistributed transaction processing
Digital blockchain networks appear to be following Metcalfe's Law1
diverse economieseconomicseconomydevices
Capitalizing on the crowd: The monetary and financial ecologies of crowdfunding
Entry of FinTech Firms and Competition in the Retail Payments MarketThe digital revolution in financial inclusion: international development in the
fintech era
3
Ecosystem Nurturing a FinTech ecosystem: The case of a youth microloan startup in China 1End-to-end Entry of FinTech Firms and Competition in the Retail Payments Market 1Entry Entry of FinTech Firms and Competition in the Retail Payments Market 2Environmental Sciences & Ecologyenvironmental services
Can Financial Technology Innovate Benefit Distribution in Payments for Ecosystem Services and REDD plus?
Capitalizing on the crowd: The monetary and financial ecologies of crowdfunding
2
equity Can Financial Technology Innovate Benefit Distribution in Payments for Ecosystem Services and REDD plus? 1
exclusion The digital revolution in financial inclusion: international development in the fintech era 1
financialfinancial inclusionfinancialisation
FintechNurturing a FinTech ecosystem: The case of a youth microloan startup in ChinaThe digital revolution in financial inclusion: international development in the
fintech era
3
Fintech, Financial technologyFintech industry
FintechCapitalizing on the crowd: The monetary and financial ecologies of
crowdfundingDigital blockchain networks appear to be following Metcalfe's LawEntry of FinTech Firms and Competition in the Retail Payments MarketNurturing a FinTech ecosystem: The case of a youth microloan startup in China
Predicting and Deterring Default with Social Media Information in Peer-to-Peer Lending
The digital revolution in financial inclusion: international development in the fintech era
Analyzing China's Fintech Industry from the Perspective of Actor-Network Theory
8
offline authentication Who can get money? Evidence from the Chinese peer-to-peer lending platform 1front-end Entry of FinTech Firms and Competition in the Retail Payments Market 1geographygeographies
Capitalizing on the crowd: The monetary and financial ecologies of crowdfunding
The digital revolution in financial inclusion: international development in the fintech era
2
Government & LawGovernancegovernmentality
Analyzing China's Fintech Industry from the Perspective of Actor-Network Theory
Can Financial Technology Innovate Benefit Distribution in Payments for Ecosystem Services and REDD plus?
The digital revolution in financial inclusion: international development in the fintech era
The digital revolution in financial inclusion: international development in the fintech era
4
impact Predicting and Deterring Default with Social Media Information in Peer-to-Peer Lending 1
information asymmetryInformation Science & Library Scienceimperfect information
Who can get money? Evidence from the Chinese peer-to-peer lending platformNurturing a FinTech ecosystem: The case of a youth microloan startup in China
Predicting and Deterring Default with Social Media Information in Peer-to-Peer Lending
3
innovation Fintech 1
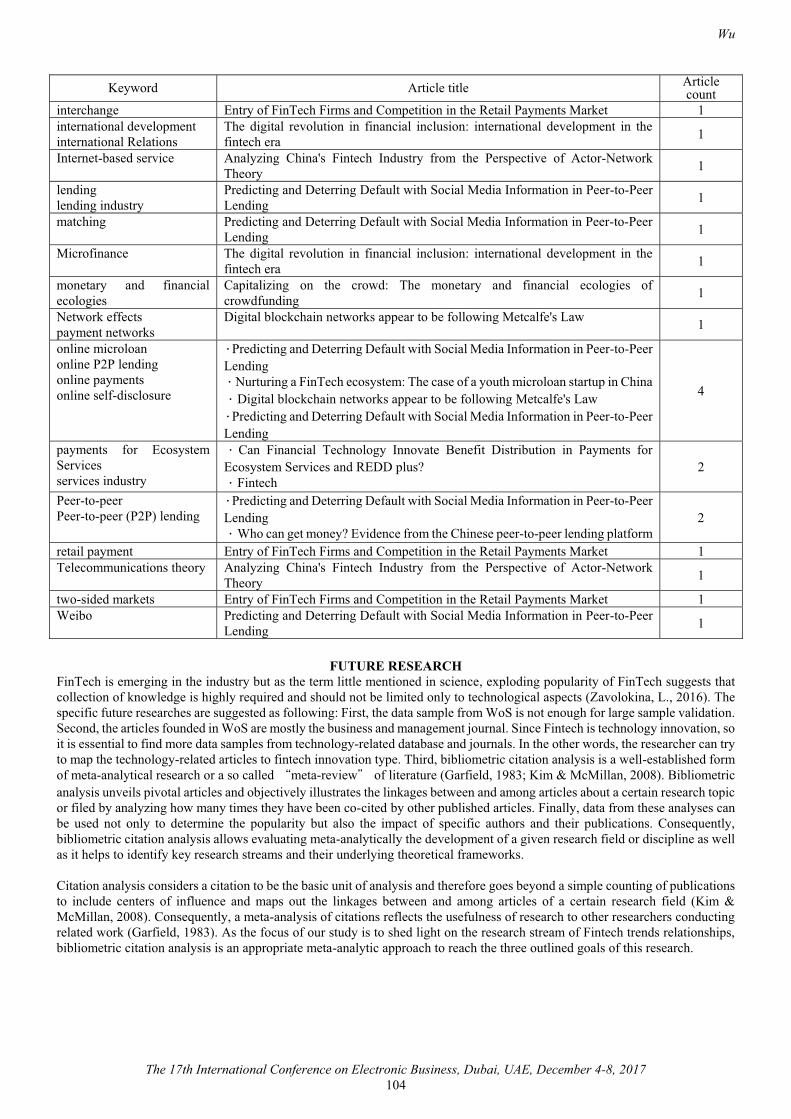
Wu
The 17th International Conference on Electronic Business, Dubai, UAE, December 4-8, 2017104
Keyword Article title Articlecount
interchange Entry of FinTech Firms and Competition in the Retail Payments Market 1international developmentinternational Relations
The digital revolution in financial inclusion: international development in the fintech era 1
Internet-based service Analyzing China's Fintech Industry from the Perspective of Actor-Network Theory 1
lendinglending industry
Predicting and Deterring Default with Social Media Information in Peer-to-Peer Lending 1
matching Predicting and Deterring Default with Social Media Information in Peer-to-Peer Lending 1
Microfinance The digital revolution in financial inclusion: international development in the fintech era 1
monetary and financial ecologies
Capitalizing on the crowd: The monetary and financial ecologies of crowdfunding 1
Network effectspayment networks
Digital blockchain networks appear to be following Metcalfe's Law 1
online microloanonline P2P lendingonline paymentsonline self-disclosure
Predicting and Deterring Default with Social Media Information in Peer-to-Peer Lending
Nurturing a FinTech ecosystem: The case of a youth microloan startup in ChinaDigital blockchain networks appear to be following Metcalfe's Law
Predicting and Deterring Default with Social Media Information in Peer-to-Peer Lending
4
payments for Ecosystem Servicesservices industry
Can Financial Technology Innovate Benefit Distribution in Payments for Ecosystem Services and REDD plus?
Fintech2
Peer-to-peerPeer-to-peer (P2P) lending
Predicting and Deterring Default with Social Media Information in Peer-to-Peer Lending
Who can get money? Evidence from the Chinese peer-to-peer lending platform2
retail payment Entry of FinTech Firms and Competition in the Retail Payments Market 1Telecommunications theory Analyzing China's Fintech Industry from the Perspective of Actor-Network
Theory 1
two-sided markets Entry of FinTech Firms and Competition in the Retail Payments Market 1Weibo Predicting and Deterring Default with Social Media Information in Peer-to-Peer
Lending 1
FUTURE RESEARCHFinTech is emerging in the industry but as the term little mentioned in science, exploding popularity of FinTech suggests that collection of knowledge is highly required and should not be limited only to technological aspects (Zavolokina, L., 2016). The specific future researches are suggested as following: First, the data sample from WoS is not enough for large sample validation. Second, the articles founded in WoS are mostly the business and management journal. Since Fintech is technology innovation, so it is essential to find more data samples from technology-related database and journals. In the other words, the researcher can try to map the technology-related articles to fintech innovation type. Third, bibliometric citation analysis is a well-established form of meta-analytical research or a so called meta-review of literature (Garfield, 1983; Kim & McMillan, 2008). Bibliometric analysis unveils pivotal articles and objectively illustrates the linkages between and among articles about a certain research topic or filed by analyzing how many times they have been co-cited by other published articles. Finally, data from these analyses can be used not only to determine the popularity but also the impact of specific authors and their publications. Consequently,bibliometric citation analysis allows evaluating meta-analytically the development of a given research field or discipline as well as it helps to identify key research streams and their underlying theoretical frameworks.
Citation analysis considers a citation to be the basic unit of analysis and therefore goes beyond a simple counting of publications to include centers of influence and maps out the linkages between and among articles of a certain research field (Kim & McMillan, 2008). Consequently, a meta-analysis of citations reflects the usefulness of research to other researchers conducting related work (Garfield, 1983). As the focus of our study is to shed light on the research stream of Fintech trends relationships, bibliometric citation analysis is an appropriate meta-analytic approach to reach the three outlined goals of this research.
Wu
The 17th International Conference on Electronic Business, Dubai, UAE, December 4-8, 2017105
REFERENCES[1] Arner, D.W., Barberis, J., & Buckley, R.P. (2015) The evolution of fintech: a new post-crisis paradigm. The University of
New South Wales (UNSW) and the University of Hong Kong, UNSW Law Research Paper No. 2016-62, Hong Kong, Sydney.
[2] Archambault, É., Campbell, D., Gingras, Y. & Larivière, V. (2009). Comparing bibliometric statistics obtained from the Web of Science and Scopus. Journal of the American Society for Information Science and Technology, 60(7), 1320-1326.
[3] Bensman, S.J. (2007). Garfield and the impact factor. Annual Review of Information Science and Technology, 41(1), 93-155.
[4] Bosman, J., van Mourik, I., Rasch, M., Sieverts, E. and Verhoeff, H. (2006). Scopus reviewed and compared: The coverage and functionality of the citation database Scopus, including comparisons with Web of Science and Google Scholar. Utrecht University Library, 63 pages. Retrieved from https://dspace.library.uu.nl/handle/1874/18247 (October 8, 2017)
[5] Bradford, S.C. (1934). Sources of information on specific subjects. Engineering, 137, 85-86.[6] Falagas, M.E., Pitsouni, E.I., Malietzis, G.A., & Pappas, G. (2008). Comparison of PubMed, Scopus, Web of Science, and
Google Scholar: Strengths and weaknesses. FASEB Journal, 22, 338-342.[7] Hood, W. W. & Wilson, C. S. (2001). The literature of bibliometrics, scientometrics, and informetrics. Scientometrics,
52(2), 291-314. [8] Garfield, E. (1972). Citation analysis as a tool in journal evaluation. Science, 178(4060), 471-479.[9] Gavel Y., & Iselid, L. (2008). Web of Science and Scopus: A journal title overlap study. Online Information Review, 32(1),
8-21.[10] Huang, M.H., Chang, H.W., & Chen, D.Z. (2012). The trend of concentration in scientific research and technological
innovation: A reduction of the predominant role of the U.S. in world research & technology. Journal of Informetrics, 6(4), 457-468.
[11] Kim, J., & McMillan, S. (2008). Evaluation of internet advertising research: a bibliometric analysis of citations from key sources. Journal of Advertising, 37(1), 99-112.
[12] Kutler J. (1993). Citibank is shedding individualistic image. American Banker, August 13. Retrieved from https://www.americanbanker.com/opinion/friday-flashback-did-citi-coin-the-term-fintech (October 8, 2017)
[13] Lotka, A.J. (1926). The frequency distribution of scientific productivity. Journal of Washington Academy Sciences, 16(2), 317-323.
[14] Nüesch, R., Alt, R., & Puschmann, T. (2015). Hybrid customer interaction. Business & Information Systems Engineering, 57(1), 73-78.
[15] Osareh, F. (1996a). Bibliometrics, citation analysis and co-citation analysis: A review of literature I. Libri, 46, 149-158.[16] Osareh, F. (1996b). Bibliometrics, citation analysis and co-citation analysis: A review of literature II. Libri, 46, 217-225.[17] Rainer, A., & Puschmann, T. (2016). Digitalisierung der Finanzindustrie - Grundlagen der Fintech-Evolution. Heidelberg:
Springer Gabler.[18] Tsay, M. Y., Yang, Y. H. (2005). Bibliometric analysis of the literature of randomized controlled trials. Journal of the
Medical Library Association, 93(4), 450-458.[19] World Economic Forum (2015). The future of financial services - how disruptive innovations are reshaping the way
financial services are structured, provisioned and consumed. An Industry Project of the Financial Services Community, New York.
[20] Zavolokina, L., Dolata, M,, Schwabe, G. (2016). Fintech - what’s in a name? In Proceedings of the 37th International Conference on Information Systems (ICIS 2016), AIS, Dublin, Ireland, December 11-14.
Salminen, J., Seitz, S., Jansen, B.J. & Salenius, T. (2017). Gender effect on e-commerce sales of experience gifts: Preliminary empirical findings. In Proceedings of The 17th International Conference on Electronic Business (pp. 106-115). ICEB, Dubai, UAE, December 4-8.
Salminen, Seitz, Jansen & Salenius
The 17th International Conference on Electronic Business, Dubai, UAE, December 4-8, 2017106
Gender Effect on E-Commerce Sales of Experience Gifts: Preliminary Empirical Findings
Joni Salminen*, Qatar Computing Research Institute, HBKU; and Turku School of Economics, State of Qatar, [email protected]
Sarem Seitz, Otto-Friedrich University Bamberg, Germany, [email protected] J. Jansen, Qatar Computing Research Institute, HBKU, State of Qatar , [email protected]
Tommi Salenius, Parcero Marketing Partners, Finland, [email protected]
ABSTRACTWe analyze purchase data from 493 customers of an e-commerce store selling experience gifts to find how gender correlates with average purchase value, category of purchased products, and the use of discount codes. We find no significant differences foraverage purchase value or category of purchased products, but according to the data, women are more likely to use discount codes than are males. Ideas for further research concerning the gender effect on online shopping behavior are discussed.
Keywords: e-commerce; online consumer behavior; online purchase behavior; online shopping behavior; gender_____________________*Corresponding author
INTRODUCTIONIn both e-commerce and online advertising, gender is a typical targeting and segmentation criterion (Kim et al., 2007). Products and offers are often tailored according to a customer’s gender. As Chiu et al. (2005, p. 416) note, “by learning gender differences, e se intentions.” Digital marketers use gender targeting for several purposes, including choice of products to promote, linguistic formulation of messages, and image selection. For example, Jansen et al. (2013) find that the gender-orientation of search keywords influences advertising performance. In addition to online marketers, e-commerce designers and human-computer interaction (HCI) researchers benefit from information on gender differences (Hwang, 2010).
While prior studies have pointed out overall differences between men and women in their purchase behavior (Peters, 1989; Coleyet al., 2003; Mostafa, 2007; Kolyesnikova et al., 2009), the online purchase behavior of the two genders is much less studied, apart from few examples (Cyr & Bonanni, 2005; Fan & Miao, 2012). Slyke et al. (2010) observe the same (p. 1529): “Among the many characteristics that impact the use of e-commerce, one that has received relatively little attention is gender.” Kim et al. (2007) note that the growing importance of the Internet further highlights the need for understanding online users’ behaviors from a gender point of view. Because behavioral gender differences have been established in other contexts, it is therefore worthwhile to examine whether they take place in online shopping, and, if so, how. To this end, we are looking for answers to several questions relating to gender and online customer behavior:
1. How do e-commerce purchases of experience gifts split between men and women?2. Do the products bought differ by gender? If so, how?3. Which gender is more likely to use discount codes?
Although, as shown in the next section, there are some prior studies researching gender effect on online customer behavior, we could not locate any prior study specifically focusing on the above questions, even though these questions are important to online retailers. To answer these questions, we collect e-commerce data from 493 individual customers of an e-commerce store which sells experience gifts and is based in Finland. Experience gifts are electronic or physical gift-cards that include the right to claim an experience service from a specified service provider that collaborates with the e-commerce company. Examples of experience gifts include tandem jump, rally driving, dinner in the dark (or sky), etc. Experience gifts are part of the trend for immaterial consumption that recently has become widespread across the world (Clarke, 2006; 2008). The concept has become popular in many countries, including UK, Australia, Sweden, and Finland, as an alternative to buying tangible goods (things) as a gift.
To answer the first two questions, we compare the genders by a) quantity, b) total sales value, and c) average purchase value. For the third question, we code the use of coupons by comparing the price before discount and final price. In brief, we find no statistically significant differences for average order price and choice of products, but a significant effect in the use of discount
Salminen, Seitz, Jansen & Salenius
The 17th International Conference on Electronic Business, Dubai, UAE, December 4-8, 2017107
codes, finding that males are on average 1.38 times more likely to use them. The implication is that, when specifically targetingmale online shoppers, it may be beneficial for retailers to use coupons as a recruiting tactic.
RELATED LITERATUREWe conduct a literature survey by retrieving related literature with keywords such as [“online purchase behavior” +gender]. Wefind several research papers, published in journals or conference proceedings, of which 19 are deemed relevant for this study by reading their abstracts. A further investigation into these research papers reveals three themes in prior literature examining gender effect on online shopping: 1) equality and power, 2) adoption of online commerce, and 3) behavioral differences.
The first stream is concerned with the uneven use of technological media by the two genders, and aims at discovering reasons for this state of affairs. For example, Sherman et al. (2000, p. 885) postulate that “the Internet has been a male-dominated technology since its beginnings in the late 1960s,” also referring to the “Internet gender gap”. Rodgers and Harris (2003) argue that women are less satisfied with online shopping than men, because they lack support for e-commerce activity. However, Weiser (2000) argued the gender gap is rapidly diminishing, with increasing online shopping technology focused on women shoppers (Gao et al., 2017). Often, these studies focus on women, rather than objectively comparing both genders. Overall, this stream of research is somewhat dated, at least in the Western context where both male and female audiences have widely embraced online platforms, especiallyonline social networks (Centola, 2010), and e-commerce.
The second stream focused on motivations for men and women to adopt online shopping, or, in the earlier studies, Internet as awhole. For example, Weiser (2000) found men use the Internet for entertainment and leisure, whereas women prefer using it for communication and educational purposes. Besides motivation, another important construct here is risk; for example, Garbarino and Strahilevitz (2004) studied how gender influences the perception of risk in online purchasing. They found that women perceive a higher level of risk than men. Moreover, according to their study, peer recommendations (word-of-mouth) decrease the perceived risk more for women, and also leads into a higher willingness to buy than for men. Indeed, trust and risk seem to be closely associated with one another, both relating to adoption of online commerce. As explained by Kolsaker and Payne (2002, p. 206), “an essential element of successful e gree of trust. Chiu et al. (2005) found in their structural equation modeling that men responded more strongly to awareness of security, and this influenced their online purchase intention. However, Cyr and Bonanni (2005) did not find security impactful for online shopping experience. Other constructs, used by Chiu et al. (2005), include innovativeness, perceived usefulness, and perceived ease of use. The effect of the first two is similar for both genders, while perceived ease of use is more important for women (ibid.). Finally, social dynamics in the context of e-commerce adoption have been examined. For example, Hwang (2010) found the influence of social norms stronger for women, while the effect of enjoyment was stronger for men. Overall, like the first stream, also this stream is somewhat outdated in the sense that e-commerce purchase behavior is already a routine activity for the majority of website users at this day and age, whether they are male or female, and rapidly catching worldwide, including developing markets, such as India (e.g., https://www.ecommerce-europe.eu/app/uploads/2016/10/India-B2C-E-commerce-Light-Country-Report.pdf). In fact, many novel e-shops, e.g., Nelly.se and Zalando.de in fashion are of interest to women in online shopping.
The third stream deals with differences in purchase behavior. The research here is the scarcest; as noted by Cyr and Bonanni (2005, p. 565), “very little is known about the difference in male and female perceptions of this experience.” Even though they made this statement some time ago, our survey reveals this still being the case. However, there is some specific work on this area. Cyr and Bonanni (2005) found significant differences in perceptions of website design and website satisfaction between males and females regarding online shopping experience; however, there was no significant difference in loyalty. In contrast, Mukherjee and Jansen (2014) find significant variations in consumer behavior the genders, so that women are more likely to use brand keywords than men, indicating greater loyalty. Rodgers and Harris (2003) identify trust, along with emotion and convenience, as explaining variables for satisfaction with online shopping experience, while Richard et al. (2010) find gender differences in navigation behavior on the Internet, so that men exhibit less exploratory behavior (browsing) and lower website involvement than women.
In summary, we find that there is a strong emphasis in prior research on technology adoption and acceptance. Other key constructs include trust and word-of-mouth, online shopping experience, and gender gap. Most of the surveyed research is old, consideringthe rapidly developing landscape of online shopping; e.g., some studies are postulating women exhibit anxiety over e-commerce use, or the use of computers (Yang & Lester, 2005). With the large proliferation of fashion e.g. e-commerce store, it is not likely these studies represent the current state-of-the-art of gender effects on online purchase behavior. As most studies we found are a decade old, there is a need for refreshed data that represents the current situation in the marketplace. As such, a refreshed look, such as undertaken in this study, is needed to evaluate the current situation of gender effects on online purchase behavior.
METHODData CollectionThe data was collected by randomly sampling e-commerce orders taking place during August, 2017. The e-commerce store in question sells experience gifts, i.e. electronic or physical gift-cards that include the right to claim an experience service, e.g.
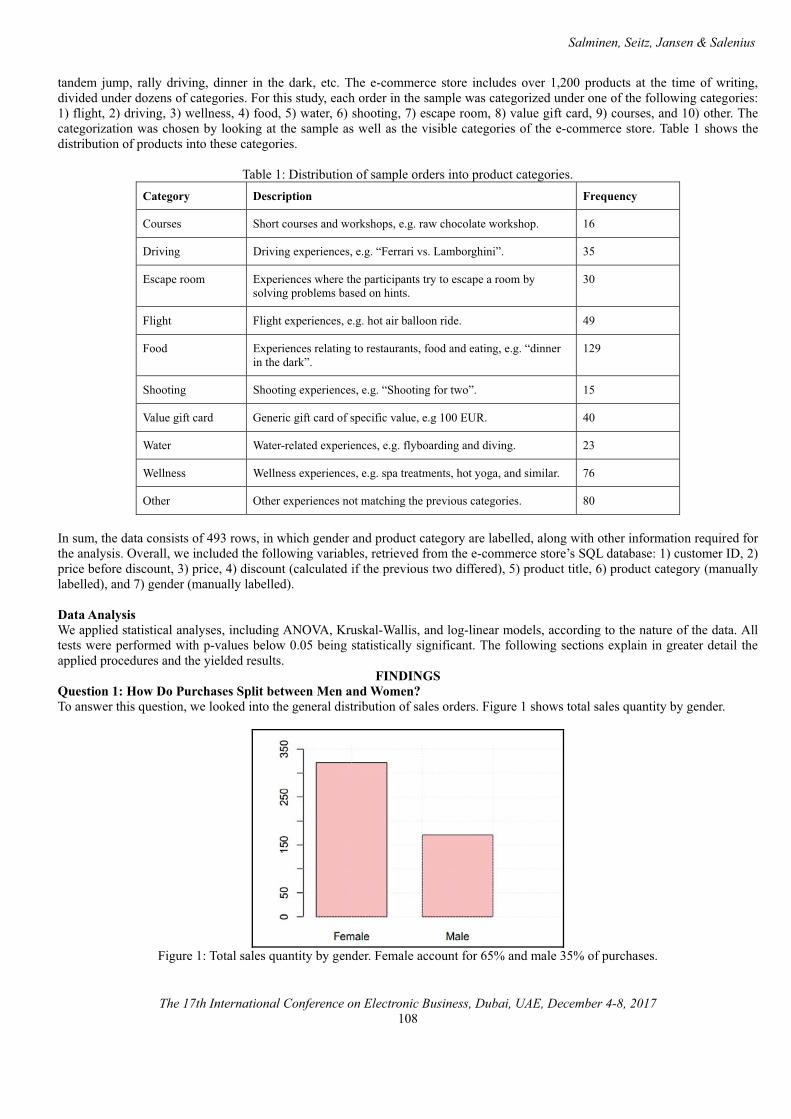
Salminen, Seitz, Jansen & Salenius
The 17th International Conference on Electronic Business, Dubai, UAE, December 4-8, 2017108
tandem jump, rally driving, dinner in the dark, etc. The e-commerce store includes over 1,200 products at the time of writing, divided under dozens of categories. For this study, each order in the sample was categorized under one of the following categories: 1) flight, 2) driving, 3) wellness, 4) food, 5) water, 6) shooting, 7) escape room, 8) value gift card, 9) courses, and 10) other. The categorization was chosen by looking at the sample as well as the visible categories of the e-commerce store. Table 1 shows the distribution of products into these categories.
Table 1: Distribution of sample orders into product categories.Category Description Frequency
Courses Short courses and workshops, e.g. raw chocolate workshop. 16
Driving Driving experiences, e.g. “Ferrari vs. Lamborghini”. 35
Escape room Experiences where the participants try to escape a room by solving problems based on hints.
30
Flight Flight experiences, e.g. hot air balloon ride. 49
Food Experiences relating to restaurants, food and eating, e.g. “dinner in the dark”.
129
Shooting Shooting experiences, e.g. “Shooting for two”. 15
Value gift card Generic gift card of specific value, e.g 100 EUR. 40
Water Water-related experiences, e.g. flyboarding and diving. 23
Wellness Wellness experiences, e.g. spa treatments, hot yoga, and similar. 76
Other Other experiences not matching the previous categories. 80
In sum, the data consists of 493 rows, in which gender and product category are labelled, along with other information required for the analysis. Overall, we included the following variables, retrieved from the e-commerce store’s SQL database: 1) customer ID, 2) price before discount, 3) price, 4) discount (calculated if the previous two differed), 5) product title, 6) product category (manually labelled), and 7) gender (manually labelled).
Data AnalysisWe applied statistical analyses, including ANOVA, Kruskal-Wallis, and log-linear models, according to the nature of the data. All tests were performed with p-values below 0.05 being statistically significant. The following sections explain in greater detail the applied procedures and the yielded results.
FINDINGSQuestion 1: How Do Purchases Split between Men and Women?To answer this question, we looked into the general distribution of sales orders. Figure 1 shows total sales quantity by gender.
Figure 1: Total sales quantity by gender. Female account for 65% and male 35% of purchases.
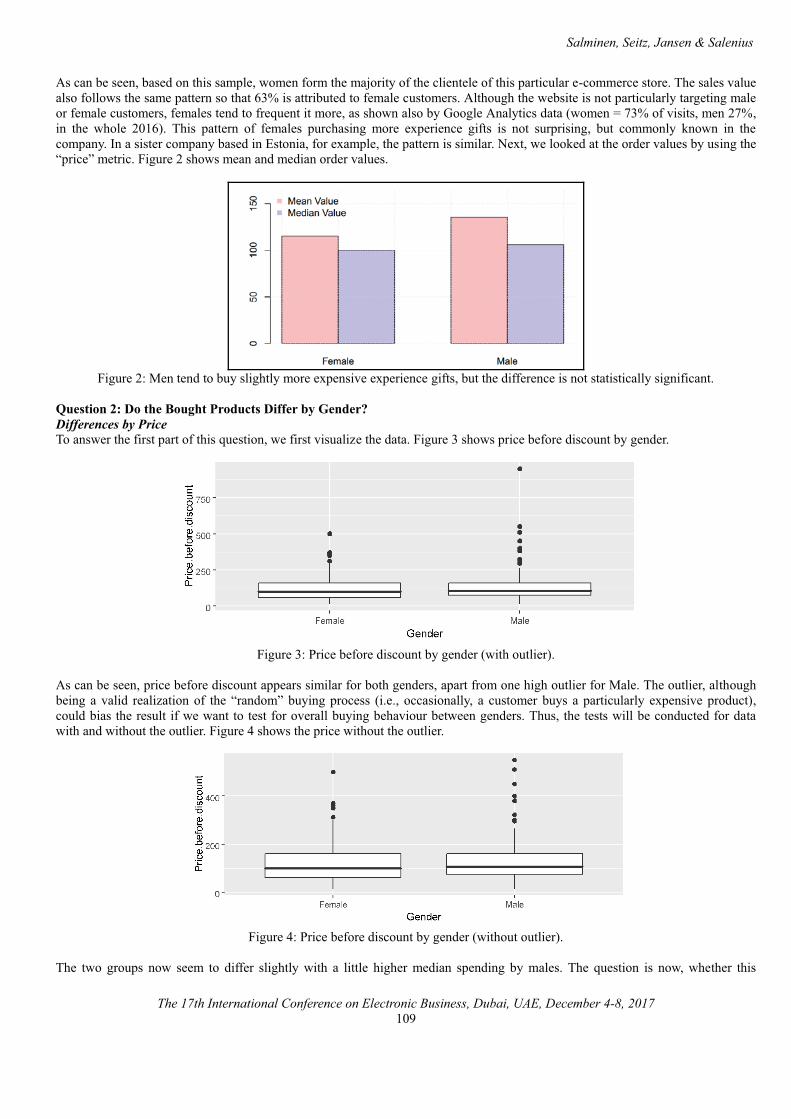
Salminen, Seitz, Jansen & Salenius
The 17th International Conference on Electronic Business, Dubai, UAE, December 4-8, 2017109
As can be seen, based on this sample, women form the majority of the clientele of this particular e-commerce store. The sales value also follows the same pattern so that 63% is attributed to female customers. Although the website is not particularly targeting male or female customers, females tend to frequent it more, as shown also by Google Analytics data (women = 73% of visits, men 27%, in the whole 2016). This pattern of females purchasing more experience gifts is not surprising, but commonly known in the company. In a sister company based in Estonia, for example, the pattern is similar. Next, we looked at the order values by using the “price” metric. Figure 2 shows mean and median order values.
Figure 2: Men tend to buy slightly more expensive experience gifts, but the difference is not statistically significant.
Question 2: Do the Bought Products Differ by Gender?Differences by PriceTo answer the first part of this question, we first visualize the data. Figure 3 shows price before discount by gender.
Figure 3: Price before discount by gender (with outlier).
As can be seen, price before discount appears similar for both genders, apart from one high outlier for Male. The outlier, although being a valid realization of the “random” buying process (i.e., occasionally, a customer buys a particularly expensive product), could bias the result if we want to test for overall buying behaviour between genders. Thus, the tests will be conducted for datawith and without the outlier. Figure 4 shows the price without the outlier.
Figure 4: Price before discount by gender (without outlier).
The two groups now seem to differ slightly with a little higher median spending by males. The question is now, whether this
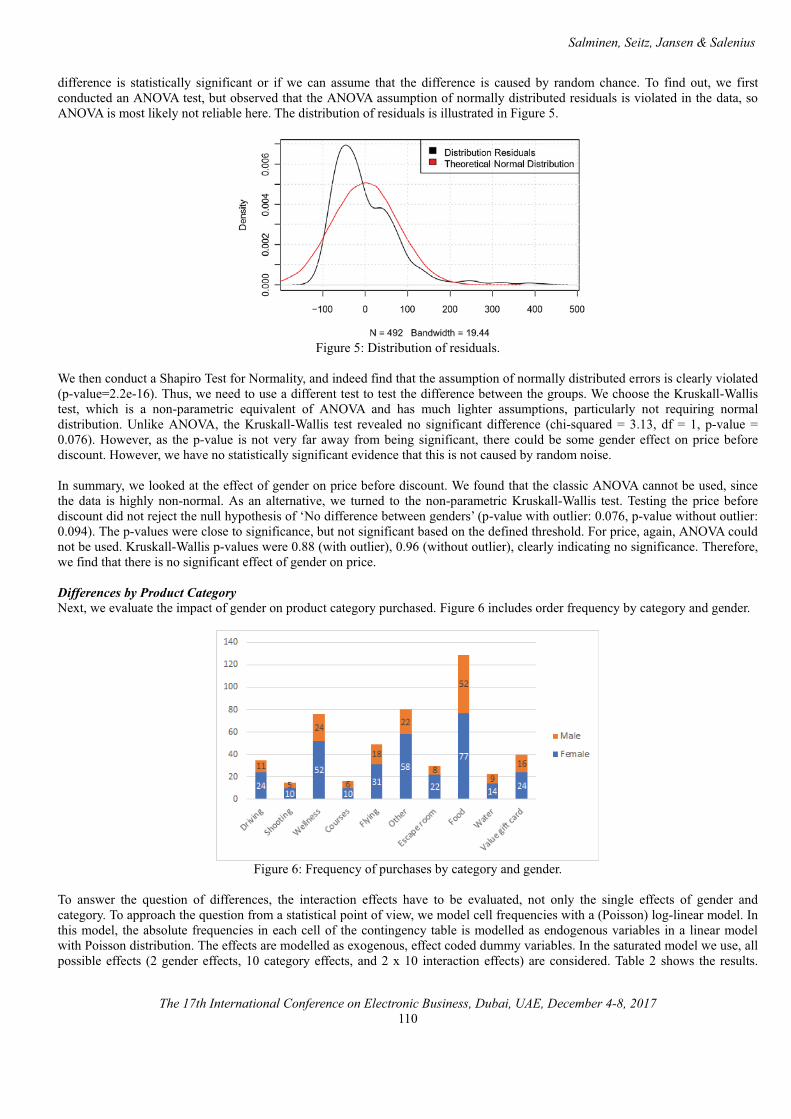
Salminen, Seitz, Jansen & Salenius
The 17th International Conference on Electronic Business, Dubai, UAE, December 4-8, 2017110
difference is statistically significant or if we can assume that the difference is caused by random chance. To find out, we first conducted an ANOVA test, but observed that the ANOVA assumption of normally distributed residuals is violated in the data, so ANOVA is most likely not reliable here. The distribution of residuals is illustrated in Figure 5.
Figure 5: Distribution of residuals.
We then conduct a Shapiro Test for Normality, and indeed find that the assumption of normally distributed errors is clearly violated (p-value=2.2e-16). Thus, we need to use a different test to test the difference between the groups. We choose the Kruskall-Wallis test, which is a non-parametric equivalent of ANOVA and has much lighter assumptions, particularly not requiring normal distribution. Unlike ANOVA, the Kruskall-Wallis test revealed no significant difference (chi-squared = 3.13, df = 1, p-value = 0.076). However, as the p-value is not very far away from being significant, there could be some gender effect on price before discount. However, we have no statistically significant evidence that this is not caused by random noise.
In summary, we looked at the effect of gender on price before discount. We found that the classic ANOVA cannot be used, sincethe data is highly non-normal. As an alternative, we turned to the non-parametric Kruskall-Wallis test. Testing the price before discount did not reject the null hypothesis of ‘No difference between genders’ (p-value with outlier: 0.076, p-value without outlier: 0.094). The p-values were close to significance, but not significant based on the defined threshold. For price, again, ANOVA could not be used. Kruskall-Wallis p-values were 0.88 (with outlier), 0.96 (without outlier), clearly indicating no significance. Therefore, we find that there is no significant effect of gender on price.
Differences by Product CategoryNext, we evaluate the impact of gender on product category purchased. Figure 6 includes order frequency by category and gender.
Figure 6: Frequency of purchases by category and gender.
To answer the question of differences, the interaction effects have to be evaluated, not only the single effects of gender andcategory. To approach the question from a statistical point of view, we model cell frequencies with a (Poisson) log-linear model. In this model, the absolute frequencies in each cell of the contingency table is modelled as endogenous variables in a linear model with Poisson distribution. The effects are modelled as exogenous, effect coded dummy variables. In the saturated model we use, all possible effects (2 gender effects, 10 category effects, and 2 x 10 interaction effects) are considered. Table 2 shows the results.
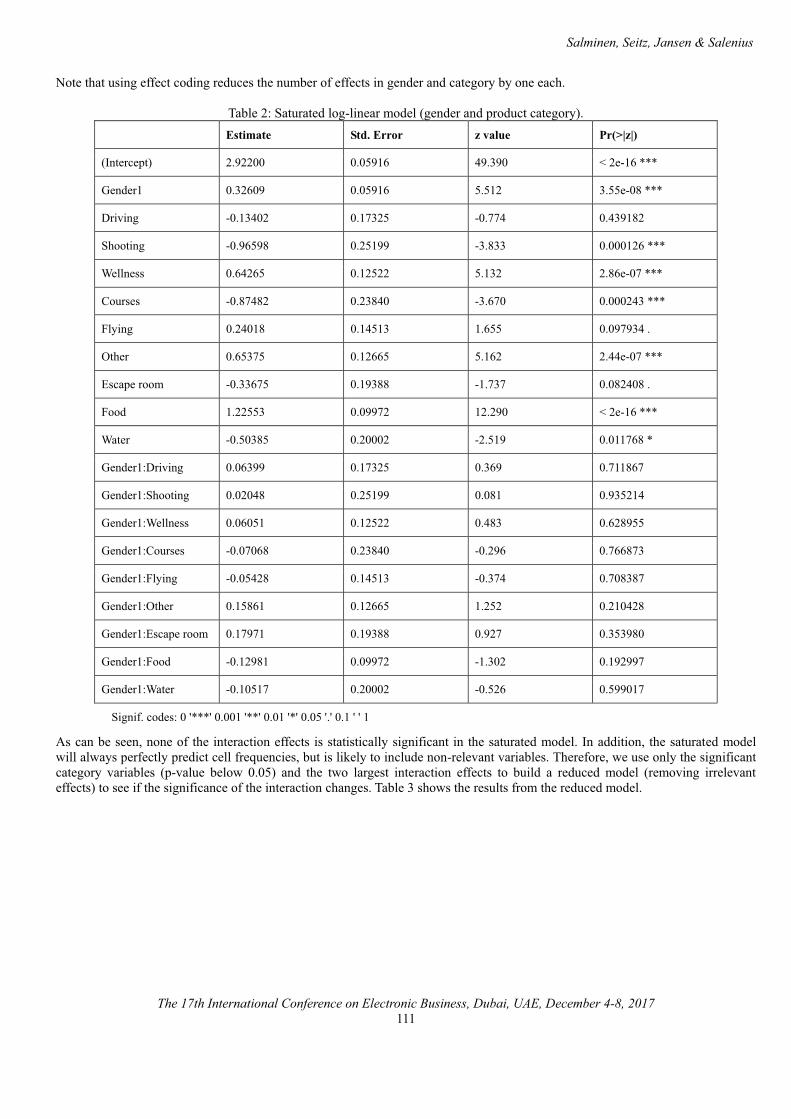
Salminen, Seitz, Jansen & Salenius
The 17th International Conference on Electronic Business, Dubai, UAE, December 4-8, 2017111
Note that using effect coding reduces the number of effects in gender and category by one each.
Table 2: Saturated log-linear model (gender and product category).Estimate Std. Error z value Pr(>|z|)
(Intercept) 2.92200 0.05916 49.390 < 2e-16 ***
Gender1 0.32609 0.05916 5.512 3.55e-08 ***
Driving -0.13402 0.17325 -0.774 0.439182
Shooting -0.96598 0.25199 -3.833 0.000126 ***
Wellness 0.64265 0.12522 5.132 2.86e-07 ***
Courses -0.87482 0.23840 -3.670 0.000243 ***
Flying 0.24018 0.14513 1.655 0.097934 .
Other 0.65375 0.12665 5.162 2.44e-07 ***
Escape room -0.33675 0.19388 -1.737 0.082408 .
Food 1.22553 0.09972 12.290 < 2e-16 ***
Water -0.50385 0.20002 -2.519 0.011768 *
Gender1:Driving 0.06399 0.17325 0.369 0.711867
Gender1:Shooting 0.02048 0.25199 0.081 0.935214
Gender1:Wellness 0.06051 0.12522 0.483 0.628955
Gender1:Courses -0.07068 0.23840 -0.296 0.766873
Gender1:Flying -0.05428 0.14513 -0.374 0.708387
Gender1:Other 0.15861 0.12665 1.252 0.210428
Gender1:Escape room 0.17971 0.19388 0.927 0.353980
Gender1:Food -0.12981 0.09972 -1.302 0.192997
Gender1:Water -0.10517 0.20002 -0.526 0.599017
Signif. codes: 0 '***' 0.001 '**' 0.01 '*' 0.05 '.' 0.1 ' ' 1
As can be seen, none of the interaction effects is statistically significant in the saturated model. In addition, the saturated model will always perfectly predict cell frequencies, but is likely to include non-relevant variables. Therefore, we use only the significant category variables (p-value below 0.05) and the two largest interaction effects to build a reduced model (removing irrelevant effects) to see if the significance of the interaction changes. Table 3 shows the results from the reduced model.
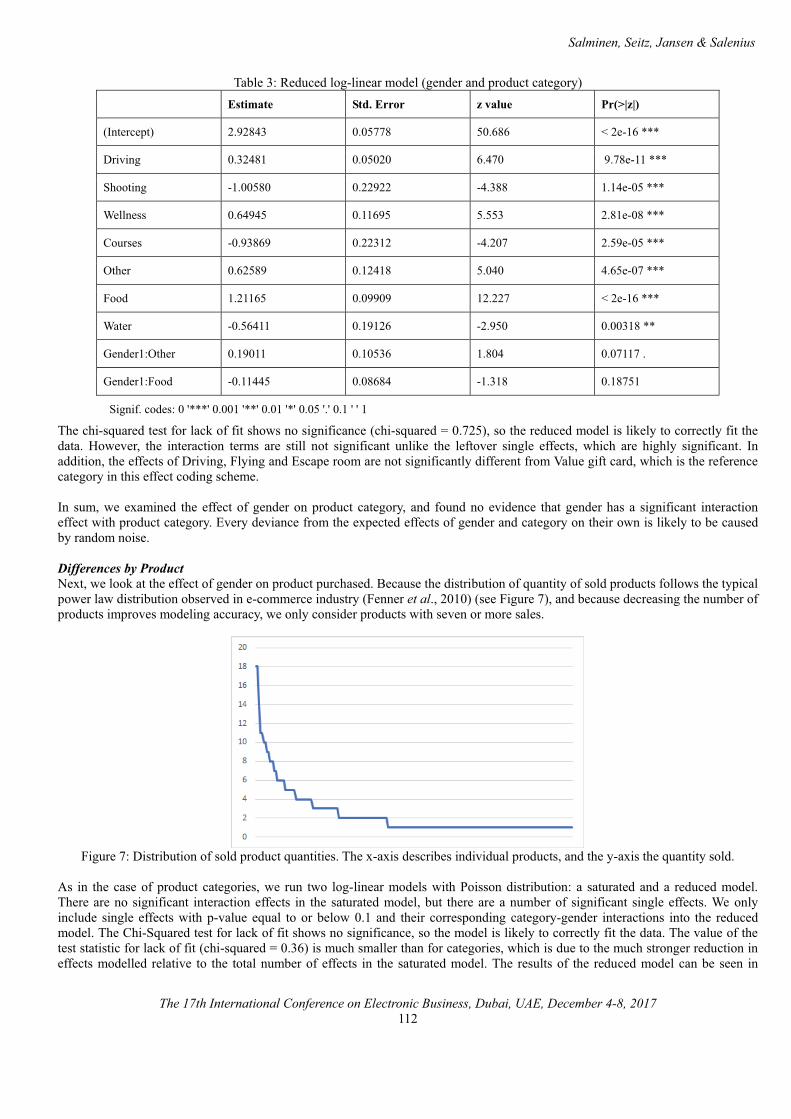
Salminen, Seitz, Jansen & Salenius
The 17th International Conference on Electronic Business, Dubai, UAE, December 4-8, 2017112
Table 3: Reduced log-linear model (gender and product category)Estimate Std. Error z value Pr(>|z|)
(Intercept) 2.92843 0.05778 50.686 < 2e-16 ***
Driving 0.32481 0.05020 6.470 9.78e-11 ***
Shooting -1.00580 0.22922 -4.388 1.14e-05 ***
Wellness 0.64945 0.11695 5.553 2.81e-08 ***
Courses -0.93869 0.22312 -4.207 2.59e-05 ***
Other 0.62589 0.12418 5.040 4.65e-07 ***
Food 1.21165 0.09909 12.227 < 2e-16 ***
Water -0.56411 0.19126 -2.950 0.00318 **
Gender1:Other 0.19011 0.10536 1.804 0.07117 .
Gender1:Food -0.11445 0.08684 -1.318 0.18751
Signif. codes: 0 '***' 0.001 '**' 0.01 '*' 0.05 '.' 0.1 ' ' 1
The chi-squared test for lack of fit shows no significance (chi-squared = 0.725), so the reduced model is likely to correctly fit the data. However, the interaction terms are still not significant unlike the leftover single effects, which are highly significant. In addition, the effects of Driving, Flying and Escape room are not significantly different from Value gift card, which is the reference category in this effect coding scheme.
In sum, we examined the effect of gender on product category, and found no evidence that gender has a significant interaction effect with product category. Every deviance from the expected effects of gender and category on their own is likely to be caused by random noise.
Differences by ProductNext, we look at the effect of gender on product purchased. Because the distribution of quantity of sold products follows the typical power law distribution observed in e-commerce industry (Fenner et al., 2010) (see Figure 7), and because decreasing the number of products improves modeling accuracy, we only consider products with seven or more sales.
Figure 7: Distribution of sold product quantities. The x-axis describes individual products, and the y-axis the quantity sold.
As in the case of product categories, we run two log-linear models with Poisson distribution: a saturated and a reduced model. There are no significant interaction effects in the saturated model, but there are a number of significant single effects. We only include single effects with p-value equal to or below 0.1 and their corresponding category-gender interactions into the reduced model. The Chi-Squared test for lack of fit shows no significance, so the model is likely to correctly fit the data. The value of the test statistic for lack of fit (chi-squared = 0.36) is much smaller than for categories, which is due to the much stronger reduction in effects modelled relative to the total number of effects in the saturated model. The results of the reduced model can be seen in
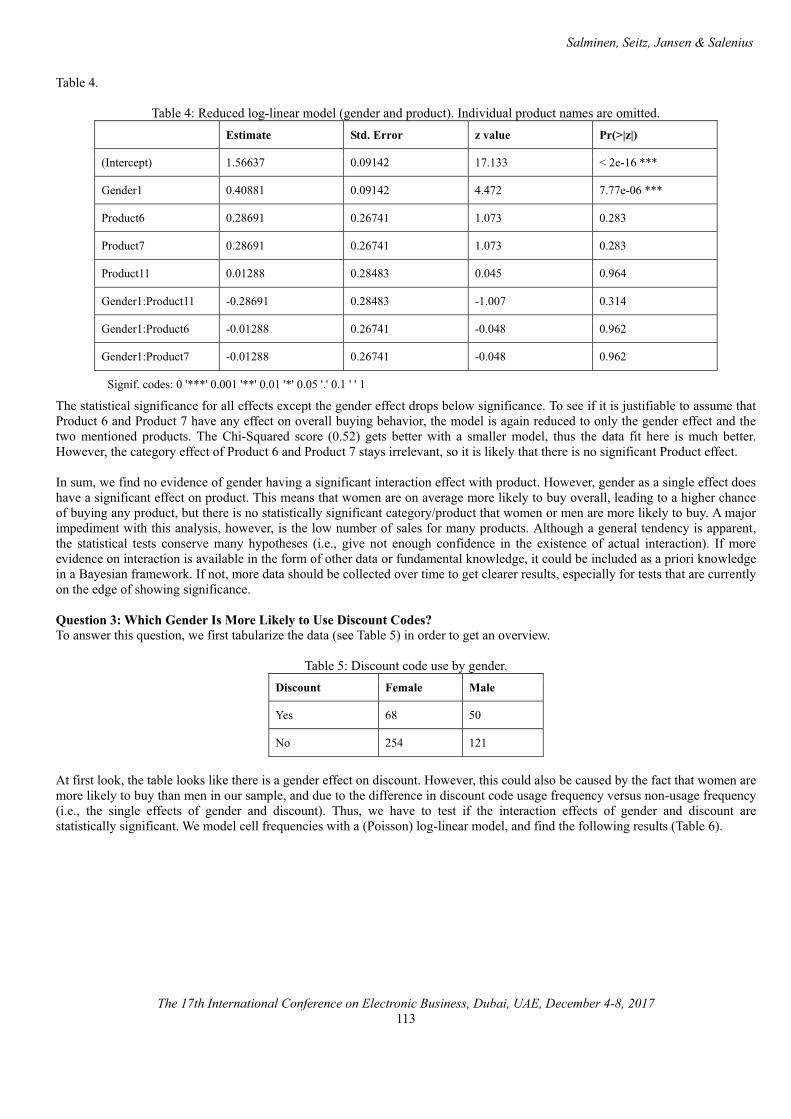
Salminen, Seitz, Jansen & Salenius
The 17th International Conference on Electronic Business, Dubai, UAE, December 4-8, 2017113
Table 4.
Table 4: Reduced log-linear model (gender and product). Individual product names are omitted.Estimate Std. Error z value Pr(>|z|)
(Intercept) 1.56637 0.09142 17.133 < 2e-16 ***
Gender1 0.40881 0.09142 4.472 7.77e-06 ***
Product6 0.28691 0.26741 1.073 0.283
Product7 0.28691 0.26741 1.073 0.283
Product11 0.01288 0.28483 0.045 0.964
Gender1:Product11 -0.28691 0.28483 -1.007 0.314
Gender1:Product6 -0.01288 0.26741 -0.048 0.962
Gender1:Product7 -0.01288 0.26741 -0.048 0.962
Signif. codes: 0 '***' 0.001 '**' 0.01 '*' 0.05 '.' 0.1 ' ' 1
The statistical significance for all effects except the gender effect drops below significance. To see if it is justifiable to assume that Product 6 and Product 7 have any effect on overall buying behavior, the model is again reduced to only the gender effect and the two mentioned products. The Chi-Squared score (0.52) gets better with a smaller model, thus the data fit here is much better. However, the category effect of Product 6 and Product 7 stays irrelevant, so it is likely that there is no significant Product effect.
In sum, we find no evidence of gender having a significant interaction effect with product. However, gender as a single effect does have a significant effect on product. This means that women are on average more likely to buy overall, leading to a higher chance of buying any product, but there is no statistically significant category/product that women or men are more likely to buy. A major impediment with this analysis, however, is the low number of sales for many products. Although a general tendency is apparent, the statistical tests conserve many hypotheses (i.e., give not enough confidence in the existence of actual interaction). If more evidence on interaction is available in the form of other data or fundamental knowledge, it could be included as a priori knowledge in a Bayesian framework. If not, more data should be collected over time to get clearer results, especially for tests that are currently on the edge of showing significance.
Question 3: Which Gender Is More Likely to Use Discount Codes?To answer this question, we first tabularize the data (see Table 5) in order to get an overview.
Table 5: Discount code use by gender.Discount Female Male
Yes 68 50
No 254 121
At first look, the table looks like there is a gender effect on discount. However, this could also be caused by the fact that women are more likely to buy than men in our sample, and due to the difference in discount code usage frequency versus non-usage frequency (i.e., the single effects of gender and discount). Thus, we have to test if the interaction effects of gender and discount are statistically significant. We model cell frequencies with a (Poisson) log-linear model, and find the following results (Table 6).
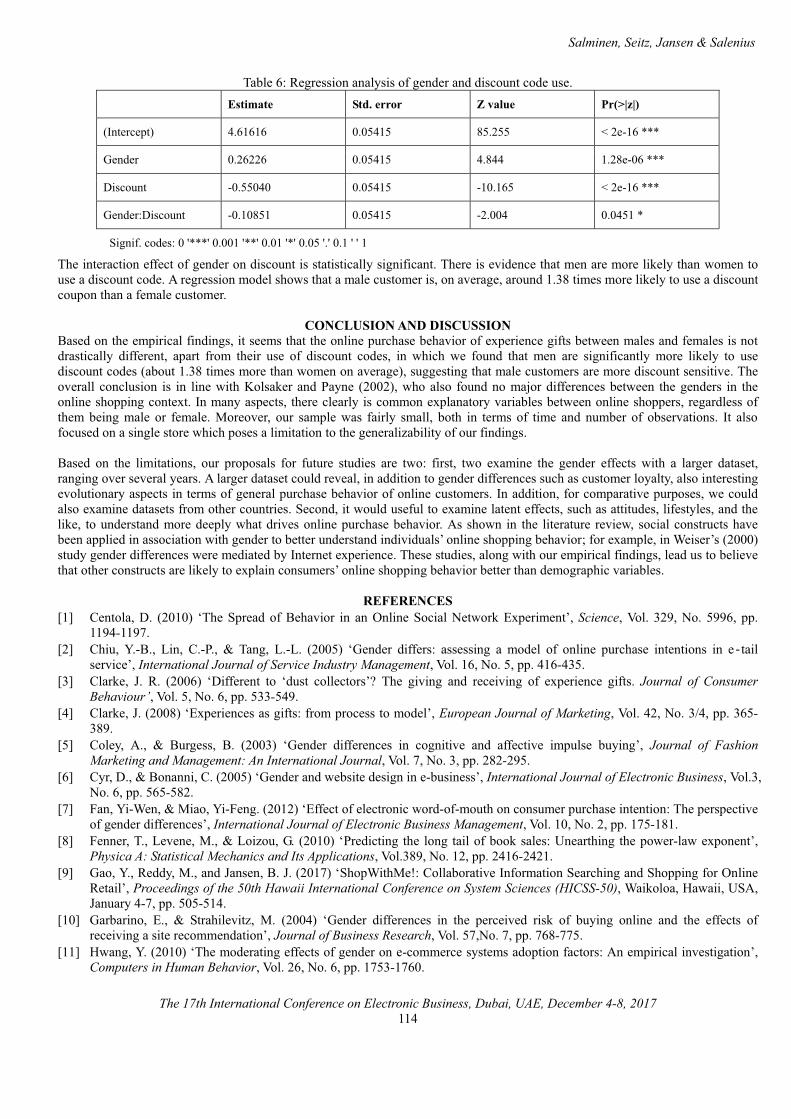
Salminen, Seitz, Jansen & Salenius
The 17th International Conference on Electronic Business, Dubai, UAE, December 4-8, 2017114
Table 6: Regression analysis of gender and discount code use.Estimate Std. error Z value Pr(>|z|)
(Intercept) 4.61616 0.05415 85.255 < 2e-16 ***
Gender 0.26226 0.05415 4.844 1.28e-06 ***
Discount -0.55040 0.05415 -10.165 < 2e-16 ***
Gender:Discount -0.10851 0.05415 -2.004 0.0451 *
Signif. codes: 0 '***' 0.001 '**' 0.01 '*' 0.05 '.' 0.1 ' ' 1
The interaction effect of gender on discount is statistically significant. There is evidence that men are more likely than women to use a discount code. A regression model shows that a male customer is, on average, around 1.38 times more likely to use a discount coupon than a female customer.
CONCLUSION AND DISCUSSIONBased on the empirical findings, it seems that the online purchase behavior of experience gifts between males and females is not drastically different, apart from their use of discount codes, in which we found that men are significantly more likely to use discount codes (about 1.38 times more than women on average), suggesting that male customers are more discount sensitive. Theoverall conclusion is in line with Kolsaker and Payne (2002), who also found no major differences between the genders in the online shopping context. In many aspects, there clearly is common explanatory variables between online shoppers, regardless ofthem being male or female. Moreover, our sample was fairly small, both in terms of time and number of observations. It also focused on a single store which poses a limitation to the generalizability of our findings.
Based on the limitations, our proposals for future studies are two: first, two examine the gender effects with a larger dataset, ranging over several years. A larger dataset could reveal, in addition to gender differences such as customer loyalty, also interesting evolutionary aspects in terms of general purchase behavior of online customers. In addition, for comparative purposes, we could also examine datasets from other countries. Second, it would useful to examine latent effects, such as attitudes, lifestyles, and the like, to understand more deeply what drives online purchase behavior. As shown in the literature review, social constructs have been applied in association with gender to better understand individuals’ online shopping behavior; for example, in Weiser’s (2000)study gender differences were mediated by Internet experience. These studies, along with our empirical findings, lead us to believe that other constructs are likely to explain consumers’ online shopping behavior better than demographic variables.
REFERENCES[1] Centola, D. (2010) ‘The Spread of Behavior in an Online Social Network Experiment’, Science, Vol. 329, No. 5996, pp.
1194-1197.[2] Chiu, Y.-B., Lin, C.-P., & Tang, L.-L. (2005) ‘Gender differs: assessing a model of online purchase intentions in e tail
service’, International Journal of Service Industry Management, Vol. 16, No. 5, pp. 416-435.[3] Clarke, J. R. (2006) ‘Different to ‘dust collectors’? The giving and receiving of experience gifts. Journal of Consumer
Behaviour’, Vol. 5, No. 6, pp. 533-549.[4] Clarke, J. (2008) ‘Experiences as gifts: from process to model’, European Journal of Marketing, Vol. 42, No. 3/4, pp. 365-
389.[5] Coley, A., & Burgess, B. (2003) ‘Gender differences in cognitive and affective impulse buying’, Journal of Fashion
Marketing and Management: An International Journal, Vol. 7, No. 3, pp. 282-295.[6] Cyr, D., & Bonanni, C. (2005) ‘Gender and website design in e-business’, International Journal of Electronic Business, Vol.3,
No. 6, pp. 565-582.[7] Fan, Yi-Wen, & Miao, Yi-Feng. (2012) ‘Effect of electronic word-of-mouth on consumer purchase intention: The perspective
of gender differences’, International Journal of Electronic Business Management, Vol. 10, No. 2, pp. 175-181.[8] Fenner, T., Levene, M., & Loizou, G. (2010) ‘Predicting the long tail of book sales: Unearthing the power-law exponent’,
Physica A: Statistical Mechanics and Its Applications, Vol.389, No. 12, pp. 2416-2421.[9] Gao, Y., Reddy, M., and Jansen, B. J. (2017) ‘ShopWithMe!: Collaborative Information Searching and Shopping for Online
Retail’, Proceedings of the 50th Hawaii International Conference on System Sciences (HICSS-50), Waikoloa, Hawaii, USA, January 4-7, pp. 505-514.
[10] Garbarino, E., & Strahilevitz, M. (2004) ‘Gender differences in the perceived risk of buying online and the effects of receiving a site recommendation’, Journal of Business Research, Vol. 57,No. 7, pp. 768-775.
[11] Hwang, Y. (2010) ‘The moderating effects of gender on e-commerce systems adoption factors: An empirical investigation’,Computers in Human Behavior, Vol. 26, No. 6, pp. 1753-1760.
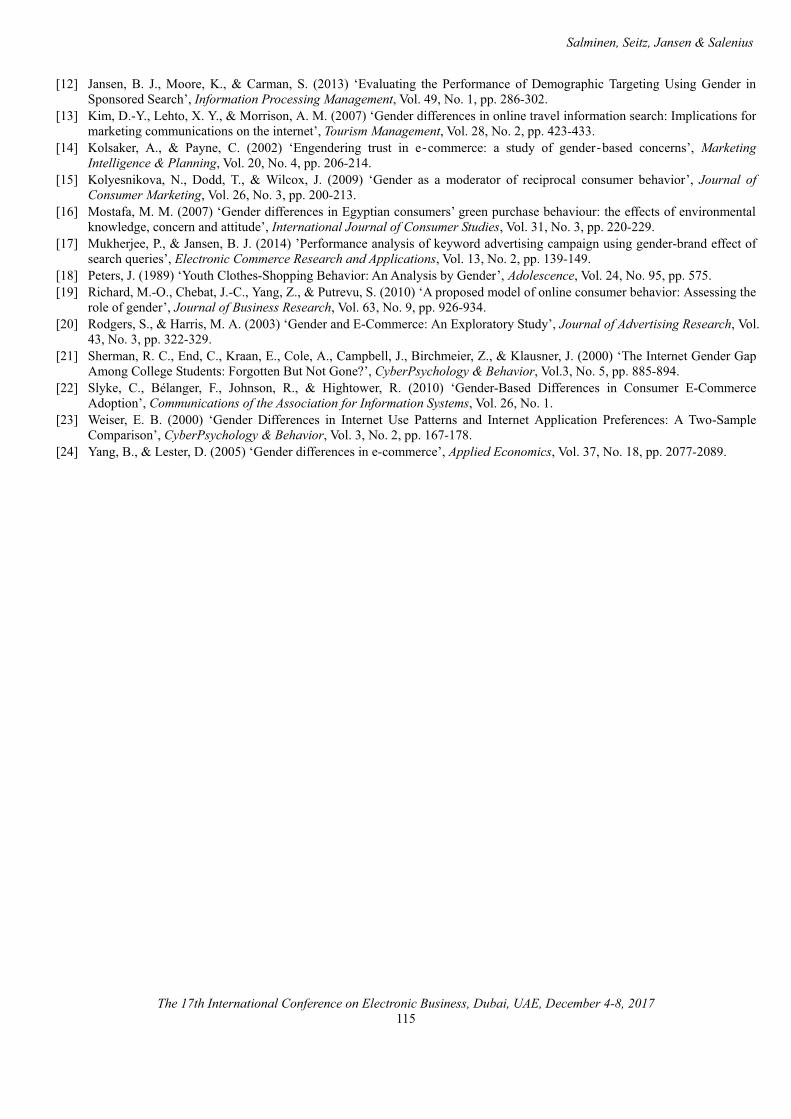
Salminen, Seitz, Jansen & Salenius
The 17th International Conference on Electronic Business, Dubai, UAE, December 4-8, 2017115
[12] Jansen, B. J., Moore, K., & Carman, S. (2013) ‘Evaluating the Performance of Demographic Targeting Using Gender in Sponsored Search’, Information Processing Management, Vol. 49, No. 1, pp. 286-302.
[13] Kim, D.-Y., Lehto, X. Y., & Morrison, A. M. (2007) ‘Gender differences in online travel information search: Implications for marketing communications on the internet’, Tourism Management, Vol. 28, No. 2, pp. 423-433.
[14] Kolsaker, A., & Payne, C. (2002) ‘Engendering trust in e commerce: a study of gender based concerns’, Marketing Intelligence & Planning, Vol. 20, No. 4, pp. 206-214.
[15] Kolyesnikova, N., Dodd, T., & Wilcox, J. (2009) ‘Gender as a moderator of reciprocal consumer behavior’, Journal of Consumer Marketing, Vol. 26, No. 3, pp. 200-213.
[16] Mostafa, M. M. (2007) ‘Gender differences in Egyptian consumers’ green purchase behaviour: the effects of environmental knowledge, concern and attitude’, International Journal of Consumer Studies, Vol. 31, No. 3, pp. 220-229.
[17] Mukherjee, P., & Jansen, B. J. (2014) ’Performance analysis of keyword advertising campaign using gender-brand effect of search queries’, Electronic Commerce Research and Applications, Vol. 13, No. 2, pp. 139-149.
[18] Peters, J. (1989) ‘Youth Clothes-Shopping Behavior: An Analysis by Gender’, Adolescence, Vol. 24, No. 95, pp. 575.[19] Richard, M.-O., Chebat, J.-C., Yang, Z., & Putrevu, S. (2010) ‘A proposed model of online consumer behavior: Assessing the
role of gender’, Journal of Business Research, Vol. 63, No. 9, pp. 926-934.[20] Rodgers, S., & Harris, M. A. (2003) ‘Gender and E-Commerce: An Exploratory Study’, Journal of Advertising Research, Vol.
43, No. 3, pp. 322-329. [21] Sherman, R. C., End, C., Kraan, E., Cole, A., Campbell, J., Birchmeier, Z., & Klausner, J. (2000) ‘The Internet Gender Gap
Among College Students: Forgotten But Not Gone?’, CyberPsychology & Behavior, Vol.3, No. 5, pp. 885-894.[22] Slyke, C., Bélanger, F., Johnson, R., & Hightower, R. (2010) ‘Gender-Based Differences in Consumer E-Commerce
Adoption’, Communications of the Association for Information Systems, Vol. 26, No. 1.[23] Weiser, E. B. (2000) ‘Gender Differences in Internet Use Patterns and Internet Application Preferences: A Two-Sample
Comparison’, CyberPsychology & Behavior, Vol. 3, No. 2, pp. 167-178. [24] Yang, B., & Lester, D. (2005) ‘Gender differences in e-commerce’, Applied Economics, Vol. 37, No. 18, pp. 2077-2089.
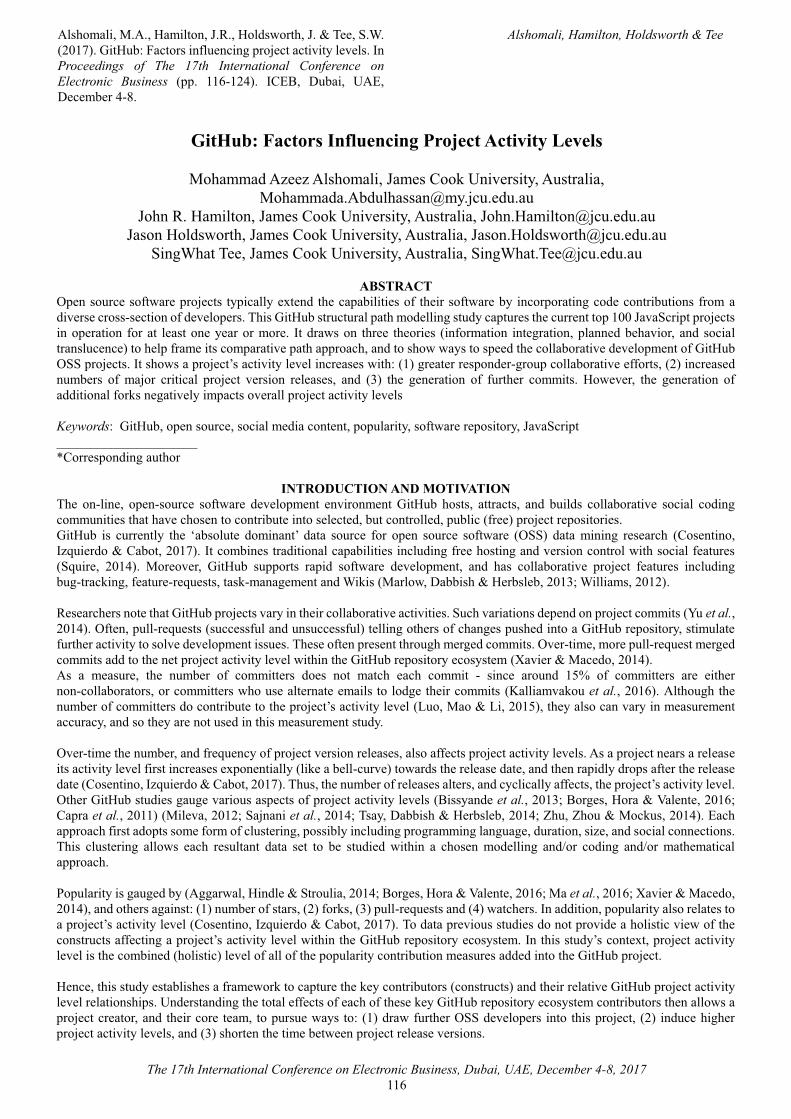
Alshomali, M.A., Hamilton, J.R., Holdsworth, J. & Tee, S.W.(2017). GitHub: Factors influencing project activity levels. InProceedings of The 17th International Conference on Electronic Business (pp. 116-124). ICEB, Dubai, UAE, December 4-8.
Alshomali, Hamilton, Holdsworth & Tee
The 17th International Conference on Electronic Business, Dubai, UAE, December 4-8, 2017116
GitHub: Factors Influencing Project Activity Levels
Mohammad Azeez Alshomali, James Cook University, Australia,[email protected]
John R. Hamilton, James Cook University, Australia, [email protected] Holdsworth, James Cook University, Australia, [email protected]
SingWhat Tee, James Cook University, Australia, [email protected]
ABSTRACTOpen source software projects typically extend the capabilities of their software by incorporating code contributions from adiverse cross-section of developers. This GitHub structural path modelling study captures the current top 100 JavaScript projects in operation for at least one year or more. It draws on three theories (information integration, planned behavior, and social translucence) to help frame its comparative path approach, and to show ways to speed the collaborative development of GitHub OSS projects. It shows a project’s activity level increases with: (1) greater responder-group collaborative efforts, (2) increasednumbers of major critical project version releases, and (3) the generation of further commits. However, the generation of additional forks negatively impacts overall project activity levels
Keywords: GitHub, open source, social media content, popularity, software repository, JavaScript _____________________*Corresponding author
INTRODUCTION AND MOTIVATIONThe on-line, open-source software development environment GitHub hosts, attracts, and builds collaborative social coding communities that have chosen to contribute into selected, but controlled, public (free) project repositories. GitHub is currently the ‘absolute dominant’ data source for open source software (OSS) data mining research (Cosentino, Izquierdo & Cabot, 2017). It combines traditional capabilities including free hosting and version control with social features(Squire, 2014). Moreover, GitHub supports rapid software development, and has collaborative project features including bug-tracking, feature-requests, task-management and Wikis (Marlow, Dabbish & Herbsleb, 2013; Williams, 2012).
Researchers note that GitHub projects vary in their collaborative activities. Such variations depend on project commits (Yu et al., 2014). Often, pull-requests (successful and unsuccessful) telling others of changes pushed into a GitHub repository, stimulate further activity to solve development issues. These often present through merged commits. Over-time, more pull-request mergedcommits add to the net project activity level within the GitHub repository ecosystem (Xavier & Macedo, 2014). As a measure, the number of committers does not match each commit - since around 15% of committers are either non-collaborators, or committers who use alternate emails to lodge their commits (Kalliamvakou et al., 2016). Although the number of committers do contribute to the project’s activity level (Luo, Mao & Li, 2015), they also can vary in measurement accuracy, and so they are not used in this measurement study.
Over-time the number, and frequency of project version releases, also affects project activity levels. As a project nears a releaseits activity level first increases exponentially (like a bell-curve) towards the release date, and then rapidly drops after the release date (Cosentino, Izquierdo & Cabot, 2017). Thus, the number of releases alters, and cyclically affects, the project’s activity level.Other GitHub studies gauge various aspects of project activity levels (Bissyande et al., 2013; Borges, Hora & Valente, 2016; Capra et al., 2011) (Mileva, 2012; Sajnani et al., 2014; Tsay, Dabbish & Herbsleb, 2014; Zhu, Zhou & Mockus, 2014). Each approach first adopts some form of clustering, possibly including programming language, duration, size, and social connections. This clustering allows each resultant data set to be studied within a chosen modelling and/or coding and/or mathematical approach.
Popularity is gauged by (Aggarwal, Hindle & Stroulia, 2014; Borges, Hora & Valente, 2016; Ma et al., 2016; Xavier & Macedo, 2014), and others against: (1) number of stars, (2) forks, (3) pull-requests and (4) watchers. In addition, popularity also relates to a project’s activity level (Cosentino, Izquierdo & Cabot, 2017). To data previous studies do not provide a holistic view of the constructs affecting a project’s activity level within the GitHub repository ecosystem. In this study’s context, project activity level is the combined (holistic) level of all of the popularity contribution measures added into the GitHub project.
Hence, this study establishes a framework to capture the key contributors (constructs) and their relative GitHub project activity level relationships. Understanding the total effects of each of these key GitHub repository ecosystem contributors then allows a project creator, and their core team, to pursue ways to: (1) draw further OSS developers into this project, (2) induce higherproject activity levels, and (3) shorten the time between project release versions.
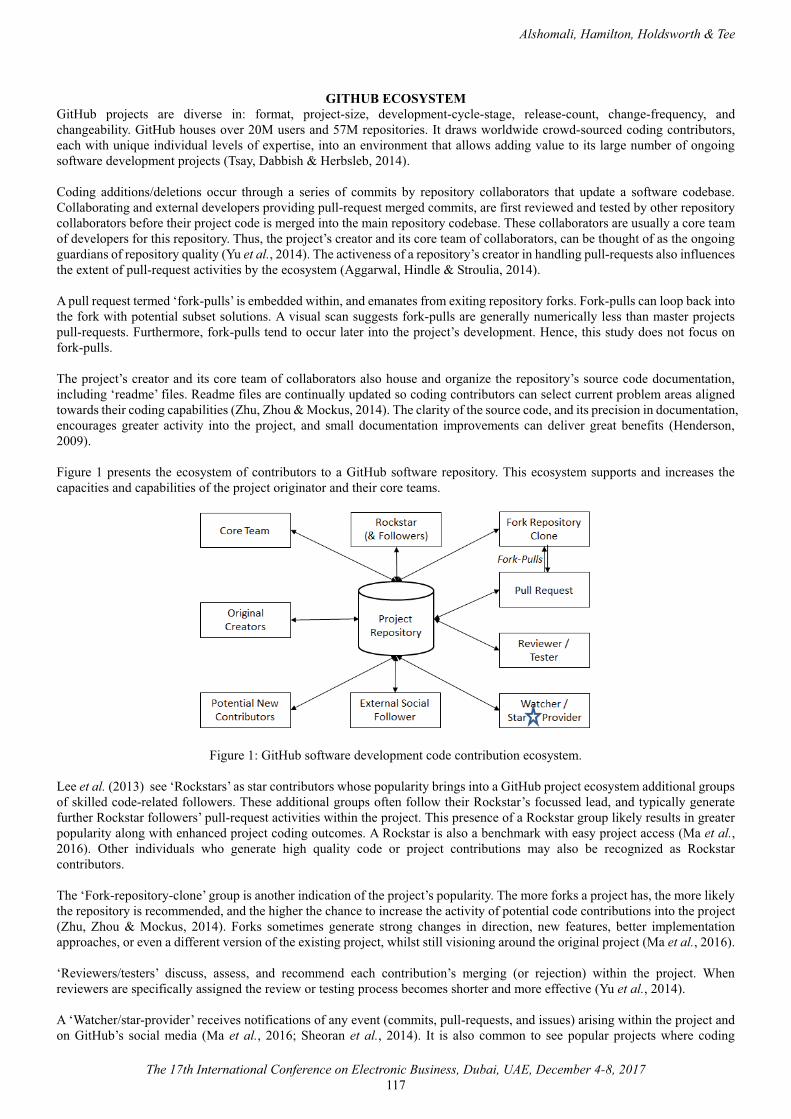
Alshomali, Hamilton, Holdsworth & Tee
The 17th International Conference on Electronic Business, Dubai, UAE, December 4-8, 2017117
GITHUB ECOSYSTEMGitHub projects are diverse in: format, project-size, development-cycle-stage, release-count, change-frequency, and changeability. GitHub houses over 20M users and 57M repositories. It draws worldwide crowd-sourced coding contributors, each with unique individual levels of expertise, into an environment that allows adding value to its large number of ongoing software development projects (Tsay, Dabbish & Herbsleb, 2014).
Coding additions/deletions occur through a series of commits by repository collaborators that update a software codebase. Collaborating and external developers providing pull-request merged commits, are first reviewed and tested by other repository collaborators before their project code is merged into the main repository codebase. These collaborators are usually a core team of developers for this repository. Thus, the project’s creator and its core team of collaborators, can be thought of as the ongoing guardians of repository quality (Yu et al., 2014). The activeness of a repository’s creator in handling pull-requests also influencesthe extent of pull-request activities by the ecosystem (Aggarwal, Hindle & Stroulia, 2014).
A pull request termed ‘fork-pulls’ is embedded within, and emanates from exiting repository forks. Fork-pulls can loop back into the fork with potential subset solutions. A visual scan suggests fork-pulls are generally numerically less than master projects pull-requests. Furthermore, fork-pulls tend to occur later into the project’s development. Hence, this study does not focus on fork-pulls.
The project’s creator and its core team of collaborators also house and organize the repository’s source code documentation, including ‘readme’ files. Readme files are continually updated so coding contributors can select current problem areas aligned towards their coding capabilities (Zhu, Zhou & Mockus, 2014). The clarity of the source code, and its precision in documentation, encourages greater activity into the project, and small documentation improvements can deliver great benefits (Henderson, 2009).
Figure 1 presents the ecosystem of contributors to a GitHub software repository. This ecosystem supports and increases the capacities and capabilities of the project originator and their core teams.
Figure 1: GitHub software development code contribution ecosystem.
Lee et al. (2013) see ‘Rockstars’ as star contributors whose popularity brings into a GitHub project ecosystem additional groups of skilled code-related followers. These additional groups often follow their Rockstar’s focussed lead, and typically generate further Rockstar followers’ pull-request activities within the project. This presence of a Rockstar group likely results in greater popularity along with enhanced project coding outcomes. A Rockstar is also a benchmark with easy project access (Ma et al., 2016). Other individuals who generate high quality code or project contributions may also be recognized as Rockstar contributors.
The ‘Fork-repository-clone’ group is another indication of the project’s popularity. The more forks a project has, the more likely the repository is recommended, and the higher the chance to increase the activity of potential code contributions into the project(Zhu, Zhou & Mockus, 2014). Forks sometimes generate strong changes in direction, new features, better implementation approaches, or even a different version of the existing project, whilst still visioning around the original project (Ma et al., 2016).
‘Reviewers/testers’ discuss, assess, and recommend each contribution’s merging (or rejection) within the project. When reviewers are specifically assigned the review or testing process becomes shorter and more effective (Yu et al., 2014).
A ‘Watcher/star-provider’ receives notifications of any event (commits, pull-requests, and issues) arising within the project and on GitHub’s social media (Ma et al., 2016; Sheoran et al., 2014). It is also common to see popular projects where coding

Alshomali, Hamilton, Holdsworth & Tee
The 17th International Conference on Electronic Business, Dubai, UAE, December 4-8, 2017118
activities are seen to be successful as being ‘starred’ extensively, and experiencing higher commit frequencies (Cosentino, Izquierdo & Cabot, 2017). Watchers tend to contribute to popularity by their external activities on social media, and other digital community forums.
‘External-social-followers’ track the actions of other coding developers of good reputation (Luo, Mao & Li, 2015). Dabbish et al.(2012) note GitHub’s External-social-follower and Tester/Watcher groups each contribute transparency into a project. They also bring additional social considerations, and their social actions can contribute towards the project’s popularity.
‘Potential-new-contributors’ can be drawn into a GitHub project by: (1) current promotional activities, (2) social media, and/or Twitter, and/or Wiki awareness campaigns, (3) following others, (4) a desire to code, and (5) sourcing a personal area of interest.
The ‘Project-repository’ houses the software codebase along with various ongoing development streams (branches) as well as Wiki, readme, and other contributions. Many software develops a regard GitHub repository as a professional platform where to host their own projects or find other interesting open-source software projects (Wu et al., 2014). Key GitHub programming languages are either web-focused (JavaScript, Ruby, PHP, CSS) or system-oriented (C, C++, Python). JavaScript, Java, and Python are the top three GitHub programming languages (Cosentino, Izquierdo & Cabot, 2017).
Github ProjectsGitHub projects are diverse in: format, project-size, development-cycle-stage, release-count, change-frequency, change-degree, forks, watchers, and contributor-skills (Aggarwal, Hindle & Stroulia, 2014). Such potentially diverse project variations can also complicate project comparisons.
When comparing relationships within and around GitHub projects (Aggarwal, Hindle & Stroulia, 2014; Cosentino, Izquierdo & Cabot, 2017) further divide different projects. Their specific categories include: (1) popularity delivering higher/consistent documentation or (2) library projects needing less documentation. Over time, documentation quality improves especially in larger projects and as responders (reporters or assignees) become more experienced (Cosentino, Izquierdo & Cabot, 2017; Xavier & Macedo, 2014). Thus comparative longitudinal GitHub studies remain complex.
GITHUB MEASUREMENT CATEGORIESSome of the measurement instruments available to GitHub researchers include:
� Project-type: GitHub projects range from major corporate software developments such as Adobe bracket, or Facebook that incorporate forks when overcoming issues and/or when speeding new release versions, through to small core creator / developer projects.
� Duration-of-project: Large GitHub projects tend to remain active, forked, retain interest and be long-term ongoing operations (Cosentino, Izquierdo & Cabot, 2017).
� Project-measures: GitHub measures commits, committers, software-releases, popularity-of-project, number-of-stars-provided, forks, watchers, followers, testers, and reviewers.
� Project-language: Key common GitHub software languages (discussed above) draw like-skilled programmers, and are more likely to retain project communities in excess of 40 (Cosentino, Izquierdo & Cabot, 2017).
� Readme files: 95% of popular GitHub projects have non-empty readme files (Tsay, Dabbish & Herbsleb, 2014).
GitHub popular projects typically engage forking. They also show clearer, more-consistent documentation advice (Aggarwal, Hindle & Stroulia, 2014), and useful documentation can draw-in other coding contributors (Hata et al., 2015). This documentation may also be supported by testing mechanisms (Tsay, Dabbish & Herbsleb, 2014), Wikis (McDONALD et al., 2014), Twitter (Singer, Figueira Filho & Storey, 2014), social media and websites (Jiang et al., 2017).
GITHUB STUDYTheoretical BasisGitHub is recognized in (Wu et al., 2014) study as a professional platform where software developers can: (1) host their own project, or (2) contribute towards other interesting projects, or (3) keep informed regarding what their peers are coding. GitHub’s repository projects are typically not developed by individuals, but by a community of coders and associates working collaboratively. Hence, the more active the community project becomes, the quicker it progresses towards task completion (coding, documentation, and discussion).
The ‘Theory of Social Translucence’ suggests a clear awareness of a project and its design strategies, is advanced where a coherent behavior occurs through the visible sharing of each project collaborator’s identity, contributions, and ongoing activities. These behavioral actions also occur within a GitHub project’s community (Dabbish et al., 2012). This transparency extends out to GitHub followers, watchers, and stars-provided, and it reaches into social supporting areas including Facebook, websites, Twitter, and Wikis (Aggarwal, Hindle & Stroulia, 2014). Thus, progress is likely quicker where coherent behavior is permeated across a GitHub project’s community.
GitHub behaviorally ties developers into a project via ‘Information Integration Theory’ - which draws on the ‘Theory of Planned
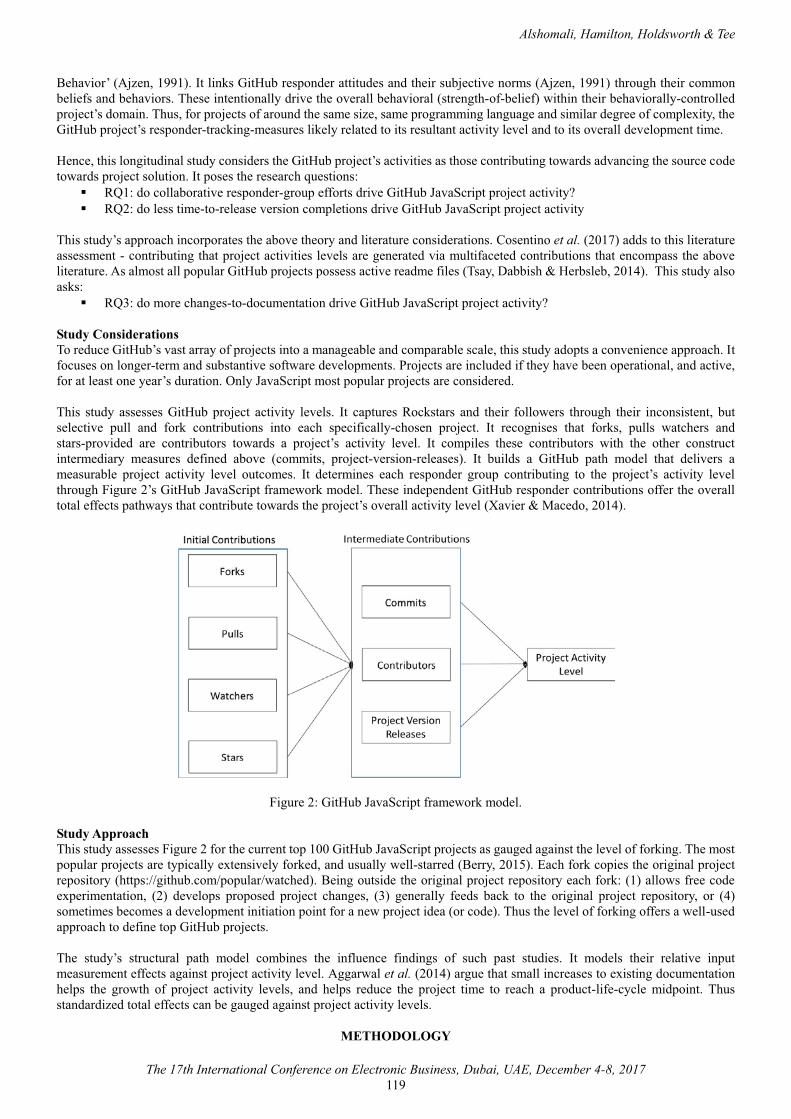
Alshomali, Hamilton, Holdsworth & Tee
The 17th International Conference on Electronic Business, Dubai, UAE, December 4-8, 2017119
Behavior’ (Ajzen, 1991). It links GitHub responder attitudes and their subjective norms (Ajzen, 1991) through their common beliefs and behaviors. These intentionally drive the overall behavioral (strength-of-belief) within their behaviorally-controlled project’s domain. Thus, for projects of around the same size, same programming language and similar degree of complexity, theGitHub project’s responder-tracking-measures likely related to its resultant activity level and to its overall development time.
Hence, this longitudinal study considers the GitHub project’s activities as those contributing towards advancing the source code towards project solution. It poses the research questions:
� RQ1: do collaborative responder-group efforts drive GitHub JavaScript project activity? � RQ2: do less time-to-release version completions drive GitHub JavaScript project activity
This study’s approach incorporates the above theory and literature considerations. Cosentino et al. (2017) adds to this literature assessment - contributing that project activities levels are generated via multifaceted contributions that encompass the above literature. As almost all popular GitHub projects possess active readme files (Tsay, Dabbish & Herbsleb, 2014). This study also asks:
� RQ3: do more changes-to-documentation drive GitHub JavaScript project activity?
Study ConsiderationsTo reduce GitHub’s vast array of projects into a manageable and comparable scale, this study adopts a convenience approach. It focuses on longer-term and substantive software developments. Projects are included if they have been operational, and active, for at least one year’s duration. Only JavaScript most popular projects are considered.
This study assesses GitHub project activity levels. It captures Rockstars and their followers through their inconsistent, but selective pull and fork contributions into each specifically-chosen project. It recognises that forks, pulls watchers and stars-provided are contributors towards a project’s activity level. It compiles these contributors with the other construct intermediary measures defined above (commits, project-version-releases). It builds a GitHub path model that delivers a measurable project activity level outcomes. It determines each responder group contributing to the project’s activity level through Figure 2’s GitHub JavaScript framework model. These independent GitHub responder contributions offer the overall total effects pathways that contribute towards the project’s overall activity level (Xavier & Macedo, 2014).
Figure 2: GitHub JavaScript framework model.
Study ApproachThis study assesses Figure 2 for the current top 100 GitHub JavaScript projects as gauged against the level of forking. The most popular projects are typically extensively forked, and usually well-starred (Berry, 2015). Each fork copies the original project repository (https://github.com/popular/watched). Being outside the original project repository each fork: (1) allows free codeexperimentation, (2) develops proposed project changes, (3) generally feeds back to the original project repository, or (4) sometimes becomes a development initiation point for a new project idea (or code). Thus the level of forking offers a well-used approach to define top GitHub projects.
The study’s structural path model combines the influence findings of such past studies. It models their relative input measurement effects against project activity level. Aggarwal et al. (2014) argue that small increases to existing documentation helps the growth of project activity levels, and helps reduce the project time to reach a product-life-cycle midpoint. Thus standardized total effects can be gauged against project activity levels.
METHODOLOGY
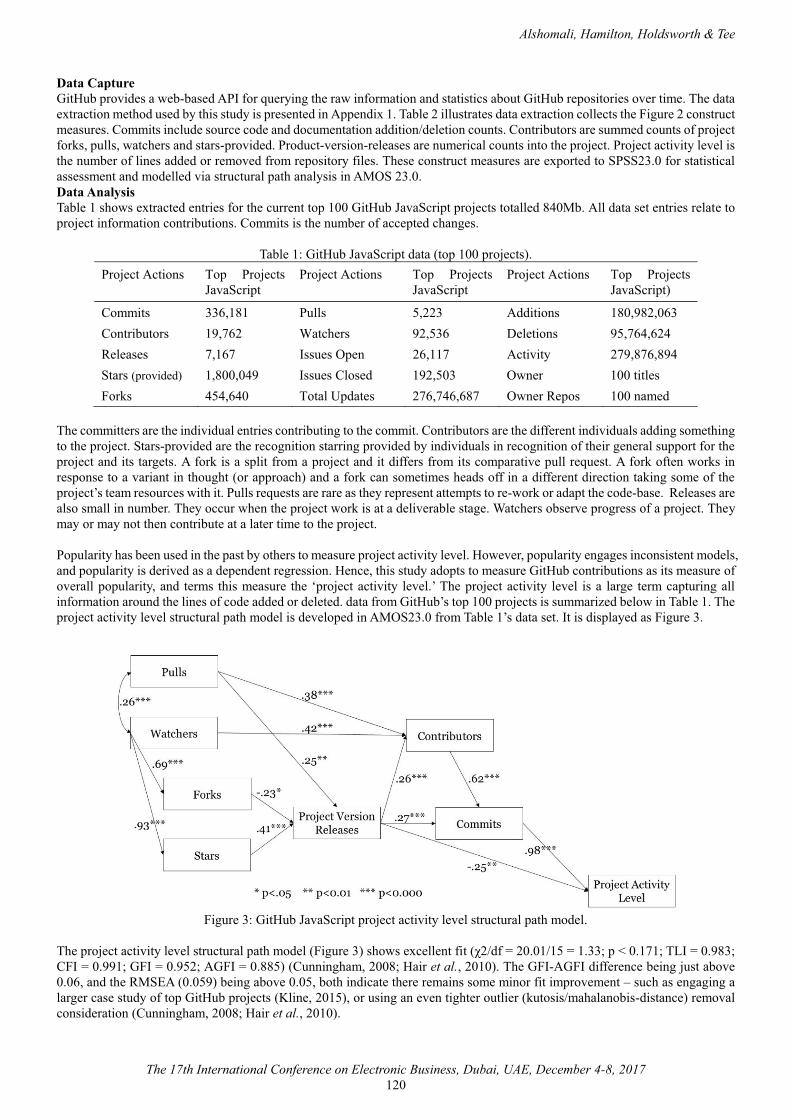
Alshomali, Hamilton, Holdsworth & Tee
The 17th International Conference on Electronic Business, Dubai, UAE, December 4-8, 2017120
Data CaptureGitHub provides a web-based API for querying the raw information and statistics about GitHub repositories over time. The data extraction method used by this study is presented in Appendix 1. Table 2 illustrates data extraction collects the Figure 2 construct measures. Commits include source code and documentation addition/deletion counts. Contributors are summed counts of project forks, pulls, watchers and stars-provided. Product-version-releases are numerical counts into the project. Project activity level is the number of lines added or removed from repository files. These construct measures are exported to SPSS23.0 for statisticalassessment and modelled via structural path analysis in AMOS 23.0.Data AnalysisTable 1 shows extracted entries for the current top 100 GitHub JavaScript projects totalled 840Mb. All data set entries relate to project information contributions. Commits is the number of accepted changes.
Table 1: GitHub JavaScript data (top 100 projects).Project Actions Top Projects
JavaScriptProject Actions Top Projects
JavaScriptProject Actions Top Projects
JavaScript)
Commits 336,181 Pulls 5,223 Additions 180,982,063Contributors 19,762 Watchers 92,536 Deletions 95,764,624Releases 7,167 Issues Open 26,117 Activity 279,876,894Stars (provided) 1,800,049 Issues Closed 192,503 Owner 100 titlesForks 454,640 Total Updates 276,746,687 Owner Repos 100 named
The committers are the individual entries contributing to the commit. Contributors are the different individuals adding something to the project. Stars-provided are the recognition starring provided by individuals in recognition of their general support for the project and its targets. A fork is a split from a project and it differs from its comparative pull request. A fork often works in response to a variant in thought (or approach) and a fork can sometimes heads off in a different direction taking some of theproject’s team resources with it. Pulls requests are rare as they represent attempts to re-work or adapt the code-base. Releases are also small in number. They occur when the project work is at a deliverable stage. Watchers observe progress of a project. Theymay or may not then contribute at a later time to the project.
Popularity has been used in the past by others to measure project activity level. However, popularity engages inconsistent models, and popularity is derived as a dependent regression. Hence, this study adopts to measure GitHub contributions as its measure of overall popularity, and terms this measure the ‘project activity level.’ The project activity level is a large term capturing all information around the lines of code added or deleted. data from GitHub’s top 100 projects is summarized below in Table 1. Theproject activity level structural path model is developed in AMOS23.0 from Table 1’s data set. It is displayed as Figure 3.
Figure 3: GitHub JavaScript project activity level structural path model.
The project activity level structural path model (Figure 3) shows excellent fi�������������������++,���-��.,�/01����2�+,�CFI = 0.991; GFI = 0.952; AGFI = 0.885) (Cunningham, 2008; Hair et al., 2010). The GFI-AGFI difference being just above 0.06, and the RMSEA (0.059) being above 0.05, both indicate there remains some minor fit improvement – such as engaging a larger case study of top GitHub projects (Kline, 2015), or using an even tighter outlier (kutosis/mahalanobis-distance) removal consideration (Cunningham, 2008; Hair et al., 2010).
Alshomali, Hamilton, Holdsworth & Tee
The 17th International Conference on Electronic Business, Dubai, UAE, December 4-8, 2017121
Three outliers (cases 25, 31, 37) were removed - leaving a final data set of 97. Ideally the data set of projects should exceed 150-160 (Hair et al., 2010; Muthén & Muthén, 2002). However structural models retain meaning within sample sizes of 100–150case range (Anderson & Gerbing, 1988; Ding, Velicer & Harlow, 1995; Tabachnick & Fidell, 2012; Tinsley & Tinsley, 1987), and with 10 times as many cases as parameters, this data set of 97 remains acceptable (Kline, 2015). The final data set contains no notable mahalanobis outlier distance (SD) gaps through to the mean. Also, all construct skews are acceptable (< 3), but with vast differences in project scope and scale, multivariate kurtosis is large (113) but acceptable (Hair et al., 2010). Thus the model is suitable for structural path analysis.Watchers are highly correlated with the stars-provided to the project, and strongly correlated with the degree of forking. The level of forking exerts negative influences towards project version releases as these draw potential project contributors into non-core development tasks. The number of project version releases exerts cyclical peak-and-trough influences that negatively directly impact the overall project activity, but positively impact into commits and contributors. Commits and project level activity move in-line with each other, but they are different constructs. Contributors (via commits) exert an intermediate effect on project level activity.
DISCUSSIONFigure 3’s project activity level structural path model is summarized in Table 2’s standardized total effects. Table 2 shows the key effects in generating Project Activity Levels. The major contributors are the pull requests, the watchers, the number-of-releases, the total different contributors, and the commits. The commits lodged directly mirror the Project Activity Levels. Thus, fivelevers can be used by the project creators and their core team leaders when seeking to speed their project’s software development processes. The number of stars-provided to the project make a lesser contribution.
The forks actually work against the project’s progress by generating very minor negative total effects into the project’s activity level. They sometimes dilute the focus of the project’s software development strategies. Here, a fork may generate new ideas, create a new project, and then draw some original project developers off into this new software development direction, thus retarding the original project’s activity level.
Table 2: Standardized Total Effects for current top (97/100) GitHub JavaScript Projects.
Pulls Watchers Forks Stars (provided) Releases Contributor
sCommit
s
Forks 0 0.69 0 0 0 0 0Stars (provided) 0 0.93 0 0 0 0 0Releases 0.25 0.22 -0.23 0.41 0 0 0Contributors 0.45 0.48 -0.06 0.11 0.26 0 0Commits 0.34 0.35 -0.10 0.18 0.43 0.62 0Activity 0.22 0.22 -0.08 0.14 0.35 0.35 0.98
Figure 3 shows collaborative responder-group efforts do drive GitHub JavaScript project activities as a multi-pronged approach (RQ1). Research question RQ2 is supported as major (critical) version releases do positively affect project activity levels. Multiple intermittent and minor version releases exert less GitHub JavaScript project activity levels because they often involve slight improvements, and only require minimal activity level contributions. The remaining research RQ3 question is supported when a code commit’s documentation is lodged. Here, more commits also brings more changes to documentation, and as a GitHub JavaScript project’s activity level rises, additional documentation emerges as a continual project requirement.
IMPLICATIONSTheoretical ImplicationsThis GitHub study follows responder behavioral patterns, in particular Information Integration Theory, and the Theory of Social Translucence. This framework allows behavioral activities to be gauged collectively and measured against each project’s overall activity level. This allows a new way to compare projects and to understand projects once the masking features such as: size, programming-language, degree-of-complexity and longevity are removed. Extensions to this study can map each project responder’s/collaborator’s identity, contributions, and ongoing activities throughto GitHub repository followers, watchers and stars-provided into their social interaction domains including Facebook, websites, Twitter, and Wikis (Aggarwal, Hindle & Stroulia, 2014). Here, interpretations of value by understanding social network site consumer engagements (Hamilton & Tee, 2013) can be incorporated to extend the behavioral understanding of GitHub’s social and external responders.
Practical ImplicationsThe activity level of JavaScript project responders is measured using repository-collated measures. These behavioral measures first include pull-requests and project watchers which results in subsequent commit changes, or watchers changing roles and then generating new pull-requests against the project’s repository. Pull-requests impact on project contributions and on project version releases, and with commits positively influence on project activity levels. Commit changes are generally clarified
Alshomali, Hamilton, Holdsworth & Tee
The 17th International Conference on Electronic Business, Dubai, UAE, December 4-8, 2017122
through comments with linkages into project documentation. If accepted, these commits may also appear as ongoing documentation updates. Table 3 shows five constructs can be leveraged to jointly (or individually) deliver, faster project software-development processes.
A lead focus for the repository creator and the core team of collaborators is to generate additional commits. Here, commits can be encouraged by cross-promotional strategies including: (1) encouraging pull-requesters to respond and to generate multiple commits, (2) promoting the starring of the ongoing value of the project’s development on Facebook, Twitter, and web media, andalso converting social media watchers into pull requesters, and (3) engaging developer forums, Wikis, conferences and across other social connectivity avenues directly targeted towards encouraging more pull requests and follow-up commits.
Social media sites can also add transaction-related project information via inclusions of community ‘fan-pages.’ Fan-pages help to build stronger communities, provided they show usefulness, economic value, and are suitably branded. Here promotions and/or other consumer benefits can be incentivized (Hamilton & Tee, 2013). In addition, to further highlight and draw developer traffic, fan-pages news can be linked to HackerNews and GitHub Explore (Borges, Hora & Valente, 2016). Ultimately the key internal approach is to generate very-rapidly reviewing and incorporating decisions across all commits.
A second behavioral approach is to recognize committers by crediting their contributions against their personal email. This is achievable by recognizing, ranking, and promoting each contribution as enhancing: performance and/or quality and/or service and/or economic value and/or emotional perception (Hamilton, John R & Tee, 2015). These value recognition triggers are rewards to the respondent committer, and they likely positively affect the committer’s satisfaction and ongoing loyalty (Hamilton, John R. & Tee, 2015). This recognition approach behaviorally encourages the committer to pursue further opportunities of benefit to a GitHub project. It also enhances their personal profile, and it promotes more project activity.This study considers a collation of contribution constructs that have sometimes been used as popularity measures as exhibiting behaviors harmonious with the project. It shows all of these contribute directly or indirectly as build components of the project’s activity level.
This study recognizes that increasing contributors is a complex task. For example, the project’s activity level is cyclic, peaking around each version release (Borges, Hora & Valente, 2016). More major and critical project releases drive activity levels. These release-date developer traffic hypes can be enhanced with boosts via continual social media project-related achievement postings (Cassidy & Hamilton, 2016) - provided quality public communications are delivered.
FUTURE RESEARCHMeasurement AspectsTo further validate the project activity level GitHub JavaScript structural path model two additional studies are suggested (1) random sampling across the full suite of JavaScript projects, and (2) re-testing against each key GitHub programming language.
The refinement of the pull request counts is another measurement consideration. Pull-requests occur because of internal commits for review as well as and via forked versions of a repository. Some fork-pull-requests loop back into the originating repository. Hence, it may be useful to categorise pull-requests, and also to consider longitudinally if fork-pulls do actually occur later during project development. This research is underway.
There remains a need to create and deploy APIs that monitor project activity levels over time. This can expose where open source software development offers maximum improvement for the GitHub project under consideration.Commits offer detailed content analysis that can be mined to elucidate where, and how, the documentation of substantive top performing programming language projects can be improved. The relevance of which commit(s) provide most benefit is another area waiting development.
Theoretical AspectsGitHub studies can be theory-based, and/or behaviorally-based, and/or translucently-based, and/or values-based. They can also be linked via social networks and web media through into other consumer marketing and retailing approaches - typically focusing on consumer motivation, consumption and gratification aspects (Hamilton, John R & Tee, 2015).
Managerial AspectsThe project activity level model is applicable for GitHub JavaScript project creators. It can be astutely managed to generate high project level activities. It can be interpreted through Table 2’s total effects and Figure 3’s path strengths towards better targeting, and harnessing of a project’s reach, and engagement, across relevant software development communities.
Learning how to extract pertinent information from responder review comments is often useful to a repository originator seeking to improve ongoing project deliverables. Approaches to understanding big data vary, but Bello-Orgaz et al. (2016) describe big data social capture approaches are of use when considering GitHub’s watchers.
Projects can be more closely managed by developing text capture routines to extract responder key words from GitHub
Alshomali, Hamilton, Holdsworth & Tee
The 17th International Conference on Electronic Business, Dubai, UAE, December 4-8, 2017123
documentation. For example value(s)-related words epitomising behaviors can include motivation (intentions to act) towards engaging/actioning, consumptive actions being undertaken, and gratification reflections of actions delivered. This data can then be real-time analysed, thus keeping GitHub repository originators behaviorally attuned to individuals and to their core collaborators.
CONCLUSIONThe current top 100 GitHub JavaScript projects are assessed across various pathways of project contribution. Data captured from these popular projects differs in: format, project-size, development-cycle-stage, change-frequency, change-degree, forks, watchers, and contributor-skills, and has remained difficult to interpret. Three theories (Information Integration, Planned Behavior, and Social Translucence) frame this study’s comparative project activity level structural path model approach.
A JavaScript project’s activity level can be enhance with increased responder-group collaborative efforts, with more frequent major project version releases, and with greater numbers of commit project additions and/or deletions. The generation of additional forks delivers a minor net negative impact on project activity levels. Hence, repository originators and their core team of collaborators should ensure forking contributions remain under close monitoring and assessment.
REFERENCES[1] Aggarwal, K., Hindle, A. & Stroulia, E. (2014). Co-evolution of project documentation and popularity within Github. In
Proceedings of the 11th Working Conference on Mining Software Repositories - MSR 2014 (pp. 360-363).[2] Ajzen, I. (1991). The theory of planned behavior. Organizational Behavior and Human Decision Processes, 50(2),
179-211.[3] Anderson, J.C. & Gerbing, D.W. (1988). Structural equation modeling in practice: A review and recommended two-step
approach. Psychological Bulletin, 103(3), 411-423.[4] Bello-Orgaz, G., Jung, J.J. & Camacho, D. (2016). Social big data: Recent achievements and new challenges. Information
Fusion, 28, 45-59.[5] Berry, R. (2015). What are the most popular GitHub repositories of all time?. Quora. Retrieved from
https://www.quora.com (3 September 2017).[6] Bissyande, T.F., Thung, F., Lo, D., Jiang, L. & Reveillere, L. (2013). Popularity, interoperability, and impact of
programming languages in 100,000 open source projects. In Proceedings of the International Computer Software and Applications Conference (pp. 303-312).
[7] Borges, H., Hora, A. & Valente, M.T. (2016). Understanding the factors that impact the popularity of GitHub repositories.In Proceedings of the 2016 IEEE International Conference on Software Maintenance and Evolution - ICSME 2016 (pp. 334-344).
[8] Capra, E., Francalanci, C., Merlo, F. & Rossi-Lamastra, C. (2011). Firms’ involvement in Open Source projects: A trade-off between software structural quality and popularity. Journal of Systems and Software, 84(1), 144-161.
[9] Cassidy, L. J., & Hamilton, J. (2016). Website benchmarking: an abridged WAM study. Benchmarking: An International Journal, 23(7), 2061-2079.
[10] Cosentino, V., Izquierdo, J.L.C. & Cabot, J. (2017). A systematic mapping study of software development with GitHub, IEEE Access, 5, 7173-7192.
[11] Cunningham, E. (2008). A Practical Guide to Structure Equation Modeling Using AMOS. Melbourne: Streams Statsline,.[12] Dabbish, L., Stuart, C., Tsay, J. & Herbsleb, J. (2012). Social coding in GitHub: transparency and collaboration in an open
software repository. In Proceedings of the ACM 2012 Conference on Computer Supported Cooperative Work (pp.1277-1286).
[13] Ding, L., Velicer, W.F. & Harlow, L.L. (1995). Effects of estimation methods, number of indicators per factor, and improper solutions on structural equation modeling fit indices. Structural Equation Modeling: A Multidisciplinary Journal, 2(2),119-143.
[14] Hair, J.F., Anderson, R.E., Tatham, R.L. & Black, W.C. (2010), Multivariate Data Analysis (7th ed.). Uppersaddle River, New Jersey: Pearson Education International.
[15] Hamilton, J.R. & Tee, S. (2013). Understanding social network site consumer engagements. In Proceedings of the 24th Australasian Conference on Information Systems. Melbourne, VIC, Australia, 4-6 December.
[16] Hamilton, J.R. & Tee, S. (2015). Engaging technologies-savvy consumers with the internet of things. In Proceedings of the 15th International Conference on Electronic Business - ICEB 2015 (pp. 242-246).
[17] Hamilton, J.R. & Tee, S. (2015). Expectations-to-value: Connecting customers with business offerings. International Journal of Internet Marketing and Advertising, 9(2), 121-140.
[18] Hata, H., Todo, T., Onoue, S. & Matsumoto, K. (2015). Characteristics of sustainable OSS projects: A theoretical and empirical study. In Proceedings of the 8th International Workshop on Cooperative and Human Aspects of Software
Alshomali, Hamilton, Holdsworth & Tee
The 17th International Conference on Electronic Business, Dubai, UAE, December 4-8, 2017124
Engineering - CHASE 2015 (pp. 15-21).[19] Henderson, S. (2009). How do people manage their documents?: An empirical investigation into personal document
management practices among knowledge workers. (Doctoral dissertation, The University of Auckland, NZ)..[20] Jiang, J., Lo, D., He, J., Xia, X., Kochhar, P.S. & Zhang, L. (2017). Why and how developers fork what from whom in
GitHub. Empirical Software Engineering, 22(1), 547-578.[21] Kalliamvakou, E., Gousios, G., Blincoe, K., Singer, L., German, D.M. & Damian, D. (2016). An in-depth study of the
promises and perils of mining GitHub. Empirical Software Engineering, 21(5), 2035-2071.[22] Kline, R.B. (2015). Principles and Practice of Structural Equation Modeling, New York: The Guilford Press.[23] Lee, M. J., Ferwerda, B., Choi, J., Hahn, J., Moon, J. Y., & Kim, J. (2013, April). GitHub developers use rockstars to
overcome overflow of news. In CHI'13 Extended Abstracts on Human Factors in Computing Systems (pp. 133-138). ACM.[24] Luo, Z., Mao, X. & Li, A. (2015). An exploratory research of GitHub based on graph model. In Ninth International
Conference on Frontier of Computer Science and Technology - FCST (pp. 96-103). IEEE.[25] Ma, W., Chen, L., Zhou, Y. & Xu, B. (2016). What are the dominant projects in the GitHub python ecosystem? In
Proceedings of 3rd International Conference on Trustworthy Systems and Their Applications - TSA 2016 (pp. 87-95).[26] Marlow, J., Dabbish, L. & Herbsleb, J. (2013). Impression formation in online peer production3*� 4��")"�#� traces and
personal profiles in GitHub. In Proceedings of the 16th ACM Conference on Computer Supported Cooperative Work (pp. 117-128).
[27] Mcdonald, N., Blincoe, K., Petakovic, E. & Goggins, S. (2014). Modeling distributed collaboration on Github. Advances in Complex Systems, 17(7/8), Paper 1450024.
[28] Mileva, Y.M. (2012). Mining the evolution of software component usage. (Doctoral dissertation, Saarland University, Germany). Retrieved from https://publikationen.sulb.uni-saarland.de/bitstream/20.500.11880/26438/1/thesis.pdf (6 July 2017).
[29] Muthén, L.K. & Muthén, B.O. (2002). How to use a Monte Carlo study to decide on sample size and determine power. Structural Equation Modeling: A Multidisciplinary Journal, 9(4), 599-620.
[30] Sajnani, H., Saini, V., Ossher, J. & Lopes, C. V. (2014). Is popularity a measure of quality? An analysis of maven components. In Proceedings of the 30th International Conference on Software Maintenance and Evolution - ICSME 2014(pp. 231-240).
[31] Sheoran, J., Blincoe, K., Kalliamvakou, E., Damian, D. & Ell, J. (2014). Understanding “watchers” on GitHub. In Proceedings of the 11th Working Conference on Mining Software Repositories - MSR 2014 (pp. 336-339).
[32] Singer, L., Figueira Filho, F. & Storey, M.-A. (2014). Software engineering at the speed of light: how developers stay current using twitter. In Proceedings of the 36th International Conference on Software Engineering - ICSE 2014 (pp. 211-221).
[33] Squire, M. (2014). Forge++: The changing landscape of FLOSS development. In Proceedings of the Annual Hawaii International Conference on System Sciences (pp. 3266-3275).
[34] Tabachnick, B.G. & Fidell, L.S. (2012), Using Multivariate Statistics (6th ed.). New York: Harper and Row.[35] Tinsley, H.E. & Tinsley, D.J. (1987). Uses of factor analysis in counseling psychology research.. Journal of Counseling
Psychology, 34(4), 414-424.[36] Tsay, J., Dabbish, L. & Herbsleb, J. (2014). Let’s talk about it: evaluating contributions through discussion in GitHub. In
Proceedings of the 22nd ACM SIGSOFT International Symposium on Foundations of Software Engineering - FSE 2014 (pp. 144-154).
[37] Williams, A. (2012), GitHub pours energies into enterprise - Raises $100 million from power VC Andreessen Horowitz, Tech Crunch. Retrieved from https://techcrunch.com (6 July 2017).
[38] Wu, Y., Kropczynski, J., Shih, P.C. & Carroll, J.M. (2014). Exploring the ecosystem of software developers on GitHub and other platforms. In Proceedings of The Companion Publication of the 17th ACM Conference on Computer Supported Cooperative Work & Social Computing (pp. 265-268). ACM.
[39] Xavier, J. & Macedo, A. (2014). Understanding the popularity of reporters and assignees in the Github. Proceedings of the 26th International Conference on Software Engineering and Knowledge Engineering (pp. 484-489). SEKE, Vancouver, Canada from July 1- 3.
[40] Yu, Y., Wang, H., Yin, G. & Ling, C.X. (2014). Reviewer recommender of pull-requests in GitHub. In Proceedings of the 30th International Conference on Software Maintenance and Evolution (pp. 609-612). ICSME.
[41] Zhu, J., Zhou, M. & Mockus, A. (2014). The relationship between folder use and the number of forks3*�4�case study on github repositories. In ESEM ’14. Torino, Italy. Retrieved from http://mockiene.com/papers/folder-short.pdf (6 July 2017).

Yen, B., Ni, K. & Chu, L.K. (2017). Graph transformation based guidance for Web navigation. In Proceedings of The 17th International Conference on Electronic Business (pp. 125-131). ICEB, Dubai, UAE, December 4-8.
Yen, Ni & Chu
The 17th International Conference on Electronic Business, Dubai, UAE, December 4-8, 2017125
Graph Transformation Based Guidance for Web Navigation
Benjamin P.-C. Yen*, The University of Hong Kong, Hong Kong, China, [email protected] Ni, Southwestern University of Finance and Economics, China, [email protected]
L.K. Chu, The University of Hong Kong, Hong Kong, China, [email protected]
ABSTRACTWith growing information volume and diverse user preferences on the web, the performance of web information retrieval has become a critical issue. Web navigation is dramatically influenced by the organizations of web contents. Hence, useful navigation guidance can considerably accelerate the information retrieval process. In this paper, web navigation is formulated as a Directed Group Steiner Forest (DGSF) problem in line graph representation of the website. A heuristic algorithm is proposed to tackle the DGSF problem and attain the suboptimal solution in polynomial time. Simulations are conducted to compare the mean searching time for the proposed DGSF-based navigation guidance and other approaches. The results suggest that the DGSF-based navigation guidance can significantly reduce the mean searching time, especially when the number of web pages is large while the number of destination pages is moderate. The discussion is also made for extending the model to take into account the websites owner’s interests and other concerns as well.
Keywords: Information retrieval, Web navigation, guidance, line graph._____________________*Corresponding author
INTRODUCTIONThe abundance of web pages of information that is featured by the Internet has two implications. On the one hand, the abundant information facilitates users to retrieve comprehensive information of interest; on the other hand, it increases the navigation time for users due to the excessive amount of irrelevant information, reducing web usability. Therefore, the accessibility of web pages should be adequately assessed and effectively enhanced. To accelerate information retrieval, navigation guidance can be provided to avoid irrelevant pages. Effective navigation guidance can benefit both surfers and website owners by reducing the searching time to retrieve information, and enhancing the advertisement and transaction functions of websites respectively.
Providing effective navigation guidance is not a trivial task due to the scale and complexity of web-sites (Wang & Yen, 2007). In addition, such a task can be further complicated by the diversity and multiplicity of web pages of interest. Basically, randomly exploring for the destination pages could be time-consuming and tiring. Besides, it is unrealistic to design a web site by having all the pages fully connected. Hence there would be a number of paths for users to follow in reaching a destination page. Themajor problem then is how to devise a mechanism to help the users to find optimal paths for retrieving the destination pages with minimum searching time. Therefore, this paper focuses on an approach to analyze the problem as the Directed Group Steiner Forest (DGSF) problem (Feldman et al., 2012). Line graph conversion (Gross & Yellen, 2006) of the web-site structure is applied for a systematic and intuitive analysis. The DGSF problem, which is essential NP-hard (Alon et al., 2006), can be solved approximately in polynomial time using a shortest path based heuristic algorithm proposed in this paper. It is verified by numerical experiments that this heuristic algorithm can efficiently generate navigation guidance for users.
Finally, we would like to comment on the applicability of the proposed web navigation guidance. The DGSF-based navigation guidance is not the only approach to improve the web navigation efficiency. In fact, existing studies have suggested several alternative approaches, such as grammatical inference approach (Korfiatis & Paliouras, 2006), web structure reorganization and optimization (Lin & Liu, 2008), etc. However, these approaches typically require the specialized technique of grammatical inference and the costly reorganization of web structure, provided that web contents are highly standard and the web structure is flexible. By contrast, the proposed web navigation guidance imposes little restriction on website contents and structure. Moreover, the proposed navigation guidance can also be applied in synergy with other approaches, for instance, it is possible to employ the grammatical inference approach to predict the preferred web pages that contain the desired information of a user; then the proposed web navigation guidance can then be generated with these web pages serving as the destination pages. Therefore, we believe this paper is a valuable development and complement to the research on web navigation guidance.
The remainder of this paper is organized as follows. A brief survey of related work is given in next section. A problem modeling is introduced afterwards, covering the web structure represented by the directed graph and its line graph, and the process of formulating the navigation as a Directed Group Steiner Forest (DGSF) problem. Subsequently a shortest path based heuristic algorithm for solving the DGSF problem is described. The numerical experiments for evaluating the performance of the DGSF-based navigation guide are presented. Finally, the paper concludes with summary and future directions.
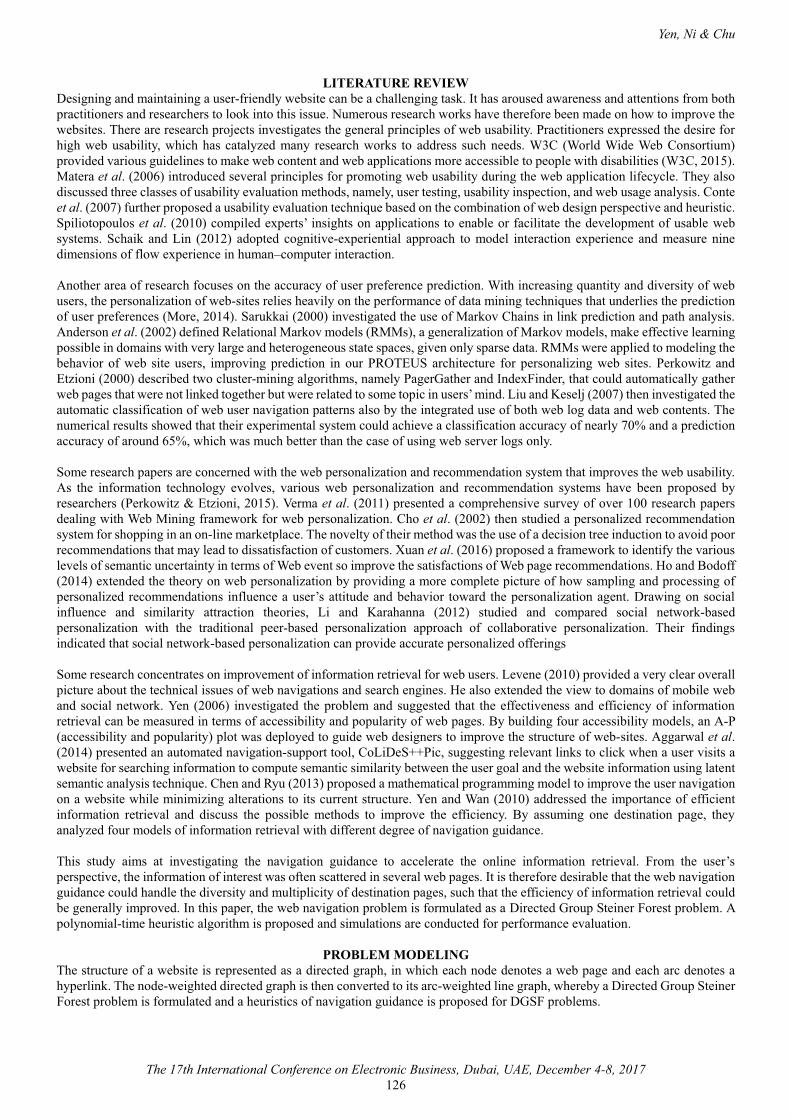
Yen, Ni & Chu
The 17th International Conference on Electronic Business, Dubai, UAE, December 4-8, 2017126
LITERATURE REVIEWDesigning and maintaining a user-friendly website can be a challenging task. It has aroused awareness and attentions from both practitioners and researchers to look into this issue. Numerous research works have therefore been made on how to improve the websites. There are research projects investigates the general principles of web usability. Practitioners expressed the desire for high web usability, which has catalyzed many research works to address such needs. W3C (World Wide Web Consortium) provided various guidelines to make web content and web applications more accessible to people with disabilities (W3C, 2015). Matera et al. (2006) introduced several principles for promoting web usability during the web application lifecycle. They also discussed three classes of usability evaluation methods, namely, user testing, usability inspection, and web usage analysis. Conte et al. (2007) further proposed a usability evaluation technique based on the combination of web design perspective and heuristic. Spiliotopoulos et al. (2010) compiled experts’ insights on applications to enable or facilitate the development of usable web systems. Schaik and Lin (2012) adopted cognitive-experiential approach to model interaction experience and measure nine dimensions of flow experience in human–computer interaction.
Another area of research focuses on the accuracy of user preference prediction. With increasing quantity and diversity of web users, the personalization of web-sites relies heavily on the performance of data mining techniques that underlies the prediction of user preferences (More, 2014). Sarukkai (2000) investigated the use of Markov Chains in link prediction and path analysis. Anderson et al. (2002) defined Relational Markov models (RMMs), a generalization of Markov models, make effective learning possible in domains with very large and heterogeneous state spaces, given only sparse data. RMMs were applied to modeling thebehavior of web site users, improving prediction in our PROTEUS architecture for personalizing web sites. Perkowitz and Etzioni (2000) described two cluster-mining algorithms, namely PagerGather and IndexFinder, that could automatically gather web pages that were not linked together but were related to some topic in users’ mind. Liu and Keselj (2007) then investigated the automatic classification of web user navigation patterns also by the integrated use of both web log data and web contents. Thenumerical results showed that their experimental system could achieve a classification accuracy of nearly 70% and a prediction accuracy of around 65%, which was much better than the case of using web server logs only.
Some research papers are concerned with the web personalization and recommendation system that improves the web usability. As the information technology evolves, various web personalization and recommendation systems have been proposed by researchers (Perkowitz & Etzioni, 2015). Verma et al. (2011) presented a comprehensive survey of over 100 research papers dealing with Web Mining framework for web personalization. Cho et al. (2002) then studied a personalized recommendation system for shopping in an on-line marketplace. The novelty of their method was the use of a decision tree induction to avoid poor recommendations that may lead to dissatisfaction of customers. Xuan et al. (2016) proposed a framework to identify the various levels of semantic uncertainty in terms of Web event so improve the satisfactions of Web page recommendations. Ho and Bodoff (2014) extended the theory on web personalization by providing a more complete picture of how sampling and processing of personalized recommendations influence a user’s attitude and behavior toward the personalization agent. Drawing on social influence and similarity attraction theories, Li and Karahanna (2012) studied and compared social network-based personalization with the traditional peer-based personalization approach of collaborative personalization. Their findings indicated that social network-based personalization can provide accurate personalized offerings
Some research concentrates on improvement of information retrieval for web users. Levene (2010) provided a very clear overall picture about the technical issues of web navigations and search engines. He also extended the view to domains of mobile web and social network. Yen (2006) investigated the problem and suggested that the effectiveness and efficiency of information retrieval can be measured in terms of accessibility and popularity of web pages. By building four accessibility models, an A-P(accessibility and popularity) plot was deployed to guide web designers to improve the structure of web-sites. Aggarwal et al.(2014) presented an automated navigation-support tool, CoLiDeS++Pic, suggesting relevant links to click when a user visits a website for searching information to compute semantic similarity between the user goal and the website information using latent semantic analysis technique. Chen and Ryu (2013) proposed a mathematical programming model to improve the user navigation on a website while minimizing alterations to its current structure. Yen and Wan (2010) addressed the importance of efficient information retrieval and discuss the possible methods to improve the efficiency. By assuming one destination page, they analyzed four models of information retrieval with different degree of navigation guidance.
This study aims at investigating the navigation guidance to accelerate the online information retrieval. From the user’s perspective, the information of interest was often scattered in several web pages. It is therefore desirable that the web navigation guidance could handle the diversity and multiplicity of destination pages, such that the efficiency of information retrieval could be generally improved. In this paper, the web navigation problem is formulated as a Directed Group Steiner Forest problem. A polynomial-time heuristic algorithm is proposed and simulations are conducted for performance evaluation.
PROBLEM MODELINGThe structure of a website is represented as a directed graph, in which each node denotes a web page and each arc denotes a hyperlink. The node-weighted directed graph is then converted to its arc-weighted line graph, whereby a Directed Group Steiner Forest problem is formulated and a heuristics of navigation guidance is proposed for DGSF problems.
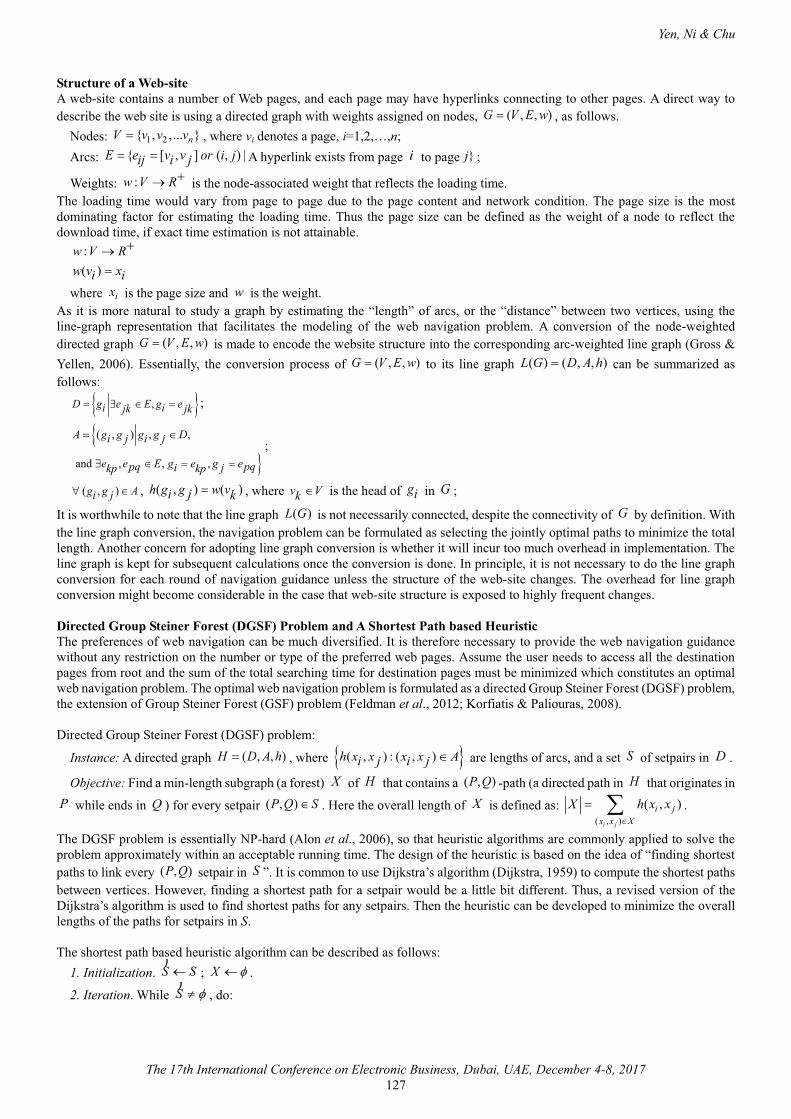
Yen, Ni & Chu
The 17th International Conference on Electronic Business, Dubai, UAE, December 4-8, 2017127
Structure of a Web-siteA web-site contains a number of Web pages, and each page may have hyperlinks connecting to other pages. A direct way to describe the web site is using a directed graph with weights assigned on nodes, ( , , )G V E w� , as follows.
Nodes: 1 2{ , ,... }nV v v v� , where vi denotes a page, i=1,2,…,n;Arcs: { [ , ] ( , ) |E e v v or i jij i j� � A hyperlink exists from page i to page }j ;
Weights: :w V R� is the node-associated weight that reflects the loading time.The loading time would vary from page to page due to the page content and network condition. The page size is the most dominating factor for estimating the loading time. Thus the page size can be defined as the weight of a node to reflect the download time, if exact time estimation is not attainable.
:( )
w V Rw v xi i
��
where ix is the page size and w is the weight.As it is more natural to study a graph by estimating the “length” of arcs, or the “distance” between two vertices, using the line-graph representation that facilitates the modeling of the web navigation problem. A conversion of the node-weighted directed graph ( , , )G V E w� is made to encode the website structure into the corresponding arc-weighted line graph (Gross & Yellen, 2006). Essentially, the conversion process of ( , , )G V E w� to its line graph ( ) ( , , )L G D A h� can be summarized as follows:
� �,D g e E g ei ijk jk� � � ;
��
( , ) , ,
and , , ,
A g g g g Di j i j
e e E g e g epq pqi jkp kp
� �
� � �;
( , )g g Ai j� � , ( , ) ( )h g g w vi j k� , where v Vk � is the head of gi in G ;
It is worthwhile to note that the line graph ( )L G is not necessarily connected, despite the connectivity of G by definition. With the line graph conversion, the navigation problem can be formulated as selecting the jointly optimal paths to minimize the total length. Another concern for adopting line graph conversion is whether it will incur too much overhead in implementation. The line graph is kept for subsequent calculations once the conversion is done. In principle, it is not necessary to do the line graph conversion for each round of navigation guidance unless the structure of the web-site changes. The overhead for line graph conversion might become considerable in the case that web-site structure is exposed to highly frequent changes.
Directed Group Steiner Forest (DGSF) Problem and A Shortest Path based HeuristicThe preferences of web navigation can be much diversified. It is therefore necessary to provide the web navigation guidance without any restriction on the number or type of the preferred web pages. Assume the user needs to access all the destination pages from root and the sum of the total searching time for destination pages must be minimized which constitutes an optimal web navigation problem. The optimal web navigation problem is formulated as a directed Group Steiner Forest (DGSF) problem, the extension of Group Steiner Forest (GSF) problem (Feldman et al., 2012; Korfiatis & Paliouras, 2008).
Directed Group Steiner Forest (DGSF) problem:
Instance: A directed graph ( , , )H D A h� , where � �( , ) : ( , )h x x x x Ai j i j � are lengths of arcs, and a set S of setpairs in D .
Objective: Find a min-length subgraph (a forest) X of H that contains a ( , )P Q -path (a directed path in H that originates in P while ends in Q ) for every setpair ( , )P Q S� . Here the overall length of X is defined as:
( , )
( , )i j
i jx x X
X h x x�
� � .
The DGSF problem is essentially NP-hard (Alon et al., 2006), so that heuristic algorithms are commonly applied to solve the problem approximately within an acceptable running time. The design of the heuristic is based on the idea of “finding shortest paths to link every ( , )P Q setpair in S ”. It is common to use Dijkstra’s algorithm (Dijkstra, 1959) to compute the shortest paths between vertices. However, finding a shortest path for a setpair would be a little bit different. Thus, a revised version of the Dijkstra’s algorithm is used to find shortest paths for any setpairs. Then the heuristic can be developed to minimize the overall lengths of the paths for setpairs in S.
The shortest path based heuristic algorithm can be described as follows:1. Initialization. S S�
); X �� .
2. Iteration. While S ��)
, do:

Yen, Ni & Chu
The 17th International Conference on Electronic Business, Dubai, UAE, December 4-8, 2017128
� Solve: � �( , )
min dist( , ) ( , )P Q S
P Q P Q S�
�))
using the revised Dijkstra’s algorithm. Let ( , )i iP Q be the optimum and
*iT be the corresponding shortest distance path.
� *iX X T� U , \{( , )}i iS S P Q�
) ).
� *( , ) ix y T� � , ( , ) 0h x y � .End While
3. Output. Return XOnce the optimal solution of the DGSF problem is attained, the solution can be employed to generate the navigation guidance. For instance, the hyperlinks in the optimal navigation paths can be highlighted on the web-site.
NUMERICAL EXPERIMENTSNumerical experiments are conducted in this section to assess the performance of the proposed navigation guidance. The assessment should be made for various structures of web-sites to evaluate the general effectiveness of the navigation guidance. Therefore, simulation approach is firstly applied to assess the performance of the proposed navigation guidance and then complemented with a case study on a real-world website.
Simulation DesignComparisons are made mainly on the mean searching time of three navigation approaches: (1) a surfer with DGSF-based navigation guidance; (2) an experienced surfer without any guidance (e.g. without repeating visits to the same pages); and(3) a surfer with simple navigation guidance.
To simulate web-sites, the varieties of web site structure should be adequately addressed. Here, the web site structure is randomly generated based on the following procedure:(1) Set the number of pages n=|V| and number of destination pages k=|N|. Randomly select k destinations from the n nodes. (2) Given a root, randomly generate an arborescence (or a directed tree) that can spans all the nodes in V. This ensures that every
node can be reached from the root. (3) Randomly generate additional outlinks for each node. According to the distribution of the number of outlinks of a web page
described by Kumar et al. (Kumar et al., 1999), the total number of outlinks in a page varies but is approximately 8 on average.
Apart from the web-site structure, the loading time for each web page is also randomly assigned (uniformly distributed between 0.5 and 1.5). This random assignment of the loading time reflects the moderate differences in the sizes of web pages. As shown by a survey (All Things Web, 2015), the median page size is 44KB; nearly 50% of the pages are less than 30KB and 20% between 31KB and 60KB. Thus the sizes of web pages only exhibit moderate differences, which could be approximately reflected by simulating the loading time between 0.5 and 1.5.
Two parameters, n and k, are set before the simulation. It is estimated that in December 2011, there are roughly 50 billion Google indexed web pages (WorldWideWebSize, 2012) and 555 million web-sites globally (Netcraft, 2011). As a result, the average number of Google indexed web pages per site is 90 (50/0.555=90). Besides, a web user may be interested in some pages of a web-site. For a certain user, these pages of interest commonly just constitute a small portion of the entire web-site. As a result, the initial simulation is conducted by setting n=90 and k=5 (roughly 5% of the entire 90 web pages). Subsequently, simulations with varying n and k are also conducted for the further assessment of the navigation performances. For each group of parameters, we repeated the simulation with different number of runs (from 2000 to 8000), and found that it is sufficient to use 5000 runs to get stabilized simulation results.
ComparisonReducing the mean searching time is the major concern in providing the web navigation guidance. By comparing with the case for experienced surfers without navigation guidance, the DGSF-based web navigation guidance is illustrated as effective in Table 1. It is also clear that the DGSF-based guidance is more effective in reducing searching time than the simple navigation guidance: 23.4223 vs. 29.3126. Further, the effectiveness of web navigation guidance for various numbers of pages is shown in Figure 1 that DGSF-based navigation guidance significantly outperforms the simple navigation guidance when the number of web pages is not too small.
The number of destination pages is another crucial factor for the performance of the proposed navigation guidance. Each surfermay expect different a number of destination pages. Figure 2 shows that the DGSF-based navigation guidance performs generally better than others, except for the case 1k � that it performs similarly as the simple navigation guidance, but much better than experienced surfer without guidance. Figure 2 also suggests that as k grows larger, there is a trend of convergence for the mean searching time of the three navigation approaches.
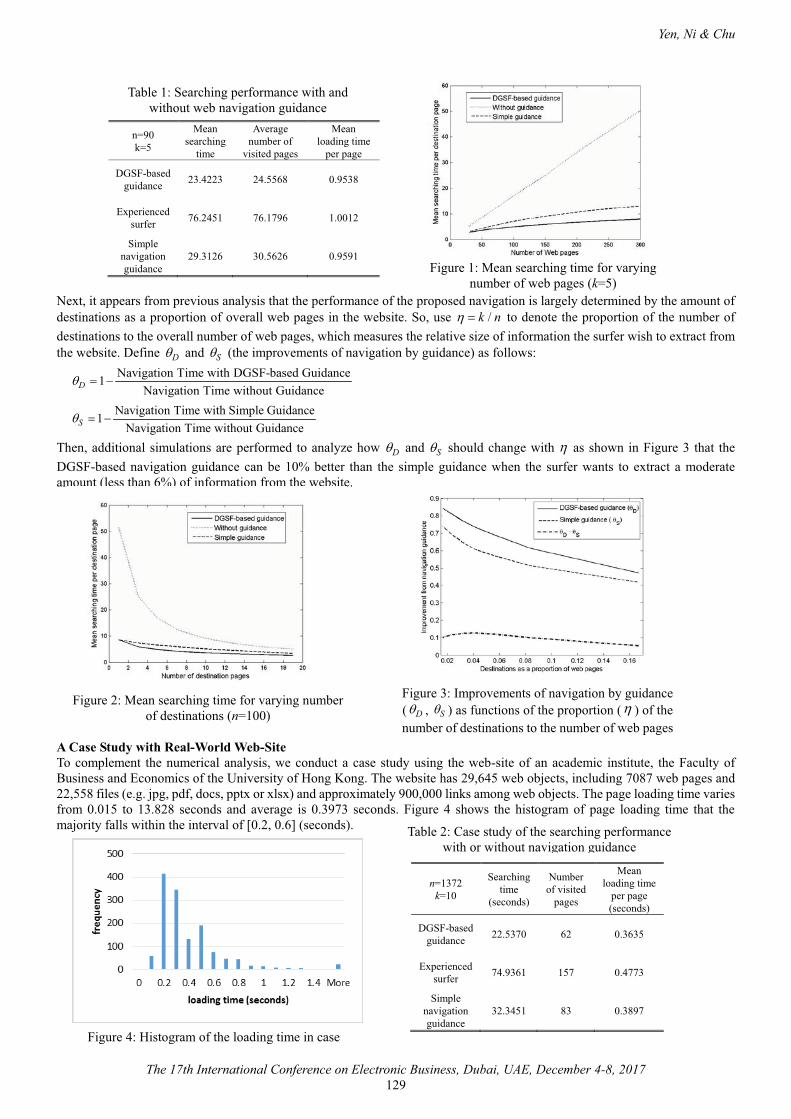
Yen, Ni & Chu
The 17th International Conference on Electronic Business, Dubai, UAE, December 4-8, 2017129
Next, it appears from previous analysis that the performance of the proposed navigation is largely determined by the amount of destinations as a proportion of overall web pages in the website. So, use /� � k n to denote the proportion of the number of destinations to the overall number of web pages, which measures the relative size of information the surfer wish to extract from the website. Define �D and �S (the improvements of navigation by guidance) as follows:
Navigation Time with DGSF-based Guidance1Navigation Time without Guidance
� � �D
Navigation Time with Simple Guidance1Navigation Time without Guidance
� � �S
Then, additional simulations are performed to analyze how �D and �S should change with � as shown in Figure 3 that the DGSF-based navigation guidance can be 10% better than the simple guidance when the surfer wants to extract a moderate amount (less than 6%) of information from the website.
A Case Study with Real-World Web-SiteTo complement the numerical analysis, we conduct a case study using the web-site of an academic institute, the Faculty of Business and Economics of the University of Hong Kong. The website has 29,645 web objects, including 7087 web pages and 22,558 files (e.g. jpg, pdf, docs, pptx or xlsx) and approximately 900,000 links among web objects. The page loading time varies from 0.015 to 13.828 seconds and average is 0.3973 seconds. Figure 4 shows the histogram of page loading time that the majority falls within the interval of [0.2, 0.6] (seconds).
Figure 4: Histogram of the loading time in case
n=1372k=10
Searching time
(seconds)
Number of visited
pages
Mean loading time
per page (seconds)
DGSF-based guidance 22.5370 62 0.3635
Experienced surfer 74.9361 157 0.4773
Simple navigation guidance
32.3451 83 0.3897
Table 2: Case study of the searching performance with or without navigation guidance
Figure 1: Mean searching time for varying number of web pages (k=5)
n=90k=5
Mean searching
time
Average number of
visited pages
Mean loading time
per page
DGSF-based guidance 23.4223 24.5568 0.9538
Experienced surfer 76.2451 76.1796 1.0012
Simple navigation guidance
29.3126 30.5626 0.9591
Table 1: Searching performance with and without web navigation guidance
Figure 2: Mean searching time for varying number of destinations (n=100)
Figure 3: Improvements of navigation by guidance (�D , �S ) as functions of the proportion (� ) of the number of destinations to the number of web pages
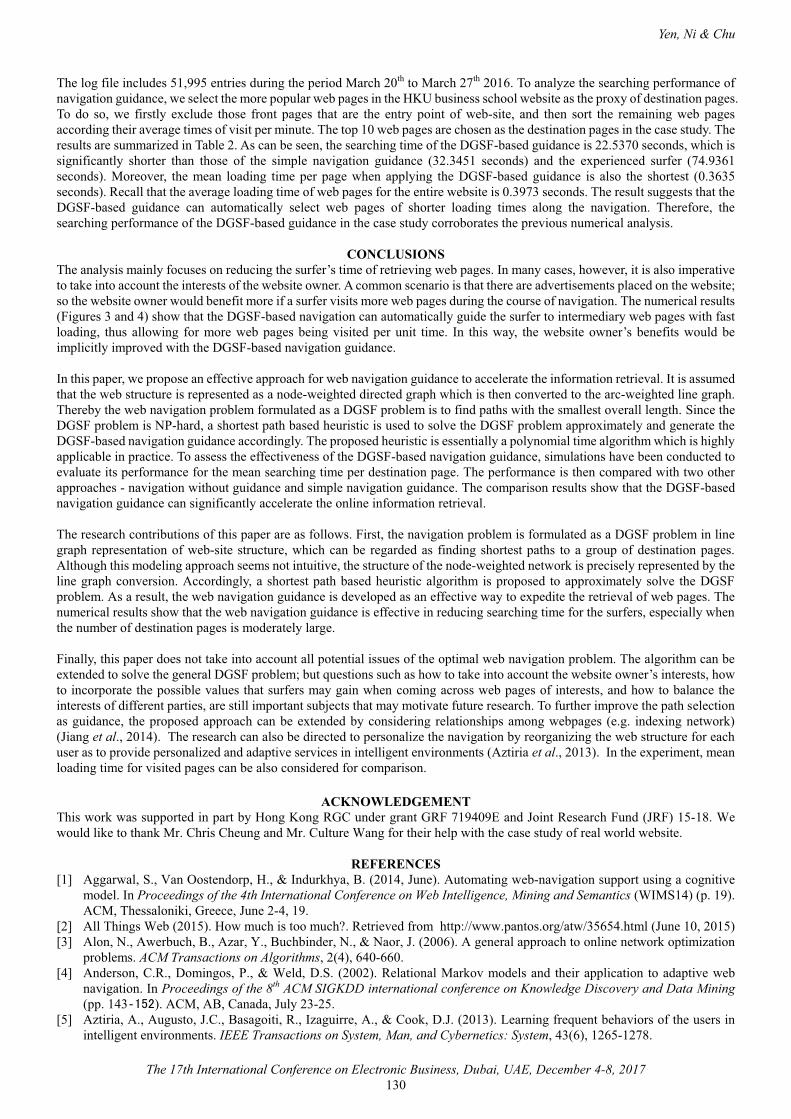
Yen, Ni & Chu
The 17th International Conference on Electronic Business, Dubai, UAE, December 4-8, 2017130
The log file includes 51,995 entries during the period March 20th to March 27th 2016. To analyze the searching performance of navigation guidance, we select the more popular web pages in the HKU business school website as the proxy of destination pages. To do so, we firstly exclude those front pages that are the entry point of web-site, and then sort the remaining web pages according their average times of visit per minute. The top 10 web pages are chosen as the destination pages in the case study. The results are summarized in Table 2. As can be seen, the searching time of the DGSF-based guidance is 22.5370 seconds, which is significantly shorter than those of the simple navigation guidance (32.3451 seconds) and the experienced surfer (74.9361 seconds). Moreover, the mean loading time per page when applying the DGSF-based guidance is also the shortest (0.3635 seconds). Recall that the average loading time of web pages for the entire website is 0.3973 seconds. The result suggests that the DGSF-based guidance can automatically select web pages of shorter loading times along the navigation. Therefore, the searching performance of the DGSF-based guidance in the case study corroborates the previous numerical analysis.
CONCLUSIONSThe analysis mainly focuses on reducing the surfer’s time of retrieving web pages. In many cases, however, it is also imperative to take into account the interests of the website owner. A common scenario is that there are advertisements placed on the website; so the website owner would benefit more if a surfer visits more web pages during the course of navigation. The numerical results (Figures 3 and 4) show that the DGSF-based navigation can automatically guide the surfer to intermediary web pages with fast loading, thus allowing for more web pages being visited per unit time. In this way, the website owner’s benefits would be implicitly improved with the DGSF-based navigation guidance.
In this paper, we propose an effective approach for web navigation guidance to accelerate the information retrieval. It is assumed that the web structure is represented as a node-weighted directed graph which is then converted to the arc-weighted line graph. Thereby the web navigation problem formulated as a DGSF problem is to find paths with the smallest overall length. Since the DGSF problem is NP-hard, a shortest path based heuristic is used to solve the DGSF problem approximately and generate the DGSF-based navigation guidance accordingly. The proposed heuristic is essentially a polynomial time algorithm which is highly applicable in practice. To assess the effectiveness of the DGSF-based navigation guidance, simulations have been conducted to evaluate its performance for the mean searching time per destination page. The performance is then compared with two other approaches - navigation without guidance and simple navigation guidance. The comparison results show that the DGSF-based navigation guidance can significantly accelerate the online information retrieval.
The research contributions of this paper are as follows. First, the navigation problem is formulated as a DGSF problem in line graph representation of web-site structure, which can be regarded as finding shortest paths to a group of destination pages. Although this modeling approach seems not intuitive, the structure of the node-weighted network is precisely represented by the line graph conversion. Accordingly, a shortest path based heuristic algorithm is proposed to approximately solve the DGSF problem. As a result, the web navigation guidance is developed as an effective way to expedite the retrieval of web pages. The numerical results show that the web navigation guidance is effective in reducing searching time for the surfers, especially when the number of destination pages is moderately large.
Finally, this paper does not take into account all potential issues of the optimal web navigation problem. The algorithm can be extended to solve the general DGSF problem; but questions such as how to take into account the website owner’s interests, how to incorporate the possible values that surfers may gain when coming across web pages of interests, and how to balance the interests of different parties, are still important subjects that may motivate future research. To further improve the path selection as guidance, the proposed approach can be extended by considering relationships among webpages (e.g. indexing network)(Jiang et al., 2014). The research can also be directed to personalize the navigation by reorganizing the web structure for each user as to provide personalized and adaptive services in intelligent environments (Aztiria et al., 2013). In the experiment, mean loading time for visited pages can be also considered for comparison.
ACKNOWLEDGEMENTThis work was supported in part by Hong Kong RGC under grant GRF 719409E and Joint Research Fund (JRF) 15-18. We would like to thank Mr. Chris Cheung and Mr. Culture Wang for their help with the case study of real world website.
REFERENCES[1] Aggarwal, S., Van Oostendorp, H., & Indurkhya, B. (2014, June). Automating web-navigation support using a cognitive
model. In Proceedings of the 4th International Conference on Web Intelligence, Mining and Semantics (WIMS14) (p. 19). ACM, Thessaloniki, Greece, June 2-4, 19.
[2] All Things Web (2015). How much is too much?. Retrieved from http://www.pantos.org/atw/35654.html (June 10, 2015)[3] Alon, N., Awerbuch, B., Azar, Y., Buchbinder, N., & Naor, J. (2006). A general approach to online network optimization
problems. ACM Transactions on Algorithms, 2(4), 640-660.[4] Anderson, C.R., Domingos, P., & Weld, D.S. (2002). Relational Markov models and their application to adaptive web
navigation. In Proceedings of the 8th ACM SIGKDD international conference on Knowledge Discovery and Data Mining(pp. 143 ). ACM, AB, Canada, July 23-25.
[5] Aztiria, A., Augusto, J.C., Basagoiti, R., Izaguirre, A., & Cook, D.J. (2013). Learning frequent behaviors of the users in intelligent environments. IEEE Transactions on System, Man, and Cybernetics: System, 43(6), 1265-1278.
Yen, Ni & Chu
The 17th International Conference on Electronic Business, Dubai, UAE, December 4-8, 2017131
[6] Berkovsky S. & Freyne, J. (2015). Web personalization and recommender systems. In Proceedings of the 21st ACM SIGKDD International Conference on Knowledge Discovery and Data Mining (KDD-2015) (pp. 2307-2308). ACM,Sydney, Australia, August 10-13.
[7] Chen M. & Ryu, Y.U. (2013). Facilitating effective user navigation through website structure improvement. IEEE Transactions on Knowledge and Data Engineering, 25(3), 571-588.
[8] Cho, Y.H., Kim, J.K., & Kim, S.H. (2002). An intelligent web recommendation system: A web usage mining approach. Expert Systems with Applications, 23, 329-342.
[9] Conte, T., Massollar, J., Mendes, E., & Travassos, G.H. (2007). Usability evaluation based on web design perspectives. InProceedings of the First International Symposium on Empirical Software Engineering and Measurement, (pp. 146-155). ESEM, Madrid, Spain, September 20-21.
[10] Dijkstra, E.W. (1959). A note on two problems in connection with graphs. Numerische Mathematik, 1, 269-271. [11] Feldman, M., Kortsarz, G., & Nutov, Z. (2012). Improved approximating algorithms for directed Steiner forest. Journal of
Computer and System Sciences, 78(1), 279-292.[12] Gross J.T. & Yellen, J. (2006) Graph Theory and Its Applications (2nd ed., p. 265). Boca Raton, FL: CRC Press.[13] Ho, S.Y. & Bodoff, D. (2014). the effects of web personalization on user attitude and behavior: an integration of the
elaboration likelihood model and consumer search theory. MIS Quarterly, 38(2), 497-520.[14] Jiang, C., Sun, H., Ding, Z., Wang, P., & Zhou, M.C. (2014). An indexing network: Model and applications. IEEE
Transactions on System, Man, and Cybernetics: System, 44(12), 1633-1648.[15] Klein, P. & Ravi, R. (1995). A nearly best-possible approximation algorithm for node-weighted Steiner trees. Journal of
Algorithms, 19(1), 104-115.[16] Korfiatis, G. & Paliouras, G. (2008). Modeling web navigation using grammatical inference. Applied Artificial Intelligence,
22(1-2), 116-138.[17] Kumar, S.R., Raghavan, P., Rajagopalan, S., & Tomkins, A. (1999). Extracting large-scale knowledge bases from the web.
In Proceedings of the 25th VLDB Conference (pp. 639-650). ACM, Edinburgh, Scotland99.[18] Levene, M. (2010) An Introduction to Search Engines and Web Navigation, John Wiley & Sons.[19] Li, S. & Karahanna, E. (2012). Peer-based Recommendations in Online B2C e-Commerce: Comparing Collaborative
Personalization and Social Network-based Personalization. Proceedings of IEEE 45th Hawaii International Conference on System Sciences (HICSS), Hawaii, USA), 733-742.
[20] Lin, W. & Liu, Y.A. A (2008). Novel Website Structure Optimization Model for More Effective Web Navigation. Proceedings of the 1st International Workshop on Knowledge Discovery and Data Mining (WKDD), Adelaide, Australia), 36-41.
[21] Liu, H. & Keselj, V. (2007)’ Combined Mining of Web Server Logs and Web Contents for Classifying User Navigation Patterns and Predicting Users’ Future Requests. Data & Knowledge Engineering, 61), 304-330.
[22] Matera, F., Rizzo, F., & Carughi, G.T. (2006) Web usability: Principles and evaluation methods, In E. Mendes & N. Mosley (Eds.), Web Engineering (pp. 143-180). Springer, Berlin Heidelberg.
[23] More, S. (2014). Modified path traversal for an efficient web navigation mining. In Proceedings of International Conference on Advanced Communication Control and Computing Technologies (pp. 940-945). IEEE, Ramanathapuram, India.
[24] Netcraft. (2011) December 2011 web server survey. Retrieved from http://news.netcraft.com/archives/2011/12/09/ december-2011-web-server-survey.html (September 20, 2017).
[25] Perkowitz, M. & Etzioni, O. (2000). Towards adaptive web sites: Conceptual framework and case study. Artificial Intelligence, 118, 245-275.
[26] Sarukkai, R.R. (2000). Link prediction and path analysis using Markov chains. Computer Networks, 33, 377-386. [27] Schaik, P. & Ling, J. (2012). An experimental analysis of experiential and cognitive variables in web navigation.
Human–Computer Interaction, 27(3), 199 234.[28] Spiliotopoulos, T., Papadopoulou, P., Martakos, D., & Kouroupetroglou, G. (2010). Integrating Usability Engineering for
Designing the Web Experience: Methodologies and Principles. Hershey, PA: IGI Global.[29] Verma, V., Verma, A.K., & Bhatia, S.S. (2011). Comprehensive survey of framework for web personalization using web
mining. International Journal of Computer Applications, 35(3), 23-28.[30] W3C (2015) Web accessibility initiative (WAI). Retrieved from http://www.w3.org/WAI/ (September 20, 2017).[31] Wang, M. & Yen, B.P.-C. (2007). Web structure reorganization to improve web navigation efficiency. In Proceedings of the
11th Pacific Asia Conference on Information Systems (pp. 411-422). PACIS, Auckland, New Zealand, July 4-7.[32] WorldWideWebSize. (2012) The size of the World Wide Web (The Internet). Retrieved from
http://www.worldwidewebsize.com/ (September 20, 2017).[33] Xuan, J., Luo, X., Zhang, G., Lu, J., & Xu, Z. (2016). Uncertainty analysis for the keyword system of web events. IEEE
Transactions on System, Man, and Cybernetics: System, 46(6), 829-842.[34] Yen, B.P.C. (2006). The design and evaluation of accessibility on web navigation. Decision Support Systems, 42,
2219-2235.[35] Yen, B.P.-C. & Wan, Y.-W. (2010). Design and evaluation of improvement method on the web information navigation – A
stochastic search approach. Decision Support Systems, 49, 14-23.
Prince, K.A. (2017). Industrie 4.0 and leadership. InProceedings of The 17th International Conference on Electronic Business (pp. 132-139). ICEB, Dubai, UAE, December 4-8.
Prince
The 17th International Conference on Electronic Business, Dubai, UAE, December 4-8, 2017 132
Industrie 4.0 and Leadership
Kylie A. Prince, James Cook University, Cairns, Australia, [email protected]
ABSTRACTIndustrie 4.0 focuses on end-to-end digital transformation with digital ecosystems. Digital transformation and industrie 4.0 are more efficient and effective with particular skills, knowledge and attitude. Leaders who practice leadership 4.0 are digital leaders and digital transformers. This digital leadership framework is based on a transformational, transactional, and authentic leadership matrix. This trichotomous leadership model is based on Adaptive Structuration Theory (AST) which applies the impact of Advanced Information Technology with leadership in a recursive relationship with each affecting and transforming the other.
Keywords: authentic, transformational, transactional, digital leadership, digital age _____________________*Corresponding author
INTRODUCTIONThe technology revolution and how a company digitizes itself influences business results (Khan, 2016). This is digital disruption and requires transformational change which this research and others call digital transformation (Westerman et al., 2011). This digital transformation global megatrend is changing existing value chains across industries, corporations, and public sectors (Khan, 2016); and demands convergence of roles in a flatter more collaborative environment (Campbell, 2012).
Digital disruption and digital transformation are associated with Industrie 4.0 (Bunse, 2013). Industrie 4.0 refers to the fourth industrial revolution which is grounded in technological evolution from cyber physical systems to embedded systems to the Internet of Things (IoT) (Bunse, 2013). Information and communication technologies (ICT) are the foundation that innovative solutions build on; and are made possible through technological advances (Bunse, 2013).
Industrie 4.0 is radically transforming industry, business models, and production value chains through smart production processes and embedded system production technologies (Bunse, 2013). In simple terms, technological advances include a reversal of conventional product process logic whereby the product communicates with the machinery to tell it what to do (Bunse, 2013).
Industrie 4.0 requires digital reinvention, such that corporation’s need to pursue new strategic focus, establish new ways ofworking and develop new expertise (Berman, Korsten & Marshall, 2016; HBR Analytic Service, 2015). Digital reinvention of the corporation through driving digital transformation requires consideration of the corporation and larger society as digital ecosystems (Eng Chew, 2013; Khan, 2016). Digital ecosystems include disruptive business models, fundamental change, and platforms that integrate end customers, and digital natives (Nally, 2016). Furthermore, gains in efficiency have the potential to transform today’s competitive environment quickly; using cloud based planning platforms (Nally, 2016).
Rogers (2016) points that digital transformation is a big task for corporations to achieve. Therefore digital transformation also requires consideration of leading the digital transformation (Khan, 2016). The leadership literature however, rarely considers digital transformation; it’s like a gap exists between digital transformation and contemporary leadership practice (Khan, 2016).
Many leadership scholars practice their art without considering digital transformation, however the intersection of these areas is interesting (Bass & Riggio, 2006; Walumbwa et al., 2008). Khan (2016) found six digital transformational competencies in three forms of contemporary leadership styles; values-based, transformational and authentic leadership styles. This research argues an overlap between all three leadership styles is warranted for digital age leadership.
Research indicates that digital age corporate leaders need to be flexible in today’s rapidly changing digital world (HBR Analytic Service, 2015; Nally, 2016). Leadership today requires the exercise of influence rather than excessive force and power (Bolden & O’Regan, 2016). Corporate leaders, especially the CEO, CTO, CDO and CIO define and lead the digital transformation heavily relying on core competencies like data analytics to enhance corporate structures (Nally, 2016).
An interview with Mastercard Chairman, Rick Haythornthwaite Nally (2016) reveals his thoughts and feelings about today’s leadership and the digital environment (Bolden & O’Regan, 2016). Nally (2016) argues that technology sources and making the most of data, to drive down the production development cycle and adoption costs is necessary for digital transformation (Bolden & O’Regan, 2016). Digital transformation is turning our world into a virtual one changing many facets of our understanding of life and the world we live in; being generally disruptive and turning our lives upside down (Bolden & O’Regan, 2016).
Prince
The 17th International Conference on Electronic Business, Dubai, UAE, December 4-8, 2017 133
Leadership rules however, are currently being rewritten for the first time ever; no longer are charismatic, omniscient and omnipotent leaders useful; a leader must know how and when to lead, support, coach, facilitate, and influence others (Bolden & O’Regan, 2016). Social activists and entrepreneurs are using powerful digital tools and accesses are setting today’s digital transformational agenda (Bolden & O’Regan, 2016).
Digital transformation fundamentally changes value chains across industries and public sectors to develop new digital ecosystems (Khan, 2016). These digital ecosystems are known for mobile apps, machine to machine, big data, industrial internal, internet of things, and industrie 4.0.
INDUSTRIE 4.0The fourth industrial revolution is about using cyber-physical systems in the manufacturing process and as such is called Industrie 4.0 (Bunse, 2013; Raza, 2016). Industrie 4.0 digital transformation is well underway in Germany, who are international leaders in embedded systems and digital technology (Bunse, 2013). Using and understanding digital technology is rapidly become a core competency with success largely depending on the corporations’ overall digital ecosystem (PwC network, 2016).
Digital ecosystems with value chain partners rely on a wide range of new technologies to communicate data that underpins gains promised by Industrie 4.0 (Nally, 2016). Industrie 4.0 focuses on end-to-end digital transformation with digital ecosystems relying on trust in data security, communication systems, and intellectual property for integrity and security (Dennis Nally, 2016).
End-to-end digital transformation is driven by focusing on people and culture, with the biggest challenge attracting the digital generation and others comfortable with working in a digital ecosystem (PwC network, 2016). Digital ecosystems expand and with it the importance of trust, transparency, and the integrity of third party data (Nally, 2016). Data analytics drive decision making with robust corporate structures supporting data analytics as an enterprise level digital capability (PwC network, 2016).Digital capabilities are important to move forward with Industrie 4.0 with (PwC network, 2016) suggesting a six step model for digital success. These steps are; mapping strategy, creating pilot projects, defining capabilities, expertise in data analytics, digital transformation, and planning an ecosystem approach (Nally, 2016). The reality of Industrie 4.0 however, is that change is transcending corporate boundaries and also national boundaries of where people do business, faster than corporations can keep up the pace (PwC network, 2016).
When digital capabilities are embed functionally in the corporation (Nally, 2016); then organising data analytics develops cross-functional expert teams (PwC network, 2016). This improves services and products where strategy and operations meet creating disruption (Nally, 2016). Consequently, disruptive business occurs with customers competing for services and products thus creating a digital culture (Nally, 2016). A digital culture aligns the digital generation with other generations; consequently all are thinking and acting like the digital generation, ready and willing to experience new technologies and new ways of operating (PwC network, 2016).
A systematic step-by-step approach to Industrie 4.0 digital capabilities starts with prioritising measures, aligning overall strategy, and jumping into it head first; by setting clear targets and prioritising measures (PwC network, 2016). Accurate measures can tell a lot about the business, providing clarity and direction (PwC network, 2016). Measuring leadership statistics and technopreurnial capability is David and goliath stuff of mass proportions (PwC network, 2016).
First movers however, are making investments in Industrie 4.0 and realising above average digital revenues and operational savings with digital services and products developing disruptive business models (PwC network, 2016). Disruptive business models are improving both top and bottom line simultaneously with Industrie 4.0 reshaping competitive digital ecosystems.Customer-centric value chains, services, and products are to be commonplace with corporations having to own relationships with end customers (PwC network, 2016).
Industrie 4.0 is spanning the globe creating digital networks and digital ecosystems, however distinct regional footprints are to be retained (PwC network, 2016). Countries such as Germany and Japan collaborate along the horizontal value chain with high investments in technology and employee training view their digital transformation in terms of cost reduction, operational efficiency, and quality assurance (PwC network, 2016). China’s standout aspects of digital transformation are in digitising and automating labour intensive manufacturing (PwC network, 2016). While the US suggest they are planning to develop disruptive business models through digitising service portfolios and products (PwC network, 2016).
Industrie 4.0 frameworks include data and analytics as core capabilities connecting such technologies as (but not limited to) Smart Sensors, Cloud Computing, Mobile Devices, loT Platforms, 3D Printing, Location Detection, Cyber-Physical Systems, etc (Nally, 2016). Industrie 4.0 leads tomorrow’s digital ecosystems to focus on people and culture to drive digital transformation and deepen digital relationships with empowered customers (PwC network, 2016). Industrie 4.0 promises a complete view of digital networks with digital transformation driven by an integration of vertical and horizontal value chains, and disruptive digital business models, (PwC network, 2016).
Prince
The 17th International Conference on Electronic Business, Dubai, UAE, December 4-8, 2017 134
Industrie 4.0 is reshaping the competition of established industries paving the way for disruptive business models and disruptions to industry, like Uber’s disruption to the taxi industry and Air B’n’B to the hotel industry (PwC network, 2016). PwC network (2016) surveyed 2,000+ corporates, and found 70% expect to dramatically increase their level of digital transformation by 2020 and only 33% rating their corporate as digitally advanced today. Global digital transformation processes however require a digital IQ far exceeding the current change process (Nally, 2016).
Digital IQ is important for the success of digital investments (PwC network, 2016). Digital IQ focuses on the broad range of people factors involved with the success of implementing the right digital technologies (Brown et al., 2013). This is important for the C suite developing a robust digital culture and attracting and retaining the right employees who should be comfortable working in a dynamic digital ecosystem environment (PwC network, 2016).
LEADERSHIP 4.0Industrie 4.0 is more efficient and effective with particular skills, knowledge, and attitude leading it (Raza, 2016). Raza (2016)argues that these particular leadership skills are about innovation and driving results; this is conceptualised as Leadership 4.0. Leadership 4.0 is based on the premise that leaders see the future, explore the future, and return to train others (Raza, 2016).
The German Chancellor Angela Markel arguably practices Leadership 4.0 emphasizing that Germany takes a lead in Industrie 4.0 by raising importance to industrial production, logistics, and by connecting to digital technologies (Raza, 2016). Raza (2016) concludes that success in tomorrow’s industrial 4.0 environment requires different characteristics, approaches and practices than traditional leadership can offer. However Raza (2016) defines leadership 4.0 as the adaptability to fit, innovate, and survive the Industrie 4.0 ecosystems (Raza, 2016).
Leadership 4.0 is further defined as the hierarchy based on functional units with the key driver of efficiency of divisional labour (Raza, 2016). Best divisions of labour are developed through organization of mass markets of divisional organizational mode and computing and information enable organisation of globalization by using tools like SAP, which need matrix organization (Raza, 2016). A combination of several innovations in digital technology developed the Leadership 4.0 terminology (Raza, 2016). Leadership 4.0 is synonymous with talent acquisition and development, and communications, whereby everyone is innovative (Raza, 2016).
Leaders who practice leadership 4.0 are digital leaders and digital transformers (Raza, 2016). Digital transformation includes a number of technologies such as data storage, digital technology, cloud computing, internet of things, digital 3D printing, mobile devices, satellite, smart cars, and algorithms to direct motor vehicles (Raza, 2016). These digital technologies when joined together integrate the virtual and physical world into a highly networked digital ecosystem with cyber-physical systems (Raza, 2016).
Based on the details and challenges of Industrie 4.0 it is required that industry leaders be equipped with skills and traits to be tomorrow’s leaders (Raza, 2016). The transition from Leadership 3.0 to Leadership 4.0 is arguably comprised of four leadership capabilities; digital vision, converting the vision into action, unit of effort re-design and transformation governance (Raza, 2016). These are elaborated as follows;
i. Digital vision, when the leader 4.0 creates a transformational vision then the digital transformation journey begins to align senior managers and staff around the vision (Raza, 2016);
ii. Converting the vision into action, when the leader 4.0 decides to move forward the vision becomes a reality formulating a road map of initiative including entry point of pilot project (Raza, 2016);
iii. Unit of effort re-designing the knowledge or jobs to be complete with the global talent tool and initiating with pilot projects to achieve the efficiency of performance to market like increasing zero marginal expenses (Raza, 2016); and
iv. Transformational governance is critical to transform using a rudder to steer the digital initiatives in the required direction to ensure sustainability of the transformation process (Raza, 2016).
Traditionally most Leadership approaches use a three factor taxonomy of skills; however the challenge of Industrie 4.0 demonstrates a need for a different skill set (Raza, 2016). Such as vertically & horizontally focused (Initiative) or technical skills, Individual ownership of development (Accountability), collective leadership (Collaboration) or interpersonal skills, and innovation (Critical Thinking) (Raza, 2016).
When corporations have high digital competencies in leadership they can meet today’s and tomorrow’s challenges (Raza, 2016). However most corporations have management only, lacking leadership or only leadership with no management to conduct digital transformation (Raza, 2016). Executives who have been steeped in analogue leadership disciplines need to change in the digital world. The Manufacturing Leadership Council calls for Industrie 4.0 vision that leaders be technology-savvy, corporations are flatter and more collaborative structures, with empowered employees (Raza, 2016). Industrie 4.0 is further defined by global competition, information-driven factories, real-time information, great speed and agility and rapid adaptability (Raza, 2016).

Prince
The 17th International Conference on Electronic Business, Dubai, UAE, December 4-8, 2017 135
LEADERSHIP IN THE DIGITAL AGEThe digital age is responsible for corporations needing to reshape and transform digital business (Khan, 2016; Nally, 2016). However, lack of digital leadership is the number one issue holding back digital business (Kotter, 1990). This likely requires finding differences in leadership, skills, and capabilities and to explore found models within today’s corporate leadership model (Khan, 2016).
Leadership in the digital age is part of Leadership 4.0 (Nally, 2016). It is ideal for leading edge corporations and is theory based on continuous change models, with proven results replicated and shared among colleagues and publications (Kotter, 1995). This digital leadership framework is structured on a combination of motivational tools and leadership styles (Prince, Hamilton, & Tee, 2016). This is technopreneurial leadership, a leading edge competitive framework with transformational, transactional, and authentic leadership matrix (Hamilton & Lynch, 2012). It is through this 3D positioning horizons matrix that we find the trichotomous leadership styles with their digital age solutions (figure 2) (Hamilton, Tee & Prince, 2016). Finding a leadership position on this matrix affords the leader insight into their digital age structuration and demonstrates the stepsrequired to attain digital age leadership.
DeSanctis and Poole (Desanctis & Scott, 1994) argue that technology and leadership participate in a recursive relationship with each affecting and transforming the other. (Avolio, Kahai & Dodge, 2001), and (Avolio et al., 2014) also argue that leader and technology should co-evolve; with leadership being a corporate social structure created by technology.
Applying Adaptive Structuration Theory (AST) to this research is about applying the impact of Advanced Information Technology (AIT) interaction with leadership in relationship; and serves the customer driven digital ecosystem (Avolio et al., 2014; Desanctis & Scott, 1994). Here, real-time data availability, digital services, and digital leadership serve the customer in a social construct (Avolio & Kahai, 2003b; Avolio, Kahai & Dodge, 2001).
Applying cutting edge AIT forces corporations to be receptive to new ideas and possibilities, providing a bottom up solution that any credible corporation could not ignore (Khan, 2016). AIT triggers an adaptive structurational process that over time changes rules and resources leading to a digital transformation (Desanctis & Scott, 1994). Consequently, a new leadership style emerges during the appropriation process which is arguably referred to as digital leadership (Desanctis & Scott, 1994).
Corporations lacking digital leadership are referred to as laggards (HBR Analytic Service, 2015). Laggards should be putting together a multidimensional framework to increase digital knowledge, competencies, and skills (HBR Analytic Service, 2015). Laggards fall behind digital leadership in three important key ways, lacking: digital first focus, connected platform of services, and digital coordination (Weill & Woerner, 2017).
Further research, 436 business leaders were interviewed by Harvard Business Review Analytic Services (HBR Analytic Service, 2015). A large gap was found between what’s needed and the current state of corporations, with only 23% confident they have the necessary knowledge and skills to succeed in digital transformation. Furthermore, the lack of digital leadership is the number one issue holding corporations back with digital business (HBR Analytic Service, 2015). Digital transformation however, is more than simply modernising IT skills; this is improving communication and working with both formal and informal learning forums (HBR Analytic Service, 2015).
Digital transformation continually requires directive leadership; with the corporate leader aiming to improve performance with new digital technologies (Kotter, 1990, 1995). Digital leadership in this context has new rules of competition, to build cooperation between generations, close the gap between strategy and operations, attract the best talent, and solidify transformation in the corporation (Khan, 2016). Digital transformation occurs as members of corporate groups bring the structural potential of new technologies into interaction appropriating available structures during the course of group decision activities (Desanctis & Scott, 1994).
In this digital age, a combination of transformational, transactional, and authentic leadership is what engages the digital generation (Khan, 2016). Within these three leadership styles we establish a trichotomous model that provides the skills drivers for a future digital leadership model that identifies the shortcomings of existing leadership and to them provides a pathway to lead corporations into the future (Khan, 2016).
AUTHENTIC LEADERSHIPAuthentic leaders are committed to the need to belong; and inclusive belonging in the real world (Walumbwa et al., 2008). The digital generation trust in these leaders because they are real, genuine, transparent, and balanced with good moral standing and self-awareness (Walumbwa et al., 2008).
In simple terms, authentic leadership creates patterns of transparency, and openness building trust and healthy corporations (Walumbwa et al., 2008). The authentic leader builds trust, meaning and healthier corporations through transparency (Walumbwa et al., 2008). Transparent leaders who are authentic influence others to be authentic also, and role model high ethical standards (Walumbwa et al., 2008).

Prince
The 17th International Conference on Electronic Business, Dubai, UAE, December 4-8, 2017 136
Avolio and colleagues have studied Authentic Leaders and authenticity for some time, graduating from Charismatic Leadership, Transformational Leadership, E-Leadership and Authentic Leadership (Avolio et al., 2014; Avolio, Kahai & Dodge, 2001; Walumbwa et al., 2008). Their definition is four-fold; self- awareness, self-regulation, transparency, balanced decisions; however Avolio et al. (2014) “back to the future” premonition for leadership development has hardly considered the present need for digitalization and influence of the digital generation (Avolio et al., 2014).
The digital generation want to follow authenticity, because it bellows ‘care for others’ (Khan, 2016). This is because the digital generation have developed a ‘care for others’ core value from having used social media for all their lives or the life of social media (Avolio et al., 2014). Social media, like face to face socialising has a transformational effect on people (Avolio et al., 2014). Leaders who hold social media in high esteem are few and far between (Khan, 2016). However, followers using social media, list the millions (Facebook, LinkedIn). Social media develops qualities unique to this type of communication alone. Social media and time for decisions is real time in flatter corporate structures (Walumbwa et al., 2008). Whereas traditionally, managers managing other managers across multiple levels slows down decision making processes (Hamilton & Lynch, 2012).
The behavioural competencies a leader may require in the future of behaviourally astute generations, such as the digital generation needs simplification, rather than complex models (Avolio et al., 2014). The authentic digital corporate leader is a self-aware and enduring organisation builder (Copeland, 2014) who balances scenario solutions against analysis (Rogers, 2016); and who builds transparent, genuine decision making solutions (Westerman et al., 2011).
Over 90% of interviewed corporations lacked the necessary social media, mobile, internal social networks, performance analysis skills (Spitzer et al., 2013). Further research revealed that 87% of corporations feel competitive opportunities are available through digital transformation; but corporations are not investing in digital skills development with only 46% investing in digital skills development (Spitzer et al., 2013).
TRANSFORMATIONAL AND TRANSACTIONAL LEADERSHIPTransformational leadership was first explored by (Burns, 1978) and developed further by (Bass, 1985) and is a transformational paradigm. Four distinct features that transformational leaders have are idealised influence, inspirational motivation, intellectual stimulation and individualised consideration (Sarros & Santora, 2001). Transformational leadership creates relationships that raise motivation and morality in both leader and their follower (Northouse, 2013); while transactional leaders do not individualise the needs of followers nor care about their development (Northouse, 2013).
Transactional leadership traditionally focuses on the reward exchanges that occur between leaders and their followers and hastwo distinct features; contingent reward, and management by exception (Northouse, 2013). Contingent reward leadership appeals to the needs and wants of individuals, achieves results, and rewards people tangibly for their efforts (Sarros & Santora, 2001). Management by exception leaders have implicit trust in their workers to finish to a satisfactory standard, avoid rocking the boat, and the business exists day to day with little sense of new horizons (Sarros & Santora, 2001).
The manifestation of transformational leadership has taken new forms because of digitalization; and characteristics of digital transformational leadership help empower a leader’s motivation through technology, and clarifys the higher purpose of work toothers (Khan, 2016). The digital transactional leader displays a behaviourally-focused and human capital motivation perspective (Xavier Lhuer, Tunde Olanrewaju, 2015). A study of 181 executives from Australian top 500 corporations, suggest there remains ambiguity about the leadership role of business executives (Sarros & Santora, 2001). It was found that these executives feel comfortable coaching their people to results but see the need for direction (Sarros & Santora, 2001).
Balancing opposite ends of a continuum transformational transactional leadership presents ongoing challenges for these executives (Sarros & Santora, 2001). While leaders who care for and nurture their workers set high standards for their corporation to enhance interpersonal skills of compassion, consistently high ethical behaviour, and communication (Sarros & Santora, 2001). Consequently leaders need to focus on the meaning behind the message, not simply the message content (Sarros & Santora, 2001).
Sarros and Santora (2001) argue that leaders are being driven into unfamiliar territory with change the only constant; and how the change is handled has direct bearing on business success (Sarros & Santora, 2001). The successful business has a successful leader, the successful leader deals with the future vision and transformation (Sarros & Santora, 2001). While transactional leadership is more focused on achieving results through corporate processes such as policies, procedures, and rewards; transformational leadership is more focused on the needs of individuals (Sarros & Santora, 2001).
CONCLUSIONTechnology today enables a new economy in Corporate Leadership for e-business, e-commerce, m-commerce, technopreneurialism, ambiguity, disorder and the ability to adapt to rapid business change (Dasgupta, 2011). Building successful corporations today requires rapid business change and transformation (Khan, 2016). This rapid change is at the heart of transformational states of mind (Avolio & Kahai, 2003a). The Digital Corporate Leader not only manages these transformational states of mind, the Digital Corporate Leader identifies inter-generational cooperation; and forms visions of potentiality, closing the gap with reality (Avolio & Kahai, 2003a).
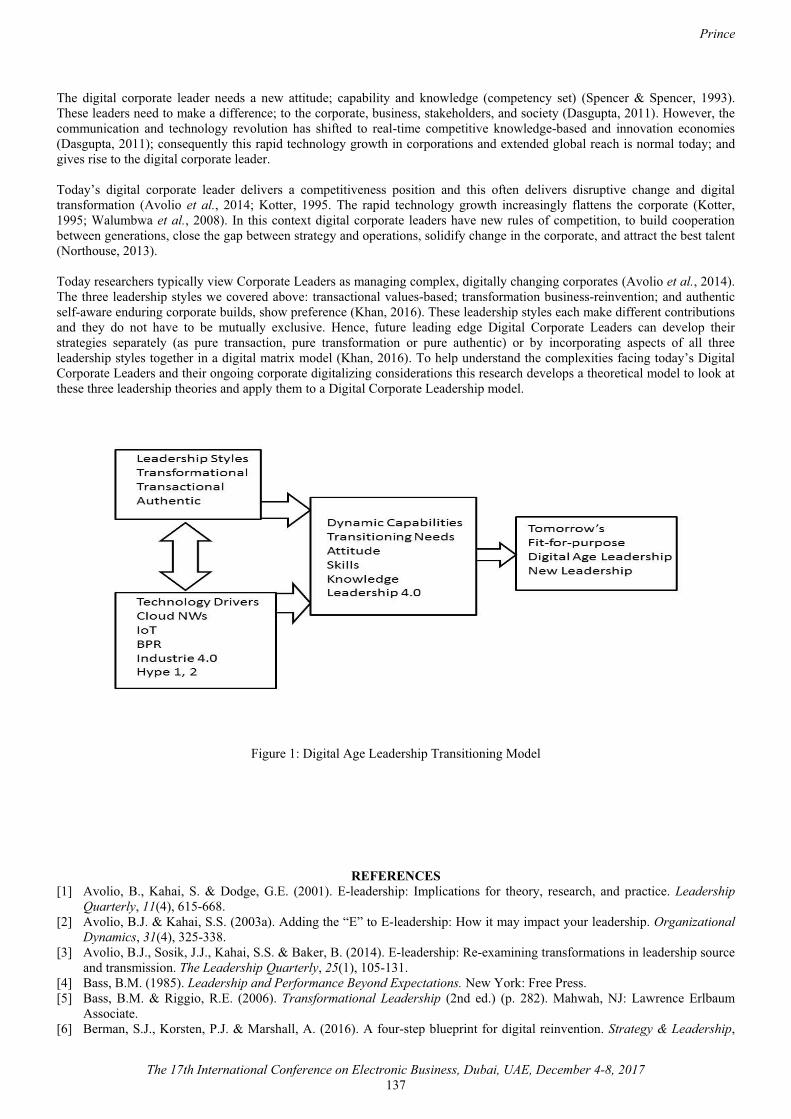
Prince
The 17th International Conference on Electronic Business, Dubai, UAE, December 4-8, 2017 137
The digital corporate leader needs a new attitude; capability and knowledge (competency set) (Spencer & Spencer, 1993). These leaders need to make a difference; to the corporate, business, stakeholders, and society (Dasgupta, 2011). However, the communication and technology revolution has shifted to real-time competitive knowledge-based and innovation economies (Dasgupta, 2011); consequently this rapid technology growth in corporations and extended global reach is normal today; and gives rise to the digital corporate leader.
Today’s digital corporate leader delivers a competitiveness position and this often delivers disruptive change and digital transformation (Avolio et al., 2014; Kotter, 1995. The rapid technology growth increasingly flattens the corporate (Kotter, 1995; Walumbwa et al., 2008). In this context digital corporate leaders have new rules of competition, to build cooperation between generations, close the gap between strategy and operations, solidify change in the corporate, and attract the best talent (Northouse, 2013).
Today researchers typically view Corporate Leaders as managing complex, digitally changing corporates (Avolio et al., 2014). The three leadership styles we covered above: transactional values-based; transformation business-reinvention; and authentic self-aware enduring corporate builds, show preference (Khan, 2016). These leadership styles each make different contributions and they do not have to be mutually exclusive. Hence, future leading edge Digital Corporate Leaders can develop their strategies separately (as pure transaction, pure transformation or pure authentic) or by incorporating aspects of all three leadership styles together in a digital matrix model (Khan, 2016). To help understand the complexities facing today’s Digital Corporate Leaders and their ongoing corporate digitalizing considerations this research develops a theoretical model to look at these three leadership theories and apply them to a Digital Corporate Leadership model.
Figure 1: Digital Age Leadership Transitioning Model
REFERENCES[1] Avolio, B., Kahai, S. & Dodge, G.E. (2001). E-leadership: Implications for theory, research, and practice. Leadership
Quarterly, 11(4), 615-668.[2] Avolio, B.J. & Kahai, S.S. (2003a). Adding the “E” to E-leadership: How it may impact your leadership. Organizational
Dynamics, 31(4), 325-338.[3] Avolio, B.J., Sosik, J.J., Kahai, S.S. & Baker, B. (2014). E-leadership: Re-examining transformations in leadership source
and transmission. The Leadership Quarterly, 25(1), 105-131.[4] Bass, B.M. (1985). Leadership and Performance Beyond Expectations. New York: Free Press.[5] Bass, B.M. & Riggio, R.E. (2006). Transformational Leadership (2nd ed.) (p. 282). Mahwah, NJ: Lawrence Erlbaum
Associate.[6] Berman, S.J., Korsten, P.J. & Marshall, A. (2016). A four-step blueprint for digital reinvention. Strategy & Leadership,
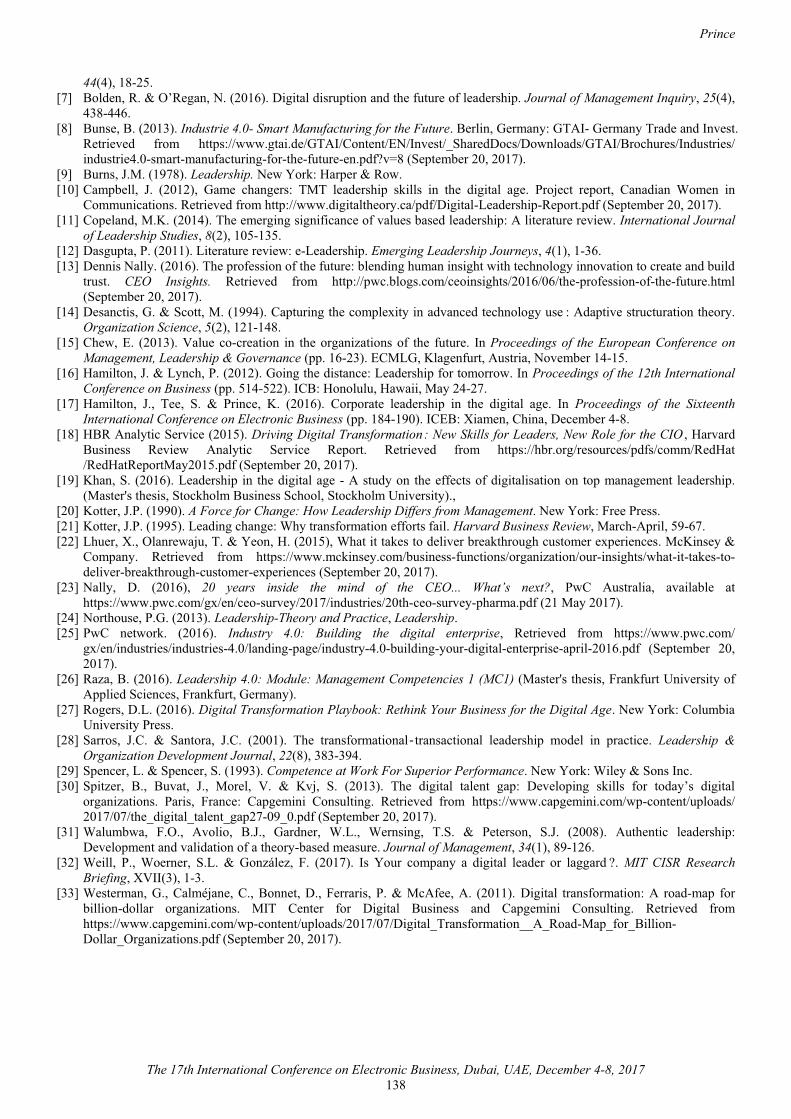
Prince
The 17th International Conference on Electronic Business, Dubai, UAE, December 4-8, 2017 138
44(4), 18-25.[7] Bolden, R. & O’Regan, N. (2016). Digital disruption and the future of leadership. Journal of Management Inquiry, 25(4),
438-446.[8] Bunse, B. (2013). Industrie 4.0- Smart Manufacturing for the Future. Berlin, Germany: GTAI- Germany Trade and Invest.
Retrieved from https://www.gtai.de/GTAI/Content/EN/Invest/_SharedDocs/Downloads/GTAI/Brochures/Industries/ industrie4.0-smart-manufacturing-for-the-future-en.pdf?v=8 (September 20, 2017).
[9] Burns, J.M. (1978). Leadership. New York: Harper & Row.[10] Campbell, J. (2012), Game changers: TMT leadership skills in the digital age. Project report, Canadian Women in
Communications. Retrieved from http://www.digitaltheory.ca/pdf/Digital-Leadership-Report.pdf (September 20, 2017).[11] Copeland, M.K. (2014). The emerging significance of values based leadership: A literature review. International Journal
of Leadership Studies, 8(2), 105-135.[12] Dasgupta, P. (2011). Literature review: e-Leadership. Emerging Leadership Journeys, 4(1), 1-36.[13] Dennis Nally. (2016). The profession of the future: blending human insight with technology innovation to create and build
trust. CEO Insights. Retrieved from http://pwc.blogs.com/ceoinsights/2016/06/the-profession-of-the-future.html(September 20, 2017).
[14] Desanctis, G. & Scott, M. (1994). Capturing the complexity in advanced technology use3*�4����")��structuration theory. Organization Science, 5(2), 121-148.
[15] Chew, E. (2013). Value co-creation in the organizations of the future. In Proceedings of the European Conference on Management, Leadership & Governance (pp. 16-23). ECMLG, Klagenfurt, Austria, November 14-15.
[16] Hamilton, J. & Lynch, P. (2012). Going the distance: Leadership for tomorrow. In Proceedings of the 12th International Conference on Business (pp. 514-522). ICB: Honolulu, Hawaii, May 24-27.
[17] Hamilton, J., Tee, S. & Prince, K. (2016). Corporate leadership in the digital age. In Proceedings of the Sixteenth International Conference on Electronic Business (pp. 184-190). ICEB: Xiamen, China, December 4-8.
[18] HBR Analytic Service (2015). Driving Digital Transformation������������ ��������������������� ���������� , HarvardBusiness Review Analytic Service Report. Retrieved from https://hbr.org/resources/pdfs/comm/RedHat /RedHatReportMay2015.pdf (September 20, 2017).
[19] Khan, S. (2016). Leadership in the digital age - A study on the effects of digitalisation on top management leadership. (Master's thesis, Stockholm Business School, Stockholm University).,
[20] Kotter, J.P. (1990). A Force for Change: How Leadership Differs from Management. New York: Free Press.[21] Kotter, J.P. (1995). Leading change: Why transformation efforts fail. Harvard Business Review, March-April, 59-67.[22] Lhuer, X., Olanrewaju, T. & Yeon, H. (2015), What it takes to deliver breakthrough customer experiences. McKinsey &
Company. Retrieved from https://www.mckinsey.com/business-functions/organization/our-insights/what-it-takes-to-deliver-breakthrough-customer-experiences (September 20, 2017).
[23] Nally, D. (2016), 20 years inside the mind of the CEO... What’s next?, PwC Australia, available at https://www.pwc.com/gx/en/ceo-survey/2017/industries/20th-ceo-survey-pharma.pdf (21 May 2017).
[24] Northouse, P.G. (2013). Leadership-Theory and Practice, Leadership.[25] PwC network. (2016). Industry 4.0: Building the digital enterprise, Retrieved from https://www.pwc.com/
gx/en/industries/industries-4.0/landing-page/industry-4.0-building-your-digital-enterprise-april-2016.pdf (September 20, 2017).
[26] Raza, B. (2016). Leadership 4.0: Module: Management Competencies 1 (MC1) (Master's thesis, Frankfurt University of Applied Sciences, Frankfurt, Germany).
[27] Rogers, D.L. (2016). Digital Transformation Playbook: Rethink Your Business for the Digital Age. New York: Columbia University Press.
[28] Sarros, J.C. & Santora, J.C. (2001). The transformational transactional leadership model in practice. Leadership & Organization Development Journal, 22(8), 383-394.
[29] Spencer, L. & Spencer, S. (1993). Competence at Work For Superior Performance. New York: Wiley & Sons Inc.[30] Spitzer, B., Buvat, J., Morel, V. & Kvj, S. (2013). The digital talent gap: Developing skills for today’s digital
organizations. Paris, France: Capgemini Consulting. Retrieved from https://www.capgemini.com/wp-content/uploads/2017/07/the_digital_talent_gap27-09_0.pdf (September 20, 2017).
[31] Walumbwa, F.O., Avolio, B.J., Gardner, W.L., Wernsing, T.S. & Peterson, S.J. (2008). Authentic leadership: Development and validation of a theory-based measure. Journal of Management, 34(1), 89-126.
[32] Weill, P., Woerner, S.L. & González, F. (2017). Is Your company a digital leader or laggard3?. MIT CISR Research Briefing, XVII(3), 1-3.
[33] Westerman, G., Calméjane, C., Bonnet, D., Ferraris, P. & McAfee, A. (2011). Digital transformation: A road-map for billion-dollar organizations. MIT Center for Digital Business and Capgemini Consulting. Retrieved from https://www.capgemini.com/wp-content/uploads/2017/07/Digital_Transformation__A_Road-Map_for_Billion-Dollar_Organizations.pdf (September 20, 2017).
Prince
The 17th International Conference on Electronic Business, Dubai, UAE, December 4-8, 2017 139
Figure 2: Corporate Leader digital age 3D positioning horizons matrix
Jung, S.G., An, J., Kwak, H., Salminen, J. & Jansen, B.J.(2017). Inferring social media users’ demographics from profile pictures: A Face++ analysis on Twitter users. InProceedings of The 17th International Conference on Electronic Business (pp. 140-145). ICEB, Dubai, UAE, December 4-8.
Jung, An, Kwak, Salminen & Jansen
The 17th International Conference on Electronic Business, Dubai, UAE, December 4-8, 2017140
Inferring Social Media Users’ Demographics from Profile Pictures: A Face++ Analysis on Twitter Users
Soon-Gyo Jung*, [email protected]
Jisun An, [email protected]
Haewoon Kwak, [email protected]
Joni Salminen, [email protected]
Bernard J. Jansen, [email protected]
1Qatar Computing Research Institute, Hamad Bin Khalifa University, Qatar,
ABSTRACTIn this research, we evaluate the applicability of using facial recognition of social media account profile pictures to infer the demographic attributes of gender, race, and age of the account owners leveraging a commercial and well-known image service, specifically Face++. Our goal is to determine the feasibility of this approach for actual system implementation. Using a dataset of approximately 10,000 Twitter profile pictures, we use Face++ to classify this set of images for gender, race, and age. We determine that about 30% of these profile pictures contain identifiable images of people using the current state-of-the-art automated means. We then employ human evaluations to manually tag both the set of images that were determined to contain faces and the set that was determined not to contain faces, comparing the results to Face++. Of the thirty percent that Face++identified as containing a face, about 80% are more likely than not the account holder based on our manual classification, with a variety of issues in the remaining 20%. Of the images that Face++ was unable to detect a face, we isolate a variety of likely issues preventing this detection, when a face actually appeared in the image. Overall, we find the applicability of automatic facial recognition to infer demographics for system development to be problematic, despite the reported high accuracy achieved for image test collections.
Keywords: Face++, Twitter, demographic inference, social media, demographics, user attributes, personas._____________________*Corresponding author
INTRODUCTIONSocial media platforms have become a major resource for population or customer segmentation analysis in many fields, including sociology, marketing, and public policy (Zagheni, Garimella & Weber, 2014). Often, these analyses require the use of users’ demographic information, many times gathered from data available from social media platforms. Major social media platforms, such as YouTube and Facebook, share aggregated demographic data, in a privacy-preserving manner. Access to this data is provided via application program interfaces (APIs) to account holders. The APIs enable one to retrieve and utilize demographic information related to user interactions with posts in these accounts. However, not all social media platforms provide such post-level information. For example, Twitter does not provide such demographic data at a tweet level. While Twitter does provide information about followers as an overall audience statistic, more granular, tweet-level information is necessary for many purposes, such as analyzing the performance of content among different target groups, or for automatic persona generation that associates demographic groups with content-level interaction (An et al, 2016).
Because accurately gathering demographic information from these platforms, particularly Twitter, has numerous obstacles (Salminen et al, 2017), researchers have proposed methods for automatically inferring demographic attributes (e.g., by leveraging users’ behavioral or profile information) (Alowibdi, Buy & Yu, 2013a; 2013b; Asoh & Ono, 2012). One of the most promising methods is the analysis of profile pictures. In particular, Face++ provides technologies for facial analysis within images and it is currently used by many researchers and industry practitioners for automating the analysis of facial images (Asoh & Ono, 2012).
In the research reported here, we evaluate the applicability of using profile pictures combined with facial recognition of these images to infer the demographic attributes of gender, race, and age of the account owners. We use Twitter (https://www.twitter.com), a popular social media platform, to retrieve users’ profile pictures, due to three reasons: 1) our system leverages tweets as a part of the automatic persona generation methodology, 2) the profile pictures on Twitter can be readilyaccessed via an API, and 3) Twitter is a highly popular social media platform and therefore impactful research context. We aim to first evaluate whether or not profile pictures are a reliable source for determining demographics automatically. For this, we leverage a commercial and well-known facial recognition service in images, specifically Face++ (https://www.faceplusplus.com/). Face++ is chosen because it represents a state-of-the-art facial recognition technology and is
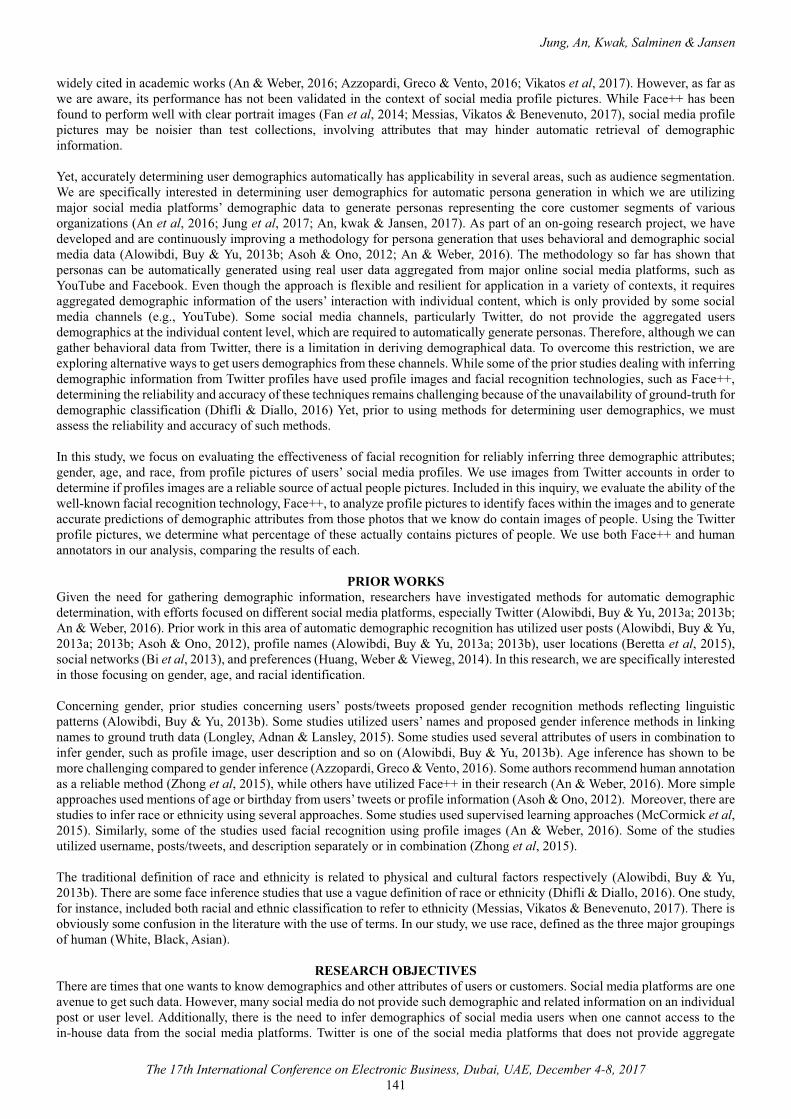
Jung, An, Kwak, Salminen & Jansen
The 17th International Conference on Electronic Business, Dubai, UAE, December 4-8, 2017141
widely cited in academic works (An & Weber, 2016; Azzopardi, Greco & Vento, 2016; Vikatos et al, 2017). However, as far as we are aware, its performance has not been validated in the context of social media profile pictures. While Face++ has been found to perform well with clear portrait images (Fan et al, 2014; Messias, Vikatos & Benevenuto, 2017), social media profile pictures may be noisier than test collections, involving attributes that may hinder automatic retrieval of demographic information.
Yet, accurately determining user demographics automatically has applicability in several areas, such as audience segmentation. We are specifically interested in determining user demographics for automatic persona generation in which we are utilizing major social media platforms’ demographic data to generate personas representing the core customer segments of various organizations (An et al, 2016; Jung et al, 2017; An, kwak & Jansen, 2017). As part of an on-going research project, we have developed and are continuously improving a methodology for persona generation that uses behavioral and demographic social media data (Alowibdi, Buy & Yu, 2013b; Asoh & Ono, 2012; An & Weber, 2016). The methodology so far has shown that personas can be automatically generated using real user data aggregated from major online social media platforms, such as YouTube and Facebook. Even though the approach is flexible and resilient for application in a variety of contexts, it requiresaggregated demographic information of the users’ interaction with individual content, which is only provided by some social media channels (e.g., YouTube). Some social media channels, particularly Twitter, do not provide the aggregated users demographics at the individual content level, which are required to automatically generate personas. Therefore, although we can gather behavioral data from Twitter, there is a limitation in deriving demographical data. To overcome this restriction, we are exploring alternative ways to get users demographics from these channels. While some of the prior studies dealing with inferring demographic information from Twitter profiles have used profile images and facial recognition technologies, such as Face++, determining the reliability and accuracy of these techniques remains challenging because of the unavailability of ground-truth for demographic classification (Dhifli & Diallo, 2016) Yet, prior to using methods for determining user demographics, we must assess the reliability and accuracy of such methods.
In this study, we focus on evaluating the effectiveness of facial recognition for reliably inferring three demographic attributes; gender, age, and race, from profile pictures of users’ social media profiles. We use images from Twitter accounts in order todetermine if profiles images are a reliable source of actual people pictures. Included in this inquiry, we evaluate the ability of the well-known facial recognition technology, Face++, to analyze profile pictures to identify faces within the images and to generate accurate predictions of demographic attributes from those photos that we know do contain images of people. Using the Twitter profile pictures, we determine what percentage of these actually contains pictures of people. We use both Face++ and human annotators in our analysis, comparing the results of each.
PRIOR WORKSGiven the need for gathering demographic information, researchers have investigated methods for automatic demographic determination, with efforts focused on different social media platforms, especially Twitter (Alowibdi, Buy & Yu, 2013a; 2013b;An & Weber, 2016). Prior work in this area of automatic demographic recognition has utilized user posts (Alowibdi, Buy & Yu, 2013a; 2013b; Asoh & Ono, 2012), profile names (Alowibdi, Buy & Yu, 2013a; 2013b), user locations (Beretta et al, 2015), social networks (Bi et al, 2013), and preferences (Huang, Weber & Vieweg, 2014). In this research, we are specifically interested in those focusing on gender, age, and racial identification.
Concerning gender, prior studies concerning users’ posts/tweets proposed gender recognition methods reflecting linguistic patterns (Alowibdi, Buy & Yu, 2013b). Some studies utilized users’ names and proposed gender inference methods in linking names to ground truth data (Longley, Adnan & Lansley, 2015). Some studies used several attributes of users in combination to infer gender, such as profile image, user description and so on (Alowibdi, Buy & Yu, 2013b). Age inference has shown to be more challenging compared to gender inference (Azzopardi, Greco & Vento, 2016). Some authors recommend human annotation as a reliable method (Zhong et al, 2015), while others have utilized Face++ in their research (An & Weber, 2016). More simple approaches used mentions of age or birthday from users’ tweets or profile information (Asoh & Ono, 2012). Moreover, there are studies to infer race or ethnicity using several approaches. Some studies used supervised learning approaches (McCormick et al, 2015). Similarly, some of the studies used facial recognition using profile images (An & Weber, 2016). Some of the studies utilized username, posts/tweets, and description separately or in combination (Zhong et al, 2015).
The traditional definition of race and ethnicity is related to physical and cultural factors respectively (Alowibdi, Buy & Yu, 2013b). There are some face inference studies that use a vague definition of race or ethnicity (Dhifli & Diallo, 2016). One study, for instance, included both racial and ethnic classification to refer to ethnicity (Messias, Vikatos & Benevenuto, 2017). There is obviously some confusion in the literature with the use of terms. In our study, we use race, defined as the three major groupings of human (White, Black, Asian).
RESEARCH OBJECTIVESThere are times that one wants to know demographics and other attributes of users or customers. Social media platforms are one avenue to get such data. However, many social media do not provide such demographic and related information on an individual post or user level. Additionally, there is the need to infer demographics of social media users when one cannot access to the in-house data from the social media platforms. Twitter is one of the social media platforms that does not provide aggregate
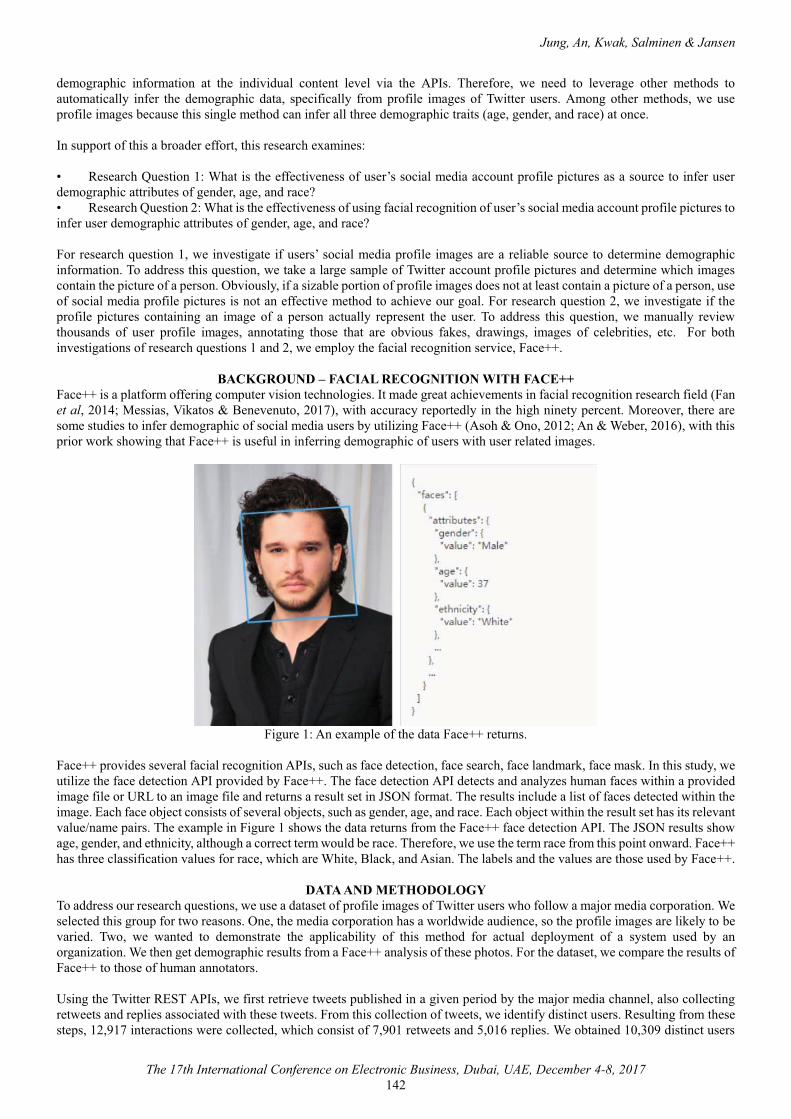
Jung, An, Kwak, Salminen & Jansen
The 17th International Conference on Electronic Business, Dubai, UAE, December 4-8, 2017142
demographic information at the individual content level via the APIs. Therefore, we need to leverage other methods to automatically infer the demographic data, specifically from profile images of Twitter users. Among other methods, we use profile images because this single method can infer all three demographic traits (age, gender, and race) at once.
In support of this a broader effort, this research examines:
• Research Question 1: What is the effectiveness of user’s social media account profile pictures as a source to infer user demographic attributes of gender, age, and race?• Research Question 2: What is the effectiveness of using facial recognition of user’s social media account profile pictures to infer user demographic attributes of gender, age, and race?
For research question 1, we investigate if users’ social media profile images are a reliable source to determine demographic information. To address this question, we take a large sample of Twitter account profile pictures and determine which images contain the picture of a person. Obviously, if a sizable portion of profile images does not at least contain a picture of a person, use of social media profile pictures is not an effective method to achieve our goal. For research question 2, we investigate if the profile pictures containing an image of a person actually represent the user. To address this question, we manually review thousands of user profile images, annotating those that are obvious fakes, drawings, images of celebrities, etc. For both investigations of research questions 1 and 2, we employ the facial recognition service, Face++.
BACKGROUND – FACIAL RECOGNITION WITH FACE++Face++ is a platform offering computer vision technologies. It made great achievements in facial recognition research field (Fan et al, 2014; Messias, Vikatos & Benevenuto, 2017), with accuracy reportedly in the high ninety percent. Moreover, there are some studies to infer demographic of social media users by utilizing Face++ (Asoh & Ono, 2012; An & Weber, 2016), with this prior work showing that Face++ is useful in inferring demographic of users with user related images.
Figure 1: An example of the data Face++ returns.
Face++ provides several facial recognition APIs, such as face detection, face search, face landmark, face mask. In this study, we utilize the face detection API provided by Face++. The face detection API detects and analyzes human faces within a provided image file or URL to an image file and returns a result set in JSON format. The results include a list of faces detected within the image. Each face object consists of several objects, such as gender, age, and race. Each object within the result set has its relevant value/name pairs. The example in Figure 1 shows the data returns from the Face++ face detection API. The JSON results show age, gender, and ethnicity, although a correct term would be race. Therefore, we use the term race from this point onward. Face++ has three classification values for race, which are White, Black, and Asian. The labels and the values are those used by Face++.
DATA AND METHODOLOGYTo address our research questions, we use a dataset of profile images of Twitter users who follow a major media corporation. We selected this group for two reasons. One, the media corporation has a worldwide audience, so the profile images are likely to be varied. Two, we wanted to demonstrate the applicability of this method for actual deployment of a system used by an organization. We then get demographic results from a Face++ analysis of these photos. For the dataset, we compare the results of Face++ to those of human annotators.
Using the Twitter REST APIs, we first retrieve tweets published in a given period by the major media channel, also collecting retweets and replies associated with these tweets. From this collection of tweets, we identify distinct users. Resulting from these steps, 12,917 interactions were collected, which consist of 7,901 retweets and 5,016 replies. We obtained 10,309 distinct users
Jung, An, Kwak, Salminen & Jansen
The 17th International Conference on Electronic Business, Dubai, UAE, December 4-8, 2017143
who are involved in the interaction with the media corporation account and collected their profile images. Figure 2 shows somesample profile images to show the variety of profile images used and illustrating that profile images are not always the expected headshot. As shown in Figure 1, some users use cartoon images like (a), or celebrities’ images like (f). Even if some users use their own photo, the photo might not include their face. Figure 2e, for instance, shows user’s legs, and Figure 2g includes two faces repeated multiple times.
In evaluating demographic recognition, we use 6 categorized age bins, like most of the social media analysis tools provide. Those with an age inferred or from ground-truth between 13 to 17 (denoted as 13-17), 18 to 24 (18-24), 25 to 34 (25-34), 35 to 44 (35-44), 45 to 54 (45-54), 55 to 64 (54-64), and 65 or older (65+). Gender is labeled as male or female. For race, Asian, Black, and White comprise the label set, which are three racial labels that Face++ provides.
Figure 2: Sample profile pictures of Twitter users. Note: Black bars added for privacy preservation.
RESULTSUsing the 10,309 profile pictures of Twitter users, we submitted the URLs to the Face++ face detection API. Of these 10,309 images, the Face++ API detected one or more faces in 3,566 (34.6%) pictures, with the remaining 6,743 (65.4%) containing no face detectable by the Face++ service. Already, focus back on our research question one, it is questionable whether profile images are a reliable source for determining user demographics, with only 34.6% of the profile pictures have a detectable facial image. As we shown in Figure 2 above, there are many profile pictures that do not contain an image of the user or even a person. So, it makes us question whether social media profile pictures are useful as a source of demographic data or not for the actual application development. However, we explore the images more to get more detailed results. Specifically, we manually check the two sub-datasets, the profile pictures in which Face++ detected a face and the profiles pictures where Face++ reported no face.
Profiles Pictures With Faces Detected by Face++In the manual coding of the 3,566 pictures where Face++ had detected, 3,177 (30.8% of the original dataset) had only one face. From our review, determining the demographics of the user from 389 images with multiple faces was problematic, as nearly all of these images contained multiple people making a determination of the actual account holder impossible from just the profile picture. During the process of the manually coding, we determined that 775 (24.4%) of the account holders had changed their profile image, so profiles images are a fairly unstable source of demographic information.
However, we then manually checked 2,402 (75.6%) of the 3,177 pictures having only one recognized face by Face++ to gauge the reliability of facial recognition technology for social media images. From our manual analysis, 80% (2,039) of the pictures had an image of a single person that could reasonably be the account holder (i.e., a real person, not a celebrity, etc.). So, this set would be utilizable for inferring user’s demographic. Interestingly, even though Face++ identifies only one face in this set of profile pictures, there were still pictures with multiple people (180 images, 7.4%). Plus, there is a lot of non-user face pictures, especially memes and celebrities (62 images, 2.5%). Also, there were pictures which are not real human being (i.e. Superman, Wonder Woman, etc.) (121 images, 5.0%). These results indicate a problem utilizing automatic face recognition services becausethe image may not be the actual Twitter user. However, the overall accuracy of at least detecting a face was about 80%.
Profiles Pictures With No Faces Detected by Face++
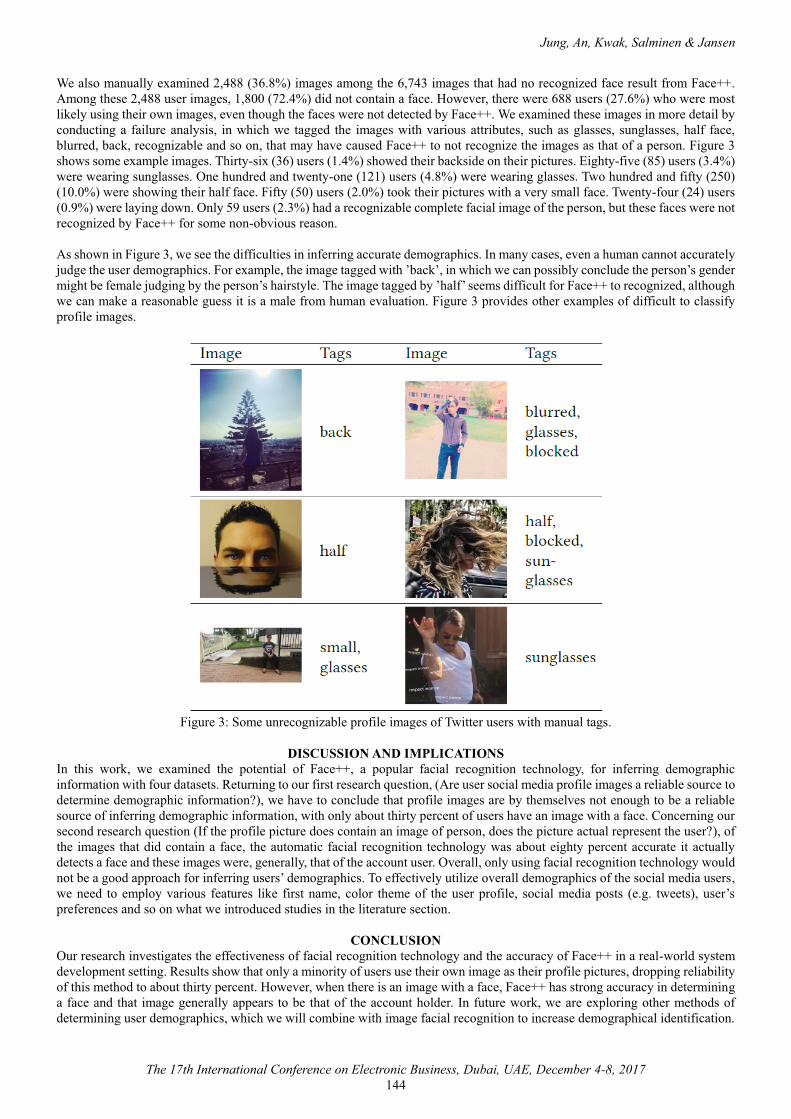
Jung, An, Kwak, Salminen & Jansen
The 17th International Conference on Electronic Business, Dubai, UAE, December 4-8, 2017144
We also manually examined 2,488 (36.8%) images among the 6,743 images that had no recognized face result from Face++. Among these 2,488 user images, 1,800 (72.4%) did not contain a face. However, there were 688 users (27.6%) who were most likely using their own images, even though the faces were not detected by Face++. We examined these images in more detail by conducting a failure analysis, in which we tagged the images with various attributes, such as glasses, sunglasses, half face, blurred, back, recognizable and so on, that may have caused Face++ to not recognize the images as that of a person. Figure 3 shows some example images. Thirty-six (36) users (1.4%) showed their backside on their pictures. Eighty-five (85) users (3.4%) were wearing sunglasses. One hundred and twenty-one (121) users (4.8%) were wearing glasses. Two hundred and fifty (250) (10.0%) were showing their half face. Fifty (50) users (2.0%) took their pictures with a very small face. Twenty-four (24) users (0.9%) were laying down. Only 59 users (2.3%) had a recognizable complete facial image of the person, but these faces were not recognized by Face++ for some non-obvious reason.
As shown in Figure 3, we see the difficulties in inferring accurate demographics. In many cases, even a human cannot accuratelyjudge the user demographics. For example, the image tagged with ’back’, in which we can possibly conclude the person’s gender might be female judging by the person’s hairstyle. The image tagged by ’half’ seems difficult for Face++ to recognized, althoughwe can make a reasonable guess it is a male from human evaluation. Figure 3 provides other examples of difficult to classify profile images.
Figure 3: Some unrecognizable profile images of Twitter users with manual tags.
DISCUSSION AND IMPLICATIONSIn this work, we examined the potential of Face++, a popular facial recognition technology, for inferring demographic information with four datasets. Returning to our first research question, (Are user social media profile images a reliable source to determine demographic information?), we have to conclude that profile images are by themselves not enough to be a reliable source of inferring demographic information, with only about thirty percent of users have an image with a face. Concerning our second research question (If the profile picture does contain an image of person, does the picture actual represent the user?), of the images that did contain a face, the automatic facial recognition technology was about eighty percent accurate it actually detects a face and these images were, generally, that of the account user. Overall, only using facial recognition technology would not be a good approach for inferring users’ demographics. To effectively utilize overall demographics of the social media users, we need to employ various features like first name, color theme of the user profile, social media posts (e.g. tweets), user’spreferences and so on what we introduced studies in the literature section.
CONCLUSIONOur research investigates the effectiveness of facial recognition technology and the accuracy of Face++ in a real-world system development setting. Results show that only a minority of users use their own image as their profile pictures, dropping reliability of this method to about thirty percent. However, when there is an image with a face, Face++ has strong accuracy in determininga face and that image generally appears to be that of the account holder. In future work, we are exploring other methods of determining user demographics, which we will combine with image facial recognition to increase demographical identification.
Jung, An, Kwak, Salminen & Jansen
The 17th International Conference on Electronic Business, Dubai, UAE, December 4-8, 2017145
REFERENCES[1] Alowibdi, J.S., Buy, U.A. & Yu, P. (2013). Empirical evaluation of profile characteristics for gender classification on twitter.
In Proceedings of the 12th International Conference on Machine Learning and Applications (pp. 365-369). IEEE, Miami, FL, USA, December 4-7.
[2] Alowibdi, J.S., Buy, U.A. & Yu, P. (2013). Language independent gender classification on Twitter. In Proceedings of the 2013 IEEE/ACM International Conference on Advances in Social Networks Analysis and Mining (pp. 739-743). ACM,Niagar Falls, ON, Canada, August 25-28.
[3] An, J. & Weber, I. (2016). #greysanatomy vs. #yankees: Demographics and hashtag use on Twitter. In the 10th International AAAI Conference on Web and Social Media – ICWSM-16. AAAI, Cologne, Germany, May 17-20.
[4] An, J., Cho, H., Kwak, H., Hassen, M. Z. & Jansen, B. J. (2016). Towards automatic persona generation using social media.In IEEE International Conference on Future Internet of Things and Cloud Workshops (FiCloudW) (pp. 206-211). IEEE, Vienna, Austria, Aug 22-24.
[5] An, J., Kwak, H. & Jansen, B.J. (2017). Personas for content creators via decomposed aggregate audience statistics. In Proceedings of the International Conference on Advances in Social Network Analysis and Mining (ASONAM 2017) (pp. 632-635). IEEE/ACM, Sydney, Australia, July 31-August 03.
[6] Asoh, H., Ikeda, K. & Ono, C. (2012). A fast and simple method for profiling a population of Twitter users. In Proceedings of the Third International Workshop on Mining Ubiquitous and Social Environments (pp. 19-26). MUSE, Bristol, UK, September 24.
[7] Azzopardi, G., Greco, A. & Vento, M. (2016). Gender recognition from face images using a fusion of svm classifiers. In International Conference on Image Analysis and Recognition (pp 533-538). ICIAR, Póvoa de Varzim, Portugal, July 13-15.
[8] Beretta, V., Maccagnola, D., Cribbin, T. & Messina, E. (2015). An interactive method for inferring demographic attributes in Twitter. In Proceedings of the 26th ACM Conference on Hypertext & Social Media (pp. 113-122). ACM, Ankara, Turkey, September 01-04.
[9] Bi, B., Shokouhi, M., Kosinski, M. & Graepel, T. (2013). Inferring the demographics of search users: Social data meets search queries. In Proceedings of the 22nd International Conference on World Wide Web (pp. 131-140). ACM, Brazil, May13-17.
[10] Dhifli, W. & Diallo, A.B. (2016). Face recognition in the wild. Procedia Computer Science, 96, 1571-1580.[11] Fan, H., Yang, M., Cao, Z., Jiang, Y. & Yin, Q. (2014). Learning compact face representation: Packing a face into an int32.
In Proceedings of the 22nd ACM international conference on Multimedia (pp. 933-936). ACM, Orlando, FL, USA, November 03-07.
[12] Huang, W., Weber, I. & Vieweg, S. (2014). Inferring nationalities of Twitter users and studying inter-national linking. In Proceedings of the 25th ACM conference on Hypertext and Social Media (pp. 237-242). ACM, Santiago, Chile, September01-04.
[13] Jung, S.G., An, J., Kwak, H., Ahmad, M., Nielsen, L. & Jansen, B.J. (2017). Persona generation from aggregated social media data. In Proceedings of the 2017 CHI Conference Extended Abstracts on Human Factors in Computing Systems (pp. 1748-1755). ACM, Denver, CO, USA, May 06-11.
[14] Longley, P.A., Adnan, M. & Lansley, G. (2015). The geotemporal demographics of Twitter usage. Environment and Planning A, 47(2), 465-484.
[15] McCormick, T.H., Lee, H., Cesare, N., Shojaie, A. & Spiro, E.S. (2015). Using Twitter for demographic and social science research: Tools for data collection and processing. Sociological Methods & Research, 46(3), 390-421
[16] Messias, J., Vikatos, P. & Benevenuto, F. (2017). White, man, and highly followed: Gender and race inequalities in Twitter. In Proceedings of the IEEE/WIC/ACM International Conference on Web Intelligence (WI'17) (8 pages). IEEE, Leipzig, Germany. August 23-26.
[17] (��$"%�% �5�6 �7�%�8% �( �9:�; �< �5�%��% �=�5 �4% �5 �5�%� �(�& �>"�:�� �(�& Harrell, F. (2017). Generating cultural personas from social data: A perspective of middle eastern users. In Proceedings of the Fourth International Symposium on Social Networks Analysis, Management and Security (pp. 120-125). SNMAS, Prague, Czech Republic, Aug 21-23.
[18] Vikatos, P., Messias, J., Miranda, M. & Benevenuto, F. (2017). Linguistic diversities of demographic groups in Twitter. InProceedings of the 28th ACM Conference on Hypertext and Social Media (pp. 275-284). ACM, Prague, Czech Republic,July 04- 07.
[19] Zagheni, E., Garimella, V.R.K. & Weber, I. (2014). Inferring international and internal migration patterns from twitter data.In Proceedings of the 23rd International Conference on World Wide Web (pp. 439-444). ACM, Seoul, Republic of Korea, April 07-11
[20] Zhong, Y., Yuan, N.J., Zhong, W., Zhang, F. & Xie, X. (2015). You are where you go: Inferring demographic attributes from location check-ins. In Proceedings of the 8th ACM International Conference on Web Search and Data Mining (pp. 295-304).ACM, Shanghai, China, January 31-February 06.
*% ��� ���� ��$�� ���� ����� ���� *%����� __� �� � �� ���������� � ��$����� �% � �$������ �!� !��������� � ��������'��� ��� ���� ��� ������ #� "��%� !$���� ���� ��#� !$����\��_&_� &�� Proceedings of The 17th International Conference on Electronic Business �''� �@~��~��� &*/<��=$�����>�/��= � �� ��@�[�
Chen, Liu, Lai, Chang & Lee
�
The 17th International Conference on Electronic Business, Dubai, UAE, December 4-8, 2017 �@~�
#�����������H� �������*��� �$ ��������'�����������_��������������*�[[���%'���*�[[����'����
�����$�*% ������������*%���%$��>��^ �������!�/#$��������\��"�����% �����{��%������"�
����������$�����������*%���%$��>��^ �������!�/#$��������\��"�����"�[{����%�� �� ��������������|�����������*%������>��^ �������!�\ �%��������\��"���������[��{��������� �
_%���_%�$��*%��������������*%���%$��>��^ �������!�/#$��������\��"�����% �������{�����������$����� �����������*%������>��^ �������!�\ �%��������\��"��������{��$� #$�"�
����������
\% ���$#�����������''����$�����������\��_&_����#���$����% �� ��!��������%���!��� ���% ��$�� ����!��$�� ����%��#�'���������� �'��� ���'���!�����\%�����$#��������� #��% ��$������� ��$� � ���������!�$����� ���� ����#� � ^ ���$����� ���� ��\% ��������\��_&_�����''�� #��������$��� ��% �" ��%� #��^ ��� ���!�������� ���� ����#��$����� ���� ������ ��$� ��% ��$�������!��%��#�'���������� � '��� ��� '���!����� \%��� ��$#�� !��#�� �%��� ���! ��� �$������� ��� �% � ����� �'%���� #� ��� ������ ����� �� �$������� ��� �% �� ���#�������$����������$�����������% ��%��#����#��� �^�� ��$�����������% �� ���� �'%���� #� ��Keywords���$���������!$����\��_&_�� �'��� ��������������������|*��� �'��#�����$�%����
�����!"������&��� � ���� �����"��%��% �# ^ ��'� ����!�&�� �� ��� �%��������!��������� � ��������'��� ������� ��������"������ ����������= ������������������� �% ������ �'��� ��� �������^ � �% �'%�������'��%��!� ��� ���#� ������'���� �����$�� ���������'��^�# ���� �^����� ��� �!� ��! �� !���� ��#� �� ���� �!� ���^ �� ��� �#^����� �� �}������ ������ �� }$��� ������ ���� �� *��^�]���\�$]������ ��/���������#�Ç�$ ��� ������ ��� '� � ���� !��������� � �������� '��� ��� ���� � � ���� ��� #�^�# #� ����� ��� �� �� �������� �������������^ ����� �� ��'�^�È�� ���@��� ����� � '��� ��� �_��# �� ="�^ #��� �� ����� �� ���������� ������ ��#� �%��#�'����� ����� � '��� �����$�����=����������������@��������� ���� �"���������@���&���##�������"��%� �% �� �"����� �^�� ��'��^�# #�����% �!$���������� ���#���� ����'� `��= ����������� ��# ��<������� ���������� � ������������� �� ��� �^�� �����' ������% �������� �^����� ���&��!������% �� �$��������$ ���� ������"���%���!� ��� ������ ��# ���� �� ������ _�� �%��� � �% � �''��'���� � � �"���� � �^�� � ^��$������ ���� ����� ������� ����� ����$��� �% ��$�] ���^ � ��#� ��] ���^ � ��! ��� !������� ������ \���� _%���� �� ����� ������� �%�$�#� � � ��� #� ��� �% � $� �©�� � �$����� � ^ ��� �$�� � �����������# ��$�������������Ç��������������*��������������~�� ���"�������'����� � ���% ���������� � �'��� ���" � ������!����% ��%��� ��!������ ��������^ ����� ����$��� ^����������_�%$%����_��^����� ���~��� �$�� ��� ��#��©�� ����� � ���#���� �^����� ���� �% � # �������������� '���� �� !�� #� ��� �% � $� �� ��� ���'� `� ��#��%��� ��� ��� ��������������%����������\%��������������$� ����!� ��!�� #�"��%��% ��%��� ��������������� ����� ���������� �$� #�������^ � ���������~��<$�� ���% �� ��������# �� �% �^����$����� ��� ������� ���� ���"%��%� �% ���� �'�������� ���������#���� � �% �������''��'���� ��%��� ������������$�� ����= �����������@��&���%���"�����$�������� ����# ����������������*=���� ��� ���� �%�#��!� ��$� #����# ���������� �����%��������~��\% � !�� ���%�����$#��"�����''����$�������� ����# ��������������� �%�#�����������!��������� � �������� �'��� ���$� ���������$�� ���!�'������ ��'�����������#��������% ��%����� ���������!� ��%�������$� ��!� ��%�'����������� � ��%�'���������������!�� ������% �� ^��$�� ���#�� � ����% ��# ������$�����!����% �$� �� ���^ ������ �%��� ��$#�� "���� $� � �% � �# ��� ���$����� ����������� ��� '� '�� � �% � ��# �� ��� ��� ��� �#]$��� ��� � �%�#� ��� �� � �"����� �^�� � � ���� �#������ � �%�#� ������%���� &���%���� ���@�� \�� ������� � ����� � � �"���� � �^�� � ���� ��� �����!������� "��%���$��� ���� � ������ et al�� ���~��� ��#� �% �� $� � �% � %� ����%����� ��������� � �%�#� ��� ������� �% � $� �©�� ! #����� " ��%���*%�$#%���� �� >'� ���� ���~�� \%��� ��� ��� ����� �% � �������%� ��� �!� �� ��$�� #� � �������� '��� ��� � �"���� � �^�� �� ���� �#������� �%�������=�%�� �����$�������#�$���������� �
&��$���"�$��$@�$;������ �% � ��� ���$� � ��� `'��� � �% � ����� ���� ���� ���� � � #�^�# #� ����� ���� �� �$������� ����$��������� �$������� � �^�� � �$��������#��! ����$�������� ���$������"�����~���%�$�����@��_��� ���$����������� �#�^�# #������ �� ��!�$� ���#�� �'��� ��' #��!��% ��"���$������ ���� ����%�����_���%���������%�$�����@��*���$����������$����������� �#�^�# #� ��������$������ ��� #�������#���� ������ �!� �% � �%� � �$������ ���� ������� �$�� *%�$�� �� �$'���� ������ �%�$�� ������ ���@�� _ �^�� � �$������ ��� #�^�# #� ������ �������������$����$� �������!��������%� ��$������ ������%�$��������_ �$������$����������� �#�^�# #������� �"����� �$���������� ��� �$������������������� �$������%� ��$������ ������ �� ����#��������~������������ � ��������'��� ���'���������������#�^�# #�
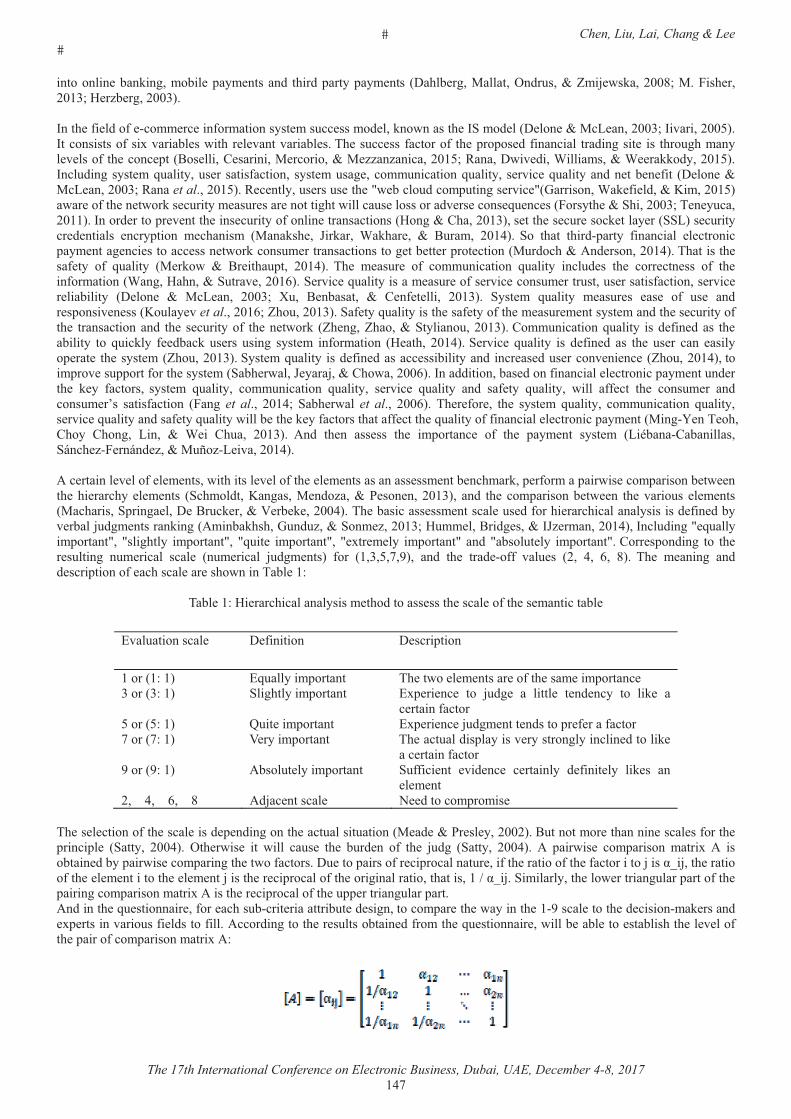
� Chen, Liu, Lai, Chang & Lee �
The 17th International Conference on Electronic Business, Dubai, UAE, December 4-8, 2017 �@��
���������� ��������������� �'��� ������#� �%��#�'�����'��� ���� �=�%�� ��������������#�$��������] "��������[�������% ���������� ��� �����������&���% �!� �#��!� ����� �� ���!������������� ���$�� �����# ������"������% �&_���# ���= ��� ������ ����������&�^�����������&������������!���`�^������ ��"��%�� � ^����^������ ��\% ��$�� ���!�������!� �% �'��'�� #�!��������� ���#������� � ��� �%��$�%������� ^ ����!��% ����� '���<�� �����* ��������� ����������� ������������������������="�^ #���������������� �����#���������&���$#�������� ���$�������$� �������!������������ ��$��� ������$����������$������� � �^�� ��$��������#�� ��� � !��� �= ��� ������ ���������������et al��������� � ������$� ���$� ��% ��" �����$#����'$������ �^�� ��������������� !� �#����������������"�� ��!��% �� �"����� �$������ ��$� ���� ��������%��"������$� ����������#^ �� ����� �$ �� ���������% ���_%���������\ � �$����������&����# �����'� ^ ����% ���� �$������!������ ����������������������*%����������� ���% �� �$� ����� ����� ���__���� �$������� # ������� ����'����� � �%������ �������% �� }������� ���%�� �� �� <$����� ���@�� _�� �%��� �%��#�'����� !��������� � ��������'��� ����� ��� �������� ���� �"��������$� ������������������� ��� �� ��'��� ��������$�#��%�����# ���������@��\%�������% ���! ��� �!� �$������ �� ���"� �� <� ��%�$'��� ���@�� \% � � ��$� � �!� ����$��������� �$������ ����$# �� �% � ���� ��� ��� �!� �% ���!������������������%�����_$���^ �����~��_ �^�� ��$������������ ��$� ��!�� �^�� �����$� ����$����$� �������!��������� �^�� �� ���������� �= ��� � �� ��� ���� ������ $�� < �������� �� * �! � ����� ������ _��� �� �$������ � ��$� �� �� � �!� $� � ��#�� �'����^ � ������$��� ^�et al�����~���%�$��������_�! ����$����������% ���! ����!��% �� ��$� � ������� ����#��% �� �$������!��% � ��������������#� �% � � �$������!� �% �� �"���� ��% �����%������_�������$��������*���$����������$������ ���# !�� #���� �% ��������� ��� �$������ ! #����� $� ��� $����� ���� �� ��!��������� �� ��%�� ���@��_ �^�� � �$������ ��� # !�� #� ��� �% � $� �� ���� �������' ��� � �% ����� ����%�$��������_��� ���$������ ���# !�� #������� ������������#� ���� �� #�$� �����^ �� �� ���%�$�����@��������'��^ ��$''����!����% ����� ���_��% �"����} ����]����*%�"������~��&���##���������� #����!��������� � ��������'��� ���$�# ���% � � �� !�������� ���� �� �$������� ����$��������� �$������� � �^�� � �$������ ��#� ��! ��� �$������� "���� �!! ��� �% � ����$� �� ��#�����$� ���� �����!������� ������ et al�� ���@�� _��% �"��� et al�� ���~�� \% � !�� �� �% � ���� �� �$������� ����$��������� �$�������� �^�� ��$��������#���! ����$������"����� ��% �� ��!��������%����!! ����% ��$�������!�!��������� � ��������'��� ���������� ��\ �%��*%��� *%����� ����� �� � �� *%$��� ������ ��#� �% �� ��� ��� �% � ��'������ � �!� �% � '��� ��� ���� �� ���������*�����������_��% ��� ���# ������$���� �^������@������ ������� ^ ���!� � � �����"��%������ ^ ���!��% � � � ������������� ��� ���� ��%������' �!������'���"�� ����'�������� �" ���% �%� ����%�� � � ���� �_�%���#������������ �#�������� ��� ��� ������� ��#� �% � ���'�������� �" �� �% � ^����$�� � � ��������%������_'����� ���= �<�$�� ������ �� � �����@��\% ���������� ��� ������� �$� #�!���%� ����%�����������������# !�� #����^ �����]$#�� ��������������������%�%���$�#$�����_��� ����������$�� ���<��#� �����&}� ���������@���&���$#����� �$�������'��������� �����%���� ��'��������� ��$�� � ��'��������� � `�� � ��� ��'�������� ��#� ������$� ��� ��'��������*��� �'��#���� ��� �% �� �$������ �$� ������ ���� � ��$� ������ ]$#�� ����� !��� ������������� ��#� �% � ���# ��!!� ^��$ �� ���� @�� ~�� [�� \% � � ������ ��#�# ����'������!� ��%����� ��� ��%�"�����\��� �����
\��� ������ ����%��������������� �%�#������� ����% ����� ��!��% �� ����������� �
/^��$���������� � = !�������� = ����'�����
������������ /�$�������'������� \% ��"�� � � ������ ��!��% ���� ���'������ ������������� _���%������'������� /`' �� �� � ��� ]$#� � �� ����� � � �# ���� ��� ��� � ��
� ������!������������������ $�� ���'������� /`' �� �� �]$#�� ���� �#�����'� ! ����!������������������ � �����'������� \% ����$���#��'�������^ ������������������ #������� �
��� ������!������������������ �����$� �����'������� _$!!��� ��� ^�# �� � � �������� # !���� ��� ��� �� ���
� � ������ � @�� � ~�� � [� �#]�� ������� � � #�������'����� �
�\% �� � �������!��% ����� ����# ' �#��������% ����$������$�������� �# ����� �� ���������<$��������� ��%������ ����� ��!����% �'�����'� � �_������ ���@�� ��% �"�� � ��� "���� ��$� � �% � �$�# �� �!� �% � ]$#�� �_������ ���@�� �� '���"�� � ���'������� �����`� �� ��������� #����'���"�� ����'�������% ��"��!�������=$ ����'������!�� ��'���������$� ���!��% ��������!��% �!�����������]����Ì��]���% ��������!��% � � � ���������% � � � ���]�����% �� ��'�������!��% ������������������%���������¡�Ì��]�_�����������% ���" ��������$����'�����!��% �'����������'������������`�������% �� ��'�������!��% �$'' ��������$����'������#�����% ��$ ��������� ��!��� ��%��$������ ����������$� �# ������������'�� ��% �"�������% ��������� �����% �# ���������� �����#� `' �������^����$��!� �#�����!���������#��������% �� �$���������� #�!�����% ��$ ��������� ��"����� ���� ���� �������%��% �� ^ ���!��% �'�����!����'������������`�����
�
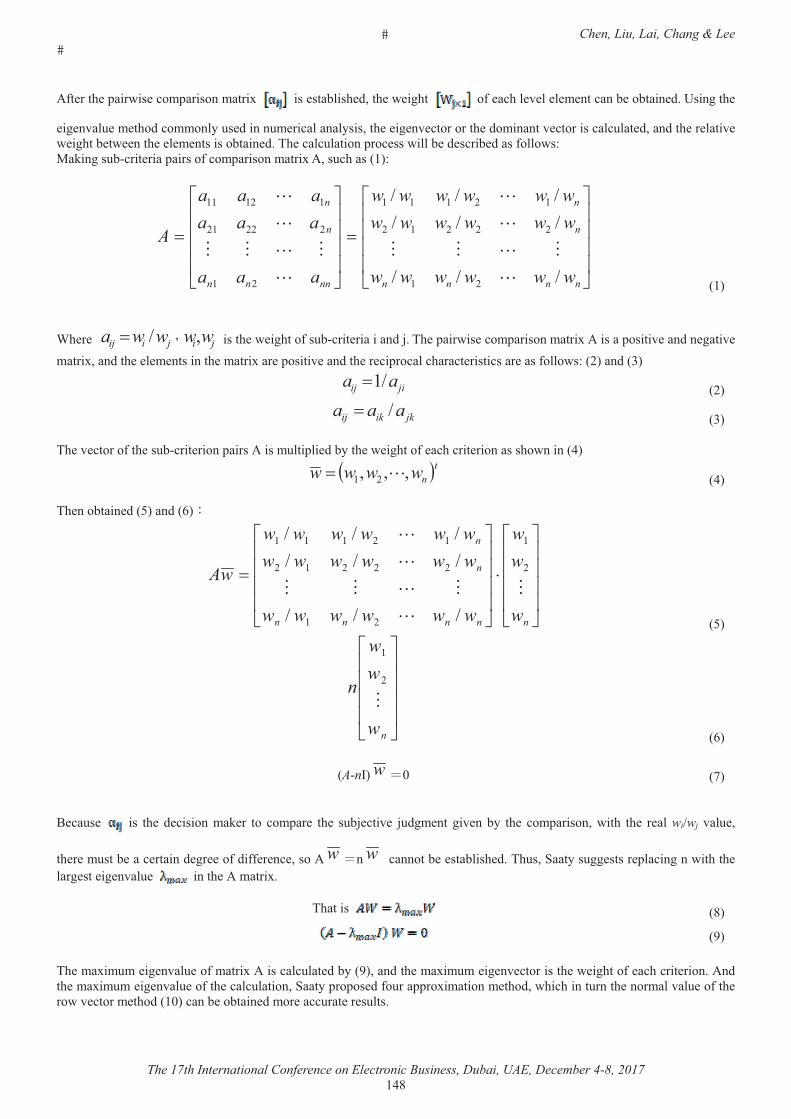
� Chen, Liu, Lai, Chang & Lee �
The 17th International Conference on Electronic Business, Dubai, UAE, December 4-8, 2017 �@[�
��!� ���% �'���"�� ����'������������`� � ��� �������% #���% �" ��%�� � �!� ��%�� ^ �� � � �������� ������� #�>������% �
�� �^��$ �� �%�#����������$� #�����$� �����������������% � �� �^ ���������% �#��������^ ������������$��� #����#��% �� ����^ �" ��%��� �" ���% � � � ������������� #�\% �����$�������'��� ���"����� �# ����� #����!����"�����������$������ ����'������!����'������������`�����$�%����������
����
�
�
����
�
�
�
����
�
�
����
�
�
�
nnnn
n
n
nnnn
n
n
wwwwww
wwwwwwwwwwww
aaa
aaaaaa
A
¡¡¡
¡¡¡¡¡¡
��
�����
�����
��
�����
�����
�
����
�
�
�
����
�
�
� ����
� � � � � � � �
�% � � jiij wwa ¡� ji ww� � ����% �" ��%���!��$������ ��������#�]�\% �'���"�� ����'������������`��������'�����^ ���#�� ����^ ������`����#��% � � � ��������% ������`��� �'�����^ ���#��% �� ��'�������%����� ���������� ����!����"���������#�����
jiij aa ¡�� ���
jkikij aaa ¡� ���� � � � � � � �
\% �^ ������!��% ��$������ �����'�����������$���'�� #�����% �" ��%���!� ��%����� ���������%�"������@��
� �tnwwww ��� �� �� �@�� � � � � � � �
\% �������� #�������#��~� �
����
�
�
����
�
�
�
����
�
�
����
�
�
�
nnnnn
n
n
w
ww
wwwwww
wwwwwwwwwwww
wA�
�
����
�
�
�
�
��
�����
�����
¡¡¡
¡¡¡¡¡¡
���
����
�
�
����
�
�
nw
ww
n�
�
�
�~�� � � � � � � �
�A�n&� w �� ���� � � � � � � �
�< ��$� � � ��� �% �# ������� ��� �� ��� ���'�� � �% � �$�] ���^ � ]$#�� ��� ��^ �� ��� �% � ���'�������� "��%� �% � � ��� wi¡wj� ^��$ ��
�% � ��$���� ���� ������# �� ��!�#�!! � �� ������ w � w � �������� � �������% #�\%$���_������$�� ����� '���������"��%��% ����� ��� �� �^��$ � � ����% ��������`�
\%������ � �[�
���
� � � � � � � � � �\% ���`��$�� �� �^��$ ��!������`����������$��� #�����������#��% ���`��$�� �� �^ ���������% �" ��%���!� ��%����� �������#��% ���`��$�� �� �^��$ ��!��% �����$��������_�����'��'�� #�!�$���''��`��������� �%�#��"%��%�����$����% ��������^��$ ��!��% ���"�^ ������ �%�#����������� ������� #���� ����$��� �� �$����
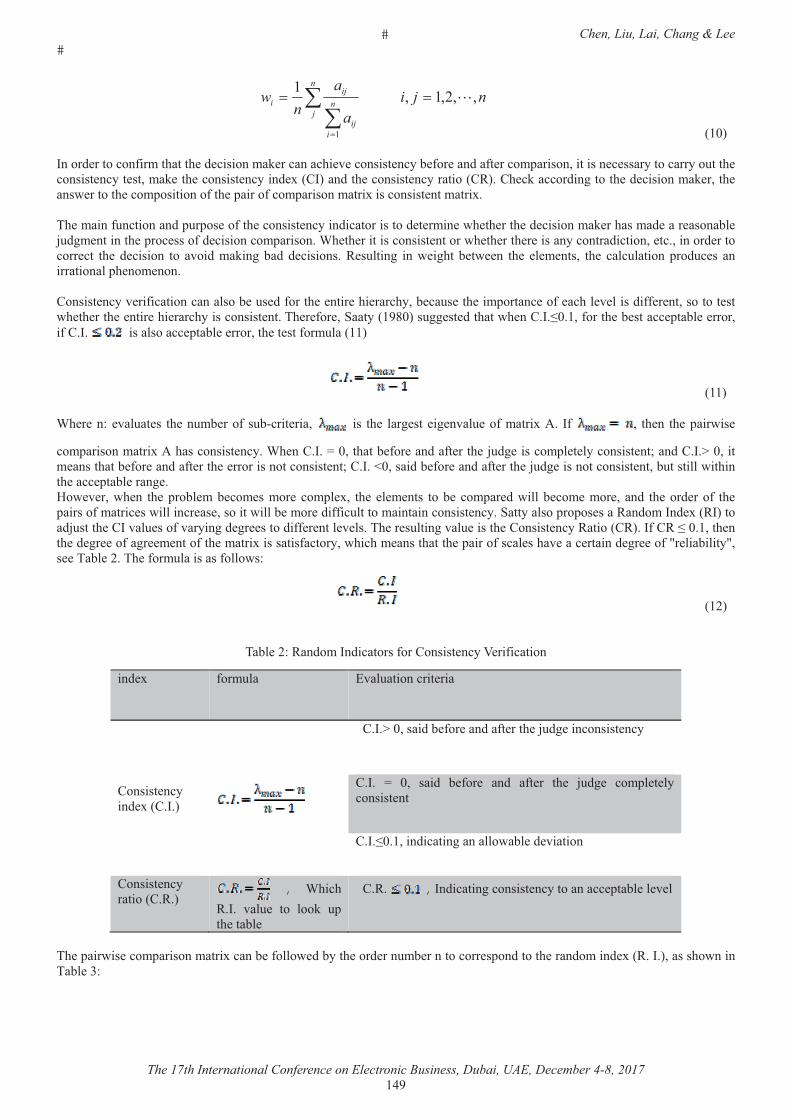
� Chen, Liu, Lai, Chang & Lee �
The 17th International Conference on Electronic Business, Dubai, UAE, December 4-8, 2017 �@��
��
��
�
n
jn
iij
iji nji
a
an
w �������
�
�
����� � � � � � � � �
&����# ��������!�����%����% �# ���������� ��������%� ^ �������� ����� !�� ���#��!� �����'��������������� � ����������������$���% �������� ����� ������� ��% �������� ������# `��*&����#��% �������� �����������*���*% ��������#��������% �# ���������� ����% ����" ������% ����'���������!��% �'�����!����'������������`����������� ��������`��\% ������!$���������#�'$�'�� ��!��% �������� ������#�������������# � ���� �"% �% ���% �# ���������� ��%�����# ���� ������� �]$#�� �������% �'��� ����!�# ����������'��������% �% ��������������� ������"% �% ���% � ��������������#�������� ���������# ��������� ��� �% �# ������� ��� �^��#����������#� # �������� � �$������ ���" ��%�� � �" �� �% � � � ����� �% � ����$�������'��#$� �� ��������������'% ��� �����*������ ����^ ��!������������������ �$� #�!����% � ���� �%� ����%���� ��$� ��% ���'������ ��!� ��%�� ^ �����#�!! � ����������� ���"% �% ���% � ���� �%� ����%������������ ���\% � !�� ��_��������[����$�� �� #��%���"% ��*&����!����% �� ������ '���� � �������!�*& � ����������� '���� � �������% �� ���!���$��������
����� � � � � � � � � �
�% � ���� ^��$�� �� �% ��$�� ���!� �$������ ����� � ��� �% � ���� ��� �� �^��$ ��!������`��� &!� �� �% �� �% �'���"�� �
���'������������`���%���������� �����% ��*&�º�����%���� !�� ���#��!� ���% �]$#� �������'� � ���������� ������#�*&Î�������� �����%���� !�� ���#��!� ���% � ������������������� ����*&�Â������#�� !�� ���#��!� ���% �]$#� ��������������� �����$��������"��%����% ���� '���� ����� ���" ^ ���"% �� �% �'���� ��� ��� ����� ����'� `�� �% � � � ���� ���� ����'�� #�"����� ��� ���� �� ��#� �% ���# ���!� �% �'������!������� ��"�������� �� ��������"����� ���� �#�!!��$���������������������� ����_����������'��'�� �������#���&�# `���&������#]$����% �*&�^��$ ���!�^�������# �� �����#�!! � ���� ^ ���\% �� �$������^��$ �����% �*������ �����������*���&!�*��Í������% ���% �# �� ��!���� � ����!��% ������`���������!��������"%��%�� �����%����% �'�����!����� ��%�^ ���� ������# �� ��!��� ������������� �\��� ���\% �!���$���������!����"���
�����
� � � � � � � � �\��� �������#���&�#��������!���*������ ����� ��!��������
��# `� !���$��� /^��$���������� ����
*������ ������# `��*&��
�
� *&�������#�� !�� ���#��!� ���% �]$#� ���������� ����
*&� º� ��� ���#� � !�� � ��#� �!� �� �% � ]$#� � ���'� � ���������� ���
*&������#���������������"��� �# ^�������
*������ �����������*���
�%��%��&� ^��$ � ��� ����� $'��% ����� �
� *� &�#��������������� ������������� '���� �� ^ �
�\% �'���"�� ����'������������`������ �!����" #�����% ���# ���$�� ����������� �'��#�����% ����#�����# `����&�������%�"�����\��� �������
� Chen, Liu, Lai, Chang & Lee �
The 17th International Conference on Electronic Business, Dubai, UAE, December 4-8, 2017 ����
\��� �������#���&�#�������\��� �
��# �� �� �� �� @� �� ~� �� [�
�&� ���� ���� ��[� ��� ���� ��@� ���� �@��
��# �� �� ��� ��� ��� ��� �@� ���
�&� �@�� �@�� ���� �@[� ��~� ���� ��[�
�\% �" ��%���!� ��%����� �������$���'�� #�����% �' �!������ ��!��% �'���������% �� �$������'��#$�������% ��^ �����' �!������ ��!��% �'����������#�!��������% ��^ �����' �!������ ��!��% �'���������������$������ ���% �'���������!��% �'���������%��������� ��������"� ��%��% ���'������ ��!��% � � � �������% �$������ �����������������!���# �������������������� ��� ����$�#�� ���������% ��������#��$������ ������ �����%�"�����\���@���#�\������
\��� �@��= !���������!�'���������#�� ���#�������� ����!����% ��$�������!�!��������� � ��������'��� ������� ��
��������� ���� # !�������� \% � ��$�� � �!� �% ���� ���$� �
_��� ���$������ /^��$������ �!� �% � ��!��������� ���� �� ��� �!�� "%��%�����$# �� �� � �!� �' �������� ��� � � �'��� �� �������$� �!$���������!� `���������!��% ����� ��� �� ��!�$� �� �� ��!���� ���� �� ��!� � ����������#��% �# �� ��!�$� �©��� #��_��� �� �%����� ��������� ���� ��� �� �������� ���� ��� ����������� ���� �� ��� ��������� ���� �� ���� ��� �������� �� !!��� ����� � ��$�� � $��� �� � �'��� � ��� � ��#����� ��� �'��� � � ��� �
�= ��� � �� ��� ����������
*���$����������$������
\% � ^��$������ �!� �% � �$�'$�� �!� �% � ����$������������� ��� ����$#���� �% � ���� ��� ���� ���'� � � ������� ��� ���� � � ^��� �� ���$�#����� ������������'� % ����������� $� !$�� ���� � ����������� $'����#�� ����] ���^������#���� ����������!��% ��$�'$��#����
�= ��� � �� ��� ����������
_ �^�� ��$������ _ �^�� � �$������� � %�^������ ��� ������ ��#� !���������' �!������ �&�� ���!�$�#��%����% ��$�������!�� �^�� �"����%�^ � �� '�����^ � ���� ������� "��%� �% � ��� ������ �!�� %�^�����% ���% �� �^�� ��$������������#���% �� %�^������� ����������% ������� ������#��% �� %�^������� ������"����%�^ ������'��������% ��$���� �©��� %�^�������#��% ���% ��$���� �� � %�^���� "���� %�^ � ��� ��'���� ��� �% ����'���©��!���������' �!������ �
�� ��%����� < ����� �������$����������~��
_�! ����$������ �% ��$������% �&�� �� ��*��$#�*��'$�����_ �^�� ���% �$� ������"�� ��%����!��% �� �"����� �$���������������%������"������$� ����������#^ �� ����� �$ �� ��
� �}������ �� ��'���������� � ����� � ��< �������� ����� ��� � ��� ������]�� �����!��������
��
�\��� ����= !���������!� $������*��� ����!�������������/� ������������ ���_��� ��
_$������ ���� = !�������� \% � ��$�� � �!� �% ���� ���$� �
/�� ��!�$� � ���������� ��� ��!���$� ������� ������� #� �< �������� * �! � ������� \���� ������ ��#�*% ������[��
� �'��� ��' #� >� ��� ������� � ���� � �$ ���� !�������� � �������������� ��#��% ���� ������$������� ��� ��� ���
����#� �� ��������&##���$�� �� <��� ����
� Chen, Liu, Lai, Chang & Lee �
The 17th International Conference on Electronic Business, Dubai, UAE, December 4-8, 2017 ����
���[�����#� *% ������[��
���$����� \% � ���� ��� ��� �!� �% � ��!��������� '��^�# #� ��� �% �&�� �� �� `�%��� �
�� ������ \�##�� ����`����������
&�� #��� � &��������� ���% ���!���������'� � �� #��$���� �$'����#�� � ���`��� �� \�##��������
&�� ������ ����� ��������������'��^�# ������% ���!�����������$�� #� �*��' ��� <��"��� ��}�� ������@��
� ���������� \% � " ���� � ��� ��� � ��� � ������� ��#� ���$��� ��� ��'� � ����% �������� #�� �^�� ���'������� ��
����������������&>����>��������
\�$��� >� ����� �"������������� '���% ���� ��������'��^�# #�����% ������ ����� ��'�' ��� �
������ ����� �� ���������@��
>� �������!�������
\% ��$���� ��� �$� ���% �'��#$������� �^�� ���#��������% ��'� � ���������!������!�������
����^ ����$�������������������
� �"����� �$�����
� ������� '��� ������ �!� ' �'� � ��� �% � &�� �� �� "% �� �% �'��� ������ � ��$� ��� ����$#���� ' ������� &�� �� �� '��^������#�� �$�������% �$� ��!� ������� �$����������� ��%���!�� �#����#�������
������� =�����%����$�%� ��� �� �� �� ����������$������@��
���� ��� �$����� &�!��������� ��� �% � '��� ���� �%�$�#� ��$� � �%��� �% � #����� �$���������� ��� �$�����!����% �$� ��!��% ���'����%���� ��� ���#��% �!$�����������#�' �!������ �� �$�� � ����
��'^���� � ����$����#��� �������������"�����~��
_�! ������# � ���
&�� �� ��������������� �$������ �$�� � �������*��!����������!��% ��# �������!��% �$� �©�� � ������������$�����=�����$���� � ����'� #� ��#� # ���'� #� *��!�# ������ #���� �� =������� ������ @� \% � ����� '$#������� �!� �% � ��������������!���������� �$�� � ����
���%�� ������ ��� ����������~��
�\% ��������# ���!��% �� �%�#������� #�����% �$� ��!�/$���# ���#������ ���� ^��$�� ��% ��# ������$�������#�� ����^ ��# ����_���*% ����� ��������\% �#������ �� �" ���% ����$��������#��% �� ����^ �'��`���������$� #�����% �������!��% �� � ��������% � �\% �#������ �'�����'� ����$� #���� `'� ����% �#������ �� �" ���% ���� �����^ ����#��% ��# ������$�����\% �� �$������%��%���#��% �� �$��� ��� ��� !! ���^ � "��� ��� ���^ � �% � '���� �� &�� �� ����� #� '�������� ^��$������� �������� ��� #� ��� # ������� ������$� �������_��������� ����������� ���"���#� '���� ���� ����� �!� �% � '��] ���� �� � $�$����� �$�������� ���� # ������� ������� ��*=���� ��#� �% � � '�������� �� ��$�$����� `��$��^ �������$��������^ ����#���������% ���$�������� ����# ��������������� �%�#����$� #����# ���"��%��% �� ���"���#����#�$��������� ��������� $���������\�����*%�$����� $��������&���% ���� ����� ���#��$�$����� `��$��^ ����#����������#������ �'������������ et al���% ����#������������� �����% �� ������$���������������$����%������� # ���������~��&���%������$��������% ��# ������$���������% ��'���������$������\��_&_�����'�����$������$� !$��!���# ������"��%��$�%�'���� �������$#�����_�'$��������~���\% �'�����^ � �# ������$����� ��&_����#�� ����^ � �# ������$����� ��&_���� �# !�� #� !����� ��� �% � ^��$������'��� ���\% �������� #��# ������$���������% � ^��$�������!��% �� � !�����!��% �'�������������$� ���!��% ����� ���^��$ ��!��% �������!��% �'��' �����!��% ���� ��� ����!��% ������ ���^��$ ������% ���% ��%��#���% �� ����^ ��# ������$���������% ������$��^��$ ��!��% ���� �����^ �����#��% ���������� ���������% ����� ���&���% ��%��� ��!��% �'���������% �#������ �!�����% ��# ������$������ � �������% �#������ �!�����% ��# ������$���������% �� ������$�����!����% �� ������$�����������% �'� ^��$����$#� ����%�"��%��� �% � �# ������$����������������'� ! � �� ���# ����� ��� ���� �%�#� �����$� !$��� �%�#� ������^ ��% �� ���� � �������!� �% �'��������_�*% ���������\������������������@��&���##������� �% �'� ! � �� ���# ����� ��� ���� �%�#�!�����$� ���% �� �� ������ �������$������������� ���� ��% ��'��������!������' �'� ���% ��������# ������� � `'���� #�������$� ���&�� �% �!��$� �� �"�� ^��$���������� ����*����#�*���� �$� #� ��� `'������_� ��� �% ����'� ��'�� ��!�����% � �������� �% �� ����^ ��# ������$��������#�������% ��# ������$������% ���% ������% � �������'�� #�"��%��% ������% � ���% �#������ �
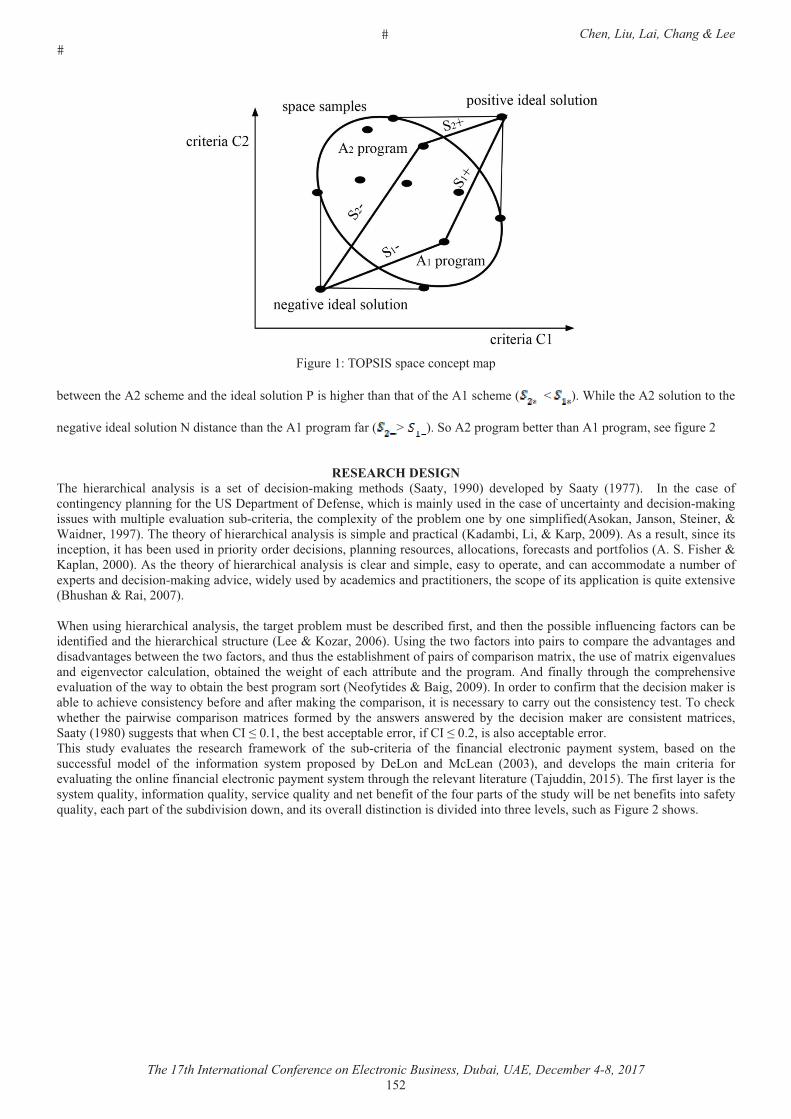
� Chen, Liu, Lai, Chang & Lee �
The 17th International Conference on Electronic Business, Dubai, UAE, December 4-8, 2017 ����
����$� ����\��_&_��'�� ����� '����'�
�� �" ���% ������% � ���#��% ��# ������$����������%��% ���%����%����!��% ������% � �� �  ���%�� ��% �������$���������% �
� ����^ ��# ������$�������#������ ��%����% ����'�������!���� ��_�����'�������� �� ���%������'��������� �!��$� ���
��$�$���%�!$��<��
\% � %� ����%����� ��������� ��� �� � �� �!� # �������������� � �%�#�� �_������ ������ # ^ ��' #� ��� _����� ������� � &�� �% � ��� � �!�������� ����'��������!����% �>_�= '���� ����!�= ! �� ��"%��%�����������$� #�����% ���� ��!�$�� ����������#�# �����������������$ ��"��%��$���'� � ^��$�������$������ ������% ����'� `�����!��% �'���� ���� ������ ����'��!� #���������}�������_� �� ��������#� ���������\% ��% �����!�%� ����%��������������������'� ���#�'������������#���������������'�������������� �$�������� �������� '���������%���� ��$� #����'����������# ��# ���������'��������� ��$�� ����������������!�� ��������#�'���!���������_����% ������'���������������% ��% �����!�%� ����%������������������� �����#����'� �� ��������' ��� ����#������������#�� ����$�� ���!� `' ������#�# ���������������#^�� ��"�# ���$� #�������# �������#�'��������� �����% ����' ��!������''�������������$�� � `� ���^ ��<%$�%������������������% ��$�����%� ����%����������������% ����� ��'���� ���$���� �# ����� #�!��������#��% ���% �'������ ���!�$ ������!������������ ��# ���!� #���#��% �%� ����%��������$��$� ��� �������������~��>������% ��"��!������������'�����������'�� ��% ��#^����� ����#�#���#^����� ��� �" ���% ��"��!����������#��%$���% � �������%� ����!�'������!����'������������`���% �$� ��!������`� �� �^��$ ����#� �� �^ ����� ����$�������������� #� �% �" ��%���!� ��%�������$� ���#� �% �'���������#� !������� �%��$�%� �% ����'� % ���^ � ^��$�������!��% �"��������������% �� ���'�������������� �!���# ����<�����������&����# ��������!�����%����% �# ���������� �������� ������%� ^ �������� ����� !�� ���#��!� ����������% ����'��������������� � ����������������$���% �������� ����� ���\���% ���"% �% �� �% � '���"�� � ���'������� ������ �� !��� #� ��� �% � ���" ��� ���" � #� ��� �% � # ������� ��� �� �� � ������� ��� ������ ���_��������[����$�� �����%���"% ��*&�������% �� ������ '���� � �������!�*&����������������� '���� � �����\%��� ��$#�� ^��$�� �� �% � � � ���%� !��� "���� �!� �% � �$������ ���� �!� �% � !��������� � �������� '��� ��� ���� ��� ��� #� ��� �% ��$�� ��!$�� ��# �� �!� �% � ��!��������� ���� �� '��'�� #� ��� = ���� ��#� ��� ��� �������� ��#� # ^ ��'�� �% � ����� ���� ���� !��� ^��$�������% ������ �!��������� � ��������'��� ������� ���%��$�%��% �� � ^������� ���$� ��\�]$##����������\% �!�������� ������% ����� ���$���������!����������$�������� �^�� ��$��������#�� ��� � !����!��% �!�$��'������!��% ���$#��"����� �� ��� � !�����������! ����$������� ��%�'�����!��% ��$�#�^������#�"�����#������^ �����#��������������#�^�# #�������%� �� ^ �����$�%�������$� ����%�"��
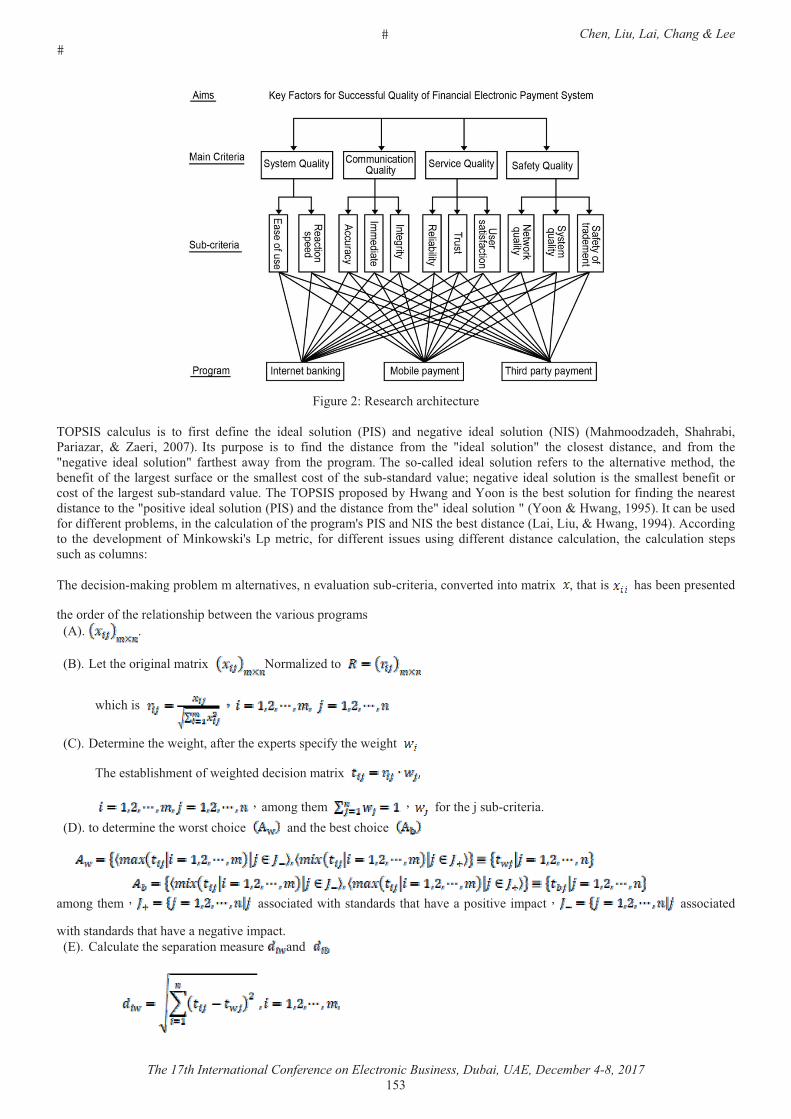
� Chen, Liu, Lai, Chang & Lee �
The 17th International Conference on Electronic Business, Dubai, UAE, December 4-8, 2017 ����
����$� ����� � ���%����%�� ��$� �
�\��_&_� ����$�$�� ��� ��� !����� # !�� � �% � �# ��� ���$����� ��&_�� ��#� � ����^ � �# ��� ���$����� ��&_�� ���%���#��# %�� _%�%���������������� �� �� ���� ������ &��� '$�'�� � ��� ��� !��#� �% � #������ � !���� �% � ��# ��� ���$������ �% � ���� ��� #������ �� ��#� !���� �% ��� ����^ � �# ��� ���$������ !���% ��� �"��� !���� �% � '�������\% � ������� #� �# ��� ���$����� � ! ��� ��� �% � ��� �����^ � � �%�#�� �% �� � !����!� �% ����� ����$�!�� ���� �% ������ ���������!� �% ��$������#��#�^��$ ��� ����^ ��# ������$���������% ������ ���� � !������������!��% ����� ����$������#��#�^��$ �\% �\��_&_�'��'�� #�����"������#����������% �� ������$�����!���!��#�����% �� �� ���#������ �����% ��'�����^ ��# ������$�������&_����#��% �#������ �!�����% ���# ������$����������������"�����������&������� �$� #�!���#�!! � ���'���� ��������% �����$��������!��% �'������©���&_���#��&_��% �� ���#������ ���������$�����"��������@�������#������� �% �# ^ ��'� ����!������"���©���'�� ������ !���#�!! � ��� ���$ ��$�����#�!! � ���#������ �����$�������� �% �����$��������� '���$�%�������$������\% �# ��������������'���� ������� �����^ ����� ^��$�������$������ ��������^ �� #�����������`� ���%����� � %���� ��'� � �� #�
�% ���# ���!��% �� �������%�'�� �" ���% �^����$��'�������� ����� �
�<��� ���% ���������������`� �������� #���� �
"%��%���� �
�*��= � ���� ��% �" ��%����!� ���% � `' �����' ��!���% �" ��%�� � �
\% � �������%� ����!�" ��%� #�# ������������`� �
�������% �� � !����% �]��$������ �����=�����# � ���� ��% �"������%��� � � ��#��% �� ����%��� � �
�
��������% � � �������� #�"��%�����#��#���%���%�^ ���'�����^ ���'��� � �������� #�
"��%�����#��#���%���%�^ ���� ����^ ���'�����/��*���$��� ��% �� '��������� ��$� ��#� �
�
� Chen, Liu, Lai, Chang & Lee �
The 17th International Conference on Electronic Business, Dubai, UAE, December 4-8, 2017 ��@�
����� *���$��� ��% �� ����^ �'��`�������!��% �� ����%��� � �
���������#������ � ������% ���# ���!���� ���%��� ��% �� ������$�����
&���%�����$#���" �!��$�������%������"%���� � ���� #���� � ��������'��� ���� ��� #�� � ���%���#���#$�������%�� �"%��!� �$ �����$� �!��������� � ��������'��� ���� �'��# �����%�" #����������$�� ���!���� �'��� ��� `' ����\% ��$ ��������� �"������$ #����������!������ ������������$ ��������� ��\��� �~��%�"���% �# �����'%����!��% �� �'��# ����
\��� �~��= �����'%�����!��% �� �'��# ����
*%����� �������� �� �$ ���� � �� �������� �# �� � �� � ��� � ��� [~~��� � � ��� � �� ��@���� � � ������� ~� @���������� �� �����κ@�� ~� @����/#$�������� ^ �� � �*��� � � �� ��������#$�� � ��� ~~������$'������ � �<$��� ��� �� �����&�!��������� �� ��������$!���$����� � �� ~~~��_ �^�� � �� ~~~��_ �!� �'��� #� �� �����_�$# ��� �� �������% ��� �� ~~~�����! ����������� �� � � �� �� ��� [~~����� �� ��@����������� ���� � �� ����%���!�^ �� ���� �� �����
��� � �%��� !�^ � � ����� � ��� �%���� ��� ����
�� �����
��� ��%�����# ��# � [� ~����
�!�������&)����
<�� #�����% �%� ����%��������$��$� ������������#��$ ��������� �#������% � ^��$���������$��$� ��!��% �!��������� � ��������'��� ������� ���$���������������$�� #�\% �" ��%���!��% ��������#��$������ �������# ^ ��' #����#��% �'� ! � �� ���# ���!��% ��$������ ������� ^��$�� #����\��_&_�\% ���% �� ���$�� ���!��������!� � ��������'��� ����$�������� �#���$�� #�\% ������������ '���� ����� #�� ��"��%�������� �� �������'������������������' �!������������� �����% ���>������% �*%��� ���� ����!�"�� �!����' ������������������% �*������ �����������*����$���� �� ����%���������� ���% ���������������� ����� �$�� � ����\%��$�%��% �������� ����� �����% �" ��%��^��$ ������� #����������� �����!$��\% �*��^��$ ���!��% ��^ ������ ^ ��'� � �� #����\��� �~��� �� ����%���������#���������%����% ��^ �����%� ����%������������ ������#��%����% �" ��%���!� ��%����� ������������$��� #���#� ^��$�� #������!������������'�� #������� `' ������#����������� ��$� ����� ��^������ �\��� ����%�"���% �������� ����������!��� ��%�� ^ ��
\��� ����*��^��$ ��!��� ��%�� ^ ��
� ^ �� �^ ��� �^��$ �
*�� ^��$ ��������`��
_��� �� �$������� ����$��������� �$������� � �^�� � �$���������! ����$������ �������� ���@�¸��~[�
/�� ��!�$� ��� �'��� ��' #���$������ ����� ����@�[� �����¸��~�@����$��������� #���������'� � � ��� ������[� �����¸��~���� �������������$����$� �������!���������$������ ����� ������[� �����¸����[�
� Chen, Liu, Lai, Chang & Lee �
The 17th International Conference on Electronic Business, Dubai, UAE, December 4-8, 2017 ����
\��� ����*��^��$ ��!��� ��%�� ^ ��� �"���� � �$������ ���� �� � �$������ ������������ � �$�������$������ ����� �������� �����¸����[�
�*�����$ ����'��� ����% ��$ ��������� �#����!������� `' ������#������� ��$� ������#��% ��^ ������ ^ ����#��% �!�������� ����% �� ���#���� ���!��% ��������$������ ����&���##��������% ��^ ������ ^ ���!�^� "���% �!�������� ��� ������� ����!����% ������� ��� ����$������ �����"%��%�" � �������$�] ������ `' �����#���� �������" � �����% ���# ���!���������������! ��������������� %��!��!��% �#��������% ����� ��"��%����% �'��� �����%�$�#� ��$� ��% ���! ����!���!���������/�� ��!�$� ���������� �������% ����^ �� �� ��!��% �$� ��!���!��������� � ��������'��� ������� ���� �'��� ��' #���������� ! �������% ���% ����# ��!��% �� �'��� ��' #�_��� �� � �$����� ���[���� � ! ��� ��� �% � '��^���� �!� �% � � �"���� � �$������ �% � $� � �!� ������ � �$������ � �"���� ����$���������$��������� � �$�����\�$��� �������� "%��%� ��� ��� #� ��� �% � $� �©�� '�����^ � `' ���������� ��� "������� ��� ��� '�� �% � ����� ����� ��'�' ��� �'��^�# #�����% ������ ���� ���������\% ����^ ����� ����� �� ��!�$� ���#�� �'��� ��' #��� ��% ����� ����!����% � ^��$�������!��% ��$�������!��% ���������� ����_��� ��� �$�������#�� �"����� �$������ ���������% ���! ����$�������!��% ���� ��� ������� ����\�$�������% ��$�������!�� �^�� �&������� �� ���%����% �%��% ���% �� ����^ ���'������ ��!��% ��$������ ������% �%��% ���% ���'������ ��!��% ���������� ����&���##��������% ���'������ ��!��% ���� ^��$�������$������ ������% ��$�������!��% ����� ����#��% ��$�������!��% ���������!��% ��$������ ����%�^ ���%��%�'��'�����������$� �����#� `' ����� �� ^ ��%����% ��$�������!�� �$�������#����� ���$����������% ���'�����!� � ��������!���������'��� ������� ���$������� ��!�������\��� �[��%�"���% ��^ ������ ^ ����� ��� ����!��% ��������#��$������ ����" ��%��^��$ ����#����������
\��� �[���^ ������ ^ ����� ��� ����!��% ��������#��$������ ����" ��%��^��$ ����#�������������� ��������� ���� _$������ ���� _$������ ����
" ��%��*��'� `�" ��%��
_�������
� �� ���������!� $�������!� ����������/� ������������ ���_��� ��
_��� �� �$��������@@����
/�� ��!�$� � @�[��� ����� ��� �'��� ��' # ������ ����� ��
&�!��������� �$����������[���
���$����� ��@��� @[��� ��&�� #��� � ������ @���� [�&�� ������ ��~��� @���� ��
_ �^�� � �$��������������
� ���������� �[�~�� ����� ���\�$��� �[���� ��[�� ��>� �������!������ �[���� �~[�� ���
_�! ��� �$����������~���
� �"����� �$�����
������ ����� ~�
���� ��� �$����� ��~��� ��[�� @�_�! ��� �!����# � ���
������ ������ ��
������ �% � �������%� ��� �!� �% � !�$�� ����� ���� ����� ��� �$������ �����!� �% � !��������� � ��������'��� ��� ���� �� '�������� !�������'���������������% � �������%� ����!� �% �!�$����������� ���������$������ �����!� �% �!��������� � ��������'��� ������� ��'��������!�������'��������������'�������!����% �� � �������!� � ��������'��� ������� ��<���% �^����$��!���������^ ������% �'��������^��$ ��!��% ��%� �'��������'������!�^� "���% �" ��%���!� ��%�'������������% ���� � � � � �������#��������% ����'� % ���^ �^��$ ��!� ��%����� ������������!�$�#��%����% �!��������� � ��������'��� ������� ����% � �����% ��%��#�'�����'��� �����% ��%��#�����% �&�� �� ���������% ��������'��� ����������%����� ���!�^�� #�����% �$� �����#� `' ����\��� ���_%�"���% ���'�����!�!��������� � ��������'��� ����!�� ��!�����������% �� � �������!��% ��^ �����'������� ����#����'� `�" ��%��^��$ �
\��� ����� ��%���!��% �!��������� � ��������'��� ������� ��
_$������ ���� *��'� `�" ��%�� &�� �� ���������� ����� �'��� ��� \%��#� '�����'��� ���
/�� ��!�$� � ���[� ��� [�� ���� �'��� ��' #� ����� ��� ��� [�����$����� ��@[� [[� [�� ���&�� #��� � ��@�� ��� [�� ���&�� ������ ��@�� ��� ��� ���� ���������� ����� ��� [�� ���\�$��� ����� ��� [[� ���>� �������!������� ����� [�� [�� ���� �"����� �$����� ����� ��� ��� �@�
� Chen, Liu, Lai, Chang & Lee �
The 17th International Conference on Electronic Business, Dubai, UAE, December 4-8, 2017 ��~�
\��� ����� ��%���!��% �!��������� � ��������'��� ������� ��
���� ��� �$����� ����� ��� [�� ���_�! ����!����# � ��� ����� [�� [[� ����^ ��� � � �@��~� ��~��� ��@~�*��' ����^ � ��� � �� �� ��
�\��_&_�� �%�#����$� ��% �!��������������!��% ��#^����� ����% ������� ���������%����%���� �%�#�����$����� �!����% ��% � ��!��%�����$#������'������ ��������#�!!��$�����#� �������$�# �����#�\��_&_�� �$�� ���"��������'� � �$���� ����% �" ��%���!��% �������$� �������"����% ������������������� �����������������������# �� ������'��' ����������������%�����������}$���!����% ��' ��������!�!��������� � �������� '��� ��� ���� �� �$������ �!� �% � � �� !������� %�^ � �% � �%����� �������� \%$��� �% � # ������� �����`� �!� �����������������!��% �^ �������������� #�^����% �'� � #������ '�������%�"�����\��� ����
\��� �����= ������������`�!������������� ����� ���_��� ���$�# ��� ��
�������� ¡� ��������� ����
_��� ���$������ *���$����������$����� _ �^�� ��$����� _�! ����$������
&�� �� ���������� ��@@�� ������ ������ ��@���
����� �'��� ��� ��~@�� ���[�� ������� ��@���
\%��#� '�����'��� ���
���[�� ���[~� ���[�� ������
" ��%��� ���[�� ��@@�� ������ ��~@��
�% ��# ��� ��~��� ������ ������ ��[@���% �"����� ��@[�� ������ ��~��� ������
��������% �� `���� '�����% �\��_&_�� �%�#�������# � ���� ��% �'�����^ ��# ������$�������&_����#��% �� ����^ ��# ������$�������&_����#�����$��� ��% �#������ �� �" ���% ����$�������#��% ��# ������$�������#��% �� ����^ ��# ������$����������%����% ���% � ����� �� � �� #� ��� �% � ���� ��� ��� �% � �# ��� ���$������ ��#� �% � #������ � !���� �% � � ����^ � �# ��� ���$����� !���% ��� \% � !�� �� �% � �# ������$�������#��% �� ����^ ��# ������$������� �����$��� #�!��� ��%����� ����������%�"�����\��� ������#�\��� ����
�\��� �����&# ������$�����!����% ��$�������!�!��������� � ��������'��� ������� ���
������_��$����� � ����^ ��# ������$������&_�
��������¡���������� ���� _��� ���$������ *���$����������$������ _ �^�� ��$������ _�! ����$������
&�� �� ���������� ������ ���~�� ����[� ��[[��
����� �'��� ��� ������ ���~[� ��[��� ���[~�
\%��#�'�����'��� ��� ������ ������ ������ ������
���#� �% ��� �� �% ���#������ �"��%� �% � �# ��� ���$���� ������#� �% �#������ ��!� �% � �# ������$���� �_���*���$��� � �% � � '��������� ��$� �!��� ��%���% � �!�����% ��# ������$���� #�¹ ��#��% �� '��������� ��$� ��!��% �� ����^ ��# ������$���� #�� ���#���������% �� ����^ �# �� ��!����� � ����*����!� ��%���% � �����% ��# ������$�������������� ����� #������#��������% ���� ��!��%���^��$ ����#��% �!��������� � ��������'��� ������� ����% � �������� �����% ��# ������$����������%�"�����\��� ����� � �
\��� ������ ����^ �'��`�������!�!��������� �'��� ����# ������$������
�������� #�¹� #��� *������`������� � �$����������&�� �� ���������� ����[� ��[��� ������ ��
\��� �����&# ������$�����!����% ��$�������!�!��������� �'��� ������� ���
&# ��_��$����� &# ������$����� � �&_�
��������¡���������� ���� _��� ���$������
*���$����������$������ _ �^�� ��$������ _�! ����$������
&�� �� ���������� ���[�� ����@� ��~��� ��[~[�
����� �'��� ��� ����@� ���@�� ��@��� ����[�
\%��#�'�����'��� ��� ��~[~� ���@�� ��[��� ������

� Chen, Liu, Lai, Chang & Lee �
The 17th International Conference on Electronic Business, Dubai, UAE, December 4-8, 2017 ����
����� �'��� ��� ����~� ����@� ���~�� ��\%��#�'�����'��� ��� ���[�� ������ ������ ��
�*������#�� � �% � � �$���� �!� �% � ^��$������ �!� �% � ���� ����� �% � �#^����� �� �!� �% � �%� � '�������� ����� �% � � �$����� !����" #� ����%��#�'�����'��� ����&�� �� ���������������� �'��� ������ �����%����� ���!����% �!���������$� �����#�� ��� `' ����!�^���������% �� ����^ ����$�����"��%��% ��# ������$������%�������$��� �����������!��% �� ��!��������%����!! ����% ��$�� ����!� � ��������'��� �����
����&"����� �\% � ���� �!� �%��� '�' �� ��� ��� # ^ ��'� �� %� ����%�� !��� "���� ��� ��� ������ �% � � �� �$�� ��� !������� �!� �% � �$������ �!� !��������� � ��������'��� ������� ���*��'�� ��% �� ����^ �" ��%��^��$ ��"��%��������\��_&_���������� �����$�# �����#��% ���'�����!��% � ���� ���� ��� �% � �$������ �!� � �������� '��� ����\%��$�%� �%��� #$��� ��� ��� ��� ��# ��� ��� ���� ��� � �%���$�%��� ��� ��� �% ���'�����!��% ��$�# ��� �����#�!$��% ��'��^�# ������#$������� �� �����% �$� ��!� � ��������'��� ������� ������������������'�������� ! � �� ���#��$�������^ �� ���� �#�����������% �!��������� � ��������'��� ���'��^�# ��� ��&���##��������% �$� �����#� `' ������� ��%����% ���! ����$�������%�$�#�� ������# � #�����% �!����������# �������!����% ��$�������!��% � !��������� � ��������'��� ��� ���� ��� ��#� ����" ��%��^��$ � ����~�������$���� !��� ��^ ���%��%�'��'�������\% � !�� �� �% �� �$������$�������!��% �$�# �������� ^ ���!��% ��"������ ��������$# #�����% ��^ ������ ^ ���!��������������$������!����% ���'���`����� ����������������� �$�������#�� �"����� �$�������$��% ���� �� �% ����� ���$�������!� �% �$�# ������� � ^ �� ����$# #� ��� �% � �� ��!�$� ���#�� �'��� ��' #�� �% ��^ ����� � ^ ���!�������������% ���'��%� ���#�����% ��$�������!���!�����������#�� �^�� ��$�������"%��%�����������% �$�# ����������� ����������� #���"��#�� �% � � �%������ ��' ���� �!� �% � ���� �� ��#� � �^�� � � ^ �� \% � � �$���� �%�"� �%��� �% � " ��%�� ^��$ �� �!� �% � �"�� ��#� ����$�# ����������� ������ �� ����^ �����"���$���% ���� �������� � ��������� ^��$�� ��% ��$������ ����\%���'% ��� ����� '� � �����% �$� �©�� � ��������'��� ���� %�^����!��������'������ ���������� �$��������#��% �������# ���% � �� ��!�'��� ����' �����������" ^ ����% �� �$�����!��% ���$#��!�$�#��%��� ��%� ^��$�������$������ ����%�^ �������'������ ���$��$� �����#� `' ����� �� ^ ��%����% �!����������$�������!� � ��������'��� �����#����� ���$�������%�$�#�� � �'%���� #���#���� ���������#��% ���������������� ������#� ��������' ��� �>� ����� �����������!��% �$� ��!��% ����� ����#��� ������!� #������������� ^� "� �% � !��������� � ��������'��� ��� ���� ���$������ ��� ��� ��� � �$����� !��� �% � !$�$� �# ^ ��'� ����!� � �������� ���#���� �^����� ���� �% � � � ���% ��� ��# � �� �$�� �� �!� � ���#�� ��#� � ���� �#������� \% � !����� $� �� � ^ ��� �� ���'� % ���^ ���� ��� ����!��% �� �$�����!��% ��$�# ��� ����% ���]�������!�$� ���!����% �������������� �$������ �� ��!�$� ���#�� �'��� ��' #�� �$�� � ��������� �#$ ����"���������������� �$�� � ������% �� �$�� #�� ^ ���!��$������#�!! � ������\% � %� ����%����� ���$��$� � ��#� ��� ��� ��� �!� �% � ���� ����� �% � �������%� ��� �!� �% � ��� ��� ��� ��# ��� ���� ����� ��� '��^�# � ��� � ���� � ��������'��� ������� ����#��% ������!$���������� ! � �� ����#�!��������� � ��������'��� ������� ���$''�� ���"����� �#�!! � ���"��%��% �� #���!�$� ���� �% �� � ^������� ��� ������� �������������� �!��� �% �� ! � �� �� �% � ^��$������� �$����!����% ����� ��'��^�# ������'��^�# ��$�������^ ��#^�� ��\% �# ^ ��'� ����!�!��������� � ��������'��� ������� ��"����� ���� ���#���� �^�����$�� &!� �% ��' ��!����� ����!� � ��������'��� ������ ��� ����%�$�#�� ���� #�����% ���] ���^ ���!��% �!� �#���% �'��] �����#��% ����' ��!���# ���� #������# ���������% ���� ��� �����# ��"����� ���� ������� �"��%��' ��!���� #��� � ���% �������� ! ������% � ^��$��������# ���!��%�����$#�������% ��� �%��#������'��^ ��% �# �� ��!�#�������������������% ���% ��%��#�������$��� ������ ����% ���$ ��%����� ���������!��% �!� �#�!������ �^��$��� � � � ���%��$�$� ���$#�������%��� ��$�^ ����' �!����������� �����������������$#��������� `��'� ����� �� �� �����'�� ��#������������� ��
�$*$�$��$��£�¤� ����_��������������� ��������������/`� ��������!�\��_&_�!����$������] ���^ ����� ����� ������� ���'�����������
'���� ���Applied Mathematics and Computation���~�������@����~� �£�¤� �# ���� ���������������� �'���������^ �����������!��% �� ^ ���!�$� ��©���� '���� ��!� ��������������� ����Journal of
Internet Banking and Commerce,������������� �£�¤� �������%�%�� _�� �$�#$��� ��� �� _��� ��� �� ������� _�! ��� ����� ��� ��� ��� $����� ��������� %� ����%�� '��� ��� ������
#$�����'����������#��$#� ������!�������$������'��] ����Journal of Safety Research,�46��������� �£@¤� �'^���� ���������$����#������������_ �$� ���!�"�� �# ^ ��'� ������ `��'� �IEEE Security & Privacy,���@��������� �£�¤� �������� ��� }������� �� ��� _� �� ��� ��� �� ���#� ��� �� ������� \% � ���� � �!� �% � ���� ��� � �������� '��� ��� ���� ���
Computer,���������[���� �£~¤� �������������������������=���������=��\������_������\������_�������~��\�$�����#�]$���� � ��� �% ��#�'������!���
" �!�� � �'��� ������� ��Transforming Government: People, Process and Policy,������������@��� �£�¤� < �������� &�� * �! � ����� ��� �� \���� *��� ������� >�# �����#���� �% � ��� � # ���� ��#� ���� �$ �� �� �!� ���^ ��� ���
� �^�� ��$���������� �'���������^ ����������&��Proceedings of the Twenty Eighth International Conference on Information Systems����' ������&*&_������� ���� $ � ���*���#���= � �� ������� �
� Chen, Liu, Lai, Chang & Lee �
The 17th International Conference on Electronic Business, Dubai, UAE, December 4-8, 2017 ��[�
£[¤� <%$�%�����������������������Strategic Decision Making: Applying the Analytic Hierarchy Process.�_'���� ��_�� �� ���<$��� ���� #���
£�¤� <�� ��������* ������������ �������������� ����������������������''�������% ������������������������ �^�� �������� ���$#��&��International Conference on Data Management Technologies and Applications �''���@��~���&�&_� }$��������� �
£��¤�*%�$#%����� ��� �� >'� ���� &� ����~�� � ��������� �!� � � ���� � �^�� � �$������ !������� "��%� ��������� %� ����%�� '��� ��� ��#�!$���� `� ��� ���������� �� ��� � �!� '$����� � ����� $���� International Journal of Business and Systems Research�� �����@����~���[�� �
£��¤�*% ��� ��#� ����[�� �� ��# �� �!� ����$� �� ��� '���� � �!� ����� � '��� ��� International Journal of Mobile Communications,�~����������� �
£��¤�*% ���_������� ��������������$�����$���'� �������$� �����$'�# ����������������� #�����% ���� �^�����' ���\��_&_�� �%�#�Expert Systems with Applications,����@�����������[� �
£��¤�*% ���_�����������\�����<�����������$'��$�����" ���� � ^��$��������� #�����������������!�\��_&_�� ����'��" ��%����#������Journal of Convergence Information Technology,��������������� �
£�@¤�*��' ��� �� ��� <��"��� �� *�� �� }�� ��� *� =� ����@�� � �%�#�� ��#� ���� ��� !��� �����! ������ !$�#�� >_� ��� ��� ���~���~���@����%��������=*��>_���� �����#�\��# ������!!�� � �
£��¤�=�%�� ����\���$���}������#�$���}�������������������� ^� "��!������ �'��� ���� � ���%�Electronic Commerce Research and Applications,��@������~���[@� �
£�~¤�=�%�� ����\���������������#�$���}�������] "�����������[��������'� � �����#�!$�$� ��!������ �'��� ����� � ���%������� ���$� �� ^� "�Electronic Commerce Research and Applications���������~���[�� �
£��¤�= � ������� �� _�� ��� ��# �� ��� <������ ��� � ���� ��� �� ���� � ��� �� ������� *%��� �� �� ��� ��� �������� �% � ���� '�� �!� ������ �� � �^�� �� ��#� ^��$ �� ��� ���#���' � '��������� ����� � ��� ��#� # ������� ������� Ecological complexity,� �������~������ �
£�[¤�= ��� ������������ ����/��� �������\% �= ��� ���#���� �����# ���!� ��!������������� ��� �$�� ������ � ��� ���$'#�� �Journal of Management Information Systems,����@�������� �
£��¤���������� $� �%���&��_$��������*�� ��������� ���/�����������������@��\�$���������!����������#������ �� '$��%�� ���� �������\% ���# ���������� ��!�' �� �^ #� !! ���^ � ����!� ����� �� �������$�������� �%�������MIS Quarterly, �[�����@���@��� �
£��¤����% �����_������'�����_�}��������� �%�#�!����$''�������$������������$��$'#�� ��$����� � �������������>_���� ������~��@���~@����%��������=*��>_���� �����#�\��# ������!!�� �
£��¤����% ������������*��#$�������������� �'��� ���������������$����������*� ���� #������ �����$���������# ^�� �>_���� ������[������������%��������=*��>_���� �����#�\��# ������!!�� �
£��¤�������% ��_������_%���<� �������*���$� ��'������� ���#������' �� '������ ��� &�� �� �� �%�''����Journal of Business Research,��~������[~��[��� �
£��¤�������=��������%������������������'������� �%������!����'����� #�� ���%��$�����������% �" ����#����'�������"��%���% ��� �%�������IEEE Transactions on Automation Science and Engineering��~�@���~@��~��� �
£�@¤����������������� !� �#��������������_��������\% � !! �����!�&\���'������� ����#�# ��^ �����# ��������$#����'$������$�� ��� ��#� !���� ' �!������ � !��� ���$#� �$''��� #� '��� �� �� ��#� �' �������� International Journal of Information Management�����@����������� �
£��¤���������������@��\% �����������!���'������!�� �^�� ��$����������$���� �������!���������#��$���� �����������\% ���� ��!�����`����� �����=��������#��� ���������&�� ����������>��^ �������*�*���� ������
£�~¤�� ��%��_�����@��_��� ����#�� �%�#�!���$�����������������������!�����������=���#��=���''������������� #������#�$� ��� %�^������#���!���������!���������$� ��! #������������� #�������������'���!����!���'��^�#�������������� ��$� � ����#�����!������ �����$� ��! #�����!��������������#�'��#$�������� �^�� ���!�'�����'� � ������!$�$� ��$���� ����$� ������#¡������� ������ ���>_���� ������[������������%��������=*��>_���� �����#�\��# ������!!�� �
£��¤�� ��� ����������������� ������#���������"��%������ �' �������# ^�� ��Communications of the ACM,�@~���������[� �£�[¤�� � ��� }����������]��*�������!��\� }� �������_��� �� $����� ��# ' �# ��� ������$� � ������ ��� �%�"� ����$���!� �%�� #� �����
��] ���������� �' ���^ �$� ��������� ���� ����£��¤������� &� <�� �� *%����� _� ������� \% � � #������� ��� ��!�����$� �� ��$��� ��� ��� ����� �� ��%���� ���'� #�������'$��%�� �
��� ������International Journal of Information Management, ���~����������� �£��¤��$�������=���������������������@��<$�����������^ ��" ��� �^�� ���� #��%��#�'�����'��� ������� ��!��� ����� �� �
Electronic Commerce Research���@�@���~���~��� �£��¤��$�� ���}����<��#� ���}������&}� ��������}�����@�����$'�# ��������������"��%��% ����������%� ����%��'��� ������
� � !����������� ��� �������$�������The Patient-Patient-Centered Outcomes Research, �����������@�� �£��¤�&�^�����}����������� �'�������� ����!��% �= ��� ���� �����# ���!���!������������� ���$�� ���ACM Sigmis Database,
�~�����[���� �£��¤�}�������}������'�������<��������The components of perceived risk.���' ��'� � �� #�����% �_������ #������!��% ��%��#�
���$������! � �� ��!��% �������������!�������$� ��� � ���%�£�@¤�}������ ��� ������ ��� �� }$��� �� ������� � ��$����� ����$� �� ' �� '������ �!� ����� � �%�''���� ���^ �� �� � Journal of
Service Management,��@�����������@� �£��¤���#������ �� _�� ���� }�� �� ���'�� �� �� ������� � ���!� �#� ����$������������ #� � �$� � ����� � '��� ��� � �^�� �
Proceedings of the 11th international Conference on Electronic Commerce��\��' ���\��"�����$�$��������������@������£�~¤���%���*��������Ë�� ��� �������}�������~��&# �������% !����#�����$� ��'��� ����%��� ��=� ��� �$������ ��������� �¨�
Journal of Financial Services Research����������������� �
� Chen, Liu, Lai, Chang & Lee �
The 17th International Conference on Electronic Business, Dubai, UAE, December 4-8, 2017 ����
£��¤������� ��� =�����%�� ��� ��$�%� ��� ��� �� �� �� ��� _� ������� my data just goes everywhere:” user mental models of the internet and implications for privacy and security.� ��' �� '� � �� #� ��� �% �_��'���$�� ���>���� � ���^���� ��#� _ �$������_�>�_��
£�[¤������*��\�������_%����������������_����������� �'���������$#���!��$���� ����' �� '�������!�� �$�������#���$������ �'��� ������� ���Electronic Commerce Research and Applications�������[@���� �
£��¤�������=� <������$�� ������� = ���������� ����@�� _������ � #��� � ��$��� ��� ��#������ �#���� ���� ���������� ���� �����$�# ���#�� ���'������ ��!������ ��������"�'� ^�� �� ���#�%��#����� ��%�'�'$��������Canadian Psychology/Psychologie canadienne,����@����@�� �
£@�¤���$��� �̂�_�������������_�%$%��_����_��^�����}�����~��/`'���������#�'�������#�$� ��!�'��� ��������$� �������>_�����$� ���The RAND Journal of Economics��@�������������� �
£@�¤������ ��}�� ��$�� \���� �� �"����� *��� ����@�� \�'���� !��� ��=�� European journal of operational research, �~�����@[~����� �
£@�¤�� ����������������������~��&�^ �����������% � !! ����!�" ���� ��$��������� ��$��� ����$�� ����������������%� ����%��'��� ����������''����%�Decision Support Systems��@��������[���@��� �
£@�¤�� ����������������������%����_���������$�#�����% �� �#��\% �/!! ����!�� ! � �� ����$'�����*��"#!$�#����= ��������������Proceedings of the 50th Hawaii International Conference on System Sciences,�<���&����#����"�����>_���}��$����@���
£@@¤�� �� ����������#�������}�����~��_�! �������#��#�����'� � ������!����'� ^ ��������� �^ ���������#��$�����������" ��!������� �����'����������% ��$��$� ��!���! �����������'��� ���� %������������$����Rehabilitation Nursing��@�������~���� �
£@�¤���������*��������������_Ê��% ��� ��Ê�# ���}�����$Ë���� �^���������@����� � # �����!��% ��#�'������!��% �� "������ �'��� ������� ����\% ���# ������� !! ����!��� �Computers in Human Behavior,������@~@�@�[� �
£@~¤�������������$����%���������� # ������=�������~��_ �$��������$ ���������� �'��� ���!�����% ��$���� ��^� "'����� �£@�¤���$��*������$��}������������������������# ��!� �� �'��� ��"��%�<�*� ����� �� �Logistics Technology,�1���~����£@[¤����%������*��_'����� ���}��= �<�$�� ��������� �� � ��������@������/\�//���#������\% �# ������!��' ���������
��� ��� �� ����$������� ���� ����������_�� ���% ���������/\�//�"��%� �# ����!�����European Journal of Operational Research,����������������� �
£@�¤���%���#��# %��_��_%�%������ }������������������� ������ ����������] ���� � ���������$�����!$����������#�\��_&_�� �%���$ �International Journal of Human and Social Science��������������@�� �
£��¤�������% �������}�������_�����%�� �������<$�����������@������������!�� �$� � � ����������������������_/\������ ��!��� � ���������������������International Journal of Research in Advent Technology�������������� �
£��¤���������� *�� ���^ ����� \�� �� ��'�^�È�� �� ����@�� >�# �����#���� �% � &�� �� �� �������� �#�'������ �� $��!� #� �% ���� �!���� '���� � ��#� $� � �!� � �%������� ��#� ' �� �^ #� ����� �''��������� International Journal of Information Management���@���������� �
£��¤����$#���� &�� �� _�'$����� \� ����~�� Evaluation of B2C website based on the usability factors by using fuzzy AHP & hierarchical fuzzy TOPSIS.�&� IOP Conference Series: Materials Science and Engineering 114���� ��' �� ������� &����$����%����
£��¤������"��������~��Software Security: Building Security In.�>'' ��_�##� ���^ ����}���##������ �� �����! ��������£�@¤�� �# ����������� �� ����� ���������=�'��] ��� � � ������$����� �% � ���������� �"����'��� ��� IEEE transactions on
Engineering Management��@���������~~� �£��¤�� ���"�� �� _�� �� <� ��%�$'��� }� ����@�� Information Security: Principles and Practices� &�#����'������ &��� � ������
/#$�������£�~¤������� �� \ �%�� ��� *%��� *%����� _�� ����� <�� �� � �� *%$��� }� ������� �������� �!! ������ ����$� ���� ' �� '����� �!�
� ��������'��� ������� �'����������������Internet Research�����@���@~��@[�� �£��¤����%���������_���%���� �������_ � �������!� �''��'���� � � �����������������%��� �� ��� �����^ ��*�������� ���������$�����
�����������%� ����%��'��� ���International Journal of Bank Marketing,�������������@�� �£�[¤����� ����*����< ��������&��������= ^ ��'� ����!���������$� ������� ��$� ��% �' �� '�������!��#�'����������!���������
� �%�����������^������Information Systems Research���������������� �£��¤��$�#��%�� _� }�� �� ��# ������ �� ����@�� _ �$����� '��������� ��#� ^�# �� �� �% � � ����� '��� ��� ���� ��� !���� &��
International Conference on Financial Cryptography and Data Security��''��������_'���� ���< ������� �# �� ���£~�¤�� ������ �� ��� \�##�� �� ��� �� ��`���� <� �� ������� ��� � # ���� �!� ��!��������� ��#� ���� �� �$������� ��� �'�������
`����������"��%����% ����� `���!�#����"�� %�$�����Journal of Management Information Systems�����@����������� �£~�¤�� �!���# ��� *� ��� �� <����� �� �� ������� � �%�#� !��� � �$ ������ ��#� � � �^���� ��� ����� � '��� ��� �%��$�%� �� '��� ���
���� ������ ��>_���� ���������[���@�����%��������=*��>_���� �����#�\��# ������!!�� �£~�¤������%��������&���%������<�����@������# ��!���# � �������$���� ��� ^ ����� ����������'$��%�� ����<�*�" ���� ��$�����
\��_&_���#�!$�����������$� ���� #����� ��Arabian Journal for Science and Engineering, 39��������������� �£~�¤������/�����~��&�� ��������'��� ������$�������������� ����� �'��� �� �£~@¤����^ ���������$������\�����������_��������*$���� ��# ���%�����$�#��������!��#��������#������ ����������%��Journal of
Retailing���������������~� �£~�¤���#�$��� }�������� ������������ $����� ��������%������� �'��� ���� !���¨�\�"��#����#������� ��#� �$����' ��' ���^ �
`'��������� &�� Proceedings of the 42nd Hawaii International Conference on.the System Sciences� �''� ������ �&*__��������������"�����>_���}��$����������
£~~¤������*�_�������}��������������_�����@�����������!! ������ ���� ������� '���� ��!������%����$�� �� ����������� ������%��%�� �%����'��� ��Information & management��@��~�������[�@� �
� Chen, Liu, Lai, Chang & Lee �
The 17th International Conference on Electronic Business, Dubai, UAE, December 4-8, 2017 �~��
£~�¤����� ��/�<��*��^�]���\�$]������/����/���������#�Ç�$ ���\��������&�!�$ �� ��!���$�����#�' �� �^ #�^��$ �����% ���� ���������'$��%�� ����^ ������� ��&�� ���������% � !! �����!����$���� ������$������ � # ����Tourism Management��47���[~����� �
£~[¤�������# ��$���� &�� ���������Ç���� ��� �� ��������*����������� �� ����~�� = � ��������� �!� �% � ��� ������ ��� $� � ��*�� �%������� ��� �� '��� ��� ���� ��� ��� ��� '���� � ��# �� �''����%� Information Systems and e-Business Management���@�����������@� �
£~�¤������� �� ��� ="�^ #��� �� ��� ���������� �� =�� �� � �����#��� �� ������� &�^ ���������� �$�� ��� �!� ��� ���^ ��� �����������^ ��^���#�������!������� ���� #�&_��$�� �����# ��Information Systems Frontiers��������������@�� �
£��¤�� ���������=�<����= ������\� �������/� �������������'� � ��� ��� ��#�'��� ��� ���� ��>_���� ������~������������%��������=*��>_���� �����#�\��# ������!!�� �
£��¤� �����_����� ���� �"������������@������� �'��� ������� ��$������� �������'%����#�^��$������'�����'%��Proceedings of 2014 IEEE Students' Conference on Electronics and Computer Science��''������&///��<%�'����&�#��������%�����
£��¤�_������\������������"������� ���# ��������\% ����������%� ����%��'��� ���European Journal of Operational Research, @[��������~� �
£��¤�_��% �"�������} ����]�������*%�"���*�����~��&�!������������� ���$�� ����&�#�^�#$�����#����������������# � ���������Management Science, ���������[@���[~@� �
£�@¤�_������ \� �� ����@�� =������� ��������% � ��������� %� ����%�� ��#� � �"���� '��� �� �� ����¡����� Journal of Systems Science and Systems Engineering�������������� �
£��¤�_�%���#���=����������}��� �#������������� ��� ������������The Analytic Hierarchy Process in Natural Resource and Environmental Decision Making���������_'���� ��_�� �� ���<$��� ���� #����<��
£�~¤�_��# ��/����="�^ #���������� �������*����������������=����������# ���������$� �����#�'�������� ��������!�� ��� ������ � '��� ���� ��� �% � >��� #� ����#���� `� �#���� >\�>\� "��%� ����^���^ � ���� ������ ��#� ��$��� Psychology & Marketing�����[���[~��[��� �
£��¤�\�]$##���������������#�!���������!�= ������#���� �����# ������% ��$�� ����!���!������������� ��!������#�$��^ ��������^ ����� �TOJET: The Turkish Online Journal of Educational Technology,��@�@����������
£�[¤�\ � �$���� =� ������� &�� �� �� ���$#� � �$������ \% � ���$����� �!� ����$����� Information Security Technical Repo���� �~�������������
£��¤�\����������*%�$����*����� $�� }�=� ���������� !! ���^ � ��� ^��$��������# �� !��� �% �" ����� #����� ������!� �% ������� ���#$�����Expert Systems with Applications,��[��������@�������~� �
£[�¤� �����������%���*����_$���^ ���� ����~������� �'��� ���� �$������ �%� �������#��%��� �� ��Proceedings of the 2016 Second International Conference on Mobile and Secure Services �''������&///������ �^��� ������>_���� ��$�����~����
£[�¤���`����<������\�##����������������% �� ��������� ���������!�$� �������!���������#�� �%���������� '���� �Information Systems Research���~�����[������ �
£[�¤����#� ����������������&##���$�������<��� ����������[��&�� �� �������������������������������%����������������$� ��' �� '������Banks and Bank Systems�����������@~� �
£[�¤������� �� ������� /����� �� � �$��� ��� � �%�#����� �� !��� �$''��� ��#� # ���#� �%���� ����� � ��� >_� ��� ����''��������������¡�~����~�����%��������=*��>_���� �����#�\��# ������!!�� �
£[@¤�$��}�=��< �������� &����* �! � �������\� ������� &�� ��������� �^�� ��$������"��%����� ����#� ��!����������$���������� �'�������� �������% � �� �^�� ����� `��Mis Quarterly���������������@� �
£[�¤�������_���$�����*%�$����������$'����_� ���������� ��!� �%��� �� ��� ����������� �% � � �^�� ��$������� �����!�������� ��#�� '$��%�� � ��� ������ ��� �� �$�����%��� �� ������ ��$������� �� � ����� �^����� ��� International Journal of Mobile Communications�������������� �
£[~¤�� ��<�����$���������"��������~��>� ��!���'�������� �' �!������ ���#������ ���������� �������'��^ ��\��" ���� ��$������Journal of Hospitality and Tourism Management��26������� �
£[�¤���������������"�����*����������Multiple Attribute Decision Making: An Introduction��������@��������� � ���_�� �'$�����������
£[[¤��$���������@������� �'��� ���� �"����� �$������������#�'� ^ ������� �%�������� � ���%�Network Security Technology & Application��4����' ������ �
£[�¤�� ��%����� �� ��� < ����� �� ��� �� �����$������� �� ����~�� \% � � %�^������ ���� �$ �� �� �!� � �^�� � �$������ Journal of Marketing��~���������@~� �
£��¤��%����� �� ����~�� ��# �� !��� �$���'� � ������$� � # ������� ������� "��%� % ������� ������$���� !$���� ��!��������� ��#� �����''����������Journal of Intelligent & Fuzzy Systems����������~����~�~� �
£��¤��% ��������%���������_�������$�����������\% ���'������!���!����������$��������#����� ���$���������$� ��©�������$��� ���� ������ ��� ��!��������� `�%��� � ^���$��� ����$���� ��� ��� �'������� ��^ ���������� Decision Support Systems�� 56��������@� �
£��¤��%�$�� \� ������� ��� �'������� `���������� �!� ������$��� � ��� ������ �!� ����� � '��� ��� � �^�� �� Decision Support Systems���@�������[������� �
£��¤��%�$��\�����@��>�# �����#�����% �# � ����������!������ �'��� ���������$��� �$��� �Industrial Management & Data Systems����@�~�����~��@[��
_� '%��� �� ��� ������� ��# ������ ��#� ��������� �!� �% ���%� ������ ���� �� ��� � ��$#�� �!� �% � >��� #� _��� �� &��Proceedings of The 17th International Conference on Electronic Business �''� �~������� &*/<�� =$����� >�/��= � �� ��@�[�
Stephanie
�
The 17th International Conference on Electronic Business, Dubai, UAE, December 4-8, 2017 � � � �~��
#��� ������ ��������$�%� ���$���������_���������������������"�����������
�� ���_� '%��� �����������\ �%����������>��^ �������_����'�� ��! ������{ ��$ #$���
����������
\% �>��� #�_��� ���>_�����"���#�� �# ������ #������ �%������������������������%�'' ������� �%�� ������ ��!��% �� ���� !!��� ���% ���%��� � ���� ��� ��� �% � "���#� \% � ��$������� ������%�� $��$�������� � �' �#���� ��� % ���%��� � %��� ����� � #� � ^ ���� � ��% ���%��� �� !��������'$���% ���$�������% ���%��� ����� ������% �'��%�!�������]����^ �%�$���� ��$�%�� !����"����% ��&\/*�������!������"%��%���# �'��^������!������ ���^ ��!����#�'������!�/� ��������� ���%�� ���#�����'%�����������#�%��'������\% �$������ �������!� �%��� � !����"��� ��� !��� ����� ���^����������� �% ���$������� !���� �� #�% ���%��� � ���� �� ��� �% �%�' � �%��� ���"�$�#� � �#� ��� !!��� ���� ��#� ���� �$ ������ �� #��'� ��� �% � ��$������� % ���%��� � `' �#��$� � ���%�$�%� �% � � !���� ��� #�$����'$�� #�/����#�'������������� �# #�������!����� ���^����%�������� ��!$����� ���� #���� ���!�����������$�� ���!�������%���� ��'��'�� #�����^ ���� ��% � ����$ ����#���� ��% � ������ �����%�'��� ���� ��������#��$�������� ��Keywords: /�% ���%� ������ �����&\/*���/� ��������� ���%�� ���#���>_� �% ���%�� � ���%� `�%��� ��% ���%���!��������� `�%��� �����������������������|*��� �'��#�����$�%���
������!"������
\% �>_�%�����"����� ������% �!�� !������!�� � ���%���#�����^���������� #������ �%���������!� ��$�% ���������$�� ��!$���� "�� � ������� ��� �^ ������� �_%�� �� _���%�� ������ &�� ��� �� �$���������� ��^ ��� ���� ��� � #����� � � ���%� ��� '���� ��%�'� "��%� �% ����������&�����$� ���!�� ���%��'��� �� ��'���������% �� ��� ����� #�� #�����"���!��� ������ #����� ����!��� #�� #�������%�������#�%��'���������#�%����� ��!��% �������#^��� #�% ���%��� ����� �������% �"���#�������������������������!� ���% ���� ���#^��� ����# � ��� ��� �� ���#� � �%�������� � �#� ����� �� ���# ���#� !���� "�'��#$���� ��#� � �^�� ��\%��� ��� �' ������� ��� ��� � �' ����!�% ���%��� � ��#$����� ��� �� ���� �� �!� !����� ���' ������� ������ �� ������ %��'������ ��� �!� �� �� ���� �� �!� %�"� ��# ��� ��#���'%������� #��% � �$�'� �����#���#� �������% ���'��� �������� �� #� ������������$�%����� �#������ �������^ �$� ��!�� �%�������'������������ ��$� ��%����% �%$� ���'�������^ ��� ������# ����� �%���������� �$�'� ����� �"���%"%�� ���#�'��!����� �_�������% ��� �%��#���% � ��� �� #�����'��! ���������"%���� � �� �����'$���% ������ ��� �$�'� �����#���#� ������$� ���#������% ���% ����% � ��� �'��� ����"%���� �� #����� �� ^ ��%����% � ���� ���� �%������ ��'��^�# �� �� ���$���� ���_%����_���%��������\%$�����% ���%��� � ���� �� "���#� � �# �� ��� � #����� � �%�������� �% � >_� ����� %�'' ��� ��� %�^ � �% � ����� `' ���^ � ��� " ��� ��� �% � �������'%������� #�% ���%��� ����� ������% �"���#��\% �>_� ��'�� �% � ������!� ��#$�������� #��������� ��� � �����!� �������$���% ���%��� � `' �#��$� �"��%�������!� �����=���' ������% ���%��� �������@���������� ���%���� �^����������~��\%�����$�%����������� �����Ï�[������������_�$�� ������# ������������&���������% �&�����$� ��!�� #���� ����$ #������'���!$��� '�������� #�¢\��/�������$����"%��%�'���� #��$���%���� �" ��@@�������#��[�����# ��%�����$�� #����>_�%��'������������ �$����!�� #����� ��������#��%���%��!��!� �% � �# ��%��" � ����$�����'� ^ ����� ��� ^ ������ "�$�#� ���� ����� %�^ � ��^ #� '� ���$�� ��^ ��� �$�� ����� ��^ #� ��� �� ��� �% � �$� � �!� Ï���Ï��� �������� ' �� � ��� ��� �� � ������ ��� %���� �� ������ #� �%��� �% �>_�"�$�#�%�^ �����##�������� ���������#������� ��� ����#��'������ �!������ ����������� #� �����' �#���� ��� % ���%��� � ��� �% � ��� � ' �� ���� � �!� �=�� ��� �% � � `�� %��% ��� �' �#���� ��$����� ��� �% � "���#� ��$�%��� ���@���$��% ���� ��������'��] �� #��%����!��% ��$�� ������� ��!��!!�����������$ #���% �>_��' �#�������% ���%��� �"������� ����Ï�@������������� ���@�� "%��%� "���� ���$��� ��� ���� �!� �% � ��$������� �=�� ���*���%��� ������ \%��� ��� ��$� � !��� ���� ��� ��� �$�%� �� ��� � �!���^ ��� ��� �' �#���� ��� % ���%��� � ���� �� ���%�� ���'����� � �' �#���� ��� ��% �� �� ��� ����$#���� � �$����� ��#� " ���� ������% � ���'$������������� ��% ��^ �����" �!�� ��!��% ���$������<���� �����������\% �>_�% ���%��� ����� �������%�'' ������� ��� ��!��% ���������'� `����� �������% �"���#���^��^������� `� ���^ ��������!���� �� �������%�'��������'��^�# ����!���� ���#�'�� ��� !������ ����� �� &&&�����% �����=��� ���� ��� ��_�#�!�������%��$�������������%�$�%�% ���%��� �!������� ���$�%����%��'����������������#���������!!�� ����#���% ��!������� ���� ��"� #�������%�'��^�� ���#�'$����� ����� ���*$������������������� �����!����%�% ���%��� �'��^��������#�!�����������% �>_������� �����% �'��^�� � �#��!��% �'$�����'��^�� �� �������`������#�`���������% �>_������%�'' ������� ��% ��������#$�������� #���������%���#� �������$����� �$��^ �����% ���%���^ ��� �!�������' �'� ��=�^����_�� �������_�%� �����_�$�� ������@���# �'�� ��% �% �^���' �#�������% ���%��� ��%�������������''� ������ ���������� ����� ��� ��� �������� ' �'� � ���@��� " � � $����$� #� ��� ���@� �_���%� �� � #������ ������� �% � � ������ � � ���� ���� "����������$���� � ��� ���"���� $��!!��#�������� �!� ���$���� � � ��� � ] ������ �!� ���$���� � ��� '��^�� � ���$� ��� ��� ����$��� �!� '� � `����������#������� �*$��������������\% ��$�# ���!�% ���%��� ���������� �% �'�'$�������%���� �����% �^�� �%��� ���"��� ������ #� ����������$� � ��� ���$�� �� ��� �� �����$'��� �� ��� ����� ���������� �� ������ ����� �!� �% � � "� �� '� ^�� ��� ��� �% � >_� % ���%��� �

� Stephanie�
The 17th International Conference on Electronic Business, Dubai, UAE, December 4-8, 2017 � � � �~��
��#$������� ��!� ��������$� #�����% ���$��������^ ��� ����� �����% �'��^�� �� �����!���# ��^ ��������" ������!���������% ���%��� �����#����%����������" ^ ����^ ���% ������! "�# ��# ���% � �%�^ �� �������!�������%��� ������% ���$�� ���!�% ���%��� ��' �#��������% �>_��"��%�� � ���� ��^ ��� ��� % ���%� `' �#��$� � ���#$����� ������� ��� @[��� �!� �% � ������ % ���%� `' �#��$� � ��� ���@� �������� � ���%���� �^����������~��\%���������� �� ����#���� ���% ���^ ��� �����# ��������� ����� �����% �'��^�� �� ��������#������ �������$� #������"�# ����� ��!���^ ��� ������$���� �'����������# ���� ����� �����% ��� �����������$#����! # ����'����������� �� #���� ��� #����#�� *%��#� ���� � ���%� &��$���� � �������� �*�&���� ��#� % ���%� '����� �!! � #� ��� ��#�^�#$��� ���� �� ��� " ��� ��� ��� �% �= '���� ����!�� � �����!!������ ^ ��% � �����% �@[�����^ ��� ����' �#�������% ���%��� ���������������# � #�!�����" ���%����% ��^ ��� �!����������% ��# ^ ��' #���$���� ��"%��%��''��`���� �������#����������<���� ������������� ��%���%��!����@����!��% �'��^�� �% ���%��� ��' �#����"����������$� #���� �'��� ����� #����$���� ����� ���������@��_���%���� #������������_$�%��� �� �#� ��������������%$� �!��������� ���������� !����$��� �� ����$�������� �$���� ��������������������!� ��� �!������'���� � � �# ����"%��%������ �#����# �� �� #�'��#$���^������#�" �� � #����' ����^ � �������� ����'����� ��� �% �� ��������$'�����!�� � �������������������#$ ����'�����������% ���%����$���� ���������� ��"%��%����%�#����'����������% �'��� ��!��% ��������#������$���� �# #�$'���������������' ����^ � �������% ��$������� ����� ���� ������ ������������� ������� �����$��^ �����% ���%���^ ��� �����% �>_�����% �!���� �� #����� ��!�����% ���%��� ����� �������������������"%��%��������� �% �'��� � � �����!��� �% ���$��������������������% ���%��� � �' �#����\% ����� �����'��� ����"�# � ���� ��!�% ���%��� �# ��^ �������$���� ���#�'��� ���� �%��������%�������� �!����� #�'$����������" ������'��^�� ������#��������% �'� � �� ��!���� ��������^ �������� �����������#���� ���#���� ���� ������ �^�� ���_%����_���%�������������#��������% ������ ������ ���!��% �&�����$� ��!�� #���� ����$�%����� ��%��#��!��% �������% ���%��� � `' �#��$� �"���"��� !$���' �#�����������$����!�^����$��!��������$�%������ !!��� �����#�� #$�#����� �^�� ���!��$#����$� ���� '�'��� ����#��#����������������������#��������$������� ��������� #��''���$���� �� !��� '� ^ ������ �<���� ���� ������ &�� ��� �%$�� �''�� ��� �%��� �% � >_� % ���%��� � ���� �� ��� �� '���� ^��$ � '��'��������� ����^ ��������������� ������ ���������\% ����� ��%���� ��% #�����''����'�����"% ���$�#�$�� #�������%��� �����$�%�� # #�����%�$�%�%�"��% ��%��� ������ ������'���% #���������� ����_%��!�� �������������������<�$�%� ���������
����9<��"�!��$@�$;�
����"����%� �����������������,�������� �����!������ �� '� ��� �% �>_�� ����� '$��$��� ��� �����!���� �% � % ���%��� � ��#$����� "��� �% � �� ���%� &�!��������� \ �%������� !���/����������#�*��������� ���%�������&\/*�������"%��%�"������� #��������"������ ��# ������������ �������������$� �����@��\% ��&\/*������"��������'�� ����!��% ��� ������� ��^ �����#�� ��^ ��� ��������!������������� ������������$�$��������� �� #� ��� ����$��� � �% � �#�'����� �!� /���� ��#� �$''������� � �%������ �� \% � �!!�� � �!� �% � ��������� *���#������� !��� � ���%�&�!��������� \ �%������� ���*� ��� ��*�&\��� �� #�^������ "��%��� �% � >_� = '���� ��� �!� � ���%� ��#� �$���� _ �^�� ��� "��������� #� �% � � �'����������� �!� �� ������ �� ����� ���� '���� !��� �� ��$�����"�# � ��� ��' ���� � % ���%� ��!��������� ���� �� \% ��&\/*�� ���� ��# � '��^������ !��� ��� ���^ �� "���%� ��� �������� ��� �'$�� �#�'����� �!� /���� ������ '%��������� ��#� %��'�������<�$� ��%��� �� \�^ �� ��� ������ \% � � ���������� ����� ���' �� #� %��'����� �#������������� ��� �!��� � '����� �� ��� '��� ��� �% ����!�# ����������!�'��� ���#���� ������'����� �"��%� �% �� ���%� &��$���� ���������������#�����$�������������� ��&��������^�����$� ��!��������#�_ �$������$� ��!�������&�� ������_��� �������%����*�$��� ���������*���� �&&&�����% ���������������\����������������!$��% �� � �������������� #��% ��&���������$���$� �"��� ���� #������������#�� ��� `� ���^ ��%��� ����� �% ��&�������^������#�_ �$������$� ����#���� ���% �� �% �������� ������!������� �% ��$�# ��� ���!��&\/*�����$� ��������\% ��&�����$� �� ����� �''�� #� ��� �% � &\� ^ �#���� �������������� "��%� % ���%��� � '��^�# ��� ��� ��# �� ��� '� ^ ��� �% �� !���� ���� �������� `'�������� �% �'��� ���#���� ��� �% ���'��� ������ �<�$� ��%���� �����������#���� ������ ��$� � �������� �% ��&\/*������"��� ������� �����%�!�� ����% ������ ��!��% ���^ ��� ���"%��%���"�"��� #������� ��%��� ��!��% ��$���!���������% ���%��� ���#$��������#��^����&\��#�'�������#�!�������������� �� ������ ���^������������% �!���� �� #����� ������% �'��� ����&�� ����� ������ �% � ��*� �"��# #� �@[� �������� "���%� �!� ������� ��� �% � ��� >_� ���� ��� �% � =�������� �!� *��$������ ��#� �% � !�^ �! # ���� � ������� ��� �%��$�%� �% �_��� �� ���%� &�!���������/`�%��� � ��&/��*��' ����^ ���� � �����������\% ��������" � �!$�# #��%��$�%��% ��&\/*������!����% �'$�'�� ��!�# ^ ��'������!�����$��$� ���#��$�� ��������'����������� `�%��� �'��� ���#���� ������ �% �^����$��% ���%��� ������������������%�"��%��� ��#� ������� �% � ���� �� �\% ��!!�� ��!� �% ����������*���#�������������������� �#��� �! ��$� ��!��% �����"����%����% ����� �����% ����� �# ������ #��� ����"%��%�� � �^ #��% ��"��#�"������� �% �#� � �'������ � !��� # ^ ��'���� �% � '���� ��#� ��������� ' �!������ � !��� � '������� ��� ' �� �% � �$�# ��� �� ��� �% � �"��#� ����� ��_ ���%� ���%&\���������/^ ���% ���%��� �'��^�# �� ������ �!����% �/���&�� ���^ ���������"���� �$�� #����� �'�����!����� ������ ��$�%��&/������% �� ��]��� # ^ ��'� ��� !����"���� �% ��&\/*������ �!������ "��� �% � ���� ��� ���� ������ ��#� �!!��#��� � *�� ����� ���������"����������*�� �������'����*���"%��%�"���^�� #��������"��������%�������!� �������������� ����$��'�������������� ��<������������\% ��*��"������ #���� ���� ������% ���%� ���$���� ���^ ��� � !����� ���������#��������������������� �������% ���%��� ����������������������\% ������' ��!���������� ��$�� #��% ������!��������� ��%���% ���%�&\���$�#�'�������� ������% �% ���%��� �� ��� #��������!��$��������#� !!��� �����<$������<$�� �������������<�$� ��%������������� �����'�� ����!��% ��*��"����% �� ���%�&��$���� �/`�%��� ����� �'��� �"%��%��' � #��������� �������&������������� ����� �'��� �!���% ���%����$���� ��%��� ���� ���%�'' ������� � ����% �� ���'������������#��� �"��%��% ���� #������������$� ��!��% �'���!��������'�����������#��'��������# ������# ����'��������!�#�!! � ���% ���%�'�����/������ �� �$�� ��� �%��� �%������� �'��� ��"%��%��' ��� ��"��%�$�������� ���"����� ���� ����'��^�# ��!!��#��� ����$���� ����$'���������������' �'� ���������������*�� �����������~�������% � �^����$��� � ���� �������������#��% ���'��^��������� �� �� ^ #����%�^ ��% ��������������'��^ ��% �' �!������ ��!��% �>_�% ���%��� ����� ��
� Stephanie�
The 17th International Conference on Electronic Business, Dubai, UAE, December 4-8, 2017 � � � �~��
�^ ����� ����#�� ��������!���� ���� !!��� ������#� �$�����%��$�%�������( ��������&��� �����������!��% �!�����%����% �"�# �'� �#��#�'������!�/��������� ^����� ������� ���� ��% �!���� �� #�% ���%��� ���#$���������% �>_���% �! # ������^ ��� �����# ����$�'� � # �� #�������� ����!�Ï�����������#���������"��#���% ���$� ��%��$�%��% �������&\/*�� ���� �<�$� ��%��� �� \��^ �� ��� ������ \%��� ���$��� "��� ��� � � �' ��� �^ �� �� �'��� �!� ��� � ���� ��� ��� ���^ �� ���'%�����������#�%��'��������� ���$��� ��% ����#�'�������#�� �����!$��$� ��!�/����\% ���� ���^ ���% � �"������$��$� #���������������#��������''����%�¥�����������"����!��##��������'��� �����!�'��^�# ���# �������� #�� �����!$��$� ��!�/�������#����������� �����!��$�����������!�� �����!$��$� �"�������# �������� #���#� ������� �����<�� ���������\% �¢� �����!$��$� ����� ����� ^��^ #��^ ���%� ����� ��!���������������~�_��� �&�!��$� #����#������'�$� ���#��%����������� �&&����$������#^��� #����������'��� �� �����#����� ��������'��^ #��$���� ��'�����$���������'��^ #�'�'$�������% ���%��� ���%&\�� �̂�������� ��! ��$� ���!�� �����!$�� $� � ����$# � � �������� '� ���������� �$������ � ��$� � ��� � '������� ��#� ��!��������� `�%��� � �\��#��� ����� ��_�%��� ���������%�� ����/�������%�^ �� ^ ����!$����������� ����%� ��!��% � ����'�����$������ ������# � #�������������'���������� �����!$��$� ��� ��$� ��!��% ���'�� �����������'��^ ��$�������!���� ���#�� #$� ��������� ���% �����*���$���������\% � ���� �!$����������� ���� ������ *�������� = ������� _$''���� �*=_�� ������ �%��� �$''���� �� '%�������� ��� ������� ^�# �� ����� #�# �������� � ���#����'��� ���
��� ���# �'� �#�$� ��!��%������� ������ �� ^ #����% �'�� #$� �� #����� ��������#���'��^ ��$�������!���� ��� *��'$� ��� #� �%�������� ��# �� /����� �*��/�� ���� ��� �%��� !�������� � ���'$� ��� #� ��# ��� !��� � #����� '��#$���� ��#�
� �^�� ���$�%����#�$���������������� �������#�������� ���\%������� �������� �# #����'� ^ ���� #����� �������%����� ���# �����% �'��� ����!��������� �� ��!���'%����������%��#"�������
�� � ���%� &�!��������� /`�%��� � ��&/�� �%��� ���� �� � �$� � ��#� � ��� ��� � �%������ �!� '��� ��� #���� "��%� ��% �� % ���%��� �'��^�# ����'%������ ��� � �� ����# '���� ������#�������\%���%����% �'�� ���������� #$� ���������� ������������ #$�#����� ������#���'��^ �� !!��� ��� ��
�\%$����% �!�����'������!��%���� !����"�����'��� ���� ��� #�/��������������������!������������ �#������ �%�������$� ����� "�&�� �� �� �� �� ������ ��! � � ^ �� #� �%��� ��� ����� ��� �� ��� @� �#$���� $� #� �% � &�� �� �� � �$������ \% � ��'� � ����� !��� $����� �% �&�� �� �� "��� ��� � ���%� !��� % ���%�� ��� #� ��!��������� ��% ���� ���#��� ���%��"� ��� ���� �� �� ��$������ ������ \% � ��� � �!�����$� ������� �� #����� �%�������"���� ������� ^�# ������#��%���"���"%���"����##� �� #�����% �� !����\% �� ���� �!����% �% ���%��� �'��^�# ����%��$�%��%���� !����"����%����% ��%�#�����#�'������������� ��!�#�������� �"��%�� ����������!!���\��� �����������&���'�� ��!��% �!�����%������ ��%��������!��% �>_�%��'������$� #����'$� ���!������ �'$�'�� �����% ���% ������!����[����������$������!��% � �%��'������%�#����'� % ���^ �% ���%�&\����� ���"��%���������/������$�#��% ���� �' ���#�������!��% �'���������� ��!!�� ��%�#�!$����!$���������/������� ����������#��<��� ���<�$�% ���_'�%������%���� �����������" ^ ���"��%������'����!����$�� ��%��� �����������@�����$�������!��% �����! # ������$� ���� �%��'������%�#��#�'� #����� ������������/������� ��"��%�������������� �����#��� ��%��#�%�#��#�'� #������'� % ���^ �/����*%��� �������� �����_ ���������������!��� �% �'%������������� ��%���[���%�#��#�'� #�������/������#���� ��%������%��#��!$����!$���������/����������@��_%�������~���\% ���� ���$'#�� ���� �% � /��� ��� ���^ � '������� ��� �%��� � ����� ��� �������� "���%� �!� ��� ���^ �� %�^ � � �� '��#� �$�� ��� ��� � �%��� @[@�����% ���%��� �'��^�# �������!� �#�}��$�������~����� ��������~��\%����� �� ����%�"��%��� �% ��&\/*����� ���^ ��%�^ �'��� #�����$�������� ���������������/����#�'�������#�� �����!$��$� �������'%�����������#�%��'���������� ���� ���������( �������$�%� ����#� ������� �����<�� ���������%��%���%����� �� ���%��� �� �� ���$�� � #����%��'����������% ���/�����'� � ����������� ��!��% � � "��� �% � % �^�� $'!����� `' �� �� "%��%� ��� �% � ��� � �!� ��� � %��'������ " � � %��% �� �%��� �% ��� ����� � ���� ��� ��'����� `' �#��$� � �^ �� �� !�^ � � ��� ' ���#� ��% �� �%��� �� �� ����$# #� $�� ������ ��&� ��#� �% � ������ ��� � ����^ � ��'���� �!���'� � �������% �� �%���������$�%����������!�'��#$���^��������!!�#�"���� ���#�'��������������!�� ^ �$ ����������% �'��� ����!��#�'����� ��� �% � ���� �� � !�� � ��� � ��� � �� "��� �!� ��! � � �� ����% �� �����!������ ����� �� "��� �!� ��$�� � � ������� � !���� �% �'%���������%�� #�����% � �%��'������\% ��%��� �� ��!�� #����'���������� �'������ �������'� � ������/������� ���" � �� ������% ���� ���� ������*$�� �����*���� ��< �� �����<�����#������������ ������������� ������ �\% � `' ������� �^� " #���� �� #�����% ����^ �� ����� #��%��� �� ����#���������$�%�������� �������% �!�����%���� ������� ����$� �/����"���'�����$������%��%��������% � ��# �� � � ������� �!� '%��������� &�� !���� �% � '%���������� � �$����� � ��� $� � �% � /��� '���!���� %��� � �� �$�� #� ����� �� � "��$��� ��� ��# �� ��� ��� � ^ �#���� "%�� ����� #� �!! ����� ����� � � �^�� �� ��� ��'�$� � '%�������� ��� �� ��� �% � /��� ��#� � � ��� �� '����� !���'%����������������!!������ !��� �% �'$�'�� ��!������!��������'����� � ���]������' �����������$�����������$�$�������������&���'' �����%������ ��� ���% �!���������% ����$�#������ �#�!! � ���!�����!!�������% ������/^ �����#�� ��% � ��� ���� �� #�����'������ ���%����� ����� ������������ �%�����������$�����������% ����� ��� ����������%����% ��#���������#�� ����� !��� %��#���� � �����!� ��� ��� ��� ������ !��� !! ���^ � ��� ���^���� ���]������' ������� ����$�����������$�$���������������� �^ ��� �% � �'%��������������#���������#�'������' ����� ��!��������#�'���������% �������# ���%������% �' ����� �����^ �������'�� #�����% ������� ����������������� #�"��%���������������#�$'���#�����% �/�����������##������' �����������$����������_ '� �� �����������_�� ���������$�������$'�������� !�����!������^ ���������/���! �������% ���^ ��� �����#������ ���� �����������'�� ��!��% �! # ������� ���^ �����]������' �����������$�����������$�$��������������!� ��������% ���^ ��� ������ ���^ �������������!������ ��� ���$��� � �#�'����� ��#� ���� � ���#� _�� � '%��������� ��#� %��'������ #�� ���� "���� ��� ��^ ��� ��� �% � /��� ��� � ��� ��� �% �� �%������� ��� �!� ��� ������ ^��^����_���� �� ���$�#��!� !��� #�/��� ��'� � ���������"%��%�%�^ ���# � �% ��"����� � �$������ ����% ���# ����������"�����������%��% ����$������$�^ ��$�%���� �����]������' �����������$�����������$�$�������������
� Stephanie�
The 17th International Conference on Electronic Business, Dubai, UAE, December 4-8, 2017 � � � �~@�
�\% �'��� ���� ����������� ��!��% �� !����"��������$� ��������������������$�������#$����$���� �#��'���#�����%�!�����% ���%��� �"%��%�� �$�� #��%���% ���%��� ����� �����^ �!����!��$�������� '���#������ ����!��$����������� ���� #���� �\%���� ����'��������% �'��� ��������% �� ��� ��!���� ���#�!��$������������������% ������� �����$�����������% ���" ��� ����_ ��������et al.����������% ���%��� � ���� �� �%���������##� �� #� '���#������ �"��������# � #���� !������� �%�����!� �%���� �� � �$�� � ���\%���'���#�����%�!��� ���% �#�� ������!����% �% ���%��� ����� ����!��% �!$�$� ������� ��� ���' ����^ �!���% ���%��� ����� ������� ���� ��' ���� ����������!�������� ����%�������!�'��� ���#�������%�"��%�����#��$���# ��% �'��^�# ��� ��������%$��'�^�����% �"���!�������% ���%�#����' ��������������'��� ������� ���'�$� #������������$#������ ���#����$��et al.��������\%���"���"%���"��������# � #������� �!�������$���'��� ���� ������ `' �� �� ����\% �/������ ���^ ��#���������'���%��� ����/����#�'��������% ���!���� �����!$��$� ��!��% �/�����% �% ���%��� �'��^�# ����� �� �$�� #�������������� �"��%���% ������ %��# �������% �� ������������$��������'������'�� ����� ���%�&�!���������/`�%��� ����&/��"%��%�!�������� ����%�������!�% ���%���!��������������#������������������� ������ #�����#��#��!���� �� ����� �����#����������#��$�������!���� ������ �� ����������\% �����#�'�������!����% � �� ��������&/������ ����� �� #�����% ������� �� ^ ���&/��"%��%������$����"����� ��� #�������!�������������"�# �% ���%���!��������� `�%��� ����"����� � ���%�/`�%��� ����*��������@��\% � � ���%� /`�%��� � ���$����� ����� #��!!� ��� ��� ��*� ! # ���� ��������^ � ��� ���~� ��#� � � "��� ���������� #� ��� ����� ��� \% �_ �$�������] ������'��^�� �� �������������^ ��!����$''����\% � � ���%�/`�%��� ��$�� ���������������� ��% ����� ����&/�� �"��������% �>_���$''������� ��� � �%��� ���� �������� '��� ����� @� ! # ���� �� ��� ��� � ����� ���� �!� >_� %��'������� �~����� � #����� ���$'��� �@��¹�#�������� � �� ��� ��#� [���� '%������ �� ������� ���� �% � ��� ���� �� �\% � _ �$���� ���] ���� ������ \% � ���$� � !��� �% � '������'������������������������% ��''���$��������#���"���"��%� `' ���^ ��$������������������� �!�� �"��%����#����'���� �����#����� #$� ��% ���� ���� ! ����� � ^ ������� ������� ����#��#��� � ���� ��� � ���� ��#���^ ����� � ��� ����� � �%��$�%� �% � � ���%� /`�%��� � &��� �$���� �% �'������'��������������������'��� �"�� ��' ���!� ! �� ��� �% � � ���%�/`�%��� ����� ��� �% ����$��� � ���%�/`�%��� �� �"�����������'������� ��"%��%���������#�������� ���� #�������$���� ^ �$ �����#�\ ������� ���"% ���% ��!�������� �������#���#� ¡� ��� � �� ��� ^���#�� � �% ��� '��#$��� \%��� ��� %�"� � ���%� /`�%��� � %��� ���$��$� #� �% � � �"���� ��� �� �$�$����� � � !������������ � ����%�� � � ���%�/`�%��� ���������������� ^ ����!�� #�������% �� ��������&/���%���������� �����%��$�%��% �� �"������ ������ ����!�� #���� ������$��� �"�����"%��%�����$������� �����! " ���$�� ���!�% ���%��� �������������������% �� ^ ���!���� ������������$������\% �! # �����$''����!����&/��"���!������%����� �����#������ #����'��^�#�����% � � ����� ��"��%�������$'�!$�#����&��"���%�" ^ ��� !������% ����� �����#����^ �����$�������� ��$��� �����# ��!����% ������%�$�� ��% ������% ����"��������'���� ��%�'�"��%��% �'��^�� �� ���������������������#� ������� ����<�� �����}%���������\% � �#���] ���^ �!����% �! # ������^ ��� ���"�������������#�� ��% ����� �� ^ ���&/����������������� ^ ��� �"�������# ^ ��'�����''��'���� �� �%����������#��#��\%���"����!�������� ����� ��������!�'��� ��� #���� � �#���� ��� �� ������ �!� ¢���� #����� !��� '�'$������� % ���%� ����� � ��� ����^��� �� "%��%� ���� '�������� ��'��^ �% ���%��� ��$���� �����%���������������" ������!�����������������et al.������������% ���� ��!��% �� !������% ����� ����� �#��%�#� ����� �����"������ �������� ���%�&�!��������������������������&���"%��%�'��� �� #��% ���'�����������!�������� ����������#���� `�%��� ���� �% � ������ � ^ ��"��%���# !�� #�� ����'%������� ���\% ���&��� ��'����������� �� #�% ���%��� �'��^�# ����'�� �������������� ����#�'$�����% ���%�# '���� ����\% �!������������ ���^ ���� #����% ���%��� �'��^�# ���# ������������� �����!$��$� ��%��$�%�% ���%���!��������� `�%��� ������� � #���� � �������% ���&���"%��%���� �#��%�#��% ����$��$� ������%� ^ ��&/�\%$���% � ���"%�� ���&���� ��� ��&/���!� ���% �� !����&��������� ���� #��%����&/�����%�^ ��"��� �������# ' �#��������% ����� `��\% �� �������� ! ������% �'��� ����!� `�%�������% ���%���!����������������% � ������!�������������$�%���� `�%��� ��_ ������ $'� �% � �&/�� ��#� � ������ �% � ���� %��# ��� ��� � �����!$���� `�%��� � #���� ��� "���� �%��� "�$�#� � �$��� ��� ��'��^ #� !!��� ������#��$�������$���� ��"������%��� �� ������� ��%������% ����� �����"%��%��% ����� %��# ����%�� ���� `�%��� �#����"���# � ���� #���� #����� �!���� � ������% ���%�������% ����� ��'$�������� � ����!���%� ^���� !!��� ������#��$���������% ���%��� �\%���� �$�� #�����������"�� ���!���������������������'��� ��%��$�%��% � `�%��� �����������������% �^����'�� �������!��% ��&/�!������ �����#���� #���#�� �����!$�����������������#� ������� ���et al.��������_�� ��&/��$��� �����# ���" � ������$�������� �� ��$� ��% ����$ ��!��������� #���� ���^ ���������������� %��# �����$�#������ �� ���^ #������!�������������������� ��'��^�# �����#�'��� ����" � �$�"����������'���!����������������!����"%��%��% �'�� ���� � !�� #��% ������!�������������#� ������� ���et al.������������% ���%��� �� �"����%������ ��!��% ��&/��"��%������ ����'%������� �����%��� �#�� ��������' �����"��%� ��%���% ����#� �% � !�� � � ���� ������ #� ��� �%�� � �% ��� '��� ����� #���� "��%� �% � ��% �� �&/�� ���� ��� ������ �'���� !���� �% � �%��� �� ��#���$�� #� ���^ �� �% � � " � � ��� � ��� � ��� �% � !���� �!� #��'���� � ����#��#�� � ���� �#�'� #� ��� �% � �&/�� �%��� # � �� #���� ��' �����������#����� �$ ����� `�%��� ��!�#������������% � ��&/��\%$���% �^ ����$��#������������!��% ����������� �"������% ��&/���� ��������� #���#�#������ �� #��\% ���` #�� �$������ �# #���� �% ���%���'� � ����������$�%����/�����#��&/���������% �>_�� #�����% �� �����������%��� �% ���%���^��^ #���� ��%���]$���� �%������# ������= ����% ��et al.��������&��"������ �^ #��%������������������ ���% �� �%�������"�����'� � �� #�]$���!��� �����"����� �"��%�$������!�� ���%���!� �% ������� ���� ������'���% #��%��$�%��% �� �%��������� ��� ����/$���%�� ������ � #� ��� ��� ����� �$�%� ��'� � ��������� �$�� #� �$�� ��� � � !���$� �� \%$��� �% � � #� !��� �� ��� !$���� '���� #���'� � �������� ����� ��� ��^��^���� �% � � �� ���� %��# ��� "��� � ������ #� ���� �% � �$�� ��� ��#� �$������������� �!� �% ���%���'� � ���������� �� �$��� ��� ��# �� ��� ���������� � ��#� �� �� � ^��$ � "��%� ���� �� #� ���� %��# ��� "��� # � #� �� � � ���������'�� ����!� �% ������ ������������$����� � �����]� �����]���#����� ����#��� �#��`���_ ^# ���������� ��� ����#�/$���%�������� �$�� ��� ��������� ���'� % ���^ � ���"� #� � ���$�� � �%��������� '�� ������ "��%� �$��� ��� ��$� �� ��#� � �����^���� ����$���� ��� #������� �� ����$��� �����# ���%���"�$�#�� ����%� ��������������#�����������$�������� �
� Stephanie�
The 17th International Conference on Electronic Business, Dubai, UAE, December 4-8, 2017 � � � �~��
�$q��������������#��� ��\%$���� ^ ��� ����������% ��&\/*��� !������% ��$ ���!���^���� ��$��� �����# ����%���"����% �'������%� ^ ���!$������� ���� #���$�������� ����������% ���%���!���������� �"����������$ ��&��$�# ���������%���� ���%�!������$�������� ��$��� �����# ����������� �' ���� ������ `���� ���� ��$��� �����# ����%����� ���� �#�����$� �����% ��$�%�!���� �� #�% ���%��� ���#$������!��% �>_��Managed Care Organizations (MCO) �����$���$��� �����# ������# ��^ ��% ���%��� �%�^ �� �����$� �����% �>_�!�����! "�# ��# ����"��� ��$�%���# ���%�������� #���������'�'$�����������% �������'�����$������������ �'��� ���" ��% #�#�"������% �������!����$���� �!����% ��� �'��� ��"����% ������ #�*�� �����������������*���\�'�������!����� #�����% � �'��� �������^ ��� �����% ��*��������� �������% ������#�������� % ���%��� � # ��^ ��� ���� �� ��� �% � >_� �_%�� �� _���%�� ������ &�� !$�������� ��� �%��� "���� ��� �'��� �� ��� ��^ ��� ���� ������ �������������"��%�����*������!! ����� � �� #�% ���%�'����!����% ��� �'��� ����������� �����^ ����'$��%������ `' ���^ ����$���� �'�����\%� ���' ���!������ #�'������� ��!! � #��������*������ ������� ���%������ ���� ��������������������������� ! �� #����^�# ������������������������#�������������!�_ �^�� ����_����������##������' �����������$����������_ '� �� �����������&�����������% �'���������� �'��^�# ��������������� � ' ���������#���� ���� ����#��% �'���������'����!������ �"��%����% � � �"���� �� ���� ��� �% � ��% �� %��#� �!! ��� �� "�# �� �%��� � �!� % ���%��� � '��^�# ��� ��#� #� �� ���� %�^ � �% � '������� ��� �'��^�# ����������������� � ' ��!��� ����������� �������' ����������� ���� �^ ������������ �!� `��� �"% �����'�� #���������������%������ ^ ������"��� �� ������� ����� ��$���# ��!��% �� �"����>�# �����#������������������ � `' ���^ ���#����'����� ���!������ �� � �^ #��$���# ��% �� �"�������#�!! � ���!������� �� � �^ #�"��%����% �� �"����¥�������� ������ �# #������'�$� �^��$ �����_� � ��� �% � � �� �� �%��� �� �" �����������#���������� �% �'����� �!� ��� �����*�� ��� �� ��'�������� ���������"%��%�!$����������� "%������ ���!�` #�'��� �����������"% � ��% �!����������������������! �� #�����% �'��^�# ���\% �'��^�# ���� � �^ ���!�` #����$����������%���'��� ���' ��� �� ��� ���#� ����!�%�"��$�%���� ����'��^�# #�����% �� �� ��#$������% �' ���#�&!�� ����%��� `' �� #���� ����'��^�# #���% ��'��!������#�����^ �� �����!���� ��%��� `' �� #���� ������^ ����% �#�!! � �� �"����%�^ ����� ������� #�����% ��_$�%���������� � ���� � !�����% �'�� ���� ��$� ��!��% �� ������������!! ������� �����!��$#� ����" ^ ���������� ���$� �!������� ����!�'��^�# ������'����� #�����% ��$�������!���� ���� ������� ������������� ���������\% ���]����%���������� �!� �%��� ��# �� "��� ���� !��" #� # ����� �!� � "��#���� '%��������� !��� ���� ��^���� �# �$�� � ��� � ��� �% ��� '��� �������� ���������� &����% ��"��#��� �% �'%���������%�#� ��� ����$���������� !��� �% �% ���%��$���� �� �!� �% ��� '��� ����� "%��%� ��� ��#���#^����� ��Accountable Care Organizations (ACO) ���$�#� ����� �� ������ �� � "� ^��$ ���� #� ��# �� �!� % ���%��� � ���"�� ��� ����$����� � *�� � �������������� ��*��� "��������#$� #�����% ���^ ��� ��� �%��$�%��% �� #���� �_%�� #�_�^�����������������% �����*� �������_�!���������������*�����'��� ��#��������%��'��������#���% ��% ���%��� �'��^�# ���"%������������ ���� ��$� ��%����% ��%��������������� #���� �'��� ����%�^ ���� ������ �������$��������� �'��^�# #������� !!��� ������� ��&��������� ���� #��%���� #���� �������������������������$���� �'������� �%��� ��^ ����� ������� �� #�~��� ���� ��#���# ��"%��%�^ ��������$� #� ��� �% �'�������#$����� �% ��� �'���� ��� &���##�����������������^ �����$�� ��' �'� �"��%�� ������#��������� ����#����#�������&������� ��!��% ����� �����$�� ���!����$���� �����% �>_���#���^ � #���� ��%���������������� �����������!����@��_���%���� #����������������*��#�!! ���!��������*������% �� �� ��%���������# ���� #�����##� ����% ��%������������!��% ����� ��&������*�������� � ����% �!������������������'����� �" ���% �'��^�# �����#�'�� ������#���##��������������$��'��� ������ � �� #� ���'��^�# ���� ������$������'���� � ������ �^ ��� �% ��*��#� ���������!�� �� �� ����������� �"����!��������% ���� ��% ��� �$�� �_$�%�����# ������ �� ^ #����'��^ � !!��� ������" �������$�������� � �' �������"��%��% ��#^ ����!��% �/����% ���'������� ���!�"%��%������$''�����%�����# ������ �����!�� '�����������!� '%���������� ��� �^ ������� ��#� �������� #� �$���� �� �������� ������ \% � �*�� ��# �� %��� ��$�%�� ��� ^ �� �$���# � �!� �% �� #���� �'�������"��%��% �'��^�� �� ��������$� �����#�'��^�# ��� �� �����������*����' ���������������% ��et al.��������������������� ��� �!� �% � !����� �$��� �� �!� ������ �% � � �� � �� ������ �!� ���� ����^ � '$����� ��#� '��^�� � �*��� ��$%� �� ���� _�$�# ��� ����*� �������������Pay for Performance (P4P) Systems ��� ���� �������� ������� #� '��� ��� ��# �� �$�� ����� ��'� � �� #� ��� �% � ! # ���� ��^ ��� ��� ��� ���� � #���� � '������� �����������% ���%��� �������"��%�$���������'����� ������% ��$�������!���� �����% �����!���� �!������ ���@������� ���@������ ����� � # ^�� #� ��� � ��$� � �% � ' �!������ � �!� �% � '��^�# ��� ������ � � �� #� #�� ������� $����� '� �# !�� #� ��#�������� \% � �� ��$� � ���� �� � $� #� ��� ��� ��� �% �� ��� �% � ������ �!� �% ��� !!��� ���� ��� ��� ��� ���' ���� � �% �� �����#������ �*���" ����\���������� ��' �� ����% ��� �� �� �"��#�� ������ �@�� ��� �� ��^ � �"��� !���� �% � ���#�������� ! �!���� �^�� � ��# �� "%��%���� ���^�� ��'��^�# ���!���'��^�#������������� �^�� �����'������ �"��%�$������� ���#�!����������� !!��� ����_$�%������� ����������� �������$� �� ��� ��� ���� �� � ��� % ���%��� � ������ �$�� ����� � �$���� ��� �� !!��� ��� �� ��� �� � �$��� �!� �^ �$����������� �!� ����� �� ��$�� ��&����� �"��%��% �'��� ���� ����������#'������!��% �� !������% ��@������ ��������!! ������' ���� �� #�'� ^ ���^ ���� �"��%����% �% ���%��� ����� ������ "��#����'��^�# �������% ��������!�%�"�" ����% ����`���� �'� ^ ���^ ���� ������'��^ �% ���%��$���� �� \% � ! �!���� �^�� � ���� ��� ��� �% � ���������� � "��#�� '��^�# ��� !��� � �� ������ '� ^ ���^ � ��� � "%��%� ��� �% �' ���%�$�%���� � !!��� ����%���#������������� ������������"��%����% ����� ������%���'��^�# �������#����'��!���!�����% ���'��� ������#^ �������� �% �"��� ��!!���'��� ��������#������� �% ���� ��% �'��^�# ������'��!������� `��'� ����'��^�# ��"���� ������� ��!���#��� ����'��� ����$!! �����#� ��!���$� ���#�� ����!��% �'��� ��������#���������� '��$�# �����������%��$�%�'� ^ ���^ ���� ��$�%������$��� ��% ������������ �������~�����%�$�%��% ��@������ ���%�"��'����� ����� �� ���������% ���� � �����!��% �'��^�# �����#��% �'��� ������% ��$ ������� ������"% �% �����"����� ���'���!$����#����"%��� `� ������������'��^ �% ���%��$���� ��
� Stephanie�
The 17th International Conference on Electronic Business, Dubai, UAE, December 4-8, 2017 � � � �~~�
Provider-Led Healthcare Networks������������ �#��%���%���� ���''�� �������% �>_�% ���%��� ���#$��������� ��% � ����� ����!��% ��*�����'��^�# ��� #�% ���%��� �� �"�����<���%��'������^ ������������ ���� ����� ������"��%�� #�����'������ ����#������'%���������"%����������!!��#������^ ������/�����#����'���"��%�� �$�������� '�������� �$�� � �������������!�������� �% ���%��� �� �"���������� �������~����� �^ ����% ��������!! ��% ���%�'��������]$����% �"���������$���� ����'��� ��#��������^ ��% ���'��� �����% ��## #�� � !�����!����^ �� �� ���#� ��� � ���� ��$� � � ���%��� � *���$� �� _$�^ ��� ������ \% � � '��^�# �� ���� ��� ���� �$��#� �% ��� �"�� '����� ��� ���$�� � ��� `�������'��������'���� ��"��%���% ���%�'�����/��� ������������ � �$�%� � �"���� ��� _$�� �� � ���%�� �� ����!���'��!��� % ���%��� � '��^�# �� "��%� '� � �� � ��� ����% ��� *���!������� �� ���� ��#���"������ ��!��% ����� ���% ���%��� ����� �������% �>_���������$# ������������#�����$�����% ���%��� �'��^�# ������#�� � ��� ��Ï�������������� ^ �$ ��\% �����������#�����$�����'��^�# ����������� �"������ �� �$�� #����'������$�����'�����! ����%�^ ���� ������_$�� ��� ���%���/���'���!����\% �! # ������� ���^ ���$�� �������^ ���% ��$�����'�����! ����" ^ ���"% ���% ���� ���^ ���� �'%�� #��$����% �% ���%��� �'��^�# ������_$�� ��� ���%���� �"����"����%�^ ����� ����% ��$�����'�������#��$''��������������% ����"��_�� ��!��% � �'��^�# ������ �'������ ��^ ���% ���/���� ��� #�����������%��������% ���'��� ����!������ �������% ����� ������% ��� �#����#���� ���% ���]$�����������% �������_$�� ��� ���%������%���������$���� ������%����!! ���% ���%�'��������������%�� ��!! � #��������� #���� �����������������*���¥������������#���_��%�� �_$�� ��� ���%����������!���'��!������������������������$���� ��������!���'��!�����������##������' �����������$����������_ '� �� ������������Personal Health Records (PHR) ����% �� �$��� ��� ��# �� �%��� ���� � #� ��� ������ ���$�#� �% � ��� � �!� �% � � !���� "��� �% � ���� ��� � ���%� � ���#�� ������ \% ����� '�� �!� ���� ����� #� ��� ���$� � ��� � ��� ��� '����������� �% � � �%������� ��� � ���� '��� ������ �� #� ��� #�!! � ��� !���� �% �'��^�# ����� �� #� ���$� � �!� �% � /���� �_$��� �̂� *%������� ��$���� �� �������� ������ _ ^ ���� ���� ��# ��� � �� #� ��� �% ����� ����% ������������ ��� ��� ��������� � ���%���#��������!��� ���%��$���"%��%����#�� �%�^ ������%�#������ #��$�� �������'�� ��!���#�������������#� �������% #���� ��&� `'�������������� � ���%� `�� #�!�����% �� �^�� ���� �����������Integrated Delivery Systems (IDS) \% � ��� ��������% ��% ���%��� �# ��^ �����# ������'���� ! �� #���������� ���� #�# ��^ ������� ����&=_��"%��%��� � �� ��������^����$�� !������!� ����� ����'���� ��%�'�� ������%��'�������'%��������� ��#� ���$� ������ &=_������ �# ����� #� ��� ��� �"�����!��������������� �%��� ��% �� #�� ����� '��^�# �� ��� ������ �� ��� '��^�# � �� " �������#���� #� ������$$�� �!� ��� � ��� ���� � �� ���� ��# !�� #�'�'$����������#����$� ������$����������!����% �% ���%��$���� ���!��% �'�'$����������%���������������#�!������� �����_%����_���%���������\% �>_�� % ���%��� � ��#$����� ��� `� ���^ ��� !���� �� #� ��#�'�'$��� #�"��%� ��$��� ��� % ���%��� �# ��^ ��� ��# ���\% � ��� ���$#����$�#��������$�%�$'������ ��!��% �#����������# ���� #� ������������������$����������� ��$�� #����������''���$�������#����$��� �����# ������ ��$�� !$��^ �#��������������� ��&\�^ �#��������������!! ������� �� �^�� �����'%���������"%���� ����������� #����$� ��% �/����$��� ^ ��% � ���%�^ �������'���"��%��% �� �����!$��$� ����� ���������# ������ � ������ �!����% �/������ ���^ ��\% � ��&\�^ �#����� �$�� ��% �'%������������� ���� ���������$���"��%��% ���#�"����#�����!�"�� �!�����% ���" ���� ���#��������������������'$� ������% �������$�������������\% �'%��������������%�^ �����%�� ��% ����''����� ������ �#���"��%��% ��&\�^ �#�������% �^ �#�������%�^ �������� �"�������^���$����������� ���� ��� ������ �"%�� ��% �'%����������� �#������% �'��� ����%������ ��������$�'��� � ����%��� �% � ������ �� �% �� �^ ������� ��$���!� #�'%������������ #������% ����$���� �� ��� �&�#���&��� ������ ��% �/���&�� ���^ ���������%���'��^�# #���� ���#���� �����'%������������# ^ ��'������$���� ���"% �% ������������%���� �$�� #����� �����!$��$� ��!��% �/����
*�$&!��$�$���%�#$�%�!�&�<)�\% � ��� � ��$#�� '� � �� #� ��� �%��� '�' �� ��� '���� �!� �� ���� �� ��$#�� ��^ ���������� �% � ��������� �$�� ��� !������� !��� # ^ ��'���� ���$�������� � �% ���%� ������ ��\% � !�^ �� ��� ������$#����� ��$#�����'��� #� �%� �'%�� ����� ���# ^ ��'� ����!����� '�$�����# ���^���#�������!����� '�$�����# ��$�������� ���$#� ����#���������� �������������$� ���'��^�# ����%��%�� ^ ���^ �^� "��!��% �� � ���%�� �%�#�������#�'� #��
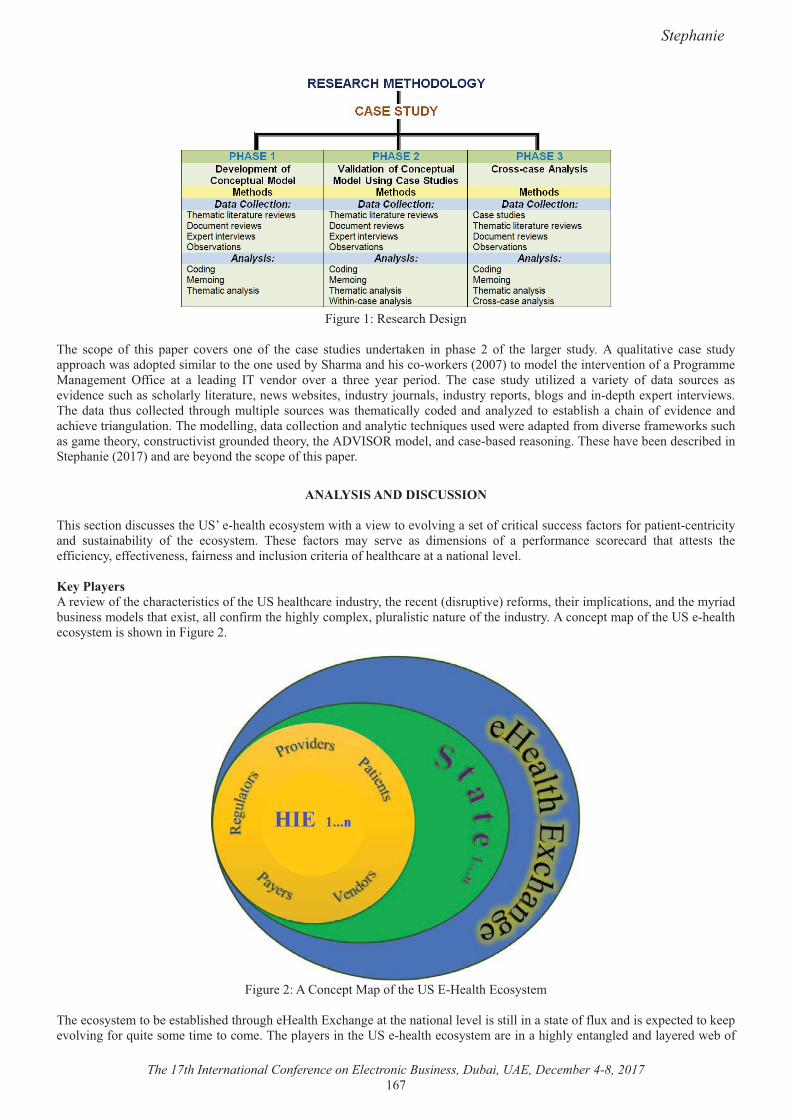
� Stephanie�
The 17th International Conference on Electronic Business, Dubai, UAE, December 4-8, 2017 � � � �~��
����$� ����� � ���%�= �����
�\% � ���' � �!� �%��� '�' �� ��^ ��� �� � �!� �% � ��� � ��$#� �� $�# ���� �� ��� '%�� � �� �!� �% � ���� �� ��$#�� �� �$�������^ � ��� � ��$#���''����%�"����#�'� #�������������% ��� �$� #����_%�������#�%������"��� ���������������# ���% ���� �^ �������!����������� ������ � ��� �!!�� � ��� �� � �#���� &\� ^ �#��� �^ �� �� �%� � � ��� ' ���#� \% � ��� � ��$#�� $����� #� �� ^��� ��� �!� #���� ��$�� �� ��� ^�# �� ��$�%������%���������� ���$� ��� "��" ���� �����#$�����]�$���������#$������ '��������������#����# '�%� `' ������ �^� "��\% �#���� �%$������ �� #� �%��$�%��$���'� � ��$�� ��"��� �% ������������# #���#������� #� ��� �������%����%�����!� ^�# �� ���#���%� ^ �������$�������\% ���# �������#�������� ��������#����������� �%���$ ��$� #�" � ��#�'� #�!����#�^ �� �!��� "������$�%������� ��% �����������$���^�������$�# #��% ������% ��=�&_�����# �����#���� ���� #�� ��������\% � �%�^ �� ��# ����� #����_� '%��� ����������#��� �� ���#��% ����' ��!��%���'�' ���
���&)������!�!���"�������\%���� ������#���$�� ���% �>_�� �% ���%� ������ ��"��%���^� "���� ^��^������� ���!�����������$�� ���!�������!���'��� ���� �����������#� �$������������� �!� �% � ������ �� \% � � !������� ���� � �^ � ��� #�� ������� �!� �� ' �!������ � ���� ���#� �%��� ��� ���� �% � !!��� ����� !! ���^ � ����!���� �����#�����$��������� �����!�% ���%��� ���������������� ^ ���9���' ��������� ^� "��!��% ��%����� ���������!��% �>_�% ���%��� ���#$�������% �� � ����#���$'��^ ��� !�������% �����'�������������#��% ������#��$��� �����# ����%��� `������������!�����% �%��%������'� `��'�$������������$� ��!��% ���#$����������� '����'��!��% �>_� �% ���%� ������ ������%�"��������$� �����
����$� ������*��� '����'��!��% �>_�/�� ���%�/������ ��
�\% � ������ ������ � �������% #��%��$�%� � ���%�/`�%��� �����% ����������� ^ �������������������� ��!�!�$`���#���� `' �� #����� '� ^��^����!����$�� ���� ���� ������� �\% �'��� �������% �>_� �% ���%� ������ ���� ������%��%��� ������ #���#���� � #�" ���!�
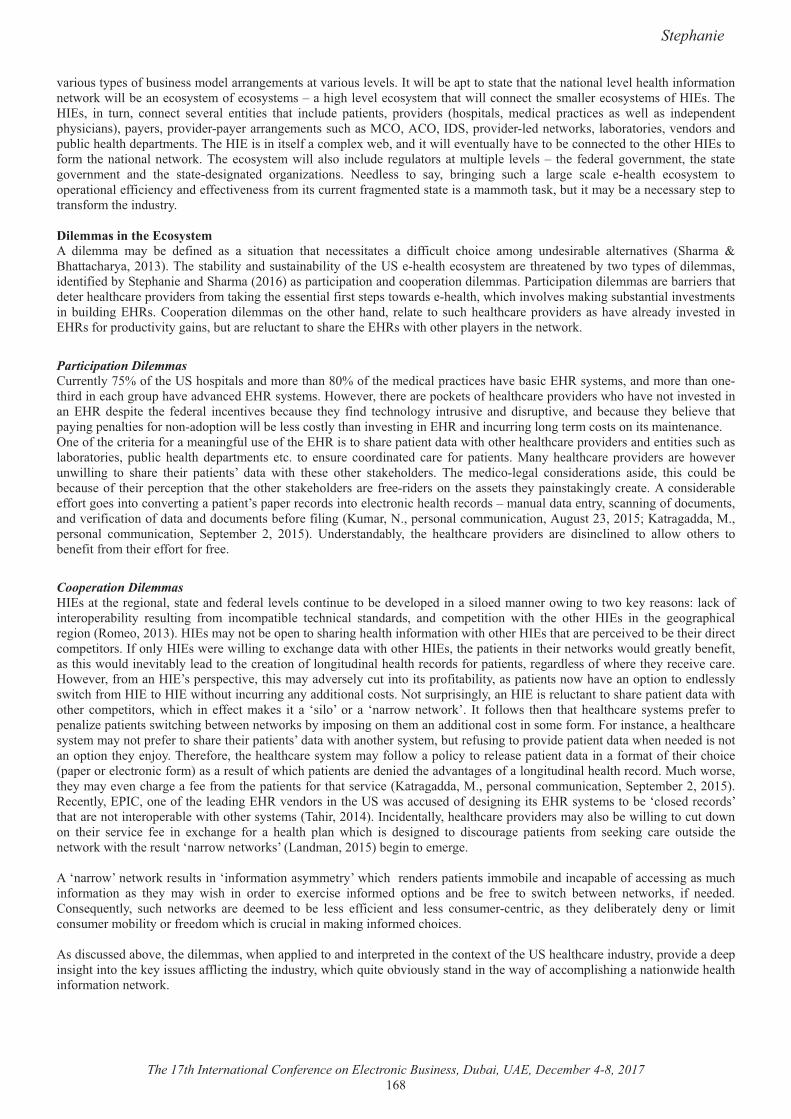
� Stephanie�
The 17th International Conference on Electronic Business, Dubai, UAE, December 4-8, 2017 � � � �~[�
^����$����' ���!��$��� �����# �������� � �������^����$��� ^ ���&��"����� ��'��������� ��%����% ����������� ^ ��% ���%���!���������� �"����"����� ���� ������ ���!� ������ ���¥���%��%�� ^ �� ������ ���%���"�������� ����% ������ �� ������ ����!��&/��\% ��&/��� ��� �$���� ���� ��� � ^ ���� ����� �� �%��� ����$# � '��� ����� '��^�# ��� �%��'������� � #����� '������ �� ��� " ��� ��� ��# ' �# ���'%�����������'�� ����'��^�# ��'�� �������� � �����$�%�����*����*���&=_��'��^�# ��� #�� �"���������������� ���^ �#������#�'$�����% ���%�# '���� ����\% ��&/���������� �!������'� `�" �����#����"���� ^ ��$�����%�^ ����� ����� �� #�����% ���% ���&/�����!�����% ����������� �"����\% � ������ ��"��������� ����$# �� �$�����������$���'� � � ^ ���¥� �% � ! # ������^ ��� ���� �% ����� ���^ ��� ��� ��#� �% � ���� �# ������ #� �������������� � #� ��� ��� ����� ��������� �$�%� �� ���� � ���� � �% ���%� ������ �� ����' ��������� !!��� ������#� !! ���^ � ���!���������$�� ���!���� �� #����� ������������%��������$���������� ���� � �������� '���������!�����% ���#$������!� �����������$����������� #�� ���� ���� � � # !�� #� ��� �� ���$������ �%��� � � ������ �� �� #�!!��$��� �%��� � ������ $�# ������ � ��� �����^ �� �_%����� ��<%�����%������������\% �������������#��$��������������!��% �>_� �% ���%� ������ ���� ��%� �� � #�����"����' ���!�#�� �������# ���!� #����_� '%��� ���#�_%���������~�����'������'��������#����' �������#�� ������������'������#�� ������� ������ ����%���# � ��% ���%��� �'��^�# ���!������������% � �� ������!������� '����"��#�� �% ���%��"%��%���^��^ ����������$������������^ ��� ��������$��#����/����*��' �������#�� �������� �% ���% ��%��#�� � ��� � ����$�%�% ���%��� �'��^�# ������%�^ ���� �#�� ��^ �� #� ���/����!���'��#$���^������������$���� �� �$����������%�� ��% �/����"��%���% ��'��� �������% �� �"�����
Participation Dilemmas *$�� ����������!��% �>_�%��'��������#���� ��%���[����!��% �� #�����'������ ��%�^ �������/������� ������#���� ��%����� ��%��#���� ��%����$'�%�^ ��#^��� #�/������� �����" ^ ����% � ��� �'��� ����!�% ���%��� �'��^�# ���"%��%�^ �������^ �� #������� /���# �'�� � �% � ! # ���� ��� ���^ ��� ��$� � �% �� !��#� � �%������� ����$��^ � ��#�#���$'��^ �� ��#� � ��$� � �% �� � �� ^ � �%���'������' ����� ��!��������#�'�����"����� �� �����������%�����^ ���������/�����#����$������������ ��������������������� ���� ���� ��!��% ����� ����!������ �����!$��$� ��!��% �/����������%�� �'��� ���#����"��%���% ��% ���%��� �'��^�# �����#� ����� ���$�%�������������� ��� '$�����% ���%� # '���� ���� ��� ��� ��$� � ����#���� #� ��� � !��� '��� ���� �����% ���%��� � '��^�# ��� �� �%�" ^ ��$�"������� ��� �%�� � �% ��� '��� ����� #���� "��%� �% � � ��% �� ���� %��# ��� \% � � #����� ���� �����# �������� ���# �� �%��� ��$�#� � �� ��$� ��!� �% ���' �� '������%��� �% ���% ������ %��# ����� �!� ���# �������% ���� ��� �% ��'��������������� �� ��������# ���� � !!������ ����������^ ��������'��� �����'�' ��� ���#������� � ��������% ���%�� ���#��¥����$���#���� ����������������!�#��$� �������#�^ ��!���������!�#������#�#��$� ����� !�� �!��������$��������' �����������$�����������$�$��������������������##������' ������� ����$���������� _ '� �� �� ��� ������ >�# �����#������ �% � % ���%��� � '��^�# ��� �� � #�������� #� ��� ����"� ��% ��� ���� � !���!�����% ��� !!����!���!� ��
Cooperation Dilemmas �&/������% �� ������������ ���#�! # ����� ^ ���������$ ����� �# ^ ��' #���������� #����� ���"��������"��� ��� �������������!���� ��' ��������� � �$������ !���� �����'����� � � �%������ ����#��#��� ��#� ���' ������� "��%� �% � ��% �� �&/�� ��� �% � � ����'%������ ��������� ����������&/����������� ��' ������%������% ���%���!���������"��%���% ���&/���%����� �' �� �^ #����� ��% ���#�� ������' �������&!�������&/��" � �"���������� `�%��� �#����"��%���% ���&/����% �'��� ��������% ���� �"�����"�$�#��� ������ � !��������%���"�$�#��� ^�������� �#�����% ��� �������!�������$#�����% ���%�� ���#��!���'��� ������ ���#� ����!�"% � ��% ��� � �^ ���� ���" ^ ���!��������&/���' ��' ���^ ���%��������#^ �� ����$�����������'��!��������������'��� ������"�%�^ �����'�������� �#� ������"���%�!�����&/�����&/�"��%�$�����$�����������##�������������������$�'��������������&/����� �$����������%�� �'��� ���#����"��%���% �� ���' ��������"%��%� ��� !! ������ �� ��� �� ¢��������� �� ¢�����"�� �"����� &�� !����"�� �% �� �%���% ���%��� � ���� ���'� ! �� ���' ����� �'��� �����"���%����� �" ��� �"����������'����������% ������##������������������� �!��������������� ����% ���%��� ����� ����������'� ! ������%�� ��% ���'��� �����#����"��%�����% ������ ����$��� !$��������'��^�# �'��� ���#����"% ��� # #������������'������% �� �]���\% � !�� ���% �% ���%��� ����� ������!����"���'���������� � �� �'��� ���#���������!�������!��% ����%��� ��'�' ����� � ��������!����������� �$����!�"%��%�'��� ������ �# �� #��% ��#^����� ���!���������$#�����% ���%�� ���#��$�%�"��� ���% ������ ^ ���%��� ���! �!�����% �'��� ����!����%���� �^�� ���������##������' �����������$����������_ '� �� ������������ � ������/�&*���� ��!��% �� �#����/���^ �#��������% �>_�"������$� #��!�# ������������/������� ������� �¢���� #�� ���#����%����� �������� ��' ���� �"��%���% ������ ����\�%�������@��&���# ��������% ���%��� �'��^�# ������������� �"�����������$��#�"����� �% ��� � �^�� � ! � ��� `�%��� � !��� �� % ���%� '���� "%��%� ��� # ���� #� ��� #����$��� � '��� ���� !���� � ����� ��� � �$���# � �% �� �"����"��%��% �� �$���¢�����"�� �"����������#������������ ������� � �� ����¢�����"��� �"����� �$�������¢��!�������������� �����"%��%��� �# ���'��� ����������� ���#�����'��� ��!���� ����������$�%���!��������� ��� �% �� ���� "��%� ��� ��# �� ��� ` ���� � ��!��� #� �'������ ��#� � � !� � ��� �"���%� � �" �� � �"������ �!� � # #�*��� �$ ������ �$�%� � �"����� �� � # � #� ��� � � � ��� !!��� ��� ��#� � ��� ����$� ��� ������� ��� �% �� # ��� ��� ��� # ��� ��� ����������$� ��������������!� #���"%��%������$�����������������!��� #��%��� ������#���$�� #����^ ���% �#�� ������"% ���''�� #������#���� �'� � #�����% ����� `���!��% �>_�% ���%��� ���#$������'��^�# ���# '������%��������% �� �����$ ���!!���������% ���#$������"%��%��$�� ���^��$��������#�����% �"����!������'���%������������"�# �% ���%���!���������� �"������

� Stephanie�
The 17th International Conference on Electronic Business, Dubai, UAE, December 4-8, 2017 � � � �~��
������ ���������*����������������� ��'������������$�%� ���$����������
�%���!����"���������� !�#���$�������!���� �� ���� �#���������# �����% � `' ������� �^� " #��!�����������������#��$����������% �>_� �% ���%� ������ ����\% �� � !��������$����!�����'����������% �$� ��!��% �/���"���� ^ ��$������$�" ��%��$�# ���!��% ���^ ��� �������% �/������#��% � �$�� �$ ��� ����� ���� � ������ ��� ������� \% � /��� �'�" ��� �% � %��'������ ��#� '%��������� ��� '��^�#���� ��� ��� ��� ������ �� #� % ���%��� � ������ �� �%��$�%� "%��%� �% �� ���� ����� !$��% �� �����%��� ����� #�� �� �� ��#� �$� ��� � �#���� ��� �� ��� � !! ���^ ���#�� �� ������#���� #���� �<���% ���� �� �����!$��$� ����� ������� ������ �� ���������%�' #���% �% ���%��� �'��^�# ���"����%�^ ���%� ^ #� !!��� ��� �� �%��� �������� � ��� ���� �� #� ��������"%��%�� ��� �$����"�$�#�% �'���^ �� �% ���/�������� ���� ������������������������% ���%������$������% �/���"�$�#�% �'�� #$� ��% �� ���%��!�����''����� ���'��������!����@�����$� �����������$� ����%$����^������'%����������^��$��� ���� �\% ���� ���^ #���$�#�� �$� #�!������ �'��� �������$����������"%��%�����$���% �'�� � � ��� � ��� � � ^ �$ �� ��� �^ ��� � ���� '���� �!� ��� ������ �� ����� `'��#�� �% � � �"���� ��#� �% � ���� �� !��� �% �% ���%��� �'��^�# �����#��' ���#�����!���� "��$��� ����''���$���� ���_���� ��� #�����'������ ���!� ��!��#�/�����^ ��� ���� !����##�������#� �% � !�� � ]���� ���� ��% ���%��� �� �"�����"%��%�%�^ ���� �#����# ��% ���^ ��� ����������$�����'�����! ���% ��������� ����% �/�����#�� � !���!��������$� ����#��% ������� ��^ ���% ����$���������� ��������������! �!�����% ���'��� �����%����% �'��� ����� ������ �$��������� �'�" �� �������� �� ���"����#���� ����% ����"��/�������$�������" �������% ������������# ��# �"%���% ���%�� ��% ���!���������"��%����^�� � ���$� ���%�^ � �% �'�" �� ��� ����� � �% ���%��#�'��������������� ������#��������#�'������!��� ��� �%��$�%����' ��������� �%������������������"%����% �! # ������^ ��� ���#� ���%��$�%��% �/���&�� ���^ ���������&��� �$�����% ������� !!��� ��� ���%���"����% �'��% ��# � �����#�'� ^ ���!��$#��"��� ���#���$� ����% ���%��� �'��^�# ����"%��%�����$���"�$�#�� �$�������$������������^�����!����% ���^ ���% �������$��� � ���# ^ ��'� ������� �/���!�������� #� �^�������� �������!�� � !���������$� ���"%��'����$�%�� ���!����% ���% ���%�'����%��# ���� �^�������%���"%����% ������%�^ ����'���!����% ���!�� ����!�� �����$���������"��%��% ���'%�������������� �������������'��������� ����#��^���� �% ���%���������������%����% ���'��^�# ���%�^ �/������%���"�$�#��� ^�������� �#�����% ��� ������ �!� �� ������$#����� % ���%� � ���#�"%��%� "���� � � $���$���$�� ��#�'������ ��!� �� ����� '��� ����%�^ � �% � ���%�� ���# ���#���� ��� ��� ��!���������"%��%���� �% ����"����#�!���"%��%� �% ��'������"����!�����$��������! ����%��� ��!��� ���� � ������������!�� #��������� ����\% ���^ ��� ����! # ����������� ���������#�� ���!������������!�'��� ���#�������������^ ��� ����"� #����� �����#���������% ��$���#�����!��% �������� ����% ���%���!���������\% �¢����#������%$�����$�$��� #������ �$� #����������!���!���$������� !! ���^ �% ���%� '����� ��� �$�� ����� !��� # ^ ��'���� ����� "������� ��#� �#^������ � �%�������� � �#���� ��� ��� �^ ����� ��'��^ � ��� ���'�'$������� % ���%� �^����������� �!� ���� #���� ���� ����� !��� �� ���������� ��#� ��!��������� �''���$���� �� "%��%� �% � '%����� $���������'��� ������$� ����!��#��$� ����#���� ����$��� �����&��^� "��!� �% ������^ � ���� ���!�#���� �$�%��� ���� ������%�^ � ����������#�� �� ���$#���� #����$��������$�#�� ���# ������ ��'�����"%��%�������%�� �%����������#� ������������! ����� ����%�$�%��% � ��� ������]���'��� ���"%���� ��$�� �����$������% ����$#�� �%����������^ ���% � `'�� ��������� ����"%��%�% ���%���!���������������"�����������%��%������ ����%������� �����% ���%������ ��������������% ���%���!�������������� ���������$#�&���% �� ���!$�$� ��% ����$#�� �%�������"����� ������� ��������'�� ����!� �% ���%�'������������� ^ ����!�� ����!� �% ���%�# ' �#�����% � ^��$������!��% �� �%�������!����% ������ ��������������" ^ ����% � ��� ���������� �������$��%�"��% �� �%����������� ��$� �� �$�������#����!�# ����������!�%��%���� �����^ �% ���%���!������������%�$�%� ����'������ �%������ ����$�#�% �'�������� ��$�%����� ��������%��������'��������"����� �� ���%����% ���^ ��� ������$������ �'�����������!����% �� �$�������#����!�# ����������!��% � �% ���%� ������ �������# ��������������'$��������!�# �� �¥��������� ���"%��� �% ���^ ��� ���%���� ��#�����!��� �% ����������!������������� �����'��^����������% ��=&*��� # ����= '�����&��$���� �*��'���������������# ' �# ����� ����"%��%����$� ��# '��������#����������!���������������$��������� ��$� �����$� ��'��� �������
����&"��������� �����!$�������!���������%�������� �$# #��% �>_�% ���%��� ���#$�����'���������������$����!��% �������$ #�#��� ����������% � '��������� � �# ��%�'� ��#� �% � ��% �� � �� ���� %��# ��� ���$�� ¢%�"�� �$�%� �� �����!��������� ��$�#� � � ���$�%�� ���$�� _ ^ ����� !����� %�^ � � �� '��'�� #� ��� �% � '����� �%�$�%� ���%���� �$���������� � ��� ��� %�^ � � �� �����'���% #� �� "��%� �% � '������ � `� '������!��"�����#������ !��������% ��&\/*�������!��������#��% ����� ������� ��������#��!!��#��� �*�� �������*����!������ ���%�$�%� ��� ��� ���� ����� ��� �����$# � �!� �% � � � !����� %�^ � �$�� # #� ��#�� ��� "%��� � ��$� �� �% �� %�^ � � ^ ��% � ���� �$�� #������� ��" '�����%��� ������% �>_�% ���%��� ���#$����������#���' ���&�� ��� ���#� �%���� ���'�� #� �����% �� # ^ ��' #� ��$���� ��� �% � >_�% ���%��� � ���� �� %��� � �� ������� ����� $�# �' �!������� ���� ��$� ���!�% ���%��$���� ���=�^���et al.�����@������� `' ����%�^ � `'� �� #��% �^� "��%�����#�������������!�'��� ���% ���%�� ���#�������� #�"��%���� !! ���^ �$� ��!���!���������� �%�������"�$�#�����������"�������������������% ��'��������% ���%��� ������� ��#� �% � # � ���������� �$������ �!� ��� � �%��� '���$ � �% � >_� % ���%��� � ��#$����� �<��#��'�#%���� et al.�� ������ \% ���^ ��� ��� �% � !�� �# ��# #� �%��� ���� � !�����!� �% �% ���%��� � ��#$����� �%�$�#����$������ ����"��%� �������%���������������� ^ �� % ���%� ��!��������� � �%������� ��!�����$��$� � \%��� � �$�� #� ��� �% � �� ������ �!� �% � /��� &�� ���^ � �������� "%��%� ���
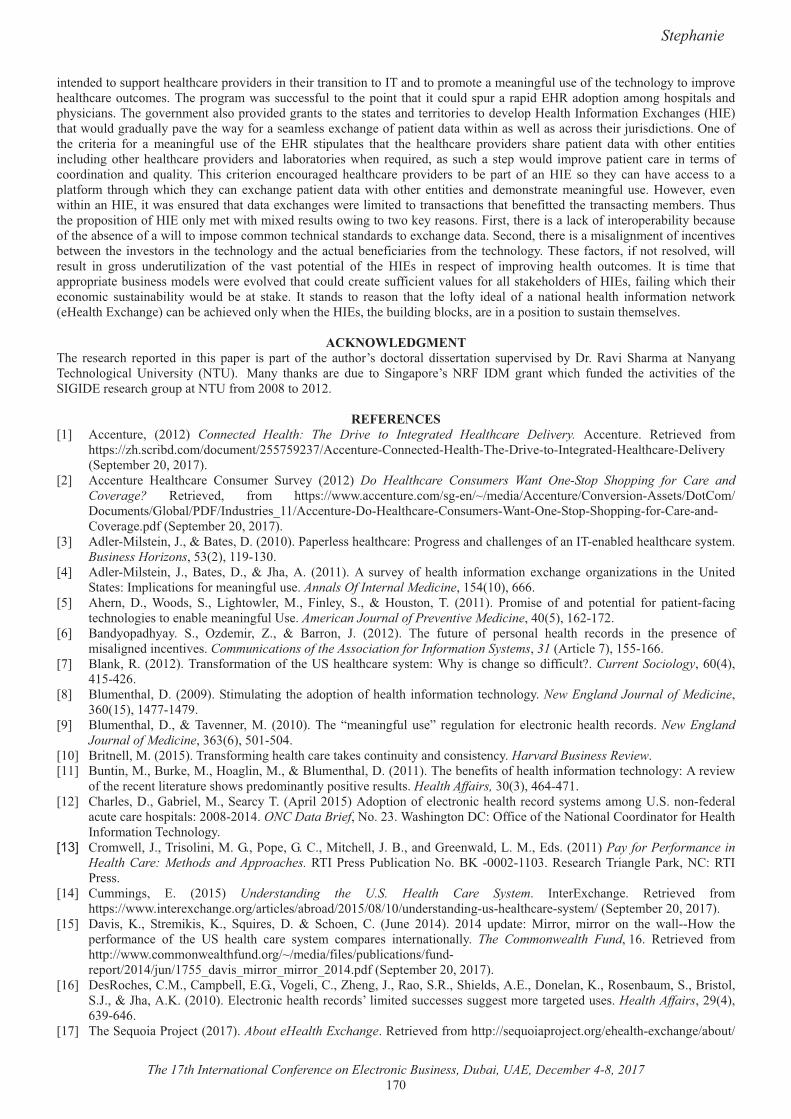
� Stephanie�
The 17th International Conference on Electronic Business, Dubai, UAE, December 4-8, 2017 � � � ����
��� �# #�����$''����% ���%��� �'��^�# �������% �����������������&\���#����'����� ���� �����!$��$� ��!��% �� �%������������'��^ �% ���%��� ��$���� ��\% �'�������"����$�� ��!$�� ��� �% �'����� �%��������$�#��'$������'�#�/����#�'�����������%��'��������#�'%���������\% ���^ ��� ��������'��^�# #������������% ����� ����#�� ������� �����# ^ ��'�� ���%�&�!���������/`�%��� ����&/���%���"�$�#����#$�����'�^ ��% �"���!������ ��� ��� `�%��� ��!�'��� ���#����"��%������" ��������������% ���]$���#���������� ��!��% � ���� ���� !��� �� � �����!$�� $� � �!� �% � /��� ���'$��� �� �%��� �% � % ���%��� � '��^�# ��� �%�� � '��� ��� #���� "��%� ��% �� ����� ������$#������% ��% ���%��� �'��^�# ��� ��#� ���������� ��"% �� � �$�� #�� ��� �$�%� �� �� '�"�$�#� ��'��^ �'��� ��� ��� � ��� � �����!�����#�������� ��#� �$������ \%��� ���� ����� ���$��� #� % ���%��� �'��^�# ��� ���� �'���� �!� ����&/� ��� �% �� ����%�^ � ��� ��� ��� ��'���!���� �%��$�%�"%��%� �% ������ `�%��� �'��� ���#����"��%���% �� ����� �� ��#�# �������� �� �����!$��$� ���" ^ ��� ^ ��"��%�������&/�����"��� ��$� #��%���#���� `�%��� ��" � ������ #������������������%���� � !��� #��% �������������� �� ���\%$���% �'��'���������!��&/������� ��"��%���` #�� �$�����"��������"��� ��� ��������������% � ������������!���� ��' ���������� ��$� ��!��% ���� �� ��!���"���������'�� ��������� �%����������#��#����� `�%��� �#����_ ���#���% � ��������������� ����!���� ���^ ��� �" ���% ���^ ����������% �� �%���������#��% ����$���� � !������ ��!�����% �� �%�������\% � �!�������� �!������ ���^ #��"����� �$��� ��� ������ $�# �$����������� �!� �% � ^���� '�� ������ �!� �% � �&/�� ��� � �' ��� �!� ��'��^���� % ���%� �$���� �� &�� ��� ��� � �%����''��'���� ��$��� �����# ���" � � ^��^ #��%�����$�#��� �� ��$!!��� ���^��$ ��!����������� %��# ����!��&/���!�������"%��%��% ��� �������� �$������������� "�$�#� � � ��� ���� � &�� ����#�� ��� � ����� �%��� �% � ��!��� �# ��� �!� �� ��������� % ���%� ��!��������� � �"����� � ���%�/`�%��� ������� ���%� ^ #������"% ���% ��&/����% ��$��#�������������� ������'������������$�������% �� �^ ���
��9��;&$!<#$���\% � � � ���%� � '��� #� ��� �%��� '�' �� ��� '���� �!� �% � �$�%����� #�������� #��� �������� �$' �^�� #����=�� ��^�� _%����� ��� ��������\ �%���������� >��^ ������ ��\>��� ����� �%����� �� � #$ � ��� _����'�� ��� ���� &=�� ������ "%��%� !$�# #� �% � ����^��� �� �!� �% �_&�&=/�� � ���%����$'�����\>�!�������[����������
�$*$�$��$��£�¤� ��� ��$� �� ������� Connected Health: The Drive to Integrated Healthcare Delivery.� ��� ��$� � � ��� ^ #� !����
%��'��¡¡�%�����#���¡#��$� ��¡���������¡��� ��$� �*��� �� #�� ���%�\% �=��^ ����&�� ���� #�� ���%��� �= ��^ ����_ '� �� ������������
£�¤� ��� ��$� � � ���%��� � *���$� �� _$�^ �� ������� Do Healthcare Consumers Want One-Stop Shopping for Care and Coverage? � ��� ^ #�� !���� %��'��¡¡"""��� ��$� ���¡��� �¡¸¡� #��¡��� ��$� ¡*��^ ��������� ��¡=��*��¡�=��$� ���¡������¡�=�¡&�#$���� ����¡��� ��$� �=��� ���%��� �*���$� ���������� �_��'�_%�''����!���*�� ���#�*�^ ��� '#!��_ '� �� ������������
£�¤� �#� ������� ����}����<�� ���=����������' �� ���% ���%��� ������� �����#��%��� �� ���!����&\� ���� #�% ���%��� ����� ��Business Horizons������������������
£@¤� �#� ������� ���� }�� <�� ��� =�� �� }%��� �� ������� �� �$�^ �� �!� % ���%� ��!��������� `�%��� � �������������� ��� �% � >��� #�_��� ���&�'����������!���� �����!$��$� �Annals Of Internal Medicine����@������~~~��
£�¤� �% ���� =�� ���#��� _�� ���%��"� ��� ��� ���� ��� _�� �� ��$������ \� ������� ������ � �!� ��#� '�� ������ !��� '��� ���!������� �%������ ����� ���� �� �����!$��>� �American Journal of Preventive Medicine��@�������~�������
£~¤� <��#��'�#%���� _�� ��# ����� ��� �� <������� }� ������� \% � !$�$� � �!� ' ������� % ���%� � ���#�� ��� �% � '� � �� � �!��������� #���� ���^ ��Communications of the Association for Information Systems��31�������� ����������~~�
£�¤� <�������� �������\����!����������!� �% �>_�% ���%��� ����� ����%������%��� ����#�!!��$��¨�Current Sociology��~��@���@���@�~�
£[¤� <�$� ��%����=��������_���$��������% ��#�'������!�% ���%���!���������� �%�������New England Journal of Medicine���~��������@����@���
£�¤� <�$� ��%����=����\�^ �� ����� �������\% ��� �����!$��$� �� � �$������� !��� � ��������% ���%� � ���#��New England Journal of Medicine���~��~���������@�
£��¤� <���� �������������\����!�������% ���%���� ���� ��������$������#�������� ����Harvard Business Review�£��¤� <$���������<$�� �������������������<�$� ��%����=��������\% �� � !�����!�% ���%���!���������� �%����������� ^� "�
�!��% �� � ������ ���$� ��%�"��'� #����������'�����^ �� �$����Health Affairs,��������@~@�@����£��¤� *%��� ���=������� ������_ �����\���'�����������#�'������!� � ��������% ���%�� ���#����� ���������>_�����! # ����
��$� ���� �%��'����������[����@�ONC Data Brief�����������%�������=*���!!�� ��!��% ����������*���#�������!���� ���%�&�!���������\ �%�������
����� *���" ����}��\�����������������' ����*������% ����}�<����#��� �"��#�������/#���������Pay for Performance in Health Care: Methods and Approaches.��\&��� ����$�������������<�������������� � ���%�\������ ��������*���\&��� ���
£�@¤� *$�������� /� ������� Understanding the U.S. Health Care System� &�� �/`�%��� � � ��� ^ #� !����%��'��¡¡"""��� � `�%��� ���¡������ �¡�����#¡����¡�[¡��¡$�# �����#����$��% ���%��� ����� �¡��_ '� �� ������������
£��¤� =�^���� ��� _�� ������� ��� _�$�� ��� =� �� _�%� ��� *� �}$� � ���@�� ���@� $'#�� �� �������� ������� ��� �% � "�������"� �% �' �!������ � �!� �% � >_� % ���%� ��� � ���� �� ���'�� �� ��� ������������ The Commonwealth Fund���~� � ��� ^ #� !����%��'�¡¡"""������" ���%!$�#���¡¸¡� #��¡!�� �¡'$����������¡!$�#�� '���¡���@¡]$�¡�����#�^��������������������@'#!��_ '� �� ������������
£�~¤� = ����% ���*���*��'� ����/������ ����*���% ����}�������_���_%� �#����/��=�� ����������� ���$���_��<��������_}����}%�������������/� ��������% ���%�� ���#�������� #��$�� �� ���$�� ������ ����� � #�$� ��Health Affairs�����@���~���~@~��
£��¤� \% �_ �$�������] ����������About�eHealth Exchange�� ��� ^ #�!����%��'�¡¡� �$���'��] �����¡ % ���%� `�%��� ¡���$�¡�
� Stephanie�
The 17th International Conference on Electronic Business, Dubai, UAE, December 4-8, 2017 � � � ����
�_ '� �� ������������£�[¤� /��� ��� �� ������� ��$��%���� �� '��^�# �� � #� % ���%� '���¨� BDC� Insighs� � ��� ^ #� !����
%��'�¡¡"""�#��#^��������¡"'����� ��¡$'���#�¡����¡�[¡��$��%���������^�# ��� #�� ���%�����'#!� �_ '� �� �� ����������
£��¤� ���% ���/����*� �����������_�!�����=��������<$��#�����% �'��%��������$����� ���� �New England Journal of Medicine���~���~����@@���@@��
£��¤� �� �������_��*$�� ���_=����*���� �����< �� ���/�����<�����#��=}��������\% �!�����������#����!����������������!���'� � ������ � ��������% ���%�� ���#�����'���������� �'������ ��Health Affairs���������@[��@[��
£��¤� ��������������� ������������< ���#���'�����������"�� "�'��� ��� `' ��� ����� �����!��#��% �©�" ���'��©�������$����!������'��^�# �����#�'�� ���� ���Health Affairs�����������������[��
£��¤� ������� �� ������� ����$����� � ��� � ��������������� ��� � ������ �$�� #�!! � ��� Times.com�� � ��� ^ #� !����%��'�¡¡"""����� ����¡����¡��¡��¡$'�%��¡����$����� ���� ������������������ �%�����$��#�!! � ��%���¨��º�� �_ '� ��� ������������
£��¤� �$�%����������@��*�����$����>_�% ���%���� �JAMA�����������������£�@¤� ������� � ���%� ��� �^������ ����~�� *�$����� ����������� World Health Organization�� �^������ � ���
%��'�¡¡""""%����¡�%�¡��$���� �¡ ��¡�����}��$�������[��£��¤� ���#����%��}��������� ���%�� !�������'������������� #��Health Affairs����������@���@~�£�~¤� ������#����/��<��� ���*��<�$�% ������_'�%���������%���� ������������*��� ��������!��������������'��^ �% ���%�
Health Affairs����������[@��[[�£��¤� � ���%&\�� ̂� ������� Meaningful Use Criteria and How to Attain Meaningful Use of EHRs� � ��� ^ #� !����
%��'��¡¡"""% ���%����^¡'��^�# ���'��! ��������¡%�"��������� �����!$��$� ��������%�������£�[¤� � ������ ������������� ���%��� �� !������#�������'����������!����% �>_� �������Business Horizons������������������£��¤� &�� ���������_��� ��*�������%�������*�$��� ���}����������' ��^ ��$�� � ��������� #������ ���#���\% � !! �����!���� ���
���'%��������©�# �����������$� ����'� `���!���������� �%������ ��Decision Sciences��@�����������@���£��¤� ��������� <�� ������� =�� �� ���� �$�� ��� _� ������� \% � ����#���� � ^��$����� ��� % ���%��� �� ��� � ������� ^��$ � ��#�
����^������ ������ ��*��'���� � ��� ^ #� !����%��'�¡¡"""������ ����¡�����%��¡% ���%����� �����#�� �^�� �¡�% �����#����� ^��$��������$��% ���%���� ��_ '� �� ������������
£��¤� ��������� �� *� �����%� ���@�� � �#���� �� � ���%� !��#�� � #����� �����$'���� ����$���� !��� ��]������ �!� ' ������������$'��� �� NerdWallet� � ��� ^ #� !���� %��'�¡¡"""� �#"��� ����¡����¡% ���%¡���������� #����������¡� �#"��� ��% ���%���$#�� ������ ���~����������� �������~�����$��� �� #���������������¡��_ '� �� ������������
£��¤� ���#����� }��� ������������"�� �"����� ��#�% ���%��� ����' �������Healthcare Financial Management��~��@���������@�
£��¤� ���� �� ���}����������&/����������!����&��Forecast 2010: Hospitals���' ��������$ ��!�Health Management Technology.�� ��� ^ #�!����%��'�¡¡"""@% ���%���� �%���¡ ����¡������¡� ��$�� �¡��# `%����_ '� �� ������������
£�@¤� �������� =� ������� >_� % ���%� ��� �� _' �#���� �� ����� � ������ �% � � ���� CNBC�� � ��� ^ #� !����%��'�¡¡"""�������¡����¡��¡�[¡$��% ���%���� ��' �#�������%��%�� �$������ ����������#%�����_ '� �� ������������
£��¤� ��*����� /� ����@�� �&/� �� �� ��^ � "��%� � ���%� `�%��� � Healthcare IT News.� � ��� ^ #� !����%��'�¡¡"""% ���%��� ��� "����¡� "�¡%� ��� ����^ � % ���%� `�%��� ��_ '� �� ������������
£�~¤� ��*���%������������>_�% ���%��� ��' �#����"����� ��%������!��=��������@�������� '����BMJ��%@��@��£��¤� ��� ����\��������*����#�����������!��% ���� ����������� � ��#����������� ���Journal of Health Services Research &
Policy�����������������£�[¤� � ���% ���������*���$���\��������< � !������#�#��"�������!� � ��������% ���%�� ���#����� ���Risk Management and
Healthcare Policy��4��@������£��¤� � ��� ��� \�� ��/$���%�� �� ��������� �# �����'��� ���� ���� #� �''����%� !��� ���������� �% ���%� �$��� �����# ��� Health
Policy and Technology�����������[��£@�¤� ������� ����������~������!���' �!������ ����� ���� "��#�#���������#�'��^�# ��� !��� !!��� ����About.com Health,
� ��� ^ #�!����%��'�¡¡% ���%���$���� ���$����¡�#¡!���¡!¡'@'%����_ '� �� ������������£@�¤� ��� ��&&&��������% �����=��=��� ���/��� ��� ��<��_�#�!!��=�������%��$����_��������\% ����������!�% ���%���� ����
�% �>��� #�_��� ��JAMA�������[�����@���£@�¤� �$%� �� ���� =�� _�$�# ���� ��� �� ��*� ������ �� ������� ���"�%� �!� �*��� ��#� ��� �����^ � '��� ��� ��# ��� ��� �����
Health Affairs.�� ��� ^ #�!����%��'�¡¡% ���%�!!�������¡����¡����¡�~¡�[¡���"�%��!��������#���� �����^ �'��� �����# ����������¡��_ '� �� ������������
£@�¤� �������� � ������ ����~�� �����*�� � Health Insurance Exchange.� � ��� ^ #� !���� %��'�¡¡�������� !�������¡��������� �% ���%����$���� � `�%��� ¡��_ '� �� ������������
£@@¤� \% � �!!�� � �!� �% � ��������� *���#������� ������� � �� �% � !����� ���$�� _��� � � ���%� &�!��������� /`�%��� � �������.�� ��� ^ #� !���� %��'��¡¡"""% ���%����^¡��� �¡# !�$��¡!�� �¡� ���% �!��������$������ �%� �'��������'#!� �_ '� �� �� ����������
£@�¤� ������!!�� }� /�� �� \��� ��� �� �� ������� �� '������ !��� �% � ��'���� �!� % ���%��� � � !���� ���$����� ��� '��� ������ ���'��� �� ������ ������$�� ���Healthcare Executive���������~~�~��
£@~¤� �Ð$���&�=��_�$��$���=����&���!�������_��������� �Ñ �����= % � ����*�������� ������������������/�������� � ������ #�����' �/�����#�/���~�~�Journal of Medical Systems�����@����[�������
£@�¤� ��� ��������~��/���&�� ���^ ���������_���$��� '����}��$�������~��&\/*�����" ����� �����!$��>� ��/���HIPAA
� Stephanie�
The 17th International Conference on Electronic Business, Dubai, UAE, December 4-8, 2017 � � � ����
News� � ��� ^ #� !���� %��'�¡¡"""%�� �%���" ��� �¡ %����� ���^ �'�����������$��� '����]��$�������~¡� �_ '� �� �� ����������
£@[¤� ��� ���}��������*��� ����% �=����Journal of AHIMA/American Health Information Management Association��[@��������~�
£@�¤� ��$� �� �� ����@�� �%��� ��� �&\/*�� ���� �� ���%� &�!��������� \ �%������� !��� /�������� ��#� *�������� � ���%� ����¨�= !�������� !���� �%��&����� SearchHealthIT� � ��� ^ #� !���� %��'�¡¡� ���%% ���%��� �%���� ����¡# !�������¡�&\/*�������_ '� �� ������������
£��¤� _ ���%� ���%&\� ������� _��� � �&/� ����� !���� �% � �&\/*�� ���� � ��� ^ #� !���� %��'�¡¡� ���%% ���%���� �%���� ����¡��'¡_��� ��&/������!�����% ��&\/*�������_ '� �� ������������
£��¤� _ ��������� ��� ������� ��� � ��$����� ��� �� ������� ��$�� �� ������� _� '�� ��"��#�� �� #������� % ���%� ������ �� Journal of Biomedical Informatics,�@@�@���~���~�~�
£��¤� _%��!�� ����}��������������������<�$�%� ������������*�����������$ �����>_�% ���%���� �JAMA�������[�����@����@~�£��¤� _%������ �_�� �� <%�����%������ _� ������� ���"� #� � #�� ����� "��%��� ��������������� � ���$������ !���� ��� � �% ����
Knowledge-Based Systems��45�����������£�@¤� _%������ �� _�� _�##��$��� ��� _%������ ��� _���%�� ��� �$����� ��� ��$�%���� _�� �� <�� �] �� _� ������� � ^ �������
���"� #� ������ � ���!������"�%������� ���$#���!�\��������$�������� �^�� ��Journal of Information Technology Case and Application Research����@������~���
£��¤� ������� � �$����� ������� /��� �#�'����� ��� ��� ��� �$���� � ������ Practice Fusion� � ��� ^ #� !����%��'�¡¡"""'������ !$�������¡����¡ %���#�'�������� �¡��_ '� �� ������������
£�~¤� _%��������_���%��=��������Major characteristics of US health care delivery. Essentials of the US health care system.�_$#�$��������}�� ����#�<���� ����$����% ���������
£��¤� _���%�� }�� ��� #������ *� �������� ���%� ���$���� � ��^ ��� � ��� �% � >��� #� _��� ��� ���@�>_� * ��$�� <$� �$�� *$�� �����'$������� � '������ �~������� ���%�������� =*�� >_� ��^ ��� ��� ��������� �!!�� � � ��� ^ #� !����%��'��¡¡"""� ��$���^¡�������¡'$����������¡����¡# ��¡�~�����%�����_ '� �� ������������
£�[¤� _�$�� ���=���� ��# ������ *� ������� >_�% ���%� ��� � !���� �� ������� ' ��' ���^ �� �' �#�����$� � �!� � �^�� ��� '��� ��� ��#�% ���%���������$���� ��Issue brief (Commonwealth Fund)��15�������
£��¤� _� '%��� �� �� ������� ��# ������ #������� ��#� ^��$ � !��"�� ��� �% ���%��=�������� #��� ��������� �������� \ �%����������>��^ �������_����'�� ��
£~�¤� _� '%��� �������_%�������_�����~��� ���%���������$#����# �����#�������!��"�������� �% ���%� ������ ��Journal of Advances in Management Sciences & Information System��2�������
£~�¤� _$��� �̂����*%�������=����$����*������������������@��/^��$������!��� "����!���' �������% ���%�� ���#����������!��� ���%��$���^������� �� ���%�&������ #������!��% �43rd Hawaii International Conference on System Science �'�������&///��&*__����"�����>_���}��$������[�
£~�¤� \�%���� =� ����@�� /'��� _��� ��� ! ����� % ��� �^ �� ��� ��' ��������� Modern Healthcare� � ��� ^ #� !����%��'�¡¡"""��# ��% ���%��� ���¡������ ¡���@����¡�/�_¡�������@���_ '� �� ������������
£~�¤� \��#��� ��� ����� /�� �� _�%��� �� _� ������� /������ �% � �#�'����� ��#� $� � �!� � �������� % ���%� � ���#�� ��� ������ '������ ��Health Affairs�����@���~~[�~����
£~@¤� ^�������$�������^���� � �����]� ���}/����]���#�������� ����#����*��� �#��`���������_ �# ���/�����������%���$��� �����# ����������$���������% �# ^ ��'� ����!� � ���%�� �%������ ��Journal of Medical Internet Research�����@��� ��@�
£~�¤� ���������������������A Prospective Analysis of the Future of the US�Healthcare Industry. �%�� ���' ��_ �� ���* �� ���!�=�������\����!����������>*�&�^�� �
£~~¤� ���� ���� }� ����~�� �� � '��^�# ��� #� % ���%� ��� � � �"����� ���� ���� ��� !���¨� Health Affairs.� � ��� ^ #� !����%��'�¡¡% ���%�!!�������¡����¡���~¡��¡��¡�� �'��^�# ��� #�% ���%���� �� �"����������������!���¡��_ '� �� ������������
���
�$���}����%���}����������� #��������% ������ �����$� ��'$��%�� � � %�^���� $����� �$����!� #� ^��$��� '� ! � �� �� &�Proceedings of The 17th International Conference on Electronic Business �''� �����[��� &*/<�� =$����� >�/��= � �� ��@�[�
Yu & Ahn
�
The 17th International Conference on Electronic Business, Dubai, UAE, December 4-8, 2017 ����
'�������������#��� ����������'����������>���������H��������@��� �'����������
���$��]�����$����&_\��_�$�%���� ����� ��#��{�$��� ������������}� ��� ����%�|����&_\��_�$�%���� ���]�%�{�$��� ������������
����������
���������� �����$� ������ ���# ����������$���% �'��#$���������'����� ���#�\% �# ������������������% ������ � �^����� �������$� ���!��� ���%������!������!��% �# ����'�\%���'�' ����������%����% �# ������������������% ������ ��%�''�������%��%���# ' �#��������% �'��#$�����!�������'� ��������#��% ���^��$���'� ! � �� �<��'� #��������% �%$������^��$���'� ! � �� ���� #�����% ����� �'��� ��������# ���!�' �� �^ #������!$�� �����#�' �� �^ #�^��$������'� `������%�����$#��� �� #����_�����'��%���# ��!����^��$���'� ! � �� ��������$� ������������������#�'$��%�� ���� ������^����� ���#�� �# �������# ����������%��% ��������� #������������ `' ��� ����" ��$��������� #��$��'� #����������� �'� ! � �� ���# ���$��% �����'����!������ ���#������� #�������������'��'�� #����^���#�� ��% ������$�����!��$����# ��"��%��% ���� �������� ��%�''�������'������� ��
Keywords�����$���'� ! � �� ����������'� ����������#$����������������&��� �'��� �������*����!$�� �������$������'� `��������������������������|*��� �'��#�����$�%����
�����!"������&���% � ����������� ��$����" � �� � #��% ���!������������� ������#�������"��%��% �@�%���#$�������� ^��$������%������$�# �"����" ���^ ������� ���"% � �����#��������� ������� #�= �'�� ��% ���$�#������!����������" ��� ���$�����������$������"% � �" ��%�$�#���^ �$'���� ��!��$��'� ���$��^��$ ��/^ ��� !�� ��% ����'$� ���" � ������#$� #��������������� ������ �"�������'���%���������� �� ���_����� '� #��� #� �%��� ' �'� ��� ��� ������ "�$�#� �����!�������� # �� �� � "% �� �% �� ��� ��� ��� ���% �� ��!��������� ��� ��� ���!���������� ��� ���^������ ���% �# ���������� ������� ������� ��� ��'��� �����#�' �'� ��� �!��� #������� �#�!!��$����%��� ��&�# #��%���'� #�������� ������%�^ �� ��� ���� #���������� ���� #��%��$�%��% ��#^ �� � !! �����!���!����������^ ����#�����% ������ ���#������ � �^����� ����_�%"���������@��&�������$������"% � ���� �������������� #�������' �'� �#������%�^ ������%��� ��$������ ������ �������������^ �!�������"% ���% ����� ���# ��������\% � ����� � �%�''���� ����� `' �� �� �� �� � ��� `��'� � �!� # �������������� �%��� # ' �#�� �$�%� ��� �% � !����� ��'� ������� ������������^ � � � ����$�%�� � ���%�%���� �����#$�� #�����% �!�������'� ������&����#���� ��!�$�#��%���' �'� � ^��$�� ��% ���!�������'� ������������������ ���#������ ����������� ^��$����$#� ��%�^ �������%�"���%��������� ���@������������������ ���# ���������� #� ��� �% � !����� ��'� ������ ����% �� et al�� ������� �$�� �% � � �� !���� �%��� ���� ��$#� �� �%�� � ��� �%��� �% � !����� ��'� ������ ���'� �# � ���� #�!������%����' ���#��!���� � ���� ���%����% �' �'� �$�# �����#��"%������� �����%��$�%��% � � ��&��!�������^ ���%��%����� �������%���� ��!�$�#�� �" ��'� ! � �� � ^��$�������!����% �" ���� ��!� ��̂ � "�������!������ ����#�!������ ���\����������etal�����@��&����% ��"��#���" � ^��$�� � �% �'��#$��� ������'����� ���#��%��$�%��% � � ����$�� ^ ���!��� �������� ������^ ��� �%��� ^��$������#� �������%��� � ������&��� �����%���" ����������^ ������ ���# ��������� ���#� ����!�"% �% �����������#��� !�� �" �� ���� �"%���" �%�^ �� ������" �� ����� #� ���� ���� ^ ����� � ���% ��%�^ ���� #��%���������$��� �� ����"��� ������# ������% �!�����%�������$� ������ �# ��������!��� ���%��$�%�# �� �� #���� ������"% �����!������!������'$� ������������ ���� ��_%�''������������ ���� �������!! �������$� ����'$��%�� �# ������������%�"����#�!! � ���'��#$���'��� ����� ���# ' �#�������"% �% ���% ���� ��%�''���������# ����'����'$� ������%�''��������������'%�� ����� `��'� ����� �= '������%�� ��$��#������� ������$''�� ����!! �������� ��$���� ���'��#$����"��%��$�%�%��% ��'��� ��%��$�%��% ���'��#$���#��'����'�� ���������et al�����@��<$��� �� ��$� ��%�������� ���� ��$� �' �'� �'���� ������ ����������% ������ ���� �����% ���%�������% �# ����'���� ���"%��%��!� ��� �$���������'$���^ ��$������&���%���"�������!������!��% ������ ��������� ���� ���" � ^��$�� ���'��#$��������!��� ��'�� ����#��% �!�������!�!�������'� ������'����������'���������� �����% �'��� ����%����������$� ���% �!�������'� �������!�'��#$����% �¨��%��%�^������ ����� �$��# ��# ��$������"��%��������� !�^��$��� `' �� �� ¨���������'� �����������$�����^��$��� `' �� �� ��$����� #��� �# ��������������# ' �#��% �^��������$�� ���$���^ �' �� '��������������� ������������$#� ��%�^ ���� �'� #� ������^ � �% ����� ����!� �%���� �$���$�����^����$�����#���' �'%������'%�����" ���� ���=�����et al�����~��= ���� ����� �� ��� ���������� �� �� �et al���������
&��$���"�$��$@�$;�% ��$������\% �%���� !! ��������� '� � �����^ ��������^ �������% �����%���� ! ����������������# �$�� ���! � �� �����$��$����"��! ��$� ���!������] ���"��%��������! "�'� � ���!���!������������"�������'��������$��!���� ������\%�������% �!��������� '��'$����% #����/#"��#�\%���#�� ��\%���#�� �����������$�� ���!���$#� ��%�^ � `'��� #��% ����� ������� �" ��!�������'� ��������#�%���� !! �������%��

Yu & Ahn
The 17th International Conference on Electronic Business, Dubai, UAE, December 4-8, 2017 ��@�
��@~��*������������� �#�������*�����������������&��'���%��������% �%���� !! ���� ! ��������#�^�#$�����!�������'� ������!������������' �!������ � ^��$���������#��������������� ����� #�����% �����$� ���������$# ���"��#����' ��!���'��#$�������% ����� `���!�����#� ���� � ^��$������ ������� ����� !� �#� &�# #�� ���%���� �� !�$�#� �%���� ��% ���� ^��$�������!���'��#$������ #����^��$�����!���������%�����'��!�$�#� !! �������% �' �� �^ #�$� !$�� ����!��% �'��#$����_��# � �� ����}$ �� ���������� ��� #���$#� ��%�^ ��%�"���%���� ��% ��������� �$��!$��'��#$������ �' �� �^ #�������������$� !$������#����#�et al��������� �� �� ���< ���� ������������$������������� ��� #��� �����#����#���������'������$������\% �'������� !! ��������������������^ �������% �����������������% �%���� !! ���\% ��% �����$�� �����%����% ���!������������ #�����% �!�������'� ������%����������� ����!�$ �� �����% ��^ �������'� ������!����������%�����!����������"%��%���������� #���� ���������������^�����������$��^ #����� � � ������@����^���#��������� ���������\% �'������� !! ���� ! �������% �� �����'���������!���!��������� !! ����"%��%����� �� �%��� �% ���' �����!� ��!��������� �%����� �'� � �� #���� �% �� ���������'����������#���� �% � �#��� � ������!�����������!��� ���' �������������%�����!����������� � ��� ������ �����������������������#�_%�!!����������������_%�!!�������~[��\%����% �������������� ���"��%��% ���� ������# �� � ����% �����"%��%��$�� �����%����% ���##� �'�����!��% �������!�� ���� ���� �� ���� #���������" ����� ����'�� #�����% � ���� ����'�������������� ����� � �������!�����������������������&�� '���%������� �% � �% ���� �!� ���� `�� !! ��� `� �#�� �% � '� ^��$���� � ����� #� �% ���� �!� '������� !! ��� \%��� �% ���� ��� �����%������!���]$#�� ����$������% �����������'� � �� #���!���������� � �����%������� ! ������������ `���%���� �^ ��������$�# ��� �!���'��� ������� "���!�����������#����� ���%���' �'� �� � �^ ���!�������������% ����"������ `���������������^���������\%����% ���� ���� `'����� �% � !���� �%��� �% � # ��� #� ��!��������� ��� ����^ ��� � ������ #� "%�� � �% � $�"��� #� ��!��������� ���� �� ���������^ �#�������� �"��%�'� ^��$������ `��\% ��^ ��������� `��������"� #� ����$��$� ���� #�����% �'���� `' �� �� ����������� ! �� #�����������% ��������% �����# ����� �������#��%�����% ����% �������� `'������% �!$�#�� ������ �����"%��' �'� ���� �#�!! � ���^��$ �]$#�� �������$���% ���� �����$�$���<� " ����\� � ������[���&�������^��$���%����% � ^��$�������!������] �������#�!! ��!����' ��������' ������ ��$� ���������� #�����% ����"����% ������% ���%��������] ���^ ���#����$��� � ^��$�������!��% ���] �����` ���#�������������%� ����^ � ����� #��% ��� ���������# ����� ��% �'���%�������!��% �����$� ��"%��"��������� ���% � `' �� #� � �$���� �%��$�%� ��� #��� � ��#� �������^ � ^��$������ �!� �% � !����� ��'� ������� "%��%� ���� � � ��� �'� � #� !���� �% �' ��' ���^ ��% � `' ��������% ���������� �������������(����#��� �\�� `'����� �% � ������������ �!� ' �'� ��� !����� ��'� ������ ��#� �% ��� ����$�'����� � %�^������ �%��� ��$#�� �#�'��� �% �_���$�$������������ �'��� �_��������# ��� �"��� #����'��^ ��%����% �!�������'� �������!�'��#$��������$������ ����!! ����% ������ �����$� �������������������'$��%������� %�^������\% � _���$�$������������ �'��� � �_������ ��# �� ��� �% � `'������� �!� �% � ��������� _���$�$��� �'��� � �_���� ��# �� �%��������# ���� %�^�������' ��' ���^ �\%�����# ����^ ������ ���� ����������% ���� ��!� �% �����������%����������������� �� #��� �� #����������%����% � `� ����� �^����� �����!�����������$��� ��% ������������#��% �����������%������ '����$�%�����$���'��#$� ���% �!������ ��������%��$�%��% ���� �����'��� ����_%�^ ����_�������������&���% ���# �������$�$�����������������%���������#$� ������� ���% ��%$���� �������\% ��$ ���!��$�%�����$�����������$# ���������� � � ���� �!� ������ ��� # ������ �$�� ����� �%�� � �!� !������� �� �$����� ���%������ ��� �'������ ������ � ��� ��������� �� ������� ������_'��� �� ���et al�����~��\% �� `��� #������������������ !� �����% ���� ��������� ���!��% � ���������!��% ��!! �� #�' ������%��$�%� `� ���������$���� � �����������%$���� ����������$��������%�$�%�����#�^��$ ������� �'� � �� #���� �% ���<����������[~��\% �!������� '��� �'��� ������% �� �$����!� `� ���������$�����#��% ���� �������� �'� ��������!��% �����������"%��%���������$# ����%�%$����� %�^������� �'��� ����#������$#������%��� ���_%�^ ����_�������������\%$����% �_���$�$������������ �'��� ���# �������� #�����% ����$�'������%����% �����$�$���_��!�����% � `� ����� �^����� ����!! ������' ���������� ����� ������������� ������"%��%������ �$������� �������������� ��''����%�����^��#��� ���$�� �������������[��������$��� � ���%���� �'���%�^ ���� #����������% � �����$�$������������ �'��� ���# �������% �'$��%������� %�^������������ #�"��%��% � ����$� ���� �������� ��� �% � ���$��� �%�''���� '��� ��� ��� � " � $� #� ��� �%��� ��$#��� � ^ ���� '� ^��$�� ��$#� �� �������$�$������������ �'��� ���# ���$� #��% ��������< ������et al����[�����#�^��$���# ������/����$�et al��������������_%��������������������$���\% � !�� ������%�����$#���# ����� � � ������$�%����������!��������#�^��$������'� `�����%�������!�����% �!�������'� ������� " � � $� #� ��� �% � `� ����� �^����� ��� ����$��� !��� �% �$� �� �!� �� !������� !����� ��'� ������ �%��$�%� �% � ��� �����'��� ���� ����� � ����$� ��� � �'��# #� "��%� � %�^������ ��� �����$#����� �%��� �� "%��%� ��� ��� �����#��� � "��%�_���$�$������������ �'��� ���# ���'��>��������������^ ���% �� ���������� !!�����%�^ �� ��$�# ���� ����� `�������% �� ��% ���� � � �����!����� �����̂ ����$������ �'��� ������!� �#��= ���� �� ��#� � �� ��� ��� !��� `��'� �� %�^ � �%�"�� �%��� �% � ���'$��������� � �%�#�� �!� � ��% ����� ��� #� ��� �% � �'���������'������������'� `��������������#�����������!��% �'%������'%���� �^ ���������������% ����$���'� ! � �� ��!����% �'%������'%���% �� ^��$�� ������ ��=�����et al�����~��&^������#�_��%��%�^ ������� #��%���%$���� `' ����������$�������!��% �^��$����'' ����!�" ���� ���� ���������"��%��% ���'��'�� #����'� #���������'$���������&^����et al��������\% � �'� #�����������$# ��!���������� ����
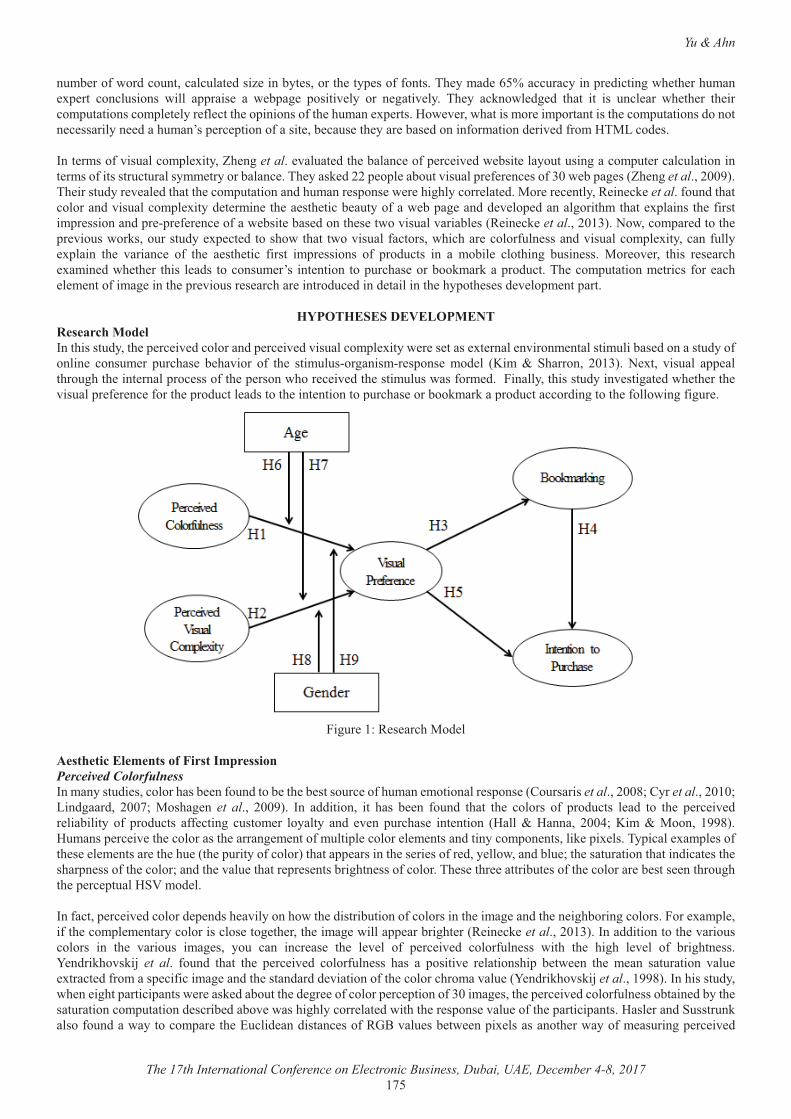
Yu & Ahn
The 17th International Conference on Electronic Business, Dubai, UAE, December 4-8, 2017 ����
�$�� ���!�"��#���$��������$��� #���� ������� �������% ���' ���!�!�����\% ����# �~������$��������'� #�������"% �% ��%$���� `' ��� �����$������ "���� �''���� � �� " �'�� � '�����^ ��� ��� � ����^ ��� \% �� �����"� #� #� �%��� ��� ��� $��� ��� "% �% �� �% ������'$�����������'� � ���� !� ����% ��'��������!��% �%$���� `' ������" ^ ���"%��������� ���'�����������% ����'$��������#������� � ��������� #���%$������' �� '������!������ ��� ��$� ��% ���� ���� #������!���������# ��^ #�!�����\�����# ����&��� �����!�^��$������'� `������% ���et al� ^��$�� #��% ������� ��!�' �� �^ #�" ���� �����$��$����������'$� ������$����������� �����!��������$��$�������� ������������� �\% ����� #����' �'� ����$��^��$���'� ! � �� ���!����" ��'�� ����% ���et al��������\% �����$#��� ^ �� #��%����% ����'$���������#�%$����� �'��� �" � �%��%������� ��� #���� �� � ������� �� �� �et al�!�$�#��%�����������#�^��$������'� `����# � ���� ��% �� ��% ����� �$����!���" ��'�� ���#�# ^ ��' #�����������%���%��� `'�������% �!�������'� ��������#�'� �'� ! � �� ��!���" ���� ���� #�����% � ��"��^��$���^������ ���� �� �� �et al����������"�����'�� #�����% �'� ^��$��"�������$����$#�� `' �� #�����%�"��%����"��^��$���!��������"%��%��� ������!$�� �����#�^��$������'� `���������!$���� `'����� �% � ^������ � �!� �% � � ��% ���� !����� ��'� ������� �!� '��#$���� ��� �� ����� � ����%���� �$��� ��� ��� �^ ��� �%��� � � ���%� `���� #�"% �% �� �%��� � �#�� �������$� ���� ��� ������ ���'$��%�� ���������������'��#$���\% ����'$�������� ������!��� ��%� � � ����!����� �����% �'� ^��$��� � ���%��� ������#$� #����# ���������% �%�'��% � ��# ^ ��'� ���'�����
%)'��%$�$��!$@$&�'#$�����������#��� �&���%�����$#����% �' �� �^ #���������#�' �� �^ #�^��$������'� `����" � �� ����� `� ����� �^����� ���������$������ #��������$#���!������ � ����$� �� '$��%�� � � %�^���� �!� �% � ����$�$������������ �'��� � ��# �� ����� �� _%������� ������ � `��� ^��$��� �'' ����%��$�%��% ���� �����'��� ����!��% �' �����"%��� � �^ #��% �����$�$��"���!��� #������������%�����$#����^ ������ #�"% �% ���% �^��$���'� ! � �� �!����% �'��#$���� �#������% ���� ���������'$��%�� ���������������'��#$��������#��������% �!����"����!��$� �
����$� ����� � ���%���# ��
�����������$ ���������*�������(�������Perceived Colorfulness &���������$#� ���������%���� ��!�$�#����� ��% �� �����$�� ��!�%$���� ���������� �'��� ��*�$�������et al�����[��*���et al�����������#����#�� ������ ���%�� �� et al�� ������ &�� �##������� ��� %��� � �� !�$�#� �%��� �% � ������� �!� '��#$���� � �#� ��� �% � ' �� �^ #�� ���������� �!� '��#$���� �!! ������ �$���� �� �������� ��#� ^ �� '$��%�� � ��� ������ ������ �� ������� ���@�� ���� �� ������ ���[���$�����' �� �^ ��% �����������% ������� � ����!��$���'� ������� � � ������#���������'�� �������� �'�` ���\�'����� `��'� ���!��% � � � � ������ ��% �%$ ���% �'$������!���������%����'' ��������% �� �� ���!�� #��� ���"����#���$ ���% ����$��������%�����#���� ���% ��%��'� ����!��% ����������#��% �^��$ ��%���� '� � ��������%�� ����!�������\% � ��%� �������$� ���!��% ��������� �� ���� ���%��$�%��% �' �� '�$����_����# ���&��!�����' �� �^ #�������# ' �#��% �^�������%�"��% �#������$������!������������% ����� ���#��% �� ��%������������������ `��'� ���!��% ����'� � ������������������� ���� �% ����% ����� �"�����'' �������%� ���� �� �� �et al��������&���##����������% �^����$��������� ��� �% � ^����$�� ���� ��� ��$� ���� ���� �� � �% � � ^ �� �!� ' �� �^ #� �����!$�� ��� "��%� �% � %��%� � ^ �� �!� ����%�� ���� �#���%�^���]� et al� !�$�#� �%��� �% � ' �� �^ #� �����!$�� ��� %��� �� '�����^ � � �������%�'� � �" �� �% � � ��� ���$������� ^��$ � `����� #�!�������' ��!������� ���#��% �����#��#�# ^��������!��% ��������%�����^��$ ��� �#���%�^���]�et al�����[��&��%�����$#���"% �� ��%��'������'�����" � ���� #����$���% �# �� ��!�������' �� '������!�������� ����% �' �� �^ #������!$�� ��������� #�����% ����$����������'$�������# ����� #����^ �"���%��%������� ��� #�"��%��% �� �'��� �^��$ ��!��% �'������'��������� ����#�_$����$��������!�$�#���"���������'�� ��% �/$���# ���#������ ���!���<�^��$ ��� �" ��'�` ����������% ��"����!�� ��$�����' �� �^ #�
Yu & Ahn
The 17th International Conference on Electronic Business, Dubai, UAE, December 4-8, 2017 ��~�
�����!$�� �������� ����_$ ����$����������&���% ������ ���% ����� #���� `' ��� ���'������'��������$���% �' �� �^ #��������!�[@����� ����#����!��� #��%����% ����� �������� �" ���% ����'$� ��� ��$� � ���� �$�����#��% �� �'��� �^��$ ����^ ���%��%�������#���������� ���$#� ��������!$��'%������'%���� �� � ������� ���# #����'� ��$���� ��_���������~��&���##�������� ^ ������$#� ��%�^ �� '��� #��%����% �� ��% ����'� ! � �� ��!�^��$���' �� '��������%��% ������% �' �� �^ #������!$�� ���� ^ ���!����� ������ �� ������������et al������������ ����_$ ����$���������������%��et al��������\% � !�� ���% �!�����%�'��% ����"���# ��^ #���� #�����% ����^ ���� ���$� �� ^� "���H1: The perceived colorfulness will be positively related with the visual preference. �Perceived Visual Complexity ���� ���# ����!�� � ���%�%���� �����#$�� #��������������% ���������$��������% �^��$������'� `�����%��������!! ���^��$���'� ! � �� �����%����#�$�et al�����[�����#���������%������~���% ���et al��������\$�%�et al��������<�$ ������#���$�'���� #��$���%����% ����'� `�����!�������������'�� �������" �'�� ������������������ ��% ���� ^��$���������#�� � ���%�%����%�"���%�������$� ������% ��!�^�����# ��� �̂ ��$������'� `�����<�$ ��������$�����[��� ���� ��et al�����~��\%������������� ���"��%�< ���� ©���% �����%�����# ��� �� ^ ���!����'� `����!��� ���'�����^ ���'��������^��$��� `��� � ����"% � �����^ �����"����^ ���%��%�� ^ ���!����'� `����� �#����������'���������"�� ^ ������$��������< ���� �����@�������#�������%����% ������% � ���������^ �� #�>��%�' #�� �������%�'�� �" ��� ��% ���� ^��$��������#�^��$������'� `�����"%��%�� �����%���%��%���#���"����'� `�����$����� �� ���'� ! �� #��%����� ���# ��� ����'� `�����$�������% ���% ��%��#��\$�%�et al�!�$�#�����^ ������ ����^ ���� ���� �������%�'�� �" ��̂ ��$������'� `������#�� ��% ����'� ! � �� ��\$�%�et al��������\% �����$#���%�" #��%���'������'�����%�#����$�%�"��� �!�������'� �������!����� ��"��%�%��% ��� ^ ����!�^��$������'� `�������'�� #������" ��� ^ ����!�^��$������'� `������\% �� ����^ ���������^ ������ `' ��� ������ �$����� �" ���%���^��$������'� `������#�� ��% ����'� ! � �� ����� ����� � ������������"��� ������"%��%����'�� ���������� ���'%������'%������ '� � ���%$������' �� �^ #�^��$������'� `���������#����������#�����#����[~���' �'� �! ����� ����'� `���������!������������������# �� ����#���� ���������� ������������������'������!�^� "����� �%�����et al� `���� #�^����$�� � � ������$�%���������������%�� ������� ����#��%�' ���������$��� ��% ���$�� ����#����'� `�����!��% ���'������ �%�����et al��������&��'�����$������% ��!�$�#��%���^��$�����' �� '���� ���$�� ������ �� ��"% ����'��%�^ ������� ��$�� ���!�����������"% ���% �#������ �!������ ��������������% ��������%�����"�# �#������$���������� �#�!! � �� ����%$ ���&���##�������� ^ ������$#� ��%�^ ��$�� �� #��%���' �� �^ #�̂ ��$������'� `��������� ��''��`���� #�����% �'�` �����'�` ��� `�$� ����#������$������!����������#����%�"�!�� ���������'������ ����#�^�# �������� ����������� �� � � �����%�������� ��� �����#������$��% #��<�$ ��������$�����[��<$���et al��������&^����et al���������������% ����% ���et al�#�^�# #��% ����� ������������'� � ���!�� ^ ����$�����$��������$�#��� �# ���'��������� �%�#�������'�� �%�"��$�%���!������������������� #������ �" ���� ���� ����% ��� et al�� ������ \% � ��������� �%�" #� �%��� ���� �� � �� �� #� ����� ��� � �$�#��� � !���� ���� �'' ��� ��� � � �$�%� ��� ����'� `���#�� ������ �� ���'��! �����������'�� #�������� ��"��%������ ���$�� ���\% � !�� ������$����$#����% ��$�� ���!��$�#��� �# ���'��������� �^ ��"��������$� #����� ��$� �^��$������'� `����&���##�������^��$������'� `����������� ���� ��� #�����% ������� � ����!���!����������<$���et al��������&���%�����$#���" �# �������� #��% �� �������%�'�� �" ��^��$������'� `������#�^��$���'� ! � �� ��%��$�%��% ����� ����������� ����#�� �����������$� #����� ��$� �� ��% ���� � � �������� �������������^ ���# ��<�� #�����% ����^ ���� ���$� �!��#�������% �� ^ ���!�' �� �^ #�^��$������'� `����"��� `' �� #����%�^ ���� ����^ � !! ������^��$���'� ! � �� �\% � !�� ��" �# ^ ��' #��% �!����"����%�'��% �����H2: The perceived visual complexity will be negatively related to the visual preference.
@��� �'�������������^��^����������������'�������Consumer Behavior according to the Visual Preference \% �����$� �������������������##�������!�^���� ����������� ���#������ ��%�''�����!! �����$����' �����!$�����������"������$���������������%�"���$��'� ! � �� �!�����'��#$�������##���������$��������!�!�^���� ���� �����'��#$����\%���� �%���������������������% ���� �� ������������!�^���� ������ ������$��� �\% ����� '���!��% �"��%�������"%��%������ ����#����� ��% ������������������% �'��#$����������������%���� ��!�$�#����� ���!$��������!��% �" ���%�''���������!����% �'$�'�� ��!��������������#������������!������������� �����������*��� ����$�������� ������������%�����������&���##�������� ^ ������$#� ��%�^ ��# ���!� #��% � ������$���������������^������$������%�''�������������&�� �� ���%�''����>���������������^���������$��������!����% �'$�'�� ��!��������������#����������% ��� ����!���� � ������# ����� #����^ �\%�������$# ��!$��% ������^������ ��������"�#�"�� �% � ���' � ��#� ^��$�� � ��!��������� ��� �� %��% �� � ^ �� &�� �% � ��$#���!� *��� � ��#� �$�������� ���$����������� ����^������ "��� !�$�#� ��� %�^ � �� '�����^ � !! ��� ��� �%�''���� ����� $� � �*��� � �� �$�������� ��� ������ _��� � �%���$���������������^�������"%��%� ������������� �% �'������� � �� ��� ��� !��#� �% �� ������������ � ��#$� #������ ���'� ! � �� ��!� �% �'��#$����%��%�^��$���'� ! � �� ���� `' �� #����%�^ ���'�����^ � !! �������%�''���������$��� ��&��� �����!�!$�������������������!�^���� �������� �� ���������� � ���%��%�" #��%����% �'� ! � �� �!�����'�����$����" ���� ���#���� ��%�"���� � �������% �" ���� ������$�� �������%������%�����'�����^ � !! �������% �� ^����������� ��������������$��������&���##����������%���� %��� ��$#�� ����� !�$�#� �%��� �% � ��� ������ ��� � ^����� �% � ��� � ���� �� �� �% � ��� ������ ��� ���������� ��� �%��� !�������� �% � ��� ©��'� ! � �� ��%�^ ���'�����^ ���#������!������ !! �������% ���� �������������������% ���� �
Yu & Ahn
The 17th International Conference on Electronic Business, Dubai, UAE, December 4-8, 2017 ����
��##���������������% ���� ��!�����$� ������������������% ����^ ��������� ���$�#�'� � # ����$���'$��%�� ��������� ��%�''����\% � !�� ���% �̂ ��$���'� ! � �� �!����% �'��#$���'%������'%��"����� �#�����% �'� ! � �� �!����% �'��#$���#$ �����% �%���� !! ������#��$�%�'��#$���'� ! � �� ��'' �������� �#�����% �� ���'$��%�� ��\%���#�� ����������� �^ ��������#���������� � ���%���������% �^����$��'��#$���������$� ������� �������% �� ��% �����'' ����!��% �'��#$�����#�'�������������! ��$� ���������� �� ��% �����$� ��������������"��#���%���'��#$����"%��%�� �#������% �'$��%�� ���� ������������������[��<�� #�����% ����^ ���� ���$� �� �$������% �!����"����%�'��% � ��" � �#��"���H3: The visual preference will be positively related to the consumer’s bookmarking H4: The visual preference will be positively related to the consumer’s purchase intention �Bookmarking as a Mediator ���� ����� #����^ ���� ��!��% ����� ������� ����!����%�� �"%���$���������������� ���#������ � �^����� ��������% ����^ ��������� ��"%��%����#�� ������ ��� #�����% ����^ �������!����%�'' ��������$� ����� ��� �/���� �� ©�� $��� ����� � ���%�_�����������%�"� �%��� "���#"�# � '$��%�� � ���^ ������ ��� �� " � � ���� ��� �% � �%��#� �$��� �� �!� ���~�� ��#� �% � �##��������� ��� �� "%��%����� �'��#������% ��$�� ���!��� �������% ��%�''������������'�� #�����% �'��#$���# �����'�� �^� "��"���[�������% ���� ��$��� �������%���� ����������� ��%�'��' ��������� ������������"�����������$��%�"��% ������#��^ �������$� ����� �� ���!�����������^��^����� ���%�!���'��#$��������� �������!���!������������#����'�������"��%���% ��'��#$����������!�"%��%�� �#����!�����'$��%�� �&�# #���������$#� ��%�^ ��%�"���%�������� ��%�''������#������ �'$��%�������� �#�!! � �����������\% ����������^������!���$���������� ��%�''��������% �'%������������^ �� �� ��!������ ������� ����^������% ����� �#�� ��������%����_"������%�������@��_ �# ��et al�����������!������ ��������������������!������ �����������������&���##�������� � ���� � ���%�%����%�"��������!� ^�# �� �!����% �� �������%�'�� �" ��% #�����!��������!������ ������$� ���$�%����]�����#���� ���� �� !����#����$�������� �'$��%�������<��#� ���������% �������[��>�����������!��������� ���� ���'�������!���!�����'$��%�� ���� �^ ��������#�������*��� ���#��$�������� ��"%��%�^ �� ����$#������%�''���������$� ���% �!� �$ �����!�'$��%�� ����� �� ������% �!� �$ �����!��%�''���������$��� ����� �� ���*��� ����$�������� ���������<�� #�����% ���� ���$� �!��#�������% �!����"����%�'��% � ����$�#�� �# ��^ #��H5: Consumers’ bookmarking will be positively related to their purchase intention and has a mediating effect on the relation between the visual preference and the purchase intention �Age as a Moderator &��������$���^ �����%�����%����% ��� ��!���' ��������� ��� #�����% �' �� '������!���������#��% ���!���������'��� �������������� #�"��%�^��$��� ���'� `���� &���� � ��� #� ��$#���_��������#$�� #����$ ��������� � ��$#����� �% �������'� ! � �� ��!� �% �' �'� � �����������$���� �������$#����}�'����_����'�� ����#���% ����$���� ���_���������~��\% �� �$�����!��% ��$ ��������� ��%�" #��%����% ��� ���#�� �# ���!��% �'������'���������% � `' ��� ��������$'�%�#��������!������ !! ������������'� ! � �� �&���##��������������$#� ��%�^ ���#���� #��%����� �����������!������^������ �����% ��������^ �'��� �����#�'� ! � �� �!����������!��������*%��#�et al����~[��=������������������%������� ������@���������<� #�������_���������~���������% �' ��' ���^ ��!�^��$������'� `������ ^ ������$#� ��%�^ ��%�"���%����% ���� ����'� `��% �'��� ������^��$�����!�����������% ��� �� ���% � !! ����!��� �_������ ^�# �� ��$�� �����%���^��$������'� `���������%��� �"��%��� ����� ����et al�!�$�#��%�����# ������������" � ���� ��$�� '���� ����^��$���#���$����� ���%���%�#������ �� ����^ � !! ������#��^����������������� ����et al�����~��\% �!����"����%�'��% � ������� �# ��^ #�!�����% ���� ���$� �� ^� "���H6: Age will moderate the effect of perceived colorfulness on visual preference. Specifically, the effect of perceived colorfulnesson visual preference will be stronger for young people than for old people. H7: Age will moderate the effect of perceived visual complexity on visual preference. Specifically, the effect of perceived visual complexity on visual preference will be stronger for old people than for young people. �Gender as a Moderator _��!�����������$#� ��%�^ ��$�� �� #�� �# ��#�!! � �� ������% �# ��������������'��� ������%�$�%������� � ���% ��%�^ ��%�"���%���#�!! � ���'� ! � �� ��!���' �� �^ #������!$�� �����#�' �� �^ #�������#������$�����# ' �#����� �# ����$��� �����������������_��^ ��et al����[[��_�����"����et al�����@�������%���'� � �����$#���" �"������������!���� �# ��"% ����� �������% � !! ����!��% �# �� ��!�' �� �^ #������!$�� ������^��$���'� ! � �� �� ��$� �� �# ��'� ! � �� ��!���������^�������������$���� ����#��$��$� ���_�����"����et al�����@��������% #������������� �^ �������% ���� ��!�' �� �^ #�^��$������'� `������ � ���� ^����#���% �"�����!�$�#���� �# ��#�!! � �� ����'��� ��������#�� !��������!����������� � ���� ^������% �"�� ���������&���% �����$#���"�� ��'��� �� #���� ���!������������'�� #����� ����#�� !�� #��% ���� '� #���!���������� �� ���"%��%�� �����%����% ������������� '���� ���������!�"�� �©��^��$������'� `������ �%��% ���%����%����!�� ��\%������������ �"��%��% �!��#������%���"�� ��� � ������ ���� �����##����������!������������������'��� �� ���%���� �$�� ���� � !!������$�%�������'� % ���^ ���#��� ���' ��!����# ���!���������=��� ����_���%��������\% � !�� ���% �!����"����%�'��% � ��" � �# ��^ #���� #�����% ����^ ���� ���$� ���$#� ���H8: Gender will moderate the effect of perceived colorfulness on visual preference. Specifically, the effect of perceived

Yu & Ahn
The 17th International Conference on Electronic Business, Dubai, UAE, December 4-8, 2017 ��[�
colorfulness on visual preference will be stronger for females than for males. H9: Gender will moderate the effect of perceived visual complexity on visual preference. Specifically, the effect of perceived visual complexity on visual preference will be stronger for males than for females. �
#$�%�!�&�<)�!���� ������� ����#$�� #���" ����� #� `' ��� ��������� ����% �'������'������!�������'� �������!�!��%������ ����������� � �^����� ���\% �'������'�����" � �� � �� #�!��������� �'��������!�����% ���&_\����#$�� �_�%�����!������ � ���/���� �������#��% ��<����$# ���������$��� #������ ����� �"��%��% ������'�� ��%�"�����% �����% ��"���$� #����� ��$� ��% �'������'������!�������'� �������!��% � �'��#$����\��� #$� ��% ������� ��� #�����% ����� �����$�%����'������ ��" �#������% #��% ���� ���� ���!�����% ������%�������#�\��%������##��������������� ��^ ��% ������� ��� #����'��� ���� ���" � �� � �� #�!������������'��#$�������������������¸���������������� ����%�''�����''��$q(�������'�����������������% �'������'�������� �����% �����"��%��% ����"������� �# ^�� �\% ��� �#��% ���� !�# ����'������!��% � `' ��� �����#��% �'$�'�� ��!��% � `' ��� ���!�����\% �'$�'�� ��!��% � `' ��� ���"��������^ ������ ��% �����$� ��� %�^������������ � �^����� ��������#�������^��$���'� ! � �� ��!� ���%����'������'�����%�#�������$� �����' �!���������� ���!� `' ��� �����% �^��$���'� ! � �� � `' ��� �����#��% ������ � �^����� ��� `' ��� ����&���% �!�����^��$���'� ! � �� � `' ��� �����% �'������'������"���'��#$������� ��!��������% ������% ����'$� ����� ��\% ����� ����'��� #����'���$� ���!���� �����% ����#����'���$� ���!�! ��� �����% ����'%������'%��!�����# ��" �������% �'��#$���"�����'' �������% ���� ��!���������� �� ���#���#��% ��#���'' ������ #��� ����!� ���%�����% �'������'����"�������" ���%� ��$ �������!��� ��%�'%������� #���� �% � !����� ��'� �������!� �% �'%���� ������"������!$��" � � �% �'���$� �� ������� ������� �����!$������ ��������!$����������"����'����� #�" � ��% �'���$� �������������������'� `������ ������'� `���������"��$�%�#�#���$���� #��% �'���$� ��^��$���������������������'' ���������� ����'' ��������� �� �� �et al��������\% �'� ���������� ���"��%�~�' �'� �"������'� � #�������$��������$� �� ��%��������������% ������ � �^����� ��� `' ��� �����% �'������'��������� �� #����������� ��%�''���������'�� ��"%��%�"�����# �����#^��� �\%������$��� #������ ��%�''����'�� �#��'��� #���� ������ ���!������������ ��!� `' ��� ���\% �'������'�������$�#�!� ����%��� ��% ���!�^���� �'��#$���������% ��#������% ����$�������� ��%�''����\�� ������� ��% � !! ����!�'��� �������'��#$����" � �'��� #��% ���� ����$����!��Ï��!� �� ��$�%���� ������� �# ���������" ���� #��% �'������'�����"%���'��#$�����������% ����'��#$�����% ���� �"����������'$��%�� ��
����$� �������������� �_%�''�����''���������
������#�������@��� ����� �����������% �������~������ ��$� #�����% � `' ��� �����% �!����������� �'��#��������% ������!$�� ��� � � ������#��% �^��$������'� `��������� ������� #��%��$�%��% ����� �'��� ������� �%�#�� �$� #�}�����' �*����#������% � ���� `������ ��%�!������!�����% �'��#$������� ���#�� ! ������% ����� �� ��������$�� ���# ��!� ���� ����$#� ���� �� �� �et al���������
�\��� ����&��� �� ������^������ ���
@��� ��� !�����(�����$ � \% �'$������!���������"��%�� ���#������% �'��������������_��$������� \% ���� �������!������������$ � \% �^��$�����' �� �^ #�����%�� ���*�����#������$�������$��"%�� ��
��*��\% �' �� ����!�'�` ������� ������ ��!��~��������
*��������� �#���%�^���]�et al�����[��
\% ��$���!��^ ��� ����$�������^��$ ���#�������#�# ^�������
*����������� ����_$����$����������
*��'$���������# ���!�/$���#����#������ �� �" ����<�'�` ���
�� �^ � ���$�� ���!�� �^ ������'�� ���� #���� �$���^ �# ���'��������
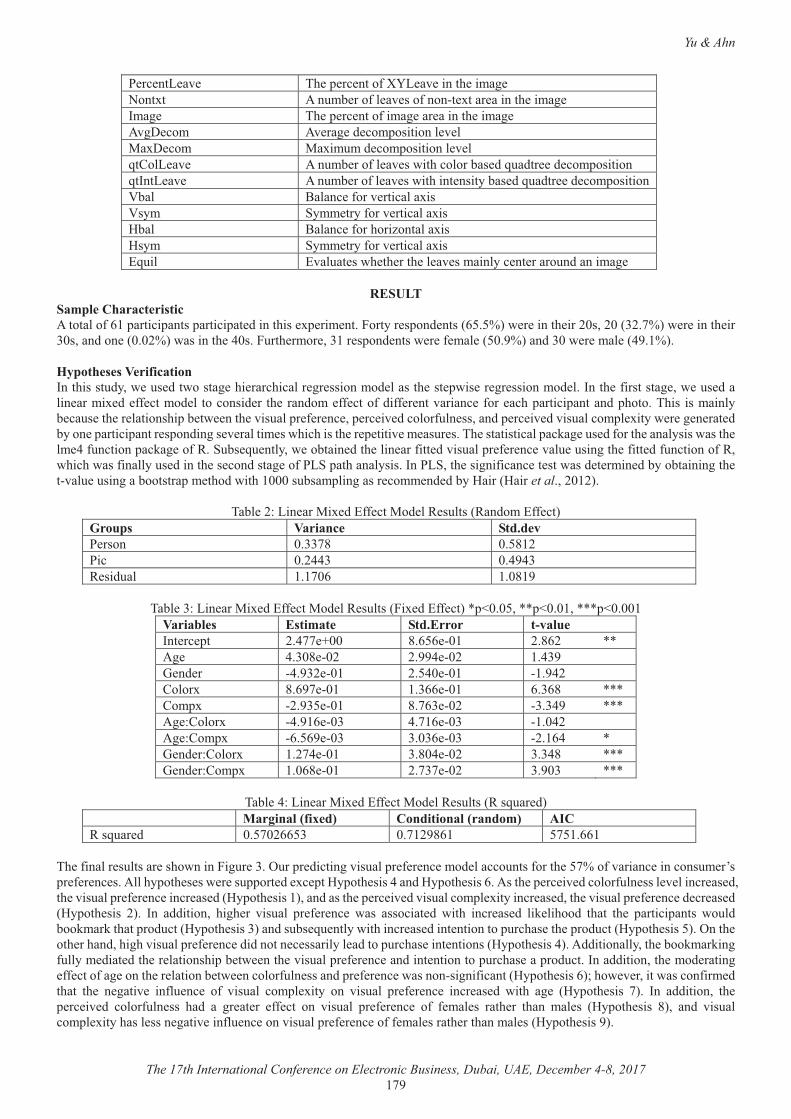
Yu & Ahn
The 17th International Conference on Electronic Business, Dubai, UAE, December 4-8, 2017 ����
� �� ��� �^ � \% �' �� ����!��� �^ �����% ����� �����`�� ���$�� ���!�� �^ ���!������ `���� ������% ����� �&��� � \% �' �� ����!����� ��� ������% ����� ��^�= ���� �^ ��� �# ���'��������� ^ ����`= ���� ��`��$��# ���'��������� ^ ����*��� �^ � ���$�� ���!�� �^ ��"��%���������� #��$�#�� �# ���'����������&��� �^ � ���$�� ���!�� �^ ��"��%���� ��������� #��$�#�� �# ���'������������� <����� �!���^ ��������`�������� _��� ����!���^ ��������`�������� <����� �!���%�����������`�������� _��� ����!���^ ��������`���/�$��� /^��$�� ��"% �% ���% �� �^ ���������� �� �����$�#�������� �
��$�"&��
��( ������������������������!�~��'������'�����'������'�� #�����%��� `' ��� ���������� �'��# �����~�����" � �����% ������������������" � �����% ����������#��� ��������"�������% �@����$��% ���� ������ �'��# ����" � �! ��� ����������#����" � ���� ��@������%�(��������@����������&���%�����$#���" �$� #��"������ �%� ����%������ �� ��������# ������% ��� '"�� �� �� ��������# ��&���% �!��������� ��" �$� #������ �����` #� !! �����# �� ��������# �� �% ����#��� !! ����!�#�!! � ���^������ �!��� ��%�'������'������#�'%����\%��� ����������� ��$� ��% �� �������%�'�� �" ���% �^��$���'� ! � �� ��' �� �^ #������!$�� ������#�' �� �^ #�^��$������'� `����" � �� � ��� #������ �'������'����� �'��#����� ^ ������� ��"%��%�����% �� ' ����^ �� ��$� ��\% �������������'����� �$� #�!����% ����������"����% ��� @�!$�������'����� ��!���_$�� �$ ������" ������� #��% ���� ���!��� #�^��$���'� ! � �� �^��$ �$������% �!��� #�!$��������!����"%��%�"���!�������$� #�����% �� ���#����� ��!���_�'��%����������&����_���% ������!����� �� ���"���# � ���� #���������������% ���^��$ �$���������������'�� �%�#�"��%�������$����'��������� ���� �# #���������������et al���������
\��� ������� �����` #�/!! �����# ��� �$��������#���/!! ����<���(�� @����� ������>�� ����� ����[� ��[������� ��@@�� �@�@��� ��#$��� ����~� ��[���
�\��� ������� �����` #�/!! �����# ��� �$�������` #�/!! ����|'�����||'�����|||'�����
@��� ��� $������� ����$����� ��> ���&�� �� '�� �@�� ¹��� [~�~ ���� �[~�� ||��� � @��[ ���� ���@ ���� �@��� �� �# �� �@��� ���� ��@� ���� ���@�� �*����`� [~�� ���� ��~~ ���� ~�~[� |||�*��'`� ����� ���� [�~� ���� ���@�� |||��� �*����`� �@��~ ���� @��~ ���� ���@�� ��� �*��'`� �~�~� ���� ���~ ���� ���~@� |�� �# ��*����`� ���@ ���� �[�@ ���� ��@[� |||�� �# ��*��'`� ��~[ ���� ���� ���� ����� |||�
�\��� �@����� �����` #�/!! �����# ��� �$���������$�� #��
� #��� �`��q��k� ������� �`����k� ��������$�� #� �����~~��� �����[~�� ����~~��
�\% �!������ �$������ ��%�"��������$� ����$��'� #�������^��$���'� ! � �� ���# ������$����!����% ������!�^������ ��������$� ����'� ! � �� ������%�'��% � ��" � ��$''��� #� `� '����'��% ����@���#���'��% ����~�����% �' �� �^ #������!$�� ���� ^ ������ �� #���% �̂ ��$���'� ! � �� ����� �� #����'��% ����������#�����% �' �� �^ #�̂ ��$������'� `�������� �� #���% �̂ ��$���'� ! � �� �# �� �� #����'��% ���� ��� &�� �##������� %��% �� ^��$��� '� ! � �� � "��� �������� #� "��%� ���� �� #� ��� ��%��#� �%��� �% � '������'����� "�$�#�����������%���'��#$������'��% ���������#��$�� �$ �����"��%����� �� #���� ���������'$��%�� ��% �'��#$������'��% �����������% ���% ��%��#��%��%�^��$���'� ! � �� �#�#������ � ��������� �#����'$��%�� ���� ����������'��% ����@���##������������% �������������!$����� #��� #��% �� �������%�'�� �" ���% �^��$���'� ! � �� ���#���� ���������'$��%�� ���'��#$���&���##��������% ���# ������� !! ����!��� �����% �� �������� �" �������!$�� �����#�'� ! � �� �"������������!���������'��% ����~���%�" ^ ������"������!��� #��%��� �% � � ����^ � ��!�$ �� � �!� ^��$��� ���'� `���� ��� ^��$��� '� ! � �� � ���� �� #� "��%� �� � ���'��% ���� ��� &�� �##������� �% �' �� �^ #� �����!$�� ��� %�#� �� �� �� �� !! ��� ��� ^��$��� '� ! � �� � �!� ! ��� �� ���% �� �%��� ��� �� ���'��% ���� [��� ��#� ^��$������'� `����%���� ���� ����^ ���!�$ �� ����^��$���'� ! � �� ��!�! ��� �����% ���%������ �����'��% �������
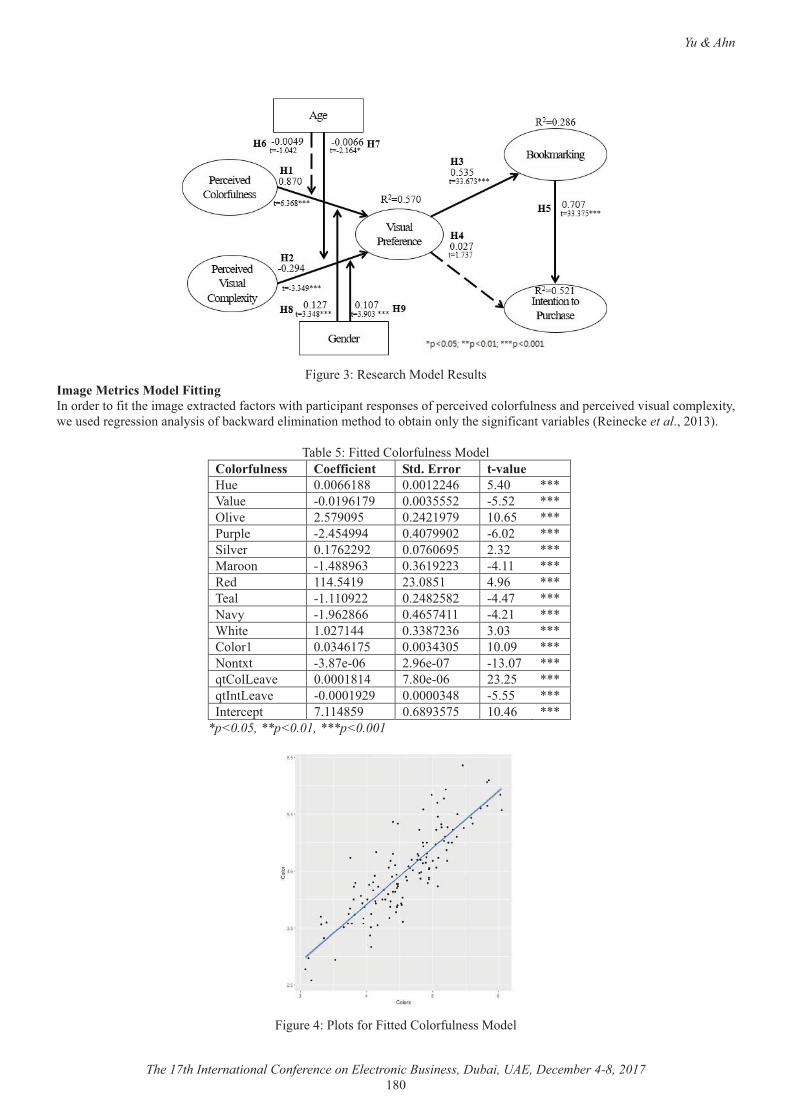
Yu & Ahn
The 17th International Conference on Electronic Business, Dubai, UAE, December 4-8, 2017 �[��
�
����$� ����� � ���%���# ��� �$����
�����#�������#��� �*������&����# �����!����% ����� � `����� #�!�������"��%�'������'����� �'��� ���!�' �� �^ #������!$�� �����#�' �� �^ #�^��$������'� `�����" �$� #�� �� ����������������!�����"��#� ������������ �%�#�����������������% ������!������^������ ���� �� �� �et al��������
�\��� �������� #�*����!$�� �����# ��
�� ���� ���� ����������� �����$����� ��> ����$ � ���~~�[[� ������@~� �@�� |||����$ � �����~���� ��������� ����� |||����^ � �������� ��@������ ��~�� |||��$�'� � ��@�@��@� �@������� �~��� |||�_��^ �� ���~����� ���~�~��� ���� |||�������� ��@[[�~�� ��~������ �@��� |||�� #� ��@�@��� ���[��� @�~� |||�\ ��� ��������� ��@[��[�� �@@�� |||���^�� ���~�[~~� �@~��@��� �@��� |||��%�� � �����@@� ���[���~� ���� |||�*������ ���@~���� ����@���� ����� |||�����`�� ��[� ��~� ��~ ���� ����� |||���*��� �^ � �����[�@� �[� ��~� ����� |||���&��� �^ � ���������� ������@[� ����� |||�&�� �� '�� ���@[��� �~[������ ��@~� |||�
*p<0.05, **p<0.01, ***p<0.001��
�����������������
���$� �@��������!������� #�*����!$�� �����# ��
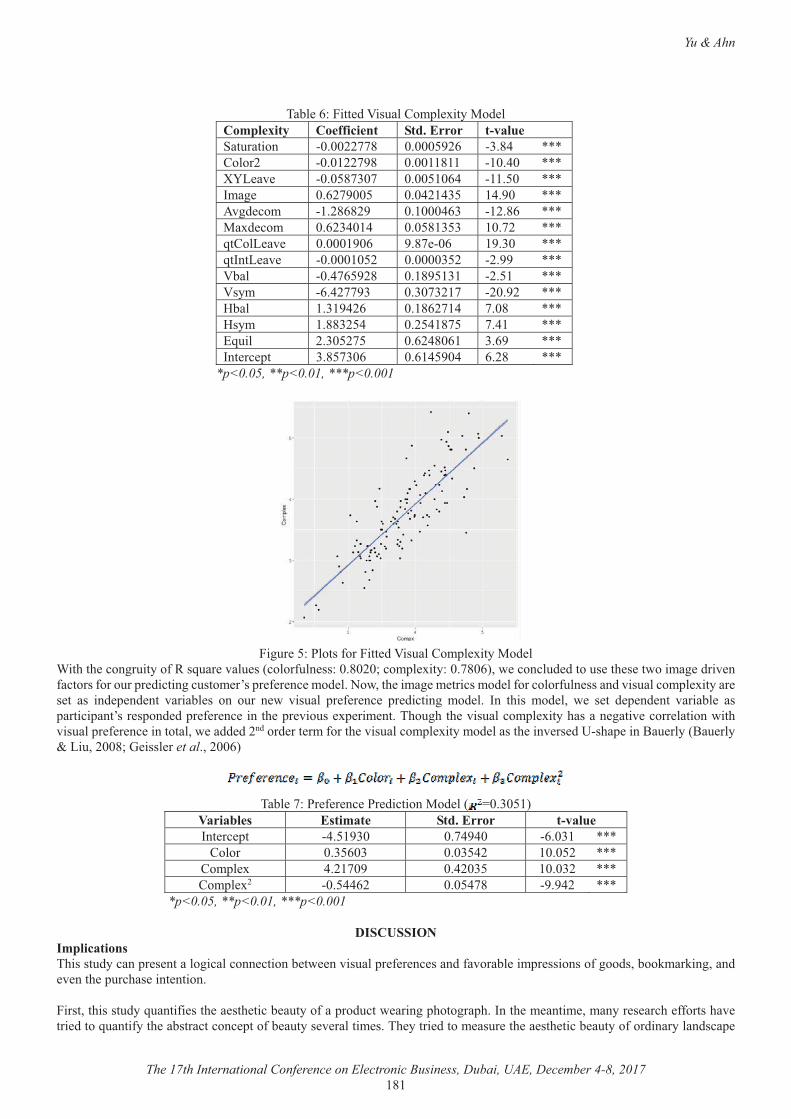
Yu & Ahn
The 17th International Conference on Electronic Business, Dubai, UAE, December 4-8, 2017 �[��
��
\��� �~������ #����$���*��'� `������# �����( �q���� ����������� �����$����� ��> ���_��$������� ��������[� �������~� ��[@� |||�*������ ��������[� �����[��� ���@�� |||��� �^ � ����[����� ������~@� ������ |||�&��� � �~������� ��@��@��� �@��� |||��^�# ���� ���[~[��� �����@~�� ���[~� |||���`# ���� �~��@��@� ���[����� ����� |||���*��� �^ � �������~� �[� ��~� ����� |||���&��� �^ � ���������� ��������� ����� |||������ ��@�~���[� ��[������ ����� |||������ �~@������ ��������� ������ |||������ ����@�~� ��[~���@� ��[� |||������ �[[���@� ���@�[��� �@�� |||�/�$��� �������� �~�@[�~�� �~�� |||�&�� �� '�� �[����~� �~�@���@� ~�[� |||�
*p<0.05, **p<0.01, ***p<0.001 �
����������������
���$� ����������!������� #����$���*��'� `������# �����%��% ������$�����!�����$�� �^��$ ��������!$�� �����[��������'� `�������[�~���" ������$# #����$� ��% � ��"������ �#��^ ��!�������!����$��'� #��������$���� ����'� ! � �� ���# ����"���% ����� �� ��������# ��!��������!$�� �����#�̂ ��$������'� `������ �� �� ��� ��# ' �# ��� ^������ �� ��� �$�� � "� ^��$��� '� ! � �� � '� #������� ��# �� &�� �%��� ��# ��� " � � �� # ' �# ��� ^������ � ���'������'������� �'��# #�'� ! � �� �����% �'� ^��$�� `' ��� ���\%�$�%��% �^��$������'� `����%������ ����^ ����� �������"��%�^��$���'� ! � �� �����������" ��## #���#���# ��� ���!����% �^��$������'� `������# ������% ���^ �� #�>��%�' ����<�$ �����<�$ ��������$�����[��� ���� ��et al�����~���
�
\��� ������ ! � �� ��� #���������# ��� º�������@��� ��� $������� �����$����� ��> ���&�� �� '�� �@������ ��@�@�� �~���� |||�
*����� ���~��� ����@�� ������ |||�*��'� `� @������ �@����� ������ |||�*��'� `�� ���@@~�� ���@�[� ���@�� |||�
*p<0.05, **p<0.01, ***p<0.001 �
!���"��������( �������\%�����$#������'� � ����������������� ������� �" ��^��$���'� ! � �� ����#�!�^����� ���'� ��������!����#������������������#� ^ ���% �'$��%�� ���� ���������������%�����$#���$����!� ���% �� ��% ����� �$����!���'��#$���" ������'%������'%�&���% �� ����� �������� � ���%� !!�����%�^ ���� #�����$����!���% �������������� '���!�� �$���� ^ ������� ��\% ����� #����� ��$� ��% �� ��% ����� �$����!���#���������#���' �
Yu & Ahn
The 17th International Conference on Electronic Business, Dubai, UAE, December 4-8, 2017 �[��
'%������'%������ � �^����̂ ��$���'� ! � �� �� �'��� �����" ���� �������!�����'%���'���$� ��&���%�����$#����$����!������% �� ��% ����� �$����!��% �'���$� ���!��%�''���������'��#$�����"%��%���������# � #����� ��% ���$�����"����!����% ������ ����� ����� �� ����# ����'������ ������� ��$��������^ ��$ �� ��"��%�$����������% ��$���� ��#�� ��������$���% �!�������'� �������!��% �'��#$���\%���"������ �� �������� �������'����������%����������$�%� ��� ��!����% ����� �����#�� ����������� �# �����������$��"%��%�'��#$�������#��'���� ����� ��'���������� ��$� ���� ��$����� �� �% � �%�''���� �''� ����$�� ��#� #��'���� ����� ��� !��� �% � ' �������� #� !�������'� �������<�� #�����%��������� ����� � `' �� #����� ���� ����� ���% ����"������� �� �����%�"������� ���'���$� ��!��% �'��#$����% ��"�������� �����#�%�"����� ������ ��% ����� ���_ ���#������ ��������% � ����!������'%�� ���������� � �����������$#���% �����$� ��� %�^�������� �����% ������ � �^����� ������� ���"���#�� ����� ���������������� #��% �� �����!$��'��%��!�%�"��% �!�������'� �������!��% ����� �� �#�����'$��%�� ������������ #������ � �^����� ��� `' ��� �����\%��#��" ����#$�� #���� �����!$����$#������% ����^ ��������� ��"%��%�����% ����� ������� ����!��%�� �"%���$������� ��������� ��%�''���� ������ &�� !����� ��%������ %�^ � '� � �� #� ����� ������^ ��� �� ���$�� �%��� ���$ � ��� ���$�� �% � !! ��� �!� �% � �$�� �� �!�����$� �������������������% ����$���'$��%�� �&���%�����$#�����_�'��%�����������%�" #�'�����^ ����� �������� �" ���% ��"����&�����������*��������������������������%�����$#���" ����#$�� #���� `' ��� ����������������#����'������' ��' ��������� ��$������~�� `' ��� ������''��������!���������� ����#����! ��� ��*����# ������!��% ��$�� ���!������ �$� �����%����$�� ��� ���������������� '� � ���"%�� ������ �����$� ������ "�� ��~��'%������'%���!�� ����#�"�� ��" �������''�� ��" � �� � �� #��������#������������% ������������#�����������!�'��#$������� ��� ���� � #��������� ��%�''�����''��&���##����������%�$�%�" ��%�� �'%������'%��"��%���������^������ �� ��������#��%�" #���#�!! � ���� ���!�����% �������� �"��� �# ���� �% � ������������!� �%�����$#�� ��� �%��� �% �� ���!�'%������'%��'� � �� #������� ���#�! ��� �'������'�����#�!! � #�\% � !�� �����!$�$� �� � ���%��������� � ������������!����"% �% ���% ���������� �$��������� ���%� ^ #����� '����������%���� � ���%�"��%�!������ � `� �# #�#����!���'$� ���! ��� ��$���� ����_ ���#���%�����$#��� ��$� #�������% ���!�$ �� ��!��% �!�������'� ������! �����#�� � �^ #�������'�����!�� ���#��\%$����������� ����#��%����������������$����� �� � ���% ���$�%���������� ��� !! �����!�^��$����'' ���������������������' ��' ���^ ������ ���� ��� ������^��$���'� ! � �� ���!��% ����� �������%��� ��% �!�������'� �������^ ����� ���%�����$#��� #������ � `'��# #����� �����!�� ��% ����'� ! � �� ���#���� ��%�!��� �������%�'��\%��#������ #$� �������!�'�������!���������% �'%������'%��" � ������ #�����%���������$� ������\��%���������% �# �������' �"�������� #����� ����^ ������'� �����% ��������������������%���������#�!!��$���������$��� ���� !� ����% �" ��%���!��% � ^��$�������!���#�^�#$���!��%�������� ��$�$� �� � ���%�"��������# ���% �'��#$������ ���������%����������� � `� �# #������"�# �^��� ����!�����%�������� ����� �����#� ^ ���%� �������������������"��%�� ����%�''�����''������������������ ��� �% � ��$#��� " � ������ #� �% � � %�^���� �!� ����$� ��� $����� �% � ��������� !$������� ��� ����� � �%��$�%� `' ��� ������" ^ ����%����������!$���� `'������% �� %�^�����!������ �����$� ���!�����% �� ������������% � �#�#$ �����% ���'�� �" ���% �� ��� �^����� �����#��% ������������ �^����� ���\���^ ���� ��% � ��������������" ���% #$� #����#�� ��������������� �"��%�� ������ ������'�����<���#�������� ��%�''�����''����������$��� �������^���#�� ��$��'� #���������# ������ ������\%���� � ���%�!$���� `'���� #��% �^������ ����' �'� ©��^��$���'� ! � �� ����� �����!�' �� �^ #������!$�� �����#�^��$������'� `����\%���^��$���'� ! � �� � `' �� #����%�^ ���'�����^ � !! ���������%�����$� ������������������#�'$��%�� ���� ��������$�����#�� �������!�$ �� #� ����� ������������ &�� �% � ��$#��� �� %� ����%����� � �� ������ ��������� �!� �% � '��%� ��������� ��� #� ��� �% �����$�$������������ �'��� ���# ��"���' �!��� #�&���% �!��������� ������� �����` #� !! �����# ��"����''�� #���#��% �' �� �^ #������!$�� �����#�' �� �^ #�^��$������'� `���� `'���� #��% �^������ �����% �^��$���'� ! � �� �&���% �� ���#����� ��!�� �� ������������������_�'��%����������"���$� #���������� �%�"�^��$���'� ! � �� ��!! �����% ��$�� ���!�'��#$����������� #���#�'$��%�� ���� ������ \%��$�%� �% � � �'������� � � ���%� ������� � ^ ���� �% �� ������ ��#� ����� ����� ��'���������� " � � ��# �� "%��%� �� � `' �� #���������!���������������$� �����% �!$�$� ���$#���������� �����$� ����� %�^�������#����^ ��������� ���
��9��;&$!<$#$���\%���� � ���%�"����$''��� #�����% �!$�#����!�����% �� � ���%�� �� ��!���%�' ������ �� #����� ��������&_\�
��$*$�$��$��
£�¤� ������}������*%����'�#%����������[���¢/!! �����!����� `����#�'������� ������$ ������ ������!����' ���������#����Journal of Marketing Research��''��@���@��
£�¤� �` ���#�����������¢_�% ����% ����������!���������'��� ��������# ���!�' �� '�������#�������������American political science review������~������@��''���@[���~~�
£�¤� ������% #�� �� _� ������� ¢*�� �������� ' �� '����� �!� ������� /^�# �� � !���� � ���#���� ��� ����� ��$�#������ Psychology research and behavior management������[��''�����
£@¤� ���%��_�/����@~��¢����������'� ��������!�' ������������The Journal of Abnormal and Social Psychology������@���������''���[��
Yu & Ahn
The 17th International Conference on Electronic Business, Dubai, UAE, December 4-8, 2017 �[��
£�¤� ������������*����_%�!!������������~[��¢�$����� ��������'��'�� #����� ����#�������������'��� �� ����Psychology of learning and motivation���������''�[������
£~¤� <���������������[~��Principles of marketing management�_�� �� �� � ���%��������� ��£�¤� <�$ ����� ��� �� ��$�� �� ����[�� ¢/!! ���� �!� ���� ���� ��#� �$�� �� �!� ���'���������� � � ���� ��� ��� �!�� � ��#� # �����
� ��% �������Intl. Journal of Human–Computer Interaction�������@��������''������[��£[¤� < ��������}����*��"� �����/������������������[���¢\% � !! �����!�������������� �# �������Journal of retailing�£�¤� < ���� �� =� /� ����@�� Studies in the new experimental aesthetics: Steps toward an objective psychology of aesthetic
appreciation�� ���'% � ��£��¤�<� " ����������\� � ����}�*����[���¢��� ��!���% ��������� �����!���'��� ����Cognitive psychology����������������''�
��������£��¤�<��#� ���/���������% ����������[��¢� #�������#�$������������%�''�����������\% ������ � `' �� �� ���Journal of Business
research������~������@��''�������@�£��¤�<$����/����������������� �������������� ����/��������¢�������! ��$� ���!���� ��'�� ��� �������%�'��� �" ��" ��'�� �
���'� `������#���� ����!!�����Journal of the Association for Information Science and Technology�����������������''���@~�£��¤�*%��#�� &�������� ���}����������� �������� ���~[�� ¢�� ���#� � `�#�!! � �� �� ����%��#� �©��������'� ! � �� ����Child
development��''������@��£�@¤�*��� ����������$�������� ����� ������� ¢< ���#� �$������ ����^������� � %��#� ����$� ��©� ����� � �%�''���� ����� $� ���
Journal of Business Research������63��������''��[~�����£��¤� *��������=� ������� ¢�������� ^ ��$�� � � ���� ��� � � ������ �!� ��!��������� ��#� �'������ �%��� ���The Journal of Social
Psychology�����������������''�[���~�£�~¤�*�$��������*����_"� � �����_�}�������������/�����[��¢��� �'���������^ �����������!�������� �' ���$� ���#�� �# �� !! ����
���" ��� ��% �������Journal of Usability Studies���������������''���������£��¤�*����=��� �#��������������� �� ������� ¢*���$�� �'' ��� ��� " ���� � # ����� "��%��� ��#� ������� �$��$� ��� �� �$����� �%�#�
^��$�������International journal of human-computer studies,�����~[��������''������£�[¤� =��� ����������_���%����/��������¢� �# ��#�!! � �� �������!���������'��� ����������� �� ������ �'�������� ����!��% �
� � ���^������# ������#^ ��������� �'��� ���Journal of Advertising�������@��������''�@���~�£��¤�=���������}��%���=������}����������}�������~�������¢_�$#������ ��% ��������'%������'%������� ��$����������'$���������
�''����%�&��European Conference on Computer Vision��''��[[������_'���� ���< ������� �# �� ���£��¤�= ���� ��� ��� �� � �� ��� ��� =� ������� �$�$���� ¢� ��% ���� ���� � ������!�������� !��� �$������$�� �� ������ &��Pattern
Recognition (ICPR), 2010 20th International Conference on��''��@����@����&///�£��¤�=�����������������¢*%�����������$��'� ! � �� ��"��%��� ����������'�����^ ���$#�������$�� ����#���# ������^ �� ������
�� #���¥���� �����Gerontology������@������@��''�������~�£��¤�/!�����<����\���%���������}�����@��An introduction to the bootstrap�*�*�'� ���£��¤�/����$��_�������%� �����������=�^���������������¢�����'% �����$����� ���!������ �� ��������������� '�$�����# ����#�
��'������������Journal of Business research�������@������,�''������[@�£�@¤�����%��\���������� ���/�������@��¢\% �������'� ! � �� ���!��������$����%��#� ����The American Journal of Psychology��
����46��������''�@@[�@���£��¤�� ���� ������������%���������������������\�����~��¢\% ���!�$ �� ��!�%�� �'�� ����'� `�����������$� ����� �������
�����$# �����#�'$��%�� ���� �����Journal of Advertising����������������''�~��[��£�~¤�������}����_���� #����������� ��*������� ����}����������¢������ ��� ����!��% �$� ��!�'�������� ������$�� �����$��$����
�$��������# ������������ ������ � ���%���Journal of the academy of marketing science, ����@���������''�@�@�@���£��¤���������������������������@��¢\% ���'�����!�" ��'�� �� `���������$�#�����$������������������� �#���������� � �������
� ��% �������#�� %�^��$������� ��������Behaviour & information technology,�������������,�''��[������£�[¤������������_� �� ��������� ���=�������^ ���������������*� ����@����^ �� ��� ¢� ��$�����'��� �#�������������� ��#�
�� �������� ����� �� �" ����� ����Proceedings of the 2014 conference on internet measurement conference���''�������[��£��¤����������� ��� � �� �� �� ��� �� *%����� �� ������� �'����� ¢&�!����'%��� � ��% ������ = �������� !��� �% � !�����
��'� ���������Proceedings of the 33rd Annual ACM Conference on Human Factors in Computing Systems��''���[�������£��¤����� ���=����_Ò����$����_��������� ��$���������$�!$�� ���������$�������� ����&��Proc. IST/SPIE Electronic Imaging 2003:
Human Vision and Electronic Imaging VIII����������������*���*��������������''�[�����£��¤���$��^ #���*������� � � ���=�\�����@��¢� ���� ���# �� !! �������' ��$���������������$# ���� ���%�' ��' ���^ ���Journal
of Consumer Research,���������������''�������[�£��¤�� �#������*����*����������������������¢�$�� ���^ �������� %�^�������'������� !! �����Psychonomic Science,������������
�,�''���������£��¤����� �����\����# ������}��� ����������\�������\�}����<��"���}�����~��¢=��^ ��#������������\% � !! �����!�����$�� ���
���^ %��� �����������#� �^����� ������'� `������#��� ����#��^����' �!������ ���Accident Analysis & Prevention�������[���� �,�''��[������
£�@¤���^���#��*�&�������# �������������¢&���% � ���¢��"��!�'����������' ��$��������The order of presentation in persuasion��''������
£��¤��$��� ������*�������������������¢<�������������'�� �����!�� `�#�!! � �� �����������'� ! � �� ���Current Biology,�������������~��''��~����~���
£�~¤�&^����������_��%����������� ���������������������%��¢/�'���������^���#�� #�" ��'�� �# ������ ��������Proceedings of the SIGCHI conference on Human factors in computing systems��''����~����*��
Yu & Ahn
The 17th International Conference on Electronic Business, Dubai, UAE, December 4-8, 2017 �[@�
£��¤�������_�/����<� #����_��������¢\% �������'� ! � �� ���!��%��#� ����Journal of Applied Psychology������~������,�''������~~�
£�[¤� � ��������������¢\% �#$����!�$���������!������� �����!�'� � �^������! ���Theological Studies,�������������,�''���������£��¤� ����� }�� �� ������ }� �� ����[�� ¢= �������� ��"��#�� ��������� $��������� ��� �$���� �� ��� �!�� ����$��"���%�� ��� �!�
��� �������������� ����� �!�� ����Interacting with computers��������������,�''������£@�¤������}����� ������_�}��������¢/!! �����!�� '$���������#�" ���� ��$�������������� �����$� ��©� ��������' �� �^ #��������#�
'$��%�� ���� �������<�� #�����% �����$�$������������ �'��� ���# ����Journal of Research in Interactive Marketing,������������,�''�����~�
£@�¤������}�*�*�����$�����������¢\�"��#�����$�# �����#�����!��% �� %�^��$������� ���������$� ���" ����� ���International journal of information management,�������������,�''�������[�
£@�¤����#����#�����������¢� ��% ������̂ ��$����'' ����$�����������#�$� �������!��������"%���#���% �$� �©�� � ��� ����% �$� �©�������¨����Australian Journal of Emerging Technologies & Society, ��������� ��
£@�¤����#����#�����=$# ���*��_ ���=��_$� ��������������������������¢��� `'����������!�� ��������� �" ��^��$����'' ������$��"���%�� �����#�' �� �^ #�$����������!�%�� '�� ����ACM Transactions on Computer-Human Interaction (TOCHI),������[������,�''���
£@@¤����% ��� ��� >�� ��� ��� _��� #�# �� ��� �� ��%��� }� ������� ¢��� !����� ����� �� ��� ���������� �!� �% � '%������� ��������^ � ����� � ���' ���Sex Roles�������[�������,�''������@��
£@�¤���������*�������[��¢� �������%�'����� ��������%��%���^��^ � ���'��#$���������$� ��''����%���Journal of product & brand management,������������,�''�~��~�
£@~¤������������_�����������}��������¢*����$ �����!��� �����#��$���������#��^ ���!�������� � ^��$���������#�� %�^������Journal of retailing, ������������,�''������[��
£@�¤�� � ���� ^���}������% �"������=��������¢/`'�������#�!! � �� �������� �©���#�! ��� �©�'��� ����������� �� ����Journal of Consumer Research,������[������,�''�~�����
£@[¤����%����#�$��/�����' ���_����< �%%�! ���_�����[��_ '� �� ���¢���$������'� `������#�� ��% ����' �� '������!�" ��'�� ����&��Proceedings of the 26th annual ACM international conference on Design of communication��''�������@���*��
£@�¤���� ��� �/���� �� � $��� ��������~��� ��� ^ #�!����%��'�¡¡��!���� ��� ���¡ ���� �� �� '����/ �����~%����£��¤������%������������#������������^ ������������_ '� �� ���¢\�"��#�����'$�����������# ����!��% �^��$���� ��% �����'' ���
�!�����$� ��^�# �����&��European Conference on Computer Vision �''����@��_'���� ���< ������� �# �� ���£��¤����%�� �������$��%��}�����Á��������_��������¢���� ��������������$�� ��/`' ��� ����� ^�# �� �!���� � !������ !! �����!�
^��$���� ��% ��������' �!������ ���Ergonomics,��������������,�''�����������£��¤��������&����������%$ ����*��������¢���������������^ � �������''���� #����������� ���Emotion,�����������@,�''�@�[�£��¤� ���#�������������%���}�����~��¢��� '�� �� ��% ������\% �� ���%�!���'� ! � �� �!���������#��% ��%��� �� ���!��$�] ���^������
Interacting with Computers�������[�����~,�''�����������£�@¤�� �� �� �������< ���� �������������¢&�'��^����' �!������ ��' �� �^ #�$������������#�� ��% �����"��%��$��$�������#�'��^ �
$� ����� �!�� ����ACM Transactions on Computer-Human Interaction (TOCHI), �����[���� �,�''�[�£��¤�� �� �� ������ %��\���������`��������#���������%���������$��}������]����������������'�����¢�� #�������$� ��©� !�����
��'� ��������!�" ���� �� ��% �����"��%����$����!���������!�' �� �^ #�^��$������'� `������#������!$�� �����&��Proceedings of the SIGCHI Conference on Human Factors in Computing Systems��''���@�����[���*��
£�~¤���%��� �� }�� �� _"������%���� �� ����@�� ¢�� ��'������ �!� ����� � �%�'' ��� ��� #� ��� �%�''���� ����^��������� Journal of business research, ������������,�''��@[�����
£��¤���� �%�����������������������������������¢� ��$�����^��$�����$�� ����Journal of vision, Vol. 7, No. �,�''�������£�[¤��$�� ����}������������������[���¢��# ����'������!��% ��!! ���^ ��$������������$� #���� �^����� ������Journal of personality
and social psychology, �����[������,�''�����£��¤�_������������~��¢*��'�����^ ���$#� �����������'� ! � �� ����}�'�����#���% ��������� �������"��%��' ����� �'%���������% �
'� ! � �� �!���"%�� ���Color Research & Application, ������������,�''����@��£~�¤�_�%"������<�����@��\% �'���#�`��!��%��� ���%��� ��������� ��New York: Ecco�£~�¤�_ �# �������< �������������� �%���������������¢��� �������� ���� ��Ó���"����^ �� ��������$�����^ �� �� ������ ��¨����
Sloan Management Review,�����@�������,�''����£~�¤�_%�^ ����������_�����������������¢� ������'��� �����%��� ���Entrepreneurship: Critical Perspectives on Business and
Management,������������,�''���@�£~�¤�_��^ �����*�����*$�� ��������*%��������������*%��� ���*����_���%���������## ��������������!� �#��/�<����[[��
¢_ `���#��������#�!! � �� �������������#��$�� ��'� ! � �� ����Perceptual and Motor Skills������~~������,�''���������£~@¤�_��������������~��Cognition and the visual arts��&\�'� ���£~�¤�_��# � �� ��������_�$ ���}��������¢\% ���!�$ �� ��!�# ������ ��% ��������$���������� �������/!! �������$� ��' �!������ ���#�
' �� �^ #�$�����������Applied ergonomics,�����@���������''�@���@���£~~¤�_�����"��������_�����"�������������� ���*�����@��¢_ `�#�!! � �� �����������'� ! � �� �������� �#� `�� � �#�!! � �� �����
�$��$� ���#� ����������Psychonomic bulletin & review,�������������,�''�����������£~�¤�_'��� �� ����/����*��"� �����/����� �# ��������������~��¢&�'��^�����% ����� � �^����� ����#����!��������$ ���!! ���
^��$���������#�� %�^����¨����The Journal of Marketing��''�~��[��£~[¤�\%���#�� ��/����������¢����������� ��������'���%�������������������Journal of applied psychology,�����@���� �,�''�������£~�¤�\��������������*��%�^�������������% ���$���������@��¢>���������������#�� �'��� ���� ��� ����� ^��$�� ��% �������� ����
�!���� #��� �� ��% ����' �� '�������!�" ��'�� ����SIGHCI 2004 Proceedings��''����

Yu & Ahn
The 17th International Conference on Electronic Business, Dubai, UAE, December 4-8, 2017 �[��
£��¤�\$�%��������� ����� ���/�/��_�Á*����������'"���������<�������^�����}����������¢\% ���� ��!�^��$������'� `������#�'������'��������� ���#����!�������'� �������!�" ���� �������������"��#��$�# �����#����� ��% ����]$#�� ������International Journal of Human-Computer Studies, �������������,�''���@�[���
£��¤����%�������������¢*�������� �# ���������#���$''���������������^ �" ���%�''�����''����% �¨�£��¤����!������ �����������������*��������¢_%�''��������� �!���!� #���������������#�!$����California Management Review,
����@���������''��@����£��¤����#����/����[~��¢\�������'� `�����= !���������!��% �������$�����Organizational behavior and human decision processes,
������������,�''�~��[��£�@¤�� �#���%�^���]��_����<����� ������}����# ���## ���������[��}��$�����¢�'���������������� '��#$�������!����$�������� ����
&��Color and Imaging Conference���������[��������''��@���@���_��� ���!���&�������_�� �� ���#�\ �%�������£��¤��% �����_��*%�����������&�������}�}��������$��% �� �� �������������'�����¢*��� ���������"�� ^ ������ ������������"��%�
$� �����'�#�� ��% ������#��!! ���^ �]$#�� �����!�" ��'�� ����Proceedings of the SIGCHI Conference on Human Factors in Computing Systems��''��������*��
��
Hung, W.H., Chuang, K.J. & Liao, Y.C. (2017). Principles of increasing the interactivity of mobile applications of smart parking. In Proceedings of The 17th International Conference on Electronic Business (pp. 186-191). ICEB, Dubai, UAE, December 4-8.
Hung, Chuang & Liao
The 17th International Conference on Electronic Business, Dubai, UAE, December 4-8, 2017186
Principles of Increasing the Interactivity of Mobile Applications of Smart Parking
Wei-Hsi Hung*, National Chengchi University, Taiwan, [email protected] Chuang, National Chengchi University, and Hsuan Chuang University, Taiwan,
[email protected] Liao, National Chung Chang University, Taiwan, [email protected]
ABSTRACTMobile applications (APPs) are adopted and downloaded widely around the world. Those APPs are those for examples linking to enterprise applications, management information systems, education systems, and healthcare systems. Thus, the importance of potential development APPs is hung. The objective of this study is to elicit design principles for ensuring the interactivity of smart parking APPs to be used especially in the city. This study conducted a systematic review on the past literature of interface design and case studies on seven smart parking APPs on the market in order to develop a design framework for smart parking APPs, which include a list of design principles. Then, four experts of APP design were involved in a series of interviews to improve the readability and usability of the framework. Finally, this study identified 11 principles for improving the interactivity of smart parking APPs, which are useful to the situation when users need to interact with a smart phone urgently in a small-touch-screen environment.
Keywords: mobile applications, interactivity, smart parking, design principles and case studies._____________________*Corresponding author
INTRODUCTIONThe advancement of information technology infrastructure, hardware, and software has caused the smart phone becoming aubiquitous computing platform for our daily life (Ballagas et al., 2006). In addition, the number of smartphone users is growingquickly. Mobile applications (APPs) are adopted and downloaded widely around the world for the use not only in personal occasions, but also business purposes. Those APPs are those for examples linking to enterprise applications, management information systems, education systems, and healthcare systems. Thus, the importance of APPs is growing, and the potentialdevelopment of them is hung.
At the same time, smartphones include a range of functions of traditional mobile phone, digital camera, Internet, global position system, near field communication, Bluetooth, infrared ray, and many other functions. Thus, the applications for downloading are increasing as well. Another advantage of smartphones is the touch screen. Different from traditional computers, the touch screen enables users to interact with the software instantly by figures or pens rather than large a keyboard and mouse. Thus, they are more portable than normal computers or even notebooks in various kinds of situations. Traditionally, the development of web pages tended to integrate a range of functions and items in a single page. Yet, this principle may not be applicable to mobileapplications (APPs) since the screen of the smart phone is small and it has a touch screen for interacting with applications. Thus, there is a need to study what design principles are suitable to APPs development in terms of interaction concern.
Nowadays, the increase and growth of transportation tools is growing fatly. Thus, it is relatively harder to find parking spaceespecially in the city (Monzon, 2015). In a crowded city, people drive their cars slowly, and finally arrive the car park. However, the car park may provide no space. Therefore, parking problem needs APPs to deal with. Although there are various kinds ofsmart parking APPs available in the market, very few of them are with good design. Most of them are hard to use because of the poor interaction between APPs and the users.
The objective of the study is to elicit design principles for ensuring the interactivity of smart parking APPs to be used especially in the city. For the smart parking APP, it particularly can be used in the situation when drivers need to interact with it for finding a parking space urgently through a small touch screen. Thus, the elicited principles can help the driver to quickly find the parking spaces through the use of smartphones. It is also hoped that the principles can increase the download number of smart parking APPs.
LITERATURE REVIEWSmart Phone ApplicationsSmart phones have become the electronic products used by most people in the world. Smart phones can help users to make phone call, have contact with others, process information, access to multimedia and Internet access, etc. In addition to more and more powerful processor cores and more advanced operating systems, the peripheral technologies of smart phones such as the development of wireless networks and the advancement of telecommunications technology all allow the very fast growth of the smart phones in terms of quantity and in speed (Balasubramanian et al., 2002; Hsu,2014).

Hung, Chuang & Liao
The 17th International Conference on Electronic Business, Dubai, UAE, December 4-8, 2017187
When defining smart phones, Zheng and Ni (2006) believe that in addition to the traditional phone call and Short Message Service (SMS) features, smart phones also have the abilities to connect wireless networks and personal information management. In addition to that, because of the development of the Internet, users can get information from the Internet faster, which allows the users to access to the latest information as well as to solve their needs more quickly and easily (Sarker & Wells, 2003). As more and more people are having smart phones, developers are also aware of the importance of mobile applications and are actively develop a variety of applications as well (Hwang, Shiau, & Jan, 2007).
User Interface DesignThe interface is the device that can allow interactions between the machine system and the users. It is through the interface that the machine system and the users are able to communicate and interact with their messages. The interface also let the users, through decision-making operation, to achieve the intended intention. It is also the interaction between human and the machine equipment that allow the users to have more efficient interaction with the information devices (Preece, 1993).
Norman (2013) believes that the key interactive interface design should be the system’s ability to response immediately, which means it cannot make the users to wait for too long. Interface communication is just like the usual conversation between twopeople, which must have the characteristics of interactive dialogue, and the corresponding tips of feedback when implement of the action can be the use of the sound, the changes of button or animation, etc., so as to make the system more interactive and user-friendly.
Shneiderman and Plaisant (2010) made several recommendations, and the excerpts are summarized as follows: Firstly, the system must strive for consistency (Strive for Consistency): let the user have a consistent operation mode, the same picture, terms,tips, instructions or the same operating procedures, etc., which will allow users to spend less time when using the mobile applications. Secondly, offer informative feedback (Offer Informative Feedback): If the user makes a very important operation, the system should give him a clear notice. The design dialog should produce the yield closure (Design Dialog to Yield Closure). The system should design dialog to yield closure that clearly inform the user’s status whether he is at the starting point, in the progress stage or at the end of operation. Thirdly, offer simple error handling (Offer Simple Error Handling): let the user know what kind of error he has made and to provide a simple solution that allows the user to leave the wrong operation. The system must also provide the opportunity for the user to correct his wrong actions. Fourthly, to support the user’s internal locus control (Support Internal Locus of Control): let the user feel that they can take the initiative to control the system. Through their own control, they hope they can get the desired results, rather than simply respond to the system. Fifthly, to reduce the user’sshort-term memory load (Reduce Short-term Memory Load): According to the study, human memory can only remember 5 to 9 things for a short period of time. In order to let the users avoid receive too much information at the same time, a concise and simple interface should be provided.
Apple (2013) has put forward the principles of the iOS interface design, some of the key excerpts are: Focus on the Primary Task,Elevate the Content People Care About, Think Top Down, Give People a Logical Path to Follow, Make Usage Easy and Obvious, Use User-Centric Terminology, De-emphasize Settings, Brand Appropriately, Make Search Quick and Rewarding, Be Succinct, in the development of Apple iOS, use the UI provided by Apple to design (Use UI Elements Consistently, Consider Adding Physicality and Realism, Delight People with Stunning Graphics, Handle Orientation Changes, Make Targets Fingertip-Size, Use Subtle Animation to Communicate, and Ask People to Save Only When Necessary).
Interactivity of the Smart PhoneThe so-called interaction refers to the feedback that a receiver generates for the message content as well as for the source of the message. Through constant feedback from the user, the source of the message and the receiver can continually correct the contents of the message in order to achieve a more effective two-way communication (Wiener, 1948). Wobbrock, Myers, and Aung (2008) pointed out that it is important to be able to use mobile devices and interact with them anywhere. People will not want to use their mobile devices at a fixed location. Liu (2003) proposed to use active control, two-way communication and synchronicity to measure the interaction of the site. McMillan and Hwang (2002) used mobility on practical operational services,and applied "Measurement of Perceptual Interaction: the discussion of role of control, time and communication in perceptualinteraction" to explore the theme of: User Control, Time, and Direction of Communication.
METHODOLOGYThis study explores the design criteria for "smart parking APP", which firstly through the literature analysis of the smart phone applications, user interface design, and smart phones interactions, and then we pinpoint the relevant literature for sorting out. The literature review is a comprehensive analysis of a large number of studies collected on a certain topic. The literature review requires a comprehensive analysis of the literature, summarizing and analyzing the materials so that the materials are more concise and logical. It is necessary for us to carry out a more specialized, comprehensive, in-depth and systematic discussion of the consolidated literature. The study should have the ability to synthesize, analyze and criticize the literature, as well as tointegrate and develop the advantages and disadvantages of the literature that correspond the research theory direction and hypothesis based on the discussion and research results (Burton & Steane, 2004).
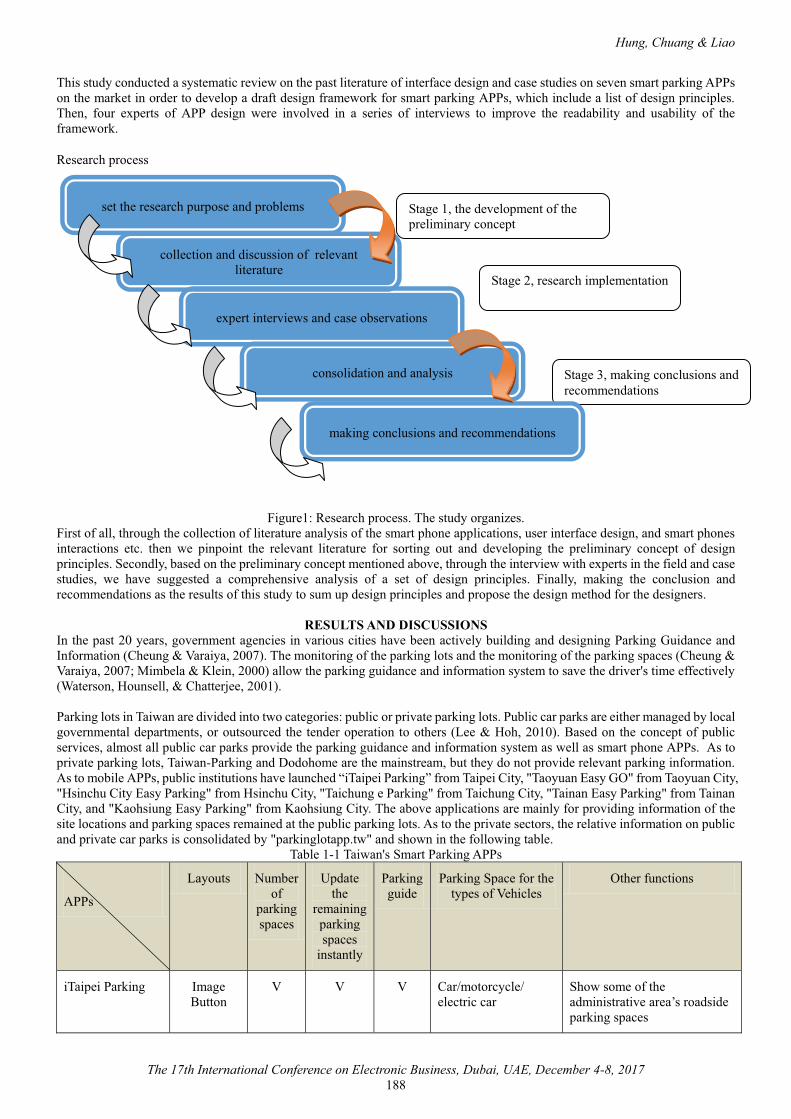
Hung, Chuang & Liao
The 17th International Conference on Electronic Business, Dubai, UAE, December 4-8, 2017188
This study conducted a systematic review on the past literature of interface design and case studies on seven smart parking APPs on the market in order to develop a draft design framework for smart parking APPs, which include a list of design principles. Then, four experts of APP design were involved in a series of interviews to improve the readability and usability of the framework.
Research process
Figure1: Research process. The study organizes.First of all, through the collection of literature analysis of the smart phone applications, user interface design, and smart phones interactions etc. then we pinpoint the relevant literature for sorting out and developing the preliminary concept of design principles. Secondly, based on the preliminary concept mentioned above, through the interview with experts in the field and case studies, we have suggested a comprehensive analysis of a set of design principles. Finally, making the conclusion and recommendations as the results of this study to sum up design principles and propose the design method for the designers.
RESULTS AND DISCUSSIONSIn the past 20 years, government agencies in various cities have been actively building and designing Parking Guidance and Information (Cheung & Varaiya, 2007). The monitoring of the parking lots and the monitoring of the parking spaces (Cheung & Varaiya, 2007; Mimbela & Klein, 2000) allow the parking guidance and information system to save the driver's time effectively(Waterson, Hounsell, & Chatterjee, 2001).
Parking lots in Taiwan are divided into two categories: public or private parking lots. Public car parks are either managed by local governmental departments, or outsourced the tender operation to others (Lee & Hoh, 2010). Based on the concept of public services, almost all public car parks provide the parking guidance and information system as well as smart phone APPs. As to private parking lots, Taiwan-Parking and Dodohome are the mainstream, but they do not provide relevant parking information. As to mobile APPs, public institutions have launched “iTaipei Parking” from Taipei City, "Taoyuan Easy GO" from Taoyuan City, "Hsinchu City Easy Parking" from Hsinchu City, "Taichung e Parking" from Taichung City, "Tainan Easy Parking" from TainanCity, and "Kaohsiung Easy Parking" from Kaohsiung City. The above applications are mainly for providing information of the site locations and parking spaces remained at the public parking lots. As to the private sectors, the relative information on public and private car parks is consolidated by "parkinglotapp.tw" and shown in the following table.
Table 1-1 Taiwan's Smart Parking APPs
APPs
Layouts Number of
parking spaces
Update the
remaining parking spaces
instantly
Parking guide
Parking Space for the types of Vehicles
Other functions
iTaipei Parking ImageButton
V V V Car/motorcycle/ electric car
Show some of theadministrative area’s roadsideparking spaces
Stage 2, research implementation
Stage 1, the development of the preliminary concept
Stage 3, making conclusions and recommendations
collection and discussion of relevant literature
expert interviews and case observations
set the research purpose and problems
consolidation and analysis
making conclusions and recommendations
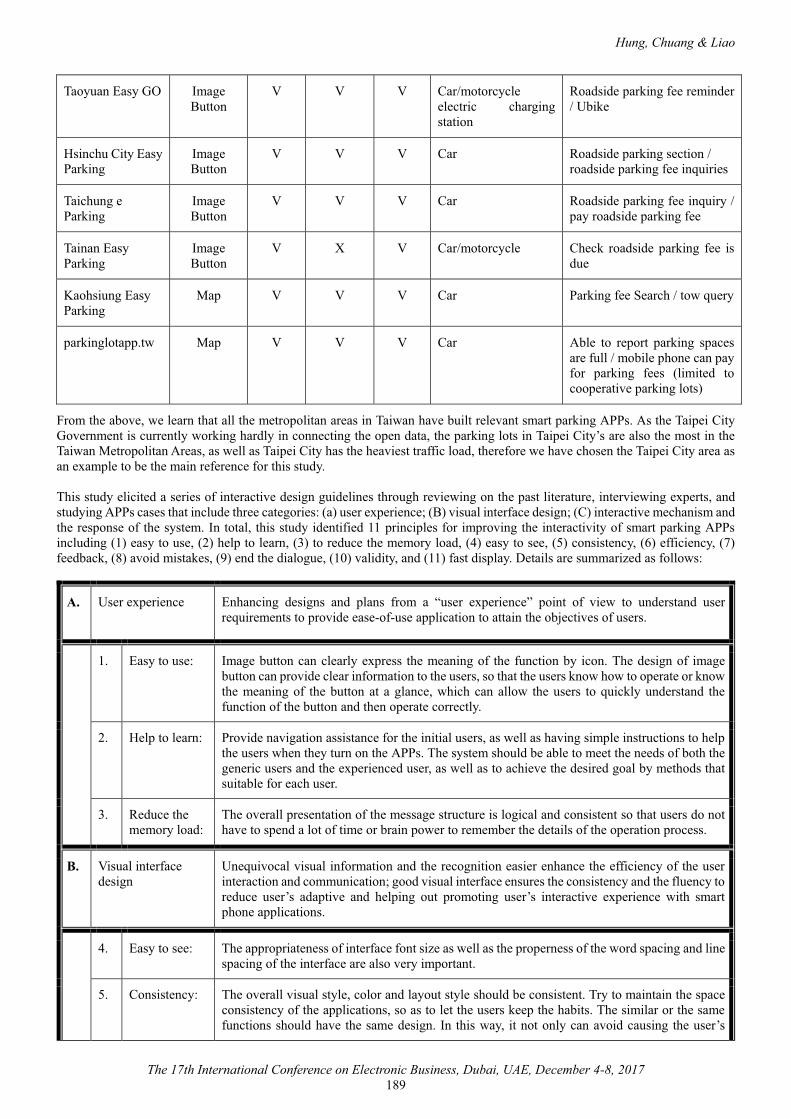
Hung, Chuang & Liao
The 17th International Conference on Electronic Business, Dubai, UAE, December 4-8, 2017189
Taoyuan Easy GO ImageButton
V V V Car/motorcycle electric charging station
Roadside parking fee reminder/ Ubike
Hsinchu City EasyParking
ImageButton
V V V Car Roadside parking section / roadside parking fee inquiries
Taichung e Parking
ImageButton
V V V Car Roadside parking fee inquiry / pay roadside parking fee
Tainan Easy Parking
ImageButton
V X V Car/motorcycle Check roadside parking fee is due
Kaohsiung Easy Parking
Map V V V Car Parking fee Search / tow query
parkinglotapp.tw Map V V V Car Able to report parking spaces are full / mobile phone can pay for parking fees (limited to cooperative parking lots)
From the above, we learn that all the metropolitan areas in Taiwan have built relevant smart parking APPs. As the Taipei City Government is currently working hardly in connecting the open data, the parking lots in Taipei City’s are also the most in the Taiwan Metropolitan Areas, as well as Taipei City has the heaviest traffic load, therefore we have chosen the Taipei City area as an example to be the main reference for this study.
This study elicited a series of interactive design guidelines through reviewing on the past literature, interviewing experts, and studying APPs cases that include three categories: (a) user experience; (B) visual interface design; (C) interactive mechanism and the response of the system. In total, this study identified 11 principles for improving the interactivity of smart parking APPsincluding (1) easy to use, (2) help to learn, (3) to reduce the memory load, (4) easy to see, (5) consistency, (6) efficiency, (7)feedback, (8) avoid mistakes, (9) end the dialogue, (10) validity, and (11) fast display. Details are summarized as follows:
A. User experience Enhancing designs and plans from a “user experience” point of view to understand user requirements to provide ease-of-use application to attain the objectives of users.
1. Easy to use: Image button can clearly express the meaning of the function by icon. The design of imagebutton can provide clear information to the users, so that the users know how to operate or know the meaning of the button at a glance, which can allow the users to quickly understand the function of the button and then operate correctly.
2. Help to learn: Provide navigation assistance for the initial users, as well as having simple instructions to helpthe users when they turn on the APPs. The system should be able to meet the needs of both the generic users and the experienced user, as well as to achieve the desired goal by methods that suitable for each user.
3. Reduce the memory load:
The overall presentation of the message structure is logical and consistent so that users do not have to spend a lot of time or brain power to remember the details of the operation process.
B. Visual interface design
Unequivocal visual information and the recognition easier enhance the efficiency of the user interaction and communication; good visual interface ensures the consistency and the fluency toreduce user’s adaptive and helping out promoting user’s interactive experience with smart phone applications.
4. Easy to see: The appropriateness of interface font size as well as the properness of the word spacing and line spacing of the interface are also very important.
5. Consistency: The overall visual style, color and layout style should be consistent. Try to maintain the space consistency of the applications, so as to let the users keep the habits. The similar or the same functions should have the same design. In this way, it not only can avoid causing the user’s
Hung, Chuang & Liao
The 17th International Conference on Electronic Business, Dubai, UAE, December 4-8, 2017190
confusion, but also allow the users spend less time in adapting or learning it.
6. Efficiency: The users feel fluency when sliding the page interface so as to promote a satisfactory operating experience. System response and the speed of the display must be also considered.
C. Interactive mechanism and the response of the system
Emphasizing fully integrated systems development on hardware and software application program, helping user getting a response quickly, handling the working order and procedures,supplying information accuracy, and being effectively stabilize to obtain the latest informationto meet the needs of the users.
7. Feedback: The system should be able to provide a meaningful and understandable feedback to the user's operation so that users can understand that they have successfully achieved a certain setting or target. If the user makes a very important operation, the system should give a clear response. Agraphical representation of the system loading page or response latency should also be provided.
8. Avoid mistakes:
When the user has a wrong operation, the system should not only let the user know what kind of error he has made, but must also provide a simple solution to allow the user to leave the wrong operation. The interface system operation should be stable, and the interface operation should have a function to return back to the previous page. The APP design should avoid as much as possible having error condition without prior warning.
9. End the dialogue:
A series of actions should be organized into three parts: the beginning, the mean, and the end. When the action is over, the APP should provide a feedback to let the users know that the action has been completed, that is, when the user clicks on any function or parking lot, the corresponding result will be bounced in order to let the user know that the action has been completed.
10. The Validity: The link function is valid and can be accurately linked to the correct page. Place the most important functions on the top (Think Top Down). When the users want to use some certainimportant features, they can spend less time in operating it so as to quickly meet the needs of the users. Do not place the low functional keys or useless functions on the interface in order not to cause the confusion of the users.
11. Fast Display: The pages can be quickly presented when the users click on them. For the users, the user satisfaction for the mobile application can be increased if the waiting time for response can be reduced.
CONCLUSIONThe objective of this study was to elicit the design principles of an excellent interactive smart phone APP, and to solve the demand for public parking in the urban traffic infrastructure. This study was aimed at eliciting design guidelines for the intelligent parking APP for high interaction, real-time, portable, car-driven, small-screen environment that requires highinteractivity. Through the literature review, interview with four experts in the field, urban intelligent parking APP case study (seven Taiwan Metropolitan area intelligent parking APP cases), we have concluded a comprehensive analysis of a set of interactive design guidelines framework. Such set of design guidelines has 11 main points: 1. easy to use, 2. help to learn, 3. to reduce the memory load, 4. easy to see, 5. consistency, 6. efficiency, 7. feedback, 8. avoid mistakes, 9. end the dialogue, 10. validity, and 11. fast display. This study found that the proposed interactive design criteria can be used in the actual design, to enhance the interaction between APP and the user, and can provide references for follow-up developers.
As in the past literature, most of the main features of the field of research are: computer screen display, computer operation, e-commerce or database system development ... and so on as the main direction. However, this study is mainly aimed at real-time, portable, car-driven, small-screen mechanisms as our main research focus, especially in the field of highly interactive smartphone APP field to explore its design principles. Therefore, the application of the field is relatively different from theenvironment of computers. Under such circumstances, the study of the interactive design principles can be extended to the scope of application, such as: in case of emergency, it can also be applied to develop the real-time intelligent APP used by police and fire system, or applied on the rescue intelligent APP used in the disaster rescue ... and so on. As for the industry, the design principles can also be provided for the developers to be used in their development, so that they can design the smart phone APPthat is actually more interactive to the users, as well as having more mobility and real-time functions.
There are several limitations in this study. When applying the APP design principles in different systems, different needs of the
Hung, Chuang & Liao
The 17th International Conference on Electronic Business, Dubai, UAE, December 4-8, 2017191
usage scenarios, or different culture or operating habits in other country, the developed principles may needs revision. Our suggestions for future research are to study how the principles are applied in different types of APP, and compare the different designs principles in different types of APP. Future research can also explore whether there will be any significant impacts fromdifferent sizes of smart device for the users when they use the APP.
REFERENCES[1] Apple (2013). Human interface guidelines, Retrieved from https://developer.apple.com/ios/human-interface-guidelines/
overview/themes/ (1 December 2017).[2] Balasubramanian, S., Peterson, R. A. & Jarvenpaa, S. L. (2002). Exploring the implica tions of m-commerce for markets
and marketing. Journal of the Academy of Marketing Science, 30(4), 348-361.[3] Ballagas, R., Borchers, J., Rohs, M. & Sheridan, J. G. (2006). The smart phone: A ubiquitous input device. IEEE Pervasive
Computing, 5(1), 70-77.[4] Burton, S. & Steane, P. (2004) Surviving Your Thesis. London, UK: Routledge.[5] Cheung, S. Y., & Varaiya, P. P. (2007). Traffic surveillance by wireless sensor networks: Final report. Working paper,
California PATH Program, Institute of Transportation Studies, University of California at Berkeley.[6] Hsu, J. S. C. (2014). Understanding the role of satisfaction in the formation of perceived switching value. Decision Support
Systems, 59, 152-162.[7] Hwang, R. J., Shiau, S. H., & Jan, D. F. (2007). A new mobile payment scheme for roaming services. Electronic Commerce
Research and Applications, 6(2), 184-191.[8] Lee, J. S., & Hoh, B. (2010). Sell your experiences: A market mechanism based incentive for participatory sensing. In
Proceedings of the 8th Annual IEEE International Conference on Pervasive Computing and Communications - PerCom2010 (pp. 60-68). IEEE, Mannheim, Germany, March 29 - April 2.
[9] Liu, Y. (2003). Developing a scale to measure the interactivity of websites. Journal of Advertising Research, 43(2), 207-216.
[10] McMillan, S. J. & Hwang, J. S. (2002). Measures of perceived interactivity: An exploration of the role of direction of communication, user control, and time in shaping perceptions of interactivity. Journal of Advertising, 31(3), 29-42.
[11] Mimbela, L. E. Y., & Klein, L. A. (2000). Summary of vehicle detection and surveillance technologies used in intelligent transportation systems. Working paper, Intelligent Transportation Systems Joint Program Office, Federal Highway Administration.
[12] Monzon, A. (2015). Smart cities concept and challenges: Bases for the assessment of smart city projects, In International Conference on Smart Cities and Green ICT Systems (pp. 17-31). IEEE, Lisbon, Portugal, May 20-22.
[13] Norman, D. A. (2013) The Design Of Everyday Things (Revised and Expanded Edition). New York: Basic Books.[14] Preece, J. (1993) A Guide to Usability: Human Factors in Computing. Boston, MA: Addison-Wesley Longman Publishing
Co., Inc..[15] Sarker, S. & Wells, J. D. (2003). Understanding mobile handheld device use and adoption. Communications of the ACM,
46(12), 35-40.[16] Shneiderman, B. & Plaisant, C. (2010) Design the User Interface-Strategies for Effective Human-Computer Interaction.
Boston, MA: Addison-Wesley.[17] Waterson, B. J., Hounsell, N. B. & Chatterjee, K. (2001). Quantifying the potential savings in travel time resulting from
parking guidance systems—A simulation case study. Journal of the Operational Research Society, 52(10), 1067-1077.[18] Wiener, N. (1948) Cybernetics: Or Control and Communication in the Animal and the Machine, The M.I.T. press,
Cambridge, Massachusetts.[19] Wobbrock, J. O., Myers, B. A. & Aung, H. H. (2008). The performance of hand postures in front-and back-of-device
interaction for mobile computing. International Journal of Human-Computer Studies, 66(12), 857-875.[20] Zheng, P. & Ni, L. M. (2006). Spotlight: The rise of the smart phone. IEEE Distributed Systems Online, 7(3), 3-3.
_����� ��� }�� ��� ���^�¦�� �� �� }��� ��� <}� ������������ ��� �!� #���� ��� �� � ��� ��������������� ��� `'������^ ��$�������^ � ��������� �!� �$��� ��� '��! ���������� ���� ���� &��Proceedings of The 17th International Conference on Electronic Business �''� ��������� &*/<�� =$����� >�/��= � �� ��@�[�
Salminen, Milenkovi� & Jansen
�
The 17th International Conference on Electronic Business, Dubai, UAE, December 4-8, 2017 ����
'��� �������!���������������[����_���$q( ����>��H� ����>��� ����������������'�������� ����������
�}����_����� �|�� �����*��'$������ � ���%�&�����$� ���<�>����#�\$��$�_�%�����!�/����������_��� ��!�
������]������ �{%��$ #$������������� ���^�¦�������� ���{���������
< ����#�}�}��� ��� �����*��'$������ � ���%�&�����$� ���<�>��_��� ��!� �������]��� �{%��$ #$����
���������&�� �%��� `'��������� ��$#��� " � ������ � ���� ���� ���� !���� ��� '������'������ �% � ��� �� �������� !���� ��'� ����� � ��� ��#� ��% ���$��� ���'��! ��������������!�"�� �# ^ ��' ��������# ���!��� ��'���� ����!� �'�������#������� �� ������������������\% ����� ������ �� ��� ^ #�!������'$��������^������ ����� #&��#���$�������%� �#����"%��%��% �'������'������� �#���$�������% �'���� ���� ����������#������� �� � ��'� � ����������#������ � ���� �$� ��$�������^ ���#���� ��������� � �% ����� ������#� !��#� ���$ �� !����� ^ ��������� � ���� ��� #� ��� ���� ��� ����$#���� ���� ]��� # ����'������ ��#� � ��$��� ���� ���� � �# ��%�'�� ���� ���������� ��' ����� ��#� �#�������������$��#����$� ���#�������\% �!��#����������%��%���%�� �%��� ¢#������� ������� ������� ]$������� ���� ���$���������������!������#�!! � ��� ��� ��� ����$#���� ��������� ��� ������� '������� ��� ��#� �$��� ��� ' ����� \% � �$���'������� �!� ������� � �$�� #� %��# ��� �% �� ��$��� ��� �!� �$�%� ��#�^�#$����� ��#� �% � `������� ��������������� ���$��$� �� �� � ���� ��"���� ���'����� � "��%� �% � �$���#����'����������$� ��!�#������� �������� ������$# �"��%�� ���� �#�����������##� ����% � ����$ ���Keywords���=������� �� �������������'���� ��������� � �������������������������|*��� �'��#�����$�%����
�����!"������\% � � ��� �� � �#�$�� ��� � ��� ��� #���� ��� �� � ��� �������������� � �� ��� ����� ^��$ � !���� �% � ���� �� #� �������� ��� ���% �� ����$� ����!���������� �������������������������$��� � ��� ��'� � ��� ��� ���'������ ��!� ��� �% �'���� ����� ������ ��� #� ������"� #� ���#� `' ���� ��!��% �#������� ���������$�����������������������$ ���"%��%�%��# ���% �!$��� `'������������#�$� ��!�#������� �� ������%� ^�����$��� ��� ������ >�# �����#���� ���$�� �% � � '���� ���� %�" ^ ��� ��� ����� #� ��� �% � �$�� ��� � � ���%� ��� ���$� � <�� � ^ ������� �% ����� �����!���%��%���� � ^�������� #&��#���$�������%� �#��" ��������'��^�# �$� !$�������%���������% ����$� ��!��% ����������������'���� ���� ������� ���#������� �� � &��'�����$�����" �������%����� � �% �� �� �% � ��������#��������$��� ���'��! �����������#���% ������ %��# ����%��# ������% �!$���$� ��!�#������� �� �����������������¨�� ����" ���%����$ �������%��$�%����$�������^ �����������!������������� #������� ����!�������'������'������
�$&��$!�&��$���"�$��^ ������ �% � ��'��� �!� ��������������� ���$ �� ��#� #���� ��� �� � ��� ���������� %��� ���� � �� `'��� #� ��� # ����� &�� '�����$����� %�"��������������� $� � ���������� ��� '������ �� ��� ��� �' �� � � ���%� �$ ������ ������� �� �%������ ���@�� *��������� ������ �%�� � �������������������%�^ ��#�'� #����������������� ����'��������%��# ���� %��#��% ��' ������������$ ������������% �'��!�����������!�������������^ ��� ���� ������� ������ &�� '�����$����� �%� � �$���% � �� ��� '����� ��� ���$� � ��� ��������������� ���$ �� "��%� ���������� ���� � ��# ���!� #�� �%�� � � ���� ��� ���$ �� "��%� ���������� �#�'������ ��� �����!������� #���� ����� �����%���� ��#� ��� ����� � ��� �!� �����������}�^�� ������~��� � ��" �$� �������������% � ������ ��������� ��� !����#������� �� ���� ��$� ����������� �������� �"�# ���$� #����� '���$���% ����������������������#�#������� �� ��# !�� #�����% �$� ��!����'$���������� �%���$ ����#�����#����������^ �� ���"���#������������'���� ������ �%��%�����������\% � !�� �������� ��� �� ����'���������$����$#������% �������������� ����!���� ���$� ������ �#��!�!��$���������% �%��%�������� ���� ���$� ��%���'�����$������# ����"��%�#������� �� ���#�#������� �������=������� ������������������������ '��������� ���� �� #� ���� '�� ��#� ]��� ��� � �=�^ �'���� �� ������� ������� ��� ��� � ��� ��� $� #� ��� ���# ���� ��� ���$� � �%��� �% � � ��������������� �%��� %��� � ���� �!� � � ���%� ���#������ "��%� �$��!� �#�� �$�%� ��� � �� ���������� ��#� �$���� �� ���������� &�� �% � !����"����� ��������" ���� !����$������ ��% ��%� ����^ � ����� #��$���% � ���!�������������������$ ��"��%������������������������� ���������(����\% � ��� �'�� �������#�'��������$ ��� ��� #������������������ ������������������������ �����$�%���������� #����� ���#�� ��$� � �������� ������ "��%� ��� �%��� � � ������� �� �' ������� "% �� ��� ��� � ^ ������ $�# ��' �!������ � ��� ��#�^�#$���� �%��� "�$�#� ���% �� � �^ �' �!������ �# ������$� `'��� #� �� ���et al�� ��������'���� ���#���^��#� ������� �# ���!�� �%��� !�������'��%�����^ � ��� ��!������������� ���#�'����������%� �� ��������� �$ �� ���!��% ��#�'�������#�$� ��!������� ��*������������������$ ���%���#��������������#� ��
Salminen, Milenkovi� & Jansen�
The 17th International Conference on Electronic Business, Dubai, UAE, December 4-8, 2017 ����
���������������'�� �������#^����� ����$���%����% �'����! ��������!�#������#�������������������� �� �����' ��������� #$� ����������!���'��#$���^������#�'��!�������������#��##��'� ��$� �!��� !! ���^ �'����������#�# ����������������� `��'� ��!��$�%��#^ �� � !! �������#������� ���������� #��^���� #�"�� ���� ����� �$#� ��� ��� �^ ����� � #��� �' �#� �������� ���� ������� "%��%� %��� '�������� �$�� #� �% ����#�������� '$����% ���� "������� ��� ��� �#�'�� ���������� ��� '���� �!� �% ��� ��� �� '��� �� �� ��'���� � ��#� ��^��#� ������� ����� ��� �^ �'�" ��� ��� #� ���$ ��� �" �����!!���#����� ���#^���� ��"%��%�� �������$�� ��� �%��� ������!�$� ��'������'������ ���'��%�����^ � ������� �� �#�'����� � ��� ��#� <�$�� � ������� #������$��%� � �" �� '��������� ��#� ��!�����$��$���� � ������ !��� !���$� � �!� �#�'������ ��$� � ��� ���� ���� "%��%� � ��� ��� �$�� ��� �� #�^������ � �" �� %$���� ��#� � �%���������� ���$ �� \"�� ��]��� ����� ��� �%���}Ô�^�� ������~��� �����������$# �������!�����������#�������!���� �¥����� ������������#�'�����������^��^ �$�'� #�������������#�������� �%������$����"����� ������������������^ ��� �������%��'�� ����� �� ��������$�^ �������������!����������������� �^ ����!� ���#�'�������% ������'���� ���!��������������� ���� ������� ��� ����^��$ � `�����������������#��%���������@��'��~������ ��%�������������� ���$��� �������������������$��� ^ �������^��$ �!����#�����= �'�� ����� �����$��'�� ������� `���������^��$��� ������%���!����#����� '� � ������' ����� �����#�������$�$��'���������'���� ��!������������������*���������������}Ô�^�� ������~��'�~������$ ���%��������#�������% � #����$� � ����!�����$�# �����#���#�� !�� #������� �����!$�������$�������%����� ���'��� ��!�#��^����!$�$� ����������\% �'������!����������������!��������� �� #����/#"��#����#�\����#������~��"%��'���$��� ��%���$�� ����% � ��� �� "����#�!! � ����������������� ����� %��# ��� �% ������������ �����%��%���� �����^������������������#�'������ '� � �����������# ���� �������� ��� ��� � ���� �!� � ��$�� ��� ���� �� !! ���^ � �''��������� � '� � ���� �� �����# ���� � ����� ��� �% � ������������� �/#"��#�� ��\����#������~�� }Ô�^�� �� ����~�� � ������� �% � � ������ � � ������'���� ��� ��� �%����������������� ���$��� � ��� � � ��� �� ���� �������!�� ������ �%��� ������%����'� % ���^ ���#������ ��� ���%������� �% ������ �$����� �� ������������ �% �%$�#� #���!�� ������ �%����� ���'��������^������ �^�������� �'���!��������#��% ��'�������������% ���$� �!���# ���������������� '� � ��������$ ��%��� �� �����$�%�������!����������!�#��������������%�������� �� ������� ��!��% ��� ���'���� �����������������#���������!������������� �������������%��!��% ����^ ����$ ����#�'�������#�^��$ � `�����������% ������ � ����!�#������� ��������%�"����� �!������'������������#� ��et al��������'�~�~����� ����������������� #����%�^ ���% ����%��' �'� ���� !! �����#����#��^ ���$��$�����%��� ��&���##��������� �% � ����� � ��� ���$ �� ' ��������� ��� ��������������� �$��$� � � ���� %��%��� �$����#�� �������� ��#� ���'����� #� �<��� ��� ��[~��= �������������_�% ������������% � ����^ �������� �� � ���%�����% ����� `���!�#������� �� ���#������������������� ���$� ������ �!�$�#�����% �������� �������!�'������ ���#����# �������� `��'� ������% ������^��#�<$��� ���� ^� "������� ��=�^ �'������#��������������'������$������ ��% ���'��������� `' �� �� ��!����������#������� ���������=������� �������#�����#��" ���������%����� ��%��&��'�����$�����=�^ �'������#���������������#^���� �'��^�#�����% �#������� �������"��%��������� `' ��� ���"��%��% �#������#����� ����\% �#������ ���"��%��%�����^ �������^ �"�������$�����!����������$'�"��%�����^���^ ����$���������#�'����������''�����������������^�����$��� ��� '���� ��� ��� ����� ��� �% � #�� ���� � �" �� ������ ��#� �''�� #� � � ���%� ¥� "��%�$�� ������ � � ���%�� ���$�#��� ������#����^ �� �� �� � � !�� $���# �� ��#� "��%�$�� �''�� #� � � ���%� �% ��� !$��� ^��$ � ������� �''��'���� #� ��!�� ��������������� �� ���$������=�^ �'������#���������������$�� ���������������� ����� ������"��%��% �#������$��"��%��% �����������������$���� ��!������'��#$������#� '��� �� �� ����% �� !���� �!� ��������������� #������ ��� � �" �� �% � #���� ��� ������� ��#� ��% �� # '���� ���� ��� �%���� # �'�� ������# ���� � ��'� � �^�� � ��� �% � ^���$ � �!� � ���� �#����#��^ ���� �% � � ������ ��� �%��� �$�%� �� ���� � �!� ���������� ���$����� ��� `�� � ���#�!!��$��� ��� ��!$� � �%��$�%�$�� �% � ��������������� ����$#���� �% � ���#���������� �� ���^ �#��^ �� # '���� ����� �$�%� ��� ���� ������}Ô�^�� ��� ���~�� \%��� �� ���^����#��^ � ^ ��$�� #����#��^ � #�� ���� � '� � ���� �� ����� � ��� ���$ � ��� �% � � �� � �%��� �% � �"����� �����^ � '���#������ ���$������ ��#� ' ������� `' �� �� � ��� #� ��� �� � %��#�� ��#� #����#��^ �� ��� �% � ��% �� %��#�� �� ������� ��$���� �#��^ ���!���# ������������������" ���������' ������^ ����� ������ ��$�� ������% ��������������\% ����$ ����������%���#���� ��� ������� �� ����� ������ #��$�� �� ## #� ��� �% ���������������� ���� `���# ' �# ������"%��� }Ô�^�� �� ����~�� � ! ��� ������� ��$� � ��� � ��$�� ��� "%��%� ����$# � ����������� �������� &\� ��!�����$��$� �� ������� ��� �!� �% � ` �$��^ � �����%�� ����� ��� ��#�� �# ��%�'�� ��#� �% � ���!��� ��������������� �$��$� � /^�# ������ ����� � ��� �!� #���� ��� ������� � '� � ���� �� ���'� `� ������������������$ ���!�"%��%� �% � � �������� �� ��$�%� � � ���%� ��� !������ ���'� � �$�# �����#�����'������#$ � ��� �% ���^ �����!� �%��� ��� � ��� �% ����������������� �������=�^ �'���������������������/^ ���%�$�%�����#���#�� � �����%����� �����������!�#������� �� �'���� ���%�^ �� ��'� � �� #��������$����� #����^ ����# ���� #���#�����$���������# ��������!��% � ����$ ��� �' �������!����������� � ���' ��' ���^ ���������� �� ���������##� �������%���� � ���%���'������# ���� #�������!���������!��% �'���� �����% ##�������%������% ������ � �����' ����!�#������� �����������" ������#���$�������% ����$� ��!��% ������ �����% ���������������
#$�%�!���������H�������\% �'�������� � ���%��$ �������!��%���"���������%����� ��% �� ���% � ��������#��������$��� ���'��! �����������#���% ������ %��# ����!� #���� ��� �� �� �%��� �� � %��# ����� �% � !$��� $� � ��#� `'���������� �!� #���� ��� �� � ��� �������������¨� ��� �^ ��� " � ����� ��"� #��'��! ���������!����#�!! � ���!� �#���!�'������ �� �������� ���� ���� ���� ��� '� � $����' �� �^ ��% � ��%��� �� �¨�\% �!����"����� �������"����# ����� ��$��#�������� ������� �%���$ ��#�������#��% ������������� �%�#��''�� #��
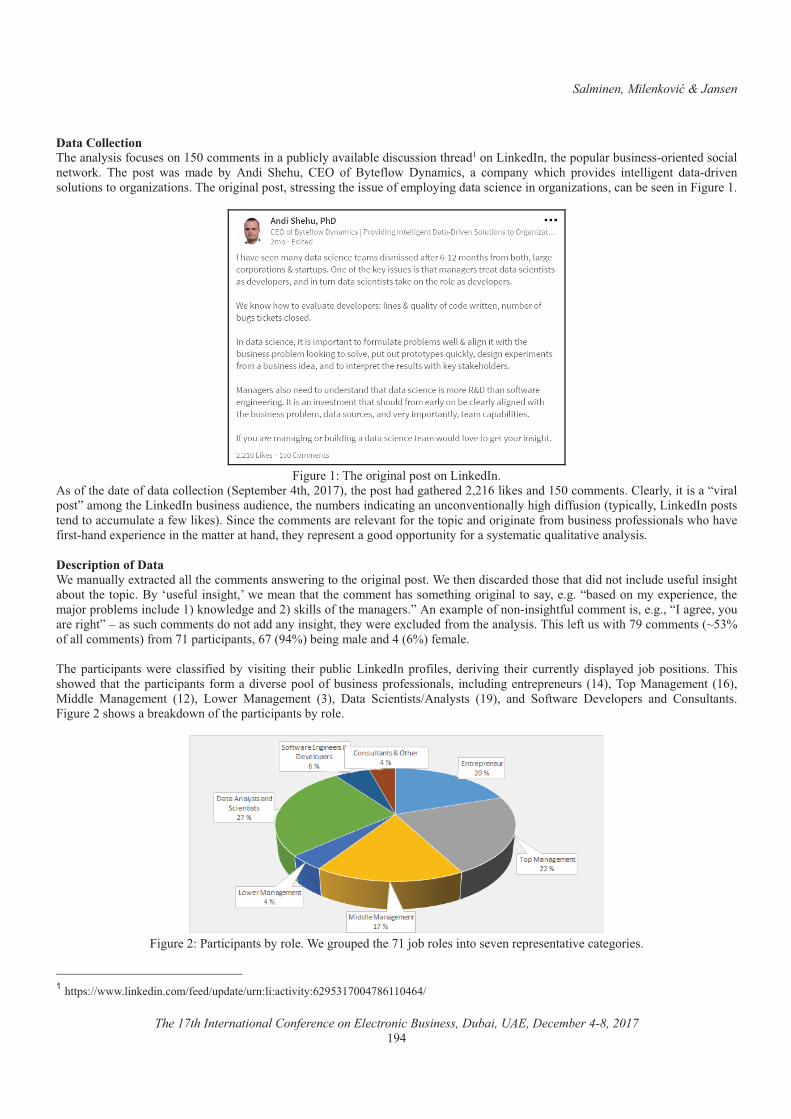
Salminen, Milenkovi� & Jansen�
The 17th International Conference on Electronic Business, Dubai, UAE, December 4-8, 2017 ��@�
�!���� ������\% ����������!��$� ������������� ���������'$��������^������ �#���$�������%� �#��������� #&����% �'�'$�����$��� ������ �� #��������� �"���� \% � '���� "��� ��# � ��� ��#�� _% %$�� */�� �!� <�� !��"� =��������� �� ���'���� "%��%� '��^�# �� ��� ���� ��� #����#��^ �����$�����������������������\% ����������'�������� �������% ����$ ��!� �'�������#������� �� ������������������������ �� ��������$� ����
����$� ����\% ����������'����������� #&��
����!��% �#�� ��!�#�������� �������_ '� �� ��@�%����������% �'����%�#����% � #�����~���� ����#��������� ����*� ���������������^�����'������������% ����� #&���$��� ����$#� �� ���% ��$�� �����#�����������$����^ ����������%��%�#�!!$��������'������������ #&��'������ �#�������$�$��� ���! "���� ���_��� ��% ����� ������ �� � ^����!����% ���'�����#��������� �!�����$��� ���'��! ���������"%��%�^ �!�����%��#� `' �� �� �����% ����� �����%��#���% ��� '� � ��������#��''���$�����!��������� �������$�������^ �����������!�����(�������!��� ����$����� `����� #������% ����� �������" ���������% ����������'����� ��% ��#�����# #��%�� ��%���#�#���������$# �$� !$�������%�����$���% ���'���<��¢$� !$�������%����" �� ����%����% ����� ���%������ �%��������������������� ������ #������� `' �� �� ���% ���]���'���� �������$# �������"� #� ���#������������!��% ������ ������� `��'� ��!����������%�!$������ ������� ����&���� ����$��� ����%���¥�����$�%����� ����#�������##����������%����% ��" � � `��$# #�!�����% ����������\%���� !��$��"��%�������� �����¸�����!��������� �����!�������'������'������~����@���� ������� ���#�@��~���! ��� ��\% �'������'�����" � � ������!� #� ���^�������� �% ���'$����� ���� #&��'��!�� ��� # ��^���� �% ��� �$�� �����#��'��� #� ]���'��������� \%����%�" #� �%��� �% �'������'����� !������#�^ �� �'�����!��$��� ���'��! ���������� ����$#���� ��� '� � $��� ��@���\�'������ � ��� ��~�����##� � ����� � ��� ������ ��" �� ����� � ��� ����� =���� _�� ������¡��������� ������ ��#� _�!�"�� � = ^ ��' ��� ��#� *���$����������$� ����%�"������ ��#�"���!��% �'������'����������� ��
����$� �����������'����������� �� ����$' #��% ����]������ �������� ^ ��� '� � �����^ ���� ���� ��
���������������������������������������������������%��'��¡¡"""���� #�����¡! #¡$'#�� ¡$����������^����~��������@�[~���@~@¡�
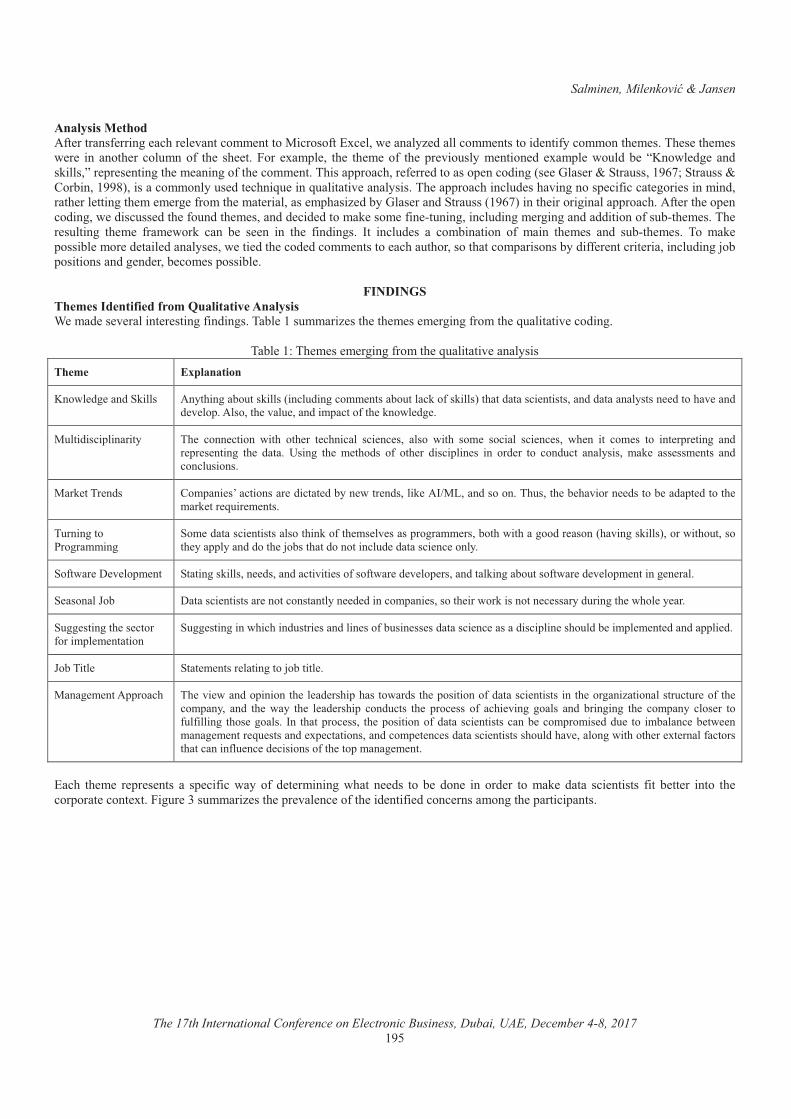
Salminen, Milenkovi� & Jansen�
The 17th International Conference on Electronic Business, Dubai, UAE, December 4-8, 2017 ����
� �����#�������!� �������! ������ ��%�� � ^�������� �������������!��/`� ���" ������� #��������� ��������# ���!����������% � ��\% � ��% � ��" � � ��� ����% �� ���$��� �!� �% � �% ������ `��'� �� �% � �% � ��!� �% �'� ^��$���� � ����� #� `��'� � "�$�#�� � ����"� #� ���#����������� '� � �������% �� �������!��% ����� ���\%����''����%��� ! �� #��������' ����#������ ����� ����_���$������~���_���$�����*����������[�����������������$� #�� �%���$ �����$�������^ ����������\% ��''����%�����$# ��%�^��������' ��!������ ���� ��������#�����% ��� �������% �� � �� �!�����% ���� ��������� �'%���� #�������� ����#�_���$������~�������% �������������''����%��!� ���% ��' ����#�����" �#���$�� #��% �!�$�#��% � �����#�# ��# #������� ���� �!�� ��$����������$#����� ��������#��##�������!��$���% � ��\% �� �$������ �% � � !��� "���� ���� � � � �� ��� �% � !��#����� &�� ����$# �� �� ������������ �!� ����� �% � �� ��#� �$���% � �� \�� ��� �'������ ���� �# ���� #������� ���" ��� #��% ���# #����� ������� ��%��$�%��������%������'�����������#�!! � ������� ���������$#����]���'�����������#�� �# ���� ��� ��'������ ��
*��!��<������������������������H� ����>��� ������ ���# �� ^ ������� � ������!��#�����\��� ����$������ ���% ��% � �� � ������!�����% ��$�������^ ���#�����
\��� ����\% � �� � ������!�����% ��$�������^ ���������������� $q( ����
���"� #� ���#�_������ ����%�������$��������������$#�������� �������$��������!����������%���#������� ����������#�#�������������� #����%�^ ���#�# ^ ��'��������% �^��$ ����#���'�����!��% ����"� #� �
�$���#����'��������� \% � ���� ������ "��%� ��% �� � �%������ ��� �� ��� ����� "��%� ��� � ������� ��� �� ��� "% �� ��� ��� �� ��� ��� �'� ����� ��#�� '� � ������ �% � #���� >����� �% � � �%�#�� �!� ��% �� #����'��� �� ��� ��# �� ��� ���#$��� ���������� ��� � ��� ��� ���� ��#������$������
���� ��\� �#�� *��'��� ������������� �#����� #����� "��� �#������ ��&¡������#�������\%$����% �� %�^����� #������ ��#�'� #�����% ����� ��� �$�� � ����
\$���������������������
_�� �#������� �������������%�����!��% �� �^ �����'������� �������%�"��%������#�� ������%�^����������������"��%�$�������% ���''�����#�#���% �]�����%���#����������$# �#������� �� ������
_�!�"�� �= ^ ��'� ��� _���������������� #�����#�����^��� ���!���!�"�� �# ^ ��' ������#������������$����!�"�� �# ^ ��'� ������� � ����
_ �������}��� =������� ��������� ����������������� # #�������'��� �������% ���"������������ � ������#$������% �"%�� �� ���
_$�� �������% �� �����!�����'� � ��������
_$�� ���������"%��%���#$���� ����#���� ���!��$��� �� ��#������� �� ������#����'��� ��%�$�#�� ���'� � �� #���#��''�� #
}���\��� � _��� � ����� ����������]������� �
����� � ����''����%� \% �^� "���#��'�������% �� �# ��%�'�%�����"��#���% �'���������!�#������� �����������% �������������������$��$� ��!��% ����'����� ��#� �% � "��� �% � � �# ��%�'� ���#$���� �% � '��� ��� �!� ��%� ^���� ������ ��#� ��������� �% � ���'���� ���� �� ���!$�!������� �%�� ������� &�� �%���'��� ���� �% �'���������!�#������� ������������ ����'����� #�#$ � ��� �������� �� �" ������� � ���� �$ ������#� `' ������������#����' � �� ��#������� ��������%�$�#�%�^ ��������"��%���% �� `� �����!��������%���������!�$ �� �# ���������!��% ���'������ � �����
�/��%� �% � � � '� � ���� �� �' ��!��� "��� �!� # � �������� "%��� � #�� ��� � � #�� � ��� ��# �� ��� ��� � #���� ��� ������� !��� � �� �� ����� �% ����'���� ����� `�����$� ����$������ ���% �'� ^�� �� ��!��% ��# ���!� #����� �����������% �'������'�������
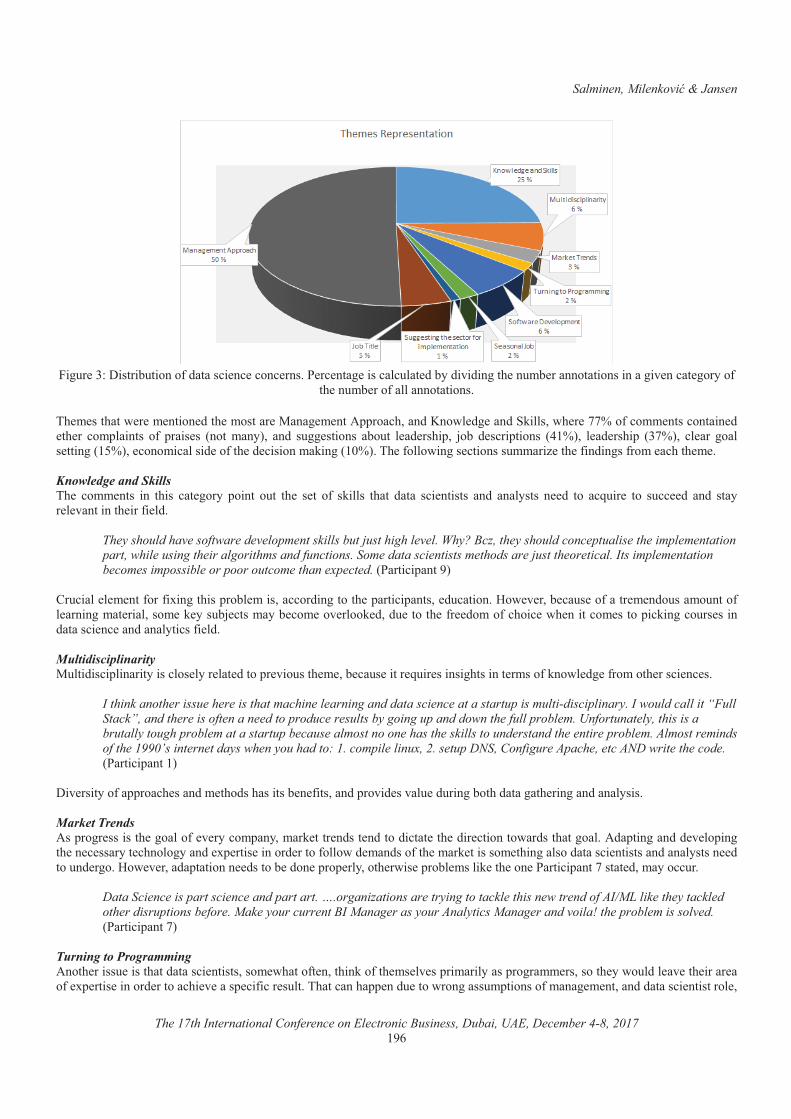
Salminen, Milenkovi� & Jansen�
The 17th International Conference on Electronic Business, Dubai, UAE, December 4-8, 2017 ��~�
����$� ����=������$������!�#������� �� ����� ����� �� ���� ��������$��� #����#�^�#�����% ��$�� ���������������������^ ����� ������!�
�% ��$�� ���!������������������\% � ���%���" � �� ����� #��% �������� ������ � ����''����%����#����"� #� ���#�_�������"% � ������!����� ����������� #� �% �� ���'������� �!� '���� �� ����� ������� ��#� �$�� ������� ���$�� � �# ��%�'�� ]��� # ����'������ �@����� � �# ��%�'� ������� �� ��� ������ ������������� ������������# ��!��% �# ��������������������\% �!����"����� ��������$������ ��% �!��#�����!���� ��%��% � ��Knowledge and Skills \% � ���� ���� ��� �%��� ��� ����� '����� �$�� �% � � �� �!� ������� �%��� #���� ��� ������� ��#� ��������� � #� ��� ���$�� � ��� �$�� #� ��#� ������ � ^��������% ���!� �#���
They should have software development skills but just high level. Why? Bcz, they should conceptualise the implementation part, while using their algorithms and functions. Some data scientists methods are just theoretical. Its implementation becomes impossible or poor outcome than expected. ��������'�������
�*�$����� � � ���!���!�`�����%���'���� �����������#��������% �'������'������ #$���������" ^ ���� ��$� ��!����� � �#�$�����$����!�� ���������� ��������� �� ���$�] ��������� ��� ��^ ����� #��#$ �����% �!� #����!��%��� �"% �������� �����'���������$�� �����#������� �� ���#�����������!� �#��Multidisciplinarity �$���#����'���������������� ���� ��� #����'� ^��$���% � ��� ��$� ����� �$�� �������%������� �����!����"� #� �!������% ����� �� ����
I think another issue here is that machine learning and data science at a startup is multi-disciplinary. I would call it “Full Stack”, and there is often a need to produce results by going up and down the full problem. Unfortunately, this is a brutally tough problem at a startup because almost no one has the skills to understand the entire problem. Almost reminds of the 1990’s internet days when you had to: 1. compile linux, 2. setup DNS, Configure Apache, etc AND write the code.���������'�������
�=�^ �������!��''����% ����#�� �%�#��%�������� � !�������#�'��^�# ��^��$ �#$��������%�#�������% �������#������������Market Trends ���'���� �������% �������!� ^ ������'��������� ���� �#��� �#����#����� ��% �#�� ��������"��#���%���������#�'�������#�# ^ ��'�����% �� � ������� �%���������#� `' ���� ������# �����!����"�# ���#���!��% ����� �������� �%���������#������� ���������#����������� #����$�# ������" ^ ����#�'�������� #������ �#�� �'��' �������% �"�� �'���� ������ ��% ��� ��������'���������� #���������$����
Data Science is part science and part art. ….organizations are trying to tackle this new trend of AI/ML like they tackled other disruptions before. Make your current BI Manager as your Analytics Manager and voila! the problem is solved. ��������'�������
Turning to Programming ����% �����$ �����%���#������� ����������� "%����!� ����%�����!��% �� �^ ��'������������'������� ��������% ��"�$�#�� �^ ��% ����� ���!� `' ���� ������# �������%� ^ ����' ��!���� �$���\%�������%�'' ��#$ ����"��������$�'�������!������ � ������#�#������� ��������� ��
Salminen, Milenkovi� & Jansen�
The 17th International Conference on Electronic Business, Dubai, UAE, December 4-8, 2017 ����
"%��%�" �"����#���$������ ���
One of the challenges I face is that the DS want to be a developer until their stuff breaks and they get called at 2am to fix it. I think a DS should build prototypes but production is better left to developers/engineers. ��������'����[��
�Software Development _��� ��% ����� ���'���� ��"�����#������������ �" ����!�"�� �# ^ ��'� �����#�'���������������� ���# ����#�#������� �� ���#��������������% ���% ������ �'������'������$���� #��% �'$�'�� ���#�#$�� ���!���!�"�� �# ^ ��' ���������# �����'������$���% �#�!! � �� ��������"��%���� ����� �" ���$��� �������� � ����#������� �� ����#���!�"�� �# ^ ��'� �����
Lines and quality of code are not the only parameters to judge software development. If these lines and quality do not align to business objective it is a failure and to add to your statement if the software products that are gathering and providing you with the data on which data scientist do number crunching, are not build in the right way I am sure neither will be any data data science nor will be any software product. It all has to happen in harmony and as a unified system not fragmented and unstructured.���������'����~��
�Seasonal Job � �!�$�#��%���'������'������%�����!�#������� �� ��������� ��!���� �������]�������� ��!� ���% ������������ �#�� ��#������� ��������� �� ������^ #����#�!! � ���'����������%�������$# �'�������������#�# ^ ��'� ���_���' �%�'����� �� ���'�����!���#������� �������������"����'������� �!����$���'� ����'��� ����%������� ������! �� #������'��������!���"%��%��% ��#������%�^ ��% �� � �������$���!����������
Just playing devils advocate here... So, what happens when a “data scientist” has revealed no useful (or additional) insights? Are the businesses obligated to still hold on to them when no value is being demonstrated? I can’t see that a team is let go whilst they are adding value... My personal view is that many “data scientists” have skipped the general data analytics phase, which is why they are let go once the job is done. Your seasoned data analysts are adept at finding general problems and coming up with solutions. Machine learning and AI sounds great but most companies don’t need it! Most value from an analytics perspective is still generated through “supervised” and deterministic methods. There is big gap between ”General Data Analysts” and ”Data Scientists”. ��������'��������
�Suggesting the Sector of Implementation �� ����� ������'�����$����!��$� #�����''������#������� �� ���#���������������% ����' ���!���#$���� �������]$�������$��� ���� �^�� ���
Our annual reviews for schools are built in our shop, for presentation to client systems that lack capacity and can’t afford in-house expertise. That's a kind of niche that needs to be served more often, even in the private sector. ��������'�����~��
�Job Title � ������� ��� �%��� �% � �� �% �'������'����� `'� �� #� �% ��$ ������ �%��� ��� ��� ]$��� �% � ���� � �#���� ��� ������� ���� �%���� #���%����������� ����������������������% �"%�� �]���# ����'������������"��%� #$���������'%�� ��!�# ^ ��'���������#�^�#$��������#������� �������
They [data scientists] need to be a resource, like engineers, rather than a project hire. Perhaps the name is the problem, most companies don’t see themselves in the “science” business. So maybe Data Engineer would be a better name. ��������'��������
�#�������((������������� � ����''����%�"���%��%���'� ^�� �������% ���#�����" ��'������������� ^ �����$���� ���� �������# �����# ����� ���������� �# �����\% ��$���� ���� ������� �� �����\��� ����

Salminen, Milenkovi� & Jansen�
The 17th International Conference on Electronic Business, Dubai, UAE, December 4-8, 2017 ��[�
\��� ����_$���% � ���!������ � ����''����%����������� $q( ����
}=����$ �� }���# ����'�������}=���� �����'��' ����� ����#��� ���������% ������� �"��%��% ����������#������� �������%�$�#�%�^ �\%�� �}=���� � ��% ������������� ���"��%��% ��� ��'��� #�����% �]���'���������#$������% ���� �^� "�� =���� ��� ������� �� � � �$�� #� ��� %�^ � ^����$�� ��% �� �������� ��� � ��#����� ��!�"�� � ���� ������ ���_�� ��!��% ����� ������ �'�����^ ���#�����$# ���'��' ��#������������ �" ��}=��
� �# ��%�'� \% � ��'���� ��'� ����� � ��� %��� "% �� ��� ��� �� ��� `' ���������� ����^�������� ��#� �����������������# ��% ����'�����������% �"����% ��%��#� � `� ������ �$ �������#�%�"��% ��'�����%�� �����% ��� �'��� �� <���������� �% � $�# �����#���� �!� ���$��$� �� ����# � �% � ���'���� ��#� ���� � ������� ��� #������� �� �
/������������' ���� �% ���% � ��������"�� � ����!��% �� �$�� � �����!��% �#������� ���������$���% �������!�!$�#�������% �� #������^ ���� ������% �� ��������� ������#����� ��% �"����#������� ������"�����' ��� ����#�"%���"����� �� �$�� #��!��% ��
\ ����!�' �'� � ��#������� �������������]$����� ���� ���� �' ����������"% ���������# �����������#�'����������'��] ����#������� �� ��%�$�#�� ��%�$�%���!������� ����!���#�^�#$����
*����������$��#����$� ���#�������
����� ����%�$�#���"����%�^ ����� ����������#�^�������!�"%����% ��"����$� ��% �#����!��������%����% ��������� ��# �$�� �� �$ ����!����#������� ��������
�JD Issues ����� �!� ���� ���� $�# �� �% � ����� � ��� �''����%� �% � � !��$� #� ��� }��� # ����'������� "% � � ���� ���� ����������� � ����^ �! #�����" � ���# ����$�����'��� ���� �$ �����%���#������� ������������"�������# ^ ��' ������#� ���� ����#$ ����������!�'� ��� �# !���������!�]���� �'���������� ��\"��#������� �������'������$���%���'���� ��^ ���" ������
“One of the key issues is that managers treat data scientists as developers”. Indeed, I have seen recently many positions requiring data scientists be capable to make iOs apps! I also think some corporations and startups are losing the compass of what data scientist is! ��������'����@~��
�Data Science is part science and part art. The issue here is two fold. One, the IT recruiters are used to coders. I got sent the usual skill assessment form asking for advanced level SQL expertise. No problem with that. Problem was there was none on data science. Second, organizations are trying to tackle this new trend of AI/ML like they tackled other disruptions before. Make your current BI Manager as your Analytics Manager and voila! the problem is solved. Just browse here on Linkedin for Analytics Managers profiles in large IT/Consulting organizations. The usual skill set like SQL, OLAP, SSRS, SSIS, Power BI, and point & click data visualization tools. How would they engage a Data Scientist?���������'�������
�� ����������$# ��%���' �'� �! �����!������ �%�^����" ���# !�� #�]���# ����'���������������% ��'% � ��!��% ���$�����#������� �� ������� �� � ��� '� � $�� ���� �� #� �%��� �������������� �%�$�#� �� � $'� ��� �% � ]��� # ����'������� ���� � �%��� #� �� ���� % �'� � ����� ��� ���� ���% � ����
I think if we had less names and definitions for roles in a single business world, we’d do a better job as a team. I bet there is no way to define all those existing roles; data architect, data analytics, data intelligence, data scientist,... same goes to process, system,etc. And by the way, your definition of a sw developer is very interesting too. I believe a true sw developer would start with business need on data side and ends her/his work when the right data is out.���������'����~@��
�Leadership _�� � ����� � ��� `' ���� %�^ � �$�� �� #� �%��� ����� ��� #�� ���� � #� ��� � � `' ��� ��� �% � !� �#� �% �� �� � ���������� ��� � �#����������� ���*� ���������������% ����% ��� #����%�^ �$�# �����#������#��''����$��� ������"� #� ���#� `' ���� �<�� #�����% �����������" �!��#��%����% �'���� ��������$�# �����#�����!�#������� �� ���#�����'������������% ���������������������'��������� #��%���'��' ��$�# �����#�����!���� ������������������^��������#�%�^�������������� �� � ������"% ��� ��������������#� `' ���������!����% �#������� �� �� ����
Ironically, the terms Data Analytics, Data Science, Business Intelligence et al tend to be misnomers in the way these are practiced in the industry, and especially in the way a lot of consulting companies offer these services. Most of them seem to be oriented towards ”technology implementation” of the above. Could be because they are led by technologists, or because that is the service that clients want out of these companies. In a typical Problem -> Data -> Insights -> Actions

Salminen, Milenkovi� & Jansen�
The 17th International Conference on Electronic Business, Dubai, UAE, December 4-8, 2017 ����
journey, consulting organizations that offer Data Analytics tend to focus on the 2nd leg of this journey i.e. Data to Insights where the focus is on data structures, sources, integrations, implementation etc. All these things make it a technical story. And therefore, a sense that data scientists/analysts are coders. However, the 1st leg of identifying the Business Problem, and decomposing it into a Data Problem seems to be out of scope. Maybe organizations need to focus on building Data Science/Analytics practices that has a healthy mix of 2 types of roles: 1) Business Analysts with relevant industry expertise and background/understanding of Statistics, and 2) Technology developers.���������'�����[��
�Economical Aspects *$������� �������#�� ��������� �������# �������^ �� `' �� ����������� �� ���%��% ��'��!�������% ��%����� ������ ��% ������� ������!���#�������!��������!�#������� �� ���#�#�������������� ��������������� ���������% �� #�!�����!$����!$���������#������� �� �� ���"����� �#������ ��!� �% � ���$ ��� ����� #� ���� ���"%��%� ����%������#������� ������� !���' ���� ���'����������"% � � �% ��"�������$�����#��#������������������� �'���������#��% ��� ���^ #������% ��'�����������
When data science teams are set up just as a checkbox to prove stakeholders that we are also doing something with data... disillusionment generally happens. Once backed by strong business use cases and clearly defined expected outcomes - it can do wonders. However, very few clearly understand the truth behind the hoopla of data science!! ��������'��������
�Bang on.. Most commonly faced problems by data sciences organizations.. Clients end up creating a 90 day analytics plan sometimes.. I mean come on!! Everyone needs to understand that data sciences or rather decision sciences is a slow medicine.. You just can't expect very short term outcomes.. And even worst part is that today I see a lot of software companies masquerading as data sciences companies not solving business problems rather developing black box solutions.. These put more pressure on genuine data scientist companies to deliver quick outcomes.���������'��������
�� � ���� �����$# � �%��� #���� ��� �� � #� �� ���� � � �������� '��^�# � �$���� � �$����� �$�� ���% �� ��� � ^��$��� �� ����� � ���� ��#� # '���� � ^����� �$��������'��� �� ������� ���%����� ��������!��%���#����'��� ��Team of People \% �� ������ �!���"��#��� ����% � � �������� � �����������$'��!�#���� ��� ���������$�� �� � ����!�' �'� �"��%�#�!! � ��� ��� �� ����%�%������������#�^ ��������"%���� �"���������� �% ��������^������'���� ������������ ���������� ����
Tom Ordonez shared with me that Data Science is not a role but a team. You have to have a data scientist, a business leader, a UI/UX specialist, and a programmer. A lot of organizations are under the mistaken belief that hiring a Ph.D. is all that is required. Data science requires a dedicated team to deliver actionable insights. ��������'�����@��
�Clarity about Data Use and Goals ��^������^������������������#��� ����������� �������#��������% �'������'��������$��������%�^������� � ^�� #�� ^ ���!� !!��� ������#�'��#$���^��������# ��% ����������������������$� ��%������� �'��� ���� ��"�� ��!��%�� ���������������"%���� #������ �#�� ��!����% �'� ^��$�������� �'��� ��
I would agree with the sentiments of this post. Aligning on the business goal, quick prototypes, and failing fast is very important in this space. I would also point out that, data-scientists treated as a developer analogy is not that bizarre though. We have to keep in mind that, in industry research without results may or may not be affordable all the time. As a developer has to make sure his/her basic idea works before architecting a software, so do we in making sure the research cycles are short, followed by quick validations and alignment on the business problem. Data Scientists = Hackers + Developer + Statistician + Machine Learning Experts + Business savvy + Researcher (in my opinion). ��������'�����[��
����^�������'�����(��\��� ����%�"������ ��#�"���!��% ����� �������'������'������
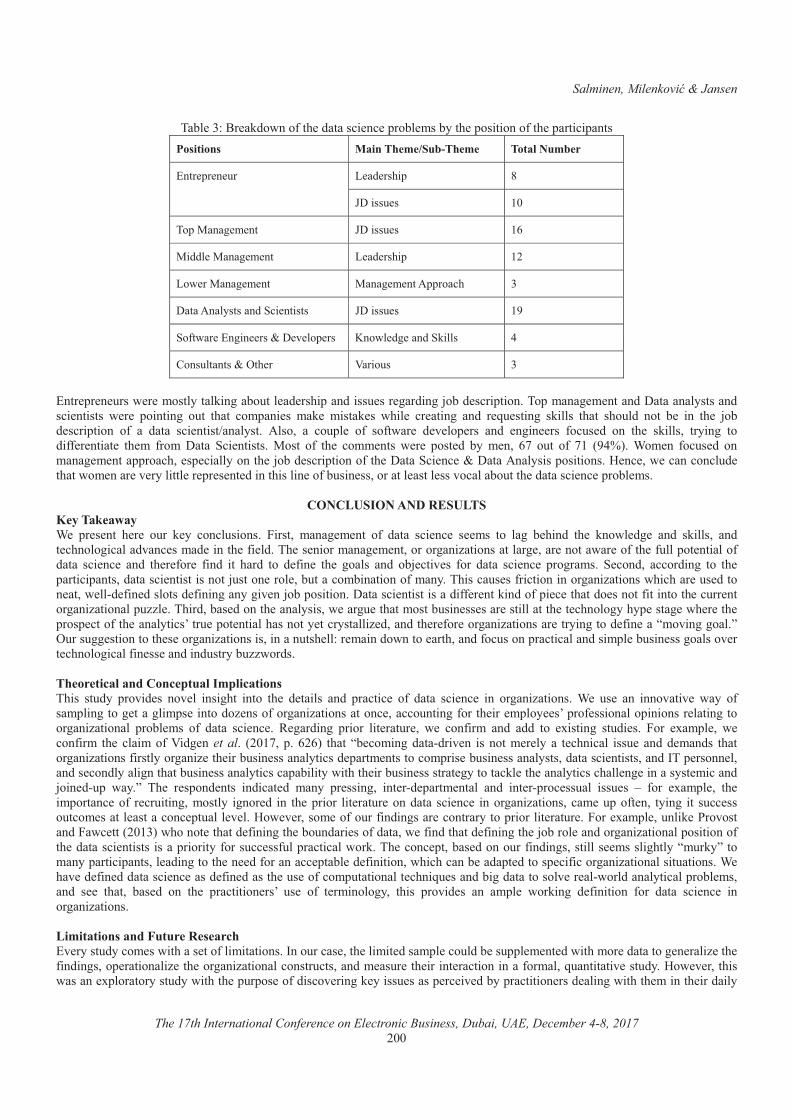
Salminen, Milenkovi� & Jansen�
The 17th International Conference on Electronic Business, Dubai, UAE, December 4-8, 2017 ����
\��� ����<� ��#�"���!��% �#������� �� �'���� �������% �'���������!��% �'������'�����'�������� #������������������ ��� ��������
/��� '� � $�� � �# ��%�'� [�
}=����$ �� ���
\�'������ � ��� }=����$ �� �~�
��##� ������ � ��� � �# ��%�'� ���
��" ������� � ��� ����� � ����''����%� ��
=���������������#�_�� ������� }=����$ �� ���
_�!�"�� �/���� �����= ^ ��' ��� ���"� #� ���#�_������ @�
*���$�����������% �� �����$�� ��
�/��� '� � $���" � �������������������$��� �# ��%�'���#����$ ��� ���#����]���# ����'�����\�'������ � �����#�=���������������#���� ������� " � � '�������� �$�� �%��� ���'��� �� ��� � ������ �� "%�� � �� ������ ��#� � �$ ������ ������� �%��� �%�$�#� ���� � � ��� �% � ]���# ����'����� �!� �� #���� ��� �����¡�������� ������ �� ��$'� � �!� ��!�"�� � # ^ ��' ��� ��#� ���� ��� !��$� #� ��� �% � �������� ������� ���#�!! � ����� � �% �� !���� =���� _�� ������� ����� �!� �% � ���� ���� " � � '��� #� ��� � ��� ~�� �$�� �!� ��� ��@��� ��� �� !��$� #� �������� � ����''����%�� �' �����������% �]���# ����'������!��% �=����_�� �� ���=�������������'���������� �� ��" ����������$# ��%���"�� ���� �^ �������� �� '� � �� #�����%������ ��!��$��� ����������� ����� ���^��������$���% �#������� �� �'���� �����
����&"�������!��$�"&���9����^����� � '� � ��� % � � �$�� � �� �����$������ ������� ����� � ��� �!� #���� ��� �� � � ��� ��� ���� � %��#� �% � ���"� #� � ��#� �������� ��#�� �%�����������#^��� ����# �����% �!� �#�\% �� ���������� � ���������������������������� ���� ������"�� ��!��% �!$���'�� �������!�#���� ��� �� � ��#� �% � !�� � !��#� ��� %��#� ��� # !�� � �% � ������ ��#� ��] ���^ �� !��� #���� ��� �� � '�������� _ ���#�� �����#���� ��� �% �'������'������#������� �������������]$����� ���� ���$�����������������!������\%�����$� ��!�������������������������"%��%��� �$� #����� ����" ���# !�� #�������# !������������^ ��]���'��������=������� �����������#�!! � ������#��!�'� � ��%���#� ������!���������% ��$�� ������������������'$��� �\%��#����� #�����% �����������" ����$ ��%���������$��� �� ���� �����������% �� �%�������%�' ����� �"% � ��% �'���' ����!��% ��������������$ �'�� ������%�������� ������������ #����#��% � !�� ����������������� �����������# !�� ������^�����������$���$�� ����������% � �������������������������$��% ����� �����#�"����� ���%����#�!��$�����'�����������#����'� ��$��� ����������^ ��� �%����������!�� �� ���#���#$������$��"��#������������ �������(�� ���( �������\%��� ��$#�� '��^�# �� ��^ �� �����%�� ����� �% � # ������ ��#� '������ � �!� #���� ��� �� � ��� �������������� � � $� � ��� ����^���^ � "��� �!����'��������� ��������'� ������#�� ����!��������������������� ������$������!����% ��� �'��� ���'��! ���������'�������� ������������������������� '���� ��� �!� #���� ��� �� � � ���#���� '����� ��� ���$� �� " � ���!���� ��#� �##� ��� `������� ��$#� �� ���� `��'� �� " ����!���� �% � �������!���#� ��et al� �������'� ~�~�� �%��� �� �������#����#��^ �� ��� ����� � ��� �� � �%������ ���$ � ��#�# ���#�� �%�����������������!�������������� ��% ����$��� �������������# '���� ����������'��� ��$��� �������������#������� ����������#�&\�' ����� �����#�� ���#����������%����$��� ���������������'��������"��%��% ����$��� �������� ����������� ��% ������������%��� �� ���������� ������#�]��� #�$'� "���� \% � � �'��# ���� ��#���� #� ����� '� ������� ��� ��# '���� ����� ��#� ��� ��'��� ��$��� ���$ �� ¥� !��� `��'� �� �% ���'������ ��!� � ��$������� ������� ����� #� ��� �% �'����� ��� ���$� ����#���� ��� �� � ������������������ ��� �$'��!� ��� ������ ��� �$�� ����$���� ������ ���������� '�$���� ^ ����" ^ ������ ��!��$��!��#������� �������������'�������� ���$� ����� `��'� ��$���� ����^������#���"� ����������"%����� ��%���# !�������% ���$�#��� ���!�#�����" �!��#��%���# !�������% �]������ ���#����������������'���������!��% �#������� ������� �����'��������!����$�� ��!$��'���������"����\% ����� '������ #�����$��!��#������������� �������%������$�������������'������'������� �#��������% �� #�!��������� '���� �# !���������"%��%������ ��#�'� #�����' ��!���������������������$�������� �%�^ �# !�� #�#������� �� ����# !�� #�����% �$� ��!����'$���������� �%���$ ����#�����#����������^ �� ���"���#������������'���� ������#� � � �%���� ��� #� ��� �% � '��������� ���� $� � �!� � ����������� �%��� '��^�# �� ��� ��'� � "������� # !�������� !��� #���� ��� �� � ������������������&�����������*��������������/^ �����$#����� ��"��%���� ���!�������������&���$����� ���% ������ #����'� ���$�#�� ��$''� � �� #�"��%���� �#�������� � ����� ��% �!��#�������' ���������� ��% ����������������������$�������#�� ��$� ��% ������ �������������!��������$��������^ ���$#����" ^ ����%���"������ `'�����������$#��"��%��% �'$�'�� ��!�#����^ ������ �����$ �����' �� �^ #����'��������� ���# ������"��%��% ������% ���#�����
Salminen, Milenkovi� & Jansen�
The 17th International Conference on Electronic Business, Dubai, UAE, December 4-8, 2017 ����
'��! ����������^ ���$��% ����$#� �������##� ����% ��%������������!��%��� `'�����������$#��&��'�����$������% �!����"�����$ ��������� �� !��!���!$��% ��� � ���%���
�� How could the organizational readiness for data science be improved?�<�� #�����% �^��� ����!��% �'������'���������" �����% � � �� � $�# ������� #�!! � �� �� ��� ������������� � �#�� ��� !��� #���� ��� �� � \% � !�� �� ��� ��� ��$����� !��� �% � � ��� ���$� ������������������� ����!�����% ���� ��#^��� #��� ��\���%��� �#����� �� � ���%����� # #�
�� How could job expectations from a data scientist be correctly aligned with organizational resources and decision-making authority?�&���$��!��#������" �'���� #��$���$�%��������$ �� �������'�����!��% ����������������� ��������" ^ ���������$��� ���"%���� ��$� �������$������^ ���#���% �"�� ������� �$�# ���� ������^��#��������$ �� ����#�!$���� `'������% �'�� �������!�#������� �� ���#�#������� ������������������������
��$*$�$��$��
£�¤� �������������%������������@��<$��� ���������������%����"���#�"%���� `�¨�Business Horizons����������~������£�¤� <��� ��� }� <� ���[~�� ��������������� �$��$� �� *��� ��� � � �� ��$�� � �!� �$����� #� ���' ����^ � �#^����� ¨� Academy of
Management Review���������~�~�~~��£�¤� *��������� *� ������� = ������� ���������� ¥� � �� ��� =�������������� Information Sciences�� ��� '� ��� � ��� ^ #� !����
%��'��¡¡"""��� �� #�� �����¡��� �� ¡������ ¡'��¡_������������������_ '� �� ������������£@¤� =�^ �'�����\�������������=�}��������=������� ������Harvard Business Review�������������~�£�¤� = �������=����������*��'���� ��$��$� ���#���������������� !! ���^ � ���}�%����� ����_����£~¤� = ����/�<�������#� ����_����������*%��� �������� ������� �����%��� ���The Journal of Applied Behavioral Science���������
���@��£�¤� /#"��#���}�_����\����#���/�������~��>��������"� #� ������ � ��������^ ����� `�����������������#�����#������#�� #$� �
����� ���������Procedia Computer Science��99���~�@��£[¤� ���� ���<������_���$�����������~���The Discovery of Grounded Theory: Strategies for Qualitative Research�\�����������
�$����% ���£�¤� ������&�����������$�^ ���!�" ����� ��$�� ���� ������$� #����&�� �� �§# ' �# ����������������������� ��Internet Research��
���������������£��¤� ������� ���� �� ������� Markkinointiviestinnän määrä Suomessa 2014�� �$ ���� � ��� ^ #� !���� %��'��¡¡��������]��!�¡�''¡�
$'���#�¡��� �¡�¡����¡��¡������������^� ��������������_$�� �������@���'�����'#!��_ '� �� ������������£��¤� ��'���� �� ��� �� ��^��#�� _� ������� �� �$���� ^ �� ��# �� �!� � ������� � ��� ��!��������� � �%������� ��'� � �������� MIS
Quarterly���������@~��@���£��¤� }Ô�^�� ��� }� ����~�� The use of digital analytics for measuring and optimizing digital marketing performance� }�^Ô����Ô�
_�$#� �� ���<$��� ��� ��#�/�������������� ��� ^ #� !���� %��'��¡¡]�`]�$!�¡#�'�� ¡%��#� ¡���@�~�[�¡������ �_ '� �� ������������
£��¤� � ���������<�$�� ������������%��� ��$� � �����������^ ��!����Measuring Business Excellence��@�@�������£�@¤� � ��������������}����������������%��#�������� ���������<�$�� �������� �� �� ������������� �!������ �� ��$� � ���
���� �� # ������ = ^ ��'���� ��#� � ������ �� '��� ��§��� #� �''����%� International Journal of Operations & Production Management�����������������@��
£��¤� � �����������������\% ����'� � ����������!���������� ���!���� � ���%�Journal of Political Economy,�~������������~�£�~¤� ���^������������"� ����\��������=������� �� ���#������ �������%�'��������#������#�#����#��^ ��# ��������������Big Data��
������������£��¤� _�% ���� /� �� ������� ��������������� *$��$� �� �%��� ��� ��� ��#� %�"� ��� �%��� � ��� &�� Human Resource Management in
International Firms��''��~�[���������^ ���������������#����£�[¤� _���$���������*�������}�������[��Basics of Qualitative Research: Techniques and Procedures for Developing Grounded
Theory. ������� � ���_��/�£��¤� � �%� !���� *����� !��������_� ������� >�# �����#���� �% � ���� ����� # '���� ����� ��!�$ �� �"��%��� �% � !����Journal of
Marketing����������@����£��¤� ��#� ������_%�"��_�����������=�<������������� � ����%��� �� �� ����� ������^��$ �!�����$��� �������������European
Journal of Operational Research���~������~�~�~���£��¤� ������ ����\����*� ������=��������� �#����' �'� �"% ���% �����"���� ��%�����$�#��Harvard Business Review��}$� ��
�[�

Nazir, M., Hamilton, J.R., & Tee, S.W. (2017). Real money trading in virtual worlds. In Proceedings of The 17th International Conference on Electronic Business (pp. 202-207). ICEB, Dubai, UAE, December 4-8.
Nazir, Hamilton & Tee
The 17th International Conference on Electronic Business, Dubai, UAE, December 4-8, 2017202
Real Money Trading in Virtual Worlds
Mohamed Nazir, James Cook University, Australia, [email protected] R. Hamilton, James Cook University, Australia, [email protected]
SingWhat Tee, James Cook University, Australia, [email protected]
ABSTRACTSignificant real money is traded into and out of virtual world currencies. Virtual world participating users buy and sell virtual products, virtual goods, virtual properties, virtual services, and other virtual items of interest. As gamers, some trade real money to: buy assets including characters, currencies and other auctioned items. Others buy at virtual auctions, purchase virtual currencies, purchase virtual land, build virtual properties and use virtual facilities. The Theory of Planned Behavior maps astructural equation modelling approach for real money trading (RMT) - suggesting RMT can be behaviorally promoted to participant users in virtual worlds.
Keywords: Real money trading virtual world, planned behavior, attitude, intention, perceived behavioral control, structural model, second life_____________________*Corresponding author
INTRODUCTIONVirtual worlds (VWs), virtual communities (VCs) and social networking sites (SNSs) have experienced substantive technological developments, and continual growth, in end-user engagement across the globe (Chung, Nam, & Koo, 2016; Guo & Gong, 2011). This has altered the boundaries, the limits and the scope of virtual social communications (Chung et al., 2016; Wang, Yeh, Chen & Tsydypov, 2016). VWs, VCs and SNSs each provide different, yet dynamic platforms. Each platform supports different social interactions between their communities of online global end-users, and each does so without restrictions of boundaries, borders, time or space (Bell, 2008; Novak, Mladenow & Strauss, 2014).
Different virtual worlds have their own virtual currencies, which they use inside their own virtual world. These in-game real money trades allow the purchase and sale of virtual items or structures. The virtual currency within these games has an actual real money trading (RMT) value (Aichner & Jacob, 2015)
The virtual world economy is now a multibillion-dollar industry. Virtual world currency is used in virtual worlds to buy and sell virtual products, goods, properties, services and other items of interest. This is first enabled when real money is initially traded for virtual currency. Real money trading (RMT) in virtual worlds continues to grow as gaming environments like World-of-Warcraft see gamers buy assets including characters, currencies and items, and as others such as in Second-Life orEntropia-Universe also attend virtual auctions, buy virtual land, build virtual properties and use virtual facilities (Anderson, 1971; Guo & Barnes, 2007).
RMT is also a real world trading activity. Hence RMT has both real and virtual world applications. This creates a dual money trading economy where real money flows from the real world into the virtual world and vice-versa. Such exchanges depend upon how each trading market is configured for its participant users as they chose to interact within their chosen virtual world and its allowed activities. Data from 2011 showed US RMT being in-excess of US$B2.1 per year in 2011(Nazir & Man Lui, 2017). By2014 projected data showed Second-Life economy alone reaching US$3B per year (Nazir & Lui, 2014). In 2016 Reuters.com reports that the company Super Data Research estimates the market for in-game items (virtual goods) could reach a value exceeding US$46B and to grow compounding at 6% per annum. In 2017 NewZoo.com reported the entire 2016 gaming market as valuing US$99.6B.
Virtual world money transactions can be (1) developer-to-business (where virtual places are bought and sold to corporations or individuals), (2) developer-to-consumer (where items are exchanged for currency or for game interactions), business-to-business (where companies trade virtually), business-to-consumer (where virtual items are sold for profit), consumer-to-consumer (whereBusiness-to-Business (B2B); Business-to-Customer (B2C); or Customer-to-Customer (C2C) where virtual objects are traded between users) Figure 1 (Cagnina & Poian, 2007; Hendaoui, Limayem & Thompson, 2008; Nazir & Lui, 2014, 2016).
Although the monetary systems in differing virtual worlds are different, virtual currencies include PED (used in Entropia-Universe), linden dollars (used in Second-Life) and gold (used in World-of-Warcraft and EverQuest) are common, and these can be exchanged in various ways for real money.
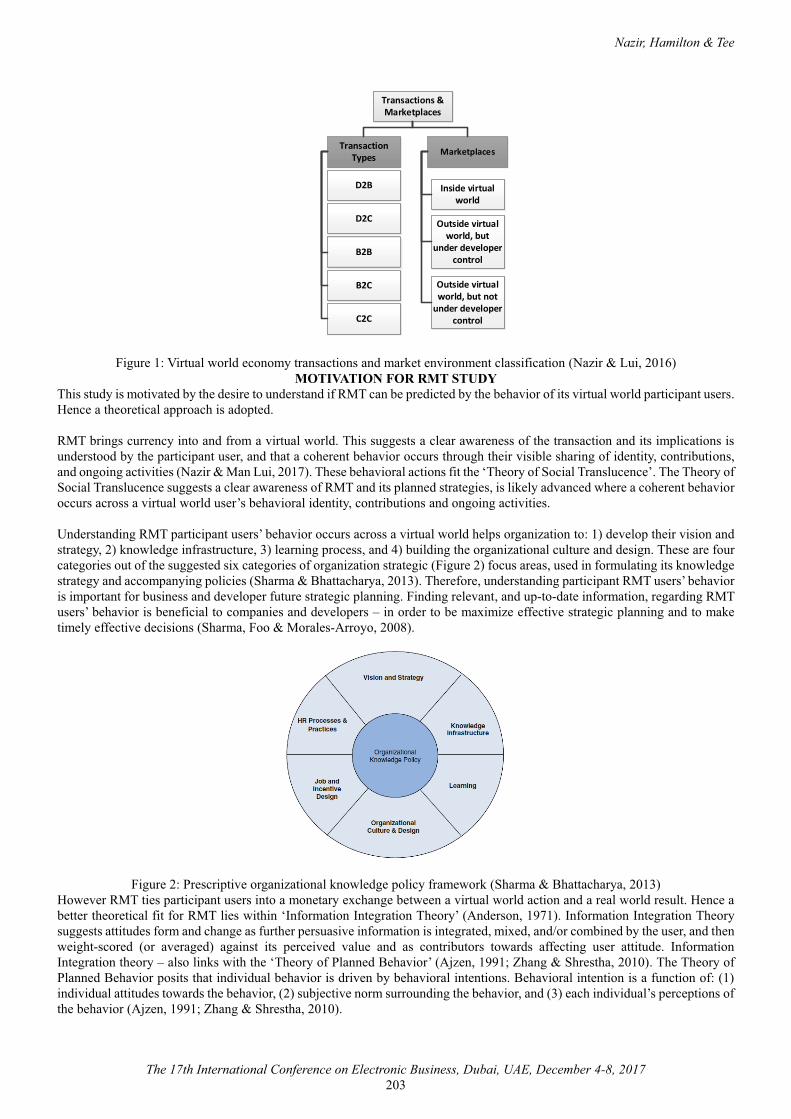
Nazir, Hamilton & Tee
The 17th International Conference on Electronic Business, Dubai, UAE, December 4-8, 2017203
Transaction Types Marketplaces
Transactions & Marketplaces
B2B
B2C
C2C
Inside virtual world
Outside virtual world, but
under developer control
Outside virtual world, but not
under developer control
D2C
D2B
Figure 1: Virtual world economy transactions and market environment classification (Nazir & Lui, 2016)MOTIVATION FOR RMT STUDY
This study is motivated by the desire to understand if RMT can be predicted by the behavior of its virtual world participant users. Hence a theoretical approach is adopted.
RMT brings currency into and from a virtual world. This suggests a clear awareness of the transaction and its implications is understood by the participant user, and that a coherent behavior occurs through their visible sharing of identity, contributions, and ongoing activities (Nazir & Man Lui, 2017). These behavioral actions fit the ‘Theory of Social Translucence’. The Theory of Social Translucence suggests a clear awareness of RMT and its planned strategies, is likely advanced where a coherent behavioroccurs across a virtual world user’s behavioral identity, contributions and ongoing activities.
Understanding RMT participant users’ behavior occurs across a virtual world helps organization to: 1) develop their vision and strategy, 2) knowledge infrastructure, 3) learning process, and 4) building the organizational culture and design. These are four categories out of the suggested six categories of organization strategic (Figure 2) focus areas, used in formulating its knowledge strategy and accompanying policies (Sharma & Bhattacharya, 2013). Therefore, understanding participant RMT users’ behavior is important for business and developer future strategic planning. Finding relevant, and up-to-date information, regarding RMT users’ behavior is beneficial to companies and developers – in order to be maximize effective strategic planning and to make timely effective decisions (Sharma, Foo & Morales-Arroyo, 2008).
Figure 2: Prescriptive organizational knowledge policy framework (Sharma & Bhattacharya, 2013)However RMT ties participant users into a monetary exchange between a virtual world action and a real world result. Hence a better theoretical fit for RMT lies within ‘Information Integration Theory’ (Anderson, 1971). Information Integration Theory suggests attitudes form and change as further persuasive information is integrated, mixed, and/or combined by the user, and then weight-scored (or averaged) against its perceived value and as contributors towards affecting user attitude. Information Integration theory – also links with the ‘Theory of Planned Behavior’ (Ajzen, 1991; Zhang & Shrestha, 2010). The Theory of Planned Behavior posits that individual behavior is driven by behavioral intentions. Behavioral intention is a function of: (1) individual attitudes towards the behavior, (2) subjective norm surrounding the behavior, and (3) each individual’s perceptions of the behavior (Ajzen, 1991; Zhang & Shrestha, 2010).
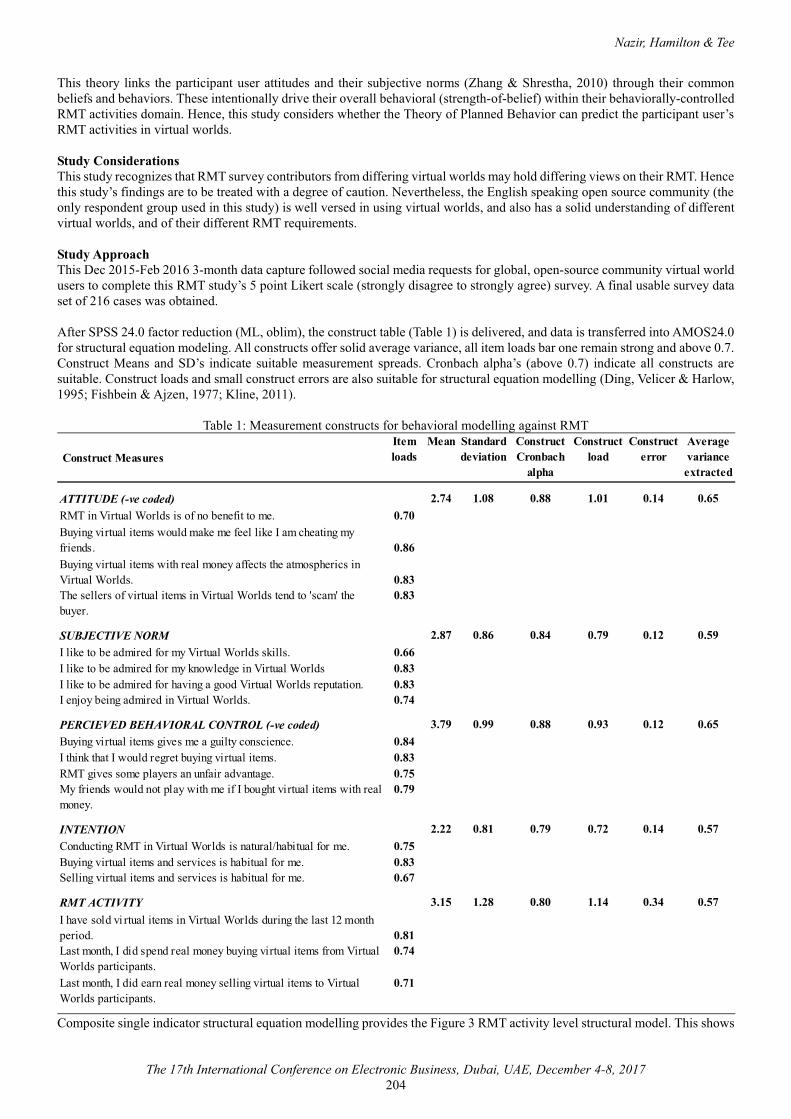
Nazir, Hamilton & Tee
The 17th International Conference on Electronic Business, Dubai, UAE, December 4-8, 2017204
This theory links the participant user attitudes and their subjective norms (Zhang & Shrestha, 2010) through their common beliefs and behaviors. These intentionally drive their overall behavioral (strength-of-belief) within their behaviorally-controlled RMT activities domain. Hence, this study considers whether the Theory of Planned Behavior can predict the participant user’s RMT activities in virtual worlds.
Study ConsiderationsThis study recognizes that RMT survey contributors from differing virtual worlds may hold differing views on their RMT. Hencethis study’s findings are to be treated with a degree of caution. Nevertheless, the English speaking open source community (the only respondent group used in this study) is well versed in using virtual worlds, and also has a solid understanding of different virtual worlds, and of their different RMT requirements.
Study ApproachThis Dec 2015-Feb 2016 3-month data capture followed social media requests for global, open-source community virtual world users to complete this RMT study’s 5 point Likert scale (strongly disagree to strongly agree) survey. A final usable survey data set of 216 cases was obtained.
After SPSS 24.0 factor reduction (ML, oblim), the construct table (Table 1) is delivered, and data is transferred into AMOS24.0 for structural equation modeling. All constructs offer solid average variance, all item loads bar one remain strong and above 0.7. Construct Means and SD’s indicate suitable measurement spreads. Cronbach alpha’s (above 0.7) indicate all constructs are suitable. Construct loads and small construct errors are also suitable for structural equation modelling (Ding, Velicer & Harlow, 1995; Fishbein & Ajzen, 1977; Kline, 2011).
Table 1: Measurement constructs for behavioral modelling against RMT
Construct MeasuresItem loads
Mean Standard deviation
Construct Cronbach
alpha
Construct load
Construct error
Average variance extracted
ATTITUDE (-ve coded) 2.74 1.08 0.88 1.01 0.14 0.65RMT in Virtual Worlds is of no benefit to me. 0.70Buying virtual items would make me feel like I am cheating my friends. 0.86Buying virtual items with real money affects the atmospherics in Virtual Worlds. 0.83The sellers of virtual items in Virtual Worlds tend to 'scam' the buyer.
0.83
SUBJECTIVE NORM 2.87 0.86 0.84 0.79 0.12 0.59I like to be admired for my Virtual Worlds skills. 0.66I like to be admired for my knowledge in Virtual Worlds 0.83I like to be admired for having a good Virtual Worlds reputation. 0.83I enjoy being admired in Virtual Worlds. 0.74
PERCIEVED BEHAVIORAL CONTROL (-ve coded) 3.79 0.99 0.88 0.93 0.12 0.65Buying virtual items gives me a guilty conscience. 0.84I think that I would regret buying virtual items. 0.83RMT gives some players an unfair advantage. 0.75My friends would not play with me if I bought virtual items with real money.
0.79
INTENTION 2.22 0.81 0.79 0.72 0.14 0.57Conducting RMT in Virtual Worlds is natural/habitual for me. 0.75Buying virtual items and services is habitual for me. 0.83Selling virtual items and services is habitual for me. 0.67
RMT ACTIVITY 3.15 1.28 0.80 1.14 0.34 0.57I have sold vi rtual items in Virtual Worlds during the last 12 month period. 0.81Last month, I did spend real money buying virtual items from Virtual Worlds participants.
0.74
Last month, I did earn real money selling virtual items to Virtual Worlds participants.
0.71
Composite single indicator structural equation modelling provides the Figure 3 RMT activity level structural model. This shows
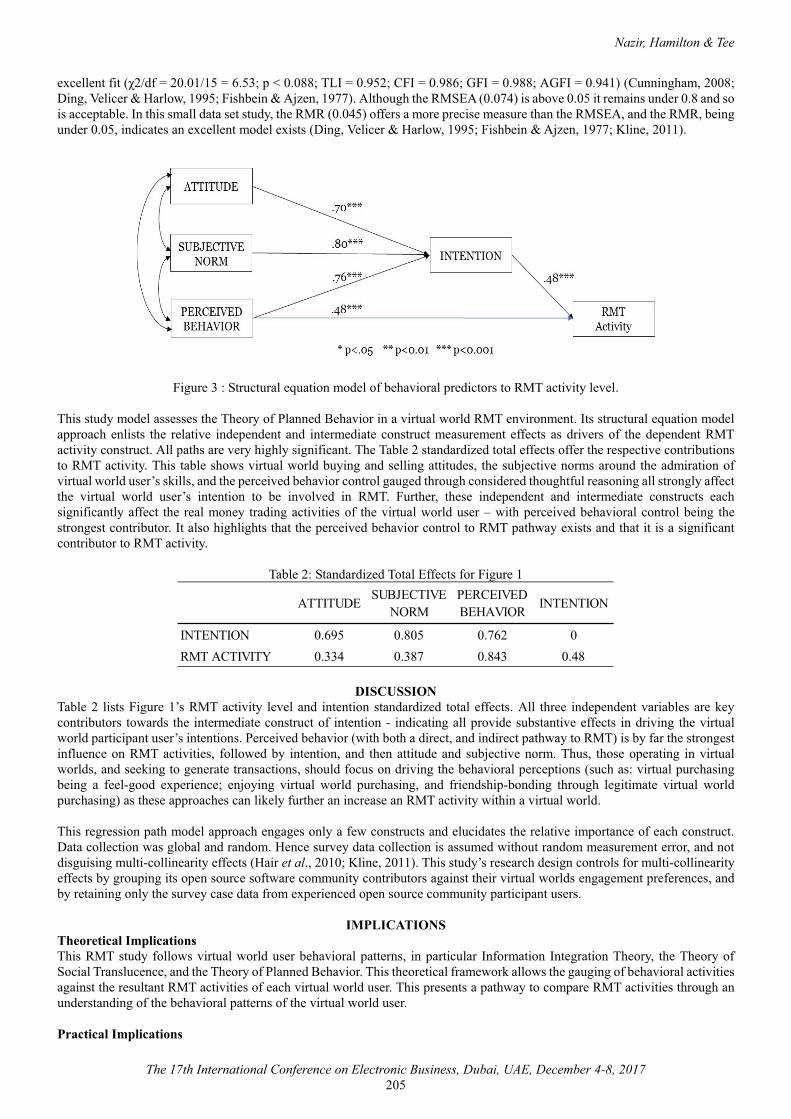
Nazir, Hamilton & Tee
The 17th International Conference on Electronic Business, Dubai, UAE, December 4-8, 2017205
excellent �"���������������������+,���-�����,�/01����2��,�?@1����2��,�&@1����2��,�4&@1����2A��(Cunningham, 2008; Ding, Velicer & Harlow, 1995; Fishbein & Ajzen, 1977). Although the RMSEA (0.074) is above 0.05 it remains under 0.8 and so is acceptable. In this small data set study, the RMR (0.045) offers a more precise measure than the RMSEA, and the RMR, being under 0.05, indicates an excellent model exists (Ding, Velicer & Harlow, 1995; Fishbein & Ajzen, 1977; Kline, 2011).
Figure 3 : Structural equation model of behavioral predictors to RMT activity level.
This study model assesses the Theory of Planned Behavior in a virtual world RMT environment. Its structural equation model approach enlists the relative independent and intermediate construct measurement effects as drivers of the dependent RMT activity construct. All paths are very highly significant. The Table 2 standardized total effects offer the respective contributions to RMT activity. This table shows virtual world buying and selling attitudes, the subjective norms around the admiration of virtual world user’s skills, and the perceived behavior control gauged through considered thoughtful reasoning all strongly affect the virtual world user’s intention to be involved in RMT. Further, these independent and intermediate constructs eachsignificantly affect the real money trading activities of the virtual world user – with perceived behavioral control being the strongest contributor. It also highlights that the perceived behavior control to RMT pathway exists and that it is a significant contributor to RMT activity.
Table 2: Standardized Total Effects for Figure 1
ATTITUDE SUBJECTIVE NORM
PERCEIVED BEHAVIOR INTENTION
INTENTION 0.695 0.805 0.762 0RMT ACTIVITY 0.334 0.387 0.843 0.48
DISCUSSIONTable 2 lists Figure 1’s RMT activity level and intention standardized total effects. All three independent variables are key contributors towards the intermediate construct of intention - indicating all provide substantive effects in driving the virtual world participant user’s intentions. Perceived behavior (with both a direct, and indirect pathway to RMT) is by far the strongest influence on RMT activities, followed by intention, and then attitude and subjective norm. Thus, those operating in virtual worlds, and seeking to generate transactions, should focus on driving the behavioral perceptions (such as: virtual purchasing being a feel-good experience; enjoying virtual world purchasing, and friendship-bonding through legitimate virtual world purchasing) as these approaches can likely further an increase an RMT activity within a virtual world.
This regression path model approach engages only a few constructs and elucidates the relative importance of each construct. Data collection was global and random. Hence survey data collection is assumed without random measurement error, and not disguising multi-collinearity effects (Hair et al., 2010; Kline, 2011). This study’s research design controls for multi-collinearity effects by grouping its open source software community contributors against their virtual worlds engagement preferences, and by retaining only the survey case data from experienced open source community participant users.
IMPLICATIONSTheoretical ImplicationsThis RMT study follows virtual world user behavioral patterns, in particular Information Integration Theory, the Theory of Social Translucence, and the Theory of Planned Behavior. This theoretical framework allows the gauging of behavioral activities against the resultant RMT activities of each virtual world user. This presents a pathway to compare RMT activities through an understanding of the behavioral patterns of the virtual world user.
Practical Implications

Nazir, Hamilton & Tee
The 17th International Conference on Electronic Business, Dubai, UAE, December 4-8, 2017206
The study findings demonstrate the strength of Theory of Planned Behavior in predicting RMT participant users’ behavior in virtual world platforms. Other studies have successful utilize Theory of Planned Behavior as a theoretical framework to determine users’ behavior toward Internet purchasing, internet banking, and other economic online behaviors (George, 2004; Lin, 2006; Shih & Fang, 2004).
With the increasing number of studies investigating virtual purchasing behavior and RMT activities using Theory of Planned Behavior framework, researchers may now discover the most important antecedents, helping virtual world industry to understand the RMT behavior virtual platforms (George, 2004; Lin, 2006; Shih & Fang, 2004).
Understanding RMT participant user behavior, as confirm in this study, should help business and developers to identify the critical factors to improve and implement successful strategies. These strategies should be able to increase their sales and boost the number of RMT transactions taking place in this dynamic virtual world platform.
FUTURE RESEARCHThe sample used in this study targets three of the most popular virtual worlds (Second Life, World of Warcraft, and Entropia Universe). Analytical results present may therefore have limited generalization. Future research may considered more virtual worlds such as Quest, There, IMVU, etc.
The sample size used in this study (216) representing the three virtual worlds is small. Hence, it is unclear whether these analytical results can be generalized to represent other virtual worlds such as Quest, There, IMVU, etc. Further research may collect more responses to validate this study finding.
Future research could consider other factors in the Theory of Planned Behavior, such as trust, loyalty, and privacy. Including these factors may provide a bigger picture predicting RMT participant user behavior in virtual worlds more accurately. Valid and reliable scales for the proposed constructs need to be developed and adapted in future research.
As intention focuses more on future behavior, while actual participating in RMT activities measures the past behavior, includingmeasurements for both intention to participate in RMT activities and actually participating in RMT activities may further strengthen this study’s findings.
CONCLUSIONThe theories of Planned Behavior and Social Translucence both map this study’s structural equation modelling approach. Real money trading (RMT) is shown to have behavioral connotations. The study suggests RMT can likely be promoted to participant users in virtual worlds using a Theory of Planned Behavior approach - particularly by emphasizing items to a participant user that bring their related behavioral perceptions and intention aspects into strong consideration.
REFERENCES[1] Aichner, T. & Jacob, F. (2015). Measuring the degree of corporate social media use. International Journal of Market
Research, 57(2), 257-275.[2] Ajzen. (1991). The theory of planned behavior. Organizational Behavior and Human Decision Processes, 50(2), 179-211.[3] Anderson, N.H. (1971). Integration theory and attitutde change. Psychological Review, 78(3), 171-206.[4] Bell, M.W. (2008). Toward a definition of “Virtual Worlds". Journal of Virtual Worlds Research, 1(1), 1-5.[5] Cagnina, M.R. & Poian, M. (2007). How to compete in the metaverse: The business models in Second Life. Working Paper
No. 01-2007, University of Udine (Economics), Italy. [6] Chung, N., Nam, K. & Koo, C. (2016). Examining information sharing in social networking communities: Applying
theories of social capital and attachment. Telematics and Informatics, 33(1), 77-91.[7] Cunningham, E. (2008). A practical guide to structural equation modelling using Amos. Melbourne: Statsline.[8] Ding, L., Velicer, W.F. & Harlow, L.L. (1995). Effects of estimation methods, number of indicators per factor, and improper
solutions on structural equation modeling fit indices. Structural Equation Modeling: A Multidisciplinary Journal, 2(2), 119-143.
[9] Fishbein, M. & Ajzen, I. (1977). Belief, attitude, intention and behavior: An introduction to theory and research. Contemporary Sociology, 6(2), 244.
[10] George, J.F. (2004). The theory of planned behavior and Internet purchasing. Internet Research, 14(3), 198-212.[11] Guo, J. & Gong, Z. (2011). Measuring virtual wealth in virtual worlds. Information Technology and Management, 12(2),
121-135.[12] Guo, Y. & Barnes, S. (2007). Why people buy virtual items in virtual worlds with real money. ACM SIGMIS Database,
38(4), 69-76.[13] Hair, J.F., Anderson, R.E., Tatham, R.L. & Black, W.C. (2010). Multivariate Data Analysis (7th ed.). Uppersaddle River,
New Jersey: Pearson Education International.[14] Hendaoui, A., Limayem, M. & Thompson, C.W. (2008). 3D social virtual worlds: Research issues and challenges. IEEE
Internet Computing, 12(1), 88-92.
Nazir, Hamilton & Tee
The 17th International Conference on Electronic Business, Dubai, UAE, December 4-8, 2017207
[15] Kline, R.B. (2011) Principles and Practice of Structural Equation Modeling (3rd ed.). New York: The Guilford Press.[16] Lin, H.-F. (2006). Understanding behavioral intention to participate in virtual communities. CyberPsychology & Behavior,
9(5), 540-547.[17] Nazir, M. & Lui, C. (2014). Opportunities and challenges for real money trading in virtual world. In Proceeedings of the
Fourteenth International Conference on Electronic Business (pp. 182-188). ICEB: Taipei, Taiwan, December 8-12.[18] Nazir, M. & Lui, C. (2016). A brief history of virtual economy. Journal for Virtual Worlds Research, 9(1), 1-24.[19] Nazir, M. & Lui, C.S.M. (2017). A survey of research in real-money trading (RMT) in virtual world. International Journal
of Virtual Communities and Social Networking, 9(1), 34-53.[20] Novak, N.M., Mladenow, A. & Strauss, C. (2014). Virtual worlds as settings for avatar-based innovation processes. Journal
of Service Science Research, 6(1), 71-98.[21] Sharma, R.S. & Bhattacharya, S. (2013). Knowledge dilemmas within organizations: Resolutions from game theory.
Knowledge-Based Systems, 45, 100-113.[22] Sharma, R.S., Foo, S. & Morales-Arroyo, M. (2008). Developing corporate taxonomies for knowledge auditability - A
framework for good practices. Knowledge Organization, 35(1), 30-46.[23] Shih, Y. & Fang, K. (2004). The use of a decomposed theory of planned behavior to study Internet banking in Taiwan.
Internet Research, 14(3), 213-223.[24] Wang, T., Yeh, R.K., Chen, C. & Tsydypov, Z. (2016). What drives electronic word-of-mouth on social networking sites?
Perspectives of social capital and self-determination. Telematics and Informatics, 33(4), 1034-1047.[25] Zhang, D. & Shrestha, P. (2010). Doing business in Second Life: E-commerce in 3D online environment. International
Journal of Electronic Business, 8(2), 148-169.
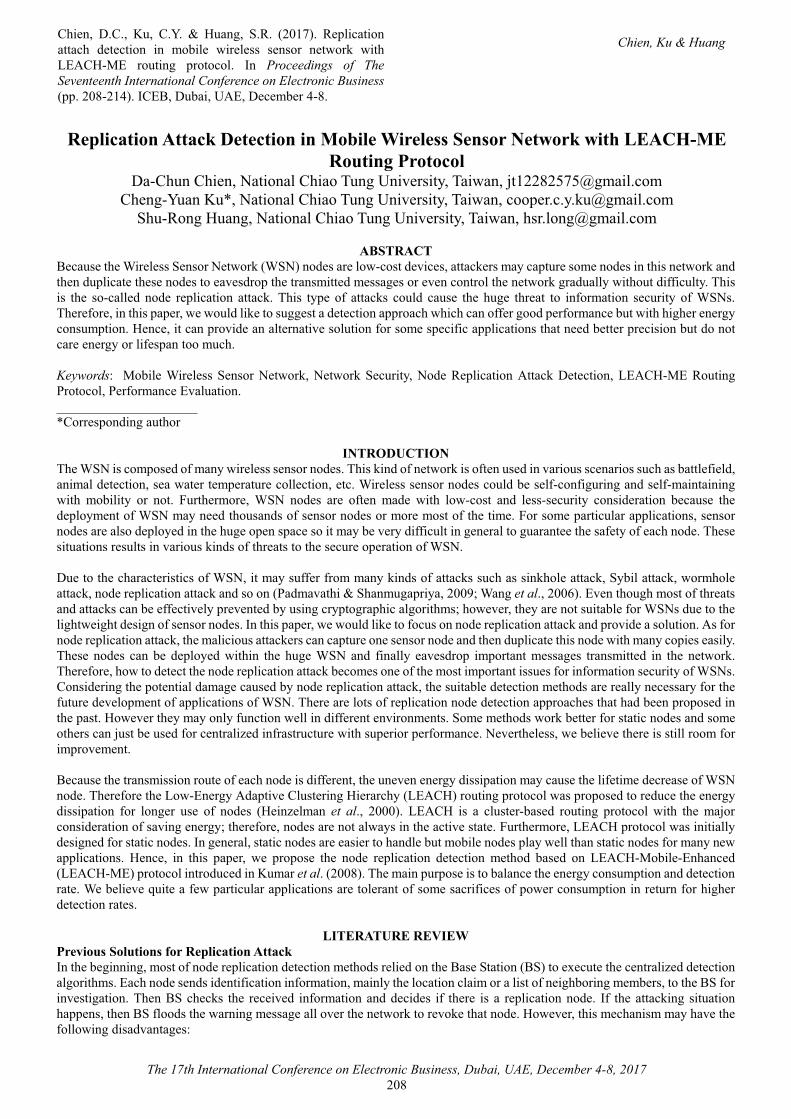
Chien, D.C., Ku, C.Y. & Huang, S.R. (2017). Replication attach detection in mobile wireless sensor network with LEACH-ME routing protocol. In Proceedings of The Seventeenth International Conference on Electronic Business(pp. 208-214). ICEB, Dubai, UAE, December 4-8.
Chien, Ku & Huang
The 17th International Conference on Electronic Business, Dubai, UAE, December 4-8, 2017208
Replication Attack Detection in Mobile Wireless Sensor Network with LEACH-MERouting Protocol
Da-Chun Chien, National Chiao Tung University, Taiwan, [email protected] Ku*, National Chiao Tung University, Taiwan, [email protected]
Shu-Rong Huang, National Chiao Tung University, Taiwan, [email protected]
ABSTRACTBecause the Wireless Sensor Network (WSN) nodes are low-cost devices, attackers may capture some nodes in this network and then duplicate these nodes to eavesdrop the transmitted messages or even control the network gradually without difficulty. This is the so-called node replication attack. This type of attacks could cause the huge threat to information security of WSNs. Therefore, in this paper, we would like to suggest a detection approach which can offer good performance but with higher energy consumption. Hence, it can provide an alternative solution for some specific applications that need better precision but do not care energy or lifespan too much.
Keywords: Mobile Wireless Sensor Network, Network Security, Node Replication Attack Detection, LEACH-ME Routing Protocol, Performance Evaluation._____________________*Corresponding author
INTRODUCTIONThe WSN is composed of many wireless sensor nodes. This kind of network is often used in various scenarios such as battlefield, animal detection, sea water temperature collection, etc. Wireless sensor nodes could be self-configuring and self-maintainingwith mobility or not. Furthermore, WSN nodes are often made with low-cost and less-security consideration because the deployment of WSN may need thousands of sensor nodes or more most of the time. For some particular applications, sensor nodes are also deployed in the huge open space so it may be very difficult in general to guarantee the safety of each node. These situations results in various kinds of threats to the secure operation of WSN.
Due to the characteristics of WSN, it may suffer from many kinds of attacks such as sinkhole attack, Sybil attack, wormhole attack, node replication attack and so on (Padmavathi & Shanmugapriya, 2009; Wang et al., 2006). Even though most of threats and attacks can be effectively prevented by using cryptographic algorithms; however, they are not suitable for WSNs due to the lightweight design of sensor nodes. In this paper, we would like to focus on node replication attack and provide a solution. As for node replication attack, the malicious attackers can capture one sensor node and then duplicate this node with many copies easily. These nodes can be deployed within the huge WSN and finally eavesdrop important messages transmitted in the network.Therefore, how to detect the node replication attack becomes one of the most important issues for information security of WSNs.Considering the potential damage caused by node replication attack, the suitable detection methods are really necessary for the future development of applications of WSN. There are lots of replication node detection approaches that had been proposed in the past. However they may only function well in different environments. Some methods work better for static nodes and some others can just be used for centralized infrastructure with superior performance. Nevertheless, we believe there is still room for improvement.
Because the transmission route of each node is different, the uneven energy dissipation may cause the lifetime decrease of WSN node. Therefore the Low-Energy Adaptive Clustering Hierarchy (LEACH) routing protocol was proposed to reduce the energy dissipation for longer use of nodes (Heinzelman et al., 2000). LEACH is a cluster-based routing protocol with the major consideration of saving energy; therefore, nodes are not always in the active state. Furthermore, LEACH protocol was initially designed for static nodes. In general, static nodes are easier to handle but mobile nodes play well than static nodes for many new applications. Hence, in this paper, we propose the node replication detection method based on LEACH-Mobile-Enhanced (LEACH-ME) protocol introduced in Kumar et al. (2008). The main purpose is to balance the energy consumption and detection rate. We believe quite a few particular applications are tolerant of some sacrifices of power consumption in return for higher detection rates.
LITERATURE REVIEWPrevious Solutions for Replication AttackIn the beginning, most of node replication detection methods relied on the Base Station (BS) to execute the centralized detectionalgorithms. Each node sends identification information, mainly the location claim or a list of neighboring members, to the BS for investigation. Then BS checks the received information and decides if there is a replication node. If the attacking situation happens, then BS floods the warning message all over the network to revoke that node. However, this mechanism may have the following disadvantages:
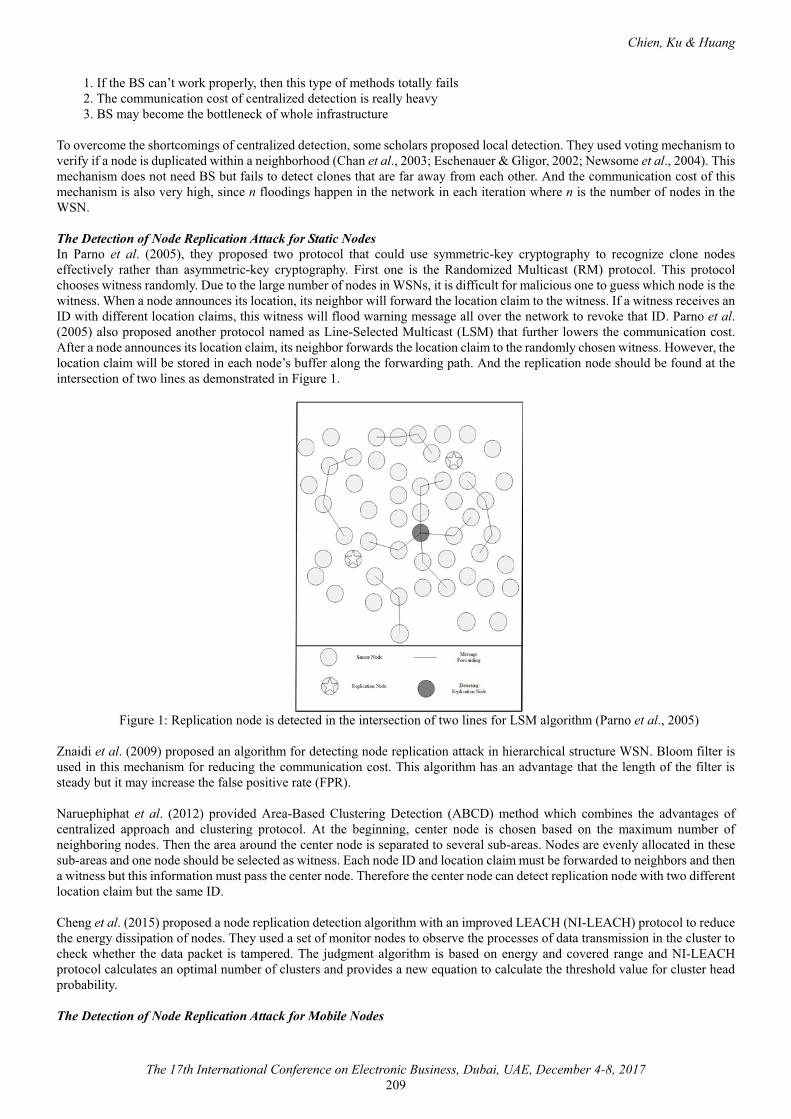
Chien, Ku & Huang
The 17th International Conference on Electronic Business, Dubai, UAE, December 4-8, 2017209
1. If the BS can’t work properly, then this type of methods totally fails2. The communication cost of centralized detection is really heavy3. BS may become the bottleneck of whole infrastructure
To overcome the shortcomings of centralized detection, some scholars proposed local detection. They used voting mechanism to verify if a node is duplicated within a neighborhood (Chan et al., 2003; Eschenauer & Gligor, 2002; Newsome et al., 2004). This mechanism does not need BS but fails to detect clones that are far away from each other. And the communication cost of this mechanism is also very high, since n floodings happen in the network in each iteration where n is the number of nodes in the WSN.
The Detection of Node Replication Attack for Static NodesIn Parno et al. (2005), they proposed two protocol that could use symmetric-key cryptography to recognize clone nodes effectively rather than asymmetric-key cryptography. First one is the Randomized Multicast (RM) protocol. This protocol chooses witness randomly. Due to the large number of nodes in WSNs, it is difficult for malicious one to guess which node is the witness. When a node announces its location, its neighbor will forward the location claim to the witness. If a witness receives an ID with different location claims, this witness will flood warning message all over the network to revoke that ID. Parno et al.(2005) also proposed another protocol named as Line-Selected Multicast (LSM) that further lowers the communication cost. After a node announces its location claim, its neighbor forwards the location claim to the randomly chosen witness. However, the location claim will be stored in each node’s buffer along the forwarding path. And the replication node should be found at the intersection of two lines as demonstrated in Figure 1.
Figure 1: Replication node is detected in the intersection of two lines for LSM algorithm (Parno et al., 2005)
Znaidi et al. (2009) proposed an algorithm for detecting node replication attack in hierarchical structure WSN. Bloom filter is used in this mechanism for reducing the communication cost. This algorithm has an advantage that the length of the filter is steady but it may increase the false positive rate (FPR).
Naruephiphat et al. (2012) provided Area-Based Clustering Detection (ABCD) method which combines the advantages of centralized approach and clustering protocol. At the beginning, center node is chosen based on the maximum number of neighboring nodes. Then the area around the center node is separated to several sub-areas. Nodes are evenly allocated in these sub-areas and one node should be selected as witness. Each node ID and location claim must be forwarded to neighbors and then a witness but this information must pass the center node. Therefore the center node can detect replication node with two different location claim but the same ID.
Cheng et al. (2015) proposed a node replication detection algorithm with an improved LEACH (NI-LEACH) protocol to reducethe energy dissipation of nodes. They used a set of monitor nodes to observe the processes of data transmission in the cluster to check whether the data packet is tampered. The judgment algorithm is based on energy and covered range and NI-LEACH protocol calculates an optimal number of clusters and provides a new equation to calculate the threshold value for cluster head probability.
The Detection of Node Replication Attack for Mobile Nodes

Chien, Ku & Huang
The 17th International Conference on Electronic Business, Dubai, UAE, December 4-8, 2017210
Yu et al. (2013) proposed two algorithms, Extremely Efficient Detection (XED) and Efficient Distributed Detection (EDD), for detecting clone nodes in mobile WSN. The strength of these two methods is due to the localized detection, network-wide synchronization avoidance and network-wide revocation avoidance. For XED, two mobile nodes exchange a random number when they encounter each other first time. Then these two node can verify each other when they meet again. However, XED cannot protect collusion of two nodes. EDD can be used for avoiding collusion by having counters in each node to count how many times they meet each other. A threshold for these counters will be set for replication attack warning.
Another solution for mobile replication nodes detection in WSNs was proposed by Lee (2009). In this algorithm, any selected node can initiate the review round by broadcasting )(tR . )(tR is a random number generated at time t . Any %����B�����")�sthis number at time )(�T and this receiving time should be different for different node with very huge probability. This information with ID will be forwarded to the randomly chosen witness with probability P by neighbors and the witness is responsible for replication node revocation.
PROPOSED DESIGNTo deal with the issues emphasized before, we design a node replication detection approach for mobile MSN operating on the LEACH-ME routing protocol and it is partially similar to the one proposed in Lee (2009). However, our proposed method delivers different authentication information and is working on different routing protocol. We also divide detection phase into four steps. The notations used in the detection algorithm are listed in the following Table 1.
Table 1: The notations used in the detection algorithmNotations Meanings
lC Cluster l
lCH Cluster head of cluster l
sID ID of node s)(tR Random number generated by sink at time t
)( lCHT Timestamp of lCH receiving detection request packet from sink
ll Member list of cluster l
lm Mapping list for cluster head of cluster l recording ID-timestamp pair ! )(, yx CHTIDfi
)( sIDHA fixed interval for next detection cycleA hash-function-based algorithm
The first step: the random number is broadcasted by sinkDetection phase is initiated by sink node in the beginning of one detection interval at time t . In general, it is often deployed around the center of WSN and is also easy to reach all of the nodes. At first, a random number )(tR is generated by sink node at time t and then it uses broadcasting method to send detection request packet with )(tR to all other cluster heads in the WSNas shown in Figure 2.
C lu s te r H e a d
M e m b e r N o d e
S in k
C lu s te r
R e p lic a tio nN o d e
B ro a d c a s t R ( t) G a te w a y
Figure 2: Broadcast of )(tR from sink node to cluster nodes
The second step: is broadcasting member list.As a cluster head iCH receives the detection request packet, then iCH must decide which other cluster head jCH should be multi-casted with the verification packet that includes its member list il , attached )( iCHT and sID of cluster head iCH .
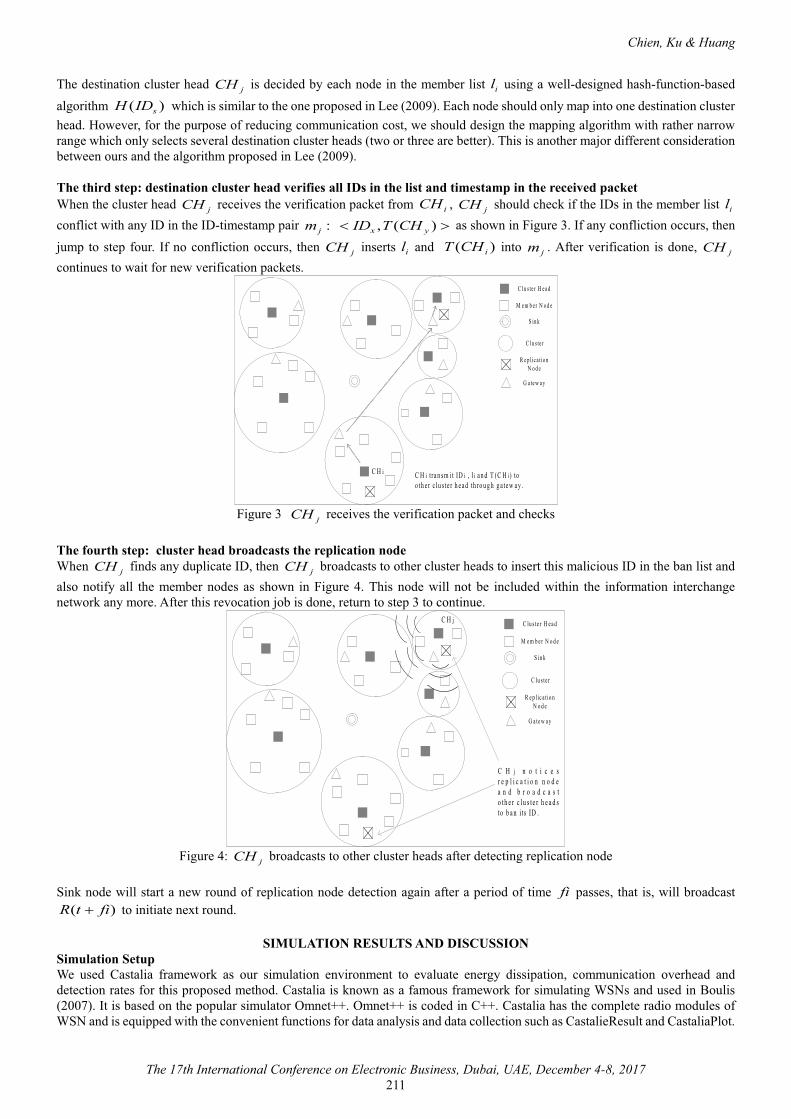
Chien, Ku & Huang
The 17th International Conference on Electronic Business, Dubai, UAE, December 4-8, 2017211
The destination cluster head jCH is decided by each node in the member list il using a well-designed hash-function-basedalgorithm )( sIDH which is similar to the one proposed in Lee (2009). Each node should only map into one destination cluster head. However, for the purpose of reducing communication cost, we should design the mapping algorithm with rather narrow range which only selects several destination cluster heads (two or three are better). This is another major different consideration between ours and the algorithm proposed in Lee (2009).
The third step: destination cluster head verifies all IDs in the list and timestamp in the received packetWhen the cluster head jCH receives the verification packet from iCH , jCH should check if the IDs in the member list ilconflict with any ID in the ID-timestamp pair :jm ! )(, yx CHTID as shown in Figure 3. If any confliction occurs, then jump to step four. If no confliction occurs, then jCH inserts il and )( iCHT into jm . After verification is done, jCHcontinues to wait for new verification packets.
C lu s te r H e a d
M e m b e r N o d e
S in k
C lu s te r
R e p lic a tio nN o d e
G a te w a y
C H i C H i tra n s m it ID i , l i a n d T (C H i) to o th e r c lu s te r h e a d th ro u g h g a te w a y .
Figure 3 jCH receives the verification packet and checks
The fourth step: cluster head broadcasts the replication nodeWhen jCH finds any duplicate ID, then jCH broadcasts to other cluster heads to insert this malicious ID in the ban list and also notify all the member nodes as shown in Figure 4. This node will not be included within the information interchange network any more. After this revocation job is done, return to step 3 to continue.
C lu s te r H e a d
M e m b e r N o d e
S in k
C lu s te r
R e p lic a tio nN o d e
G a te w a y
C H j
C H j n o t i c e s r e p l i c a t i o n n o d e a n d b r o a d c a s t o th e r c lu s te r h e a d s to b a n i ts ID .
Figure 4: jCH broadcasts to other cluster heads after detecting replication node
Sink node will start a new round of replication node detection again after a period of time fi passes, that is, will broadcast)( fitR � to initiate next round.
SIMULATION RESULTS AND DISCUSSIONSimulation SetupWe used Castalia framework as our simulation environment to evaluate energy dissipation, communication overhead and detection rates for this proposed method. Castalia is known as a famous framework for simulating WSNs and used in Boulis(2007). It is based on the popular simulator Omnet++. Omnet++ is coded in C++. Castalia has the complete radio modules of WSN and is equipped with the convenient functions for data analysis and data collection such as CastalieResult and CastaliaPlot.
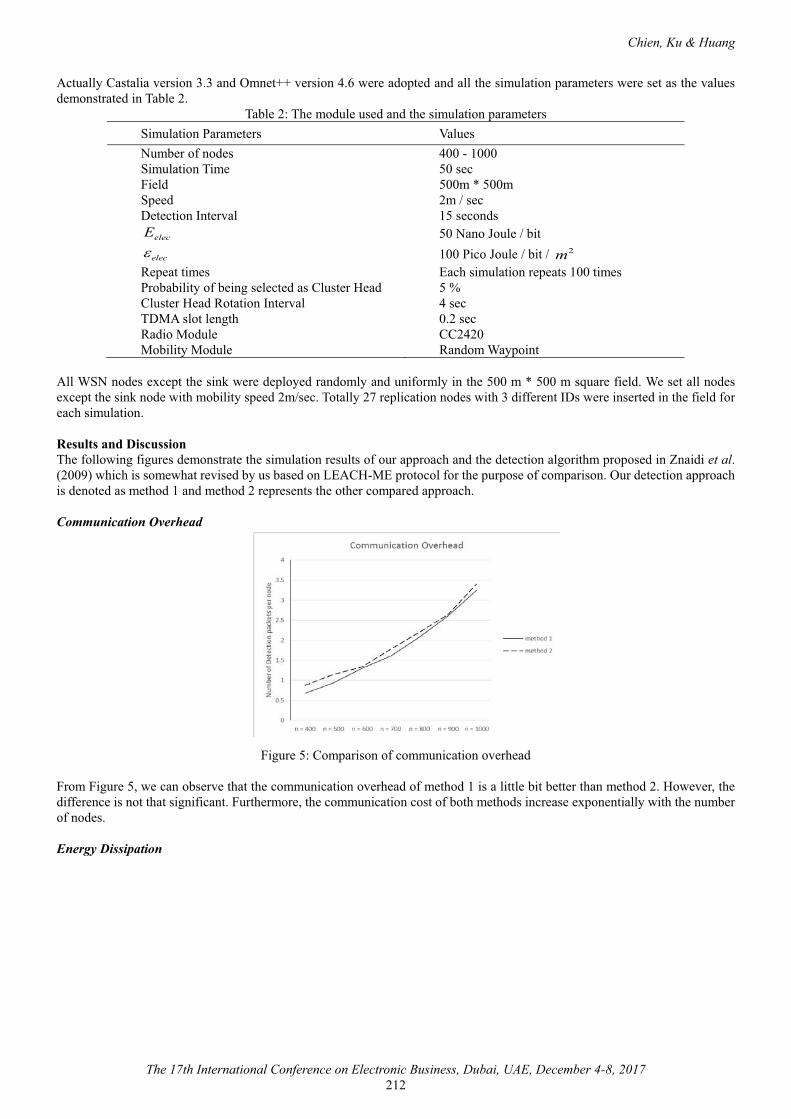
Chien, Ku & Huang
The 17th International Conference on Electronic Business, Dubai, UAE, December 4-8, 2017212
Actually Castalia version 3.3 and Omnet++ version 4.6 were adopted and all the simulation parameters were set as the values demonstrated in Table 2.
Table 2: The module used and the simulation parametersSimulation Parameters ValuesNumber of nodesSimulation Time
400 - 100050 sec
Field 500m * 500mSpeed 2m / secDetection Interval 15 seconds
elecE 50 Nano Joule / bit
elec" 100 Pico Joule / bit / 2mRepeat times Each simulation repeats 100 timesProbability of being selected as Cluster Head 5 %Cluster Head Rotation Interval 4 secTDMA slot length 0.2 secRadio Module CC2420Mobility Module Random Waypoint
All WSN nodes except the sink were deployed randomly and uniformly in the 500 m * 500 m square field. We set all nodes except the sink node with mobility speed 2m/sec. Totally 27 replication nodes with 3 different IDs were inserted in the field for each simulation.
Results and DiscussionThe following figures demonstrate the simulation results of our approach and the detection algorithm proposed in Znaidi et al. (2009) which is somewhat revised by us based on LEACH-ME protocol for the purpose of comparison. Our detection approach is denoted as method 1 and method 2 represents the other compared approach.
Communication Overhead
Figure 5: Comparison of communication overhead
From Figure 5, we can observe that the communication overhead of method 1 is a little bit better than method 2. However, thedifference is not that significant. Furthermore, the communication cost of both methods increase exponentially with the number of nodes.
Energy Dissipation
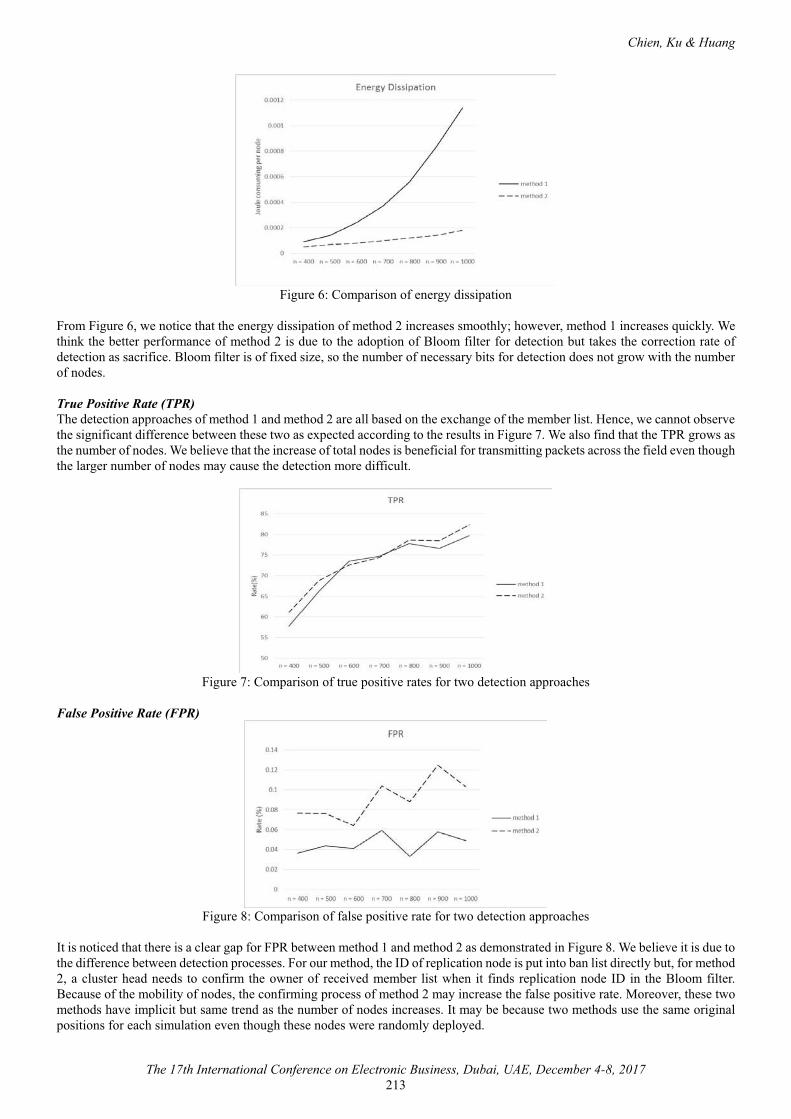
Chien, Ku & Huang
The 17th International Conference on Electronic Business, Dubai, UAE, December 4-8, 2017213
Figure 6: Comparison of energy dissipation
From Figure 6, we notice that the energy dissipation of method 2 increases smoothly; however, method 1 increases quickly. We think the better performance of method 2 is due to the adoption of Bloom filter for detection but takes the correction rate of detection as sacrifice. Bloom filter is of fixed size, so the number of necessary bits for detection does not grow with the number of nodes.
True Positive Rate (TPR)The detection approaches of method 1 and method 2 are all based on the exchange of the member list. Hence, we cannot observe the significant difference between these two as expected according to the results in Figure 7. We also find that the TPR grows as the number of nodes. We believe that the increase of total nodes is beneficial for transmitting packets across the field even though the larger number of nodes may cause the detection more difficult.
Figure 7: Comparison of true positive rates for two detection approaches
False Positive Rate (FPR)
Figure 8: Comparison of false positive rate for two detection approaches
It is noticed that there is a clear gap for FPR between method 1 and method 2 as demonstrated in Figure 8. We believe it is due to the difference between detection processes. For our method, the ID of replication node is put into ban list directly but, for method 2, a cluster head needs to confirm the owner of received member list when it finds replication node ID in the Bloom filter. Because of the mobility of nodes, the confirming process of method 2 may increase the false positive rate. Moreover, these two methods have implicit but same trend as the number of nodes increases. It may be because two methods use the same originalpositions for each simulation even though these nodes were randomly deployed.
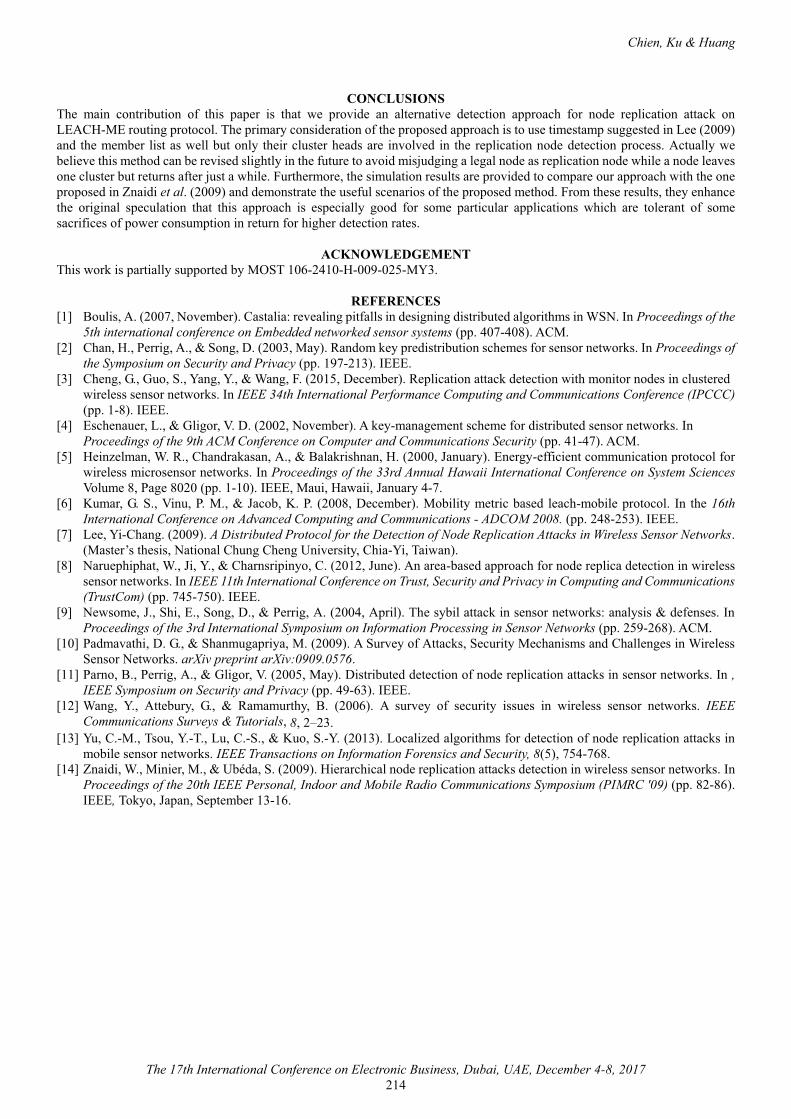
Chien, Ku & Huang
The 17th International Conference on Electronic Business, Dubai, UAE, December 4-8, 2017214
CONCLUSIONSThe main contribution of this paper is that we provide an alternative detection approach for node replication attack on LEACH-ME routing protocol. The primary consideration of the proposed approach is to use timestamp suggested in Lee (2009)and the member list as well but only their cluster heads are involved in the replication node detection process. Actually we believe this method can be revised slightly in the future to avoid misjudging a legal node as replication node while a node leavesone cluster but returns after just a while. Furthermore, the simulation results are provided to compare our approach with the one proposed in Znaidi et al. (2009) and demonstrate the useful scenarios of the proposed method. From these results, they enhance the original speculation that this approach is especially good for some particular applications which are tolerant of some sacrifices of power consumption in return for higher detection rates.
ACKNOWLEDGEMENTThis work is partially supported by MOST 106-2410-H-009-025-MY3.
REFERENCES[1] Boulis, A. (2007, November). Castalia: revealing pitfalls in designing distributed algorithms in WSN. In Proceedings of the
5th international conference on Embedded networked sensor systems (pp. 407-408). ACM.[2] Chan, H., Perrig, A., & Song, D. (2003, May). Random key predistribution schemes for sensor networks. In Proceedings of
the Symposium on Security and Privacy (pp. 197-213). IEEE.[3] Cheng, G., Guo, S., Yang, Y., & Wang, F. (2015, December). Replication attack detection with monitor nodes in clustered
wireless sensor networks. In IEEE 34th International Performance Computing and Communications Conference (IPCCC)(pp. 1-8). IEEE.
[4] Eschenauer, L., & Gligor, V. D. (2002, November). A key-management scheme for distributed sensor networks. In Proceedings of the 9th ACM Conference on Computer and Communications Security (pp. 41-47). ACM.
[5] Heinzelman, W. R., Chandrakasan, A., & Balakrishnan, H. (2000, January). Energy-efficient communication protocol for wireless microsensor networks. In Proceedings of the 33rd Annual Hawaii International Conference on System Sciences Volume 8, Page 8020 (pp. 1-10). IEEE, Maui, Hawaii, January 4-7.
[6] Kumar, G. S., Vinu, P. M., & Jacob, K. P. (2008, December). Mobility metric based leach-mobile protocol. In the 16th International Conference on Advanced Computing and Communications - ADCOM 2008. (pp. 248-253). IEEE.
[7] Lee, Yi-Chang. (2009). A Distributed Protocol for the Detection of Node Replication Attacks in Wireless Sensor Networks.(Master’s thesis, National Chung Cheng University, Chia-Yi, Taiwan).
[8] Naruephiphat, W., Ji, Y., & Charnsripinyo, C. (2012, June). An area-based approach for node replica detection in wireless sensor networks. In IEEE 11th International Conference on Trust, Security and Privacy in Computing and Communications (TrustCom) (pp. 745-750). IEEE.
[9] Newsome, J., Shi, E., Song, D., & Perrig, A. (2004, April). The sybil attack in sensor networks: analysis & defenses. In Proceedings of the 3rd International Symposium on Information Processing in Sensor Networks (pp. 259-268). ACM.
[10] Padmavathi, D. G., & Shanmugapriya, M. (2009). A Survey of Attacks, Security Mechanisms and Challenges in Wireless Sensor Networks. arXiv preprint arXiv:0909.0576.
[11] Parno, B., Perrig, A., & Gligor, V. (2005, May). Distributed detection of node replication attacks in sensor networks. In , IEEE Symposium on Security and Privacy (pp. 49-63). IEEE.
[12] Wang, Y., Attebury, G., & Ramamurthy, B. (2006). A survey of security issues in wireless sensor networks. IEEE Communications Surveys & Tutorials, 8, 2–23.
[13] Yu, C.-M., Tsou, Y.-T., Lu, C.-S., & Kuo, S.-Y. (2013). Localized algorithms for detection of node replication attacks in mobile sensor networks. IEEE Transactions on Information Forensics and Security, 8(5), 754-768.
[14] Znaidi, W., Minier, M., & Ubéda, S. (2009). Hierarchical node replication attacks detection in wireless sensor networks. InProceedings of the 20th IEEE Personal, Indoor and Mobile Radio Communications Symposium (PIMRC '09) (pp. 82-86).IEEE, Tokyo, Japan, September 13-16.
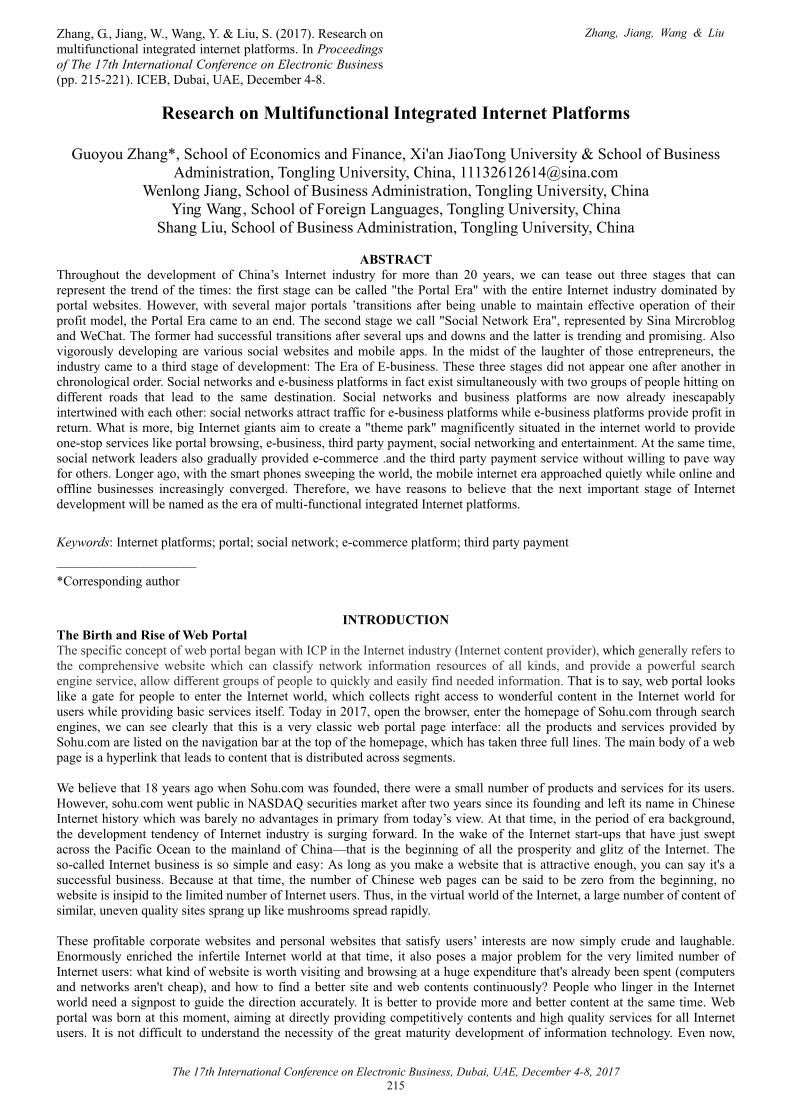
Zhang, G., Jiang, W., Wang, Y. & Liu, S. (2017). Research onmultifunctional integrated internet platforms. In Proceedings of The 17th International Conference on Electronic Business(pp. 215-221). ICEB, Dubai, UAE, December 4-8.
Zhang, Jiang, Wang & Liu
The 17th International Conference on Electronic Business, Dubai, UAE, December 4-8, 2017215
Research on Multifunctional Integrated Internet Platforms
Guoyou Zhang*, School of Economics and Finance, Xi'an JiaoTong University & School of Business Administration, Tongling University, China, [email protected]
Wenlong Jiang, School of Business Administration, Tongling University, ChinaYing Wang, School of Foreign Languages, Tongling University, China
Shang Liu, School of Business Administration, Tongling University, China
ABSTRACTThroughout the development of China’s Internet industry for more than 20 years, we can tease out three stages that can represent the trend of the times: the first stage can be called "the Portal Era" with the entire Internet industry dominated by portal websites. However, with several major portals ’transitions after being unable to maintain effective operation of theirprofit model, the Portal Era came to an end. The second stage we call "Social Network Era", represented by Sina Mircroblog and WeChat. The former had successful transitions after several ups and downs and the latter is trending and promising. Also vigorously developing are various social websites and mobile apps. In the midst of the laughter of those entrepreneurs, the industry came to a third stage of development: The Era of E-business. These three stages did not appear one after another in chronological order. Social networks and e-business platforms in fact exist simultaneously with two groups of people hitting ondifferent roads that lead to the same destination. Social networks and business platforms are now already inescapably intertwined with each other: social networks attract traffic for e-business platforms while e-business platforms provide profit in return. What is more, big Internet giants aim to create a "theme park" magnificently situated in the internet world to provideone-stop services like portal browsing, e-business, third party payment, social networking and entertainment. At the same time, social network leaders also gradually provided e-commerce .and the third party payment service without willing to pave way for others. Longer ago, with the smart phones sweeping the world, the mobile internet era approached quietly while online and offline businesses increasingly converged. Therefore, we have reasons to believe that the next important stage of Internet development will be named as the era of multi-functional integrated Internet platforms.
Keywords: Internet platforms; portal; social network; e-commerce platform; third party payment_____________________*Corresponding author
INTRODUCTIONThe Birth and Rise of Web PortalThe specific concept of web portal began with ICP in the Internet industry (Internet content provider), which generally refers to the comprehensive website which can classify network information resources of all kinds, and provide a powerful search engine service, allow different groups of people to quickly and easily find needed information. That is to say, web portal looks like a gate for people to enter the Internet world, which collects right access to wonderful content in the Internet world for users while providing basic services itself. Today in 2017, open the browser, enter the homepage of Sohu.com through search engines, we can see clearly that this is a very classic web portal page interface: all the products and services provided by Sohu.com are listed on the navigation bar at the top of the homepage, which has taken three full lines. The main body of a web page is a hyperlink that leads to content that is distributed across segments.
We believe that 18 years ago when Sohu.com was founded, there were a small number of products and services for its users. However, sohu.com went public in NASDAQ securities market after two years since its founding and left its name in Chinese Internet history which was barely no advantages in primary from today’s view. At that time, in the period of era background, the development tendency of Internet industry is surging forward. In the wake of the Internet start-ups that have just swept across the Pacific Ocean to the mainland of China—that is the beginning of all the prosperity and glitz of the Internet. The so-called Internet business is so simple and easy: As long as you make a website that is attractive enough, you can say it's a successful business. Because at that time, the number of Chinese web pages can be said to be zero from the beginning, no website is insipid to the limited number of Internet users. Thus, in the virtual world of the Internet, a large number of content of similar, uneven quality sites sprang up like mushrooms spread rapidly.
These profitable corporate websites and personal websites that satisfy users’ interests are now simply crude and laughable.Enormously enriched the infertile Internet world at that time, it also poses a major problem for the very limited number of Internet users: what kind of website is worth visiting and browsing at a huge expenditure that's already been spent (computers and networks aren't cheap), and how to find a better site and web contents continuously? People who linger in the Internet world need a signpost to guide the direction accurately. It is better to provide more and better content at the same time. Web portal was born at this moment, aiming at directly providing competitively contents and high quality services for all Internet users. It is not difficult to understand the necessity of the great maturity development of information technology. Even now,
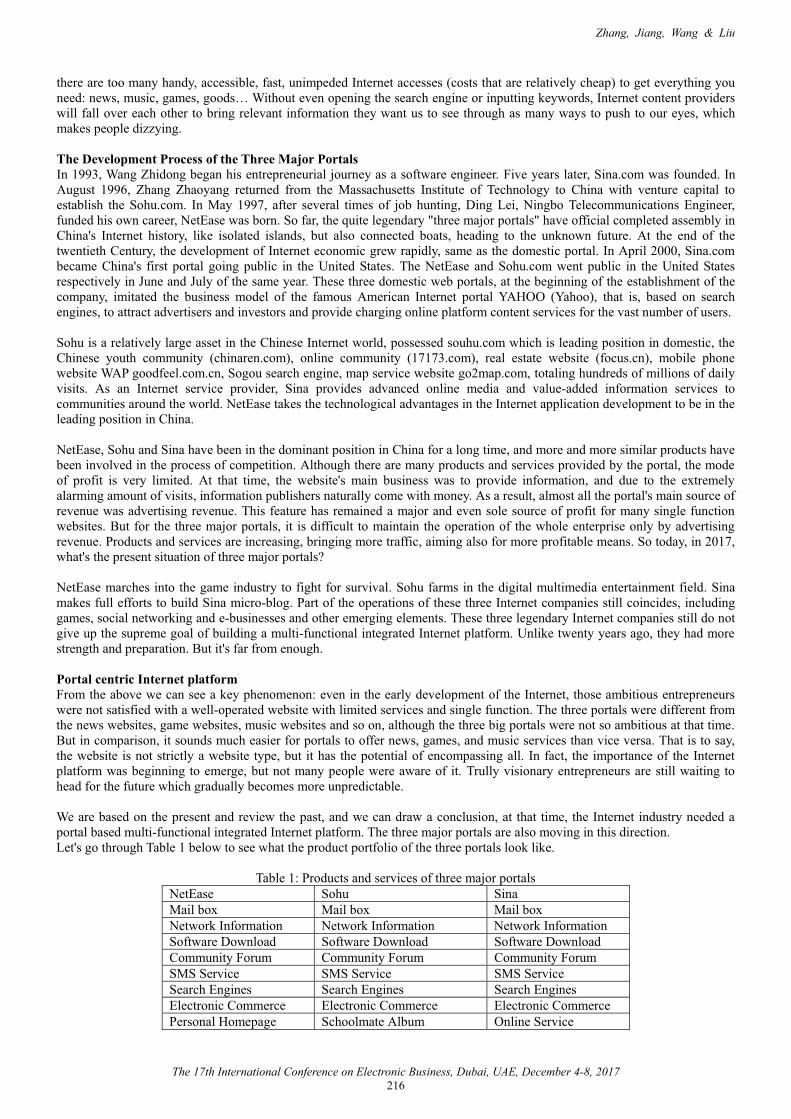
Zhang, Jiang, Wang & Liu
The 17th International Conference on Electronic Business, Dubai, UAE, December 4-8, 2017216
there are too many handy, accessible, fast, unimpeded Internet accesses (costs that are relatively cheap) to get everything you need: news, music, games, goods… Without even opening the search engine or inputting keywords, Internet content providers will fall over each other to bring relevant information they want us to see through as many ways to push to our eyes, which makes people dizzying.
The Development Process of the Three Major PortalsIn 1993, Wang Zhidong began his entrepreneurial journey as a software engineer. Five years later, Sina.com was founded. In August 1996, Zhang Zhaoyang returned from the Massachusetts Institute of Technology to China with venture capital to establish the Sohu.com. In May 1997, after several times of job hunting, Ding Lei, Ningbo Telecommunications Engineer, funded his own career, NetEase was born. So far, the quite legendary "three major portals" have official completed assembly in China's Internet history, like isolated islands, but also connected boats, heading to the unknown future. At the end of the twentieth Century, the development of Internet economic grew rapidly, same as the domestic portal. In April 2000, Sina.com became China's first portal going public in the United States. The NetEase and Sohu.com went public in the United States respectively in June and July of the same year. These three domestic web portals, at the beginning of the establishment of the company, imitated the business model of the famous American Internet portal YAHOO (Yahoo), that is, based on search engines, to attract advertisers and investors and provide charging online platform content services for the vast number of users.
Sohu is a relatively large asset in the Chinese Internet world, possessed souhu.com which is leading position in domestic, the Chinese youth community (chinaren.com), online community (17173.com), real estate website (focus.cn), mobile phone website WAP goodfeel.com.cn, Sogou search engine, map service website go2map.com, totaling hundreds of millions of daily visits. As an Internet service provider, Sina provides advanced online media and value-added information services to communities around the world. NetEase takes the technological advantages in the Internet application development to be in the leading position in China.
NetEase, Sohu and Sina have been in the dominant position in China for a long time, and more and more similar products have been involved in the process of competition. Although there are many products and services provided by the portal, the mode of profit is very limited. At that time, the website's main business was to provide information, and due to the extremely alarming amount of visits, information publishers naturally come with money. As a result, almost all the portal's main source of revenue was advertising revenue. This feature has remained a major and even sole source of profit for many single function websites. But for the three major portals, it is difficult to maintain the operation of the whole enterprise only by advertising revenue. Products and services are increasing, bringing more traffic, aiming also for more profitable means. So today, in 2017, what's the present situation of three major portals?
NetEase marches into the game industry to fight for survival. Sohu farms in the digital multimedia entertainment field. Sina makes full efforts to build Sina micro-blog. Part of the operations of these three Internet companies still coincides, including games, social networking and e-businesses and other emerging elements. These three legendary Internet companies still do not give up the supreme goal of building a multi-functional integrated Internet platform. Unlike twenty years ago, they had more strength and preparation. But it's far from enough.
Portal centric Internet platformFrom the above we can see a key phenomenon: even in the early development of the Internet, those ambitious entrepreneurs were not satisfied with a well-operated website with limited services and single function. The three portals were different from the news websites, game websites, music websites and so on, although the three big portals were not so ambitious at that time.But in comparison, it sounds much easier for portals to offer news, games, and music services than vice versa. That is to say, the website is not strictly a website type, but it has the potential of encompassing all. In fact, the importance of the Internet platform was beginning to emerge, but not many people were aware of it. Trully visionary entrepreneurs are still waiting to head for the future which gradually becomes more unpredictable.
We are based on the present and review the past, and we can draw a conclusion, at that time, the Internet industry needed a portal based multi-functional integrated Internet platform. The three major portals are also moving in this direction.Let's go through Table 1 below to see what the product portfolio of the three portals look like.
Table 1: Products and services of three major portalsNetEase Sohu SinaMail box Mail box Mail boxNetwork Information Network Information Network InformationSoftware Download Software Download Software DownloadCommunity Forum Community Forum Community ForumSMS Service SMS Service SMS ServiceSearch Engines Search Engines Search EnginesElectronic Commerce Electronic Commerce Electronic CommercePersonal Homepage Schoolmate Album Online Service

Zhang, Jiang, Wang & Liu
The 17th International Conference on Electronic Business, Dubai, UAE, December 4-8, 2017217
Digital Assistant Virtual Host Local SiteAnimation Domain Name Registration Solution-- Enterprise Promotion --* Source: Wikipedia
The above table provides NetEase, Sohu and Sina’ products and services for market target customers, many of which overlap, a few are different, and in general, rich and varied. So, how much profit are these products and services have brought about? Obviously it is nothing.
For a long time, the three portals were profitable by attracting advertisers and venture capitalists [4]. The site has obtained great amount of visits to the market by expanding its product lines to keep advertisers and investors interested. Such a so-called profit model, although guaranteed a steady income of a certain number of three portals, far from enough to maintain the long-term operation of the site. New business models need to be developed urgently. With the bursting of the Internet economic bubble and the emergence of Web2.0, the absolute superiority of the portal has been completely lost, and the operation mode with portal as the center is no longer of concern. As a result, the three major portals have begun to transform.Facts have proved that portal is just a periodic product of a special era, the multifunctional integrated Internet platform centered on portal websites is doomed to be unable to last long. This is determined by the very limited business model of the portal.
Nevertheless, in our opinion, the importance of the multi-functional integrated Internet platform has been revealed at that time.At the same time, we must make it clear that such platforms must have a representative center, or the focus of enterprise resource delivery. Combination of products and services provided by the Internet platform should radiate from the point to the surface, the target market will gradually spread, in order to achieve maximum benefits. The three major portals have always wanted to do something that has not been done, and a company of the same period has completed its grand layout in the midst of a controversy.
SOCIAL NETWORKING INCLUDING PORTAL AND E-COMMERCEFrom Instant Messenger to Social PlatformAs the new concept of portal is attracting eyes of immature domestic Internet industry in the vast majority of practitioners, one software called OICQ was developed by a little-known Internet Co Tencent and launched on the market in 1999. The software, which was targeted as an instant messaging network tool at the time, was similar to a portal site, but was modeled on ICQ, aninternational chat tool. With the continuous development and optimization of the Tencent over the past ten years, it has evolved into the QQ we all know today. We found that the original purpose of QQ (OICQ) is to provide online chat for users, and this service needs segmentation market, and a special dating site have already involved. At the same time, the three major portals have similar products, but it is only one of the general directions of many attempts to make profits, and has not received much strategic attention.
Tencent has its vision, made QQ as its main business and polished QQ into the most popular online chat tool step by step.Similarly, in its early stage, Tencent QQ encountered the same vital problem, hard to gain profit, as the three major portals did.Different from the three major portals, Tencent QQ has always focused on resources instant messaging in this market and the QQ instant messaging software, finally made outstanding achievements. No one could have imagined that many people were not initially optimistic about the QQ, however, in a few years later, it defeated many opponents represented by Microsoft MSN, and became the largest personal instant messaging software in China in terms of usage amount. In the process of Tencent's growing, it gradually derived many lifestyle and entertainment features, including Tencent portal, QQ show, QQ games, QQ mail, PaiPai.com etc. That is to say, Tencent has become a platform for integration of the rich and colorful products and services.
Here, we can confirm exactly that, Tencent portal had achieved what the portals wanted to do but ultimately failed to. That is simply to make chat QQ as the center platform and guide a huge group of users flow into various products and services. Today, we no longer call QQ an instant messenger, but would rather call it an Internet social platform. In addition to its basic social functions, QQ is also open to all of Tencent's products. QQ users can easily use all of Tencent's product services. Tencent is fully aware of the strategic position of the social platform, and has developed epoch-making mobile phone communication social software - WeChat based on the solid market laid by QQ. Made a more exciting success.
Today, WeChat has replaced QQ as the most successful social platform Tencent has opened up, with more excuses for opening up and more far-reaching impact on the Internet industry as a whole. Another Internet Corporation, Sina, had been well-known for a time with portal, caught up with the opportunity of social networking. Frustrated on the portal, Sina turned to the social network and made a big effort to build Sina micro-blog, which eventually reshaped its brilliance. It can be said that the success of Sina, micro-blog and WeChat marks the pinnacle of China's Internet social networking era.
The Functionality of Internet SocializingThe same with the portal, in the later stage of development, Internet socializing has naturally changed from the theme of a website into an additional function. More and more enterprises begin to integrate social function in their product line, even

Zhang, Jiang, Wang & Liu
The 17th International Conference on Electronic Business, Dubai, UAE, December 4-8, 2017218
there is no need to develop this function, it is easy for the ever-changing network information technology to do. Portals can open social product services to a wide range of users, such as online chat products offered by three major portals. At the same time, other types of Web sites can also integrate portal functionality, such as the home page of the Tencent, which started with instant messenger QQ (www.qq.com).
With the popularity of smart phones, all Internet Co pay more and more attention to the product layout of the mobile terminal. As early as Jobs redefined the phone with iPhone, the phone QQ has taken an important position in users’ mind. The web server, computer and mobile phone have become the three largest Internet Co battlefields, among which the intelligent mobile phone terminal replaced the former two to take the main position in each big enterprise. In addition to these Internet products which have been struggling in the networking market, such as WeChat, Sina, micro-blog, Baidu Post Bar, more and more other types of mobile phone APP considerably step closer to the social function and become neither fish nor fowl. One of the most representatively is Alipay as the third party payment software. In stark contrast, WeChat's mobile payment market is like a duck to water. That's due to the advantage of social networking. Social networking can easily be condensed into a functional product service, as well as more compatible Internet services such as portals and e- commerce.
Profit models for Social NetworksBased on product characteristics, we analyze the differences between the portal and social networks, as well as the pros and cons. But the real reason for making social networks mainstream is that social networks have a stable and effective profit model. Portal profit model mentioned earlier, namely advertising + venture capital. Once the flow of Web sites no longer keeps advertisers satisfied, advertising revenue falls sharply, and it is hard for investors to appeal to them. So, how do social networks ensure profitability?
Today, the domestic social network products are broadly divided into three categories: the first category is WeChat (includingQQ), Sina, micro-blog and Baidu stick, etc. This category is often the main product or strategic layout of large companies, regardless of resources, located in the upper reaches of the food chain. The second category is located in the middle reaches, facing the market segments, such as douban.com, NetEase, Lofter (Le Hu), Renren.com and so on. The third category is the ever-emerging products of start-ups, such as MOMO and so on.
Due to various reasons, these three types of social network shave sharp differences in various products and services, but act the same in terms of gaining profit. Domestic social networking profit mainly include advertising, membership, games, electricity providers and continue to be tapped out of profit methods. Today's online advertising marketing and Web1.0 portal era are quite different. On the basis of retaining popular display ads, the marketing approach has been greatly enriched by creative practitioners who can say that only surprisingly they can't do it. At present, WeChat and Sina micro-blog are the two largest Internet marketing platforms. Plus, social networking is the UGC web site, where users create content. Huge user groups share information and communicate content in social networks, and the traffic is huge and stable. This makes the web more attractiveto users and allows them to remain loyal and continue to produce content rather than run out of it.
This big feature of social networking ensures its strong user stickiness and makes it profitable, stable and sustainable.We can draw a conclusion that the most important problem is how to make the right profit for the multi-functional integrated Internet platform. That is to say, it is impossible for each platform to make a hundred percent money, but there must be one such product that maintains platform operations and radiates other product services. In terms of this, Tencent is acting perfectly with the starting point being QQ, aka social networking. Therefore, the entire Internet market will pay so much attention to social networking, many industry giants do social networking at any cost. Among them, Ali is a top-ranking player.
INTERRELATIONSHIP BETWEEN ELECTRONIC BUSINESS PLATFORMS AND SOCIAL NETWORKSRidge Road of Alipay Social NetworkingAt the end of last chapter, Ali made all costs to break into the market of social networking which is already saturated; the most representative is Alipay app mobile phone on the integration of social function of resilience. Alipay, a third party online payment platform founded by Alibaba group in December 2004, is now a Alibaba affiliated company group. Alipay can pay online, the official application support credit card free repayment, Q coins recharge, water gas fee payment. You can also pay for air travel, education fees, book payments and tickets for major events. Alipay was originally a function in order to solve the network transaction security set by Taobao. The function first uses "the third party secured transaction model". In December 2004 Alipay become an independent Zhejiang Alipay Network Technology Co Ltd, renamed in January 2008 on Alipay Network Technology Co. Ltd. As of December 2012, the number of registered users of Alipay exceeded 80 million, the peak daily turnover of more than 20 billion RMB, the peak number of transactions reached 105.8 million.
Alipay (hereinafter refers to mobile phone app) is an important product of Ali to layout the mobile communication. Mentioned in the previous chapter, social networking is easy to be integrated into a small but complete function. Alipay spent a lot to do social networking, but with little success.
Table 2: Mobile phone monthly active rankingRanking Mobile APP Field Developers Monthly active population (10,000)
1 WeChat social intercourse tencent 78,696.202 QQ social intercourse tencent 57,944.80

Zhang, Jiang, Wang & Liu
The 17th International Conference on Electronic Business, Dubai, UAE, December 4-8, 2017219
3 Alipay payment Ali 33,712.704 Taobao e-commerce Ali 29,740.205 Iqiyi video Iqiyi 24,561.106 QQ browser browser tencent 24,128.907 Tencent videos video tencent 23,919.60
* Source: Analysys think tank
From Table 2, we can see that in the mobile phone mobile communications market, Tencent and Ali are two major competition giants, Tencent can be said to fully suppressed ali. Of the top seven in the rankings, 4 came from the Tencent and 2 from ali. The first two are social software, the third or fourth are leading payment and e-commerce providers. Here you can fully see the importance of multi-functional integrated Internet platform, if not in Tencent's banner, it is difficult to believe that QQ browser and Tencent video will have a place on the list.
As Ali's biggest rival, it’s easy for Tencent to do e-business, payment and the Internet finance, in fact Tencent has done so. However, Ali hasn’t done so well in social networking so they take heavy defensive measures in its original business areas.This is the magic of social networking, which can be a mainstay of a multi-functional integrated Internet platform, and can also be compatible with multiple products in all directions. The portals and e-businesses can reluctantly do the former, but not the latter.
Portal, Social and E-commerce- Pulling in the Same DirectionBecause of its advantages of openness, expansibility, low cost and high income, e-commerce has gained more than twenty-two years of development since it was formally born in 1995.The explosive development of an emerging industry, of course, will give birth to one or more "Big Mac" industry giants. Today, Alibaba group is undoubtedly the leader in the field of e-commerce, but also the biggest and most direct beneficiaries and participants in sharing the huge development bonus of e-commerce industry.
After the birth of Alibaba in 1999, meet at Alibaba strategy was formulated. With China having gradually become the "factory of the world", Ali launched import and export trade credit information products and services such as homeopathy integrity and Chinese Suppliers and China, the implementation of the development strategy of the third party B2B business platform always online exhibition ", for domestic small and medium-sized enterprises to expand domestic and foreign markets, making greatcontribution. Ali, after years of steady development, the competitors far behind, a banner incarnation of B2B business platform; step into the capital market and used to be the highest domestic market capitalization of Internet Co; The world's largest sales of electronic business platform; with the world's largest amount of registered users of electronic business platform… All these proved Ali’s successes. Today’s Ali wants to do more, but the difficulties are also more. Ali obviously does not want to be limited to an e-commerce platform, but to become the top of the Internet industry giant, that is, multi-functional integrated Internet platform, all inclusive. Ali, however, had a rival target of equal magnitude, which was the Tencent, and the annoying adversary was much closer to that end than Ali.
Ali created so many achievements today, relying on the e-commerce platform; Tencent can now have such a huge body mass, because of never abandoning the social network; At the same time, NetEase, Sohu and Sina, which had the same ambitions, chose the web portal. Interesting thing is that the portal, social and e-commerce in China's history of the birth of the internet almost appeared at the same time. Different people take different roads, and they reach different destinations naturally. Now it seems that the social network and e-commerce providers made what the portals cannot make. Or what NetEase, Sohu and Sina did not do, Tencent and Ali did. More than 20 years ago, the two Internet Co. were in the opposite direction. In fact, the portal is still there, and the NetEase, Sina and Sohu are still having the same aim, but the possibility is not much. In our view, the NetEase is still moving in that direction, which can be seen from its social and e-commerce of the action. As for Sina and Sohu,their original aspiration should have died long ago.
Internet Platform Needs People's Sense of ParticipationWhether it is portal platform, or social network and e-commerce platform, or is the so-called multi-functional integrated Internet platform, we believe that the most indispensable is the sense of participation. The world of the Internet, the real world, and the people who are full of personality and participating in the whole operation of the system are the source of the connection between man and the world. If the virtual cyberspace does not get existence and participation of real people, the Internet will have no meaning. Similarly, a commercial Internet platform, if it does not allow its users to have an impact on the sense of participation and satisfaction, there will be no long-term development of vitality.
Portal is more like a simple information display and content portal integrated platform, visitors actively seek information andpassively receive information. Once they find a better information center platform, they will be easily fond of the new and gettired of the old. Social networks and business platforms are based on the participation and input of countless users: Social networking requires users to exchange information and distribute content, and the electronic business platform requires buyers and sellers to trade in it. People need social networking to meet the needs of society and the e-business platform for easy shopping. Accordingly, these two Internet platforms need more people to participate in the operation of the entire web site system.
Zhang, Jiang, Wang & Liu
The 17th International Conference on Electronic Business, Dubai, UAE, December 4-8, 2017220
We believe that the construction of multi-functional integrated Internet platform must pay attention to the user's sense of participation. Social networks are born with such genes, so for now, it is the most likely to be the key to the success of a multi-functional integrated Internet platform. As a matter of fact, we have every reason to think that the Tencent has completed its preliminary layout. And this is what Ali cannot do, because once you have decided on the initial self-image, it was like you have scattered the seeds and different fruits will come out of different breeds.
THE PROSPECT OF MULTI-FUNCTIONAL INTEGRATED INTERNET PLATFORMCommon Features of Portals, Social Networking and E-CommerceFrom the text above, a portal centered multifunctional integrated Internet platform (three portals) failed but social networking centered multifunctional integrated Internet platform (Tencent) is successful, and why is that? When the portal market is emerging, the country is in the embryonic stage of the Internet industry. The functional characteristics of the large-scale integration of the portal website conform to the market demand at that time, and have been favored by the market. But with the rapid development of the Internet industry, Internet users are surging, they got many methods to get access to information, theportal market gradually saturated, and eventually withdraw from the stage of history Web1.0, followed by Web2.0's, ended with the decline of the portal and made a choice of social networking. Or it could be said that the social network embraces Web2.0.
Like portal websites, domestic social networks are relatively late and developing fast. The first craze took place in 2008, when the "steal farming" game became popular and swept the web. After this, "social + game" business model continues so far.After the heat of "stealing farming" dissipated, "forwarding" became one of the basic components of social networks without taking any extra trouble. People begin to assemble, discuss, and share information on a specific topic in the online community.Baidu post bar, douban.com, Renren.com and a large number of thematic communities become flourish. Communication is one of the basic needs of human beings. Whether in reality or in the virtual Internet world, social networking has always been atimeless theme. The emergence of social networks has made the world of the Internet more virtual and subtler than the real world. It's hard to say whether the real world dominates the Internet or contrary, which is the real world.
There is no doubt that the world is revolutionary. From the foregoing point of view, the so-called multi-functional integrated Internet platform seems to have to provide at least three services: portal, social networking and e-commerce platform. The reason, we believe is that these three Internet products and services are very complex, systematic and consistent. And the characteristics of these three kinds of unification are also the essential qualities of the multi-functional comprehensive Internet platform. Compared to other single functional and confirmed target market of the Internet products, portals, social and e-commerce are facing undefined and broad customer groups.
For example, people go to restaurants for having foods, cinema for watching movies. But in Disneyland, there are restaurants and cinemas, and there are more recreational facilities than ordinary amusement parks. Portals, social networks and e-commerce platforms are like playgrounds, and the ultimate dream is to become Disneyland of the Internet world. Well, is there such an Internet company can do this? At present, it seems that Tencent is approaching the ultimate goal held by of its fellow Internet Companies.
Platform Competition Status and Analysis of the Advantages of All PartiesIf we selected several Internet Co from the portal, social and commercial fields to compete for the title of a multifunctional integrated Internet platform, we will focus on the NetEase, Tencent, Ali and Baidu. The three Internet Co products line overlap, so that competition can’t be avoided. NetEase started with a portal, and now the product line across the portal, games, social networking, e-commerce and other fields has made many achievements. Its NetEase portal, mailbox, computer game agent, mobile game development, overseas purchasing, NetEase cloud music, NetEase public class, pictures social community LOFT and other brand services have hit scale.Compared to NetEase, Tencent and Baidu have done so much better. Its products and services almost cover all areas that can be subdivided into the Internet industry. QQ, QQ mailbox, QQ music, QQ browser, QQ video, QQ game, QQ typewriting, Tencent video, Tencent map, Tencent news, Tencent cloud and so on. And it’s the same case by changing the prefix of these products into "Baidu": Baidu music, Baidu audio and video, Baidu browser, Baidu typewriting, Baidu maps, Baidu news, Baidu cloud, and so on. Ali is naturally unwilling to fall behind, in addition to its own business, it is involved in the same fields with Tencent, Baidu. For Internet giants with strong capital, it is easy to move into an emerging market segment. The four Internet giants listed in the previous chapter have different strengths, and the following is a brief analysis.
Compared with competitors, the NetEase does not have specific advantages and the portal it relied on at an early stage has already lost the historical position. NetEase is successful, and we think it is because NetEase operates in the target market intensively and meticulously. After all, it’s a technology oriented company. The advantage of Tencent in above has been discussed; the social network is the trump card. Ali's trump card is the electronic supplier platform which was already noted above. As for Baidu, it mastered the search engine and resorted to every means in order to gain traffic for its products. We believe that Tencent is most likely to win this competition. In fact, Tencent is already in the upper hand. This is the magic of relying on social networks. Tencent doesn’t always enter the niche markets at the first opportunity, but it makes more profit
Zhang, Jiang, Wang & Liu
The 17th International Conference on Electronic Business, Dubai, UAE, December 4-8, 2017221
than its competitors who move earlier.
ProspectWe believe that the Tencent model can’t be copied. That is to say, even after the emergence of social applications beyond WeChat, it will not drive an Internet Co beyond Tencent. Only Tencent can surpass itself. Of course, it can't be Ali. That is to say, the Internet industry entrepreneurs will never parachute in a so-called multifunctional Internet platform, in fact, no one will do such a thing to tell some fantastic tales. As for the multi-functional integrated Internet platform, it is better to do the addition and subtraction than to start from scratch. It could only bring challenges to the Internet giants who were developed to a certain degree of maturity rather than endless stream of Internet parvenus ripened by capitals. Ali wants to make a breakthrough in networking and O2O services, however, the self-defeating efforts brought a lot of discomfort to users. Tencent is not able to duck in all market segments. E-commerce related Paipai.com failed and turned to cooperate with Jingdong, Revealing an old saying, “the enemy's enemy is a friend.”
As can be seen, such platforms are "multi" functioning, rather than "all-round" functioning. Its comprehensive features allow integration capabilities, but can’t be compatible with everything in the Internet world. After all, the Internet is too big for a company. Dispute between Tencent and Ali, by imitating each other's way, will see a fight in each potential market competition.They had better return to their profound field to achieve perfection. Ultimately, the choice of users will prove everything.
CONCLUSIONThrough the four chapters, we have sorted out three very representative stages of Internet development. We need to make it clear once again, the portal, social network and e-business almost simultaneously appeared, but in different time periods occupied the central position of the Internet industry. They did not appear a single linear chronological order.
Since China officially joined the Internet, it has been more than 20 years. In the wild growth of the industry, the number of Internet users is increasing day by day, the market is growing steadily, and all kinds of companies and enterprises emerge one after another. Generations of ambitious entrepreneurs made endless struggle, dying the promising “blue sea” of internet industry with cruel bloody red. Every Internet practitioner needs to face the problem, how to come out on top in the tide of the Internet. As for the Internet giants that have been developing so far, it is the most important thing to strengthen the status while continuing to increase. NetEase, Sohu and Sina are the three major domestic portals, the three almost simultaneously created Internet Co today are totally different from their beginning, no one will use the "portal" to describe them. Speaking of NetEase, we first think of NetEase games, domestic online agent and production benchmark. Sohu turned to multimedia digital entertainment, trying to build an entertainment community with video, news, games and other media information. Sina seize the social networking as its life-saving straw, pushing micro-blog into Chinese top 1 social network.
Meanwhile, Internet giants, led by Tencent, Ali and Baidu, have joined new markets that have been opened by creative practitioners, with one just finished and another come on the scene, turning the treacherous industry into a capital battlefield with no bullet. It is worth to notice that, at the beginning, the portal, social network and e-commerce are fragmented, but in the process of continuous progress, the three have a subtle and complex relationship. Till today, this connection still exists. The portal is no longer in its prime, but it has not completely disappeared. Social networking seems to embrace everything, becoming the dominant factor of “Internet plus". E-commerce is still hot, which was cited as a direct and effective way of gaining profit by many start-up companies. The Internet has been moving forward, with countless new things being discovered grabbing people's attention showing an endless play. In such complex market environment, who would be the next to cause the uproar, we can only wait and see.
ACKNOWLEDGMENTThis paper is supported by Foundation of Philosophy & Social Science of AH Province, China(AHSK11-12D336) and Teaching & Research Foundation on Higher Education of AH Province, China(2012jyxm521).
REFERENCESReferences are available upon request from the corresponding author.
Fan, C., Wen, T., Xu, B., Wang, J. & He, K. (2017). Research on the development of measurement scale for the synergy of college technological and creative team. InProceedings of The 17th International Consortium for Electronic Business (pp. 222-227). ICEB, Dubai, UAE, December 4-8.
Fan, Wen, Xu, Wang & He
The 17th International Conference on Electronic Business, Dubai, UAE, December 4-8, 2017222
Research on the Development of Measurement Scale for The Synergy of College Technological and Creative Team
Chuanhao Fan, Hohai University, China, [email protected] Wen*, Hohai University, China, [email protected]
Buchao Xu, East China University of Technology, China, [email protected] Wang, Hohai University, China, [email protected]
Kaiyuan He, Hohai University, China, [email protected]
ABSTRACTBased on the strictly scale development program and the sorting of existing literature, we used the methods of interview and open questionnaire to collect measurement items for the synergy of college technological and creative team. Next we preliminarily revised measurement items through expert interview, then explored and verified the presurvey scale by using exploratory factor analysis and confirmatory factor analysis. The results show that the measurement scale, consisted of 17 items with good reliability and validity, is constituted of member's identification of team goals, information communication among members, commitment of cooperation, inter-behavior between members.
Keywords: College technological and creative team; synergy; the development of scale_____________________*Corresponding author
INTRODUCTIONIn the era of knowledge economy, the global competition is more and more fiercely. As a new form of Industry-University-Research(IUR) organization and a prominent platform for creative talents training, the college technological creative team has become an influential component of the state's scientific and technological innovation systems, as well as plays an important role in the overall development of Chinese scientific research level and the improvement of the national comprehensive strength. Many studies have observed that individual development is a short-term benefit, only through cooperation, information sharing and resources sharing can the team realize the long-term effect of "1+1>2", so as to improve the performance of innovation (Buraj, 2007; C. Annique & Alvaro, 2010; Wu & Su, 2012; Xie et al., 2014).
The concept of synergy is a relationship based upon the resources sharing, in which, enterprises are able to realize symbiosis and mutual growth (Ansoff, 1957). Subsequently, Haken established synergetics in 1970’s, which mainly reveals the evolution law of system from disorder to order. Soon afterwards, synergetics has been received extensive attention and application. The focus of these studies is the synergistic connotation (Chen & Yang, 2012; Yang et al., 2013), coordination mechanism (Li & Liang, 2012; Liang et al., 2014), synergistic effect (Sirower,1997; Yun et al., 2006) and collaborative optimization management (Wang et al., 2012; Wu et al., 2013). In recent years, some researchers try to measure the synergy from different methods. Firstly, in 2004, researchers constructed the evaluation of three synergy stages, which contains three dimensions of ideological synergy, behaviour synergy and contingency coordination, with 18 measurement items (Wu et al., 2012). Secondly, the synergy ability model was constructed with 23 indexes, which includes six aspects: thinking synergy, knowledge application ability, management ability, interpersonal relationship ability, emergency response ability and innovation ability(Wang & Miao, 2007). Thirdly, a synergy evaluation index was constructed system from three aspects: market capability, scientific and technological innovation ability and team management ability, with 10 secondary indicators and 26 third-class indicators (Lu & Bu, 2010). Fourthly, collaborative evaluation system was constructed, containing 14 indicators from individual, team, organization and inter-organization four levels (Xu, 2010). Lastly, based on the aspects of information, resources, capabilities and Strategies, a synergistic effect evaluation model which contains 9 indicators was constructed (Wang & Zhao, 2013). From overview of the existing research on synergetic measure, it is found that no consensus has yet been formed on the synergy measure. The existing research focus on the industrial level, moreover, in which it mainly focuses on Man and machine, man and system, as well as man and tool. However, it is rarely that researchers pay attention to systematic study of synergy between people, especially to the synergy of college technological and creative team. Hence, this research mainly makes efforts on the exploration of synergy of college technological and creative team, through which, the authors develop a measurement scale to meet the requirement of synergy of college technological and creative team.
Kevin Forsberg pointed out that effective teamwork has four basic principles, which are clearly defining common goals,recognition of mutual dependence on the basis of mutual respect, accepting the shared code of conduct, and sharing rewards and spirit of teamwork and energy. Based on the above principles and the actual situation of college technological creative team, the authors take the synergy of college technological and creative team as a process, and give its definition is that the
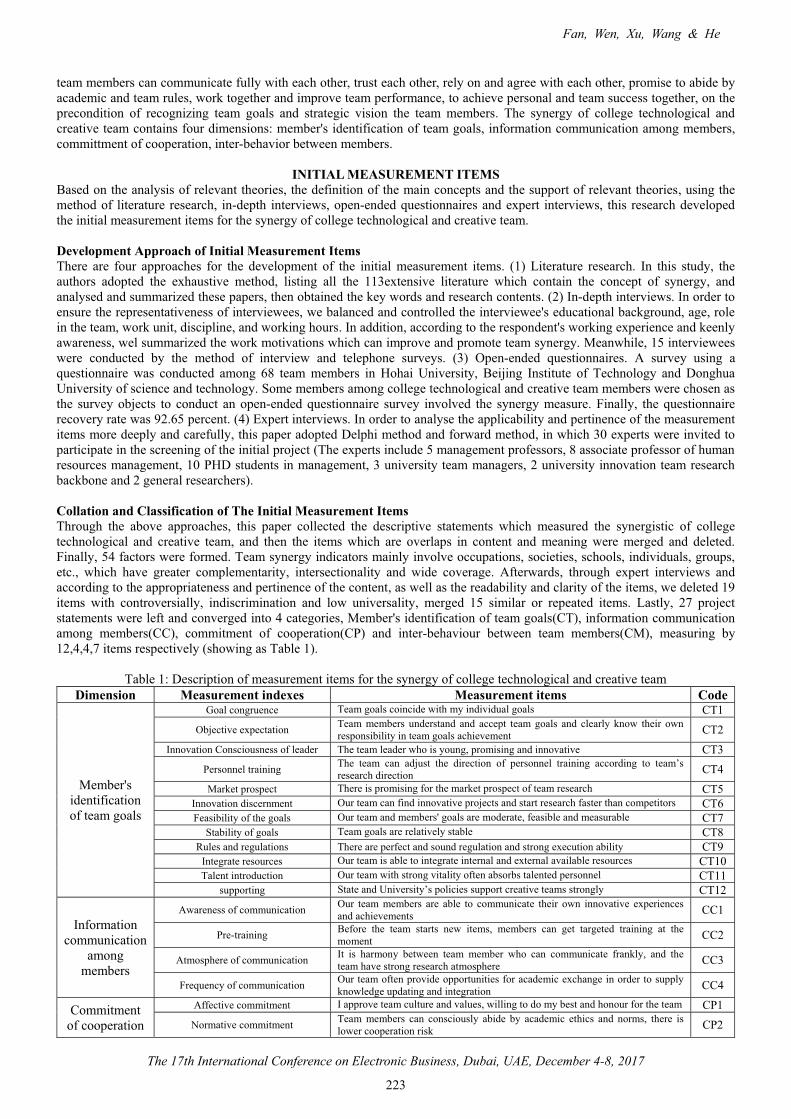
Fan, Wen, Xu, Wang & He
The 17th International Conference on Electronic Business, Dubai, UAE, December 4-8, 2017
223
team members can communicate fully with each other, trust each other, rely on and agree with each other, promise to abide by academic and team rules, work together and improve team performance, to achieve personal and team success together, on the precondition of recognizing team goals and strategic vision the team members. The synergy of college technological and creative team contains four dimensions: member's identification of team goals, information communication among members, committment of cooperation, inter-behavior between members.
INITIAL MEASUREMENT ITEMSBased on the analysis of relevant theories, the definition of the main concepts and the support of relevant theories, using the method of literature research, in-depth interviews, open-ended questionnaires and expert interviews, this research developedthe initial measurement items for the synergy of college technological and creative team.
Development Approach of Initial Measurement ItemsThere are four approaches for the development of the initial measurement items. (1) Literature research. In this study, the authors adopted the exhaustive method, listing all the 113extensive literature which contain the concept of synergy, andanalysed and summarized these papers, then obtained the key words and research contents. (2) In-depth interviews. In order to ensure the representativeness of interviewees, we balanced and controlled the interviewee's educational background, age, role in the team, work unit, discipline, and working hours. In addition, according to the respondent's working experience and keenly awareness, wel summarized the work motivations which can improve and promote team synergy. Meanwhile, 15 intervieweeswere conducted by the method of interview and telephone surveys. (3) Open-ended questionnaires. A survey using a questionnaire was conducted among 68 team members in Hohai University, Beijing Institute of Technology and Donghua University of science and technology. Some members among college technological and creative team members were chosen as the survey objects to conduct an open-ended questionnaire survey involved the synergy measure. Finally, the questionnaire recovery rate was 92.65 percent. (4) Expert interviews. In order to analyse the applicability and pertinence of the measurement items more deeply and carefully, this paper adopted Delphi method and forward method, in which 30 experts were invited to participate in the screening of the initial project (The experts include 5 management professors, 8 associate professor of human resources management, 10 PHD students in management, 3 university team managers, 2 university innovation team research backbone and 2 general researchers).
Collation and Classification of The Initial Measurement ItemsThrough the above approaches, this paper collected the descriptive statements which measured the synergistic of collegetechnological and creative team, and then the items which are overlaps in content and meaning were merged and deleted.Finally, 54 factors were formed. Team synergy indicators mainly involve occupations, societies, schools, individuals, groups, etc., which have greater complementarity, intersectionality and wide coverage. Afterwards, through expert interviews and according to the appropriateness and pertinence of the content, as well as the readability and clarity of the items, we deleted 19 items with controversially, indiscrimination and low universality, merged 15 similar or repeated items. Lastly, 27 project statements were left and converged into 4 categories, Member's identification of team goals(CT), information communication among members(CC), commitment of cooperation(CP) and inter-behaviour between team members(CM), measuring by 12,4,4,7 items respectively (showing as Table 1).
Table 1: Description of measurement items for the synergy of college technological and creative teamDimension Measurement indexes Measurement items Code
Member's identification of team goals
Goal congruence Team goals coincide with my individual goals CT1Objective expectation Team members understand and accept team goals and clearly know their own
responsibility in team goals achievement CT2Innovation Consciousness of leader The team leader who is young, promising and innovative CT3
Personnel training The team can adjust the direction of personnel training according to team’s research direction CT4
Market prospect There is promising for the market prospect of team research CT5Innovation discernment Our team can find innovative projects and start research faster than competitors CT6Feasibility of the goals Our team and members' goals are moderate, feasible and measurable CT7
Stability of goals Team goals are relatively stable CT8Rules and regulations There are perfect and sound regulation and strong execution ability CT9
Integrate resources Our team is able to integrate internal and external available resources CT10Talent introduction Our team with strong vitality often absorbs talented personnel CT11
supporting State and University’s policies support creative teams strongly CT12
Information communication
among members
Awareness of communication Our team members are able to communicate their own innovative experiences and achievements CC1
Pre-training Before the team starts new items, members can get targeted training at the moment CC2
Atmosphere of communication It is harmony between team member who can communicate frankly, and the team have strong research atmosphere CC3
Frequency of communication Our team often provide opportunities for academic exchange in order to supply knowledge updating and integration CC4
Commitment of cooperation
Affective commitment I approve team culture and values, willing to do my best and honour for the team CP1Normative commitment Team members can consciously abide by academic ethics and norms, there is
lower cooperation risk CP2
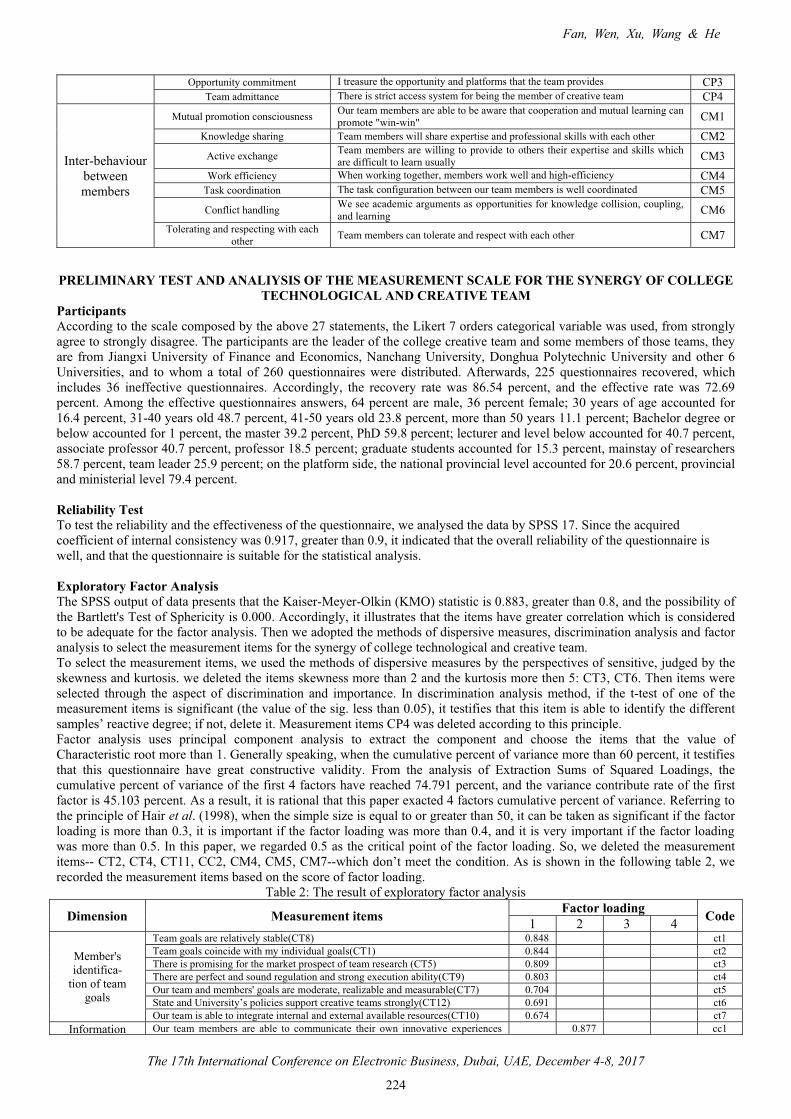
Fan, Wen, Xu, Wang & He
The 17th International Conference on Electronic Business, Dubai, UAE, December 4-8, 2017
224
Opportunity commitment I treasure the opportunity and platforms that the team provides CP3Team admittance There is strict access system for being the member of creative team CP4
Inter-behaviour between members
Mutual promotion consciousness Our team members are able to be aware that cooperation and mutual learning can promote "win-win" CM1
Knowledge sharing Team members will share expertise and professional skills with each other CM2Active exchange Team members are willing to provide to others their expertise and skills which
are difficult to learn usually CM3Work efficiency When working together, members work well and high-efficiency CM4
Task coordination The task configuration between our team members is well coordinated CM5Conflict handling We see academic arguments as opportunities for knowledge collision, coupling,
and learning CM6Tolerating and respecting with each
other Team members can tolerate and respect with each other CM7
PRELIMINARY TEST AND ANALIYSIS OF THE MEASUREMENT SCALE FOR THE SYNERGY OF COLLEGE TECHNOLOGICAL AND CREATIVE TEAM
ParticipantsAccording to the scale composed by the above 27 statements, the Likert 7 orders categorical variable was used, from strongly agree to strongly disagree. The participants are the leader of the college creative team and some members of those teams, theyare from Jiangxi University of Finance and Economics, Nanchang University, Donghua Polytechnic University and other 6 Universities, and to whom a total of 260 questionnaires were distributed. Afterwards, 225 questionnaires recovered, which includes 36 ineffective questionnaires. Accordingly, the recovery rate was 86.54 percent, and the effective rate was 72.69percent. Among the effective questionnaires answers, 64 percent are male, 36 percent female; 30 years of age accounted for 16.4 percent, 31-40 years old 48.7 percent, 41-50 years old 23.8 percent, more than 50 years 11.1 percent; Bachelor degree or below accounted for 1 percent, the master 39.2 percent, PhD 59.8 percent; lecturer and level below accounted for 40.7 percent, associate professor 40.7 percent, professor 18.5 percent; graduate students accounted for 15.3 percent, mainstay of researchers58.7 percent, team leader 25.9 percent; on the platform side, the national provincial level accounted for 20.6 percent, provincial and ministerial level 79.4 percent.
Reliability TestTo test the reliability and the effectiveness of the questionnaire, we analysed the data by SPSS 17. Since the acquired coefficient of internal consistency was 0.917, greater than 0.9, it indicated that the overall reliability of the questionnaire iswell, and that the questionnaire is suitable for the statistical analysis.
Exploratory Factor AnalysisThe SPSS output of data presents that the Kaiser-Meyer-Olkin (KMO) statistic is 0.883, greater than 0.8, and the possibility of the Bartlett's Test of Sphericity is 0.000. Accordingly, it illustrates that the items have greater correlation which is considered to be adequate for the factor analysis. Then we adopted the methods of dispersive measures, discrimination analysis and factor analysis to select the measurement items for the synergy of college technological and creative team.To select the measurement items, we used the methods of dispersive measures by the perspectives of sensitive, judged by the skewness and kurtosis. we deleted the items skewness more than 2 and the kurtosis more then 5: CT3, CT6. Then items were selected through the aspect of discrimination and importance. In discrimination analysis method, if the t-test of one of themeasurement items is significant (the value of the sig. less than 0.05), it testifies that this item is able to identify the different samples’ reactive degree; if not, delete it. Measurement items CP4 was deleted according to this principle.Factor analysis uses principal component analysis to extract the component and choose the items that the value of Characteristic root more than 1. Generally speaking, when the cumulative percent of variance more than 60 percent, it testifies that this questionnaire have great constructive validity. From the analysis of Extraction Sums of Squared Loadings, the cumulative percent of variance of the first 4 factors have reached 74.791 percent, and the variance contribute rate of the first factor is 45.103 percent. As a result, it is rational that this paper exacted 4 factors cumulative percent of variance. Referring to the principle of Hair et al. (1998), when the simple size is equal to or greater than 50, it can be taken as significant if the factor loading is more than 0.3, it is important if the factor loading was more than 0.4, and it is very important if the factor loading was more than 0.5. In this paper, we regarded 0.5 as the critical point of the factor loading. So, we deleted the measurement items-- CT2, CT4, CT11, CC2, CM4, CM5, CM7--which don’t meet the condition. As is shown in the following table 2, we recorded the measurement items based on the score of factor loading.
Table 2: The result of exploratory factor analysis
Dimension Measurement items Factor loading Code1 2 3 4
Member's identifica-
tion of team goals
Team goals are relatively stable(CT8) 0.848 ct1Team goals coincide with my individual goals(CT1) 0.844 ct2There is promising for the market prospect of team research (CT5) 0.809 ct3There are perfect and sound regulation and strong execution ability(CT9) 0.803 ct4Our team and members' goals are moderate, realizable and measurable(CT7) 0.704 ct5State and University’s policies support creative teams strongly(CT12) 0.691 ct6Our team is able to integrate internal and external available resources(CT10) 0.674 ct7
Information Our team members are able to communicate their own innovative experiences 0.877 cc1
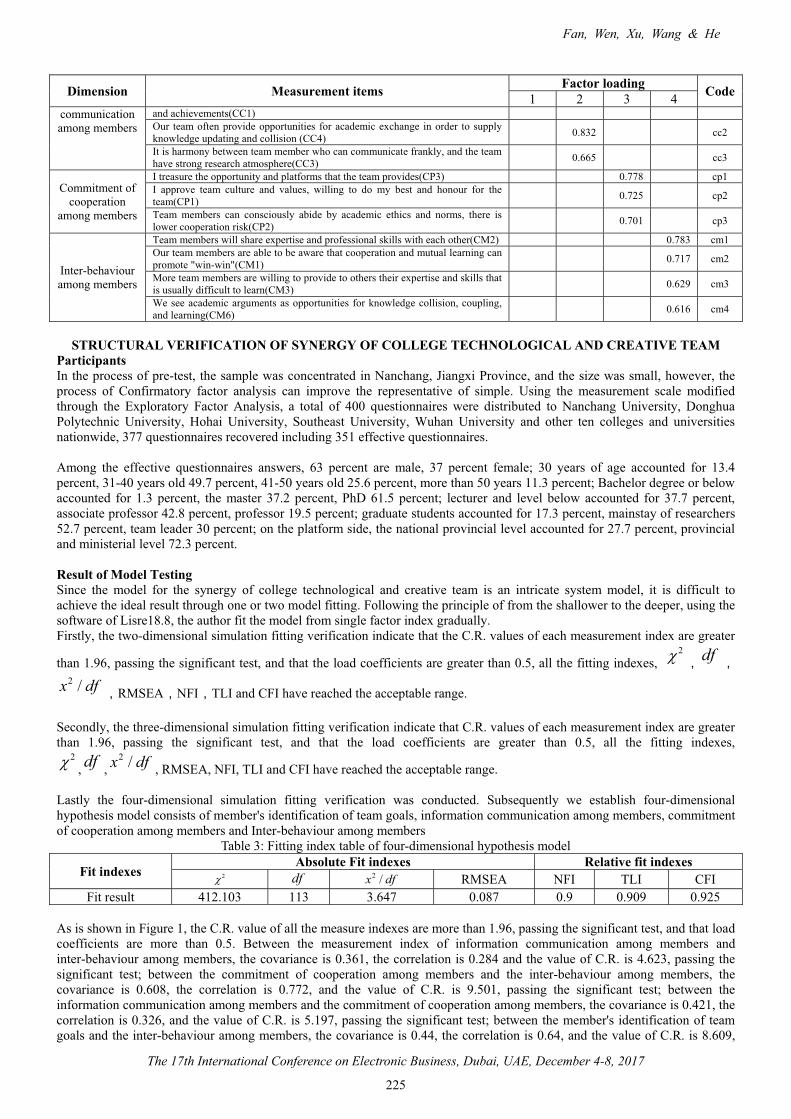
Fan, Wen, Xu, Wang & He
The 17th International Conference on Electronic Business, Dubai, UAE, December 4-8, 2017
225
Dimension Measurement items Factor loading Code1 2 3 4communication among members
and achievements(CC1)Our team often provide opportunities for academic exchange in order to supply knowledge updating and collision (CC4) 0.832 cc2
It is harmony between team member who can communicate frankly, and the team have strong research atmosphere(CC3) 0.665 cc3
Commitment of cooperation
among members
I treasure the opportunity and platforms that the team provides(CP3) 0.778 cp1I approve team culture and values, willing to do my best and honour for the team(CP1) 0.725 cp2
Team members can consciously abide by academic ethics and norms, there is lower cooperation risk(CP2) 0.701 cp3
Inter-behaviour among members
Team members will share expertise and professional skills with each other(CM2) 0.783 cm1Our team members are able to be aware that cooperation and mutual learning can promote "win-win"(CM1) 0.717 cm2
More team members are willing to provide to others their expertise and skills that is usually difficult to learn(CM3) 0.629 cm3
We see academic arguments as opportunities for knowledge collision, coupling, and learning(CM6) 0.616 cm4
STRUCTURAL VERIFICATION OF SYNERGY OF COLLEGE TECHNOLOGICAL AND CREATIVE TEAMParticipantsIn the process of pre-test, the sample was concentrated in Nanchang, Jiangxi Province, and the size was small, however, the process of Confirmatory factor analysis can improve the representative of simple. Using the measurement scale modified through the Exploratory Factor Analysis, a total of 400 questionnaires were distributed to Nanchang University, Donghua Polytechnic University, Hohai University, Southeast University, Wuhan University and other ten colleges and universities nationwide, 377 questionnaires recovered including 351 effective questionnaires.
Among the effective questionnaires answers, 63 percent are male, 37 percent female; 30 years of age accounted for 13.4 percent, 31-40 years old 49.7 percent, 41-50 years old 25.6 percent, more than 50 years 11.3 percent; Bachelor degree or below accounted for 1.3 percent, the master 37.2 percent, PhD 61.5 percent; lecturer and level below accounted for 37.7 percent, associate professor 42.8 percent, professor 19.5 percent; graduate students accounted for 17.3 percent, mainstay of researchers 52.7 percent, team leader 30 percent; on the platform side, the national provincial level accounted for 27.7 percent, provincial and ministerial level 72.3 percent.
Result of Model TestingSince the model for the synergy of college technological and creative team is an intricate system model, it is difficult to achieve the ideal result through one or two model fitting. Following the principle of from the shallower to the deeper, using the software of Lisre18.8, the author fit the model from single factor index gradually.Firstly, the two-dimensional simulation fitting verification indicate that the C.R. values of each measurement index are greater
than 1.96, passing the significant test, and that the load coefficients are greater than 0.5, all the fitting indexes, 2# df
2 /x df RMSEA NFI TLI and CFI have reached the acceptable range.
Secondly, the three-dimensional simulation fitting verification indicate that C.R. values of each measurement index are greater than 1.96, passing the significant test, and that the load coefficients are greater than 0.5, all the fitting indexes,
2# , df ,2 /x df , RMSEA, NFI, TLI and CFI have reached the acceptable range.
Lastly the four-dimensional simulation fitting verification was conducted. Subsequently we establish four-dimensional hypothesis model consists of member's identification of team goals, information communication among members, commitment of cooperation among members and Inter-behaviour among members
Table 3: Fitting index table of four-dimensional hypothesis model
Fit indexesAbsolute Fit indexes Relative fit indexes
2# df 2 /x df RMSEA NFI TLI CFIFit result 412.103 113 3.647 0.087 0.9 0.909 0.925
As is shown in Figure 1, the C.R. value of all the measure indexes are more than 1.96, passing the significant test, and that load coefficients are more than 0.5. Between the measurement index of information communication among members and inter-behaviour among members, the covariance is 0.361, the correlation is 0.284 and the value of C.R. is 4.623, passing the significant test; between the commitment of cooperation among members and the inter-behaviour among members, the covariance is 0.608, the correlation is 0.772, and the value of C.R. is 9.501, passing the significant test; between the information communication among members and the commitment of cooperation among members, the covariance is 0.421, the correlation is 0.326, and the value of C.R. is 5.197, passing the significant test; between the member's identification of team goals and the inter-behaviour among members, the covariance is 0.44, the correlation is 0.64, and the value of C.R. is 8.609,
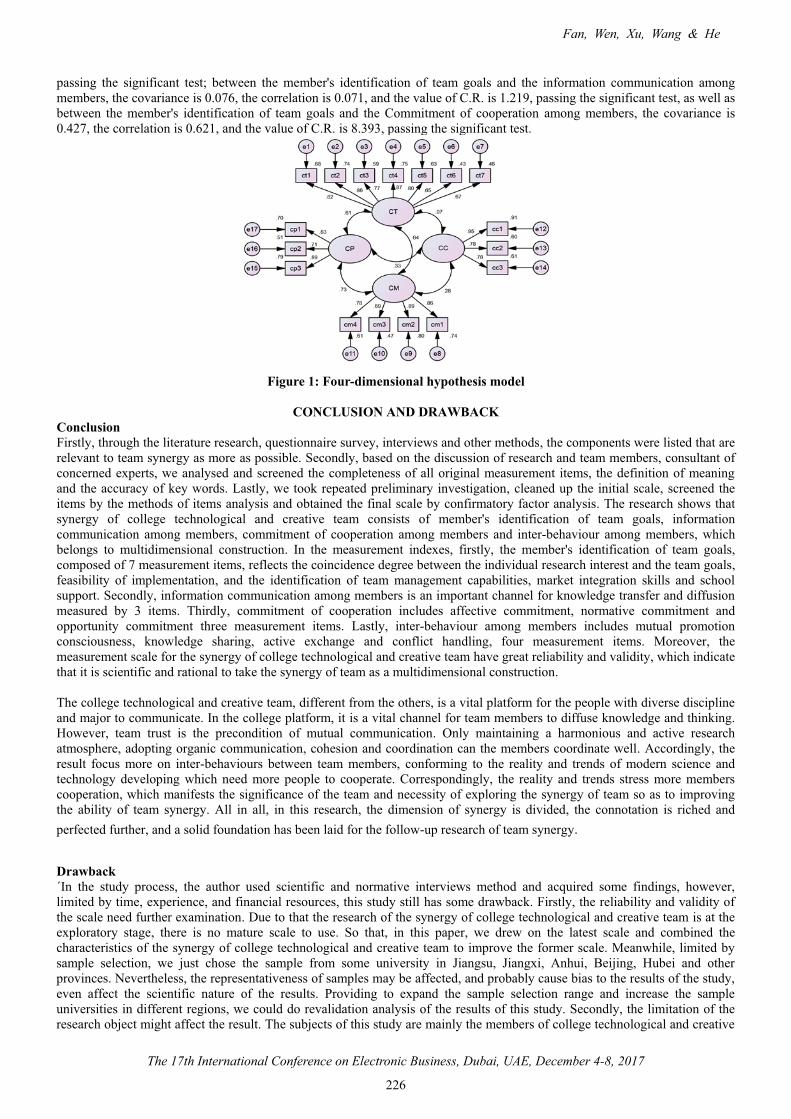
Fan, Wen, Xu, Wang & He
The 17th International Conference on Electronic Business, Dubai, UAE, December 4-8, 2017
226
passing the significant test; between the member's identification of team goals and the information communication among members, the covariance is 0.076, the correlation is 0.071, and the value of C.R. is 1.219, passing the significant test, as well as between the member's identification of team goals and the Commitment of cooperation among members, the covariance is0.427, the correlation is 0.621, and the value of C.R. is 8.393, passing the significant test.
Figure 1: Four-dimensional hypothesis model
CONCLUSION AND DRAWBACKConclusionFirstly, through the literature research, questionnaire survey, interviews and other methods, the components were listed that are relevant to team synergy as more as possible. Secondly, based on the discussion of research and team members, consultant of concerned experts, we analysed and screened the completeness of all original measurement items, the definition of meaning and the accuracy of key words. Lastly, we took repeated preliminary investigation, cleaned up the initial scale, screened the items by the methods of items analysis and obtained the final scale by confirmatory factor analysis. The research shows that synergy of college technological and creative team consists of member's identification of team goals, information communication among members, commitment of cooperation among members and inter-behaviour among members, which belongs to multidimensional construction. In the measurement indexes, firstly, the member's identification of team goals,composed of 7 measurement items, reflects the coincidence degree between the individual research interest and the team goals, feasibility of implementation, and the identification of team management capabilities, market integration skills and school support. Secondly, information communication among members is an important channel for knowledge transfer and diffusionmeasured by 3 items. Thirdly, commitment of cooperation includes affective commitment, normative commitment and opportunity commitment three measurement items. Lastly, inter-behaviour among members includes mutual promotion consciousness, knowledge sharing, active exchange and conflict handling, four measurement items. Moreover, the measurement scale for the synergy of college technological and creative team have great reliability and validity, which indicate that it is scientific and rational to take the synergy of team as a multidimensional construction.
The college technological and creative team, different from the others, is a vital platform for the people with diverse discipline and major to communicate. In the college platform, it is a vital channel for team members to diffuse knowledge and thinking. However, team trust is the precondition of mutual communication. Only maintaining a harmonious and active research atmosphere, adopting organic communication, cohesion and coordination can the members coordinate well. Accordingly, the result focus more on inter-behaviours between team members, conforming to the reality and trends of modern science and technology developing which need more people to cooperate. Correspondingly, the reality and trends stress more members cooperation, which manifests the significance of the team and necessity of exploring the synergy of team so as to improving the ability of team synergy. All in all, in this research, the dimension of synergy is divided, the connotation is riched and perfected further, and a solid foundation has been laid for the follow-up research of team synergy
DrawbackCIn the study process, the author used scientific and normative interviews method and acquired some findings, however, limited by time, experience, and financial resources, this study still has some drawback. Firstly, the reliability and validity of the scale need further examination. Due to that the research of the synergy of college technological and creative team is at the exploratory stage, there is no mature scale to use. So that, in this paper, we drew on the latest scale and combined the characteristics of the synergy of college technological and creative team to improve the former scale. Meanwhile, limited by sample selection, we just chose the sample from some university in Jiangsu, Jiangxi, Anhui, Beijing, Hubei and other provinces. Nevertheless, the representativeness of samples may be affected, and probably cause bias to the results of the study, even affect the scientific nature of the results. Providing to expand the sample selection range and increase the sample universities in different regions, we could do revalidation analysis of the results of this study. Secondly, the limitation of the research object might affect the result. The subjects of this study are mainly the members of college technological and creative
Fan, Wen, Xu, Wang & He
The 17th International Conference on Electronic Business, Dubai, UAE, December 4-8, 2017
227
team, no or less management department participated, especially the participation of the state departments, which may lead to bias in the result of the study. In the future, researchers can add the managers of school science and technology management departments and government related departments as the object of study, so as to make a comparison and repairing of the research conclusions furtherly.
REFERENCES[1] Annique, C., Alvaro, Kazuhiro. (2010). R&D collaborations and product innovation. Product Development&
Management Association, 27(5), 673-689.[2] Ansoff, H.I. (1957). Strategies for diversification. Harvard Business Review, 35(5), 113-124.[3] Buraj, David, L. (2007). How interfirm collaboration benefits IT innovation. Information &Management, 44(1), 53-62.[4] Chen, J., Yang, Y.J. (2012). Theoretical basis and content for collaborative innovation. Studies in Science of Science, 2,
161-164.[5] Li, Z.C., Liang, C.X. (2012). Exploration on the cooperative innovation mechanism——Base on the perspective of
university. China Higher Education Research, 7, 81-84.[6] Liang, C., Wang, Z.X. (2014). Research on science and technology innovation ability promotion of universities under the
perspective of collaborative innovation. Scientific Management Research, 32(1), 23-26.[7] Lu, P., Bu, L.H. (2010). The construction of synergy evaluation index system in college creative team. Journal of Harbin
Institute of Technology (Social Sciences Edition), 12(2), 95-100.[8] Sirower, M. (1997). The Synergy Trap. New York: The Free Press.[9] Wang, J.Y., Zhao, Q.C. (2013). A research on the measurement of synergy effects in SMEs cluster based on IRCS-ANP.
Journal of Shan Dong University (Social Sciences and Philosophy Edition), 3, 102-107.[10] Wang, X.H., Ma, J.M., Zeng, S.K., Zhao, X.M. (2012). Hybrid reliability analysis method based collaborative
optimization. Journal of Beijing University of Aeronautics and Astronautics, 38(4), 525-528,534.[11] Wang, Y.Q., Miao, J.J. (2007). Research on synergistic force model of project team. Science & Technology Progress and
Policy, 24(9), 46-48. [12] Wu, Q.L., Lu, L.J., Qian, G.Y. (2012). Synergy stage of project team. Science & Technology Progress and Policy, 4, 7-79. [13] Wu, Y., Su, J. (2012). Research on complexity of knowledge innovation system and its collaborative mechanism of action
in research team. Science of Science and Management of S & T, 33(1), 156-165.[14] Wu, Y.N., Yang, Y.S., Feng, T.T. (2013). Research on the large complex projects macro quality chain and collaborative
optimization. Soft Science, 27(7), 1-6.[15] Xie, X.M., Zuo, L.L., Liu, S.Y. (2014). Impact of synergic innovation models of SMEs on synergic innovation effect:
Double-moderating effect of synergic mechanism and synergic environment. Science of Science and Management of S. &T., 35(5), 72-81.
[16] Xu, X.G. (2010). Mechanism of organizational synergetic learning and empirical study in China. Systems Engineering-Theory Methodology Application, 6, 284-322.
[17] Yang, J.R., Yang, R., Ma, Y.K. (2013). Discussion of synergetic innovation theory and construction of regional development synergetic innovation mechanism. Theoretical Front in Higher Education, 1, 56-62.
[18] Yun, J., Liu, L., Gao, J. (2006). Value-creation and strategic improvement of business group: Perspective of synergy. Research on Financial and Economic Issues, 4, 79-86.
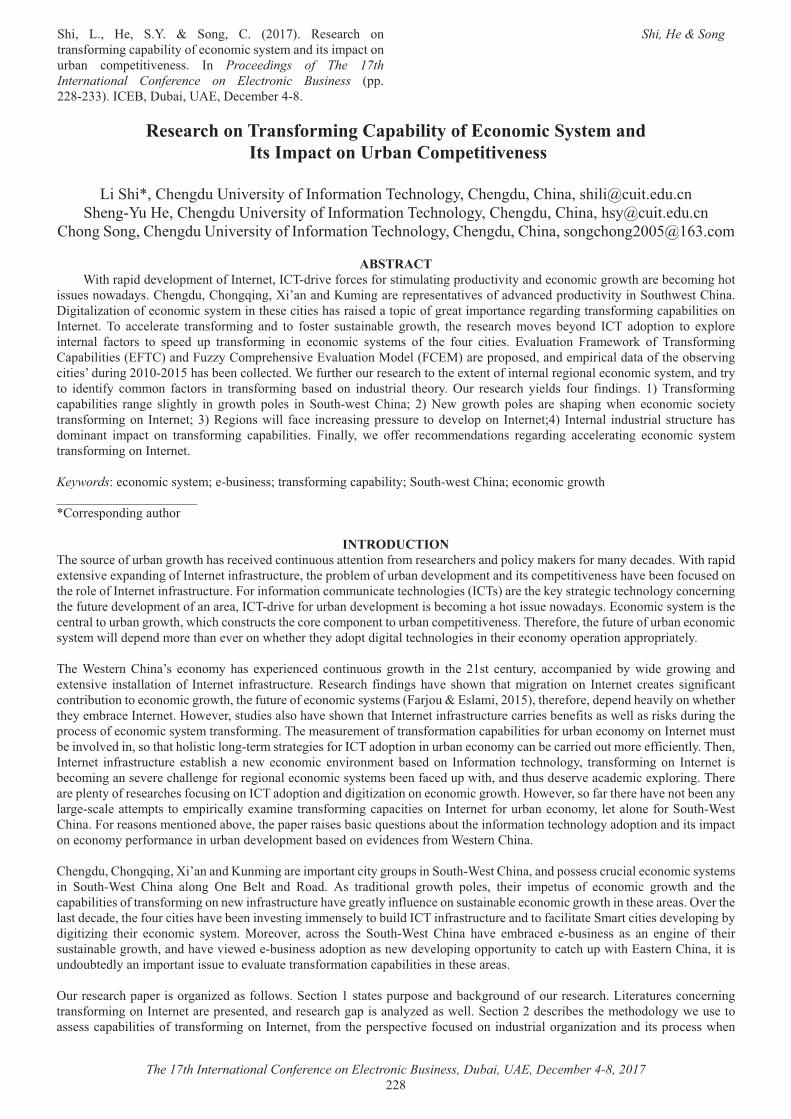
_%��� ��� � �� _�� �� _����� *� ������� � � ���%� ��������!���������'���������!� ������������ ����#�������'�������$����� ���' ����^ � ��� &�� Proceedings of The 17th International Conference on Electronic Business �''���[������&*/<��=$�����>�/��= � �� ��@�[�
Shi, He & Song
�
The 17th International Conference on Electronic Business, Dubai, UAE, December 4-8, 2017 ��[�
���������������������(�� �������$�����������������������(�����"������(�����>������
����_%�|��*% ��#$�>��^ �������!�&�!���������\ �%��������*% ��#$��*%������%���{�$�� #$���
_% ����$�� ��*% ��#$�>��^ �������!�&�!���������\ �%��������*% ��#$��*%�����%��{�$�� #$���*%����_�����*% ��#$�>��^ �������!�&�!���������\ �%��������*% ��#$��*%����������%�������{�~����
����������
���%���'�#�# ^ ��'� ����!�&�� �� ���&*\�#��^ �!��� ��!�������$�������'��#$���^������#� �����������"�%��� �� �������%������$ ����"�#����*% ��#$��*%����������������#��$������� �� '� � �����^ ���!��#^��� #�'��#$���^�������_�$�%" ���*%����=���������������!� ������������ ������% � ����� ��%������� #�����'����!��� �����'������ �� ���#���������!���������'������� �����&�� �� �� \�� ��� � ��� � �����!������� ��#� ��� !��� �� �$�������� � ���"�%�� �% � � � ���%� ��^ �� � ���#� &*\� �#�'����� ��� `'��� ���� ����� !������� ��� �' #� $'� �����!������� ��� �������� ���� ��� �!� �% � !�$�� ���� �� /^��$������ ���� "���� �!� \����!�������*�'������� ���/�\*����#��$����*��'� % ���^ �/^��$��������# ����*/����� �'��'�� #����#� �'�������#�����!��% ���� �^�������� ���#$���������������%���� ������ �� #�� �!$��% ���$��� � ���%�����% � `� ����!���� ������ ������� ������������ �����#�������� �# ���!�� ������� !������� ��� �����!������� ��� #� ��� ��#$������� �% ���� �$�� � � ���%� �� �#�� !�$�� !��#����� ��� \����!���������'������� �� ���� � ����%���� ��� ���"�%� '�� �� ��� _�$�%�" ��� *%����� ��� � "� ���"�%� '�� �� �� � �%�'���� "% �� �������� ���� ��������!���������� &�� �� ������� ������"���� !�� � ���� ������'� ��$� � ���# ^ ��'����&�� �� ��@�� &�� ����� ��#$������� ���$��$� �%���#�������� ��'���� ��� �����!������� ��'������� �� ��������� " � �!! �� � ���� �#������� � ���#���� ��� � ������� �������� ���� �������!����������&�� �� ��
�Keywords�� ������������ ��� ��$��� ���������!���������'���������_�$�%�" ���*%����� �����������"�%�����������������������|*��� �'��#�����$�%����
�����!"������\% ���$�� ��!�$��������"�%�%���� � �^ #�������$�$����� ������!����� � ���% �����#�'��������� ���!��������# ��# �����%���'�#� `� ���^ � `'��#�����!�&�� �� ����!�����$��$� ���% �'���� ���!�$�����# ^ ��'� �����#��������' ����^ � ���%�^ �� ��!��$� #�����% ���� ��!�&�� �� ����!�����$��$� �������!�������������$����� �� �%������ ���&*\����� ��% �� ������� ����� �%����������� �������% �!$�$� �# ^ ��'� ����!������ ���&*\�#��^ �!���$�����# ^ ��'� ������� ���������%������$ ���"�#����/������������ ������% �� ���������$��������"�%��"%��%�������$�����% ���� ����'�� ������$��������' ����^ � ���\% � !�� ���% �!$�$� ��!�$����� ������������ ��"����# ' �#���� ��%��� ^ �����"% �% ���% ���#�'��#�������� �%������ ������% ��� ��������' ��������''��'���� ����\% � � �� ��� *%������ ������� %��� `' �� �� #� ������$�$�� ���"�%� ��� �% � ����� � ��$���� �����'��� #� ��� "�# � ���"���� ��#� `� ���^ � ��������������!� &�� �� �� ��!�����$��$� �� � ���%� !��#�����%�^ � �%�"�� �%���������������� &�� �� �� �� �� �� �����!�������������$�������� �����������"�%���% �!$�$� ��!� ������������ �������]�$���/���������������% � !�� ��# ' �#�% �^�������"% �% ���% �� ����� �&�� �� ����" ^ �����$#� �������%�^ ��%�"���%���&�� �� ����!�����$��$� ������ ��� � !�������" ������������#$������% �'��� ����!� ������������ �������!�������\% �� ��$� � ����!������!�����������'������� ��!���$����� ����������&�� �� ���$���� ���^��^ #���������%���%�������������� �������� �� ��!���&*\��#�'��������$����� ������������ ������ #��$����� � !!��� �����\% ���&�� �� �� ��!�����$��$� � �������%� ��� "� �������� �^����� ������ #���� &�!��������� � �%�������� �����!���������� &�� �� �� ���� ����������� ^ � ��%��� �� �!���� ������� ������������ ���� ��!�� #�$'�"��%����#��%$��# � �^ ����# ���� `'�������\% � ��� �'� �����!�� � ���% ��!��$��������&*\��#�'�������#�#��������������� �����������"�%���" ^ ������!����% � �%�^ ������ ���������� ����� ���� �'������ �'��������� `���� ������!���������'����� �����&�� �� ��!���$����� ��������� ������ �!���_�$�%�� ���*%��������� ������� ����� #����^ ���% �'�' ������ ���������$ ����������$���% ���!���������� �%��������#�'�������#�������'������� �������' �!������ ����$�����# ^ ��'� ������ #���� ^�# �� ��!����� �� ���*%�����*% ��#$��*%����������������#��$�������� ���'���������������$'�����_�$�%�� ���*%�������#�'��� �����$����� ������������ ������ _�$�%�� ��� *%���� ������ �� � < ��� ��#� ���#� ��� ���#�������� ���"�%� '�� ��� �% ��� ��' �$�� �!� �������� ���"�%� ��#� �% ���'������� ���!������!����������� "���!�����$��$� �%�^ ��� �������!�$ �� �����$�������� � �����������"�%�����% � ��� ����^ ���% ������# ��# ���% �!�$������ ��%�^ �� ����^ ��������� �� �������$��#�&*\���!�����$��$� ���#����!�������� �_��������� ��# ^ ��'�������#���������� �% ��� �������� ���� �� ��� �^ ��� ������� �% � _�$�%�� ��� *%���� %�^ � ����� #� ��$��� ��� ��� ��� ���� � �!� �% ����$�������� ����"�%����#�%�^ �^� " #� ��$��� ����#�'��������� "�# ^ ��'�����''���$������������%�$'�"��%�/��� ���*%�����������$�#�$�� #��������'����������$ ���� ^��$�� ������!�����������'������� ������% � ��� �����$��� � ���%�'�' ������������ #����!����"��_ ������������ ��'$�'�� ���#��������$�#��!��$��� � ���%���� ���$� ������ �����������!����������&�� �� ���� �'� � �� #����#�� � ���%���'���������� #����" ���_ ��������# ����� ���% �� �%�#������" �$� ������� �����'������� ���!������!����������&�� �� ���!�����% �' ��' ���^ �!��$� #������#$����������������������#�����'��� ���"% ��

Shi, He & Song
The 17th International Conference on Electronic Business, Dubai, UAE, December 4-8, 2017 ����
�������� "��%� &�� �� �� ��!�����$��$� � &�� �%��� � ������� " � '� � ��� �$�� � � ���%� !��� "���� ��#� �% � �$���� *��'� % ���^ �/^��$��������# ����*/���� ������# �������� ��$��� �%�#���!�#����'� '��� ����������%���� ������&��� ���������" �!��$����� ^��$��������'������� ���!������!����������&�� �� ����� #����!�$��^��������"�%�'�� �����_�$�%�� ���*%����*��'���� ���#��������!��������!���������'�������� ��%�"������%���� ������&��� ������@��" �#��"�����% ���'��!������!���������'����� ���������% � ����� �����#�!$��% ���$��� � ���%�����# ���!����� ������ �������!��% � � ������������ ��&���% ������� �������� ��������" ��$������ ��$��� � ���%�!��#�������#��!! ����'����������!���'����������������!$�!���������� �������# ^ ��'���] ���^ ��_�$#����������������#�!$�$� �� � ���%���'������ �������##� �� #�����%���� �������
�$�$���%�#$�%�!�&�<)�$> �����*������^��\���##� ����% �'���� ���!�&�� �� �������!���������'������� ������ ������������ ������������ ������% �!�$������ ���" � �������%���� ^��$���������� ����� #�/^��$���������� "����!���\����!�������*�'������� ���/�\*����� #������#$������� ���������% ����\%��� !��� "���� ����$# �� !�$�� ��� ���� ��� ��� �$����� ���� ��� ��#� ��� ��#�^�#$��� ��#�������� \% � �!�� � ����� #� ^��$������!��� "����"����� ��������� #������������'���� ���#������������#���� ��% ������!���������'������� ���!���� �^ #� ������������ ��<�� #������#$��������% �����" � `� ��������� �����$��$� ��!�� ������� ������������ �����#����'�� ��% �� � ���%�!��� "�������!�$��'������ ��!�����������'������� ���'��#$�������!!��#�������������$�'�������'����� ����#�����^��������'����� ���$��� � ���%�!��� "��������%�"��� ��"����&�!���������*�'������� ��������������&�!�����������!�����$��$� �������������������!�` #���� �' � ����������� ������������������������ �'%�� �' � ����������� �������������������&�� �� ��' � ����������� �������������&�!���������� �^�� ���������������������^ ��� ��$�'$���!���!���������� �^�� ���������������������^ ��� ����"�%���� ��!���!���������� �^�� �<����#$�������!!��#��������������������_��� ��!�'��#$��������������������������������=������������������������������#�� ��������# `�������������������������������� ���# `�������������/!!��� �����!�'��#$�������������������������������'��#$���^������������$��$� �� ������������������������������'��#$���^���������#$������ �����������������������������'��#$���^�������� �^�� �� �����������������/!!��� �����!���^ ��� ���������������������� !!��� �����!���^ ��� �����������$��$� �� ����������������������� !!��� �����!���^ ��� ��������#$������ ����������������������� !!��� �����!���^ ��� ������� �^�� �� �����*�*���$�'�������'����� ��������������_��� ��!�����$�'�����������������������'��'��������!�������^��$� ��!�� ��������������������������"�%���� ��!�������^��$� ��!�� ������������������������=��' ��' ������������������*���$�'�����'�� ����������������������������#��'����� ������ ��!�$������ ��# �������������������������"�%���� ��!�#��'����� ������ ��!�$������ ��# ����������������������#��'����� ������ ��!��$����� ��# ��������������������@����"�%���� ��!�#��'����� ������ ��!��$����� ��# �����������������*���$�'��������$��$� �������������������/�� ���� !!��� ����!��$����� ��# ����������������������/�� ���� !!��� ����!��$����� ��# ����=�&���^��������'����� ���������#����&�^ ��� ������� � ���%����������������#�����'$����� �������!���=���������������#���# �������!���=�' ����� ���������#�������������������������������#����#$������ �������� ���������������#����$��������!����� � ���$# ���' �������%�$���#���������������#����$�������!����%���#���� �� � #$�������

Shi, He & Song
The 17th International Conference on Electronic Business, Dubai, UAE, December 4-8, 2017 ����
�������#�����' �� ����!�� ������� ����������������������#���# �� ��!�!�� ������'�����# ' �# ������������������#���# �� ��!�!�� �������# �# ' �# ����
&���% ����^ ��������% ���'%�� ����#��$�� ����#���� ��% �'���������"%��%��% �^������ �� ���������� `��'� ����#����������� ����������% ������ �����\% �" ��%���!� ��%� ��#������� ��� �%��� !��� "���� ���# ��# #������#���� ���� �"��� #�� �#�� ��� &�# `� ���&��'��� � #�������#�/�����������$����������\%������#�!! � ���!�����$��'� ^��$��� � ���%��_%�� �������������"%��%�����$��� #���#���������" ��%����%��$�%����������%� ����%��'��� ���������'��� � #����_��������[~��������&���%���� � ���%����# ����������$'����������� #�"��%�[� `' ����!������^ ��� ����� � ���%�������$� �����#� �� �'��� ��= �'%��� �%�#�����''�� #�����# ���!��� ����^ �" ��%�������$��� #��%��$�%�������� ��%� `' ���� ��%��!��� ��%���#�����������% �!��� "�����������%� ����� ����!����# �������� �$�����!��% � `' ����*��'�������% �� �$�����!��$����#�������" ��%���"��%��%�� ��!���&��" �!��#��%�������$��������$���� ���� �^ �����������\�����'�� ��$��� �$����"��%���% ��� �$����!����!�� ������%�������������� �%����������� ^ ���" ��#�'������%� �����^ ��� �� ���!����"�������#�/�����������$���$> �����#�������\��!$��% ���$�� � � ���%��" � �������%� ^��$��������# ������ #��$����*��'� % ���^ �/^��$��������# �� ��*/����*/����� �������% #���� #����!$�����% �����"%��%�������'�� #��!��"��'��� ����� ��������`���#�� ����^ �� �� ��%�'����# �����$���������# ��\�� ^��$�� ������!���������'����� ����� �'� ��� ��������������� ��������`����#�^�# #�����������~����� ����#���������� #�^��$ �!����~����������#�����������������\% ����� ��������`�������� #���� �$�����������#��% �" ��%���^ ���������%�"����� �$��������\% �� ����^ �� �� ��%�'����# ��!������!�������*�'������� �����&�� �� ��� ������������� ��������`��������$��� #�����% �!����"���� �$���������
�
��������������������������������������������� �^�^�^�^^��^� ~�@����� ������������������������������������������������������������������������
������������������������������������� �����������������������������������������������������������������������������
� �m
nmnn
m
m
n sss
rrr
rrrrrr
wwwRW ������_ ��
��
�����
�����
��� $�
����
�
�
����
�
�
$$$$$
$$
�$���
�����������������������������������% � ��W ���" ��%��^ ������!� ^��$������!�������� ��� R ����% �!$����� ������������`�� ijr ���� �� ��%�'�# �� ��!��% � thi !���
thj ���$��� � � ������!$����� ���� mS ���� �� ��%�'�# �� ��!���� �^ #� ������������ ��������� ���� �� � �����!���� �� ��%�'����# �# �� ��� ������' ���#���!$����������$� #������#��������%����� ���������!���#������������$��� � ���%�!��� "��������� ������� ������' ���#���!$���������#�# �� ������� ������' ���#���!$��������� �����$� #������������ �� � ���%�#����\% �!��� �����$� #�!���#�����% �%��% ���% �� �� �����#��% ����� ������#�'� #�!���#�����% �� ����% �� �� ��/�$������@�������� ������� ������' ���#���!$���������#� �$������������% �# �� �������� �
%%&
%%'
(
��
�
�
�
��abaxxr
bxbxa
ax
)!!
�
���������������������������������������������������������������������������
%%&
%%'
(
��
�
�
�
��abxbxr
bxbxa
ax
)!!
�
�������������������������������������������������������������������������
�
���������!��� � ���� ��� �% � � � ���%� #���� !���� *%���� _����������� � �������� *%���� ������ _����������� � �������� ��#� /#$������� _������������ ����������*%������" ^ ������ �#������������ ������� #�#�� �����!����� ���������$�%��������������#�� ��������# `��������������� ���# `�� �� ��$� ��% ��"����# `�!����" #��$��!��� ��� � ���%��_%������~���$��% ���� ��� !�� ������!���������'����� ���!�
Shi, He & Song
The 17th International Conference on Electronic Business, Dubai, UAE, December 4-8, 2017 ����
� ������� ������������ ������� ������� #��#����!������ �������$���� ��������� #����� '�#�� ������%���� ��$��=�� ����������������������� �%�#���� �$� #�����#]$���!��� !! ����"%��%����� �!����^���������� ��$� � ���$������
�$�"&��������#���� ��� �$������� ���� #� ���^ � ��#� #���� ���� �� #� !���� � �������� " � ����$��� � ��!��������� ��'������� ��� '��#$�������!!��#��������� ����$�'����� ��'����� �� ��#� ����^������ ��'����� �� �$�� � � ���%� � �$���� � ^ ��� �%��� ���#������ ���"�%� '�� �� ���_�$�%" ��� *%���� ������ '�����^ � ��� �����!������� ��� &�� �� ��� ���%�$�%� �% �� �� � ���� � %��#� /��� ��� *%���� � �$���� !���� !�$��#�� ������� ���� #� ���/�\*� `'�� � �%������ �^ #�$����� ������������ ����� �#�!! � ��� ��� �% ��� ��� ���%�"% �� �����!�������*% ��#$���#�������� � `� �� ��� ��� �% ��� ����^��������'����� ��� ��#��$����� ��� '����� ��� ��� ���� ��#$������� ���$��$� ���� !���*%��������� ����% �^�� ��#$������������$� ���$�%� !��� �����=�����"�%���$�� �����������% �^���$�# �� ��� ���� ��#$������� ���$��$� �������������&�!�����������'������� ���� ����'�� #��!���!�����������!�����$��$� ���#���!���������� �^�� ��$��� �$������#���� ��%������������%����� �����'�������" �� ������"�%�'�� ������% �����!�����������'������� ���!� ��̂ ������^ ��� ������&�� �� ��!������������� �=�!! � ���� ^ ����!���!���������� �^�� �������� �'� ��!����%��������!���'��#$�������!!��#����������#�����$�'�������'����� ����% ���� ����%���# ���!��% ����� �����#��!� ��^� " #������#��������!���'���' ��$���!�� ����������� ���\% �� �$����!����% � ��"��#�� �������� ^ ����%�������% ����#���������"�%�'�� ������% � ��� �����% ���� ������� �������� ���� ��� �� � ������ '�����^ � $�# �� ¢&�� �� �¹�� # ^ ��'���� �^����� ��� ��� ��� # ���� #� ��� ����� � � ���% ���'���' ��$������ �� �^����� ���%������ ���' �$����� ����� �� "�� �%���������&���^���������� ���%����� ��������!�#������� �������/������������ ��"��%�%��% ���' ����#�����^������� ^ ��"������� ��#�'���� ���������!������������&�� �� ����!�����$��$� �\�����^��$ ��!�����^��������'������� ���������������'���� ���# `���# �$'��!��%� �'������ ��^ ��� ��� ��� � � ���%� �� ������ ������ �' �� ��� �!� � ������� ������� &���^������ � �$���� ����� �%�"� �� �� ��� ��'� ��� �% � ����#���������"�%�'�� �� ���_�$�%" ���*%����� �� ��%�'�# �� ��!� ����^��������'������ �������� ����@�[���� �������� ��� �% �%��% ������� ���^��$ �¢~���"%�� ��%�������$������������~�"��%����� ���^��$ �¢������% �� ���'� % ���^ � �����# ������� �!� �% � � !�$�� #�� ������� ��� /�\*�� " � # #$� � �% � ^��$������ � �$���� �!� �����!���������'������� ���!��% � �!�$��� ������� ������������ ���\% �� �$������ ����� #����\��� �����
\��� ����/����������� �$�����!�\����!�������*�'������� �������� �^ #�/��������_��� ���*��� �� � �� ��%�'�# �� � \�����^��$ �
*% ��#$� ������ ������ ������ ��@��� ��~��� ������ @@��@�*%�������� ������ ��~�~� ��[��� ����~� ��~��� ������ ������
�©��� ���@�� ������ ��@��� ��~��� ��@��� ����[� @������$������ ��[�[� ��[�~� ������ ����[� ��[��� ��@@~� �~����
��
����������� �� �����\��� ���������!���������'������� ���!��% �!�$������ ���� ����� �¥�$������^ ����$�%�\% �%��% ������*% ��#$��"��%������!���������'������� ��^��$ �� ����@@��@�� ��"%�� ���% ���" ����� ��������% � ����� �����*%��������"��%��% �^��$ �������*% ��#$����$�����#����' �!������ ����$�# �����������% �!�����%��������������'����_�$�%" ���*%������������$���# ` �����������������% ���#�'��� �"��%���� ���# `���$�%����'��#$�������!!��#����������#�����$�'�������'����� ���#��''�������%����� %��#�*% ��#$��"%�� �� '�����% �!����������!�����������'������� ����#�����^��������'����� ��*%������������% ���" ����� �����% ���� �^ #� ������������ ����'������#$ ��������% �^��'��#$���������� ����#������$� �'��#$������� �^�� ��
����&"������\%��� � � ���%� ���!����� �% � ��'������ � �!� &*\� �#�'����� ��� $����� �������� ���"�%�� ��#� `'��� �� !$��% �� ���������� �!������!���������'������� �������#$�������� ^ ��/��$��� �������% �� �������!�&*\��#�'��������#�����#�!!$����� `� ���^ ��������������������� ����������� ����������������%�# ^ ��'�����''���$���� ����#�� ^ � ��%��� �� ������% ���� ���� �_' ��!���������$��!��#�������#���� ��%���$����� ������������ ����� �����^ ������#������������!��������"��%������!���������'����� ��# ^ ��'������������^��$���� �#��!�% � ��� � �$��\% �'% ��� ������!�����%��� �������������� � !���!������!���������� �%��������#�'�����]$���������%���#�� �!������% ��!��� ���#^��� #�� �%������ ����� ��������%����������%�$�%�¢#���������'����������"�����$�������� "����"�%�� �� ������$����� �������# ^ ��'� ����� �������!���������'�#���� `'�������%����#^��� #�������� ������������ ���� ���'�������!��� $����� �������� ���� �� �����!������� _ ���#���� �$�� � � ���%� � ^ ���� �% � '% ��� ���� �%��� � �^�� �� # ��^���� !���� &*\�#�!!$����� �� � � ������� ��� � ��$����� �%��� ������ ��!�����$��$� � !��� ��� � ������� #������� �����!������� *��'�� #� "��%� /��� ���*%�������� �^ #�$����� ������ �����_�$�%" ���*%������ ���! ��������� �^�� ������ ��������!���������� �%������ ��\%$����������� �!�� #�$'�"��%�� ^ � ��%��� �� �"% �� ���������&�� �� ����!�����$��$� �!���������!�� �^�� ��% �'����!��������!�������\%��#�����$�� �'������� ��$#� �� ��#���� � �%��� ����^������ ������� �� �� � ���� ������� ��$�%� ��� !�������� � $����� ������� �����!������� ���_�$�%" ���*%�����������^������� ��$�� ���' ����� ����#� `' �#��$� ������=���� ��$�%���" ���%���/��� ���*%����&���^������
Shi, He & Song
The 17th International Conference on Electronic Business, Dubai, UAE, December 4-8, 2017 ����
��'������� ���� �# � �������� !������� !���$����� ������ ���#�'�� ���� "�'��#$��������� � ������#��� ���$����� ���# ^ ��'�� "� ����������������#� ����������# ��\%$���_�$�%" ���*%�����%�$�#�'������ ���� ����������$��$� �����^��������'������� ������% � ��� ����!��$����������'��^���������!���������'����� ����#� �%�������$��������' ����^ � ����%�$�%�����^�������
&�#�����������!�*"�"�$��$�$���%��$��� � ���%��������� #����� ^ ����"�����������*% ��#$��*%����������������#��$�������� ��������"�%�'�� �����_�$�%�� ���*%������$����% ��$����� ������������ ����� ���������$# #�!���^����$��� ���������� `��'� ���$�����������������$# #�����$��� � ���%�# ������ ��$� ��!�#������� �� ���" ^ ����$���������^�����$�����#����������������#���� ������ ���^ ��� ����������#����� �� ��&��!$�$� �� � ���%��" �"���� `� �#��$��� � ���%��������$# ���� �$����� ������������ ��_ ���#���$��!��� "����#� ����������$# ���% ��'�� ����������'�������!���������$�%����'�����������#�� �$�������!������������������������ ���$� ��%�^ ����$����� #��%����% ��$�� ����!���� ����������� ������ ^ �������&*\�# ' �#�����'��������% ��$�������!��% ��^ ������' ������� �^����� ����"%��%����'������# ��# #������� ������������� �����#���������#�� �$�������!��� "������� �^ ���������� !! ���^ �$� ��!�&*\���#������!����������&�� �� ���� �� � !���!����%��% ����������������"%��%��� ���'�$� #���� #$��������$������������ �^ #�$�������#��� ������������ #�����$��� � ���%�!��� "�����$��% ����$#� ���%�$�#���^ ������ ���� �# � ����������!������!����������&�� �� ����#�������'�������!�������$��������' ����^ � ���!����&*\������!�������
���9��;&$!<$#$���
\%��� "���� ��� �$''��� #� ��� ��������� _������ _�� �� � �$�#� �!� *%���� ������� ���@<������� � � �� � ��# �� #� ��� ��%����������� ����!�����$������ ��$ ���}������� �$���#�������$������������#��������% ����$�� ����������$�����������!���# ���������� ���������#$����������$��$� ������������" �� ^�� #��$��� � ���%�� �������%�����% ����������� `' ����!����������_���������<$� �$�!����% ���������$���^ ����� ������#��% �!� �#���$#��'������'�����!����% �����^��^ � ���
��$*$�$��$��
£�¤� ������� %��\������$����������������� � ����!��� "����!��� ���^ ��� ����= !�����������$������%��� �� ����''���$���� �����#��$�� ���European Journal of Scientific Research������������@��
£�¤� <��� ���_�=$�����_�������^���<��������The Global Information Technology Report 2016,�����#�/�����������$��£�¤� <��� �� =� ��� ���� ��� _� =�� �� _��% ��� =� /� ������� &�� �% � ��!��������� � �%������� � ^��$����� �^ �¨� International
Productivity Monitor�������������~�£@¤� <� ������%�"��� ��� �� �������$�� =� �� ����@�� = � ��������� �!� ���^ ��� ��� � �#�� ���� �� ��� ���$� � � ^� "� &��
Management of Engineering & Technology (PICMET), 2014 Portland International Conference on �''���@������&///��������"���}�'����}$���������
£�¤� ���]�$������#�/�������������~��_$�^ ������% ���!�$ �� ��!���#$�������� �#�� ������ ����� �� ���� '���� �Journal of Administrative Management, Education and Training��4����~�����
£~¤� ����#�^���������������������#$���������&*\�������$������� #����<_�������ISACA Journal��2������£�¤� }��� ������=������_����%����}�����������������% ��' #��������>_� �����������"�%�����% ���!����������� �Brookings
Papers on Economic Activity�������������������£[¤� ���� ���_�=����_��% ���=�/��������&�!���������� �%���������#�'��#$���^������% � ��� �" ���"���#�"% � ��� �" ������¨�
Economic Review (Atlanta, GA)��[���������@~�£�¤� ���^ �����\����������������� ���������� ���$� � � ^� "��!� ��!��������� � �%��������#�'�������# ��� ��� !���� � ^ ��The
Electronic Journal Information Systems Evaluation���@�������������£��¤����^ ����� \� ��#� =%�������� ������� ����� �#�'����� ��� � $����������� �!� <�<� ����� �� �� >�# �����#���� '��� ���� �������
/$��' �Journal of Global Information Management����������@�[��@���£��¤���� �"��# ������������ $������������= ���������$��� �����# �����#�������������� ������] �����\% ��������$������!�&_�
Journal of the Association for Information Systems���@���������£��¤����������������� �����_�������� �*��� �� ��#�'��������# ^ ��'������$���� �������# ����#������$� ���Information &
Management��@��~���[���[���£��¤�� �����������= �����������*�����������*����������������_���������������@��*$�� ����� �#�����_�����*������������^ ���
_�� ������� #�!�����Cities��38������~�£�@¤�_�����\������������"������� ���# ��������\% ����������%� ����%��'��� ���European Journal of Operational Research��
@[��������~�£��¤�_������\�����[~���`��������!�$�#�������!��% ����������%� ����%��'��� ���Management Science���������[@��[���£�~¤�_��� ��������#�� ������������[���%��#��!������#�'�� �'���$� � ������� ��¨�>��������������� �� ��������� �'���������
� ��������� '�$�����# ��IEEE Transactions on Engineering Management��������������£��¤�_� �����}�������������'����}��������� ��$����� �� �#�� ���!��������# ���'� � �����������%��'������������ ���$� �� ^� "�£�[¤�_%����� ����}��`�������}��������� � ���%����&�� �� �������!�����������'�������!�� ������� ������������ ��Science &
Technology Progress and Policy���@������������£��¤�_%���������~��&�#$�����������������!��������%�'����� �������� �"���� �������!����������<�� #����#�����#� ��������
����� � �'���������$#��&��Proceedings of the16th International Conference on Electronic Business �''�������[��&*/<��=$�����>�/��= � �� ��@�[���
£��¤�\����� ���$�����=����=� "��_�����@����� ��� ����!���� �� ����� #� ����� �� �� �#�� �������� ���� � �������$������ �� �'��� ���\�"��#�������#$�������� �� #�!��� "������#������� `���' ��!��������$� �� Information Technology Journa����������������~�

Shi, He & Song
The 17th International Conference on Electronic Business, Dubai, UAE, December 4-8, 2017 ����
£��¤�>��� #� �������� ����~�� /���^ ��� ��� �$�^ �� ���~� � ��� ^ #� !���� %��'�¡¡"����'�� $�'�����¡��� �¡&�� �� �¡�=��$� ���¡>������@��'#!��_ '� �� �������������
£��¤�� ����=��*� ������/��< ����������<$`���������� ����\���$�#���%��=��� �� ��� ���}�������������_'�����������@��<$��� �����# ���Business & Information Systems Engineering��~�����@�����
£��¤�����#�/�����������$���������\% ����������!���������� �%�������� '�������������"�%���#�]���������%�' ������ �� #�"��#�� ��� ^ #�!����%��'�¡¡"""�" !��$����¡#���¡�/���&\��� '��������'#!��_ '� �� ������������
£�@¤��%$�������� � ��������$��_��������/� ���������$��� ����#�'��������/$��' ���!����������������$�������� ��� ����!��% �!��������������#���%��������European Journal of Information Systems�����@��������~[�
�
Guan, C., Wei, J., Chan, M.L.C. & Chia, B.H.A. (2017).Senior citizens’ self-efficacy for ICT use: The influence of gender, social influence and social support. In Proceedings of The 17th International Conference on Electronic Business (pp. 234-240). ICEB, Dubai, UAE, December 4-8.
Guan, Wei, Chan & Chia
The 17th International Conference on Electronic Business, Dubai, UAE, December 4-8, 2017234
Senior Citizens’ Self-Efficacy for ICT Use: The Influence of Gender, Social Influence and Social Support
Chong Guan, Singapore University of Social Sciences, Singapore, [email protected]
Jie Wei, Singapore University of Social Sciences, Singapore, [email protected] M. L. Chan, Singapore University of Social Sciences, Singapore, [email protected]
Allan B. H. Chia*, Singapore University of Social Sciences, Singapore, [email protected]
ABSTRACTAs the world becomes more digitally connected and most countries have longer life expectancy and an ageing population, it is critical to understand the factors affecting ICT adoption among the senior citizens. Previous researchers examined how various factors influence ICT adoption among senior citizens, including age, degree of functional impairment, financial resources, education level etc. In addition to the demographic factors, psychological factors such as computer self-efficacy (CSE) is also crucial in understanding ICT adoption among seniors. Building upon the classic psychological theory of self-efficacy, we proposed that CSE is an important mediating factor between social influence, social support and usage. We further posit that gender moderates the effect on social support and CSE among senior citizens. Specifically, the effects on women are augmented. To test the developed hypotheses, we conducted a person-administered survey comprising 503 Singaporeans aged between 55 and 75 years of age. Collected data were analysed using partial least squares. The results confirmed the proposed hypotheses and demonstrated that gender, social influence, social support and CSE are crucial in understanding ICT usage amongst seniors.Specific insights on the use of ICT among senior citizens are revealed.
Keywords: ICT use, self-efficacy, senior citizens, social influence, social support._____________________*Corresponding author
INTRODUCTIONAs the world becomes more connected, more information and services are delivered digitally to people, tremendously improving the quality of individuals’ daily life and even increasing social welfare (Hansen, Lundberg, & Syltevik, 2018; Choi & Dinitto, 2013). However, a digital inequality problem emerges as the socio-economically less privileged group has limited access to the digital world due to their incapability to navigate with electronic device (Hsieh, Rai, & Keil, 2011). Some researchers also called this phenomenon as the digital divide (Al-Jaghoub & Westrup, 2009). As Warschauer (2003) pointed out about the digital divide, the ultimate goal for reducing the digital divide is not about access to the internet, but about the benefits from such new social practices, e.g. better communication with the family and friends. Specifically, in the domain of Information and Communication Technology (ICT) use, senior citizens are often identified as a lagged-behind social group that has failed to keep pace with the technological advancements (Friemel, 2016). As most countries in the world have longer life expectancy and an ageing population, it is critical to understand the factors affecting ICT adoption among the senior citizens. “Active aging” requires a senior citizen to participate in the society with social, physical, and mental well-being, which also implies the importance of ICT adoption in the digital era (Moulaert & Biggs, 2013).
The previous literature on ICT adoption focused on the Technology Acceptance Model (TAM) with the support of Theory of Reasoned Action (TRA), which has been tested by a large number of studies in the context of ICT adoption (Rauniar et al., 2014; Kim & Shin, 2015; Marangunic & Granic, 2015). Two important factors identified by TAM studies include perceived usefulness (PU) and perceived ease of use (PEOU), as well as individuals’ attitude and behavioral intention towards ICT adoption. However,research testing actual ICT use remains sparse, especially in the context of senior citizens’ ICT use. This research measures the actual ICT use by senior citizens (including both frequency and ICT device variety) rather than the behavioral intention.
Moreover, previous researchers examined how various factors influence ICT adoption among senior citizens, including age, degree of functional impairment, financial resources, education level etc. (Choi & Dinitto, 2013). In addition to the demographic factors, psychological factors such as computer self-efficacy (CSE) is also crucial in understanding ICT adoption. CSE originated from the classic psychological concept of self-efficacy (Bandura, 1986), and is defined as an individual judgment of one’s capability to use a computer. It is closely related to individuals’ decision to use computers and the perceived ease to effectively operate computer systems (Bao, Xiong, & Hu, 2013; Compeau & Higgins, 1995). Individuals with higher CSE have higher confidence in evaluatingtheir own ability to finish computer-based tasks. CSE has been found to be a significant variable to predict the behavioral intention
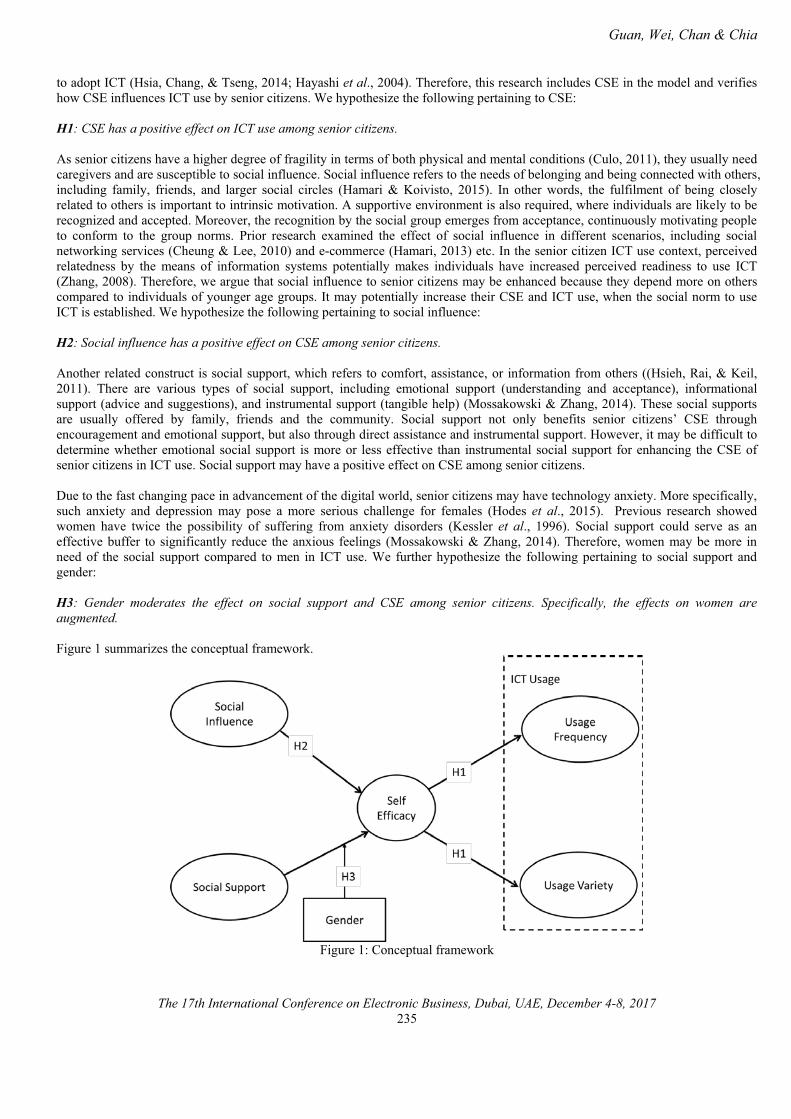
Guan, Wei, Chan & Chia
The 17th International Conference on Electronic Business, Dubai, UAE, December 4-8, 2017235
to adopt ICT (Hsia, Chang, & Tseng, 2014; Hayashi et al., 2004). Therefore, this research includes CSE in the model and verifies how CSE influences ICT use by senior citizens. We hypothesize the following pertaining to CSE:
H1: CSE has a positive effect on ICT use among senior citizens.
As senior citizens have a higher degree of fragility in terms of both physical and mental conditions (Culo, 2011), they usually need caregivers and are susceptible to social influence. Social influence refers to the needs of belonging and being connected with others, including family, friends, and larger social circles (Hamari & Koivisto, 2015). In other words, the fulfilment of being closely related to others is important to intrinsic motivation. A supportive environment is also required, where individuals are likely to be recognized and accepted. Moreover, the recognition by the social group emerges from acceptance, continuously motivating people to conform to the group norms. Prior research examined the effect of social influence in different scenarios, including social networking services (Cheung & Lee, 2010) and e-commerce (Hamari, 2013) etc. In the senior citizen ICT use context, perceived relatedness by the means of information systems potentially makes individuals have increased perceived readiness to use ICT(Zhang, 2008). Therefore, we argue that social influence to senior citizens may be enhanced because they depend more on others compared to individuals of younger age groups. It may potentially increase their CSE and ICT use, when the social norm to use ICT is established. We hypothesize the following pertaining to social influence:
H2: Social influence has a positive effect on CSE among senior citizens.
Another related construct is social support, which refers to comfort, assistance, or information from others ((Hsieh, Rai, & Keil, 2011). There are various types of social support, including emotional support (understanding and acceptance), informational support (advice and suggestions), and instrumental support (tangible help) (Mossakowski & Zhang, 2014). These social supportsare usually offered by family, friends and the community. Social support not only benefits senior citizens’ CSE through encouragement and emotional support, but also through direct assistance and instrumental support. However, it may be difficult todetermine whether emotional social support is more or less effective than instrumental social support for enhancing the CSE of senior citizens in ICT use. Social support may have a positive effect on CSE among senior citizens.
Due to the fast changing pace in advancement of the digital world, senior citizens may have technology anxiety. More specifically, such anxiety and depression may pose a more serious challenge for females (Hodes et al., 2015). Previous research showed women have twice the possibility of suffering from anxiety disorders (Kessler et al., 1996). Social support could serve as an effective buffer to significantly reduce the anxious feelings (Mossakowski & Zhang, 2014). Therefore, women may be more in need of the social support compared to men in ICT use. We further hypothesize the following pertaining to social support and gender:
H3: Gender moderates the effect on social support and CSE among senior citizens. Specifically, the effects on women are augmented.
Figure 1 summarizes the conceptual framework.
Figure 1: Conceptual framework
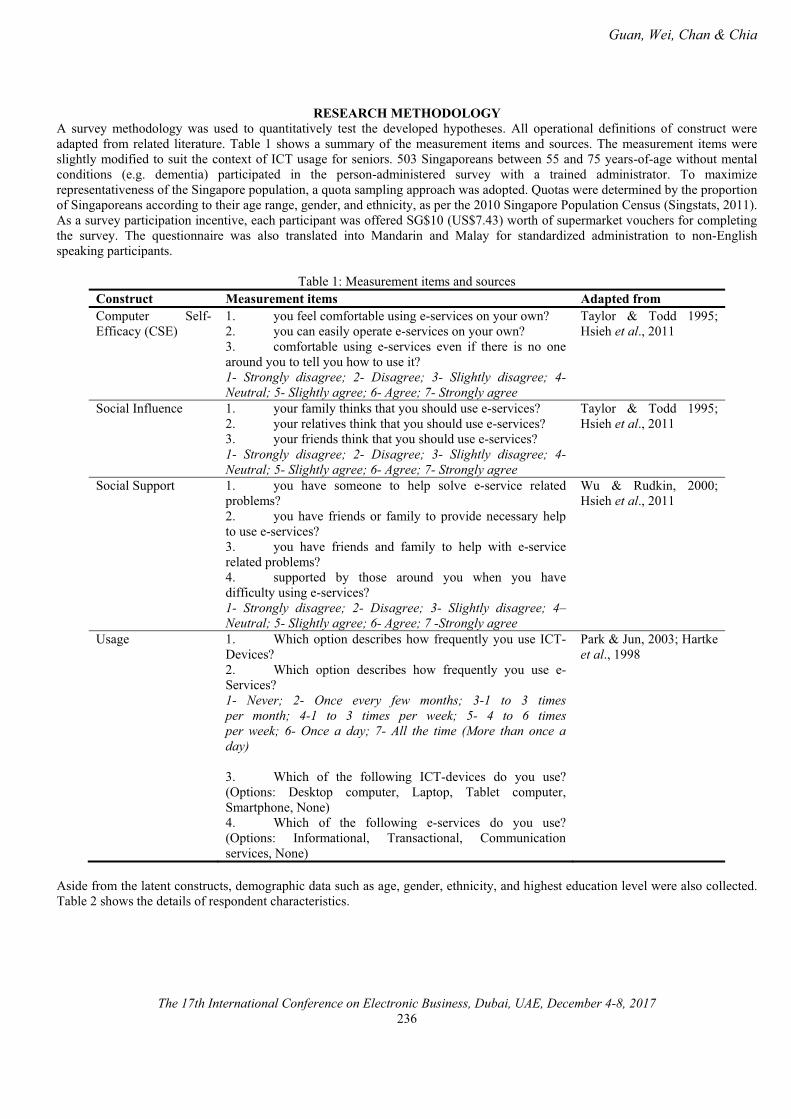
Guan, Wei, Chan & Chia
The 17th International Conference on Electronic Business, Dubai, UAE, December 4-8, 2017236
RESEARCH METHODOLOGYA survey methodology was used to quantitatively test the developed hypotheses. All operational definitions of construct were adapted from related literature. Table 1 shows a summary of the measurement items and sources. The measurement items were slightly modified to suit the context of ICT usage for seniors. 503 Singaporeans between 55 and 75 years-of-age without mental conditions (e.g. dementia) participated in the person-administered survey with a trained administrator. To maximize representativeness of the Singapore population, a quota sampling approach was adopted. Quotas were determined by the proportionof Singaporeans according to their age range, gender, and ethnicity, as per the 2010 Singapore Population Census (Singstats, 2011). As a survey participation incentive, each participant was offered SG$10 (US$7.43) worth of supermarket vouchers for completing the survey. The questionnaire was also translated into Mandarin and Malay for standardized administration to non-English speaking participants.
Table 1: Measurement items and sourcesConstruct Measurement items Adapted fromComputer Self-Efficacy (CSE)
1. you feel comfortable using e-services on your own?2. you can easily operate e-services on your own?3. comfortable using e-services even if there is no one around you to tell you how to use it?1- Strongly disagree; 2- Disagree; 3- Slightly disagree; 4-Neutral; 5- Slightly agree; 6- Agree; 7- Strongly agree
Taylor & Todd 1995; Hsieh et al., 2011
Social Influence 1. your family thinks that you should use e-services?2. your relatives think that you should use e-services?3. your friends think that you should use e-services?1- Strongly disagree; 2- Disagree; 3- Slightly disagree; 4-Neutral; 5- Slightly agree; 6- Agree; 7- Strongly agree
Taylor & Todd 1995; Hsieh et al., 2011
Social Support 1. you have someone to help solve e-service related problems?2. you have friends or family to provide necessary help to use e-services?3. you have friends and family to help with e-service related problems?4. supported by those around you when you have difficulty using e-services?1- Strongly disagree; 2- Disagree; 3- Slightly disagree; 4–Neutral; 5- Slightly agree; 6- Agree; 7 -Strongly agree
Wu & Rudkin, 2000;Hsieh et al., 2011
Usage 1. Which option describes how frequently you use ICT-Devices?2. Which option describes how frequently you use e-Services?1- Never; 2- Once every few months; 3-1 to 3 times per month; 4-1 to 3 times per week; 5- 4 to 6 timesper week; 6- Once a day; 7- All the time (More than once a day)
3. Which of the following ICT-devices do you use? (Options: Desktop computer, Laptop, Tablet computer, Smartphone, None)4. Which of the following e-services do you use? (Options: Informational, Transactional, Communication services, None)
Park & Jun, 2003; Hartke et al., 1998
Aside from the latent constructs, demographic data such as age, gender, ethnicity, and highest education level were also collected.Table 2 shows the details of respondent characteristics.
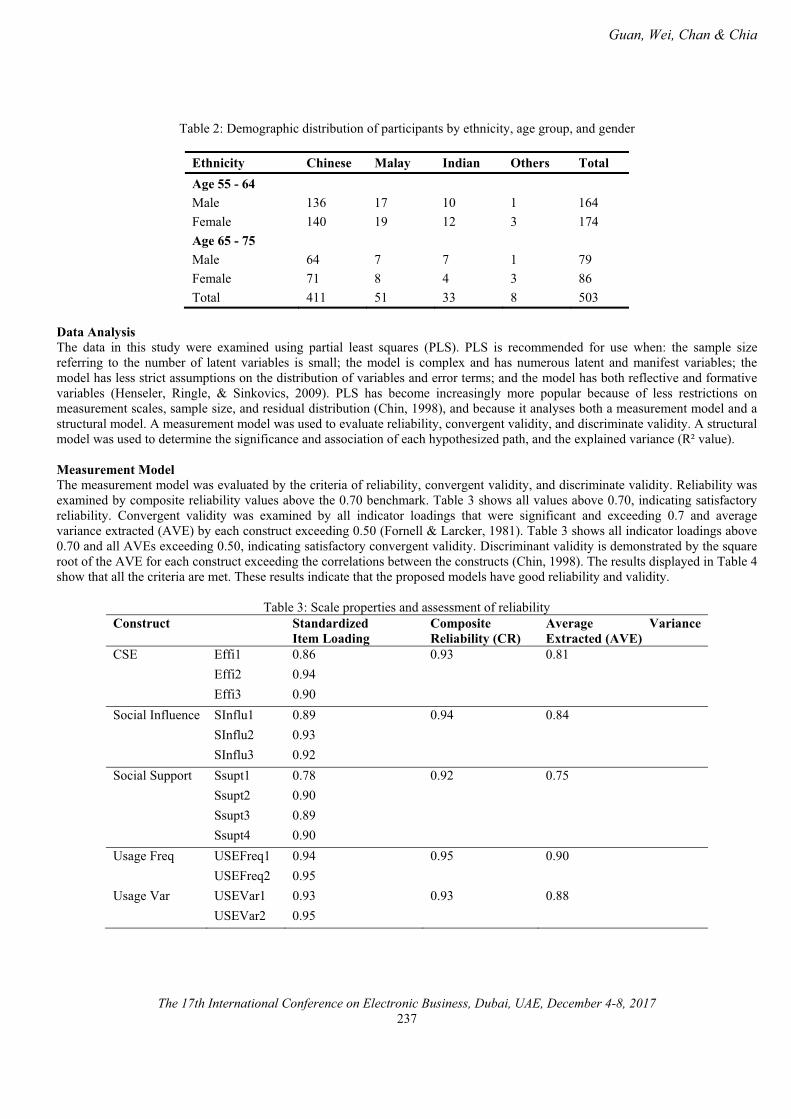
Guan, Wei, Chan & Chia
The 17th International Conference on Electronic Business, Dubai, UAE, December 4-8, 2017237
Table 2: Demographic distribution of participants by ethnicity, age group, and gender
Ethnicity Chinese Malay Indian Others TotalAge 55 - 64Male 136 17 10 1 164Female 140 19 12 3 174Age 65 - 75Male 64 7 7 1 79Female 71 8 4 3 86Total 411 51 33 8 503
Data AnalysisThe data in this study were examined using partial least squares (PLS). PLS is recommended for use when: the sample size referring to the number of latent variables is small; the model is complex and has numerous latent and manifest variables; the model has less strict assumptions on the distribution of variables and error terms; and the model has both reflective and formative variables (Henseler, Ringle, & Sinkovics, 2009). PLS has become increasingly more popular because of less restrictions on measurement scales, sample size, and residual distribution (Chin, 1998), and because it analyses both a measurement model and a structural model. A measurement model was used to evaluate reliability, convergent validity, and discriminate validity. A structural model was used to determine the significance and association of each hypothesized path, and the explained variance (R² value).
Measurement ModelThe measurement model was evaluated by the criteria of reliability, convergent validity, and discriminate validity. Reliability was examined by composite reliability values above the 0.70 benchmark. Table 3 shows all values above 0.70, indicating satisfactory reliability. Convergent validity was examined by all indicator loadings that were significant and exceeding 0.7 and average variance extracted (AVE) by each construct exceeding 0.50 (Fornell & Larcker, 1981). Table 3 shows all indicator loadings above 0.70 and all AVEs exceeding 0.50, indicating satisfactory convergent validity. Discriminant validity is demonstrated by the square root of the AVE for each construct exceeding the correlations between the constructs (Chin, 1998). The results displayed in Table 4show that all the criteria are met. These results indicate that the proposed models have good reliability and validity.
Table 3: Scale properties and assessment of reliabilityConstruct Standardized
Item LoadingComposite Reliability (CR)
Average Variance Extracted (AVE)
CSE Effi1 0.86 0.93 0.81Effi2 0.94Effi3 0.90
Social Influence SInflu1 0.89 0.94 0.84SInflu2 0.93SInflu3 0.92
Social Support Ssupt1 0.78 0.92 0.75Ssupt2 0.90Ssupt3 0.89Ssupt4 0.90
Usage Freq USEFreq1 0.94 0.95 0.90USEFreq2 0.95
Usage Var USEVar1 0.93 0.93 0.88USEVar2 0.95
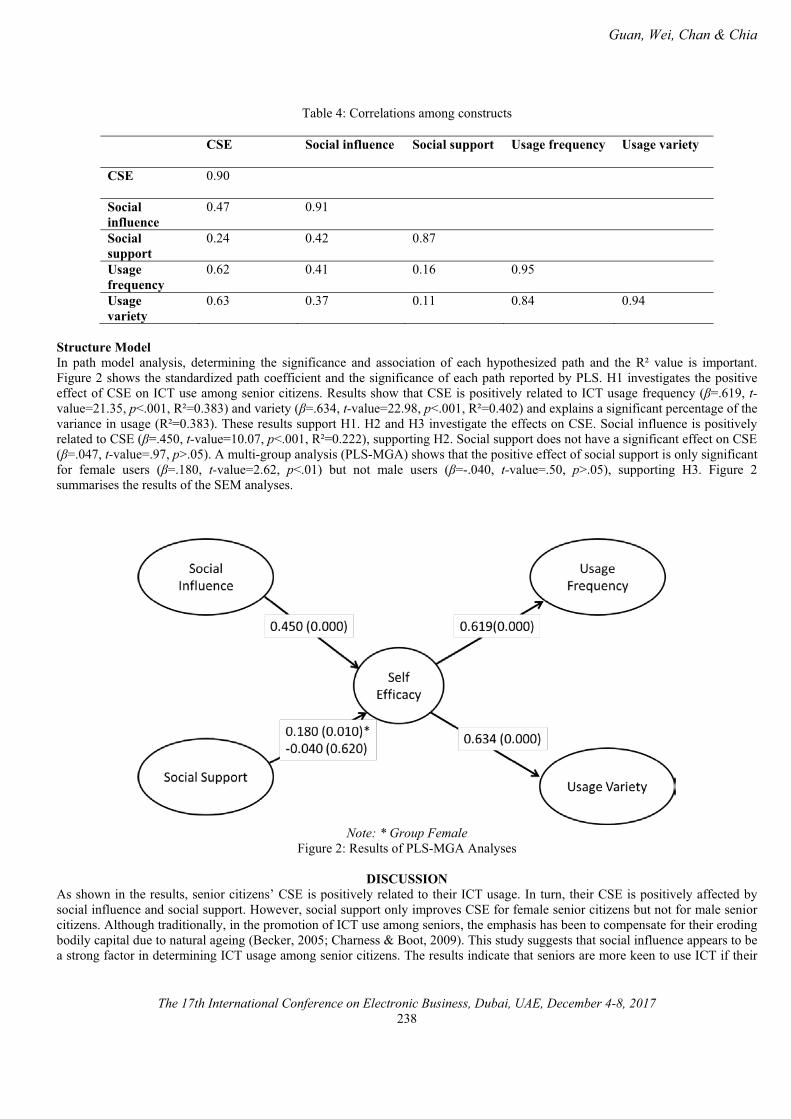
Guan, Wei, Chan & Chia
The 17th International Conference on Electronic Business, Dubai, UAE, December 4-8, 2017238
Table 4: Correlations among constructs
CSE Social influence Social support Usage frequency Usage variety
CSE 0.90
Social influence
0.47 0.91
Social support
0.24 0.42 0.87
Usage frequency
0.62 0.41 0.16 0.95
Usagevariety
0.63 0.37 0.11 0.84 0.94
Structure ModelIn path model analysis, determining the significance and association of each hypothesized path and the R² value is important. Figure 2 shows the standardized path coefficient and the significance of each path reported by PLS. H1 investigates the positiveeffect of CSE on ICT use among senior citizens. Results show that CSE is positively related to ICT usage frequency (�=.619, t-value=21.35, p<.001, R²=0.383) and variety (�=.634, t-value=22.98, p<.001, R²=0.402) and explains a significant percentage of the variance in usage (R²=0.383). These results support H1. H2 and H3 investigate the effects on CSE. Social influence is positively related to CSE (�=.450, t-value=10.07, p<.001, R²=0.222), supporting H2. Social support does not have a significant effect on CSE (�=.047, t-value=.97, p>.05). A multi-group analysis (PLS-MGA) shows that the positive effect of social support is only significant for female users (�=.180, t-value=2.62, p<.01) but not male users (�=-.040, t-value=.50, p>.05), supporting H3. Figure 2 summarises the results of the SEM analyses.
Note: * Group FemaleFigure 2: Results of PLS-MGA Analyses
DISCUSSIONAs shown in the results, senior citizens’ CSE is positively related to their ICT usage. In turn, their CSE is positively affected by social influence and social support. However, social support only improves CSE for female senior citizens but not for male senior citizens. Although traditionally, in the promotion of ICT use among seniors, the emphasis has been to compensate for their eroding bodily capital due to natural ageing (Becker, 2005; Charness & Boot, 2009). This study suggests that social influence appears to be a strong factor in determining ICT usage among senior citizens. The results indicate that seniors are more keen to use ICT if their
Guan, Wei, Chan & Chia
The 17th International Conference on Electronic Business, Dubai, UAE, December 4-8, 2017239
family and friends think that they should use these devices and services. For female senior citizens, they are more likely to use ICT when their family and friends provide encouragement and technical assistance. This is in line with recent research suggesting the significance of social capital in seniors use of ICT (Friemel, 2014). Therefore, to minimize the exclusion of seniors as cities become smarter and the world becomes more technology-enabled, some degree of social engineering intervention may be required. Based on this finding, such interventions may be more effective if it is not only targeted at the seniors, but also at their family and friends to be more encouraging and supportive of seniors in using ICT.
CONCLUSIONThis research demonstrated that psychological factors such as computer self-efficacy (CSE) is crucial in understanding ICT usage among senior citizens. In ICT usage amongst seniors, we found that CSE is an important mediating factor between social influence, social support and usage. From these insights, implications to policy and practice are also articulated with the aspiration towards social inclusion of senior citizens in this increasingly technologically-enabled world. To conclude, in attempting to promote ICT usage amongst seniors, we suggest that scholars and implementers of intervention programs may find it effective to focus more onsocial dimensions. It is believed that such an approach can also lead to the emancipation and reduction of inequalities amongdifferently advantaged groups even as cities become smarter and the world becomes more technology-enabled.
REFERENCES[1] Al-Jaghoub, S. & Westrup, C. (2009). Reassessing social inclusion and digital divides. Journal of Information
Communication and Ethics in Society, 7(2), 146-158.[2] Bandura, A. (1986) Social Foundations of Thought and Actions, Prentice-Hall, Englewood Cliffs, NJ.[3] Bao, Y., Xiong, T. & Hu, Z. (2013). Exploring gender differences on general and specific computer self-efficacy in mobile
learning adoption. Educational Computing Research, 49(1), 111-32.[4] Becker, S. A. (2005). E-government usability for older adults. Communications of the ACM, 48, 102-104.[5] Charness, N. & Boot, W. R. (2009). Aging and information technology use: potential and barriers. Current Directions in
Psychological Science, 18(5), 253-258.[6] Cheung, C. M. K. & Lee, M. K. O. (2010). A theoretical model of intentional social action in online social networks.
Decision Support Systems, 49(1), 24-30.[7] Chin, W. W. (1998). The parital least squares approach to structural equation modeling. In G.A. Marcoulides (Ed.). Modern
Methods for Business Research (pp. 295-336). Mahwah, NJ: Lawrence Erlbaum Associates.[8] Choi, N. G. & Dinitto, D. M. (2013). The digital divide among low-income homebound older adults: Internet use patterns,
ehealth literacy, and attitude toward computer/ Internet use. Journal of Medical Internet Research, 15(5), 1-16.[9] Compeau, D. R. & Higgins, C. A. (1995). Computer self-efficacy: Development of a measure and initial test. MIS Quarterly,
19(2), 189-211.[10] Culo, S. (2011). Risk assessment and intervention for vulnerable older adults. BC Medical Journal, 53(8), 421-25.[11] Fornell,C. & Larcker, D. F. (1981). Evaluating structural equation models with unobservable variables and measreument error.
Journal of Marketing Research, 18(1), 39-50.[12] Friemel, T. N. (2016). The digital divide has grown old: determinants of a digital divide among seniors. New Media and
Society, 18(2), 313-331.[13] Hamari, J. (2013). Transforming homo economicus into homo ludens: A field experiment on gamification in a utilitarian peer-
to-peer trading service. Electronic Commerce Research and Applications, 12(4), 236-245.[14] Hamari, J. & Koivisto, J. (2015). Working out for likes: An empirical study on social influence in exercise gamification.
Computers in Human Behavior, 50, 333-347.[15] Hansen, H.T , Lundberg, K. & Syltevik, L.J. (2018). Digitalization, street level bureaucracy and welfare users’ experiences.
Social Policy and Administration, 52(1), 67-90.[16] Hartke, R. J., Prohaska, T.R. & Furner, S. E. (1998). Older adults and assistive devices use, multiple-device use, and need.
Journal of Aging and Health, 10(1), 99-116.[17] Hayashi, A., Chen, C., Ryan, T. & Wu, J. (2004). The role of social presence and moderating role of computer self efficacy in
predicting the continuance usage of e-learning systems. Journal of Information Systems Education, 15(2), 139-154.[18] Henseler, J., Ringle, C. M. & Sinkovics, R. R. (2009). The use of partial least squares path modeling ininternational marketing.
Advances in International Marketing, 20, 277-319.[19] Hodes,G.E, Pfau, M.L., Purushothaman, I., Ahn, H. F., Golden, S. A., Christoffel, D. J., Magida, J.,Brancato, A.,Takahashi,
A., Flanigan, M. E., Menard, C., Aleyasin, H., Koo, J. W., Lorsch, Z.S., Feng, J.,Heshmati, M., Wang, M., Turecki, G., Neve, R., Zhang. B., Shen, L., Nestler, E. J. & Russo, S. J. (2015). Sex differences in nucleus accumbens transcriptome profiles associated with susceptibility versus resilience to subchronic variable stress. The Journal of Neuroscience, 35(50), 16362-76.
[20] Hsia, J.W., Chang, C.C, & Tseng, A. H.(2014). Effects of individuals locus of control and computer self-efficacy on their e-learning acceptance in high-tech companies. Behavior and Information Techonology, 33(1), 51-64.
[21] Hsieh, J. J. P.-A., Rai, A. & Keil, M. (2011). Addressing digital inequality for the socioeconomically disadvantaged through government initiatives: Forms of capital that affect ICT utilization. Information Systems Research, 22(2), 233-253.
Guan, Wei, Chan & Chia
The 17th International Conference on Electronic Business, Dubai, UAE, December 4-8, 2017240
[22] Kessler, R. C., Nelson, C.B., McGonale, K.A., Liu, J., Swartz, M.& Blazer, D.G. (1996). Comorbidity of DSM-III-R major depressive disorder in the general population: Results from the us national comorbidity survey. British Journal of Psychiatry, 30, 17-30.
[23] Kim, K. J. & Shin, D.-H (2015). An acceptance model for smart watches: Implications for the adoption of future wearable technology. Internet Research, 25(4), 527-541.
[24] Marangunic, N. & Granic, A. (2015). Technology acceptance model: A literature review from 1986 to 2013. Universal Access in Information Society, 14(1), 81-95.
[25] Mossakowski, K. N. & Zhang, W. (2014). Does social support buffer the stress of discrimination and reduce psychological distress among Asian Americans? . Social Psychology Quarterly, 77(3), 273-95.
[26] Moulaert, T. & Biggs, S. (2013). International and European policy on work and retirement: Reinventing critical perspectiveson active ageing and mature subjectivity. Human Relations, 66(1), 23-43.
[27] Park, C. & Jun, J. K. (2003). A cross-cultural comparison of Internet buying behavior: Effects of Internet usage, perceived risks, and innovativeness. International Marketing Review, 20(5), 534-553.
[28] Rauniar,R., Rawski, G., Yang, J. & Johnson, B. (2014). Technology acceptance model (TAM) and social media usage: Anempirical study on Facebook. Journal of Enterprise Information Management, 27(1), 6-30.
[29] Singstats (2011). Census of population 2010, Demographic characteristics, education, language, and religion. Retrieved from https://www.singstat.gov.sg (18 October 2017)
[30] Taylor, S. & Todd, P. A. (1995). Understanding information technology usage: A test of competing models. Information Systems Research, 6(2), 144-176.
[31] Warschauer, M.(2003) Technology and Social Inclusion: Rethinking the Digital Divide. Cambridge, MA: MIT Press.[32] Wu, H. & Rudkin, L (2000). Social contact, socioeconomic status, and the health status of older Malaysians. Gerontologist,
40(2), 228-234.[33] Zhang, P. (2008). Technical opinion: motivational affordances: Reasons for ICT design and use. Communications of the ACM,
51(11), 145-147.

Bo, Z. & Li, Y. (2017). Wearable medical devices acceptance and expectance of senior population in china. InProceedings of The 17th International Conference on Electronic Business (pp. 241-251). ICEB, Dubai, UAE, December 4-8.
Zhang & Li
The 17th International Conference on Electronic Business, Dubai, UAE, December 4-8, 2017 241
Wearable Medical Devices Acceptance and Expectance of Senior Population in China
Bo Zhang*, ESSEC Business School, Singapore, [email protected] Li, ESSEC Business School, Singapore, [email protected]
ABSTRACTThe purpose of this paper is to investigate: 1. How well the senior population in China accept the wearable medical devices; 2. What kind of products the senior population in China would like to choose; 3. At what price the senior population are willingto pay. Collected information from secondary data resources to understand the wearable medical devices market in China and conducted online survey through professional survey software WenJuanXing to collect primary data from 217 elderlies (above 50 years old) in China. Based on the data collected by the online survey, half of the respondents are interested in using wearing medical devices. Top three concerns about the wearable medical devices are safety, veracity and reliability. About 56% of respondents are willing to pay no more than 600 RMB (about 90 USD) for the device itself. About 54% of respondents are willing to pay no more than 60 RMB / Month for the service (about 110 USD per year).
Keywords: Wearable medical devices, senior population, technology acceptance, e-health_____________________*Corresponding author
INTRODUCTIONThe Chinese population is ageing fast. In 2010, there were 12.4% of the population in China over 60. However, forecasted by Statista (2016) the share of population aged 60 and above will reach 17.5% in 2020, 25.3% in 2030, 30.9% in 2040 and 36.5% in 2050. According to WHO: China Country Assessment Report on Ageing and Health (2015), there were about 168 million people over 60-year-old in 2010, however in 2040 the number will roll up to 402 million. This demographic trend is the result of falling mortality at younger ages, followed by decreasing fertility. Between 1950 and 2015, the total fertility rate per woman declined from 6.11 to 1.66. Over the same time, the overall mortality rate declined (from 22.2 to 7.2 per 10 000 population) resulting in a steady increase in life expectancy.
In term of demographic characteristics and their geographical distribution, in 2010, regions with higher oldest old proportionexpanded largely in the East coastal area in China. In the meanwhile, provinces including Sichuan, Guangxi, Guizhou, Hunan, Hubei and the Northeast also emerged much higher proportion of oldest old compared with 2000 (Wang et al., 2016).
Globally, older persons already constitute a large share of the population in the more developed regions. According to United Nation’s World Population Ageing Report (2015), in 2015, close to one in four people living in developed regions was aged 60 years or over, and it is projected to continue to rise such that, in 2050, older persons will account for one in three people in the developed region. In 2050, there will be 24.6% of Asian population over 60 years old, 34.2% in Europe which is the highest ratio among all the regions.
However, insufficient resources are available for the care of the elderly. Too few geriatric hospitals and nursing homes are available, which could lead to suboptimum geriatric medicine, rehabilitation, psychiatric, and palliative care services (Wang & Chen, 2014). At the end of 2014, there were 212 million people over the age of 60 in China. Over 40 million of them were disabled. For every thousand people over the age of 60, there were 26 nursing home beds available in China. That is compared to the 50 to 70 beds available for every thousand people over the age of 65 in developed countries, reported by China Research Center on Ageing (2015).
Wearable Medical Devices Definition of wearable medical devicesWearable technology was not newly born, one early piece of widely adopted wearable technology was the calculator watch, introduced in the 1980s. Wearable technology was early used in health field was the hearing aid. The first wearable hearing aid using vacuum tube technology went on sale in England in 1936, and a year later in America. Wearable devices are rapidly advancing in terms of technology, functionality, and size, with more real-time applications (Crawford, 2016) Currently in US the FDA draft guidance for low risk devices advises that personal health wearables are general wellness products if they collect data on weight management, physical fitness, relaxation or stress management, mental acuity, self-esteem, sleep management, or sexual function. There are hundreds of wearable devices in the world fall into different categories (see Figure 8).
A wearable medical device may be defined as a biosensor that collects physiological data, such as heart rate, temperature, blood pressure, blood oxygen level, glucose level, etc. Most of the time a device is with remote/wireless communication, as

Zhang & Li
The 17th International Conference on Electronic Business, Dubai, UAE, December 4-8, 2017242
part of any wearable item that attaches to the body. Wearable medical devices may also be developed to predict diseases attack. Predictive wearable tech is also coming to health care in an effort to foresee oncoming sickness and medical emergencies before they happen. Developers hope that successful harnessing of wearable tech’s forecasting powers will lead not just to fewer trips to the doctor, but, more broadly, to significant improvements in public health and safety (Lavendusk, 2016).
Market of wearable medical devices across the world and major companiesThe demand for wearable medical devices and remote patient monitoring systems is increasing, and the global market is expectedto reach $612 billion in the next eight years, according to a new report from San Francisco-based Grand View Research on Connected Health And Wellness Devices Market (2016). Smart watches will dominate initial sales within the wearable device category according to many sources, with the Apple Watch accounting for perhaps 40 percent of units shipped (Moar 2017)
In many developed countries, healthcare expenditures are reduced by using telemedicine or telehealth in alliance with wearable devices, such analytics enable health systems to identify potential health issues in real time. The Affordable Care Act or Obamacare is pushing the value-based care model and technology provides the support needed for the program to succeed and the US government to save money. Telehealth is one such healthcare distribution method within the Population Health Programs model using wearable technologies to help bring down US healthcare costs. The healthcare data can be continuously collected and transformed since users generally wear the device 24 hours a day. However, a great deal research and development is required to ensure that the data generated is managed correctly (Donovan et al., 2009) and is of a high quality (O'donoghue &Herbert 2012) And to build up users’ confidents and to help them to use the devices comfortably is essential for any products in this particular market.
There are two main kinds of healthcare wearable devices in the current market. The first is fitness wearable devices, which help users to track and monitor their daily fitness conditions such as steps, distance, calories burned, sleep, and diet. These fitness wearable devices such as Fitbit, Mi Band from Xiao Mi, are more suitable for the young and the healthy users. On the contrary, medical wearable devices are more likely to be adopted by the elder and patients who have chronic diseases. Wearable medical devices are generally designed for certain chronic disease such as diabetes, high blood pressure, cardiac disease. Various firms, including Google, Apple, Samsung, and some medical wearable devises start-ups are making efforts on researching various kinds of medical wearable devices.
Wearable Medical Devices for Senior populationwearable medical devices could help older people remain at home and stay independent by enabling elderly to manage their chronic diseases such as hypertension, diabetes mellitus, cardiovascular diseases. More importantly, by using the wearable medical devices older people would be able to predict adverse events and call for help during emergency.
Up to date there are only handful successful products for elderly in the market, with more and more start-ups coming. One of the promising products is CarePredict Tempo (Figure 9), which is currently slated for global release to care facilities later this year, and should be directly available to U.S. consumers in early 2017. CarePredict Tempo learns the normal daily activity patterns of seniors. It monitors and records these daily patterns over time. If these patterns begin to change in ways that could indicate a health issue may be developing, an alert is sent.
Another start up, Lively, has designed a safety watch as well (also called Lively Figure 10) that interacts with sensors located around the home and a central base station. There are two ways to wear Lively, wear the neck or either on the wrist. The Lively safety watch, which is available now for US $49.99 with monthly service charge at $ 14.99.
However, even there is such promising product, the elderly might not adopt the technology and accept the wearable medical devices. A study carried out in the UK in early 2015 among 1000 people reported that almost half (56%) said that wearable tech was "just a fad". Considering most of the seniors are afraid to access these high technologies, companies need to tailor the medical wearable devices and match the physical and mental needs of the senior population, to help them to overcome the fear of using devices and let the devices serve them better.
METHODOLOGYOverview of designIn this study, the author had conducted an online survey to collect first-hand information from senior population in China about their opinions towards wearable medical devices (Table 1). Original survey was in Chinese.
SampleThere were 217 respondents completed the survey during two-weeks period (16/08/16 -02/09/16). Among the 217 respondents, there are 95 males and 122 females from 11 different provinces cross China.
Sampling Technique Through snowball sampling and convenience sampling. The on-line survey was published through a Chinese professional survey platform WenJuanXing. Respondents filled in the questionnaire through smart-phone or computer on-line with/without their children’s help.
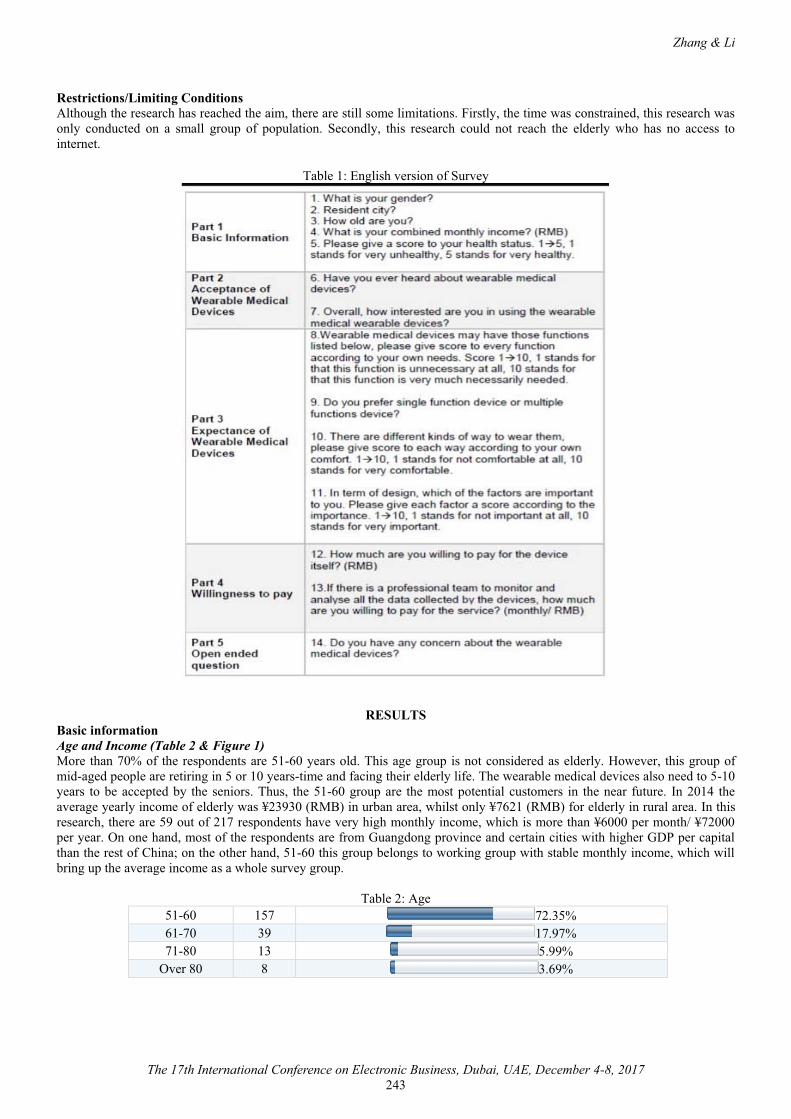
Zhang & Li
The 17th International Conference on Electronic Business, Dubai, UAE, December 4-8, 2017243
Restrictions/Limiting ConditionsAlthough the research has reached the aim, there are still some limitations. Firstly, the time was constrained, this research was only conducted on a small group of population. Secondly, this research could not reach the elderly who has no access to internet.
Table 1: English version of Survey
RESULTSBasic informationAge and Income (Table 2 & Figure 1)More than 70% of the respondents are 51-60 years old. This age group is not considered as elderly. However, this group of mid-aged people are retiring in 5 or 10 years-time and facing their elderly life. The wearable medical devices also need to 5-10years to be accepted by the seniors. Thus, the 51-60 group are the most potential customers in the near future. In 2014 the average yearly income of elderly was ¥23930 (RMB) in urban area, whilst only ¥7621 (RMB) for elderly in rural area. In this research, there are 59 out of 217 respondents have very high monthly income, which is more than ¥6000 per month/ ¥72000 per year. On one hand, most of the respondents are from Guangdong province and certain cities with higher GDP per capital than the rest of China; on the other hand, 51-60 this group belongs to working group with stable monthly income, which will bring up the average income as a whole survey group.
Table 2: Age51-60 157 72.35%61-70 39 17.97%71-80 13 5.99%
Over 80 8 3.69%
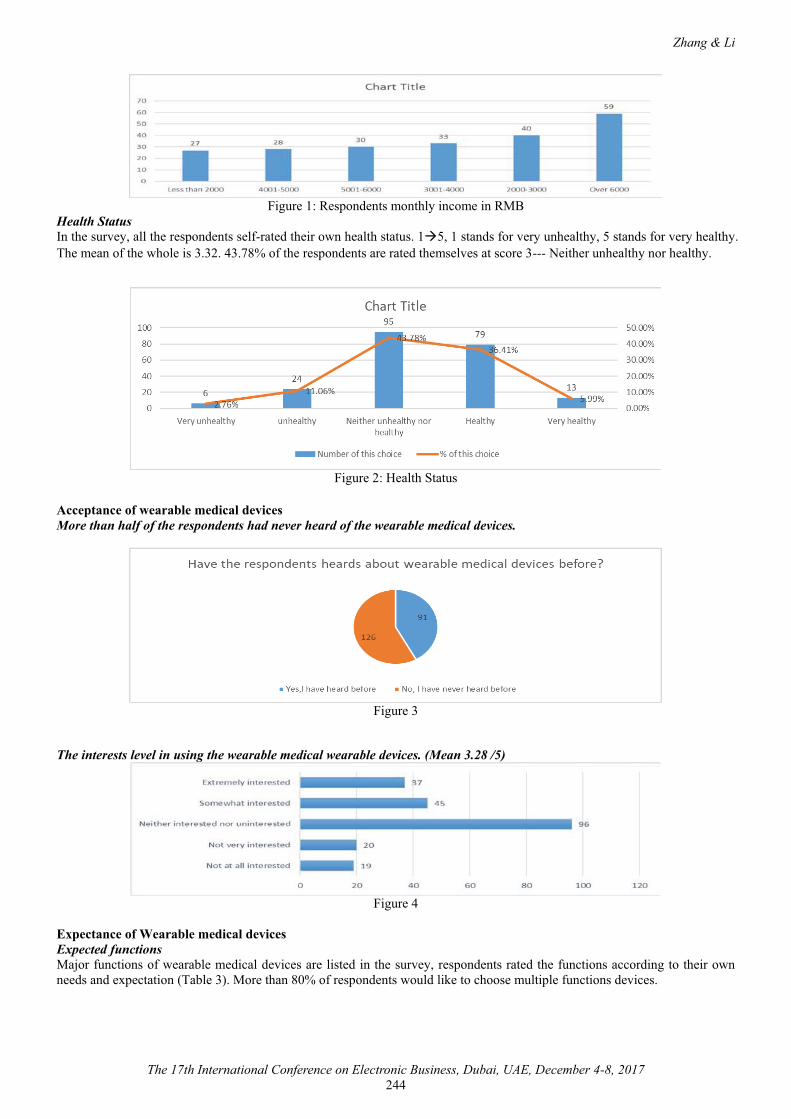
Zhang & Li
The 17th International Conference on Electronic Business, Dubai, UAE, December 4-8, 2017244
Figure 1: Respondents monthly income in RMBHealth StatusIn the survey, all the respondents self-rated their own health status. 1�5, 1 stands for very unhealthy, 5 stands for very healthy. The mean of the whole is 3.32. 43.78% of the respondents are rated themselves at score 3--- Neither unhealthy nor healthy.
Figure 2: Health Status
Acceptance of wearable medical devicesMore than half of the respondents had never heard of the wearable medical devices.
Figure 3
The interests level in using the wearable medical wearable devices. (Mean 3.28 /5)g
Figure 4
Expectance of Wearable medical devicesExpected functions Major functions of wearable medical devices are listed in the survey, respondents rated the functions according to their own needs and expectation (Table 3). More than 80% of respondents would like to choose multiple functions devices.
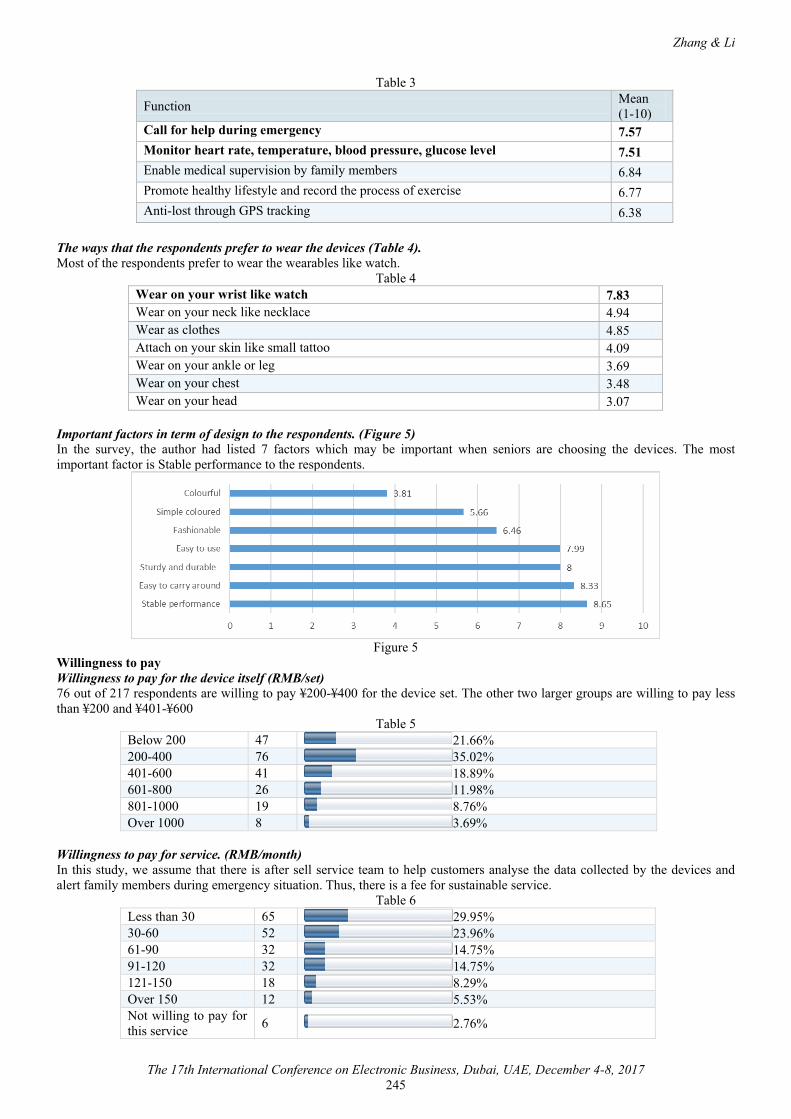
Zhang & Li
The 17th International Conference on Electronic Business, Dubai, UAE, December 4-8, 2017245
Table 3
Function Mean(1-10)
Call for help during emergency 7.57Monitor heart rate, temperature, blood pressure, glucose level 7.51Enable medical supervision by family members 6.84Promote healthy lifestyle and record the process of exercise 6.77Anti-lost through GPS tracking 6.38
The ways that the respondents prefer to wear the devices (Table 4).Most of the respondents prefer to wear the wearables like watch.
Table 4Wear on your wrist like watch 7.83Wear on your neck like necklace 4.94Wear as clothes 4.85Attach on your skin like small tattoo 4.09Wear on your ankle or leg 3.69Wear on your chest 3.48Wear on your head 3.07
Important factors in term of design to the respondents. (Figure 5)In the survey, the author had listed 7 factors which may be important when seniors are choosing the devices. The most important factor is Stable performance to the respondents.
Figure 5Willingness to payWillingness to pay for the device itself (RMB/set)76 out of 217 respondents are willing to pay ¥200-¥400 for the device set. The other two larger groups are willing to pay less than ¥200 and ¥401-¥600
Table 5Below 200 47 21.66%200-400 76 35.02%401-600 41 18.89%601-800 26 11.98%801-1000 19 8.76%Over 1000 8 3.69%
Willingness to pay for service. (RMB/month)In this study, we assume that there is after sell service team to help customers analyse the data collected by the devices and alert family members during emergency situation. Thus, there is a fee for sustainable service.
Table 6Less than 30 65 29.95%30-60 52 23.96%61-90 32 14.75%91-120 32 14.75%121-150 18 8.29%Over 150 12 5.53%Not willing to pay for this service 6 2.76%
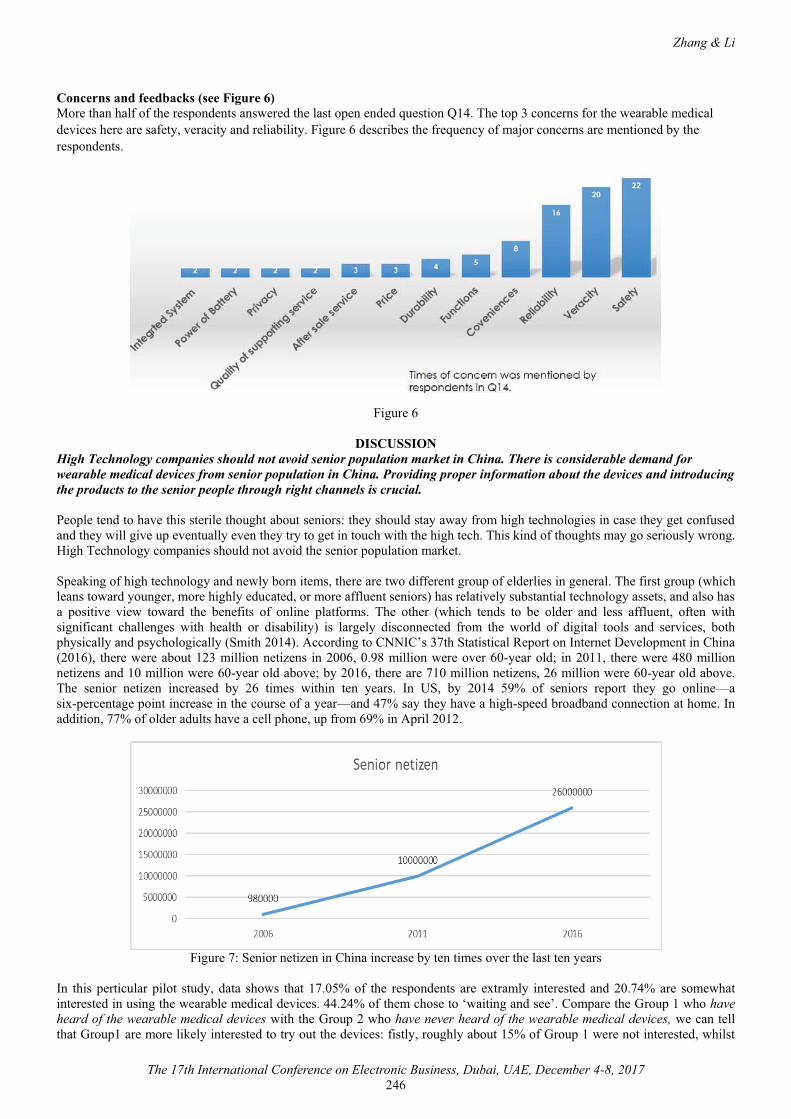
Zhang & Li
The 17th International Conference on Electronic Business, Dubai, UAE, December 4-8, 2017246
Concerns and feedbacks (see Figure 6)More than half of the respondents answered the last open ended question Q14. The top 3 concerns for the wearable medical devices here are safety, veracity and reliability. Figure 6 describes the frequency of major concerns are mentioned by the respondents.
Figure 6
DISCUSSIONHigh Technology companies should not avoid senior population market in China. There is considerable demand for wearable medical devices from senior population in China. Providing proper information about the devices and introducing the products to the senior people through right channels is crucial.
People tend to have this sterile thought about seniors: they should stay away from high technologies in case they get confused and they will give up eventually even they try to get in touch with the high tech. This kind of thoughts may go seriously wrong. High Technology companies should not avoid the senior population market.
Speaking of high technology and newly born items, there are two different group of elderlies in general. The first group (which leans toward younger, more highly educated, or more affluent seniors) has relatively substantial technology assets, and also has a positive view toward the benefits of online platforms. The other (which tends to be older and less affluent, often with significant challenges with health or disability) is largely disconnected from the world of digital tools and services, both physically and psychologically (Smith 2014). According to CNNIC’s 37th Statistical Report on Internet Development in China(2016), there were about 123 million netizens in 2006, 0.98 million were over 60-year old; in 2011, there were 480 million netizens and 10 million were 60-year old above; by 2016, there are 710 million netizens, 26 million were 60-year old above. The senior netizen increased by 26 times within ten years. In US, by 2014 59% of seniors report they go online—asix-percentage point increase in the course of a year—and 47% say they have a high-speed broadband connection at home. In addition, 77% of older adults have a cell phone, up from 69% in April 2012.
Figure 7: Senior netizen in China increase by ten times over the last ten years
In this perticular pilot study, data shows that 17.05% of the respondents are extramly interested and 20.74% are somewhat interested in using the wearable medical devices. 44.24% of them chose to ‘waiting and see’. Compare the Group 1 who have heard of the wearable medical devices with the Group 2 who have never heard of the wearable medical devices, we can tell that Group1 are more likely interested to try out the devices: fistly, roughly about 15% of Group 1 were not interested, whilst
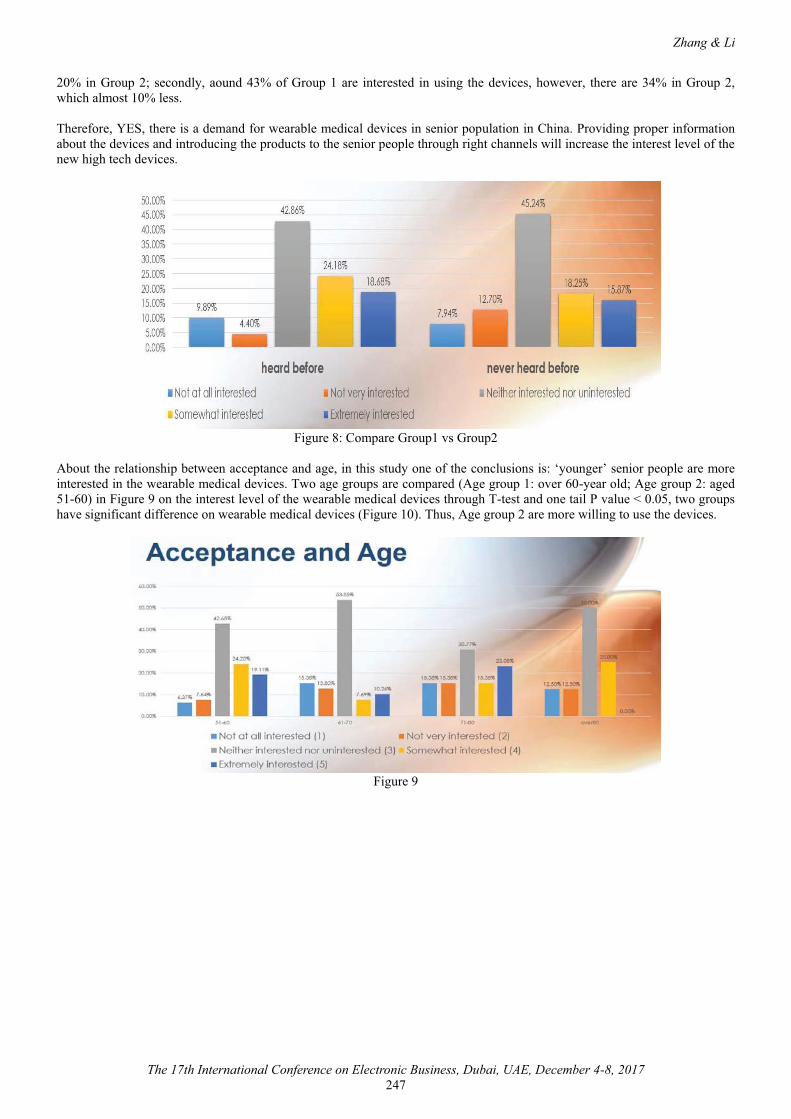
Zhang & Li
The 17th International Conference on Electronic Business, Dubai, UAE, December 4-8, 2017247
20% in Group 2; secondly, aound 43% of Group 1 are interested in using the devices, however, there are 34% in Group 2, which almost 10% less.
Therefore, YES, there is a demand for wearable medical devices in senior population in China. Providing proper information about the devices and introducing the products to the senior people through right channels will increase the interest level of the new high tech devices.
Figure 8: Compare Group1 vs Group2
About the relationship between acceptance and age, in this study one of the conclusions is: ‘younger’ senior people are more interested in the wearable medical devices. Two age groups are compared (Age group 1: over 60-year old; Age group 2: aged 51-60) in Figure 9 on the interest level of the wearable medical devices through T-test and one tail P value < 0.05, two groups have significant difference on wearable medical devices (Figure 10). Thus, Age group 2 are more willing to use the devices.
Figure 9
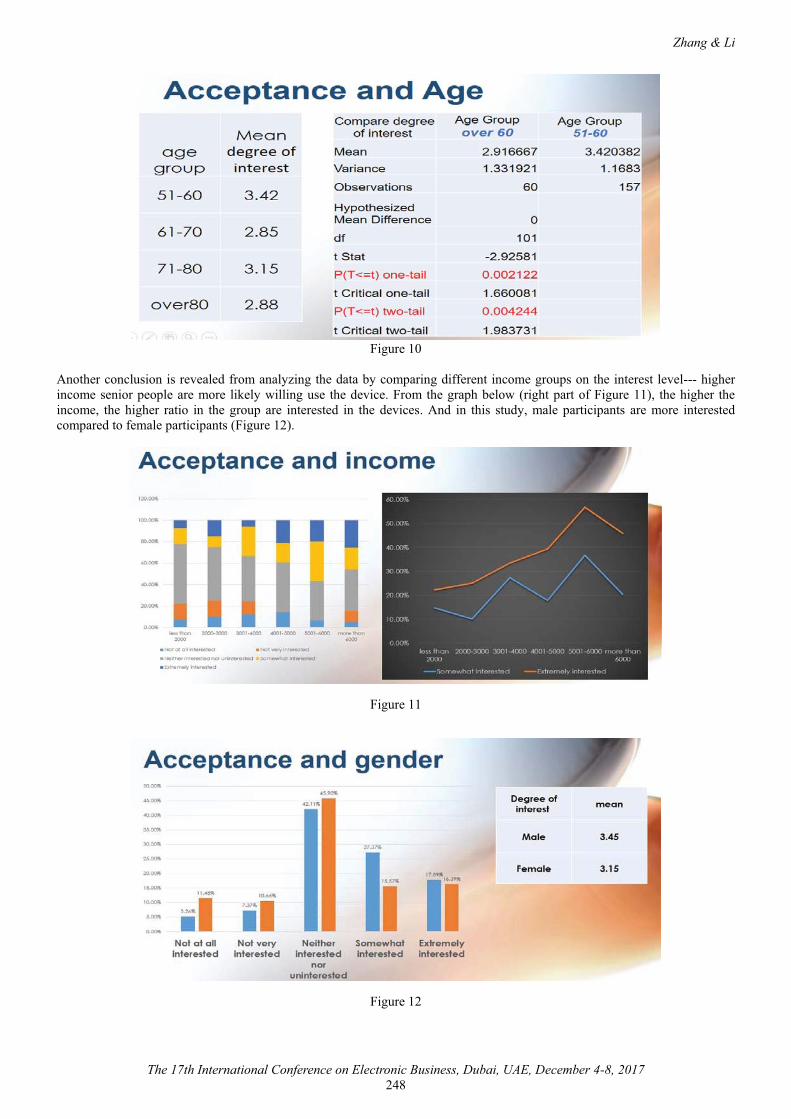
Zhang & Li
The 17th International Conference on Electronic Business, Dubai, UAE, December 4-8, 2017248
Figure 10
Another conclusion is revealed from analyzing the data by comparing different income groups on the interest level--- higher income senior people are more likely willing use the device. From the graph below (right part of Figure 11), the higher the income, the higher ratio in the group are interested in the devices. And in this study, male participants are more interested compared to female participants (Figure 12).
Figure 11
Figure 12
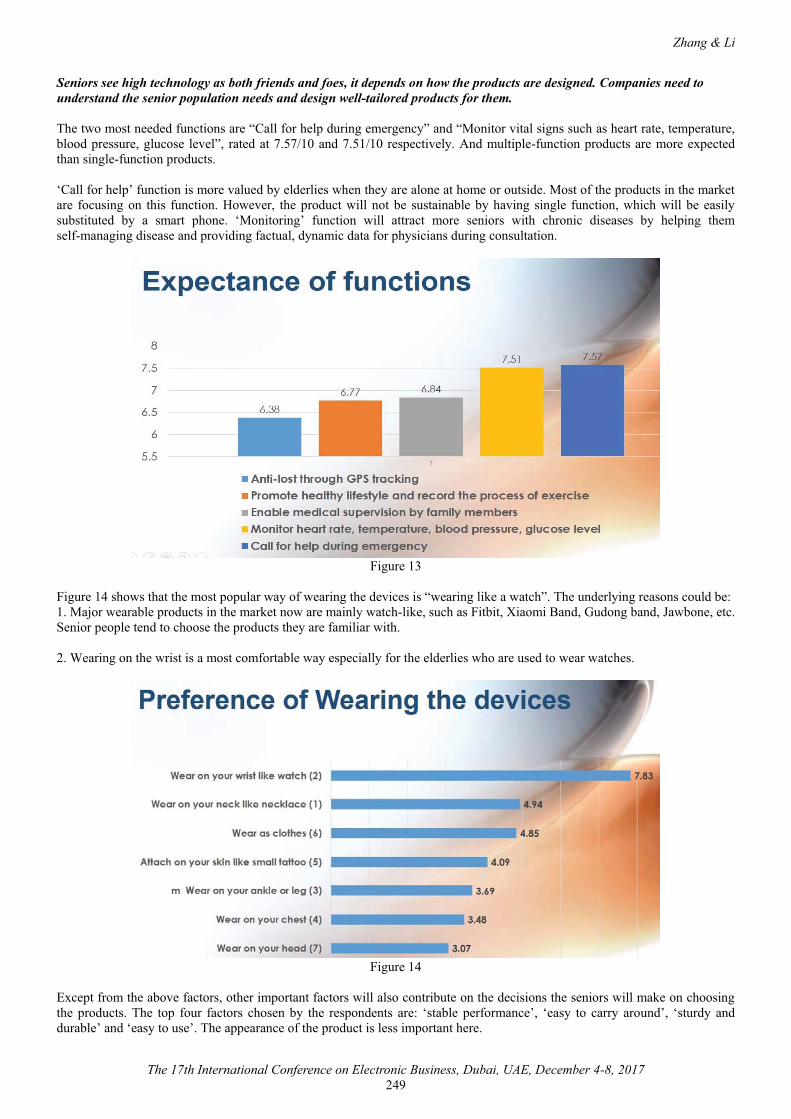
Zhang & Li
The 17th International Conference on Electronic Business, Dubai, UAE, December 4-8, 2017249
Seniors see high technology as both friends and foes, it depends on how the products are designed. Companies need to understand the senior population needs and design well-tailored products for them.
The two most needed functions are “Call for help during emergency” and “Monitor vital signs such as heart rate, temperature, blood pressure, glucose level”, rated at 7.57/10 and 7.51/10 respectively. And multiple-function products are more expected than single-function products.
‘Call for help’ function is more valued by elderlies when they are alone at home or outside. Most of the products in the marketare focusing on this function. However, the product will not be sustainable by having single function, which will be easily substituted by a smart phone. ‘Monitoring’ function will attract more seniors with chronic diseases by helping them self-managing disease and providing factual, dynamic data for physicians during consultation.
Figure 13
Figure 14 shows that the most popular way of wearing the devices is “wearing like a watch”. The underlying reasons could be:1. Major wearable products in the market now are mainly watch-like, such as Fitbit, Xiaomi Band, Gudong band, Jawbone, etc. Senior people tend to choose the products they are familiar with.
2. Wearing on the wrist is a most comfortable way especially for the elderlies who are used to wear watches.
Figure 14
Except from the above factors, other important factors will also contribute on the decisions the seniors will make on choosingthe products. The top four factors chosen by the respondents are: ‘stable performance’, ‘easy to carry around’, ‘sturdy and durable’ and ‘easy to use’. The appearance of the product is less important here.
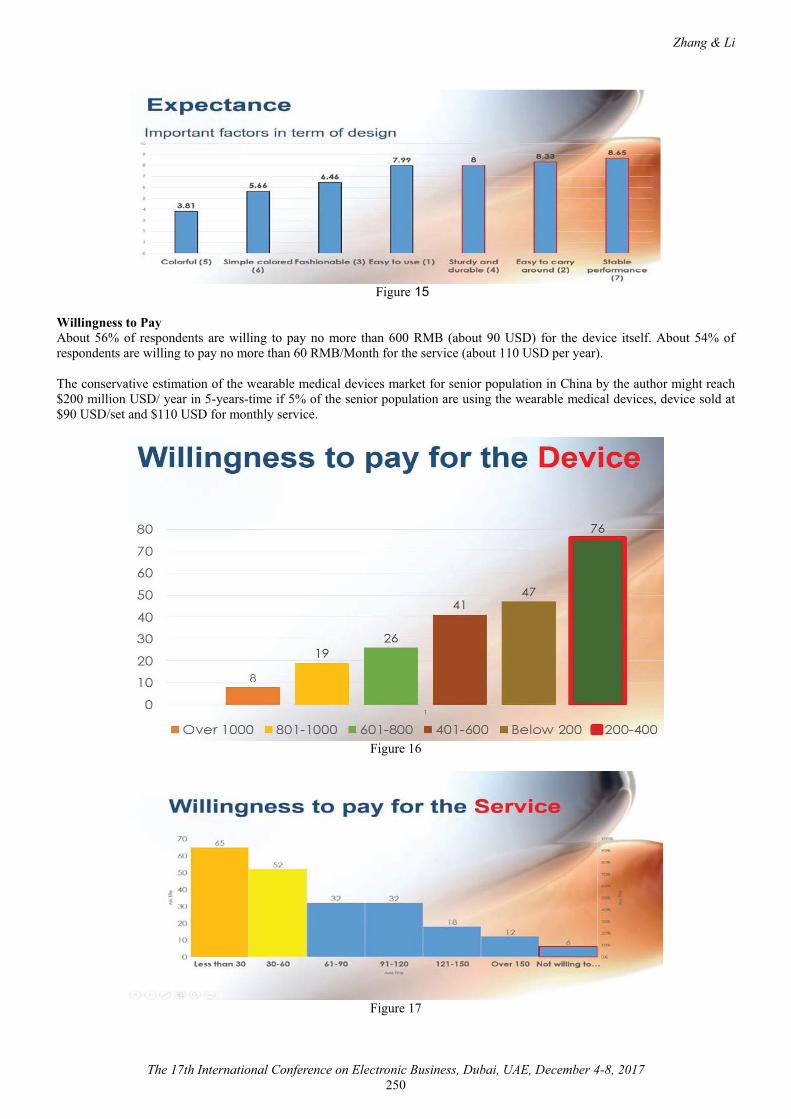
Zhang & Li
The 17th International Conference on Electronic Business, Dubai, UAE, December 4-8, 2017250
Figure 15
Willingness to PayAbout 56% of respondents are willing to pay no more than 600 RMB (about 90 USD) for the device itself. About 54% of respondents are willing to pay no more than 60 RMB/Month for the service (about 110 USD per year).
The conservative estimation of the wearable medical devices market for senior population in China by the author might reach $200 million USD/ year in 5-years-time if 5% of the senior population are using the wearable medical devices, device sold at $90 USD/set and $110 USD for monthly service.
Figure 16
Figure 17
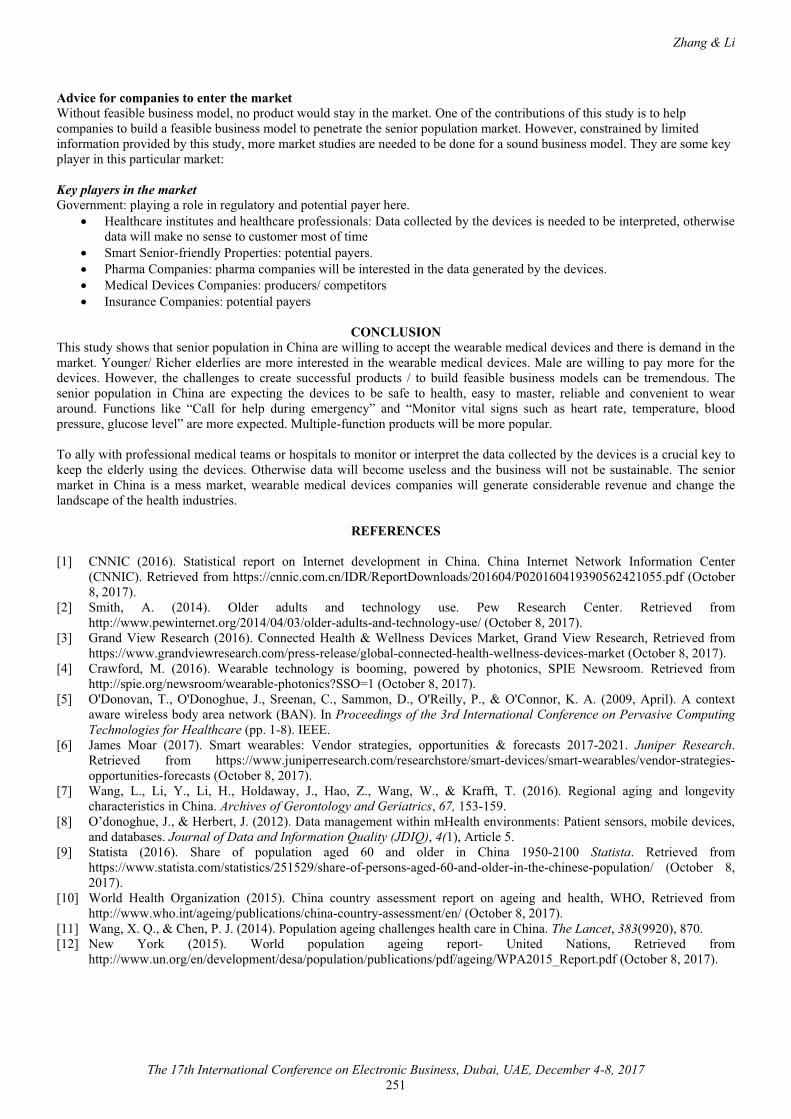
Zhang & Li
The 17th International Conference on Electronic Business, Dubai, UAE, December 4-8, 2017251
Advice for companies to enter the marketWithout feasible business model, no product would stay in the market. One of the contributions of this study is to help companies to build a feasible business model to penetrate the senior population market. However, constrained by limited information provided by this study, more market studies are needed to be done for a sound business model. They are some key player in this particular market:
Key players in the marketGovernment: playing a role in regulatory and potential payer here.
� Healthcare institutes and healthcare professionals: Data collected by the devices is needed to be interpreted, otherwise data will make no sense to customer most of time
� Smart Senior-friendly Properties: potential payers. � Pharma Companies: pharma companies will be interested in the data generated by the devices.� Medical Devices Companies: producers/ competitors� Insurance Companies: potential payers
CONCLUSIONThis study shows that senior population in China are willing to accept the wearable medical devices and there is demand in the market. Younger/ Richer elderlies are more interested in the wearable medical devices. Male are willing to pay more for the devices. However, the challenges to create successful products / to build feasible business models can be tremendous. The senior population in China are expecting the devices to be safe to health, easy to master, reliable and convenient to wear around. Functions like “Call for help during emergency” and “Monitor vital signs such as heart rate, temperature, blood pressure, glucose level” are more expected. Multiple-function products will be more popular.
To ally with professional medical teams or hospitals to monitor or interpret the data collected by the devices is a crucial key to keep the elderly using the devices. Otherwise data will become useless and the business will not be sustainable. The senior market in China is a mess market, wearable medical devices companies will generate considerable revenue and change the landscape of the health industries.
REFERENCES
[1] CNNIC (2016). Statistical report on Internet development in China. China Internet Network Information Center(CNNIC). Retrieved from https://cnnic.com.cn/IDR/ReportDownloads/201604/P020160419390562421055.pdf (October 8, 2017).
[2] Smith, A. (2014). Older adults and technology use. Pew Research Center. Retrieved from http://www.pewinternet.org/2014/04/03/older-adults-and-technology-use/ (October 8, 2017).
[3] Grand View Research (2016). Connected Health & Wellness Devices Market, Grand View Research, Retrieved from https://www.grandviewresearch.com/press-release/global-connected-health-wellness-devices-market (October 8, 2017).
[4] Crawford, M. (2016). Wearable technology is booming, powered by photonics, SPIE Newsroom. Retrieved from http://spie.org/newsroom/wearable-photonics?SSO=1 (October 8, 2017).
[5] O'Donovan, T., O'Donoghue, J., Sreenan, C., Sammon, D., O'Reilly, P., & O'Connor, K. A. (2009, April). A context aware wireless body area network (BAN). In Proceedings of the 3rd International Conference on Pervasive Computing Technologies for Healthcare (pp. 1-8). IEEE.
[6] James Moar (2017). Smart wearables: Vendor strategies, opportunities & forecasts 2017-2021. Juniper Research.Retrieved from https://www.juniperresearch.com/researchstore/smart-devices/smart-wearables/vendor-strategies-opportunities-forecasts (October 8, 2017).
[7] Wang, L., Li, Y., Li, H., Holdaway, J., Hao, Z., Wang, W., & Krafft, T. (2016). Regional aging and longevity characteristics in China. Archives of Gerontology and Geriatrics, 67, 153-159.
[8] O’donoghue, J., & Herbert, J. (2012). Data management within mHealth environments: Patient sensors, mobile devices, and databases. Journal of Data and Information Quality (JDIQ), 4(1), Article 5.
[9] Statista (2016). Share of population aged 60 and older in China 1950-2100 Statista. Retrieved from https://www.statista.com/statistics/251529/share-of-persons-aged-60-and-older-in-the-chinese-population/ (October 8, 2017).
[10] World Health Organization (2015). China country assessment report on ageing and health, WHO, Retrieved from http://www.who.int/ageing/publications/china-country-assessment/en/ (October 8, 2017).
[11] Wang, X. Q., & Chen, P. J. (2014). Population ageing challenges health care in China. The Lancet, 383(9920), 870.[12] New York (2015). World population ageing report- United Nations, Retrieved from
http://www.un.org/en/development/desa/population/publications/pdf/ageing/WPA2015_Report.pdf (October 8, 2017).
Supranee S. & Rotchanakitumnuai S. (2017). The acceptance of the application of blockchain technology in the supply chain process of the Thai automotive industry. In Proceedings of The 17th International Conference on Electronic Business(pp. 252-257). ICEB, Dubai, UAE, December 4-8.
Supranee & Rotchanakitumnuai
The 17th International Conference on Electronic Business, Dubai, UAE, December 4-8, 2017252
The Acceptance of the Application of Blockchain Technology in the Supply Chain Process of the Thai Automotive Industry
Sowichaya Supranee*, Thammasat University, Thailand, [email protected] Rotchanakitumnuai, Thammasat University, Thailand, [email protected]
ABSTRACTBlockchain technology is an optional new technologies to manage the supply chain process. This technology helps to improve and solve the issue of transparency as well as monitor operations in the supply chain. The study found that the perceived benefits of Blockchain technology in the automotive industry, inter-organizational trust are the important factors that affect the acceptance of Blockchain in the supply chain process. Inter-organizational relationship has negative impact on Blockchain technology acceptance. The non-mediated power is a key factor that builds inter-organizational trust and leads to success in the technology application in this industry. The results can be used as a guideline for the automotive industry to apply Blockchain technologies to the operations.
Keywords: Blockchain, Supply Chain, Automotive Industry_____________________*Corresponding author
INTRODUCTIONThe Thai automotive industry is the country's dominant industry from the past to the present, in particular the auto-parts manufacturing industry that has grown steadily. This makes automakers and car-related business, such as auto-parts manufacturers and car dealers need to adjust their marketing strategies to accommodate the needs of the auto market in each category and build trust in the quality of their cars to consumers. Therefore, the effective supply chain management of the automotive industry is very important for creating competitive opportunities. The effective management requires good cooperation from organizations involved from raw material supply to product delivery to consumers. Each process requires an exchange of information among stakeholders, for example the underlying data of the parts used in the production process (Drawing), the requirements for the automotive parts manufacture (Part Specification), and the documents regarding the standard of how to test a prototype before entering the production line (Standard Engineering). Generally, the process of an exchange of information relating to the production is done by automakers and the first tier supplier of automotive parts only. If the second tier supplier of automotive parts wants the information from the automaker for reference, the second tier supplier has to ask the automaker for the information or documents on the standards through the first tier supplier only. As abovementioned, it can be seen that an exchange of information among organizations still lacks equality in terms of acquiring the benefits from the process. It is also found that the first tier supplier benefits the most because it obtains the information from both the automaker and the second tier supplier of automotive parts. Therefore, trust building between automotive parts manufacturers and automakers will result in an exchange of mutually useful information (Corsten & Felde, 2005). In case of personal data or sensitive information, organizations should not trust and give the information to the third party because it is at risk to be attacked and could be misused. Consequently, organizations owning those data need to control their information for the safety or should limit the ability of the third party and staff to access those critical data (Zyskind & Nathan, 2015).
Nowadays, Blockchain technology is being discussed significantly with respect to the integration of systems among organizations to create transparency and build trust in their transactions. Blockchain is actually adopted for the first time in the financial industry as the basis for digital currencies (Cryptocurrency) such as Bitcoin (Nakamoto, 2008), which is a Peer-to-Peer transaction and changes a business model of industries having the distributed database. Blockchain is the technology that makes the various information can be systematically linked to each other without an intermediary. This technology is also beneficial in the matter of trust, information sharing and privacy (Zhao et al, 2016), even if transaction partners are never known. These are the highlights of Blockchain. At present, Blockchain is likely to be widely applied in various industries, the manufacturing industry included, so all parts of the supply chain are reliable and can be monitored. As a result, the use of Blockchain in the supply chain process will help all stakeholders can share information and monitor the accuracy of the occurring transactions including the manufacturing process, the shipment, and the delivery of the products to consumers. Moreover, it helps to accelerate the process and make recording transactions in the supply chain process become more effective and reliable (Apte & Petrovsky, 2016). For the automotive industry, automotive parts manufacturers have invested in research and development about the organization's innovation. Due to the increasing current innovations and pressures on production costs, they have to find means to avoid unnecessary expenses (Ili et al, 2010). In addition to helping to build trust, the application of Blockchain technology in the supply chain process can help to reduce the costs of corporate transactions and to prevent fraud as well.
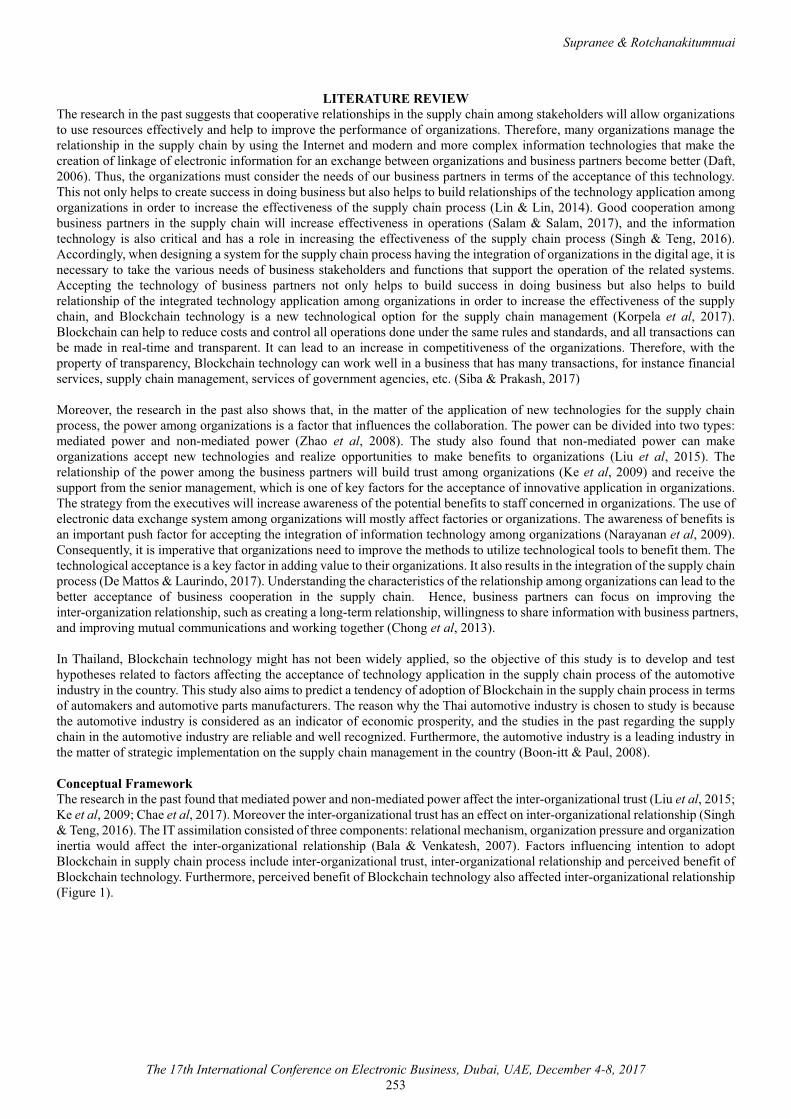
Supranee & Rotchanakitumnuai
The 17th International Conference on Electronic Business, Dubai, UAE, December 4-8, 2017253
LITERATURE REVIEWThe research in the past suggests that cooperative relationships in the supply chain among stakeholders will allow organizations to use resources effectively and help to improve the performance of organizations. Therefore, many organizations manage the relationship in the supply chain by using the Internet and modern and more complex information technologies that make thecreation of linkage of electronic information for an exchange between organizations and business partners become better (Daft, 2006). Thus, the organizations must consider the needs of our business partners in terms of the acceptance of this technology. This not only helps to create success in doing business but also helps to build relationships of the technology application amongorganizations in order to increase the effectiveness of the supply chain process (Lin & Lin, 2014). Good cooperation among business partners in the supply chain will increase effectiveness in operations (Salam & Salam, 2017), and the information technology is also critical and has a role in increasing the effectiveness of the supply chain process (Singh & Teng, 2016). Accordingly, when designing a system for the supply chain process having the integration of organizations in the digital age, it is necessary to take the various needs of business stakeholders and functions that support the operation of the related systems.Accepting the technology of business partners not only helps to build success in doing business but also helps to build relationship of the integrated technology application among organizations in order to increase the effectiveness of the supplychain, and Blockchain technology is a new technological option for the supply chain management (Korpela et al, 2017). Blockchain can help to reduce costs and control all operations done under the same rules and standards, and all transactions can be made in real-time and transparent. It can lead to an increase in competitiveness of the organizations. Therefore, with the property of transparency, Blockchain technology can work well in a business that has many transactions, for instance financial services, supply chain management, services of government agencies, etc. (Siba & Prakash, 2017)
Moreover, the research in the past also shows that, in the matter of the application of new technologies for the supply chainprocess, the power among organizations is a factor that influences the collaboration. The power can be divided into two types: mediated power and non-mediated power (Zhao et al, 2008). The study also found that non-mediated power can make organizations accept new technologies and realize opportunities to make benefits to organizations (Liu et al, 2015). The relationship of the power among the business partners will build trust among organizations (Ke et al, 2009) and receive the support from the senior management, which is one of key factors for the acceptance of innovative application in organizations. The strategy from the executives will increase awareness of the potential benefits to staff concerned in organizations. The use of electronic data exchange system among organizations will mostly affect factories or organizations. The awareness of benefits is an important push factor for accepting the integration of information technology among organizations (Narayanan et al, 2009). Consequently, it is imperative that organizations need to improve the methods to utilize technological tools to benefit them. The technological acceptance is a key factor in adding value to their organizations. It also results in the integration of the supply chain process (De Mattos & Laurindo, 2017). Understanding the characteristics of the relationship among organizations can lead to the better acceptance of business cooperation in the supply chain. Hence, business partners can focus on improving the inter-organization relationship, such as creating a long-term relationship, willingness to share information with business partners, and improving mutual communications and working together (Chong et al, 2013).
In Thailand, Blockchain technology might has not been widely applied, so the objective of this study is to develop and test hypotheses related to factors affecting the acceptance of technology application in the supply chain process of the automotive industry in the country. This study also aims to predict a tendency of adoption of Blockchain in the supply chain process in terms of automakers and automotive parts manufacturers. The reason why the Thai automotive industry is chosen to study is because the automotive industry is considered as an indicator of economic prosperity, and the studies in the past regarding the supplychain in the automotive industry are reliable and well recognized. Furthermore, the automotive industry is a leading industry in the matter of strategic implementation on the supply chain management in the country (Boon-itt & Paul, 2008).
Conceptual Framework The research in the past found that mediated power and non-mediated power affect the inter-organizational trust (Liu et al, 2015; Ke et al, 2009; Chae et al, 2017). Moreover the inter-organizational trust has an effect on inter-organizational relationship (Singh & Teng, 2016). The IT assimilation consisted of three components: relational mechanism, organization pressure and organization inertia would affect the inter-organizational relationship (Bala & Venkatesh, 2007). Factors influencing intention to adopt Blockchain in supply chain process include inter-organizational trust, inter-organizational relationship and perceived benefit of Blockchain technology. Furthermore, perceived benefit of Blockchain technology also affected inter-organizational relationship (Figure 1).
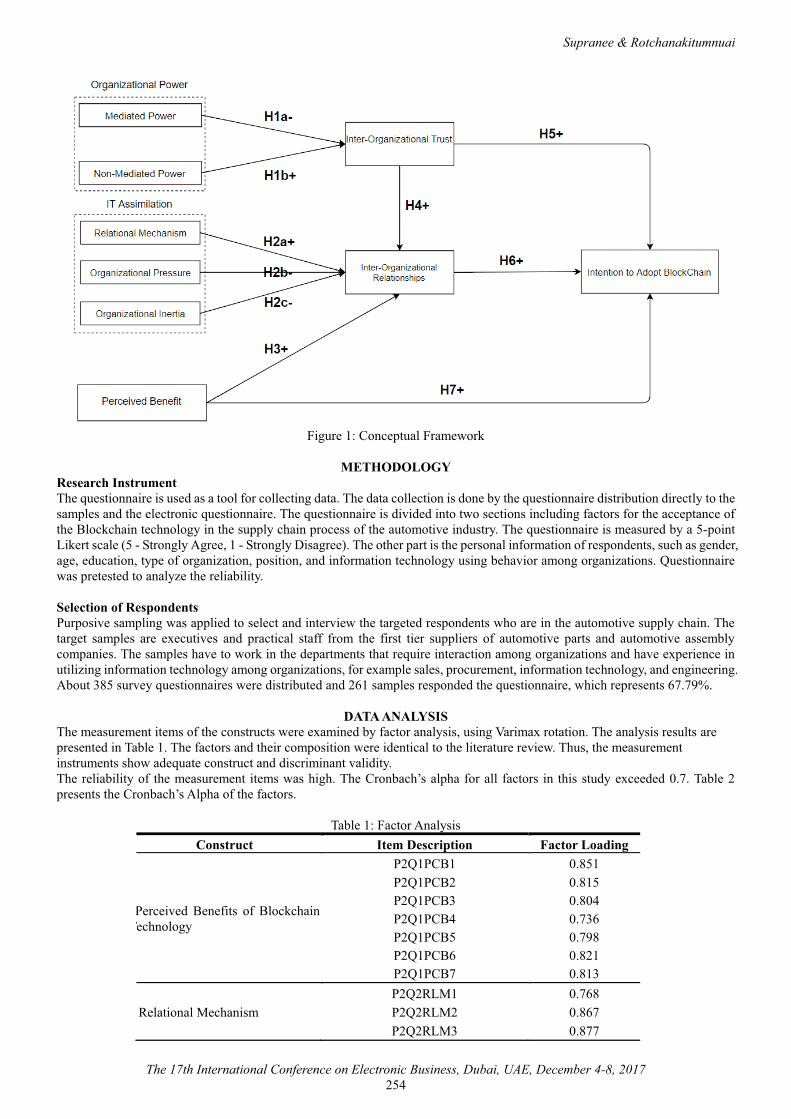
Supranee & Rotchanakitumnuai
The 17th International Conference on Electronic Business, Dubai, UAE, December 4-8, 2017254
Figure 1: Conceptual Framework
METHODOLOGYResearch InstrumentThe questionnaire is used as a tool for collecting data. The data collection is done by the questionnaire distribution directly to the samples and the electronic questionnaire. The questionnaire is divided into two sections including factors for the acceptance of the Blockchain technology in the supply chain process of the automotive industry. The questionnaire is measured by a 5-point Likert scale (5 - Strongly Agree, 1 - Strongly Disagree). The other part is the personal information of respondents, such as gender, age, education, type of organization, position, and information technology using behavior among organizations. Questionnaire was pretested to analyze the reliability.
Selection of RespondentsPurposive sampling was applied to select and interview the targeted respondents who are in the automotive supply chain. The target samples are executives and practical staff from the first tier suppliers of automotive parts and automotive assembly companies. The samples have to work in the departments that require interaction among organizations and have experience in utilizing information technology among organizations, for example sales, procurement, information technology, and engineering. About 385 survey questionnaires were distributed and 261 samples responded the questionnaire, which represents 67.79%.
DATA ANALYSISThe measurement items of the constructs were examined by factor analysis, using Varimax rotation. The analysis results are presented in Table 1. The factors and their composition were identical to the literature review. Thus, the measurement instruments show adequate construct and discriminant validity.The reliability of the measurement items was high. The Cronbach’s alpha for all factors in this study exceeded 0.7. Table 2 presents the Cronbach’s Alpha of the factors.
Table 1: Factor AnalysisConstruct Item Description Factor Loading
Perceived Benefits of Blockchain Technology
P2Q1PCB1 0.851P2Q1PCB2 0.815P2Q1PCB3 0.804P2Q1PCB4 0.736P2Q1PCB5 0.798P2Q1PCB6 0.821P2Q1PCB7 0.813P2Q2RLM1 0.768
Relational Mechanism P2Q2RLM2 0.867P2Q2RLM3 0.877
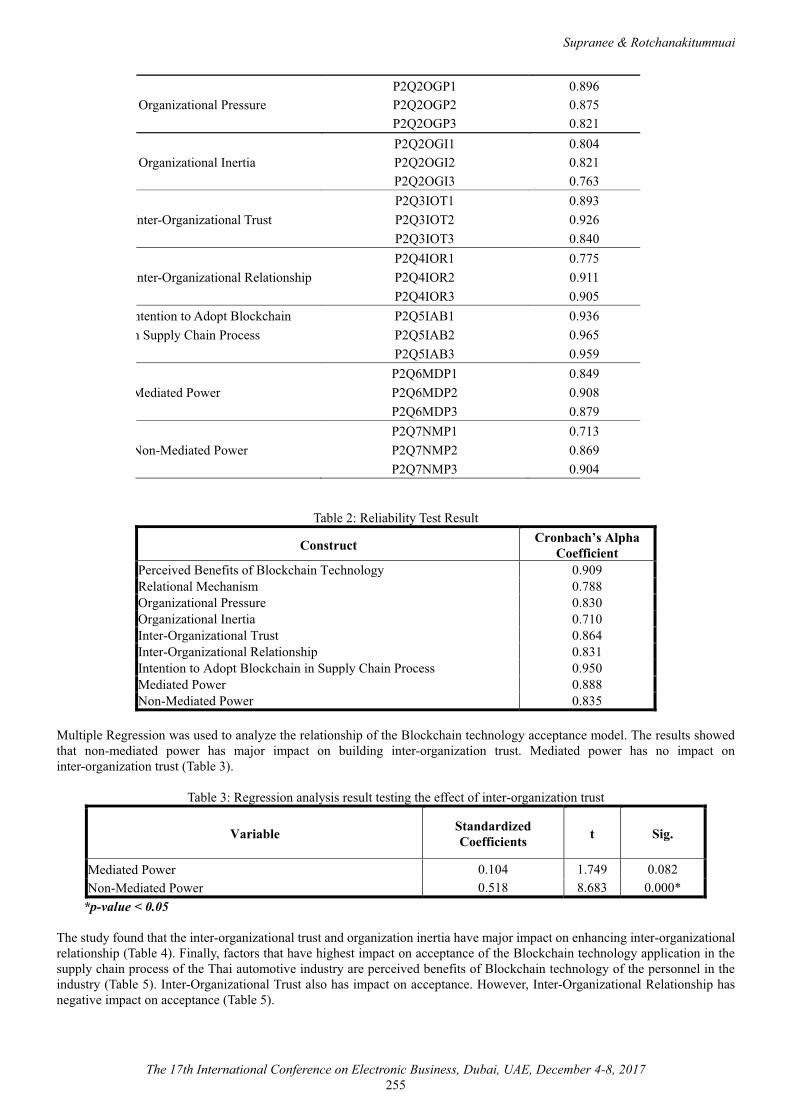
Supranee & Rotchanakitumnuai
The 17th International Conference on Electronic Business, Dubai, UAE, December 4-8, 2017255
P2Q2OGP1 0.896Organizational Pressure P2Q2OGP2 0.875
P2Q2OGP3 0.821P2Q2OGI1 0.804
Organizational Inertia P2Q2OGI2 0.821P2Q2OGI3 0.763P2Q3IOT1 0.893
Inter-Organizational Trust P2Q3IOT2 0.926P2Q3IOT3 0.840P2Q4IOR1 0.775
Inter-Organizational Relationship P2Q4IOR2 0.911P2Q4IOR3 0.905
ntention to Adopt Blockchain P2Q5IAB1 0.936n Supply Chain Process P2Q5IAB2 0.965
P2Q5IAB3 0.959P2Q6MDP1 0.849
Mediated Power P2Q6MDP2 0.908P2Q6MDP3 0.879P2Q7NMP1 0.713
Non-Mediated Power P2Q7NMP2 0.869P2Q7NMP3 0.904
Table 2: Reliability Test Result
Construct Cronbach’s Alpha Coefficient
Perceived Benefits of Blockchain Technology 0.909Relational Mechanism 0.788Organizational Pressure 0.830Organizational Inertia 0.710Inter-Organizational Trust 0.864Inter-Organizational Relationship 0.831Intention to Adopt Blockchain in Supply Chain Process 0.950Mediated Power 0.888Non-Mediated Power 0.835
Multiple Regression was used to analyze the relationship of the Blockchain technology acceptance model. The results showed that non-mediated power has major impact on building inter-organization trust. Mediated power has no impact on inter-organization trust (Table 3).
Table 3: Regression analysis result testing the effect of inter-organization trust
Variable Standardized Coefficients t Sig.
Mediated Power 0.104 1.749 0.082Non-Mediated Power 0.518 8.683 0.000*
*p-value < 0.05
The study found that the inter-organizational trust and organization inertia have major impact on enhancing inter-organizational relationship (Table 4). Finally, factors that have highest impact on acceptance of the Blockchain technology application in the supply chain process of the Thai automotive industry are perceived benefits of Blockchain technology of the personnel in the industry (Table 5). Inter-Organizational Trust also has impact on acceptance. However, Inter-Organizational Relationship has negative impact on acceptance (Table 5).
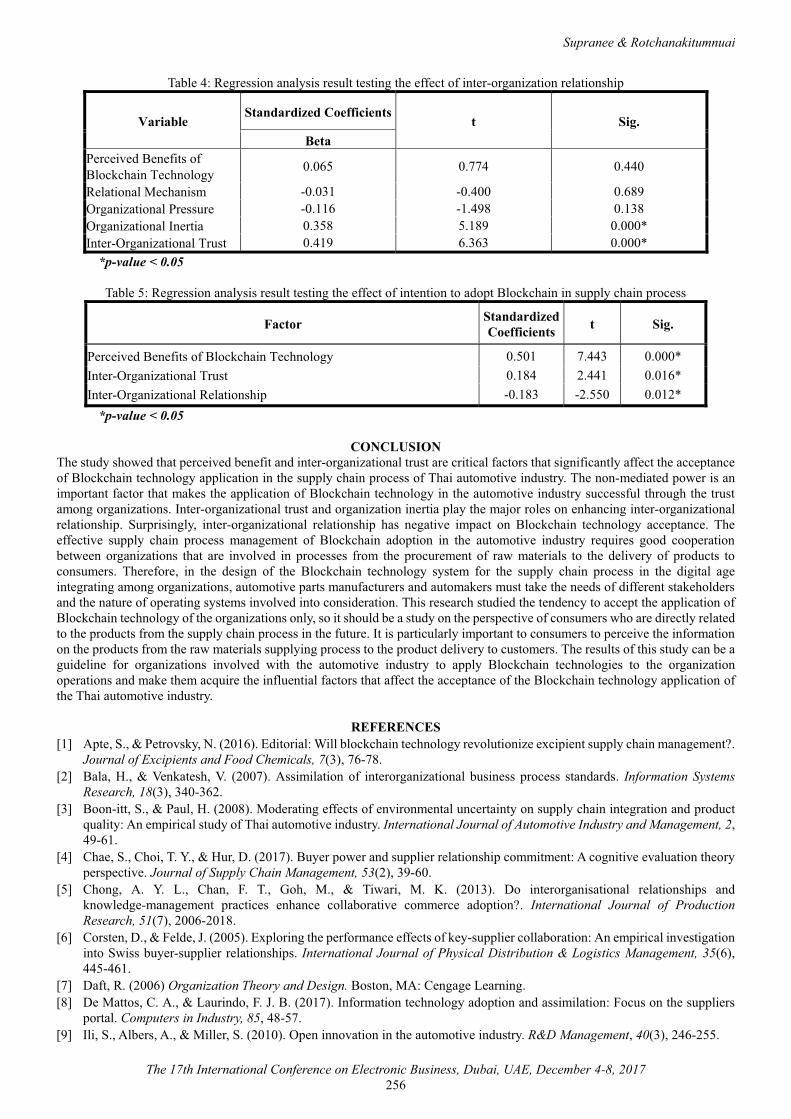
Supranee & Rotchanakitumnuai
The 17th International Conference on Electronic Business, Dubai, UAE, December 4-8, 2017256
Table 4: Regression analysis result testing the effect of inter-organization relationship
VariableStandardized Coefficients
t Sig.Beta
Perceived Benefits of Blockchain Technology 0.065 0.774 0.440
Relational Mechanism -0.031 -0.400 0.689Organizational Pressure -0.116 -1.498 0.138Organizational Inertia 0.358 5.189 0.000*Inter-Organizational Trust 0.419 6.363 0.000*
*p-value < 0.05
Table 5: Regression analysis result testing the effect of intention to adopt Blockchain in supply chain process
Factor Standardized Coefficients t Sig.
Perceived Benefits of Blockchain Technology 0.501 7.443 0.000*Inter-Organizational Trust 0.184 2.441 0.016*Inter-Organizational Relationship -0.183 -2.550 0.012*
*p-value < 0.05
CONCLUSIONThe study showed that perceived benefit and inter-organizational trust are critical factors that significantly affect the acceptance of Blockchain technology application in the supply chain process of Thai automotive industry. The non-mediated power is an important factor that makes the application of Blockchain technology in the automotive industry successful through the trust among organizations. Inter-organizational trust and organization inertia play the major roles on enhancing inter-organizational relationship. Surprisingly, inter-organizational relationship has negative impact on Blockchain technology acceptance. The effective supply chain process management of Blockchain adoption in the automotive industry requires good cooperation between organizations that are involved in processes from the procurement of raw materials to the delivery of products to consumers. Therefore, in the design of the Blockchain technology system for the supply chain process in the digital age integrating among organizations, automotive parts manufacturers and automakers must take the needs of different stakeholders and the nature of operating systems involved into consideration. This research studied the tendency to accept the application of Blockchain technology of the organizations only, so it should be a study on the perspective of consumers who are directly related to the products from the supply chain process in the future. It is particularly important to consumers to perceive the information on the products from the raw materials supplying process to the product delivery to customers. The results of this study can be a guideline for organizations involved with the automotive industry to apply Blockchain technologies to the organization operations and make them acquire the influential factors that affect the acceptance of the Blockchain technology application of the Thai automotive industry.
REFERENCES[1] Apte, S., & Petrovsky, N. (2016). Editorial: Will blockchain technology revolutionize excipient supply chain management?.
Journal of Excipients and Food Chemicals, 7(3), 76-78.[2] Bala, H., & Venkatesh, V. (2007). Assimilation of interorganizational business process standards. Information Systems
Research, 18(3), 340-362.[3] Boon-itt, S., & Paul, H. (2008). Moderating effects of environmental uncertainty on supply chain integration and product
quality: An empirical study of Thai automotive industry. International Journal of Automotive Industry and Management, 2, 49-61.
[4] Chae, S., Choi, T. Y., & Hur, D. (2017). Buyer power and supplier relationship commitment: A cognitive evaluation theory perspective. Journal of Supply Chain Management, 53(2), 39-60.
[5] Chong, A. Y. L., Chan, F. T., Goh, M., & Tiwari, M. K. (2013). Do interorganisational relationships and knowledge-management practices enhance collaborative commerce adoption?. International Journal of Production Research, 51(7), 2006-2018.
[6] Corsten, D., & Felde, J. (2005). Exploring the performance effects of key-supplier collaboration: An empirical investigation into Swiss buyer-supplier relationships. International Journal of Physical Distribution & Logistics Management, 35(6), 445-461.
[7] Daft, R. (2006) Organization Theory and Design. Boston, MA: Cengage Learning.[8] De Mattos, C. A., & Laurindo, F. J. B. (2017). Information technology adoption and assimilation: Focus on the suppliers
portal. Computers in Industry, 85, 48-57.[9] Ili, S., Albers, A., & Miller, S. (2010). Open innovation in the automotive industry. R&D Management, 40(3), 246-255.
Supranee & Rotchanakitumnuai
The 17th International Conference on Electronic Business, Dubai, UAE, December 4-8, 2017257
[10] Ke, W., Liu, H., Wei, K. K., Gu, J., & Chen, H. (2009). How do mediated and non-mediated power affect electronic supply chain management system adoption? The mediating effects of trust and institutional pressures. Decision Support Systems,46(4), 839-851.
[11] Korpela, K., Hallikas, J., & Dahlberg, T. (2017). Digital supply chain transformation toward blockchain integration. InProceedings of the 50th Hawaii International Conference on System Sciences. HICSS, Waikoloa, Hawaii, USA, January01-04.
[12] Lin, T. H., & Lin, I. C. (2014). Factors for information technology acceptance willingness and adoption in logistics industry from supply chain perspectives International Journal of Electronic Business Management, 12(3), 167-177.
[13] Liu, H., Ke, W., Wei, K. K., & Hua, Z. (2015). Influence of power and trust on the intention to adopt electronic supply chain management in China. International Journal of Production Research, 53(1), 70-87.
[14] Nakamoto, S. (2008). Bitcoin: A peer-to-peer electronic cash system. Retrieved from https://bitcoin.org/bitcoin.pdf(October 10, 2017).
[15] Narayanan, S., Marucheck, A. S., & Handfield, R. B. (2009). Electronic data interchange: Research review and future directions Decision Sciences, 40(1), 121-163.
[16] Salam, M. A., & Salam, M. A. (2017). The mediating role of supply chain collaboration on the relationship between technology, trust and operational performance: An empirical investigation. Benchmarking: An International Journal, 24(2), 298-317.
[17] Siba, K., & Prakash, A. (2017). Block-chain: An evolving technology. Global Journal of Enterprise Information System,8(4), 29-35.
[18] Singh, A., & Teng, J. T. (2016). Enhancing supply chain outcomes through information technology and trust. Computers in Human Behavior, 54, 290-300.
[19] Zhao, J. L., Fan, S., & Yan, J. (2016). Overview of business innovations and research opportunities in blockchain and introduction to the special issue. Financial Innovation, 2, 28. https://doi.org/10.1186/s40854-016-0049-2
[20] Zhao, X., Huo, B., Flynn, B. B., & Yeung, J. H. Y. (2008). The impact of power and relationship commitment on the integration between manufacturers and customers in a supply chain. Journal of Operations Management, 26(3), 368-388.
[21] Zyskind, G., & Nathan, O. (2015). Decentralizing privacy: Using blockchain to protect personal data. In Security and Privacy Workshops (SPW 2015) (pp. 180-184). IEEE, San Jose, California, USA, May 21-22.
Meek & Shen
The 17th International Conference on Electronic Business, Dubai, UAE, December 4-8, 2017257
[12] Haines, R., Hough, J., Cao, L., & Haines, D. (2014). Anonymity in computer-mediated communication: More contrarian ideas with less influence. Group Decision and Negotiation, 23(4), 765-786..
[13] Lea, M., Spears, R., & Watt, S. (2007). Visibility and anonymity effects on attraction and group cohesiveness. European Journal of Social Psychology, 37(4), 761-773. doi:10.1002/ejsp.398
[14] Lhotáková, M. (2012). The growing brand equity and brand value–The learnings from most valuable brands. Studia Commercialia Bratislavensia, 5(19), 434-448.
[15] Li, H., Liu, Y., Xu, X., Heikkilä, J., & van der Heijden, H. (2015). Modeling hedonic is continuance through the uses and gratifications theory: An empirical study in online games. Computers in Human Behavior, 48, 261-272. doi:10.1016/j.chb.2015.01.053
[16] Liaw, G. F. (2011). A study on the influence of consumers' participation in a brand community on purchase intention. Journal of International Management Studies, 6(1), Paper 5. Retrieved from http://www.jimsjournal.org/5%20%20Gou-Fong%20Liaw.pdf (10 October 2017)
[17] Lu, X., Phang, C. W. & Yu, J. (2011). Encouraging participation in virtual communities through usability and sociability development: An empirical investigation. ACM SIGMIS Database, 42(3), 96-114.
[18] Meek, S.A. (2016) Understanding influences on the critical-to-success factors in online brand communities. (Doctoral dissertation, Edith Cowan University, Perth, Australia).
[19] Muniz, A. M. & O'Guinn, T. C. (2001). Brand community. Journal of Consumer Research, 27(4), 412-432.[20] Sicilia, M. & Palazón, M. (2008). Brand communities on the Internet: A case study of Coca-Cola's Spanish virtual
community. Corporate Communications: An International Journal, 13(3), 255-270.[21] Spears, R., & Lea, M. (1992). Social influence and the influence of the “social” in computer-mediated communication.
In M. Lea, (Ed.), Contexts of Computer-Mediated Communication. London: Harvester-Wheatsheaf.[22] Sutanto, J. (2013). The effects of network ties on relational social capital and knowledge contribution in virtual local
community. Journal of Global Information Management, 21(3), 42-42. doi:10.4018/jgim.2013070103[23] Tabachnick, B.G., & Fidell, L.S. (2007). Using Multivariate Statistics (5th ed.). Needham Height, MA: Allyn & Bacon.[24] Tashakkori, A., & Teddlie, C. (1998). Mixed Methodology: Combining Qualitative and Quantitative Approaches.
Thousand Oaks, CA: Sage.[25] Tidwell, L. C., & Walther, J. B. (2002). Computer-mediated communication effects on disclosure, impressions, and
interpersonal evaluations: Getting to know one another a bit at a time. Human Communication Research, 28(3), 317-348.[26] Tonteri, L., Kosonen, M., Ellonen, H., & Tarkiainen, A. (2011). Antecedents of an experienced sense of virtual
community. Computers in Human Behavior, 27(6): 2215–23. doi:10.1016/j.chb.2011.06.018. [27] Tsai, W., & Ghoshal, S. (1998). Social capital and value creation: The role of intrafirm networks. Academy of
Management Journal, 41(4), 464-476.[28] Tsai, H., Huang, H., & Chiu, Y. (2012). Brand community participation in Taiwan: Examining the roles of individual-,
group-, and relationship-level antecedents.[29] Walther, J. (1992). Interpersonal effects in computer-Mediated interaction: A relational perspective. Communication
Research, 19(1), 52-52.[30] Wang, H., Chung, J. E., Park, N., McLaughlin, M. L. & Fulk, J. (2012). Understanding online community participation:
A technology acceptance perspective. Communication Research, 39(6), 781-801. [31] Wirtz, J., Den Ambtman, A., Bloemer, J., Horváth, C., Ramaseshan, B., Van De Klundert, J., Gurhan Canli, Z. &
Kandampully, J. (2013). Managing brands and customer engagement in online brand communities. Journal of Service Management, 24(3), 223-244.
[32] Woisetschläger, D. M., Hartleb, V. & Blut, M. (2008). How to make brand communities work: Antecedents and consequences of consumer participation. Journal of Relationship Marketing, 7(3), 237-256.
[33] Yoon, C., & Rolland, E. (2012). Knowledge-sharing in virtual communities: familiarity, anonymity and self-determination theory. Behaviour & Information Technology, 31(11), 1133-1143.
[34] Zhao, L., Lu, Y., Wang, B., Chau, P. Y. & Zhang, L. (2012). Cultivating the sense of belonging and motivating user participation in virtual communities: A social capital perspective. International Journal of Information Management,, 32(6), 574-588.
Meek, S. & Shen, K.N. (2017). The antecedents and outcomes of identifiability in online brand communities. In Proceedings of The 17th International Conference on Electronic Business(pp. xx-xx). ICEB, Dubai, UAE, December 4-8.
Meek & Shen
The 17th International Conference on Electronic Business, Dubai, UAE, December 4-8, 2017258
The Antecedents and Outcomes of Identifiability in Online Brand Communities
Stephanie Meek*, Edith Cowan University, Australia, [email protected] Shen, University of Wollongong, Dubai, [email protected]
ABSTRACTUser generated content is a fundamental aspect of an online brand community (OBC), therefore facilitating the continuance of knowledge sharing and social interaction is imperative to the success of the community. The purpose of this study is to investigate the influence of perceived identifiability on the factors that encourage ongoing participation in OBCs. Results indicate that perceived identifiability has a significant positive influence on an OBC members’ participative behaviour and sense of belonging. Whilst network ties have a significant positive influence on perceived identifiability and a sense of belonging all of which are factors shown to be critical to the ongoing success and sustainability of OBCs.
Keywords: Online brand community, identifiability, participative behaviour, sense of belonging, network ties._____________________*Corresponding author
INTRODUCTIONOnline brand communities (OBCs) are open environments where membership is predominantly free of charge. This means that members can choose to share their knowledge and socialise, therefore by the same token they can choose to leave the community at any given time (Abouzahra & Tan, 2014). User generated content facilitates the continuance of knowledge sharing and social interaction of online communities. Particularly, a review of the literature regarding OBCs highlights several factors as critical to their ongoing success. These are a) having active members who participate regularly in the community (Koh & Kim, 2004; Liaw, 2011; Lu et al., 2011; Meek, 2016), b) having members who have developed a sense of belonging (SOB) to the community (Casalo et al., 2007; Meek, 2016; Sicilia & Palazon, 2008; Woisetschläger et al., 2008), and c) having members who have developed strong network ties with other members in the community (Meek, 2016; Sutanto, 2013).
To encourage participation and attract members, many communities allow people to join without having to provide any personal details, so they remain anonymous to the extent that they use a pseudonym and their true identity remains hidden. Anonymity traditionally refers to the inability of others to identify an individual or for others to identify one’s self (Christopherson 2007) and is a factor that produces a wide range of effects such as participative behaviour (Meek, 2016), autonomy (Yoon & Rolland, 2012), intention to reciprocate (Feng & Ye, 2016) and a sense of belonging in online communities (Lee, 2004; Meek, 2016).
LITERATURE REVIEWThe Social Identity of Deindividuation Effects (SIDE) model suggests in a community environment, where anonymity is the norm and individuals know little about each other, they immerse themselves in the group (Blanchard & Markus, 2004; Blanchard, 2008; Haines, Hough, Cao, & Haines, 2012; Lee, 2004; McCloud, 2000; McKenna, Green, & Gleason, 2002). This increases the relevance of their identity with the group and produces favourable outcomes, such as cohesion with the group or increased sense of community (Blanchard, 2008; Lea, Spears & Watt, 2007; Lea, Spears & de Groot, 2001; Talò, Mannarini & Rochira, 2014; Walther, 1992). SIDE also proposes that when names are made available in a group setting the group’s social identity becomes less important, since the emphasis has shifted to the individual developing a personal identitywithin the community (Blanchard, 2008; Haines et al, 2012). Based on this premise, members in an OBC start off by identifying closely with the community due to their affinity with the brand; however, by contributing regularly they form network ties with other members and over time and through active participation, members become recognisable. Their identity then becomes related to their individual contributions to the community which in turn increases their sense of belonging (Blanchard, 2008).
Social Information Processing theory (SIP) is another interpersonal communication theory used to explain how people in anonymous online environments effectively relate to each other (Mathwick et al., 2008; Walther, 1992). SIP proposes relationships in an online environment have the same basic structure as traditional face-to-face relationships even though they take longer to develop initially, therefore although it takes longer to establish close friendships in an online community, the more their network ties increase the less anonymous members become (Blanchard, 2008). Previous studies also suggest network ties are established between people from diverse backgrounds in online communities due to the lack of physical or verbal cues, which is less likely to occur in face-to-face settings (Mathwick et al., 2008; Walther, 1992).
The Hyperpersonal Model of Relationship Development, builds on the SIDE and SIP models and presupposes people develop more network ties in online communities than in face-to-face situations because computer-mediated communication allows them to portray themselves any way they like (Blanchard, 2008; Walther, 1992). Members of OBCs can choose what
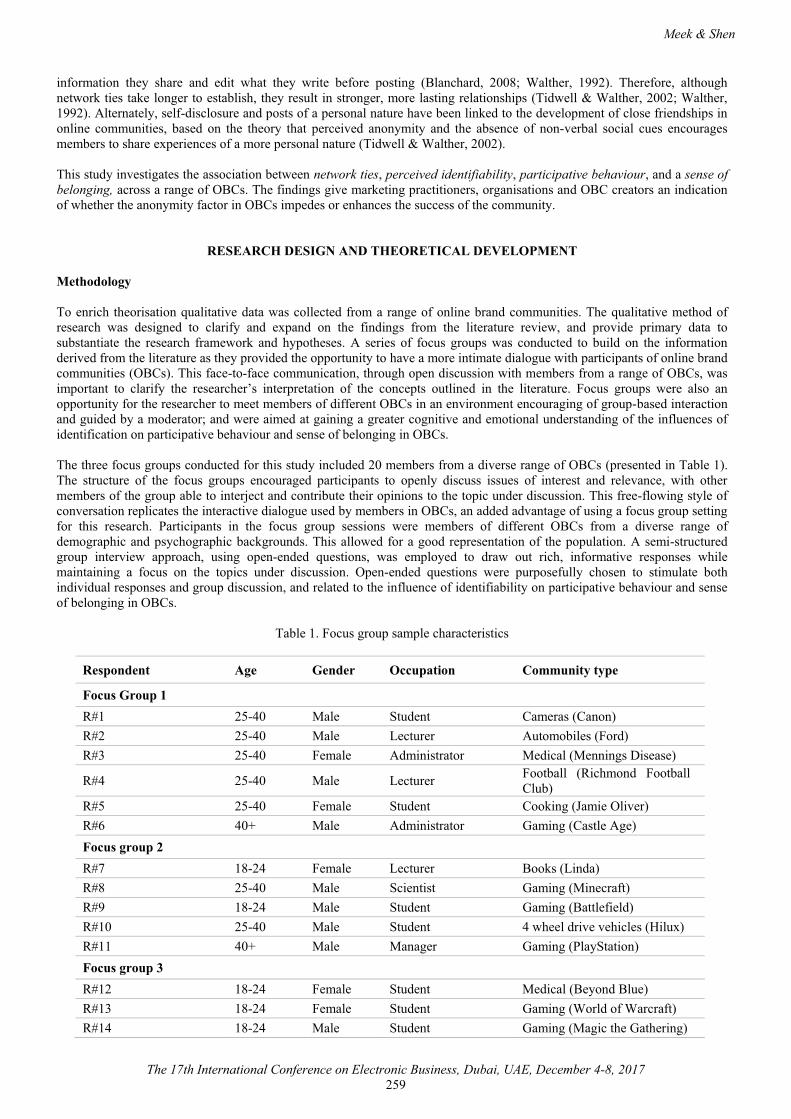
Meek & Shen
The 17th International Conference on Electronic Business, Dubai, UAE, December 4-8, 2017259
information they share and edit what they write before posting (Blanchard, 2008; Walther, 1992). Therefore, although network ties take longer to establish, they result in stronger, more lasting relationships (Tidwell & Walther, 2002; Walther,1992). Alternately, self-disclosure and posts of a personal nature have been linked to the development of close friendships in online communities, based on the theory that perceived anonymity and the absence of non-verbal social cues encourages members to share experiences of a more personal nature (Tidwell & Walther, 2002).
This study investigates the association between network ties, perceived identifiability, participative behaviour, and a sense of belonging, across a range of OBCs. The findings give marketing practitioners, organisations and OBC creators an indication of whether the anonymity factor in OBCs impedes or enhances the success of the community.
RESEARCH DESIGN AND THEORETICAL DEVELOPMENT
Methodology
To enrich theorisation qualitative data was collected from a range of online brand communities. The qualitative method of research was designed to clarify and expand on the findings from the literature review, and provide primary data to substantiate the research framework and hypotheses. A series of focus groups was conducted to build on the information derived from the literature as they provided the opportunity to have a more intimate dialogue with participants of online brand communities (OBCs). This face-to-face communication, through open discussion with members from a range of OBCs, was important to clarify the researcher’s interpretation of the concepts outlined in the literature. Focus groups were also an opportunity for the researcher to meet members of different OBCs in an environment encouraging of group-based interaction and guided by a moderator; and were aimed at gaining a greater cognitive and emotional understanding of the influences of identification on participative behaviour and sense of belonging in OBCs.
The three focus groups conducted for this study included 20 members from a diverse range of OBCs (presented in Table 1). The structure of the focus groups encouraged participants to openly discuss issues of interest and relevance, with other members of the group able to interject and contribute their opinions to the topic under discussion. This free-flowing style of conversation replicates the interactive dialogue used by members in OBCs, an added advantage of using a focus group setting for this research. Participants in the focus group sessions were members of different OBCs from a diverse range of demographic and psychographic backgrounds. This allowed for a good representation of the population. A semi-structured group interview approach, using open-ended questions, was employed to draw out rich, informative responses while maintaining a focus on the topics under discussion. Open-ended questions were purposefully chosen to stimulate both individual responses and group discussion, and related to the influence of identifiability on participative behaviour and sense of belonging in OBCs.
Table 1. Focus group sample characteristics
Respondent Age Gender Occupation Community type
Focus Group 1R#1 25-40 Male Student Cameras (Canon)R#2 25-40 Male Lecturer Automobiles (Ford)R#3 25-40 Female Administrator Medical (Mennings Disease)
R#4 25-40 Male Lecturer Football (Richmond Football Club)
R#5 25-40 Female Student Cooking (Jamie Oliver)R#6 40+ Male Administrator Gaming (Castle Age)Focus group 2R#7 18-24 Female Lecturer Books (Linda)R#8 25-40 Male Scientist Gaming (Minecraft)R#9 18-24 Male Student Gaming (Battlefield)R#10 25-40 Male Student 4 wheel drive vehicles (Hilux)R#11 40+ Male Manager Gaming (PlayStation)Focus group 3R#12 18-24 Female Student Medical (Beyond Blue)R#13 18-24 Female Student Gaming (World of Warcraft)R#14 18-24 Male Student Gaming (Magic the Gathering)

Meek & Shen
The 17th International Conference on Electronic Business, Dubai, UAE, December 4-8, 2017260
R#15 18-24 Male Student Entertainment (Sony)R#16 18-24 Female Student Gaming (Grand Theft Auto)R#17 18-24 Female Student Books (Amazon)R#18 18-24 Male Student Gaming (PlayStation)R#19 18-24 Female Student Fashion (LookBook)R#20 18-24 Male Student Gaming (PlayStation)
Focus Group Findings
When asked how identifiable members felt they were, and how their level of anonymity affected their behaviour, several participants in the focus groups commented that although they were anonymous they had become recognisable over time, not only from their pseudonyms but as part of a small network of close friends. This corresponds with the Social Identity Model of Deindividuation (SIDE), and suggests in a group environment, anonymity increases members’ identity with the group and produces favourable outcomes, such as cohesion with the group or an increased sense of community (Spears & Lea, 1992; Walther, 1992). The following quotes illustrate how anonymity was no longer relevant for several respondents. Their observations imply, they had become well known within the community through active participation and considered themselves part of the group. This supports the idea that the more identifiable members are, the more they participate and thestronger their sense of belonging.
I’ve been in the Magic (Magic the Gathering) forum for years, I play with the same group I chat with, they know me. I’m going to a tournament next year with some of them (R#14).
It doesn’t mean anything. We all know each other, we’re in a team, it’s just a stupid name, like a…nickname it’s what you talk about and how you play the game they know you by (R#13).
I was in a community of people who had mods that had been going on for years; people knew the characters that made those mods, so they were well known by everyone in the community (R#8).
Yeah! You have people who are constantly on the forum and constantly asking questions, they end up with tens of thousands of posts and become forum personalities that everyone knows (R#9).
It was also apparent from respondents’ comments that anonymity reduces social or cultural cues, allowing friendships to develop based on people’s contributions to the community, rather than their background or status outside the community. This is akin to Social Information Processing theory (SIP), where the lack of physical or verbal cues helps to bridge the cultural divide, resulting in the development of close network ties and increased participative behaviour (Mathwick et al., 2008; Walther, 1992), and is reflected in the following quotes from respondents:
I know people from all over, it doesn’t matter where they come from the community is a good place to meet up. Yeah! Now we’re friends. (R#9).
I didn’t know anyone to start but made friends over time, in fact the people I’m friends with now I probably would never have talked to if I hadn’t joined this community (R#15).
Other participants suggested using a pseudonym gave them a sense of anonymity, and subsequently the freedom to express themselves without worrying about being recognised outside the forum. For example, one participant in the first focus group offered this explanation when asked how using a pseudonym had affected his participative behaviour:
I don’t feel confident to speak face to face all the time, anonymity allows for more open discussion, in front of someone it’s harder to say things, but online I can write it (R#1).We are being judged but there is a disconnection (R#11).
Both observations by R#1 and R#11 correspond with Best and Kreuger (2006) and Lea et al., (2001, p. 528) who argued that being anonymous “decreases attention to others, reduces concerns about being positively evaluated by others, and creates an impersonal, task-oriented focus for group interaction”.
The qualitative research demonstrates that members of OBCs become known to each other through the network ties they develop and their contributions to the community. In the focus groups several participants suggested they were not consideredanonymous anymore because they all knew each other well based on the history of their interactions and ongoing participation in the community. This suggests that anonymity gives individuals the freedom to participate in an OBC and the more identifiable members of OBCs are, the more they will participate which enhances their sense of belonging.
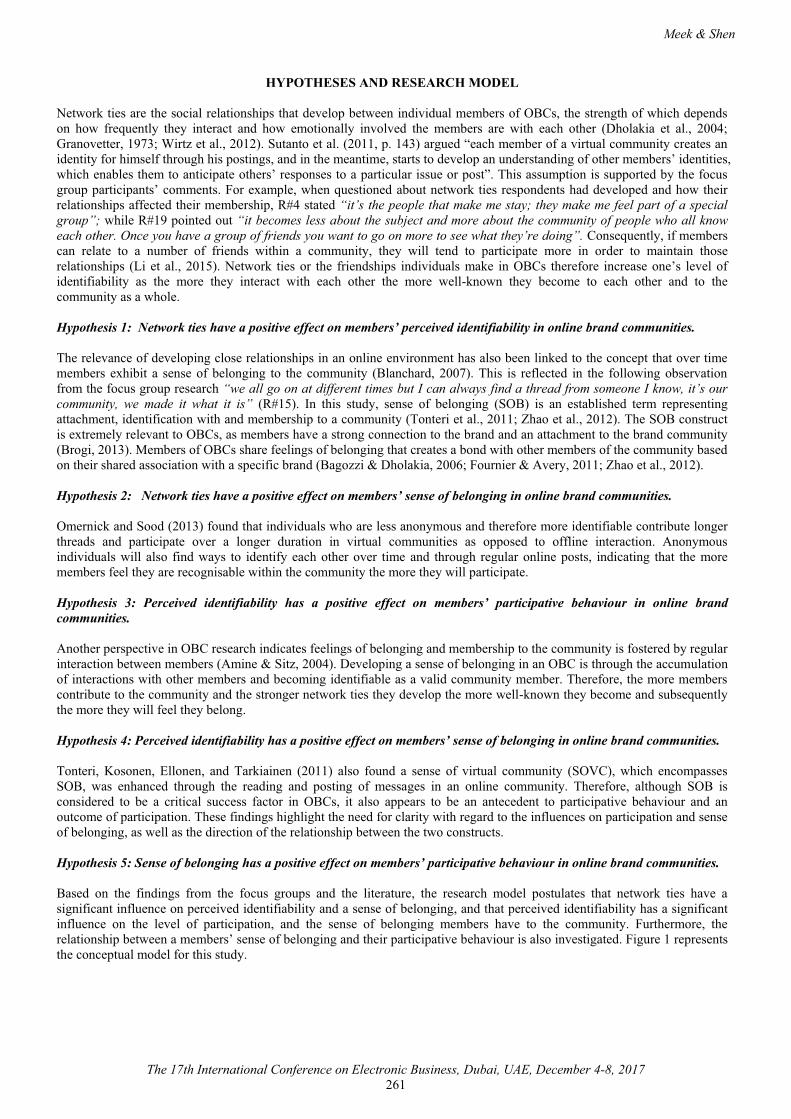
Meek & Shen
The 17th International Conference on Electronic Business, Dubai, UAE, December 4-8, 2017261
HYPOTHESES AND RESEARCH MODEL
Network ties are the social relationships that develop between individual members of OBCs, the strength of which depends on how frequently they interact and how emotionally involved the members are with each other (Dholakia et al., 2004; Granovetter, 1973; Wirtz et al., 2012). Sutanto et al. (2011, p. 143) argued “each member of a virtual community creates an identity for himself through his postings, and in the meantime, starts to develop an understanding of other members’ identities, which enables them to anticipate others’ responses to a particular issue or post”. This assumption is supported by the focus group participants’ comments. For example, when questioned about network ties respondents had developed and how their relationships affected their membership, R#4 stated “it’s the people that make me stay; they make me feel part of a special group”; while R#19 pointed out “it becomes less about the subject and more about the community of people who all know each other. Once you have a group of friends you want to go on more to see what they’re doing”. Consequently, if members can relate to a number of friends within a community, they will tend to participate more in order to maintain those relationships (Li et al., 2015). Network ties or the friendships individuals make in OBCs therefore increase one’s level of identifiability as the more they interact with each other the more well-known they become to each other and to the community as a whole.
Hypothesis 1: Network ties have a positive effect on members’ perceived identifiability in online brand communities.
The relevance of developing close relationships in an online environment has also been linked to the concept that over time members exhibit a sense of belonging to the community (Blanchard, 2007). This is reflected in the following observation from the focus group research “we all go on at different times but I can always find a thread from someone I know, it’s our community, we made it what it is” (R#15). In this study, sense of belonging (SOB) is an established term representing attachment, identification with and membership to a community (Tonteri et al., 2011; Zhao et al., 2012). The SOB construct is extremely relevant to OBCs, as members have a strong connection to the brand and an attachment to the brand community (Brogi, 2013). Members of OBCs share feelings of belonging that creates a bond with other members of the community based on their shared association with a specific brand (Bagozzi & Dholakia, 2006; Fournier & Avery, 2011; Zhao et al., 2012).
Hypothesis 2: Network ties have a positive effect on members’ sense of belonging in online brand communities.
Omernick and Sood (2013) found that individuals who are less anonymous and therefore more identifiable contribute longer threads and participate over a longer duration in virtual communities as opposed to offline interaction. Anonymous individuals will also find ways to identify each other over time and through regular online posts, indicating that the more members feel they are recognisable within the community the more they will participate.
Hypothesis 3: Perceived identifiability has a positive effect on members’ participative behaviour in online brand communities.
Another perspective in OBC research indicates feelings of belonging and membership to the community is fostered by regular interaction between members (Amine & Sitz, 2004). Developing a sense of belonging in an OBC is through the accumulation of interactions with other members and becoming identifiable as a valid community member. Therefore, the more members contribute to the community and the stronger network ties they develop the more well-known they become and subsequently the more they will feel they belong.
Hypothesis 4: Perceived identifiability has a positive effect on members’ sense of belonging in online brand communities.
Tonteri, Kosonen, Ellonen, and Tarkiainen (2011) also found a sense of virtual community (SOVC), which encompasses SOB, was enhanced through the reading and posting of messages in an online community. Therefore, although SOB is considered to be a critical success factor in OBCs, it also appears to be an antecedent to participative behaviour and an outcome of participation. These findings highlight the need for clarity with regard to the influences on participation and sense of belonging, as well as the direction of the relationship between the two constructs.
Hypothesis 5: Sense of belonging has a positive effect on members’ participative behaviour in online brand communities.
Based on the findings from the focus groups and the literature, the research model postulates that network ties have a significant influence on perceived identifiability and a sense of belonging, and that perceived identifiability has a significant influence on the level of participation, and the sense of belonging members have to the community. Furthermore, the relationship between a members’ sense of belonging and their participative behaviour is also investigated. Figure 1 represents the conceptual model for this study.
Meek & Shen
The 17th International Conference on Electronic Business, Dubai, UAE, December 4-8, 2017262
Figure 1. Conceptual research model
DISCUSSION
There has been a rapid increase in the number of OBCs over the last decade, prompting an interest from marketers and scholars in the field of online consumer behaviour, yet little empirical research has been undertaken specifically related toOBCs (Li eta l, 2013; Lhotáková, 2011). To date studies have mainly focused on virtual communities in general. However, OBCs encompass a consumer-brand-consumer triad (Muniz & O’Guinn, 2001) and uniqueness that differentiates them from other types of online communities. Studies show the more members communicate with each other online the more they feel connected to the community and the brand around which the community revolves (Liaw, 2011; Koh & Kim, 2004). Because members of OBCs participate voluntarily in a community, they choose their level of participation depending on their objectives and the influences that shape their online experience (Bateman et al., 2011; Tsai, Huang & Chiu, 2012). Therefore, if members develop network ties with other members there is a higher chance that they will continue to involve themselves in the community over the long term.
Findings from the qualitative research in this study indicate that the more identifiable members are in the community the more they participate, and develop a sense of belonging. This is consistent with Doolittle and MacDonald (1978) who suggest that when people in a community interact with each other they develop a feeling of safety and belonging that reduces their perceived anonymity. In this way the feeling of being recognised in the group encourages continued participation in the community. Furthermore, as members became better known in the community and have developed mutual associations or network ties with others, regardless of their initial motive for participating, their sense of belonging increases as they develop attachments to more people. Although anonymity may be of benefit to new members by giving them the confidence to join into conversations or browse without making any contributions, as they become more committed to the community they like to be recognised by other members. Therefore, being less anonymous or more identifiable through contributions to the community will increase their sense of belonging.
FURTHER RESEARCHFuture research into the influence of identifiability in OBCs could explore comparisons between company-initiated OBCs and consumer-initiated OBCs, and the level of anonymity required for membership to the community. The role of moderators in OBCs would also be an interesting theme for research as there are differences between successful and unsuccessful OBCs that may have some relevance to the way they are managed and the administrative teams’ objectives.
REFERENCES[1] Abouzahra, M. & Tan, J. (2014). The effect of community type on knowledge sharing incentives in online communities:
A meta-analysis. In The 47th Hawaii International Conference on System Sciences (HICSS) (pp.1765-1773). IEEE,Waikoloa, HI, USA, January 6-9.
[2] Algesheimer, R., Dholakia, U., & Herrmann, A. (2005). The social influence of brand community: Evidence from European car clubs. Journal of Marketing, 69(3), 19-34.
[3] Bateman, P.J., Gray, P.H. & Butler, B.S. (2011). Research Note—The impact of community commitment on participation in online communities. Information Systems Research, 22(4), 841–854.
[4] Blanchard, A. L. & Markus, M.L. (2004). The experienced ‘sense’ of a virtual community: Characteristics and processes. Database for Advances in Information Systems, 35(1), 65–79.
[5] Blanchard, A. (2008). Testing a model of sense of virtual community. Computers in Human Behavior, 24(5), 2107-2123. doi:10.1016/j.chb.2007.10.002.
[6] Casaló, L., Flavián, C. & Guinalíu, M. (2007). The impact of participation in virtual brand communities on consumer trust and loyalty: The case of free software. Online Information Review, 31(6), 775-792.
[7] Chiu, C.M., Hsu, M.H. & Wang, E.T.G. (2006). Understanding knowledge sharing in virtual communities: An integration of social capital and social cognitive theories. Decision Support Systems, 42(3), 1872-1888.
H4
H1
H3H2
H5Sense ofbelonging
Perceived Identifiability
Network ties
Participative behaviour
Meek & Shen
The 17th International Conference on Electronic Business, Dubai, UAE, December 4-8, 2017263
[8] Christopherson, K. M. (2007). The positive and negative implications of anonymity in internet social interactions: Onthe internet, nobody knows you’re a dog. Computers in Human Behavior, 23(6), 3038–3056. doi: 10.1016/j.chb.2006.09.001.
[9] Dholakia, U., Bagozzi, R. & Pearo, L. (2004). A social influence model of consumer participation in network-and small-group-based virtual communities. International Journal of Research in Marketing, 21(3), 241-263
[10] Doolittle, R. J., & MacDonald D. (1978). Communication and a sense of community in a metropolitan neighborhood: A factor analytic examination. Communication Quarterly, 26(3), 2-7.
[11] Granovetter, M. (1992). Problems of explanation in economic sociology. In N. Nohria & R. Eccles (Eds.), Networks and Organizations: Structure, Form and Action (pp. 25–56). Boston, MA: Harvard Business School Press.
[12] Haines, R., Hough, J., Cao, L., & Haines, D. (2014). Anonymity in computer-mediated communication: More contrarian ideas with less influence. Group Decision and Negotiation, 23(4), 765-786..
[13] Lea, M., Spears, R., & Watt, S. (2007). Visibility and anonymity effects on attraction and group cohesiveness. European Journal of Social Psychology, 37(4), 761-773. doi:10.1002/ejsp.398
[14] Lhotáková, M. (2012). The growing brand equity and brand value–The learnings from most valuable brands. Studia Commercialia Bratislavensia, 5(19), 434-448.
[15] Li, H., Liu, Y., Xu, X., Heikkilä, J., & van der Heijden, H. (2015). Modeling hedonic is continuance through the uses and gratifications theory: An empirical study in online games. Computers in Human Behavior, 48, 261-272. doi:10.1016/j.chb.2015.01.053
[16] Liaw, G. F. (2011). A study on the influence of consumers' participation in a brand community on purchase intention. Journal of International Management Studies, 6(1), Paper 5. Retrieved from http://www.jimsjournal.org/5%20%20Gou-Fong%20Liaw.pdf (10 October 2017)
[17] Lu, X., Phang, C. W. & Yu, J. (2011). Encouraging participation in virtual communities through usability and sociability development: An empirical investigation. ACM SIGMIS Database, 42(3), 96-114.
[18] Meek, S.A. (2016) Understanding influences on the critical-to-success factors in online brand communities. (Doctoral dissertation, Edith Cowan University, Perth, Australia).
[19] Muniz, A. M. & O'Guinn, T. C. (2001). Brand community. Journal of Consumer Research, 27(4), 412-432.[20] Sicilia, M. & Palazón, M. (2008). Brand communities on the Internet: A case study of Coca-Cola's Spanish virtual
community. Corporate Communications: An International Journal, 13(3), 255-270.[21] Spears, R., & Lea, M. (1992). Social influence and the influence of the “social” in computer-mediated communication.
In M. Lea, (Ed.), Contexts of Computer-Mediated Communication. London: Harvester-Wheatsheaf.[22] Sutanto, J. (2013). The effects of network ties on relational social capital and knowledge contribution in virtual local
community. Journal of Global Information Management, 21(3), 42-42. doi:10.4018/jgim.2013070103[23] Tabachnick, B.G., & Fidell, L.S. (2007). Using Multivariate Statistics (5th ed.). Needham Height, MA: Allyn & Bacon.[24] Tashakkori, A., & Teddlie, C. (1998). Mixed Methodology: Combining Qualitative and Quantitative Approaches.
Thousand Oaks, CA: Sage.[25] Tidwell, L. C., & Walther, J. B. (2002). Computer-mediated communication effects on disclosure, impressions, and
interpersonal evaluations: Getting to know one another a bit at a time. Human Communication Research, 28(3), 317-348.[26] Tonteri, L., Kosonen, M., Ellonen, H., & Tarkiainen, A. (2011). Antecedents of an experienced sense of virtual
community. Computers in Human Behavior, 27(6): 2215–23. doi:10.1016/j.chb.2011.06.018. [27] Tsai, W., & Ghoshal, S. (1998). Social capital and value creation: The role of intrafirm networks. Academy of
Management Journal, 41(4), 464-476.[28] Tsai, H., Huang, H., & Chiu, Y. (2012). Brand community participation in Taiwan: Examining the roles of individual-,
group-, and relationship-level antecedents.[29] Walther, J. (1992). Interpersonal effects in computer-Mediated interaction: A relational perspective. Communication
Research, 19(1), 52-52.[30] Wang, H., Chung, J. E., Park, N., McLaughlin, M. L. & Fulk, J. (2012). Understanding online community participation:
A technology acceptance perspective. Communication Research, 39(6), 781-801. [31] Wirtz, J., Den Ambtman, A., Bloemer, J., Horváth, C., Ramaseshan, B., Van De Klundert, J., Gurhan Canli, Z. &
Kandampully, J. (2013). Managing brands and customer engagement in online brand communities. Journal of Service Management, 24(3), 223-244.
[32] Woisetschläger, D. M., Hartleb, V. & Blut, M. (2008). How to make brand communities work: Antecedents and consequences of consumer participation. Journal of Relationship Marketing, 7(3), 237-256.
[33] Yoon, C., & Rolland, E. (2012). Knowledge-sharing in virtual communities: familiarity, anonymity and self-determination theory. Behaviour & Information Technology, 31(11), 1133-1143.
[34] Zhao, L., Lu, Y., Wang, B., Chau, P. Y. & Zhang, L. (2012). Cultivating the sense of belonging and motivating user participation in virtual communities: A social capital perspective. International Journal of Information Management,, 32(6), 574-588.
Rotchanakitumnuai S. (2017). The multi-channel e-service quality for Thai electronic tourism. In Proceedings of The 17th International Conference on Electronic Business (pp. 258-265). ICEB, Dubai, UAE, December 4-8.
Rotchanakitumnuai
The 17th International Conference on Electronic Business, Dubai, UAE, December 4-8, 2017264
The Multi-Channel E-Service Quality for Thai Electronic Tourism
Siriluck Rotchanakitumnuai,Thammasat Business School, Thammasat University, Thailand
ABSTRACTThis research identifies the multi-channel electronic service quality of Thai e-tourism including various online channels such as websites, social networks, smartphones, and Internet of Things, and their impact on cognitive image. The analysis of the factors of electronic tourism based on the survey from Thai and foreign tourists, the service quality of multichannel E-tourism consists of 8factors: tangibility, responsiveness, reliability, trust, accessibility, ease of use, real time IoT, and security. The results of the study showed that the tourists considered the service quality via the Internet of Things technology important because of immediate responsiveness through devices and applications which can create cognitive and affective image.
Keywords: E-service quality, multi-channel e-service quality, e-tourism, cognitive image
INTRODUCTIONElectronic tourism (E-Tourism) provides faster service to customers, generates more income, and reduces costs. E-tourism provides tourist information and services, makes contacts, shares information, and publishes video clips and pictures anytime and anywhere. These advantages of E-Tourism are considerably important to the tourism industry relating to services that can be provided directly to tourists in a digital format (Buhalis & Law, 2008). Tourists prefer E-Tourism to search for information and services from websites, exchange viewpoints via social networks, and use other tourist services. Tourists are able to search for information, make contactsfor choosing places to go through various channels. The Internet of Things is a technology that allows the connection of devices and to intelligently manage a service process automatically with minimum human intervention. The Internet of Things also connects E-Tourism applications to communicate with destinations and services, for example tourist attractions, restaurants, geography, and weather. This technology is very beneficial to tourists and related businesses by adding value and optimizingbusiness operations (Buhalis & Amaranggana, 2014). The IoT is very crucial to support a “Smart Tourism Destination”. It requiresinfrastructure that supports the connection of information technology and communications with digital tools and the devices of tourists in order to facilitate the search for information, improve resource management, and create an impressive travel experience for tourists (Chui et al. 2010).
The government plays an important role to formulate a policy and plans to change a tourist city into a “Smart Tourism Destination”. The Thai government has proposed investment to stimulate a continuous growth of the tourism industry in the future. This goal is a challenge for the government and agencies concerned because many countries are developing their tourist attractions and implementing smart cities as well. Tourism is one of the major sectors for Thailand and requires a continuous growth. The government needs to constantly promote tourism as one of the five main strategies of the tourism development plan, in particular increasing the quality of Thai E-Tourism to create the positive image of tourism to Thai and foreign tourists.
The objective of this research is to identify the feature of the electronic service quality of Thai e-tourism including various online channels such as websites, social networks, and smartphones. It includes the service quality via the Internet of Things. The impact of multi-channel service quality factors on cognitive image was investigated.
LITERATURE REVIEWElectronic Service Quality (E-Service Quality)The concept of service quality has been studied for a long time, particularly the SERVQUAL Model by Parasuraman et al. (1985) that assessed the attitude of consumers or users toward the service quality of human service providers. There are 10 factors determining service quality including reliability, responsiveness, competence, access, courtesy, communication, credibility, security, tangibles, and customer understanding. Grönroos (1994) adopted two main factors to evaluate a service quality, functional and technical quality.
Rotchanakitumnuai
The 17th International Conference on Electronic Business, Dubai, UAE, December 4-8, 2017265
The Internet has been used to provide customers with services ranging from the creation of an organization’s website to give information and services to customers to the website and further formation of an organization’s social networks to communicatewith customers and members of the network (Beldona & Cai, 2006; Bevanda et al. 2008; Chow & Sheung, 2008; Ho & Lee, 2007; Shchiglik & Barnes, 2004). Service quality has been applied to services via the Internet or the electronic service delivery such as the E-S-QUAL (Parasuraman et al. 2005), the SITEQUAL Model (Yoo & Donthu, 2001) and the e-SQ Modelet al. (Zeithaml et al. 2002). However, the results of this research somewhat vary. Some researches studied only some aspects of service quality such as a quality of information (Barnes & Vidgen, 2003; Lee & Lin, 2005; Lu et al. 2012; Parasuraman et al. 2005). Others focused only the quality of information and technology (Ranganathan and Ganapathy, 2002). Rotchanakitumnuai (2008) studied features of the whole process of electronic service including integrated website design, service design, technology, and customer service quality. In terms of e-tourism, Babu and Subramoniam (2015) analyzed the quality of E-tourism through websites using SERVQUAL including reliability, access, responsiveness, ease of use, security, tangibles, trust, personalization, credibility, and empathy. In past studies, the quality of multichannel electronic service in the tourism industry has not been studied yet.
Multichannel e-service qualityMultichannel e-service quality is assessed by tourists or users of online channels including websites, social networks, mobile phones, email, etc. (Chatterjee, 2010; Sousa. & Voss, 2011; Vesa & Heck, 2005). Currently, the Internet of Things Technology has become a fast and convenient channel of communication and information search for tourists via mobile devices. However, the management of multichannel electronic service quality becomes essential to the country’s image and benefits for the tourism industry (Choi & Kimes, 2002; Lai, 2010; Pearce, 2009; Pearce & Taniguchi, 2008). Multichannel e-service quality is an overall quality evaluated by the tourists through online channels such as websites, social networks, mobile phones, and email. This research will identify the service quality of multichannel electronic service delivery. The importance of the Internet of Things inproviding quality online information and service delivery to tourists is considered.
The Internet of ThingsInformation technology and the Internet have been employed in the service industry, particularly in the tourism industry, especially wireless communication system and mobile devices which are widely used. The link between tourists and the cyber world has moved forward to a connection without human beings which is called “Cyber-Physical System (CPS)”. This means communications can be done through information technology and communications. The Internet of Things is one of the CPS technologies. The Internet of Things Technology helps the connection of operations of devices able to work autonomously and more intelligentlywith less human intervention. The IoT also creates a connection of the Internet to communicate with the external systems and activities that are processed and calculated automatically. For example, the Internet of Things consisting of RFID (Radio Frequency Identification) and Sensors embedded in devices connected to the Internet to exchange information. The Internet of Things brings about considerable benefits to the logistics business, production control, environment control, climate forecast and healthcare because the IoT can communicate from device to device or from device to human beings. For the tourism industry, the IoT can improve the process of services to be more productive, for instance, an application that provides real-time tourist information and location-based services to identify attractive destinations or restaurants nearby (Buhalis & Amaranggana, 2014; Buhalis & Law, 2008).
Cognitive and Affective ImageCognitive evaluation refers to beliefs and knowledge about an object whereas affective evaluation refers to feelings about the object (Baloglu & Brinberg, 1997; Lee & Lijia, 2011). Cognitive destination image can be measured based upon images of natural environment, built environment and technology, socially responsible environment (Baloglu & Brinberg, 1997). In the tourism literature, cognitive and affective destination image is the antecedent of destination behavior, which in turn affects tourist’ behavioral intentions towards the destination.
RESEARCH METHODOLOGYThis research project collected data from a sample of Thai and foreign tourists. Judgment sampling was used by selecting the behavior of tourists who searched for travel information from the Internet or used travel services through the Internet. The questions were developed from the literature review. The items were reviewed and tested by e-commerce experts. The edited questionnaire
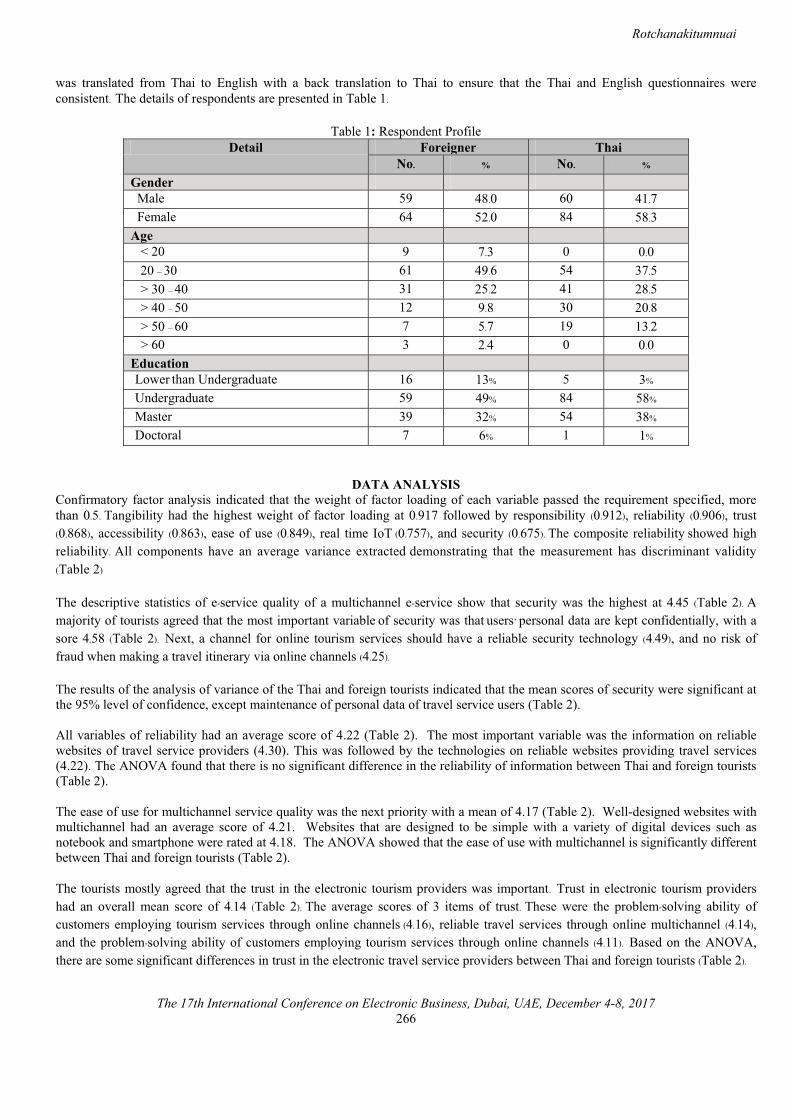
Rotchanakitumnuai
The 17th International Conference on Electronic Business, Dubai, UAE, December 4-8, 2017266
was translated from Thai to English with a back translation to Thai to ensure that the Thai and English questionnaires were consistent. The details of respondents are presented in Table 1.
Table 1: Respondent ProfileDetail Foreigner Thai
No. % No. %Gender Male 59 48.0 60 41.7 Female 64 52.0 84 58.3Age < 20 9 7.3 0 0.0 20 – 30 61 49.6 54 37.5 > 30 – 40 31 25.2 41 28.5 > 40 – 50 12 9.8 30 20.8 > 50 – 60 7 5.7 19 13.2 > 60 3 2.4 0 0.0Education Lower than Undergraduate 16 13% 5 3% Undergraduate 59 49% 84 58% Master 39 32% 54 38% Doctoral 7 6% 1 1%
DATA ANALYSISConfirmatory factor analysis indicated that the weight of factor loading of each variable passed the requirement specified, more than 0.5. Tangibility had the highest weight of factor loading at 0.917 followed by responsibility (0.912), reliability (0.906), trust (0.868), accessibility (0.863), ease of use (0.849), real time IoT (0.757), and security (0.675). The composite reliability showed high reliability. All components have an average variance extracted demonstrating that the measurement has discriminant validity (Table 2)
The descriptive statistics of e-service quality of a multichannel e-service show that security was the highest at 4.45 (Table 2). A majority of tourists agreed that the most important variable of security was that users’ personal data are kept confidentially, with asore 4.58 (Table 2). Next, a channel for online tourism services should have a reliable security technology (4.49), and no risk of fraud when making a travel itinerary via online channels (4.25).
The results of the analysis of variance of the Thai and foreign tourists indicated that the mean scores of security were significant at the 95% level of confidence, except maintenance of personal data of travel service users (Table 2).
All variables of reliability had an average score of 4.22 (Table 2). The most important variable was the information on reliable websites of travel service providers (4.30). This was followed by the technologies on reliable websites providing travel services (4.22). The ANOVA found that there is no significant difference in the reliability of information between Thai and foreign tourists(Table 2).
The ease of use for multichannel service quality was the next priority with a mean of 4.17 (Table 2). Well-designed websites with multichannel had an average score of 4.21. Websites that are designed to be simple with a variety of digital devices such as notebook and smartphone were rated at 4.18. The ANOVA showed that the ease of use with multichannel is significantly different between Thai and foreign tourists (Table 2).
The tourists mostly agreed that the trust in the electronic tourism providers was important. Trust in electronic tourism providers had an overall mean score of 4.14 (Table 2). The average scores of 3 items of trust. These were the problem-solving ability of customers employing tourism services through online channels (4.16), reliable travel services through online multichannel (4.14), and the problem-solving ability of customers employing tourism services through online channels (4.11). Based on the ANOVA, there are some significant differences in trust in the electronic travel service providers between Thai and foreign tourists (Table 2).
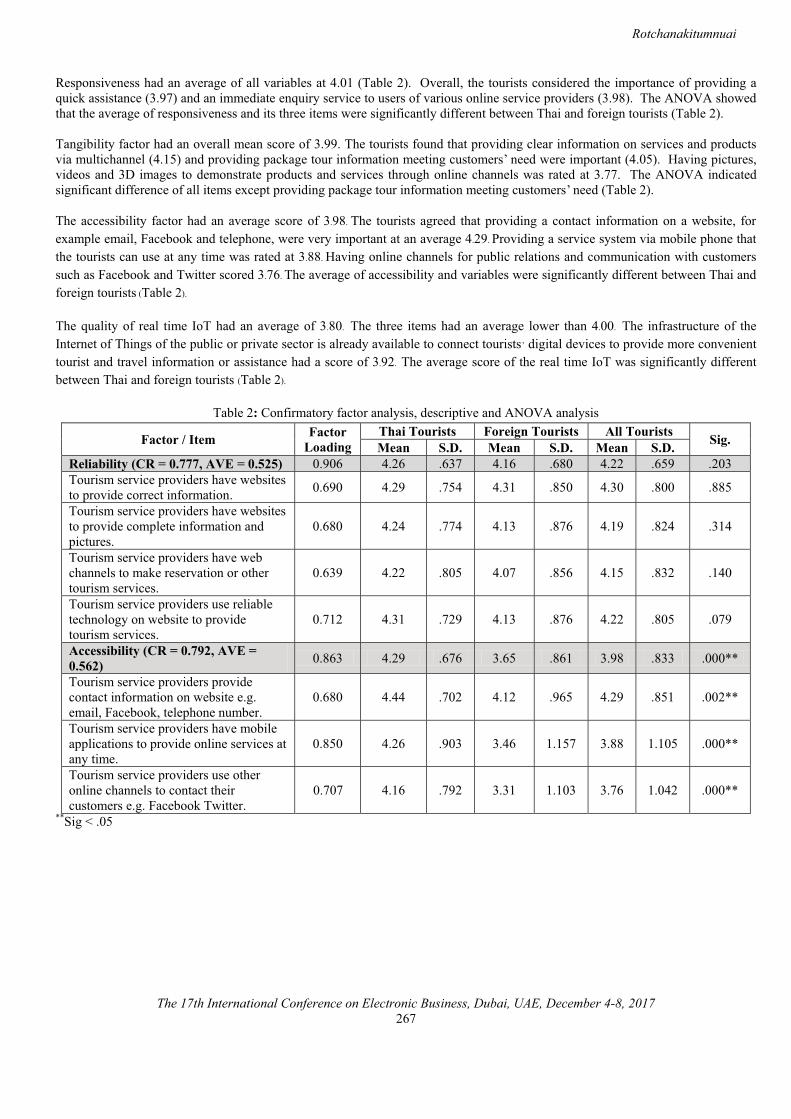
Rotchanakitumnuai
The 17th International Conference on Electronic Business, Dubai, UAE, December 4-8, 2017267
Responsiveness had an average of all variables at 4.01 (Table 2). Overall, the tourists considered the importance of providing a quick assistance (3.97) and an immediate enquiry service to users of various online service providers (3.98). The ANOVA showed that the average of responsiveness and its three items were significantly different between Thai and foreign tourists (Table 2).
Tangibility factor had an overall mean score of 3.99. The tourists found that providing clear information on services and products via multichannel (4.15) and providing package tour information meeting customers’ need were important (4.05). Having pictures, videos and 3D images to demonstrate products and services through online channels was rated at 3.77. The ANOVA indicated significant difference of all items except providing package tour information meeting customers’ need (Table 2).
The accessibility factor had an average score of 3.98. The tourists agreed that providing a contact information on a website, for example email, Facebook and telephone, were very important at an average 4.29. Providing a service system via mobile phone that the tourists can use at any time was rated at 3.88. Having online channels for public relations and communication with customers such as Facebook and Twitter scored 3.76. The average of accessibility and variables were significantly different between Thai and foreign tourists (Table 2).
The quality of real time IoT had an average of 3.80. The three items had an average lower than 4.00. The infrastructure of the Internet of Things of the public or private sector is already available to connect tourists’ digital devices to provide more convenient tourist and travel information or assistance had a score of 3.92. The average score of the real time IoT was significantly different between Thai and foreign tourists (Table 2).
Table 2: Confirmatory factor analysis, descriptive and ANOVA analysis
**Sig < .05
Factor / Item Factor Loading
Thai Tourists Foreign Tourists All Tourists Sig.Mean S.D. Mean S.D. Mean S.D.Reliability (CR = 0.777, AVE = 0.525) 0.906 4.26 .637 4.16 .680 4.22 .659 .203Tourism service providers have websites to provide correct information. 0.690 4.29 .754 4.31 .850 4.30 .800 .885
Tourism service providers have websites to provide complete information and pictures.
0.680 4.24 .774 4.13 .876 4.19 .824 .314
Tourism service providers have web channels to make reservation or other tourism services.
0.639 4.22 .805 4.07 .856 4.15 .832 .140
Tourism service providers use reliable technology on website to provide tourism services.
0.712 4.31 .729 4.13 .876 4.22 .805 .079
Accessibility (CR = 0.792, AVE =0.562) 0.863 4.29 .676 3.65 .861 3.98 .833 .000**
Tourism service providers provide contact information on website e.g. email, Facebook, telephone number.
0.680 4.44 .702 4.12 .965 4.29 .851 .002**
Tourism service providers have mobile applications to provide online services at any time.
0.850 4.26 .903 3.46 1.157 3.88 1.105 .000**
Tourism service providers use other online channels to contact their customers e.g. Facebook Twitter.
0.707 4.16 .792 3.31 1.103 3.76 1.042 .000**
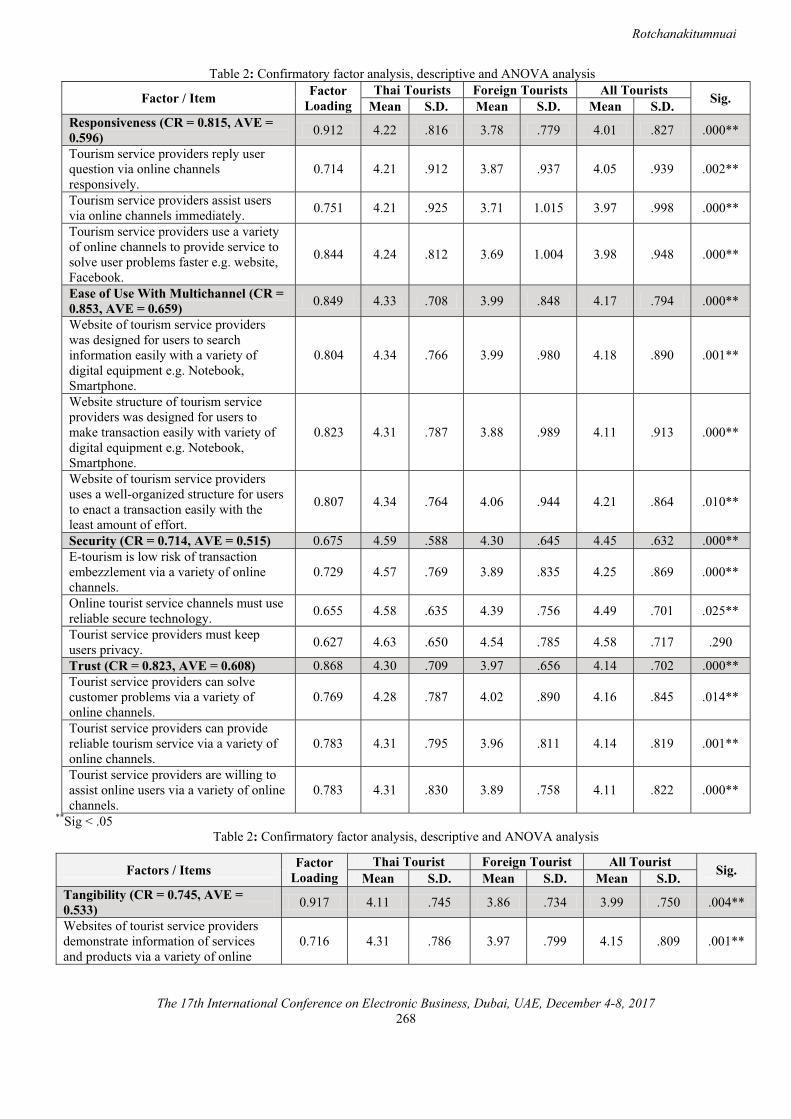
Rotchanakitumnuai
The 17th International Conference on Electronic Business, Dubai, UAE, December 4-8, 2017268
**Sig < .05Table 2: Confirmatory factor analysis, descriptive and ANOVA analysis
Table 2: Confirmatory factor analysis, descriptive and ANOVA analysis
Factor / Item Factor Loading
Thai Tourists Foreign Tourists All Tourists Sig.Mean S.D. Mean S.D. Mean S.D.Responsiveness (CR = 0.815, AVE =0.596) 0.912 4.22 .816 3.78 .779 4.01 .827 .000**
Tourism service providers reply user question via online channels responsively.
0.714 4.21 .912 3.87 .937 4.05 .939 .002**
Tourism service providers assist users via online channels immediately. 0.751 4.21 .925 3.71 1.015 3.97 .998 .000**
Tourism service providers use a variety of online channels to provide service to solve user problems faster e.g. website, Facebook.
0.844 4.24 .812 3.69 1.004 3.98 .948 .000**
Ease of Use With Multichannel (CR =0.853, AVE = 0.659) 0.849 4.33 .708 3.99 .848 4.17 .794 .000**
Website of tourism service providers was designed for users to search information easily with a variety of digital equipment e.g. Notebook, Smartphone.
0.804 4.34 .766 3.99 .980 4.18 .890 .001**
Website structure of tourism service providers was designed for users to make transaction easily with variety of digital equipment e.g. Notebook, Smartphone.
0.823 4.31 .787 3.88 .989 4.11 .913 .000**
Website of tourism service providers uses a well-organized structure for users to enact a transaction easily with the least amount of effort.
0.807 4.34 .764 4.06 .944 4.21 .864 .010**
Security (CR = 0.714, AVE = 0.515) 0.675 4.59 .588 4.30 .645 4.45 .632 .000**E-tourism is low risk of transaction embezzlement via a variety of online channels.
0.729 4.57 .769 3.89 .835 4.25 .869 .000**
Online tourist service channels must use reliable secure technology. 0.655 4.58 .635 4.39 .756 4.49 .701 .025**
Tourist service providers must keep users privacy. 0.627 4.63 .650 4.54 .785 4.58 .717 .290
Trust (CR = 0.823, AVE = 0.608) 0.868 4.30 .709 3.97 .656 4.14 .702 .000**Tourist service providers can solve customer problems via a variety of online channels.
0.769 4.28 .787 4.02 .890 4.16 .845 .014**
Tourist service providers can provide reliable tourism service via a variety of online channels.
0.783 4.31 .795 3.96 .811 4.14 .819 .001**
Tourist service providers are willing to assist online users via a variety of online channels.
0.783 4.31 .830 3.89 .758 4.11 .822 .000**
Factors / Items Factor Loading
Thai Tourist Foreign Tourist All Tourist Sig.Mean S.D. Mean S.D. Mean S.D.Tangibility (CR = 0.745, AVE =0.533) 0.917 4.11 .745 3.86 .734 3.99 .750 .004**
Websites of tourist service providers demonstrate information of services and products via a variety of online
0.716 4.31 .786 3.97 .799 4.15 .809 .001**
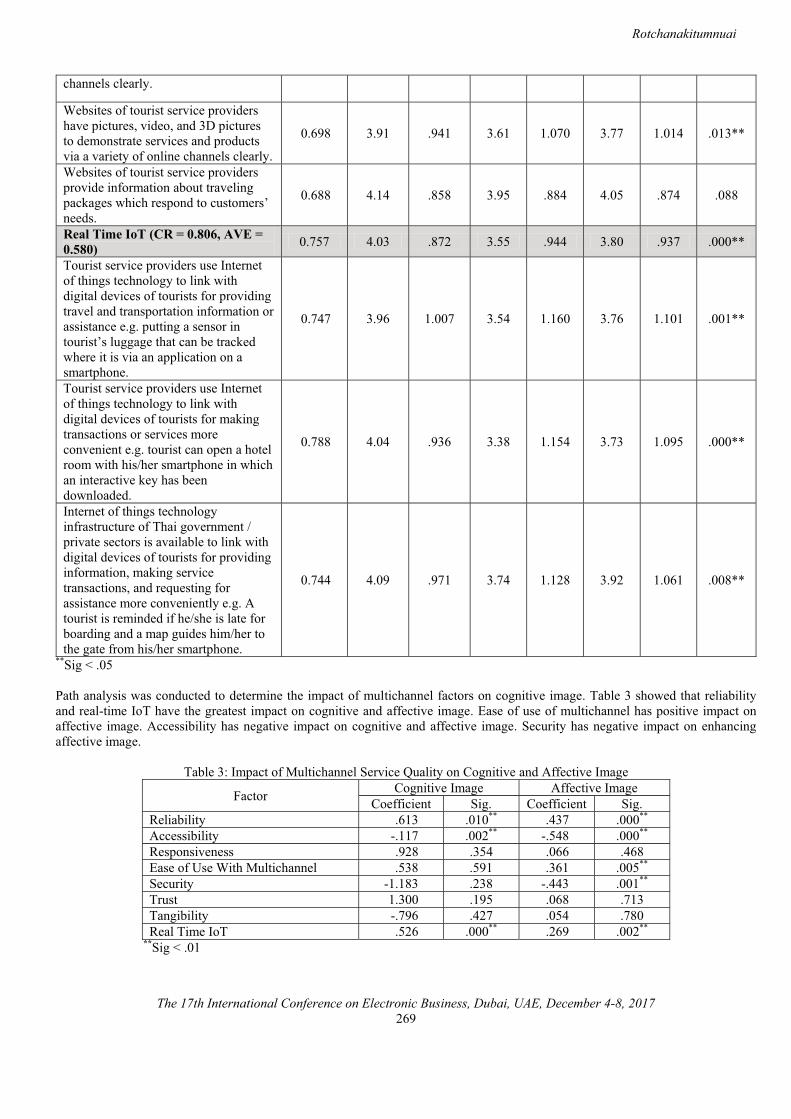
Rotchanakitumnuai
The 17th International Conference on Electronic Business, Dubai, UAE, December 4-8, 2017269
**Sig < .05
Path analysis was conducted to determine the impact of multichannel factors on cognitive image. Table 3 showed that reliability and real-time IoT have the greatest impact on cognitive and affective image. Ease of use of multichannel has positive impact on affective image. Accessibility has negative impact on cognitive and affective image. Security has negative impact on enhancing affective image.
Table 3: Impact of Multichannel Service Quality on Cognitive and Affective Image
Factor Cognitive Image Affective ImageCoefficient Sig. Coefficient Sig.
Reliability .613 .010** .437 .000** Accessibility -.117 .002** -.548 .000**
Responsiveness .928 .354 .066 .468Ease of Use With Multichannel .538 .591 .361 .005**
Security -1.183 .238 -.443 .001**
Trust 1.300 .195 .068 .713Tangibility -.796 .427 .054 .780Real Time IoT .526 .000** .269 .002**
**Sig < .01
channels clearly.
Websites of tourist service providers have pictures, video, and 3D pictures to demonstrate services and productsvia a variety of online channels clearly.
0.698 3.91 .941 3.61 1.070 3.77 1.014 .013**
Websites of tourist service providers provide information about traveling packages which respond to customers’ needs.
0.688 4.14 .858 3.95 .884 4.05 .874 .088
Real Time IoT (CR = 0.806, AVE =0.580) 0.757 4.03 .872 3.55 .944 3.80 .937 .000**
Tourist service providers use Internet of things technology to link with digital devices of tourists for providing travel and transportation information or assistance e.g. putting a sensor in tourist’s luggage that can be tracked where it is via an application on a smartphone.
0.747 3.96 1.007 3.54 1.160 3.76 1.101 .001**
Tourist service providers use Internet of things technology to link with digital devices of tourists for making transactions or services more convenient e.g. tourist can open a hotel room with his/her smartphone in which an interactive key has been downloaded.
0.788 4.04 .936 3.38 1.154 3.73 1.095 .000**
Internet of things technology infrastructure of Thai government / private sectors is available to link with digital devices of tourists for providing information, making service transactions, and requesting for assistance more conveniently e.g. A tourist is reminded if he/she is late for boarding and a map guides him/her to the gate from his/her smartphone.
0.744 4.09 .971 3.74 1.128 3.92 1.061 .008**

Rotchanakitumnuai
The 17th International Conference on Electronic Business, Dubai, UAE, December 4-8, 2017270
CONCLUSION AND DISCUSSIONThis study has expanded the research on the quality of electronic tourism of Thailand using multiple channels including websites, Facebook, Twitter, smartphones, and the Internet of Things. According to the analysis of the factors of electronic tourism based on the survey from Thai and foreign tourists, the service quality of multichannel E-tourism comprises 8 factors: tangibility, responsiveness, reliability, trust, accessibility, ease of use, real time IoT, and security. The results of the study showed that the tourists considered the service quality via the Internet of Things technology important because of immediate responsivenessthrough devices and applications. The Internet of Things is a key factor in the quality of electronic tourism that Thai tourism entrepreneurs need to focus on.
For the quality of the electronic tourism service, security is the top priority. This means that channels of online travel service need to have a reliable security technology. The personal data of the users and travel transactions through online channels must have no risk of fraud. The study also confirmed the similar results of past studies that security quality plays an important role in the creation of e-service quality.
Tourists concentrate on the importance of reliability of information, which is the next priority including websites of service providers and technologies. Thai and foreign tourists’ emphasis this factor is important, particularly the reliability of the information on the websites of tourist service providers.Ease of use with all channels is another important factor including access to websites and travel transactions via digital channels. Thai and foreign tourists rated the reliability of the information on the websites of tourist service providers as critical. This factor is important as it has major impact on cognitive image creation.
The score for trust supports previous studies for both the reliability of electronic service providers and the problem-solving ability for customers to use the services through online channels. The tourists highly rated the importance of accessibility to information that enables the users to contact the travel service providers on the websites including emails or Facebook. They did not give much priority to other online channels for public relations and contact to customers through social media. Foreign tourists gave the lowest scores on this factor.
Similarly, the tourists viewed the quality of service tangibility including giving the clear information through channels and information on travel packages responding to the need of customers as very necessary. Having pictures, videos and 3D images to show the services and products relevant to tourism via online channels was less important.
Relating to the IoT technology connecting devices to receive information immediately, foreign tourists considered the quality of this aspect in Thailand relatively very low compared to the other quality factors. This can be because the country has just initially employed IoT. The creation of smart destination probably will take a very long time to develop IoT to improve the quality of Thai electronic tourism in the future as this factor have impact on cognitive creation.
Future research may expand the scope of electronic service quality through multiple electronic service channels related to specific tourist destinations such as Phuket. It may include research on the service quality of each electronic channel in order to improve the channels for further quality development.
ACKNOWLEDGEMENTThe author gratefully acknowledges the financial support by Thammasat University under the TU Research Scholar Budget 2016.
REFERENCES[1] Babu, S. R. & Subramoniam, S. (2015). Development of a scale to measure e-tourism service quality in Kerala. Journal of IT
and Economic Development, 6(2), 36-59.[2] Baloglu, S. & Brinberg, D. (1997). Affective images of tourism destination. Journal of Travel Research, 35(4), 11-15.[3] Barnes, S.& Vidgen, R.T. (2003). Measuring Web site quality improvements: A case study of the forum on strategic
management knowledge exchange. Industrial Management & Data Systems, 103(5), 297-309.[4] Beldona, S. & Cai, L. A. (2006). An exploratory evaluation of rural tourism websites. Journal of Convention and Event
Tourism, 8(1), 69-80.[5] Bevanda, V., Grzinic, J. & Cervar, E. (2008). Analysing the users perception of web design quality by data mining tools.
Tourism and Hospitality Management, 14(2), 251-262.[6] Buhalis, D. & Amaranggana, A. (2014). Smart tourism destination. Information and Communication Technologies in
Tourism, In Proceedings of the International Conference (pp. 553-564). ICCT, Dublin, Ireland, January 21-24
Rotchanakitumnuai
The 17th International Conference on Electronic Business, Dubai, UAE, December 4-8, 2017271
[7] Buhalis, D. & Law D. (2008). Progress in information technology and tourism management: 20 years on and 10 years after the Internet—The state of e-Tourism research. Progress in Tourism Management, 29(4), 609-623.
[8] Chatterjee, P. (2010). Multiple-channel and cross-channel shopping behavior: Role of consumer shopping orientations. Marketing Intelligence & Planning, 28(1), 9-24.
[9] Choi, S., and Kimes, S. E. (2002). Electronic distribution channels’ effect on hotel revenue management. Cornell Hotel and Restaurant Administration Quarterly, 43(3), 23-31.
[10] Chow, W.S. & Sheung, C. L. (2008). Social network, social trust and shared goals in organizational knowledge sharing. Information & Management, 45, 458-465.
[11] Chui, M., Löffler, M. & Roberts, R. (2010). The Internet of things. McKinsey Quarterly, 2, 1-9.[12] Grönroos, C. (1994). From marketing mix to relationship marketing: Towards a paradigm shift in marketing. Management
Decision, 32, 24-20.[13] Ho, C.I. & Lee, Y.L. (2007). The development of an e-travel service quality scale. Tourism Management, 28(6), 1434-1449.[14] Lai, L.S.L. (2010). The role of web-based social media in the formation of a tourism destination image. IADIS International
Conference Web Based Communities (pp. 3-12). MCCSIS, Freiburg, Germany, July 29 - 31. [15] Lee, J. & Lijia, K.X. (2011). Cognitive destination image, destination personality and behavioral intentions: An integrated
perspective of destination branding. Retrieved from http://scholarworks.umass.edu/cgi/viewcontent.cgi?article=1193&context= gradconf_hospitality (October 10, 2017).
[16] Lee, G.G. & Lin, H.G. (2005). Customer perceptions of e-service quality in online shopping. International Journal of Retail & Distribution Management, 33(2), 161-176.
[17] Lu, J., Wang, X. & Xu, Z. (2012). Research on website e-service quality of scenic area: The perspective of customer satisfaction and behaviour intention. International Conference on Information Management, Innovation Management and Industrial Engineering (pp. 205-208). IEEE, Xi’an, China, December 26-27.
[18] Parasuraman, A., Zeithaml, V.A. & Berry, L.L. (1985). A conceptual model of service quality and its implications for future research. Journal of Marketing, 49 (April), 41-50.
[19] Parasuraman, A., Zeithaml, V.A. & Malhotra, A. (2005). ES-QUAL: A multiple-item scale for assessing electronic service quality. Journal of Service Research, 7(3), 213-233.
[20] Pearce, D. G. (2009). Channel design for effective tourism distribution strategies. Journal of Travel & Tourism Marketing, 26, 507-521.
[21] Pearce, D. G. & Taniguchi, M. (2008). Channel performance in multi-channel tourism distribution systems. Journal of Travel Research, 46, 256-267.
[22] Ranganathan, C. & Ganapathy, S. (2002). Key dimensions of business-to-consumer web sites. Information and Management,39, 457-465.
[23] Rotchanakitumnuai, S. (2008). Measuring e-government service value with the E-GOVSQUAL-RISK model. Business Process Management Journal, 14(5), 724-737.
[24] Shchiglik, C. & Barnes, S. J. (2004). Evaluating website quality in the airline industry. Journal of Computer Information Systems, 44(3), 17-25.
[25] Sousa, R. & Voss, C.A. (2011). Service quality in multichannel services employing virtual channels. Journal of Service Research, 8(4), 356-371.
[26] Vesa, J. & Heck, E.V. (2005). Multi-access technologies in online consumer auction markets in Finland. European Management Journal, 23(2), 182-194.
[27] Yoo, B. & Donthu, N. (2001). Developing a scale to measure the perceived quality of Internet shopping sites (SiteQual). Quarterly Journal of Electronic Commerce, 2(1), 31-47.
[28] Zeithaml, V.A., Parasuraman, A. & Malhotra, A. (2002). Service quality delivery through Web sites: A critical review of extant knowledge. Journal of the Academic of Marketing Science, 30(4), 362-75.
Huang, S. & Xu, D.M. (2017). The nature of IT firms: A systemic literature review and analysis. In Proceedings of The 17th International Conference on Electronic Business(pp. 266-280). ICEB, Dubai, UAE, December 4-8.
Huang & Xu
The 17th International Conference on Electronic Business, Dubai, UAE, December 4-8, 2017272
The Nature of IT Firms: A Systemic Literature Review and Analysis
Sha Huang*, The University of Queensland, Australia, [email protected] Xu, The University of Queensland, Australia, [email protected]
ABSTRACTIT firms have grown in economic importance in the last few decades. It is the interest of both practitioners and researchers across a range of business management and information system disciplines. Having conducted a systemic literature review, we proposed a new conceptual definition and conceptual frameworks which together provides a deeper understanding of the essence of “IT firms”. The definition we proposed of IT firm offers a way forward for identification of IT firms with increased understanding and a clear boundary. The conceptual framework synthesized the characteristic dimensions of IT firms. It not only improves current understanding of IT firms but also provides a solid foundation for further studies of IT firms. The types of IT firms developed in this paper offers a means of classifying different IT firms. The IT firm development framework in relation to innovation focus and improvisational capabilities not only advances understanding about IT firms, but also providesfurther research opportunities towards empirical testing and knowledge building. The insights discovered in the paper are also useful for business practitioners in strategy and consulting. The frameworks provide useful knowledge and advice for IT firmswithin the industry.
Keywords: IT firm innovation, types of IT firms, IT firm definition, conceptualisation of IT firm, improvisational capabilities_____________________*Corresponding author
INTRODUCTIONIn the recent decades, information technology (IT) firms have taken center stage in our modern economies. IT firms have become the driver of economic growth, created innovative products and changed the way we live our lives (Paul and Gupta, 2014). IT firms also have a direct and/or indirect influence on other firms due to their nature and integration into other industries’ environments (Breznik & Lahovnik, 2012). The importance of IT firms is evident in the wide coverage they receive in the mass media as well as academic and business publications. However, despite the importance of IT firms in our economy, we still lack a deep and up-to-date understanding of what an IT firm is in our fast-changing world.
The aim of this paper is to examine the nature of IT firms and provide a deeper understanding that capture the essence of IT firms. There are a number of grounds for believing that this systemic literature review is both necessary and timely. Currently, there is no widely accepted comprehensive definition of what an IT firm is both in literature and in practice. The very few definitions appeared in the literature are based on vague undefined constructs or on a single perspective that actually include some non IT firms and left out other IT firms (Lee et al., 2015; Pollach, 2011). There is also a lack of agreement in the literature about specific criteria to be used in deciding which firms should be categorized as an IT firm. In addition, there is inadequacy in cohesive understanding about the nature of IT firms. Due to the digital disruption in the recent years, the nature of IT firms has evolved as well. The previous identification of IT firms using industry product classification is no longer adequate to capture the full essence and different types of IT firms. For example, Uber would be classified under the taxi industry, but very few would disagree that Uber is also an IT firm. (Canace, 2014; Findikoglu & Watson .
The lack of a deeper understanding of IT firms hinders research advancements (Locke & Golden-Biddle, 1997). Confusion about the nature of IT firms and lack of an up-to-date, commonly accepted definition interferes with the appearance of a common research language, thus making it difficult for researchers to build upon the work of others (Grinstein & Goldman, 2006). Also, better understanding of the different types of IT firms and factors influencing them would allow researchers to better scope their studies. In addition, the lack of a clear concept and deeper understanding hinders government efforts to support IT firms, and impede the attempt of consulting and investment firms to properly benchmark and assess the risks of different types of IT firms.
Given the importance of IT firms and the problems with lack of deeper understanding, this paper is motivated by the need for acomprehensive and integrated definition of IT firms, and a conceptual framework that captures the essence of IT firms. Our research question is “What is the nature of IT firms?”. The remainder of this paper is structured as follows: Section 2 describes the methodology employed. Section 3 presents the synthesized conceptual frameworks showing and discussing the key characteristics of IT firms and the insights about different types of IT firms, as well as presenting the new definition of ITfirms. Section 4 concludes the paper and discusses the contributions and limitations.
METHODOLOGYIn order to identify the recurring attributes and reveal the underlying characteristics of IT firms, we conducted a systemic literature review and analysis. The main aim of the systemic literature review is to define “IT firm” and to propose a conceptual framework to provide insights about the nature of IT firms. We followed a three phase process of systemic
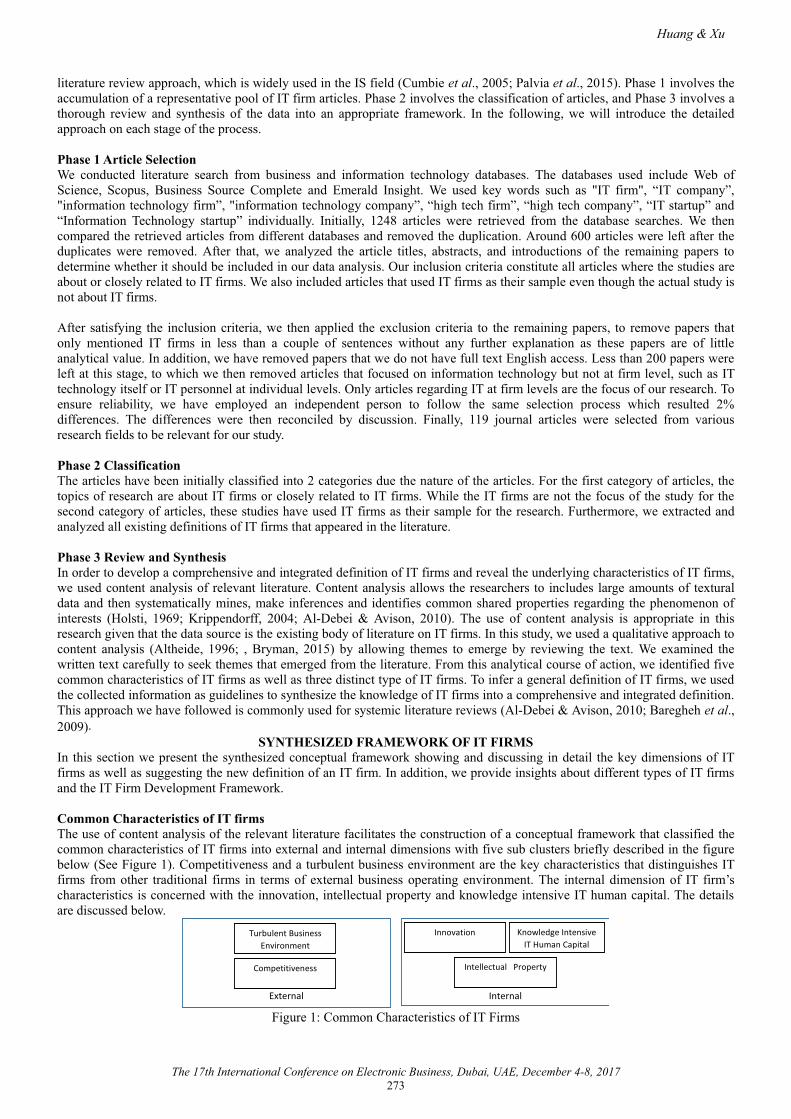
Huang & Xu
The 17th International Conference on Electronic Business, Dubai, UAE, December 4-8, 2017273
literature review approach, which is widely used in the IS field (Cumbie et al., 2005; Palvia et al., 2015). Phase 1 involves the accumulation of a representative pool of IT firm articles. Phase 2 involves the classification of articles, and Phase 3 involves a thorough review and synthesis of the data into an appropriate framework. In the following, we will introduce the detailed approach on each stage of the process.
Phase 1 Article SelectionWe conducted literature search from business and information technology databases. The databases used include Web of Science, Scopus, Business Source Complete and Emerald Insight. We used key words such as "IT firm", “IT company”, "information technology firm”, "information technology company”, “high tech firm”, “high tech company”, “IT startup” and “Information Technology startup” individually. Initially, 1248 articles were retrieved from the database searches. We then compared the retrieved articles from different databases and removed the duplication. Around 600 articles were left after the duplicates were removed. After that, we analyzed the article titles, abstracts, and introductions of the remaining papers to determine whether it should be included in our data analysis. Our inclusion criteria constitute all articles where the studies are about or closely related to IT firms. We also included articles that used IT firms as their sample even though the actual study is not about IT firms.
After satisfying the inclusion criteria, we then applied the exclusion criteria to the remaining papers, to remove papers that only mentioned IT firms in less than a couple of sentences without any further explanation as these papers are of little analytical value. In addition, we have removed papers that we do not have full text English access. Less than 200 papers wereleft at this stage, to which we then removed articles that focused on information technology but not at firm level, such as IT technology itself or IT personnel at individual levels. Only articles regarding IT at firm levels are the focus of our research. To ensure reliability, we have employed an independent person to follow the same selection process which resulted 2% differences. The differences were then reconciled by discussion. Finally, 119 journal articles were selected from various research fields to be relevant for our study.
Phase 2 ClassificationThe articles have been initially classified into 2 categories due the nature of the articles. For the first category of articles, the topics of research are about IT firms or closely related to IT firms. While the IT firms are not the focus of the study for the second category of articles, these studies have used IT firms as their sample for the research. Furthermore, we extracted and analyzed all existing definitions of IT firms that appeared in the literature.
Phase 3 Review and SynthesisIn order to develop a comprehensive and integrated definition of IT firms and reveal the underlying characteristics of IT firms, we used content analysis of relevant literature. Content analysis allows the researchers to includes large amounts of textural data and then systematically mines, make inferences and identifies common shared properties regarding the phenomenon of interests (Holsti, 1969; Krippendorff, 2004; Al-Debei & Avison, 2010). The use of content analysis is appropriate in this research given that the data source is the existing body of literature on IT firms. In this study, we used a qualitative approach to content analysis (Altheide, 1996; , Bryman, 2015) by allowing themes to emerge by reviewing the text. We examined the written text carefully to seek themes that emerged from the literature. From this analytical course of action, we identified five common characteristics of IT firms as well as three distinct type of IT firms. To infer a general definition of IT firms, we used the collected information as guidelines to synthesize the knowledge of IT firms into a comprehensive and integrated definition. This approach we have followed is commonly used for systemic literature reviews (Al-Debei & Avison, 2010; Baregheh et al., 2009).
SYNTHESIZED FRAMEWORK OF IT FIRMS In this section we present the synthesized conceptual framework showing and discussing in detail the key dimensions of IT firms as well as suggesting the new definition of an IT firm. In addition, we provide insights about different types of IT firms and the IT Firm Development Framework.
Common Characteristics of IT firmsThe use of content analysis of the relevant literature facilitates the construction of a conceptual framework that classified the common characteristics of IT firms into external and internal dimensions with five sub clusters briefly described in the figurebelow (See Figure 1). Competitiveness and a turbulent business environment are the key characteristics that distinguishes IT firms from other traditional firms in terms of external business operating environment. The internal dimension of IT firm’scharacteristics is concerned with the innovation, intellectual property and knowledge intensive IT human capital. The detailsare discussed below.
Internal
External
Turbulent Business Environment
Innovation
Intellectual Property
Knowledge Intensive IT Human Capital
Competitiveness
Figure 1: Common Characteristics of IT Firms
Huang & Xu
The 17th International Conference on Electronic Business, Dubai, UAE, December 4-8, 2017274
Turbulent Business EnvironmentA distinctive characteristic of IT firms revealed from the literature analysis is the turbulent business operating environment. IT firms operate in much more turbulent business environments compared to other traditional firms. IT firms belong to the knowledge-based economy in which unpredictable and rapidly changing environment is the norm, and knowledge, creativity, and innovation play an ever-increasing role in generating and sustaining growth (Ramayah, 2010; Cisco & LIW, 2015).
“One of the most predictable things about today’s business world is its unpredictability. ... To achieve that position in such a competitive and rapidly changing market such as technology is perhaps even more remarkable . . .” C1-25 (Cisco & LIW, 2015).
This is quite different to firms that operate in a traditional business environment. The traditional businesses operate in much more predictable environments in which the focus is on prediction and optimization-based efficiencies (Singh, 2010). Information systems are used in the traditional businesses for achieving the strategic alignment with organizational goals using pre-defined ‘best practices’. The assumption is that these ‘best practices’ retain their effectiveness over time due to the more stable environment and certainty regarding future markets (Singh, 2010; Chen, 2010; Tak & Lim, 2008).
In contrast to the traditional firms, the increasing turbulent operation environment of IT firms is characterized by high levels of uncertainty and an inability to predict the future (Almeida, 2008). The use of best practices in the information and control systems with pre-defined goals may not necessarily achieve long-term organizational success (Singh, 2010). The increasing turbulent environment of IT firms challenges the assumptions underlying the ‘accepted way of doing things’. IT firms need the capability to understand the problems afresh given the changing environmental conditions. The focus is not only on finding theright answers but on finding the right questions. This turbulent environment is contrasted from the traditional stable environment by its emphasis on ‘doing the right thing’ rather than ‘doing things right’ (Singh, 2010; Andriole, 2010; Huang, 2009).
“Couple this with a marketplace that continues to evolve rapidly as technology changes and advances, an ever-expanding menu of IT offerings, options and services, and increased customer demand for superior quality products and services in shorter time frames, and it becomes clear that matters are not getting any easier for the small IT provider.” C2-31 (Swinarski et al., 2012)
“IT are characterized by technical and market-based uncertainty. Technical uncertainty arises due to concerns about the feasibility of the new technology, and market uncertainty arises from the lack of knowledge about whether customers will ultimately prefer the product . . .” C1-05 (Banker et al., 2011)
A few existing literatures investigated the persistence and change in the industry leading IT firms as well as how and why certain IT firms thrive in the dynamic environments of rapid technological change while other firms do not (Gemser et al., 2006; Chen, 2010; Cisco & LIW, 2015; Swinarski et al., 2012; Almeida, 2008). To keep pace with the pathway to success in the rapidly-changing and competitive environment, IT firms must build or acquire new capabilities and then leverage these to ensure long-term survival (Almeida, 2008).
CompetitivenessCompetitiveness is another characteristic that comes to light from our literature review. IT firms are facing higher competition compared to other firms. There are major international players as well as local players. Globalization has accelerated competition among IT firms, which has caused them to compete not only with local rivals but also with global competitors(Kang et al., 2014).
“No longer shielded from the global marketplace, small IT providers must contend with competition from overseas companies. Further, this competition is not limited to contract programming. Global players are now involved in higher IT functions and consulting opportunities, including system design, systems integration, and contract management.” C2-31 (Swinarski et al., 2012)
The fast pace of technological change can lead to the development of new products that pose a threat to existing products(Banker et al., 2011). How to respond appropriately to the potential threat posed by new entrants is a common dilemma facing incumbent IT firms. While this threat exists for all incumbent firms, it is more pronounced in the IT firms due to faster technological change, shorter product life cycles, low cost of entry, as well as both technical and market uncertainty surrounding new innovation (Banker et al., 2011; Sang-Yong Tom, 2006; Ackroyd, 1995; Huang, 2009).
“While existing capabilities provide the basis for a firm’s current competitive position, without renewal, these same capabilities will soon become rigidities that will constrain a firm’s future ability to compete. Therefore, firms need to revitalize their operations by changing the scope of their business, their competitive approaches, or both.” C1-384 (Huang, 2009)
“IT industries portray characteristics of intense rivalries, constantly evolving strategies, instant imitators and few barriers to entry . . .” C2-02 (Almeida, 2008)
Huang & Xu
The 17th International Conference on Electronic Business, Dubai, UAE, December 4-8, 2017275
The low cost of entry in IT industries makes it easier for start-ups with intellectual capital to emerge as industry leaders in a short time (Banker et al., 2011; Zhu & Qian, 2015). The rapid technological changes coupled with low start-up costs facilitate the flourish of start-up IT firms that try to build business models around new technologies. All IT firms needs to be constantly aware of the emerging technology landscape as well as the shifting consumer preferences to stay competitive (Banker et al., 2011; Globerman et al., 2005; Canace, 2014; Zhu & Qian, 2015). With the increasing competitive landscape, no firms are safe. The leading IT firms of the yesterdays can quickly get overtaken by the star firms of today. The leading IT firms of today can quickly get overtaken by the rising stars of tomorrow (Kang et al., 2014; Findikoglu & Watson ; Ovidiu-Iliuta, 2014).
“Firms today need to be fast growing, efficient, flexible, adaptable and future-ready to secure and maintain a dominant market position. Without these qualities, it is virtually impossible to be competitive . . .” C1-13 (Canace, 2014)
“Rapidly changing technological trends intensified the competition among technology firms, and the ability to fulfill complexand innovative technology requirements of the customers became increasingly important . . .” C1-29 (Findikoglu &Watson
InnovationIt is evident from our literature pool that innovation has been increasingly seen as the most critical competitive advantage of IT firms (Wang et al., 2012). In the IT industry, there is a clear difference in relation to firm performance between firms that innovate and those that do not. Developing a sound innovation strategy is an important part of strategic management in any firm, but especially for IT firms, since IT product life cycles are shorter and the industry competitive environment is more dynamic compared to the more stable traditional industries (Ramayah, 2010, Chen, 2004). Knowledge-intensive businesses such as IT firms are seen as the enablers of innovation, and the innovative efforts in these firms are different than those in traditional firms due to the knowledge-intensive nature of these firms (Jha & Bose, 2015).
“There is a clear difference in terms of organizational performance between firms that innovate and those that do not. The advantages of product innovation are numerous and have been well acknowledged empirically by numerous studies . . .” C1-62 (Ramayah, 2010)
Porter (1996) defines innovation as an attempt to create competitive advantage by perceiving or discovering new and better ways of competing in an industry and bringing them to the market. Innovation leads to the creation of new markets, as well as new and improved products in order to achieve growth, better performance and sustainable competitive positions (Ramayah, 2010).
Innovation process has been tackled by some studies within the IT firm literature. Both Research and Development (R&D) and acquisition strategies are commonly pursued by firms in the IT industry (Banker et al., 2011). Empirical studies have found that more diversified IT firms are more likely to innovate through acquisitions than from R&D (Banker et al., 2011). Nonetheless, the importance of an IT firm’s R&D has also been well documented. R&D helps IT firms to develop the absorptive capacity to generate new knowledge and in turn identifies the potential opportunities to fill the gaps in the industry positioning map, such as new customer segments, new customer needs, or new production methods (Hwang et al., 2013; Chen, 2004). In addition, the nature of innovation in IT firms are systemically shifting from hardware to software. (Arora et al., 2013). Given the importance of innovation to IT firms, more research is needed to develop deeper understanding of IT firm’s innovation process.
Intellectual PropertyIntellectual property is a crucial strategic asset in the rapid technological development of IT firms. The world of intellectual property organization defines intellectual property as the creations of the mind; inventions; literary and artistic works; and symbols, names and images used in commerce. Patent, trade mark, copyright and design rights are all part of intellectual property (Halpern and Johnson, 2014). For IT firms, patent is the most important type of intellectual property. Patents owned by a firm represent the output of its research efforts and the codified knowledge that it has created during the inventive process. Strategic patenting is particularly important in cumulative technologies like semiconductors, software, and business methods(Dibiaggio et al., 2014).
“Most new software and Internet services companies pay little or no dividends, do not place much emphasis on profits, and invest mainly in intellectual capital rather than physical assets . . .” C1-23 (Cusumano, 2012)
“Patent data are commonly used to elucidate inventive capabilities, especially in the semiconductor industry … Although certain firms do not protect their inventions through patents, in the semiconductor industry, patenting is a vital part of maintaining technological competitiveness. Semiconductor firms sell products embedded with hundreds, if not thousands, of patented inventions. . .” C1-24 (Dibiaggio et al., 2014)
A number of researchers used patent statistics to analyze IT firms’ technological competencies and to analyze their knowledgebase characteristics (Dibiaggio et al., 2014; Cho, 2009b; Silvola, 2006; Lee et al., 2015). Studies that examined the differential

Huang & Xu
The 17th International Conference on Electronic Business, Dubai, UAE, December 4-8, 2017276
effects of patents from various sources found that patents by internal R&D boosted sales, profits, and corporate value (Lee et al., 2015). Also, the host country’s property rights protection is an influencing factor on IT firm’s international acquisition performance (Zhu & Qian, 2015).
Knowledge Intensive IT Human Capital Another characteristic of IT firm that arose from our literature review is the knowledge intensive IT human capital. Human capital represents the combined knowledge, skill, innovativeness and capabilities of the firm’s individual employees. Human capital is the critical asset in the knowledge era of IT firms (Kamath, 2008; Cooke & Huang, 2011). IT firms are composed of a mix of IT, methodology, and personnel to bring valuable solutions to customers by “high-knowledge people” (Cho, 2009a). People are key success factors in IT firms because the experience, motivation, and knowledge of employees define the quality of solutions (Cho, 2009a; Ramayah, 2010; Singh, 2010).
“IT firms rely on tacit knowledge-based resources such as employee talents, ideas and expertise rather than on physical assets…” C2-02 (Almeida, 2008)
“Decades ago, businesses generated value through tangible assets, such as building and equipment. In our more knowledge-based economy, businesses are likely to generate much of their value through differentiating themselves by using intangible assets. Human capital constitutes a key intangible asset.” C2-01 (Abraham, 2015)
According to resource based view (Barney, 2001), firm resources include all assets, capabilities, organizational processes, firm attributes, information, knowledge, etc., controlled by a firm that enable the firm to conceive of and implement strategies that improve the firm’s efficiency and effectiveness (Barney, 2001; Rugman & Verbeke, 2002). Besides tangible resources, intangible resources such as skill, competency and expertise are also important. It is widely accepted that intangible assets are the major drivers of corporate value and growth for IT firms (Kamath, 2008; Zhu & Qian, 2015; Dibiaggio et al., 2014). Bharadwaj (2000) adopted resource based view in the IS domain and considered human IT resources as one of the IS assets. IT human capital include people with both technical IT skills, such as programming, systems analysis and design, and people withmanagerial IT skills, such as the effective management of IS functions, and project management skills (Bharadwaj, 2000; Wade & Hulland, 2004).
In the existing literature, many have researched into how IT firms can attract employee talents. Early studies investigated the best human resource management practices for retaining IT experts and showed that satisfaction with a respectful andstimulating work environment; satisfaction with training and development; satisfaction with innovative benefits and satisfaction with incentive compensation significantly increase functional retention of employees in firms (Abraham, 2015). Others found ‘employer brand’ has become one of the most popular ways to manage highly qualified IT employees in the conditions of ‘war for talent’ (Kucherov & Zamulin, 2016).
Types of IT FirmsIn this section, we discuss the three types of IT firms identified from the literature analysis, their characteristics and differences. Also, we will discuss the movements between different types of firms and recommendations on improvements in terms of innovation and improvisational capabilities. The 119 articles of IT firms are classified into two broad categories (See Appendix 1). The first category covers the majority of the journal articles analyzed. This includes articles such as “Innovation in IT firms: An investigation of intramural and extramural R&D activities and their impact” (Jha & Bose, 2015), where topics and/or problems of the research papers are about or closely related to IT firms. The first category of articles are very useful in identifying the recurring attributes and reveal the underlying characteristics of IT firms.
The second category includes articles where the topic of research is not about IT firms, but IT firms are used as their sample. For example, “Chinese Employees Negotiating Differing Conflict Management Expectations in a U.S.-Based Multinational Corporation Subsidiary in Southwest China” (Deng, 2014). The second category of articles also provided good sources of different types of IT firms as well as explicit and implied definitions of IT firms. Three broad types of IT firms emerged from the literature analysis based on the nature of the firm’s main products or services (See Table 1).
Table 1: Types of IT FirmType I Type II Type III
IT hardware product producer IT software and professional service provider
IT enabled service provider
Example: Dell, Nokia, Acer, Intel, Sony, Samsung and Taiwan Semiconductor
Example: Microsoft, CGI, Oracle, SAP and Symantec
Example: Uber, Airbnb, Amazon, Facebook and Twitter
C1 - 23 *C2 - 5 *
C1- 39 *C2 - 25 *
C1 - 11 *C2 - 6 *
*C1 refers to the number of articles where the studies are about or closely related to IT firms. C2 refers to the number of articles that are not about IT firms but used IT firm as their sample

Huang & Xu
The 17th International Conference on Electronic Business, Dubai, UAE, December 4-8, 2017277
Type I IT Hardware Product ProducerThe first type of IT firm that emerged from our analysis is the IT hardware product producer. Type I IT firms are mainly concerned with the production and/or manufacture of IT hardware products such as desktop and laptop PCs, tablet computers, servers, storage devices, smartphones, component of IT devices, etc. (Lee et al., 2015; Dibiaggio et al., 2014; Guo, 2014; Park & Lee, 2014).
“Some of these firms are computer manufacturers like IBM, Compaq and Hewlett- Packard . . .” C1-74 (Viardot, 2000)
“That Japanese hardware manufacturers will face increasing challenges due to the rising importance of embedded software in IT hardware products . . .” C1-04 (Arora et al., 2013)
Examples of Type I IT firms include Dell, Nokia, Sharp, Acer, Intel, Sony, Samsung Electronics and Taiwan Semiconductor(Lee et al., 2015; Findikoglu & Watson . Although a number of researches recognize IT hardware product producer as a distinct type of IT firm (Viardot, 2000; Arora et al., 2013), very few research has actually investigated Type I IT firms. The existing studies on Type I IT firms are interested in technology assimilation and inventive performances. It was found from empirical research that effectiveness of technology assimilation is significantly higher when multidisciplinary andmultifunctional teams are involved (Wong, 1998). In addition, organizational structure that encourages communication, networking and flexibility brought about by modern information technologies are shown to be important in achieving the right conditions for effective technology assimilation of Type I IT firms (Wong, 1998). Studies of Type I IT firms have also shown that complementarity and substitutability of knowledge elements are key determinants of the firm's inventive performance. Theoverall level of complementarity (substitutability) between knowledge components positively (negatively) contributes to firms’ inventive performance. A relatively high level of substitutability (complementarity) positively (negatively) contributes to explorative inventions (Dibiaggio et al., 2014)
Type II IT Software and Professional Service ProviderThe second type of IT firms that appeared from our data analysis is IT software and professional services providers. Type II IT firms provide their clients with a diverse range of IT services, ranging from simple support and maintenance projects to more complex custom software development (Feuerstein, 2013; Biancolino et al., 2013). IT firms of this type tend to be both knowledge-based and labor intensive (Huber, 2013; Feuerstein, 2013). Examples of the Type II IT firms include Microsoft, CGI, Oracle, SAP and Symantec.
“Although the largest global providers remain Western companies such as IBM or Accenture, Indian service providers (e.g. Wipro, TCS and Infosys) have grown significantly and are able to compete in terms of cost. Accordingly, the ‘global delivery model’ of Indian service providers constitutes an exemplar for successful offshore outsourcing of IT services for many Westerncompanies.” C1-28 (Feuerstein, 2013).
“The IT consultants were employed as programmers, systems developers, systems architects and application architects. They worked on a consultant basis, charging customers per hour for providing them with IT-related services.” C1-61 (Peterson, 2007).
“The market for IT services depends very much on outsourcing and the transfer of IT workers from the client to the IT firm. This has theoretical and empirical implications for how IT firms manage recruitment, skill development and job security.” C2-09 (Grimshaw, 2009).
IT software and professional services providers can be further refined by the type of services they provide. However, it is common for large IT software and professional services firms to provide multiple if not all of the services. Types of IT software and professional services are shown below (Viardot, 2000; Findikoglu & Watson ; Kato, 2014) :
Software Development Services: These firms develop software products and solutions for businesses and consumers.
IT Consulting Services: They help client firms to adapt to changes in their operating environments with the use of IT. They involve business process design, marketing advice, change management, training and re-skilling.
Systems Engineering Services: They assist clients in the design and running of information systems and include capacity planning, systems management and help desk.
Systems Integration Services: These help client firms to make various information technologies work together to achieve business solutions and performance. Information technologies encompass very different elements like computer and communication hardware, operating and applications software, and multimedia technologies.

Huang & Xu
The 17th International Conference on Electronic Business, Dubai, UAE, December 4-8, 2017278
Support Services: These are designed to keep technological solutions running. They include hardware and software maintenance, repair, relocation and replacement. Back-up and business recovery services are also included allowing clients to carry on working even after a major disaster.
Outsourcing Services: They help client firms to concentrate on their core business. Outsourcing allows clients to hand over all or part of their information systems under long-term contracts.
Network Services: These enable the clients to enjoy the benefits of network computing and cover services like data network management, electronic transactions, workgroup applications, hosting and internet connections.
Unlike Type I firms, Type II firms have been studied extensively in the existing literature. Type II firms are most frequentlyused as sample IT firms as well. IT outsourcing has been a research focus on existing literature of Type II firms. (Simon, 2011; Feakins, 2009; Miozzo, 2008; Grimshaw & Miozzo, 2006). Study has shown that the decisions of client companies to outsource is strongly influenced by both internal (i.e., asset-specificity, size, and internal organization of IT) and external (i.e., institutional environment) determinants (Barthélemy, 2005). Also, IT services firms move between countries not only in their own operations, but also the execution of contracts with client firms. These practices relocate client firms’ outsourcing from subsidiaries of IT firms within the same national economy to subsidiaries located outside it, in turn facilitating consolidation and regionalization of business segments of multinational client firms (Miozzo, 2008).
Another area of focus in the literature is the internationalization of Type II IT firms (Paul & Gupta, 2014; Feuerstein, 2013; Yang & Hsia, 2007). In traditional models such as product life cycle theory, firm internationalization is seen as a gradual process of capability build-up by which firms slowly accumulate the resources necessary to face foreign market uncertainty(Paul & Gupta, 2014). However, this is not the case for IT firms, empirical results indicate that IT firm age has no impact on internationalization. IT firms are “born-global” firms that, apparently, had undergone faster processes of internationalization than would have been expected for firms of similar size, age, and nature (Paul & Gupta, 2014; Yang & Hsia, 2007)
Other studies have investigated the human resources management of Type II IT firms (Goles et al., 2008; Mathiassen, 2008; Zampieri, 2004; Blomquist, 2007). As technology advances and the business environment continues to change, a key challenge facing IT software and service providers is identifying critical skill sets, both today and in the future. Studies have indicated software and services providers place increasingly more emphasis on business domain and project management skills than on technical skills (Goles et al., 2008).
Type III IT Enabled Service Provider The third type of IT firms that surfaced from our analysis is IT enabled service providers. Type III IT firms differs from Type II IT firms in the fact that the service provided by the third type are not IT professional services, but other services in a variety of industry. Examples include taxi services in the case of Uber, accommodation services in the case of Airbnb and social media services such as Facebook and Twitter. However, IT still forms the core competencies of this type of firms. The services Type III IT firms offer are IT enabled services in which without the key resources of IT infrastructure, personnel and knowledge, these types of firms would not exist.
“Twitter, along with Facebook and Youtube, represents the rapid growth of Web 2.0 ... has been the fastest growing social media platform ... ” C1- 80 (Zhu & Qian, 2015).
“Alibaba International and Alibaba China were established in 1998 in Hong Kong and in Hangzhou ... It now has 300,000 visits daily. Alibaba China is a Chinese site for domestic trade . . .” C1-21 (Chung et al., 2013).
Type III IT firms arise from the digital economy. Digital networking and communications infrastructure provide a global platform where people and organizations can cooperate, communicate, search for and obtain information as much as exchange digital products and services (Grzunov, 2014). Many recent start-up IT firms fall into this type. Organizations with innovative ideas of better or even completely new ways of doing business, offering services and sales of tangible and intangible assets find their place in the sector of internet entrepreneurs (Chung et al., 2013).
“This rather new system mostly relies on information technology (P2P) to empower individuals and other profit and non-profit organizations with ways of sharing excess capacity in goods, knowledge and services. ... Airbnb.com, as an outstanding example of the new e-business model, enables individuals to rent their unoccupied living space and other short-term accommodation to guests . . .” C1-36 (Grzunov, 2014)
Type III IT firms has been largely ignored in the existing literature. Some scholars have recently started to pay more attentionin Type III firms (Tiago et al., 2016; Chae, 2015; Andriole, 2010; Cusumano, 2012). A few articles investigated Type III firms such as Facebook and Twitter (Cusumano, 2012; Tiago et al., 2016; Chae, 2015). The role of Twitter in supply chain management has been investigated, and it was found that supply chain tweets are used by different groups of supply chain professionals and organizations (e.g., news services, IT companies, logistic providers, manufacturers) for information sharing,
Huang & Xu
The 17th International Conference on Electronic Business, Dubai, UAE, December 4-8, 2017279
hiring professionals, and communicating with stakeholders (Chae, 2015). Also, Facebook IPO has been studied and factorsthat reflect a company’s worth have been explored (Cusumano, 2012).
Innovation and Improvisational Capabilities of Different Types of IT Firms Even though all IT firms have a strong focus on innovation, different type of IT firms focuses on different types of innovation. An innovation can be a new product or service, a new production process technology, a new structure or administrative system,or a new plan or program pertaining to organizational members (Damanpour, 1991). For many years, researchers have established the importance of demarcating between the types of innovation to better understand innovation strategies as well as determinants of each innovation category (Downs Jr. & Mohr, 1976; Damanpour, 1991).
Innovation types can be categorized in several ways. Early studies of innovation types had a binary focus in pairs such as product/process, administrative/technical and radical/incremental (Rowley et al., 2011). In recognition of the increasing significance for firms managing across the range of different types of innovation, a number of integrative models of innovation have been proposed (Damanpour, 1991; Trott, 2008; Rowley et al., 2011). A commonly used typology proposed by Trott (2008)classified innovations into four types: product, process, marketing and organizational innovation.
Product innovation is the implementation of a new or significantly improved product (good or a service). Product innovation aims to present a new or improved product or service for the customers and customers see the impact of such innovation in the products or services they receive. Process innovation refers to the implementation of a new or significantly advanced method,often aimed at improving efficiency or service delivery. Process innovations involve new elements introduced into an organization's production or service operations-input materials, task specifications, work and information flow mechanisms, and equipment used to produce a product or render a service. Product and process innovations are considered to be technical innovations and are related to basic work activities (Damanpour, 1991; Trott, 2008).
Marketing innovation constitutes the introduction of new commercial methods in product design, product access, product promotion or pricing strategies for new and existing services. Organizational innovation is concerned with new organizational methods in the firm’s business practices and workplace organization. For example, new mechanisms to improve learning and knowledge sharing among staff, the integration or disintegration of departments, the introduction of quality management systems, as well as new education and training schemes would be considered as organizational innovations. Marketing and organizational innovations are considered to be administrative innovation which involves changes to the social structures of the firm. Marketing and organizational innovations are more directly related to the firm’s management and are indirectly related to the basic work activities (Trott, 2008; Damanpour, 1991). In this paper we separate the types of innovation in IT innovation and business model innovation. We define “IT innovation” to be product and process innovations that are technical and IT related. We define “business model innovation” to be marketing and organizational innovations that are management focused, such as a new way of doing business (See figure 2).
Apart from innovation, another key characteristic of IT firms identified earlier was that IT firms operate in a highly turbulent business environment where an unpredictable, rapidly changing environment is the norm (Ramayah, 2010; Cisco & LIW, 2015). Competitive advantage in the turbulent environments can be based on undertaking reconfiguration better, faster, and more efficiently than the competition (Ilinitch et al., 1996). As a result, the firm’s improvisational capabilities play an important role in such business environments. We define improvisational capability as the ability to spontaneously reconfigureexisting resources to build new operational capabilities to address urgent, unpredictable, and novel environmental situations(Pavlou & El Sawy, 2010).
The three types of IT firms appear to be different in the type of innovation they focus on initially and their level of improvisational capability. Type I IT firms tend to be high in IT innovation but low in business model innovation. Given the shorter product cycle and more dynamic industrial environment, IT hardware product manufactures have to constantly innovate to keep their product up to date ( (Banker et al., 2011; Almeida, 2008). It is not surprising that the Type I IT firms would be highly focused on technical innovation (Almeida, 2008; Dibiaggio et al., 2014; Banker et al., 2011). On the other hand, the product manufacturing business model is very mature and therefore little focus is given to business model innovation such as a new organizational method of business practice or a new way of doing business (Dibiaggio et al., 2014; Ramayah, 2010). Also, Type I IT firms tend to have lower improvisational capabilities compared to Type II and Type III firms. Higher proportion of assets are invested in longer term fixed assets such as factory and machinery, and as a result it is harder for Type I firms to reconfigure existing resources in a sudden change of business environment (Arora et al., 2013; Nidumolu et al., 2009).
Type II IT firms are considered to be intermediate in both IT innovation and business model innovation. These type of firms provide their clients with a diverse range of IT services, ranging from simple support and maintenance projects to more complex custom software development (Feuerstein, 2013; Biancolino et al., 2013). Technical IT innovation is an important part of the business in order to achieve competitive advantage (Swinarski et al., 2012; Biancolino et al., 2013; Wang et al., 2012; James et al., 2013). However, being service orientated firms, Type II firms also put in considerable effort in business model innovation such as finding new ways to improve knowledge sharing among employees in the company. (Park & Lee, 2014; James et al., 2013; Pandey & Dutta, 2013). Type II firms have better improvisational capabilities than Type I firms,
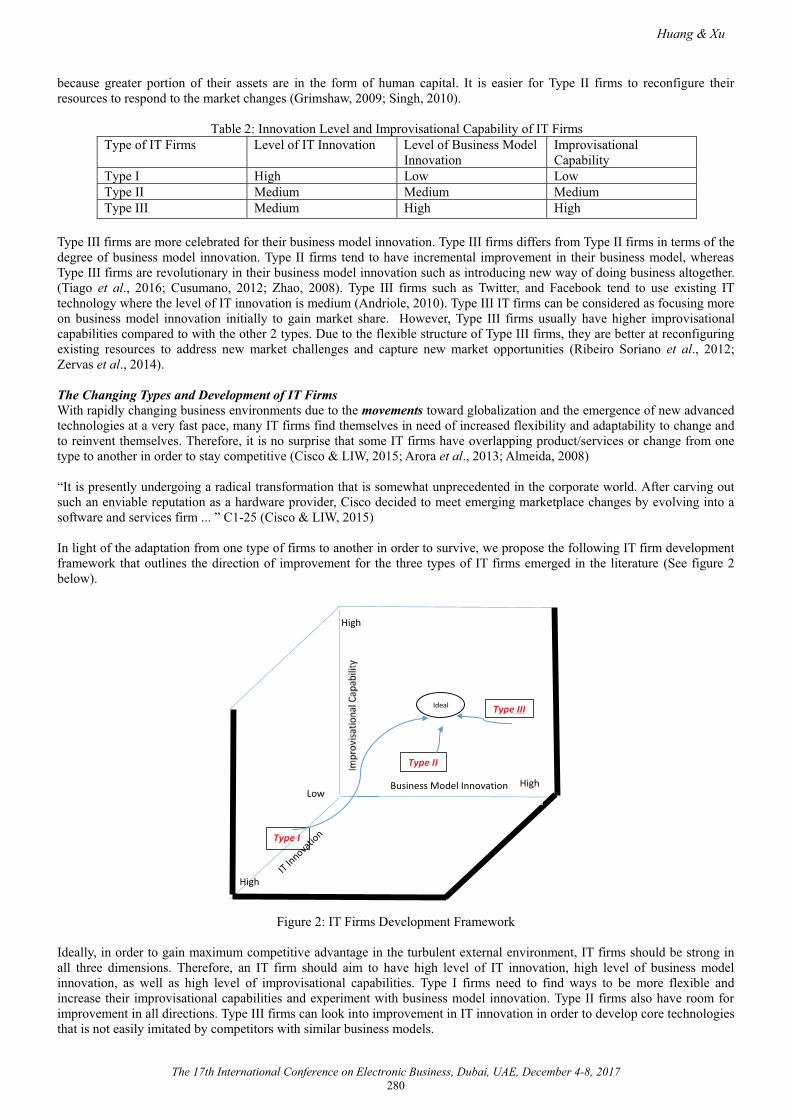
Huang & Xu
The 17th International Conference on Electronic Business, Dubai, UAE, December 4-8, 2017280
because greater portion of their assets are in the form of human capital. It is easier for Type II firms to reconfigure their resources to respond to the market changes (Grimshaw, 2009; Singh, 2010).
Table 2: Innovation Level and Improvisational Capability of IT FirmsType of IT Firms Level of IT Innovation Level of Business Model
InnovationImprovisational Capability
Type I High Low LowType II Medium Medium MediumType III Medium High High
Type III firms are more celebrated for their business model innovation. Type III firms differs from Type II firms in terms of the degree of business model innovation. Type II firms tend to have incremental improvement in their business model, whereas Type III firms are revolutionary in their business model innovation such as introducing new way of doing business altogether.(Tiago et al., 2016; Cusumano, 2012; Zhao, 2008). Type III firms such as Twitter, and Facebook tend to use existing IT technology where the level of IT innovation is medium (Andriole, 2010). Type III IT firms can be considered as focusing more on business model innovation initially to gain market share. However, Type III firms usually have higher improvisational capabilities compared to with the other 2 types. Due to the flexible structure of Type III firms, they are better at reconfiguring existing resources to address new market challenges and capture new market opportunities (Ribeiro Soriano et al., 2012; Zervas et al., 2014).
The Changing Types and Development of IT FirmsWith rapidly changing business environments due to the movements toward globalization and the emergence of new advanced technologies at a very fast pace, many IT firms find themselves in need of increased flexibility and adaptability to change andto reinvent themselves. Therefore, it is no surprise that some IT firms have overlapping product/services or change from one type to another in order to stay competitive (Cisco & LIW, 2015; Arora et al., 2013; Almeida, 2008)
“It is presently undergoing a radical transformation that is somewhat unprecedented in the corporate world. After carving outsuch an enviable reputation as a hardware provider, Cisco decided to meet emerging marketplace changes by evolving into a software and services firm ... ” C1-25 (Cisco & LIW, 2015)
In light of the adaptation from one type of firms to another in order to survive, we propose the following IT firm development framework that outlines the direction of improvement for the three types of IT firms emerged in the literature (See figure 2 below).
Business Model Innovation
Type I
Type III
Type II
Low
High
High
High
Ideal
Figure 2: IT Firms Development Framework
Ideally, in order to gain maximum competitive advantage in the turbulent external environment, IT firms should be strong in all three dimensions. Therefore, an IT firm should aim to have high level of IT innovation, high level of business model innovation, as well as high level of improvisational capabilities. Type I firms need to find ways to be more flexible and increase their improvisational capabilities and experiment with business model innovation. Type II firms also have room for improvement in all directions. Type III firms can look into improvement in IT innovation in order to develop core technologies that is not easily imitated by competitors with similar business models.
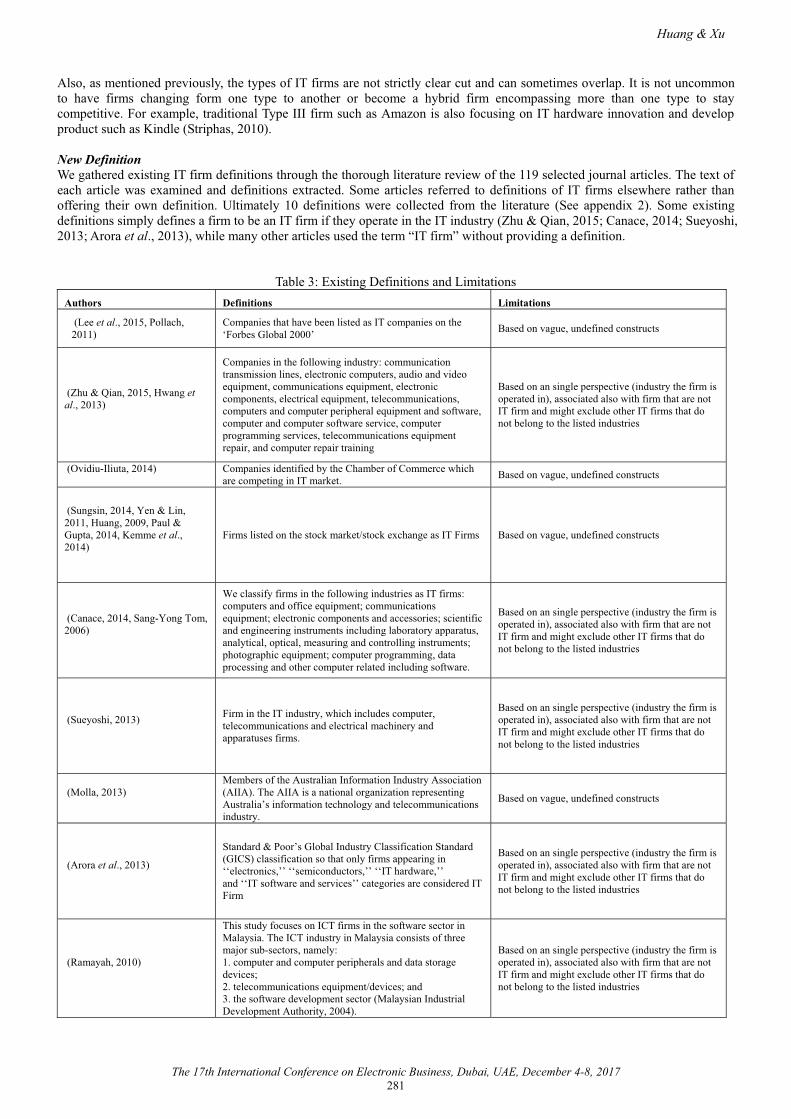
Huang & Xu
The 17th International Conference on Electronic Business, Dubai, UAE, December 4-8, 2017281
Also, as mentioned previously, the types of IT firms are not strictly clear cut and can sometimes overlap. It is not uncommon to have firms changing form one type to another or become a hybrid firm encompassing more than one type to stay competitive. For example, traditional Type III firm such as Amazon is also focusing on IT hardware innovation and develop product such as Kindle (Striphas, 2010).
New DefinitionWe gathered existing IT firm definitions through the thorough literature review of the 119 selected journal articles. The text of each article was examined and definitions extracted. Some articles referred to definitions of IT firms elsewhere rather than offering their own definition. Ultimately 10 definitions were collected from the literature (See appendix 2). Some existing definitions simply defines a firm to be an IT firm if they operate in the IT industry (Zhu & Qian, 2015; Canace, 2014; Sueyoshi, 2013; Arora et al., 2013), while many other articles used the term “IT firm” without providing a definition.
Table 3: Existing Definitions and LimitationsAuthors Definitions Limitations
(Lee et al., 2015, Pollach, 2011)
Companies that have been listed as IT companies on the ‘Forbes Global 2000’ Based on vague, undefined constructs
(Zhu & Qian, 2015, Hwang etal., 2013)
Companies in the following industry: communication transmission lines, electronic computers, audio and video equipment, communications equipment, electronic components, electrical equipment, telecommunications, computers and computer peripheral equipment and software, computer and computer software service, computer programming services, telecommunications equipment repair, and computer repair training
Based on an single perspective (industry the firm is operated in), associated also with firm that are not IT firm and might exclude other IT firms that do not belong to the listed industries
(Ovidiu-Iliuta, 2014) Companies identified by the Chamber of Commerce which are competing in IT market. Based on vague, undefined constructs
(Sungsin, 2014, Yen & Lin, 2011, Huang, 2009, Paul &Gupta, 2014, Kemme et al.,2014)
Firms listed on the stock market/stock exchange as IT Firms Based on vague, undefined constructs
(Canace, 2014, Sang-Yong Tom, 2006)
We classify firms in the following industries as IT firms: computers and office equipment; communications equipment; electronic components and accessories; scientific and engineering instruments including laboratory apparatus, analytical, optical, measuring and controlling instruments;photographic equipment; computer programming, data processing and other computer related including software.
Based on an single perspective (industry the firm is operated in), associated also with firm that are not IT firm and might exclude other IT firms that do not belong to the listed industries
(Sueyoshi, 2013) Firm in the IT industry, which includes computer, telecommunications and electrical machinery and apparatuses firms.
Based on an single perspective (industry the firm is operated in), associated also with firm that are not IT firm and might exclude other IT firms that do not belong to the listed industries
(Molla, 2013) Members of the Australian Information Industry Association(AIIA). The AIIA is a national organization representing Australia’s information technology and telecommunications industry.
Based on vague, undefined constructs
(Arora et al., 2013)
Standard & Poor’s Global Industry Classification Standard(GICS) classification so that only firms appearing in ‘‘electronics,’’ ‘‘semiconductors,’’ ‘‘IT hardware,’’and ‘‘IT software and services’’ categories are considered IT Firm
Based on an single perspective (industry the firm is operated in), associated also with firm that are not IT firm and might exclude other IT firms that do not belong to the listed industries
(Ramayah, 2010)
This study focuses on ICT firms in the software sector in Malaysia. The ICT industry in Malaysia consists of three major sub-sectors, namely:1. computer and computer peripherals and data storage devices;2. telecommunications equipment/devices; and3. the software development sector (Malaysian Industrial Development Authority, 2004).
Based on an single perspective (industry the firm is operated in), associated also with firm that are not IT firm and might exclude other IT firms that do not belong to the listed industries
Huang & Xu
The 17th International Conference on Electronic Business, Dubai, UAE, December 4-8, 2017282
(Silvola, 2006) We define high-tech firms by their R&D intensity. In addition, we define software industry as a special type of R&D-intensive firm
non-exclusive, based on a single perspective of IT firm (R & D activities)
We found the existing definitions to be limiting in nature and can create problems in defining IT firms. Most of the definitions are based on a single perspective (industry the firm is operated in), and can be associated also with firms that are not IT firm and exclude other IT firms that do not belong to the listed industries. Other definitions are based on vague undefined constructs. Given the limitations of the existing definitions, we found none of the existing definition being a comprehensivedefinition that completely captured the essence of IT firms, even though the existing literature provide fragmented aspects of IT firms. A new comprehensive and integrated definition of IT firms was developed from the in-depth analysis of the text of the relevant chosen IT articles.
According to the above analysis, we propose a comprehensive and integrated new definition of IT firm:
An IT firm is a firm where the production and/or the use of information technology form (s) the core competency of the firm, and IT human capital is a major strategic resource of the firm.
Information technology is defined by the US Bureau of Economic Analysis (BEA) as office, computing and accounting machinery (OCAM) which consists primarily of computers. Information processing equipment (IPE) is also considered part of IT. IPE includes communication equipment, scientific and engineering instruments, photocopiers and related equipment. In addition, software and related services are included (Brynjolfsson & Yang, 1996). In short, IT refers to technology, and essentially hardware, software and telecommunication networks. It is thus both tangible (e.g., servers, personal computers, routers and network cables) and intangible (e.g., software of all types). IT facilitates the acquisition, processing, storage, delivery and sharing of information and other digital content (Brynjolfsson & Yang, 1996). Core competency can include tangible assets as well as intangible skills and know-how possessed by an organization. Core competencies are defined as “areas where an organization must excel in order to maintain leadership” (Drucker & Drucker, 1994).
Our definition has advantage over existing definitions in several ways. Firstly, existing definitions using a firm’s industrymembership are limiting and can be associated also with firms that are not IT firms and exclude other IT firms that do not belong to the listed industries. Our definition overcomes the industry limitations since IT firms in any industry can be included. Secondly, our definition is based on literature with clearly defined constructs compared to other definitions that are based on vaguely undefined constructs such as stock exchange listings. Thirdly, existing definitions tend to be fragmented and only describe a single perspective of IT firms, whereas our definition is comprehensive and integrated, capturing the full essence of IT firms. The conceptual framework and textual definitions, which seek to subsume and supersede earlier definitions, recognize that a comprehensive and integrated definition of IT firm needs to encompass a number of dimensions of the essence of an IT firm.
CONCLUSIONS IT firms have grown in economic importance in the last few decades (Canace, 2014). It is the interest of both practitioners and researchers across a range of business management and information system disciplines. Having conducted a systemic literature review, we proposed a new conceptual definition and conceptual frameworks which together summarizes the essence of “IT firms”.
This study is of both theoretical and practical importance. We have provided a deep understanding of IT firms. The definition we proposed of IT firm offers a way forward for identification of IT firms with increased understanding and a clear boundary.The conceptual framework synthesized the characteristic dimensions of IT firms. It not only improves current understanding of IT firms but also provides a solid foundation for further studies of IT firms. The types of IT firms developed in this paper offers a means of classifying different IT firms. The IT firm development framework in relation to innovation focus and improvisational capabilities not only advances understanding about IT firms, but also provide further research opportunities towards empirical testing and knowledge building. The insights discovered in this paper is also useful for business practitioners in strategy and consulting. The frameworks provide useful knowledge and advice for IT firms within the industry.
However, there are limitations with this paper. As a conceptual paper, we have developed the textual definitions and conceptual frameworks from existing theoretical work in a range of disciplines. Further empirical work is needed to validate the proposed definition and framework in terms of its suitability, usefulness and acceptability across different disciplines. Although this research has provided some clarification of IT firms, there are many areas for future-related research. The IT firm innovation process deserves deeper understanding. The relationship between the different characteristics of IT firms also need further investigation.
REFERENCES [1] Abraham, S. (2015). What are the best HRM practices for retaining experts? A longitudinal study in the Canadian
information technology sector. International Journal of Manpower, 36 (3), 416-432.
Huang & Xu
The 17th International Conference on Electronic Business, Dubai, UAE, December 4-8, 2017283
[2] Ackroyd, S. (1995). On the structure and dynamics of some small, UK . Journal of Management Studies, 32 (2), 141-161.
[3] Al-Debei, M. & Avison, D. (2010). Developing a unified framework of the business model concept. European Journal of Information Systems, 19 (3), 359-376.
[4] Almeida, S. (2008). Survival strategies and characteristics of start-ups: An empirical study from the New Zealand IT industry. Technovation, 28 (3), 161-169.
[5] Altheide, D. L. (1996). Qualitative Media Analysis. Thousand Oaks, CA: Sage Publications.[6] Andriole, S. J. (2010). Business Impact of Web 2.0 Technologies. Communications of the ACM, 53 (12), 67-79. [7] Arora, A., Branstetter, L. G., & Drev, M. (2013). Going soft: How the rise of software-based innovation led to the decline
of Japan's IT industry and the resurgence of Silicon Valley. Review of Economics and Statistics, 95 (3), 757-775. [8] Banker, R. D., Wattal, S., & Plehn-Dujowich, J. M. (2011). R&D versus acquisitions: Role of diversification in the choice
of innovation strategy by information technology firms. Journal of Management Information Systems, 28 (2), 109-144. [9] Baregheh, A., Rowley, J., & Sambrook, S. (2009). Towards a multidisciplinary definition of innovation. Management
Decision, 47 (8), 1323-1339. [10] Barney, J. B. (2001). Resource-based theories of competitive advantage: A ten-year retrospective on the resource-based
view. Journal of management, 27 (6), 643-650. [11] Barthélemy, J. (2005). An empirical investigation of IT outsourcing versus quasi-outsourcing in France and Germany.
Information & Management, 42 (4), 533-542. [12] Bharadwaj, A. S. (2000). A resource-based perspective on information technology capability and firm performance: an
empirical investigation. MIS Quarterly, 24 (1), 169-196. [13] Biancolino, C. A., Maccari, E. A., & Pereira, M. F. (2013). Innovation as a tool for generating value in the IT services
sector. Revista Brasileira de Gestão de Negócios, 15 (48), 410. [14] Blomquist, T. (2007). Project marketing in multi-project organizations: A comparison of IS/IT and engineering firms.
Industrial Marketing Management, 36 (2), 206-218. [15] Breznik, L. & Lahovnik, M. (2012). Innovation capability as a source of competitive advantage in Slovenian information
technology firms,. Technics Technologies Educaton Managment, 7 (3), 1132-1144. [16] Bryman, A. (2015) Social Research Methods: Oxford University Press.[17] Brynjolfsson, E., & Yang, S. (1996). Information technology and productivity: A review of the literature. Advances in
Computers, 43, 179-214. [18] Canace, T. M., Steven. (2014). The impact of technology-motivated M&A and joint ventures on the value of IT and non-
IT firms: a new examination. Review of Quantitative Finance & Accounting, 43 (2), 333-366. [19] Chae, B. (2015). Insights from hashtag upplychain and twitter analytics: Considering twitter and twitter data for supply
chain practice and research. International Journal of Production Economics, 165, 247-259. [20] Chen, S.H. (2004). Taiwanese IT firms’ offshore R&D in China and the connection with the global innovation network.
Research Policy, 33 (2), 337-349. [21] Chen, Y.M. (2010). The continuing debate on firm performance: A multilevel approach to the IT sectors of Taiwan and
South Korea. Journal of Business Research, 63 (5), 471-478. [22] Cho, Y. (2009). Successful IT start-ups' HRD practices: Four cases in South Korea. Journal of European Industrial
Training, 33 (2), 125-141. [23] Cho, Y. M., & Gary N. (2009). Leading Asian countries' HRD practices in the IT industry: A comparative study of South
Korea and India. Human Resource Development International, 12 (3), 313-331. [24] Chung, S. A., Choi, Y., & Lim, J. S. (2013). The Role of the Entrepreneur and government in the development of Korean
information technology firms. In P.O. de Pablos (Ed.). (2013). International Business Strategy and Entrepreneurship: An Information Technology Perspective: An Information Technology Perspective (Chapter 7, pp. 104-120). Hershey, PA: IGI Global.
[25] Cooke, F. L., & Huang, K. (2011). Postacquisition evolution of the appraisal and reward systems: A study of Chinese IT firms acquired by US firms. Human Resource Management, 50 (6), 839-858.
[26] Cumbie, B. A., Jourdan, Z., Peachey, T., Dugo, T. M., & Craighead, C. W. (2005). Enterprise resource planning research: where are we now and where should we go from here?. JITTA: Journal of Information Technology Theory and Application, 7 (2), 21-36.
[27] Cusumano, M. A. (2012). Technology strategy and management: Reflecting on the Facebook IPO. Communications of the ACM, 55 (10), 20-23.
[28] Damanpour, F. (1991). Organizational innovation: A meta-analysis of effects of determinants and moderators. Academy of Management Journal, 34 (3), 555-590.
[29] Deng, Y. & Xu, K. (2014). Chinese employees negotiating differing conflict management expectations in a U.S. based multinational corporation subsidiary in southwest China. Management Communication Quarterly, 28 (4), 609-624.
[30] Dibiaggio, L., Nasiriyar, M., & Nesta, L. (2014). Substitutability and complementarity of technological knowledge and the inventive performance of semiconductor companies. Research Policy, 43 (9), 1582-1593.
[31] Cisco & LIW (2015). Taking Cisco into a new era: The critical role of leadership development. EFMD Global Focus, 9(3), 1-6.
[32] Downs Jr., G. W., & Mohr, L. B. (1976). Conceptual issues in the study of innovation. Administrative Science Quarterly, 21 (4), 700-714.
[33] Drucker, P. F. (1994). Post-Capitalist Society. Abingdon-on-Thames, UK: Routledge.
Huang & Xu
The 17th International Conference on Electronic Business, Dubai, UAE, December 4-8, 2017284
[34] Feakins, M. (2009). Offshoring in the core: Russian software firms onshoring in the USA. Global Networks, 9 (1), 1-19. [35] Feuerstein, P. (2013). Patterns of work reorganization in the course of the IT industry's internationalization. Competition
& Change, 17 (1), 24-40. [36] Findikoglu, M. N. & Watson (2015). Do small and medium ed IT firms form service partnerships
with nonlocal IT firms? An assessment of facilitators. Journal of Small Business Management, 53 (4), 986-1010. [37] Gemser, G., Jacobs, D., & Ten Cate, R. (2006). Design and competitive advantage in technology-driven sectors: The Role
of usability and aesthetics in dutch it companies. Technology Analysis & Strategic Management, 18 (5), 561-580. [38] Globerman, S., Shapiro, D., & Vining, A. (2005). Clusters and intercluster spillovers: Their influence on the growth and
survival of Canadian information technology firms. Industrial and Corporate Change. [39] Goles, T., Hawk, S., & Kaiser, K. M. (2008). Information technology workforce skills: The software and IT services
provider perspective. Information Systems Frontiers, 10 (2), 179-194. [40] Grimshaw, D. & Miozzo, M. (2006). Institutional effects on the IT outsourcing market: Analysing clients, suppliers and
staff transfer in Germany and the UK. Organization Studies, 27 (9), 1229-1259. [41] Grimshaw, D. M., Marcela. (2009). New human resource management practices in knowledge-intensive business services
firms: The case of outsourcing with staff transfer. Human Relations, 62 (10), 1521-1550. [42] Grinstein, A. & Goldman, A. (2006). Characterizing the technology firm: An exploratory study. Research Policy, 35 (1),
121-143. [43] Grzunov, L. (2014). Evaluation of shared digital economy adoption: Case of Airbnb. In The 37th International
Convention on Information and Communication Technology, Electronics and Microelectronics (pp. 1574-1579). IEEE-MIPRO, Opatija, Croatia, May 26-30.
[44] Guo, Y. G. (2014). Energy and network aware workload management for sustainable data centers with thermal storage. IEEE Transactions on Parallel & Distributed Systems, 25 (8), 2030-2042.
[45] Halpern, S. W. & Johnson, P. (2014). Harmonising Copyright Law and Dealing with Dissonance: A Framework for Convergence of US And EU Law. Cheltenham, UK: Edward Elgar Publishing.
[46] Holsti, O. R. (1969). Content Analysis for the Social Sciences And Humanities. Boston, MA: Addison-Wesley Pub. Co.[47] Huang, Y. F. (2009). Strategic renewal within an information technology firm: Exploration, exploitation and corporate
venturing. International Journal of Entrepreneurial Behavior & Research, 15 (5), 436-452. [48] Huber, F. (2013). Knowledge-sourcing of R&D workers in different job positions: Contextualising external personal
knowledge networks. Research Policy, 42 (1), 167-179. [49] Hwang, J. H., Kim, M.S. & Chun, S.H. (2013). The role of R&D and corporate governance in Korea: IT firms versus
non-IT firms. Information Technology and Management, 14 (1), 29-41. [50] Ilinitch, A. Y., D'Aveni, R. A. & Lewin, A. Y. (1996). New organizational forms and strategies for managing in
hypercompetitive environments. Organization Science, 7 (3), 211-220. [51] James, T. L., Khansa, L., Cook, D. F., Bruyaka, O., & Keeling, K. B. (2013). Using network-based text analysis to
analyze trends in Microsoft's security innovations. Computers & Security, 36), 49-67. [52] Jha, A. K. & Bose, I. (2015). Innovation in IT firms: An investigation of intramural and extramural R&D activities and
their impact. Information & Management. [53] Kamath, B. (2008). Intellectual capital disclosure in India: Content analysis of “TecK” firms. Journal of Human Resource
Costing & Accounting, 12 (3), 213-224. [54] Kang, I., Han, S. & Shin, G.C. (2014). A process leading to strategic alliance outcome: The case of IT companies in
China, Japan and Korea. International Business Review, 23 (6), 1127-1138. [55] Kato, A. (2014). Software industry in okinawa: Is 'domestic offshore outsourcing' scheme feasible?. Computer Systems
Science and Engineering, 29 (1), 115-126. [56] Kemme, D. M., Nikolsko (2014). Foreign capital, spillovers and export performance in
emerging economies: Evidence from Indian IT firms. Review of Development Economics, 18 (4), 681-692. [57] Krippendorff, K. (2004). Reliability in content analysis. Human Communication Research, 30 (3), 411-433. [58] Kucherov, D. & Zamulin, A. (2016). Employer branding practices for young talents in IT companies. Human Resource
Development International, 19 (2), 178-188. [59] Lee, B., Cho, H. H., & Shin, J. (2015). The relationship between inbound open innovation patents and financial
performance: Evidence from global information technology companies. Asian Journal of Technology Innovation, 23 (3), 289-303.
[60] Locke, K. & Golden-Biddle, K. (1997). Constructing opportunities for contribution: Structuring intertextual coherence and “problematizing” in organizational studies. Academy of Management Journal, 40 (5), 1023-1062.
[61] Mathiassen, G. (2008). Between control and drift: Negotiating improvement in a small software firm. Information Technology & People, 21 (1), 69-90.
[62] Miozzo, M. (2008). Service multinationals and forward linkages with client firms: The case of IT outsourcing in Argentina and Brazil. International Business Review, 17 (1), 8-27.
[63] Molla, A. (2013). Identifying IT sustainability performance drivers: Instrument development and validation. Information Systems Frontiers, 15 (5), 705-723.
[64] Nidumolu, R., Prahalad, C. K. & Rangaswami, M. R. (2009). Why sustainability is now the key driver of innovation. Harvard Business Review, 87 (9), 56-64.
[65] Ovidiu-Iliuta, D. (2014). The link between organizatoinal culture and performance management practice: A case of IT companies form Romania. Annals of the University of Oradea, Economic Science Series, 23 (1), 1156-1163.
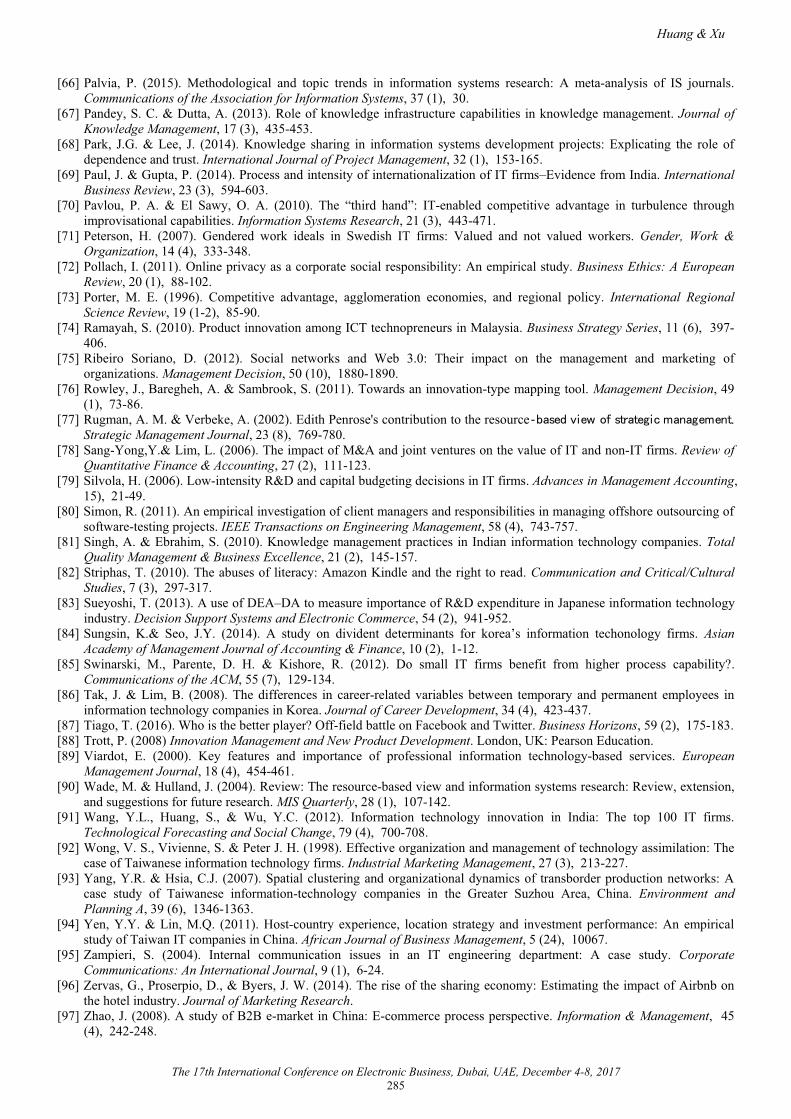
Huang & Xu
The 17th International Conference on Electronic Business, Dubai, UAE, December 4-8, 2017285
[66] Palvia, P. (2015). Methodological and topic trends in information systems research: A meta-analysis of IS journals. Communications of the Association for Information Systems, 37 (1), 30.
[67] Pandey, S. C. & Dutta, A. (2013). Role of knowledge infrastructure capabilities in knowledge management. Journal of Knowledge Management, 17 (3), 435-453.
[68] Park, J.G. & Lee, J. (2014). Knowledge sharing in information systems development projects: Explicating the role of dependence and trust. International Journal of Project Management, 32 (1), 153-165.
[69] Paul, J. & Gupta, P. (2014). Process and intensity of internationalization of IT firms–Evidence from India. International Business Review, 23 (3), 594-603.
[70] Pavlou, P. A. & El Sawy, O. A. (2010). The “third hand”: IT-enabled competitive advantage in turbulence through improvisational capabilities. Information Systems Research, 21 (3), 443-471.
[71] Peterson, H. (2007). Gendered work ideals in Swedish IT firms: Valued and not valued workers. Gender, Work & Organization, 14 (4), 333-348.
[72] Pollach, I. (2011). Online privacy as a corporate social responsibility: An empirical study. Business Ethics: A European Review, 20 (1), 88-102.
[73] Porter, M. E. (1996). Competitive advantage, agglomeration economies, and regional policy. International Regional Science Review, 19 (1-2), 85-90.
[74] Ramayah, S. (2010). Product innovation among ICT technopreneurs in Malaysia. Business Strategy Series, 11 (6), 397-406.
[75] Ribeiro Soriano, D. (2012). Social networks and Web 3.0: Their impact on the management and marketing of organizations. Management Decision, 50 (10), 1880-1890.
[76] Rowley, J., Baregheh, A. & Sambrook, S. (2011). Towards an innovation-type mapping tool. Management Decision, 49(1), 73-86.
[77] Rugman, A. M. & Verbeke, A. (2002). Edith Penrose's contribution to the resource . Strategic Management Journal, 23 (8), 769-780.
[78] Sang-Yong,Y.& Lim, L. (2006). The impact of M&A and joint ventures on the value of IT and non-IT firms. Review of Quantitative Finance & Accounting, 27 (2), 111-123.
[79] Silvola, H. (2006). Low-intensity R&D and capital budgeting decisions in IT firms. Advances in Management Accounting, 15), 21-49.
[80] Simon, R. (2011). An empirical investigation of client managers and responsibilities in managing offshore outsourcing ofsoftware-testing projects. IEEE Transactions on Engineering Management, 58 (4), 743-757.
[81] Singh, A. & Ebrahim, S. (2010). Knowledge management practices in Indian information technology companies. Total Quality Management & Business Excellence, 21 (2), 145-157.
[82] Striphas, T. (2010). The abuses of literacy: Amazon Kindle and the right to read. Communication and Critical/Cultural Studies, 7 (3), 297-317.
[83] Sueyoshi, T. (2013). A use of DEA–DA to measure importance of R&D expenditure in Japanese information technology industry. Decision Support Systems and Electronic Commerce, 54 (2), 941-952.
[84] Sungsin, K.& Seo, J.Y. (2014). A study on divident determinants for korea’s information techonology firms. Asian Academy of Management Journal of Accounting & Finance, 10 (2), 1-12.
[85] Swinarski, M., Parente, D. H. & Kishore, R. (2012). Do small IT firms benefit from higher process capability?. Communications of the ACM, 55 (7), 129-134.
[86] Tak, J. & Lim, B. (2008). The differences in career-related variables between temporary and permanent employees in information technology companies in Korea. Journal of Career Development, 34 (4), 423-437.
[87] Tiago, T. (2016). Who is the better player? Off-field battle on Facebook and Twitter. Business Horizons, 59 (2), 175-183. [88] Trott, P. (2008) Innovation Management and New Product Development. London, UK: Pearson Education.[89] Viardot, E. (2000). Key features and importance of professional information technology-based services. European
Management Journal, 18 (4), 454-461. [90] Wade, M. & Hulland, J. (2004). Review: The resource-based view and information systems research: Review, extension,
and suggestions for future research. MIS Quarterly, 28 (1), 107-142. [91] Wang, Y.L., Huang, S., & Wu, Y.C. (2012). Information technology innovation in India: The top 100 IT firms.
Technological Forecasting and Social Change, 79 (4), 700-708. [92] Wong, V. S., Vivienne, S. & Peter J. H. (1998). Effective organization and management of technology assimilation: The
case of Taiwanese information technology firms. Industrial Marketing Management, 27 (3), 213-227. [93] Yang, Y.R. & Hsia, C.J. (2007). Spatial clustering and organizational dynamics of transborder production networks: A
case study of Taiwanese information-technology companies in the Greater Suzhou Area, China. Environment and Planning A, 39 (6), 1346-1363.
[94] Yen, Y.Y. & Lin, M.Q. (2011). Host-country experience, location strategy and investment performance: An empirical study of Taiwan IT companies in China. African Journal of Business Management, 5 (24), 10067.
[95] Zampieri, S. (2004). Internal communication issues in an IT engineering department: A case study. Corporate Communications: An International Journal, 9 (1), 6-24.
[96] Zervas, G., Proserpio, D., & Byers, J. W. (2014). The rise of the sharing economy: Estimating the impact of Airbnb on the hotel industry. Journal of Marketing Research.
[97] Zhao, J. (2008). A study of B2B e-market in China: E-commerce process perspective. Information & Management, 45(4), 242-248.
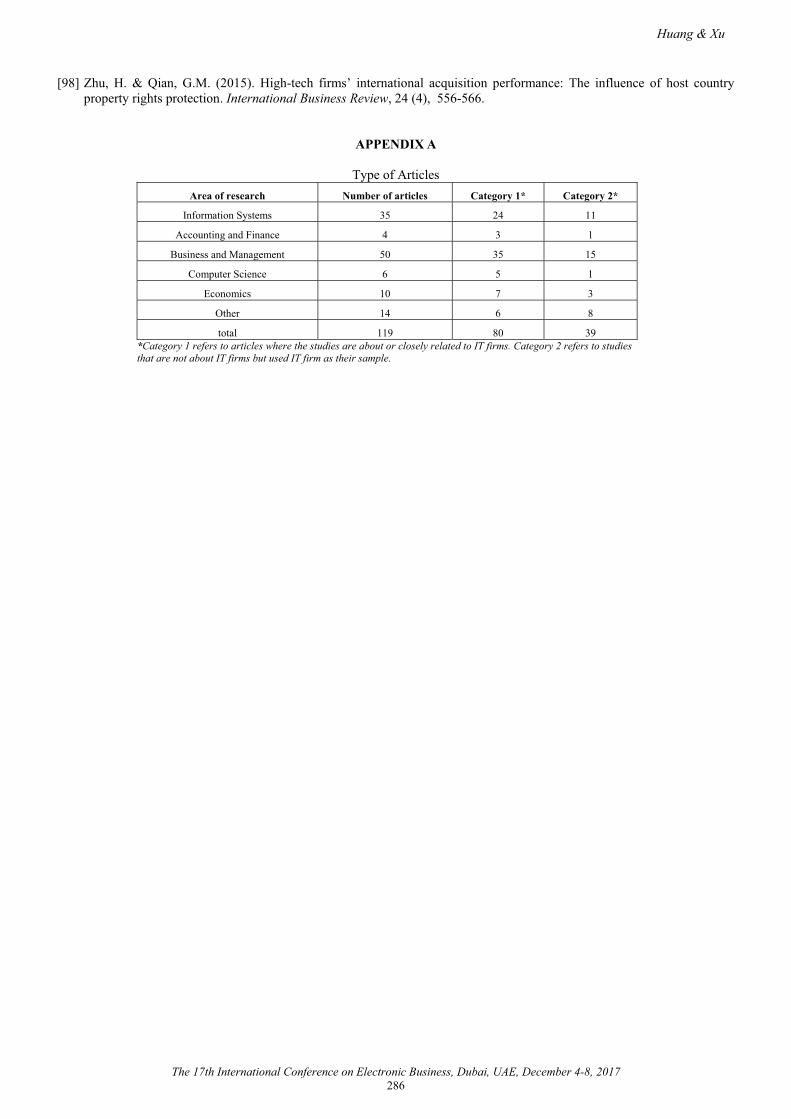
Huang & Xu
The 17th International Conference on Electronic Business, Dubai, UAE, December 4-8, 2017286
[98] Zhu, H. & Qian, G.M. (2015). High-tech firms’ international acquisition performance: The influence of host country property rights protection. International Business Review, 24 (4), 556-566.
APPENDIX A
Type of ArticlesArea of research Number of articles Category 1* Category 2*
Information Systems 35 24 11
Accounting and Finance 4 3 1
Business and Management 50 35 15
Computer Science 6 5 1
Economics 10 7 3
Other 14 6 8
total 119 80 39*Category 1 refers to articles where the studies are about or closely related to IT firms. Category 2 refers to studies that are not about IT firms but used IT firm as their sample.
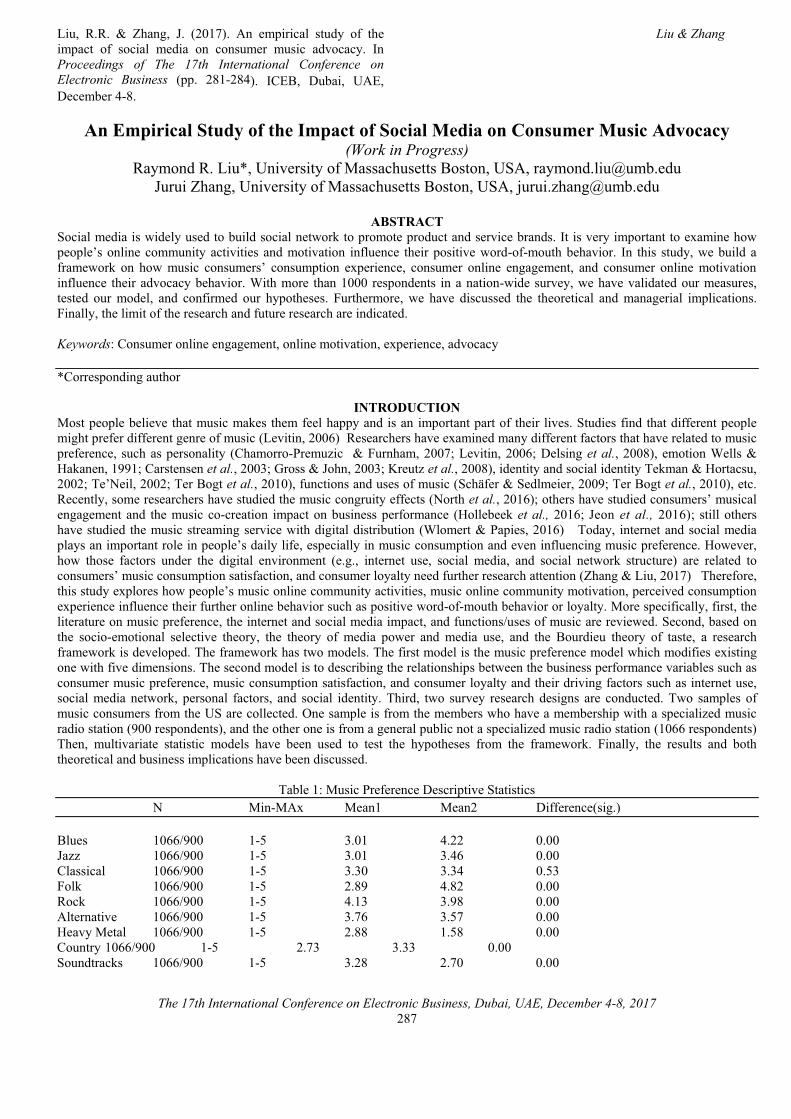
Liu, R.R. & Zhang, J. (2017). An empirical study of the impact of social media on consumer music advocacy. InProceedings of The 17th International Conference on Electronic Business (pp. 281-284). ICEB, Dubai, UAE, December 4-8.
Liu & Zhang
The 17th International Conference on Electronic Business, Dubai, UAE, December 4-8, 2017287
An Empirical Study of the Impact of Social Media on Consumer Music Advocacy(Work in Progress)
Raymond R. Liu*, University of Massachusetts Boston, USA, [email protected] Zhang, University of Massachusetts Boston, USA, [email protected]
ABSTRACTSocial media is widely used to build social network to promote product and service brands. It is very important to examine how people’s online community activities and motivation influence their positive word-of-mouth behavior. In this study, we build a framework on how music consumers’ consumption experience, consumer online engagement, and consumer online motivation influence their advocacy behavior. With more than 1000 respondents in a nation-wide survey, we have validated our measures, tested our model, and confirmed our hypotheses. Furthermore, we have discussed the theoretical and managerial implications. Finally, the limit of the research and future research are indicated.
Keywords: Consumer online engagement, online motivation, experience, advocacy
*Corresponding author
INTRODUCTIONMost people believe that music makes them feel happy and is an important part of their lives. Studies find that different people might prefer different genre of music (Levitin, 2006) Researchers have examined many different factors that have related to music preference, such as personality (Chamorro-Premuzic & Furnham, 2007; Levitin, 2006; Delsing et al., 2008), emotion Wells & Hakanen, 1991; Carstensen et al., 2003; Gross & John, 2003; Kreutz et al., 2008), identity and social identity Tekman & Hortacsu, 2002; Te’Neil, 2002; Ter Bogt et al., 2010), functions and uses of music (Schäfer & Sedlmeier, 2009; Ter Bogt et al., 2010), etc. Recently, some researchers have studied the music congruity effects (North et al., 2016); others have studied consumers’ musical engagement and the music co-creation impact on business performance (Hollebeek et al., 2016; Jeon et al., 2016); still others have studied the music streaming service with digital distribution (Wlomert & Papies, 2016) Today, internet and social media plays an important role in people’s daily life, especially in music consumption and even influencing music preference. However, how those factors under the digital environment (e.g., internet use, social media, and social network structure) are related to consumers’ music consumption satisfaction, and consumer loyalty need further research attention (Zhang & Liu, 2017) Therefore, this study explores how people’s music online community activities, music online community motivation, perceived consumption experience influence their further online behavior such as positive word-of-mouth behavior or loyalty. More specifically, first, the literature on music preference, the internet and social media impact, and functions/uses of music are reviewed. Second, based on the socio-emotional selective theory, the theory of media power and media use, and the Bourdieu theory of taste, a research framework is developed. The framework has two models. The first model is the music preference model which modifies existing one with five dimensions. The second model is to describing the relationships between the business performance variables such as consumer music preference, music consumption satisfaction, and consumer loyalty and their driving factors such as internet use, social media network, personal factors, and social identity. Third, two survey research designs are conducted. Two samples of music consumers from the US are collected. One sample is from the members who have a membership with a specialized music radio station (900 respondents), and the other one is from a general public not a specialized music radio station (1066 respondents)Then, multivariate statistic models have been used to test the hypotheses from the framework. Finally, the results and both theoretical and business implications have been discussed.
Table 1: Music Preference Descriptive StatisticsN Min-MAx Mean1 Mean2 Difference(sig.)
Blues 1066/900 1-5 3.01 4.22 0.00Jazz 1066/900 1-5 3.01 3.46 0.00Classical 1066/900 1-5 3.30 3.34 0.53Folk 1066/900 1-5 2.89 4.82 0.00Rock 1066/900 1-5 4.13 3.98 0.00Alternative 1066/900 1-5 3.76 3.57 0.00Heavy Metal 1066/900 1-5 2.88 1.58 0.00Country 1066/900 1-5 2.73 3.33 0.00Soundtracks 1066/900 1-5 3.28 2.70 0.00
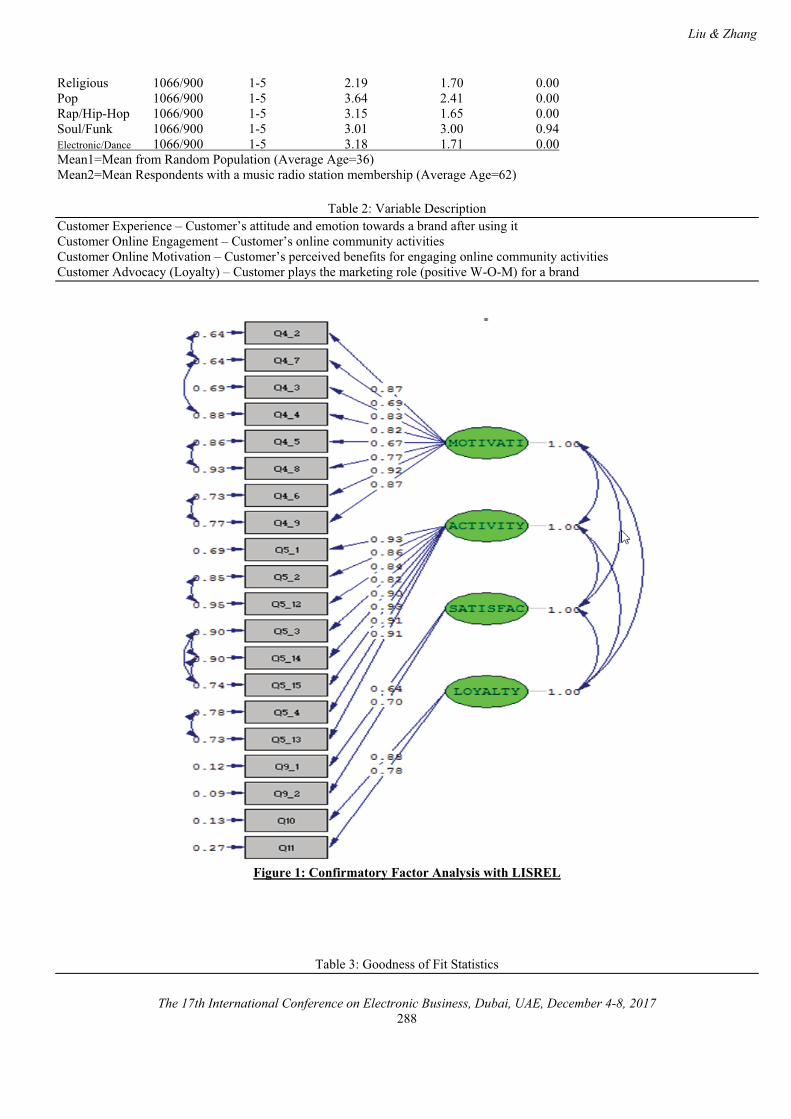
Liu & Zhang
The 17th International Conference on Electronic Business, Dubai, UAE, December 4-8, 2017288
Religious 1066/900 1-5 2.19 1.70 0.00Pop 1066/900 1-5 3.64 2.41 0.00Rap/Hip-Hop 1066/900 1-5 3.15 1.65 0.00Soul/Funk 1066/900 1-5 3.01 3.00 0.94Electronic/Dance 1066/900 1-5 3.18 1.71 0.00Mean1=Mean from Random Population (Average Age=36)Mean2=Mean Respondents with a music radio station membership (Average Age=62)
Table 2: Variable DescriptionCustomer Experience – Customer’s attitude and emotion towards a brand after using it Customer Online Engagement – Customer’s online community activitiesCustomer Online Motivation – Customer’s perceived benefits for engaging online community activitiesCustomer Advocacy (Loyalty) – Customer plays the marketing role (positive W-O-M) for a brand
Figure 1: Confirmatory Factor Analysis with LISREL
Table 3: Goodness of Fit Statistics
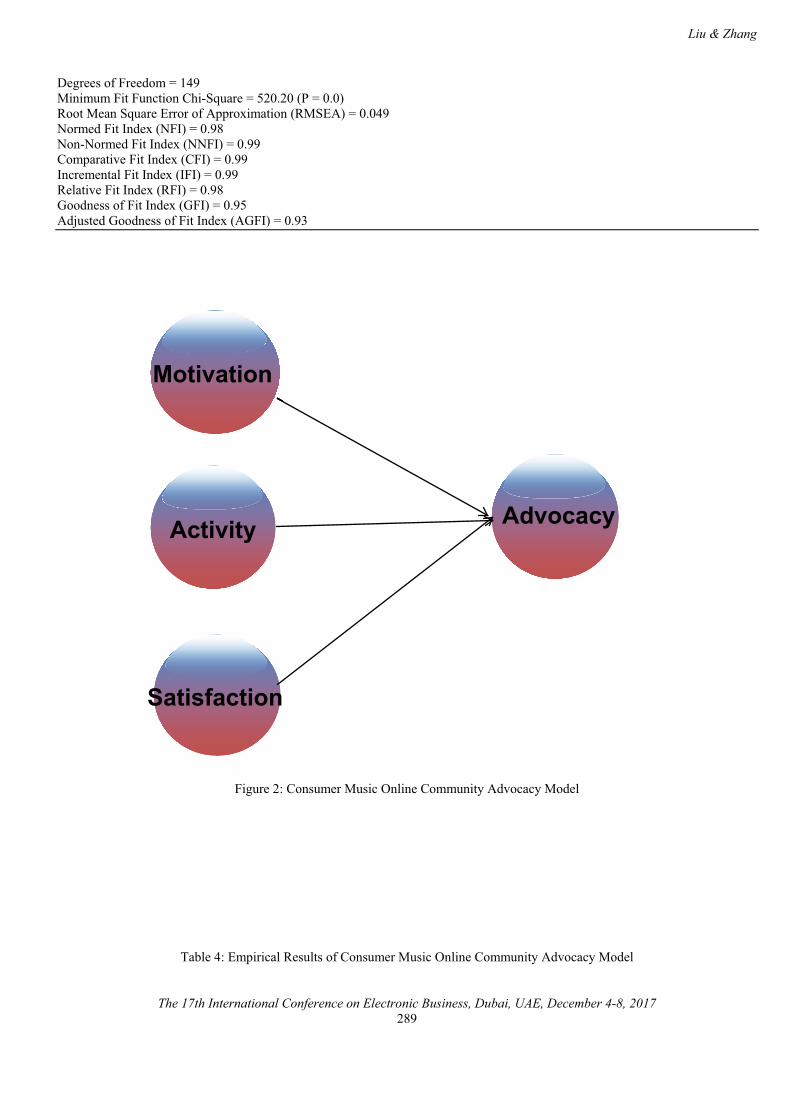
Liu & Zhang
The 17th International Conference on Electronic Business, Dubai, UAE, December 4-8, 2017289
Degrees of Freedom = 149Minimum Fit Function Chi-Square = 520.20 (P = 0.0)Root Mean Square Error of Approximation (RMSEA) = 0.049Normed Fit Index (NFI) = 0.98Non-Normed Fit Index (NNFI) = 0.99Comparative Fit Index (CFI) = 0.99Incremental Fit Index (IFI) = 0.99Relative Fit Index (RFI) = 0.98Goodness of Fit Index (GFI) = 0.95Adjusted Goodness of Fit Index (AGFI) = 0.93
Figure 2: Consumer Music Online Community Advocacy Model
Table 4: Empirical Results of Consumer Music Online Community Advocacy Model
Activity
Motivation
Satisfaction
Advocacy
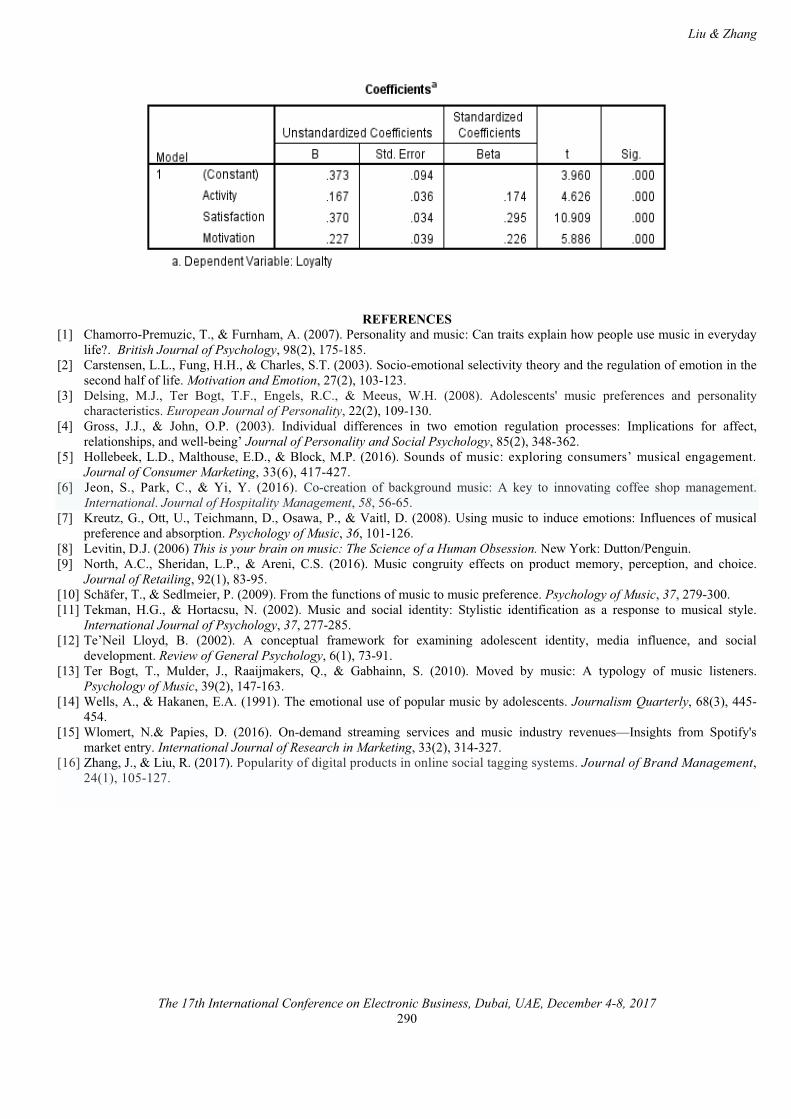
Liu & Zhang
The 17th International Conference on Electronic Business, Dubai, UAE, December 4-8, 2017290
REFERENCES[1] Chamorro-Premuzic, T., & Furnham, A. (2007). Personality and music: Can traits explain how people use music in everyday
life?. British Journal of Psychology, 98(2), 175-185.[2] Carstensen, L.L., Fung, H.H., & Charles, S.T. (2003). Socio-emotional selectivity theory and the regulation of emotion in the
second half of life. Motivation and Emotion, 27(2), 103-123.[3] Delsing, M.J., Ter Bogt, T.F., Engels, R.C., & Meeus, W.H. (2008). Adolescents' music preferences and personality
characteristics. European Journal of Personality, 22(2), 109-130.[4] Gross, J.J., & John, O.P. (2003). Individual differences in two emotion regulation processes: Implications for affect,
relationships, and well-being’ Journal of Personality and Social Psychology, 85(2), 348-362.[5] Hollebeek, L.D., Malthouse, E.D., & Block, M.P. (2016). Sounds of music: exploring consumers’ musical engagement.
Journal of Consumer Marketing, 33(6), 417-427.[6] Jeon, S., Park, C., & Yi, Y. (2016). Co-creation of background music: A key to innovating coffee shop management.
International. Journal of Hospitality Management, 58, 56-65.[7] Kreutz, G., Ott, U., Teichmann, D., Osawa, P., & Vaitl, D. (2008). Using music to induce emotions: Influences of musical
preference and absorption. Psychology of Music, 36, 101-126.[8] Levitin, D.J. (2006) This is your brain on music: The Science of a Human Obsession. New York: Dutton/Penguin.[9] North, A.C., Sheridan, L.P., & Areni, C.S. (2016). Music congruity effects on product memory, perception, and choice.
Journal of Retailing, 92(1), 83-95.[10] Schäfer, T., & Sedlmeier, P. (2009). From the functions of music to music preference. Psychology of Music, 37, 279-300.[11] Tekman, H.G., & Hortacsu, N. (2002). Music and social identity: Stylistic identification as a response to musical style.
International Journal of Psychology, 37, 277-285.[12] Te’Neil Lloyd, B. (2002). A conceptual framework for examining adolescent identity, media influence, and social
development. Review of General Psychology, 6(1), 73-91.[13] Ter Bogt, T., Mulder, J., Raaijmakers, Q., & Gabhainn, S. (2010). Moved by music: A typology of music listeners.
Psychology of Music, 39(2), 147-163.[14] Wells, A., & Hakanen, E.A. (1991). The emotional use of popular music by adolescents. Journalism Quarterly, 68(3), 445-
454.[15] Wlomert, N.& Papies, D. (2016). On-demand streaming services and music industry revenues—Insights from Spotify's
market entry. International Journal of Research in Marketing, 33(2), 314-327.[16] Zhang, J., & Liu, R. (2017). Popularity of digital products in online social tagging systems. Journal of Brand Management,
24(1), 105-127.
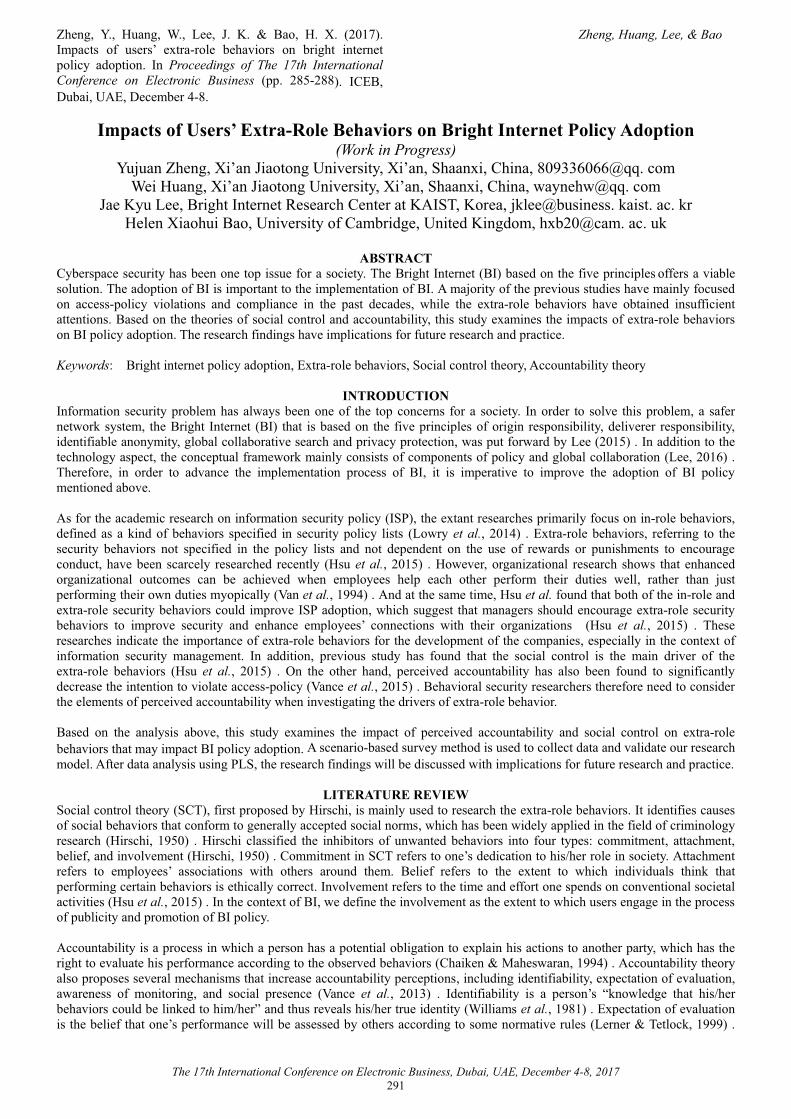
Zheng, Y., Huang, W., Lee, J. K. & Bao, H. X. (2017).Impacts of users’ extra-role behaviors on bright internet policy adoption. In Proceedings of The 17th International Conference on Electronic Business (pp. 285-288). ICEB, Dubai, UAE, December 4-8.
Zheng, Huang, Lee, & Bao
The 17th International Conference on Electronic Business, Dubai, UAE, December 4-8, 2017 291
Impacts of Users’ Extra-Role Behaviors on Bright Internet Policy Adoption(Work in Progress)
Yujuan Zheng, Xi’an Jiaotong University, Xi’an, Shaanxi, China, 809336066@qq. comWei Huang, Xi’an Jiaotong University, Xi’an, Shaanxi, China, waynehw@qq. com
Jae Kyu Lee, Bright Internet Research Center at KAIST, Korea, jklee@business. kaist. ac. krHelen Xiaohui Bao, University of Cambridge, United Kingdom, hxb20@cam. ac. uk
ABSTRACTCyberspace security has been one top issue for a society. The Bright Internet (BI) based on the five principles offers a viablesolution. The adoption of BI is important to the implementation of BI. A majority of the previous studies have mainly focused on access-policy violations and compliance in the past decades, while the extra-role behaviors have obtained insufficient attentions. Based on the theories of social control and accountability, this study examines the impacts of extra-role behaviors on BI policy adoption. The research findings have implications for future research and practice.
Keywords: Bright internet policy adoption, Extra-role behaviors, Social control theory, Accountability theory
INTRODUCTIONInformation security problem has always been one of the top concerns for a society. In order to solve this problem, a safer network system, the Bright Internet (BI) that is based on the five principles of origin responsibility, deliverer responsibility, identifiable anonymity, global collaborative search and privacy protection, was put forward by Lee (2015) . In addition to the technology aspect, the conceptual framework mainly consists of components of policy and global collaboration (Lee, 2016) . Therefore, in order to advance the implementation process of BI, it is imperative to improve the adoption of BI policy mentioned above.
As for the academic research on information security policy (ISP), the extant researches primarily focus on in-role behaviors, defined as a kind of behaviors specified in security policy lists (Lowry et al., 2014) . Extra-role behaviors, referring to the security behaviors not specified in the policy lists and not dependent on the use of rewards or punishments to encourage conduct, have been scarcely researched recently (Hsu et al., 2015) . However, organizational research shows that enhanced organizational outcomes can be achieved when employees help each other perform their duties well, rather than just performing their own duties myopically (Van et al., 1994) . And at the same time, Hsu et al. found that both of the in-role and extra-role security behaviors could improve ISP adoption, which suggest that managers should encourage extra-role security behaviors to improve security and enhance employees’ connections with their organizations (Hsu et al., 2015) . These researches indicate the importance of extra-role behaviors for the development of the companies, especially in the context of information security management. In addition, previous study has found that the social control is the main driver of the extra-role behaviors (Hsu et al., 2015) . On the other hand, perceived accountability has also been found to significantly decrease the intention to violate access-policy (Vance et al., 2015) . Behavioral security researchers therefore need to consider the elements of perceived accountability when investigating the drivers of extra-role behavior.
Based on the analysis above, this study examines the impact of perceived accountability and social control on extra-role behaviors that may impact BI policy adoption. A scenario-based survey method is used to collect data and validate our research model. After data analysis using PLS, the research findings will be discussed with implications for future research and practice.
LITERATURE REVIEWSocial control theory (SCT), first proposed by Hirschi, is mainly used to research the extra-role behaviors. It identifies causes of social behaviors that conform to generally accepted social norms, which has been widely applied in the field of criminology research (Hirschi, 1950) . Hirschi classified the inhibitors of unwanted behaviors into four types: commitment, attachment, belief, and involvement (Hirschi, 1950) . Commitment in SCT refers to one’s dedication to his/her role in society. Attachment refers to employees’ associations with others around them. Belief refers to the extent to which individuals think that performing certain behaviors is ethically correct. Involvement refers to the time and effort one spends on conventional societal activities (Hsu et al., 2015) . In the context of BI, we define the involvement as the extent to which users engage in the process of publicity and promotion of BI policy.
Accountability is a process in which a person has a potential obligation to explain his actions to another party, which has the right to evaluate his performance according to the observed behaviors (Chaiken & Maheswaran, 1994) . Accountability theory also proposes several mechanisms that increase accountability perceptions, including identifiability, expectation of evaluation, awareness of monitoring, and social presence (Vance et al., 2013) . Identifiability is a person’s “knowledge that his/herbehaviors could be linked to him/her” and thus reveals his/her true identity (Williams et al., 1981) . Expectation of evaluation is the belief that one’s performance will be assessed by others according to some normative rules (Lerner & Tetlock, 1999) .
Zheng, Huang, Lee & Bao
The 17th International Conference on Electronic Business, Dubai, UAE, December 4-8, 2017 292
Monitoring is the process of watching or tracking a user’s activities (Griffith, 1993) . Social presence is the awareness of other users in the system (Walther, 1992) .
As for the academic research on ISP, previous researches widely investigated the security related in-role behaviors based on deterrence theory, protection motivation theory and so on, concluding that managers should pay more attention to encourage employees to comply with the security related policies (Lowry et al., 2014; Bovens, 2010) . Comparing to in-role behaviors, extra-role behaviors initiatively refer to the positive or prosocial behaviors in a collaborative working environment. Especially, Griffith (1993) emphasized the necessity of extra-role behaviors in the interdependent context, which has been scarcely researched in the environment of emerging new technology. Given for the limitation of existing literatures, we would like to investigate the impact of social control and perceived accountability on extra-role behaviors that may impact BI policyadoption.
RESEARCH MODELIn our research context, BI has not been put into effect so far due to the higher adherence to the current internet system, difficult coordination among the global participants and so on. Therefore, uncertainty and interdependence are significant features of BI. Correspondingly, extra-role behaviors in our context could include preferring to conducting the highly uncertain tasks (i. e., initiative) and performing altruistic behaviors to aid others (i. e., helping).
We argue that social control could boost the extra-role behaviors from the perspective of commitment (Wiener, 1982; Scholl, 1981; Mowday et al., 1979) , attachment (Dyne et al., 1994) , internalized belief and involvement based on SCT (Irvin & Stansbury, 2004; Allen & Meyer, 1990) . According to the same logic, we expect that accountability related to organizational security is positively associated with extra-role security behaviors towards BI policy through identifiability, expectation of evaluation (Hochwarter et al., 2007; Sedikides et al., 2002; Lerner & Tetlock, 1999; Geen, 1991) , awareness of monitoring(Vance et al., 2015; Bond & Titus, 1983) and social presence based on accountability theory (Robert et al., 1991; Guerin, 1986; Bond & Titus, 1983) .
According to SCT and accountability theory, we argue that the relationship between involvement and expectation of evaluation could be interactive with each other (Hsu et al., 2015) ; We also propose that the user’s prosocial behaviors could be improved due to the increasing level of social presence, especially with the existence of his intimate relatives (Vance et al., 2013; Walther, 1992) . Individuals who have strong beliefs are more likely to generate favorable attitudes toward extra-role behaviors, especially when being monitored, because they want to present their internalized belief by means of being observed by the others; Finally, when individuals sense that they are distinguishable within a group, their commitment to the organization would be increased because some scholars argue that commitment drives employees to perform altruistic behaviors by promoting their identification with the organization (Organ & Ryan, 1995; Wiener, 1982; Mowday et al., 1979) , which could increase their extra-role behaviors towards BI policy.
In the process of BI policy adoption, the extra-role behavior of BI may be important. When employees perform initiative behaviors as well as help some employees who don’t understand the content of BI policy, they may hold a positive attitude orperceive a higher level of behavioral control, which would probably increase the adoption of BI policy (Chang et al., 2012; Ajzen, 2002) .
Based on the analysis, we propose that the two mechanisms, the social control and accountability, may impact extra-role behaviors positively, leading to a higher level of BI policy adoption. The research model is shown below.
Fig. 1. Modified Research Model
Zheng, Huang, Lee & Bao
The 17th International Conference on Electronic Business, Dubai, UAE, December 4-8, 2017 293
METHODOLOGYWe would like to adopt the scenario method, which has more advantages than the traditional survey. As for the scenario instruments, it will involve pre-scenario items, an instructional scenario and post-scenario items, all of which will be adjusted from the existing instruments. In this study, we treat the social control as a second-order formative construct including four reflective constructs. Commitment was measured with three items adapted from Meyer and Herscovitch (2001) . Involvement was assessed with five items developed by Lee (2016) . Attachment was assessed with three items adapted from Chiu et al.(2006) . Belief was measured with three items adapted from Ajzen (2002) . Identifiability, expectation of evaluation, awareness of monitoring, and social presence, all of which are components of accountability, were measured by items adapted from Vance(Vance et al., 2015; Vance et al., 2013) . The measures for adoption towards BI policy were adapted from Woon andKankanhalli (2007) . After refining the measurement scale, we will collect data through Questionnaire Star, which is a well-established questionnaire collection platform in China to validate our proposed model.
DISCUSSIONSTheoretical ContributionThere may be two main contributions of the current research. First, this study examines the effect of perceived accountability and social control on employees’ extra-role behaviors, while most previous researches mainly focused on studying the intention to violate or comply with ISP. Second, the proposal investigates the interaction effect of social control and perceived accountability on employees’ extra-role behaviors, which has not been researched in the literature.
Practical ContributionThis study could improve the extra-role behavior of BI policy, and then probably promote the possibility of successful application of BI.
CONCLUSIONSThis work significantly contributes to the information security field by identifying potential determinants of BI policy adoption from a different perspective. By using social control theory and accountability theory, this study discusses that only combining social control and accountability together, could the extra-role behavior be improved greatly, then resulting in the increased level of perceived adoption towards BI policy.
REFERENCES[1] Ajzen, I. (2002). Perceived behavioral control, self-efficacy, locus of control, and the theory of planned behavior. Journal
of Applied Social Psychology, 32(4), 665–683. [2] Allen, N. J., & Meyer, J. P. (1990). The Measurement and Antecendent of Affective Continuance And Normative
Commitment To The Organization Journal of Occupational Psychology. Journal of Occupational Psychology, 63, 1–18. [3] Anthony Vance, Paul Benjamin Lowry, & D. E. (2013). Using accountability to reduce access policy violations in
information systems. Journal of Management Information Systems, 29(4), 263–290. [4] Bond, C. F., & Titus, L. J. (1983). Social facilitation: A meta-analysis of 241 studies. Psychological Bulletin, 94(2),
265–292. [5] Bovens, M. (2010). Two concepts of accountability: Accountability as a virtue and as a mechanism. West European
Politics, 33(5), 946–967. [6] Chaiken, S., & Maheswaran, D. (1994). Heuristic processing can bias systematic processing: Effects of source credibility,
argument ambiguity, and task importance on attitude judgment. Journal of Personality and Social Psychology, 66(3), 460-473.
[7] Chang, A. J. -T., Wu, C. -Y., & Liu, H. -W. (2012). The effects of job satisfaction and organization commitment on information security policy adoption and compliance. In 2012 IEEE International Conference on Management of Innovation and Technology (pp. 442–446). IEEE, Bali, Indonesia, June 11-13.
[8] Chiu, C. -M., Hsu, M. -H., & Wang, E. T. G. (2006). Understanding knowledge sharing in virtual communities: An integration of social capital and social cognitive theories. Decision Support Systems, 42(3), 1872–1888.
[9] Dyne, L. Van, Graham, J. W., & Dienesch, R. M. (1994). Organizational Citizenship Behavior: Construct Redefinition, Measurement, and Validation. Academy of Management Journal, 37(4), 765–802.
[10] Geen, R. G. (1991). Social motivation. Annual Review of Psychology, 42(1), 377–399. [11] Griffith, T. L. (1993). Monitoring and performance: A comparison of computer and supervisor monitoring. Journal of
Applied Social Psychology, 23(7), 549–572. [12] Guerin, B. (1986). Mere presence effects in humans: A review. Journal of Experimental Social Psychology, 22(1), 38–77. [13] Hirschi, T. (1950). The causes of delinquency. British Medical Journal, 2(4674), 335–336. [14] Hochwarter, W. A., Ferris, G. R., Gavin, M. B., Perrewé, P. L., Hall, A. T., & Frink, D. D. (2007). Political skill as
neutralizer of felt accountability—Job tension effects on job performance ratings: A longitudinal investigation. Organizational Behavior and Human Decision Processes, 102(2), 226–239.
[15] Hsu, J.S.C., Shih, S. P., Yu, W. H., & Lowry, P. B. (2015). The role of extra-role behaviors and social controls in information security policy effectiveness. Information Systems Research, 26(2), 282–300.
[16] Irvin, R. A., & Stansbury, J. (2004). Citizen participation in decision making: Is it worth the effort?. Public Administration Review, 64(1), 55–65.
Zheng, Huang, Lee & Bao
The 17th International Conference on Electronic Business, Dubai, UAE, December 4-8, 2017 294
[17] Lee, J. K. (2015). Guest editorial: Research framework for AIS grand vision of the bright ICT initiative. MIS Quarterly, 39(2), iii–xii.
[18] Lee, J. K. (2016). Invited commentary—Reflections on ICT-enabled bright society research. Information Systems Research, 27(1), 1–5.
[19] Lerner, J. S., & Tetlock, P. E. (1999). Accounting for the effects of accountability. Psychological Bulletin, 125(2), 255. [20] Lowry, P. B., Posey, C., Roberts, T. L., & Bennett, R. J. (2014). Is your banker leaking your personal information? The
roles of ethics and individual-level cultural characteristics in predicting organizational computer abuse. Journal of Business Ethics, 121(3), 385–401.
[21] Meyer, J. P., & Herscovitch, L. (2001). Commitment in the workplace: Toward a general model. Human Resource Management Review, 11(3), 299–326.
[22] Mowday, R. T., Steers, R. M., & Porter, L. W. (1979). The measurement of organizational commitment. Journal of Vocational Behavior, 14(2), 224–247.
[23] Organ, D. W., & Ryan, K. (1995). A meta-analytic review of attitudinal and dispositional predictors of organizational citizenship behavior. Personnel Psychology, 48(4), 775–802.
[24] Robert A. McLean, W. L. S. and W. W. S. (1991). A unified approach to mixed linear models. The American Statistician, 45(1), 54–64.
[25] Scholl, R. W. (1981). Differentiating organizational commitment from expectancy as a motivating force. Academy of Management Review, 6(4), 589–599.
[26] Sedikides, C., Herbst, K. C., Hardin, D. P., & Dardis, G. J. (2002). Accountability as a deterrent to self-enhancement: The search for mechanisms. Journal of Personality and Social Psychology, 83(3), 592–605.
[27] Hsu, J. S. C., Shih, S. P., Hung, Y. W., & Lowry, P. B. (2015). The role of extra-role behaviors and social controls in information security policy effectiveness. Information Systems Research, 26(2), 282-300.
[28] Van Dyne, L., W. Graham, J., & M. Dienesch, R. (1994). Organizational citizenship behavior: Construct redefinition, measurement, and validation. Academy of Management Journal, 37(4), 765–802.
[29] Vance, A., Lowry, P. B., & Eggett, D. (2013). Using accountability to reduce access policy violations in information systems. Journal of Management Information Systems, 29(4), 263–290.
[30] Vance, A., Lowry, P. B., & Eggett, D. (2015). Increasing accountability through user-interface design artifacts: A new approach to addressing the problem of access-policy violations. MIS Quarterly, 39(2), 345–366.
[31] Walther, J. B. (1992). Interpersonal effects in computer-meditated interaction: A relational perspective. Communication Research, 19(1), 52-90.
[32] Wiener, Y. (1982). Commitment in organizations: A normative view. Academy of Management Review, 7(3), 418–428. [33] Williams, K., Harkins, S. G., Latané, B., & Latane, B. (1981). Identifiability as a deterrant to social loafing: Two cheering
experiments. Journal of Personality and Social Psychology, 40(2), 303–311. [34] Woon, I. M. Y., & Kankanhalli, A. (2007). Investigation of IS professionals’ intention to practise secure development of
applications. International Journal of Human-Computer Studies, 65(1), 29-41.
Chuang, H.C. & Chang, H.L. & Hsu, P.C. (2017). Improving the performance of inventory control– Taking W company as an example. In Proceedings of The 17th International Conference on Electronic Business (pp. 289-292). ICEB, Dubai, UAE, December 4-8.
Chuang, Chang & Hsu
The 17th International Conference on Electronic Business, Dubai, UAE, December 4-8, 2017295
Improving The Performance of Inventory Control – Taking W Company as anExample
(Work in Progress)Howard Hao-Chun Chuang, National Chengchi University, Taiwan, [email protected]
Hsin-lu Chang, National Chengchi University, Taiwan, [email protected] Hsu*, National Chengchi University, Taiwan, [email protected]
ABSTRACTThe W company is facing a problem that their demand is intermittent. Because intermittent demand is difficult to predict, there are some models being created to deal with it. Using these models, such as Bootstrapping, Croston’s method, and Discrete-auto-regressive-moving-average model, to predict and compare with the current one if any of them outperforms.
Keywords: Intermittent demand, bootstrapping, discrete auto-regressive-moving-average model._____________________*Corresponding author
INTRODUCTIONIntroduction of Industry and CompanyNowadays, the war is no longer between the companies but the supply chains. There are three kinds of companies from upstream to downstream in the semiconductor industry: semiconductor components manufacturers, distributors, and users or system manufacturers. Although the manufacturers can directly deal with users, the distributors have their roles. To themanufacturers, the distributors are like the substituted warehouses and the product promoters. The manufacturers can focus on their professions and progress even faster because of saving the money and the time in marketing and business management. For the users, distributors allow them to buy all components as once and help the ones who are lack of bargaining power to get quantity discount.
W company, the biggest semiconductor distributor in the Asia, has more than 15,000 staffs all around the world and has the offices in more than 71 countries. they also act as an agency for more than 250 companies. Their turnover in 2016 are more than 16 billion US dollars.
Besides the service mentioned in the previous paragraph, W company provides more. For the upstream, they collectinformation from the market and aggregate them to give the manufacturers suggestions about development and the quantity ofdemand. For the downstream, they specially provide product maintenance support as the same level of the manufacturers. Not to mention the product design and development. Other services include the financial support and the inventory management.
Research MotivationThe life cycles of the semiconductor components are short. The semiconductor components often explode unexpectedly. W company are facing to a problem that they have so many kinds of stocks, but they don’t know how to keep them in order to make the total cost as low as possible. In fact, the total cost is a tradeoff between the cost of warehousing and the cost of out of stock. Once the W company keeps the quantity of stocks more than what its downstream actually need, the turnover rate of the common items will decrease and the customized item will probably become the dead stock which bringing in the recycle cost. On the contrary, if W company is in the situation that it is out of stock, it will harm the relationship between itself and itsdownstream. The better case is the retailers decrease the ordering quantities, and the worst case is breaking the partnership. Furthermore, W company has to pay the fine. Nowadays, W company is still using a simple way to predict the demand, which is based on the moving average. To find a more accurate way of making the total cost even lower is the most difficult dilemma that the W company has to face to.
Research QuestionWhich replenishment solution has the lowest total cost.Identify the features of each solution. What are the advantages of each solution?
LITERATURE REVIEWThe Forecasting Method W Company Use CurrentlyAlthough moving-average has neither a scientific approach nor a theoretical foundation, it still the best of all for now. The current replenishment method used in the W company is to calculate the average of demands of the past eight weeks and times the summation of lead time and the adjustment factor. (1) When the amount of the available stock, which is equal to the end of week on hand stock plus the begin of week backlog and minus the order receivable, is less than amount of the safety stock, it will start the replenishment. Sending out an order which has the quantity equal to the difference between the safety stock and

Chuang, Chang & Hsu
The 17th International Conference on Electronic Business, Dubai, UAE, December 4-8, 2017296
the available stock. Contrarily, the quantity of the available stock is more than the quantity of the safety stock, nothing will happen. (2) It will repeat over and over until the data of the last week has been calculated.pp ( ) p
(1)
(2)Where is the safety stock at time t, D is the demand from 8 to 1 weeks ago, LT is the lead time and r is the adjustment factor.
is he order quantity at time t and is the available stock before ordering at time t. (Chou & Chuang, 2016) (Chou & Chuang, 2017)
Model Specially Design for Intermittent DemandThe orders that W company received were intermittent, which means that most of the time the demands were zero. It is really reasonable because we don’t have iPhone X presentation frequently, which means the demand of the semiconductor components is not frequently being. Due to this special demand pattern, we can’t just take some recent demand to get an average to predict. There are some methods focus on this kind of question and here are five of them.
Croston’s Method: separate actual demand into two parts, zero or not.p p
(3)
(4)Where is the actual demand at time t. is the estimate mean non-zero demand at time t. is the estimate mean interval
size between non-zero demand at time t. is the estimate mean demand size at time t.
Discrete-Auto-Regressive-Moving-Average(DARMA) Model: The combination of Auto-regressive and moving-average.The auto-regressive part . c is a constant, is a parameter of model and is the error.
The moving-average part . is a constant and is a parameter of model.
(5)Where is the t-th values of the series, is a random binary variable and is a random variable which value equals to {0,1,2,…}
Bootstrapping: simultaneously consider demand before and stochastic variation.
(6)If (7)1. Use the demand data from past to estimate the transition probabilities for the Markov chain.2. Produce a sequence of events from the Markov chain.3. Replace the non-zero parts with data from past, and jitter them.4. Sum up forecast values horizontally to get the lead time demand. (Daniel Waller, 2015]
RESEARCH PLANVariables we use are beneath.
Table 1: definition of variablest number of weeks within dataSL_t number of weeks that counts in calculating the service levelLT Lead time of ordering.num Numbers of different kinds of demand.D Demandr Adjustment factor of ordering quantity.r_upp Upper limit of adjustment factor.r_low lower limit of adjustment factor.r_incre amount that adjustment factor increase.m Denominator of moving average.FR Fill rate, which is the lower limit of equal to (BOH+OR)/D.
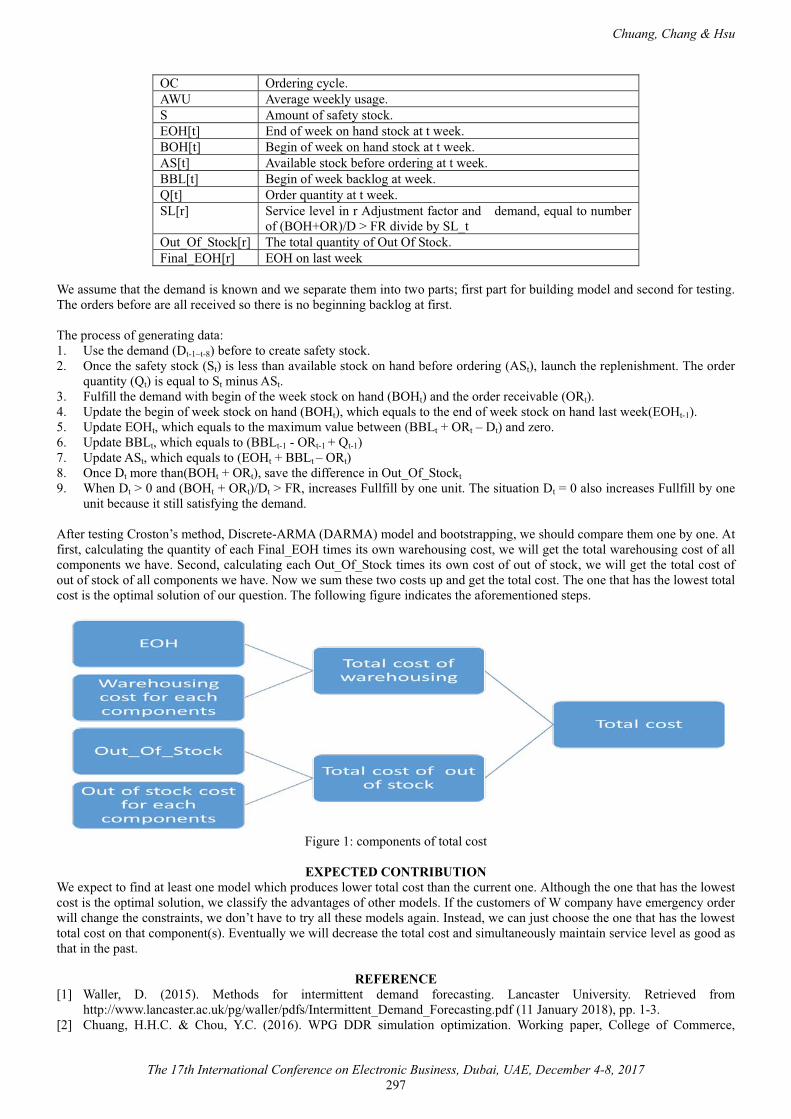
Chuang, Chang & Hsu
The 17th International Conference on Electronic Business, Dubai, UAE, December 4-8, 2017297
OC Ordering cycle.AWU Average weekly usage.S Amount of safety stock.EOH[t] End of week on hand stock at t week.BOH[t] Begin of week on hand stock at t week.AS[t] Available stock before ordering at t week.BBL[t] Begin of week backlog at week.Q[t] Order quantity at t week.SL[r] Service level in r Adjustment factor and demand, equal to number
of (BOH+OR)/D > FR divide by SL_tOut_Of_Stock[r] The total quantity of Out Of Stock.Final_EOH[r] EOH on last week
We assume that the demand is known and we separate them into two parts; first part for building model and second for testing. The orders before are all received so there is no beginning backlog at first.
The process of generating data:1. Use the demand (Dt-1~t-8) before to create safety stock.2. Once the safety stock (St) is less than available stock on hand before ordering (ASt), launch the replenishment. The order
quantity (Qt) is equal to St minus ASt.3. Fulfill the demand with begin of the week stock on hand (BOHt) and the order receivable (ORt).4. Update the begin of week stock on hand (BOHt), which equals to the end of week stock on hand last week(EOHt-1).5. Update EOHt, which equals to the maximum value between (BBLt + ORt – Dt) and zero.6. Update BBLt, which equals to (BBLt-1 - ORt-1 + Qt-1)7. Update ASt, which equals to (EOHt + BBLt – ORt)8. Once Dt more than(BOHt + ORt), save the difference in Out_Of_Stockt9. When Dt > 0 and (BOHt + ORt)/Dt > FR, increases Fullfill by one unit. The situation Dt = 0 also increases Fullfill by one
unit because it still satisfying the demand.
After testing Croston’s method, Discrete-ARMA (DARMA) model and bootstrapping, we should compare them one by one. At first, calculating the quantity of each Final_EOH times its own warehousing cost, we will get the total warehousing cost of all components we have. Second, calculating each Out_Of_Stock times its own cost of out of stock, we will get the total cost of out of stock of all components we have. Now we sum these two costs up and get the total cost. The one that has the lowest total cost is the optimal solution of our question. The following figure indicates the aforementioned steps.
Figure 1: components of total cost
EXPECTED CONTRIBUTIONWe expect to find at least one model which produces lower total cost than the current one. Although the one that has the lowest cost is the optimal solution, we classify the advantages of other models. If the customers of W company have emergency order will change the constraints, we don’t have to try all these models again. Instead, we can just choose the one that has the lowest total cost on that component(s). Eventually we will decrease the total cost and simultaneously maintain service level as good as that in the past.
REFERENCE[1] Waller, D. (2015). Methods for intermittent demand forecasting. Lancaster University. Retrieved from
http://www.lancaster.ac.uk/pg/waller/pdfs/Intermittent_Demand_Forecasting.pdf (11 January 2018), pp. 1-3.[2] Chuang, H.H.C. & Chou, Y.C. (2016). WPG DDR simulation optimization. Working paper, College of Commerce,

Chuang, Chang & Hsu
The 17th International Conference on Electronic Business, Dubai, UAE, December 4-8, 2017298
National Chengchi University, Taiwan.[3] Chuang, H.H.C. & Chou, Y.C. 2017). WPG DDR lead-time demand forecasting. Working paper, College of Commerce,
National Chengchi University, Taiwan.
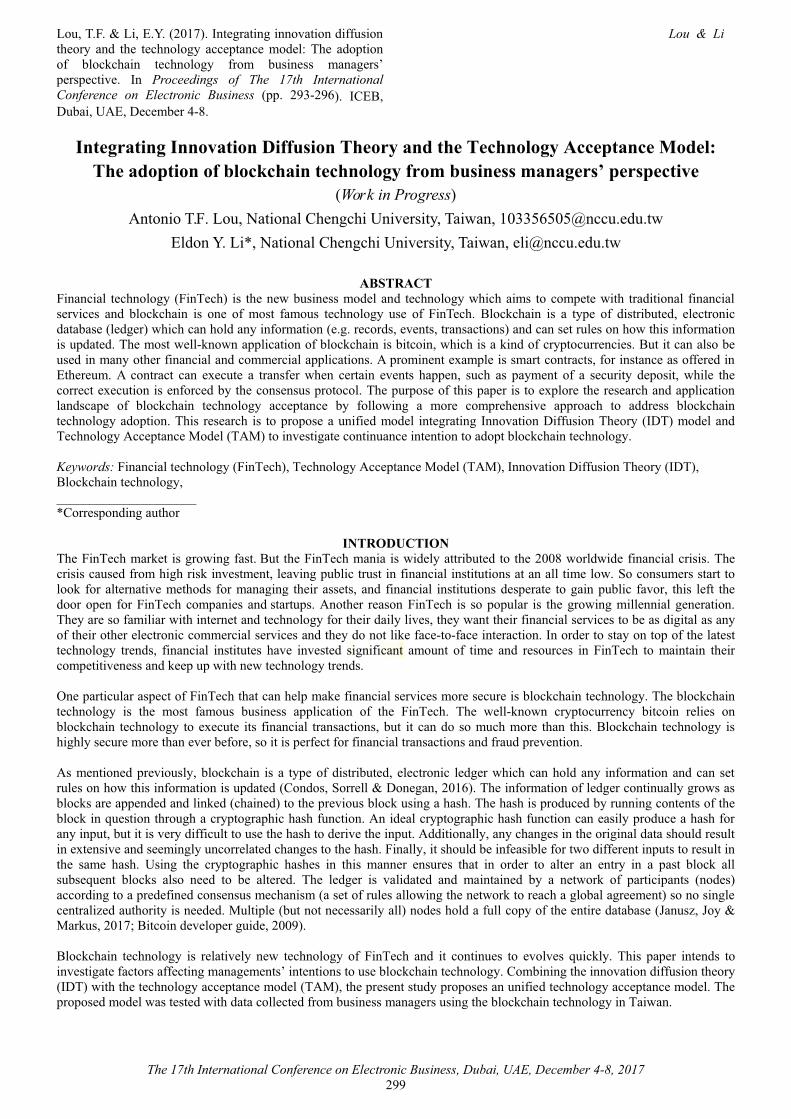
Lou, T.F. & Li, E.Y. (2017). Integrating innovation diffusion theory and the technology acceptance model: The adoption of blockchain technology from business managers’perspective. In Proceedings of The 17th International Conference on Electronic Business (pp. 293-296). ICEB, Dubai, UAE, December 4-8.
Lou & Li
The 17th International Conference on Electronic Business, Dubai, UAE, December 4-8, 2017299
Integrating Innovation Diffusion Theory and the Technology Acceptance Model: The adoption of blockchain technology from business managers’ perspective
(Work in Progress)Antonio T.F. Lou, National Chengchi University, Taiwan, [email protected]
Eldon Y. Li*, National Chengchi University, Taiwan, [email protected]
ABSTRACTFinancial technology (FinTech) is the new business model and technology which aims to compete with traditional financial services and blockchain is one of most famous technology use of FinTech. Blockchain is a type of distributed, electronic database (ledger) which can hold any information (e.g. records, events, transactions) and can set rules on how this informationis updated. The most well-known application of blockchain is bitcoin, which is a kind of cryptocurrencies. But it can also be used in many other financial and commercial applications. A prominent example is smart contracts, for instance as offered in Ethereum. A contract can execute a transfer when certain events happen, such as payment of a security deposit, while the correct execution is enforced by the consensus protocol. The purpose of this paper is to explore the research and application landscape of blockchain technology acceptance by following a more comprehensive approach to address blockchain technology adoption. This research is to propose a unified model integrating Innovation Diffusion Theory (IDT) model and Technology Acceptance Model (TAM) to investigate continuance intention to adopt blockchain technology.
Keywords: Financial technology (FinTech), Technology Acceptance Model (TAM), Innovation Diffusion Theory (IDT), Blockchain technology,_____________________*Corresponding author
INTRODUCTIONThe FinTech market is growing fast. But the FinTech mania is widely attributed to the 2008 worldwide financial crisis. The crisis caused from high risk investment, leaving public trust in financial institutions at an all time low. So consumers start to look for alternative methods for managing their assets, and financial institutions desperate to gain public favor, this left the door open for FinTech companies and startups. Another reason FinTech is so popular is the growing millennial generation. They are so familiar with internet and technology for their daily lives, they want their financial services to be as digital as any of their other electronic commercial services and they do not like face-to-face interaction. In order to stay on top of the latest technology trends, financial institutes have invested significant amount of time and resources in FinTech to maintain their competitiveness and keep up with new technology trends.
One particular aspect of FinTech that can help make financial services more secure is blockchain technology. The blockchain technology is the most famous business application of the FinTech. The well-known cryptocurrency bitcoin relies on blockchain technology to execute its financial transactions, but it can do so much more than this. Blockchain technology is highly secure more than ever before, so it is perfect for financial transactions and fraud prevention.
As mentioned previously, blockchain is a type of distributed, electronic ledger which can hold any information and can set rules on how this information is updated (Condos, Sorrell & Donegan, 2016). The information of ledger continually grows as blocks are appended and linked (chained) to the previous block using a hash. The hash is produced by running contents of the block in question through a cryptographic hash function. An ideal cryptographic hash function can easily produce a hash for any input, but it is very difficult to use the hash to derive the input. Additionally, any changes in the original data should result in extensive and seemingly uncorrelated changes to the hash. Finally, it should be infeasible for two different inputs to result in the same hash. Using the cryptographic hashes in this manner ensures that in order to alter an entry in a past block all subsequent blocks also need to be altered. The ledger is validated and maintained by a network of participants (nodes) according to a predefined consensus mechanism (a set of rules allowing the network to reach a global agreement) so no single centralized authority is needed. Multiple (but not necessarily all) nodes hold a full copy of the entire database (Janusz, Joy &Markus, 2017; Bitcoin developer guide, 2009).
Blockchain technology is relatively new technology of FinTech and it continues to evolves quickly. This paper intends to investigate factors affecting managements’ intentions to use blockchain technology. Combining the innovation diffusion theory (IDT) with the technology acceptance model (TAM), the present study proposes an unified technology acceptance model. The proposed model was tested with data collected from business managers using the blockchain technology in Taiwan.
Lou & Li
The 17th International Conference on Electronic Business, Dubai, UAE, December 4-8, 2017300
THEORETICAL BACKGROUNDTAM was treated as a good theoretical model to explain the acceptance of new technology, however it is questionable whether the TAM model can be applied to all the cases of new technology adoption. So many empirical research recommend integrating TAM with other theories or models to cope with radical technological change and improve the quality and explanatory power (Carter & Be´langer, 2005; Legris, Ingham & Colerette, 2003). TAM and IDT are similar in some constructs and complement each other to examine the adoption of new technology (Lee, Hsieh & Hsu, 2011). Past researchers indicate that the integration of these two theories could provide a better model than either standing alone (Wu & Wang, 2005; Chen, Gillenson & Sherrell, 2002) and some prior studies prove good results of integrating the two models (Sigala, Airey, Jones & Lockwood, 2000; Gefen, 2004).
Technology Acceptance Model (TAM)This study employs two major theoretical models—the TAM and IDT. We will begin by considering the model of TAM. Based on Ajzen and Fishbein's Theory of Reasoned Action (TRA) model, Davis introduced TAM for predicting technologyusage and acceptance (Taylor & Todd, 1995; Davis, Bagozzi & Warshaw, 1989). TAM suggests that perceived usefulness (PU) and perceived ease of use (PEOU) are two primary determinants in explaining individual users’ adoption intention. While PU is defined as the degree to which a person believes that using a particular system will enhance his or her job performance, PEOU refers to the degree to which the person believes that using the system will be free of effort. The TAM has been validated repeatedly by many scholars in different settings since it was first published and so has been widely used in technology adoption research in the past decades. However, TAM is also a relatively simple model which can be modified or extended in different ways and, therefore, many extensions integrating other theories have appeared in the literature (Zhang, Guo & Chen, 2008). The model hypothesizes that technology acceptance is decided by users behavioral intention (BI) to use, Which is in turn influenced by users' attitudes (A) toward using. Finally, attitude is directly affected by beliefs about the technology, which consists of PU and PEOU. TAM is among the most influential and discussed theories in predicting and explaining end-user behavioral technology usage. It is one of the base theories for this study because of its solid theoretical foundation (Lee, Hsieh & Hsu, 2011).
Innovation Diffusion Theory (IDT)The most well-known theory about technical innovation is IDT. Research on IDT has been widely applied in various fieldssuch as science, sociology, communication, agriculture, marketing, internet, and technology, etc (Rogers, 1995; Karahanna, Straub & Chervany, 1999; Agarwal, Sambamurthy & Stair, 2000). An innovation is “an idea, practice, or object that is perceived as new by an individual or another unit of adoption”. On the other hand, Diffusion is “the process by which an innovation is communicated through certain channels over time among the members of a social system” (Rogers, 1995). Therefore, the IDT theory argues that “potential users make decisions to adopt or reject an innovation based on beliefs that they form about the innovation” (Karahanna, Straub & Chervany, 1999). IDT theory tries to explain innovation decision process, determining factors of rate of adoption, and different categories of adopters. It helps in predicting the likelihood and rate of adoption of an innovation (Chen, Gillenson & Sherrell, 2002). IDT includes five significant innovation characteristics: compatibility(CPT), relative advantage(RAD), complexity(CPX), and trialability and observability. Relative advantage is defined as the degree to which an innovation is considered as being better than the idea it replaced. This construct is found to be one of the best predictors of the adoption of an innovation. Compatibility refers to the degree to which innovation is regarded as being consistent with the potential end-users’ existing values, prior experiences, and needs. Complexity is the end-users’ perceived level of difficulty in understanding innovations and their ease of use. Trialability refers to the degree to which innovations can be tested on a limited basis. Observability is the degree to which the results of innovations can be visible by other people. These characteristics are used to explain end-user adoption of new technologies and the decision-making process(Lee, Hsieh & Hsu, 2011). But according to prior researches of the meta-analysis of 75 diffusion articles conducted by Tomatzky and Klein, found that only relative advantage, compatibility and complexity were consistently related to adoption of technical innovations (Tornatzky & Klein, 1982).
RESEARCH MODELThis research proposes an integrated model based on IDT and TAM models to take advantage of these two theoretical models.The two basic TAM factors are PU and PEOU and three important factors for innovation are relative advantage, compatibility and complexity (trialability and observability are omitted due to the previous analysis of Tomatzky and Klein), which are included as the major determinants in our integrated framework of the new technology adoption (see Fig.1).This model will better reveal how these different factors influence business managers’ acceptance intentions and usage behavior of blockchain technology adoption process in FinTech industry. The validity and applicability of the proposed model will be tested based on the following hypotheses.
TAM Model HypothesesThe proposed research model adopts TAM belief—attitude— intention—behavior relationship. These relationships can stated in the following hypotheses. H1: users’ behavioral intention (BI) had a positive effect on his or her actual use the blockchain technology.H2: users’ attitude toward using (A) had a positive effect on his or her BI to use the blockchain technology.H3: users’ perceived usefulness (PU) had a positive effect on his or her BI to use the blockchain technology.H4: users’ perceived usefulness (PU) had a positive effect on his or her attitude toward using (A) the blockchain technology.
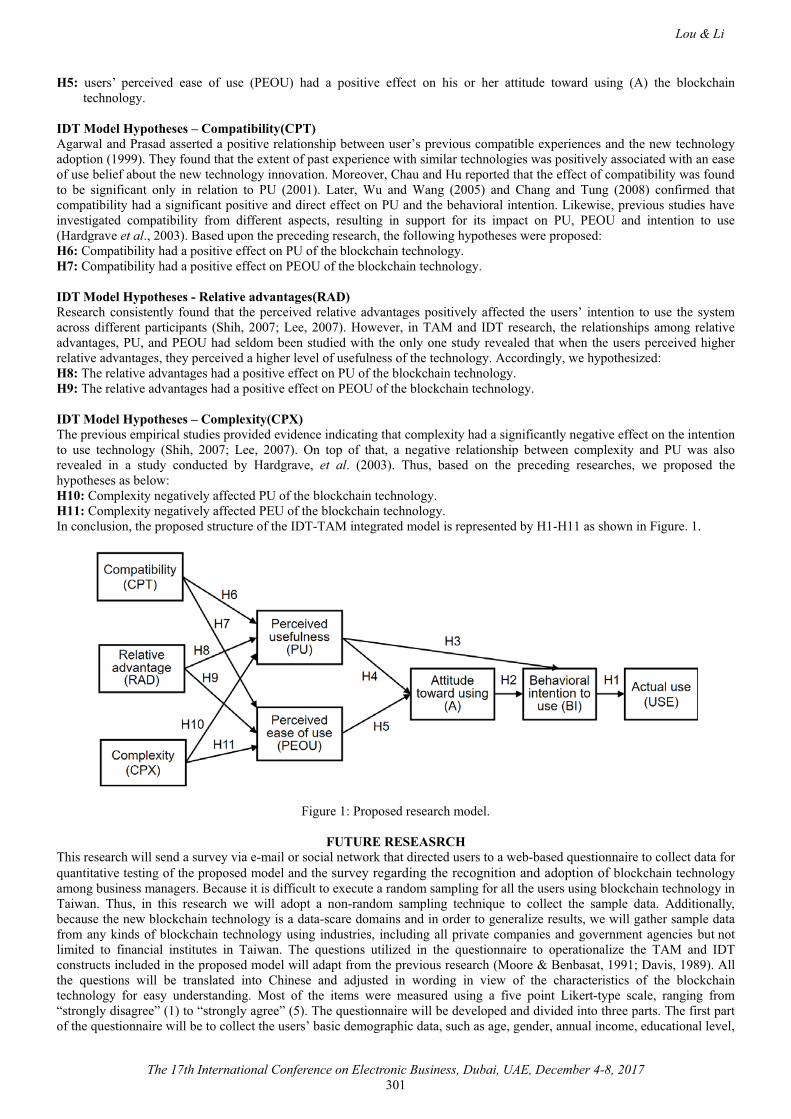
Lou & Li
The 17th International Conference on Electronic Business, Dubai, UAE, December 4-8, 2017301
H5: users’ perceived ease of use (PEOU) had a positive effect on his or her attitude toward using (A) the blockchain technology.
IDT Model Hypotheses – Compatibility(CPT)Agarwal and Prasad asserted a positive relationship between user’s previous compatible experiences and the new technology adoption (1999). They found that the extent of past experience with similar technologies was positively associated with an ease of use belief about the new technology innovation. Moreover, Chau and Hu reported that the effect of compatibility was found to be significant only in relation to PU (2001). Later, Wu and Wang (2005) and Chang and Tung (2008) confirmed that compatibility had a significant positive and direct effect on PU and the behavioral intention. Likewise, previous studies haveinvestigated compatibility from different aspects, resulting in support for its impact on PU, PEOU and intention to use (Hardgrave et al., 2003). Based upon the preceding research, the following hypotheses were proposed:H6: Compatibility had a positive effect on PU of the blockchain technology.H7: Compatibility had a positive effect on PEOU of the blockchain technology.
IDT Model Hypotheses - Relative advantages(RAD)Research consistently found that the perceived relative advantages positively affected the users’ intention to use the systemacross different participants (Shih, 2007; Lee, 2007). However, in TAM and IDT research, the relationships among relative advantages, PU, and PEOU had seldom been studied with the only one study revealed that when the users perceived higher relative advantages, they perceived a higher level of usefulness of the technology. Accordingly, we hypothesized:H8: The relative advantages had a positive effect on PU of the blockchain technology.H9: The relative advantages had a positive effect on PEOU of the blockchain technology.
IDT Model Hypotheses – Complexity(CPX)The previous empirical studies provided evidence indicating that complexity had a significantly negative effect on the intention to use technology (Shih, 2007; Lee, 2007). On top of that, a negative relationship between complexity and PU was also revealed in a study conducted by Hardgrave, et al. (2003). Thus, based on the preceding researches, we proposed thehypotheses as below:H10: Complexity negatively affected PU of the blockchain technology.H11: Complexity negatively affected PEU of the blockchain technology.In conclusion, the proposed structure of the IDT-TAM integrated model is represented by H1-H11 as shown in Figure. 1.
Figure 1: Proposed research model.
FUTURE RESEASRCHThis research will send a survey via e-mail or social network that directed users to a web-based questionnaire to collect data for quantitative testing of the proposed model and the survey regarding the recognition and adoption of blockchain technologyamong business managers. Because it is difficult to execute a random sampling for all the users using blockchain technology in Taiwan. Thus, in this research we will adopt a non-random sampling technique to collect the sample data. Additionally, because the new blockchain technology is a data-scare domains and in order to generalize results, we will gather sample data from any kinds of blockchain technology using industries, including all private companies and government agencies but not limited to financial institutes in Taiwan. The questions utilized in the questionnaire to operationalize the TAM and IDT constructs included in the proposed model will adapt from the previous research (Moore & Benbasat, 1991; Davis, 1989). All the questions will be translated into Chinese and adjusted in wording in view of the characteristics of the blockchaintechnology for easy understanding. Most of the items were measured using a five point Likert-type scale, ranging from “strongly disagree” (1) to “strongly agree” (5). The questionnaire will be developed and divided into three parts. The first part of the questionnaire will be to collect the users’ basic demographic data, such as age, gender, annual income, educational level,
Lou & Li
The 17th International Conference on Electronic Business, Dubai, UAE, December 4-8, 2017302
work experience, prior experience using new technology, etc. The second part of the questionnaire was based on the constructs of PU, PEOU, BI , A, USE in the TAM model and was adapted from the measurement defined by Davis et al. and Venkatesh & Davis (Davis, Bagozzi & Warshaw, 1989; Venkatesh & Davis, 2000). The third part of the questionnaire was based on IDT including compatibility (CPT), complexity (CPX), relative advantages (RAD), observability (OB), and trialability (TRI). The above items were adapted from the previous studies (Taylor & Todd, 1995; Davis, Bagozzi & Warshaw, 1989; Moore & Benbasat, 1991; Karahanna, Straub & Chervany, 1999).
REFERENCES[1] Agarwal, R., Sambamurthy, V., & Stair, R. M. (2000). The evolving relationship between general and specific computer
efficacy: An empirical assessment. Information Systems Research, 11(4), 418-430.[2] Agarwal, R., & Prasad, J. (1999). Are individual differences germane to the acceptance of new information
technologies?. Decision Sciences, 30, 361-391.[3] Bitcoin Developer Guide (2009). Retrieved from https://bitcoin.org/en/developer-guide (20 September 2017).[4] Carter, L. & Be´langer, F. (2005). The utilization of e-government services: Citizen trust, innovation and acceptance
factors. Information Systems Journal, 15(1), 5-25.[5] Chang, S. C., & Tung, F. C. (2008). An empirical investigation of students’ behavioural intentions to use the online
learning course websites' , British Journal of Educational Technology, 39(1), 71-83.[6] Chau, Y. K., & Hu, J. H. (2001). Information technology acceptance by individual professionals: A model comparison
approach. Decision Sciences, 32(4), 669-719.[7] Chen, L. D., Gillenson, M. L., & Sherrell, D. L. (2002). Enticing online consumers: An extended technology acceptance
perspective. Information and Management, 39(8), 705-719.[8] Condos J., Sorrell W.H., & Donegan S.L. (2016). Opportunities and risks. Technical report on Blockchain technology,
State of Vermont, USA. [9] Davis, F D. (1989). Perceived usefulness, perceived ease of use, and user acceptance of information technology. MIS
Quarterly, 13(3), 319-340.[10] Davis, F. D., Bagozzi, R. P., & Warshaw, P. R. (1989). User acceptance of computer technology: A comparison of two
theoretical model. Management Science, 35(8), 982-1003.[11] Gefen, D. (2004). What makes an ERP implementation relationship worthwhile: Linking trust mechanisms and ERP
usefulness. Journal of Management Information Systems, 21(1), 263-288.[12] Hardgrave, B., Davis, F., & Riemenschneider, C. (2003). Investigating Determinants of Software Developers’ Intentions
to Follow Methodologies. Journal of Management Information Systems, 20(1), 123-151.[13] Janusz J. Sikorski, Joy H & Markus K (2017). Blockchain technology in the chemical industry: Machine-to-machine
electricity market. Applied Energy; 195, 234-246.[14] Karahanna, E., Straub, D.W., & Chervany, N. L. (1999). Information technology adoption across time: A cross-sectional
comparison of pre-adoption and post-adoption beliefs. MIS Quarterly, 23, 183-213.[15] Lee, Y. H., Hsieh, Y. C., & Hsu, C. N. (2011). Adding innovation diffusion theory to the technology acceptance model:
Supporting employees' intentions to use e-learning systems. Journal of Educational Technology & Society, 14(4), 124.[16] Lee, Y. H. (2007). Exploring key factors that affect consumers to adopt e-reading services. (Master’s thesis, Huafan
University, Taiwan).[17] Legris, P., Ingham, J. & Colerette, P. (2003). Why do people use information technology? A critical review of the
technology acceptance model. Information and Management, 40, 191-204.[18] Moore, G. C., & Benbasat, I. (1991). Development of an instrument to measure the perceptions of adopting an
information technology innovation. Information Systems Research, 2(3), 192-222.[19] Rogers, E. M. (1995). Diffusion of innovations (4th ed.). New York: Free Press.[20] Shih, C. H. (2007) Integrating Innovation Diffusion Theory and UTAUT to Explore The Influencing Factors on Teacher
Adopt Elearning System – With MOODLE as an Example. (Master’s thesis, Dayeh University, Taiwan).[21] Sigala, M., Airey, D., Jones, P., & Lockwood, A. (2000). The diffusion and application of multimedia technologies in the
tourism and hospitality industries. In Information and Communication Technologies in Tourism 2000 (pp. 396-407). Vienna: Springer.
[22] Taylor, S., & Todd, P. A. (1995). Understanding information technology usage: A test of competing models. Information Systems Research, 6(1), 144-176.
[23] Tornatzky, L. G., & Klein, K. J. (1982). Innovation characteristics and innovation adoption-implementation: A meta-analysis of findings. IEEE Transactions on Engineering Management, 1, 28-45.
[24] Venkatesh, V., & Davis F. D. (2000). A theoretical extension of the technology acceptance model: Four longitudinal field studies. Management Science, 46(2), 186-204.
[25] Wu, J. H., & Wang, S. C. (2005). What drives mobile commerce? An empirical evaluation of the revised technology acceptance model. Information and Management, 42(5), 719-729.

Hsieh, K.H. & Li, E.Y. (2017). Progress of Fintech industry from venture capital point of view. In Proceedings of The 17th International Conference on Electronic Business (pp. 297-301). ICEB, Dubai, UAE, December 4-8.
Hsieh & Li
The 17th International Conference on Electronic Business, Dubai, UAE, December 4-8, 2017303
Progress of Fintech Industry from Venture Capital Point of View(Work in Progress)
Ku-Hsien Hsieh*, National Chengchi University, Taiwan, [email protected] Y. Li, National Chengchi University, Taiwan, [email protected]
ABSTRACTFintech (financial technology) is a term that broadly described the innovation of financial product and service using IT technology. Fintech uses a lot of new business model such as FXP2P and supply chain finance, and new technology such as blockchain and cryptocurrency. According to World Economic Forum report, fintech bring disruptive innovations that are reshaping the way financial services. Also, in World Economic Forum report have structured research framework against six (6)function of financial services and eleven (11) clusters of innovation. CrunchBase is a web 2.0 wiki-liked database for startup company that includes the information for founders, key team members, basic financial information, and venture capital fundingand important events. This paper uses Python to web scrape CrunchBase website for studying the progress of Fintech industry and find out the development of IT technology and innovation. The objectives of this paper are to study the CrunchBase database to compare with World Economic Forum report research framework and find out the actual progress of Fintech industry.
Keywords: Fintech, Venture Capital, Innovation, Information Retrieval, Informetrics, _____________________*Corresponding author
INTRODUCTIONInformation science is a science field that study the collection, production, organization, classification, storage, retrieval, dissemination and protect of information. Information science can be a pure or as an applied science. Research in informationscience field can focus on the information user, the system that process information, the organization that adopt certain technology, or any other related field. Information Within information science, information retrieval and informetrics had developed from different areas, but share some common interest.
The informetrics traditionally can divided into six topics of: (1). Bibliometric theory, mathematical models and formalization of bibliometric laws, (2). Case studies and empirical papers, (3). Methodological papers including application, (4). Indicators engineering and data presentation, (5). Sociological approach to bibliometrics, sociology of science, and (6). Science policy, science management and general or technical discussion (Scharnhorst & Woulters, 2001). It is essential for informetrics that using mathematical or statistical model to analyze the information, and create indicators to present the usage of the information(Borner, Chen & Boyack, 2003).
Financial technology (Fintech) is a term that describe the new technology and innovation that aims to compete with traditional financial institutions to delivery better and more effective financial services. In today’s digital era, people are seeking for easy access, convenience, efficiency, and speed. People want to use web or mobile to conduct transaction, and these transaction activities including the financial payment. Therefore, Fintech companies, mostly IT companies, start to provide both individuals and business with new financial tools or services. According to World Economic Forum report, fintech bring disruptive innovations that are reshaping the way financial services. Also, in World Economic Forum report have structured research framework against six (6) function of financial services and eleven (11) clusters of innovation (WEF, 2015; WEF, 2017).
As many new industries start to grow, the Venture Capital (VC) companies will start to invest in these start-up companies and help transfer into an industry. According to SparkLabs study, funding for VC-backed Fintech companies reaches to $13.8 billion in 2015 compared to $6.7 billion in 2014. The Fintech investment from VCs grows 106% from 2014 to 2015, just in one-year period. CrunchBase is a web 2.0 wiki-liked database for startup company that includes the information for founders, key team members, basic financial information, and venture capital funding and important events. This paper uses Python to web scrape CrunchBase website for studying the progress of Fintech industry and find out the development of IT technology and innovation(Srinaganya, 2015).
The objective of this paper is to design a model and indicator for Fintech using the concept and theory from Informetrics, then study the CrunchBase database to compare with World Economic Forum report research framework and find out the actual progress of Fintech industry.
The first section is the introduction. Then the paper is structured as the following: we will give brief background introduction in next section. Section 2 will include terminology of information retrieval (IR), informetrics/webometrics, fintech, and explain the investment progress of the venture capital industry. In Section 3, we will describe the World Economic Forum (WEF) research framework and the data structure of CrunchBase, then mapping the relationship between the date items. Then, the model design

Hsieh & Li
The 17th International Conference on Electronic Business, Dubai, UAE, December 4-8, 2017304
and methodology are explained in section 4. Finally, discussion and implication are described in section 5.TERMINOLOGY
Information RetrievalInformation retrieval (IR) is a selective process in which the information is extracted from a store information. The information can be structured, semi-structured, or non-structured. Traditionally, IR is used to locate the text-based information which can be any full-text documents or content type document such as bibliographic records of database. In recent years, the document had expanded to include websites HTML DOM-type documents and multimedia formats such as images, voices and videos (Ding, C,Foo, 2001)
The process of interactive information retrieval involves the searcher querying the IR system for the right information to be collected. The searcher initially submits a query or write a program to the IR system. The query search consists of one or more search terms that will be searched within the retrieved documents. A list of record matching the search query will then be stored into database for analysis. This process may repeat if necessary.
Recent years, IR system may also act as the search engines in World Wide Web (Almind & Ingwersen, 1997). In this case, the search data will be stated in HTML file text. Ever more, for web exchanged data format JSON, the search terms may be the JSONtag and search result will be the JSON data. Information retrieval remain a key research area within information science. Overthe past twenty years, the information has expanded from simple text search, to DBMS search, then to World Wide Web search(Bennett & El-Arini, 2011).
Informetrics/WebometricsInformetrics is quantitative study of information. Like information science, it includes the production, dissemination, and use of all form of information. Informetrics research investigates the existing data and attempts to develop mathematical models to better understand the information as whole. The informetrics encompasses several other fields: bibliometrics, scientometrics, webometrics, and cybermetrics (Thelwall, 2009; Hood, 2001). Bibliometrics studies the quantitative of literature records information. Scientometrics studies the statistical analysis of research pattern in sciences fields. Webometrics studies and measures the websites to get structure of the world wide web and usage patterns (Scharnhorst & Woulters, 2006).
Major areas of informetrics are (Wolfram, 2000):1. Class bibliometric laws:
� Lotka’s Law – examines the author productivity in a frequency distribution� Bradfor’s Law – examines the journal productivity as the concentration of articles in a subject area within journals � Zipf’s Law – examines word usage frequency occurs within document
2. Citation and co-citation analysis – examines the citing patterns of authors and publications to determine the importance of the paper
3. Indicators – examines the productivity of studies area output4. Information growth and obsolescence – examines subject area grows or decline over the time5. Information resource usage – examines the information resources are used over time
Venture CapitalVenture Capital is a type of private equity to provide the funding for the startup companies, possible in highly growth potential industries. Investing in early-stage companies is risky. The venture capital investors are typically very large financial institutions such as pension fund, insurance companies, and private bank. The VCs put small percentage of their investment into high-risk start-up companies. The purpose of VCs investment is hoping to get sufficient returns at acceptable risk. According to Harvard Business Review articles, the VCs in general expect a return of 25~35% per year over the lifetime of the investment(Zider, 1998).
The answers for VCs to meet the expected return are controlling the investment profile and the deal structure. The priority for the investment profile is to invest in good industry, not good people and good idea. So, it is essential for VCs to invest the companies in accelerating growth period.
The is crucial to understand how venture capital performs the “funding rounds” progress. In general, the funding rounds will gothrough the different periods in the following table. The funding grows rapidly when funding round progresses. In general, the seed round is under US$500K, Series A then will move above US$ 1 million. The venture capitalist can exit during Mezzanine round, IPO, or an acquisition (Zider, 1998).
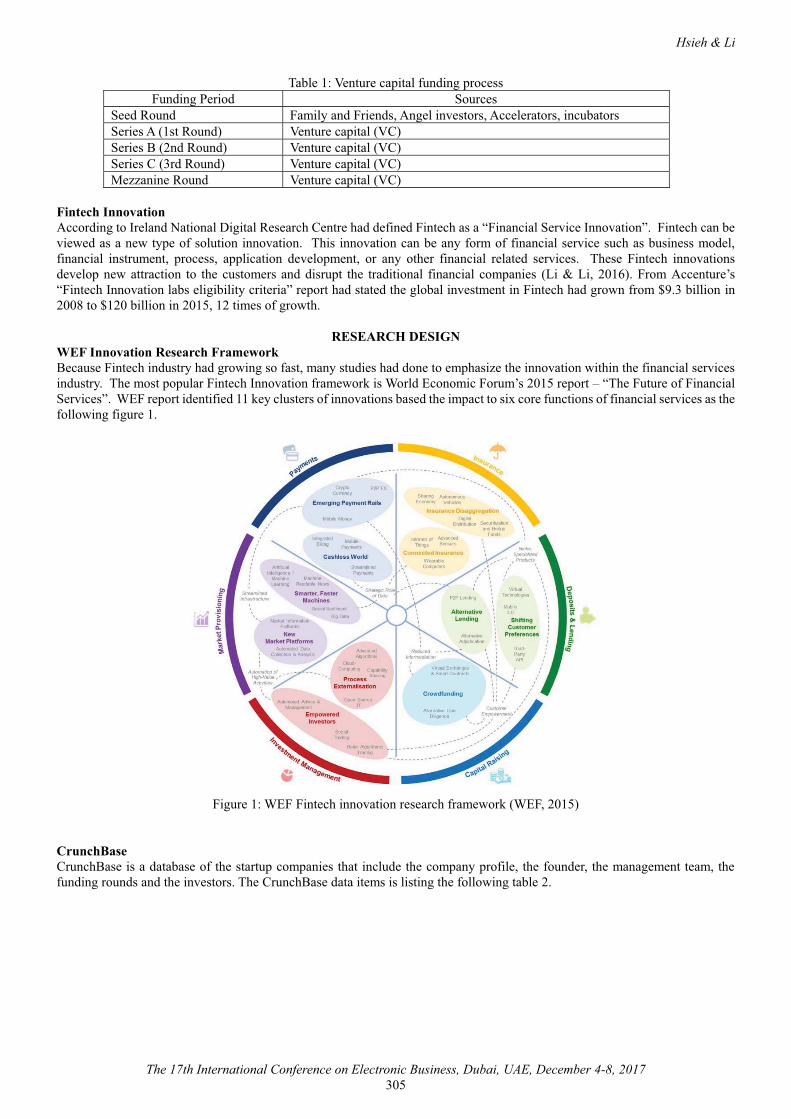
Hsieh & Li
The 17th International Conference on Electronic Business, Dubai, UAE, December 4-8, 2017305
Table 1: Venture capital funding processFunding Period Sources
Seed Round Family and Friends, Angel investors, Accelerators, incubatorsSeries A (1st Round) Venture capital (VC)Series B (2nd Round) Venture capital (VC)Series C (3rd Round) Venture capital (VC)Mezzanine Round Venture capital (VC)
Fintech InnovationAccording to Ireland National Digital Research Centre had defined Fintech as a “Financial Service Innovation”. Fintech can be viewed as a new type of solution innovation. This innovation can be any form of financial service such as business model, financial instrument, process, application development, or any other financial related services. These Fintech innovations develop new attraction to the customers and disrupt the traditional financial companies (Li & Li, 2016). From Accenture’s“Fintech Innovation labs eligibility criteria” report had stated the global investment in Fintech had grown from $9.3 billion in 2008 to $120 billion in 2015, 12 times of growth.
RESEARCH DESIGNWEF Innovation Research FrameworkBecause Fintech industry had growing so fast, many studies had done to emphasize the innovation within the financial services industry. The most popular Fintech Innovation framework is World Economic Forum’s 2015 report – “The Future of Financial Services”. WEF report identified 11 key clusters of innovations based the impact to six core functions of financial services as the following figure 1.
Figure 1: WEF Fintech innovation research framework (WEF, 2015)
CrunchBaseCrunchBase is a database of the startup companies that include the company profile, the founder, the management team, the funding rounds and the investors. The CrunchBase data items is listing the following table 2.
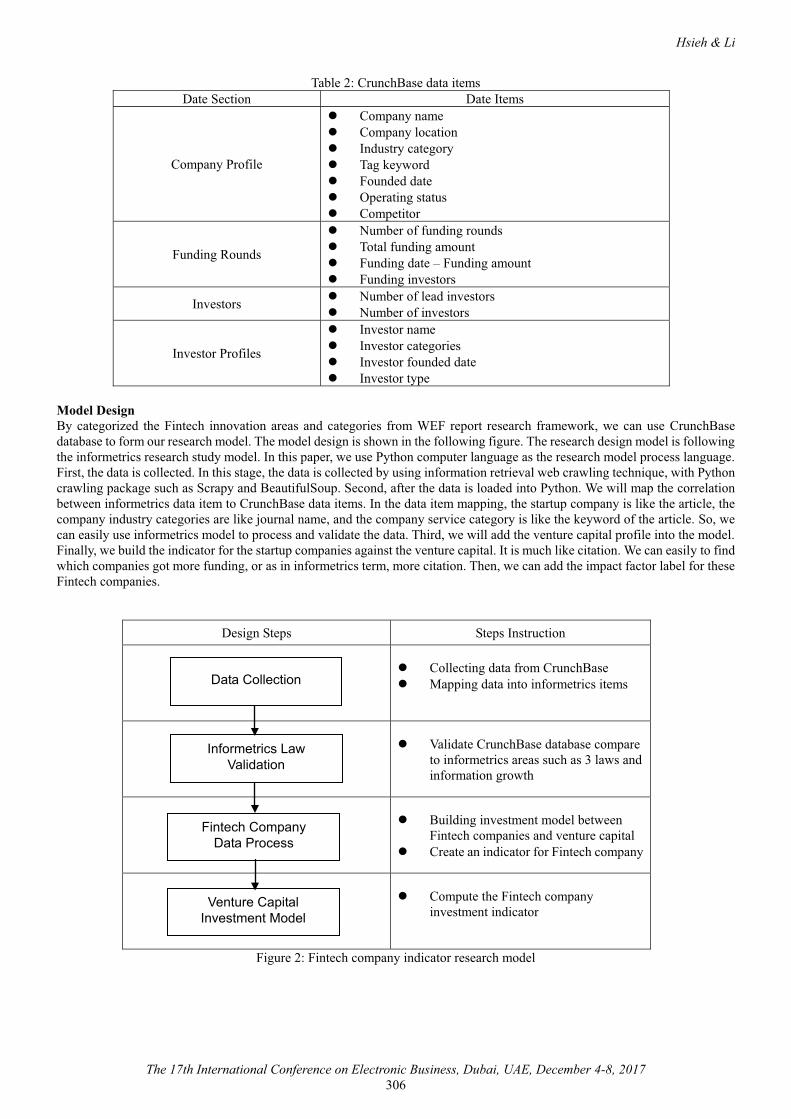
Hsieh & Li
The 17th International Conference on Electronic Business, Dubai, UAE, December 4-8, 2017306
Table 2: CrunchBase data itemsDate Section Date Items
Company Profile
� Company name� Company location� Industry category� Tag keyword� Founded date� Operating status� Competitor
Funding Rounds
� Number of funding rounds� Total funding amount� Funding date – Funding amount� Funding investors
Investors � Number of lead investors� Number of investors
Investor Profiles
� Investor name� Investor categories� Investor founded date� Investor type
Model DesignBy categorized the Fintech innovation areas and categories from WEF report research framework, we can use CrunchBasedatabase to form our research model. The model design is shown in the following figure. The research design model is following the informetrics research study model. In this paper, we use Python computer language as the research model process language.First, the data is collected. In this stage, the data is collected by using information retrieval web crawling technique, with Python crawling package such as Scrapy and BeautifulSoup. Second, after the data is loaded into Python. We will map the correlationbetween informetrics data item to CrunchBase data items. In the data item mapping, the startup company is like the article, the company industry categories are like journal name, and the company service category is like the keyword of the article. So, we can easily use informetrics model to process and validate the data. Third, we will add the venture capital profile into the model. Finally, we build the indicator for the startup companies against the venture capital. It is much like citation. We can easily to find which companies got more funding, or as in informetrics term, more citation. Then, we can add the impact factor label for these Fintech companies.
Design Steps Steps Instruction
� Collecting data from CrunchBase� Mapping data into informetrics items
� Validate CrunchBase database compare to informetrics areas such as 3 laws and information growth
� Building investment model between Fintech companies and venture capital
� Create an indicator for Fintech company
� Compute the Fintech company investment indicator
Figure 2: Fintech company indicator research model
Data Collection
Informetrics Law Validation
Fintech CompanyData Process
Venture CapitalInvestment Model
Hsieh & Li
The 17th International Conference on Electronic Business, Dubai, UAE, December 4-8, 2017307
CONCLUSIONAt the beginning of the conclusion, the author has to say this paper is still a working paper. The model is under development and current progress is presented as the following. First, the author had using Python to parse the company profile that label “Fintech”. Total of 4,730 Fintech companies had founded from CrunchBase database and totally of 154 tag keywords were indexed, and more than $200 billion was funded. Second, the data from Crunchbase basically followed the basic principle laws of informetrics. Of course, still more research needs for developing the indicator and more computation needs for validate the venture capital investment model.
REFERENCES[1] Almind, T. & Ingwersen, P. (1997) ‘Informetric analyses on the world wide web: methodological approaches to
‘webometrics’’, Journal of Documentation, Vol. 53, No.4, pp. 404-426. [2] Bennett, P. & El-Arini, K. (2011) ‘Enriching Information Retrieval’, ACM SIGIR Forum, Vol. 4, No. 2, pp.60-64.[3] Borner, K., Chen, C. & Boyack, K.W. (2003) ‘Visualizing Knowledge Domains’, Annual Review of Information and
Technology, Vol. 37, No. 1, pp. 179-255.[4] Ding, Y., Chowdhury, G.G. & Foo S. (2001) ‘Bibliometrics Cartography of Information Retrieval Research by using
Co-word Analysis’, Information Processing & Management, Vol. 37, No. 6, pp. 817-842.[5] Hood, W. W., & Wilson, C. S. (2001) ‘The Literature of Bibliometrics, Scientometrics, and Informetrics’, Scientometrics,
Vol. 52, No. 2, pp. 291-314.[6] Li, E. & Li, J. ‘Information Security Challenges in the New Era of Fintech’, Proceeding of ICEB 2016.[7] Scharnhorst, A. & Woulters, P. (2006) ‘Web indicators – A New Generation of S&T Indicators?’, Cybermetrics, Vol. 10,
Issue: 1.[8] Srinaganya. G. & J.G.R. S. (2015) ‘A Technical Study on Information Retrieval using Web Mining Techniques’, ICIIECS,
IEEE.[9] Thelwall, M. (2009) Introduction to Webometrics: Quantitative Web Research for the Social Sciences, San Raphael, CA:
Morgan & Clapypool.[10] World Economic Forum (2015) The Future of Financial Services, World Economic Forum.[11] World Economic Foru. (2017) Beyond Fintech: A Pragmatic Assessment of Disruptive Potential In Financial Services,
World Economic Forum.[12] Wolfram, D. (2000) ‘Application of Informetrics to Information Retrieval Research’, Informing Science, Vol. 3, No. 2, pp.
77-82.[13] Zider, B. (1998) ‘How Venture Capital Works’, Harvard Business Review, Issue: November-December, 1998.
Huang, G.K.J. & Chiang, K.H. (2017). RegTech evolution: The TrustChain. In Proceedings of The 17th International Conference on Electronic Business (pp. 302-305). ICEB, Dubai, UAE, December 4-8.
Huang & Chiang
The 17th International Conference on Electronic Business, Dubai, UAE, December 4-8, 2017308
RegTech Evolution: The TrustChain(Work in Progress)
Grant K.J. Huang*, National Chengchi University, Taiwan, [email protected] Chiang, National Chengchi University, Taiwan, [email protected]
ABSTRACTIntegrity is a lifelong duty. Credit is not only given to natural persons but also to corporate citizens. In this work, we propose a blockchain-based RegTech system which helps to track the credit of organizations. The creditability of tender entity, participants and subcontractors altogether comprise the long-lasting undeniable TrustChain. The framework is scalable to all elements deemed necessary to corporate score card and referral to the developing RegTech. We expect the consistency and honesty of corporate citizens lay the foundation of a Trust society.
Keywords: RegTech, Blockchain, Smart Contract, Credit, Corporate Social Responsibility._____________________*Corresponding author
INTRODUCTIONBlockchain / distributed ledger or bitcoin-like technology has been regarded as an opportunity of many industries. The real innovation is not the digital coins themselves, but the trust machine that mints them (Kõlvart et al., 2016). The autonomous, decentralized property and comparative advantages of accountability, traceability, authenticity and non-repudiation challengecurrent 3rd party intermediary function as centralized authentication, and also launch the new digitalization era of financial industry, credit system, file sharing, investment tracking, and even the Internet of Things.
Accompanying the quick evolving technology, new term Regulatory technology (RegTech) appears in 2016 at governmental level in UK FCA. It reminds us of the first few years of big data and its equivalent important topics - big security. Modernregulation, like ‘General Data Protection Regulation’ by EU Parliament, focuses on unifying data protection for all individualsand governs the data controller of personal data. However, it is widely perceived that counting only on limited legal resourcesto rectification would be ineffective. We may instead expect people to behave well proactively and build a mechanism with positive reinforcement and penalty impact that is naturally persuasive and if possible, encouraging to the cumulative credit which could be regarded as an asset.
Society nowadays requires more and more corporate governance and transparency for resourceful enterprises. For the public procurement stakeholders, besides the profession and contractual capacity, play by rule of the game and do what is right, just and fair altogether help generate the solid accountability. For long, economist and computer scientists have strived to enhance the credit system by designing various mechanisms. Now we have a worthy alternative to invest. With embedded smart contracts evolving from blockchain, the gap between expectation and feasible methods gets closer. Smart contracts combine protocols with user interfaces to formalize and secure relationships over computer networks (Szabo, 1997). By contrast to traditional contract, parties in smart contracts have no choice but to implement completely(Kõlvart et al., 2016). Afterinstructions are given, the predefined transaction will be self-enforcing. It largely saves the cost of supervision and eliminatesthe room to negotiation on payment. This confines all related parties to focus on content of agreements instead of nonperformance discount.
E-Procurement Blockchain based system is developing quickly, however, its application in corporate regulation is rare. We select a lucrative zone to highlight the necessity of exploration. Moreover, from different perspective of the professional misconduct against public interest, people observe a smattering knowledge of the grey side of the ecosystem. To get a glance at the status of Taiwan, we conduct following analysis.
Data PreprocessingFor research purpose, we develop a web crawler to retrieve the web open data during Oct 2013 and Nov 2015 of National Procurement System, compare interim tenders (totally 108,360 cases) with the profile in Department of Commerce, MOEA by help of SheetHub.com.(Wang, 2015).
Data AnalysisAfter data preparation, we count the occurrences on same bidding cases. As in Figure 1, each company is a single node. If intersections of bidding on same cases are more than 5 times, the parties involved will be given an edge. Here is the example of procurement amount between NTD 20 million and NTD 100 million.

Huang & Chiang
The 17th International Conference on Electronic Business, Dubai, UAE, December 4-8, 2017309
Figure 1: Bidding on same cases > 5 times
Some enterprises are inclined to meet frequently, who might be competitors of each other. However, among such intersections, there are instances that different companies bidding on same case are of the same directors. And one of them at last wins the
tender. We use the Jacaard index to compare the similarity and diversity of the directors of board. Table 1 and
2 exemplify such occurrences.
Table 1: Product procured: Brown Rice
Table 2: Product procured: Gas CO2
The “Government Procurement Law” and “Enforcement Rules of the Government Procurement Act” regulate that at first round of open tendering procedures, there must be three or more tenderers submit their tenders. With a stretching lens to the connections of related business and their directors of board, we found that some participants indeed belong to the same owners. Such situation might be patterns of accompanying-bidding or bid rigging. No matter what reasons behind, the phenomenon may require a ledger to record for reference.
BLOCKCHAIN BASED TRUSTCHAINOriginal blockchain is a continuous ledger recorded on world distributed systems and is the Proof of Work process for bitcoin verification. Current blockchain incorporates interdisciplinary application and evolves a synthesis of distributed system, data compression, network protocol, cryptography, information theory, and game theory. To meet our requirement, in additional to nature of blockchain, we need a tokenized system capable of chaining only key value. The key needs to be distinct to connectexternal database of more detail requiring no computation. And the smart contract in a permissioned blockchain allows distributed encryption, fork tolerance, serialized consistency is suitable. We adopt the Ethereum Virtual Machine based smart contract, which is Turing complete to calculate everything computable we program inside.
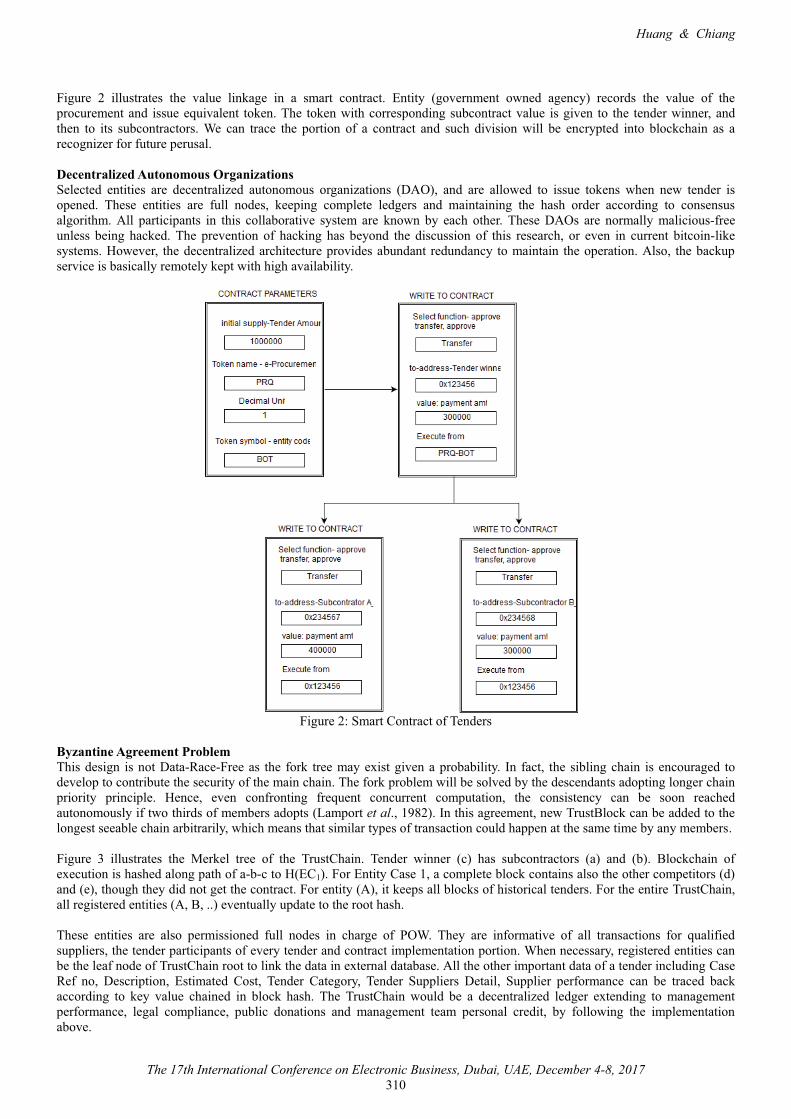
Huang & Chiang
The 17th International Conference on Electronic Business, Dubai, UAE, December 4-8, 2017310
Figure 2 illustrates the value linkage in a smart contract. Entity (government owned agency) records the value of the procurement and issue equivalent token. The token with corresponding subcontract value is given to the tender winner, and then to its subcontractors. We can trace the portion of a contract and such division will be encrypted into blockchain as a recognizer for future perusal.
Decentralized Autonomous OrganizationsSelected entities are decentralized autonomous organizations (DAO), and are allowed to issue tokens when new tender is opened. These entities are full nodes, keeping complete ledgers and maintaining the hash order according to consensus algorithm. All participants in this collaborative system are known by each other. These DAOs are normally malicious-free unless being hacked. The prevention of hacking has beyond the discussion of this research, or even in current bitcoin-like systems. However, the decentralized architecture provides abundant redundancy to maintain the operation. Also, the backup service is basically remotely kept with high availability.
Figure 2: Smart Contract of Tenders
Byzantine Agreement ProblemThis design is not Data-Race-Free as the fork tree may exist given a probability. In fact, the sibling chain is encouraged to develop to contribute the security of the main chain. The fork problem will be solved by the descendants adopting longer chain priority principle. Hence, even confronting frequent concurrent computation, the consistency can be soon reached autonomously if two thirds of members adopts (Lamport et al., 1982). In this agreement, new TrustBlock can be added to the longest seeable chain arbitrarily, which means that similar types of transaction could happen at the same time by any members.
Figure 3 illustrates the Merkel tree of the TrustChain. Tender winner (c) has subcontractors (a) and (b). Blockchain of execution is hashed along path of a-b-c to H(EC1). For Entity Case 1, a complete block contains also the other competitors (d) and (e), though they did not get the contract. For entity (A), it keeps all blocks of historical tenders. For the entire TrustChain, all registered entities (A, B, ..) eventually update to the root hash.
These entities are also permissioned full nodes in charge of POW. They are informative of all transactions for qualified suppliers, the tender participants of every tender and contract implementation portion. When necessary, registered entities can be the leaf node of TrustChain root to link the data in external database. All the other important data of a tender including Case Ref no, Description, Estimated Cost, Tender Category, Tender Suppliers Detail, Supplier performance can be traced back according to key value chained in block hash. The TrustChain would be a decentralized ledger extending to management performance, legal compliance, public donations and management team personal credit, by following the implementation above.
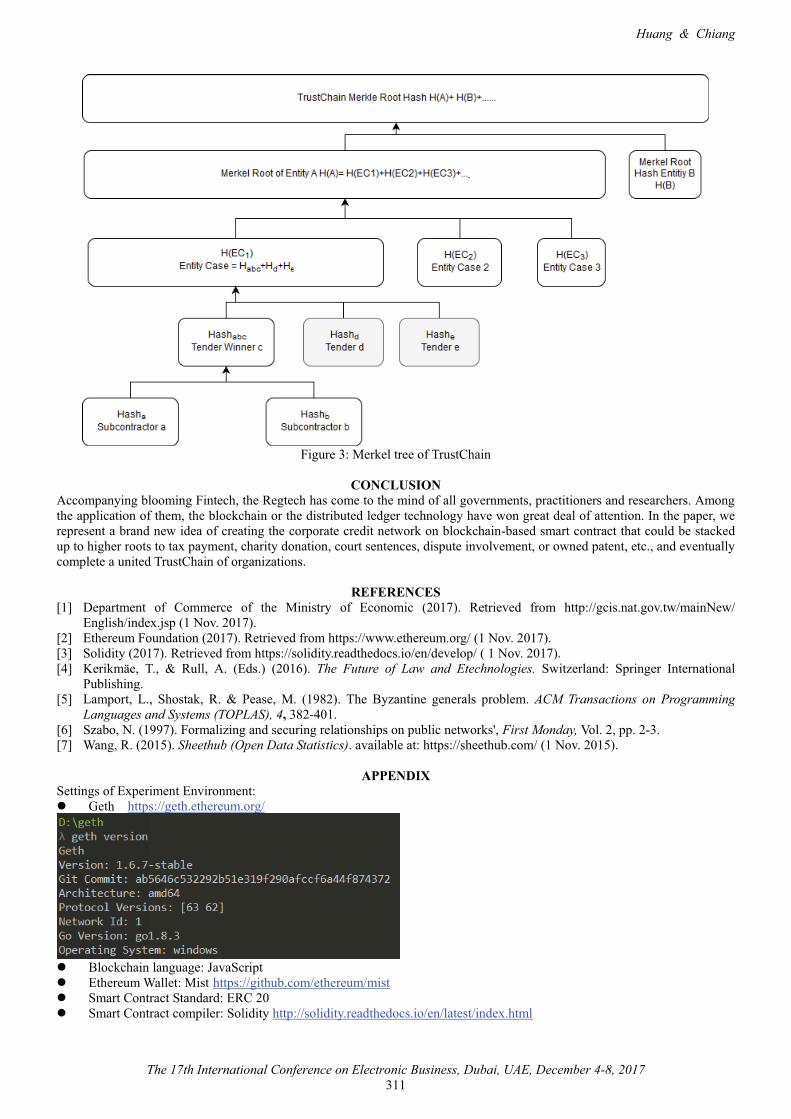
Huang & Chiang
The 17th International Conference on Electronic Business, Dubai, UAE, December 4-8, 2017311
Figure 3: Merkel tree of TrustChain
CONCLUSIONAccompanying blooming Fintech, the Regtech has come to the mind of all governments, practitioners and researchers. Among the application of them, the blockchain or the distributed ledger technology have won great deal of attention. In the paper, we represent a brand new idea of creating the corporate credit network on blockchain-based smart contract that could be stacked up to higher roots to tax payment, charity donation, court sentences, dispute involvement, or owned patent, etc., and eventually complete a united TrustChain of organizations.
REFERENCES[1] Department of Commerce of the Ministry of Economic (2017). Retrieved from http://gcis.nat.gov.tw/mainNew/
English/index.jsp (1 Nov. 2017).[2] Ethereum Foundation (2017). Retrieved from https://www.ethereum.org/ (1 Nov. 2017).[3] Solidity (2017). Retrieved from https://solidity.readthedocs.io/en/develop/ ( 1 Nov. 2017).[4] Kerikmäe, T., & Rull, A. (Eds.) (2016). The Future of Law and Etechnologies. Switzerland: Springer International
Publishing.[5] Lamport, L., Shostak, R. & Pease, M. (1982). The Byzantine generals problem. ACM Transactions on Programming
Languages and Systems (TOPLAS), 4, 382-401.[6] Szabo, N. (1997). Formalizing and securing relationships on public networks', First Monday, Vol. 2, pp. 2-3.[7] Wang, R. (2015). Sheethub (Open Data Statistics). available at: https://sheethub.com/ (1 Nov. 2015).
APPENDIXSettings of Experiment Environment:� Geth https://geth.ethereum.org/
� Blockchain language: JavaScript� Ethereum Wallet: Mist https://github.com/ethereum/mist� Smart Contract Standard: ERC 20� Smart Contract compiler: Solidity http://solidity.readthedocs.io/en/latest/index.html
Zhang, X. & Xu, B. (2017). Study on the influence mechanism of knowledge inertia on the adoption of innovative medical equipment. In Proceedings of The 17th International Conference on Electronic Business (pp. 306-310). ICEB, Dubai, UAE, December 4-8.
Zhang & Xu
The 17th International Conference on Electronic Business, Dubai, UAE, December 4-8, 2017312
Study on the Influence Mechanism of Knowledge Inertia on the Adoption ofInnovative Medical Equipment
(Work in Progress)Xun Zhang, Hohai University, China, [email protected]
Biao Xu*, Nanjing University, China, [email protected]
ABSTRACTThis study examines the influence mechanism of knowledge inertia on the adoption of innovative medical equipment. We develop a conceptual model of the relationship of knowledge inertia, knowledge absorptive capability and the adoption of innovative medical equipment. Our research findings show that knowledge absorptive capability has a significant positive impact on the adoption of innovative medical equipment while knowledge inertia has a negative impact. In the mean time, knowledge absorptive capability mediates the relationship between knowledge inertia and the adoption of innovative medical equipment. Moreover, perceived organizational support and knowledge potential of doctor has a moderating effect on the relationship between knowledge inertia and knowledge absorptive capability. The paper rounds off with a discussion of expected contributions.
Keywords: knowledge inertia, knowledge absorptive capability, adoption of new equipment, perceived organizational support, knowledge potential._____________________*Corresponding author
INTRODUCTIONWith the development of new medical technology, new medical devices and other equipment are continuously used for clinical diagnosis and treatment. The range of medical innovation devices is very wide, including multi-row CT, PET- CT, superconducting magnetic resonance, proton accelerator etc. However, while a large number of advanced medical equipment has been introduced into a hospital, a lot of new equipment has been left unused. Some of them even have never used after beenpurchased. This kind of phenomenon is very common in China, even in some big hospitals. For example, according to the findings of Beijing Municipal Bureau of Audit, the value of idle equipment reached 661 million Yuan in 5 municipal public hospitals and some equipment has not been put into use for nearly 3 years since has purchased (xinhuanet.com, 2016). This caused serious waste of medical resources.
In the meantime, the research of the adoption of innovation pays more attention on the whole adoption model. For example, from theory of reasoned action (Sheppard et al., 1988), theory of planned behavior (Ajzen, 1985), technology acceptance model(Davis, 1985) and innovation diffusion theory (Rogers, 2010), theses research try to explain the adoption of information system in hospital. They all carry out research on organizational level. For example, from hospital level, some studies try to do the research on the adoption of electronic medical records (Angst & Agarwal, et al., 2010; Berner, Detmer & Simborg, 2005), the relationship between the new technology adoption of public health insurance and hospital (Freedman et al., 2015), the influence mechanism of managed care on new technology (Mas & Seinfeld, 2008), which nursing homes adopted health information technology (Zhang et, al., 2016), and also comparing hospital’s adoption of advanced technologies by patient's medical record (Sugihara et al., 2016). Only a few studies focus on the individual level, for example, the influence of individual's educationlevel on the adoption of new drugs (Lleras-Muney & Lichtenberg, 2002). So, the current research still lacks much attention on the individual level and ignores the influence of personal motivation and characters. However, in hospital context, doctors’ individual characteristic is very important. They can directly influence the adoption of new equipment.
In order to solve the research gap, the study focuses on the psychological perception of doctors and investigates the effects of knowledge inertia on their adoption of medical equipment. Specifically, the paper examines the mediation effect of knowledge absorptive capabilities and moderation effects of organizational support and knowledge potential on the relationship between knowledge inertia and knowledge absorptive capability.
THEORETICAL FRAMEWORKKnowledge inertia Inertia originally is a concept in physics. It means a state that “objects continue in a state of rest or uniform motion unless acted upon by forces” (Liao et al., 2008). The concept of inertia can be dated back to the year of 1985 (Sternberg, 1985). However, the concept of knowledge inertia was brought by Liao et al. in the year of 2002. By applying the concept of inertia to human behavior, Liao et al. (2002) points out that it means using of previous experience, knowledge or procedures to solve problems and seek new knowledge. Although the concept was brought into research for more than 15 years, it did raise much attention of
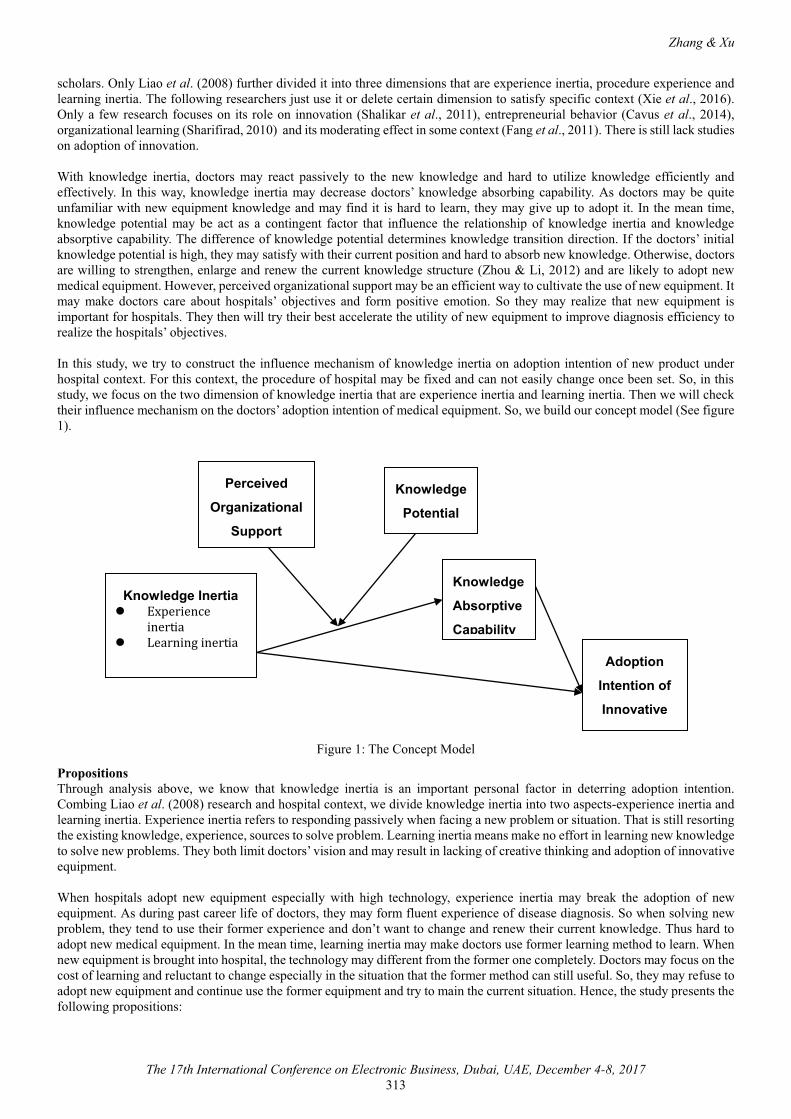
Zhang & Xu
The 17th International Conference on Electronic Business, Dubai, UAE, December 4-8, 2017313
scholars. Only Liao et al. (2008) further divided it into three dimensions that are experience inertia, procedure experience and learning inertia. The following researchers just use it or delete certain dimension to satisfy specific context (Xie et al., 2016).Only a few research focuses on its role on innovation (Shalikar et al., 2011), entrepreneurial behavior (Cavus et al., 2014), organizational learning (Sharifirad, 2010) and its moderating effect in some context (Fang et al., 2011). There is still lack studies on adoption of innovation.
With knowledge inertia, doctors may react passively to the new knowledge and hard to utilize knowledge efficiently and effectively. In this way, knowledge inertia may decrease doctors’ knowledge absorbing capability. As doctors may be quiteunfamiliar with new equipment knowledge and may find it is hard to learn, they may give up to adopt it. In the mean time, knowledge potential may be act as a contingent factor that influence the relationship of knowledge inertia and knowledge absorptive capability. The difference of knowledge potential determines knowledge transition direction. If the doctors’ initial knowledge potential is high, they may satisfy with their current position and hard to absorb new knowledge. Otherwise, doctors are willing to strengthen, enlarge and renew the current knowledge structure (Zhou & Li, 2012) and are likely to adopt new medical equipment. However, perceived organizational support may be an efficient way to cultivate the use of new equipment. It may make doctors care about hospitals’ objectives and form positive emotion. So they may realize that new equipment is important for hospitals. They then will try their best accelerate the utility of new equipment to improve diagnosis efficiency to realize the hospitals’ objectives.
In this study, we try to construct the influence mechanism of knowledge inertia on adoption intention of new product under hospital context. For this context, the procedure of hospital may be fixed and can not easily change once been set. So, in this study, we focus on the two dimension of knowledge inertia that are experience inertia and learning inertia. Then we will check their influence mechanism on the doctors’ adoption intention of medical equipment. So, we build our concept model (See figure 1).
Figure 1: The Concept Model
PropositionsThrough analysis above, we know that knowledge inertia is an important personal factor in deterring adoption intention. Combing Liao et al. (2008) research and hospital context, we divide knowledge inertia into two aspects-experience inertia and learning inertia. Experience inertia refers to responding passively when facing a new problem or situation. That is still resorting the existing knowledge, experience, sources to solve problem. Learning inertia means make no effort in learning new knowledge to solve new problems. They both limit doctors’ vision and may result in lacking of creative thinking and adoption of innovative equipment.
When hospitals adopt new equipment especially with high technology, experience inertia may break the adoption of new equipment. As during past career life of doctors, they may form fluent experience of disease diagnosis. So when solving new problem, they tend to use their former experience and don’t want to change and renew their current knowledge. Thus hard to adopt new medical equipment. In the mean time, learning inertia may make doctors use former learning method to learn. When new equipment is brought into hospital, the technology may different from the former one completely. Doctors may focus on the cost of learning and reluctant to change especially in the situation that the former method can still useful. So, they may refuse to adopt new equipment and continue use the former equipment and try to main the current situation. Hence, the study presents the following propositions:
Knowledge Inertia� Experience
inertia
� Learning inertia
Knowledge
Absorptive
Capability
Adoption
Intention of
Innovative
Perceived
Organizational
Support
Knowledge
Potential
Zhang & Xu
The 17th International Conference on Electronic Business, Dubai, UAE, December 4-8, 2017314
P1a: Experience inertia negatively influences doctors' adoption intention of innovative equipment.P1b: Leaning inertia negatively influences doctors' adoption intention of innovative equipment.
Absorptive capability was originally defined at an organizational level (Cohen and Levinthal 1989, 1990). Now days, many scholars use it in different level (Van Wijk et al. 2008). For our study, we focus on individual level. It means that individual within an organization exploits the knowledge to make new ideas or products by bringing external knowledge into the organization (Lane, Koka, and Pathak 2006). It reflects the utility of outer knowledge. The outer knowledge can only be transferred into inner knowledge of doctors that can bring high performance. When hospitals bringing new equipment into hospital, doctors will face much new knowledge. Due to the influence of inertia, those are experience, resource and methods, doctors will face difficulty in absorbing new knowledge. Also, new knowledge may even conflict with current knowledge and doctors may need to sacrifice some benefit. Doctors may reject new knowledge’s absorbing. Thus, it very hard for doctors to integrate new knowledge into knowledge systems. So, knowledge inertia may have negative effect on knowledge absorptive capabilities. Hence, the study presents the following propositions:
P2a: Experience inertia negatively influences knowledge absorptive capabilities.P2b: Leaning inertia negatively influences knowledge absorptive capabilities.
An individual with high absorptive capability can acquire and assimilate a large of new knowledge. So doctors who can absorb new knowledge may be confident in handling new technology. They may tend to improve utilization of new technology.Through their demonstration effect, many other doctors may begin to accelerate absorbing of new knowledge and adoption of new equipment. In addition, through assimilating diverse external new knowledge, doctors can be accustomed to understanding new knowledge and learns how to transfer new knowledge to other doctors in a way that they can easily understand (Reagans &McEvily 2003). Thus reducing new knowledge absorbing cost of other doctors. Hence, the study presents the following propositions:
P3: Knowledge absorptive capabilities positively influences doctors' adoption intention of innovative equipment.
Combining the previous proposition P1a, P1b, P2a, P2b, P3, knowledge absorptive capability mediated the relationship between knowledge inertia and doctors’ adoption intention is suggested. Absorptive capability reflects doctors’ learning capability. If doctors’ learning capability is strong, they can easily understand the intention of hospital as well as the complex knowledge of new equipment. However, a doctor who has fluent experience may have high knowledge inertia and may hard to absorb new knowledge, so this decrease doctors’ learning capability and they may reluctant to adopt new equipment. This decreases the utility of new equipment. Hence, the study presents the following propositions:
P4: Knowledge absorptive capability mediates the relationship between knowledge inertia and doctors' adoption intention.
Perceived organizational support refers to an employee perceives the extent that how organizations value their contribution and care about their happiness (Chiaburu et al., 2015). According to organizational support theory, employees tend to personify an organization and believe that the intent of organization may either hostile or malicious to them (Bosset and Bourgeois, 2015). So this may illustrate that individual may perceived differently to an organization. If doctors perceived high organizational support, they will collect new knowledge actively and change new work method or process to improve their value. So they may tend to accelerate knowledge absorbing and overcome the negative effect of knowledge inertia. In low organizational support, they may feel upset, lacking of capability to carry out knowledge absorbing. Hence, the study presents the following propositions:
P5: Perceived organizational support negatively moderates the relationship between knowledge inertia and doctors' knowledge absorptive capability
Knowledge potential reflects the degree of knowledge that doctors possess. The difference of knowledge potential forms anatural pressure that represents a capability (Monteiro et al., 2008). It determines knowledge flowing direction often transfers and diffuses knowledge from high to low. Doctors may have different potentials because of their different kinds of knowledge. So, doctors with high knowledge potential are likely to have more knowledge and experience, and may be confident about their knowledge. They tend to use current knowledge and ignore new situation. Thus this may lead to their rejection of new knowledge. On the contrary, doctors with low knowledge potential want to change their knowledge potential by learning. Due totheir limited knowledge and experience, they may be more active with new method and technology. They usually try to access, absorb and integrate new knowledge into their knowledge system. So, doctors with low potential tend to focus on learning and experiencing more to enrich their knowledge structures. Thereby promoting knowledge absorption. Hence, the study presents the following propositions:
P6: Knowledge potential positively moderates the relationship between knowledge inertia and doctors' knowledge absorptive capability.
STUDY DESIGN AND METHODOLOGY
Zhang & Xu
The 17th International Conference on Electronic Business, Dubai, UAE, December 4-8, 2017315
Our target populations are current Chinese public hospitals. Potential respondents comprise of doctors from different departments. For the survey, we will develop a questionnaire with measurement items adapted from extant literature. The questionnaire may be first developed in Chinese, translated into English, and then back-translated to Chinese to ensure construct equivalence. A professional translator and two research assistants independently will conduct the translations, and will come to an agreement on the final version for the questionnaire. The questionnaire will be pilot tested among 20 doctors who work in our target hospitals. Their responses provided preliminary evidence about the face validity of the measurement items and will bedropped from the dataset.
Our proposed model and propositioned relationships among constructs will be evaluated by using SEM-PLS modeling in SmartPLS 3.0M. PLS-PM has become popular in modern quantitative research, particularly because it has notable advantages, such as minimal demands on measurement scales, sample distribution, and sample size. It excels at causal-predictive analysis in which hypothesized relationships are complex and few bases have been established.
EXPECTED CONTRIBUTIONSThis study focuses on knowledge inertia and tries to build a theoretical framework of its relationships with knowledge absorptive capability and doctors’ adoption intention of new equipment. Our study expects to make contributions in three aspects. First, this study may contribute to the adoption of innovation. Prior studies have been considering factors of organizational that influence adoption of innovation but neglect individual’s characteristics. Even few studies pay attention to individual level. There is no research focuses on negative part of knowledge. This study brings knowledge inertia that belongs to individual level into hospital context. This may help uncover the influence mechanisms of knowledge inertia on adoption of innovation to some extent. Second, we divide knowledge inertia into two dimensions (i.e. experience inertia and learning inertia) and test their influence respectively on knowledge absorptive capability. This may enrich knowledge absorptive capability literature. Third, we view knowledge absorptive capability as a direct antecedent of doctors’ adoption intention of innovative medical equipment. This may contribute to our understanding of knowledge absorptive mechanisms through which knowledge inertia dimensions influence adoption intention of innovative medical equipment. Moreover, the process of knowledge absorptive capability requires some contingency factors (Chen, 2004). Two moderating variables, knowledge potential and perceived organizational support will be examined. Organizational support is indispensable in the process of adoption of innovative product. In addition, doctors in hospital who have high knowledge potential should try to change their mind to accept new knowledge. Only this way can help improve their knowledge structures. Then this can accelerate the adoption of new equipment in hospitals.
ACKNOWLEDGEMENTThis work was supported by the Ministry of Education in China Project of Humanities and Social Sciences (Project No.14YJC630198) and National Natural Science Foundation of China (Grant No. 71473116). Also, this work was supported by “Fundamental Research Funds for the Central Universities” (Project No. No.2014B15014).
REFERENCES[1] Ajzen, I. (1985). From intentions to actions: A theory of planned behavior. In Action control (pp. 11-39). Springer, Berlin
Heidelberg.[2] Angst, C. M., Agarwal, R., Sambamurthy, V., & Kelley, K. (2010). Social contagion and information technology
diffusion: the adoption of electronic medical records in US hospitals. Management Science, 56(8), 1219-1241.[3] Audit of Beijing found idle medical equipment worth of 661 million Yuan in 5 municipal public hospitals.
http://news.xinhuanet.com/local/2016-07/22/c_1119264958.htm.( accessed 24 Oct 2017).[4] Berner, E. S., Detmer, D. E., & Simborg, D. (2005). Will the wave finally break? A brief view of the adoption of electronic
medical records in the United States. Journal of the American Medical Informatics Association, 12(1), 3-7.[5] Bosset, I., & Bourgeois, E. (2015). Motivation to transfer: linking perceived organizational support to training to personal
goals. Zeitschrift für Erziehungswissenschaft, 18(1), 169-199.[6] Cavus, M. F., Koc, M., & Aksoy, A. (2014). Entrepreneurial Behaviors: Are the People Restricted by Knowledge Inertia?.
International Review of Management and Marketing, 4(1), 42-48.[7] Chen, C. J. (2004). The effects of knowledge attribute, alliance characteristics, and absorptive capacity on knowledge
transfer performance. R&D Management, 34(3), 311-321.[8] Chiaburu, D. S., Chakrabarty, S., Wang, J., & Li, N. (2015). Organizational support and citizenship behaviors: A
comparative cross-cultural meta-analysis. Management International Review, 55(5), 707-736. [9] Cohen, W. M., & Levinthal, D. A. (1990).Absorptive capacity: A new perspective on learning and innovation.
Administrative science quarterly, 35(1), 128-152.[10] Cohen, W. M., & Levinthal, D. A. (1989).Innovation and learning: the two faces of R & D. The economic journal, 99(397),
569-596.[11] Davis, F. D. (1985). A technology acceptance model for empirically testing new end-user information systems: Theory and
results’ (Doctoral dissertation, Massachusetts Institute of Technology).[12] Fang, C. H., Chang, S. T., & Chen, G. L. (2011). Organizational learning capability and organizational innovation: The
moderating role of knowledge inertia. African Journal of Business Management, 5(5), 1864-1870.
Zhang & Xu
The 17th International Conference on Electronic Business, Dubai, UAE, December 4-8, 2017316
[13] Freedman S, Lin H, Simon K. (2015). Public health insurance expansions and hospital technology adoption’.Journal of Public Economics, 121, 117-131.
[14] Lane, P. J., Koka, B. R., & Pathak, S. (2006). The reification of absorptive capacity: A critical review and rejuvenation of the construct. Academy of management review, 31(4), 833-863.
[15] Lleras-Muney, A., & Lichtenberg, F. R. (2002). The effect of education on medical technology adoption: are the more educated more likely to use new drugs’ (No. w9185), National Bureau of Economic Research.
[16] Liao, S. H. (2002). Problem solving and knowledge inertia. Expert systems with applications, 22(1), 21-31.[17] Liao, S. H., Fei, W. C., & Liu, C. T. (2008). Relationships between knowledge inertia, organizational learning and
organization innovation. Technovation, 28(4), 183-195.[18] Mas, N., & Seinfeld, J. (2008). Is managed care restraining the adoption of technology by hospitals?. Journal of health
economics, 27(4), 1026-1045.[19] Monteiro, L. F., Arvidsson, N., & Birkinshaw, J. (2008). Knowledge flows within multinational corporations: Explaining
subsidiary isolation and its performance implications. Organization Science, 19(1), 90-107.[20] Reagans, R., & McEvily, B. (2003). Network structure and knowledge transfer: The effects of cohesion and range.
Administrative science quarterly, 48(2), 240-267.[21] Rogers, E. M. (2010) Diffusion of innovations. Simon and Schuster.[22] Shalikar, S., Lahoutpour, N., & Rahman, A. B. A. (2011). The Study on the impact of knowledge inertia on organization.
Australian Journal of Basic and Applied Sciences, 5(10), 1207-1213.[23] Sharifirad, M. S. (2010). Relationship between knowledge inertia and organizational learning. International Journal of
information Technology and Knowledge management, 2(2), 323-327.[24] Sheppard, B. H., Hartwick, J., & Warshaw, P. R. (1988). The theory of reasoned action: A meta-analysis of past research
with recommendations for modifications and future research. Journal of consumer research, 15(3), 325-343.[25] Sternberg, R.J. (1985). Beyond IQ: A Triarchih Theory of Human Intelligence. Cambridge University Press, N. Y.[26] Sugihara, S., Ichimiya, H., Inui, T., Ito, Y., Saito, Y., Igarashi, I., & Kawabuchi, K. (2016) How do Hospitals Adopt
Advanced Treatment Techniques? An assessment through the records of AMI patients in Japan. Research Institute of Economy, Trade and Industry (RIETI).
[27] Van Wijk, R., Jansen, J. J., & Lyles, M. A. (2008). Inter-and intra-organizational knowledge transfer: a meta-analytic review and assessment of its antecedents and consequences. Journal of management studies, 45(4), 830-853.
[28] Xie, X., Fang, L., Zeng, S., & Huo, J. (2016). How does knowledge inertia affect firms product innovation?’ Journal of Business Research, 69(5), 1615-1620.
[29] Zhang, N., Lu, S. F., Xu, B., Wu, B., Rodriguez-Monguio, R., & Gurwitz, J. (2016). Health information technologies: Which nursing homes adopted them?. Journal of the American Medical Directors Association, 17(5), 441-447.
[30] Zhou, K. Z., & Li, C. B. (2012). How knowledge affects radical innovation: Knowledge base, market knowledge acquisition, and internal knowledge sharing. Strategic Management Journal, 33(9), 1090-1102.
Chang, H.L., Chuo, Y.C. & Yang, H.C. (2017). The impact of product variety and product diversification on inventory levels: From a distributor perspective. In Proceedings of The17th International Conference on Electronic Business (pp. 311-314). ICEB, Dubai, UAE, December 4-8.
Chang, Chuo & Yang
The 17th International Conference on Electronic Business, Dubai, UAE, December 4-8, 2017317
The Impact of Product Variety and Product Diversification on Inventory Levels: From a Distributor Perspective
(Work in Progress)Hsin-lu Chang, National Chengchi University, Taiwan, [email protected]
Yen-Chun, Chou, National Chengchi University, Taiwan, [email protected] Yang*, National Chengchi University, Taiwan, [email protected]
ABSTRACTWe have been working with W company, one of the largest electronic component distributors in Asia, to improve their warehouse management. Our research examines how product variety, the number of items demanded by customer plants through time i in month t, and product diversification, the proportion of total orders each item carried by customer plants i in month t through time, influence inventory levels. We argue that product variety and product diversification are positively related with inventory cost. We also argue that the impacts of product variety and product diversification on inventory cost are negativelymoderated by IT integration. W company’s inventory records come from many customers’ orders at plant level across months. We thus aim to use panel data analysis to examine W company’s product strategies and resulting inventory performance at each customer-plant level over 6 months.
Keywords: Format instruction, ICEB, e-business, electronic commerce, headers and footers._____________________*Corresponding author
INTRODUCTIONWe have been working with W company, one of the largest electronic component distributors in Asia, to improve their warehouse management. W company is an intermediate trader between electronic components manufacturers and electronic devices manufacturers. As an electronic component distributor, W company mainly profits from serving its customers distinct categories of electronic items they need. To meet customers’ demand, W company has to maintain high service level, and make sure that the number of electronic components in the customer hub is sufficient for customers to call off whenever they demand.Fully fulfilling customers’ demands and avoiding stock-out are critical for their competitiveness against competitors.
W company has two ways of serving customers products, distributing items to customer hubs or delivering products directly to customers. The former way is an implementation of vendor-management inventory (VMI), which is a tool used to improve customer service, multi-firm supply chain efficiency and reduce inventory cost (Achabal et al., 2000; Kuk, 2004; Waller et al., 1999). Although VMI can reduce inventory cost, the uncertainty of actual demands makes it difficult to manage the warehouse, and results in tremendous storage costs. In most situations, customers place orders approximately once a month to W company, and the order quantities are usually unchanged. Even though the customers have placed orders, it does not mean that they will call off the exact quantity of items they ordered. They always call off less than the demand they gave to W company, with theremain items stored in the customer hub, causing considerable inventory costs. With the replenishment decision of W company, which is simply based on their experience and simple rules, the difference between the quantities supplied by W company and those called off by customers becomes even more larger. With high inventory levels, the management of warehouse becomes more important.
Ballou (Ballou, 1992) estimates that having inventories can cost between 20% and 40% of their value per year. Inventory cost is a severe problem for W company since inventory cost has a considerable effect on firm profitability. Moreover, product variety makes the inventory levels higher and the management of warehouse more complicated. Product variety has been proved to impact holding costs, service levels and delivery reliability (Closs, Nyaga & Voss, 2010). Prior research finds out that an increase in product variety increases inventory costs and decreases service levels (Closs, Nyaga & Voss, 2010). Furthermore, Graman and Magazine posit high levels of product variety require correspondingly higher levels of inventory (Graman & Magazine, 2002; Closs, Nyaga & Voss, 2010). According to previous research, product variety results in higher levels of inventory and inventory costs. However, product variety is essential to firm competitiveness and sales. To resolve the tradeoff, we are interested in examining the impact of product variety on inventory levels. In addition to product variety, we assume that product diversification, the proportion of total orders by a customer plant each item accounts for may influence inventory level and inventory cost. Prior research (Berg & Zijm, 1999) posits that reduced inventory levels not only reduce inventory costs, but also improve the efficiency of the order-picking operation within the warehouse. This paper examines how the product variety, product diversification influences the inventory level which is critical to warehouse management. We also simultaneously examine whether IT integration level moderates the relationship between product variety, diversification and the inventory level.
This research examines the simultaneous effects of product variety and product diversification on inventory level in customer

Chang, Chuo & Yang
The 17th International Conference on Electronic Business, Dubai, UAE, December 4-8, 2017318
plant. We clarify the effects of product variety and product diversification on inventory level into four categories: high product variety and high diversification, low product variety and low diversification, low product variety and high diversification, and low product variety and low diversification. We also consider the moderated effect of IT integration level on the relationship mentioned above. The above of classifications are further explored on two types of inventory management: customer direct and vendor-managed hub. Prior research mentions that if the computer manufacturer’s channel is customer direct, then its strategy is differentiation, focusing on relatively small number of profitable or customized SKU’s (Closs, Nyaga & Voss, 2010). If the computer manufacturer’s channel is distributor, then its strategy focuses on cost leadership, focusing on relatively low margin profit but relatively high volumes. We aim to compare the two types of inventory management, and see any significant differences on product strategies, i.e., the four classifications above, applied and associated performances.
LITERATURE REVIEWIn the marketing literature, high product variety has been found to be essential for satisfying customer needs, and in turn increase the probability of completing a sale (Wan, Evers & Dresner, 2012). Companies routinely increase product variety in order to enhance competitiveness and grow sales. However, increasing product variety is known to have negative effects on operations, such as an increase in inventory levels (Wan, 2017). Higher product variety results in higher inventory levels due to large numbers of SKUs, which have their own lot sizes, safety stock, and order quantity levels (Zipkin, 2000). Product variety alsoincreases the complexity and uncertainty in the operating environment. Graman and Magazine (2002) posit that greater product complexity requires correspondingly higher inventory levels. Thus, we argue that product variety might also increase the complexity and uncertainty in warehouse management, and in turn increase the inventory cost. Prior research (Wan, Evers &Dresner, 2012) finds out that increasing product variety may have positive impacts on sales, while increasing “too much” may have negative effects. Therefore, we suggest that product variety can satisfy customer demands and maintain competitiveness, but it might also increase complexity of warehouse management and increase inventory cost.
Prior research has mentioned the concept of international diversification, reflecting the number of different markets in which the firm operates and their importance to the firm. The level of international diversification is measured by the percentage of total sales represented by each market (Hitt, Hoskisson & Kim, 1997). Inspired by the concept of diversification indicator, which can show the importance of each market to the firm, we extend the concept to customer orders, called product diversification, which show the proportion of total orders each item carried by customer plant. Product diversification can reflect the importance ofeach item in total orders. The research (Hitt, Hoskisson & Kim, 1997) also suggests that unrelated product diversification spreads the risk across product markets, thereby reducing the probability of severe losses and increasing the probability of achieving a positive return. Hitt and colleagues (1995) argued that an integrated low-cost and differentiation strategy is often necessary to compete in international market. Firms focusing on specific market niches can provide both low-cost and differentiated product, thereby avoiding the competition. The entropy measure of product diversification(PDT) is defined as PDT = Sigma i [Pi x ln(l/Pi)], where Pi is the sales attributed to segment i and ln(l/Pi) is the weight given to each segment, or the natural logarithm of the inverse of its sales (Hitt, Hoskisson & Kim, 1997).
Prior research (Rai et al. 2006) indicated that a firm's information technology (IT)-based platform capabilities have a substantial effect on supply chain process integration. This capability is deeply embedded into the structure of interfirm operational processes, such as order management, inventory management, logistics, and distribution; and information processes, such as demand planning and forecasting. IT integration is an essential element in supply chain management (SCM), and have positive effects on firm performance. IT integration improves information sharing between customer and firm in supply chain; therefore, we suggest that IT integration level as a moderator in our research model.
RESEARCH FRAMEWORKOur research examines how product variety, the number of items demanded by customer plants through time i in month t, and product diversification, the proportion of total orders each item carried by customer plants i in month t through time, influence inventory levels. Our research model is shown in figure 1. Low product variety means that the order demand in the customer hub is composed of small number of items; low product diversification presents that only small number of items account for most oftotal order quantities in customer hub. On the contrary, high product variety means that there are many kinds of items demanded in customer hub, and high product diversification means that the proportion each item accounts for in the total order in the customer hub is with slight difference.
According to prior research (Wan, 2017), increase in product variety has negative impacts on operations, increase the complexity and uncertainty in the operating environment. Higher product variety results in higher inventory levels due to large numbers of SKUs (Zipkin, 2000). Graman and Magazine (2002) posit that greater product complexity requires correspondingly higher inventory levels. They all suggest that increasing in product variety results in higher inventory level. Therefore, we argue that product variety is positively related with inventory cost.H1 Product variety is positively related with inventory cost.
Product diversification, the proportion of total orders each item carried by customer plants i in month t through time, can show the importance of each item to the orders by customer plant. We suggest that with higher product diversification, most items in the orders are important to the customer plant, in turn making it more difficult and complicated to manage inventory, resulting in
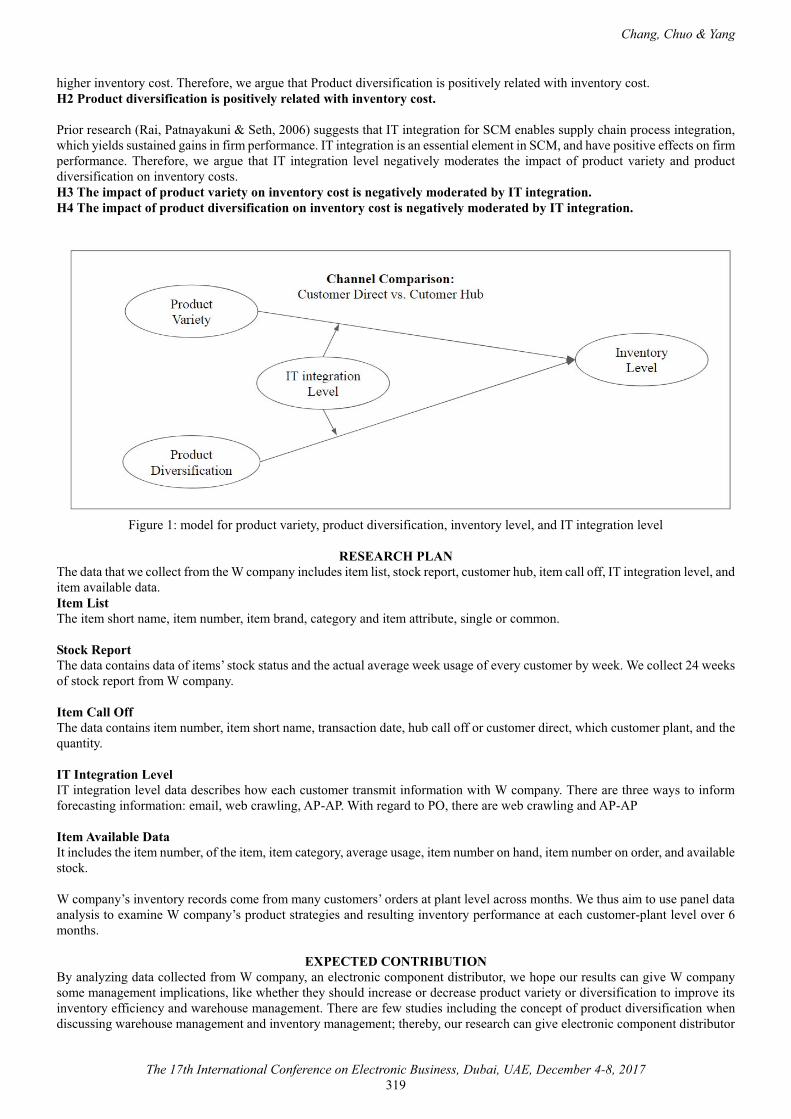
Chang, Chuo & Yang
The 17th International Conference on Electronic Business, Dubai, UAE, December 4-8, 2017319
higher inventory cost. Therefore, we argue that Product diversification is positively related with inventory cost.H2 Product diversification is positively related with inventory cost.
Prior research (Rai, Patnayakuni & Seth, 2006) suggests that IT integration for SCM enables supply chain process integration, which yields sustained gains in firm performance. IT integration is an essential element in SCM, and have positive effects on firm performance. Therefore, we argue that IT integration level negatively moderates the impact of product variety and product diversification on inventory costs. H3 The impact of product variety on inventory cost is negatively moderated by IT integration.H4 The impact of product diversification on inventory cost is negatively moderated by IT integration.
Figure 1: model for product variety, product diversification, inventory level, and IT integration level
RESEARCH PLANThe data that we collect from the W company includes item list, stock report, customer hub, item call off, IT integration level, and item available data.Item ListThe item short name, item number, item brand, category and item attribute, single or common.
Stock ReportThe data contains data of items’ stock status and the actual average week usage of every customer by week. We collect 24 weeks of stock report from W company.
Item Call Off The data contains item number, item short name, transaction date, hub call off or customer direct, which customer plant, and the quantity.
IT Integration Level IT integration level data describes how each customer transmit information with W company. There are three ways to inform forecasting information: email, web crawling, AP-AP. With regard to PO, there are web crawling and AP-AP
Item Available DataIt includes the item number, of the item, item category, average usage, item number on hand, item number on order, and available stock.
W company’s inventory records come from many customers’ orders at plant level across months. We thus aim to use panel data analysis to examine W company’s product strategies and resulting inventory performance at each customer-plant level over 6 months.
EXPECTED CONTRIBUTIONBy analyzing data collected from W company, an electronic component distributor, we hope our results can give W company some management implications, like whether they should increase or decrease product variety or diversification to improve itsinventory efficiency and warehouse management. There are few studies including the concept of product diversification when discussing warehouse management and inventory management; thereby, our research can give electronic component distributor
Chang, Chuo & Yang
The 17th International Conference on Electronic Business, Dubai, UAE, December 4-8, 2017320
new management approaches. Also, theoretically, one of key influence/role of IT is to improve information sharing. Given the industry context where electronic manufacturers can reschedule or cancel orders from W company, it is interesting to empiricallyexamine the effect of IT integration on the relationship between product variety, product diversification, and inventory costs.
REFERENCES[1] Achabal, D.D., McIntyre, S.H., Smith, S.A., & Kalyanam, K. (2000). A decision support system for vendor managed
inventory. Journal of Retailing, 76(4), 430-454.[2] Kuk, G. (2004). Effectiveness of vendor-managed inventory in the electronics industry: determinants and outcomes.
Information & Management, 41(5), 645-654.[3] Waller, M., Johnson, M.E., & Davis, T. (1999). Vendor-managed inventory in the retail supply chain. Journal of Business
Logistics, 20(1), 183.[4] Ballou, R.H. (1992). Business Logistics Management (3rd ed.). Englewood Cliffs, NJ: Prentice-Hall.[5] Closs, D.J., Nyaga, G.N., & Voss, M.D. (2010). The differential impact of product complexity, inventory level, and
configuration capacity on unit and order fill rate performance. Journal of Operations Management, 28(1), 47-57.[6] Graman, G.A., & Magazine, M.J. (2002). A numerical analysis of capacitated postponement. Production and Operations
Management, 11(3), 340-357.[7] van den Berg, J.P., & Zijm, W.H.M. (1999). Models for warehouse management: Classification and examples.
International Journal of Production Economics, 59(1), 519-528.[8] Rai, A., Patnayakuni, R., & Seth, N. (2006). Firm performance impacts of digitally enabled supply chain integration
capabilities. MIS Quarterly, 30(2), 225-246.[9] Wan, X., & Sanders, N.R. (2017). The negative impact of product variety: Forecast bias, inventory levels, and the role of
vertical integration. International Journal of Production Economics, 186, 123-131.[10] Wan, X., Evers, P.T., & Dresner, M.E. (2012). Too much of a good thing: The impact of product variety on operations and
sales performance. Journal of Operations Management, 30(4), 316-324.[11] Hitt, M.A., Hoskisson, R.E., & Kim, H. (1997). International diversification: Effects on innovation and firm performance
in product-diversified firms. Academy of Management Journal, 40(4), 767-798.

Ben Dhaou, S., Zalan T. & Toufaily E. (2017). Blockchain technology adoption: implications and challenges. InProceedings of The 17th International Conference on Electronic Business (p. 315). ICEB, Dubai, UAE, December 4-8.
Ben Dhaou, Zalan & Toufaily
The 17th International Conference on Electronic Business, Dubai, UAE, December 4-8, 2017
321
Blockchain Technology Adoption: Implications and Challenges(Abstract Only)
Soumaya Ben Dhaou, United Nations University, Portugal [email protected] Zalan*, American University in Dubai, Dubai Media City, [email protected]
Elissar Toufaily, American University in Dubai, Dubai Media City, [email protected]
ABSTRACTAccording to the World Economic Forum, by 2025 10% of the world’s GDP (currently about $100 trillion) may be on blockchain. Blockchain technology is described as a distributed ledger technology (DLT) underpinned by five fundamental principles: decentralization, peer-to-peer transmission; transparency with pseudonymity; irreversibility of records; and computational logic. Despite blockchain’s transformative potential, it is unclear how Blockchain applications are implemented across industries and product/service categories. The purpose of the paper is to discuss the general challenges, risks, and implications related to blockchain implementation and adoption by the private and public sectors. We discuss how blockchain should overcome multiple barriers–technological, governance, organizational and social–for its widespread adoption. Mainly, the regulatory uncertainty, scalability and performance, interoperability, data privacy, security, legacy systems and the skills gap barriers to adoption are examined. Moreover, the socioeconomic implications of blockchain are discussed mainly the financial, economic, social and institutional impacts.
Keywords: Blockchain technology, distributed ledger technology, blockchain implications, blockchain challenges, adoption._____________________*Corresponding author
Tang, H. & Lin, X.W. (2017). Curbing shopping cart abandonment in C2C markets—An uncertainty reduction approach. In Proceedings of The 17th International Conference on Electronic Business (pp. 316-318). ICEB, Dubai, UAE, December 4-8.
Tang & Lin
The 17th International Conference on Electronic Business, Dubai, UAE, December 4-8, 2017322
Curbing Shopping Cart Abandonment in C2C Markets—An Uncertainty Reduction Approach
(Abstract Only)Heng Tang*, Faculty of Business Administration, University of Macau, Macau SAR, [email protected] Lin, Faculty of Business Administration, University of Macau, Macau SAR, [email protected]
Keywords: shopping cart abandonment, seller uncertainty, product uncertainty, uncertainty reduction theory._____________________*Corresponding author
INTRODUCTIONAfter two decades of dazzling proliferation of digital markets, it is widely recognized that such growth is drastically slowing down in the coming years, especially in those developed economies (BCG 2016). On the other hand, however, online sellers are continuously damaged from the tremendous loss caused by shopping cart abandonment (SCA). SCA is the phenomenon that a customer puts items into her virtual shopping cart in the online buying website, but somehow choose not to proceed with payment eventually (Egeln & Joseph 2012). Statistics by eMarketer revealed a shocking SCA rate as around 70% on average, causing a loss of over $18 billion a year (eMarketer 2016).
SCA has drawn extensive intention from marketers (Koufaris 2002; Reichheld & Schefter 2000). In contract, it is surprising to find that there is little empirical research studying the underlying mechanisms of SCA phenomenon (with only a few notable exceptions, see (Fenech 2002; Fernandes 2012; Kukar-Kinney & Close 2010; Rajamma et al. 2009)). The myriad of e-commerce and marketing studies examine the antecedents of consumers’ “intention to buy” in general, they face challenge to adapt to understanding SCA behavior. Curiously, empirical research about the buyer’s driving/curbing force of “crossing the finish line” is nascent. Against this backdrop, we herein conceptualize Intention to Checkout as the subjective probability that a customer will proceed with payment under the circumstance that products have already been chosen but not yet payed (termed the “post-cart” stage hereafter). In the current research, we contend that risk concerns caused by various uncertain situations become the dominating heuristics for payment decision making (Kahneman & Tversky 1979). Whilst a buyer having decided the choice of seller and products, her primary interest about the goods, and her initial attitude towards the website and the vendor, are largely shaped. The click of “pay” button hence leads directly to the outcome of the transaction, either positive or negative, triggering the buyer’s vigilance against potential losses.
Therefore, this research anchors on one specific theoretical perspective, buyer perceived uncertainty, to investigate SCA phenomenon. In order to understand how uncertainty influences SCA, our first objective is to address this gap by studying the effects of different types of uncertainty perception on intention to checkout during post-cart stage. Drawing on uncertainty reduction theory (URT) from communication literature, we posit that buyers can employ three strategies (i.e., passive, active, and interactive strategies) to acquire information in order to mitigate uncertainty encountered during the post-cart stage. we want to address a prominent question for researchers and marketers, viz.: what CMC facilities are most effective in reducing which type of uncertainty perception during the post-cart stage?
In line with URT, we propose that three core characteristics of C2C sellers enable the aforementioned communication strategies: (1) effective product descriptions, (2) interactivity, and (3) effective feedback systems, respectively. We conceptualize effectiveness of product descriptions as the capability of the buyer to describe product details and help buyers familiarize with the product. Following the conceptualization of interactivity in literature (Liu 2003; Teo et al. 2003), interactivity is defined as the quality of buyer-seller interaction. Finally, we define “effectiveness of feedback systems” as the extent to which the feedback systems of can provide a large volume of unselective feedback opinions towards past transactions. Notably, because the perception of how effective these communication facilitators can vary across different individuals, we consider perceptual rather than objective effects herein. Thus, we consider the following three constructs as the direct predictor of uncertainty, i.e., perceived effectiveness of product descriptions (PEPD), perceived interactivity (PI), and perceived effectiveness of feedbacksystems (PEFS). Collectively, we conceptualize Communication Strategy Facilitators (CSFs) as a consumer’s general perceptionof a buyer’s capability of facilitating three core communication strategies in her pre-purchase information acquisition process. In general, we postulate that strong CSFs can potentially contribute to buyer uncertainty reduction, thereby amplify intention to checkout. Our conceptual framework is presented in Figure 1.
(Remark: detailes of hypothesis development and methodlogy are omitted in this extended abstract.)
INTENDED IMPLICATIONSImplications to TheoryThis research contributes to the literature in three ways. First, taking a communication view, this research regards transaction
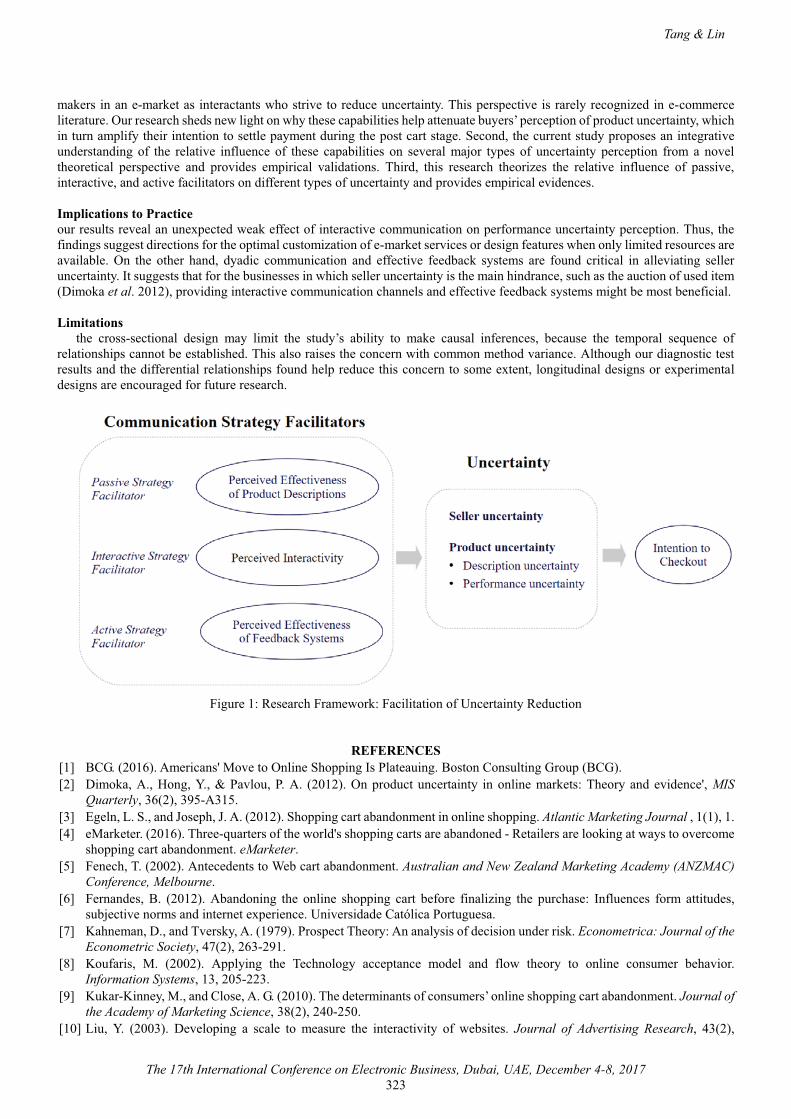
Tang & Lin
The 17th International Conference on Electronic Business, Dubai, UAE, December 4-8, 2017323
makers in an e-market as interactants who strive to reduce uncertainty. This perspective is rarely recognized in e-commerce literature. Our research sheds new light on why these capabilities help attenuate buyers’ perception of product uncertainty, which in turn amplify their intention to settle payment during the post cart stage. Second, the current study proposes an integrative understanding of the relative influence of these capabilities on several major types of uncertainty perception from a novel theoretical perspective and provides empirical validations. Third, this research theorizes the relative influence of passive,interactive, and active facilitators on different types of uncertainty and provides empirical evidences.
Implications to Practiceour results reveal an unexpected weak effect of interactive communication on performance uncertainty perception. Thus, the findings suggest directions for the optimal customization of e-market services or design features when only limited resources are available. On the other hand, dyadic communication and effective feedback systems are found critical in alleviating seller uncertainty. It suggests that for the businesses in which seller uncertainty is the main hindrance, such as the auction of used item (Dimoka et al. 2012), providing interactive communication channels and effective feedback systems might be most beneficial.
Limitationsthe cross-sectional design may limit the study’s ability to make causal inferences, because the temporal sequence of
relationships cannot be established. This also raises the concern with common method variance. Although our diagnostic test results and the differential relationships found help reduce this concern to some extent, longitudinal designs or experimental designs are encouraged for future research.
Figure 1: Research Framework: Facilitation of Uncertainty Reduction
REFERENCES[1] BCG. (2016). Americans' Move to Online Shopping Is Plateauing. Boston Consulting Group (BCG).[2] Dimoka, A., Hong, Y., & Pavlou, P. A. (2012). On product uncertainty in online markets: Theory and evidence', MIS
Quarterly, 36(2), 395-A315.[3] Egeln, L. S., and Joseph, J. A. (2012). Shopping cart abandonment in online shopping. Atlantic Marketing Journal , 1(1), 1.[4] eMarketer. (2016). Three-quarters of the world's shopping carts are abandoned - Retailers are looking at ways to overcome
shopping cart abandonment. eMarketer.[5] Fenech, T. (2002). Antecedents to Web cart abandonment. Australian and New Zealand Marketing Academy (ANZMAC)
Conference, Melbourne.[6] Fernandes, B. (2012). Abandoning the online shopping cart before finalizing the purchase: Influences form attitudes,
subjective norms and internet experience. Universidade Católica Portuguesa.[7] Kahneman, D., and Tversky, A. (1979). Prospect Theory: An analysis of decision under risk. Econometrica: Journal of the
Econometric Society, 47(2), 263-291.[8] Koufaris, M. (2002). Applying the Technology acceptance model and flow theory to online consumer behavior.
Information Systems, 13, 205-223.[9] Kukar-Kinney, M., and Close, A. G. (2010). The determinants of consumers’ online shopping cart abandonment. Journal of
the Academy of Marketing Science, 38(2), 240-250.[10] Liu, Y. (2003). Developing a scale to measure the interactivity of websites. Journal of Advertising Research, 43(2),

Tang & Lin
The 17th International Conference on Electronic Business, Dubai, UAE, December 4-8, 2017324
207-216.[11] Rajamma, R. K., Paswan, A. K., and Hossain, M. M. (2009). Why do shoppers abandon shopping cart? Perceived waiting
time, risk, and transaction inconvenience. Journal of Product & Brand Management, 18(3), 188-197.[12] Reichheld, F. F., and Schefter, P. (2000). E-Loyalty - Your secret weapon on the Web. Harvard Business Review, 78(4),
105.[13] Teo, H. H., Oh, L. B., Liu, C. H., and Wei, K. K. (2003). An empirical study of the effects of interactivity on Web user
attitude. International Journal of Human-Computer Studies, 58(3), 281-305.
Hayati, B. (2017). Customer satisfaction with e-service recovery: roles of perceived justice and customer emotions. in Proceedings of The 17th International Conference on Electronic Business (pp. 319-320). ICEB, Dubai, UAE, December 4-8.
Hayati
The 17th International Conference on Electronic Business, Dubai, UAE, December 4-8, 2017325
Customer Satisfaction with E-Service Recovery: Roles of Perceived Justice and Customer Emotions
(Abstract Only)Babak Hayati, Asian Institute of Management, Philippines, [email protected]
ABSTRACTMultiple variables inside and outside of an organization can influence the quality of service delivery to customers. Even though some of these factors can potentially be controlled through organized efforts by the firm, there will still remain instances at which companies fail to provide their services at the expected level. Service failure encounters are important moments of truth for both firms and customers because negative emotions created throughout the process may lead to the disconnection of relationship between firms and their customers (Smith & Bolton, 2002). Thus, service recovery attempts are critical in re-building and, possibly, enhancing customer-firm relationships (Morgan & Hunt, 1994). If not done right, a failed recovery may result in negative outcomes such as customer switching behavior and negative word of mouth (Keaveney, 1995). Industry reports indicate that service failures possibly influence 70% of all repurchase or switching decisions (Balter, 2008). Therefore, strategic planning is critical for service-oriented firms in order to successfully identify and manage the service recovery processes.
Services literature defines service recovery (SR) as a process through which a firm responds to and rectifies its failures in service delivery (Kelley & Davis, 1994). Previous studies have shown that customers are emotionally involved during SR and their affective states play critical roles in their evaluation of a firm’s SR efforts (Smith & Bolton, 2002). In addition, when a company fails to provide its services at the expected level, customers might perceive an imbalance between their spent resources (money, time, etc.) to receive the service and the firm’s efforts in providing the service. Thus, due to customers’ affective involvement during SR, customers are more sensitive to inequity and injustice issues that they observe in a firm’s handling of the SR process (Maxham, 2001). As a result, previous scholars have introduced perceived justice as an important driver of customer emotions and satisfaction with SR (Chebat & Slusarczk, 2005).
Despite significant advances in SR research, there are still important gaps in our understanding of how this process works from the perspective of customers’ perceived justice, emotions, and satisfaction. First, although the role of emotions during SR has been highlighted, previous scholars have mainly focused on negative emotions and ignored the possible influence of positive emotions on customer satisfaction with SR. This is surprising because successful recovery from service failures can actually lead to senses of satisfaction, trust and loyalty to the firm (Tax, Brown & Chandrashekaran, 1998). Therefore, it is important to understand the role that positive emotions with service recovery play during SR. Second, previous studies have either focused on the antecedents or consequences of customer satisfaction with SR. There is a lack of a comprehensive model that takes into both drivers and outcomes of SR. A comprehensive model can provide an appropriate managerial framework for SR handling situations. Third, there is limited amount of research on how cognitive evaluations of perceived justice during SR combine with emotional responses to SR in order to form customer satisfaction (Chebat & Slusarczyk, 2005). It is important to study this phenomenon in SR research because customer satisfaction is driven by both affective and cognitive states of customers. Fourth, there is a lack of research on how customers react to service recovery in the context of e-services where face-to-face interaction with customers is minimal or non-existent during SR and most of the recovery process happens through online channels.
This study explores how customer’s perceived justice with SR leads to both positive and negative customer emotions, which finally influence customer’s satisfaction with SR. We collect data from an online travel booking company in US which mainly handles customer service recovery through the online chat medium. We address the mentioned gaps in services literature by showing that dimensions of perceived justice (i.e. distributive, procedural, interactional) have varying effects on both positive and negative customer emotions. We also demonstrate that customer emotions mediate the relationship between perceived justice and customer
Hayati
The 17th International Conference on Electronic Business, Dubai, UAE, December 4-8, 2017326
satisfaction with SR and, thus, need to be carefully considered in SR situations. Therefore, our findings provide a useful and practical framework for managers to understand how the SR process should be managed to maximize customer satisfaction.
Keywords: E-service recovery, customer emotions, customer perceived justice, customer satisfaction
REFERENCES[1] Balter, D. (2008). The Word of Mouth Manual (2nd ed.). Boston: Bzz Pubs. [2] Chebat, J. C. & Slusarczyk, W. (2005). How emotions mediate the effects of perceived justice on loyalty
in service recovery situations: an empirical study. Journal of Business Research, 58(5), 664-673.[3] Keaveney, S. M. (1995). Customer switching behavior in service industries: An exploratory study.
Journal of Marketing, 59(April), 71-82.[4] Kelley, S. W., & Davis, M. A. (1994). Antecedents to customer expectations for service recovery.
Journal of the Academy of Marketing Science, 22(1), 52-61. [5] Smith, A. K., & Bolton, R. N. (1998). An experimental investigation of customer reactions to service
failure and recovery encounters paradox or peril?. Journal of Service Research, 1(1), 65-81.[6] Maxham, J. G. (2001). Service recovery's influence on consumer satisfaction, positive word-of-mouth,
and purchase intentions. Journal of Business Research, 54(1), 11-24.[7] Morgan, R. M., & Hunt, S. D. (1994). The commitment-trust theory of relationship marketing. Journal of
Marketing, 58(July), 20-38. [8] Smith, A. K., & Bolton, R. N. (2002). The effect of customers' emotional responses to service failures on
their recovery effort evaluations and satisfaction judgments. Journal of the Academy of Marketing Science, 30(1), 5-23.
[9] Tax, S. S., Brown, S. W., & Chandrashekaran, M. (1998). Customer evaluations of service complaint experiences: Implications for relationship marketing. Journal of Marketing, 62(April), 60-76.
Janse, N., Ou, C.X.J., Angelopoulos, S., Davison, R.M. & Jia, J.W.Y. (2017). Do security breaches matter to consumers?. In Proceedings of The 17th International Conference on Electronic Business (p. 321). ICEB, Dubai, UAE, December 4-8.
Janse, Ou, Angelopoulos, Davison & Jia
The 17th International Conference on Electronic Business, Dubai, UAE, December 4-8, 2017327
Do Security Breaches Matter to Consumers?(Abstract Only)
Noury Janse, Tilburg University, Nederland, [email protected] X.J. Ou*, Tilburg University, Nederland, [email protected]
Spyros Angelopoulos, Tilburg University, Nederland, [email protected] M. Davison, City University of Hong Kong, China, [email protected] Wanying Jia, City University of Hong Kong, China, [email protected]
ABSTRACTOnline security has been an important topic in electronic business. However, even the best IT security infrastructures cannot assure that cyber-attacks and malicious intrusions can be prevented. Therefore, it is important to know what is to be done when a security breach occurs, and how it influences consumers’ perceptions and behaviors. Via a survey of 258 respondents, this paper makes a first attempt to identify the relationships among security breach announcements, consumers’ perceived risks(including performance risk, financial risk, time risk and privacy risk), company reputation and a consumer’s intention to transact. Our key findings and implications are discussed.
Keywords: Security breach, perceived risk, company reputation, intention to transact_____________________*Corresponding author
Cheng, J.H., Liu, R.G., & Du, T.C. (2017). Exploring how conflict and uncertainty affect repurchase intention in social commerce---The mediating effect of perceived deceptiveness. In Proceedings of The 17th International Conference on Electronic Business (p. 322). ICEB, Dubai, UAE, December 4-8.
Cheng, Liu, & Du
The 17th International Conference on Electronic Business, Dubai, UAE, December 4-8, 2017328
Exploring How Conflict and Uncertainty Affect Repurchase Intention in Social Commerce---The Mediating Effect of Perceived Deceptiveness
(Abstract Only)Jao-Hong Cheng*, Department of Information Management, National Yunlin University of Science and
Technology, Douliou, Taiwan, [email protected] Liu , Department of Information Management, National Yunlin University of Science and
Technology, Douliou, Taiwan, [email protected] C. Du, Department of Decision Sciences and Managerial Economics,
The Chinese University of Hong Kong, Shatin, NT, Hong Kong, [email protected]
ABSTRACTThis paper aims to examine how factors influence perceived deceptiveness and repurchase intention in social commerce. A novel research model comprises five research hypotheses with four constructs, including conflict, uncertainty, perceived deceptiveness and repurchase intention. The structure is measured by good support in the literature. Structural equation modeling is used to analyze survey data collected from 351 usable responses. The results show that perceived deception is the key factor affecting the repurchase intention. The findings of the study provide useful insights into how online merchants should manage conflict behaviors and reduce uncertainty so as to mitigate perceived deceptiveness and in turn enhance the repurchase intention for the social commerce as a whole.
Keywords: Conflict, Uncertainty, Perceived Deceptiveness, Repurchase Intention_____________________*Corresponding author
Song, W., Chen, J. & Li, W. (2017). Spillover effect of consumer awareness on third-party sellers’ selling strategies on retail platforms. In The 17th International Conference on Electronic Business (p. 323). ICEB, Dubai, UAE, December 4-8.
Song, Chen & Li
The 17th International Conference on Electronic Business, Dubai, UAE, December 4-8, 2017329
Spillover Effect of Consumer Awareness on Third-Party Sellers’ Selling Strategies on Retail Platform
(Abstract Only)Wen Song, Dalian University of Technology, China, [email protected] Chen*, The University of Texas at Dallas, USA, [email protected]
Wenli Li, Dalian University of Technology, China, [email protected]
ABSTRACTGlobal e-commerce sales have reached over $1 trillion and e-commerce has experienced unprecedented prosper for the past years. Along with this remarkable growth is the emergence of giant online retailers such as Amazon.com in the U.S. and JD.com in China. Traditionally these retailers adopt merchant revenue model under which they buy products from suppliers and resell to consumers. Over years, the leading online retailers have developed a considerable consumer base. With the options of reaping their dominance via their merchant revenue model, interestingly, these retailers open their platforms and allow third-party sellers to sell on their platforms, thus inviting competition. Small merchants might use the platforms to reach customers who otherwise would not know the existence of the merchants, and are attracted to the retailers' platforms by the promise of tapping into their huge user base. Third-party sellers report an average of 50% increase in sales when they join Amazon's platform. In turn, Amazon takes a commission for every sale (e.g., 6% for personal computers and 15% for mobile phones). Intuitively, both the retailer and the third-party sellers benefit from the partnership if the third-party sellers sell products different from those offered by the retailer. However, one puzzling phenomenon is that these retailers allow third-party sellers to sell identical products as those offered by the retailers, and we often observe both a retailer and a third-party seller offering the same product on the retailer's platform.
More interestingly, many third-party sellers have their own websites and carry more products than retailers in some specific category, and when they join a retailer's platform they sell some of their products on the retailer's platform. Sometimes these third-party sellers may even choose to sell the same product as the retailer, instead of different products, on the retailer's platform. For example, www.HANDU.com sells clothing for women, men, and kids on its own website, but only sells women dress on JD.com. Conceivably, the sellers do so because the presence of sellers on a retailer's platform can increase the traffic to the sellers' websites: When a product by a third-party seller is listed on a retailer's platform and is exposed to its consumers, some of the consumers may also become aware of the other products offered by the seller, with the help of different online tools such as search engines. We call this cross-product awareness increase spillover effect of consumer awareness.
This paper aims to answer the following questions. With an open platform and a given commission rate, how does the spillover effect affect a third-party seller’s incentive to join a retailer’s platform and how does the spillover effect affect its product offering on the platform? We develop a game-theoretic model in which the platform is open and the commission rate is given, and the third-party seller carries identical products as the retailer as well as exclusive products that the retailer does not carry. The third party chooses whether to join the platform; If so, the third party chooses which product(s), the identical product, theexclusive product, or both products, is/are sold on the retailer’s platform.
We find that the third party's optimal selling strategies vary with its initial awareness, the extent of spillover effect, and the commission rate. Specifically, for a low commission rate, when its initial awareness and spillover effect are mild, the third party sells both identical and exclusive products on the retailer's platform; when its initial awareness is high or spillover effect is salient, the third party sells exclusive products only. For a high commission rate, the third party only sells identical products if the spillover effect relative to initial awareness is significant; otherwise, the third party does not offer any product. In particular, even when the commission rate is very high, the third party may still have incentive to sell the identical product on the retailer's platform. For instance, when the spillover effect relative to the initial awareness level is significant, even the retailer asks for the whole revenue of third party's sales on the retailer's platform, the third party still optimally chooses to sell the identical product on the retailer's platform. This surprising result is because in this case the spillover effect is more important than the initial awareness, the benefit of increased demand for exclusive product resulting from spillover effect outweighs the cost of contributing the revenue from the identical product to the retailer.
Keywords: Online retailing, spillover effect, coopetition, consumer awareness_____________________*Corresponding author

Yang, L. (2017). The development situation and strategies of cross border e-commerce in China. In Proceedings of The 17th International Conference on Electronic Business (pp. 330-331). ICEB, Dubai, UAE, December 4-8.
Yang
The 17th International Conference on Electronic Business, Dubai, UAE, December 4-8, 2017330
The Development Situation and Strategies of Cross Border E-commerce in China
Lifan Yang*, East China University of Political Science and Law, Shanghai, China, [email protected]
ABSTRACT
With the quick development of E-commerce development, Cross Border business activity via the Internet which was as the complicated business model now has the new development situation and strategies in China. In this paper, we divided the business process of Cross Border E-commerce into five parts. They are marketing capability part, logistics part, payments part, tariff policy part and transaction rules part. We analyze each part development situation, advantage aspects, and problems innowadays. Based on this analysis and case study, we try to find more effective development strategies for Cross Border E-commerce of China in the worldwide competition. Therefore, five kinds of strategies which most of them from the government perspectives we have found in the following parts. For the government, we advise them to create favorable environment for Cross-Border E-Commerce, to vigorously promote the development of electronic payment industry, to optimize logistics and distribution services of electronic commerce, to make the e-commerce credit service system perfectly and to improve the information infrastructure and security system.
Marketing Capability in Cross Border Ecommerce
It refers to enterprises’ market activities such as supply and demand analysis, parity ability, customer recognition and quickjudgment, international sales and other capabilities. Many cross-border companies believe that the current international e-commerce platforms can’t fully meet the needs of cross-border e-commerce enterprises, and can’t significantly enhance the import and export capacity through the platforms online. Now it’s urgent to cultivate the local cross-border service platforms to guide more and more small and medium enterprises to settle in these platforms, to expand the scale and enhance the efficiency of the import and export through the Internet.
Logistics in Cross Border Ecommerce
In the cross-border logistics, the electronic logistics, the transfer speed and the transaction cost are all far from expectation, which seriously affect the development of cross-border e-commerce in China. Therefore, if we could integrate domestic and international logistics resources and take their advantages, these measures will enhance the speed of development of the cross-border e-commerce and lead to larger scale of cross-border transactions.
Payment in Cross Border Ecommerce
As the development of the electronic settlement, third party payment, transaction security, electronic credit development, inparticular, Paypal, Alipay and other online financial instruments, cross-border payments are no longer bottlenecks that restrict the development of cross-border e-commerce.
Tariff Policy in Cross Border Ecommerce
At present, most of the cross-border e-commerce platforms export through express parcels. Thus export enterprises can only obtain the transport bills, but they cannot provide Customs Export Declaration and other legal documents. Under the guidance and support of the government, the tax exemption policy for small bills not only provides a policy support for the export of these products in a standardized and orderly environment, but also attracted a large number of small and medium enterprises to involve in and thus promote the development of cross-border e-commerce in China.
Transaction Rules in Cross Border E-commerce
Business rules of cross-border e-commerce transactions is imminent, which includes the rights and obligations of both parties, the standard level of cross-border trading platform services, the information security of cross-border e-commerce transactions, online contract mechanism and disputes, the legal and regulatory services in cross-border transactions, the trade body, the specification of credit rating and evaluation behavior, the laws and regulations supervision of the third party payment platform, the punishment of the transaction order destruction, the standardization of cross-border e-commerce poundage and the needs for cross-border e-commerce disputes processing.
The Strategies of Cross Border E-commerce in China

Yang
The 17th International Conference on Electronic Business, Dubai, UAE, December 4-8, 2017331
To create favorable environment for cross-border e-commerce
We should create a favorable environment is important to the development of cross-border e-commerce. We can expand China’s discourse right in the cross-border e-commerce through organizing cross-border e-commerce professional meetings that have international influence, we can organize professional training for the transformation from traditional foreign trade enterprises and e-commerce enterprises to cross-border e-commerce, create good environment for innovation and entrepreneurship and encourage college students to enter the field of cross-border e-commerce venture, in order to form the good development environment of cross-border e-commerce in the whole society.
To vigorously promote the development of electronic payment industry
We can cultivate a group of leading third-party payment companies in China, innovate the mode of products and services and build electronic payment platform for the application of e-commerce in the various fields. We can also study on the formulation of electronic payment management of cross-border trade and promote the construction of electronic payment interoperability and security system.
To optimize logistics and distribution services of electronic commerce
We can deepen the construction of logistics distribution system, strengthen the guidance of the various distribution subjects, improve circulation efficiency of city distribution logistics, and enhance the service quality of e-commerce logistics. We can also support the development of professional services of logistics information platform, promote the outsourcing of logistics information service and promote the logistics information system to be widely used.
To perfect e-commerce credit service system
We can study the establishment of network operators’ credit index system, promote the collection and management services of network operators’ credit information, encourage social intermediary institutions to carry out network operators’ credit evaluation activities.
To improve the information infrastructure and security system
We can improve the online service quality and access speed, speed up the construction and coverage of a new generation of mobile communication network and urban wireless broadband network, accelerate the construction of Internet data center and the optimization of price structure and promote e-commerce enterprises to reduce network operating costs. We can also establish and improve the information security system of e-commerce enterprises, promote the storage system construction of the third party electronic data and strengthen the construction of security authentication infrastructure.
Keywords: Development, strategies, cross-border e-commerce._____________________*Corresponding author
REFERENCES
(*Full reference list is available upon request from the corresponding author.)

Tseng, T.S. (2017). The study on cross border e-commerce startup. In Proceedings of The 17th International Conference on Electronic Business (p. 324). ICEB, Dubai, UAE, December 4-8.
Tseng
The 17th International Conference on Electronic Business, Dubai, UAE, December 4-8, 2017332
The Study on Cross Border E-Commerce Startup(Abstract Only)
Tzu Shan Tseng*, Ming Chuan University, Taiwan, [email protected]
ABSTRACTThe internet has been enhanced the roads of global commercials. Companies use the internet platforms to sell their products and make the profits for the companies. Cross Border E-Commerce is an important opportunity in this time point but it will be challenged at the same time. This application will use multiple research methodologies: Field observations method on thecross border e-commerce platforms - Alibaba, Amazon, Aliexpress, Lazada and eBay for one year; Focus group methos and then in-depth Interview method for studying and providing the suggestions about the critical factors to have Cross Border E-Commerce Startup. Luckily, the study got the results and applications: Firstly, about the products requiring, the StarUp must require or produce the products with uniqueness. Secondly, for expanding the international markets for surviving, the StarUp must enter cross border e-Commerce internet world. Thirdly, for reducing the cost, the StarUp must use cross border e-Commerce to reach the global customers in different countries. Fourthly, the oversea warehouses will be one trend of cross-border e-Commerce. Fifthly, it is very important for StarUp to learn and get professionals on, for example, the optimization of Keywords of their products and the analyzing the Big Data for marketing and selling. Finally, the StarUp must group and train their own professional cross border e-Commerce team.
Keywords: Cross-border e-commerce, StartUp, training_____________________*Corresponding author